FINANCIAL STATEMENTS 2015-16

Welcome message from author
This document is posted to help you gain knowledge. Please leave a comment to let me know what you think about it! Share it to your friends and learn new things together.
Transcript

FINANCIAL STATEMENTS 2015-16

Table of Contents
STATEMENT BY THE CHIEF EXECUTIVE AND CHIEF FINANCIAL OFFICER.......3Statement of Comprehensive Income for Safe Work Australia....................................4Statement of Financial Position for Safe Work Australia..............................................5Statement of Changes in Equity for Safe Work Australia.............................................6Cash Flow Statement for Safe Work Australia.............................................................7Schedule of Commitments...........................................................................................8Note 1: Summary of Significant Accounting Policies..................................................10Note 2: Events After the Reporting Period.................................................................18Note 3: Net Cash Appropriation Arrangements..........................................................18Note 4: Expenses.......................................................................................................19Note 4: Expenses continued......................................................................................20Note 5: Own-Source Income......................................................................................21Note 6: Fair Value Measurements..............................................................................22Note 7: Financial Assets.............................................................................................23Note 8: Non-Financial Assets.....................................................................................26Note 9: Payables........................................................................................................30Note 10: Provisions....................................................................................................31Note 11: Cash Flow Reconciliation............................................................................32Note 12: Senior Management Personnel Remuneration...........................................32Note 13: Financial Instruments...................................................................................34Note 14: Financial Assets Reconciliation...................................................................35Note 15: Appropriations..............................................................................................36Note 16: Special Accounts.........................................................................................39Note 17: Reporting of Outcomes................................................................................40Note 18: Budgetary Reports and Explanations of Major Variances...........................41
Page 2 of 45

Page 3 of 45
STATEMENT BY THE ACCOUNTABLE AUTHORITY AND CHIEF FINANCIAL OFFICERIn our opinion, the attached financial statements for the year ended 30 June 2016 comply with subsection 42(2) of the Public Governance, Performance and Accountability Act 2013 (PGPA Act), and are based on properly maintained financial records as per subsection 41(2) of the PGPA Act.
In our opinion, at the date of this statement, there are reasonable grounds to believe that Safe Work Australia will be able to pay its debts as and when they fall due.
Signed Signed
....................................... .......................................Michelle Baxter Danette Fenton-MenziesChief Executive Officer Chief Financial Officer
23 September 2016 23 September 2016

Statement of Comprehensive Income for Safe Work Australiafor the period ended 30 June 2016
2016 2015Original Budget
Notes $'000 $'000 $'000
NET COST OF SERVICESExpenses
Employee Benefits 1.1A 13,081 11,970 12,868Suppliers 1.1B 5,885 5,888 6,752Grants 1.1C 196 - 100Depreciation and Amortisation 2.2A 711 600 171Write-Down and Impairment of Assets 1.1D 4 9 -
Total expenses 19,877 18,467 19,891
Own-Source IncomeOwn-source revenue
Sale of Goods and Rendering of Services 1.2A 10,274 10,155 10,028Other Revenue 1.2B 54 51 -
Total own-source revenue 10,328 10,206 10,028
GainsReversal of Write-downs and Impairment 1.2C - 3 -Other Gains 1.2D 3,040 9 60
Total gains 3,040 12 60Total own-source income 13,368 10,218 10,088Net (cost of)/contribution by services (6,509) (8,249) (9,803)Revenue from Government 1.2E 9,625 9,607 9,632Surplus/(Deficit) before income tax on continuing operations 3,116 1,358 (171)Surplus/(Deficit) after income tax on continuing operations 3,116 1,358 (171)
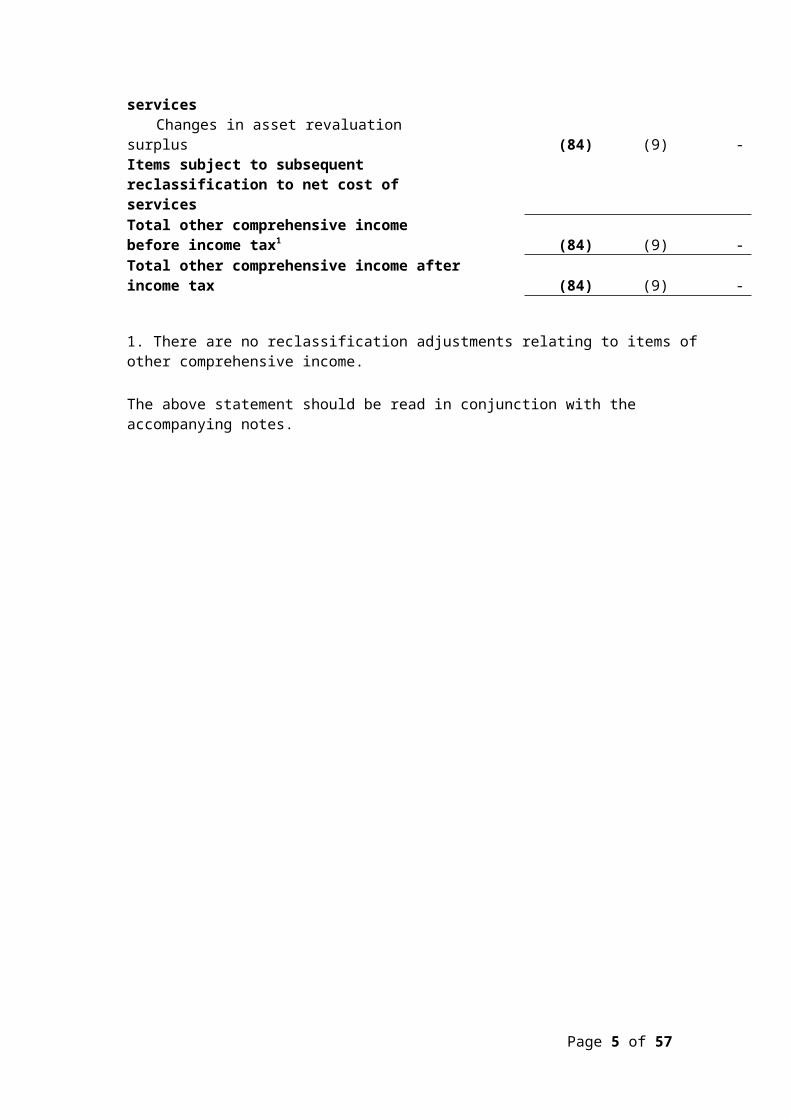
OTHER COMPREHENSIVE INCOMEItems not subject to subsequent reclassification to net cost of services
Changes in asset revaluation surplus (84) (9) -Items subject to subsequent reclassification to net cost of servicesTotal other comprehensive income before income tax1 (84) (9) -Total other comprehensive income after income tax (84) (9) -
1. There are no reclassification adjustments relating to items of other comprehensive income.
The above statement should be read in conjunction with the accompanying notes.
Page 4 of 45
Page 5 of 45
Budget Variances CommentaryStatement of Comprehensive Income for not-for-profit Reporting Entities- Suppliers: The variance of -$0.867m (-12.84%) was mostly due to staffing changes
which enabled work to be undertaken in-house resulting in a reduction in the use of consultancy services.
- Grants: The variance of $0.096m (96%) was due to an increase in one-off grants funded during the year as a result Safe Work Australia engaging in more targeted funding.
- Depreciation and Amortisation: The variance of $0.540m (315.79%) was due to Safe Work Australia moving to new premises at Level 7, Nishi Building, 2 Phillip Law Street, Acton during the year. The leasehold fitout of the new premises was recognised at fair value from 1 July 2015 and the Agency incurred additional fitout costs for alterations (this work was internally funded by the Agency). The recognition of the fitout is also recognised in Changes in Asset Revaluation Surplus.
- Other Gains: The variance of $2.980m (4966.67%) was due to budgeted gains not including the recognition of new fitout asset as described in the Depreciation and Amortisation variance explanation above.

Statement of Financial Position for Safe Work Australia
as at 30 June 2016
2016 2015Original Budget
Notes $’000 $’000 $’000
ASSETS
Financial assets
Cash and Cash Equivalents 2.1A 375 294 303
Trade and Other Receivables 2.1B 11,749 12,618 11,291
Other Financial Assets 2.1C 42 45 -
Total financial assets 12,166 12,957 11,594
Non-financial assets
Buildings 2.2A 3,048 130 183
Plant and Equipment 2.2A 172 154 167
Computer Software 2.2A 28 11 117
Other Non-Financial Assets 2.2B 40 20 82
Total non-financial assets 3,288 315 549
Assets held for sale - - -
Total assets 15,454 13,272 12,143
LIABILITIES
Payables
Suppliers 2.3A 1,217 1,770 2,008
Grants 2.3B 19 - -
Other Payables 2.3C 196 793 392
Total payables 1,432 2,563 2,400
Page 6 of 45

Provisions
Employee Provisions 4.1A 3,509 3,301 4,013
Total provisions 3,509 3,301 4,013
Total liabilities 4,941 5,864 6,413
Net assets 10,513 7,408 5,730
EQUITY
Contributed Equity 4,948 4,275 4,296
Reserves 776 860 859Retained surplus/(Accumulated
deficit) 4,790 2,273 575
Total equity 10,513 7,408 5,730
The above statement should be read in conjunction with the accompanying notes.
Statement of Changes in Equity for Safe Work Australia
for the period ended 30 June 2016
Page 7 of 45
Budget Variances Commentary- Buildings: The variance of $2.865m (1565.57%) relates to capital
expenditure on the fitout at Safe Work Australia's new premises and recognition and revaluation of the fitout at fair value.
- Supplier and Other Payables: The variances of -$0.791m (-39.39%) (Supplier Payables) and -$0.196m (-49.96%) (Other Payables) relate to the timing of invoices received.
- Employee Provisions: The variance of -$0.504m (-12.56%) reflects a change in the composition of employee annual and long service leave provisions compared with the budgeted amount due to a combination of staff turnover and changes to the standard parameters issued by the Department of Finance.

2016 2015Original Budget
Notes $’000 $’000 $’000
CONTRIBUTED EQUITY
Opening balance
Balance carried forward from previous period 4,275 4,050 4,223
Adjusted opening balance 4,275 4,050 4,223
Transactions with owners
Distributions to owners
Contributions by owners
Departmental capital budget 73 225 73
Total transactions with owners 73 225 73
Transfers between equity components 600 - -
Closing balance as at 30 June 4,948 4,275 4,296
RETAINED EARNINGS
Opening balance
Balance carried forward from previous period 2,274 916 746Write off of asset revaluation decrements upon disposal of assets - (9) -
Adjusted opening balance 2,274 907 746
Comprehensive income
Surplus/(Deficit) for the period 3,116 1,358 (171)
Total comprehensive income 3,116 1,358 (171)
Transfers between equity components (600) 9 -
Closing balance as at 30 June 4,790 2,274 575
Page 8 of 45

ASSET REVALUATION RESERVE
Opening balance
Balance carried forward from previous period 860 860 859
Adjusted opening balance 860 860 859
Comprehensive incomeWrite off of asset revaluation decrements upon disposal of assets - 9 -
Other comprehensive income (84) - -
Total comprehensive income (84) 9 -
Transfers between equity components - (9) -
Closing balance as at 30 June 776 860 859
2016 2015Original Budget
Notes $’000 $’000 $’000
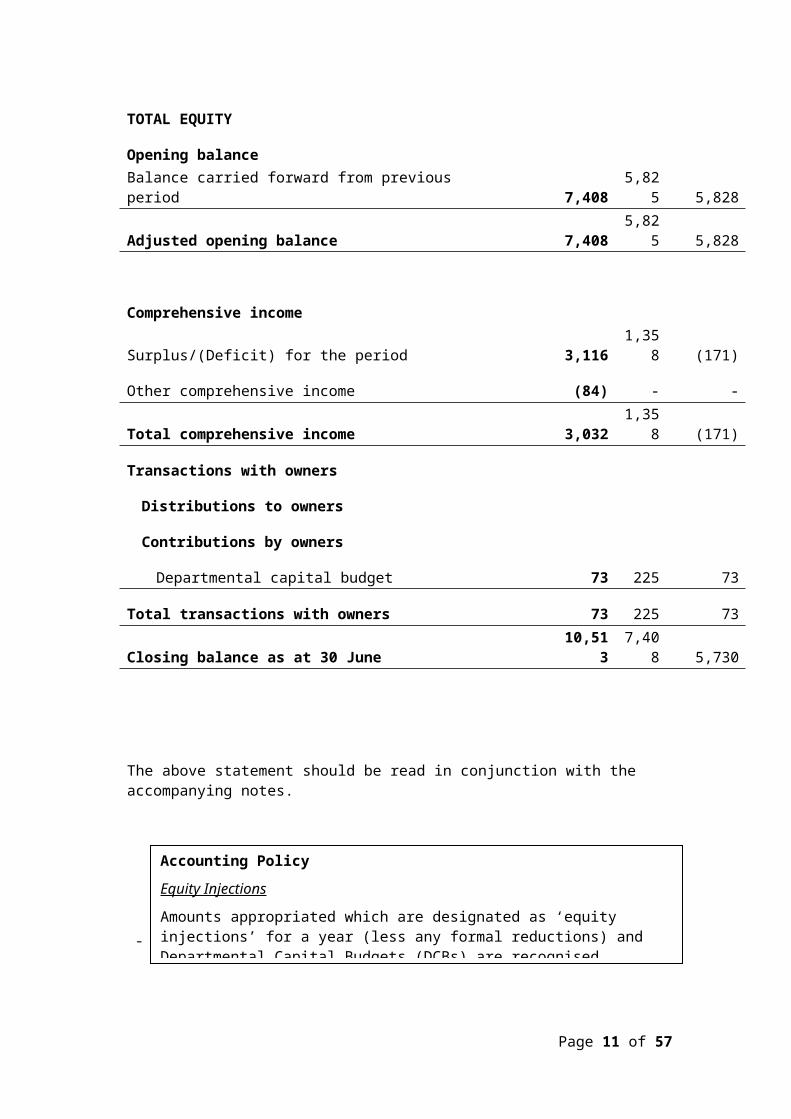
TOTAL EQUITY
Opening balance
Balance carried forward from previous period 7,408 5,825 5,828
Adjusted opening balance 7,408 5,825 5,828
Comprehensive income
Surplus/(Deficit) for the period 3,116 1,358 (171)
Other comprehensive income (84) - -
Total comprehensive income 3,032 1,358 (171)
Transactions with owners
Page 9 of 45

Distributions to owners
Contributions by owners
Departmental capital budget 73 225 73
Total transactions with owners 73 225 73
Closing balance as at 30 June 10,513 7,408 5,730
The above statement should be read in conjunction with the accompanying notes.
-
Page 10 of 45
Accounting PolicyEquity Injections
Amounts appropriated which are designated as ‘equity injections’ for a year (less any formal reductions) and Departmental Capital Budgets (DCBs) are recognised directly in contributed equity in that year.
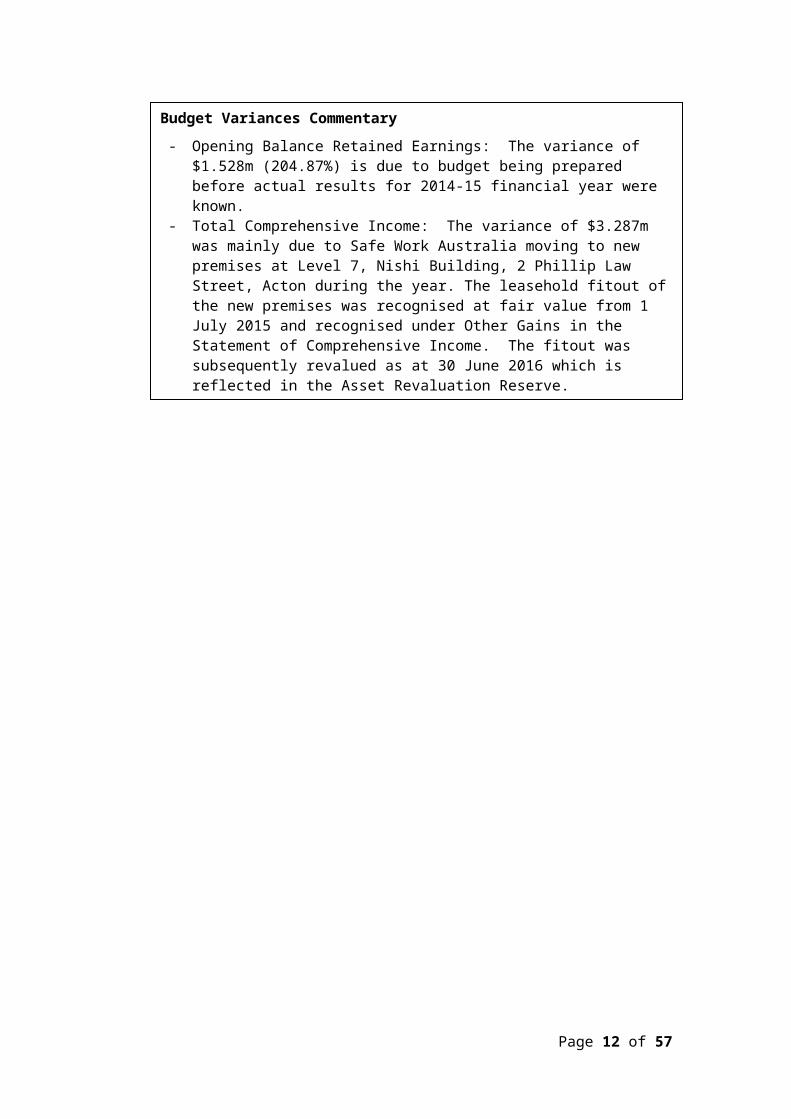
Budget Variances Commentary- Opening Balance Retained Earnings: The variance of $1.528m
(204.87%) is due to budget being prepared before actual results for 2014-15 financial year were known.
- Total Comprehensive Income: The variance of $3.287m was mainly due to Safe Work Australia moving to new premises at Level 7, Nishi Building, 2 Phillip Law Street, Acton during the year. The leasehold fitout of the new premises was recognised at fair value from 1 July 2015 and recognised under Other Gains in the Statement of Comprehensive Income. The fitout was subsequently revalued as at 30 June 2016 which is reflected in the Asset Revaluation Reserve.
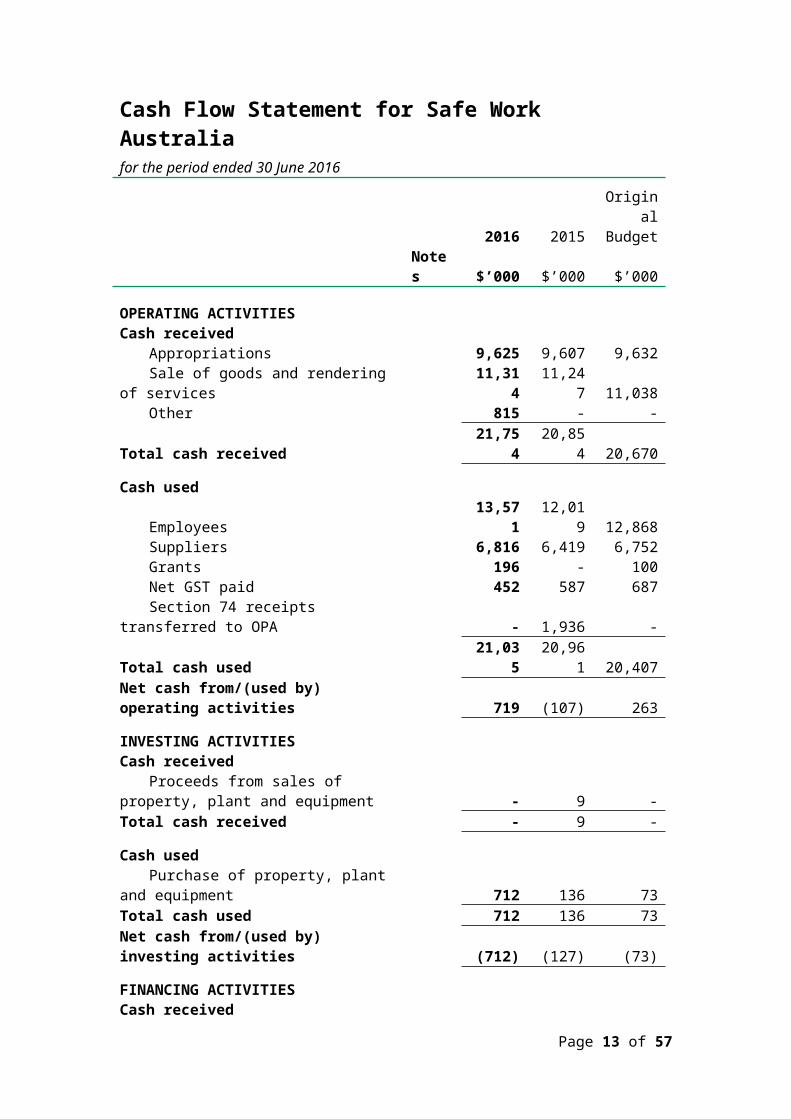
Cash Flow Statement for Safe Work Australiafor the period ended 30 June 2016
2016 2015Original Budget
Notes $’000 $’000 $’000
OPERATING ACTIVITIESCash received
Appropriations 9,625 9,607 9,632Sale of goods and rendering of
services 11,314 11,247 11,038Other 815 - -
Total cash received 21,754 20,854 20,670
Cash usedEmployees 13,571 12,019 12,868Suppliers 6,816 6,419 6,752Grants 196 - 100Net GST paid 452 587 687Section 74 receipts transferred to
OPA - 1,936 -Total cash used 21,035 20,961 20,407Net cash from/(used by) operating activities 719 (107) 263
INVESTING ACTIVITIESCash received
Proceeds from sales of property, plant and equipment - 9 -Total cash received - 9 -
Cash usedPurchase of property, plant and
equipment 712 136 73Total cash used 712 136 73Net cash from/(used by) investing activities (712) (127) (73)
FINANCING ACTIVITIESCash received
Contributed equity 73 225 73Total cash received 73 225 73
Cash usedOther - - 263
Total cash used - - 263Net cash from/(used by) financing activities 73 225 (190)
Net increase/(decrease) in cash held 80 (9) -Cash and cash equivalents at the beginning ofthe reporting period 294 303 303Cash and cash equivalents at the end of the
2.1A 375 294 303
Page 11 of 45
reporting period
The above statement should be read in conjunction with the accompanying notes.
Page 12 of 45
Budget Variances Commentary
Cash Flow Statement for not-for-profit Reporting Entities- Grants: The variance of $0.096m (96%) was due to an increase in one-off
grants funded during the year.- Net GST paid: The variance of -$0.235m (-34.21%) was due to the different
GST statuses of Safe Work Australia's Suppliers.- Purchase of property, plant and equipment: The variance of $0.542m
(742.47%) is due to additional fitout costs of alterations to the leasehold fitout at Nishi, 2 Phillip Law Street, Acton. This work was internally funded by the Agency.
Summary of Significant Accounting PoliciesObjectives of Safe Work Australia
Safe Work Australia is an Australian Government controlled not-for-profit entity. Safe Work Australia is the body leading the development of national policy to improve work health and safety and workers’ compensation across Australia. The establishment of Safe Work Australia was provided for in the Intergovernmental Agreement for Regulatory and Operational Reform in Occupational Health and Safety (IGA), agreed by the Council of Australian Governments on 3 July 2008. Safe Work Australia was established as a former Executive Agency on 1 July 2009 and as a Statutory Agency on 1 November 2009.
Safe Work Australia operates in accordance with the Safe Work Australia Act 2008 (SWA Act) and its functions under this Act include to:• develop national policy relating to OHS and workers' compensation, and• prepare a model Act and model regulations relating to OHS and, if necessary,
revise these:(i) for approval by the Ministerial Council, and(ii) for adoption as laws of the Commonwealth, each of the states and each of
the territories.
Safe Work Australia has a single outcome as follows:
Outcome 1: Healthier, safer and more productive workplaces through improvements to Australian work health and safety and workers’ compensation arrangements.
The continued existence of the Agency in its present form and with its present programmes is dependent on Government policy and on continuing funding by Parliament for the entity’s administration and programmes.
Agency activities contributing toward this outcome are classified as departmental. Departmental activities involve the use of assets, liabilities, income and expenses controlled or incurred by the entity in its own right.
The Basis of Preparation
The financial statements are general purpose financial statements and are required by section 42 of the Public Governance, Performance and Accountability Act 2013.
The financial statements have been prepared in accordance with: a) Public Governance, Performance and Accountability (Financial Reporting) Rule 2015 (FRR) for reporting periods ending on or after 1 July 2015; and b) Australian Accounting Standards and Interpretations issued by the Australian Accounting Standards Board (AASB) that apply for the reporting period.
The financial statements have been prepared on an accrual basis and in accordance with the historical cost convention, except for certain assets and liabilities at fair value. Except where stated, no allowance is made for the effect of changing prices on the results or the financial position. The financial statements are presented in Australian dollars.
Page 13 of 45

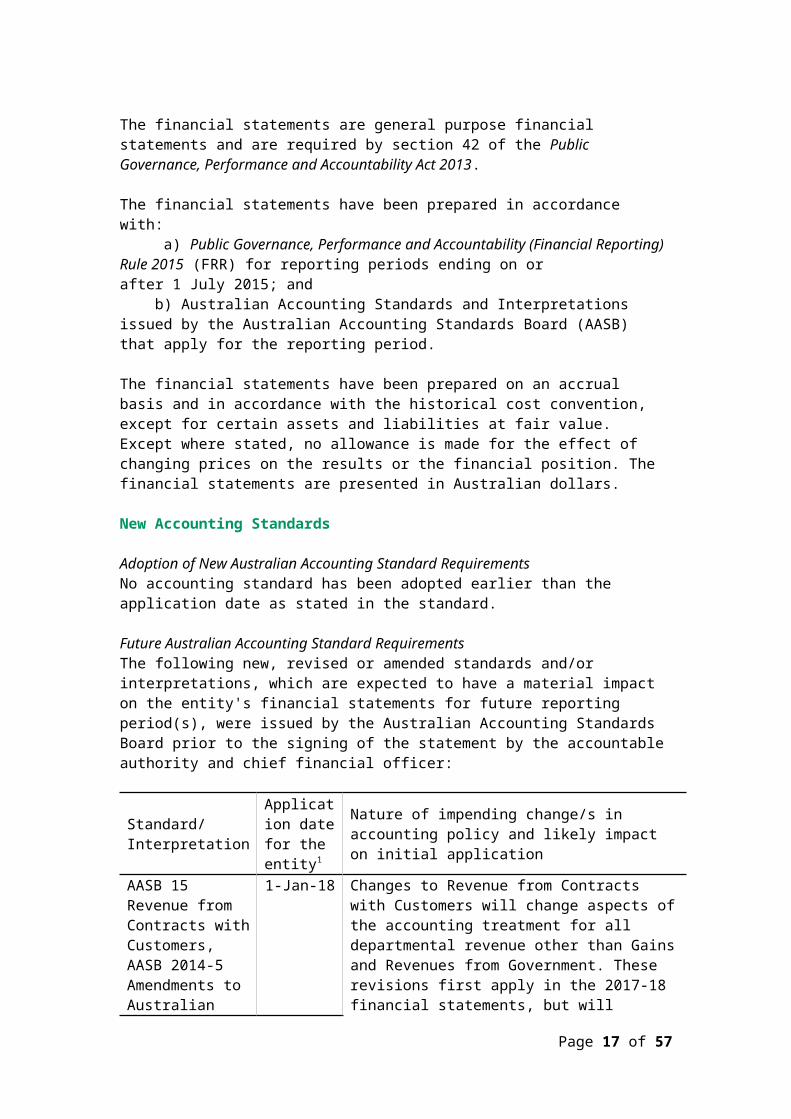
New Accounting Standards
Adoption of New Australian Accounting Standard RequirementsNo accounting standard has been adopted earlier than the application date as stated in the standard.
Future Australian Accounting Standard RequirementsThe following new, revised or amended standards and/or interpretations, which are expected to have a material impact on the entity's financial statements for future reporting period(s), were issued by the Australian Accounting Standards Board prior to the signing of the statement by the accountable authority and chief financial officer:
Standard/ Interpretation
Application date for the entity1
Nature of impending change/s in accounting policy and likely impact on initial application
AASB 15 Revenue from Contracts with Customers, AASB 2014-5 Amendments to Australian Accounting Standards arising from AASB 15, AASB 2016-3 Amendments to Australian Accounting Standards - Clarifications to AASB 15
1-Jan-18
Changes to Revenue from Contracts with Customers will change aspects of the accounting treatment for all departmental revenue other than Gains and Revenues from Government. These revisions first apply in the 2017-18 financial statements, but will require retrospective adjustments for accounting treatments for the 2016-17 comparative disclosures.
Likely impact: The likely impact is currently not known. Depending on the nature of the Agency's transactions, the new standard may have a significant impact on the timing of the recognition of revenue.
AASB 16 Leases 1-Jan-19
Changes to Leases will bring all leases onto the balance sheet of lessees. These revisions first apply in the 2018-19 financial statements.
Likely impact: The likely impact is currently not known. Depending on the nature of the Agency's leases, the new standard may have a material impact at the time of adoption.
1. The entity’s expected initial application date is when the accounting standard becomes operative at the beginning of the entity’s reporting period.
All other [new/revised/amending standards and/or interpretations] that were issued prior to the sign-off date and are applicable to future reporting period(s) are not expected to have a future material impact on the entity’s financial statements.
Page 14 of 45

Taxation
The entity is exempt from all forms of taxation except Fringe Benefits Tax (FBT) and the Goods and Services Tax (GST).
Revenues, expenses and assets are recognised net of GST except:a) where the amount of GST incurred is not recoverable from the Australian
Government; andb) for receivables and payables.
Events After the Reporting Period
Departmental
There was no subsequent event that had the potential to significantly affect the ongoing structure and financial activities of the agency.
Breach of Section 83 of the Constitution
Safe Work Australia is not aware of any breach of Section 83 of the Constitution.
The Australian Government continues to have regard to developments in case law, including the High Court's decision on Commonwealth expenditure in Williams v Commonwealth (2012) 288 ALR 410, as they contribute to the larger body of law relevant to the development of Commonwealth programs. In accordance with its general practice, the Government will continue to monitor and assess risk and decide on any appropriate actions to respond to risks of expenditure not being consistent with constitutional or other legal requirements.
Page 15 of 45

Financial Performance This section analyses the financial performance of Safe Work Australia for the year ended 2016.
1.1 Expenses2016 2015
$’000 $’000
1.1A: Employee BenefitsWages and salaries 8,564 8,332Superannuation
Defined contribution plans 748 645Defined benefit plans 1,286 1,248
Leave and other entitlements 2,110 1,351Separation and redundancies 373 394Total employee benefits 13,081 11,970
Accounting PolicyAccounting policies for employee related expenses is contained in the People andRelationships section.
1.1B: SuppliersGoods and services supplied or rendered
Consultants 1,938 2,101Contractors 42 137Travel 223 171IT services 381 269Recruitment and Training 221 154Advertising 129 60Office Supplies 46 65Venue Hire / Guest Speakers 27 10Subscriptions 36 17Corporate Costs 1,068 925Property Costs 144 225Sponsorships 65 46Other 505 584
Total goods and services supplied or rendered 4,825 4,762
Goods supplied 57 81Services rendered 4,768 4,681Total goods and services supplied or rendered 4,825 4,762
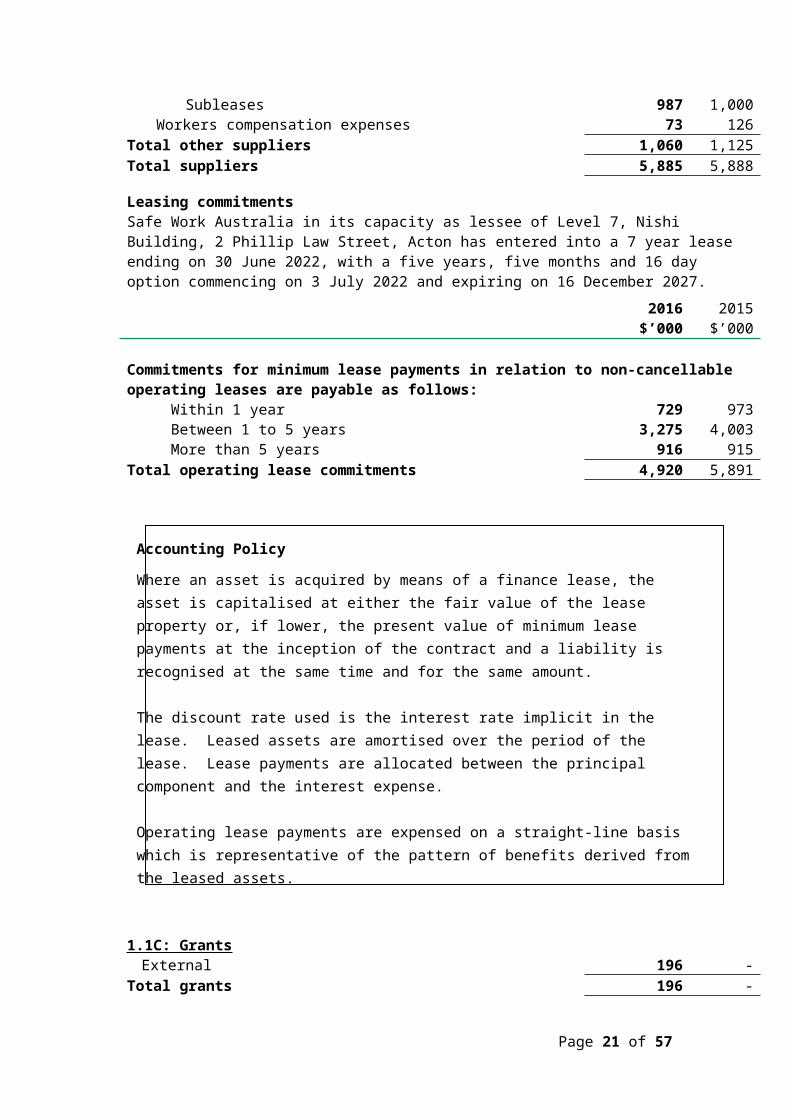
Other suppliersOperating lease rentals in connection with
Subleases 987 1,000Workers compensation expenses 73 126
Total other suppliers 1,060 1,125Total suppliers 5,885 5,888
Leasing commitments
Safe Work Australia in its capacity as lessee of Level 7, Nishi Building, 2 Phillip Law Street, Acton has entered into a 7 year lease ending on 30 June 2022, with a five years, five months and 16 day option commencing on 3 July 2022 and expiring on 16 December 2027.
Page 16 of 45
2016 2015$’000 $’000
Commitments for minimum lease payments in relation to non-cancellableoperating leases are payable as follows:
Within 1 year 729 973Between 1 to 5 years 3,275 4,003More than 5 years 916 915
Total operating lease commitments 4,920 5,891
1.1C: GrantsExternal 196 -
Total grants 196 -
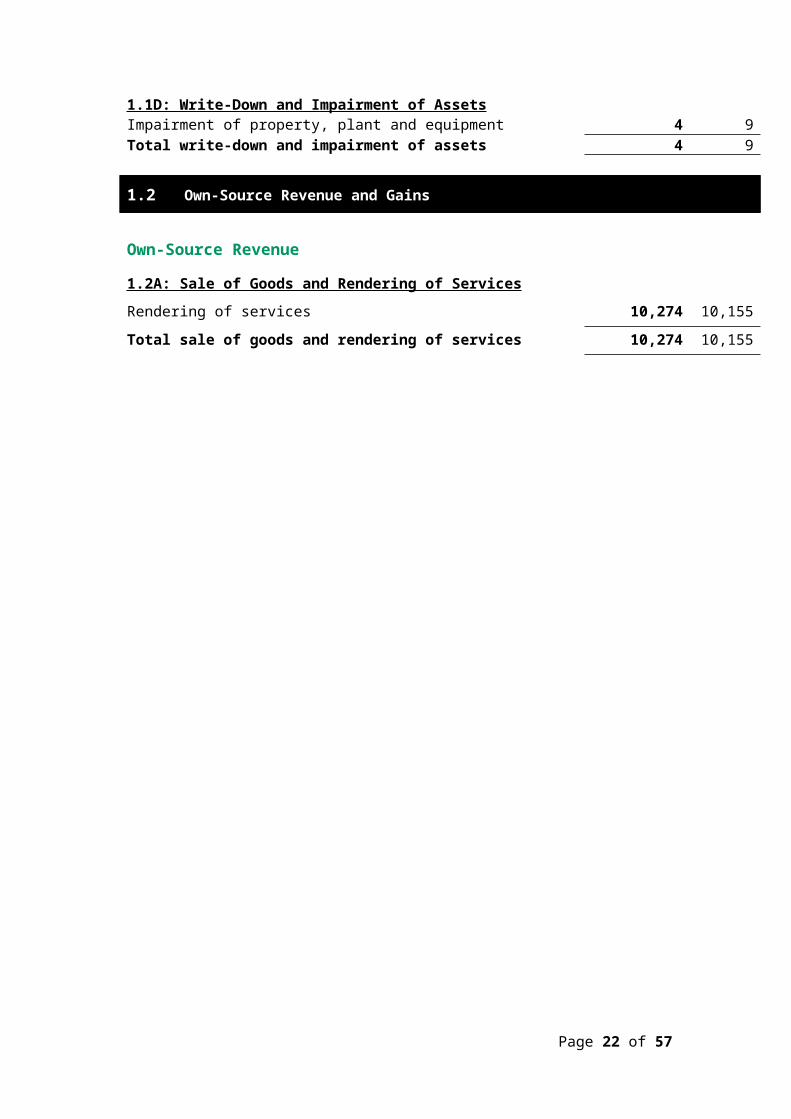
1.1D: Write-Down and Impairment of AssetsImpairment of property, plant and equipment 4 9Total write-down and impairment of assets 4 9
1.2 Own-Source Revenue and Gains
Own-Source Revenue
1.2A: Sale of Goods and Rendering of ServicesRendering of services 10,274 10,155
Total sale of goods and rendering of services 10,274 10,155
Page 17 of 45
Accounting Policy
Where an asset is acquired by means of a finance lease, the asset is capitalised at either the fair value of the lease property or, if lower, the present value of minimum lease payments at the inception of the contract and a liability is recognised at the same time and for the same amount.
The discount rate used is the interest rate implicit in the lease. Leased assets are amortised over the period of the lease. Lease payments are allocated between the principal component and the interest expense.
Operating lease payments are expensed on a straight-line basis which is representative of the pattern of benefits derived from the leased assets.

2016$’000
2015$’000
1.2B: Other RevenueResources received free of charge
Remuneration of auditors 44 46Provision of consultancy services - 5
Other 10 -
Total other revenue 54 51
Page 18 of 45
Accounting Policy
Revenue from rendering of services - States and Territory contributionsState and Territory contributions are recognised in equal monthly amounts over the course of the year as work is completed. All contributions are deemed as being earned at the reporting date. Contribution amounts are derived by reference to the Inter-Governmental Agreement for Regulatory and Operational Reform in Occupational Health and Safety.
Other revenue from rendering of servicesRevenue from rendering of services is recognised by reference to the stage of completion of contracts at the reporting date. The revenue is recognised when:
a) the amount of revenue, stage of completion and transaction costs incurred can be reliably measured; and
b) the probable economic benefits associated with the transaction will flow to the Agency.
The stage of completion of contracts at the reporting date is determined by reference to the proportion of costs incurred to date compared to the estimated total costs of the transaction.
Receivables for goods and services, which have 30 day terms, are recognised at the nominal amounts due less any impairment allowance account. Collectability of debts is reviewed at end of the reporting period. Allowances are made when collectability of the debt is no longer probable.
Accounting PolicyResources Received Free of ChargeResources received free of charge are recognised as revenue when, and only when, a fair value can be reliably determined and the services would have been purchased if they had not been donated. Use of those resources is recognised as an expense.Resources received free of charge are recorded as either revenue or gains depending on their nature.

2016$’000
2015$’000
Gains
1.2C: Reversal of Write-downs and ImpairmentReversal of impairment losses - 3
Total reversals of previous asset write-downs and impairments - 3
1.2D: Other GainsGains from sale of assets - 9Other 3,040 -Total other gains 3,040 9
.
2016$’000
2015$’000
1.2E: Revenue from GovernmentAppropriations
Departmental appropriations 9,625 9,607Total revenue from Government 9,625 9,607
Page 19 of 45
Accounting Policy
Sale of AssetsGains from disposal of assets are recognised when control of the asset has passed to the buyer.
OtherThis is associated with Other Revenue.
Safe Work Australia recognised leasehold fitout for its new premises - Nishi Building, 2 Phillip Law Street, Acton, as at commencement of the sub-lease on 1 July 2015.

Financial Position This section analyses Safe Work Australia's assets used to conduct its operations and the operating liabilities incurred as a result. Employee related information is disclosed in the People and Relationships section.
2.1: Financial Assets
2016$’000
2015$’000
2.1A: Cash and Cash EquivalentsCash in special accounts 375 294Cash on hand or on deposit - -Total cash and cash equivalents 375 294
2.1B: Trade and Other ReceivablesGoods and services receivablesGoods and services 142 158Total goods and services receivables 142 158
Appropriations receivablesAppropriation receivable 11,537 12,342
Total appropriations receivables 11,537 12,342
Other receivablesStatutory receivables 70 118
Page 20 of 45
Accounting Policy
Revenue from Government
Amounts appropriated for departmental outputs for the year (adjusted for any formal additions and reductions) are recognised as Revenue from Government when the entity gains control of the appropriation, except for certain amounts that relate to activities that are reciprocal in nature, in which case revenue is recognised only when it has been earned. Appropriations receivable are recognised at their nominal amounts.
Accounting PolicyCash is recognised at its nominal amount. Cash and cash equivalents includes:
a) cash on hand;b) demand deposits in bank accounts with an original maturity of 3 months or less
that are readily convertible to known amounts of cash and subject to insignificant risk of changes in value; and
c) cash in special accounts.
Total other receivables 70 118Total trade and other receivables (gross) 11,749 12,618Less impairment allowance - -
Total trade and other receivables (net) 11,749 12,618
Trade and other receivables (net) expected to be recoveredNo more than 12 months 11,749 12,618
Total trade and other receivables (net) 11,749 12,6182016
$’0002015$’000
Trade and other receivables (gross) aged as followsNot overdue 11,749 12,618
Total trade and other receivables (net) 11,749 12,618
Credit terms for goods and services were 30 days (2015: 30 days).
2.1C: Other Financial AssetsAccrued income 42 45Total other financial assets 42 45
Other financial assets expected to be recoveredNo more than 12 months 42 45
Total other financial assets 42 45
2.2: Non-Financial Assets
2.2A: Reconciliation of the Opening and Closing Balances of Property, Plant and Equipment and Intangibles
Reconciliation of the opening and closing balances of property, plant and equipment for
Page 21 of 45
Accounting PolicyLoans and ReceivablesTrade receivables, loans and other receivables that have fixed or determinable payments and that are not quoted in an active market are classified as 'loans and receivables'. Loans and receivables are measured at amortised cost using the effective interest method less impairment. Interest is recognised by applying the effective interest rate.
2016
Buildings$’000
Plant and equipment
$’000
Computer Software1
$’000Total$’000
As at 1 July 2015Gross book value 1,170 226 303 1,699Accumulated depreciation, amortisation and impairment (1,040) (72) (292)
(1,404)
Total as at 1 July 2015 130 154 11 295Additions
Leasehold Fitout Resource Received Free of Charge 3,040 - - 3,040
Purchases 593 91 - 684Internally developed - - 28 28
Revaluations and impairments recognised in other comprehensive income (81) (4) - (85)Depreciation and amortisation (634) (66) (11) (711)Disposals
Other - (4) - (4)
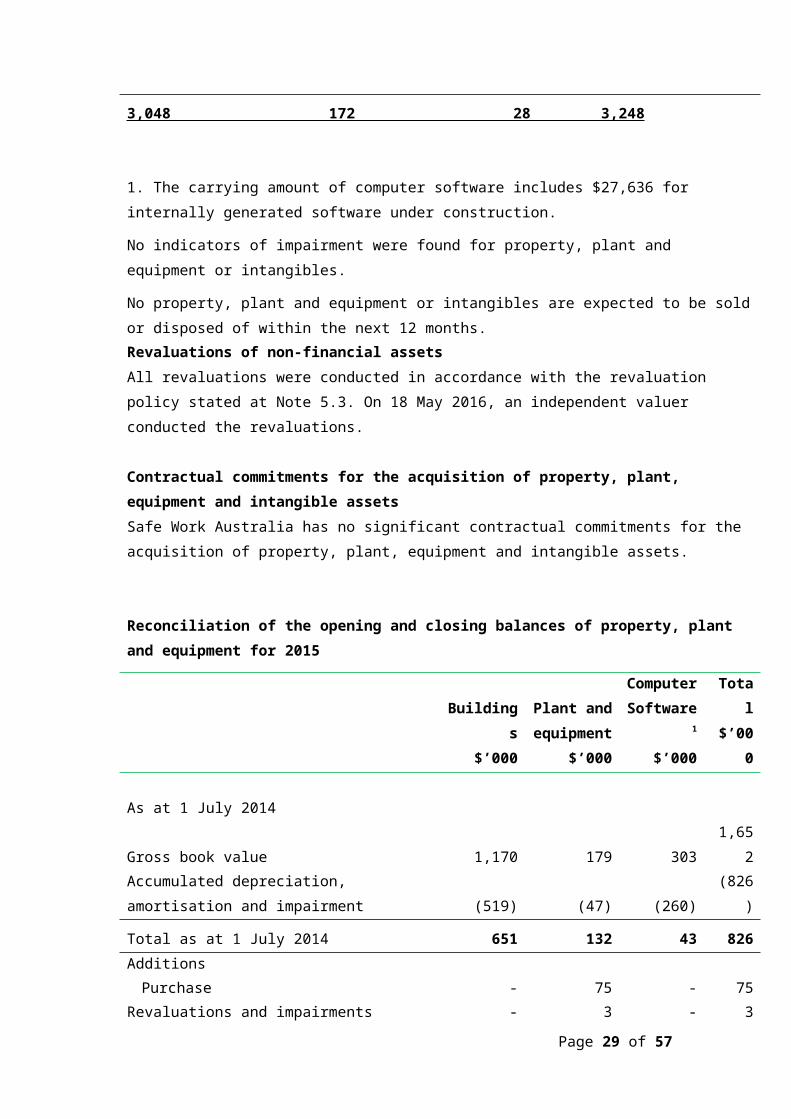
Total as at 30 June 2016 3,048 172 28 3,248
Total as at 30 June 2016 represented byGross book value 3,048 187 319 3,554Accumulated depreciation, amortisationAnd impairment - (15) (291) (206 )
Total as at 30 June 2016 3,048 172 28 3,248
1. The carrying amount of computer software includes $27,636 for internally generated software under construction.
No indicators of impairment were found for property, plant and equipment or intangibles.
No property, plant and equipment or intangibles are expected to be sold or disposed of within the next 12 months.Revaluations of non-financial assetsAll revaluations were conducted in accordance with the revaluation policy stated at Note 5.3. On 18 May 2016, an independent valuer conducted the revaluations.
Contractual commitments for the acquisition of property, plant, equipment and intangible
Page 22 of 45

assetsSafe Work Australia has no significant contractual commitments for the acquisition of property, plant, equipment and intangible assets.
Reconciliation of the opening and closing balances of property, plant and equipment for 2015
Buildings$’000
Plant and equipment
$’000
Computer Software1
$’000Total$’000
As at 1 July 2014Gross book value 1,170 179 303 1,652Accumulated depreciation, amortisation and impairment (519) (47) (260) (826)
Total as at 1 July 2014 651 132 43 826Additions
Purchase - 75 - 75Revaluations and impairments recognised in other comprehensive income - 3 - 3Depreciation and amortisation (521) (47) (32) (600)Disposals
Other - (9) - (9)
Total as at 30 June 2015 130 154 11 295
Accounting PolicyAssets are recorded at cost on acquisition except as stated below. The cost of acquisition includes the fair value of assets transferred in exchange and liabilities undertaken. Financial assets are initially measured at their fair value plus transaction costs where appropriate.
Assets acquired at no cost, or for nominal consideration, are initially recognised as assets and income at their fair value at the date of acquisition, unless acquired as a consequence of restructuring of administrative arrangements. In the latter case, assets are initially recognised as contributions by owners at the amounts at which they were recognised in the transferor’s accounts immediately prior to the restructuring.
Asset Recognition Threshold
Purchases of property, plant and equipment are recognised initially at cost in the statement of financial position, except for purchases costing less than the thresholds listed below for each class of asset, which are expensed in the year of acquisition (other than where they form part of a group of similar items which are significant in total).
Page 23 of 45

• Leasehold Improvements: $20,000• Plant and Equipment: $2,000• Purchased Software: $2,000• Internally Developed Software: $50,000
The initial cost of an asset includes an estimate of the cost of dismantling and removing the item and restoring the site on which it is located. This is particularly relevant to ‘make good’ provisions in property leases taken up by the entity where there exists an obligation to restore the property to its original condition. These costs are included in the value of the entity's leasehold improvements with a corresponding provision for the ‘make good’ recognised.
Revaluations
Following initial recognition at cost, property, plant and equipment are carried at fair value less subsequent accumulated depreciation and accumulated impairment losses. Valuations are conducted with sufficient frequency to ensure that the carrying amounts of assets did not differ materially from the assets’ fair values as at the reporting date. The regularity of independent valuations depends upon the volatility of movements in market values for the relevant assets.
Revaluation adjustments are made on a class basis. Any revaluation increment is credited to equity under the heading of asset revaluation reserve except to the extent that it reversed a previous revaluation decrement of the same asset class that was previously recognised in the surplus/deficit. Revaluation decrements for a class of assets are recognised directly in the surplus/deficit except to the extent that they reversed a previous revaluation increment for that class.
Any accumulated depreciation as at the revaluation date is offset against the gross carrying amount of the asset and the asset restated to the revalued amount.
Depreciation
Depreciable property, plant and equipment assets are written-off to their estimated residual values over their estimated useful lives to the entity using, in all cases, the straight-line method of depreciation.
Depreciation rates (useful lives), residual values and methods are reviewed at each reporting date and necessary adjustments are recognised in the current, or current and future reporting periods, as appropriate.
Depreciation rates applying to each class of depreciable asset are based on the following useful lives:
• Leasehold Improvements: Lease term• Plant and Equipment: 3 to 15 years
Impairment
All assets were assessed for impairment at 30 June 2016. Where indications of impairment exist, the asset’s recoverable amount is estimated and an impairment adjustment made if the asset’s recoverable amount is less than its carrying amount.
The recoverable amount of an asset is the higher of its fair value less costs of disposal and its value in use. Value in use is the present value of the future cash
Page 24 of 45

flows expected to be derived from the asset. Where the future economic benefit of an asset is not primarily dependent on the asset’s ability to generate future cash flows, and the asset would be replaced if the entity were deprived of the asset, its value in use is taken to be its depreciated replacement cost.
Derecognition
An item of property, plant and equipment is derecognised upon disposal or when no further future economic benefits are expected from its use or disposal.
Computer Softwares
The Safe Work Australia's intangibles comprise internally developed software for internal use. These assets are carried at cost less accumulated amortisation and accumulated impairment losses.Software is amortised on a straight-line basis over its anticipated useful life. The useful lives of the entity's software are 2 to 5 years (2015: 2 to 5 years).
All software assets were assessed for indications of impairment as at 30 June 2016.
2016$’000
2015$’000
2.2B: Other Non-Financial AssetsPrepayments 40 20
Total other non-financial assets 40 20
Other non-financial assets expected to be recoveredNo more than 12 months 40 20
Total other non-financial assets 40 20
No indicators of impairment were found for other non-financial assets.
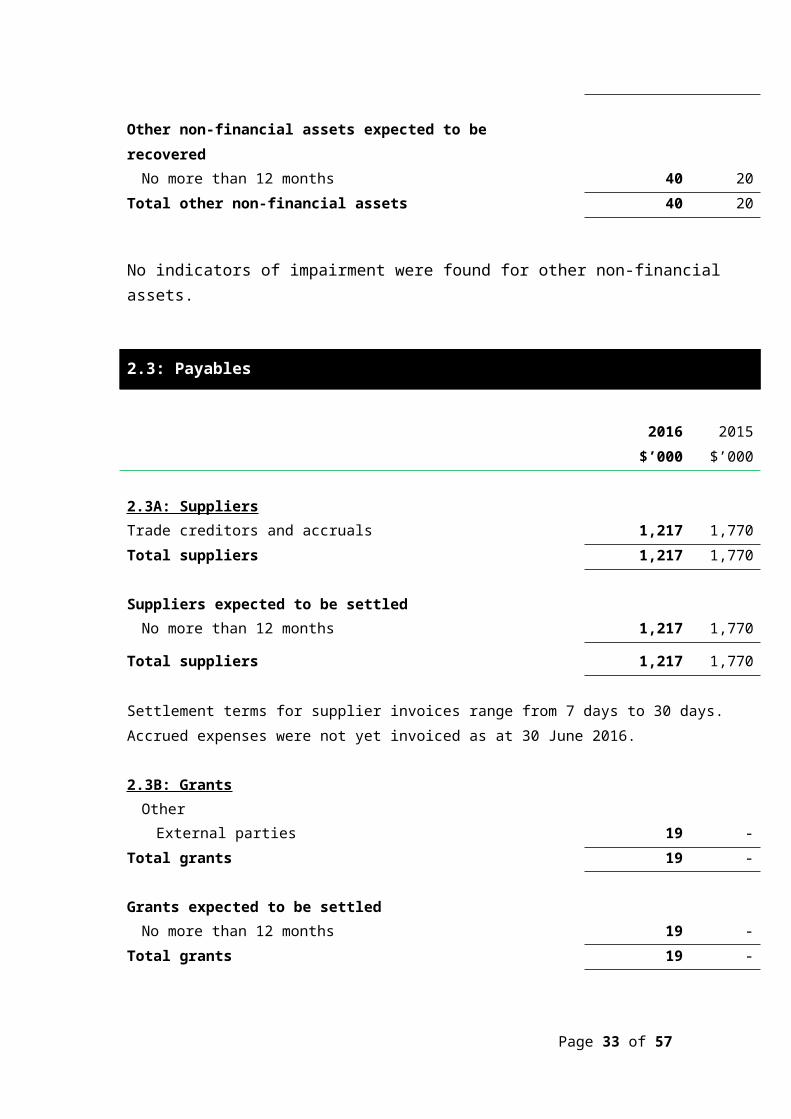
2.3: Payables
2016$’000
2015$’000
2.3A: SuppliersTrade creditors and accruals 1,217 1,770Total suppliers 1,217 1,770
Page 25 of 45

Suppliers expected to be settledNo more than 12 months 1,217 1,770
Total suppliers 1,217 1,770
Settlement terms for supplier invoices range from 7 days to 30 days. Accrued expenses were not yet invoiced as at 30 June 2016.
2.3B: GrantsOther
External parties 19 -Total grants 19 -
Grants expected to be settledNo more than 12 months 19 -
Total grants 19 -
Settlement terms for grants are within 30 days of providing a correctly rendered invoice.
2.3C: Other PayablesSalaries and wages 54 708Superannuation 7 67Other 135 18Total other payables 196 793
Other payables to be settledNo more than 12 months 196 793
Total other payables 196 793
Page 26 of 45

Funding This section identifies Safe Work Australia's funding structure.
3.1: Appropriations
3.1A: Annual Appropriations ('Recoverable GST exclusive')
Annual Appropriations for 2016
Appropriation Act PGPA Act
Annual Appropriation
$’000
Advance to the Finance
Minister$’000
Section 74 Receipts
$’000
Section 75 Transfers
$’000
Total appropriation
$’000
Appropriation applied in 2016
(current and prior years)
$’000Variance1
$’000
DepartmentalOrdinary annual services 9,632 - - - 9,632 9,625 7Capital Budget2 73 - - - 73 73 -
Total departmental 9,705 - - - 9,705 9,698 7
1. During 2016, $7,470 was withheld from Safe Work Australia's departmental appropriation under section 51 of the PGPA Act and quarantined for administrative purposes. This reduction was for Whole of Government savings relating to Public Sector Superannuation Accumulation Plan administration expenses.
2. Departmental Capital Budgets are appropriated through Appropriation Acts (No.1,3,5). They form part of ordinary annual services, and are not separately identified in the Appropriation Acts.
Page 27 of 45

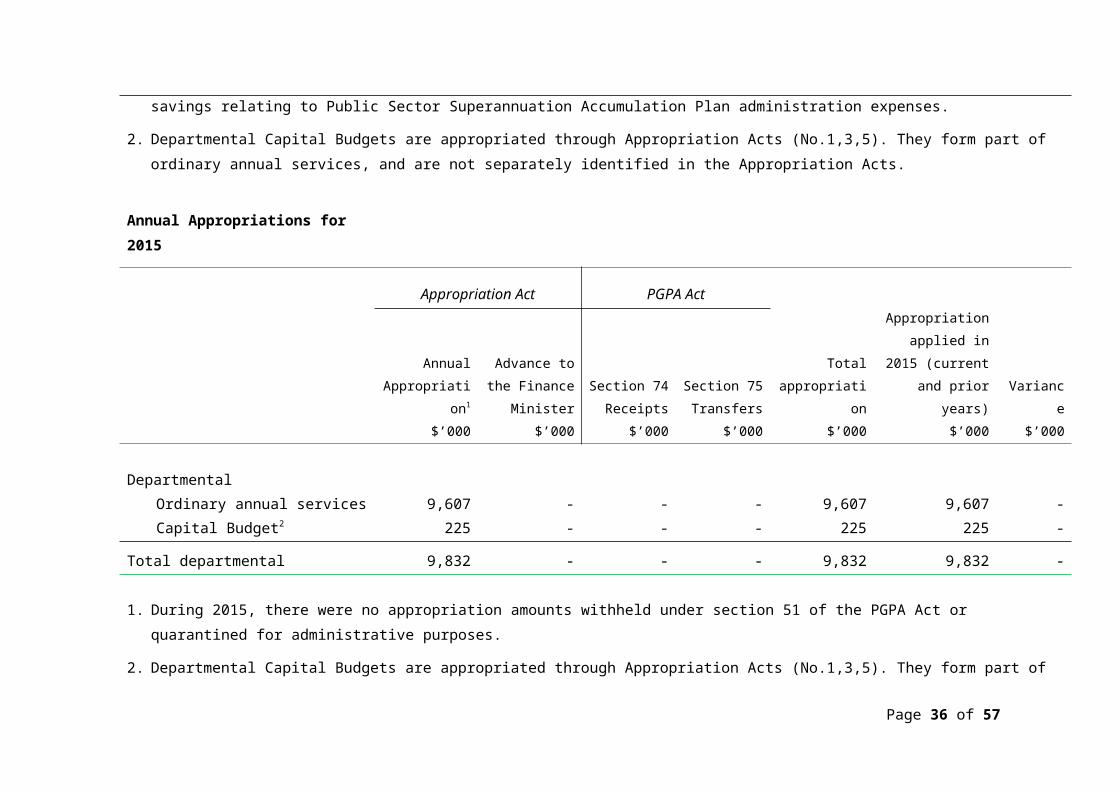
Annual Appropriations for 2015
Appropriation Act PGPA Act
Annual Appropriation1
$’000
Advance to the Finance Minister
$’000
Section 74 Receipts
$’000
Section 75 Transfers
$’000
Total appropriation
$’000
Appropriation applied in 2015
(current and prior years)$’000
Variance$’000
DepartmentalOrdinary annual services 9,607 - - - 9,607 9,607 -Capital Budget2 225 - - - 225 225 -
Total departmental 9,832 - - - 9,832 9,832 -
1. During 2015, there were no appropriation amounts withheld under section 51 of the PGPA Act or quarantined for administrative purposes.
2. Departmental Capital Budgets are appropriated through Appropriation Acts (No.1,3,5). They form part of ordinary annual services, and are not separately identified in the Appropriation Acts.
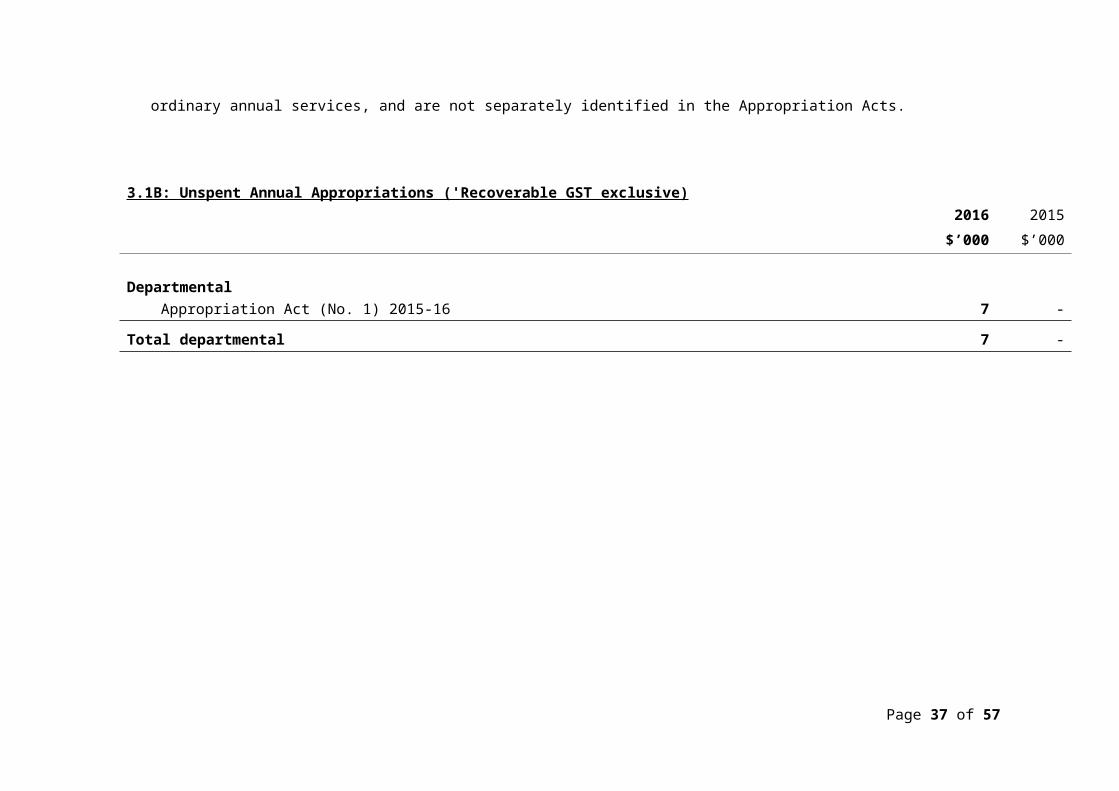
3.1B: Unspent Annual Appropriations ('Recoverable GST exclusive)2016
$’0002015$’000
DepartmentalAppropriation Act (No. 1) 2015-16 7 -
Total departmental 7 -
Page 28 of 45
Page 29 of 45

3.2: Special Accounts
Safe Work Australia Special Account1
2016$’000
2015$’000
Balance brought forward from previous period 12,636 10,708IncreasesAppropriation credited to Special Account 9,625 9,607Capital injection - Departmental Capital Budget 73 225Revenue from services 11,314 10,238Other receipts 10 9
Total increases 21,022 20,079
Available for payments 33,658 30,788
DecreasesDepartmentalPayments made to suppliers 7,724 6,134Payments made to employees 13,571 12,018Net GST paid 452 -
Total departmental 21,747 18,152
Total decreases 21,747 18,152
Total balance carried to the next period 11,911 12,636
1. Appropriation: Public Governance, Performance and Accountability Act 2013, section 80.
Establishing Instrument: The Safe Work Australia Special Account was established in accordance with section 64 of the Safe Work Australia Act 2008.
Purpose: To provide a source of finance to resource Safe Work Australia.
3.3: Net Cash Appropriation Arrangements
2016$’000
2015$’000
Total comprehensive income/(loss) less depreciation/amortisation 2,321 749
Page 30 of 45

expenses previously funded through revenue appropriationsTotal comprehensive income less depreciation/amortisation expenses previously funded through revenue appropriations 2,321 749Plus: depreciation/amortisation expenses previously funded through revenue appropriation 711 600Total comprehensive income/(loss) - as per the Statement of Comprehensive Income 3,032 1,349Total comprehensive income - as per the Statement of Comprehensive Income 3,032 1,349
3.4: Cash Flow Reconciliation
3.4A: Cash Flow Reconciliation
2016$’000
2015$’000
Reconciliation of cash and cash equivalents as per statement of financial position and cash flow statement
Cash and cash equivalents as perCash flow statement 375 294Statement of financial position 375 294
Discrepancy 0 0
Reconciliation of net cost of services to net cash from/(used by) operating activitiesNet(cost of)/contribution by services (6,509) (8,249)Revenue from Government 9,625 9,607Cash from (to) OPA 805 (1,936)
Adjustments for non-cash itemsDepreciation/amortisation 711 600Net write down of non-financial assets 4 9Gain on disposal of assets - (12)Resources received free of charge 44 51Gain on recognition of asset for first time (3,040) -
Movement in assets and liabilitiesAssets
(Increase)/Decrease in net receivables (10) 25(Increase)/Decrease in prepayments (20) 61(Increase)/Decrease in GST receivable 16 (60)
Page 31 of 45

LiabilitiesIncrease/(Decrease) in employee provisions 225 (374)Increase/(Decrease) in suppliers payables (395) (229)Increase/(Decrease) in other payables (712) 400Increase/(Decrease) in GST payable (25) -
Net cash from/(used by) operating activities 719 (107)
People and relationships This section describes a range of employment and post-employment benefits provided to our people and our relationships with other key people.
4.1: Employee Provisions
2016$’000
2015$’000
4.1A: Employee ProvisionsLeave 3,509 3,301
Total employee provisions 3,509 3,301
Employee provisions expected to be settledNo more than 12 months 1,255 1,188More than 12 months 2,254 2,113
Total employee provisions 3,509 3,301
Page 32 of 45
Page 33 of 45
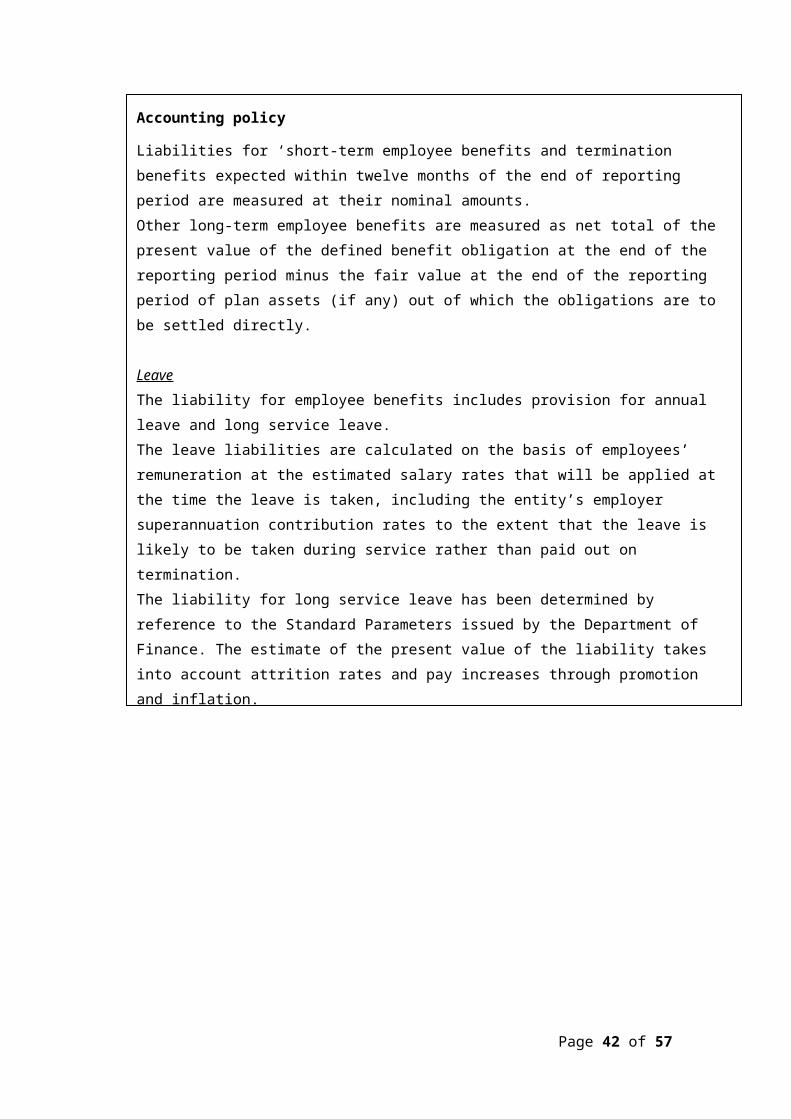
Accounting policy
Liabilities for ‘short-term employee benefits and termination benefits expected within twelve months of the end of reporting period are measured at their nominal amounts.Other long-term employee benefits are measured as net total of the present value of the defined benefit obligation at the end of the reporting period minus the fair value at the end of the reporting period of plan assets (if any) out of which the obligations are to be settled directly.
LeaveThe liability for employee benefits includes provision for annual leave and long service leave.The leave liabilities are calculated on the basis of employees’ remuneration at the estimated salary rates that will be applied at the time the leave is taken, including the entity’s employer superannuation contribution rates to the extent that the leave is likely to be taken during service rather than paid out on termination.The liability for long service leave has been determined by reference to the Standard Parameters issued by the Department of Finance. The estimate of the present value of the liability takes into account attrition rates and pay increases through promotion and inflation.
Separation and RedundancyProvision is made for separation and redundancy benefit payments. The entity recognises a provision for termination when it has developed a detailed formal plan for the terminations and has informed those employees affected that it will carry out the terminations.
SuperannuationThe entity's staff are members of the Commonwealth Superannuation Scheme (CSS), the Public Sector Superannuation Scheme (PSS), or the PSS accumulation plan (PSSap), or other superannuation funds held outside the Australian Government.The CSS and PSS are defined benefit schemes for the Australian Government. The PSSap is a defined contribution scheme.The liability for defined benefits is recognised in the financial statements of the Australian Government and is settled by the Australian Government in due course. This liability is reported in the Department of Finance’s administered schedules and notes.The entity makes employer contributions to the employees' defined benefit superannuation scheme at rates determined by an actuary to be sufficient to meet the current cost to the Government. The entity accounts for the contributions as if they were contributions to defined contribution plans.The liability for superannuation recognised as at 30 June represents outstanding contributions.

4.2: Senior Management Personnel Remuneration
2016$’000
2015$’000
Short-term employee benefitsSalary 983 959Motor vehicle and other allowances 37 40
Total short-term employee benefits 1,020 999
Post-employment benefitsSuperannuation 204 214
Total post-employment benefits 204 214
Other long-term employee benefitsAnnual leave 82 85Long-service leave 46 31
Total other long-term employee benefits 128 116
Termination benefitsVoluntary redundancy payments - 196
Total termination benefits - 196
Total senior executive remuneration expenses 1,352 1,526
Total number of senior management personnel included in the above table (Table 4.2): 2016: 5 (2015: 6).
Managing uncertainties This section analyses how Safe Work Australia manages financial risks within its operating environment.
5.1: Contingent Assets and Liabilities
Page 34 of 45

5.2: Financial Instruments
2016$’000
2015$’000
5.2A: Categories of Financial Instruments
Financial AssetsLoans and receivables
Cash and cash equivalents 375 294Goods and other receivables 142 158Accrued revenue 42 45
Total loans and receivables 559 497
Total financial assets 559 497
Financial LiabilitiesFinancial liabilities measured at amortised costSuppliers 1,217 1,770Other Payables 215 793
Total financial liabilities measured at amortised cost 1,432 2,563
Total financial liabilities 1,432 2,563
Page 35 of 45
Accounting Policy
Contingent liabilities and contingent assets are not recognised in the statement of financial position but are reported in the notes. They may arise from uncertainty as to the existence of a liability or asset or represent an asset or liability in respect of which the amount cannot be reliably measured. Contingent assets are disclosed when settlement is probable but not virtually certain and contingent liabilities are disclosed when settlement is greater than remote.
Safe Work Australia has no contingent liabilities or assets for the reporting period. The Agency is unaware of any quantifiable, unquantifiable or significant remote contingencies for the reporting period.
Page 36 of 45
Accounting Policy
Financial assetsSafe Work Australia classifies its financial assets in the following category:
a) loans and receivables.
The classification depends on the nature and purpose of the financial assets and is determined at the time of initial recognition. Financial assets are recognised and derecognised upon trade date.
Effective Interest MethodIncome is recognised on an effective interest rate basis except for financial assets that are recognised at fair value through profit or loss.
Loans and ReceivablesTrade receivables, loans and other receivables that have fixed or determinable payments that are not quoted in an active market are classified as 'loans and receivables'. Loans and receivables are measured at amortised cost using the effective interest method less impairment. Interest is recognised by applying the effective interest rate.
Page 37 of 45
Financial Assets at Fair Value Through Profit or LossFinancial assets are classified as financial assets at fair value through profit or loss where the financial assets:
a) have been acquired principally for the purpose of selling in the near future;b) are derivatives that are not designated and effective as a hedging instrument; orc) are parts of an identified portfolio of financial instruments that the entity manages
together and has a recent actual pattern of short-term profit-taking.Assets in this category are classified as current assets.
Financial assets at fair value through profit or loss are stated at fair value, with any resultant gain or loss recognised in profit or loss. The net gain or loss recognised in profit or loss incorporates any interest earned on the financial asset. Available-for-Sale Financial AssetsAvailable-for-sale financial assets are non-derivatives that are either designated in this category or not classified in any of the other categories.
Available-for-sale financial assets are recorded at fair value. Gains and losses arising from changes in fair value are recognised directly in reserves (equity) with the exception of impairment losses. Interest is calculated using the effective interest method and foreign exchange gains and losses on monetary assets are recognised directly in profit or loss. Where the asset is disposed of or is determined to be impaired, part (or all) of the cumulative gain or loss previously recognised in the reserve is included in surplus and deficit for the period.
Impairment of Financial AssetsFinancial assets are assessed for impairment at the end of each reporting period.Financial assets held at amortised cost - if there is objective evidence that an impairment loss has been incurred for loans and receivables, the amount of the loss is measured as the difference between the asset’s carrying amount and the present value of estimated future cash flows discounted at the asset’s original effective interest rate. The carrying amount is reduced by way of an allowance account. The loss is recognised in the Statement of Comprehensive Income.
Available for sale financial assets - if there is objective evidence that an impairment loss on an available-for-sale financial asset has been incurred, the amount of the difference between its cost, less principal repayments and amortisation, and its current fair value, less any impairment loss previously recognised in expenses, is transferred from equity to the Statement of Comprehensive Income.
Financial assets held at cost - if there is objective evidence that an impairment loss has been incurred, the amount of the impairment loss is the difference between the carrying amount of the asset and the present value of the estimated future cash flows discounted at the current market rate for similar assets.

2016$’000
2015$’000
5.2B: Fair Value of Financial Instruments
Carrying amount
2016$’000
Fair value 2016
$’000
Carrying amount
2015$’000
Fair value 2015$’000
Financial AssetsLoans and receivables 559 559 497 497
Total financial assets 559 559 497 497
Financial LiabilitiesFinancial liabilities measured at amortised cost 1,432 1,432 2,563 2,563
Total financial liabilities 1,432 1,432 2,563 2,563
5.2C: Credit Risk
Page 38 of 45
Financial liabilitiesFinancial liabilities are classified as other financial liabilities. Financial liabilities are recognised and derecognised upon ‘trade date’.
Financial Liabilities at Fair Value Through Profit or LossFinancial liabilities at fair value through profit or loss are initially measured at fair value. Subsequent fair value adjustments are recognised in profit or loss. The net gain or loss recognised in profit or loss incorporates any interest paid on the financial liability.
Other Financial LiabilitiesOther financial liabilities, including borrowings, are initially measured at fair value, net of transaction costs. These liabilities are subsequently measured at amortised cost using the effective interest method, with interest expense recognised on an effective interest basis. Supplier and other payables are recognised at amortised cost. Liabilities are recognised to the extent that the goods or services have been received (and irrespective of having been invoiced).

Safe Work Australia was exposed to minimal credit risk as the majority of loans and receivables comprises cash, appropriations receivable and statutory receivables (GST receivable from the Australian Taxation Office). The maximum exposure to credit risk is the risk that arises from potential default of a debtor. This amount is equal to the total amount of trade debtors, which is $141,790 (2015: $157,953).
No collateral is held by Safe Work Australia to mitigate against credit risk.
Credit quality of financial assets not past due or individually determined as impaired
Not past due nor impaired
2016$’000
Not past due nor impaired
2015$’000
Past due or impaired
2016$’000
Past due or
impaired 2015$’000
Loans and receivables 559 458 - `
Total 559 458 - -
Ageing of financial assets that were past due but not impaired in 2016
0 to 30 days$’000
31 to 60 days$’000
61 to 90
days$’000
90+ days$’000
Total
$’000
Loans and receivables - - - - -
Total - - - - -
Ageing of financial assets that were past due but not impaired in 2015
0 to 30 days
$’000
31 to 60 days
$’000
61 to 90
days$’000
90+ days
$’000
Total$’00
0
Loans and receivables 39 - - - 39
Total 39 - - - 39
No assets have been individually assessed as impaired.
Page 39 of 45

5.2D: Liquidity Risk
Liquidity risk is the risk that Safe Work Australia will not be able to meet its obligations as they fall due.Safe Work Australia has sufficient available financial assets to meet all financial liabilities at 30 June 2016. The Agency is jointly funded by the Commonwealth and State and Territory governments and manages its budgeted funds to ensure it is able to meet payments as they fall due. In addition, the Agency has policies in place to ensure timely payments are made when due and has no past experience of default.
Maturities for non-derivative financial liabilities in 2016
On demand$’000
Within 1 year
$’000
Between 1 to 2 years
$’000
Between 2 to 5 years
$’000
More than 5 years
$’000Total$’000
Trade creditors and accruals 1,432 - - - - 1,432
Total 1,432 - - - - 1,432
Maturities for non-derivative financial liabilities in 2016
On demand$’000
Within 1 year
$’000
Between 1 to 2 years
$’000
Between 2 to 5 years
$’000
More than 5 years$’000
Total$’000
Trade creditors and accruals 2,563 - - - - 2,563
Total 2,563 - - - - 2,563
5.2E: Market Risk
Safe Work Australia holds basic financial instruments that do not expose the Agency to market risks such as 'currency risk' or 'interest raterisk'.
Page 40 of 45

Page 41 of 45
5.3: Fair Value Measurement
The following tables provide an analysis of assets and liabilities that are measured at fair value. The remaining assets and liabilities disclosed in the statement of financial position do not apply the fair value hierarchy.The different levels of the fair value hierarchy are defined below.Level 1: Quoted prices (unadjusted) in active markets for identical assets or liabilities that the entity can access at measurement date.Level 2: Inputs other than quoted prices included within Level 1 that are observable for the asset or liability, either directly or indirectly.Level 3: Unobservable inputs for the asset or liability.
Page 42 of 45
Accounting Policy
Safe Work Australia engaged the services of the Australian Valuation Solutions (AVS) to conduct a detailed external valuation of non-financial assets at 30 June 2016 and has relied upon those outcomes to establish carrying amounts. An annual assessment is undertaken to determine whether the carrying amount of the assets is materially different from the fair value. Comprehensive valuations carried out at least once every three years. AVS has provided written assurance to SWA that the models developed are in compliance with AASB 13.The methods utilised to determine and substantiate the unobservable inputs are derived and evaluated as follows:
Physical Depreciation and Obsolescence - Assets that do not transact with enough frequency or transparency to develop objective opinions of value from observable market evidence have been measured utilising the Depreciated Replacement Cost approach. Under the Depreciated Replacement Cost approach the estimated cost to replace the asset is calculated and then adjusted to take into account physical depreciation and obsolescence. Physical depreciation and obsolescence has been determined based on professional judgement regarding physical, economic and external obsolescence factors relevant to the asset under consideration. For all Leasehold Improvement assets, the consumed economic benefit / asset obsolescence deduction is determined based on the term of the associated lease.
Safe Work Australia's policy is to recognise transfers into and transfers out of fair value hierarchy levels as at the end of the reporting period. There were no transfers between levels for 2016.
A number of property, plant and equipment assets were invoiced and capitalised after the external valuation took place. These assets are recorded at cost.

5.3A Fair Value Measurement
Fair value measurements at the end of the reporting period
2016$’000
2015$#’000
Category (Level 1, 2 or 3) 3,4
Valuation Technique(s) Inputs used
Non-financial assets2
Buildings 3,048 130 Level 3 Depreciated replacement cost (2015: Depreciated replacement cost)
Building costs per square metre; physical depreciation and obsolescence
Plant and equipment 172 154 Level 2 Market approach (2015: Market approach)
Prices and relevant market transactions for similar assets
1. No non-financial assets were measured at fair value on a non-recurring basis as at 30 June 2016 (2015: Nil).
2. Safe Work Australia's assets are held for operational purposes and not held for the purposes of deriving a profit. The current use of all non-financial assets is considered their highest and best use.
3. There were no transfers between levels for recurring fair value measurements during the year.
4. The remaining assets and liabilities reported by Safe Work Australia are not measured at fair value in the Statement of Financial Position.
5.3B: Reconciliation for Recurring Level 3 Fair Value Measurements
Financial assets
Non-financial assets
Financial liabilities
Non-financial liabilities
Buildings2016
$’0002015$’000
2016$’000
2015$’000
2016$’000
2015$’000
2016$’000
2015$’000
As at 1 JulyAs at 1 JulyTotal gains/(losses) recognised in other
- -
- -
130(81)
651 -
- -
- -
- -
- -
Page 43 of 45

comprehensive income1
Leasehold fitout received free of charge
- - 3,040 - - - - -
Purchases 593Depreciation - - (634) (521) - - - -
Total as at 30 June - - 3,048 130 - - - -
1. These gains/(losses) are presented in the Statement of Comprehensive Income under Changes in Asset Revaluation Surplus.
Other information
6.1: Reporting of Outcomes
Safe Work Australia has one outcome: Outcome 1: Healthier, safer and more productive workplaces through improvements to Australian work health and safety and workers' compensation arrangements.
Outcome 11 Total2016
$’0002015$’000
2016$’000
2015$’000
ExpensesEmployee benefits 13,081 11,970 13,081 11,970Suppliers 5,885 5,888 5,885 5,888Grants 196 - 196 -Depreciation and amortisation 711 600 711 600Write-down and impairment of assets 4 9 4 9
Total expenses 19,877 18,467 19,877 18,467
Own-source income - -Sale of goods and rendering of services 10,274 10,155 10,274 10,155Other Revenue 3,094 63 3,094 63
Total own-source income 13,368 10,218 13,368 10,218
Net cost/(contribution) of outcome delivery 6,509 8,249 6,509 8,249
AssetsFinancial assets 12,166 12,957 12,166 12,957Non-financial assets 3,288 315 3,288 315
Total assets 15,454 13,272 15,454 13,272
Page 44 of 45

LiabilitiesPayables 1,432 2,564 1,432 2,564Provisions 3,509 3,301 3,509 3,301
Total liabilities 4,941 5,865 4,941 5,865
1. Outcome 1 is described in the Overview. Net costs shown included intra-government costs that were eliminated in calculating the actual Budget Outcome. Refer to Outcome 1 Resourcing Table on page 10 of this Annual Report. Safe Work Australia has only one Outcome. Refer to the Statement of Financial Position for further details about the classes of assets and liabilities.
Page 45 of 45
Related Documents


