Safe separation distance score: a new metric for evaluating wildland firefighter safety zones using lidar Michael J. Campbell a , Philip E. Dennison a and Bret W. Butler b a Department of Geography, University of Utah, Salt Lake City, UT, USA; b US Forest Service, Rocky Mountain Research Station, Missoula Fire Sciences Laboratory, Missoula, MT, USA ABSTRACT Safety zones are areas where firefighters can retreat to in order to avoid bodily harm when threatened by burnover or entrapment from wildland fire. At present, safety zones are primarily desig- nated by firefighting personnel as part of daily fire management activities. Though critical to safety zone assessment, the effective- ness of this approach is inherently limited by the individual fire- fighter’s or crew boss’s ability to accurately and consistently interpret vegetation conditions, topography, and spatial character- istics of potential safety zones (e.g. area and geometry of a forest clearing). In order to facilitate the safety zone identification and characterization process, this study introduces a new metric for safety zone evaluation: the Safe Separation Distance Score (SSDS). The SSDS is a numerical representation of the relative suitability of a given area as a safety zone according to its size, geometry, and surrounding vegetation height. This paper describes an algorithm for calculating pixel-based and polygon-based SSDS from lidar data. SSDS is calculated for every potential safety zone within a lidar dataset covering Tahoe National Forest, California, USA. A total of 2367 potential safety zones with an SSDS ≥1 were mapped, representing areas that are suitable for fires burning in low wind and low slope conditions. The highest SSDS calculated within the study area was 9.65, a score that represents suitability in the highest wind-steepest slope conditions. Potential safety zones were clustered in space, with areas in the northern and eastern portions of the National Forest containing an abundance of safety zones while areas to the south and west were completely devoid of them. SSDS can be calculated for potential safety zones in advance of firefighting, and can allow firefighters to carefully compare and select safety zones based on their location, terrain, and wind conditions. This technique shows promise as a standard method for objectively identifying and ranking safety zones on a spatial basis. ARTICLE HISTORY Received 8 August 2016 Accepted 1 December 2016 KEYWORDS Wildfire; firefighters; safety zones; lidar; GIS 1 Introduction Between 1910 and 2015, there were 1087 documented wildland firefighter fatalities in the United States (National Interagency Fire Center 2016). The causes of fatalities vary greatly (Figure 1), but the leading causes fall into the category of burnovers, CONTACT Michael J. Campbell [email protected] INTERNATIONAL JOURNAL OF GEOGRAPHICAL INFORMATION SCIENCE, 2017 VOL. 31, NO. 7, 1448–1466 http://dx.doi.org/10.1080/13658816.2016.1270453 © 2016 Informa UK Limited, trading as Taylor & Francis Group

Welcome message from author
This document is posted to help you gain knowledge. Please leave a comment to let me know what you think about it! Share it to your friends and learn new things together.
Transcript

Safe separation distance score: a new metric for evaluatingwildland firefighter safety zones using lidarMichael J. Campbella, Philip E. Dennisona and Bret W. Butlerb
aDepartment of Geography, University of Utah, Salt Lake City, UT, USA; bUS Forest Service, Rocky MountainResearch Station, Missoula Fire Sciences Laboratory, Missoula, MT, USA
ABSTRACTSafety zones are areas where firefighters can retreat to in order toavoid bodily harm when threatened by burnover or entrapmentfrom wildland fire. At present, safety zones are primarily desig-nated by firefighting personnel as part of daily fire managementactivities. Though critical to safety zone assessment, the effective-ness of this approach is inherently limited by the individual fire-fighter’s or crew boss’s ability to accurately and consistentlyinterpret vegetation conditions, topography, and spatial character-istics of potential safety zones (e.g. area and geometry of a forestclearing). In order to facilitate the safety zone identification andcharacterization process, this study introduces a new metric forsafety zone evaluation: the Safe Separation Distance Score (SSDS).The SSDS is a numerical representation of the relative suitability ofa given area as a safety zone according to its size, geometry, andsurrounding vegetation height. This paper describes an algorithmfor calculating pixel-based and polygon-based SSDS from lidardata. SSDS is calculated for every potential safety zone within alidar dataset covering Tahoe National Forest, California, USA. Atotal of 2367 potential safety zones with an SSDS ≥1 weremapped, representing areas that are suitable for fires burning inlow wind and low slope conditions. The highest SSDS calculatedwithin the study area was 9.65, a score that represents suitabilityin the highest wind-steepest slope conditions. Potential safetyzones were clustered in space, with areas in the northern andeastern portions of the National Forest containing an abundanceof safety zones while areas to the south and west were completelydevoid of them. SSDS can be calculated for potential safety zonesin advance of firefighting, and can allow firefighters to carefullycompare and select safety zones based on their location, terrain,and wind conditions. This technique shows promise as a standardmethod for objectively identifying and ranking safety zones on aspatial basis.
ARTICLE HISTORYReceived 8 August 2016Accepted 1 December 2016
KEYWORDSWildfire; firefighters; safetyzones; lidar; GIS
1 Introduction
Between 1910 and 2015, there were 1087 documented wildland firefighter fatalities inthe United States (National Interagency Fire Center 2016). The causes of fatalities varygreatly (Figure 1), but the leading causes fall into the category of burnovers,
CONTACT Michael J. Campbell [email protected]
INTERNATIONAL JOURNAL OF GEOGRAPHICAL INFORMATION SCIENCE, 2017VOL. 31, NO. 7, 1448–1466http://dx.doi.org/10.1080/13658816.2016.1270453
© 2016 Informa UK Limited, trading as Taylor & Francis Group

entrapments, burns and asphyxiation (BEBA). BEBA are the direct result of fatal exposureto excessive heat, fire, and/or smoke and comprise 45% of the total fatalities from 1910to 2015. Burnover results from fire rapidly overtaking firefighting personnel before theycan move to a safe area, and entrapment indicates that firefighters’ ability to move to asafe area is compromised. Though BEBA have declined as a percentage of total fatalitiesin recent decades (Figure 1), burnover and entrapment have been implicated in recenttragic incidents involving multiple fatalities, including 14 firefighters in the 1994 SouthCanyon fire in Colorado and 19 firefighters in the 2013 Yarnell Hill fire in Arizona (Butleret al. 1998, Arizona State Forestry Division 2013). These events are not limited to theUnited States. For example, in 2010, 44 police and firefighters were entrapped andultimately perished in the 2010 Mount Carmel Fire in Israel (United Nations Office forthe Coordination of Humanitarian Affairs 2010).
Gleason (1991) proposed a system of interdependent safety measures to reducefirefighter risk of burnover and entrapment: lookouts, communications, escape routes,and safety zones (LCES). Safety zones are a critical component of this system, essentiallyareas large enough to allow firefighters to escape the harmful effects of fire (Beighley1995). According to the US National Wildfire Coordinating Group (NWCG) IncidentResponse Pocket Guide (IRPG), LCES should be established and known to all membersof a fire crew before it is needed (NWCG 2014). The IRPG indicates that safety zones canbe areas that have already burned, can be natural (rock areas, water, meadows) orconstructed (clear-cuts, roads, helicopter landing zones), and should be scouted for sizeand hazards. If they are upslope of flames, downwind of flames, or adjacent to particu-larly heavy fuels, a larger safety zone is needed (National Wildfire Coordinating Group2014).
Safety zones must be large enough to hold firefighting personnel and equipment,and should provide a safe separation distance (SSD) between vegetation and these
Figure 1. Wildland firefighter fatalities by type (BEBA = burnover, entrapment, burns, and asphyxia-tion; VHA = vehicle, helicopter, aircraft; HA = heart attack; OM = other medical; TS = tree, snag)(National Interagency Fire Center 2016).
INTERNATIONAL JOURNAL OF GEOGRAPHICAL INFORMATION SCIENCE 1449

assets (Figure 2). The SSD must be large enough that heat from the wildfire is reduced tothe point that a fire shelter is not necessary to prevent firefighter injury. The currentNWCG guideline for estimating SSD comes from Butler and Cohen (1998a), who deter-mined, based on radiant heat modeling, that SSD should be equal to or greater thanfour times flame height. This guideline assumes flat terrain and does not account forconvective heat transfer, which can strongly contribute to firefighter heat exposure(Butler 2014, Butler et al. 2015).
Relatively few studies have attempted to characterize convective heat flux in a wild-land fire environment, due to its inherent complexity and measurement difficulty.Frankman et al. (2013) demonstrated the varied but significant effects of convectiveenergy flux (both heating and cooling), which were heavily influenced by fuel, wind, andterrain conditions. Zarate et al. (2008) suggested adding a 20% increase in SSD toaccount for the additional convective heat flux. Butler et al. (2015) point out thatexposure to high winds and adjacency to steep slopes has the potential to transferconvective heat as far as two to three flame lengths ahead of the fire front. To accountfor convective heat flux, Butler (2015) proposed that the SSD calculation can be adjustedusing a ‘slope-wind factor’ (Δ):
SSD ¼ 8� Hv � Δ; (1)
where Hv is vegetation height. For flat terrain and low wind speeds, SSD is simplyeight times vegetation height, identical to the current NWCG guideline (assuming flameheight is equal to two times the vegetation height). Although flame height will notalways be equal to twice the vegetation height, it is a useful approximation for crownfire conditions, enabling a broad-scale pre-fire assessment of SSD based on existingvegetation conditions, rather than requiring that firefighters predict flame heights. Asslope and wind speed increase, the slope-wind factor increases to provide a larger SSD
Figure 2. Basic safety zone example diagram (after Dennison et al. 2014).
1450 M. J. CAMPBELL ET AL.

value. Examples of slope-wind factors from Butler (2015) are shown in Table 1. Based onthe slope-wind factor, a potential safety zone sufficient for flat terrain and moderatewind speed (SSD = 8 × Hv × 1.5) could be too small for flat terrain and strong windspeed (SSD = 8 × Hv × 3).
Field estimates of safety zone geometry and surrounding vegetation height, whichare used to calculate SSD, are prone to large errors (Bechtold et al. 1998, Steele 2000).This study demonstrates a method for identifying, evaluating and mapping the relativesuitability of all potential safety zones throughout a given area in order to improve theprocess of safety zone designation. Specifically, the objectives of this study are (1) tointroduce a new metric for evaluating potential safety zones, based on safety zonegeometry, area, surrounding vegetation height, and number of firefighting personnelpresent: the Safe Separation Distance Score (SSDS), (2) to develop an algorithm to mapSSDS using lidar data, and (3) to test the implementation of the algorithm on a lidardataset from Tahoe National Forest.
2 Methods
2.1 Data and study area
Lidar is a type of active remote-sensing system that enables the generation of very highspatial resolution three-dimensional models of terrain and above-ground structure(vegetation, buildings, etc.) (Lefsky et al. 2002). Discrete return lidar instruments, whichare typically mounted on an aircraft, emit hundreds of thousands of individual pulses oflaser light to the ground every second. The light in each pulse interacts with features onthe ground and reflects back to the sensor. Extremely accurate measurement of theelapsed time between light transmission and reception enables calculation of a preciseelevation of the reflective object (Lefsky et al. 2002). The result of such data collection istypically a point cloud comprised of millions of points, each with an associated x, y, andz value. In order to be able to extract useful information from a lidar point cloud, pointsare generally classified into ground and non-ground (e.g. vegetation and buildings)(Meng et al. 2010). Many methods exist for ground point classification, the accuraciesof which vary significantly according to the method used, the terrain conditions and thedegree to which surface features obscure the ground surface (Reutebuch et al. 2003).Discrete ground points can be interpolated into digital terrain models (DTMs), which arecontinuous raster representations of the ground surface (Kraus and Pfeifer 2001). In thepresence of vegetation, lidar pulses typically interact with several surfaces prior toreaching the ground surface. In these cases, the ‘last return’ can often, though notalways, represent the ground surface, while the ‘first return’ represents the elevation of
Table 1. Slope-wind factor safe separation distance matrix from Butler (2015).Slope-wind factor (Δ)
Slope (%)
Wind speed (ms−1) Flat (<20%) 21–30% 31–50% >50%
Light (0–3) 1 1 3 5Moderate (4–7) 1.5 2 4 6Strong (8–13) 3 3 6 7.5Very strong (>13) 4.5 5 7 9
INTERNATIONAL JOURNAL OF GEOGRAPHICAL INFORMATION SCIENCE 1451

the highest reflective surface. First return points can be interpolated to generate a digitalsurface model (DSM). In the absence of above-ground objects (e.g. bare soil), surface andterrain model pixel values should be equal. Vegetation height can be computed bysubtracting terrain elevations from surface elevations (Dubayah and Drake 2000,Popescu et al. 2002). Dennison et al. (2014) used lidar to map safety zones for differentexpected flame heights, but did not directly utilize variable vegetation height informa-tion provided by lidar data.
SSDS were calculated for potential safety zones within Tahoe National Forest,California, USA. A lidar-derived DTM and DSM, each with a spatial resolution of 1.0 m,were obtained from the US Forest Service (Figure 3). The raw point cloud data fromwhich these datasets were derived were collected between 2013 and 2014 with anaverage pulse density of 8 pulses/m2.
The study area encompasses 5335 km2, 4549 km2 (85%) of which is within the TahoeNational Forest administrative boundary. There is a wide range of elevations throughout thestudy area, from 268 m at its lowest point to 2813m at the highest with a mean elevation of1686 m. The land cover is primarily composed of conifer forest (77%), shrubland (8%),riparian vegetation (4%), sparse vegetation (3%), hardwood forest (2%), and grassland (1%),with the remaining area being a combination of a variety of rarer cover types, includingdeveloped land (LANDFIRE 2012). Within the dominant conifer class, the distribution offorest types is as follows: Douglas-fir (Pseudostuga menziesii)/grand fir (Abies grandis)/whitefir (Abies concolor) mix (34%), red fir (Abies magnifica) (28%)/Douglas-fir (Pseudotsuga
Figure 3. Study area map.
1452 M. J. CAMPBELL ET AL.

menziesii)/ponderosa pine (Pinus ponderosa)/lodgepole pine (Pinus contorta) mix (21%),ponderosa pine (Pinus ponderosa) (15%), and other conifer (2%).
2.2 Safety zone model
SSDS is a unitless value that is attributed to a forest clearing that provides firefightingpersonnel with an estimate of the relative suitability of that clearing as a safety zoneaccording to its area, geometry, surrounding vegetation height, and number of fire-fighting personnel and equipment present. SSDS can be compared directly to the slope-wind factor for expected wind speed and slope (Table 1) to determine whether a specificsafety zone is adequate for expected conditions. Using lidar data, an SSDS can becalculated for all potential safety zones within an area. Multiple geospatial data proces-sing steps are required to calculate SSDS from a lidar-derived terrain and surface models.An automated model was developed in Python using primarily ESRI ArcGIS tools tofacilitate the safety zone analysis across a relatively large study area with many forestclearings varying in size, shape, and surrounding vegetation conditions. This sectiondescribes, in detail, the model workflow.
In order to be able to assess vegetation height, a canopy height model (CHM) wasgenerated by subtracting the terrain elevation from the surface elevation for each pixel(x,y), such that:
CHM x;yð Þ¼ DSM x;yð Þ � DTM x;yð Þ; (2)
where DSM is the digital surface model and DTM is the digital terrain model. The resultingraster dataset contained a pixel-based representation of height, in meters, above theground surface (Figure 4(a)). In order to locate forest clearings, a tree/non-tree map wasgenerated using a simple height threshold classification, wherein all CHM values less than1m in height were classified as ‘non-tree’ and all CHM values equal to or greater than 1m inheight were classified as ‘tree’. A kernel filtering process was then applied to the tree/non-tree classification to eliminate small and/or isolated trees that would be unlikely, in a wildfiresetting, to have sufficient connectivity to surrounding fuels to negatively affect the qualityof an otherwise open area as a safety zone (Dennison et al. 2014). A 10% threshold within acircular kernel 30 m in diameter was used for filtering. If the area classified as ‘tree’ was lessthan 10% of the 30m kernel, it was reclassified to ‘non-tree’. Both the diameter of the kerneland the percent threshold are important parameters of the model that have direct impactson the resultant classification of clearings versus treed areas, but for the purposes of thisstudy, no sensitivity tests were performed to determine their relative effects on resultingsafety zone maps.
Clearings were located by buffering the ‘tree’ pixels by 8 m and identifying thoseareas remaining beyond the extent of the buffers. Eight meters was used because in abest-case scenario (low wind, low slope, 1 m tall surrounding trees), the safe separationdistance would be 8 m (8 × 1 m × 1). Clearings were then buffered back to the forestedge by 8 m, in order to represent the full extent of the clearing. Figure 4(b) illustratesone such clearing, though it should be noted that (Figure 4), as a whole, illustrates asingle example of processes performed on nearly 86,000 clearings throughout the studyarea.
INTERNATIONAL JOURNAL OF GEOGRAPHICAL INFORMATION SCIENCE 1453
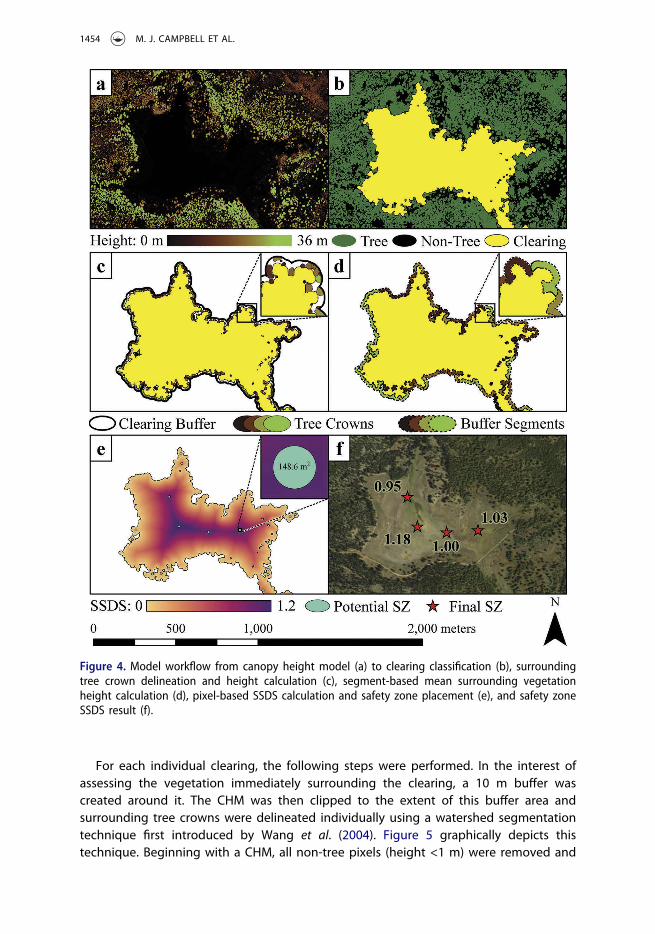
For each individual clearing, the following steps were performed. In the interest ofassessing the vegetation immediately surrounding the clearing, a 10 m buffer wascreated around it. The CHM was then clipped to the extent of this buffer area andsurrounding tree crowns were delineated individually using a watershed segmentationtechnique first introduced by Wang et al. (2004). Figure 5 graphically depicts thistechnique. Beginning with a CHM, all non-tree pixels (height <1 m) were removed and
Figure 4. Model workflow from canopy height model (a) to clearing classification (b), surroundingtree crown delineation and height calculation (c), segment-based mean surrounding vegetationheight calculation (d), pixel-based SSDS calculation and safety zone placement (e), and safety zoneSSDS result (f).
1454 M. J. CAMPBELL ET AL.

Figure 5. Tree crown delineation method.
INTERNATIONAL JOURNAL OF GEOGRAPHICAL INFORMATION SCIENCE 1455

the resulting raster was inverted (multiplied by −1) to create tree ‘basins’ out of whatwere previously tree peaks. A ‘flow direction’ image was then generated which simulatesthe flow of water within each of these tree basins. Because these basins all draininternally (because, in reality, each tree comes to an individual peak), we then delineateindividual basins, or watersheds, which generate a raster approximation of individualtree crowns. These tree crowns are then converted to a vector polygon for furtheranalysis.
Tree crown polygons were used to calculate individual tree heights by computinga within-polygon maximum CHM value. As Figure 4(c) highlights, the result of thisprocess was an array of polygons surrounding the clearing, each of which has anassociated height. However, to analyze the effect of each individual tree height onSSD would be extremely processing-intensive, rendering an algorithm such as thisineffective for application on a broad scale. On the other hand, to compute a singlemean surrounding vegetation height for an entire clearing would be an over-general-ization, particularly for large clearings where surrounding vegetation heights can varysignificantly from one portion of their perimeter to another. This variability in vegeta-tion height is important to capture, as it will have direct impacts on where the safetyzone should be located within a clearing (further from areas with taller vegetation,closer to areas with shorter vegetation). Thus, mean surrounding vegetation heightwas calculated within each of a series of buffer segments, each 10 m wide androughly 100 m in length, surrounding each clearing (Figure 4(d)). Mean tree heightwas weighted by tree crown area to avoid the downward-bias resulting from thelikely presence of a greater number of smaller (and shorter) trees than larger (andtaller) trees, such that:
Hv ¼Pn
i¼1 ai � hiPni¼1 ai
; (3)
where a is crown area and h is height for each individual tree crown i. For each linearbuffer, Euclidean distance from surrounding vegetation was then calculated on a con-tinuous pixel basis within the clearing. Using mean vegetation height and distance fromsurrounding vegetation for each pixel (x,y) within the clearing, a pixel-based SSDS(x,y)was calculated, such that:
SSDS x;yð Þ ¼ED x;yð Þ8� Hvð Þ ; (4)
where ED(x,y) is the Euclidean distance from vegetation raster data for each pixel (x,y).This SSDS calculation is essentially a transformation of the proposed SSD equation(Equation (1)), substituting the Euclidean distance raster data for SSD and solving forΔ on a pixel-by-pixel basis, thus making SSDS and Δ directly comparable values. As aresult of this calculation, each clearing had a series of individual SSDS raster layers, eachassociated with one of the linear buffers surrounding the clearing. A single clearing-wideSSDS raster is then generated by computing a pixel-by-pixel minimum SSDS valueamong each of the contributing SSDS rasters.
Most often the clearings that emerged from this mapping process were irregularly-shaped, unlike the simplified case illustrated in (Figure 2). Figure 4 highlights one such
1456 M. J. CAMPBELL ET AL.

irregular clearing. Though it maintained non-tree connectivity throughout the clearing,its large size and irregular shape could enable the placement of multiple safety zoneswithin. From a geospatial standpoint, one can clearly see in Figure 4(e) how there areseveral local maxima of SSDS within the clearing due to the effects of clearing geometryand variable surrounding vegetation height. In order to address this we employedanother watershed-based approach for locating safety zones within the clearing. Thisinvolved taking the inverse of the SSDS raster (multiplying SSDS by −1 to form SSDS‘basins’), calculating ‘flow direction’, and locating ‘sinks’, or areas of internal drainage,the results of which represent the points of local maximum SSDS, or the safest pointswithin each distinct portion of the clearing (Figure 4(e)).
The last critical variable addressed in this model is firefighter crew size. Safety zonesneed to be large enough to accommodate both personnel and equipment (e.g.engines). Andrews (2009) suggests 4.6 m2 (50 ft2) is required for each crew memberand 27.9 m2 (300 ft2) is required for each engine. For the purpose of this study, anassumed crew size of 20 firefighters and 2 engines was used, requiring a minimumsafety zone area of 148.6 m2. Circular areas of this size, representing potential safetyzones where firefighters and equipment would assemble, were centered on the pointsof local maximum SSDS (Figure 4(e)). Rather than use this highest SSDS to represent theentire safety zone, however, the lowest within-safety zone SSDS is used, because thisrepresents the relative safety of the zone on its outside edge. Again, because SSDSvalues are directly comparable to Δ values, we can determine that, because the lowestpossible Δ is 1, then any safety zone with an SSDS <1 will be unsuitable in any wind andterrain conditions. Thus, all potential safety zones with an SSDS much less than 1 areeliminated from consideration. However, given the continuous nature of SSDS, onecould still identify perhaps sub-optimal but still viable safety zones with SSDS of 0.9 or0.95, if these are the only options available to a fire crew, as seen in (Figure 4(f)).
Finally, a slope raster dataset is calculated throughout the entire study area using thelidar-derived DTM. Mean slope is then computed within each safety zone. The resultingsafety zone polygons each have an associated SSDS and slope written to the attributetable. Since SSDS is derived directly from the proposed SSD equation, SSDS values canthen be queried and compared to the Δ values in the slope-wind factor matrix todetermine the relative suitability of that clearing as a potential safety zone. For example,if a safety zone has an SSDS of 1.5, it is suitable in all conditions where a Δ of 1.5 or lessis required.
3 Results
The resulting map of potential safety zones with associated SSDS values (greater than 1)throughout the study area can be seen in Figure 6. As the map highlights, there arerelatively few safety zones that have an SSDS of 1 or greater, which is to say that at thetime of lidar acquisition, the vegetation conditions found within the study area wouldoffer relatively few potential safety zones that are sufficiently large in even the best-case(low wind and low slope) scenarios. Clustering of potential safety zones is clearlyevident, particularly in the northeastern portion of the study area. Much of the vegeta-tion in this area was burned in the high severity Cottonwood fire in 1994. Althoughroughly 20 years passed between the Cottonwood fire and the lidar data acquisition, the
INTERNATIONAL JOURNAL OF GEOGRAPHICAL INFORMATION SCIENCE 1457

subsequent slow regeneration of vegetation in certain areas of the fire lends itself wellto use as potential safety zones, according to the results of our model. Potential safetyzones are particularly sparse in the southern and western portions of the study area,where continuous swaths of forest, 400 km2 or greater in area, are entirely devoid ofpotential safety zones even at the lowest recommended SSDS of 1. It should be notedthat many of the largest safety zones with the highest SSDS values are lakes. While lakesmay seem like an ideal safety zone (no slope, vegetation, or possibility of burning), theypresent their own set of risks, such as drowning or hypothermia (Butler 2014). Theresulting safety zones were compared to the USGS National Hydrography Dataset, andall of those that fell within a waterbody were removed.
Table 2 provides a tabular account of the number of potentially viable safety zones ineach combination of wind speed and slope according to resulting SSDS. It stands to reason
Figure 6. Potential safety zones with associated safe separation distance score values throughoutthe study area. The area burned by the 1994 Cottonwood fire is outlined in red.
Table 2. Number of suitable safety zones in each combination of wind speed and slope according toSSDS values.
Slope (%)
Wind speed (ms−1) Flat (<20%) 21–30% 31–50% >50%
Light (0–3) 2367 2367 99 15Moderate (4–7) 881 352 30 7Strong (8–13) 99 99 7 2Very strong (>13) 19 15 2 2
1458 M. J. CAMPBELL ET AL.
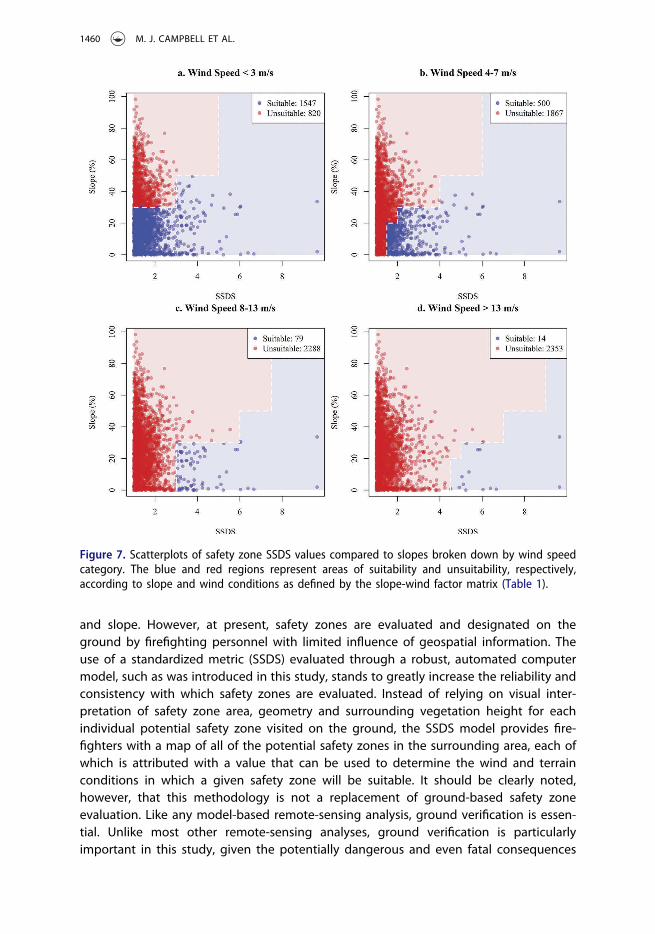
that there are many more potential safety zones with low SSDS, suitable in low wind-flatslope conditions, than high SSDSs, suitable in high wind-steep slope conditions, simplybecause there are many more small forest clearings than large. With that said, there are stillonly a total of 2367 potential safety zones with scores of greater than or equal to 1throughout the entire study area. When comparing SSDS values to the slope-wind factormatrix, we see that a safety zone with an SSDS of 1 would be suitable in the lowest wind andslope conditions (<3 ms−1 and <30%, respectively). However, as wind speeds and slopesincrease, higher SSDS values are needed to render a safety zone viable. For example, if windspeeds are slightly higher (4–7 ms−1), and slopes remain less than 30%, an SSDS of at least 2is needed, of which there are a total of 352. The highest SSDS value found throughout thestudy area was 9.65, which would be suitable for any combination of wind speed and slope.
Given that slope is a static landscape variable, SSDS can be compared to slope inorder to determine the wind speed conditions in which a given safety zone would beviable. When comparing safety zone slopes to SSDS values, we see that even at thelowest wind speed category (<3 ms−1), there are only 1547 potentially suitable safetyzones (Figure 7). As wind speed increases to 4–7, 8–13, and greater than 13 ms−1, thenumber of safety zones drops to 500, 79, and 14, respectively.
Perhaps equally important to the number of potential safety zones is their spatialdistribution, which directly impacts accessibility. As stated earlier, there is a clearly non-random distribution of safety zones throughout the study area, leaving vast tracts offorested land without any viable safety zones, particularly in the southwest. Figure 8depicts distance intervals and associated approximate travel times to safety zones withvarying SSDS thresholds. Travel rates were assumed to be 1.4 ms−1, an empiricallyderived average hiking rate along flat slopes from Tobler (1993). Table 3 highlights theproportions of the study area that fall within these same distance and time intervalsfrom safety zones. In low wind-low slope scenarios, where an SSDS of at least 1 isneeded, roughly 8% of the study area is within a 5-minute hike to the nearest safetyzone, 17% within 10 min, 41% within 30 min, and 64% within an hour (Figure 8, Table 3).Conversely, with high-SSDS safety zones being so sparse throughout the study area, only1% of the area is within an hour of the nearest safety zone with SSDS ≥7.
Clearing area is the best predictor of SSDS. Given that most forest clearings containseveral potential safety zones, we performed a linear regression between the SSDS of thehighest-rated safety zone within each clearing and the clearing area. As the data wereheavily right-skewed, we used a reciprocal-square transformation for the SSDS data and a logtransformation for the area data (Figure 9). The relatively low predictive power that emerged(r2 = 0.38) is due to the fact that clearing geometry and surrounding vegetation height alsohave significant impacts on a given safety zone’s SSDS. Additional geometric parameterssuch as clearing perimeter and area-to-perimeter ratio were also tested for statistical relation-ships, but their predictive powers were lower (r2 = 0.32 and r2 = 0.28, respectively).
4 Discussion and conclusions
This study introduced a new metric and geospatial model for identifying and evaluatingpotential wildland firefighter safety zones using lidar data. Lidar proves to be anexcellent resource for assessing many of the most important predictors of safety zonequality: clearing size and geometry, within- and surrounding-clearing vegetation height,
INTERNATIONAL JOURNAL OF GEOGRAPHICAL INFORMATION SCIENCE 1459
and slope. However, at present, safety zones are evaluated and designated on theground by firefighting personnel with limited influence of geospatial information. Theuse of a standardized metric (SSDS) evaluated through a robust, automated computermodel, such as was introduced in this study, stands to greatly increase the reliability andconsistency with which safety zones are evaluated. Instead of relying on visual inter-pretation of safety zone area, geometry and surrounding vegetation height for eachindividual potential safety zone visited on the ground, the SSDS model provides fire-fighters with a map of all of the potential safety zones in the surrounding area, each ofwhich is attributed with a value that can be used to determine the wind and terrainconditions in which a given safety zone will be suitable. It should be clearly noted,however, that this methodology is not a replacement of ground-based safety zoneevaluation. Like any model-based remote-sensing analysis, ground verification is essen-tial. Unlike most other remote-sensing analyses, ground verification is particularlyimportant in this study, given the potentially dangerous and even fatal consequences
Figure 7. Scatterplots of safety zone SSDS values compared to slopes broken down by wind speedcategory. The blue and red regions represent areas of suitability and unsuitability, respectively,according to slope and wind conditions as defined by the slope-wind factor matrix (Table 1).
1460 M. J. CAMPBELL ET AL.

of utilizing an unsuitable safety zone. However, whereas under the existing protocol forsafety zone identification, all potential safety zones must be visited and verified, themethod we have presented will enable a more targeted approach, eliminating the needto visit areas the model has determined that no viable safety zones exist, according tosurrounding vegetation, clearing geometry, slope, wind, and crew size. This will greatlyincrease the efficiency of safety zone selection and minimize potential for selectingunsuitable sites.
The results of the model implementation in Tahoe National Forest highlight a relativesparseness of suitable safety zones, especially for high winds and steep slopes.Particularly in the western and southern portions of the study area, if a wildfire wereto occur, safety zones (at least those composed of existing forest clearings) are few andfar between. However, knowing where safety zones are not may be just as useful asknowing where safety zones are. In the event of a wildfire in an area devoid of naturalsafety zones, this model can be used to highlight areas where safety zones could becreated through the use of controlled burning, timber harvesting or other manipulationof existing fuels, or through the utilization of recently burned areas in a wildfire. If
Figure 8. Euclidean distance and estimated travel time to nearest potential safety zone at a range ofSSDS thresholds throughout the study area.
Table 3. Percent of study area within distance and travel time of safety zones with different SSDSthresholds.Distance 0–420 m 420–840 m 840–2520 m 2520–5040 m >5040 mTime: 0–5 min 5–10 min 10–30 min 30–60 min >60 minSSDS ≥1 8.11% 8.69% 23.94% 23.65% 35.61%SSDS ≥2 1.84% 2.57% 9.57% 18.06% 67.95%SSDS ≥3 0.67% 1.07% 3.53% 7.71% 87.02%SSDS ≥4 0.25% 0.48% 2.28% 5.82% 91.17%SSDS ≥5 0.13% 0.31% 1.28% 3.34% 94.94%SSDS ≥6 0.06% 0.17% 0.94% 2.29% 96.54%SSDS ≥7 0.01% 0.04% 0.29% 0.85% 98.80%SSDS ≥8 0.01% 0.04% 0.29% 0.85% 98.80%SSDS ≥9 0.01% 0.04% 0.29% 0.85% 98.80%
INTERNATIONAL JOURNAL OF GEOGRAPHICAL INFORMATION SCIENCE 1461

creation or enlargement of safety zones in not feasible then fire management tacticsshould be modified to reduce firefighter risk, such as standing down until conditionschange or the fire moves to a more suitable location. Similarly, if an area has an existingpotential safety zone, but the SSDS is too low for the slope and wind conditions, it couldprovide an impetus to expand the safety zone to a suitable size and/or geometry.
One of the most important parameters not addressed by this model is fuel type, bothwithin and surrounding the potential safety zone. The model, in its present form, makes akey assumption that vegetation less than 1m in height is ‘non-tree’, and therefore eligible tobecome a safety zone, provided other conditions are met. While the 1 m threshold is amodel parameter that can be manipulated, regardless of vegetation height, certain fueltypes are undesirable for safety zones. For example, shrubs may be short in stature buthighly flammable and might not provide a viable safety zone without treatment. Althoughwe are only taking advantage of lidar’s ability to characterize vegetation height in this study,lidar can be further exploited for the estimation of other fuel parameters, such as crown bulkdensity and canopy base height (Andersen et al. 2005). Another potential solution to thisissue is incorporation with additional remote-sensing data. The use of hyperspectral ima-gery, for example, could be used to characterize within-safety zone fuel conditions throughthe spectral unmixing of green vegetation, non-photosynthetic vegetation and soils(Roberts et al. 2006). Alternatively, in the absence of hyperspectral image availability, toolssuch as LANDFIRE can provide critical fuel information such as vegetation type, height andcover, and fire behavior fuel models, albeit at a coarser level of thematic precision and withlimited accuracy (Rollins 2009). Additionally, it is understood that fuel type and condition ofthe vegetation surrounding the safety zone will impact the relative flammability of thisvegetation, potential for crown fire, and fire intensity. In order to eventually incorporatesuch information into SSDS, more detailed studies on the specific relationships between fueland fire parameters are needed.
Figure 9. Linear regression between safety zone SSDS and clearing area in which the safety zone fell.
1462 M. J. CAMPBELL ET AL.

Another key variable not assessed in the implementation of this algorithm is safetyzone accessibility. A large safety zone completely devoid of flammable vegetation maybe evaluated as having a very high SSDS, suggesting suitability in a wide range of windand terrain conditions, but if it is not accessible by a fire crew, it is not a viable option.Escape routes are a critical component of fire safety, representing pre-defined pathwaysfor accessing safety zones (NWCG 2016). Given the similarities between the conditionsthat define the relative suitability of escape routes and safety zones (low slope, lowvegetation cover), similar lidar-based approaches can be used in the future for determin-ing optimal escape routes from fire crew location to a safety zone.
A key limitation to the practical application of this study and widespread use of theproposed model for safety zone evaluation, at present, is the lack of lidar data avail-ability throughout most of the United States. In order to obtain a reliable picture ofsafety zones on a broad scale, there needs to be a similarly reliable lidar datasetextending into all areas where wildfires can occur. With the USGS 3D ElevationProgram underway (Snyder 2012), a nationwide map of safety zones could be generatedand provided to land management and firefighting agencies. However, at the time ofwriting, with the expected completion of a nationwide lidar dataset still several years inthe future, a more targeted approach to lidar data collection in fire-prone areas canprovide critical information for supporting firefighter safety operations in the interim.Alternatively, in the absence of lidar data there are other options that could prove viable,such as stereo imagery-based pseudo-point cloud extraction. However, a key limitationwith stereo imagery methods is the absence of a reliable ground surface model in areaswith dense tree canopies, thus limiting the ability to extract tree heights which are acritical parameter in safety zone analysis (St-Onge et al. 2008). Another related limitationis the fact that lidar represents a single snapshot in time. Particularly in fire-prone areas,vegetation is a dynamic entity that changes with the presence of disturbance eventsincluding wildfire, timber harvesting, insect and disease outbreaks, major wind events,and, over a much longer timescale, climate change. By one account (National FireProtection Association 2011), as much as 90% of safety zones are designated ‘in theblack’ – in already-burned areas. These areas would obviously not be depicted in a safetyzone map created using lidar data flown prior to the wildfire event. One possiblesolution to this is the incorporation of unmanned aerial vehicular technology. Themodel as it is being presented in this study is intended to be a tool for pre-fire planning(O’Connor et al. 2016), though it is conceivable that this methodology could be adaptedto a rapid response tool used for a more targeted approach for safety zone identificationand evaluation. Alternatively, the use of predictive vegetation growth models and fuelaccumulation curves could be used to estimate vegetation conditions following distur-bance events to fill in temporal gaps in lidar data collections and/or to highlight areas totarget repeat lidar data collection efforts.
Finally, it is worth noting that the scientific basis of convective and radiant heattransfer modeling upon which Δ and, as a result, SSDS are based, still requires furtherstudy (Finney et al. 2013, 2015). As stated earlier, particularly convective heat transfer is atremendously challenging physical phenomenon to model in a controlled environment.While the data used in this study are based on recent findings in the research of radiantand convective heat transfer in wildfires and their effects on humans, more research isneeded. Specifically, a more nuanced understanding of the effects of specific vegetation
INTERNATIONAL JOURNAL OF GEOGRAPHICAL INFORMATION SCIENCE 1463

types and fuel conditions, which can both be approximated with remote sensing, onheat transfer would greatly improve the effectiveness of implementing our algorithm.That being said, even if the specific Δ and SSDS numbers were to be updated withnewer science, the core methodology presented in this study would remain a viableoption for increasing firefighter safety.
Acknowledgments
Funding for this research was provided by the US Forest Service National Fire Plan through theOffice of Research, the NWCG Fire Behavior Subcommittee, and the Wildland Fire ManagementResearch Development & Application Program, Cooperative Agreements 14JV11221637123 and15CR11221637105. We would like to thank the Forest Service Region 5 Remote Sensing Lab, CarlosRamirez, Scott Conway, and Kirk Evans for providing lidar products for Tahoe National Forest.Finally, we would like to thank the anonymous reviewers, whose thoughtful questions andcomments helped to improve this paper.
Disclosure statement
No potential conflict of interest was reported by the authors.
Funding
Funding for this research was provided by the US Forest Service National Fire Plan through theOffice of Research, the NWCG Fire Behavior Subcommittee, and the Wildland Fire ManagementResearch Development & Application Program, Cooperative Agreements 14JV11221637123 and15CR11221637105.
References
Andersen, H.-E., McGaughey, R.J., and Reutebuch, S.E., 2005. Estimating forest canopy fuel para-meters using LIDAR data. Remote Sensing of Environment, 94, 441–449. doi:10.1016/j.rse.2004.10.013
Andrews, P.L., 2009. BehavePlus fire modeling system, version 5.0: variables. General technicalreport RMRS-GTR-213WWW revised. Department of Agriculture, Forest Service, Rocky MountainResearch Station, Fort Collins, CO.
Arizona State Forestry Division. Yarnell hill fire: serious accident investigation report. 23 September2013 [online]. Available from: http://wildfiretoday.com/documents/Yarnell_Hill_Fire_report.pdf[Accessed 10 July 2016].
Bechtold, W.A., Zarnoch, S.J., and Burkman, W.G., 1998. Comparisons of modeled height predic-tions to ocular height estimates. Southern Journal of Applied Forestry, 22 (4), 216–221.
Beighley, M., 1995. Beyond the safety zone: creating a margin of safety. Fire Management Notes, 55(4), 22–24.
Butler, B.W., et al., 1998. Fire behavior associated with the 1994 South Canyon fire on storm kingmountain, CO. USDA forest service research paper RMRSRP-9. Rocky Mountain Research Station,Fort Collins, CO.
Butler, B.W., 2014. Wildland firefighter safety zones: a review of past science and summary offuture needs. International Journal of Wildland Fire, 23, 295–308. doi:10.1071/WF13021
Butler, B.W., 2015. Firefighter safety zones [online]. Fire, fuel, and smoke science program, USDAforest service rocky mountain research station. Available from: http://www.firelab.org/project/firefighter-safety-zones [Accessed 30 July 2016].
1464 M. J. CAMPBELL ET AL.

Butler, B.W. and Cohen, J.D., 1998a. Firefighter safety zones: a theoretical model based on radiativeheating. International Journal of Wildland Fire, 8 (2), 73–77. doi:10.1071/WF9980073
Butler, B.W. and Cohen, J.D., 1998b. Firefighter safety zones: how big is big enough? FireManagement Notes, 58, 13–16.
Butler, B.W., Parsons, R., and Mell, W., 2015. Recent findings relating to firefighter safety zones. Missoula:U.S. Department of Agriculture, Forest Service, Rocky Mountain Research Station, 30–34.
Dennison, P.E., Fryer, G.K., and Cova, T.J., 2014. Identification of firefighter safety zones using lidar.Environmental Modelling & Software, 59, 91–97. doi:10.1016/j.envsoft.2014.05.017
Dubayah, R.O. and Drake, J.B., 2000. Lidar remote sensing for forestry. Journal of Forestry, 98 (6),44–46.
Finney, M.A., et al., 2013. On the need for a theory of wildland fire spread. International Journal ofWildland Fire, 22, 25–36. doi:10.1071/WF11117
Finney, M.A., et al., 2015. Role of buoyant flame dynamics in wildfire spread. Proceedings of theNational Academy of Sciences, 112 (32), 9833–9838. doi:10.1073/pnas.1504498112
Frankman, D., et al., 2013. Measurements of convective and radiative heating in wildland fires.International Journal of Wildland Fire, 22 (2), 157–167. doi:10.1071/WF11097
Gleason, P., 1991. LCES – a key to safety in the wildland fire environment. Fire Management Notes,52 (4), 9.
Kraus, K. and Pfeifer, N., 2001. Advanced DTM generation from lidar data. International Archives ofPhotogrammetry Remote Sensing and Spatial Information Sciences, 34 (3/W4), 23–30.
LANDFIRE, 2012. Existing vegetation type layer, LANDFIRE 1.3.0 [online]. US department of theinterior, geological survey. Available from: http://landfire.cr.usgs.gov/viewer/[Accessed 10 July2016].
Lefsky, M.A., et al., 2002. Lidar remote sensing for ecosystem studies lidar, an emerging remotesensing technology that directly measures the three-dimensional distribution of plant canopies,can accurately estimate vegetation structural attributes and should be of particular interest toforest, landscape, and global ecologists. BioScience, 52 (1), 19–30.
Meng, X., Currit, N., and Zhao, K., 2010. Ground filtering algorithms for airborne lidar data: a reviewof critical issues. Remote Sensing, 2 (3), 833–860. doi:10.3390/rs2030833
National Fire Protection Agency, 2011. Firewise communities: firefighter safety in the WUI [online].Available from: http://learningcenter.firewise.org/Firefighter-Safety/3-4.ph. [Accessed 4 January2016].
National Interagency Fire Center, 2016. Wildland fire fatalities by year [online]. Available from:https://www.nifc.gov/safety/safety_documents/Fatalities-by-Year.pdf [Accessed 4 January2016].
National Wildfire Coordinating Group, 2014. Incident response pocket guide [online]. Available from:http://www.nwcg.gov/sites/default/files/products/pms461.pdf [Accessed 4 January 2016].
National Wildfire Coordinating Group, 2016. Glossary A-Z [online]. Available from: http://www.nwcg.gov/glossary/a-z [Accessed 4 January 2016].
O’Connor, C.D., et al., 2016. Getting ahead of the wildfire problem: quantifying and mappingmanagement challenges and opportunities. Geosciences, 6 (35), 1–18. doi:10.3390/geosciences6030035
Popescu, S.C., Wynne, R.H., and Nelson, R.F., 2002. Estimating plot-level tree heights with lidar:local filtering with a canopy-height based variable window size. Computers and Electronics inAgriculture, 37, 71–95. doi:10.1016/S0168-1699(02)00121-7
Reutebuch, S.E., et al., 2003. Accuracy of a high-resolution lidar terrain model under a conifer forestcanopy. Canadian Journal of Remote Sensing, 29 (5), 527–535. doi:10.5589/m03-022
Roberts, D.A., et al., 2006. Evaluation of Airborne Visible/Infrared imaging Spectrometer (AVIRIS)and Moderate Resolution Imaging Spectrometer (MODIS) measures of live fuel moisture andfuel condition in a shrubland ecosystem in southern California. Journal of Geophysical Research,111, 1–16. doi:10.1029/2005JG000113
Rollins, M.G., 2009. LANDFIRE: a nationally consistent vegetation, wildland fire, and fuel assess-ment. International Journal of Wildland Fire, 18 (3), 235–249. doi:10.1071/WF08088
INTERNATIONAL JOURNAL OF GEOGRAPHICAL INFORMATION SCIENCE 1465

Snyder, G.I., 2012. The 3D elevation program: summary of program direction [online]. USDepartment of the Interior, US Geological Survey. Available from: https://pubs.usgs.gov/fs/2012/3089/pdf/fs2012-3089.pdf [Accessed 14 December 2016].
Steele, J., 2000. Effective firefighter safety zone size: a perception of firefighter safety. 4th
International wildland fire safety summit, Edmonton, AB, CA: International Association ofWildland Fire, 171–177.
St-Onge, B., et al., 2008. Mapping canopy height using a combination of digital stereo-photo-grammetry and lidar. International Journal of Remote Sensing, 29 (11), 3343–3364. doi:10.1080/01431160701469040
Tobler, W., 1993. Three presentations on geographical analysis and modeling, Technical Report 93-1.Santa Barbara: National Center for Geographic Information and Analysis, University of California.
United National Office for the Coordination of Humanitarian Affairs. Israel Carmel fire situationreport #2. 6 December 2010 [online]. Available from: http://reliefweb.int/sites/reliefweb.int/files/resources/DD3E82B287DB17CD852577F1006E883B-Full_Report.pdf [Accessed 10 July 2016].
Wang, L., Gong, P., and Biging, G.S., 2004. Individual tree-crown delineation and treetop detectionin high-spatial-resolution aerial imagery. Photogrammetric Engineering & Remote Sensing, 70 (3),351–357. doi:10.14358/PERS.70.3.351
Zarate, L., Arnaldos, J., and Casal, J., 2008. Establishing safety distances for wildland fires. Fire SafetyJournal, 43 (8), 565–575. doi:10.1016/j.firesaf.2008.01.001
1466 M. J. CAMPBELL ET AL.
Related Documents


