SAFE MOTHERHOOD STUDIES— TIMELINESS OF IN-HOSPITAL CARE FOR TREATING OBSTETRIC EMERGENCIES RESULTS FROM BENIN, ECUADOR, JAMAICA, AND RWANDA QUALITY ASSURANCE PROJECT MARCH 2006 This publication was produced for review by the United States Agency for International Development. It was prepared by Wendy Edson, Bart Burkhalter, Steven Harvey, Maina Boucar, Sabou Djibrina, Jorge Hermida, Patricio Ayabaca, Maurice Bucagu, Sourou Gbangbade, and Affette McCaw-Binns. OPERATIONS RESEARCH RESULTS

Welcome message from author
This document is posted to help you gain knowledge. Please leave a comment to let me know what you think about it! Share it to your friends and learn new things together.
Transcript
SAFE MOTHERHOOD STUDIES—TIMELINESS OF IN-HOSPITAL CAREFOR TREATING OBSTETRICEMERGENCIESRESULTS FROM BENIN, ECUADOR, JAMAICA, AND RWANDA
QUALITYASSURANCEPROJECT
MARCH 2006This publication was produced for review by the United States Agency for International Development.It was prepared by Wendy Edson, Bart Burkhalter, Steven Harvey, Maina Boucar, Sabou Djibrina,Jorge Hermida, Patricio Ayabaca, Maurice Bucagu, Sourou Gbangbade, and Affette McCaw-Binns.
OPERATIONSRESEARCHRESULTS

OPERATIONS RESEARCH RESULTS
SAFE MOTHERHOOD STUDIES—TIMELINESS OF IN-HOSPITAL CARE FOR TREATING OBSTETRIC EMERGENCIESRESULTS FROM BENIN, ECUADOR, JAMAICA, AND RWANDA
MARCH 2006
Wendy Edson, Bart Burkhalter, Steven Harvey, Maina Boucar,
Sabou Djibrina, Jorge Hermida, Patricio Ayabaca,
Maurice Bucagu, Sourou Gbangbade, and Affette McCaw-Binns
DISCLAIMER
The authors’ views expressed in this publication do not necessarily reflect the views of the United States Agency for International Development or the United States Government.

ii n SAFE MOTHERHOOD STUDIES–TIMELINESS OF IN-HOSPITAL CARE
The Quality Assurance Project (QAP) is funded by the U.S. Agency for International Development (USAID) under Contract Number GPH-C-00-02-00004-00. The project serves developing countries eligible for USAID assistance, USAID Missions and Bureaus, and other agencies and nongovernmental organizations that cooperate with USAID. QAP offers technical assistance in the management of quality assurance and workforce development in healthcare, helping develop feasible, affordable approaches to comprehensive change in health service delivery. The project team includes prime contractor University Research Co., LLC (URC), Initiatives Inc., Joint Commission Resources, Inc., and EnCompassLLC. Dr Edson formerly worked for URC through EnCompass.
Recommended citation: Edson W, B Burkhalter, S Harvey, M Boucar, S Djibrina, J Hermida, P Ayabaca, M Bucagu, S Gbangbade, and A McCaw-Binns. 2006. Safe motherhood studies—Timeliness of in-hospital care for treating obstetric emergencies: Results from Benin, Ecuador, Jamaica, and Rwanda. Operations Research Results. Published for the U.S. Agency for International Development (USAID) by QAP.
About this series: The Operations Research Results series presents the results of country or area research that QAP is circulating to encourage discussion and comment within the international development community. Please visit www.qaproject.org for more information on other QAP operations research studies.
ACKNOWLEDGEMENTSThe authors would like to acknowledge the following organizational partners who made it possible to carry out this study.
Benin: Valère Goyito and Céline Seignon Kandissounon of the Benin Ministry of Health; Rene Perin and the directors, obstetricians, gynecologists, and medical staff of the study hospitals; Alicia Dinnerstein and Laura Hoemeke of the USAID Mission in Coutonou; Aguima Tankoano and Alain Akpadji of the Benin Integrated Family Health Program of University Research Co., LLC (PROSAF/URC), and Debbie Gueye and Tisna Veldhuyzen van Zanten of URC.
Ecuador: Carmen Laspina, Director, Integrated Health Care, Ecuador Ministry of Health; Ramiro Jara, Director, Hospital Cantonal Otavalo; Fernando Endara, Director, Hospital San Vicente de Paul; Marcelo Davalos, Director, Hospital Ginecológico Isidro Ayoral; Fernando Orbe, Director, Hospital de Yaruquí; and Francisco Delgado, Director, Hospital Pablo Arturo Suarez.
Jamaica: Karen Lewis Bell, Deanna Ashley, Georgiana Gordon-Strachan, and Erica Hedmann of the Jamaica Ministry of Health; Jennifer Knight-Johnson, USAID Mission in Jamaica; Douglas MacDonald, Victoria Jubilee Hospital in Kingston; Sister Merly McLaren, School of Midwifery, Victoria Jubilee Hospital; Barrington Dixon, Cornwall Regional Hospital; Horace Betton and Richard May, St. Ann’s Bay Hospital; and John McCrae and Hyacinth Bromley, Black River Hospital. Rose Scringer, Keisha Spencer, Maureen Tomlinson, Lluana Humphries, Donna Simon, and others provided administrative support.
Rwanda: Thomas Karengera and Claude Sekabaraga, Rwanda Ministry of Health; the Directorate of Kigali Central Hospital; and Apolline Uwayitu, Elizabeth Drabant, and Barbara Sow of the USAID Mission in Rwanda.
In addition, we thank the technical advisors who provided excellent support throughout the study—including Colleen Conroy, Marge Koblinsky, Jeanne McDermott, Allisyn Moran, Elizabeth Ransom, Cindy Stanton, Mary Ellen Stanton, and Patricia Stephenson—and the U.S.-based support team, including Elisa Knebel for literature review, Rais Mazitov and Marta Woodward for data input, and Ebie Dupont for administrative support.
We also acknowledge our team of data collectors and other supporters:
In Benin, Noël Zonon Adannou, Sylvain Coudoro, Christophe Houngbeme, Thomas Dogue, Faoussath Badirou Fatoke, Hyacinthe Ahomlanto, Agèle Nouratou do Rego, Jeanne Houndeton, Jeanne Topanou, and Epiphane Gainsi.
In Ecuador, Lourdes Alvaro, Adriana Ayabaca, Tannya Guerrero, Isabel Vanessa Hervas, Jorge Jarrín, Fanny Logroño, Luis Mejía, Teresa Menéndez, Alex Meza, Pilar Peñafiel, and Rodrigo Rosero. Thanks to Luis Vaca, María Elena Robalino, Gabriela Izquierdo, and Lorena Carranza for their technical and administrative support.
In Jamaica, Ian Banberry, Donna Bonnaman, Sybil Brooks, Esmena Brown, Cynthia Brown-Dixon, V.P. Burton, Ada Campbell, Loxley Christie, Juleen Dixon, Laura Donaldson, Pauline Dorsen-Wright, Vivian Elliot, Vivienne Forbes, Barbara Johnson, Erica Hedmann, Elaine Maragh, Merton Marshall, Esmie May-Grant, Elizabeth McDougal, Calixto Orozco Muñoz, Joan Nicholson, Donette Simms-Stewart, Glenton Strachan, Marjorie Thelwell, Althea Thomas-Ennis, and Carmen Townsend.
In Rwanda, Vincent Kanimba, Sengorore Athanase, Makaminega Martha, Odette Mukamustanga, Mukankubito Eineck Joviane, Thérèse Mirabasungu, Hastérie Mukazikeribuga, and Thérèse Barengayabo.TEL (301) 654-8338
FAX (301) 941-8427 www.qaproject.org

SAFE MOTHERHOOD STUDIES–TIMELINESS OF IN-HOSPITAL CARE n iii
CONTENTS
ABSTRACT . . . . . . . . . . . . . . . . . . . . . . . . . . . . . . . . . . . . . . . . . iii
LIST OF FIGURES. . . . . . . . . . . . . . . . . . . . . . . . . . . . . . . . . . . . . . iv
LIST OF TABLES . . . . . . . . . . . . . . . . . . . . . . . . . . . . . . . . . . . . . . iv
I. BACKGROUND. . . . . . . . . . . . . . . . . . . . . . . . . . . . . . . . . . . . . 1 A. FACTORS RELATED TO THE TIMELINESS OF HOSPITAL CARE . . . . . . . . . 1 B. MEASURING THE THIRD DELAY . . . . . . . . . . . . . . . . . . . . . . . . . . 2 C. IMPROVING THE TIMELINESS OF CARE. . . . . . . . . . . . . . . . . . . . . . 2 D. STANDARDS FOR TIMELINESS OF CARE . . . . . . . . . . . . . . . . . . . . . 2
II. PURPOSE: DEFINE AND MEASURE TIMELINESS OF CARE . . . . . . . . . . . . . 3 A. OBSTETRIC EMERGENCIES . . . . . . . . . . . . . . . . . . . . . . . . . . . . 3 B. DEFINITIVE TREATMENT . . . . . . . . . . . . . . . . . . . . . . . . . . . . . . 3 C. CRITICAL EVENTS . . . . . . . . . . . . . . . . . . . . . . . . . . . . . . . . . 3 D. INTERVALS. . . . . . . . . . . . . . . . . . . . . . . . . . . . . . . . . . . . . . 4 E. DELAYS . . . . . . . . . . . . . . . . . . . . . . . . . . . . . . . . . . . . . . . 4
III. METHODS . . . . . . . . . . . . . . . . . . . . . . . . . . . . . . . . . . . . . . . 5 A. STUDY DESIGN . . . . . . . . . . . . . . . . . . . . . . . . . . . . . . . . . . . 5 B. STUDY SITES. . . . . . . . . . . . . . . . . . . . . . . . . . . . . . . . . . . . . 5 C. STUDY PERSONNEL . . . . . . . . . . . . . . . . . . . . . . . . . . . . . . . . 5 D. STUDY TIME LINE . . . . . . . . . . . . . . . . . . . . . . . . . . . . . . . . . . 6 E. STUDY SAMPLES . . . . . . . . . . . . . . . . . . . . . . . . . . . . . . . . . . 6 F. INDEPENDENT AND DEPENDENT VARIABLES . . . . . . . . . . . . . . . . . 6 G. INSTRUMENTS . . . . . . . . . . . . . . . . . . . . . . . . . . . . . . . . . . . 6 H. DATA COLLECTION PROCEDURES. . . . . . . . . . . . . . . . . . . . . . . . 7 I. DATA ANALYSIS . . . . . . . . . . . . . . . . . . . . . . . . . . . . . . . . . . . 7 J. RESEARCH ETHICS . . . . . . . . . . . . . . . . . . . . . . . . . . . . . . . . . 7
IV. RESULTS. . . . . . . . . . . . . . . . . . . . . . . . . . . . . . . . . . . . . . . . . 8 A. SAMPLE SIZES AND MISSING DATA. . . . . . . . . . . . . . . . . . . . . . . . 8 B. PATIENT FLOW: LABOR STATUS AND TIME/DAY OF ARRIVAL AT HOSPITAL . . . . . . . . . . . . . . . . . . . . . . . . . . . . . . . . . . . 10 C. INTERVALS BETWEEN CRITICAL EVENTS . . . . . . . . . . . . . . . . . . . 10 D. DELAYS . . . . . . . . . . . . . . . . . . . . . . . . . . . . . . . . . . . . . . 13
V. DISCUSSION . . . . . . . . . . . . . . . . . . . . . . . . . . . . . . . . . . . . . 14
VI. CONCLUSIONS AND RECOMMENDATIONS . . . . . . . . . . . . . . . . . . . 14
REFERENCES . . . . . . . . . . . . . . . . . . . . . . . . . . . . . . . . . . . . . . . 16
APPENDIX A . . . . . . . . . . . . . . . . . . . . . . . . . . . . . . . . . . . . . . . 17
APPENDIX B . . . . . . . . . . . . . . . . . . . . . . . . . . . . . . . . . . . . . . . 18
SAFE MOTHERHOOD STUDIES—TIMELINESS OF IN-HOSPITAL CARE FOR TREATING OBSTETRIC EMERGENCIESRESULTS FROM BENIN, ECUADOR, JAMAICA, AND RWANDA
ABSTRACTThis study investigated the timeliness of in-hospital care during labor and delivery in 14 hospitals in Benin, Ecuador, Jamaica, and Rwanda. It measured intervals between critical events and, based on expert opinion, judged the timeliness of those events for cases of obstetric emergencies. The critical events along the continuum of care included arrival at hospital, initial evaluation by a professional, diagnosis of an obstetric emergency, order of the definitive treatment for the emergency, and administration of the definitive treatment. Obstetric emergencies and their definitive treatments were gleaned from international standards and included oxytocin and blood transfusion for postpartum hemorrhage, anti-hypertensives and anticonvulsants for eclampsia/pre-eclampsia, cesarean section (C-section) for obstructed labor, antibiotics for sepsis, and several treatments for post-abortion complications.
Methods: Direct observations of 859 women arriving at the hospital measured the interval from arrival to the professional evaluation. Medical record reviews by experienced obstetricians of 383 cases of obstetric emergencies identified times of critical events from professional evaluation to administration of definitive treatments. The reviewers also made judgments about whether a delay had occurred and the type of delay (i.e., its causes).
Results: The times that our selected critical events occurred were in the patient records 61% of the time. Times were less well-documented in Rwanda (31%) than in the other three countries
OPERATIONS RESEARCH RESULTS
Continued on page iv

iv n SAFE MOTHERHOOD STUDIES–TIMELINESS OF IN-HOSPITAL CARE
LIST OF FIGURES
Figure 1. Critical Events and Attendant Intervals . . . . . . . . . . . . . . . . . . . . 4
Figure 2. Mean Length of Interval from Entry to Professional Evaluation by Time of Day. . . . . . . . . . . . . . . . . . . . . . . . . . . . . . . . 11
Figure 3. Mean Length of Interval from Entry to Professional Evaluation by Day of Week . . . . . . . . . . . . . . . . . . . . . . . . . . . . . . . 11
Figure 4. Mean Order, Administration, and Treatment Intervals (in Minutes) . . . . . 12
Figure A-1. Record Review Algorithm . . . . . . . . . . . . . . . . . . . . . . . . . . 17
LIST OF TABLES
Table 1. Emergency Conditions and Their Definitive Treatments. . . . . . . . . . . . 3
Table 2. Number of Study Sites by Country . . . . . . . . . . . . . . . . . . . . . . 5
Table 3. Number of Observations and Records Reviewed, by Country and Type of Hospital . . . . . . . . . . . . . . . . . . . . . . . 8
Table 4. Number of Obstetric Emergencies and Cases, by Type of Emergency and Country . . . . . . . . . . . . . . . . . . . . . . 8
Table 5. Number of Valid Treatment Intervals and OB Emergencies by Country . . . 9
Table 6. Patient Arrival Observations by Country, Labor Status, and Day . . . . . . 10
Table 7. Average Length of Evaluation Sub-Intervals: From Arrival to Professional Evaluation (in Minutes) . . . . . . . . . . . . 11
Table 8. Frequencies of Delays by Type of Delay and Country. . . . . . . . . . . . 13
Table B-1. Comparison of Methods for Measuring Delays in Care for Obstetric Emergencies . . . . . . . . . . . . . . . . . . . . . . . . . . 18
Table B-2. Definitions of Intervals for Obstetric Emergencies: Emergency Began BEFORE Arrival at Facility . . . . . . . . . . . . . . . . 19
Table B-3. Definitions of Intervals for Obstetric Emergencies: Emergency Began DURING Hospitalization. . . . . . . . . . . . . . . . . 20
Table B-4. Key Intervals: Evaluation, Treatment, Administration . . . . . . . . . . . . . 21
Table B-5. Delays . . . . . . . . . . . . . . . . . . . . . . . . . . . . . . . . . . . . 21
Table B-6. Summary of Patient Characteristics from the Medical Record Review, by Country. . . . . . . . . . . . . . . . . . . . . 22
Table B-7. Missing Record Data: Percentage of Sought Critical Event Data Items Found . . . . . . . . . . . 23
Table B-8. Treatment Interval: From Diagnosis to Administration of Definitive Treatment, by Treatment and Country (in Minutes) . . . . . . . 24
Table B-9. Administration Interval: From Order to Administration of All Treatments, by Definitive Treatment and Country (in Minutes) . . . . . . . . . . . . . 25
Continued on page v
(54–78%). The professional evaluation time was documented most frequently (81%), the order and administration times next most frequently (63%), and the diagnosis time least frequently (35%). Valid diagnosis-to-treatment intervals were obtained 65% of the time, but analysis by emergency and by treatment resulted in small samples in some countries.
The intervals between critical events varied widely across cases, diagnoses, facilities, and countries, but some patterns emerged:
• The interval between arrival and professional evaluation averaged about 30 minutes across all facilities. It was longer on weekdays than on weekends in Benin and Jamaica and longer during the day than at night in most facilities.
• The interval from the diagnosis of an obstetric emergency to the administration of its definitive treatment varied widely by type of emergency, according to data in the medical records. While postpartum hemorrhage and pre-eclampsia/eclampsia were treated on average within two hours of diagnosis, the definitive treatments for sepsis, obstructed labor, and post-abortion complications were not administered until two to six hours after diagnosis on average, probably reflecting the greater urgency of hemorrhage and eclampsia. This interval also sometimes differed widely between countries. For example, the pooled mean for postpartum hemorrhage was longer in Ecuador than the other countries, while for obstructed labor it was longer in Benin.
• Different settings also resulted in different interval lengths. The interval from an order to the administration of a C-section was lengthy in Ecuador and Benin due to delays

SAFE MOTHERHOOD STUDIES–TIMELINESS OF IN-HOSPITAL CARE n v
at the large reference hospitals and caused by busy operating room suites and personnel during the day. We found that delays were more likely in more complex facilities, such as reference hospitals, where personnel or facilities tended to be busier than at less complex ones.
The obstetricians who reviewed the patient records judged that the professional evaluation was delayed 12% of the time, the diagnosis 14% of the time, and the administration of the definitive treatment 28% of the time.
Conclusion: This study was able to define and, with varying degrees of success, to measure the intervals related to the timeliness of care for in-hospital obstetric emergencies, and to identify delays and many causes of delay. Hospitals can monitor some of the critical indicators of timeliness for treating obstetric emergencies using the methods described here. The measurement process could be made simpler and less costly by developing complication-specific abstraction forms for record review. International standards indicating appropriate intervals for treating obstetric emergencies are needed.
Table B-10. Evaluation Interval: From Arrival to Professional Evaluation (in Minutes) . . 26
Table B-11. Professional Evaluation Interval by Labor Status (in Minutes) . . . . . . . . 26
Table B-12. Professional Evaluation Interval by Time of Day (Day versus Night, in Minutes). . . . . . . . . . . . . . . . . . . . . . . . 27
Table B-13. Professional Evaluation Interval by Day of Week (Weekday versus Weekend, in Minutes). . . . . . . . . . . . . . . . . . . 27
Table B-14. Mean Treatment Interval by Hospital Type: From Diagnosis to Administration of Treatment, for All Countries and Definitive Treatments (in Minutes) . . . . . . . . . . . . . . . . . . . . . . . . . . . 28
Table B-15. Mean Administration Interval by Hospital Type: From Order to Administration of Treatment, for All Countries and Treatments (in Minutes) . . . . . . . . . . . . . . . . . . . . . . . . . . . . . . . . . 29
Table B-16. Number of Cases with Delays in Evaluation, Diagnosis, and Definitive Treatment, by Emergency. . . . . . . . . . . . . . . . . . . 30

vi n SAFE MOTHERHOOD STUDIES–TIMELINESS OF IN-HOSPITAL CARE
ABBREVIATIONS
BEOC Basic essential obstetric care
C-section Cesarean section
CHK Central Hospital of Kigali
CPD Cephalo-pelvic disproportion
ER Emergency room
HELLP Hemolysis, elevated liver enzymes, and low platelet count
HIV Human immunodeficiency virus
IMPAC Integrated Management of Pregnancy and Childbirth
IOM Institute of Medicine
MgSO4 Magnesium sulfate
MMR Maternal Mortality Ratio
OB Obstetric
OR Operating room
PMMN Prevention of Maternal Mortality Network
PPH Postpartum hemorrhage
PROSAF Benin Integrated Family Health Program
QAP Quality Assurance Project
SPSS Statistical Package for the Social Sciences
STAT Give immediately
TB Tuberculosis
URC University Research Co., LLC
USAID United States Agency for International Development
WHO World Health Organization

SAFE MOTHERHOOD STUDIES–TIMELINESS OF IN-HOSPITAL CARE n �
SAFE MOTHERHOOD STUDIES—TIMELINESS OF IN-HOSPITAL CARE FOR TREATING OBSTETRIC EMERGENCIESRESULTS FROM BENIN, ECUADOR, JAMAICA, AND RWANDA
Wendy Edson, Bart Burkhalter, Steven Harvey, Maina Boucar, Sabou Djibrina, Jorge Hermida, Patricio Ayabaca, Maurice Bucagu, Sourou Gbangbade, and Affette McCaw-Binns
I. BACKGROUNDThe Joint Commission for Hospital Accreditation developed a framework in 1993 for improving healthcare provider performance, defining nine aspects of performance. One aspect was timeliness, defined as, “the degree to which care is provided to the patient at the most beneficial or necessary time” (Joint Commission 1994). Since then, timeliness has emerged as a key component of monitoring the quality of healthcare. The Institute of Medicine in 2001 brought it into sharper focus by discussing the consequences of a lack of timeliness, ranging from long waiting times that patients may interpret as lack of respect from providers to delay in the diagnosis or treatment of an illness (IOM 2001). The National Health Care Quality report card included a conceptual framework for quality of healthcare with four dimensions: safety, effectiveness, patient centeredness, and timeliness (McGlynn et al. 2003; Kerr et al. 2004). The report defines timeliness as “obtaining needed care and minimizing unnecessary delays in getting that care.” It also defines three sub-categories of timeliness (1) access to the system of care, (2) timeliness in getting to care for a particular problem, and (3) timeliness within and across episodes of care.
In developing countries, timeliness relating to safe motherhood was brought to the fore by the three-delay model, which specifies three types of delays that contribute to the likelihood of maternal death in the event of a complication: (1)
delay in deciding to seek care, (2) delay in reaching a treatment facility, and (3) delay in receiving adequate treatment at the facility (Thaddeus and Maine 1994).
While the first two types of delays must be addressed by maternal and community education and other interventions, the third can be addressed only by a facility’s healthcare system. The purpose of this study was to define and measure the third delay, that is, delays that occurred after arrival at the hospital. Delays in transport between facilities were beyond this study’s scope, but might be a significant source of delay. We also wanted to develop an instrument that could be adapted and used to monitor the effect of quality improvement interventions on the timeliness of care.
This study was one of three carried out by the Quality Assurance Project (QAP) in four developing countries: Benin, Ecuador, Jamaica, and Rwanda. The first study examined the competency of birth attendants, the second measured performance and gauged the relative contribution of different enabling factors in the work environment, and the last—reported here—examined the timeliness of in-hospital care for obstetric emergencies. The studies were performed between September 2001 and February 2003; each country report was published in 2003 or 2004 (Ghangbade et al. 2003 [Benin]; Ayabaca et al. 2004 [Ecuador]; McCaw-Binns et al. 2004 [Jamaica]; and Boucar et al. 2004 [Rwanda]).
A. FACTORS RELATED TO THE TIMELINESS OF HOSPITAL CARESeveral studies have explored the reasons for in-hospital delays for obstetric (OB) emergencies in developing countries, revealing factors that contribute to delays in service delivery: arrival time, time of day, day of week, fees, diagnosis, personnel, equipment, and drugs and supplies.
With regard to drugs and supplies, in West Africa the Prevention of Maternal Mortality Network (PMMN) found that drug shortages resulted in family members being asked to purchase drugs at outside pharmacies and provide supplies (e.g., dressings, intravenous tubing and fluid, suture supplies, surgical gloves). These requirements delayed care, especially when pharmacies were closed (PMMN 1992; Onwudiegwu et al. 1999). Gbangbade and Reinke (1998) found that a lack of drugs and waiting for the emergency room caused delays in Benin.
With regard to personnel, two studies in West Africa found that waiting to be seen by a doctor or specialist was a cause of delay (Onwudiegwu et al. 1999; PMMN 1995). The Onwudiegwu study also attributed delays in receiving a cesarean section (C-section) to the unavailability of a pediatrician or anesthetic coverage, operating rooms being unready, and electricity failure. During a maternal mortality audit in the Gambia, Hoestermann et al. (1996) identified delayed management of cases by staff members and unavailability of

2 n SAFE MOTHERHOOD STUDIES–TIMELINESS OF IN-HOSPITAL CARE
drugs and blood. PMMN found in 1992 that a gatekeeper sometimes required a tip before admitting patients to hospital grounds, and in 1995 it found that admission fees and higher fees for C-sections delayed care. O’Rourke (1995) assessed the time between arrival and admission by the obstetrical staff in Guatemala to measure the impact of a staff training intervention: At first, almost half the patients waited over an hour, but after the intervention, women with OB complications waited shorter periods than others. The 1995 PMMN study found that delay was greater when a patient was admitted at night and shorter during the weekend, when facilities were less crowded.
Other studies have identified a missed or incorrect diagnosis as leading to delays. In Nigeria, seeking a second opinion for a C-section caused a delay (Onwudiegwu et al. 1999). In an analysis of previously collected data, Barnes-Josiah et al. (1998) cite providers who were unable to diagnose or treat acute conditions as a cause for delay. In Mexico, Langer et al. (1997) found that women with a diagnosis of abortion-related complications were kept waiting longer for definitive treatment than pregnant women, perhaps a stigma-related delay.
B. MEASURING THE THIRD DELAYPMMN studies (e.g., PMMN 1995) used patient flow analysis to study the waiting time for emergency services, observing 100 consecutively arriving patients at a hospital from admission to treatment. Treatment was defined as operative interventions (C-section or dilatation and curettage) and assisted deliveries (forceps delivery and vacuum extraction). At another hospital, observers followed a sample of emergency patients and timed each stage of the process of receiving care.
University Research Co., LLC (URC) developed another way to measure delay in Morocco in collaboration with John Snow, Inc. The interval from a woman’s arrival at the hospital to the arrival of the physician was documented in a logbook. Hospital personnel used this information to track improvements in shortening
the interval between patient arrival and delivery of care.
A more common way to assess the third delay is through a medical audit or record review. Typically, the times of four events are recorded: arrival at a facility, examination by a trained provider, making a decision to intervene, and the start of the intervention. Audits can be problematical if sufficient detail is not recorded.
Some studies have used patient interviews or focus group discussions to measure the third delay. PMMN (1992) used focus group discussions to elicit the barriers to emergency OB care for rural women and their families. Fawcus et al. (1996) interviewed the families of women who had died and staff who had cared for each woman; they also reviewed each woman’s medical records. A similar strategy was used to collect the data analyzed by Barnes-Josiah et al. (1998).
Each of these methods has positive and negative aspects. Observation is more complete but more costly, and it presents the inherent difficulty of obtaining a sufficiently large sample of OB emergencies. Medical records are easy to find and cheaper to analyze, but may not provide reasons and times of delays. Appendix Table B-1 outlines the pros and cons of each measurement method.
C. IMPROVING THE TIMELINESS OF CAREInterventions have been implemented worldwide to address these delays and decrease maternal death. One study reported that continuous quality improvement can play an important role in developing and monitoring interventions
to improve the timeliness of care (Kwast 1998; Liljestrand 1999). The results of medical record audits are commonly used to monitor and evaluate services, to guide continuous quality improvement, and even accredit services (Graham et al. 2000).
In Latin America, QAP redesigned key processes along the pathway for maternal survival, including community transportation systems, referral and counter-referral systems, reception and triage, and management of OB complications (QAP 2005). Quality improvement activities were used to quickly improve compliance with specific clinical standards, such as partograph use, laboratory exam requests, and the regular checking of vital signs.
In Morocco, Belghiti et al. (1998) present another example where monitoring the quality of care within the system generated improvements to a referral system for pregnant women.
D. STANDARDS FOR TIMELINESS OF CARESeveral studies report actual waiting times for different segments of care. Gbangbade and Reinke (1998) measured the waiting time for immediate care, defined as the time from arrival to the start of an intravenous infusion, and the waiting time for definitive care, defined as the time from arrival to the performance of a C-section. The former averaged 52 minutes and the latter 180. Both exceeded the standards of 20 minutes and 90–120 minutes, respectively, set during the standards development for the study.
PMMN (1995) found that the mean interval from admission to treatment for a complicated abortion was 243 minutes, for postpartum hemorrhage 111 minutes, and for ruptured ectopic pregnancy 49 minutes. Onwudiegwu et al. (1999) measured the time from a decision to perform a C-section to its start and found a mean interval of 4.4 hours, a median of 3.2 hours, and a mode of two hours. Jahn et al. (2000) measured the interval between decision for and actual performance of a C-section and found a mean of 4.5 hours (range: 40 minutes–11 hours).
One study reported that
continuous quality improvement
can play an important role
in developing and monitoring
interventions to improve the
timeliness of care.

SAFE MOTHERHOOD STUDIES–TIMELINESS OF IN-HOSPITAL CARE n �
II. PURPOSE: DEFINE AND MEASURE TIMELINESS OF CARE The study purpose was to improve the understanding and measurement of the third delay. Objectives supporting this purpose included (1) defining and measuring the intervals from an arrival at a hospital to receipt of care for OB emergencies in Benin, Ecuador, Jamaica, and Rwanda and (2) documenting factors related to delayed care.
Defining the timeliness of hospital care for OB emergencies enabled us to develop indicators and measures that hospitals might use to monitor and reduce delays in care. Our literature review found some definitions, indicators, and measures, but left several questions unanswered: Which OB emergencies should be studied? Which components of care warrant measurement? Where are patients when these emergencies arise: at home, at another facility, at the study hospital? How would we know whether a missed diagnosis had occurred or a diagnosis was incorrect?
A. OBSTETRIC EMERGENCIES We selected the five leading causes of maternal mortality in developing countries as the emergencies to study and used the following case definitions (Graham et al. 2000):
Postpartum hemorrhage (primary and secondary): Genital tract bleeding within 42 days after delivery, gestation of fetus of at least 24 weeks, and at least one of the following: clinical signs of shock, blood loss in excess of 1000 ml within 24 hours of delivery, or blood loss in excess of 500 ml within 42 days of delivery.
Eclampsia: Generalized fits in a pregnant patient without previous history of epilepsy. The case definition for severe pre-eclampsia was based on the Integrated Management of Pregnancy and Childbirth (IMPAC) international standards (WHO 2000): diastolic blood pressure at least 110 mm Hg or more after 20 weeks gestation and proteinuria at 3+ or more.
Obstructed labor: Clinical sign of shock, temperature at least 37.5º C, odorous vaginal discharge, and at least one of the following: labor exceeding 12 hours, uterine tetany, abnormal pelvis, Bandl’s ring, uterine rupture, haematuria, caput, or molding.
Sepsis (chorioamnionitis): Evidence of ruptured membranes and at least one of the following: temperature at least 37.5º C or odorous vaginal discharge.
Sepsis (puerperal): Temperature at least 37.5º C within 42 days of delivery and at least one of the following: odorous vaginal discharge or tender subinvoluted uterus.
Post-abortion complications (septic abortion): Gestation under 24 weeks, temperature at least 37.5º C, and at least one of the following: abdominal pain/tenderness, injury to genital tract, odorous vaginal discharge, tender fornices, or open cervix with products of conception.
Approximately 15% of the cases in the sample experienced more than one OB emergency.
B. DEFINITIVE TREATMENT We used the WHO IMPAC standards to define the definitive treatment for each obstetric emergency; definitions are summarized in Table 1: Appendix Tables B-2 and B-3 have further detail. As these standards have not been universally adopted, country-specific standards often differed from ours. In such cases, we measured both so that we could compare across countries and obtain data that would
be useful for standards of practice in each country. That is, where country standards were available, additional data were collected to measure adherence to them. For example, in Ecuador, providers did not always use magnesium sulfate (MgSO4) as the definitive treatment for severe pre-eclampsia, so we also collected data on the use of “other” anticonvulsants.
C. CRITICAL EVENTS Observers and data collectors recorded the times of five critical events within the study facility along the continuum of OB care, as pictured in Figure 1. The first data point is from observations; the second is from observations and record reviews, and the last three are from record reviews. We assumed that the time of each critical event is the moment when the event begins. The figure lists the five critical events horizontally in the top row in the order of their occurrence along the continuum of care. It also shows which events initiated and ended the “intervals” (defined below) of interest to the study.
Arrival: Time when a woman entered the first department or unit (emergency room [ER] or OB unit) that treats OB emergencies.
Professional evaluation: Time when the first evaluation by an OB professional (midwife or physician) started. An initial examination of vital signs or short history taken by auxiliary staff was not considered a professional examination.
TABlE 1. EmERgEncy condiTions And ThEiR dEfiniTivE TREATmEnTs
obstetric Emergency definitive Treatments
Postpartum hemorrhage Oxytocin or blood transfusion
Eclampsia/pre-eclampsia Anti-hypertensive or anticonvulsant (MgSO4 or other)
Obstructed labor C-section
Sepsis Antibiotic
Post-abortion complication Vacuum aspiration, dilation and curettage, or laparotomy to repair injury

� n SAFE MOTHERHOOD STUDIES–TIMELINESS OF IN-HOSPITAL CARE
Diagnosis of a particular obstetric emergency: Time recorded in the patient record when a diagnosis of the OB emergency was first noted at the study facility. Previous diagnoses, made at home, in transit, or at another facility, were not critical events for the purpose of this study.
Order of a definitive treatment for the emergency: Time recorded in the patient record for the order of the definitive treatment for the specific emergency. For example, the definitive treatment for obstructed labor was a C-section, so data collectors noted the time of the order for a C-section.
Administration of the definitive treatment: Time recorded in the patient record for the start of the administration of the definitive treatment. Record reviewers noted such details as when the administration of the definitive treatment was delivered.
An OB emergency can begin before or after arrival at the hospital, in any of several places: at home, in the study hospital, in another facility, or during transfer from another facility to the study hospital.
• When the emergency begins before arrival at the study hospital—either at home, at another facility, or during transit to the study hospital—the signs and symptoms should be present at the initial professional evaluation, and the diagnosis should be made then.
u u u u u
Evaluation Diagnosis Order Administration
Treatment
critical Event (data source)
Arrival at Hospital
(Observed)
figuRE 1. cRiTicAl EvEnTs And ATTEndAnT inTERvAls
Initial Professional Evaluation (Observed; Records)
Note: The study assumes that each critical event happened instantly, at the beginning of the event. The diagnosis interval was not calculated or analyzed. The order interval plus the administration interval is the “treatment interval.”
Diagnosis of OB
Emergency (Records)
Order of Definitive Treatment (Records)
Administration of Definitive Treatment (Records)
interval (between events)
• If the emergency started at another facility and the patient was transferred to the study hospital, the diagnosis could have been made at the first facility but should be confirmed at the initial professional evaluation at the study hospital.
• When the emergency doesn’t begin until after arrival at the study hospital, the signs and symptoms may not be present at the initial professional evaluation, so the diagnosis may occur during hospitalization.
D. INTERVALS Intervals constitute the period between critical events; they were measured in minutes for this study. One interval ended when the next one began. As Figure 1 shows, the five critical events define four intervals, each denoted by the critical event that ends the interval (evaluation, diagnosis, order, administration). We also define a “treatment” interval as the interval from the diagnosis to the administration of a definitive treatment, which is the sum of the order and administration intervals. We used different methods to estimate the duration of the intervals, which are described below, and some are detailed in Appendix Table B-4. The intervals measured by record review were calculated directly from the data only if the times of the beginning and ending events were both noted.
The evaluation interval extends from arrival at the hospital, or in some hospitals the entry into the ER or OB ward, to the initial professional evaluation. At some hospitals, patients could go straight to ER/OB without having to stop at a gate. Information on the times of the two events defining this interval (arrival and evaluation) was obtained from the patient flow data.
The order interval extends from the diagnosis of an OB emergency to the order for the definitive treatment for that emergency. Information to estimate the duration of this interval was obtained from record reviews, although the results thus obtained were “clinically inconclusive,” as discussed in the Results Section.
The administration interval extends from the order for a treatment to its administration. Information was obtained from record reviews.
The treatment interval extends from the diagnosis to the administration of the definitive treatment and equals the order interval plus the administration interval.
For several reasons, we did not attempt to measure the duration of the diagnosis interval, which extends from the professional evaluation to diagnosis. For patients whose emergency began before admission, the condition would be apparent at this evaluation, so the evaluation and diagnosis would occur almost simultaneously. For those whose emergency began during hospitalization, the interval between evaluation and diagnosis varied from case to case, depending on the course of the emergency, so the interval would be difficult to interpret as an aggregate.
E. DELAYSThe duration of an interval does not necessarily determine whether or not a delay occurred. Evidence-based standards might be developed that make a connection between the duration of an interval and whether a critical event was delayed such that a patient was put at risk. Unfortunately, few such standards exist, although some are embedded in

SAFE MOTHERHOOD STUDIES–TIMELINESS OF IN-HOSPITAL CARE n �
the IMPAC guidelines. We concluded that relying on a quantitative interpretation of “delay” would not be appropriate for this study and used another approach.
Our expert obstetrician record reviewers used their clinical expertise to determine whether a critical event was delayed. They analyzed delays in the initiation of any of three critical events: professional evaluation, diagnosis, and delivery of definitive treatment. All estimates of these delays are their opinions. They also focused on inaccurate diagnoses, which can cause delay in delivering definitive treatment. Appendix Table B-5 details the approach used to estimate the number of delays of each type.
III. METHODSA. STUDY DESIGNDuring development of the two data collection instruments (described below under “III-G. Instruments”), two key issues emerged for each instrument.
1. Patient flow observation Tool
Substandard care: We used experienced clinicians instead of lay observers in part so they could recognize substandard care and assist if needed. Most observers were practicing at other facilities. We emphasized during their training that they should assist in patient care if the health of the mother or infant was jeopardized.
Arriving obstetric emergencies: In Ecuador, our first site, women with OB emergencies went first to the ER, while in the other three countries, they went directly to the maternity ward. We observed the care given by the first department within the facility that normally treated OB emergencies. So in Benin, Jamaica, and Rwanda, we had observers in the OB unit, while in Ecuador they were in the ER. At some facilities observers in OB or ER could see the hospital entrance; if they could not, another observer was posted at the hospital gate. Patient flow had been mapped before data collection to ensure that all arrivals of OB emergencies would be captured for the study.
2. medical Record Abstraction Tool
Recorded times of critical events: To determine whether exam and treatment times would be noted in the records prior to collecting data, we reviewed five records at each facility and then used an algorithm (Appendix A) to determine whether or not to include the hospital in the study. We decided to exclude hospitals whose time documentation was inadequate for calculating the intervals of interest. No hospital initially identified as a site for record review had to be rejected because of inadequate documentation.
Documentation of delays: Reasons for delays are not always recorded and may be better assessed through provider or patient interviews, so the reviewers judged whether the documentation was sufficient to indicate whether a delay had occurred and why. We concluded that experienced obstetricians could obtain sufficient information from the patient records to make reasonable judgments about delays.
B. STUDY SITESThe study countries were selected to represent both Africa and the Latin America/Caribbean region and different languages (English, Spanish, and French). All countries also had a QAP field office. Study hospitals were selected purposively to meet the following criteria:
A range of levels of care: A large urban referral (tertiary care) hospital with an active maternity department that manages a large number of maternal complications; one or two mid-sized (secondary care, regional) hospitals; and/or a smaller district hospital.
An average of at least two births per day, sufficient to permit observation of at least five cases over a two–three day period;
At least some facilities outside the capital, but geographically close enough to be manageable within the time and budget available; and
Facilities where QAP was conducting program activities, if possible.
Before beginning data collection, all study sites were visited twice by the in-country study coordinator. During these visits, we explained the study to the facility director, received permission to conduct the study in that facility, and contacted the maternity department to coordinate the patient flow observations and the medical records department to coordinate record selection. We mapped the facility’s physical layout to determine where to post observers. Each country team conducted a rapid assessment of the hospitals and found that all met the criteria suggested by Thaddeus and Maine (1994) to qualify as a comprehensive essential obstetric care facility (Table 2).
TABlE 2. numBER of sTudy siTEs By counTRy
Regional Referral or district country hospitals hospitals Total
Benin 2 2 4
Ecuador 1 2 3
Jamaica 2 2 4
Rwanda 1 2 3
Total 6 8 14
C. STUDY PERSONNEL Patient flow observers were obstetricians, midwives, nurses, or medical students. Obstetricians were selected for the medical record review on the basis of their clinical expertise. While their judgment would be needed to determine whether a diagnosis had been missed and caused a delay, the definition of definitive treatment for a particular diagnosis was criterion based and objective.
In Benin, two obstetricians and a midwife conducted the observations, and an obstetrician and a physician/anesthesiologist performed the record reviews. In Ecuador, arrival observers were

6 n SAFE MOTHERHOOD STUDIES–TIMELINESS OF IN-HOSPITAL CARE
nurses and medical students; attending physicians observed inside the ER; and two obstetricians performed the record reviews. In Jamaica, obstetricians, midwives, general practitioners, and a pediatrician performed observations, and three obstetricians did record reviews. In Rwanda two obstetricians, a pediatrician, and five midwives formed two teams to observe patient flow, and three obstetricians reviewed records.
D. STUDY TIME LINEThe study was carried out over 18 months, from September 2001 to February 2003. After the literature review and protocol drafting (in October 2001), we convened a group of maternity health experts in Washington, DC. Participants reviewed the study protocol and discussed key methodological issues. We pilot tested all study instruments in Ecuador during November and December 2001. After the pilot, instruments were modified and translated for application in the four study countries. Data were collected in Ecuador in February 2002, in Rwanda and Benin in March 2002, and in Jamaica in June and July 2002. Early results were presented in October 2002, and country reports were written in 2003.
E. STUDY SAMPLESFor the patient flow observations, all female patients judged to be of reproductive age arriving at the facility during the period when observers were in place were included in the sample. Collection periods are described below in “III-H. Data Collection Procedures.”
The record review sample was selected by diagnostic code and computer-generated lists in Jamaica and by using delivery log books in the other countries. In each hospital, records were selected from calendar year 2001 by: (1) reviewing the delivery log books; (2) listing all patients with any of the five categories of OB emergency for the months of January, April, July, and October; and (3) selecting a systematic sample of five or more records in each hospital for each
of the following types of emergencies: postpartum hemorrhage (PPH), sepsis, pre-eclampsia/eclampsia, obstructed labor, and post-abortion complications. All records selected and retrieved by this method were reviewed to determine whether they met the criteria for inclusion in the diagnostic category.
F. INDEPENDENT AND DEPENDENT VARIABLESThe dependent variables include indicators of the intervals and indicators of delays in critical events (or misdiagnoses). The duration of the following intervals was calculated as the difference in minutes between the times of their initiating and ending critical events:
• Evaluation interval,
• Order interval,
• Administration interval, and
• Treatment interval.
Delays and misdiagnoses were judged to be either present or absent by the expert obstetric reviewers for the following:
• Delay in professional evaluation,
• Delay in diagnosis or misdiagnosis, and
• Delay in definitive treatment.
The independent variables include:
• Country,
• Type of emergency,
• Type of definitive treatment,
• Type of hospital (district, regional, referral), and
• Variables associated with entry into OB/ER, including labor status, time of day, and day of week.
We defined nine definitive treatments for the five obstetric emergencies: two for postpartum hemorrhage, two for pre-eclampsia/eclampsia, one for sepsis, one for obstructed labor, and three for post-abortion complications. Many of the cases received one or more of these nine definitive treatments although some may not have been definitive for the relevant
OB emergency. For example, for a woman with postpartum hemorrhage, oxytocin would be a “definitive treatment,” but treatment with an antibiotic would be considered an additional treatment. We make a distinction between a “definitive treatment,” meaning the definitive treatment for the OB emergency in the case under review, and “other treatment,” meaning one of the other definitive treatments that was not an appropriate definitive treatment for the case under review. Many cases included both definitive and other treatments. The order and administrative event times were sought for all treatments (both “definitive” and “other”) associated with each case.
G. INSTRUMENTSPatient flow observations required one to three data collection instruments, depending on the facility, and the record review required one. Observers used one instrument in the ER to record information on arrival time, time of initial screening, time of evaluation by a professional, start and end times of treatments and medications, time of discharge, and discharge diagnosis. Observers used another instrument in OB to record times of entry into the OB unit; initial and ongoing monitoring and evaluation by a professional; administration of antibiotics, oxytocin, or MgSO4; other treatments; delivery; and whether delivery was by C-section. Two registers were developed to record patient arrival and exit times. These tools were designed for use by clinical observers (physicians, midwives, or nurses).
The record review abstraction tool recorded information on the woman’s pregnancy outcome; parity; maternal age; maternal morbidity; type of delivery; referral status; times of the professional evaluation, diagnosis, order, and administration of all treatments; whether or not a delay had occurred in the reviewer’s opinion; reasons for any delay(s); and effectiveness of care for PPH, pre-eclampsia/eclampsia, and sepsis. This tool was designed for use by physician reviewers.

SAFE MOTHERHOOD STUDIES–TIMELINESS OF IN-HOSPITAL CARE n �
The study instruments were pilot tested during November and December 2001 at a provincial level hospital and a church hospital in Quito, Ecuador, and a county-level hospital nearby. After extensive revision, instruments were translated into English (for use in Jamaica) and French (for use in Benin and Rwanda) in late February 2002, and then reviewed by the study team in each country for applicability to the country’s healthcare setting. Revised instruments were used for data collection.
H. DATA COLLECTION PROCEDURESStudy personnel trained data collectors during one-day sessions in each country. Topics included the rationale for the study, how the study fit into the QAP country program if applicable, the Ministry of Health objectives, and how the results would be used to improve the quality of care. Each instrument was reviewed and the intent of each item clarified. In some cases, the data collectors suggested useful changes in the wording or form of the questions. Each team received a vehicle, driver, and hotel and per diem expenses.
In Rwanda, two teams of four data collectors each formed during the training. An obstetrician led each team. The day after training, teams left for the two hospitals, where the QAP in-country team facilitated their introduction to the hospital director and maternity department. Three days later, the data collectors and QAP team met again for a debriefing, to review completed
We defined nine definitive
treatments for the five
obstetric emergencies: two
for postpartum hemorrhage,
two for pre-eclampsia/
eclampsia, one for sepsis, one
for obstructed labor, and three
for post-abortion complications.
instruments, and to plan observations at the large reference hospital in the capital, Kigali. Arrival time was defined as entry into the hospital compound. Observers could see the entry gate from the OB ward at two hospitals; at the third, vehicles could go to the OB ward entrance. If on foot, the arriving woman or a companion was asked if she had been delayed between the gate and the ward.
In Benin, a retired physician posted at the hospital gate recorded the time of arrival of each woman with an OB complication. This observer asked an arriving woman or those attending her the reason for the visit and recorded her name and arrival time in a log. A second observer, a midwife, waited outside the ER or OB room to record each woman’s arrival time there. A third observer, an obstetrician/gynecologist, noted the time of key events once the woman entered the ER or OB room.
In Ecuador, we defined “arrival time” as the time the woman arrived at the first closed door where she might have to wait to be admitted. The study team had identified these doors at each hospital during the initial site assessment. An observer at these locations recorded time of arrival of each woman of reproductive age.
In Jamaica, we defined arrival as the time the patient entered the OB ward; an observer waited at the door to each OB unit.
In Rwanda and Jamaica, observers spent two or three consecutive 24-hour days, including a weekend day, at each facility. In Benin and Ecuador, observers spent non-consecutive 12-hour shifts (including days, evenings, and nights) and at least one weekend day and night in each facility.
The record reviews were completed at the three or four hospitals in each country where records were deemed to be sufficiently complete, as determined during the initial visit. Once selected, each record was reviewed using the record review instrument.
I. DATA ANALYSIS Data were keyed into either a Microsoft Access® or Statistical Package for the Social Sciences® (SPSS) database; analysis was conducted using SPSS, version 9.0.
Observers used a 24-hour clock to record the times of critical events although some data collectors denoted times as “am” or “pm.” To calculate an interval, the start time of one interval was subtracted from the start time of the next, while accounting for intervals lasting beyond midnight. Descriptive results were presented as means, medians, standard deviations, 25th to 75th percentiles, and minimums and maximums. Box plots presenting the median and 25th to 75th percentiles by groups were created to illustrate variability within groups. We compared intervals between hospitals using t-tests and analyses of variance. A difference was judged significant if the probability of the t or F value was less than 0.05. We calculated facility-level averages and pooled averages for each country.
To assess the interaction of day versus night and weekend versus weekday on an interval, we used a multifactorial ANOVA (analysis of variance between groups) design crossing time interval with time of day or day of the week.
J. RESEARCH ETHICSAll protocols were reviewed according to QAP policy and procedures. Approvals were obtained from the four Ministries of Health and all hospitals before data collection began. Data were kept confidential in file cabinets in QAP’s Bethesda, MD, office. Observers were told that if during an observation they were concerned with the care or well-being of a patient, mother or newborn, they should cease observing and intervene as they saw fit.

� n SAFE MOTHERHOOD STUDIES–TIMELINESS OF IN-HOSPITAL CARE
IV. RESULTSA. SAMPLE SIZES AND MISSING DATA
1. Patient flow data
We completed and analyzed patient flow observations of 657 patients, and expert reviewers audited 328 medical records at 14 hospitals (Table 3). Seventy percent of all patient flow cases were in one country: Ecuador.
2. Patient Record Review
Sample size: We reviewed a sample of 328 medical records, which included 383 obstetric emergencies, as some patients had more than one obstetric emergency. Our reviewers found that emergencies included both diagnosed and misdiagnosed emergencies. Over the 14 hospitals, the sample yielded nearly 1.2 emergencies per case and an average of 5.5 cases per type of emergency per hospital. We reviewed more records with the diagnosis of eclampsia/pre-eclampsia than any other diagnosis (Table 4).
Patient characteristics: Patient characteristics in the sample of audited medical records included maternal age, parity, C-section, emergency in-transfer, human immunodeficiency virus (HIV), tuberculosis (TB), fetal deaths, and live births. Patients had fairly similar characteristics across the four countries. Mean maternal age ranged from 23.9 to 26.8 years and parity from 1.3 to 1.9. C-sections were frequent, ranging from 29% to 56% of all records with data; fetal deaths ranged from 8% to 15%; and reported HIV and TB was less than 2%. (This low number of reported HIV and TB cases probably reflects underreporting and should be investigated, including bias it might introduce.) In-coming transfers were much higher in Benin (58%) than in the other three countries, which ranged from 17% to 26% (see Appendix Table B-6 for details).
Missing time-of-event data: Not all records contained the needed data. In order to measure the times that critical events occurred and then derive the
duration of intervals between these events, we sought:
• Time of professional evaluation for each case;
• Time of diagnosis of all obstetric emergencies for each case; and
• Time of order and administration of all treatments (both definitive and other) for each case.
In seven cases, the time of the diagnosis occurred after the time of the order or
definitive treatment, producing a negative interval. For example, in Ecuador the data on the time of the first dose of antibiotic in a case of sepsis was before the diagnosis in five cases. This may have been a problem with training of the data collectors rather than a true negative interval, as some patients received prophylactic doses of antibiotics prior to a procedure and were diagnosed with sepsis afterwards. In some cases where a woman had multiple OB emergencies and treatments, it was difficult to abstract the time of diagnosis and time
TABlE 3. numBER of oBsERvATions And REcoRds REviEwEd, By counTRy And TyPE of hosPiTAl
observations Records1
National Private Referral Referral Regional District Hospitals Hospital Hospitals Hospitals Total ER OB (n = 4) (n = 1) (n = 6) (n = 3) (n = 14)
Benin 0 29 21 17 25 10 73
Ecuador 459 0 24 - 21 20 65
Jamaica 0 103 36 - 55 14 105
Rwanda 0 66 30 - 55 - 85
Total 459 198 111 17 156 44 328
Notes:
1. Numbers in parentheses indicate number of hospitals in that group.
2. ER was the primary entry point in Ecuador. Although several patient flow observations were undertaken in the OB ward there, most of these patients had been in the ER and were therefore already included in the analysis of hospital arrival times.
3. Records were reviewed in two regional hospitals in Jamaica and two in Rwanda.
3
3
2
TABlE 4. numBER of oBsTETRic EmERgEnciEs And cAsEs, By TyPE of EmERgEncy And counTRy
obstetric Emergency Benin Ecuador Jamaica Rwanda Total
Postpartum hemorrhage 15 12 23 24 74
Eclampsia/pre-eclampsia 27 25 41 13 106
Obstructed labor 17 16 21 23 77
Sepsis 18 15 26 15 74
Post-abortion complications 9 10 13 20 52
Total emergencies 86 78 124 95 383
Total cases 73 64 105 85 328
Note: Some cases involved more than one OB emergency.

SAFE MOTHERHOOD STUDIES–TIMELINESS OF IN-HOSPITAL CARE n �
of definitive treatment for each of the diagnoses. We deemed negative intervals to be invalid and dropped them from the analysis.
In these situations, the time of the event that should have occurred first was considered to be invalid, except when all three times were recorded (diagnosis, order, administration) and two of the times yielded a valid interval.
Over all four countries, we obtained 61% of the sought times. Times were less well-documented in Rwanda (31%) than in Benin (54%), Ecuador (69%), and Jamaica (78%). For all countries valid times of professional evaluation were better documented (81%) than the times of the other events. The times of the order and administration of treatments were documented 63% of the time across all countries, while the time of the diagnostic event was documented in only 35% of the treatments. We found that in Jamaica, the STAT (meaning “give immediately”) dose of medications was not documented in the same location as other antibiotics in the medical record and was missed by the data collectors. Additional analysis and perhaps investigation are needed to determine whether the data that were collected are systematically different from those not obtained and whether the collected data are biased. Appendix Table B-7 has details on data missing from records reviewed.
Diagnosis times: Reviewers collected the time of the diagnosis for each OB emergency from patient records. In documenting a diagnosis, they first identified every OB emergency for a case and the time of each diagnosis (some cases involved more than one diagnosis). They used the definitions of intervals presented in Appendix Table B-3 to determine the time of diagnosis. They distinguished between diagnoses that occurred before hospitalization at the study facility and those that occurred during hospitalization. If a diagnosis was made before arrival at the study facility, reviewers indicated the time of the professional evaluation at the study facility as the time of diagnosis. If the emergency occurred during hospitalization
at the study facility, the time when the emergency was identified served as the time of diagnosis. For each case the reviewer made a judgment as to whether or not the diagnosis was delayed due to a missed or incorrect diagnosis. In some complex cases with co-morbidities and treatments, it was difficult to know with certainty the times of diagnoses and definitive treatment for every diagnosis.
Order interval estimates: The assessment, diagnosis, and plan of care can occur simultaneously, as we saw in the data we collected where the first evidence of a diagnosis was an order for treatment. We use the term “clinically inconclusive” to refer to cases where the time of the diagnosis and the time of treatment order were the same, even though many of these diagnoses may have been made earlier. Because we felt that the order interval (diagnosis–order of definitive treatment) was clinically inconclusive, we did not always calculate this interval. Instead, we estimated its mean duration by treatment and country by subtracting the mean administrative interval (order for a treatment–its administration) from the mean treatment interval (diagnosis–definitive treatment, or order interval plus administration interval) for different treatments and countries. As discussed below, these estimates may be biased and are order of magnitude only.
Data for interval estimates: Three intervals (order, administration, and treatment) were analyzed with patient record data. However, as just noted, the order interval data were estimated based on the findings from our analysis of the administration and treatment intervals. The measurement of the duration of an
interval requires two times per event—one at the beginning of the event and one at the end—so the number of valid interval durations is smaller than the number of valid event times. For all 383 definitive treatment intervals, 251 valid intervals were obtained: 65% (Table 5). Consequently, our sample sizes are quite small in many of the individual cells representing a specific treatment in one country.
Definitive treatments versus other treatment: As noted, many patients received one or more of the nine definitive treatments that was not the definitive treatment for the emergency/ies they experienced. For instances where patients received one of these nine treatments that was not the definitive treatment for their cases, we use the term “other” treatments. Of the 377 treatments, 251 were definitive (Appendix Table B-8) and 126 were other (Appendix Table B-9).
We hypothesized that the duration of administration intervals for definitive treatments and other treatments would be about the same. If so, we reasoned that we could use both to estimate the duration of the administration interval, thereby increasing our sample size. We compared the administration interval for six different treatments (oxytocin, blood transfusion, anti-hypertensives, anticoagulants, antibiotics, and C-section) using a t-test. There was no significant difference between the administration intervals of the definitive treatment data and other treatment data for any of the six treatments, with p-values varying from 0.60 to 0.99. Finding no significant difference between the administration intervals of definitive treatments and other
TABlE 5. numBER of vAlid TREATmEnT inTERvAls And oB EmERgEnciEs By counTRy
Benin Ecuador Jamaica Rwanda Total
Treatment intervals 58 74 91 28 251
OB emergencies 86 78 124 95 383
Percentage of emergencies 67.4% 94.9% 73.4% 29.5% 65.5%
Sources: OB emergencies are from Table 4; treatment intervals are from Table B-12.

�0 n SAFE MOTHERHOOD STUDIES–TIMELINESS OF IN-HOSPITAL CARE
treatments for any of the six treatments and believing that intervals required to fill an order should not differ much, we used all the treatment data, not just the definitive treatment data, to estimate the duration of the administration interval.
We thought that the duration of treatment intervals would probably be different for definitive treatments than for other treatments, because of a greater sense of urgency to implement a definitive treatment following the diagnosis of an emergency. We compared the treatment interval durations for the two categories of treatments using the t-test as we had for the administration intervals. None of the differences were significant at the 0.05 level, but the p-values were much smaller than those found for the administration intervals; four of the six treatments had p-values under 0.50. As with the administration intervals, the duration of the treatment intervals for definitive treatments were substantially shorter than those of the other treatments for five of the six treatment types, the one exception being antibiotics. Consequently, we based our estimates of the duration of the treatment interval on only the definitive treatment data, generating smaller sample sizes (Appendix Table B-8).
Non-independence of the intervals: The rapidity with which an earlier interval is completed may influence the duration of subsequent intervals. For example, a long order interval may cause providers to speed up the administration interval. To investigate this phenomenon (e.g., independence between the intervals), we compared cases where all the times of all three critical events (diagnosis, order, administration) were known (and therefore the duration of all three intervals) against cases where only the times of two critical events were known (and therefore only one interval). Unfortunately, the sample sizes were too small to reveal patterns in the data.
B. PATIENT FLOW: LABOR STATUS AND TIME/DAY OF ARRIVAL AT HOSPITALOf the 657 patient flow observations, labor status at arrival was known for 582. Of those 582, 57% of the women arrived in labor. However, the country-level average of women who arrived in labor is 68%, reflecting the heavy influence of Ecuador’s large sample (384 of 582) on the pooled percentage. The overall figure of 68% masks a large difference between the countries; in Jamaica and Rwanda, 80% and 88%, respectively, of the arrivals were in labor versus only 59% and 46%, respectively, in Benin and Ecuador. The high percentage arriving not in labor in Ecuador is probably largely due to the fact that the Ecuador observations were conducted in the ER, while the other studies were conducted in the OB ward (see Table 6).
During the observations, we scheduled observers around the clock for several days, including a weekend day. This is reflected in the percentage of observations during the day versus night and weekend versus weekday in Table 6. Ecuador’s influence on the pooled percentages arriving in the day and on the weekend is similar to the influence it had on the percentage-arriving-in-labor data.
TABlE 6. PATiEnT ARRivAl oBsERvATions By counTRy, lABoR sTATus, And dAy1
mean of Pooled country condition Benin Ecuador2 Jamaica Rwanda Total Percentages3
Arrived in labor 59% 46% 80% 88% 57% 68% (17/29) (175/384) (82/103) (58/66) (332/582)
Arrived during day 41% 61% 56% 59% 63% 56% (12/29) (279/419) (58/103) (39/64) (338/615)
Arrived during 31% 41% 37% 20% 38% 32% weekend (9/29) (189/459) (38/103) (13/66) (249/657)
1. Numbers in parentheses are the number of cases for which the condition is true divided by the number of cases with data.
2. Data on labor status at arrival and time of arrival were obtained only for some of the cases in Ecuador.
3. The mean of country percentages differs from the pooled total because of Ecuador’s large fraction of the pooled total.
C. INTERVALS BETWEEN CRITICAL EVENTS
1. Patient flow: Evaluation interval
The evaluation interval (arrival at hospital to professional evaluation) averaged 30 minutes across countries (Table 7). This figure is the sum of the mean intervals (1) from arrival to entry into OB/ER plus (2) from entry into OB/ER to the professional evaluation.
Three sub-intervals were calculated from the patient flow data: (1) the interval from arrival at hospital gate to the entry into the ER or OB, (2) the interval from the entry into ER/OB to the first exam by a provider (not necessarily a professional), and (3) the interval from entry into ER/OB to a professional evaluation. The interval from hospital arrival to entry into OB/ER, averaged over the three countries with such data, was about six minutes. The mean interval from entry into OB/ER to a professional evaluation was about 25 minutes, ranging from nine minutes in Rwanda to about 40 in Benin and Jamaica. More detailed information about sample sizes, standard deviations, and pooled versus facility means are in Appendix Table B-10.

SAFE MOTHERHOOD STUDIES–TIMELINESS OF IN-HOSPITAL CARE n ��
Effect of labor status: Women who arrived in labor received a professional evaluation sooner than those who were not in labor (such as women with miscarriages or fever) in three countries, but in Benin women not in labor were seen by a professional more quickly than those in labor, on average. However, only in Rwanda was the difference significant. Details are in Appendix Table B-11.
Effect of arriving during the day versus at night: The literature suggests that the time of arrival (day or night) might be a possible cause of delay in the initial professional evaluation. In general, patients arriving during the day (6 am to 6 pm) waited on average 30 minutes longer in the ER for an initial exam and/or professional evaluation than patients arriving at night (6 pm to 6 am; see Figure 2). Ecuador in particular presented significant differences in day versus night for this interval. Waiting time for a professional evaluation was also longer during the day in Jamaica and Benin, although these differences were not statistically significant. In Rwanda, it took patients nearly three times as long (3 minutes versus 8.8) during the night to go from the hospital arrival point into the OB unit. Details are in Appendix Table B-12.
TABlE 7. AvERAgE lEngTh of EvAluATion suB-inTERvAls: fRom ARRivAl To PRofEssionAl EvAluATion (in minuTEs)
interval1 Benin Ecuador Jamaica Rwanda All countries2
From arrival at hospital gate 8 4 - 5 5.7 to entry into ER/OB
From entry into ER/OB - - 19 - 19 to first exam
From entry into ER/OB 32 17 39 9 24.3 to professional evaluation
Evaluation interval: From arrival 40 21 393 14 30.0 to professional evaluation
1. All intervals for individual countries are the facility-level mean interval.
2. The intervals in this column are the country means of the facility means in the country.
3. The evaluation interval in Jamaica was from the entry into OB to a professional evaluation.
Source: Patient flow observations. More detailed information is in Appendix Table B-10.
figuRE 2. mEAn lEngTh of inTERvAl fRom EnTRy To PRofEssionAl EvAluATion By TimE of dAy
Effect of arriving on a weekday versus a weekend: The literature also suggests that the day of arrival (weekday or weekend) might influence the timeliness of the initial professional evaluation. The wait for a professional evaluation was much longer in Benin and Jamaica for patients who arrived on a weekday versus a weekend, as seen in Figure 3. At one Jamaican hospital, patients waited on average 93 minutes on a weekday to be evaluated by a professional, compared to 29 minutes on a weekend. In Ecuador
Interval in minutes
Benin Ecuador Jamaica Rwanda
Day Night
50
40
30
20
10
0
7.1
46.1
25.9
38.2
9.7
46.3
38.6
8.1
this interval was slightly longer on the weekend, and in Rwanda it differed little from a weekday to weekend. Details are in Appendix Table B-13.
2. medical Records: Treatment interval
The interval from diagnosis to administration of the definitive treatment (the “treatment” interval) was calculated for each OB emergency and its definitive treatment(s), using data from medical records. Definitive treatments were given for nearly 80% of the emergencies. We calculated both a facility-level mean and a pooled mean for each country, using data for definitive treatments only. Appendix Table B-8 shows that the mean treatment interval varied considerably by type of emergency: It was shorter for PPH and pre-eclampsia/eclampsia with anticonvulsants (pooled means of 57 and 172 minutes, respectively) than for obstructed labor, sepsis, and post-abortion complications (pooled means ranging from 216–306 minutes). The shorter intervals probably reflect the urgency of PPH and eclampsia, where the need for alacrity is obvious to the providers and timely treatment is essential. The facility-level means were substantially less than the pooled means for pre-eclampsia/eclampsia and sepsis,
figuRE 3. mEAn lEngTh of inTERvAl fRom EnTRy To PRofEssionAl EvAluATion By dAy of wEEk
Interval in minutes
Benin Ecuador Jamaica Rwanda
Weekday Weekend
60
50
40
30
20
10
0
12.0
43.4
12.3
24.5
30.8
53.8
23.5
13.4

�2 n SAFE MOTHERHOOD STUDIES–TIMELINESS OF IN-HOSPITAL CARE
reflecting shorter intervals in facilities with fewer observations. For individual facility results, please refer to the specific report for that country, published separately and listed in the references.
We found that in Jamaica, the STAT dose of medications was not documented in the same location as other antibiotics in the medical record and was missed by the reviewers.
3. medical Records: Administration interval
The interval from the order to the administration of a definitive treatment (the “administration” interval) was also calculated for all four countries. We calculated both a facility mean and a pooled mean for each country. In order to increase the sample size, we included all OB emergencies for which one of the definitive treatments was ordered and administered, not just the diagnosis for which it is the designated definitive treatment. Further analysis needs to be done to ascertain whether we biased the results by including all OB emergencies. This interval also varied widely by type of emergency. Appendix Table B-9 shows that mean times for administration were shortest for oxytocin and anticonvulsants (approximately one hour) and longest for C-sections and antibiotics (over two hours). The interval for administration of the definitive treatment was substantially larger in Benin than the other three countries for all such treatments.
4. medical Records: order interval
The duration of order intervals of individual cases was not calculated because of the clinical inconclusiveness of the interval, as described above. Rough estimates of the average order interval durations by type of emergency and its definitive treatment were obtained by subtracting the mean administration interval from the mean treatment interval for each category obtained from Appendix Tables B-8 and B-9. (Figure 4).
figuRE 4. mEAn oRdER, AdminisTRATion, And TREATmEnT inTERvAls (in minuTEs)
5. Treatment and Administration intervals by hospital Type
In order to better compare these results across countries, we grouped the data by hospital type—national referral hospital, regional hospital, and district hospital—for both treatment intervals and administration intervals (Appendix Tables B-14 and B-15). The results do not reveal clear patterns. No one type of hospital emerges as consistently faster or slower than the others for all types of diagnoses and treatments. The district hospitals appear more erratic than the others, perhaps due to the smaller sample sizes. For example, mean treatment intervals in district hospitals are either the highest (PPH and obstructed labor) or lowest (eclampsia, sepsis, post-abortion complications) of all hospital types for all six diagnoses, and for administration intervals either the highest (blood pressure, C-section) or lowest (oxytocin, anti-hypertensives, anticonvulsants) for five of the six treatments. In the treatment intervals, regional hospitals were especially high in post-abortion complications, and district hospitals were especially high in PPH but especially low in sepsis (Appendix Table B-14).
Although sample sizes are small, Table B-14 shows that, in national referral hospitals, Jamaica had the shortest treatment intervals for PPH and obstructed labor; Ecuador had the shortest for eclampsia
anti-hypertensives and post-abortion complications; Rwanda was shortest for eclampsia anticonvulsants, and Benin for sepsis. But in the regional hospitals, Rwanda was shortest for PPH; Ecuador was shortest for eclampsia anti-hypertensives and sepsis; and Jamaica was shortest for eclampsia anticonvulsants, obstructed labor, and post-abortion complications. Administration intervals (Appendix Table B-15) tended to follow the same country-specific patterns as the treatment intervals.
6. overall interval: Arrival to definitive Treatment
We calculated three intervals having data: evaluation (time from arrival at hospital to initial professional evaluation), treatment (time from the diagnosis to the administration of a definitive treatment), and administration (time from the order of a definitive treatment to its administration). We did not obtain the diagnosis interval (from professional evaluation to diagnosis), since it is case specific and may not be meaningful in the aggregate. We estimated the mean value of the order interval for the different emergencies and their treatments by subtracting the mean administration interval from the mean treatment interval.
Two samples were used to calculate the evaluation, treatment, and administration intervals. The first was a sample of all women entering the OB unit of a facility over several days, and the second was
PPH: Oxytocin
Eclampsia: Anti-hypertensive
Eclampsia: Anticonvulsant
Obstructed labor: C-section
Sepsis: Antibiotic
Post-abortion complication
Minutes
4413
76 96
7613
85 131
155 151
= 57
= 172
= 89
= 216
= 306
= 285
0 50 100 150 200 250 300 350
Mean order interval Mean administrative interval Mean treatment interval= 000

SAFE MOTHERHOOD STUDIES–TIMELINESS OF IN-HOSPITAL CARE n ��
derived from a list of OB emergencies treated within the facility over the previous year. Our measurement of the arrival-to-professional evaluation interval did not attempt to differentiate by emergency. We found a mean pooled interval of 30 minutes over all cases in the patient flow sample. The measurements of the treatment interval from the chart review were calculated from a sample of emergencies, with the pooled mean ranging from approximately one hour for PPH- oxytocin to six hours for obstructed labor-C-section. Figure 4 portrays pooled mean intervals for different emergencies and their definitive treatments.
Because the samples were heavily weighted towards Ecuador in the patient flow data and towards Jamaica in the chart review data, we also calculated the mean of facility means and compared it to the pooled means in Appendix Tables B-8 and B-9. The pooled and facility-level means were roughly similar for the arrival-to-professional evaluation interval and the treatment interval. In the order-to-administration interval, the facility-level mean intervals were substantially higher for postpartum-oxytocin and obstructed labor-C-section, while the pooled mean intervals were substantially higher for postpartum-blood transfusion and sepsis-antibiotics.
D. DELAYS
1. frequency of delays
We measured the intervals between critical events, but since no standards define “delay,” the reviewers judged subjectively whether delays occurred during evaluation, diagnosis, or treatment based on their interpretation of the medical record. Their reports indicate that delays occurred most frequently during the definitive treatment (28% of the time) and occurred during obstructed labor, sepsis, and pre-eclampsia/eclampsia. The professional evaluations had delays 12% of the time and diagnoses 14% of the time (Table 8). Appendix Table B-16 shows the number of delays for each diagnosis and type of delay.
TABlE 8. fREquEnciEs of dElAys By TyPE of dElAy And counTRy
delay in … Benin Ecuador Jamaica Rwanda Pooled mean1
Evaluation 6.8% 1.5% 21.9% 12.5% 12.0% (36/299)
Diagnosis 13.7% 13.8% 16.2% 12.7% 14.4% (43/298)
Definitive treatment 2 21.3% 35.0% 23.0% 27.9% (62/222)
Percentage of records with delays3 16.4%2 35.4% 46.7% 20.0% 30.8% (101/328)
1. Parentheses contain the number of cases judged to have had delays divided by the number of obstetric records containing sufficient information to ascertain whether or not a delay had occurred and of what type.
2. Delays in definitive treatment for Benin were not assessed.
3. Some records had multiple types of delays.
Source: Patient record review.
2. Reasons for delays
Delay in professional evaluation: Initial examinations by a professional were often delayed because personnel were unavailable for various reasons. Some of these delays occurred at night in smaller hospitals, but many occurred during the day in larger hospitals. One vaginal exam was delayed by lack of hospital gloves in the exam room. At one delivery, a cord clamp was not readily accessible, contributing to neonatal asphyxia.
Delay in diagnosis: Many delays occurred between arrival and diagnosis, especially for patients with obstructed labor. Missed diagnoses occurred because of long intervals (e.g., eight hours) when patients were not monitored at all, by which time signs of fetal distress had been missed and fetal heart tones had disappeared. Incorrect diagnoses also occurred. For example, our expert reviewers felt that one woman should have been diagnosed with cephalo-pelvic disproportion on arrival, given her presenting symptoms, but it took six hours to make the diagnosis because symptoms were missed. In another case, an incorrect diagnosis was made because the OB specialist was unavailable.
The expert reviewers believe that diagnosing complications, such as dystocia, uterine rupture, or severe pre-eclampsia were delayed due to healthcare provider skill, whether or not the partograph was used, or restricted availability of basic equipment (e.g., blood pressure cuff). For
one patient, lab results were not available during the night to diagnose hemolysis, elevated liver enzymes, and low platelet count (HELLP) syndrome. A power outage in radiology delayed another diagnosis. Several cases of uterine rupture, generally thought to be due to untreated obstructed labor, occurred during hospitalizations.
Delay in definitive treatment: Delays in delivering definitive treatment occurred when medication was not available because someone had taken the pharmacy key or patients could not pay for drugs, lab, or diagnostic tests. In Jamaica, Benin, and Ecuador, delays occurred when the operating theater was occupied or personnel were busy. One hospital had only one elevator for patients and visitors, and since the OB ward was one floor below the surgical floor, transport was slow. In another case, an ambulance had to go in one direction to pick up the anesthetist and in the opposite for the lab technician before a C-section could begin.
Referrals up the hierarchy were sometimes difficult, with doctors being notified late or taking a long time to arrive when called. In one Rwanda case, the doctor could not be contacted because the phone was not working and no car was available. In Jamaica, the regional referral hospital was reluctant to accept referrals from the smaller district hospital. The time spent in communication between the hospitals made the C-section finally performed by the district hospital even more urgent than it would have been.

�� n SAFE MOTHERHOOD STUDIES–TIMELINESS OF IN-HOSPITAL CARE
V. DISCUSSIONTimeliness is a critical dimension of the quality of care. It differs from effectiveness, as care may be effective, but not timely. In this study we defined critical events for in-hospital obstetric care in four developing countries and then measured the intervals between these events by using patient flow observations and record review. Experts used this information to judge whether delays had occurred during five types of OB emergencies. We were able to document the time it took to evaluate and treat the emergencies and reasons for delays.
Although we present the results for four countries in this paper, it is difficult to compare these results across countries. The data collection varied between countries as the data collectors had to adapt to each specific health system. For example, at different facilities the observers were posted at different locations to capture facility arrival times. As a result the interval from arrival at the hospital gate to entry into the ER or OB unit is difficult to compare. Systematic training of the data collectors and assessment of their inter- and intra-rater reliability was not done due to time constraints and would be useful in future studies.
Because arrival times were not usually noted in the record, the patient flow analysis was essential in measuring the interval from arrival to the initial professional evaluation as well as in documenting delays in the professional evaluation. Times of critical events and delays occurring after the evaluation were found in the patient record. The patient records contained the times of critical events 61% of the time, sufficient, we felt, to make useful estimates of treatment and administration interval distributions, although we were not able to determine whether the documented times were also representative of the undocumented times.
Medical record review found that the treatment interval for postpartum hemorrhage and pre-eclampsia/eclampsia
was about two hours on average, while that for sepsis, obstructed labor, and post-abortion complications averaged two to six hours. The interval from order to the administration of a C-section was lengthy in Ecuador and Benin due to busy OR suites and personnel during the day at the large reference hospitals. Generally, more complex hospitals had more delays because personnel or facilities were busier. While prior research had found that care was delayed when a patient was admitted at night, we found the opposite to be true in Ecuador, Jamaica, and Benin. Delays in the professional evaluation occurred more during the day and on weekdays due to greater activity at those times.
We can compare some intervals from this study with previous studies in the literature. For the interval from the decision to the start of a C-section, Onwudiegwu et al. (1999) found a mean interval of 4.4 hours in Nigeria and Jahn et al. (2000) found a mean of 4.5 hours for the same interval in Nepal. We found a range from 1.9 hours in Ecuador and Jamaica to 2.1 hours in Rwanda and 3.7 hours in Benin. PMMN (1995) found that the interval from admission to treatment for a complicated abortion was 4 hours and 3 minutes and for PPH 1 hour and 51 minutes. We found that post-abortion complications were treated in a range from 2 hours and 53 minutes in Jamaica to 5 hours and 35 minutes in Ecuador. PPH was treated after diagnosis from 28 minutes in Jamaica to 1 hour and 37 minutes in Ecuador.
VI. CONCLUSIONS AND RECOMMENDATIONSWe believe that the timeliness of care for obstetric emergencies can be defined and measured within hospitals in developing countries and that this study has taken an important step in that direction. A hospital could adapt and use the tools and procedures from this study to monitor this critical indicator of quality for obstetric emergencies.
Another issue that needs more detailed analysis stems from the fact that the record review was only successful in yielding the sought data on times of critical events 61% of the time; 39% of the time it failed. Would the missing data have changed our conclusions?
Development of standards defining appropriate intervals for the treatment of OB emergencies is important to assure good patient outcomes. This work should continue in order to document current normative times for OB emergencies. Such normative times are estimates of good current practice and can be used to develop appropriate standards.
Our first recommendation is that while our data collection process obtained useful data for a one-time study, if timeliness were to be monitored on a continual basis, such as for quality improvement, one would need a simpler way to collect these data. The review process was (1) time-consuming, as it focused on five different OB emergencies and (2) expensive, as we used experts, who are more highly paid than others who could record the times of critical events. Alternatively, short abstraction forms, focusing on only one type of emergency, could be developed. The hospital could then decide which emergency/ies to monitor, select the records with that diagnosis, and use the short form for that diagnosis. The short form would have to clearly define intervals and criteria to determine whether a
Because arrival times were not
usually noted in the record,
the patient flow analysis was
essential in measuring the
interval from arrival to the
initial professional evaluation as
well as in documenting delays in
the professional evaluation.

SAFE MOTHERHOOD STUDIES–TIMELINESS OF IN-HOSPITAL CARE n ��
diagnosis had been missed. By using criteria, a less-skilled reviewer could conduct the record review, lowering the cost. However, until objective standards are developed to identify delays in evaluation, diagnosis, and treatment, expert judgment will be needed to determine which intervals include delays.
The use of a short form would facilitate an analysis of the effectiveness in addition to the timeliness of treatments for OB emergencies. For 20% of our cases, the definitive treatment was not recorded. Does this mean that the treatment was not given, and if so what treatments were given and what was the outcome? For another 14% of cases, the definitive treatment was given, but the times needed to calculate the treatment interval were not recorded. How many of these intervals lacked the administration time and did that mean
treatment was not given? Why are records not being kept, and how can record keeping be improved?
We did not attempt to analyze the relationship between objectively measured intervals and our experts’ judgements of delays. For example, to what extent can delays of a certain type be predicted by the duration of corresponding intervals? It is anticipated that a future analysis of the data and report will address this question.
We examined the number of delays and misdiagnoses for each emergency and associated definitive treatment, but are there associations between other factors in the data set and delays?
In future studies, greater detail on the duration of the critical events themselves
may facilitate analysis of the data. Measures of the start and end times of each critical event rather than just the start time may shed light on some intervals and delays. Provider and client interviews would also improve our understanding of reasons for delays. Patient exit interviews could assess satisfaction with care and any patient perceptions of delays in care, and provider interviews could reveal the reasons for delays from their perspective.
Finally, we believe that international timeliness standards for obstetric emergencies should be developed, using the results reported here and by other studies. Such standards would be a helpful addition to the international evidence-based guidelines currently in use.

�6 n SAFE MOTHERHOOD STUDIES–TIMELINESS OF IN-HOSPITAL CARE
Graham W, P Wagaarachchi, G Penney, A McCaw-Binns, KY Antwi, and MH Hall. 2000. Criteria for clinical audit of the quality of hospital-based obstetric care in developing countries. Bulletin of the World Health Organization 78(5):614–20.
Hoestermann CF, G Ogbaselassie, J Wacker, and G Bastert. 1996. Maternal mortality in the main referral hospital in The Gambia, West Africa. Tropical Medicine and International Health 1:710–17.
IOM (Institute of Medicine). 2000. Envisioning the National Health Care Quality Report. MP Hurtado, EK Swift, and JM Corrigan, Eds. Washington, DC.
———. 2001. Crossing the Quality Chasm: A New Health System for the 21st Century. Washington, DC.
Jahn A, M Dar Iang, U Shah, and HJ Diesfeld. 2000. Maternity care in rural Nepal: A health service analysis. Tropical Medicine and International Health 5:657–65.
Joint Commission on Accreditation of Healthcare Organizations. 1994. The Framework for Improving Performance: From Principles to Practice. Oakbrook, IL: Joint Commission.
Kerr EA, EA McGlynn, J Adams, J Keesey, and SM Asch. 2004. Profiling the quality of care in communities: Results from the community quality index study. Health Affairs 23(3):247–56.
Kwast BE. 1998. Quality of care in reproductive health programmes: Concepts, assessments, barriers and improvements—an overview. Midwifery 14:66–73.
Langer A, C Garcia-Barrios, A Heimburger, K Stein, B Winikoff, V Barahona, B Casas, and F Ramirez. 1997. Improving post-abortion care in a public hospital in Oaxaca, Mexico. Reproductive Health Matters 9:20–7.
Liljestrand J. 1999. Reducing perinatal and maternal mortality in the world: The major challenges. British Journal of Obstetrics and Gynaecology 106:877–80.
McCaw-Binns A, B Burkhalter, W Edson, SA Harvey, and C Antonakos. 2004. Safe motherhood studies—results from Jamaica: Competency of skilled birth attendants; the enabling environment for skilled birth attendance at delivery; in-hospital delays in obstetric care (documenting the third delay). Operations Research Results. Bethesda, MD: Published for USAID by QAP.
McGlynn EA, SM Asch, J Adams, J Keesey, J Hicks, A DeCristofaro, and EA Kerr. 2003. The quality of health care delivered to adults in the United States. New England Journal of Medicine 348(26):2635–45.
Onwudiegwu U, O Makinde, O Ezechi, and A Adeyemi. 1999. Decision-ceasarean delivery interval in a Nigerian university hospital: Implications for maternal morbidity and mortality. Journal of Obstetrics and Gynaecology 19:30–33.
O’Rourke K. 1995. The effect of hospital staff training on management of obstetrical patients referred by traditional birth attendants. International Journal of Gynecology & Obstetrics 48 Suppl:S95–102.
QAP (Quality Assurance Project). 2005. The Latin America Essential Obstetric Care Improvement Collaborative. Unpublished internal report. QAP.
PMMN (Prevention of Maternal Mortality Network). 1992. Barriers to treatment of obstetric emergencies in rural communities of West Africa. Studies in Family Planning 23:279–91.
———. 1995. Situation analyses of emergency obstetric care: Examples from eleven operations research projects in west Africa. Social Science & Medicine 40:657–67.
Thaddeus S and D Maine. 1994. Too far to walk: Maternal mortality in context. Social Science & Medicine 38:1091–10.
WHO. 2000. Managing Complications in Pregnancy and Childbirth: A Guide for Midwives and Doctors. Vol. WHO/RHR/00.7. Geneva: World Health Organization, Department of Reproductive Health and Research.
QAP-published reports can be found at www.qaproject.org.
REFERENCESAyabaca P, SA Harvey, WN Edson, B Burkhalter,
C Antonakos, J Hermida and P Romero. 2004. Estudios de maternidad segura—Resultados del Ecuador: Competencia del personal calificado para la atención al parto; El ambiente viabilizador para la atención calificada al parto; Demoras en el tratamiento de complicaciones obstétricas dentro de los establecimientos de salud (Análisis de la tercera demora). Resultados de la investigación operativa. Bethesda, MD: Publicado para la Agencia de los Estados Unidos para el Desarrollo Internacional (USAID) por el Proyecto de Garantía de Calidad.
Barnes-Josiah D, C Myntti, and A Augustin. 1998. The “three delays” as a framework for examining maternal mortality in Haiti. Social Scence andi Medicine 46:981–93.
Belghiti A, V De Brouwere, G Kegels, and W Van Lerberghe. 1998. Monitoring unmet obstetric need at district level in Morocco. Tropical Medicine and International Health 3:584–91.
Boucar M, M Bucagu, S Djibrina, W Edson, B Burkhalter, S Harvey, and C Antonakos. 2004. Safe motherhood studies—results from Rwanda: Competency of skilled birth attendants; the enabling environment for skilled attendance at delivery; in-hospital delays in obstetric care (documenting the third delay). Operations Research Results. Bethesda, MD: Published for the U.S. Agency for International Development (USAID) by the Quality Assurance Project (QAP).
Fawcus S, M Mbizvo, G Lindmark, and L Nystrom. 1996. A community-based investigation of avoidable factors for maternal mortality in Zimbabwe. Studies in Family Planning 27:319–27.
Gbangbade S, S Harvey, W Edson, B Burkhalter, and C Antonakos. 2003. Safe motherhood studies—results from Benin: Competency of skilled birth attendants; elements of an enabling environment for skilled attendance at delivery; causes of in-facility delays in obstetric care (the third delay). Operations Research Results. Bethesda, MD: Published for USAID by QAP.
Gbangbade S and WA Reinke. 1998. Quality of emergency obstetric at the first and secondary referral hospital level in the Republic of Benin. Arlington, VA: MotherCare/John Snow International.

SAFE MOTHERHOOD STUDIES–TIMELINESS OF IN-HOSPITAL CARE n ��
APPENDIX A
figuRE A-1. REcoRd REviEw AlgoRiThm
Conduct site visit to hospital
Complete Form 4.1 Initial Site Visit Information Form
Can women with OBSTETRIC emergencies
be identified through registers?
NoIs there any
other way to identify women with OBSTETRIC emergencies (i.e., audit all
C-sections)?
NoStop
Yes
Complete Worksheet C of Form 4.1 Initial Site Visit Information Form
Select 5 patients at random (using Worksheet C as sampling frame) and obtain their medical records (may be smaller number at smaller facility)
Yes
Complete Form 3.1.C Short Chart Review Form, Q8–11
Assess completeness of 5 records:
• Performance information
• Time information (dates, hour)
Are records complete?
No, not at all
Stop
Yes, partially
Have data collectors been trained?
Train record reviewers in data abstraction
Assess inter-rater or intra-rater reliability using 5-record sample
Request all records of OBSTETRIC emergencies in last year at the facility
Review all records using Form 4.2 Chart Review of OBSTETRIC complications
NoYes

�� n SAFE MOTHERHOOD STUDIES–TIMELINESS OF IN-HOSPITAL CARE
APPENDIX B
TABlE B-1. comPARison of mEThods foR mEAsuRing dElAys in cARE foR oBsTETRic EmERgEnciEs
method
Record review
strengths
Easier to obtain sufficient sample size of OB emergencies
Ethical
Includes day and night, weekday, and weekend cases
Less expensive
More useful for treatments such as C-section with well-documented times
Large sample size
Ethical
Includes all days and nights
Large sample size
weaknesses
Incomplete records and time documentation
May be unable to assess underlying reasons for delays
May need to use expert reviewer
most likely complications
All
C-section audit
Patient flow analysis: Arrival to definitive treatment
Incomplete records
May be unable to assess underlying reasons for delays
Pre-eclampsia
Obstructed labor
Patient flow observation
Can assess reasons for delays
Can measure interval from arrival at facility to initial evaluation, which is not in record
Can document actual care and accurate time
Can validate other measurement methods
May be unable to assess underlying reasons for delays
Dependent on record keeping by patient or in log book
Difficult to obtain an adequate sample size
Expensive if observers are hired/contracted
If observers aren’t hired/contracted, dependent on staff recording events and times during emergencies
Difficult to staff night and weekend observations
Difficult ethical considerations
Perceptions may be biased
Cannot obtain accurate intervals
Not useful for obtaining facility-based statistics
Hemorrhage
Post-abortion complications
Sepsis
Can assess reason for delay (missing supplies, lack of equipment, personnel, etc.)
Easy to administer
Less expensive
Can validate other measurement methods or results
Easy to administer
Can assess reason for delay (cost of supplies, etc.)
Can validate other measurement methods or results
Provider interview
Client (family) interview
Client or family may be unaware of provider actions
Cannot obtain accurate intervals
Not useful in obtaining facility-based statistics
May be difficult to identify and locate patients who experienced delays
All
All
All

SAFE MOTHERHOOD STUDIES–TIMELINESS OF IN-HOSPITAL CARE n ��
TABlE B-2. dEfiniTions of inTERvAls foR oBsTETRic EmERgEnciEs: EmERgEncy BEgAn BEFORE ARRivAl AT fAciliTy
intra-facility Process of care: (imPAc1 standards)
Start point
Intermediate point
Postpartum hemorrhage
Arrival at facility
Signs of shock assessed
Vaginal bleeding assessed
severe Pre-eclampsia or Eclampsia
Arrival at facility
Blood pressure assessed
Other actions:
• Assess fetal condition
• Check for proteinuria
obstructed labor
Arrival at facility
Uterine contractions assessed
Cervical dilation, station assessed
Other actions:
• Review partograph or obtain labor history
• Assess fetal condition
If fetus is alive, cervix is fully dilated, and head is at 0 station or below: Deliver by vacuum extraction
If fetus is alive, cervix not fully dilated or fetal head too high: Deliver by C-section
sepsis (chorioamnionitis or Puerperal)
Arrival at facility
Fever assessed
Foul-smelling vaginal discharge assessed
Post-Abortion complications: septic Abortion or uterine, vaginal, or Bowel injuries
Arrival at facility
History of gestation less than 24 weeks obtained
Fever assessed
Foul-smelling vaginal discharge assessed
Abdominal pain/tenderness assessed
Diagnosis of septic abortion: Manual vacuum aspiration
Other actions:
• Begin antibiotics
• Diagnosis of uterine, vaginal, or bowel injuries:
• Laparotomy to repair injury
Other actions: Simultaneous manual vacuum aspiration
End point: Definitive treatment
Oxytocin 10 units given (intramuscular injection)
Other actions:2
• Massage the uterus
• Start intravenous infusion
• Catheterize bladder
• Check placenta, manual exploration/removal of retained placenta
• Examine cervix, vagina, perimeum for tears and suture
Parenteral magnesium sulfate given (diazepam if not available)
Other actions:2
• Give parenteral hydralazine for diastolic pressure ≥ 110 mm Hg
• Monitor respirations
• Place on left side
• Deliver within 12 hours of the onset of convulsions
• Deliver within 24 hours in severe pre-eclampsia
A combination of antibiotics given
Notes:
1. Source: IMPAC (Integrated Management of Pregnancy and Childbirth), WHO 2000.
2. These are actions that should be done in addition to the definitive intervention or intermediate point for an obstetric emergency begun before arrival at facility.

20 n SAFE MOTHERHOOD STUDIES–TIMELINESS OF IN-HOSPITAL CARE
TABlE B-3. dEfiniTions of inTERvAls foR oBsTETRic EmERgEnciEs: EmERgEncy BEgAn DuRiNg hosPiTAlizATion
intra-facility Process of care: (imPAc1 standards)
Start point: Identification of problem
Postpartum hemorrhage
Presence of at least one of the following:
• Signs of shock
• Vaginal bleeding > 500 ml
severe Pre-eclampsia or Eclampsia
Presence of at least one:
• Diastolic blood pressure 110 mm Hg or more and proteinuria 3+ or more
• Convulsion
obstructed labor
Partograph shows cervical dilatation to the right of alert line
sepsis (chorioamnionitis or Puerperal)
Fever present
Foul-smelling vaginal discharge present
Post-Abortion complications: septic Abortion or uterine, vaginal, or Bowel injuries
History of gestation < 24 weeks
Fever
Foul-smelling vaginal discharge present
Abdominal pain/tenderness present
Diagnosis of septic abortion or uterine, vaginal or bowel injuries reached
Or
Decision to perform manual vacuum aspiration or laparotomy reached
Diagnosis of septic abortion: Manual vacuum aspiration
Other actions: Begin antibiotics
Diagnosis of uterine, vaginal or bowel injuries: Laparotomy to repair injury
Other actions: Simultaneous manual vacuum aspiration
Intermediate point
Diagnosis of PPH reached
Or
Decision to give oxytocin reached
Diagnosis of severe pre-eclampsia or eclampsia reached
Or
Decision to give MgSO4 reached
Diagnosis of chorioamnionitis or puerperal sepsis reached
Or
Decision to give antibiotics reached
Diagnosis of obstructed labor reached
Or
Decision to perform C- section or vacuum extraction reached
End point: Definitive treatment
Oxytocin 10 units given (intramuscular injection)
Other actions:2
• Massage the uterus
• Start intravenous infusion
• Catheterize bladder
• Check placenta, manual exploration/removal of retained placenta
• Examine cervix, vagina, perimeum for tears and suture
Parenteral magnesium sulfate given (diazepam if not available)
Other actions:2
• Give parenteral hydralazine for diastolic pressure ≥ 110 mm HG
• Monitor respirations
• Place on left side
• Deliver within 12 hours of the onset of convulsions
• Deliver within 24 hours in severe pre-eclampsia
If fetus is alive, cervix is fully dilated and head is at 0 station or below: Delivery by vacuum extraction
If fetus is alive, cervix not fully dilated or fetal head too high: Delivery by C-section
A combination of antibiotics is given
Notes:
1. Source is IMPAC (Integrated Management of Pregnancy and Childbirth, WHO, 2000).
2. These are actions that should be done in addition to the definitive intervention.

SAFE MOTHERHOOD STUDIES–TIMELINESS OF IN-HOSPITAL CARE n 2�
TABlE B-4. kEy inTERvAls: EvAluATion, TREATmEnT, AdminisTRATion
key intervals
Definition
Evaluation
Average interval in minutes between arrival at facility and professional evaluation for women of childbearing age
Direct observation during patient flow study
Time patient arrived at hospital gate or OB ward, depending on facility
Time that nurse, midwife, or other professional conducted a physical exam
Subtract start time from end time, using a 24-hour clock, correcting for any date change during the interval
None were found
Treatment
Average interval in minutes between diagnosis and definitive treatment
Medical record review by obstetrical expert (MD)
Time of diagnosis by a professional
Administration
Average interval in minutes between order and administration of treatment
Medical record review by obstetrical expert (MD)
Time that treatment was ordered by a professional
Time that treatment was administered to patient
Subtract start time from end time, using a 24-hour clock, correcting for any date change during the interval
None were found
Data collection method
Start of interval
End of interval Time that the definitive treatment was administered to patient
Subtract start time from end time, using a 24-hour clock, correcting for any date change during the interval
None were found
Calculation method
Standards
TABlE B-5. dElAys
Types of delays
Definition
Professional Evaluation
Percentage of cases where the professional evaluation was late, according to the medical expert
Medical record review by obstetrical expert (MD)
Cases of OB emergencies where the professional evaluation was late
All records reviewed for the OB emergency
Divide numerator by denominator and multiply by 100
None were found
diagnosis
Percentage of cases where the correct diagnosis was missed, initially incorrect, or not made
Medical record review by obstetrical expert (MD)
Cases of OB emergencies where the diagnosis was initially missed, initially incorrect, or not made
All records reviewed for the OB emergency
Divide numerator by denominator and multiply by 100
None were found
Administration of definitive Treatment
Percentage of cases where the administration of the definitive treatment was late, according to the medical expert
Medical record review by obstetrical expert (MD)
Cases of OB emergencies where the administration of the definitive treatment was late
All records reviewed for the OB emergency
Divide numerator by denominator and multiply by 100
None were found
Data collection method
Numerator
Denominator
Calculation method
Standards

22 n SAFE MOTHERHOOD STUDIES–TIMELINESS OF IN-HOSPITAL CARE
TABlE B-6. summARy of PATiEnT chARAcTERisTics fRom ThE mEdicAl REcoRd REviEw, By counTRy
Benin (n = 73) Ecuador (n = 65) Jamaica (n = 105) Rwanda (n = 85)
Mean maternal age 24.8 23.9 26.0 26.8
Parity (mean) 1.3 1.4 1.5 1.9
Emergency C-sections 41 (56%) 28 (43%) 37 (35%) 25 (29%)
Emergency in-coming transfers 42 (58%) 11 (17%) 22 (21%) 22 (26%)
Live births 47 (64%) 38 (58%) 70 (67%) 50 (59%)
Fetal deaths 11 (15%) 6 (9%) 8 (8%) 11 (13%)
HIV-positive 0 Missing 0 1 (1%)
Infected with tuberculosis 0 1 (2%) 1 (1%) 2 (2%)

SAFE MOTHERHOOD STUDIES–TIMELINESS OF IN-HOSPITAL CARE n 2�
Benin Ecuador Jamaica Rwanda All countries
Time of professional evaluation 81% (59/73) 94% (61/65) 92% (97/105) 59% (50/85) 81% (267/328)
Time of diagnosis
Postpartum hemorrhage 72% (13/18) 42% (5/12) 35% (7/20) 7% (2/27) 35% (27/77)
Pre-eclampsia/eclampsia 52% (15/29) 38% (9/24) 34% (13/38) 23% (3/13) 38% (40/104)
Obstructed labor 48% (12/25) 53% (8/15) 29% (10/34) 0% (0/19) 32% (30/93)
Sepsis 35% (6/17) 0% (0/6) 63% (10/16) 26% (6/23) 35% (22/62)
Post-abortion complications 43% (3/7) 50% (1/2) 33% (1/3) 0% (0/7) 26% (5/19)
Pooled subtotal diagnosis 51% (49/96) 39% (23/59) 37% (41/111) 12% (11/89) 35% (124/355)
Time of order for treatment
Oxytocin 28% (15/53) 70% (23/33) 94% (50/53) 24% (6/25) 57% (94/164)
Blood transfusion 42% (5/12) 67% (12/18) 69% (9/13) - - 60% (26/43)
Anti-hypertensive 42% (11/26) 91% (21/23) 88% (30/34) - - 75% (62/83)
Anticonvulsant 33% (6/18) 76% (34/45) 76% (31/41) 100% (5/5) 70% (76/109)
C-section 79% (30/38) 67% (16/24) 97% (28/29) 6% (1/16) 70% (75/107)
Antibiotic 53% (30/57) 76% (39/51) 75% (44/59) 14% (7/50) 55% (120/217)
Post-abortion treatment 60% (3/5) 67% (2/3) 100% (3/3) 45% (5/11) 59% (13/22)
Pooled subtotal order 48% (100/209) 75% (147/197) 84% (195/232) 22% (24/107) 63% (466/745)
Time of administration of treatment
Oxytocin 34% (18/53) 42% (14/33) 89% (47/53) 36% (9/25) 54% (88/164)
Blood transfusion 83% (10/12) 50% (8/19) 77% (10/13) - - 67% (29/43)
Anti-hypertensive 58% (15/26) 0% (0/23) 85% (29/34) - - 53% (44/83)
Anticonvulsant 72% (13/18) 78% (35/45) 78% (32/41) 100% (5/5) 78% (85/109)
C-section 89% (34/38) 88% (21/24) 100% (29/29) 25% (4/16) 82% (88/107)
Antibiotic 32% (18/57) 86% (44/51) 78% (46/59) 18% (9/50) 54% (117/217)
Post-abortion treatment 60% (3/5) 67% (2/3) 100% (3/3) 73% (8/11) 73% (16/22)
Pooled subtotal administration 53% (111/209) 63% (125/197) 84% (196/232) 33% (35/107) 63% (467/745)
Pooled total 54% (319/587) 69% (356/518) 78% (529/680) 31% (120/388) 61% (1324/2173)
Notes:
1. Denominators for the professional evaluation events are number of cases; for the diagnostic events they are number of emergencies; and for the order and administration of treatments, they are number of all treatments (both definitive and other) of that type.
2. Some cases have more than one obstetric emergency, while in other cases the type of emergency is unclear, not one of the five included in the study, or not recorded.
TABlE B-7. missing REcoRd dATA: PERcEnTAgE of soughT cRiTicAl EvEnT dATA iTEms found

2� n SAFE MOTHERHOOD STUDIES–TIMELINESS OF IN-HOSPITAL CARE
TABlE B-8. TREATmEnT inTERvAl: fRom diAgnosis of EmERgEncy To AdminisTRATion of dEfiniTivE TREATmEnT, By TREATmEnT And counTRy (in minuTEs)1
Benin Ecuador Jamaica Rwanda All countries2
Postpartum hemorrhage: 52 41 97 127 28 14 30 45 51.8 57.2 Oxytocin n = 5 (0 –40) n = 10 (15 –390) n = 12 (0 –16) n = 8 (3 –43) n = 35
Pre-eclampsia/eclampsia: 217 237 109 117 135 163 153.7 171.6 Anti-hypertensives n = 14 (19 –591) n = 13 (28 –218) n = 24 (49 –255) n = 51
Pre-eclampsia/eclampsia: 110 116 97 88 89 87 24 24 80.0 89.1 Anticonvulsants (MgSO4, others) n = 12 (20 –136) n = 18 (29 –84) n = 21 (0 –85) n = 4 (14 –30) n = 55
Obstructed labor: 348 366 168 188 170 158 194 193 220.0 216.4 C-section n = 113 (153 –357) n = 14 (68 –236) n = 17 (59 –178) n = 11 (20 –285) n = 53
Sepsis: 283 312 205 254 339 365 275.7 306.3 Antibiotics n = 8 (86 –375) n = 11 (66 –255) n = 9 (183 –525) n = 28
Post-abortion complications 300 336 335 335 173 221 224 224 258.0 284.7 n = 8 (60 –704) n = 8 (78 –469) n = 8 (13 –176) n = 5 (35 –485)4 n = 29
Total5 218.3 243.5 168.5 168.7 155.7 150.0 118.0 132.1 173.2 175.1 n = 58 n = 74 n = 91 n = 28 n = 2516
Notes:
1. This table has data for treatment intervals for definitive treatments only (no other treatments) that have valid times for the diagnosis and the administrative events. In each cell except the Total row and the All Countries column, the first number in the top row is the mean of facility-level mean intervals, and second number is the pooled interval mean of all valid measurements of treatment intervals in the country, and the bottom row contains the sample size (n) and in parenthesis the 25–75th percentile of all cases.
2. In the All Countries column, the first number in the top row of each cell is the average across all countries of the country facility means, and the second number is the pooled mean of all valid treatment interval measurements across all countries.
3. Outlier removed from analysis.
4. Treatment for post-abortion complications in Rwanda was curettage.
5. In the Total row at the bottom, the first number in the top row of each cell is the average of all definitive treatments of facility means in the country, and the second number is the pooled mean of all valid interval measurements across all definitive treatments.
6. In the summary cell at the intersection of the Total row and the All Countries column, the first number is the mean across all six definitive treatments of the means across all countries of facility-level means, and the second number is the pooled interval of all valid interval measurements across countries and definitive treatments.
Source: Medical record review.

SAFE MOTHERHOOD STUDIES–TIMELINESS OF IN-HOSPITAL CARE n 2�
TABlE B-9. AdminisTRATion inTERvAl: fRom oRdER To AdminisTRATion of All TREATmEnTs, By dEfiniTivE TREATmEnT And counTRy (in minuTEs)1
facility means, Pooled means, sample size, and Percentile Range2
Benin Ecuador Jamaica Rwanda All countries3 Treatment (4 hospitals) (3 hospitals) (4 hospitals) (3 hospitals) (14 hospitals)
Oxytocin 185 111 55 38 31 37 54 54 81.3 43.8 n = 5 (0–230) n = 12 (1–55) n = 48 (0–37) n = 6 (10–90) n = 71
Blood transfusion 192 258 79 88 31 43 75.5 106.8 n = 4 (30–460) n = 5 (11–195) n = 8 (4–76) n = 17
Anti-hypertensive 190 224 59 67 54 75 75.8 95.6 n = 7 (50–611) n = 12 (1–93) n = 27 (0–105) n = 46
Anticonvulsants (MgSO4, others) 68 80 49 504 58 994 18 18 64.3 76.2 n = 4 (45–124) n = 16 (26–59) n = 28 (0–56) n = 4 (6–29) n = 52
C-section 224 164 113 136 116 102 90 1285 181.0 130.9 n = 28 (49–140) n = 16 (50–206) n = 34 (40–168) n = 9 (65–173) n = 87
Antibiotic 187 208 94 86 144 2096 44 44 117.3 150.8 n = 13 (60–227) n = 37 (30–105) n = 45 (18–365) n = 9 (30–60) n = 104
Total7 174.3 176.6 74.8 80.2 72.3 104.2 51.5 69.4 99.2 107.1 n = 61 n = 98 n = 190 n = 28 n = 3778
Notes:
1. This table has data on administration intervals for all treatments (both definitive and other) that have valid times for the order and the administrative events. A few of the mean administration intervals are nearly as large or slightly larger than the corresponding mean treatment intervals (Table B-12) because the samples were not identical; the administration interval sample includes both definitive and other treatments while the treatment interval analysis includes only definitive treatments.
2. In each cell except the Total row and the All Countries column, the first number in the top row is the mean of facility-level mean intervals, and second number is the pooled interval mean of all valid measurements of administration intervals in the country, and the bottom row has the sample size (n) and in parenthesis the 25-75th percentile of all cases.
3. In this column, the first number in the top row of each cell is the average across all countries of the country facility means, and the second number is the pooled mean of all valid administration interval measurements across all countries.
4. MgSO4 only.
5. Some C-section administration time intervals in Rwanda were obtained from patient flow observations.
6. STAT doses not recorded.
7. In this row, the first number in the top row of each cell is the average of all treatments of facility means in the country, and the second number is the pooled mean of all valid interval measurements across all treatments.
8. In this summary cell, the first number is the mean across all treatments of the means across all countries of facility-level means, and the second number is the pooled interval of all valid interval measurements across countries and treatments.
Source: Medical record review, except as described in note 5.
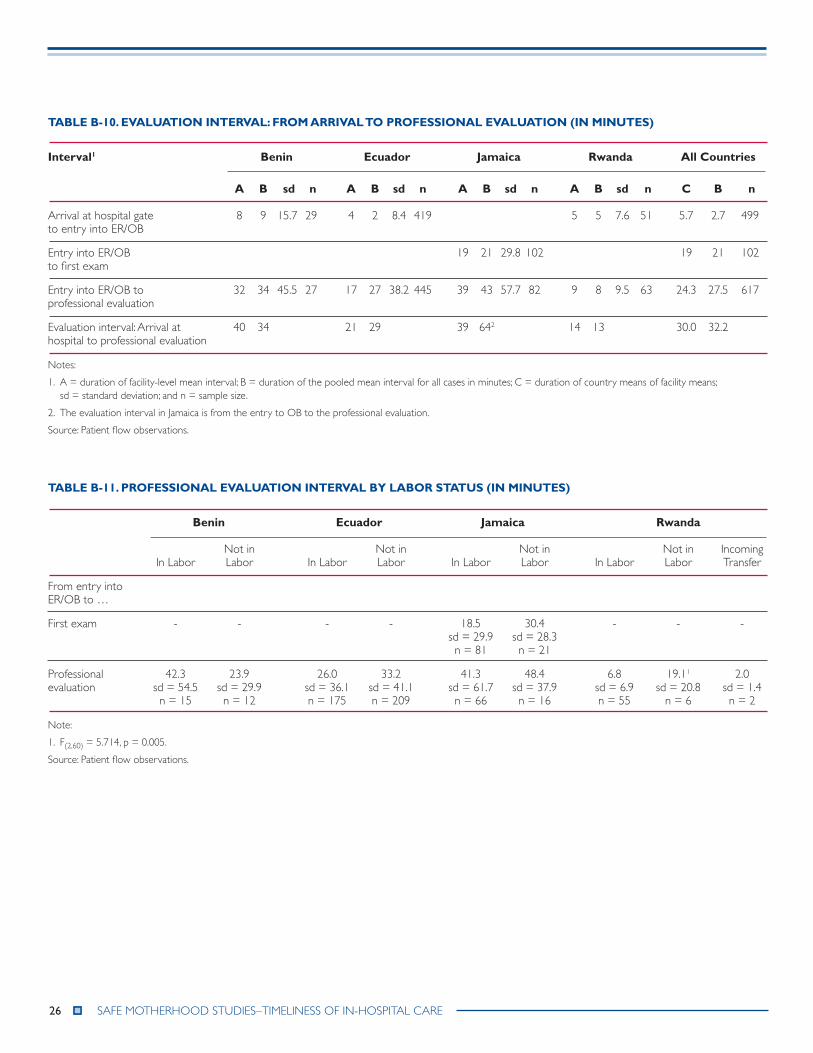
26 n SAFE MOTHERHOOD STUDIES–TIMELINESS OF IN-HOSPITAL CARE
TABlE B-10. EvAluATion inTERvAl: fRom ARRivAl To PRofEssionAl EvAluATion (in minuTEs)
interval1 Benin Ecuador Jamaica Rwanda All countries
A B sd n A B sd n A B sd n A B sd n c B n
Arrival at hospital gate 8 9 15.7 29 4 2 8.4 419 5 5 7.6 51 5.7 2.7 499 to entry into ER/OB
Entry into ER/OB 19 21 29.8 102 19 21 102 to first exam
Entry into ER/OB to 32 34 45.5 27 17 27 38.2 445 39 43 57.7 82 9 8 9.5 63 24.3 27.5 617 professional evaluation
Evaluation interval: Arrival at 40 34 21 29 39 642 14 13 30.0 32.2 hospital to professional evaluation
Notes:
1. A = duration of facility-level mean interval; B = duration of the pooled mean interval for all cases in minutes; C = duration of country means of facility means; sd = standard deviation; and n = sample size.
2. The evaluation interval in Jamaica is from the entry to OB to the professional evaluation.
Source: Patient flow observations.
TABlE B-11. PRofEssionAl EvAluATion inTERvAl By lABoR sTATus (in minuTEs)
Benin Ecuador Jamaica Rwanda
Not in Not in Not in Not in Incoming In Labor Labor In Labor Labor In Labor Labor In Labor Labor Transfer
From entry into ER/OB to …
First exam - - - - 18.5 30.4 - - - sd = 29.9 sd = 28.3 n = 81 n = 21
Professional 42.3 23.9 26.0 33.2 41.3 48.4 6.8 19.11 2.0 evaluation sd = 54.5 sd = 29.9 sd = 36.1 sd = 41.1 sd = 61.7 sd = 37.9 sd = 6.9 sd = 20.8 sd = 1.4 n = 15 n = 12 n = 175 n = 209 n = 66 n = 16 n = 55 n = 6 n = 2
Note:
1. F(2,60) = 5.714, p = 0.005.
Source: Patient flow observations.

SAFE MOTHERHOOD STUDIES–TIMELINESS OF IN-HOSPITAL CARE n 2�
TABlE B-12. PRofEssionAl EvAluATion inTERvAl By TimE of dAy (dAy vERsus nighT, in minuTEs)
Benin Ecuador Jamaica Rwanda
day night day night day night day night
From arrival at hospital to …
Entry into ER/OR 15.3 4.3 1.7 2.3 - - 3.01 8.8 sd = 22.5 sd = 5.7 sd = 7.5 sd = 10 sd = 4.5 sd = 10.1 n = 13 n = 17 n = 279 n = 140 n = 32 n = 19
From entry into ER/OB to …
First exam - - - - 24.8 15.8 - - sd = 31.6 sd = 26.8 n = 58 n = 44
Professional evaluation 46.1 25.9 38.2 9.72 46.3 38.6 8.1 7.1 sd = 61.8 sd = 29.3 sd = 44.4 sd = 13.9 sd = 46.9 sd = 68.6 sd = 9.1 sd =10.4 n = 11 n = 16 n = 269 n = 140 n = 44 n = 38 n = 38 n = 24
Notes:
1. F(1,407) = 54.61, p < 0.001.
2. F(1,49) = 8.19, p = 0.006.
Source: Patient flow observations.
TABlE B-13. PRofEssionAl EvAluATion inTERvAl By dAy of wEEk (wEEkdAy vERsus wEEkEnd, in minuTEs)
Benin Ecuador Jamaica Rwanda
weekday weekend weekday weekend weekday weekend weekday weekend
From arrival at hospital to …
Entry into ER or OB ward 12.0 1.8 1.5 2.4 - - 6.0 2.3 sd = 18.2 sd = 1.2 sd = 6.9 sd = 10.3 sd = 8.2 sd = 3.7 n = 20 n = 9 n = 247 n = 172 n = 40 n = 11
From entry into ER/OB to …
First exam - - - - 26.6 11.51 - - sd = 34.1 sd = 17.3 n = 64 n = 38
Professional evaluation 43.4 12.3 24.5 30.8 53.8 23.5 7.4 9.72 sd = 51.7 sd = 4.3 sd = 34.4 sd = 42.9 sd = 68.5 sd = 21.0 sd = 9.0 sd = 12.1 n = 19 n = 8 n = 261 n = 184 n = 52 n = 30 n = 52 n = 11
Notes:
1. F(1,100) = 6.42, p = 0.013.
2. F(1,80) = 5.55, p = 0.021.
Source: Patient flow observations..

2� n SAFE MOTHERHOOD STUDIES–TIMELINESS OF IN-HOSPITAL CARE
TABlE B-14. mEAn TREATmEnT inTERvAl By hosPiTAl TyPE: fRom diAgnosis To AdminisTRATion of TREATmEnT, foR All counTRiEs And dEfiniTivE TREATmEnTs (in minuTEs)1
Postpartum Eclampsia/ Eclampsia/ hemorrhage: Pre-eclampsia: Pre-eclampsia obstructed Post-Abortion oxytocin, Blood Anti- Anticonvulsants labor: sepsis: complication country Transfusions hypertensives (mgs04 or other) c-section Antibiotics Treatments 3,5
national Referral hospitals (4)
Benin 25 242 187 305 120 340 n = 3 n = 7 n = 5 n = 34 n = 1 n = 1
Ecuador 41 124 46 209 406 117 n = 2 n = 8 n = 10 n = 6 n = 5 n = 4
Jamaica 0 220 99 86 294 140 n = 2 n = 10 n = 8 n = 6 n = 4 n = 2
Rwanda 60 - 24 179 - 2244 n = 6 n = 4 n = 6 n = 5
Pooled mean 40 195 85 179 333 184 n = 13 n = 25 n = 27 n = 21 n = 10 n = 12
Regional hospitals (6)
Benin 130 398 113 468 541 628 n = 1 n = 4 n = 3 n = 4 n = 3 n = 3
Ecuador 30 80 194 195 70 553 n = 3 n = 2 n = 5 n = 6 n = 1 n = 4
Jamaica2 27 115 80 181 421 248 n = 6 n = 11 n = 13 n = 9 n = 5 n = 6
Rwanda2 0 - - 209 - - n = 2 n = 5
Pooled mean3 32 177 112 238 422 430 n = 12 n = 13 n = 21 n = 24 n =9 n = 13
district hospitals (3)
Benin - - - 510 168 n = 2 - n = 2
Ecuador 219 122 50 100 138 - n = 5 n = 3 n = 3 n = 2 n = 5
Jamaica 1 147 - 267 - - n = 4 n = 3 n = 2
Rwanda - - - - - -
Pooled mean 122 135 50 292 138 168 n = 9 n = 6 n = 3 n = 6 n = 5 n = 2
Notes:
1. Data are the mean treatment intervals and the number of cases for each definitive treatment by hospital type and country, except in regional hospitals in Jamaica and Rwanda (see note 2).
2. Jamaica and Rwanda had two regional hospitals each, and the mean interval for regional hospitals in these countries is the facility average, not the pooled case mean as in the other cells. Therefore, the pooled means presented in Tables B-8, B-9, and Figure 4 differ slightly.
3. The pooled mean for each definitive treatment for regional hospitals assumes that the mean interval for the country (calculated as the average of the two regional hospital means) applies to each case.
4. An outlier was removed from the analysis in Benin.
5. Treatment for post-abortion complications in Rwanda was curettage.
Source: Medical record review.

SAFE MOTHERHOOD STUDIES–TIMELINESS OF IN-HOSPITAL CARE n 2�
TABlE B-15. mEAn AdminisTRATion inTERvAl By hosPiTAl TyPE: fRom oRdER To AdminisTRATion of TREATmEnT, foR All counTRiEs And TREATmEnTs (in minuTEs)1
Anti- Anticonvulsants country oxytocin Blood Transfusions hypertensives (mgs04 or other) c-section Antibiotics
national Referral hospitals (4)
Benin 330 0 223 115 104 150 n = 1 n = 1 n = 4 n = 2 n = 114 n = 3
Ecuador 35 36 71 99 179 43 n = 9 n = 4 n = 7 n = 17 n = 9 n = 15
Jamaica 46 53 90 19 77 349 n = 14 n = 5 n = 11 n = 10 n = 13 n = 19
Rwanda 54 - - 18 - 44 n = 6 n = 4 n = 9
Pooled mean 54 41 108 66 114 177 n = 30 n = 10 n = 22 n = 33 n = 33 n = 46
Regional hospitals (6)
Benin - 120 331 45 234 372 n = 1 n = 2 n = 1 n = 7 n = 4
Ecuador 115 - 13 47 67 78 n = 1 n = 2 n = 4 n = 3 n = 12
Jamaica2 38 26 78 69 91 111 n = 29 n = 3 n = 13 n = 18 n = 16 n = 25
Rwanda2 - - - - - -
Pooled mean3 41 50 100 64 127 127 n = 30 n = 4 n = 17 n = 23 n =26 n = 41
district hospitals (3)
Benin 111 - - - 480 68 n = 2 n = 2 n = 2
Ecuador 15 123 92 43 93 160 n = 2 n = 1 n = 3 n = 4 n = 4 n = 10
Jamaica 0 - 7 - 205 15 n = 5 n = 3 n = 5 n = 1
Rwanda - - - - - -
Pooled mean 28 123 50 43 214 135 n = 9 n = 1 n = 6 n = 4 n = 11 n = 13
Notes:
1. This table contains administration intervals pooled for all cases with valid data for all treatments (both definitive and other), except regional hospitals in Jamaica and Rwanda (see note 2). A few of the mean administration intervals are nearly as large or slightly larger than the corresponding mean treatment intervals because the samples were not identical; the administration interval sample includes both definitive and other treatments while the treatment interval analysis includes only definitive treatments.
2. Jamaica and Rwanda had two regional hospitals each, and the mean interval for regional hospitals in these two countries is the facility average, not the pooled case mean as in the other cells. Therefore, the pooled means presented in Tables B-8, B-9, and Figure 4 differ slightly.
3. The pooled mean for each definitive treatment for regional hospitals assumes that the mean interval for the country (calculated as the average of the two regional hospital means) applies to each case.
4. An outlier was removed from analysis in Benin.
Source: Medical record review.

�0 n SAFE MOTHERHOOD STUDIES–TIMELINESS OF IN-HOSPITAL CARE
TABlE B-16. numBER of cAsEs wiTh dElAys in EvAluATion, diAgnosis, And dEfiniTivE TREATmEnT, By EmERgEncy
country Total
Type of delay and Emergency Benin Ecuador Jamaica Rwanda Pooled mean
Professional evaluation delays
Postpartum hemorrhage 1 0 4 0 5
Eclampsia/severe pre-eclampsia 1 0 8 2 11
Obstructed labor 2 0 8 3 13
Sepsis1 1 0 1 0 2
Post-abortion complications2 0 1 1 2 4
delay in professional evaluation 6.8% 1.5% 21.9% 12.5% 12.0% 5/73 1/65 23/105 7/56 36/299
diagnosis delays
Postpartum hemorrhage 1 0 3 1 5
Eclampsia/severe pre-eclampsia 6 6 5 3 20
Obstructed labor 3 2 5 3 13
Sepsis1 1 3 3 0 7
Post-abortion complications2 0 2 0 0 2
delay in diagnosis 13.7% 13.8% 16.2% 12.7% 14.4% 10/73 9/65 17/105 7/55 43/298
definitive treatment delays
Postpartum hemorrhage - 2 4 1 7
Eclampsia/severe pre-eclampsia - 5 9 4 18
Obstructed labor - 1 11 10 22
Sepsis1 - 6 11 0 17
Post-abortion complications2 - 2 3 0 5
delay in definitive treatment -3 21.3% 35.0% 23.0% 27.9% 13/61 35/100 14/61 62/222
Pooled delays 16.4% 35.4% 46.7% 20.0% 30.8% 12/734 23/65 49/105 17/85 101/328
Notes:
1. Sepsis includes chorioamnionitis and puerperal sepsis.
2. Post-abortion complication includes septic abortion and uterine lesions.
3. Delays in definitive treatment were not assessed in Benin.
4. The columns do not total the number of cases because some of the cases had multiple OB emergencies.
Source: Patient record review.

QUALITY ASSURANCE PROJECTUniversity Research Co., LLC
7200 Wisconsin Avenue, Suite 600Bethesda, MD 20814
Tel: (301) 654-8338Fax: (301) 941-8427www.qaproject.org
Related Documents