Safe and Healthy with Sustainable Mobility Assist. Prof. Vedran Kirincic, PhD [email protected] Sustainable energy / Mobility expert Faculty of Engineering, University of Rijeka, Croatia https://www.linkedin.com/in/vedrankirincic/

Welcome message from author
This document is posted to help you gain knowledge. Please leave a comment to let me know what you think about it! Share it to your friends and learn new things together.
Transcript

Safe and Healthy with Sustainable Mobility
Assist. Prof. Vedran Kirincic, PhD
Sustainable energy / Mobility expert
Faculty of Engineering, University of Rijeka, Croatia
https://www.linkedin.com/in/vedrankirincic/

2
Global EU
Source:
https://ourworldindata.org/ghg-emissions-by-sector#licence
https://www.acea.be/uploads/publications/ACEA_10-point_plan_European_Green_Deal.pdf
Greenhouse gas emissions
73.4% of
transport
94.6% of transport
60.6% of road transport
* All CO2 equivalent
3
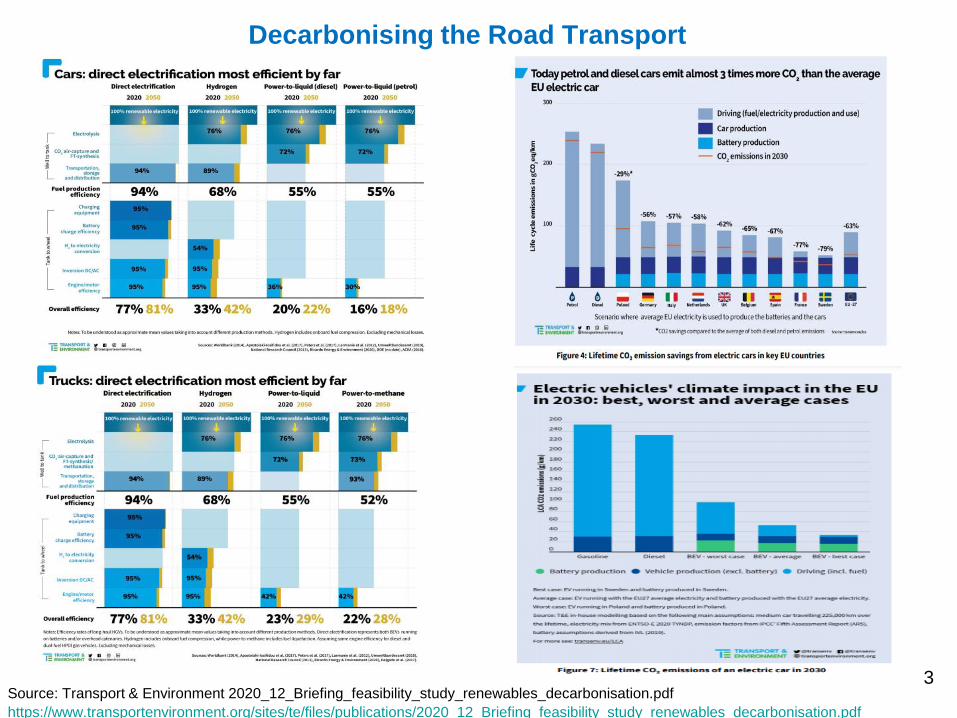
Decarbonising the Road Transport
Source: Transport & Environment 2020_12_Briefing_feasibility_study_renewables_decarbonisation.pdf
https://www.transportenvironment.org/sites/te/files/publications/2020_12_Briefing_feasibility_study_renewables_decarbonisation.pdf
4
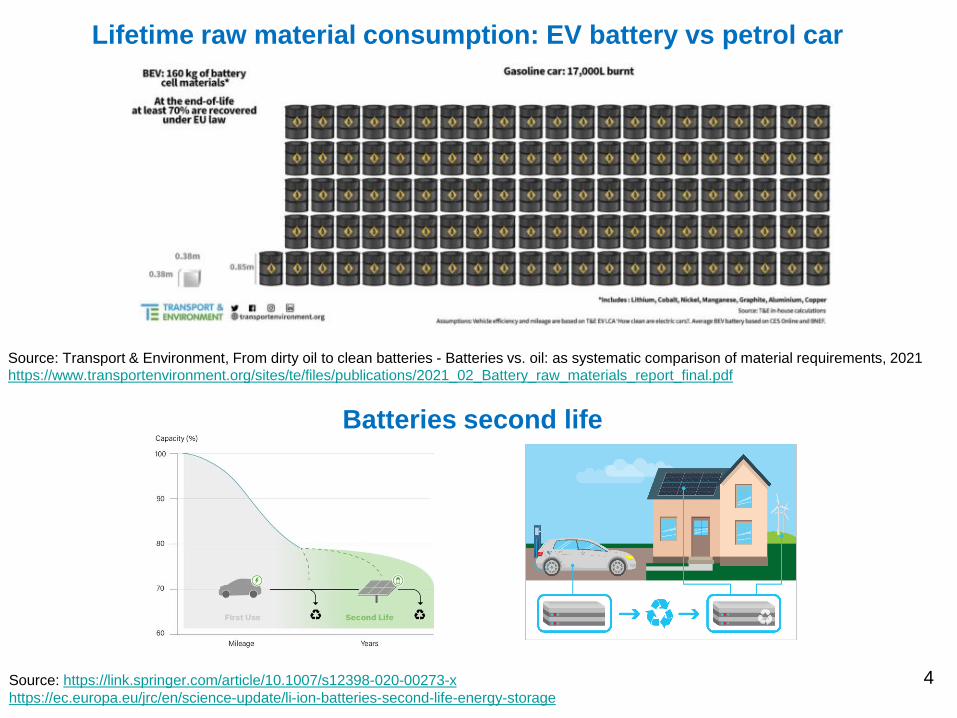
Lifetime raw material consumption: EV battery vs petrol car
Source: Transport & Environment, From dirty oil to clean batteries - Batteries vs. oil: as systematic comparison of material requirements, 2021
https://www.transportenvironment.org/sites/te/files/publications/2021_02_Battery_raw_materials_report_final.pdf
Batteries second life
Source: https://link.springer.com/article/10.1007/s12398-020-00273-x
https://ec.europa.eu/jrc/en/science-update/li-ion-batteries-second-life-energy-storage
5
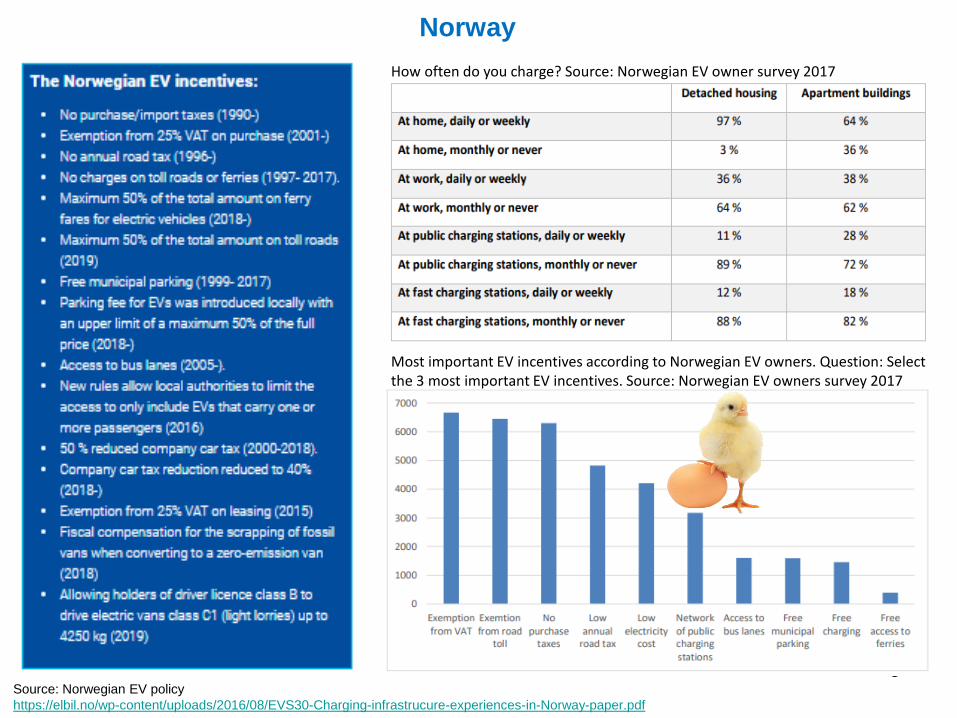
Norway
Source: Norwegian EV policy
https://elbil.no/wp-content/uploads/2016/08/EVS30-Charging-infrastrucure-experiences-in-Norway-paper.pdf
How often do you charge? Source: Norwegian EV owner survey 2017
Most important EV incentives according to Norwegian EV owners. Question: Select the 3 most important EV incentives. Source: Norwegian EV owners survey 2017

6
Croatia
Source: EIHP Energy in Croatia – Annual energy report 2019
Croatian Bureau of Statistics, https://www.dzs.hr/Hrv_Eng/Pokazatelji/Transport%20i%20komunikacije/Transport%20-
%2002%20cestovna%20infrastruktura,%20obujam%20cestovnog%20prometa.xlsx
CO2 emissionsEnergy consumption
41%101.84 PJ
Fuel consumption
by transport modeVOLUME OF ROAD TRAFFIC (NATIONAL VEHICLES),
BY TYPE OF VEHICLE, Vehicle-kilometres, million2014. 2015. 2016. 2017. 2018.
Total 22.480 24.136 26.047 26.974 28.237
M1: Passenger cars 18.262 19.444 20.809 21.473 22.322
M2/M3: Buses and coaches 276 304 328 335 351
N1: Goods vehicles up to 3.5t MPW 2.058 2.311 2.623 2.803 3.138
N2: Goods vehicles between 3.5t and 12t MPW 336 334 341 338 334
N3: Goods vehicles over 12t MPW 1.162 1.345 1.545 1.626 1.670
L1/L2/L6: Mopeds 148 148 142 130 126
L3/L4/L5/L7: Motorcycles 173 184 201 217 241
T5: Tractor on wheels 65 66 60 51 54

7
Source: EIHP Energy in Croatia – Annual energy report 2019
Croatia
The number of passenger cars per 1,000 inhabitants
Structure of cars by fuel type
CO2 emissions from energy subsectors
EU-27 = 503
Final energy consumption
by means of transport
M1 km (k) 2014 2015 2016 2017 2018 2019
CVH 12.75 12.51 12.70 12.81 12.68 12.54
8
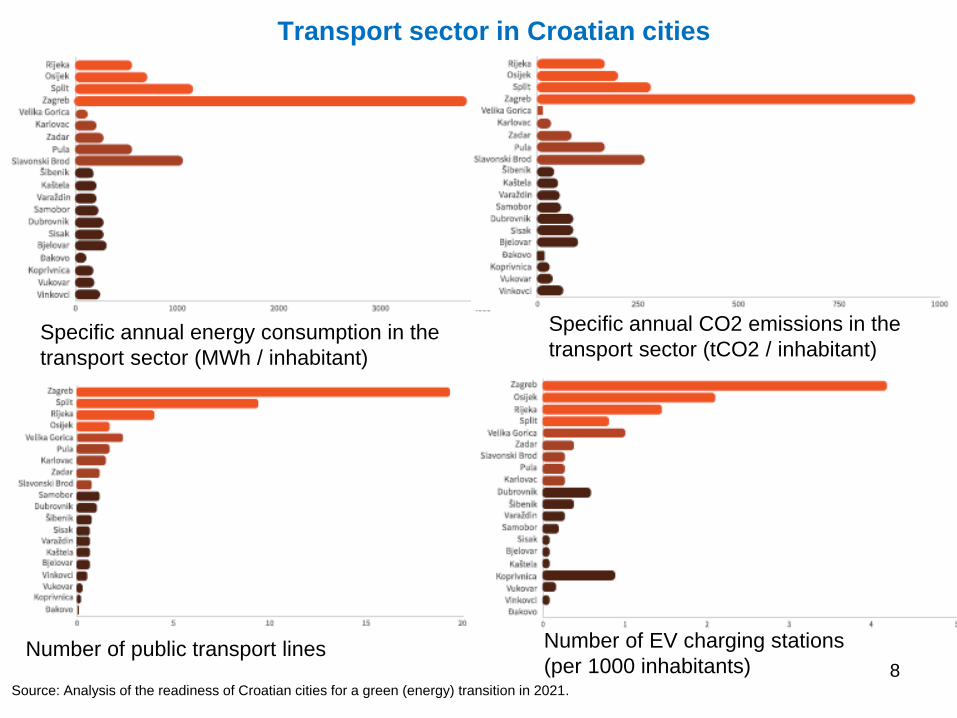
Transport sector in Croatian cities
Specific annual energy consumption in the
transport sector (MWh / inhabitant)
Specific annual CO2 emissions in the
transport sector (tCO2 / inhabitant)
Number of public transport lines Number of EV charging stations
(per 1000 inhabitants)Source: Analysis of the readiness of Croatian cities for a green (energy) transition in 2021.

Decarbonising the Road Transport
Rollout of charging points for ECVs – Trend over time in the EU (2019)
Charging points for EVs per country,
plus percentage of EU total (2019)
Normal and fast charging points, by country (2019)
ACEA, MAKING THE TRANSITION TO ZERO-EMISSION MOBILITY 2020 PROGRESS REPORT
https://www.acea.be/uploads/publications/ACEA_progress_report_2020.pdf
EV market share / charging points per 100 km of road*,
by country (2019)
HIGHEST EV purchase incentives1. Romania (up to €11,500)
2. Croatia (up to €9,200)
3. Germany (up to €9,000)

Real time tracking of available funds on the EPEEF websiteCall opened:
10.06. at 8:00Call temporary closed:
10.06. at 15:43Reserved funds:
HRK90 million (€12 million)
Reopening of call:
24.06. at 8:00Call closed:
24.06. at 9:00Reserved funds:
HRK1,8 million (€0,2 million)
-
5.000.000
10.000.000
15.000.000
20.000.000
25.000.000
-
20.000.000,00
40.000.000,00
60.000.000,00
80.000.000,00
100.000.000,00
120.000.000,00
8:0
8:1
08
:20
8:3
08
:40
8:5
09
:09
:10
9:2
09
:30
9:4
09
:50
10:0
10:1
01
0:2
01
0:3
01
0:4
01
0:5
01
1:0
11:1
01
1:2
01
1:3
01
1:4
01
1:5
01
2:0
12:1
01
2:2
01
2:3
01
2:4
01
2:5
01
3:0
13:1
01
3:2
01
3:3
01
3:4
01
3:5
01
4:0
14:1
01
4:2
01
4:3
01
4:4
01
4:5
01
5:0
15:1
01
5:2
0
Application input intensity during call
Source: Policy on e-mobility incentives in Croatia, Aleksandar Halavanja, FZOEU, EMOBICITY 5th Project Workshop
vozimoeko.fzoeu.hr

11
Croatia EU
Source: European Alternative Fuels Observatory – EAFO https://www.eafo.eu/countries/croatia/1727/summary/compare
TOTAL NUMBER AF VEHICLES
Electricity
TOTAL NUMBER AF
INFRASTRUCTURE
Electricity
GDP per capita
14,936.10 USD

12
Croatia EU
Source: European Alternative Fuels Observatory – EAFO https://www.eafo.eu/countries/croatia/1727/vehicles-and-fleet/compare
Plugin Electric Vehicles per public charging point
Market share new registrations M1
Fleet percentage of total fleet M1

13
Greenhouse gas emission intensity of electricity generation
Source: EIHP Energy in Croatia – Annual energy report 2019
EEA Greenhouse gas emission intensity of electricity generation
https://www.eea.europa.eu/data-and-maps/daviz/co2-emission-intensity-6#tab-
googlechartid_googlechartid_chart_111_filters=%7B%22rowFilters%22%3A%7B%7D%3B%22columnFilters%22%3A%7B%22pre_config_date%2
2%3A%5B2018%5D%7D%3B%22sortFilter%22%3A%5B%22index_2018%22%5D%7D

Where are we?
14
Primorje-Gorski Kotar County
2019: CRO 424, EU 569; PGZ >550
Source: Eurostat, Transport Development Strategy of the
Republic of Croatia (2017-2030), ACEA

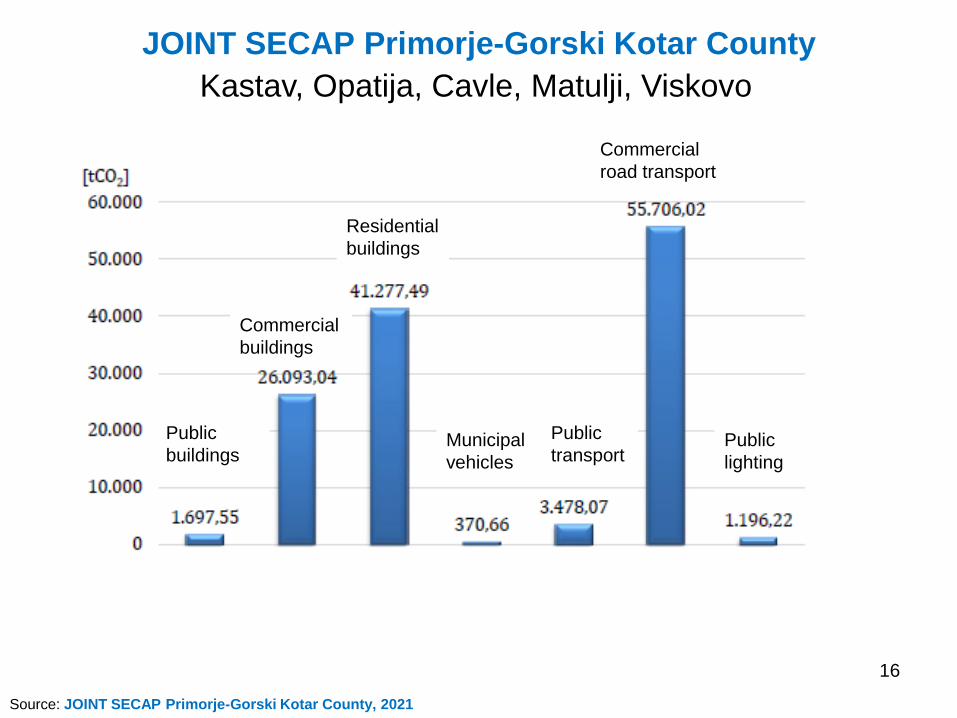
JOINT SECAP Primorje-Gorski Kotar County
15
Kastav, Opatija, Cavle, Matulji, Viskovo
Source: JOINT SECAP Primorje-Gorski Kotar County, 2021
Public
buildings
Commercial
buildings
Residential
buildings
Municipal
vehicles
Public
transport
Commercial
road transport
Public
lighting
JOINT SECAP Primorje-Gorski Kotar County
16
Kastav, Opatija, Cavle, Matulji, Viskovo
Source: JOINT SECAP Primorje-Gorski Kotar County, 2021
Public
buildings
Commercial
buildings
Residential
buildings
Municipal
vehicles
Public
transport
Commercial
road transport
Public
lighting

The City of Rijeka SECAP
17
Source: The City of Rijeka SECAP, 2020
2008 2014 2018
Natural gas
Fuel oil
Electric energy
Compressed natural gas
LNG
Gasoline
Diesel
Thermal energy from
district heating systems
Public lighting
Transport
Buildings
Baseline Emissions
Inventory - BEI
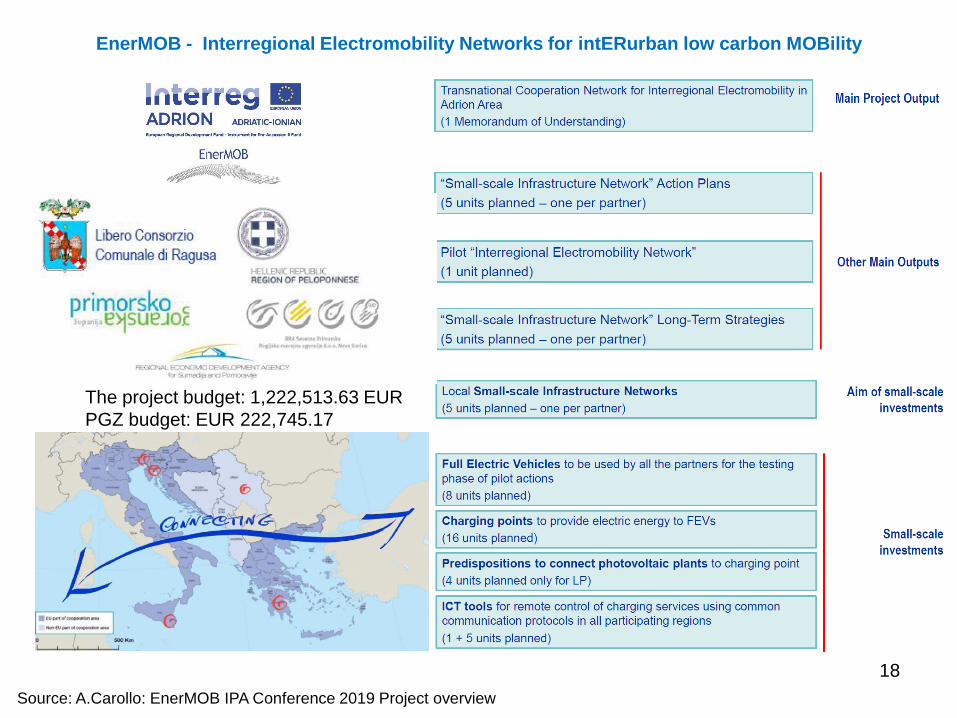
EnerMOB - Interregional Electromobility Networks for intERurban low carbon MOBility
18
Source: A.Carollo: EnerMOB IPA Conference 2019 Project overview
The project budget: 1,222,513.63 EUR
PGZ budget: EUR 222,745.17

EnerMOB - Interregional Electromobility Networks for intERurban low
carbon MOBility
19Source: County of Primorje-Gorski Kotar
Charging stations (2x22 kW AC) for electric
vehicles have been developed in the framework of
the EnerMOB project.
Three AC charging stations have been installed and
are operating in attractive tourist and traffic locations in
Rijeka International Airport, Municipality of Fužine
and on island Rab in the port Melak.
Installation of charging stations for electric vehicles
has created conditions for greater use of electric
vehicles in the County of Primorje and Gorski Kotar,
which leads to a reduction in carbon dioxide emissions
generated in road transport, increased energy
efficiency and reduced dependence on other energy
sources.
With the implementation of the EnerMOB project, the
County is more accessible and enables greater
mobility of the local population and visitors.
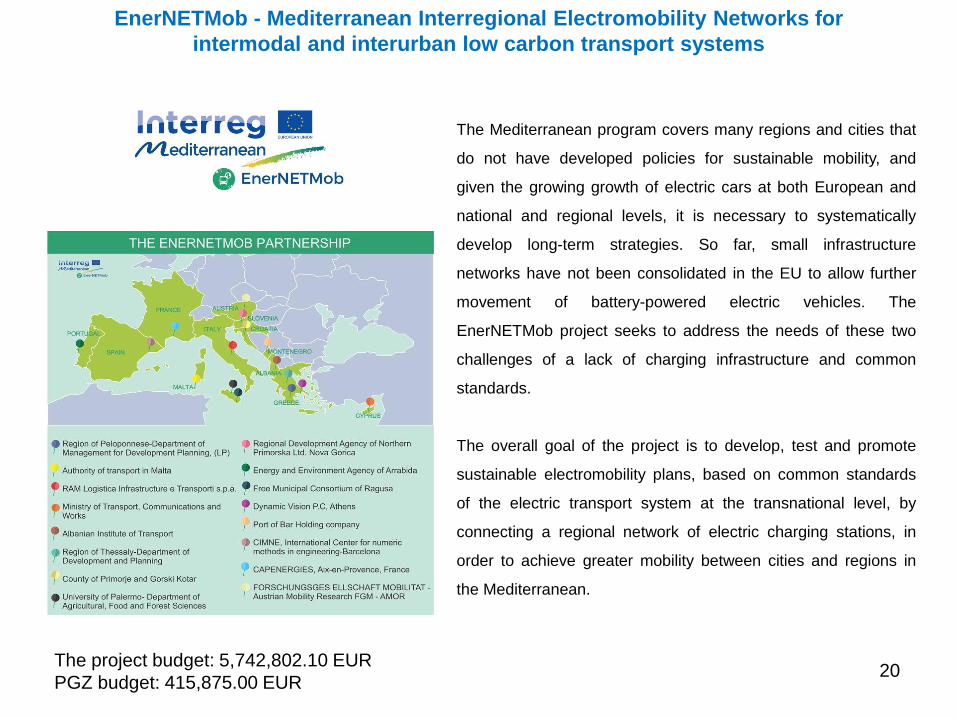
EnerNETMob - Mediterranean Interregional Electromobility Networks for
intermodal and interurban low carbon transport systems
20
The Mediterranean program covers many regions and cities that
do not have developed policies for sustainable mobility, and
given the growing growth of electric cars at both European and
national and regional levels, it is necessary to systematically
develop long-term strategies. So far, small infrastructure
networks have not been consolidated in the EU to allow further
movement of battery-powered electric vehicles. The
EnerNETMob project seeks to address the needs of these two
challenges of a lack of charging infrastructure and common
standards.
The overall goal of the project is to develop, test and promote
sustainable electromobility plans, based on common standards
of the electric transport system at the transnational level, by
connecting a regional network of electric charging stations, in
order to achieve greater mobility between cities and regions in
the Mediterranean.
The project budget: 5,742,802.10 EUR
PGZ budget: 415,875.00 EUR
21
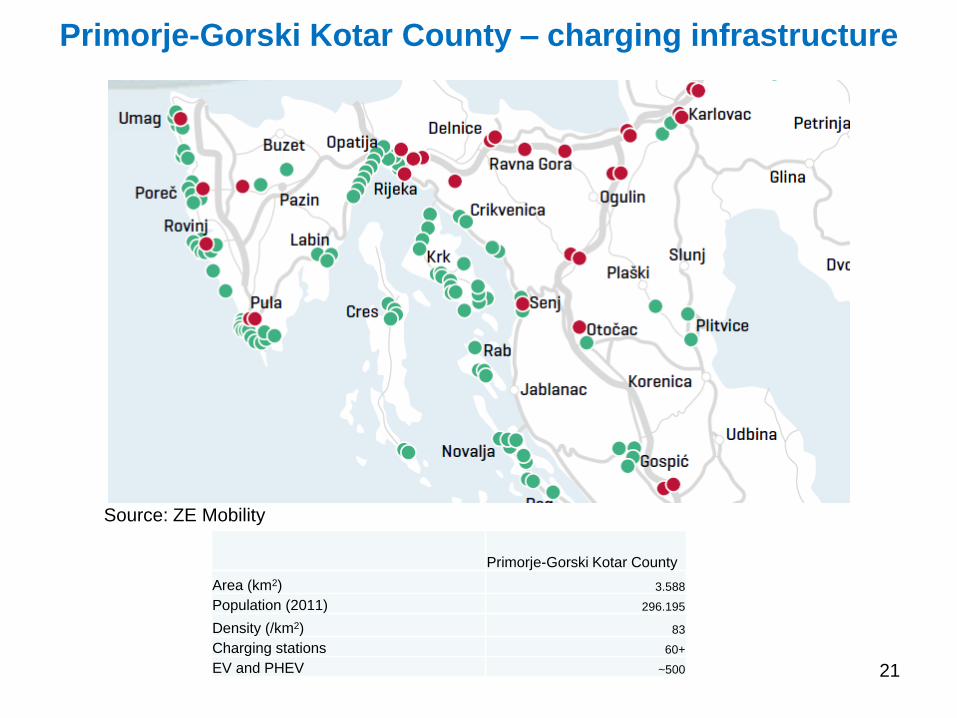
Primorje-Gorski Kotar County – charging infrastructure
Primorje-Gorski Kotar County
Area (km2) 3.588
Population (2011) 296.195
Density (/km2) 83
Charging stations 60+
EV and PHEV ~500
Source: ZE Mobility
22
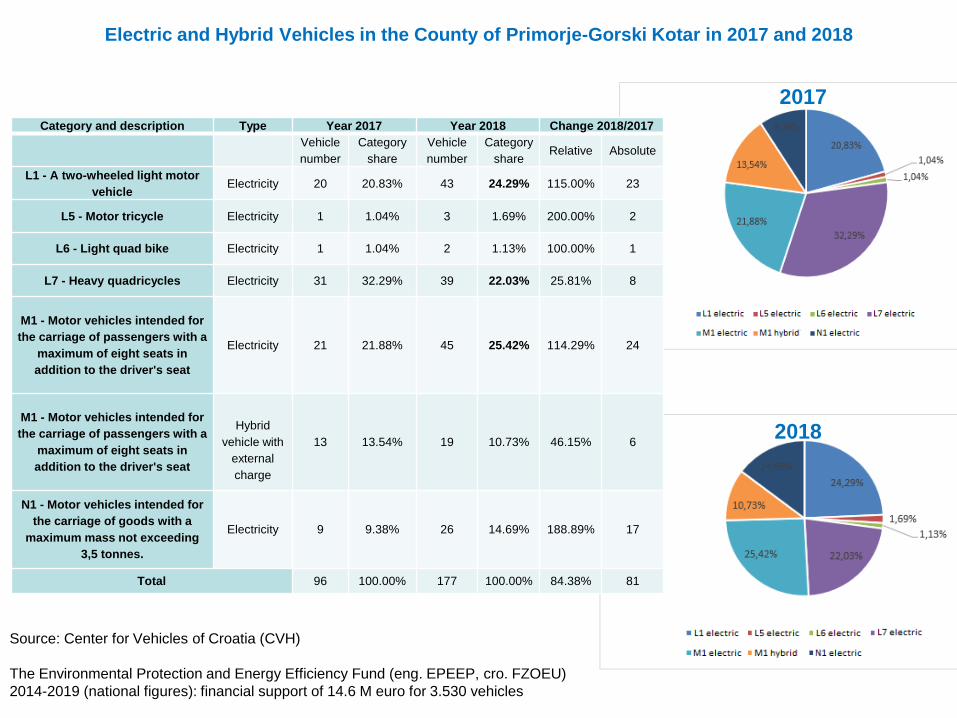
Electric and Hybrid Vehicles in the County of Primorje-Gorski Kotar in 2017 and 2018
2017
2018
Category and description Type Year 2017 Year 2018 Change 2018/2017
Vehicle
number
Category
share
Vehicle
number
Category
shareRelative Absolute
L1 - A two-wheeled light motor
vehicleElectricity 20 20.83% 43 24.29% 115.00% 23
L5 - Motor tricycle Electricity 1 1.04% 3 1.69% 200.00% 2
L6 - Light quad bike Electricity 1 1.04% 2 1.13% 100.00% 1
L7 - Heavy quadricycles Electricity 31 32.29% 39 22.03% 25.81% 8
M1 - Motor vehicles intended for
the carriage of passengers with a
maximum of eight seats in
addition to the driver's seat
Electricity 21 21.88% 45 25.42% 114.29% 24
M1 - Motor vehicles intended for
the carriage of passengers with a
maximum of eight seats in
addition to the driver's seat
Hybrid
vehicle with
external
charge
13 13.54% 19 10.73% 46.15% 6
N1 - Motor vehicles intended for
the carriage of goods with a
maximum mass not exceeding
3,5 tonnes.
Electricity 9 9.38% 26 14.69% 188.89% 17
Total 96 100.00% 177 100.00% 84.38% 81
Source: Center for Vehicles of Croatia (CVH)
The Environmental Protection and Energy Efficiency Fund (eng. EPEEP, cro. FZOEU)
2014-2019 (national figures): financial support of 14.6 M euro for 3.530 vehicles

23
Primorje-Gorski Kotar County vs rest of Croatia
6,34%
93,66%
Area
PGZ Rest of CRO
6,89%
93,11%
Population (2011)
PGZ Rest of CRO
3,77%
96,23%
Number of electric and hybrid vehicles
PGZ Rest of CRO
18,90%
81,10%
Number of sockets
PGZ Rest of CRO
19,85%
80,15%
Number of charging station locations
PGZ Rest of CRO
0,00
5,00
10,00
15,00
20,00
25,00
PGZ Rest of CRO CRO
Ratio vehicles for charging / charging locations
0,00
2,00
4,00
6,00
8,00
10,00
PGZ Rest of CRO CRO
Ratio vehicles for charging / sockets
* The EU’s Directive on Alternative Fuel Infrastructure – DAFI, 2014.
*

24
Primorje-Gorski Kotar County projections
Primorje and
Gorski Kotar
county Parameter 2020 2025 2030
Basic
scenario
AC sockets 146 268 298
DC sockets 13 21 23
Total sockets 159 289 321
Number of charging
stations (pillars) 120 231 264
Number of locations 62 110 122
Moderate
scenario
AC sockets 206 330 348
DC sockets 27 44 46
Total sockets 233 374 394
Number of charging
stations (pillars) 180 299 323
Number of locations 92 126 134
Dynamic
scenario
AC sockets 263 402 403
DC sockets 35 46 54
Total sockets 298 447 457
Number of charging
stations (pillars) 226 361 375
Number of locations 116 126 164
0
50
100
150
200
250
300
2020. 2021. 2022. 2023. 2024. 2025. 2026. 2027. 2028. 2029. 2030.
Basic scenario
Number of charging stations (pillars) Number of locations
0
50
100
150
200
250
300
350
2020. 2021. 2022. 2023. 2024. 2025. 2026. 2027. 2028. 2029. 2030.
Basic scenario
AC sockets DC sockets

Belgrade 580
km
Budapest 530
km
Milano 540
km
Wien 530 kmMunich 570 km
Krk in Europe
Bratislava 600
kmBruxelles 1350
km
0
20.000
40.000
60.000
80.000
100.000
120.000
140.000
Nu
mb
er
of
resi
de
nts
dom. stanovništvo korisnici vikendica turisti
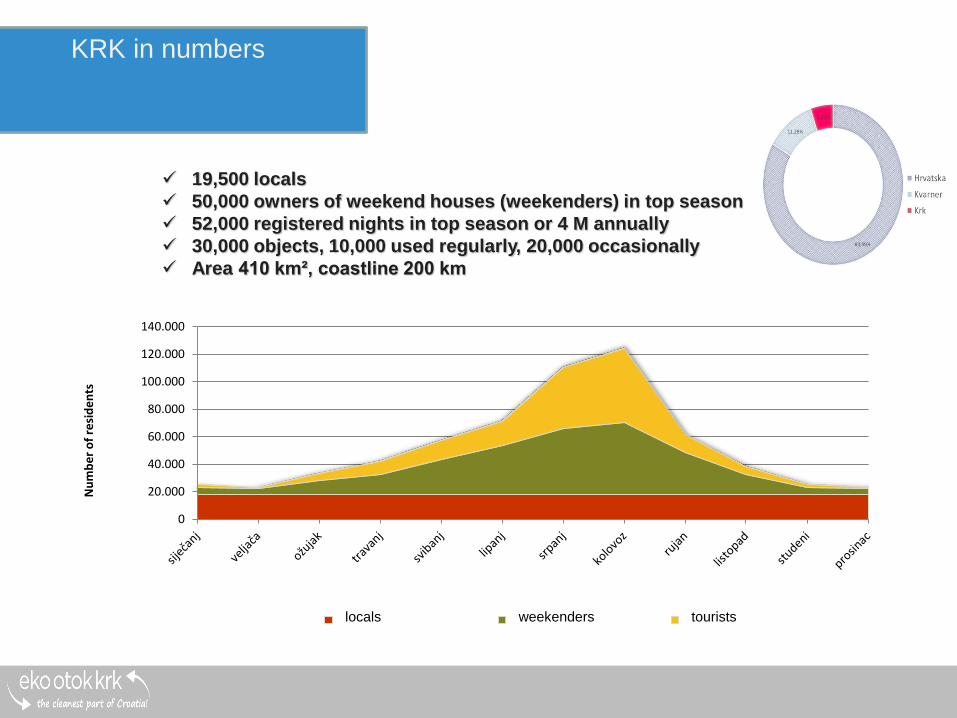
19,500 locals
50,000 owners of weekend houses (weekenders) in top season
52,000 registered nights in top season or 4 M annually
30,000 objects, 10,000 used regularly, 20,000 occasionally
Area 410 km², coastline 200 km
KRK in numbers
locals weekenders tourists

27
Source: “Interdisciplinary strategy
of zero emissions for integrated
development of the island of Krk”,
igr AG, Ponikve Eko Otok Krk,
Croatia, 2012.
The island of Krk – 2030 strategic aims
Steps towards zero GHG emissions
15%45%100%
Initia
lsta
te
15%
Energ
y s
avin
g
15%
30%
Inve
stm
en
ts
pro
fita
ble
o
ve
r
a s
ho
rt te
rm
Futu
re e
ner
gyn
eces
siti
es
To
tal o
f
en
erg
y
sa
vin
g
2030
Necessities covered by renewablesources (wind, sun, bio-mass)
Energy saving by rising the public awareness – 15%
Economicaly profitable investments in energy efficiency– 30%
Tota
l of energ
y s
avin
g
-45%
2012 2020 2025
112 GWh/A
62 GWh/A
Wind
Solar

eMobility
ELECTRIC CHARGING STATIONS
12 charging stations (7 municipalities)
127.300 Euro, EPEEP fund: 64.200 Euro (40%)
2 x 22 kW
IEC 62196 Type2 Mode 3
ELECTRIC VEHICLES
10 electric vehicles 207.452 Euro,
EPEEP 88.346 Euro (30%)
Source: Ponikve Eko Otok Krk
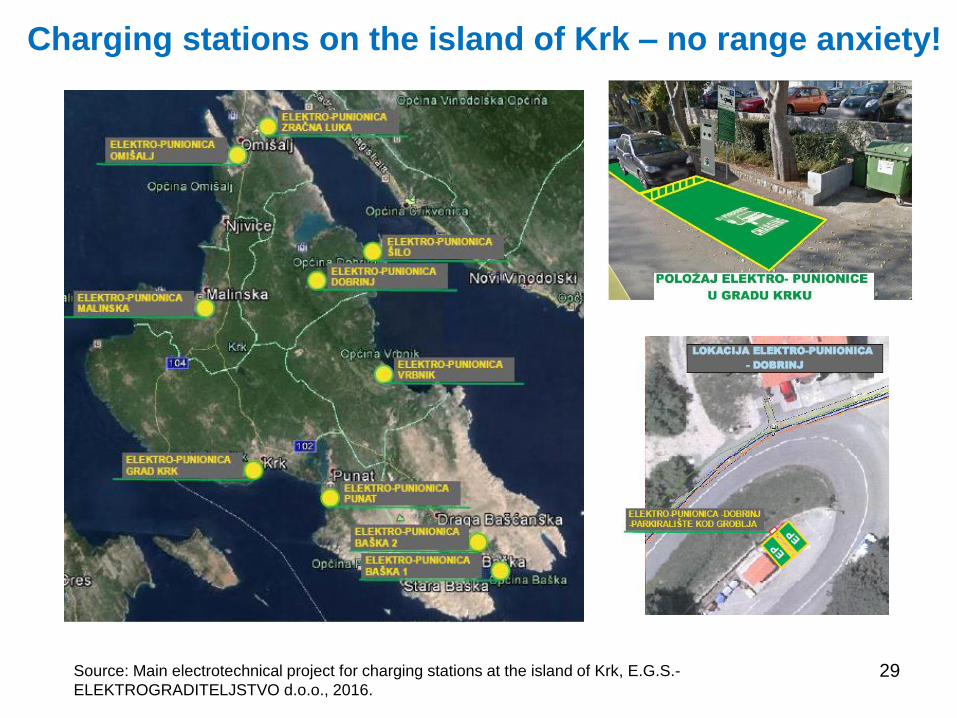
Charging stations on the island of Krk – no range anxiety!
29Source: Main electrotechnical project for charging stations at the island of Krk, E.G.S.-
ELEKTROGRADITELJSTVO d.o.o., 2016.
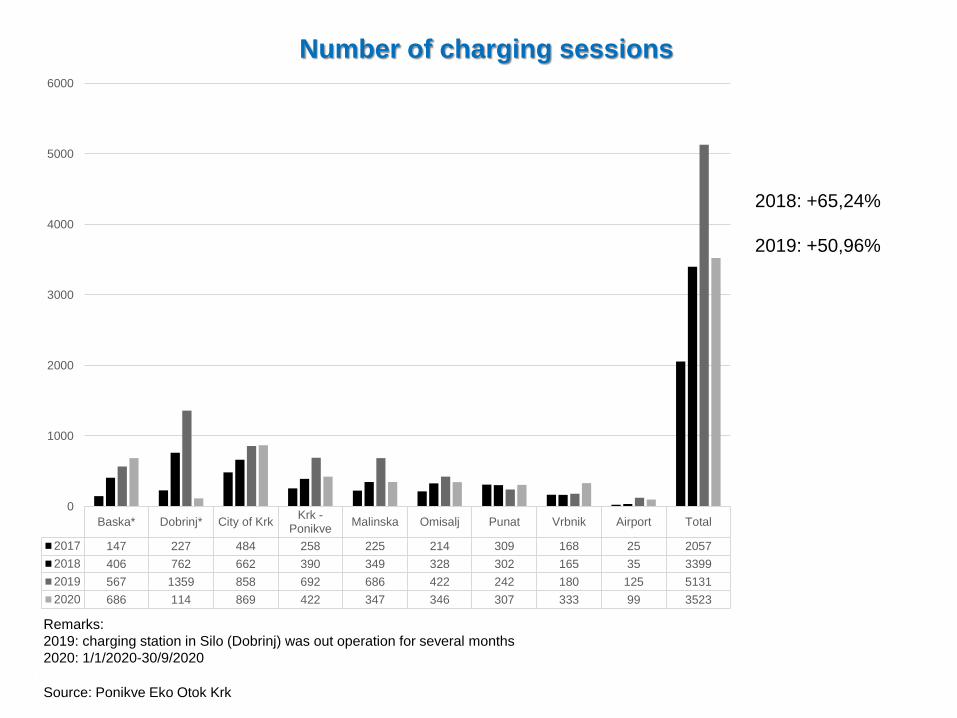
Number of charging sessions
Source: Ponikve Eko Otok Krk
2018: +65,24%
2019: +50,96%
Baska* Dobrinj* City of KrkKrk -
PonikveMalinska Omisalj Punat Vrbnik Airport Total
2017 147 227 484 258 225 214 309 168 25 2057
2018 406 762 662 390 349 328 302 165 35 3399
2019 567 1359 858 692 686 422 242 180 125 5131
2020 686 114 869 422 347 346 307 333 99 3523
0
1000
2000
3000
4000
5000
6000
Remarks:
2019: charging station in Silo (Dobrinj) was out operation for several months
2020: 1/1/2020-30/9/2020

Conversion of ICEV to EV
• Established conversion team for electric
vehicles E-mobile team Krk
• Employees of Ponikve eko otok Krk and
external experts
• Equipped auto mechanic workshop for
conversion of vehicle
• EPEEP fund subvention of 7.544 Euro
• Conversion started in 2015, finished in 2016
31Source: Ponikve Eko Otok Krk
32
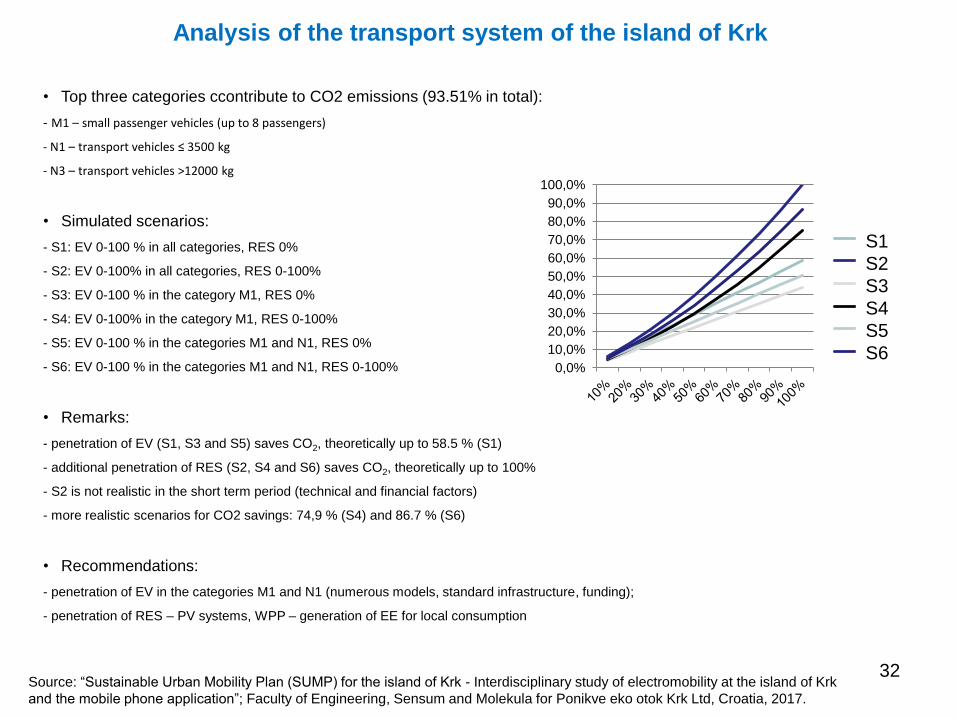
Analysis of the transport system of the island of Krk
• Top three categories ccontribute to CO2 emissions (93.51% in total):
- M1 – small passenger vehicles (up to 8 passengers)
- N1 – transport vehicles ≤ 3500 kg
- N3 – transport vehicles >12000 kg
• Simulated scenarios:
- S1: EV 0-100 % in all categories, RES 0%
- S2: EV 0-100% in all categories, RES 0-100%
- S3: EV 0-100 % in the category M1, RES 0%
- S4: EV 0-100% in the category M1, RES 0-100%
- S5: EV 0-100 % in the categories M1 and N1, RES 0%
- S6: EV 0-100 % in the categories M1 and N1, RES 0-100%
• Remarks:
- penetration of EV (S1, S3 and S5) saves CO2, theoretically up to 58.5 % (S1)
- additional penetration of RES (S2, S4 and S6) saves CO2, theoretically up to 100%
- S2 is not realistic in the short term period (technical and financial factors)
- more realistic scenarios for CO2 savings: 74,9 % (S4) and 86.7 % (S6)
• Recommendations:
- penetration of EV in the categories M1 and N1 (numerous models, standard infrastructure, funding);
- penetration of RES – PV systems, WPP – generation of EE for local consumption
Source: “Sustainable Urban Mobility Plan (SUMP) for the island of Krk - Interdisciplinary study of electromobility at the island of Krk
and the mobile phone application”; Faculty of Engineering, Sensum and Molekula for Ponikve eko otok Krk Ltd, Croatia, 2017.
0,0%
10,0%
20,0%
30,0%
40,0%
50,0%
60,0%
70,0%
80,0%
90,0%
100,0%
Scenarij 1
Scenarij 2
Scenarij 3
Scenarij 4
Scenarij 5
Scenarij 6
S1
S2
S3
S4
S5
S6

The mathematical model of the island of Krk power system – Smart Grid
33
A part of the mathematical model of the island of Krk power system
modeled in the software package NEPLAN
Source: D. Variola, V. Kirincic, D. Frankovic, R. Prenc, “Modeling of the power system of the island of Krk,”
CIRED 13 – 16.5.2018, Opatija, Croatia, 2018.
34
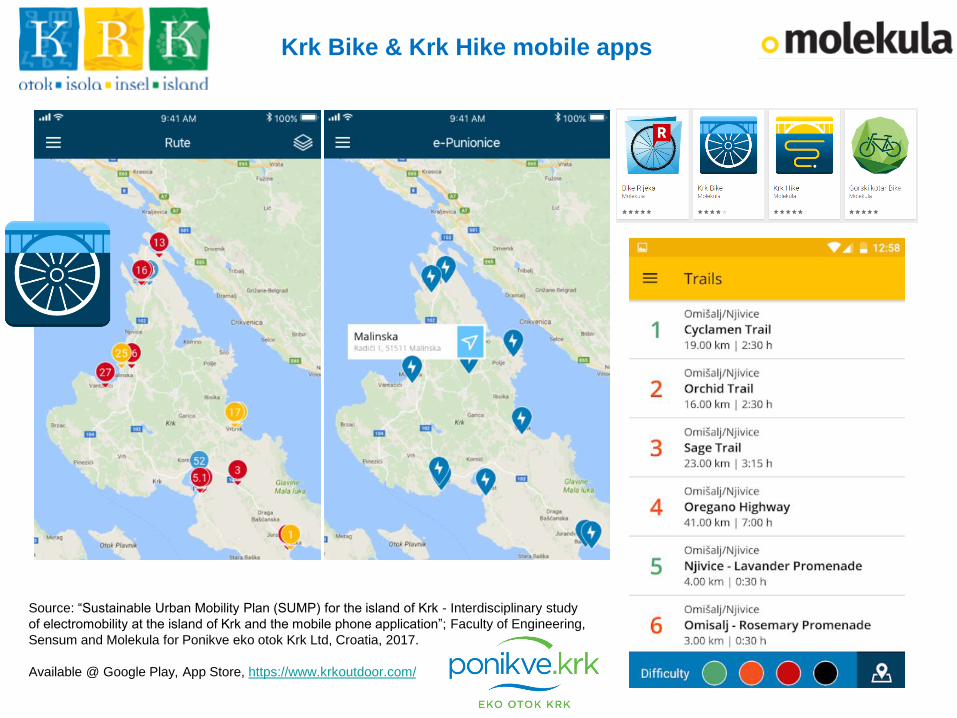
Krk Bike & Krk Hike mobile apps
Source: “Sustainable Urban Mobility Plan (SUMP) for the island of Krk - Interdisciplinary study
of electromobility at the island of Krk and the mobile phone application”; Faculty of Engineering,
Sensum and Molekula for Ponikve eko otok Krk Ltd, Croatia, 2017.
Available @ Google Play, App Store, https://www.krkoutdoor.com/
35
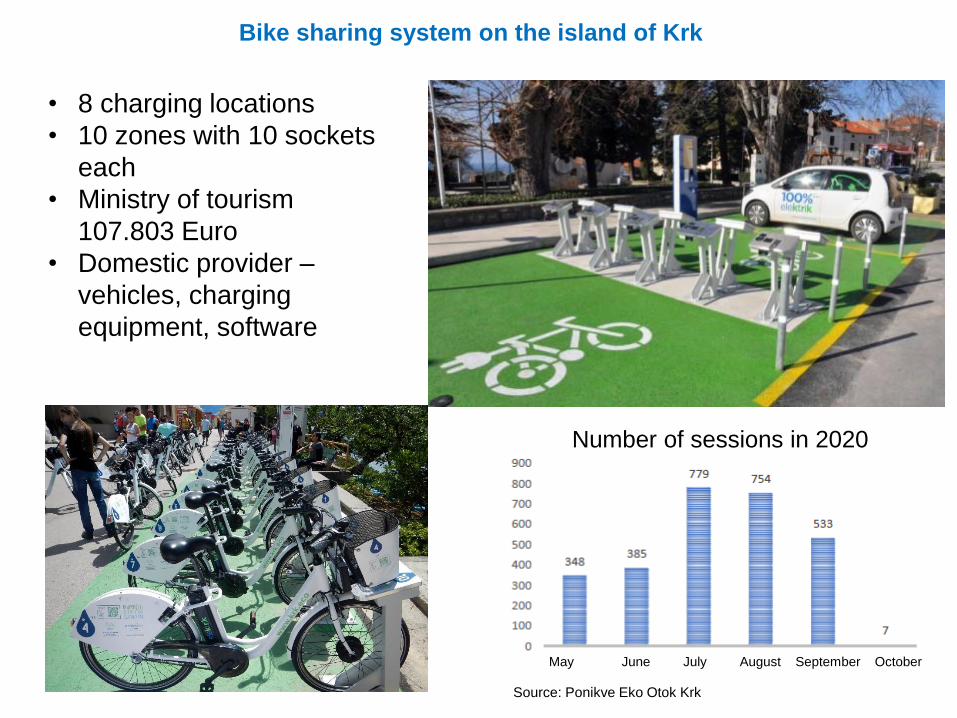
Bike sharing system on the island of Krk
• 8 charging locations
• 10 zones with 10 sockets
each
• Ministry of tourism
107.803 Euro
• Domestic provider –
vehicles, charging
equipment, software
Source: Ponikve Eko Otok Krk
Number of sessions in 2020
May June July August September October
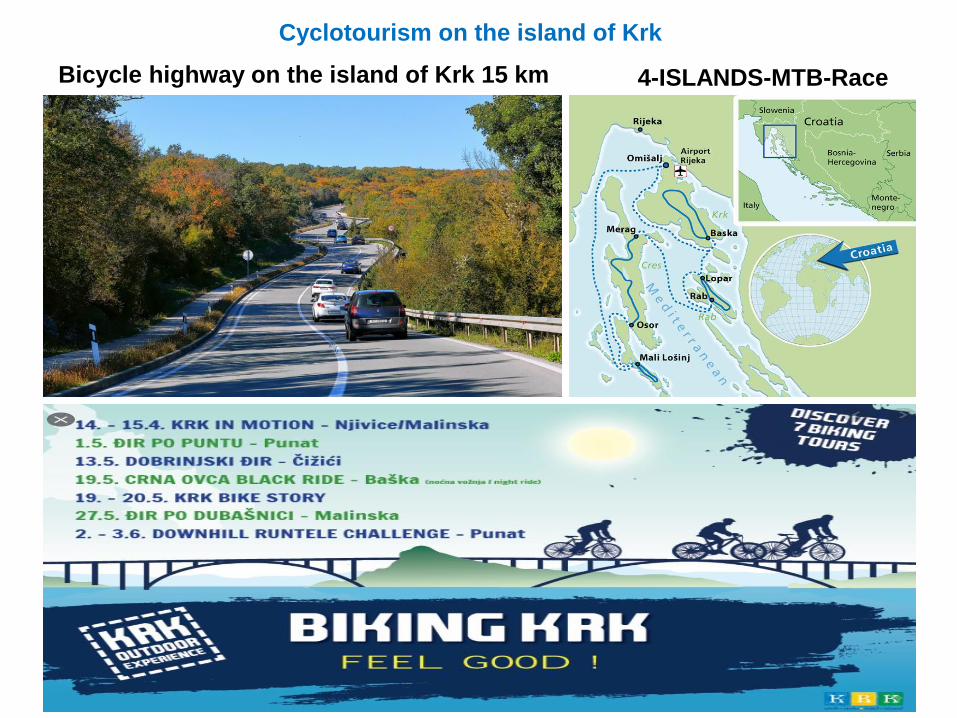
Cyclotourism on the island of Krk
4-ISLANDS-MTB-RaceBicycle highway on the island of Krk 15 km
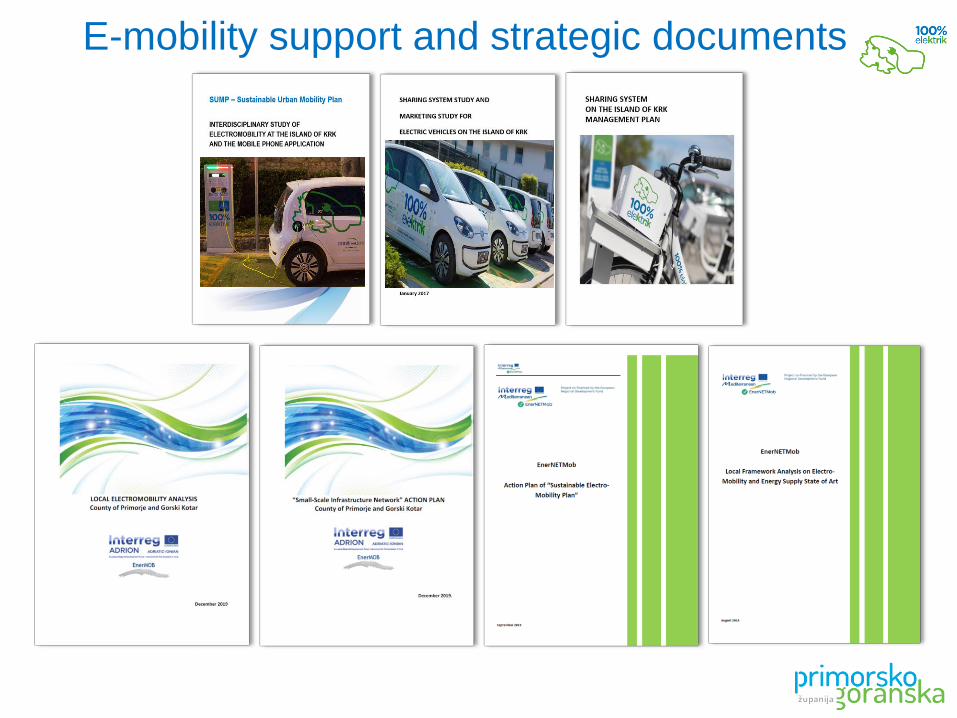
E-mobility support and strategic documents

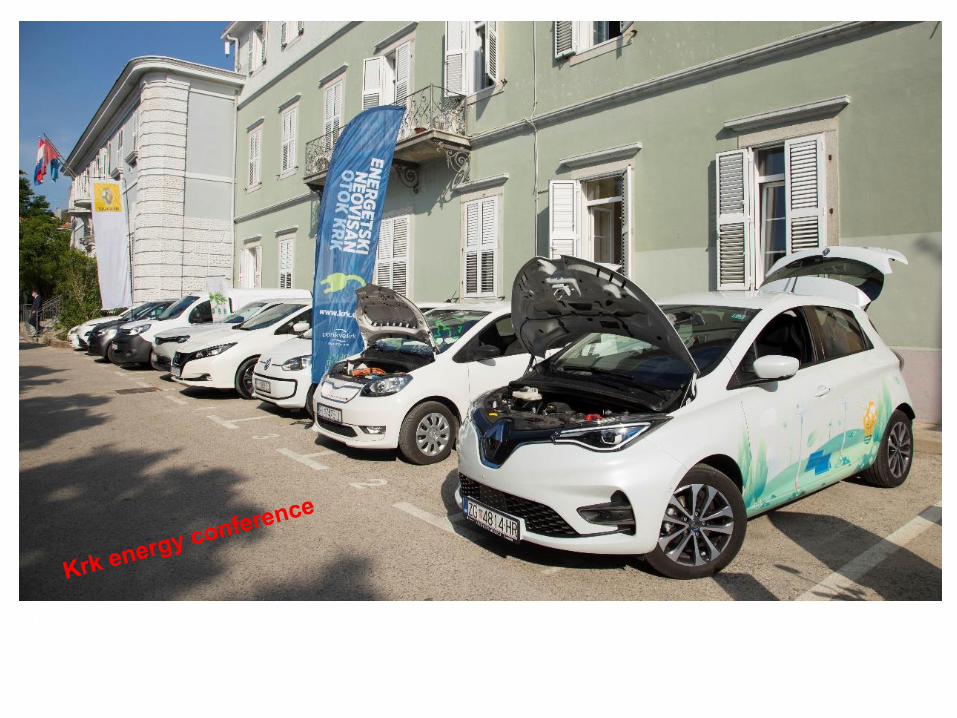
Workshops for pupils of the High School in Krk on the topic of
sustainable development, renewables and electromobility
https://www.skolskiportal.hr/clanak/2879-zele-afirmirati-ideju-o-krku-kao-energetski-neovisnom-i-ucinkovitom-otoku/
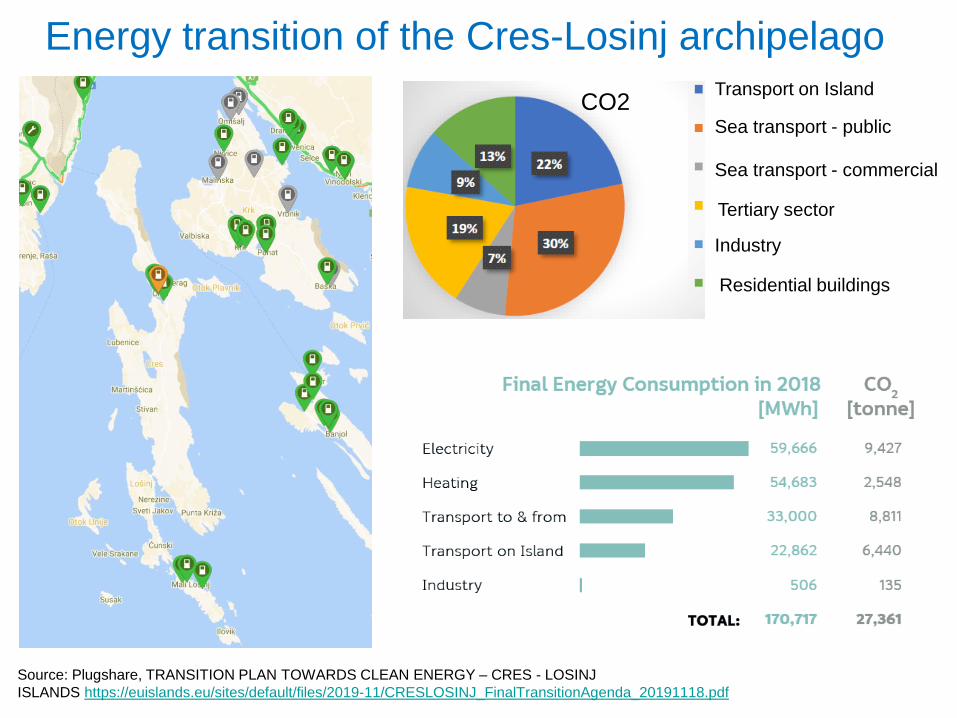
Energy transition of the Cres-Losinj archipelagoTransport on Island
Sea transport - public
Sea transport - commercial
Residential buildings
Tertiary sector
Industry
CO2
Source: Plugshare, TRANSITION PLAN TOWARDS CLEAN ENERGY – CRES - LOSINJ
ISLANDS https://euislands.eu/sites/default/files/2019-11/CRESLOSINJ_FinalTransitionAgenda_20191118.pdf
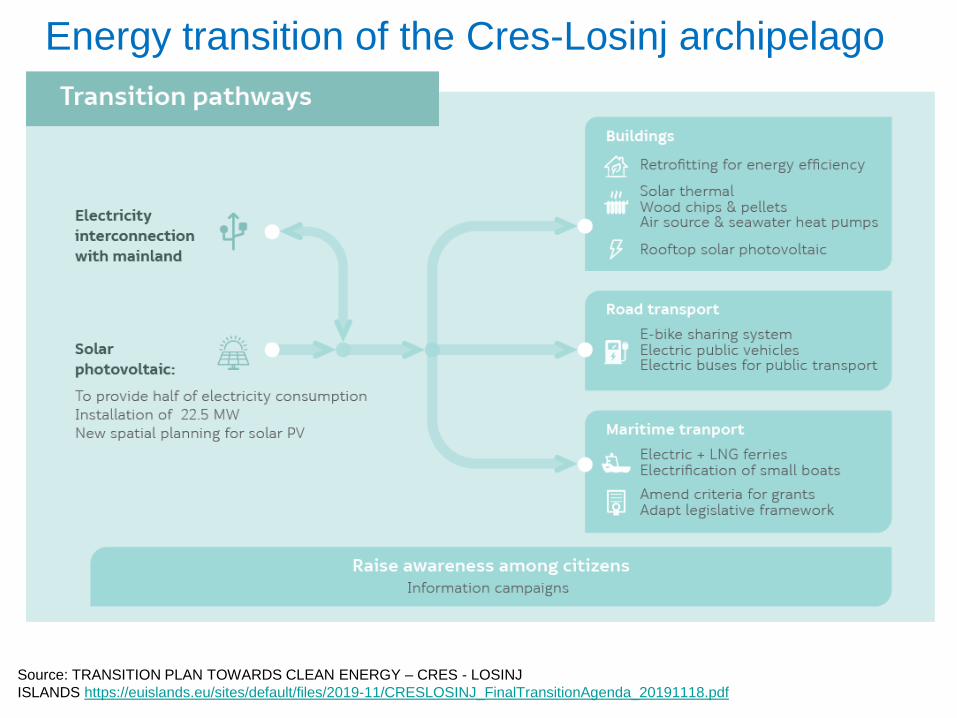
Energy transition of the Cres-Losinj archipelago
Source: TRANSITION PLAN TOWARDS CLEAN ENERGY – CRES - LOSINJ
ISLANDS https://euislands.eu/sites/default/files/2019-11/CRESLOSINJ_FinalTransitionAgenda_20191118.pdf
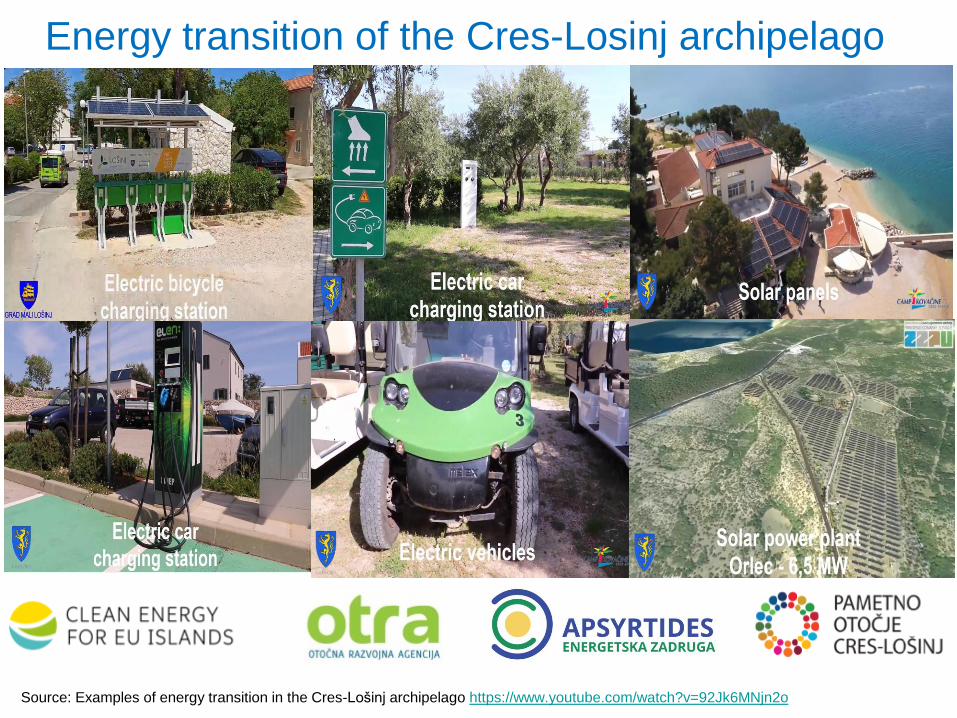
Energy transition of the Cres-Losinj archipelago
Source: Examples of energy transition in the Cres-Lošinj archipelago https://www.youtube.com/watch?v=92Jk6MNjn2o

Challenges and opportunities
https://www.strujnikrug.hr/electric-car-buying-guide/
https://www.strujnikrug.hr/ev-chargers/

Mobility As A Service - MaaS
44http://www.bipformaas.it/what-is-maas-lets-learn/
https://maas-alliance.eu/homepage/what-is-maas/
„The key concept behind MaaS is to put the users at the core of transport services, offering
them tailor made mobility solutions based on their individual needs. This means, for the first
time, easy access to the most appropriate transport mode or service will be included in a bundle
of flexible travel service options for end users.” The European Mobility as a Service Alliance
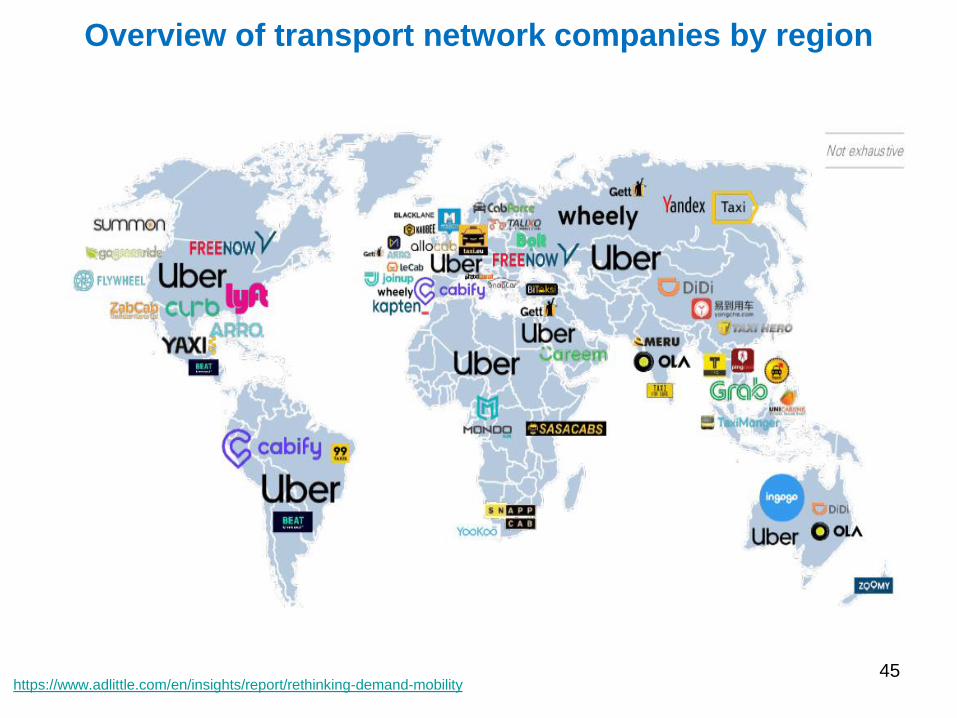
Overview of transport network companies by region
45https://www.adlittle.com/en/insights/report/rethinking-demand-mobility

Providers of free floating micro mobility services within Europe
46https://maphub.net/Augustin/micro

Mobility As A Service - MaaS
47http://www.bipformaas.it/what-is-maas-lets-learn/
https://fleets.chargetogether.org/article/mobility-as-a-service/
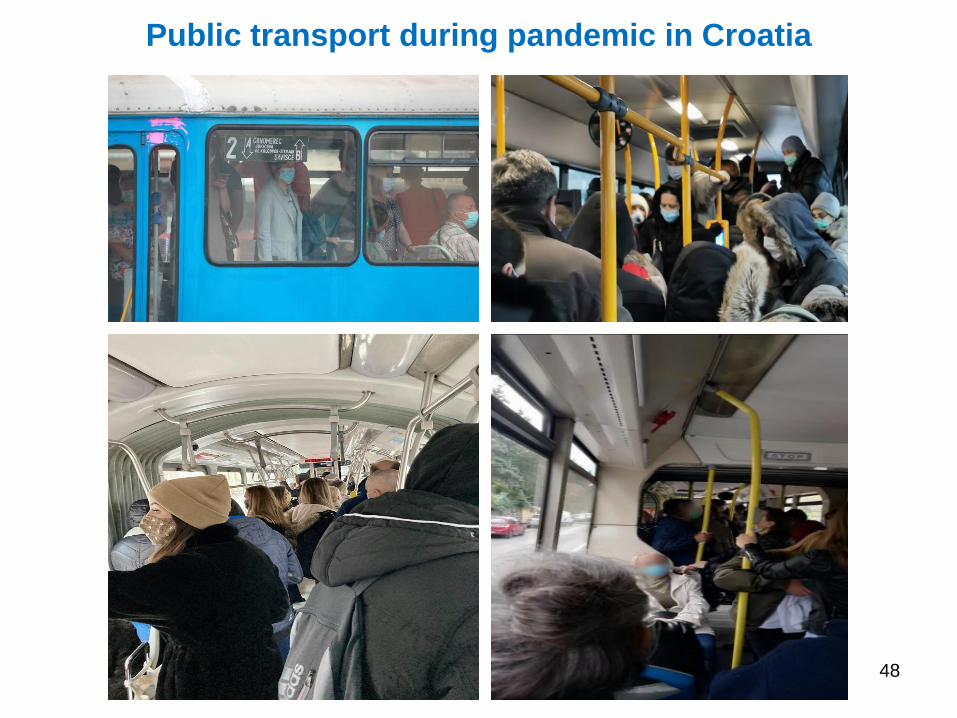
48
Public transport during pandemic in Croatia

eBike-sharing system
City of Rijeka
49
4 locations
28 e-bikes
1,5 Eur/h
March April May June July August September
Total: 3758
Number of sessions in 2020
Use of e-bikes by tariffs (hours)
Total: 3758

The fast, affordable way to ride.
50
NUMBER OF
SCOOTERS
NUMBER OF
SESSIONS WITH
SCOOTERS
BOLT SCOOTERS IN
CROATIA 2021
Rijeka, Varazdin, Osijek

electric scooter rentals
City of Rijeka
51
10 starting locations
Free floating model
200 scooters
0,1 Eur/min
NUMBER OF
SESSIONS
AVG NUMBER OF
SESSIONS PER SCOOTER
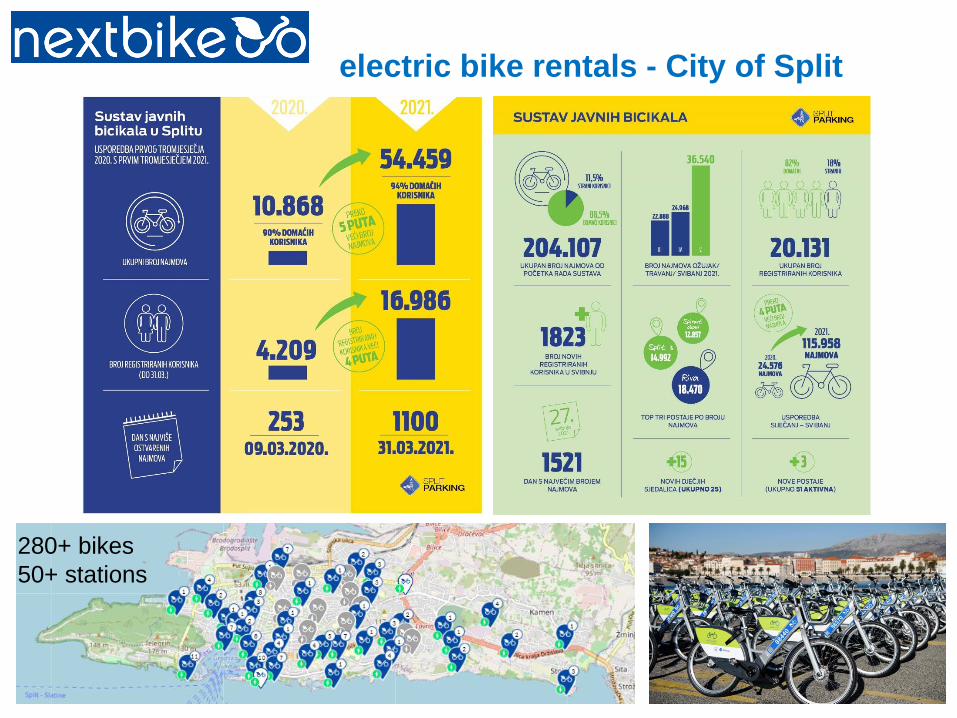
electric bike rentals - City of Split
52
280+ bikes
50+ stations
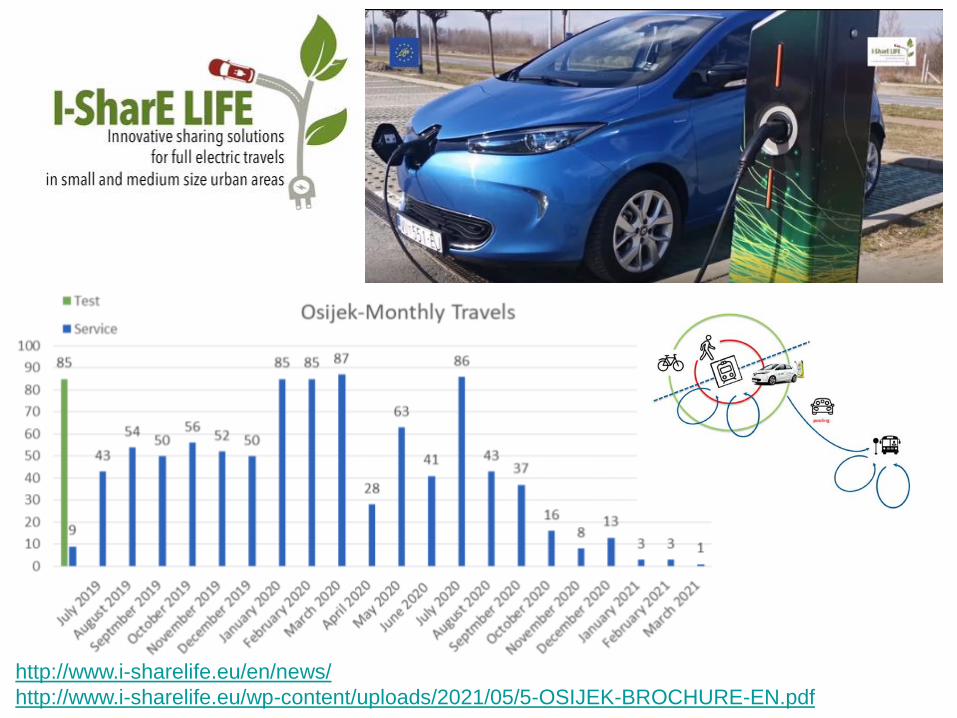
http://www.i-sharelife.eu/en/news/
http://www.i-sharelife.eu/wp-content/uploads/2021/05/5-OSIJEK-BROCHURE-EN.pdf

https://www.avantcar.hr/car-sharing/
Avant2Go car sharing
What is Avant2Go vehicle sharing?
• Quick and easy car rental - anytime.
• Payment only when using the vehicle.
• Electricity and insurance already
included.
• In your neighborhood and city, for
airport transfers,…
• State-of-the-art electric vehicles for any
rental period.
• No vehicle ownership and maintenance
costs.
• Service using a mobile application.
Locations:
• Dubrovnik
• Zagreb
• Dubrovnik Airport

https://www.total-croatia-news.com/business/24832-figures-demonstrate-uber-s-strength-in-croatia
https://www.tportal.hr/biznis/clanak/ove-brojke-najbolje-docaravaju-koliko-je-uber-postao-mocan-u-hrvatskoj-foto-20180125
https://hrturizam.hr/en/ovog-ljeta-cak-115-tisuca-turista-koristilo-uber-u-hrvatskoj/
Uber in Croatia
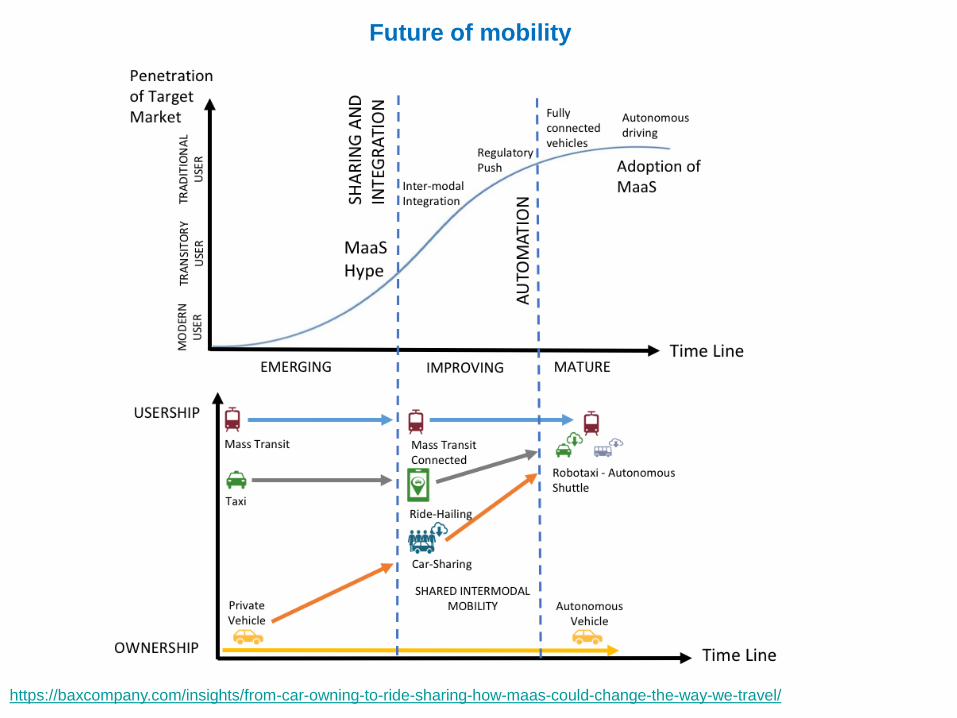
Future of mobility
https://baxcompany.com/insights/from-car-owning-to-ride-sharing-how-maas-could-change-the-way-we-travel/
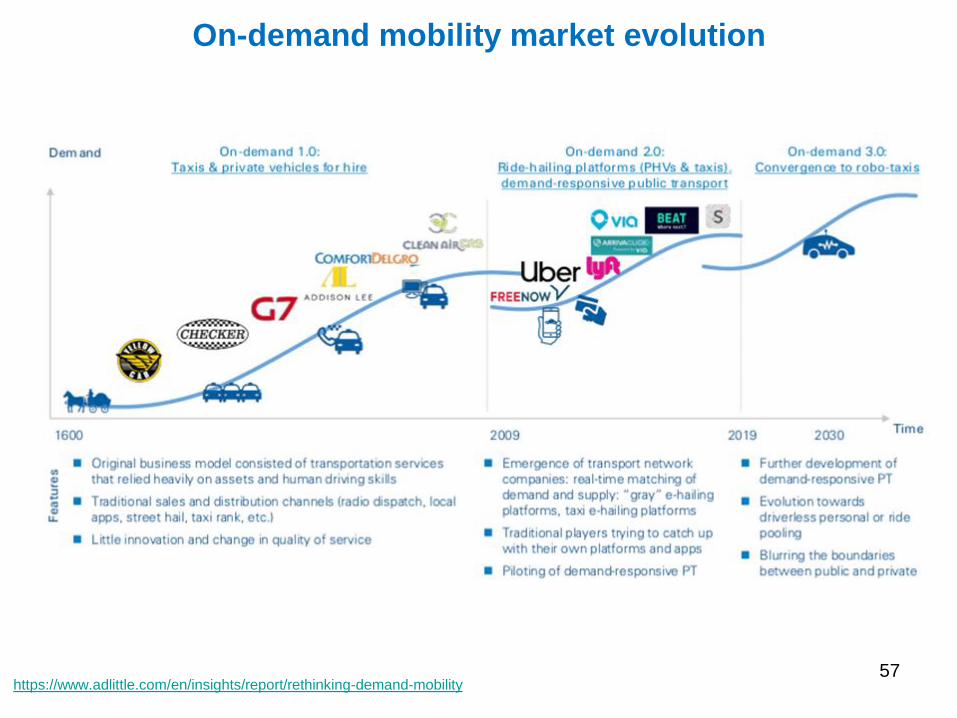
On-demand mobility market evolution
57https://www.adlittle.com/en/insights/report/rethinking-demand-mobility
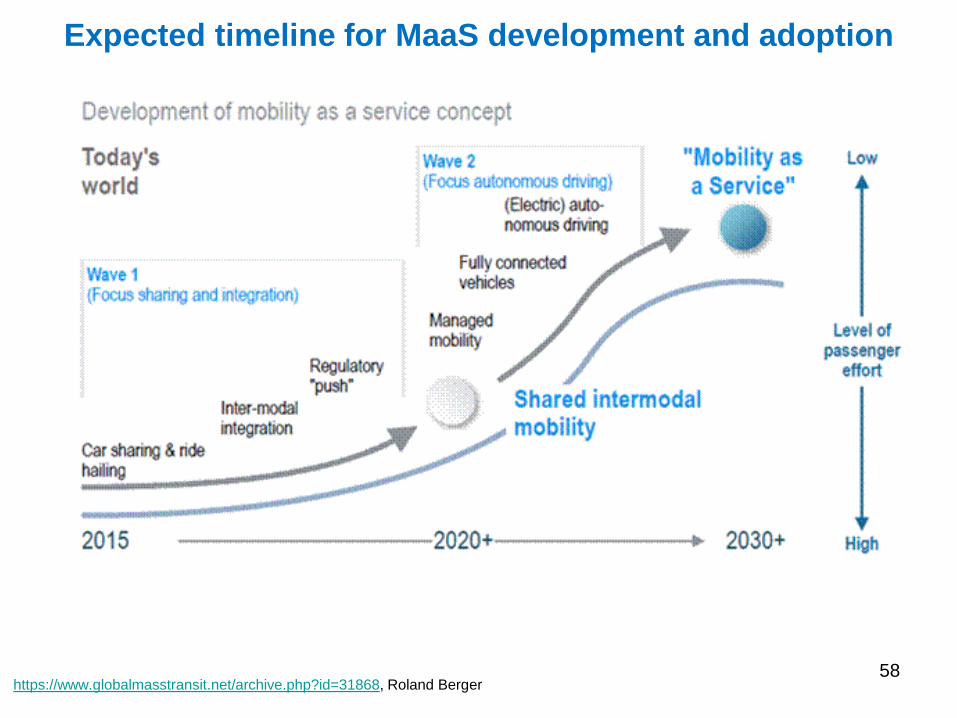
Expected timeline for MaaS development and adoption
58https://www.globalmasstransit.net/archive.php?id=31868, Roland Berger
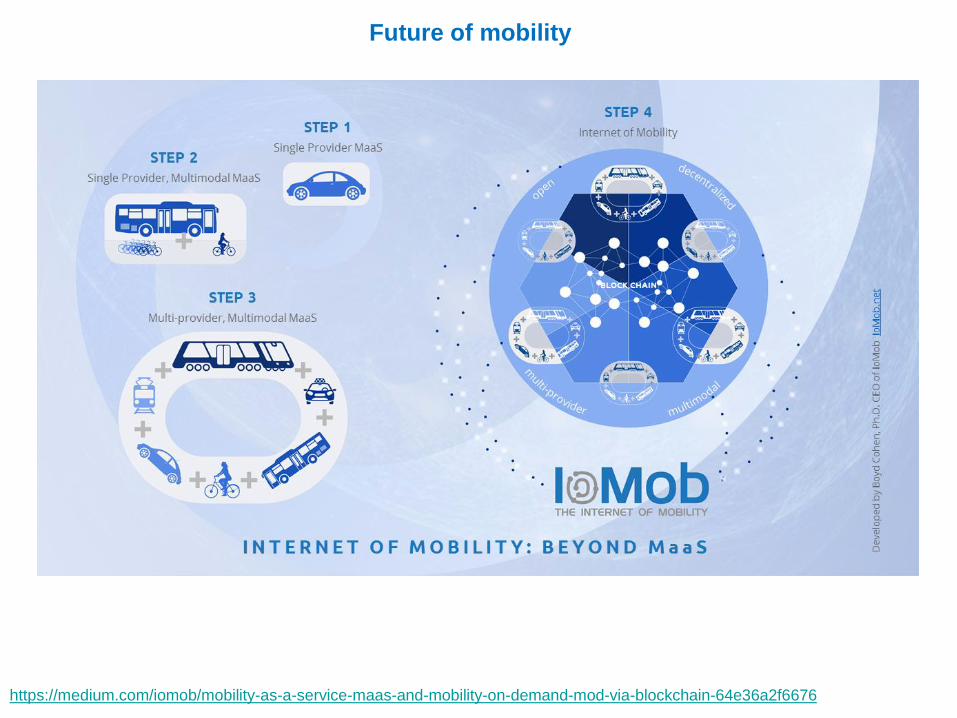
Future of mobility
https://medium.com/iomob/mobility-as-a-service-maas-and-mobility-on-demand-mod-via-blockchain-64e36a2f6676
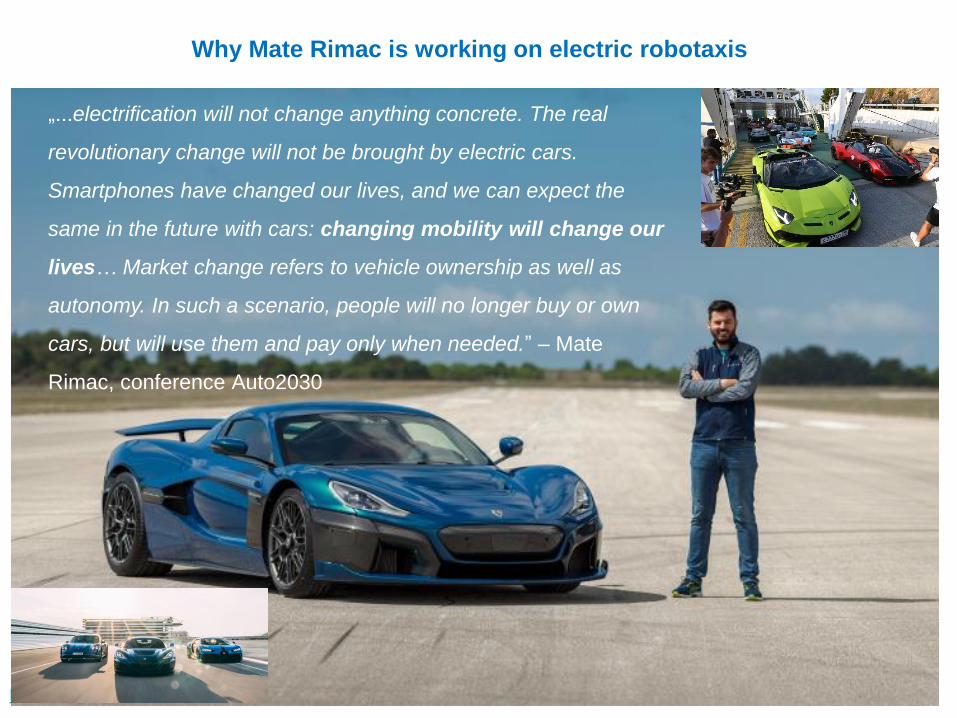
Why Mate Rimac is working on electric robotaxis
https://techcrunch.com/
„...electrification will not change anything concrete. The real
revolutionary change will not be brought by electric cars.
Smartphones have changed our lives, and we can expect the
same in the future with cars: changing mobility will change our
lives… Market change refers to vehicle ownership as well as
autonomy. In such a scenario, people will no longer buy or own
cars, but will use them and pay only when needed.” – Mate
Rimac, conference Auto2030
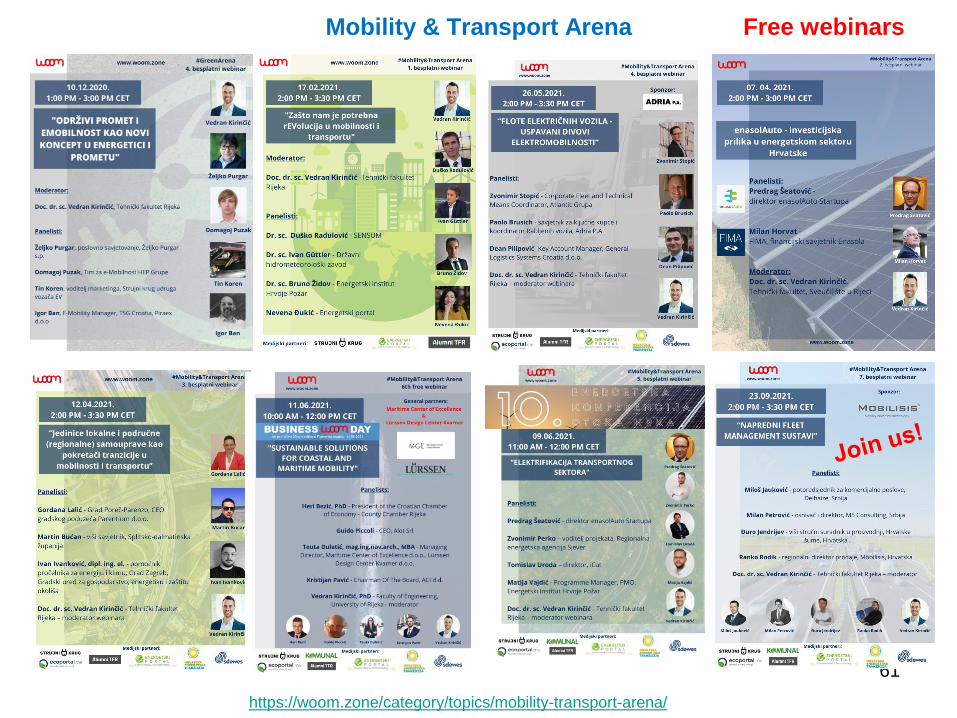
Mobility & Transport Arena
61
https://woom.zone/category/topics/mobility-transport-arena/
Free webinars

Safe and Healthy with Sustainable Mobility
Assist. Prof. Vedran Kirincic, PhD
Sustainable energy / Mobility expert
Faculty of Engineering, University of Rijeka, Croatia
https://www.linkedin.com/in/vedrankirincic/
Related Documents