Safaricom Limited FY14 Presentation 12 th May 2014

Welcome message from author
This document is posted to help you gain knowledge. Please leave a comment to let me know what you think about it! Share it to your friends and learn new things together.
Transcript


Disclaimer
The following presentation is being made only to, and is only directed at, persons to whom such presentations may lawfully be communicated (“relevant persons”). Any person who is
not a relevant person should not act or rely on this presentation or its contents. This presentation does not constitute an offering of securities or otherwise constitute an invitation or inducement to any person to underwrite or subscribe for or otherwise acquire securities in within the Company.
The presentation also contains certain non-GAAP financial information. The Group‟s management believes these measures provide valuable additional information in understanding the performance of the Company‟s businesses because they provide measures used by the Company to assess performance. Although these measures are important in the management of the business, they should not be viewed as replacements for, but rather as
complementary to, the comparable GAAP measures. Safaricom, M-PESA and Safaricom/M-PESA logos are trademarks of Safaricom Ltd. Other products and company names mentioned herein maybe the trademarks of their respective owners.
2

Contents
FY14 Highlights
FY14 Financial Review
Strategic Focus and Guidance
3
4
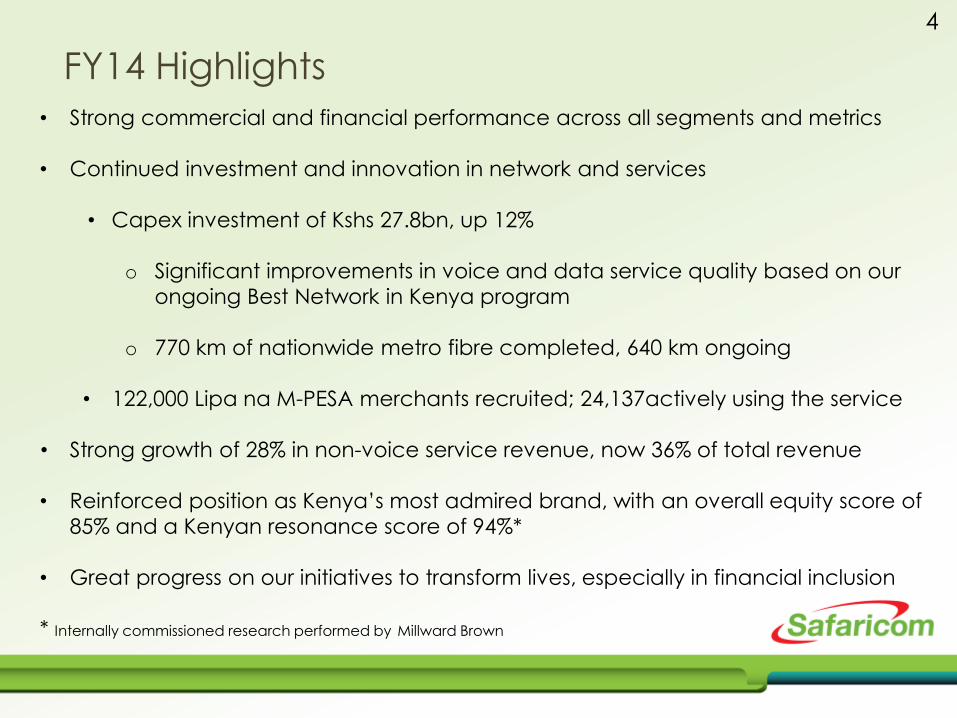
FY14 Highlights
• Strong commercial and financial performance across all segments and metrics
• Continued investment and innovation in network and services
• Capex investment of Kshs 27.8bn, up 12%
o Significant improvements in voice and data service quality based on our
ongoing Best Network in Kenya program
o 770 km of nationwide metro fibre completed, 640 km ongoing
• 122,000 Lipa na M-PESA merchants recruited; 24,137actively using the service
• Strong growth of 28% in non-voice service revenue, now 36% of total revenue
• Reinforced position as Kenya‟s most admired brand, with an overall equity score of
85% and a Kenyan resonance score of 94%*
• Great progress on our initiatives to transform lives, especially in financial inclusion
* Internally commissioned research performed by Millward Brown

Strong financial performance 5
TOTAL REVENUE
VOICE SERVICE REVENUE
NON-VOICE SERVICE REVENUE
(SMS, BROADBAND & M-PESA)
EBITDA
NET PROFIT AFTER TAX
FREE CASH FLOW
+16% to Kshs 144.7bn
+12% to Kshs 86.3bn
+28% to Kshs 52.1bn
+24% to Kshs 60.9bn
+31% to Kshs 23.0bn
+56% to Kshs 22.7bn
PROPOSED DIVIDEND PER SHARE +52% to Kshs 0.47

Contents
FY14 Highlights
FY14 Financial Review
Strategic Focus and Guidance
6
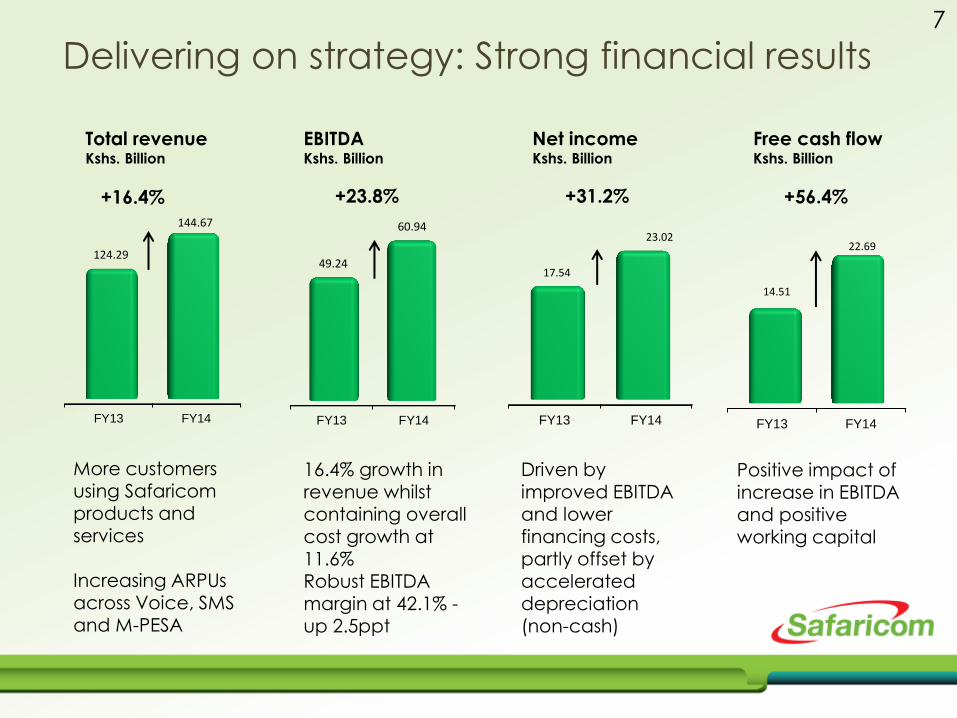
Delivering on strategy: Strong financial results
FY13 FY14
124.29
144.67
FY13 FY14
49.24
60.94
FY13 FY14
14.51
22.69
FY13 FY14
17.54
23.02
Total revenue Kshs. Billion
EBITDA Kshs. Billion
Free cash flow Kshs. Billion
Net income Kshs. Billion
+16.4% +23.8% +56.4% +31.2%
7
More customers using Safaricom products and
services Increasing ARPUs across Voice, SMS and M-PESA
16.4% growth in revenue whilst containing overall cost growth at 11.6% Robust EBITDA
margin at 42.1% - up 2.5ppt
Driven by improved EBITDA and lower financing costs, partly offset by accelerated
depreciation (non-cash)
Positive impact of increase in EBITDA and positive working capital

FY11 FY12 FY13 FY14
94.83 107.00
124.29
144.67
FY14 Total revenue Kshs. Billion
62%
33%
5% FY13
Voice Non-voice Devices
60%
36%
4% FY14
16.4%
8
Total revenue breakdown Kshs. Billion
• 16.4% growth in total revenue
• 11.1% growth in customer base to 21.6m
customers (19.4m in FY13)
• Voice service revenue growth of 11.6% and non-voice service revenue growth of 27.8%
Strong revenue growth in the period
Total revenue growth Kshs. Billion
4.72 0.07
3.16
8.96
3.47 124.29
144.67
FY13 Voice SMS Data M-PESA Devices FY14

9
Service revenue: Growth across all segments
-
20.00
40.00
60.00
80.00
100.00
120.00
140.00
FY11 FY12 FY13 FY14
63.50 68.96 77.33
86.30
7.54 7.77
10.15
13.62
11.78
16.87
21.84
26.56
4.54
5.22
6.62
9.31
0.84
1.37
2.11
2.57
Fixed service revenue
Mobile data revenue
M-PESA revenue
SMS revenue
Voice revenue
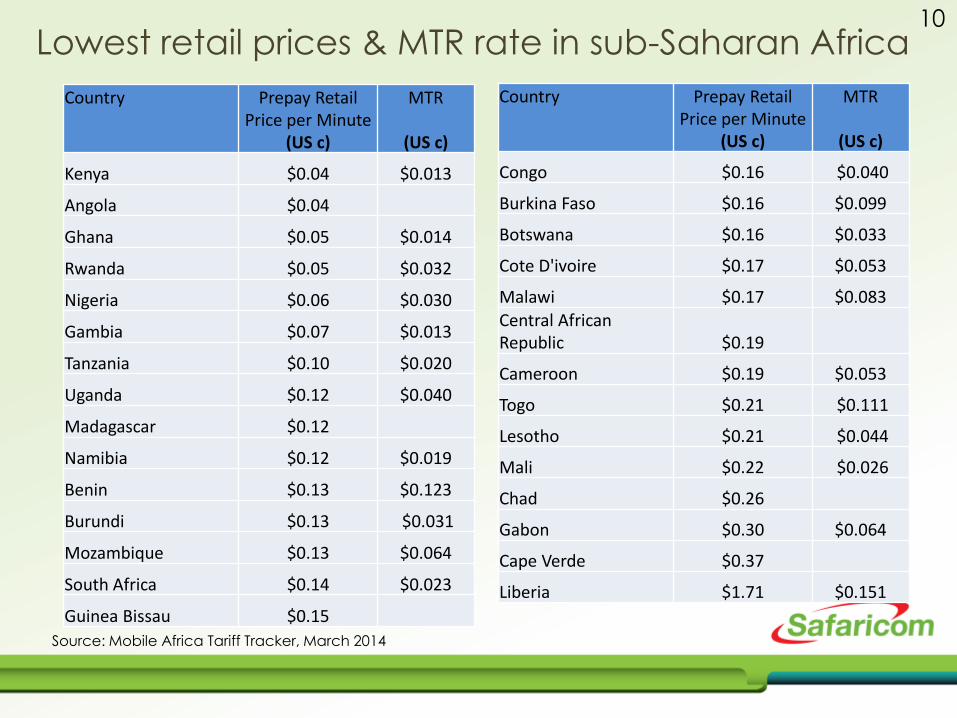
10 Lowest retail prices & MTR rate in sub-Saharan Africa
Country Prepay Retail Price per Minute
(US c)
MTR
(US c)
Kenya $0.04 $0.013
Angola $0.04
Ghana $0.05 $0.014
Rwanda $0.05 $0.032
Nigeria $0.06 $0.030
Gambia $0.07 $0.013
Tanzania $0.10 $0.020
Uganda $0.12 $0.040
Madagascar $0.12
Namibia $0.12 $0.019
Benin $0.13 $0.123
Burundi $0.13 $0.031
Mozambique $0.13 $0.064
South Africa $0.14 $0.023
Guinea Bissau $0.15
Country Prepay Retail Price per Minute
(US c)
MTR
(US c)
Congo $0.16 $0.040
Burkina Faso $0.16 $0.099
Botswana $0.16 $0.033
Cote D'ivoire $0.17 $0.053
Malawi $0.17 $0.083
Central African Republic $0.19
Cameroon $0.19 $0.053
Togo $0.21 $0.111
Lesotho $0.21 $0.044
Mali $0.22 $0.026
Chad $0.26
Gabon $0.30 $0.064
Cape Verde $0.37
Liberia $1.71 $0.151
Source: Mobile Africa Tariff Tracker, March 2014

Voice: Sustained growth momentum
FY11 FY12 FY13 FY14
63.50 68.96
77.33 86.30
Voice service revenue Kshs. Billion
FY11 FY12 FY13 FY14
17.18 19.07 19.42
21.57
Total customers Million
11.6%
11.1%
11
• 11.6% growth in voice service revenue
• Improved prepay airtime distribution
o Top-up cards distributed to over 258,303
retail outlets and 40 own retail shops
o 34.0% of airtime top-ups directly through M-PESA
• 36% increase in emergency top ups (Okoa Jahazi)
• Average blended rate per minute is Kshs 2.88
for national outgoing calls*
• 2.6% increase in outbound (on/off net)calling time to 98.2 minutes per customer per month
• 9.0% decrease in inbound calling time to 12.8
minutes per customer per month
*On top of which 16% VAT and 10% excise duty is levied
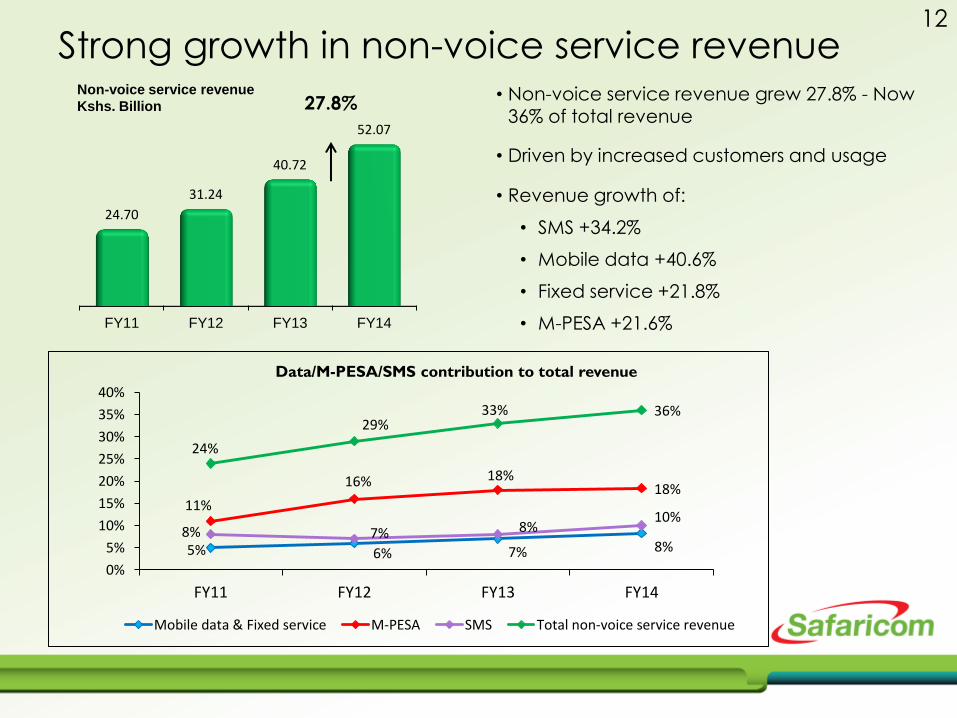
Strong growth in non-voice service revenue
FY11 FY12 FY13 FY14
24.70
31.24
40.72
52.07
Non-voice service revenue
Kshs. Billion
5% 6% 7% 8%
11%
16% 18% 18%
8% 7% 8% 10%
24%
29% 33% 36%
0%
5%
10%
15%
20%
25%
30%
35%
40%
FY11 FY12 FY13 FY14
Mobile data & Fixed service M-PESA SMS Total non-voice service revenue
Data/M-PESA/SMS contribution to total revenue
27.8%
12
• Non-voice service revenue grew 27.8% - Now 36% of total revenue
• Driven by increased customers and usage
• Revenue growth of: • SMS +34.2%
• Mobile data +40.6% • Fixed service +21.8%
• M-PESA +21.6%

M-PESA: Driving financial inclusion
FY11 FY12 FY13 FY14
11.78
16.87
21.84
26.56
M-PESA revenue Kshs. Billion
FY11 FY12 FY13 FY14
7.76 9.08
10.54
12.16
30-day active M-PESA customers Million
21.6%
15.4%
13
• 21.6% growth in M-PESA revenue, driven by:
• 15.4% increase in 30 day active users to 12.2m
• 13.0% increase in registered customers to 19.3m
• Kshs 101.3bn of real time payments per month*
• Person to Person: Kshs 81.6 bn per month (16% growth)
• Person to Business: Kshs 11.0 bn per month (73% growth)
• Business to Person: Kshs 8.7 bn per month (70% growth)
• 15,478 (23.6%) M-PESA agent outlets added in the year; now
81,025 M-PESA agent outlets.
• 122,000 Lipa na M-PESA merchants recruited; 24,137actively
using the service
*Average for April 2013 to March 2014
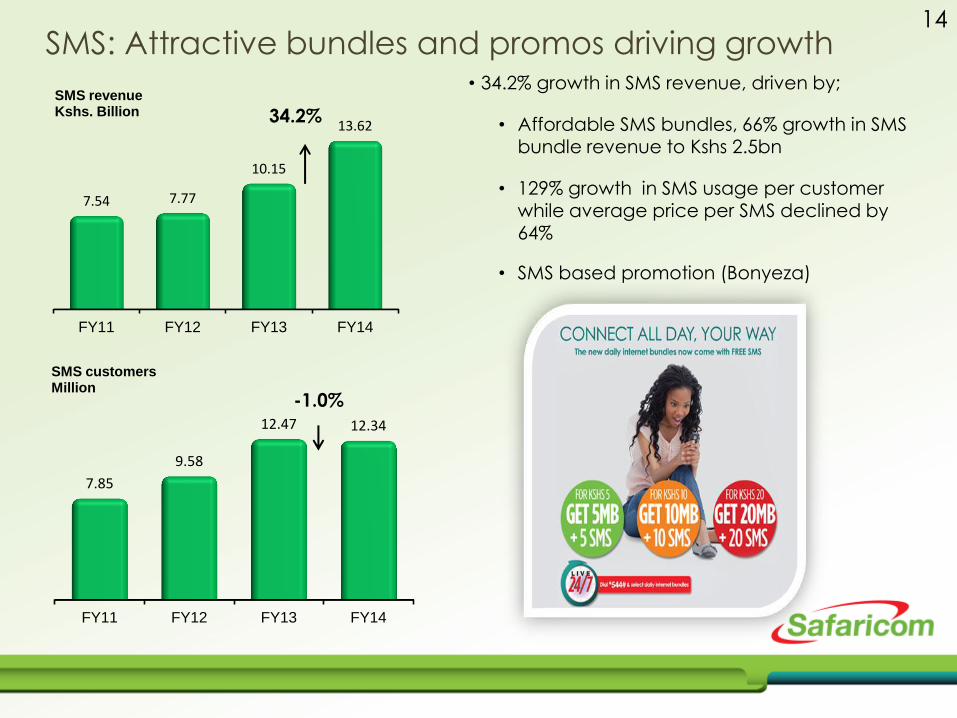
SMS: Attractive bundles and promos driving growth
FY11 FY12 FY13 FY14
7.54 7.77
10.15
13.62
SMS revenue Kshs. Billion
FY11 FY12 FY13 FY14
7.85
9.58
12.47 12.34
SMS customers Million
34.2%
-1.0%
14
• 34.2% growth in SMS revenue, driven by;
• Affordable SMS bundles, 66% growth in SMS
bundle revenue to Kshs 2.5bn
• 129% growth in SMS usage per customer while average price per SMS declined by 64%
• SMS based promotion (Bonyeza)

3.48 4.55
7.13
9.56
FY11 FY12 FY13 FY14
30-day active data customers Million
Data: Customers, usage & devices driving growth
5.37 6.59
8.73
11.88
FY11 FY12 FY13 FY14
Mobile data & Fixed service revenue Kshs. Billion
36.1%
15
• Mobile data revenue growth of 40.6% driven by:
• 34.1% growth in 30 day active mobile data users to 9.56m – now 44% of our customer base
• 16.1% increase in mobile data usage per customer while average price per MB
declined by 14.4%
• 2.3m smartphones/tablets/dongles connected
• Fixed service revenue growth of 21.8%
34.1%

Sustained ARPU growth
Kshs. Kshs. Kshs. Kshs. Kshs.
Mobile Data SMS Voice Service ARPU M-PESA
FY13 FY14
184 191
FY13 FY14
90 87
FY13 FY14
337 348
FY13 FY14
507
558
FY13 FY14
44
55
16
11.0% growth in customers and 3%
increase in usage
15.4% growth in 30 day active
customers with minimal growth in chargeable transactions per customer holds ARPU almost flat
16.1% increase in mobile data usage
Average rate per MB declined by 14.4% to Kshs 1.21
34.1% growth in 30
day active customers
Increased usage driven
by SMS bundles and campaigns (Bonyeza Ushinde)
10.1% increase in the year
driven by growth in all service revenue lines
* Voice, SMS and Service ARPU are calculated based on total mobile customers
* M-PESA and Mobile Data ARPUs are calculated based on respective 30 day active customers
+3.3% +3.8% +25% -3.3%
+10.1%

FY11 FY12 FY13 FY14
38.0 44.0 47.2
52.0
Direct cost control improves contribution margin
FY Direct costs
Kshs. Billion
17
• 10.2% increase in direct costs, lower than the 16.4% increase in total revenue
• Contribution margin increased to 64.1%
up 2.1 ppt.
• Cost savings realized in the following areas
• Customer acquisition costs (Sim cards and devices)
• Top up card costs
FY14 Direct costs breakdown
Kshs. Billion
92.71
(6.46)
(5.57)
(7.96)
(10.68)
(9.56)
144.67
(5.40) (5.36)
(0.97)
Revenue
M-P
ESA
co
mm
issio
ns
Airt
ime
com
missio
ns
Lice
nse
fee
s In
terc
onne
ct c
ost
s
Pre
miu
m rate
d s
erv
ice
cost
sH
and
set c
ost
s
Acq
uisitio
n a
nd
re
tention c
ost
sO
ther d
irect co
sts
Contrib
ution m
arg
in

Continued focus on cost control initiatives
FY OPEX
Kshs. Billion
18
• Operating costs as a % of total revenue declined to 22.0%
• 14.0% increase in operating costs versus a 16.4% increase in total revenue
• Operating cost saving initiatives focus on: • Transmission costs • Network operating costs (including fuel) • IT operational costs
* Operating costs relate to Payroll, Publicity, Leased Lines, Network & IT operational costs, and other costs (including rent, rates and insurances)
* Bad debts now reclassified under operating costs
21.15 25.47
27.88
31.77
22.3% 23.8%
22.4% 22.0%
0.5%
5.5%
10.5%
15.5%
20.5%
25.5%
0
5
10
15
20
25
30
35
FY11 FY12 FY13 FY14
Opex Opex as a % of total revenue

Strong growth in EBITDA
• 23.8% growth in FY14 EBITDA to Kshs 60.9bn
• FY14 EBITDA margin improves by 2.5 ppt to 42.1%
EBITDA
0
5
10
15
20
25
30
35
H1 FY11 H2 FY11 H1 FY12 H2 FY12 H1 FY13 H2 FY13 H1FY14 H2 FY14
18.8 16.9
14.8
22.7 22.3
26.9 28.9
32.0
Kshs. Billion
19

Largest & Fastest Network in Kenya
Largest 2G and 3G network:
• 3,140 2G enabled base stations of which
1,847 are also 3G enabled (59%)
• 900 3G sites at 21mbps • 947 3G sites at 42mbps
Base stations FY CAPEX
FY11 FY12 FY13 FY14
2501 2690
2905 3140
1140
1439 1604
1847
193 187 203 203
Total (inc 2G) 3G Wimax
Kshs. Billion
25.48 25.74 24.88
27.78
27.0%
24.0%
20.0% 19.2%
0.0%
5.0%
10.0%
15.0%
20.0%
25.0%
30.0%
20
21
22
23
24
25
26
27
28
29
FY11 FY12 FY13 FY14
CAPEX CAPEX Intensity
20
Capital expenditure of Kshs 27.78 bn invested in:
• Fibre – 770 km completed
• 640km ongoing in key metro areas Nairobi, Nakuru, Mombasa and Kisumu
• 2G and 3G capacity growth – modernization and upgrades
• Information systems upgrades

Improved cash generation 21
Kshs. Billion Kshs. Billion
FY Free Cash Flow FY Net Cash
• 56% growth in Free Cash Flow to Kshs 22.7bn
from Kshs 14.5bn in FY13
• Driven by improved EBITDA and positive
working capital
* Free Cash Flow excludes M&A and spectrum purchases
• Kshs 7.5bn corporate bond at 12.25%, expires
Nov 2014
• Kshs 4.5bn corporate bond at 7.75%, expires
Dec 2015
• Kshs 0.61bn two year term loan facility at 91
day TB rate minus 1%
1.13
22.69 (27.78)
(0.35)
(11.25)
60.94
EBITDA Interest
paid
Tax paid Capex Working
capital
Free cash
flow
5.01
(12.00)
(0.61)
17.62
Cash at bank Corporate
bond
Bank
borrowings
Net cash

FY 14 FY 13 GROWTH H2 FY14 H2 FY13 GROWTH
Voice revenue 86.30 77.33 11.6% 44.34 40.07 10.7%
Messaging revenue 13.62 10.15 34.2% 7.28 5.88 23.8%
Mobile data revenue 9.31 6.62 40.6% 5.08 3.50 45.1%
Fixed service revenue 2.57 2.11 21.8% 1.35 1.10 22.7%
M-Pesa revenue 26.56 21.84 21.6% 14.07 11.42 23.2%
Service Revenue 138.36 118.05 17.2% 72.12 61.96 16.4%
Handset revenue 4.95 4.93 0.4% 2.72 2.50 8.8%
Acquisition and other revenue 1.36 1.31 3.8% 0.63 0.72 -12.5%
Total Revenue 144.67 124.29 16.4% 75.47 65.19 15.8%
Direct costs (51.96) (47.17) -10.2% (27.17) (24.77) -9.7%
Contribution margin 92.71 77.12 20.2% 48.30 40.41 19.5%
Contribution margin % 64.1% 62.0% 2.1% 64.0% 62.0% 2.0%
Operating costs (31.77) (27.88) -14.0% (16.21) (13.45) -20.5%
Operating costs % total revenue 22.0% 22.4% -0.4% 21.5% 20.6% 0.9%
EBITDA 60.94 49.24 23.8% 32.09 26.97 19.0%
EBITDA margin % 42.1% 39.6% 2.5% 42.5% 41.4% 1.1%
Depreciation, amortisation & impairment (25.79) (22.14) -16.5% (13.09) (12.23) -7.0%
Net Financing cost (0.16) (1.65) 90.3% 0.08 (0.80) 110.0%
Taxation (11.97) (7.91) -51.3% (7.32) (4.17) -75.5%
Net Income 23.02 17.54 31.2% 11.76 9.77 20.4%
Earnings per share 0.57 0.44 29.5% 0.29 0.25 16.0%
Free Cash Flow 22.69 14.51 56.4% 8.95 9.37 -4.5%
Recommended Dividend 18.83 12.40 51.9%
Dividend per share 0.47 0.31 51.6%
Key Financials:

Contents
FY14 Highlights
FY14 Financial Review
Strategic Focus and Guidance
23

Strategy Overview 24
• Best network in Kenya
• Grow mobile and fixed data
• Partner of choice for business
• Deepen financial inclusion
• Grow, retain and reward our loyal customer base
• Grow youth appeal
• High performing innovative organization
25
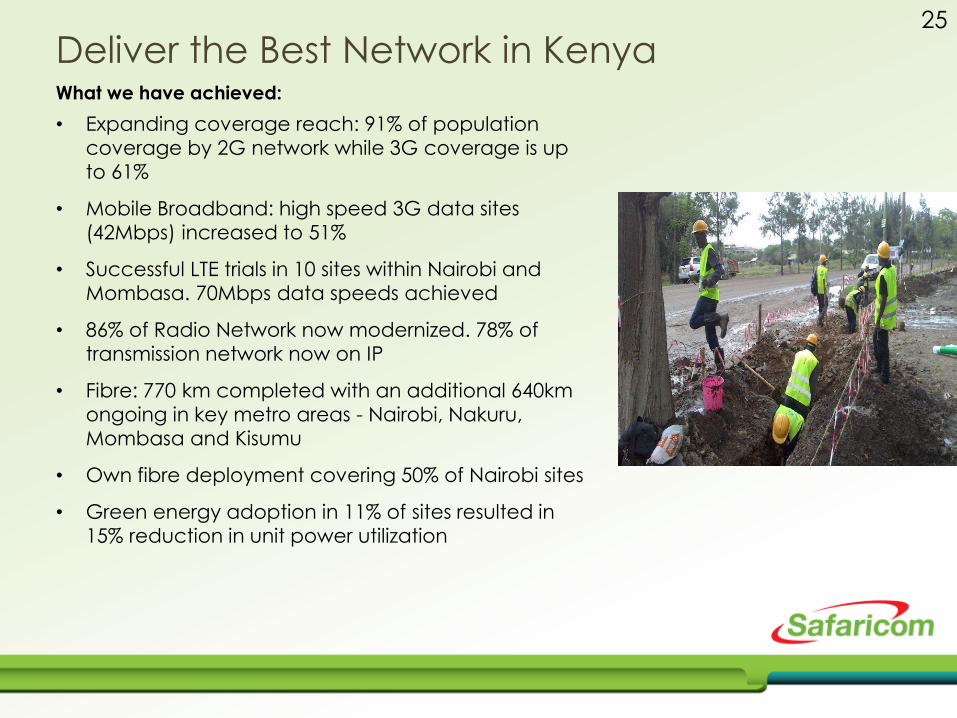
Deliver the Best Network in Kenya What we have achieved:
• Expanding coverage reach: 91% of population
coverage by 2G network while 3G coverage is up
to 61%
• Mobile Broadband: high speed 3G data sites
(42Mbps) increased to 51%
• Successful LTE trials in 10 sites within Nairobi and
Mombasa. 70Mbps data speeds achieved
• 86% of Radio Network now modernized. 78% of
transmission network now on IP
• Fibre: 770 km completed with an additional 640km
ongoing in key metro areas - Nairobi, Nakuru,
Mombasa and Kisumu
• Own fibre deployment covering 50% of Nairobi sites
• Green energy adoption in 11% of sites resulted in
15% reduction in unit power utilization

Sustained network improvement & expansion
Top priorities:
• Complete the additional 640km of own fibre
in key towns outside Nairobi
• Deploy fibre to 900 commercial buildings in
key metro areas in Kenya (Nairobi, Nakuru,
Mombasa and Kisumu)
• Increase the number of 3G sites of which
75% will be upgraded to 42mbps
• Launch of WiFi network in selected malls
within the cities
• Launch a 4G network once spectrum is
available
• Provide free broadband to schools who
have had the laptop program rolled
• Deployment of 50 base stations in 12
counties where it is not commercially
justifiable
26
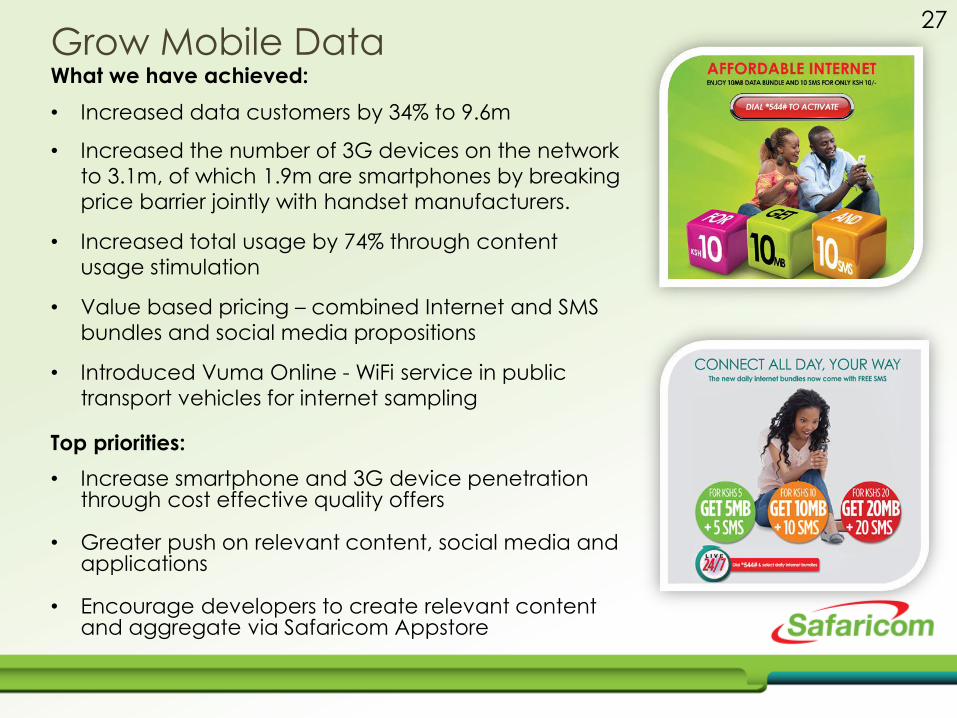
27 Grow Mobile Data What we have achieved:
• Increased data customers by 34% to 9.6m
• Increased the number of 3G devices on the network
to 3.1m, of which 1.9m are smartphones by breaking
price barrier jointly with handset manufacturers.
• Increased total usage by 74% through content
usage stimulation
• Value based pricing – combined Internet and SMS
bundles and social media propositions
• Introduced Vuma Online - WiFi service in public
transport vehicles for internet sampling
Top priorities:
• Increase smartphone and 3G device penetration through cost effective quality offers
• Greater push on relevant content, social media and applications
• Encourage developers to create relevant content and aggregate via Safaricom Appstore
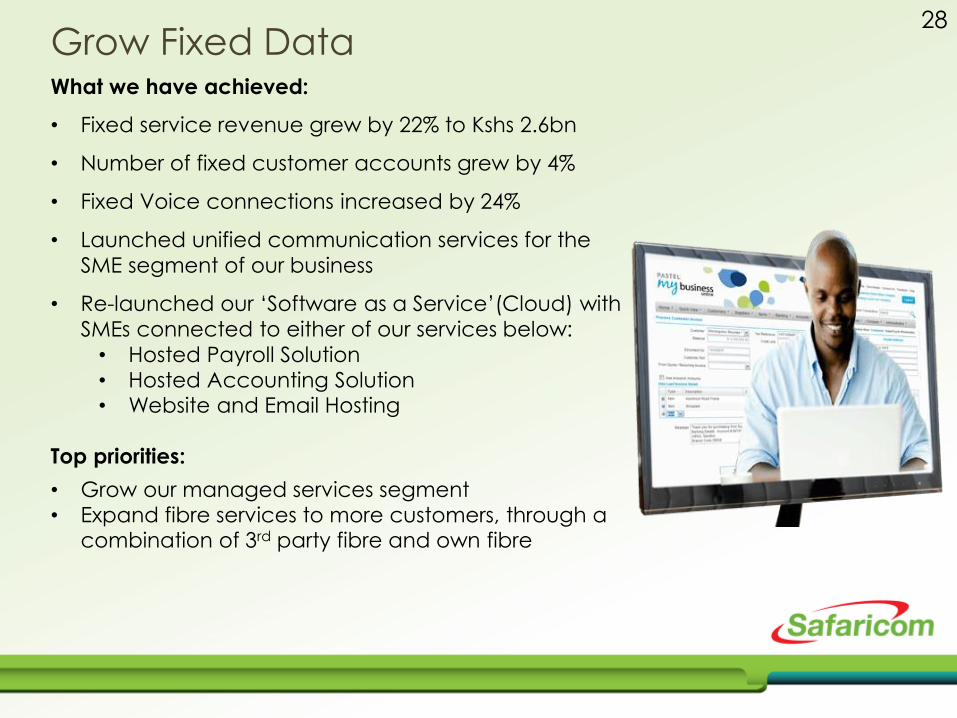
28 Grow Fixed Data What we have achieved:
• Fixed service revenue grew by 22% to Kshs 2.6bn
• Number of fixed customer accounts grew by 4%
• Fixed Voice connections increased by 24%
• Launched unified communication services for the
SME segment of our business
• Re-launched our „Software as a Service‟(Cloud) with
SMEs connected to either of our services below:
• Hosted Payroll Solution • Hosted Accounting Solution • Website and Email Hosting
Top priorities:
• Grow our managed services segment • Expand fibre services to more customers, through a
combination of 3rd party fibre and own fibre

29 Deepen financial inclusion using M-PESA What we have achieved:
• Increased M-PESA outlets by 15,478 in the year,
now at 81,025
• Launched Lipa na M-PESA: 122,000 merchants
acquired; 24,137 are now active
• Increased cashless FMCG distributors to 158
with a total of 1,271 distribution points
• M-Shwari: 3.6m active customers, Kshs 4.0bn on
deposit, Kshs 1.2bn on loan with NPLs at 2.7%
Top priorities:
• Grow M-PESA to become a primary payment
platform
• Commercialize Lipa na M-PESA by growing
active merchant base
• Grow cashless FMCG distributors
• Grow Bank to M-PESA transfers & drive uptake
of savings and loans
M-SHWARI Performance
Customers
Active Customers
Loan Balance
Non Performing Loans
March 2013 March 2014
2.5 million
1.1 million
0.3 billion
6.8 million
3.6 million
1.2 billion
Net Deposits 0.9 billion 4.0 billion
4.0% 2.7%

30
Retain market leadership
67.9%
16.5%
7.2% 8.5%
Subscriber market share-Dec 2013
Safaricom Airtel Orange Yu-Essar
73.2%
14.3%
7.3% 5.2%
Mobile data market share-Dec 2013
Safaricom Airtel Orange Yu-Essar
78.2%
11.3%
2.6% 7.9%
Voice traffic market share-Dec 2013
Safaricom Airtel Orange Yu-Essar
95.8%
3.4%
0.4% 0.6%
SMS market share-Dec 2013
Safaricom Airtel Orange Yu-Essar
Source: Communication Commission of Kenya (CCK)

31
Grow youth appeal What we have achieved:
• Increase in youth appeal with overall brand
youthfulness growing to 83% from 69% since
March 2013.
• Engagement with youth through activities and
propositions:
• Vuma online (WiFi in public transport
vehicles)
• Affordable bundles of data & SMS
• Kaa social na chattitude (data bundles)
• Niko na Safaricom live (local music
engagement events)
• Safaricom 7s (annual rugby tournament)
• Groove awards (gospel music awards)
Youthfulness attribute – by segment
Mar 13 Mar 14
69% 83%
67% 83%
67% 82%
70%
82% 70%
84%
Overall Youth Core GenY Achievers

32 Encourage further innovation What we have launched in the last 12 months:
• Lipa na M-PESA (cashless payments for goods &
services)
• Cashless FMCG distribution using M-PESA
• Lipa Kodi (rental payments to landlords)
• Chattitude and 10+10 for 10 (data bundles)
• Vuma Online (WiFi in public transport vehicles)
• The Safaricom Appstore
• The Safaricom Appstar competition
• The Safaricom Appwiz competition
• i-Cow (animal health application for farmers)
• Linda Jamii (Health insurance: premiums paid via
M-PESA)
• Telecoms lab at JKUAT university
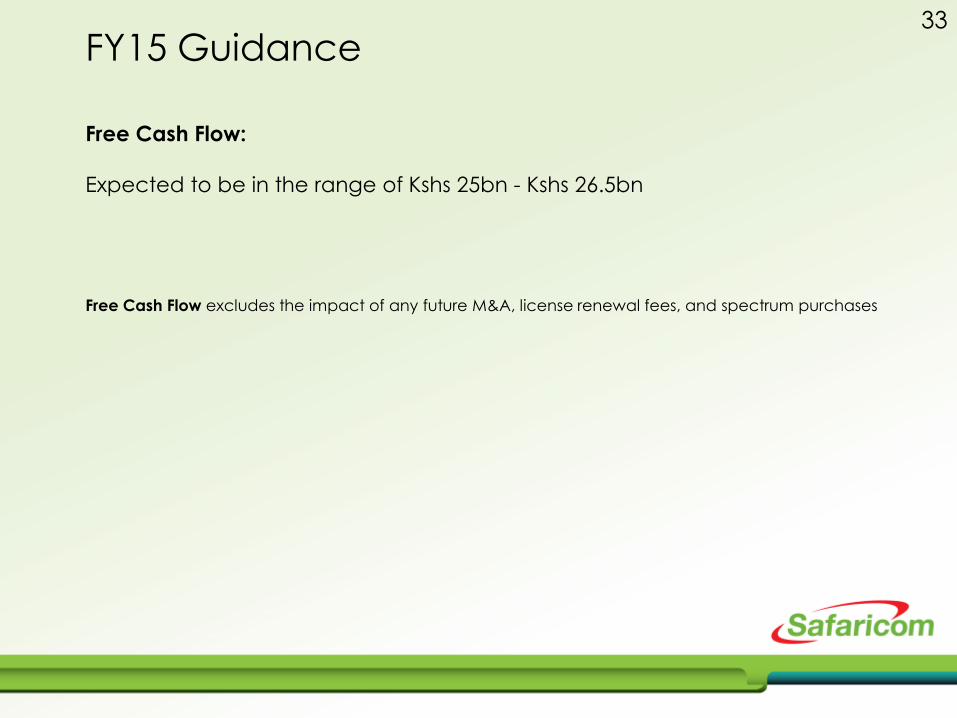
FY15 Guidance
Free Cash Flow:
Expected to be in the range of Kshs 25bn - Kshs 26.5bn
Free Cash Flow excludes the impact of any future M&A, license renewal fees, and spectrum purchases
33
34
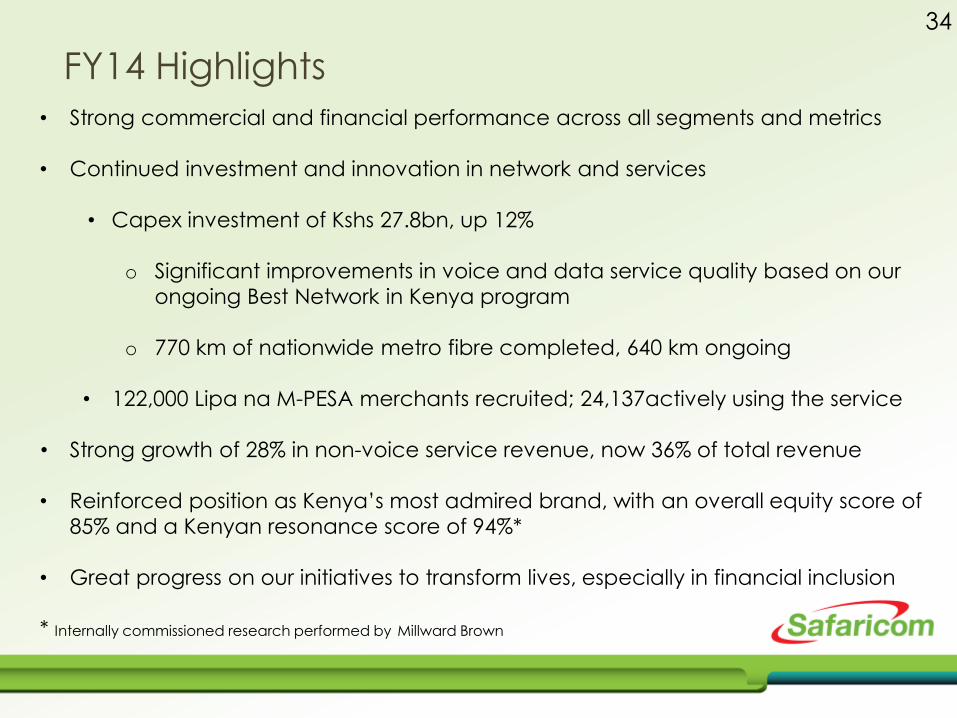
FY14 Highlights
• Strong commercial and financial performance across all segments and metrics
• Continued investment and innovation in network and services
• Capex investment of Kshs 27.8bn, up 12%
o Significant improvements in voice and data service quality based on our
ongoing Best Network in Kenya program
o 770 km of nationwide metro fibre completed, 640 km ongoing
• 122,000 Lipa na M-PESA merchants recruited; 24,137actively using the service
• Strong growth of 28% in non-voice service revenue, now 36% of total revenue
• Reinforced position as Kenya‟s most admired brand, with an overall equity score of
85% and a Kenyan resonance score of 94%*
• Great progress on our initiatives to transform lives, especially in financial inclusion
* Internally commissioned research performed by Millward Brown

Related Documents