Molecular Breeding 1: 165-179, 1995. © 1995 Kluwer Academic Publishers. Printed in Belgium. 165 Saccharum spontaneum L. 'SES 208' genetic linkage map combining RFLP- and PCR-based markers Jorge da Silva 2'3, Rhonda J. Honeycutt *, William Burnquist 3, Salah M. A1-Janabi ,,4, Mark E. Sorrells 2, Steven D. Tanksley 2 and Bruno W. S. Sobral *'* *California Institute of Biological Research, 11099 N. Torrey Pines Road, Suite 300, La Jolla, CA 92037, USA (* author for correspondence); 2Department of Plant Breeding and Biometry, Cornell University, Ithaca, N Y 14853, USA," 3 Copersucar Technology Center, Caixa Postal 162, 13.400 Piracicaba, S~to Pau[o, Brazil," 4 Current address: Agronomy Department, Baghdad Institute of Agricultural Technology, Iraq Received 20 July 1994; accepted in revised form 18 November 1994 Key words: arbitrarily primed PCR, polyploidy, polysomic inheritance, RAPD markers, single-dose fragments, sugarcane Abstract A 527 marker linkage map of Saccharum spontaneum L. 'SES 208' (2n = 64) was established by analyzing 208 single-dose (SD) arbitrarily primed PCR polymorphisms, 234 SD RFLPs, 41 double-dose (DD) and one triple-dose (TD) polymorphisms. A map hypothesis constructed using these markers (minimum LOD = 4.00, 0 = 0.25 M) had 64 linkage groups with 13 SD, nine DD, and one TD markers unlinked. Eight chromosome homology groups were identified by using DD fragments as well as SD RFLPs that identified more than one linkage group. Linkages in repulsion phase were absent from the map, as found in two previous genetic studies of this species. Together, these data demonstrate that SES 208 displayed polysomic segregation, a genetic behavior typical of autopolyploid species. As with previous studies, it was concluded that SES 208 behaved like an auto-octoploid, which was also in agreement with the number of homology groups observed. A Z2 was used to test whether the 527 markers were randomty distributed throughout the genome: both arbitrarily primed PCR markers and RFLPs had a distribu- tion that was statistically indistinguishable from random. The integrated arbitrarily primed PCR-RFLP map had a predicted genomic coverage of 93 To (considering only 442 SD polymorphisms) and an average interval between markers of 6 cM. SD markers were used to estimate the genome size of SES 208 at ca. 33 00 cM. Introduction DNA markers have been used as a fundamental tool for rapid and detailed genetic dissection of higher plants. Among the different applications of information obtained with such markers is the construction of genetic linkage maps. Once a dense map has been constructed, flanking mark- ers can be used to more precisely and quickly detect the presence of genes or quantitative trait loci (QTL). Therefore, high-density linkage maps have direct application in plant breeding due to the high probability that any gene of interest will be tightly linked to at least one marker. Such

Welcome message from author
This document is posted to help you gain knowledge. Please leave a comment to let me know what you think about it! Share it to your friends and learn new things together.
Transcript
Molecular Breeding 1: 165-179, 1995. © 1995 Kluwer Academic Publishers. Printed in Belgium. 165
Saccharum spontaneum L. 'SES 208' genetic linkage map combining RFLP- and PCR-based markers
Jorge da Silva 2'3, Rhonda J. Honeycutt *, William Burnquist 3, Salah M. A1-Janabi ,,4, Mark E. Sorrells 2, Steven D. Tanksley 2 and Bruno W. S. Sobral *'* *California Institute of Biological Research, 11099 N. Torrey Pines Road, Suite 300, La Jolla, CA 92037, USA (* author for correspondence); 2Department of Plant Breeding and Biometry, Cornell University, Ithaca, NY 14853, USA," 3 Copersucar Technology Center, Caixa Postal 162, 13.400 Piracicaba, S~to Pau[o, Brazil," 4 Current address: Agronomy Department, Baghdad Institute of Agricultural Technology, Iraq
Received 20 July 1994; accepted in revised form 18 November 1994
Key words: arbitrarily primed PCR, polyploidy, polysomic inheritance, RAPD markers, single-dose fragments, sugarcane
Abstract
A 527 marker linkage map of Saccharum spontaneum L. 'SES 208' (2n = 64) was established by analyzing 208 single-dose (SD) arbitrarily primed PCR polymorphisms, 234 SD RFLPs, 41 double-dose (DD) and one triple-dose (TD) polymorphisms. A map hypothesis constructed using these markers (minimum LOD = 4.00, 0 = 0.25 M) had 64 linkage groups with 13 SD, nine DD, and one TD markers unlinked. Eight chromosome homology groups were identified by using DD fragments as well as SD RFLPs that identified more than one linkage group. Linkages in repulsion phase were absent from the map, as found in two previous genetic studies of this species. Together, these data demonstrate that SES 208 displayed polysomic segregation, a genetic behavior typical of autopolyploid species. As with previous studies, it was concluded that SES 208 behaved like an auto-octoploid, which was also in agreement with the number of homology groups observed. A Z 2 was used to test whether the 527 markers were randomty distributed throughout the genome: both arbitrarily primed PCR markers and RFLPs had a distribu- tion that was statistically indistinguishable from random. The integrated arbitrarily primed PCR-RFLP map had a predicted genomic coverage of 93 To (considering only 442 SD polymorphisms) and an average interval between markers of 6 cM. SD markers were used to estimate the genome size of SES 208 at ca. 33 00 cM.
Introduction
DNA markers have been used as a fundamental tool for rapid and detailed genetic dissection of higher plants. Among the different applications of information obtained with such markers is the construction of genetic linkage maps. Once a
dense map has been constructed, flanking mark- ers can be used to more precisely and quickly detect the presence of genes or quantitative trait loci (QTL). Therefore, high-density linkage maps have direct application in plant breeding due to the high probability that any gene of interest will be tightly linked to at least one marker. Such
166
linkages are useful for marker-assisted selection in breeding programs [9]. Furthermore, high- density maps can provide starting points for map- based gene cloning [34]. When using linkage maps for detection and characterization of QTL, in 'genome scanning approaches', the chance of success is a function of the density of markers in the map [17, 22]. However, alternative, map- independent QTL detection methods exist which help to overcome this problem in certain cases [6, 29-311.
Restriction fragment length polymorphisms (RFLPs) were the first DNA markers proposed for construction of genetic maps [5]. Since then, RFLPs have been used to construct linkage maps in a variety of species of animals and plants [re- viewed in 21 ]. More recently a new type of DNA marker [33, 35], based on the polymerase chain reaction (PCR) [24], has been used for the con- struction of genetic maps and other applications [reviewed in 26].
Linkage maps constructed with DNA markers have been of diploid species. However, a large proportion of angiosperms are polyploid, espe- cially within the grasses [27]. Mapping polyploid species is a more complex task due to the diffi- culty in identifying genotypes by the banding phe- notype. One way to overcome this problem is to use wild diploid relatives, as done to create a RFLP map for potato [4]. Mapping of polyploids with no known diploid counterparts lagged be- hind until Wu et al. [36] proposed a method for direct mapping of any polyploid that has strict bivalent pairing at meiosis. In this case, mapping is based on the segregation of single-dose (SD) or simplex loci [4, 23]. Using this method, Da Silva et al. [11] constructed a SD RFLP (also known as single-dose restriction fragments, SDRFs) linkage map, with 216 SD loci comprising 44 linkage groups, for Saccharum spontaneum 'SES 208' (2n = 64), which is a wild relative of culti- vated sugarcane. Simultaneously, AI-Janabi et al. [1 ] constructed a linkage map of the same acces- sion using arbitrarily primed PCR [33]; the arbi- trarily primed PCR map contains 208 SD poly- morphisms distributed in 41 linkage groups. Estimates of genome size and coverage of these
two studies were in close agreement. Both con- cluded that this species presented polysomic seg- regation, typical of autopolyploids.
Da Silva [10] presented a methodology for mapping duplex (DD) and triplex (TD) loci in autopolyploids and used this methodology to ex- tend the S. spontaneum RFLP map to over 300 markers. Mapping output is higher with PCR- based markers than with RFLPs, and full auto- mation of marker acquisition and analysis is pos- sible with PCR, thereby making PCR-based markers more amenable to use in breeding pro- grams [1, 25, 26]. However, because of the lack of knowledge about the homologous relationships among PCR markers obtained with the same primer, unless Southern hybridization data are acquired, SDRFs are preferred to obtain infor- mation about homology of linkage groups, par- ticularly when using SDRFs in autopolyploids, as S. spontaneum SES 208. Otherwise, the map will be a homolog map, with 2n linkage groups [ 1, 10, 11].
In this study we integrated the arbitrarily primed PCR map [1] with the SDRF map [11] of a wild relative of sugarcane, S. spontaneum, to facilitate the application of DNA markers to sug- arcane breeding. Highly polymorphic SDRF probes and DD and TD markers were used to organize the 64 linkage groups into 8 groups of pairing homologues.
Materials and methods
Plant materials
A common population of 71 progeny derived from a cross between Saccharum spontaneum 'SES 208' (2n = 64) and its doubled haploid, 'ADP85-0068' [12, 20], was used for mapping with both arbi- trarily primed PCR and RFLP markers [see also 1, 11].
Probes and markers
RFLP probes were obtained from a random low- copy sugarcane genomic library (SG probes [8],
and three sugarcane cDNA libraries, CSB, CSC and CSR probes (CSB, cDNAs from sugarcane buds; CSC, cDNAs from sugarcane cell cultures; CSR, cDNAs from sugarcane roots). In addition, heterologous probes from maize (UMC and BNL probes), rice (RZ probes), oats (CD probes) and barley (BC probes) were used [ 11 ]. Methods used for probe preparation, Southern hybridization and autoradiography have been reported [ 11 ]. Arbitrarily primed PCR markers were obtained following the protocol of Sobral and Honeycutt [25]. Methods of DNA extraction [14], primer screening and scoring of polymorphic fragments have been described [ 1, 25].
Map construction
To construct a map hypothesis we used Map- Maker v 3.0 for IBM and v 2.0 for Macintosh [18]. Three different ordering strategies were used: (1) 442 SD markers were analyzed and pairs of linked markers were identified using two- point analysis with LOD -- 4.0 and maximum re- combination fraction (0)= 0.25 M, followed by subsequent ordering of markers using three-point and multi-point analyses; (2) a framework map of 234 SDRFs [11] was used for integration of 208 SD arbitrarily primed PCR polymorphisms [1] to the SDRF map; and (3) 442 single-dose polymorphisms were grouped (LOD = 4.0, 0 = 0.25 M), but first a 'framework' map was estab- lished using multi-point analysis with pairs of markers with LOD scores > 9.0 and 0>0.10 M, after which remaining markers were ordered one- at-a-time followed by matrix correlation analysis after the addition of each new marker. Map units (in cM) were calculated using the Kosambi map- ping function. To map double- and triple-dose RFLPs, we used the methodology presented by Da Silva [10]. First DD and TD fragments were placed on the SDRF map, then linkages between DD and TD fragments and single-dose arbitrarily primed PCR polymorphisms were investigated. Genome size was estimated according to Hulbert et al. [151, which is based on linkages observed on an existing genetic map. The expected propor-
167
tion of the genome covered by this linkage map with n markers randomly placed, was calculated according to Bishop et al. [3].
Results and discussion
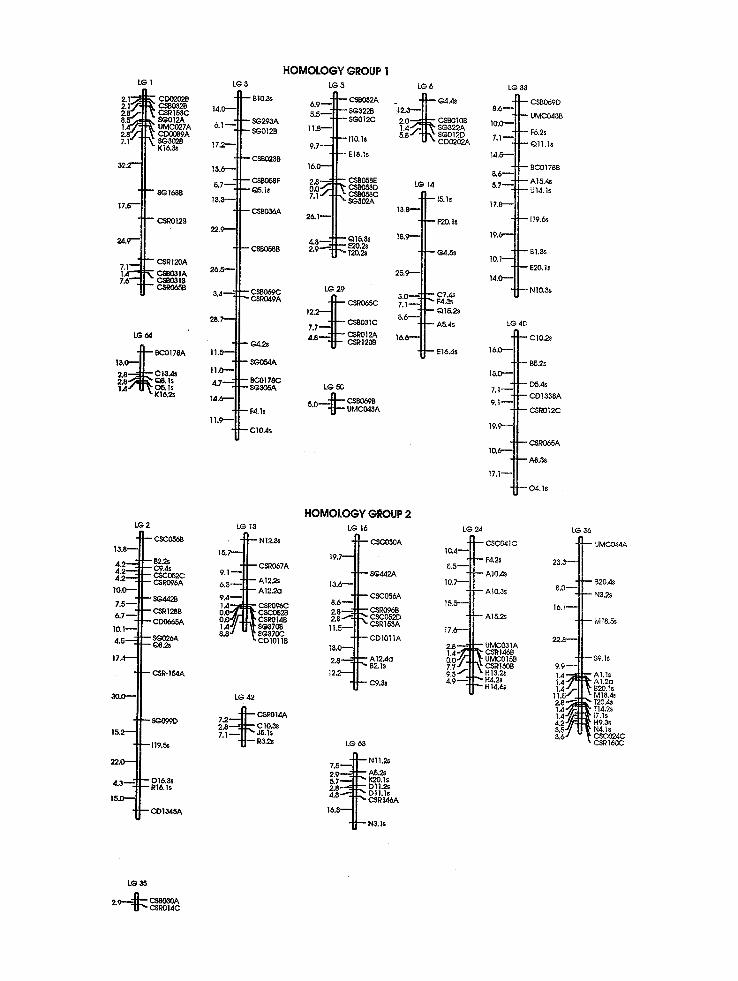
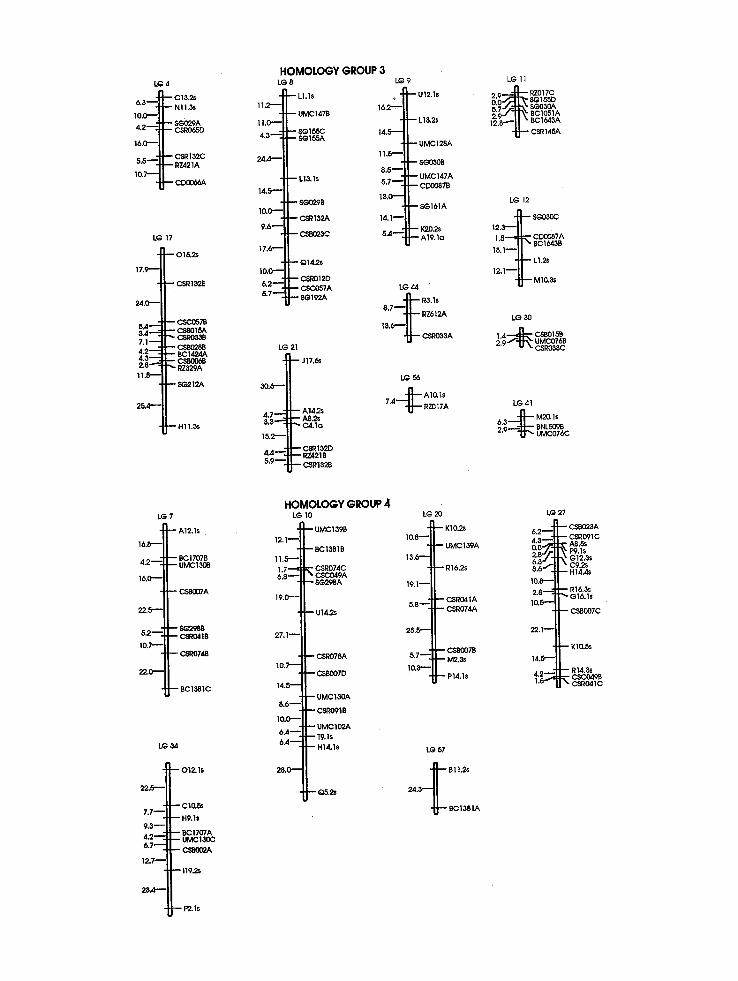
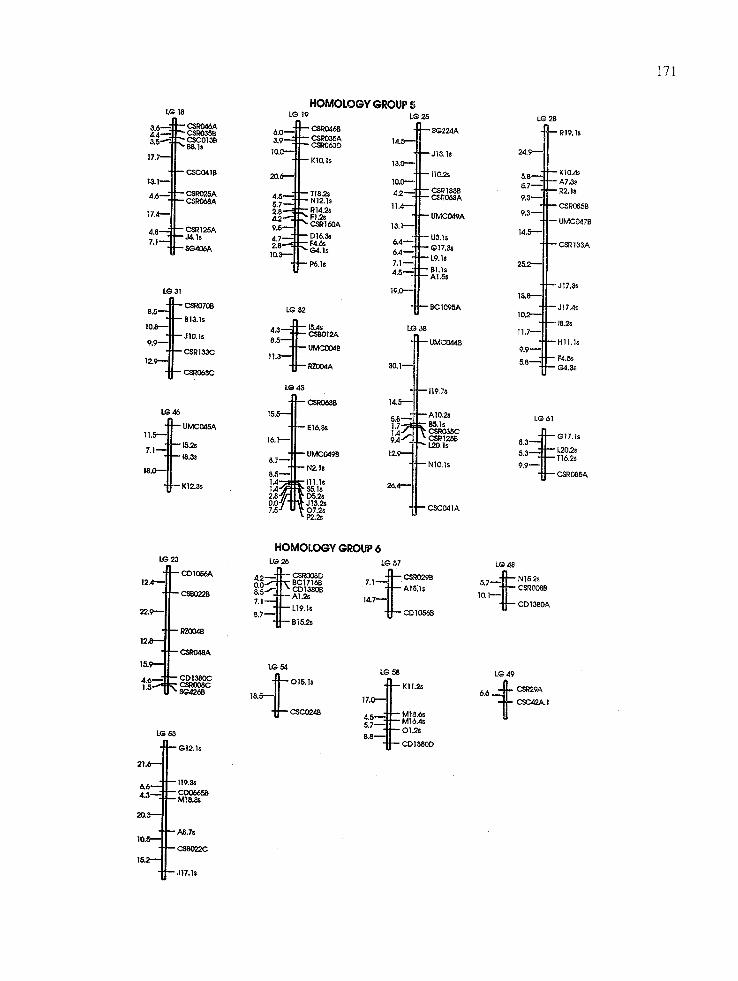
A total of 527 DNA markers, comprised of 208 PCR-based SD markers, 234 SDRFs, 41 DD (or 82 markers) and one TD (3 markers) polymor- phism, were mapped onto the sugarcane genome, yielding 64 linkage groups (Figure 1), with 12 (3~) unlinked SD markers (7 SDRFs and 5 SD arbitrarily primed PCR markers), 9 (11~o) un- linked DD markers, and 3 (100~o) unlinked TD markers. Figure 1 shows all SD markers and DD markers for linkage groups 45, 49, and 51. All remaining DD markers have their linkage rela- tionships described in Table 1. Markers were not uniformly distributed across linkage groups: the number of SD markers per linkage group varied from 2 to 16 (Fig. 1). Saccharum spontaneum cln'omosomes are of different sizes [ 16] and these differences may account for much of the differ- ences in marker distribution, as suggested for to- mato chromosomes [28]. Alternatively, there may be genomic regions that are heavily biased toward multiple-dose alleles, which are underrepresented in our data, and these regions may be lacking in cogerage in this map.
Four linkage groups are comprised of only PCR-based markers and nine linkage groups have only RFLP markers. However, a Z 2 goodness of fit test with 63 degrees of freedom showed no significant deviation from a random distribution of PCR-based (63.60 ~S) and RFLP (58.00 ns) markers among the different linkage groups, in- dicating that both kinds of markers are appropri- ate for mapping, in terms of genomic coverage. Therefore, our results suggest that sample sizes of 208 PCR-based markers or 319 SD, DD, and TD RFLPs were not adequate to identify all 64 link- age groups. The use of only SD markers limits mapping to those regions of the genome in which such markers are found. This may increase the number of markers required to detect all linkage groups. If genomic regions exist in which higher-
168
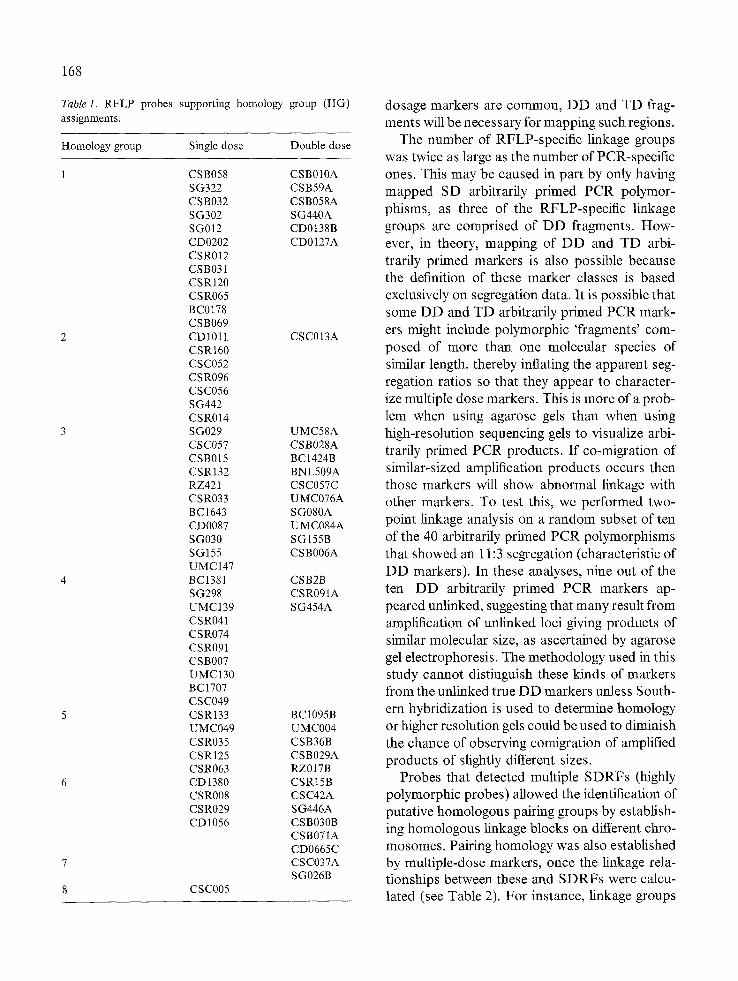
Table 1. RFLP probes supporting homology group (HG) assignments.
Homology group Single dose Double dose
1 CSB058 CSB010A SG322 CSB59A CSB032 CSB058A SG302 SG440A SG012 CD0138B CD0202 CD0127A CSR012 CSB031 CSR120 CSR065 BC0178 CSB069
2 CD1011 CSC013A CSR160 CSC052 CSR096 CSC056 SG442 CSR014
3 SG029 UMC58A CSC057 CSB028A CSB015 BC1424B CSR132 BNL509A RZ421 CSC057C CSR033 UMC076A BC1643 SG080A CD0087 UMC084A SG030 SG155B SG155 CSB006A UMC147
4 BC1381 CSB2B SG298 CSR091A UMC139 SG454A CSR041 CSR074 CSR091 CSB007 UMC130 BC1707 CSC049
5 CSR133 BC1095B UMC049 UMC004 CSR035 CSB36B CSR125 CSB029A CSR063 RZ017B
6 CD1380 CSR15B CSR008 CSC42A CSR029 SG446A CD1056 CSB030B
CSB071A CD0665C
7 CSC037A SG026B
8 CSC005
dosage markers are common, DD and TD frag- ments will be necessary for mapping such regions.
The number of RFLP-specific linkage groups was twice as large as the number of PCR-specific ones. This may be caused in part by only having mapped SD arbitrarily primed PCR polymor- phisms, as three of the RFLP-specific linkage groups are comprised of DD fragments. How- ever, in theory, mapping of DD and TD arbi- trarily primed markers is also possible because the definition of these marker classes is based exclusively on segregation data. It is possible that some DD and TD arbitrarily primed PCR mark- ers might include polymorphic 'fragments' com- posed of more than one molecular species of similar length, thereby inflating the apparent seg- regation ratios so that they appear to character- ize multiple dose markers. This is more of a prob- lem when using agarose gels than when using high-resolution sequencing gels to visualize arbi- trarily primed PCR products. If co-migration of similar-sized amplification products occurs then those markers will show abnormal linkage with other markers. To test this, we performed two- point linkage analysis on a random subset of ten of the 40 arbitrarily primed PCR polymorphisms that showed an 11:3 segregation (characteristic of DD markers). In these analyses, nine out of the ten DD arbitrarily primed PCR markers ap- peared unlinked, suggesting that many result from amplification of unlinked loci giving products of similar molecular size, as ascertained by agarose gel electrophoresis. The methodology used in this study cannot distinguish these kinds of markers from the unlinked true DD markers unless South- ern hybridization is used to determine homology or higher resolution gels could be used to diminish the chance of observing comigration of amplified products of slightly different sizes.
Probes that detected multiple SDRFs (highly polymorphic probes) allowed the identification of putative homologous pairing groups by establish- ing homologous linkage blocks on different chro- mosomes. Pairing homology was also established by multiple-dose markers, once the linkage rela- tionships between these and SDRFs were calcu- lated (see Table 2). For instance, linkage groups
LG1
+.'m Zl .~: 2.8 ~ CSR153C 8~'~,_ k ~OI2A 1.'~j~ "~- UMC027A 2.5~'. ,~ CDO~gA 7. I ~ ~ B
K16.3s
32.2"--
-- ~GI68B
17,5-"
- - CSR012B
24.9-
~ . ~ - - CSR120A K CSB03 IA
7.6-- CSBO31B CSRO65B
LG64
"Jt-'O_..jl BCO178A
'~+~ll~::cm~ 2.8.~'~ (;:18. Is 1.4-'*" U ~ C,5.1s
~ K 1 6 . 2 S
LG2
• -- C.~m~O56B
18 .8 - -
4.~__.- - BZ~
4,2"--=. -- C9.~ 4.2---= - - C~C052C
-- CSR096A 10.0-'-- 7 . 5 = - - SG442B
6.7.-- - - (~"~'128B
10.1~ 4.5-- - - . ~ ' 2 ~
- - ~ . 2 ~
17.4--
-- CSR-154A
30.0"--
15.2"--
-- 119.5~
2 2 . 0 - -
4.8--." - o16.~ - - R 1 6 . 1 e
15.0-'--
-- CD1345A
LG3
• - - B10.~ 14.0--
6 .1 - - -- SG298A ~G012B
17.2"--
• - - CSB023B 18.6"-"
5.7.._ ~ -- CSBO58F • - - QS. ls
18.3-'-
- - CSBO36A
22.9"--
- - CSBO58B
26,5"-"
8.4~." -- CSB069C CSR049A
2 8 . ~
- -- G4.2s 11.5---
- -- SG054A 11.0---
4.7- - - - BC0178C
14.6-"
' -- F4.1s 11.9--"
-- Cl0.4s
LG 18
. " - - NI2.~s
15 .7 - -
9.1 ._~" -- CSR067A
6.3"--:" - - A12.2s - - - A12.2a
9 . 4 - - 1 . i ~ - CSR096C 0,0 ' CSC052B
' CSR014B sc~7o~
• $G370C CD1011~
LG 42
7 2 . ~ CSRO14A
~5--:~--cm= 7"I--11 -J&Is
• "U- - RS.=
H O M O L O G Y G R O U P I LG 5 LG 6
_ ~ . ~ • ~ ~ 2 2 B
2 . 0 ~ CSB010B • - - 1.4.~i . l r~ • SG822A
u '~ CD0202A
~ J ~ E18,1s
2 8~.21t" CS~8E O]O.~'p|l~" CSBO~D LG 14
7 " I " I ~ t % ~ C 18.8-- - - ,5.1s
2 6 . 1 - - j j " , -- r~o.ls I I
4 8 - 1 1 " - Q15.3s 18.9-- o'o~:J::L-" E20.2s ="~T20.2s -- C-.-.-~.Ss
25.9--
LG29 2.__~__ 3,0-'-~.' -- C7.~ CSR065C 7 . 1 - - "~" F4.3s
J I~7 " ~ C$B031C 5'6-"~" A5.~QIS'2s
4 8 - - t CSROI2A • " ~ - CSRI20B 16,6"--
-- E16.4s
LG50
H O M O L O G Y G R O U P 2 LG 16
- - ~ 0 A
19.7--
• - - SG442A 18.6"---
8"6- ~. - - CSC056A
2.8- - - - - CSRO96B 2.8 ..-m ~" CSCO52D
CSRI83A 1 1 . 8 " - -
" - - C D I 0 1 1 A
18.O---
2.8---- - - A12.4a "~" B2. Is
12,2--" -- C9.3S
LG 24
10,4--
5.5_2' 1 0 3 - -
15 .5" - -
i7 ,6- -
2 .8 - 1.4~ 0,0 7,7 2 9 ,8 " 4 ,9 - -
LG63
75 - ~ Nl1.~ 2"~----:t[- As.~ 5 " 7 - - 1 r TM K20.1s
lJ'--" NS, ls
LG 33
8.6_-- -- C~B069D
- - UMC043B 10,0"--
F6.2s 7 .1- -
- -Q11 . l s 14.5"-"
8"6" ~ -- BC0178B
5.7._~" - - AI5.4s -- U14. ls
17.8--
-- 119.6s
19,6"--
" -- BI.3s 10 .1 - -
" - - E20.ls 14.0"--
-- N 10,Ss
LG 40
" -- CI0.2s
16.0-'--
" - BS.2S 18.0"--"
7.1_.~" -- DS.4s
9,1..._~ - - CDI335A
" -- CSR012C
19.9 +=-=
" - - CSRO65A 10,6-=-
-- A8.~
17.1--
- - O4.1s
-- C$C04 IC
F4.2s
- - AI0.4s
-- A I O . ~
-- AIS.2s
- - UMC03 IA ~" CSRI46B T" UMC015B
~" H13.2s "~" H4.2s
HI4.6S
LG 36
UMCO44A
23.3--
8.0__~" -- B20.4s - - N3.2S
16.1--
-- M18.Ss
22,8--
= -- S9.1S 9.9 m 1 . 4 ~ AI . ls 1.4 " I / ~ [ ' ~ " AI ,20 1.4.,1~1l ~,~ B20,1s
1 1 . ~ II ~ MIS.~
2.8 ~ T2O.~ 1.4 -//,,-'TF~ TI4.2s 1.4J/r~ 17, Is 4.2 J i r J ~ ~ H9.3s 3.5J/ | | ~- N4.1s &6 J - ~" CSC024C
CSR160C
L G 8 5
2 . 9 ~ CSBO30A " ~ C S~14C
LG4
6,3__~ - - C13.28 - - - N11 .38
10 .0 - - -
- SG029A 4 .2 - - - - CSRO65D
16.0"--"
- - CSR132C 5 , 5 ~ - - RZ421A 10.7-"
- - CD0066A
LG 17
O15.28
17.9--
- - CSR132E
24.0--
5 , 4 ~ - - CSC(~57B 3.4"-'~ - - C:$8015A 7 . 1 - - ~ CSRO33B 4 . 2 ~ -- CSB028B 4 , 3 ~ - - BC1424A
- - CSB006B 2 . 8 ~ ~" RZ329A 11.5---
- - SG212A
25.4"-"
-- H11.38
H O M O L O G Y GROUP 3 LG 8
• - - LI. Is 11.2"---
• ~ UMCI47B 11.0---
$G155C 4 . 3 ~ - - 8G155A
24.4--
' - - L18.Is
14,5---
- - - $G029B 10.0--"
- - - CSR132A 9 . 6 ~
- -- CSB023C
17.6"--
- - - Q14.28 10.0--- o,~--% -̂--:" - - ~ I 2D 5.7__: - - CSC057A
SG192A
.G 21
J17.68
30.6--
4.7"-'~ - - A14.28 3.3"~- -- A8.28
~- C4.1a
15,2"--
- - C.,.,q~ 132D 4 . 4 - - - - R7,421B 5 .9 - - -- ~ 1 3 . 2 B
LG9
- - U12.18
16.2"--
' - - L13,2S
14.5"--
- - UMC128A 11.5-- 8,5..2- - - 8G~8
-- UMCI47A 5 . 7 - - ' - CD0087B
13.0"-- • - - SG161A
14 .1 - -
-- K20,28 5.4-- -- A19.1a
LG44
87 'J l " - R3'1s
• 1 ~ CSRO33A
LG56
74 =p~ AI0.1S • ~ J ~ RZ017A
LG11
2 9 ~ ' ~ ' - RZ017C O'0.,*~n'~" $G155D ~'7 . /~ - I t~ ~ 8G080A ~ ' ~ . / " I T ~ ~" BCI051A
• "tJ'-- CSR145A
LG 12
- ~ SG030C
~2.e--II 1 5 ~ CD0087A
12 I - - ' I ] " - LI'2s
• " J J ' - - " M10.38
LG30
1 4 CSB015B o'o~----~ UMC076B - . - u ~. CSR033C
LG 41
'~-=-*Jf~- BNLSOgB " ~ UMC076C
LG7
• " ~ A12.18
~ - 'h ' - - BC1707B ~ ' ~ - - ~ I " - - UMC 130B
oo--II o9.5"--- I [ - - ~ 7 A
1 0 . 7 - - . ~ CSRO74B
"~.1~"--~ BC135tC
LG34
- - O12.18
22.5--
7 . 7 ~ - - CI0.,58 - -- H9.1S
9 , 3 - - 4,2"~." - - BCI707A
- - UMC130C 6 . 7 - -
12.7"--- - - 119.2S
- - P2 .1S
H O M O L O G Y GROUP 4 LG 10
• - - UMC139B
1 2 . 1 ~ • - - BC1381B
11,5"-- 1.7---~ ¢" ~ 7 4 C 6 . 8 ~ ~" CSC049A
8G298A
19.0--"
- - U 14.2s
27.1--
, - - C$R078A 10.7- -
- - CSB~O7D
14.5"--
8.6 " ' U M C I 3 0 A
• - - CSR091B 10.0 =- - 6.4,.,.2 -- UMCI~ 6.4.._ ~ " - - T9.1s
- - H14,1s
28 .0" - -
-- Q5.28
LG20
- - - K10.2s 1 0 . 8 ~
• - - UMC139A
13.6'--"
- - R16.2s
19.1--
5,8-" : - - CSR041A - - CSR074A
28.5"-
5 . 7 ~ - - CSB007B - - M2.38
10.3-- - - P14.18
LG 57
Jl B11'28
2 4 . 3 - - . ~ BC1381A
27
6.2*--': - - C,~023A - - CSR091C
4.3- _ _ A8.58 0.0 ~ ~o~".~ P9. Is
G12.3S 6.3" ~" C9,2S 8'6~ - - H14.48 10.8-- 2,8"--~-" - - R16.38
~" G16.18 10.5---
- - CSB007C
22.1--
• - - K10.58
14,5"-
- - R14,38 4.2"- : R- CSC049B 1"5"~ ~" CSR041C
LG 18
3.6-- -- CSRO46A 4.4-- ~ C, SR035B 3.5*'* ~ C:SC013B
~ B8.1s 17.7-'--
" -- CSC041B
13.1~ 4.6~ -- C:SR025A
-- CSR068A
17.4--
4 . 8 " -- CSR125A 7 . 1 " -- J4.1s
"SC.~06A
LG 31
8 5 ~ " ~ C~RO70B
10 8...--iF -B13. Is
9 ; - j r "- J10.1s
LG46
A - - UMCQ45A
" '~-- I I 7 1 . IF " 15.2s
• ~ t J ' - 18.3s
'"--II l J ' - - K12.~
LG 23
• - - CDIO56A 12.4"--
-- CSB022B
22.9---
' - - RZQO4B 12.8--
' - - CSRO48A 18.9"--
4.6 ~ - - CD1380C 1 . 5 " ~ ~" CSR008C
SC-426B
LG53
-- GI2.1s
21.6"--
6 . 6 ~ -- 119.3s 4,3-- ~ CD06658
MI8.3S
20.3"-
• ~ AS.7s 10.5"--
• - - C~BO'Z2C 15.2--
- - J17.1s
HOMOLOGY GROUP 5 LG 19
6 . 0 " [-" CSRO46B 3,9"~." -- CSR035A lo.o--- ~ C,.~'063D
KI0.I$
20.6"--
4.5"~ - - T18.2s 5 3 - - ~ N12.1s 2.8"-~.' - - R14.2s 4.2 -~. TM FI.2s 9 . 5 ~ %" CSR160A 4,7--: - - D16.3S 2.8...-~." - - F4.6s
~" G4.1s 10.3--- - - P6.1s
LG32
4 3 ~ ~ - 4 ~ _ . _
8"5 . ~ ~,~ulzA
• 1 1 " - UMCO~B 11.3,"--J~__ RZ004A
LG4
15.5"--"
• ~ E16,3s 16.1--
8,7-- -- UMC049B
8.s-- - N2.1s
1 . 4 . ~ • 111.Is 1.4 "$5.1s 2.8 • DS.2s 0,0 • J13,2s 7.5 • O7.2s
• P2.2s
LG 25
• - - SG224A 14.5'~
" - - J18.1s 1 8 , 0 " -
" -- 110.2s 10.0--- 4.2"-~." -- CS~133B
-- CS~06,3A 1 1 . 4 - ' -
" -- UMC049A 13.1~
6.4m ~ U3.1S 6.4m ~ G17.3s 7.1_,. ~ ~ L9.1s 4.5-- n B1,1s
- - A t . S S
19.0-"
m BCI098A
LG38
-- UMC044B
30.1--
" -- 119.7s
!4.5---
1'4J_ ~" CSR035C 9~J - ; ~" CSR ~25B 12.~_ " ~ 120. Is
26.0'--~ N10,1s I~--" CSC041A
HOMOLOGY GROUP 6 LG 26 LG 37
4 2-- 'R"-- CSRQO8D 71 " ~ CSRO29B
n'n.,,,'-l'k¢" BC 1 7 1 6 B . N _ _ L19. IS ~ 721 ] ' - - ~~---'11 ~ CD 1380B AIS:Is
8 7--Jl • ~ l l "U- - CD1056B "U-- B18,2$
LG54 LG 58
" ~ O15.1s " ~ K11.2.s
" 11 '7'°-II C$C024B A = ~ ' I t ' - M18.6s
" ' = M16.4s 5.7 ~01.~ 8.8 ~ . j ~ CD1380D
LG 28
- - R19.1s
24.9"--
5 . 8 " -- KIO.4s 8.7"-'-:" -- A7.3s
9.3_.~" -- R2,1s " -- CSR0858
9 , 3 ~ " ~ UMC047B
14.5---
CSRI33A
25.2--
~ g17..3s 13,8-"
• n g17,4s 1 0 , 2 - -
• - - 18.2s 11.7--
• ~ H I | . l s 9 . 9 ~ 5.8"--: -- F4.SS
- - G4.3S
LG 61
8.3 " ~ G|7.1s ^ ~*tt--" L20.2s
o.,~ :hE- TI6.2S
9 ' 9 - - ' U - - CSRO85A
LG 48
I 0' I m J J " - CD1380A
LG 49
6.6 . ~ CSR29A
T CSC42A.1
171
172
H O M O L O G Y GROUP 7
LG45 LGSI
0.0 . ~ C~oC037A.1 ~ j . CSC037A.2
H O M O L O G Y GROUP 8
LG 15
- -- CSC005A 10.7--"
" -- $C-004A 10.4-'-
" -- BNL911B 9 , 7 ~
-- CSR015A
16.5-'-
-- SG099A
36.7--
-- ~ 7 B
LG 22
14.1~L H4.1s
8 2~"~" C.SC005B 2'2--::I:L'- CSC024A ' II ~ CD1345C
24. I ~ I I
"U" SGO~B
H O M O L O G Y UNASSIGNED LG 39 LG 47 LG 52 LG 55
~r-oi,.8 = . l - i f ~ - CDO385B I H P9,2s
~ ~60 ~62
17. ' i ~ SG021A SGI40A °1'6--"[I
-b'--- K11.Is
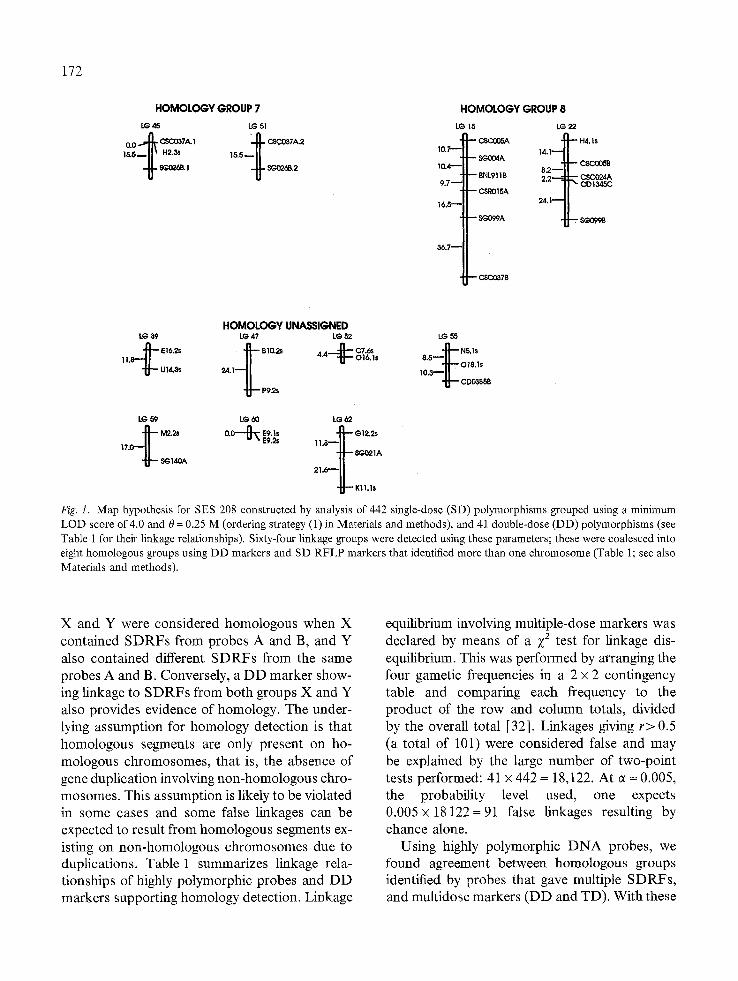
Fig. 1. Map hypothesis for SES 208 constructed by analysis of 442 single-dose (SD) polymorphisms grouped using a minimum LOD score of 4.0 and 0 = 0.25 M (ordering strategy (1) in Materials and methods), and 41 double-dose (DD) polymorphisms (see Table 1 for their linkage relationships). Sixty-four linkage groups were detected using these parameters; these were coalesced into eight homologous groups using DD markers and SD RFLP markers that identified more than one chromosome (Table 1; see also Materials and methods).
X and Y were considered homologous when X contained SDRFs from probes A and B, and Y also contained different SDRFs from the same probes A and B. Conversely, a DD marker show- ing linkage to SDRFs from both groups X and Y also provides evidence of homology. The under- lying assumption for homology detection is that homologous segments are only present on ho- mologous chromosomes, that is, the absence of gene duplication involving non-homologous chro- mosomes. This assumption is likely to be violated in some cases and some false linkages can be expected to result from homologous segments ex- isting on non-homologous chromosomes due to duplications. Table 1 summarizes linkage rela- tionships of highly polymorphic probes and DD markers supporting homology detection. Linkage
equilibrium involving multiple-dose markers was declared by means of a X 2 test for linkage dis- equilibrium. This was performed by arranging the four gametic frequencies in a 2 x 2 contingency table and comparing each frequency to the product of the row and column totals, divided by the overall total [32]. Linkages giving r>0 .5 (a total of 101) were considered false and may be explained by the large number of two-point tests performed: 41 x 442 -- 18,122. At c~ = 0.005, the probability level used, one expects 0.005 x 18 122 = 91 false linkages resulting by chance alone.
Using highly polymorphic D N A probes, we found agreement between homologous groups identified by probes that gave multiple SDRFs, and multidosc markers (DD and TD). With these
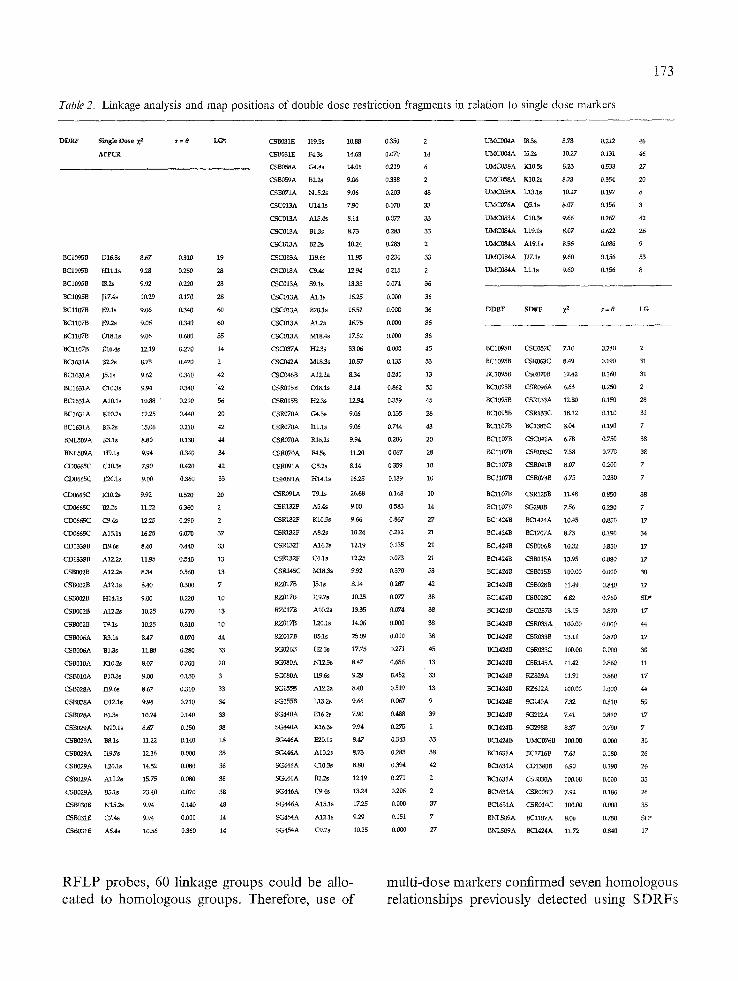
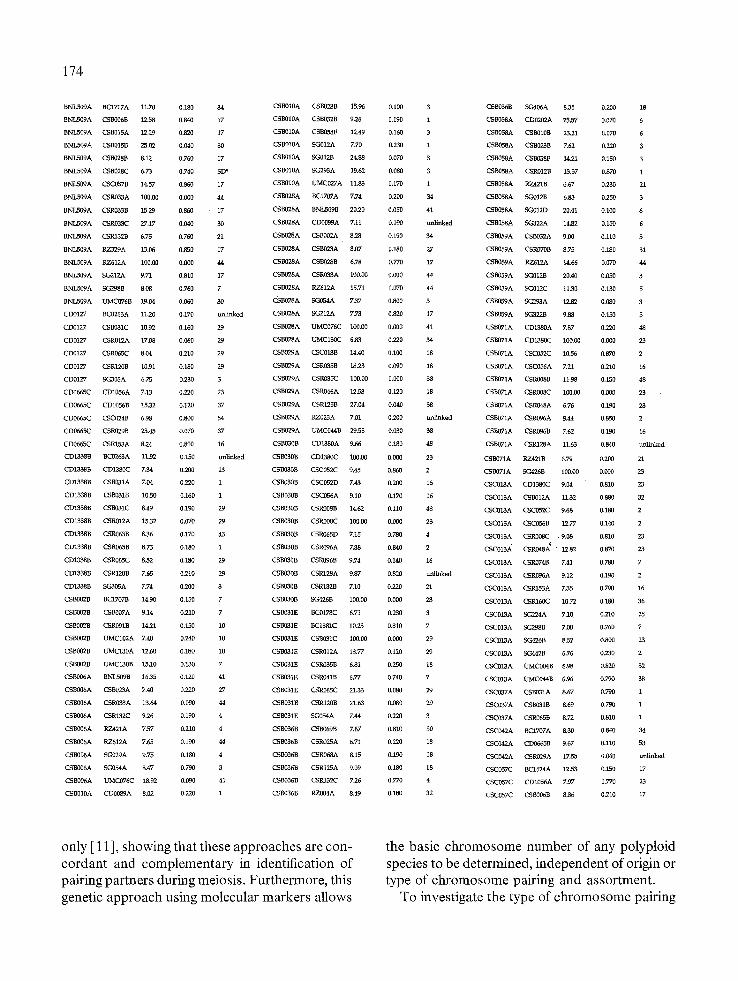
Table 2. Linkage analysis and map positions of double dose restriction fragments in relation to single dose markers
173
DDI{F Single I~)ose ~ • = O LG u CSB03IE II9.gs 10.88 0,350 2 ~C004A 18.3s 8.73 0,212 46
APPCR CSBOSIE F4.3s 14.63 0.070 14 UMC004A 15.2s I0.27 0.131 46
CSB058A C-4As 14.06 0.219 6 UMC05SA KI0.Ss 8.23 0.833 27
CSB059A B2.28 9.06 0.338 2 LriVIC 058A KI0.28 8.73 8.354 20
CSB071A NIS.2S 9,06 0.203 48 UMC058A LI3.1s 10.27 0.197 8
CSC013A Ul4.1s 7.90 0.070 33 UMC076A Qg.ls 8.07 0.156 8
CSC013A AIS.4s 8.14 0.072 33 I/MC083A C10.85 9.66 0267 42
CSC018A B1.3S 8.73 0.283 33 IJqVIC 084A LI9.1S 8.07 0.622 26
CSCOI3A B2.2s 10.24 0.283 2 I.IIvIC084A A19,1a 8.98 0.086 9
BCi095B 19163s 8.67 0.310 19 CSC013A I19.6s 11.98 0.230 33 U/vIC0842t JlT.ls 9.60 0.156 53
BC1095B HII.ls 9.28 0.250 28 CSC013A C9.4.~ 12.94 0.215 2 T3MC084A LI.Is 9.60 0.156 8
BC1095B lS.2s 9,92 0.220 28 CSC013A S9.1s 13,35 0.074 36
BC1095B J17.4s 10,29 0.170 28 CSC013A ALls 16.25 O.000 36
BCl107B E9.1s 9.06 0.340 60 CSC013A B20.1s 16.82 0.008 36 DDRF SDRF X 2 e = 8 LG
BCll07B E92s 9.06 0.340 60 CSCOI3A A1.2a 16.75 0,000 36
BCI107B O18.Is 9.06 0.680 55 CSC013A M18.4S 17.52 0.000 36
BCll07B E16.4s 12.19 0.270 14 CSC037A H2-3~ 33.06 0.000 45 BC1095B CSC082C 7,10 0.240 2
BC1631A 132.2s 8.73 0.420 2 CSC042A M18.3s 10.57 0,135 53 BC1095B CSR063C 8,49 0.190 31
BC1631A JS.ls 9.62 0.360 42 CSC046B A12.2a 824 0,241 13 BC1095B CSR070B 12,42 0.160 31
BC1631A C10.3s 9.94 0.340 42 CSR015B O18.1s 8.14 0.862 55 BC1095B CSR096A 6,63 0,250 2
BC1651A A10,1s 10.88 0.210 36 CSR015B H2-3s 12.94 0,359 45 BC1095B CSR133A 12.80 0150 28
BC1631A K10.2s 12.25 0.440 20 CSR070A G4.3s 9.06 0,135 28 BC1095B CSR133C 18.12 0.110 31
BC1631A R3.2s 15.06 0.210 ~2 CSR070A Il l . Is 9.06 0,744 43 BCl1078 BC1381C 8,04 0.190 7
BNLS09A R3.1s 8.80 0.130 44 CSR070A R16.2s 9.94 0.206 20 BC1107B CSC041A 6.78 0~750 38
BNLS09A H�.ls 9.94 0.340 34 CSR070A F4.Ss 11.20 0,067 28 BCll07B CSR035C 7.38 0,770 38
CD0665C C10,3s 7.90 0,420 42 CSF,091A Q5.2s 8.14 0.359 10 BC1107B CSR041B 8.07 0,200 7
CD0665e E20.1s 9.00 0-360 33 CSR091A i-II&ls 16.25 0.139 10 BClI07B CSR074B 6.78 0,230 7
CD0665C K102s 9.92 0.520 20 CSRO91A T�.Is 26.68 0.148 10 BCllOTB CSR125B 11.45 0,850 38
CD0665C B2.2B 11.2/ 0.360 2 CSR132F A5.4S 9.00 0.58.3 14 BCII07B SG298B 7.56 0.230 7
CD0665C C9.4s 12.25 0.290 2 CSR132F KI0.5s 9.66 0.867 27 BCI424B BCI424A 10.45 0.850 17
CD0665C AI5.1S 16.25 0,070 37 CSRI321 ~ Ag.2s 10.24 0.212 21 BCI424B BCI707A 8.73 0.190 34
CDI338B 119.6s 8,40 0.440 33 CSK132F kl4.2s i2,19 0,135 21 BC1424B CSB006B 10,32 0.850 17
CD1338B A12.2a 11.95 0.540 13 CSR132F C4.1a 12.25 0,073 21 BC1424B CSB015A i3.95 0.880 17
CSBO02B A122a 8.34 0.560 13 CSR145C M18.gs 9.92 0.370 53 BC1424B CSB018B 100,00 0.000 80
CSB002B A12.1s 8,40 0.300 7 RZ017B JS.ls 8,14 0,287 42 BC1424B CSB028B 11.49 0.840 17
CSBO02B H14.1s 9.00 0.220 10 RZ017B I19,7s 102.5 0.077 38 BC1424B CSB028C 6,82 0.760 SD*
CSB002B A12.2s 10.25 0.770 13 RZ017B AI0.2s 13-35 0.074 38 BC1424B CSC087B I3,19 0.870 17
CSB002B T�.ls 10.25 0.310 10 RZ017B L20.ls 1&06 0.000 38 BC1424B CSR033A 100.00 0.0~0 44
CSB006A R3.1s &47 0.070 44 RZ017B Bg,ls 25.09 0.000 38 BCI424B CSROS~B 13.11 0.870 17
CSB006A B1.3B 11.88 0.280 33 SG026B H2.3s 17.75 0.271 45 BC1424B CSR033C 100.00 0,800 30
CSB010A K10.2S 8,07 0,700 20 SC~80A N12-3s 8.47 0,686 13 BC1424B CSR145A ILa-2 0.860 11
CSB010A B10.3s 9.00 0.150 3 SG080A I19.6s 9.29 0.452 33 BC1424B F, Z329A 11,91 0,860 17
CSB028A I19.6s 8.67 0.310 33 SG155B A12.2a 8.40 0.519 13 BC1424B F, ZS12A 100.00 0.000 44
CSB028A O12.1s 9.94 0210 34 SG158B L13,2s 9,66 0.067 9 BC1424B ~cG140A 7.52 0.810 59
CSB028A BL3S 10,24 0.140 33 SG440A E16.2s 7.90 0.488 39 BC1424B SG212A 7.41 0.810 17
CSBO29A N10.1s 8.67 0.150 38 SG440A K16,3s 9.94 0.275 i BC1424B ~3298B 8~7 0,790 7
CSBO29A Bg.ls 11.22 0.140 18 SG446A E20.1s 8.47 0,343 33 BC1424B UMC076B 100,00 0.000 30
CSB029A I19,7s 12,36 0.000 38 SG446A A102s 8.73 0.283 38 BC1631A ~C1716B 7.63 0.180 26
CSB029A L20.1s 14.52 0.080 38 SG446A C10.3s 8.80 0.394 42 BC1631A CDI380B 6.90 0.I90 26
CSB029A A10.2s 15.75 0,080 38 SG446A BZ2s 12.19 0.271 2 BC1631A CSI~030A 100.00 0.000 35
CSB029A BS,IB 23.40 0.070 38 SG446A C9,4s 13.24 0~206 2 BC1631A CSR008D 7.92 0.180 26
CSB030B N151s 9.94 0.140 48 SG446A A15,Is 17.25 0.000 37 BC1631A CSR014C 100.00 0.000 35
CSB031E C7As 9.94 0.0DO 14 SG454A A12.1s 9,29 0.151 7 BNrLS09A BCll07A 8.05 0,750 SD*
CSB031E Ag.4s 10.56 0.360 14 SG454A C9.2s 10.25 0.000 27 BNXS09A BC1424A 11.72 0.840 17
RFLP probes, 60 linkage groups could be allo- cated to homologous groups. Therefore, use of
multi-dose markers confirmed seven homologous relationships previously detected using SDRFs
174
BNLS09A BC1707A 11-70 0.180 34 CSB010A CSB023B 15.96 0.100 3
BNLS09A CSB006B 12.58 0.840 17 CSB010A CSB032B 9.26 0.190 1
BNL509A CSB015A 12.29 0.820 17 CSB010A CSB058F 12.49 0.160 5
BNLS09A CSB015B 25.02 0.040 30 CSB010A SGO12A 7.70 0.230 1
BNL509A CSB028B 8.12 0.760 17 CSB010A SG012B 24.88 0.070 8
BNLS09A CSB028C 6 ,~ 0.740 SD* CSBO10A SG293A 19.62 0.080 3
BNI~D9A CSC057B 14.57 0.860 17 CSB010A UMC027A 11,83 0.170 1
BNLS09A CSR033A 100.00 0.000 44 CSB028A BC1707A 7.74 0,200 34
BNLS09A CSR033B 15.29 0.860 17 CSB028A BNLS09B 20.20 0.050 41
BNLS09A CSR033C 27.17 0.040 ,50 CSB028A CD0099A 7.11 0 . 1 9 0 unlinked
BNLS09A CSR132B 6.75 0.760 21 CSB028A CSB002A 8.28 0190 34
BNLS09A RT~29A 13.06 0.850 17 CSB028A CSB023A 8,07 0.180 27
BNLS09A RZ612A 100.00 0.000 44 CSB028A CSB028B 6.78 0.770 17
BNTuS09A SG212A 9.71 0.810 17 CSB028A CSR033A 100.00 0.000 44
BNLS09A SG2985 8.08 0.760 7 CSB028A RZ612A 15.71 0.070 44
BNLS09A UMC076B 19,04 0.060 80 CSB028A SG054A 7.37 0.800 3
CD0127 BC0263A 11,20 0 . 1 7 0 unllnked CSB028A ~212A Z73 0.820 17
CD0127 CSB031C 10,92 0.160 29 CSB028A UMC076C 100.00 0.000 41
CD0127 CSR012A 17.08 0.060 29 CSB028A UMC130C 6.83 0.220 34
CD0127 CSR065C 8.04 0.210 29 CSB029A CSC013B 14.40 0.100 18
CD0127 CSR120B 10.91 0.180 29 CSB029A CSR035B 18.23 0.090 18
CD0127 SG305A 6.75 0.230 3 CSB029A CSR035C 100.00 0.000 38
CD0665C CD1056A 7.15 0,220 23 CSB029A CSR046A 12.53 0.120 18
CD0665C CD1056B 15.32 0.120 37 CSBO29A CSR125B 27.04 0.040 88
CD0665C CSC024B 6.98 0.800 54 CSB029A RZ023A 7.01 0 .200 unlinked
CD0665C CSR029B 23.45 0.070 87 CSB029A UMC044B 29,58 0.030 38
CD0665C CSR180A 8.24 0,800 16 CSB030B CD1380A 9.66 0.180 48
CD13885 BC0263A 11.92 0 . 1 5 0 unlinked CSB030B CD1380C 100.00 0.000 23
CD13385 C01380C 7.34 0.200 28 CSB080B CSC052C 9.45 0.860 2
C013385 CSB031A 7,04 0.220 1 CSB030B CSC0520 7.43 0.200 16
CD1338B CSB031B 10.50 0.160 1 CSB030B CSC056A 9.10 0.170 16
CD1338B CSB081C 8,49 0.190 29 CSB030B CSR008B 14.62 0.110 48
CD1338B CSR012A 152,2 0.070 29 CSB030B CSR008C 100.00 0.000 23
C013385 CSR063B 8.36 0.170 43 CSB030B CSR065D 7.15 0.780 4
CD13385 CSR065B 8.73 0.180 1 CSB030B CSR(]96A 7.38 0.840 2
CD1338B CSR065C 8.52 0.180 29 CSB030B CSR096B 9,74 0.140 16
CD1338B CSR120B 7.65 0.210 29 CSB030B CSR128A 9.87 0 . 8 2 0 unlinked
C013385 SC~05A 7.74 0.200 8 CSB030B CSR132B 7.10 0.220 21
CSB002B BC17075 14.90 0,150 7 CSB030B SG4265 100.00 0.000 2,3
CSB002B CSB007A 9.14 0.210 7 CSB031E BC0178C 6.71 0.230 3
CSB002B CSR091B 14.21 0150 10 CSB031E BC1381C 10/3 0.810 7
CSB002B UMC102A 7.40 0.240 10 CSB031E CSB031C 100.00 0.000 29
CSB002B UMC130A 12.60 0.180 10 CSB0,31E CSR012A 13.77 0,120 29
CSB002B UMC180B 15.10 0.130 7 CSB031E CSR035B 6.81 0.250 18
CSB006A BNLS09B 16.85 0.120 41 CSB031E CSR041B 6.77 0,740 7
CSB006A CSB023A 7.40 0.220 27 CSB031E CSR065C 21.33 0.080 29
CSB006A CSR033A 13.64 0.090 44 CSB031E CSR120B 21.60 0.080 29
CSB006A CSR132C 9.26 0.190 4 CSB031E SCA154A 7.44 0.220 3
CSB006A RZ421A 7.57 0,210 4 CSB086B CSB069B 7.67 0,810 50
CSB006A RZ612A 7.65 0.190 44 CSB036B CSR025A 6,71 0.220 18
CSB006A SG029A 9.75 0.180 4 CSB036B CSR068A 8.15 0.190 18
CSB006A SG054A 8.47 0.790 3 CSB0368 CSR125A 9.09 0.180 18
CSB006A UMC076C 18.92 0.090 41 CS1B036B CSR182C 7.26 0.770 4
CSB010A CD0089A 8.02 0.220 1 CSB036B RZ004A 8.49 0.180 82
C.5B036B 5C~406A 82,8 0.200 18
CSB058A CD0202A 25,57 0.070 6
CSB05BA CSB010B 23,21 0.070 6
C55058A CSB023B 7.62 0.220 3
CSB058A CSB058F 14.21 0.150 3
CSB058A CSR012B 13.57 0.870 1
CSB058A RZ421B 6.67 0.250 21
CSB058A SC-012B 6.83 0.250 8
CSB058A SG012D 20.41 0.100 6
CSB058A SG322A 14.82 0.150 6
CSB059A CSB032A 9.00 0.110 5
CSB059A CSR070B 8,75 0.180 31
CSB(159A RZ612A 14.66 0.070 44
CSB059A SG012B 20.40 0.0,50 3
CSB059A SG012C 11.30 0.130 5
CSB059A SG293A 12.82 0.080 3
CSB059A SG322B 9.88 0.150 5
CSB071A CD1380A 7.87 0.220 48
CSB071A CDI~0C i00.00 0.000 23
CSB071A CSC052C 10.56 0.870 2
CSB071A CSC056A 7.21 0.210 16
CSB071A CSR008B 11.98 0.150 48
CSB071A CSR008C 103.00 0.000 23
CSBO71A CSR048A 6.76 0.190 23
CSB071A CSR096A 8,44 0.850 2
CSB071A CSR096B 7.62 0.190 16
CSB071A CSR128A 11.63 0.840 unlinked
CSB071A RZ421B 6.79 0.200 21
CSB071A SG4265 100.00 0.000 23
CSC013A CD1380C 9.04 0.810 23
CSC013A CSB012A 112,2 0.880 82
CSCO13A CSC052C 9.68 0,180 2
CSC010A CSC056B 12.77 0.140 2
CSC013A CSR008C • 9.08 0.810 20
CSC018d c s R o 4 8 . ~ 12.82 0.870 23
CSC013A CSR074B 7.41 0.780 7
CSC018A CSR096A 9.12 0.190 2
CSC013A CSR153A 755 0.790 16
CSC013A CSR160C 10.72 0.180 36
CSC013A SG224A 7.10 0.210 25
CSC013A SG2985 ZOO 0.760 7
C,5C018A SG426B 8,52 0.800 23
CSC015A SG4425 6.76 0.200 2
C5C013A UMC004B 8,98 0.820 32
CSC018A UMC044B 6.96 0.790 38
CSC037A CSBO31A 8.67 0.790 1
CSC037A CSB031B 8,69 0,790 I
CSC037A CSR065B 8.72 0.810 1
CSC042A BC1707A 8.30 0.840 34
C$C042A CD0665B 9.67 0.110 53
CSC04/A CSR029A 17.55 0 .060 unlinked
CSC057C BC1424A 12.53 0.150 17
C8C057C CD1056A 7.97 0.770 23
CSC057C CSB006B 8.86 0.210 17
only [ 11], showing that these approaches are con- cordant and complementary in identification of pairing partners during meiosis. Furthermore, this genetic approach using molecular markers allows
the basic chromosome number of any polyploid species to be determined, independent of origin or type of chromosome pairing and assortment.
To investigate the type of chromosome pairing
CSC057C CSB015A 12.38 0.150 15 SG155B SGOSOC 100,00 0.000 i2
C5C057C CSB028B 8,80 0.190 17 SG155B SG155A 9,61 0.870 8
CSC057C CSB028C 9,37 0,170 SD* SG1585 SG155C 9.15 0.850 8
CSC057C CSC057B 13.93 0,140 17 SG1555 SG161A 10.05 0.170 9
CSC057C C.SR033A 10.99 0.140 44 SG155B SG370C 6.69 0.750 13
CSC057C C8R0335 10.27 0.190 17 SG155B UMC049A 1131 0.160 25
C5C057C CSR132E 10.27 0.190 17 SG1555 UMC128A 17.04 0.100 9
CSC057C RZ329A 13.58 0.140 17 SG1555 L1MC147A 8.91 0.180 9
CSC057C RZ612A 6.63 0.240 44 SC-426A CD1380D 6.86 0.270 58
CSR015B CSC024B 11.69 0190 54 SG426A CSR132E 102.5 0.210 17
CSR015B CSC049A 6,64 0.750 10 SG426A SG012B 7.55 0.260 3
CSR015B CSR008C 7.61 0.250 23 SG426A UMC049B 7.72 0,240 43
CSR015B CSR029A 7.08 0 . 2 6 0 unlinked SC-440A CD0089A 16.18 0150 1
CSR015B CSR065B 7.51 0.760 1 SC4i40A CD0099A 6.64 0 . 7 3 0 tmllnked
CSR015B CSR074C 6,87 0.750 10 SG440A C00202A 11.47 0,200 6
CSR015B SCM26B 8.83 0.220 23 SG440A CD0202B 30.01 0,060 1
CSR070A CSR012C 6.84 0.210 40 SG440A CD1345A 8.05 0,760 2
CSR070A CSR041B 11,19 0.840 7 SG440A CSB010B 17.10 0.140 6
CSR070A SG2985 13.02 0.870 7 SC440A CSB032B 22.83 0.080 1
CSR070A UMC049A 9.89 0,150 25 SG440A CSR033A ii.63 0.790 44
CSR070A UMC049B 7.99 0.830 43 SG,440A CSR065D 72,7 0.740 4
CSR091A CD1080D 9.73 0.810 58 SG440A CSR153C 23.11 0.080 1
CSR091A CSB007C 7.39 0.240 27 SC-440A RZ612A 7.42 0.750 44
CSR091A CSB007D 12.04 0.200 10 SC440A SC4)12A 22.83 0.100 1
CSR091A eSR091B 100,00 0,000 10 SG440A SC-012D 18.84 0,130 6
CSR091A SG224A 7.81 0.740 25 SG440A SG3025 16.47 0,150 I
CSR091A UMCI02A 26.1~ 0.080 10 SG440A SG322A 16.82 0.140 6
CSR091A UIvIC130A 31.95 0.050 10 SC-440A UMC027A 1513 0.150 1
CSR152F CSR152B 39.80 0.020 21 SG446A CD06685 7.29 0.780 53
CSR132P CSR132D 37.56 0.030 21 SG446A CD1056A 8,43 0,190 23
CSRI32F RZ017C 9.29 0.220 11 SG446A C01056B 15.15 0.I30 37
CSR132F R Z 4 2 1 B 100,00 0.000 21 SG446A CSB018B 6,67 0.230 30
CSRI32F SG030A 7.28 0.250 11 SC-446A CSC024B 9.09 0,860 54
CSP,/32F SG1SSD 7.79 0.240 11 SG446A CSR012B 8.40 0.200 1
CSR145C CD0665B 8.03 0.210 53 SC-446A CSR029A I1.88 0 , 8 6 0 tm[inked
CSR145C CSR041A 7.53 0.750 20 SC,446A CSR029B 27.99 0.030 37
RZ017B CSROSSC 100.00 0,000 38 SCM46A C S ~ 7,94 0,210 30
RZ017B CSR125A 100.00 0.000 15 SC454A BC1051A 8.21 0,190 11
RZ017B CSR125B 100,08 0.000 38 SG454A BC1643A 8,40 0.160 11
RZ017B SG140A 7.63 0.810 59 SG454A BC17075 12.91 0.140 7
RZ017B SG406A 15.71 0.070 18 SC454A CSB007A 9.20 0,180 7
RZ017E UMC044B 12.68 0,140 38 SG454A CSB007C 15.43 0.070 27
SG0265 CSR091B 9.36 0.780 10 SG454A CSB023A 19.06 9.080 27
SG026B SC-021A 835 0.760 62 SC454A CSR091C 19.83 0.050 27
SGO80A F, C0263A 8.51 0 ,200 unllnked SG454A CSR128A 6.91 0 . 2 1 0 unlinked
SG080A CSR128B 7.58 0,230 2 SG454A RZ017C 10,20 0.150 11
SG080A SC,030B 15.52 0.130 9 SG454A RZ023A 7.60 0 .790 unlinked
SG080A SC,030C 7.97 0.210 12 SG454A SG030A 6.64 0.210 11
SG080A SG161A 6.69 0.240 9 SG454A SG1550 7.85 0.200 11
SG080A UMC147A 6.72 0,250 9 SG454A UMCI28A 7,55 0.790 9
SG155B BC1643B 10.17 0.170 12 SC~4~A T,TMC~30B 10.37 0.160 7
SG1555 CD0087A 12.07 0.180 12 UMC004.A CSR033A 6.~t 0.220 44
SG1555 CD0087B 12.10 0.160 9 UMC004A CSR063B 9.53 0.200 43
SG1555 SG030B 24.05 0.040 9 UMC004A UMC00~B 7.88 0,770 32
I/MC004A UMC045A 13.66 0.160 46
UMC058A BC0178A 834 0,850 64
UMC058A SG029B 8.12 0.180 8
UMC058A SGISSA 767 0.190 8
UIvIC058A SG212A 8,41 0.160 17
UMC076A BCI424A 8,78 0.180 17
UIvIC076A CDI056B 6.93 0.800 37
UMC076A CSB006B 10.62 0.160 17
UMC076A CSB015A 7.45 0.190 17
UMC076A CSB028B 7.43 0,200 17
IJqVIC076A CSB058F 10.55 0.160 3
UMC076A CSR033A 9.58 0.120 44
UMC076A CSR033B 8.78 0.180 17
UMC076A CSR132E 9.82 0.170 17
UMC076A RZ329A 10,22 0.160 17
UMC076A I~.Z612.A 16.31 0.060
UMC076A SG442A 7.43 0.790 16
UMC083A CSRIN6A 7.31 0,209 18
UMC083A SC~30A 8.74 0.160 11
UMC084A CD0087B 7.85 0,180 9
UMC084A C75B022C 7.25 0.180 53
UMC084A CSR008D 9.10 0,820 26
LTMC084A 9;3155,4. 8.90 0.170 8
UMC084A SG155C 12.11 0.140 8
UMC084A LvMCI47A 14.59 0.070 9
175
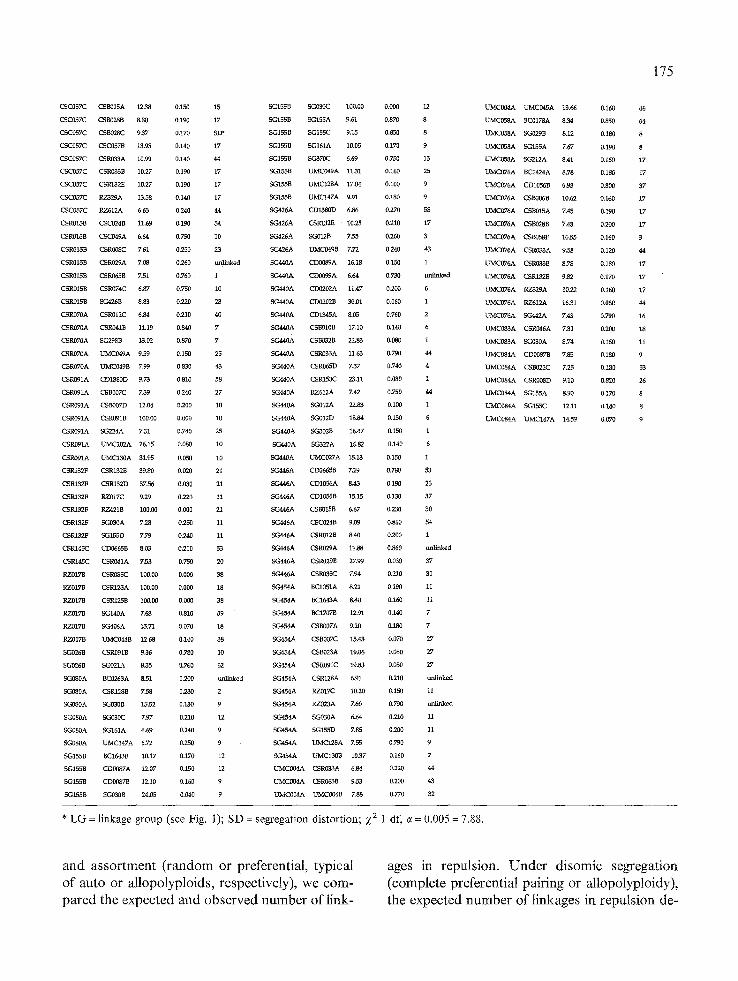
* L G = linkage g roup (see Fig. 1); S D = segregat ion dis tor t ion; )~2 1 df, e = 0.005 = 7.88.
and assortment (random or preferential, typical of auto or allopolyploids, respectively), we com- pared the expected and observed number of link-
ages in repulsion. Under disomic segregation (complete preferential pairing or allopolyploidy), the expected number of linkages in repulsion de-
176
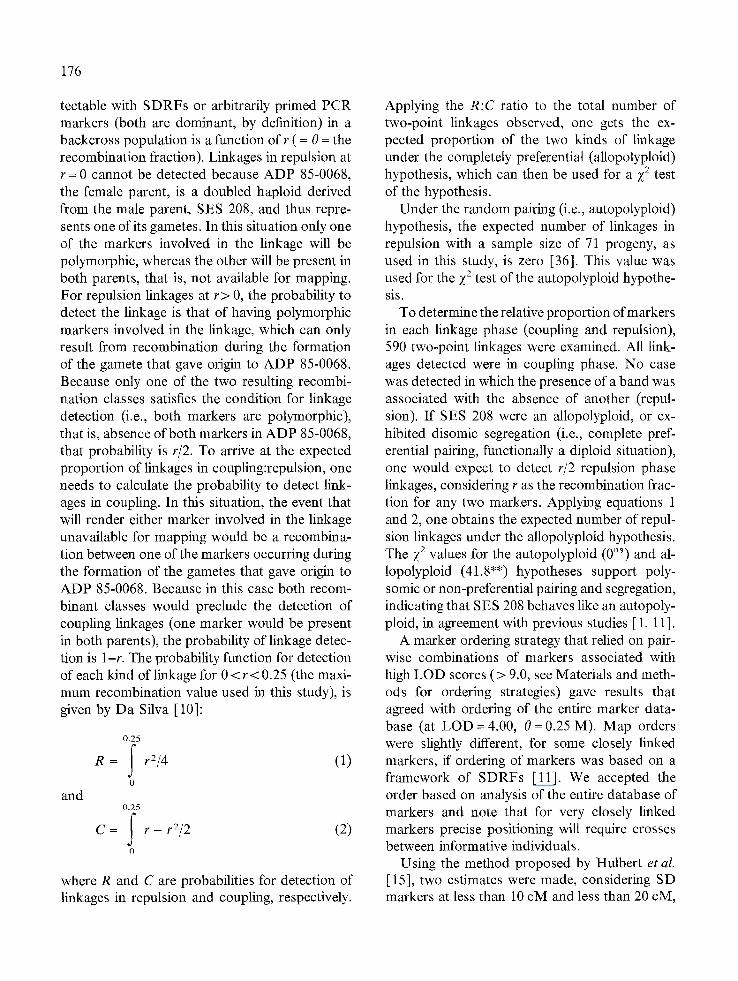
tectable with SDRFs or arbitrarily primed PCR markers (both are dominant, by definition) in a backcross population is a function of r ( = 0 = the recombination fraction). Linkages in repulsion at r = 0 cannot be detected because ADP 85-0068, the female parent, is a doubled haploid derived from the male parent, SES 208, and thus repre- sents one of its gametes. In this situation only one of the markers involved in the linkage will be polymorphic, whereas the other will be present in both parents, that is, not available for mapping. For repulsion linkages at r > 0, the probability to detect the linkage is that of having polymorphic markers involved in the linkage, which can only result from recombination during the formation of the gamete that gave origin to ADP 85-0068. Because only one of the two resulting recombi- nation classes satisfies the condition for linkage detection (i.e., both markers are polymorphic), that is, absence of both markers in ADP 85-0068, that probability is r/2. To arrive at the expected proportion of linkages in coupling:repulsion, one needs to calculate the probability to detect link- ages in coupling. In this situation, the event that will render either marker involved in the linkage unavailable for mapping would be a recombina- tion between one of the markers occurring during the formation of the gametes that gave origin to ADP 85-0068. Because in this case both recom- binant classes would preclude the detection of coupling linkages (one marker would be present in both parents), the probability of linkage detec- tion is 1-r. The probability function for detection of each kind of linkage for 0 < r < 0.25 (the maxi- mum recombination value used in this study), is given by Da Silva [10]:
and
0.25
R = f r2/4 ( 1 )
o
0.25
C= f r - r2/2 (2)
0
where R and C are probabilities for detection of linkages in repulsion and coupling, respectively.
Applying the R:C ratio to the total number of two-point linkages observed, one gets the ex- pected proportion of the two kinds of linkage under the completely preferential (allopolyploid) hypothesis, which can then be used for a Z 2 test of the hypothesis.
Under the random pairing (i.e., autopolyploid) hypothesis, the expected number of linkages in repulsion with a sample size of 71 progeny, as used in this study, is zero [36]. This value was used for the Z 2 test of the autopolyploid hypothe- sis.
To determine the relative proportion of markers in each linkage phase (coupling and repulsion), 590 two-point linkages were examined. All link- ages detected were in coupling phase. No case was detected in which the presence of a band was associated with the absence of another (repul- sion). If SES 208 were an allopolyploid, or ex- hibited disomic segregation (i.e., complete pref- erential pairing, functionally a diploid situation), one would expect to detect r/2 repulsion phase linkages, considering r as the recombination frac- tion for any two markers. Applying equations 1 and 2, one obtains the expected number of repul- sion linkages under the allopolyploid hypothesis. The Z 2 values for the autopolyploid (0 ns) and al- lopolyploid (41.8"*) hypotheses support poly- somic or non-preferential pairing and segregation, indicating that SES 208 behaves like an autopoly- ploid, in agreement with previous studies [ 1, 11 ].
A marker ordering strategy that relied on pair- wise combinations of markers associated with high LOD scores (> 9.0, see Materials and meth- ods for ordering strategies) gave results that agreed with ordering of the entire marker data- base (at LOD = 4.00, 0 = 0.25 M). Map orders were slightly different, for some closely linked markers, if ordering of markers was based on a framework of SDRFs [11]. We accepted the order based on analysis of the entire database of markers and note that for very closely linked markers precise positioning will require crosses between informative individuals.
Using the method proposed by Hulbert et al. [15], two estimates were made, considering SD markers at less than 10 cM and less than 20 cM,
to calculate the size of the genome. The average estimate was 6600 cM, but because we did not detect linkages in repulsion, this figure should be divided by two, giving an average estimate of 3300 cM. Applying the equations proposed by Bishop et al. [3] to our cross population, consid- ering 64 chromosomes with 442 mapped single- dose markers, a genome of size 3300 cM, and setting 'x' to 25 cM (one marker at every 25 cM in the genome), the expected proportion of the genome covered by single-dose markers was 93 ~o.
Considering the estimated genome size, this S. spontaneum linkage map had on average one marker every 6 cM. However, four gaps between 30 and 38 cM are still present on the map. The chance of each 30 cM gap is 0.991527 = 0.008, as- suming that marker placement in the genome is random and using the binomial distribution. If we multiply this chance by (527-30 = 497), we get four, which is the total number of adjacent 30 cM gaps we expect. Therefore, the number of ob- served gaps is as expected under non-preferential placement of markers throughout the genome and binomial distribution. Techniques that allow saturation of selected regions of the genome [13, 19] may be used to saturate these regions.
From an evolutionary perspective, detailed study of the SES 208 map, along with cytologi- cal observations, allowed inference of basic chro- mosome number and type of chromosome pair- ing and assortment. The potential importance of autopolyploidization in plant evolution has only recently been appreciated [27]. However, we are uncertain to what extent the nature of this cross has influenced our conclusions and a further assessment of S. spontaneum crosses is war- ranted. Furthermore, the S. officinarum-S, robus- turn genotypes of Saccharum may display dif- ferent chromosomal behavior at meiosis and possibly even a different basic chromosome complement [2].
Finally, from the breeder's perspective, modern sugarcane breeding progeny are usually three to four generations removed from the seminal inter- specific hybridizations between S. spontaneum (rarely S. robustum) and S. officinarum in Java. In these controlled crosses, it is possible that both
177
preferential and random pairing occurs. One might speculate that in such hybrids chromo- somes might pair randomly with other chromo- somes from the same genome but not at all with chromosomes from the other genome, although they are in the same nucleus. Genetic control of bivalent pairing may be important to increase via- bility of hybrid offspring during the evolution of the Saccharum polyploid complex. However, dur- ing breeding, progeny of interspecific crosses might be selected based on the presence or ab- sence of certain chromosomes, as aneuploidy is commonly observed in artificial hybrids [7].
Acknowledgements
This work is dedicated to The Clear Perception, in memoriam: thank you for showing happiness in your every smile and may we remain forever chil- dren and forever have ever-clearing perceptions of the world that surrounds us.
This work was sponsored by grants from the International Consortium for Sugarcane Biotech- nology to B.W.S.S. and M.S. The rave data used to construct this map have been deposited in the GrainGenes cereal database and are available on Internet. We thank numerous friends that have contributed to this work, in particular Jean- Claude Glaszmann (CIRAD, Montpellier) for fruitful discussions, Gavin Sills (CIBR, La Jolla) and Michael McClelland (CIBR, La Jolla) for critical comments.
References
1. A1-Janabi SM, Honeycutt RJ, McClelland M, Sobral BWS: A genetic linkage map of Saccharum spontaneum (L.) 'SES 208'. Genetics 134:1249-1260 (1993).
2. A1-Janabi SM, Honeycutt RJ, Sobral BWS: Chromo- some assortment in Saccharum. Theor Appl Genet 89: 959-963 (1994).
3. Bishop DT, Cmmings C, Skolnick M, Williamson JA: The number of polymorphic clones required to map the human genome. In: Weir BS (ed) Statistical Analysis of DNA Sequence Data, pp. 181-200 (1983).
178
4. Bonierbale MW, Plalsted RL, Tanksley SD: RFLP maps based on a common set of clones reveal modes of chro- mosomal evolution in potato and tomato. Genetics 120: 1095-1103 (1988).
5. Botstein D, White RL, Skolnick M, Davis RW: Con- struction of a genetic linkage map in man using restriction fragment length polymorphisms. Am J Hum Genet 32: 314-331 (1980).
6. Bridges W, Sobral BWS: A genealogical approach to identification of quantitative trait loci in plants. In: Sobral, BWS (ed) The Impact of Plant Molecular Genetics. Birkh/iuser, Boston, in press (1996).
7. Burner DM, Legendre BL: Chromosome transmission and meiotic stability of sugarcane (Saccharum spp.) hy- brid derivatives. Crop Scil 33:600-606 (1993).
8. Burnquist WB: Development and application of restric- tion fragment length polymorphism technology in sugar- cane (Saccharum spp.) breeding. Ph.D. dissertation, Cor- nell University, Ithaca, NY (1991).
9. Burr BJ, Evola SV, Burr FA, Beckmann JS: The appli- cation of restriction fragment length polymorphism to plant breeding In: Setlow JK, Hollaender A (eds) Genetic Engineering, vol. 5, pp. 45-59. Plenum Press, New York (1983).
10. Da Silva J: A methodology for genome mapping of auto- polyploids and its application to sugarcane (Saceharum spp.). Ph.D. dissertation, Cornell University, Ithaca, NY (1993).
11. Da Silva J, Sorrells ME, Burnquist WL, Tanksley SD: RFLP linkage map and genome analysis of Saccharum spontaneum. Genome 36:782-791 (1993).
12. Fitch MM, Moore PH: Haploid production from anther culture of Saceharum spontaneum L. Z Pflanzenphysiol S: 197-206 (1983).
13. Giovannoni J, Wing RA, Ganal MW, Tanksley SD: Iso- lation of molecular markers from specific chromosomal intervals using DNA pools from existing mapping popu- lations. Nucl Acids Res 19:6553-6551 (1991).
14. Honeycutt RJ, Sobral BWS, Keim P, Irvine JE: A rapid DNA extraction method for sugarcane and its relatives. Plant Mol Biol Rep 10:66-72 (1992).
15. Hulbert SH, Ilot TW, Legg EJ, Lincoln SE, Lander ES, Michelmore RW: Genetic analysis of the fungus Bremia lactucae using restriction fragment length polymorphisms. Genetics 120:947-958 (1987).
16. Janaki-Ammal EK: Cytogenetic analysis of Saccharum spontaneum L. 1. Chromosome studies in Indian forms. Indian J Agric Sci 6 :1-8 (1936).
17. Lander ES, Botstein D: Mapping Mendelian factors un- derlying quantitative traits using RFLP linkage maps. Ge- netics 121:185-199 (1989).
18. Lander ES, Green P, Abrahamson J, Barlow A, Daly MJ, Lincoln SE, Newburg L: Mapmaker: an interactive com- puter package for constructing primary genetic linkage maps of experimental and natural populations. Genomics 1:174-181 (1987).
19. Michelmore RW, Paran I, Kesseli RV: Identification of markers linked to disease resistance genes by bulked seg- regant analysis: a rapid method to detect markers in spe- cific genomic regions using segregating populations. Proc Natl Acad Sci USA 88:9828-9832 (1991).
20. Moore PH, Nagai C, Fitch MMM: Production and evaluation of sugarcane haploids. Proc Intl Soc Sugar Cane Technol 20:599-607 (1989).
21. O'Brien SJ: Genetic Maps: Locus Maps of Complex Ge- nomes. Cold Spring Harbor Laboratory Press, Cold Spring Harbor, NY (1990).
22. Paterson AH, Lander ES, Hewitt JD, Peterson S, Licoln SE, Tanksley SD: Resolution of quantitative traits into Mendelian factors using a complete linkage map of restriction fragment length polymorphisms. Nature 335: 721-726 (1988).
23. Ritter E, Gebhardt C, Salamini F: Estimation of recom- bination frequencies and construction of RFLP linkage maps in plants from crosses between heterozygous par- ents. Genetics 125:645-654 (1990).
24. Saiki RK, ScharfS, FaloonaF, Mullis KB, Horn GT, Erlich HA, Arnheim N: Enzymatic amplification of beta- globin genomic sequences and restriction site analysis for diagnosis of sickle cell anemia. Science 230:1350-1354 (1985).
25. Sobral BWS, Honeycutt R J: High output genetic map- ping in polyploids using PCR-generated markers. Theor Appl Genet 86:105-112 (1993).
26. Sobral BWS, Honeycutt RJ: Genetics, plants, and the polymerase chain reaction. In:. Mulli~ KB, Ferre F, Gibbs RA (eds) The Polymerase Chain Reaction, pp. 304-320. Birkhauser, Boston, MA (1994).
27. Soltis DE, Soltis PS: Molecular data and the dynamic nature of polyploidy. Crit Rev Plant Sci 12:243-273 (1993).
28. Tanksley SD: Mapping polygenes. Annu Rev Genet 27, in press (1993).
29. Templeton AR, Boerwinkle E, Sing CR: A eladistic analysis of phenotypic associations with haplotypes in- ferred from restriction endonuclease mapping. I. Basic theory and analysis of alcohol dehydrogenase activity in Drosophila. Genetics 117:343-351 (1987).
30. Templeton AR, Sing CF, Kessling A, Humphries S: A cladistic analysis of phenotypic associations with haplo- types inferred from restriction endonuclease mapping. II. The analysis of natural populations. Genetics 120:1145- 1154 (1988).
31. Templeton AR, Crandall A, Sing CF: A cladistic analysis of phenotypic associations with haplotypes inferred from restriction endonuclease mapping. III. Cladogram esti- mation. Genetics 132:619-633 (1992).
32. Weir BS: Genetic Data Analysis. Sinauer Associates, Sunderland, 377 pp (1990).
33. Welsh J, McCMland M: Fingerprinting genomes using PCR with arbitrary primers. Nucl Acids Res 18: 7213- 7218 (1990).
34. Wicking C, Williamson B: From linked markers to genes. Trends Genet 7:288-293 (1991).
35. Williams JGK, Kubelik AR, Livak KJ, Rafalski JA, Tingey SV: DNA potymorphisms amplified by arbitrary primers are useful as genetic markers. Nucl Acids Res 18: 6531-6535 (1990).
t79
36. Wu KK, Burnquist W, Sorrells ME, Tew TL, Moore PH, Tanksley SD: The detection and estimation of linkage in polyploids using single-dose restriction fragments. Theor Appl Genet 83:294-300 (1992).
Related Documents