1 Central Statistics Office Ministry of Statistics and Programme Implementation Government of India SAARC Development Goals India Country Report 2013 Statistical Appraisal

SAARC Development Goals India Country Report 20013
Oct 21, 2015
SAARC Development Goals
India Country Report 2013,Statistical Appraisal
Central Statistics Office
Ministry of Statistics and Programme Implementation, Government of India
India Country Report 2013,Statistical Appraisal
Central Statistics Office
Ministry of Statistics and Programme Implementation, Government of India
Welcome message from author
This document is posted to help you gain knowledge. Please leave a comment to let me know what you think about it! Share it to your friends and learn new things together.
Transcript
1
Central Statistics Office Ministry of Statistics and Programme Implementation
Government of India
SAARC Development Goals
India Country Report 2013
Statistical Appraisal
2
Acronyms
AIDS Acquired Immune Deficiency Syndrome BE Budget Estimates BPL Below Poverty Line CDS Current Daily Status CFCs Chloro-Fluoro-Carbons CO2 Carbon Dioxide CPCB Central Pollution Control Board CSO Central Statistics Office CWS Current Weekly Status DISE District Information System on Education DLHS District Level Household and Facility Survey GDP Gross Domestic Product GER Gross Enrolment Ratio GHG Greenhouse Gas GPI Gender Parity Index HDI Human Development Index HDR Human Development Report HIV Human Immunodeficiency Virus ICDS Integrated Child Development Scheme ICT Information & Communication Technology IDD Iodine Deficiency Disorders IMR Infant Mortality Rate ISACPA Independent South Asian Commission on Poverty Alleviation IT Information Technology kcal Kilo Calorie km Kilometre LULUCF Land-Use, Land-Use Change and Forestry MDGs Millennium Development Goals Mha Million Hectare MMR Maternal Mortality Ratio MRP Mixed Recall Period MSW Municipal Solid Waste NAAQS National Ambient Air Quality Standards NAMP National Air Quality Monitoring Programme NER Net Enrolment Ratio NFHS National Family Health Survey NSS National Sample Survey
3
NSSO National Sample Survey Office OBCs Other Backward Classes ODP Ozone Depleting Potential ODS Ozone Depleting Substance PC Personal Computer PGR Poverty Gap Ratio PHR Poverty Headcount Ratio PLHA People Living with HIV/AIDS PS Principal Status PWD Public Works Department RE Revised Estimates RGI Registrar General of India RSPM Respirable Suspended Particulate Matter SCs Scheduled Castes SPM Suspended Particulate Matter sq km Square Kilometre SRS Sample Registration System SS Subsidiary Status STs Scheduled Tribes STD Sexually Transmitted Disease TB Tuberculosis TRAI Telecom Regulatory Authority of India U5MR Under-Five Mortality Rate UN United Nations UNDP United Nations Development Programme URP Uniform Recall Period USOF Universal Service Obligation Fund UTs Union Territories WFPR Work Force Participation Rate WPR Worker Participation Rate
4
List of Tables Table 1: Incidence of Poverty Table 2: Consumption Share of the Poorest Table 3: Households benefitting from selected food assistance schemes of the Government Table 4: Percentage distribution of women and men aged 15-49 by frequency
of consumption of specific foods, 2005-06 Table 5: Central Government Expenditure (Plan and non-Plan) on Social
Services and Development Table 6: Trends in Social Services Expenditure by General Government (Central and State Governments combined) Table 7: Details of the Loan Disbursed/Beneficiaries covered under NSCFDC, NSKFDC and NBCFDC in 2012-13 (upto December 2012) Table 8: Total and Surfaced Road Length by Categories in India Table 9: Total number of registered motor vehicle in India Table10: Over all status of Broadcasting and Cable TV Services Table 11: Labour Force Participation Rate (LFPR) and Work Force
Participation Rate (WFPR) during 2011-12 Table 12: Birth Registration of Children Table 13: Proportion of Seats held by Women in National Parliament Table 14: Allocations for women as reflected in the Gender Budget Statement Table 15: Measured levels of expenditure on health in India Table 16: Proportion of households having access to improved water resources Table 17: Percentage Distribution of Households by Distance to Schools Table 18: Percentage of Ever Enrolled but Currently not Attending Persons Table 19: Percentage Distribution of Population (Age 15+) by Educational
Attainment Levels in 2007-08 Table 20: Pupil Teacher Ratio Table 21: Forest and Tree Cover of India 2007 Table 22: All-India Consumption of Fertilizers in Terms of Nutrients (N, P &K) Table 23: Change in Waste Composition in Selected Cities Table 24: Status of Municipal Solid Waste Management in Selected Metro
Cities 2004-05
5
List of Figures Figure 1: Trend in Nutritional Status of Children Figure 2: Unemployment rate over the years Figure 3: Total and surfaced road length in India Figure 4: Wireless subscriber (Million) Figure 5: Internet subscribers (Million) Figure 6: Year-wise Village Electrification Figure 7: Share of Women in Central Government Employment Figure 8: Maternal Mortality Ratio Figure 9: Reproductive Healthcare Figure 10: Life Expectancy of Women and Men in India (years) Figure 11: Trends in Vaccination Figure 12: Infant Mortality Rate Figure 13: Share of Health in General Government Expenditure Figure 14: Declining Trends of HIV Epidemics in India, 2007-2011 Figure 15: Malaria Situation in the Country Figure 16: Per cent persons never enrolled in different age-groups Figure 17: Drop-out Rates at Elementary Stage Figure 18: Adult (Age 15+) Literacy Rates in India Figure 19: Forest Cover (Sq. Km.) Figure 20: Total Forest Cover Figure 21: Proportion of households by type of fuel usage Figure 22: Composition of MSW in a Typical Indian City

6
Conversion Table 1 Lakh = 100,000 = 0.1 Million 1 Crore = 100,00,000 = 10 Million 1 Million = 10 Lakh = 0.1 Crore
7
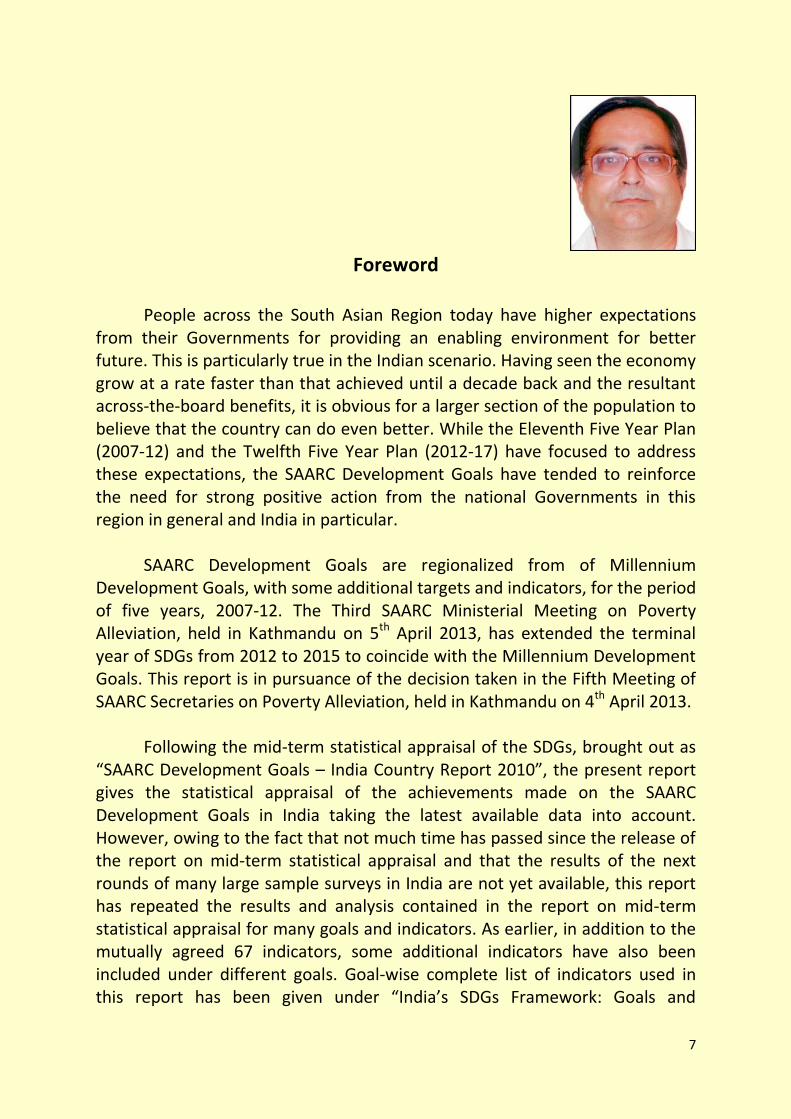
Foreword
People across the South Asian Region today have higher expectations
from their Governments for providing an enabling environment for better future. This is particularly true in the Indian scenario. Having seen the economy grow at a rate faster than that achieved until a decade back and the resultant across-the-board benefits, it is obvious for a larger section of the population to believe that the country can do even better. While the Eleventh Five Year Plan (2007-12) and the Twelfth Five Year Plan (2012-17) have focused to address these expectations, the SAARC Development Goals have tended to reinforce the need for strong positive action from the national Governments in this region in general and India in particular.
SAARC Development Goals are regionalized from of Millennium
Development Goals, with some additional targets and indicators, for the period of five years, 2007-12. The Third SAARC Ministerial Meeting on Poverty Alleviation, held in Kathmandu on 5th April 2013, has extended the terminal year of SDGs from 2012 to 2015 to coincide with the Millennium Development Goals. This report is in pursuance of the decision taken in the Fifth Meeting of SAARC Secretaries on Poverty Alleviation, held in Kathmandu on 4th April 2013.
Following the mid-term statistical appraisal of the SDGs, brought out as
“SAARC Development Goals – India Country Report 2010”, the present report gives the statistical appraisal of the achievements made on the SAARC Development Goals in India taking the latest available data into account. However, owing to the fact that not much time has passed since the release of the report on mid-term statistical appraisal and that the results of the next rounds of many large sample surveys in India are not yet available, this report has repeated the results and analysis contained in the report on mid-term statistical appraisal for many goals and indicators. As earlier, in addition to the mutually agreed 67 indicators, some additional indicators have also been included under different goals. Goal-wise complete list of indicators used in this report has been given under “India’s SDGs Framework: Goals and
8
Indicators”. I hope this report will be useful in assessing India’s progress on the attainment of SDGs in the national and collectively in the regional context.
I wish to place on record my gratitude to all Government of India
agencies without whose cooperation this report would not have been possible. Thanks are also due to the able guidance of Mrs. S. Jeyalakshmi, Additional Director General in the Social Statistics Division of the Central Statistics Office and her team of officers responsible for preparation of the Report – Mr. H. Borah, Deputy Director General; Mr. Dhrijesh Kumar Tiwari, Director and Mr. Mool Chand Bhaskar, Deputy Director – for their valuable efforts to prepare this report.
August 2013 Dr. T. C. A. Anant New Delhi Chief Statistician of India and
Secretary, Ministry of Statistics & Programme Implementation
9
Contents S. No. Title Page No. 1. Acronyms………………………………………………………………………………… 2 2. List of Tables…………………………………………………………………………… 4 3. List of Figures…………………………………………………………………………… 5 4. Conversion Table……………………………………………………………………… 6 5. Foreword…………………………………………………………………………………. 7 6. Summary.……………………………………………………..…………………………. 11 7. Introduction…………………………………………………………………………….. 18 8. SDGs Framework: Goals & Indicators………………………………………. 19 9. Livelihood SDGs……………………………………………………………………….. 23
Goal 1: Eradication of Hunger Poverty……………………………………… 24 Goal 2: Halve proportion of people in poverty by 2012….…………. 27 Goal 3: Ensure adequate nutrition and dietary
improvement for the poor…………………………………………….. 30 Goal 4: Ensure a robust pro-poor growth process……………………… 34 Goal 5: Strengthen connectivity of poorer regions
and of poor as social Group…………………………………………… 41 Goal 6: Reduce social and institutional vulnerability
of the poor, women and Children………………………………… 48 Goal 7: Ensure access to affordable justice………………………………. 52 Goal 8: Ensure effective participation of poor and of
women in anti-poverty policies and programmes……….. 54
10. Health SDGs…………………………………………………………………………..... 57
Goal 9: Maternal health…………………………………………………………… 58 Goal 10: Child health………………………………………………………………. 61 Goal 11: Affordable health care………………………………………………. 64 Goal 12: Improved hygiene and public health………………………….. 67
11. Education SDGs………………………………………………………………………. 71
Goal 13: Access to primary/community schools for all children, boys and girls…………………………………….. 72
Goal 14: Completion of primary education cycle……………………... 74 Goal 15: Universal functional literacy……………………………………….. 78 Goal 16: Quality education at primary, secondary
and vocational levels………………………………………………….. 80
12. Environment SDGs……………………………………………………………………. 81
10
Goal 17: Acceptable level of forest cover…………………………………. 82 Goal 18: Acceptable level of water and soil quality………………….. 85 Goal 19: Acceptable level of air quality……………………………………. 89 Goal 20: Conservation of bio-diversity……………………………………….91 Goal 21: Wetland conservation………………………………………………….92 Goal 22: Ban on dumping of hazardous waste,
including radio-active waste………………………………………..93
Annex: SAARC Development Goals (SDGs)……………………………. 97 References……………………………………………………………………………… 98
11
Summary
Livelihood SDGs
The incidence of poverty has declined from 45.3% in 1993-94 to 37.2% in 2004-05 and further to 21.9% in 2011-12. The percentage of persons below the Poverty Line in 2011-12 has been estimated as 25.7% in rural areas, 13.7% in urban areas and 21.9% for the country as a whole.
The proportion of children under three years of age who are underweight decreased from 43 percent in NFHS-2 to 40 percent in NFHS-3. Stunting decreased by a larger margin, from 51 percent to 45 percent. Wasting increased from 20 percent to 23 percent.
Minimum per capita daily requirement of dietary energy for healthy living is 2400 kcal in rural areas and 2100 kcal in urban areas. The proportion of population that has dietary energy consumption below 2100/2400 kcal in India tends to rise steadily since 1993-94.
The share of poorest quintile in total consumption (consumption that is accounted for by the poorest fifth of the population) in the rural areas declined from 9.6% in 1993-94 to 9.5% in 2009-10 based on URP. This decline was sharper in the urban areas where the ratio declined from 8.0% to 7.0% during this period.
Among the beneficiary households of food assistance schemes of the Central Government, the Midday Meal scheme benefited children from an estimated 22.8% of rural households in 2004-05, the Integrated Child Development Scheme (ICDS) benefited 5.7% of rural households, the Food-for-Work Scheme, only 2.7%, and the Annapoorna scheme for the elderly, 0.9%. In urban India, while children from 8% of households benefited from the Midday Meal scheme, and the ICDS scheme benefited 1.8% households, only 0.2% urban households benefited from Annapoorna, and only 0.1% from Food for Work.
51 percent of the households were using salt that was adequately iodized in 2005-06. There was virtually no change since 1998-99, when 50 percent of households were using adequately iodized salt.
General Government (Central and State Governments) expenditure on social services as a proportion of GDP has increased from 5.49 per cent in 2005-06 to 7.09 per cent in 2012-13 (BE).
The amount of term loan extended by three major Government finance and development corporations was `202.54 crore covering 30,606 beneficiaries. These corporations provided micro-finance amounting to `72.81 crore covering 40,172 beneficiaries.
12
Inequality in India for the period 2010-11 in terms of the income Gini coefficient was 36.8.
Employment growth in the country was 1.6 per cent per annum during the last decade, i.e. 1999-2000 to 2009-10, based on usual principal and subsidiary status (UPSS).
The incidence of unemployment on current daily status basis increased from 7.3 per cent in 1999-2000 to 8.3 per cent in 2004-05. However, it fell from 8.3 per cent in 2004-05 to 6.6 per cent in 2009-10.
The total road length in the country increased from 33.26 lakh km as on 31st March 2000 to 46.90 lakh km as on 31st March 2011. In terms of share in total road length, rural roads constituted the largest share of 59 per cent as on 31st March 2011.
The wireless telephone subscriber base was 919.17 million as on 31st March 2012 in comparison to the subscriber base of 811.59 million as on 31st March 2011.
The tele-density at the end of March, 2012 was 78.66 as compared to 70.89 at the end of previous year.
The Internet subscriber base in the country as on 31st March 2012 stood at 22.86 million as compared to 19.67 million as on 31st March 2011, registering an annual growth rate of about 16.19%.
There were 245 private FM radio stations operational by March 2012, besides the public service broadcaster - All India Radio (AIR) having a network of 237 broadcasting centres with 149 medium frequency (MW), 54 high frequency (SW) and 177 FM transmitters. The coverage of AIR is 91.85% of the geographical area of the country, serving 99.18% of the population.
There are an estimated 148 million TV homes in India and 94 million Cable TV subscribers as on 31st March 2012. There are an estimated 60,000 cable operators and 6000 MSOs supporting these subscribers.
The Worker Participation Rate for children in the age group of 5 to 14 years shows a declining trend between the period 1993-94 and 2007-08. The reduction in WPR for both male and female children in rural areas was from 6 per cent in 1993-94 to 2 per cent in 2007-08.
The Worker Participation Rate for women was 21.9 per cent in 2011-12 as per usual status (principal and subsidiary).
In the organized sector, women workers constituted 20.4 percent of the total organized sector employment in the country in 2010 comprising 17.9% in the public sector and 24.5% in the private sector.
The mean age at marriage for women was 19.5 years in 1992 which marginally increased to 19.9 years in 2001 and to 21.0 years in 2010.
13
The level of registration of births in India has increased from 56.2 per cent in 2000 to 81.3 per cent in 2009.
According to SRS 2011, the sex ratio at birth (number of female per 1000 male) for the country for the period 2009-11 (3-year average) has been estimated at 906.
As on 30th November 2011, there were 54,106 cases pending in the Supreme Court of India. As on 30th June 2009, 40,18,914 cases were pending in various High Courts and 2,71,20,108 cases were pending in the Subordinate Courts. The average pendency of cases in the country is 15 years.
The Legal Services Authorities Act, 1987 has created a nationwide uniform network for providing free and competent legal services to the weaker sections of the society on the basis of equal opportunity.
The share of women parliamentarians was 10.96% in 2011.
In 2008, out of 26,45,883 representatives of Gram Panchayats, 975057 (36.9%) were women. The share of women representatives at the Intermediate Panchayats was 37.1% (58191 out of 156794) and it was 37.2% (5810 out of 15613) at the District Panchayats. The three Panchayats taken together, the share of women representatives stood at 36.9%.
The proportion of women in the total Central Government employment has increased from 7.53% in 2001 to 10.04% in 2009.
Allocations for women as reflected in the Gender Budget Statement shows gradual increase in the number of Central Government Ministries coming out separately with such statement as also the increasing trend in the allocations for women.
Health SDGs
The national MMR level has come down from 327 per 100,000 live births in 1999-2001 to 212 per 100,000 live births in 2007-09, registering a decline of 35.2% over a span of eight years.
The proportion of births attended by skilled personnel has increased from 33% in 1992-93 to 47% in 2005-06 and to 52% in 2007-08.
Life expectancy in India shows a continuous increasing trend. From 60.3 years in 1991-95, it has gone up to 63.4 years in 2002-06.
The Age-Specific Fertility Rates (ASFR) in India show a declining trend across all age-groups. The ASFR for the women in the age-group 15-19 years was 51.1 in 2000 which has come down to 30.7 in 2011. Similarly,
14
ASFR for the women in the age-group 20-24 years was 218.7 in 2000 which has come down to 196.7 in 2011.
The under five mortality rate was 107 in 1992-93 (NFHS-1) which dropped to 95 in 1998-99 (NFHS-2) and further to 74 in 2005-06.
The country has observed a continuous decline in infant mortality rate. It was 80 in 1991 and decreased to 58 in 2005 and further to 44 in 2011.
the neo-natal (less than 29 days) mortality rate was 31 in 2011 compared with 33 in 2010 at the all-India level
The General Government (Central and State Governments combined) expenditure on health was 1.36% of the GDP in 2012-13 (budget estimate). As per cent of total expenditure, the expenditure on health was 4.8% and as per cent of social services expenditure, the expenditure on health was 19.2% in 2012-13.
The out-of-pocket expenditure as per cent of private expenditure on health was 92.2% in 2000 which reduced to 74.4% in 2008.
The population served per allopathic doctor in India was 1312.32 whereas there was one AYUSH doctor available per 1699.42 persons in 2011. The population served per allopathic and AYUSH doctor was 740.1. Also, one dental surgeon, nurse and pharmacist each were available for a population of 10271.1, 638.64 and 1841.35 respectively.
The overall proportion of households having access to improved water sources increased from 68.2% in 1992-93 to 91.4% in 2008-09. The urban coverage increased from 87.6% to 94% and the rural coverage from 61.0% to 90.4% during the same period.
According to Census 2001, 36.4% of the households had access to latrine which increased to 46.9% in Census 2011.
The proportion of households using improved sanitation facilities was 40.6% in 2005-06, which slightly increased to 47.6% in 2008-09.
The adult HIV prevalence has decreased from 0.41% in 2001 to 0.27% in 2011. The estimated number of people living with HIV has decreased from 24.1 lakh in 2000 to 20.9 lakhs in 2011.
The prevalence of TB in the country has reduced from 338 per lakh population in 1990 to 256 per lakh population by the year 2010.
There were 3.03 million cases of malaria in 1996 which came down to 1.60 million in 2010. The annual parasite incidence was 3.48 in 1996 which declined to 1.30 in 2010.
15
Education SDGs
More than 90% of rural and urban households had a school with primary classes within 1 km in 2007-08. However, only 61.6% of rural households, compared to 82.5% of urban households, had a school within a km providing middle level classes.
The net enrolment rate at primary level was 84.53% in 2005-06 which increased to 99.89% in 2010-11.
The Gross Enrolment Ratio (GER) at the primary level was 83.8 in 1990-91 and it increased to 95.7 in 2000-01 and to 116.0 in 2010-11. For the middle/upper primary level, the GER was 66.7 in 1990-91 which declined to 58.6 in 2000-01 and then gradually increased to 85.5 in 2010-11.
The gender parity index in primary education has gone up from 0.76 in 1990-91 to 1.01 in 2010-11 and in secondary education the increase is from 0.60 in 1990-91 to 0.87 in 2010-11.
The drop-out rate for primary classes (I-V) was 27.0% during 2010-11. It was 40.6% for elementary classes (I-VIII) during the same year.
The retention rate at primary level has gradually improved from 71.01% in 2005-06 to 75.94% in 2011-12.
The adult (age 15 & above) literacy rate in India was 48.2% in 1991 which increased to 61.0% in 2001 and further to 66.0% in 2007-08.
The percentage of trained teachers in primary schools was 86% in 2005-06 and it increased to 90% in 2010-11. It was 87% for upper primary schools in 2005-06 and 90% in 2010-11. The percentage of trained teachers in secondary schools was 89% in 2005-06 and it marginally increased to 90% in 2010-11. For senior secondary schools, the percentage of trained teachers was 90% in 2005-06 and it rose by 1 percentage point to 91% in 2010-11.
The pupil (student) teacher ratio was 43 for primary schools, 37 for upper primary schools and 31 for secondary/senior secondary schools in 1990-91. This ratio stood at 46, 34 and 33 in 2005-06 and 43, 33 and 34 in 2010-11 for primary schools, upper primary schools and secondary/senior secondary schools respectively.
The percentage of schools (all schools) having girls’ toilet was 37.42% in 2005-06 which gradually increased to 72.16% in 2011-12. The schools with functional girls’ toilet were 84.68% in 2011-12. The percentage of primary schools with girls’ toilet stood at 41.95% in 2007-08 and increased to 65.40% in 2011-12.
16
Environment SDGs
In 2011, total forest cover of the country is 692,027 km2 which is 21.05% of the geographical area of the country. In terms of density classes, area covered by very dense forests is 83,471 km2 (2.54%), that with moderately dense forests is 320,736 km2 (9.76%) and open forests is 287,820 km2 (8.75%).
The total area protected through national parks, wildlife sanctuaries, conservation reserves and community reserves stands at 1,58,745 sq km as of March 2009 (4.83% of country’s geographical area).
Per hectare consumption of chemical fertilizers has increased from 89.63 kg in 2000-01 to 144.33 kg in 2011-12.
Almost 70 per cent of surface water resources and a growing percentage of groundwater reserves are contaminated by biological, toxic, organic and inorganic pollutants.
The water quality monitoring results obtained during 1995 to 2011 indicate that the organic and bacterial contamination continue to be critical in water bodies.
Per capita emission of CO2 in India was 0.96 million tonnes in 2000 which increased to 1.37 million tonnes in 2009. The total CO2 emission in the country was 972.5 million tonnes in 2000 which rose to 1585.5 million tonnes in 2009.
Fossil fuels contributed 95% of the total commercial energy consumed in India, with the remaining 5% derived from sources like hydropower, nuclear and renewable energy.
The household sector is the second largest consumer of energy in India after the industrial sector. 71 per cent of India's households use solid fuels for cooking. More than 60 per cent of Indian households depend on traditional sources of energy like fuel-wood, dung and crop residue for meeting their cooking and heating needs.
India is a mega diverse country with only 2.4% of the land area accounting for 7-8% of the recorded species of the world, including over 45,500 species of plants and 91,000 species of animals.
India is home to 8.58% of mammalians, 13.66% of avians, 7.91% of reptilians, 4.66% of amphibians, 11.72% of fish, and 11.80% of plant species documented so far.
The network of protected areas presently covers about 4.83% of the country’s total land area under International Union for Conservation of Nature (IUCN) categories I-V and includes 100 national parks, 514
17
wildlife sanctuaries, 43 conservation reserves and 4 community reserves, all together 661 protected areas.
25 sites from India have been identified as Ramsar sites of international importance, covering an area of 6.77 lakh hectares, and six new sites are under process of designation.
The hazardous waste generated in the country is about 4.4 million tonnes, out of which 38.3 per cent is recyclable, 4.3 per cent is incinerable and the remaining 57.4 per cent is disposable in secured landfills.
*****
18
Introduction
SAARC Development Goals (Adaptation from “An Engagement with Hope”, ISACPA 2004)
At the Twelfth SAARC Summit held in Islamabad, Pakistan (4-6 January 2004), the Heads of States in their declaration directed the Independent South Asian Commission on Poverty Alleviation (ISACPA) to submit to the Thirteenth SAARC Summit “a comprehensive and realistic blue-print setting out SAARC Development Goals for the next five years in the areas of poverty alleviation, education, health, and environment giving due regard, among others, to suggestions made in the ISACPA Report”.
In addition to this SAARC mandate, two other sources of inspiration have
guided preparation of the SAARC Development Goals (SDGs): first, the regional imperative for galvanizing a popular imagination which allows zero tolerance for a continuation of the inhumanity of poverty, and secondly, the international imperative of achieving the Millennium Development Goals (MDGs) by 2015. In order to prepare the goals for the mandated areas of poverty alleviation (livelihood), education, health and environment, ISACPA took into consideration three key factors: the specificities of South Asia, linkages with the international goals as set out in the MDGs, and finally, the importance of focusing on process goals as much as on outcome goals (for example, increasing the presence of skilled birth attendants to influence the outcome goal of maternal health).
Taking the above factors into account, the ISACPA Report recommended
22 priority goals to constitute the SDGs for the period 2007-2012 in the mandated areas of livelihood, health, education and environment. Of these, 8 SDGs pertain to livelihood, 4 to health, 4 to education and 6 to environment (Annex).
While the SDGs express the regional will for a comprehensive and
strategic response to the problem of poverty and social development, the formulation of specific targets and indicators for these goals were left to be carried out at the individual country level.
*****
19
SDGs Framework: Goals & Indicators Livelihood SDGs
Goal 1 Eradication of Hunger Poverty Indicator 1: Malnutrition in children under five years Indicator 2: Malnutrition for overall population (in average intake) Goal 2 Halve proportion of people in poverty by 2012 Indicator 1: Percentage of people living on less than 1$ per day (PPP terms) Indicator 2: Head count poverty ratio based on nationally determined poverty
line(s) Goal 3 Ensure adequate nutrition and dietary improvement for the poor Indicator 1: Percentage of the poor covered by various food support
programmes Indicator 2: Micro-nutrient supplements e.g. % of people having access to
Vitamin A, iodized salt, etc. Goal 4 Ensure a robust pro-poor growth process Indicator 1: Budgetary/ fiscal expenditure for pro-poor growth sectors as % of
GDP, and as % of total government expenditures Indicator 2: % of poor covered by micro-credit and similar programmes Indicator 3: Reduction of income/consumption inequality (Gini Coefficient) Indicator 4: Rate of growth of employment (disaggregated) Indicator 5: Assets ownership by poor (quantifiable indicators to be
developed) Goal 5 Strengthen connectivity of poorer regions and of poor as social
group Indicator 1: Transport connectivity for the poor in rural areas (e.g., length of
rural roads, availability of boats per 1000 population, average time/distance to reach nearest road/major population centre)
Indicator 2: Communications connectivity: % of people using telephone/cell Phone
Indicator 3: % of rural population having access to electricity
20
Indicator 4: Representation of the excluded in local government Indicator 5: Mass media connectivity: percentage of people using TV and radio Goal 6 Reduce social and institutional vulnerability of the poor, women
and children Indicator 1: % of children who are working Indicator 2: Share of women in employment Indicator 3: Coverage or amount of public expenditure as % of GDP on Social
Protection for the Vulnerable Groups Indicator 4: Early marriage Indicator 5: Birth registration Indicator 6: Sex ratio at birth Goal 7 Ensure access to affordable justice Indicator 1: Average time required in disposal of legal disputes Indicator 2: Access to alternate disputes resolution Indicator 3: Access to free legal aid for the poor (marginalized group) Goal 8 Ensure effective participation of poor and of women in anti-
poverty policies and programmes Indicator 1: Percentage of women in local governments/ parliament/ civil
services Indicator 2: Gender Budgeting Health SDGs Goal 9 Maternal health Indicator 1: Maternal Mortality Ratio (MMR) Indicator 2: Percentage of births covered by the skilled birth attendants Indicator 3: Life expectancy of women as a ratio of life expectancy of men Indicator 4: Age specific fertility rate of 15 to 24 years girls Goal 10 Child health Indicator 1: Immunisation coverage (measles can be a proxy) Indicator 2: Under 5 mortality rate (U5MR)
21
Indicator 3: Infant Mortality Rate Indicator 4: Neo-natal mortality rate Goal 11 Affordable health care Indicator 1: Out of pocket expenditure on health as % of total household
expenditure Indicator 2: Total government expenditure on health as a % of GDP Indicator 3: % of budget allocated to primary health care vis-à-vis total health
budget Indicator 4: Number of doctors per 1000 population Goal 12 Improved hygiene and public health Indicator 1: % of population with access to safe drinking water Indicator 2: % of population having access to sanitation Indicator 3: Policies on health education Indicator 4: Prevalence rate of HIV/AIDS, TB, Malaria Education SDGs Goal 13 Access to primary/community schools for all children, boys and
girls Indicator 1: % of children having access to primary schools by distance Indicator 2: Gross Enrolment Rate/Net Enrolment Rate Indicator 3: Public expenditure on education in terms of GDP Indicator 4: Gender parity at primary and secondary level Goal 14 Completion of primary education cycle Indicator 1: Survival rates (along with drop-out) Goal 15 Universal functional literacy Indicator 2: Adult literacy rate Goal 16 Quality education at primary, secondary and vocational levels Indicator 1: Percentage of trained teachers
22
Indicator 2: Students teacher ratio Indicator 3: Percentage of schools with toilets for girls Environment SDGs Goal 17 Acceptable level of forest cover Indicator 1: Percentage of forest cover Indicator 2: Percentage or extent of community/social forest Goal 18 Acceptable level of water and soil quality Indicator 1: Chemical fertilizers/ pesticides consumption per ha of arable land Indicator 2: Percentage of contaminated wells/water sources Goal 19 Acceptable level of air quality Indicator 1: Carbon dioxide emissions Indicator 2: Particulate matter in the major metropolitan centres Indicator 3: Percentage of firewood in total energy mix Goal 20 Conservation of bio-diversity Indicator 1: % and number of protected areas out of the total land area Indicator 2: Number of protected species Goal 21 Wetland conservation Indicator 1: Number and % of protected wetland/Ramsar sites Goal 22 Ban on dumping of hazardous waste, including radio-active waste Indicator 1: Solid waste generation per capita Indicator 2: % of waste treated Indicator 3: Regulatory framework for hazardous waste treatment in place
23
Livelihood SDGs
Goal 1 Eradication of Hunger Poverty
Goal 2 Halve proportion of people in poverty by 2012
Goal 3 Ensure adequate nutrition and dietary improvement for the poor
Goal 4 Ensure a robust pro-poor growth process
Goal 5 Strengthen connectivity of poorer regions and of poor as social group
Goal 6 Reduce social and institutional vulnerability of the poor, women and
children Goal 7
Ensure access to affordable justice Goal 8
Ensure effective participation of poor and of women in anti-poverty policies and programmes
24
Goal 1 Eradication of Hunger Poverty
SDGs Indicators
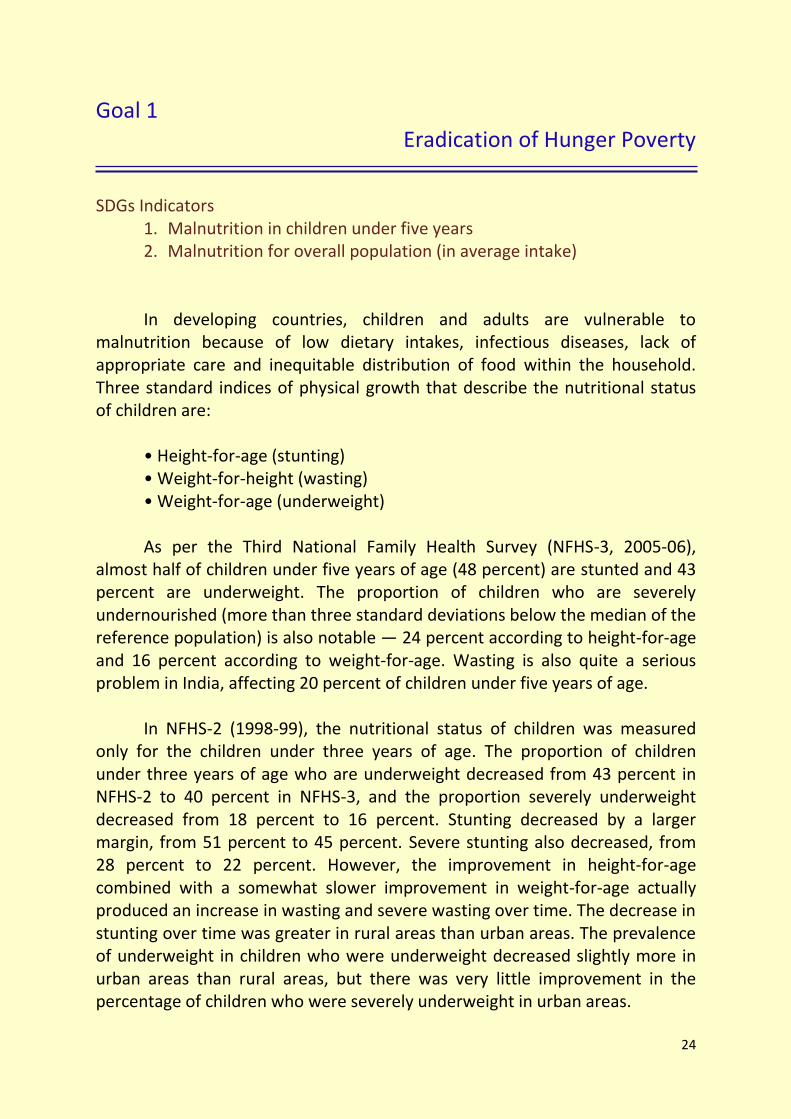
1. Malnutrition in children under five years 2. Malnutrition for overall population (in average intake) In developing countries, children and adults are vulnerable to
malnutrition because of low dietary intakes, infectious diseases, lack of appropriate care and inequitable distribution of food within the household. Three standard indices of physical growth that describe the nutritional status of children are:
• Height-for-age (stunting) • Weight-for-height (wasting) • Weight-for-age (underweight) As per the Third National Family Health Survey (NFHS-3, 2005-06),
almost half of children under five years of age (48 percent) are stunted and 43 percent are underweight. The proportion of children who are severely undernourished (more than three standard deviations below the median of the reference population) is also notable — 24 percent according to height-for-age and 16 percent according to weight-for-age. Wasting is also quite a serious problem in India, affecting 20 percent of children under five years of age.
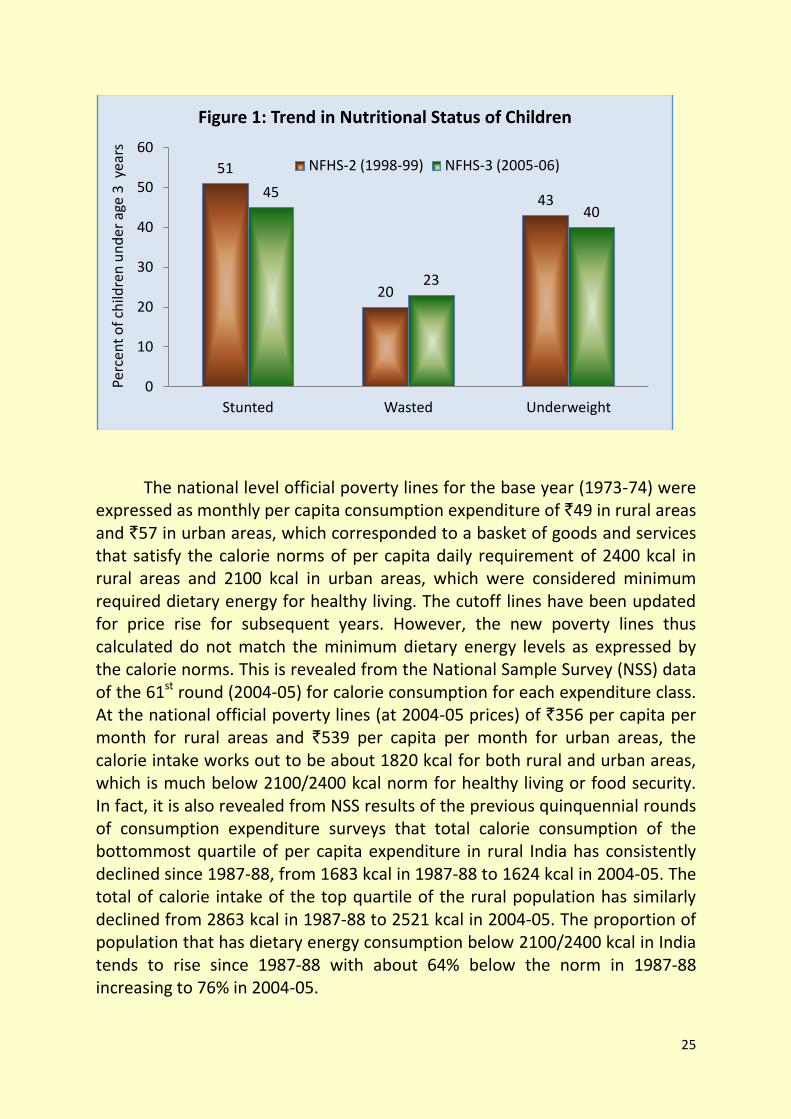
In NFHS-2 (1998-99), the nutritional status of children was measured
only for the children under three years of age. The proportion of children under three years of age who are underweight decreased from 43 percent in NFHS-2 to 40 percent in NFHS-3, and the proportion severely underweight decreased from 18 percent to 16 percent. Stunting decreased by a larger margin, from 51 percent to 45 percent. Severe stunting also decreased, from 28 percent to 22 percent. However, the improvement in height-for-age combined with a somewhat slower improvement in weight-for-age actually produced an increase in wasting and severe wasting over time. The decrease in stunting over time was greater in rural areas than urban areas. The prevalence of underweight in children who were underweight decreased slightly more in urban areas than rural areas, but there was very little improvement in the percentage of children who were severely underweight in urban areas.
25
The national level official poverty lines for the base year (1973-74) were
expressed as monthly per capita consumption expenditure of `49 in rural areas and `57 in urban areas, which corresponded to a basket of goods and services that satisfy the calorie norms of per capita daily requirement of 2400 kcal in rural areas and 2100 kcal in urban areas, which were considered minimum required dietary energy for healthy living. The cutoff lines have been updated for price rise for subsequent years. However, the new poverty lines thus calculated do not match the minimum dietary energy levels as expressed by the calorie norms. This is revealed from the National Sample Survey (NSS) data of the 61st round (2004-05) for calorie consumption for each expenditure class. At the national official poverty lines (at 2004-05 prices) of `356 per capita per month for rural areas and `539 per capita per month for urban areas, the calorie intake works out to be about 1820 kcal for both rural and urban areas, which is much below 2100/2400 kcal norm for healthy living or food security. In fact, it is also revealed from NSS results of the previous quinquennial rounds of consumption expenditure surveys that total calorie consumption of the bottommost quartile of per capita expenditure in rural India has consistently declined since 1987-88, from 1683 kcal in 1987-88 to 1624 kcal in 2004-05. The total of calorie intake of the top quartile of the rural population has similarly declined from 2863 kcal in 1987-88 to 2521 kcal in 2004-05. The proportion of population that has dietary energy consumption below 2100/2400 kcal in India tends to rise since 1987-88 with about 64% below the norm in 1987-88 increasing to 76% in 2004-05.
51
20
43 45
23
40
0
10
20
30
40
50
60
Stunted Wasted Underweight
Perc
ent
of
child
ren
un
der
age
3 y
ears
Figure 1: Trend in Nutritional Status of Children
NFHS-2 (1998-99) NFHS-3 (2005-06)
26
According to the National Sample Survey data of the 66th round (2009-10), Average dietary energy intake per person per day was 2147 Kcal for rural India and 2123 Kcal for urban India. The proportion of households with calorie intake below 2160 Kcal per consumer unit per day (80% of 2700 Kcal, a level used in NSS tabulation for comparisons) was 62% for rural and 63% for urban households in the bottom decile class. The proportion declined progressively with MPCE level. In the next decile class, it was about 42.5% in the rural sector and 45% in the urban sector. The proportion was only about 2.5% for the top 10% of population ranked by MPCE.
Estimates of average calorie intake for India from six quinquennial
surveys of consumer expenditure including the 66th round show a decline in average calorie intake between 1972-73 and 2009-10. The overall decline is substantially greater for rural than for urban India, and appears to have been sharper in the period since 1993-94 (50th round), especially in the urban sector. The proportion of households with calorie intake below the level of 2700 Kcal per consumer unit per day has grown more or less steadily since 1993-94: from under 52% in rural India to nearly 62%, and from 57% in urban India to about 63%.
27
Goal 2 Halve Proportion of People in Poverty by 2012
SDGs Indicators
1. Percentage of people living on less than 1$ per day (PPP terms) 2. Head count poverty ratio based on nationally determined poverty
line(s) The Poverty Headcount Ratio (PHR) is the proportion of population
whose per capita income/consumption expenditure is below an official threshold(s) set by the National Government. The Planning Commission in the Government of India estimates poverty at National and State levels using the poverty lines as defined and applying it to the distribution of persons by household per capita monthly consumption expenditure.
The poverty ratio according to the Government of India definition is at variance with that according to international definition. India unlike most countries has different poverty lines at sub-national level in the sense that the poverty ratios are estimated for different States of the country separately for rural and urban areas. The all India poverty ratio is obtained as state-population weighted average poverty ratio, and the all India poverty line is the per capita per month expenditure that corresponds to the all India poverty ratio.
The methodology for estimation of poverty followed by the Planning
Commission has been based on the recommendations made by experts in the field from time to time. In December 2005, Planning Commission constituted an Expert Group under the Chairmanship of Prof. Suresh D. Tendulkar to review the methodology for estimation of poverty. The Tendulkar Committee submitted its report in December 2009 and computed poverty lines and poverty ratios for 2004-05. For comparison they also computed poverty lines and poverty ratios for 1993-94 with identical methodology.
The Planning Commission periodically estimates poverty lines and
poverty ratios for each of the years for which Large Sample Surveys on Household Consumer Expenditure have been conducted by the National Sample Survey Office (NSSO) of the Ministry of Statistics and Programme Implementation. These surveys are normally conducted on quinquennial basis.
28
The last quinquennial survey in this series was conducted in 2009-10 (NSS 66th round). However, since 2009-10 was not a normal year because of a severe drought, the NSSO repeated the large scale survey in 2011-12 (NSS 68th round). The summary results of this survey were released on 20th June 2013.
The NSSO tabulates expenditure of about 1.20 lakh households. Since
these households have different number of members, the NSSO for purpose of comparison divides the household expenditure by the number of members to arrive at per capita consumption expenditure per month. This is called Monthly Per Capita Consumption Expenditure (MPCE) and is computed on the basis of three different concepts: Uniform Reference Period (URP), Mixed Reference Period (MRP), and Modified Mixed Reference Period (MMRP). As per Tendulkar Methodology, the poverty line has been expressed in terms of MPCE based on Mixed Reference Period.
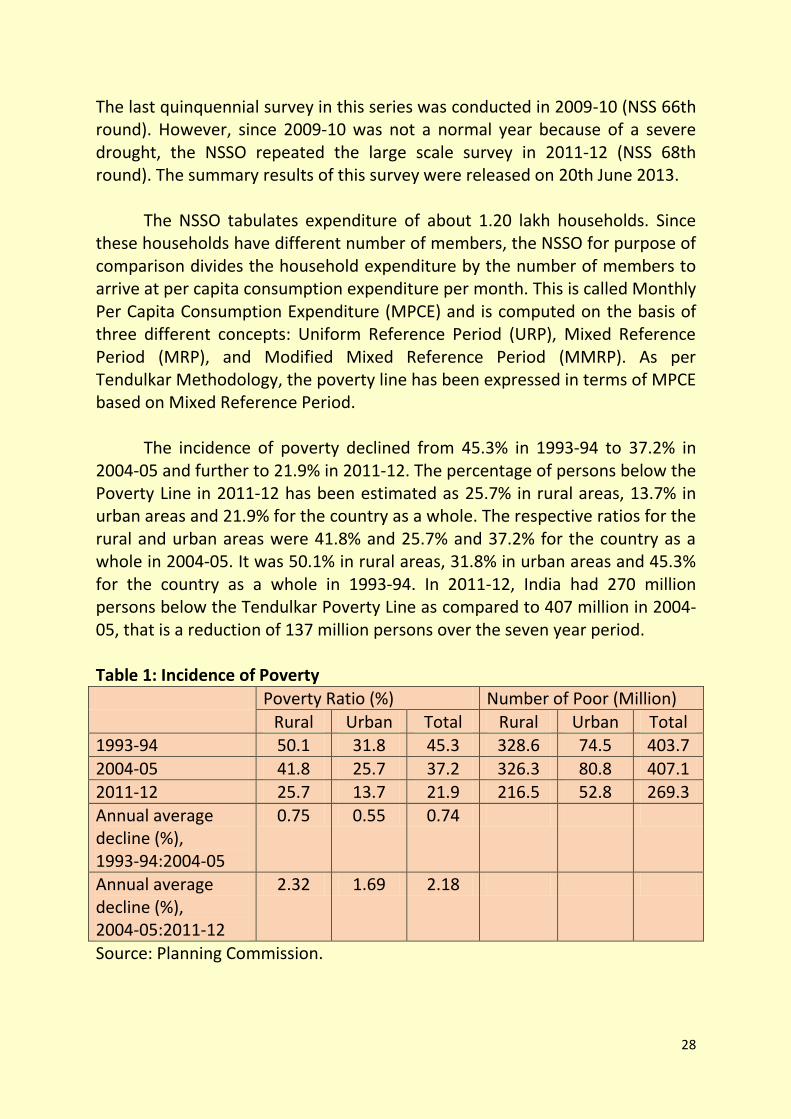
The incidence of poverty declined from 45.3% in 1993-94 to 37.2% in
2004-05 and further to 21.9% in 2011-12. The percentage of persons below the Poverty Line in 2011-12 has been estimated as 25.7% in rural areas, 13.7% in urban areas and 21.9% for the country as a whole. The respective ratios for the rural and urban areas were 41.8% and 25.7% and 37.2% for the country as a whole in 2004-05. It was 50.1% in rural areas, 31.8% in urban areas and 45.3% for the country as a whole in 1993-94. In 2011-12, India had 270 million persons below the Tendulkar Poverty Line as compared to 407 million in 2004-05, that is a reduction of 137 million persons over the seven year period.
Table 1: Incidence of Poverty
Poverty Ratio (%) Number of Poor (Million)
Rural Urban Total Rural Urban Total 1993-94 50.1 31.8 45.3 328.6 74.5 403.7
2004-05 41.8 25.7 37.2 326.3 80.8 407.1 2011-12 25.7 13.7 21.9 216.5 52.8 269.3
Annual average decline (%), 1993-94:2004-05
0.75 0.55 0.74
Annual average decline (%), 2004-05:2011-12
2.32 1.69 2.18
Source: Planning Commission.
29
During the 11-year period 1993-94 to 2004-05, the average decline in the poverty ratio was 0.74 percentage points per year. It accelerated to 2.18 percentage points per year during the 7-year period 2004-05 to 2011-12. Therefore, it can be concluded that the rate of decline in the poverty ratio during the most recent 7-year period 2004-05 to 2011-12 was about three times of that experienced in the 11-year period 1993-94 to 2004-05.
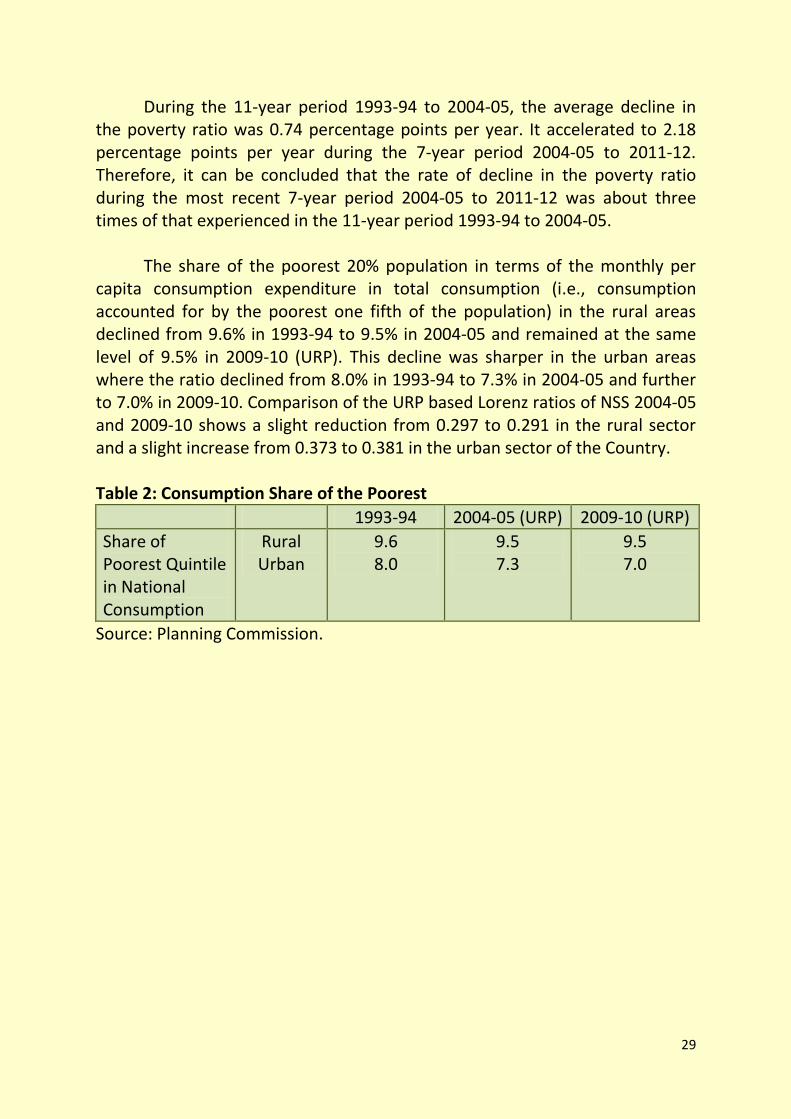
The share of the poorest 20% population in terms of the monthly per
capita consumption expenditure in total consumption (i.e., consumption accounted for by the poorest one fifth of the population) in the rural areas declined from 9.6% in 1993-94 to 9.5% in 2004-05 and remained at the same level of 9.5% in 2009-10 (URP). This decline was sharper in the urban areas where the ratio declined from 8.0% in 1993-94 to 7.3% in 2004-05 and further to 7.0% in 2009-10. Comparison of the URP based Lorenz ratios of NSS 2004-05 and 2009-10 shows a slight reduction from 0.297 to 0.291 in the rural sector and a slight increase from 0.373 to 0.381 in the urban sector of the Country. Table 2: Consumption Share of the Poorest
1993-94 2004-05 (URP) 2009-10 (URP)
Share of Poorest Quintile in National Consumption
Rural Urban
9.6 8.0
9.5 7.3
9.5 7.0
Source: Planning Commission.

30
Goal 3 Ensure Adequate Nutrition and Dietary
Improvement for the Poor
SDGs Indicators
1. Percentage of the poor covered by various food support programmes 2. Micro-nutrient supplements e.g. % of people having access to
Vitamin A, iodized salt, etc.
The National Sample Survey Office (NSSO) in the Ministry of Statistics and Programme Implementation conducts socio-economic surveys covering various subjects on regular basis. As part of the NSS 61st round during the
period July 2004–June 2005, the Household Consumer Expenditure Survey was conducted on large sample basis and this was the seventh quinquennial survey on the subject. This report analysed the Public Distribution System (PDS) as a source of household consumption as also beneficiary households of four food assistance schemes of the Government of India, namely, Food for Work, Annapoorna, Integrated Child Development Scheme and Midday Meal Scheme.
The Midday Meal scheme benefited children from an estimated 22.8% of rural households in 2004-05, the Integrated Child Development Scheme (ICDS) benefited 5.7% of rural households, the Food-for-Work Scheme, only 2.7%, and the Annapoorna scheme for the elderly, 0.9%. In urban India, while children from 8% of households benefited from the Midday Meal scheme, and the ICDS scheme benefited 1.8% households, only 0.2% urban households benefited from Annapoorna, and only 0.1% from Food for Work. Table 3: Households benefitting from selected food assistance schemes of the Government
Sector
Percent households with at least one member benefitting
Food for Work
Annapurna ICDS Midday Meal
Any Scheme
1 2 3 4 5 6
Rural 2.7 0.9 5.7 22.8 28.0
Urban 0.1 0.2 1.8 8.0 9.5
Source: NSS Report No. 510: Public Distribution System and Other Sources of Household Consumption, 2004-05.
Among household occupational types in rural India, the (mostly manual)
labour households – “agricultural labour” and “other labour” – had the highest
31
proportions of households benefiting from each of the four schemes. Similarly, in urban India, “casual labour” households had the highest proportions of beneficiary households from each of the four schemes.
Among social groups, the Scheduled Tribes had the highest proportion of
Food-for-Work beneficiary households in both rural and urban India, and also the highest proportion of ICDS beneficiaries. Rural households possessing more than 0.40 hectares of land had a higher representation among recipients of benefits from the schemes than households possessing 0.40 hectares of land or less. The class of households possessing 0.41-1.00 hectares of land had the highest proportions of Food-for-Work and Midday Meal beneficiary households among six classes of rural households formed on the basis of size of land possessed. The Midday Meal scheme benefited over 10% of rural households in most State/UTs (between 18% and 33% in 12 major States).
Ration cards were held by 81% of rural households and 67% of urban
households. Below Poverty Line (BPL) cards were held by 26.5% of rural households and 10.5% of urban households. Antyodaya card holders formed less than 3% of rural households and less than 1% of urban households. In rural areas, BPL cards were held by 43% of “agricultural labour” households and 32% of “other labour” households. In rural India BPL cards were held by 40% of Scheduled Tribe (ST) households, 35% of Scheduled Caste (SC) households, about 25% of Other Backward Classes (OBC) households, and 17% of the remaining households. In urban areas, however, it was the Scheduled Castes which had the highest percentage (17%) of households holding BPL cards, while ST and OBC households had about 14% each.
As many as 51% of rural households possessing less than 0.01 hectares of land had no ration card at all, while in all other size classes 77-86% households held a ration card of some type. In respect of ration cards meant for the poor, the class possessing “0.01-0.40 hectares” was the one with the highest proportion of cards for both BPL (32%) and Antyodaya (4%).
51% of households in the lowest size class “<0.01 hectares” had no ration card at all, while in all other size classes 77-86% households had a ration card of some kind. The highest proportion of households with ration cards was 86%, seen in the classes “0.41-1.00 hectares” and “1.01-2.00 hectares”. In respect of ration cards meant for the poor, the class “0.01-0.40 hectares” was the class of households with the highest proportion of cards for both BPL (32%) and Antyodaya (4%). It was followed by the class “0.41-1.00 hectares” (BPL, about 28%, Antyodaya, 3%). The bottom class “<0.01 hectares” had 22% of its members holding BPL cards, but this was smaller than the overall proportion of BPL card holders taking all classes together (26.5%). Likewise, Antyodaya cards were held by 2.7% of households in the bottom class, compared to 2.9% for all households.
32
Iodine is an important micronutrient. A lack of iodine in the diet can lead to Iodine Deficiency Disorders (IDD), which can cause miscarriages, stillbirths, brain disorders, and retarded psychomotor development, speech and hearing impairments, and depleted levels of energy in children. Iodine deficiency is the single most important and preventable cause of mental retardation worldwide. Iodine deficiency can be avoided by using salt that has been fortified with iodine. As per NFHS-3 (2005-06), just over half (51 percent) of the households were using salt that was adequately iodized. There was virtually no change since the time of NFHS-2 (1998-99), when 50 percent of households were using adequately iodized salt. In NFHS-3, 25 percent of households were using salt that was inadequately iodized, and the remaining 25 percent were using salt that was not iodized at all. The use of adequately iodized salt was much higher in urban areas (72 percent) than in rural areas (41 percent). There is a sharp and steady rise in the use of adequately iodized salt as the income of the household increases. Eighty-five percent of households in the highest income quintile use adequately iodized salt, compared with only 30 percent of households in the lowest income quintile.
The consumption of a wide variety of nutritious foods is important for
women’s and men’s health. Adequate amounts of protein, fat, carbohydrates, vitamins, and minerals are required for a well-balanced diet. Meat, fish, eggs, and milk, as well as pulses and nuts, are rich in protein. Dark green, leafy vegetables are a rich source of iron, folic acid, vitamin C, carotene, riboflavin, and calcium. Many fruits are also good sources of vitamin C. Bananas are rich in carbohydrates. Papayas, mangoes, and other yellow fruits contain carotene, which is converted to vitamin A. Vitamin A is also present in milk and milk products, as well as egg yolks.
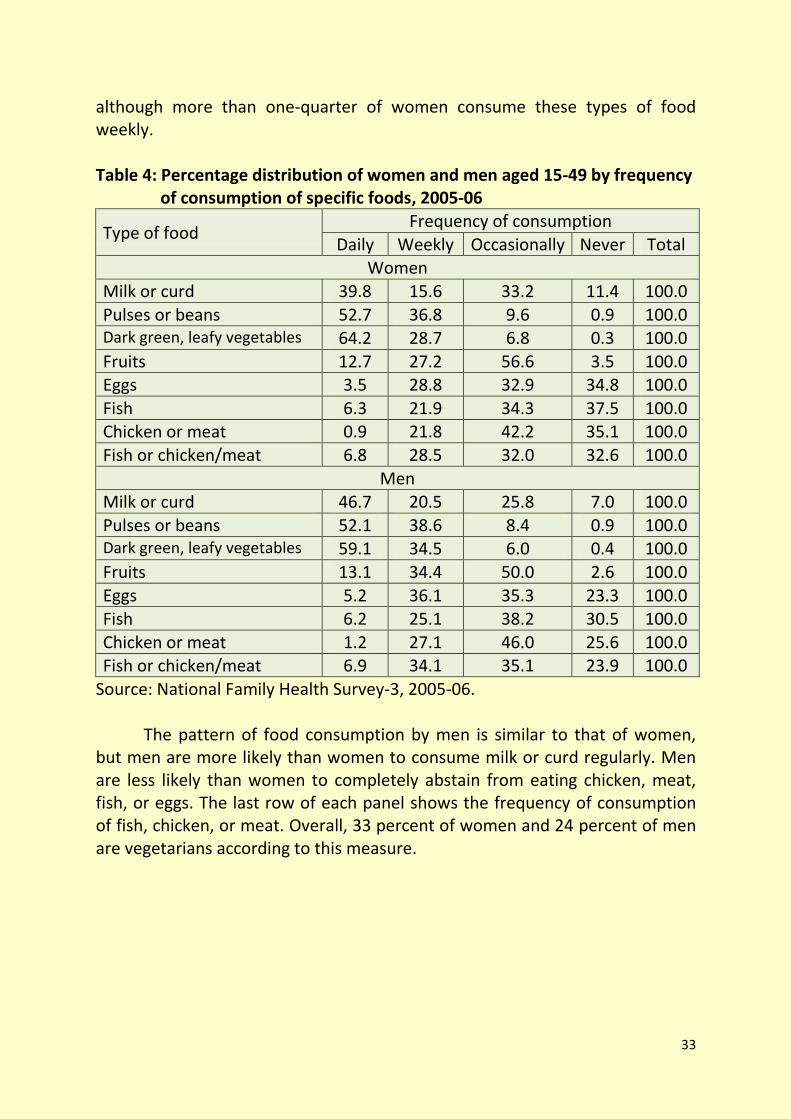
NFHS-3 asked women and men how often they consume various types
of food (daily, weekly, occasionally, or never). Among these food groups, women consume dark green, leafy vegetables most often. Almost two-thirds of women consume dark green, leafy vegetables daily and an additional 29 percent consume them weekly. More than half of women (53 percent) consume pulses or beans daily and an additional 37 percent consume them weekly. Milk or curd is consumed daily by 40 percent of women and weekly by 16 percent of women, but 11 percent never consume milk or curd and 33 percent consume milk or curd only occasionally. Consumption of fruits is less common. Sixty percent of women do not consume fruits even once a week. Very few women consume chicken, meat, fish, or eggs on a daily basis,
33
although more than one-quarter of women consume these types of food weekly.
Table 4: Percentage distribution of women and men aged 15-49 by frequency
of consumption of specific foods, 2005-06
Type of food Frequency of consumption
Daily Weekly Occasionally Never Total Women
Milk or curd 39.8 15.6 33.2 11.4 100.0
Pulses or beans 52.7 36.8 9.6 0.9 100.0
Dark green, leafy vegetables 64.2 28.7 6.8 0.3 100.0
Fruits 12.7 27.2 56.6 3.5 100.0
Eggs 3.5 28.8 32.9 34.8 100.0
Fish 6.3 21.9 34.3 37.5 100.0
Chicken or meat 0.9 21.8 42.2 35.1 100.0
Fish or chicken/meat 6.8 28.5 32.0 32.6 100.0
Men Milk or curd 46.7 20.5 25.8 7.0 100.0
Pulses or beans 52.1 38.6 8.4 0.9 100.0
Dark green, leafy vegetables 59.1 34.5 6.0 0.4 100.0
Fruits 13.1 34.4 50.0 2.6 100.0
Eggs 5.2 36.1 35.3 23.3 100.0
Fish 6.2 25.1 38.2 30.5 100.0
Chicken or meat 1.2 27.1 46.0 25.6 100.0
Fish or chicken/meat 6.9 34.1 35.1 23.9 100.0
Source: National Family Health Survey-3, 2005-06. The pattern of food consumption by men is similar to that of women, but men are more likely than women to consume milk or curd regularly. Men are less likely than women to completely abstain from eating chicken, meat, fish, or eggs. The last row of each panel shows the frequency of consumption of fish, chicken, or meat. Overall, 33 percent of women and 24 percent of men are vegetarians according to this measure.
34
Goal 4 Ensure a Robust Pro-Poor Growth Process
SDGs Indicators
1. Budgetary expenditure for pro-poor growth sectors as share of GDP and of total government expenditure
2. Proportion of poor covered by micro-credit and similar programmes 3. Reduction of income/consumption inequality (Gini Coefficient) 4. Rate of growth of employment 5. Assets ownership by poor
The global economic and financial crisis which has persisted for the last five years has not only exposed the vulnerability of almost all the countries over the globe to external shocks, but also has lessons for development planning. Countries need to have inbuilt social safety nets for facing such eventualities, which affect the weak and vulnerable the most, and wipe out the fruits of growth for years. India with its focus on inclusive development and timely interventions has, however, been able to weather the crisis better than many other countries.
India is on the brink of a demographic revolution with the proportion of working-age population between 15 and 59 years likely to increase from approximately 58 per cent in 2001 to more than 64 per cent by 2021, adding approximately 63.5 million new entrants to the working age group between 2011 and 2016, the bulk of whom will be in the relatively younger age group of 20-35 years. Given that it is one of the youngest large nations in the world, human development assumes great economic significance for it as the demographic dividend can be reaped only if this young population is healthy, educated, and skilled. The emphasis on human development also gains significance in the light of our major social indicators in the recent past being less encouraging than those of our neighbours like Bangladesh and Sri Lanka. Therefore policy planners in India have, over the years, engaged themselves in making more inclusive growth and development policies, focusing on human development. This approach has been reflected in the substantial enhancement in budgetary support for major social-sector programmes during 2012-13 like the Pradhan Mantri Gram Sadak Yojana (PMGSY), Backward Regions Grant Fund, Right to Education (RTE)-Sarv Shiksha Abhiyan (SSA),
35
Rashtriya Madhyamik Shiksha Abhiyan, National Rural Health Mission (NRHM), and rural drinking water and sanitation schemes.
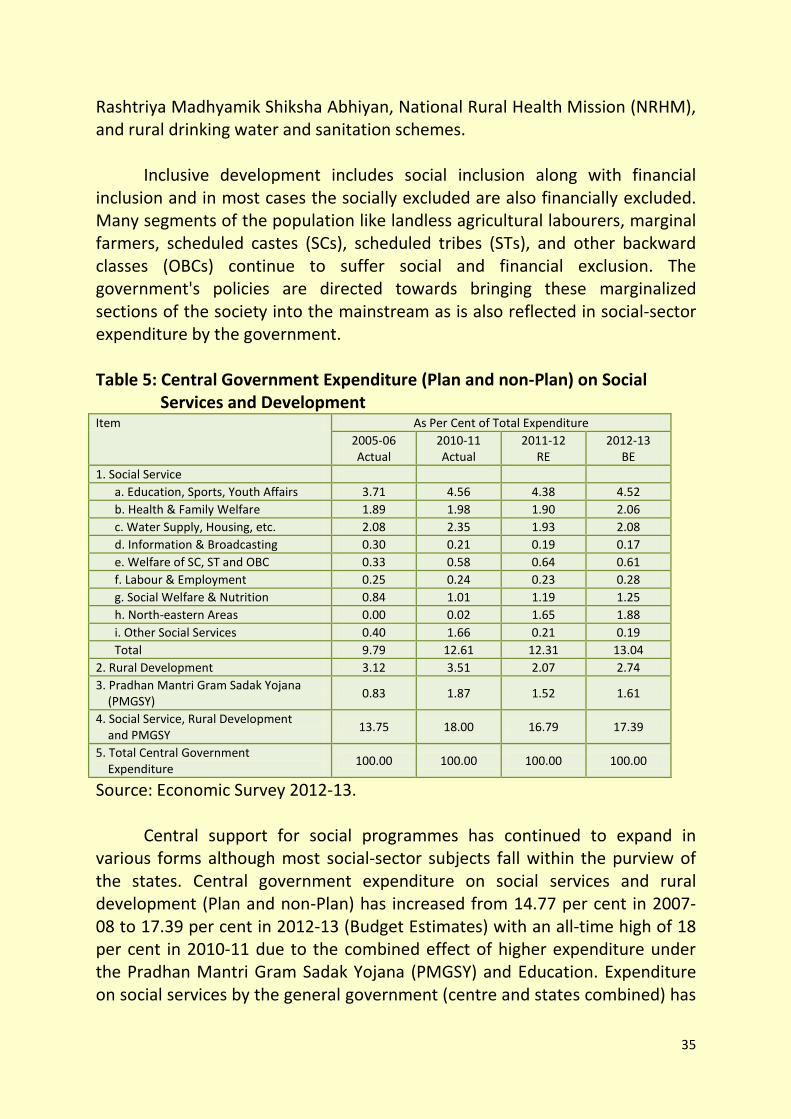
Inclusive development includes social inclusion along with financial inclusion and in most cases the socially excluded are also financially excluded. Many segments of the population like landless agricultural labourers, marginal farmers, scheduled castes (SCs), scheduled tribes (STs), and other backward classes (OBCs) continue to suffer social and financial exclusion. The government's policies are directed towards bringing these marginalized sections of the society into the mainstream as is also reflected in social-sector expenditure by the government. Table 5: Central Government Expenditure (Plan and non-Plan) on Social
Services and Development Item As Per Cent of Total Expenditure
2005-06 Actual
2010-11 Actual
2011-12 RE
2012-13 BE
1. Social Service
a. Education, Sports, Youth Affairs 3.71 4.56 4.38 4.52
b. Health & Family Welfare 1.89 1.98 1.90 2.06
c. Water Supply, Housing, etc. 2.08 2.35 1.93 2.08
d. Information & Broadcasting 0.30 0.21 0.19 0.17
e. Welfare of SC, ST and OBC 0.33 0.58 0.64 0.61
f. Labour & Employment 0.25 0.24 0.23 0.28
g. Social Welfare & Nutrition 0.84 1.01 1.19 1.25
h. North-eastern Areas 0.00 0.02 1.65 1.88
i. Other Social Services 0.40 1.66 0.21 0.19
Total 9.79 12.61 12.31 13.04
2. Rural Development 3.12 3.51 2.07 2.74
3. Pradhan Mantri Gram Sadak Yojana (PMGSY)
0.83 1.87 1.52 1.61
4. Social Service, Rural Development and PMGSY
13.75 18.00 16.79 17.39
5. Total Central Government Expenditure
100.00 100.00 100.00 100.00
Source: Economic Survey 2012-13.
Central support for social programmes has continued to expand in various forms although most social-sector subjects fall within the purview of the states. Central government expenditure on social services and rural development (Plan and non-Plan) has increased from 14.77 per cent in 2007-08 to 17.39 per cent in 2012-13 (Budget Estimates) with an all-time high of 18 per cent in 2010-11 due to the combined effect of higher expenditure under the Pradhan Mantri Gram Sadak Yojana (PMGSY) and Education. Expenditure on social services by the general government (centre and states combined) has
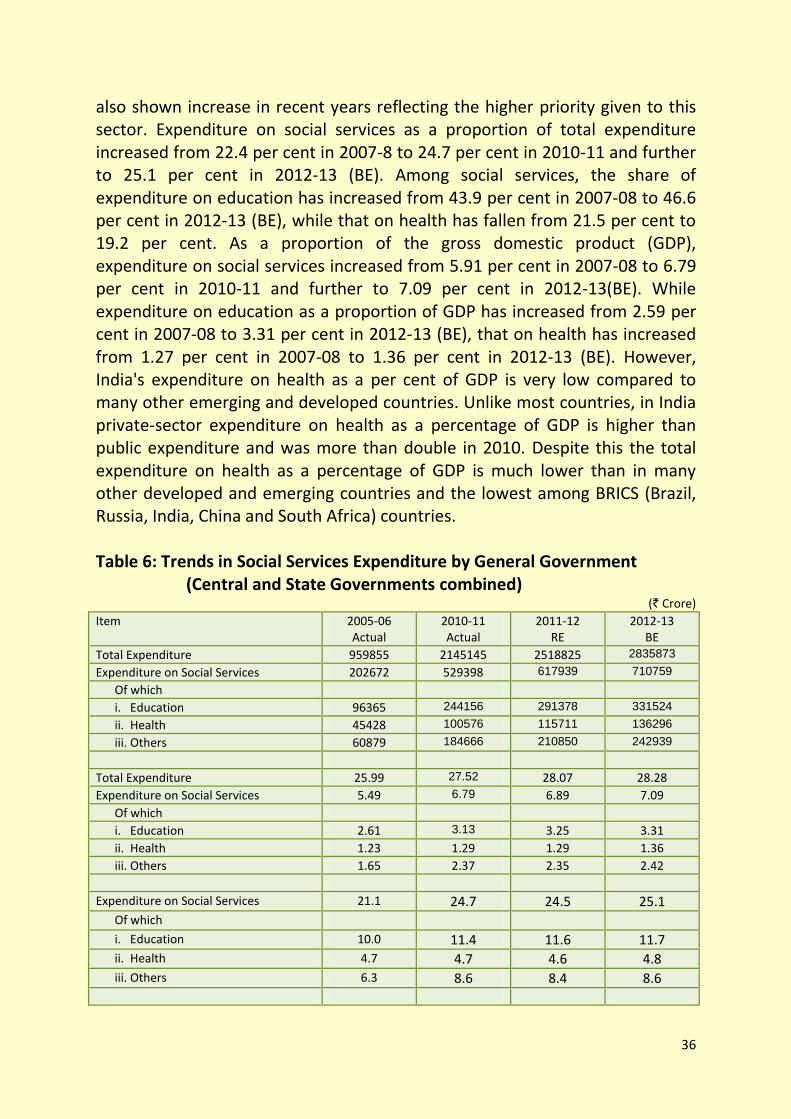
36
also shown increase in recent years reflecting the higher priority given to this sector. Expenditure on social services as a proportion of total expenditure increased from 22.4 per cent in 2007-8 to 24.7 per cent in 2010-11 and further to 25.1 per cent in 2012-13 (BE). Among social services, the share of expenditure on education has increased from 43.9 per cent in 2007-08 to 46.6 per cent in 2012-13 (BE), while that on health has fallen from 21.5 per cent to 19.2 per cent. As a proportion of the gross domestic product (GDP), expenditure on social services increased from 5.91 per cent in 2007-08 to 6.79 per cent in 2010-11 and further to 7.09 per cent in 2012-13(BE). While expenditure on education as a proportion of GDP has increased from 2.59 per cent in 2007-08 to 3.31 per cent in 2012-13 (BE), that on health has increased from 1.27 per cent in 2007-08 to 1.36 per cent in 2012-13 (BE). However, India's expenditure on health as a per cent of GDP is very low compared to many other emerging and developed countries. Unlike most countries, in India private-sector expenditure on health as a percentage of GDP is higher than public expenditure and was more than double in 2010. Despite this the total expenditure on health as a percentage of GDP is much lower than in many other developed and emerging countries and the lowest among BRICS (Brazil, Russia, India, China and South Africa) countries. Table 6: Trends in Social Services Expenditure by General Government
(Central and State Governments combined) (` Crore)
Item 2005-06 Actual
2010-11 Actual
2011-12 RE
2012-13 BE
Total Expenditure 959855 2145145 2518825 2835873
Expenditure on Social Services 202672 529398 617939 710759
Of which
i. Education 96365 244156 291378 331524
ii. Health 45428 100576 115711 136296
iii. Others 60879 184666 210850 242939
Total Expenditure 25.99 27.52 28.07 28.28
Expenditure on Social Services 5.49 6.79 6.89 7.09
Of which
i. Education 2.61 3.13 3.25 3.31
ii. Health 1.23 1.29 1.29 1.36
iii. Others 1.65 2.37 2.35 2.42
Expenditure on Social Services 21.1 24.7 24.5 25.1 Of which i. Education 10.0 11.4 11.6 11.7 ii. Health 4.7 4.7 4.6 4.8 iii. Others 6.3 8.6 8.4 8.6
37
i. Education 47.5 46.1 47.2 46.6 ii. Health 22.4 19.0 18.7 19.2 iii. Others 30.0 34.9 34.1 34.2
Source: Economic Survey 2012-13
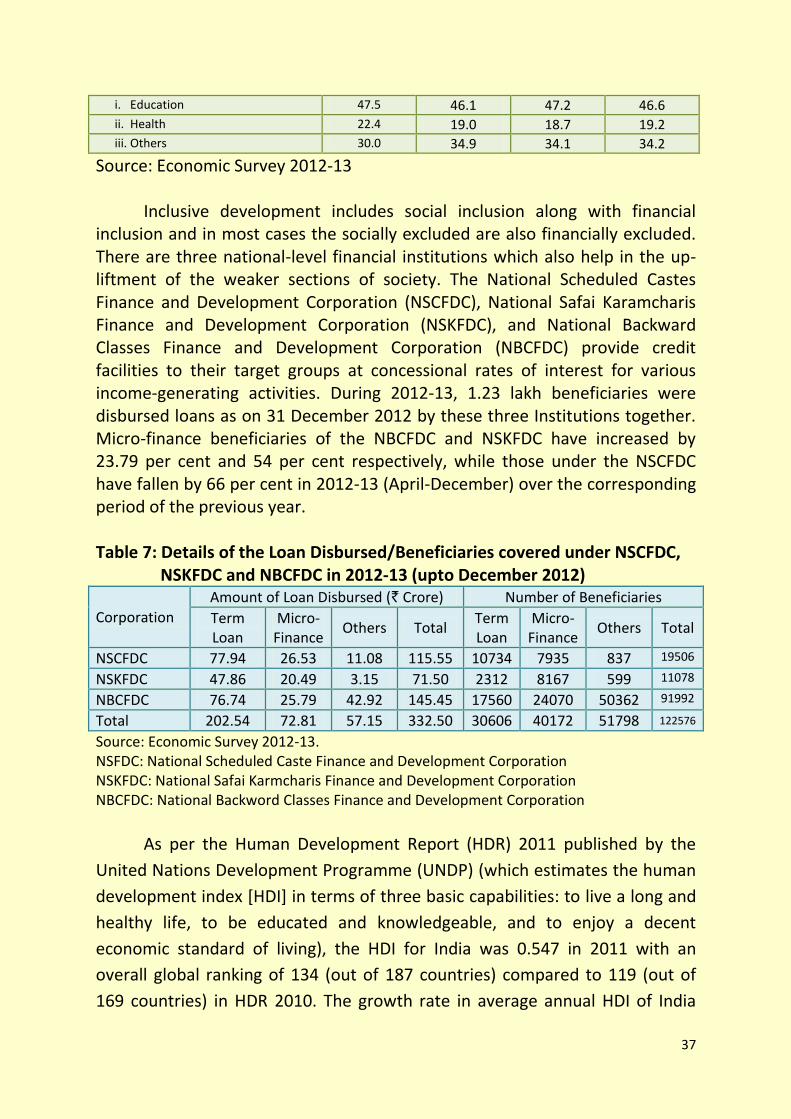
Inclusive development includes social inclusion along with financial inclusion and in most cases the socially excluded are also financially excluded. There are three national-level financial institutions which also help in the up-liftment of the weaker sections of society. The National Scheduled Castes Finance and Development Corporation (NSCFDC), National Safai Karamcharis Finance and Development Corporation (NSKFDC), and National Backward Classes Finance and Development Corporation (NBCFDC) provide credit facilities to their target groups at concessional rates of interest for various income-generating activities. During 2012-13, 1.23 lakh beneficiaries were disbursed loans as on 31 December 2012 by these three Institutions together. Micro-finance beneficiaries of the NBCFDC and NSKFDC have increased by 23.79 per cent and 54 per cent respectively, while those under the NSCFDC have fallen by 66 per cent in 2012-13 (April-December) over the corresponding period of the previous year.
Table 7: Details of the Loan Disbursed/Beneficiaries covered under NSCFDC,
NSKFDC and NBCFDC in 2012-13 (upto December 2012)
Corporation
Amount of Loan Disbursed (` Crore) Number of Beneficiaries
Term Loan
Micro-Finance
Others Total Term Loan
Micro-Finance
Others Total
NSCFDC 77.94 26.53 11.08 115.55 10734 7935 837 19506
NSKFDC 47.86 20.49 3.15 71.50 2312 8167 599 11078
NBCFDC 76.74 25.79 42.92 145.45 17560 24070 50362 91992
Total 202.54 72.81 57.15 332.50 30606 40172 51798 122576
Source: Economic Survey 2012-13. NSFDC: National Scheduled Caste Finance and Development Corporation NSKFDC: National Safai Karmcharis Finance and Development Corporation NBCFDC: National Backword Classes Finance and Development Corporation
As per the Human Development Report (HDR) 2011 published by the
United Nations Development Programme (UNDP) (which estimates the human
development index [HDI] in terms of three basic capabilities: to live a long and
healthy life, to be educated and knowledgeable, and to enjoy a decent
economic standard of living), the HDI for India was 0.547 in 2011 with an
overall global ranking of 134 (out of 187 countries) compared to 119 (out of
169 countries) in HDR 2010. The growth rate in average annual HDI of India
38
between 2000-11 is among the highest, a finding also corroborated by the
India Human Development Report (IHDR) 2011 brought out by the Institute of
Applied Manpower Research and the Planning Commission. According to the
IHDR, HDI between 1999-2000 and 2007-8 has increased by 21 per cent, with
an improvement of over 28 per cent in education being the main driver.
HDR measures inequality in terms of two indicators. The first indicator is
the income Gini coefficient which measures the deviation of distribution of
income (or consumption) among the individuals within a country from a
perfectly equal distribution. For India, the income Gini coefficient was 36.8 in
2010-11. In this respect, inequality in India is lower than many other
developing countries e.g. South Africa (57.8), Brazil (53.9), Thailand (53.6),
Turkey (40.8), China (41.5), Sri Lanka (40.3), Malaysia (46.2), Vietnam (37.6), as
well as countries like USA (40.8), Hong Kong (43.4), Argentina (45.8), Israel
(39.2), Bulgaria (45.3) etc., which are otherwise ranked very high in terms of
human development index. The second indicator is the quintile income ratio,
which is a measure of average income of the richest 20 per cent of the
population to that of poorest 20 per cent. The quintile income ratio for India
was 5.6 in 2010-11. Countries like Australia (7.0), the USA (8.5), New Zealand
(6.8), Singapore (9.8), the UK (7.8), Argentina (12.3), Mexico (14.4), Malaysia
(11.4), Philippines (9.0), Vietnam (6.2) had higher ratios. This implies that the
inequality between the top and bottom quintiles in India was lower than a
large number of countries.
To estimate the rural-urban gap, the monthly per capita expenditure
(MPCE) defined first at household level to assign a value that indicates the level
of living to each individual or household is used. According to the provisional
findings of the 68th round (2011-12) of the NSS, average MPCE (Uniform
Reference Period [URP] based) is `1281.45 and `2401.68 respectively for rural
and urban India indicating rural-urban income disparities. However, monthly
per capita rural consumption rose by 18 per cent in real terms in 2011-12 over
2009-10, while monthly per capita urban consumption rose by only 13.3 per
cent. Thus the rate of increase in the MPCE of rural areas is higher than that of
urban areas, indicating a bridging of the rural-urban gap (Table 13.6). Out of
the MPCE, the share of food as per 66th round NSS data (2009-10) is `600 (57
39
per cent) and `881(44 per cent) for rural and urban India respectively, showing
a higher share for food in rural compared to urban India.
The last decade, i.e. 1999-2000 to 2009-10, witnessed an employment growth of 1.6 per cent per annum based on usual principal and subsidiary status (UPSS). Employment growth in second half of the decade was relatively modest. This, as per NSSO survey 2009-10, was largely on account of a lower labour force participation rate (LFPR), across all ages in 2009-10 vis-à-vis 2004-05. Labour force participation rate, which reflects the persons who express their willingness to work declined from 430 per thousand persons in 2004-05 to 400 per thousand persons in 2009-10. The LFPR declined particularly for rural females. The growth of those in labour force declined possibly on account of greater number of persons opting for education/skill development. Studies using NSS data show that there has been a steady increase in the ratio of students to total population from 20.5 per cent in 1993-4 to 24.3 per cent in 2004-5 and further to 26.6 per cent in 2009-10 (Jayan Jose Thomas, EPW, December 22, 2012) and this largely explains the modest growth in employment in second half of 2000-10. The students to population ratio increased faster in rural areas and more so for females. It may, however, be mentioned that the unemployment rate, according to UPSS criteria, in fact declined between 2004-05 and 2009-10, both in rural and urban areas, implying that relatively larger proportions of persons who were willing to work, were actually employed.
An increased intensity of employment is also reflected by an overall increased availability of employment to workers based on current daily status (CDS). The CAGR of employment on CDS basis for the period 2004-05 to 2009-10 is 1.11 per cent per annum which is significantly higher than the growth of employment in UPSS terms. One development of interest is the loss in female employment in rural areas using both UPSS and CDS methods and loss in female employment in urban areas on UPSS basis. One of the reasons for this is a significant number of women (137 million in 2009-10) opted not to work to continue education. But total employment (rural and urban combined of males and females combined) is positive on both methods.
The unemployment rate increased at a slow pace on UPSS basis and at a relatively higher pace on CDS basis from 1993-4 to 2004-5. However, in 2009-10 there was a fall in the unemployment rate which was relatively more on CDS basis. Despite negligible employment growth, the unemployment rate (CDS method) fell from 8.2 per cent in 2004-5 to 6.6 per cent in 2009-10. The
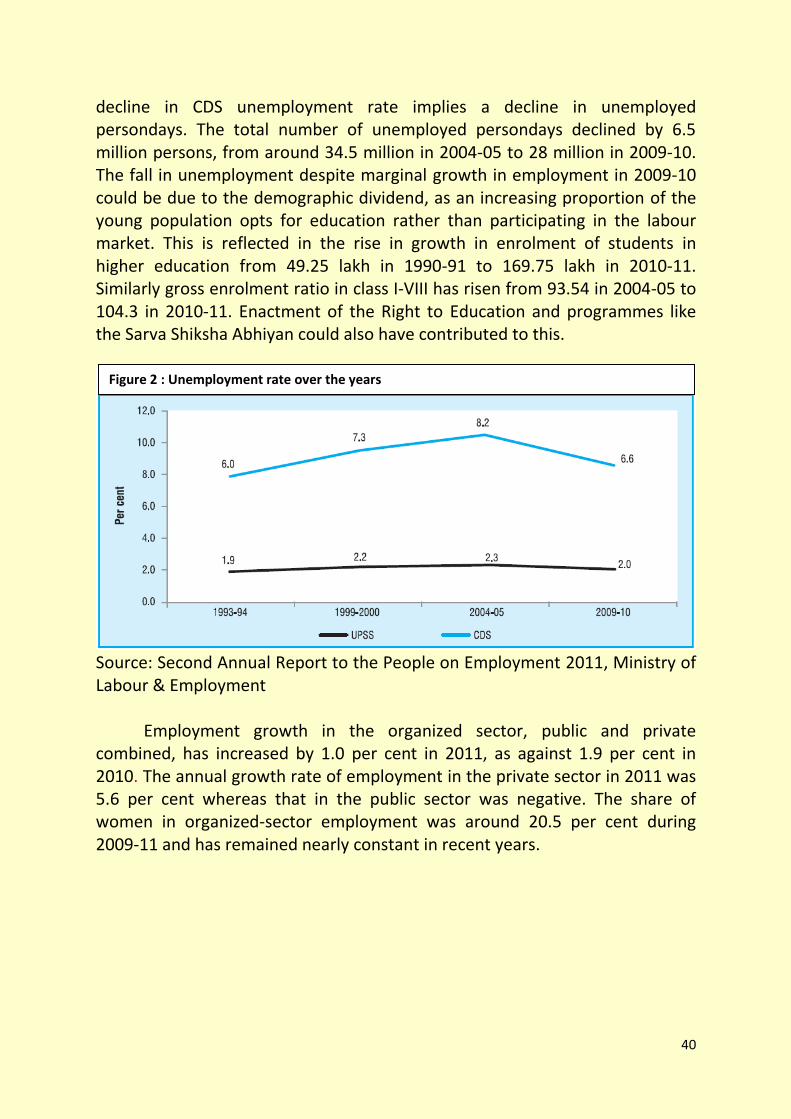
40
decline in CDS unemployment rate implies a decline in unemployed persondays. The total number of unemployed persondays declined by 6.5 million persons, from around 34.5 million in 2004-05 to 28 million in 2009-10. The fall in unemployment despite marginal growth in employment in 2009-10 could be due to the demographic dividend, as an increasing proportion of the young population opts for education rather than participating in the labour market. This is reflected in the rise in growth in enrolment of students in higher education from 49.25 lakh in 1990-91 to 169.75 lakh in 2010-11. Similarly gross enrolment ratio in class I-VIII has risen from 93.54 in 2004-05 to 104.3 in 2010-11. Enactment of the Right to Education and programmes like the Sarva Shiksha Abhiyan could also have contributed to this.
Source: Second Annual Report to the People on Employment 2011, Ministry of Labour & Employment
Employment growth in the organized sector, public and private combined, has increased by 1.0 per cent in 2011, as against 1.9 per cent in 2010. The annual growth rate of employment in the private sector in 2011 was 5.6 per cent whereas that in the public sector was negative. The share of women in organized-sector employment was around 20.5 per cent during 2009-11 and has remained nearly constant in recent years.
Figure 2 : Unemployment rate over the years
41
Goal 5 Strengthen Connectivity of Poorer Regions
and of Poor as Social Group
SDGs Indicators
1. Transport connectivity for the poor in rural areas 2. Communications connectivity 3. Proportion of rural population having access to electricity 4. Representation of the excluded groups in local government 5. Mass media connectivity
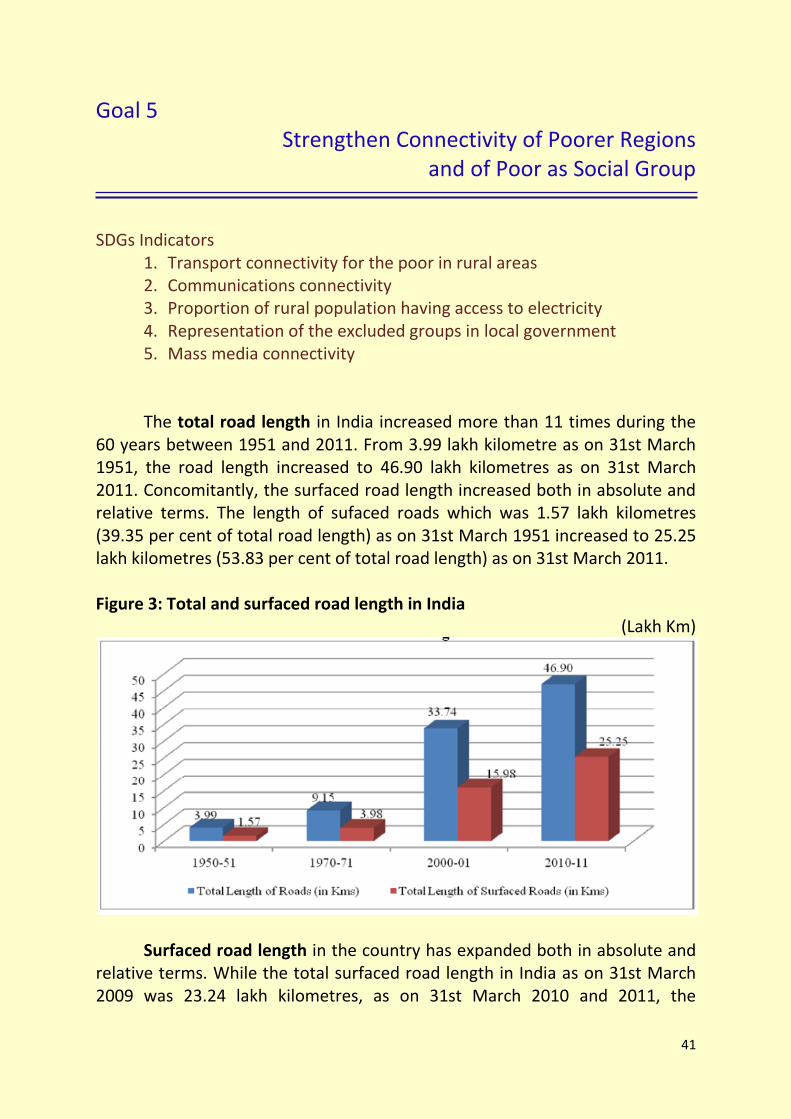
The total road length in India increased more than 11 times during the 60 years between 1951 and 2011. From 3.99 lakh kilometre as on 31st March 1951, the road length increased to 46.90 lakh kilometres as on 31st March 2011. Concomitantly, the surfaced road length increased both in absolute and relative terms. The length of sufaced roads which was 1.57 lakh kilometres (39.35 per cent of total road length) as on 31st March 1951 increased to 25.25 lakh kilometres (53.83 per cent of total road length) as on 31st March 2011.
Figure 3: Total and surfaced road length in India
(Lakh Km)
Surfaced road length in the country has expanded both in absolute and relative terms. While the total surfaced road length in India as on 31st March 2009 was 23.24 lakh kilometres, as on 31st March 2010 and 2011, the

42
corresponding figures were 24.33 lakh kilometres and 25.25 lakh kilometres, respectively. Surfaced road length as a proportion of the total road network in the country increased from 51.98 per cent as on 31st March 2009 to 53.09 per cent as on 31st March 2010 to 53.83 per cent as on 31st March 2011. Table 8: Total and Surfaced Road Length by Categories in India
(Length in Km, as on 31st March)
Source: Basic Road Statistics 2010-11, Ministry of Road Transport & Highways
In the past five years, from 2007 to 2011, the road network in the country increased by 6.74 lakh kilometres; from 40.16 lakh kilometres as on 31st March 2007 to 46.90 lakh kilometres as on 31st March 2011 (Table 2). The largest incremental increase of 3.56 lakh kilometres was in the length of rural roads. The second highest addition in road length during 2007 to 2011 was by Other PWD roads (1.70 lakh kilometres). Urban roads added a significant length of 1.11 lakh kilometres of roads during the same period. The incremental increase in National Highways, State Highways and Project roads were 4,344 kilometres, 11,663 kilometres and 20,034 kilometres, respectively.
In terms of share in total road length, rural roads constituted the largest share of 59 per cent as on 31st March 2011. This was followed by Other PWD roads (21 per cent), Urban roads (9 per cent), Project roads (6 per cent), State Highways (3 per cent) and National Highways (2 per cent).
43
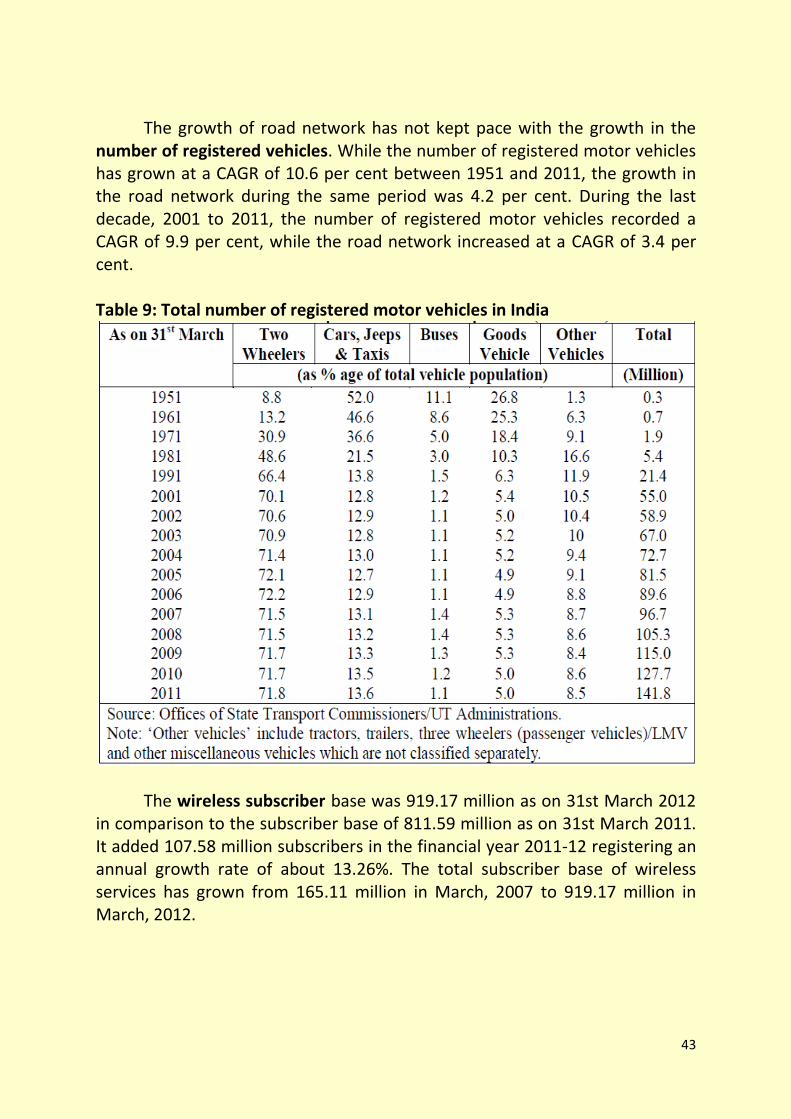
The growth of road network has not kept pace with the growth in the number of registered vehicles. While the number of registered motor vehicles has grown at a CAGR of 10.6 per cent between 1951 and 2011, the growth in the road network during the same period was 4.2 per cent. During the last decade, 2001 to 2011, the number of registered motor vehicles recorded a CAGR of 9.9 per cent, while the road network increased at a CAGR of 3.4 per cent. Table 9: Total number of registered motor vehicles in India
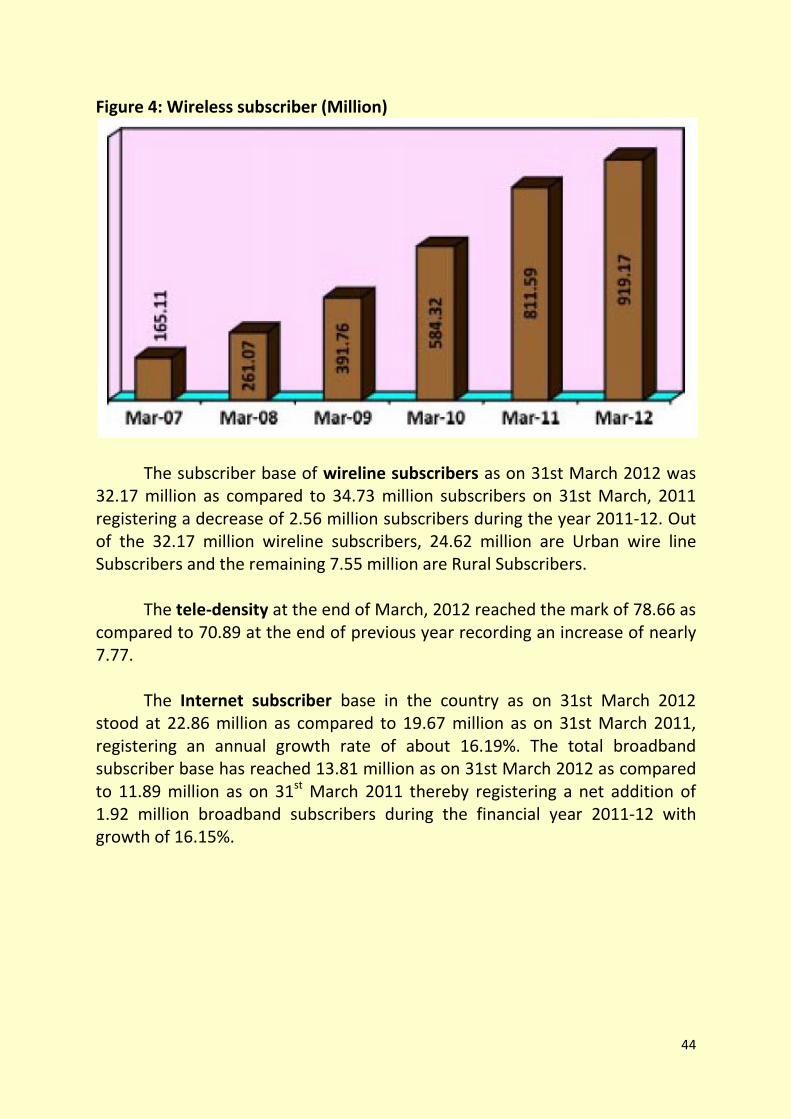
The wireless subscriber base was 919.17 million as on 31st March 2012 in comparison to the subscriber base of 811.59 million as on 31st March 2011. It added 107.58 million subscribers in the financial year 2011-12 registering an annual growth rate of about 13.26%. The total subscriber base of wireless services has grown from 165.11 million in March, 2007 to 919.17 million in March, 2012.
44
Figure 4: Wireless subscriber (Million)
The subscriber base of wireline subscribers as on 31st March 2012 was
32.17 million as compared to 34.73 million subscribers on 31st March, 2011 registering a decrease of 2.56 million subscribers during the year 2011-12. Out of the 32.17 million wireline subscribers, 24.62 million are Urban wire line Subscribers and the remaining 7.55 million are Rural Subscribers.
The tele-density at the end of March, 2012 reached the mark of 78.66 as compared to 70.89 at the end of previous year recording an increase of nearly 7.77.
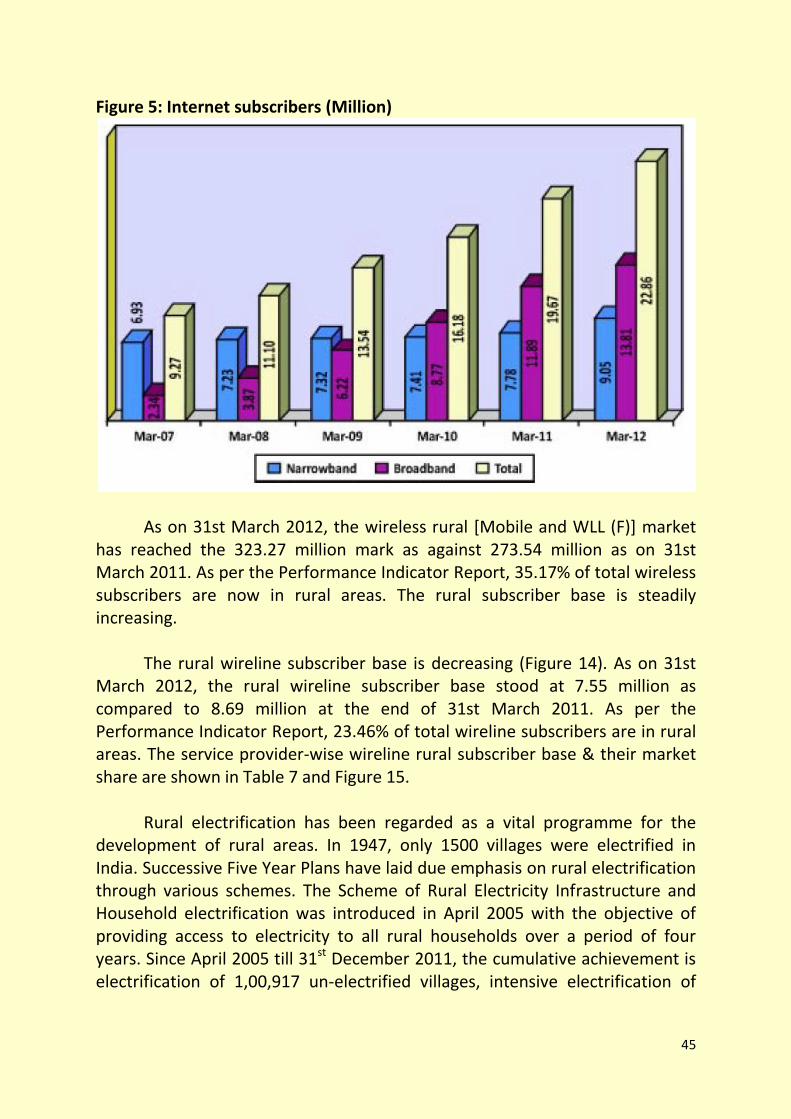
The Internet subscriber base in the country as on 31st March 2012 stood at 22.86 million as compared to 19.67 million as on 31st March 2011, registering an annual growth rate of about 16.19%. The total broadband subscriber base has reached 13.81 million as on 31st March 2012 as compared to 11.89 million as on 31st March 2011 thereby registering a net addition of 1.92 million broadband subscribers during the financial year 2011-12 with growth of 16.15%.
45
Figure 5: Internet subscribers (Million)
As on 31st March 2012, the wireless rural [Mobile and WLL (F)] market
has reached the 323.27 million mark as against 273.54 million as on 31st March 2011. As per the Performance Indicator Report, 35.17% of total wireless subscribers are now in rural areas. The rural subscriber base is steadily increasing.
The rural wireline subscriber base is decreasing (Figure 14). As on 31st March 2012, the rural wireline subscriber base stood at 7.55 million as compared to 8.69 million at the end of 31st March 2011. As per the Performance Indicator Report, 23.46% of total wireline subscribers are in rural areas. The service provider-wise wireline rural subscriber base & their market share are shown in Table 7 and Figure 15.
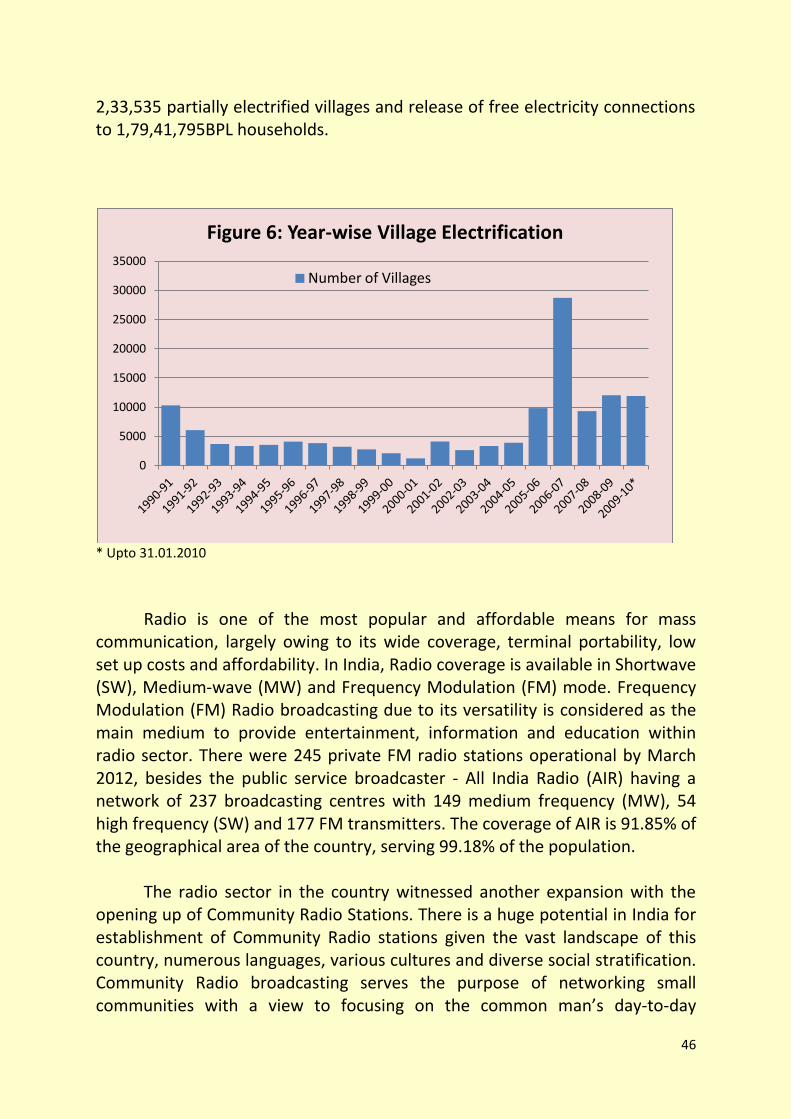
Rural electrification has been regarded as a vital programme for the development of rural areas. In 1947, only 1500 villages were electrified in India. Successive Five Year Plans have laid due emphasis on rural electrification through various schemes. The Scheme of Rural Electricity Infrastructure and Household electrification was introduced in April 2005 with the objective of providing access to electricity to all rural households over a period of four years. Since April 2005 till 31st December 2011, the cumulative achievement is electrification of 1,00,917 un-electrified villages, intensive electrification of
46
2,33,535 partially electrified villages and release of free electricity connections to 1,79,41,795BPL households.
* Upto 31.01.2010
Radio is one of the most popular and affordable means for mass
communication, largely owing to its wide coverage, terminal portability, low set up costs and affordability. In India, Radio coverage is available in Shortwave (SW), Medium-wave (MW) and Frequency Modulation (FM) mode. Frequency Modulation (FM) Radio broadcasting due to its versatility is considered as the main medium to provide entertainment, information and education within radio sector. There were 245 private FM radio stations operational by March 2012, besides the public service broadcaster - All India Radio (AIR) having a network of 237 broadcasting centres with 149 medium frequency (MW), 54 high frequency (SW) and 177 FM transmitters. The coverage of AIR is 91.85% of the geographical area of the country, serving 99.18% of the population.
The radio sector in the country witnessed another expansion with the
opening up of Community Radio Stations. There is a huge potential in India for establishment of Community Radio stations given the vast landscape of this country, numerous languages, various cultures and diverse social stratification. Community Radio broadcasting serves the purpose of networking small communities with a view to focusing on the common man’s day-to-day
0
5000
10000
15000
20000
25000
30000
35000
Figure 6: Year-wise Village Electrification
Number of Villages
47
concerns and helps them realize local aspirations. Given the vast landscape of the country with a multitude of languages, cultures and social stratification, Community Radio Services have an effective presence. CRS is set up with the involvement of various educational institutions and civil society organizations. As on March 2012, out of the 167 licenses issued for the setup of community radio stations, 130 community radio stations have become operational.
There are an estimated 148 million TV homes in India and 94 million
Cable TV subscribers as on 31st March 2012. There are an estimated 60,000 cable operators and 6000 MSOs supporting these subscribers. Further, there are six Pay DTH operators having a subscriber base of 46.25 million by the end of March 2012. The number of channels grew to 831 in 2011-12.
Table 10: Overall status of Broadcasting and Cable TV Services
Source: Annual Report 2011-12, Telecom Regulatory Authority of India.
48
Goal 6 Reduce Social and Institutional Vulnerability
of Poor, Women and Children
SDGs Indicators
1. Proportion of children who are working 2. Share of women in employment 3. Coverage or amount of public expenditure as share of GDP on social
protection of the vulnerable groups 4. Early marriage 5. Birth registration 6. Sex ratio at birth
As per the Child Labour (Prohibition & Regulation) Act, 1986, employment of children below the age of 14 years is prohibited in notified hazardous occupations and processes. The Act also regulates employment of children in non-hazardous occupations and processes. There are at present 16 hazardous occupations and 65 processes, where employment of children is prohibited. Some of the important prohibited occupations and processes are: carpet weaving, building and construction work, brick kilns, production of hosiery goods, work as domestic servants, in tea-shops, road side eateries, mechanized fishing, beverage industry, warehousing, etc. The Act also regulates the working conditions of children in other employments which are not prohibited under the Child Labour (Prohibition & Regulation) Act, 1986.
As per the Census 2001, there are 12.6 million economically active children in the age group of 5 to 14 years, of which approximately 0.12 million are working in hazardous occupations. As per the NSS, Worker Participation Rate (WPR) for children in the age group of 5 to 14 years shows a declining trend between the period 1993-94 and 2007-08. The reduction in WPR for both male and female children in rural areas was from 6 per cent in 1993-94 to 2 per cent in 2007-08. In the urban areas, the reduction in WPR for male children was from 4 per cent in 1993-94 to 2 per cent in 2007-08 and for female children from 3 per cent to 1 per cent.
Women form an integral part of the Indian workforce. According to the
Census 2001, the work participation rate for women was 25.63 per cent in
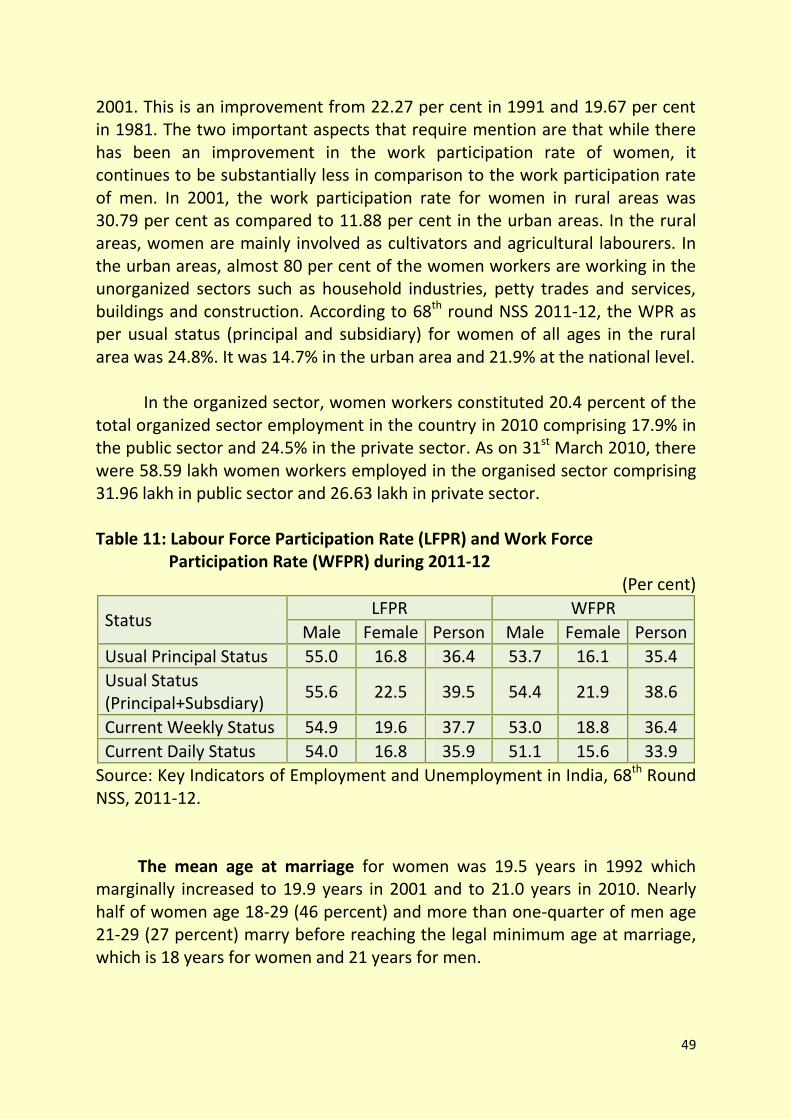
49
2001. This is an improvement from 22.27 per cent in 1991 and 19.67 per cent in 1981. The two important aspects that require mention are that while there has been an improvement in the work participation rate of women, it continues to be substantially less in comparison to the work participation rate of men. In 2001, the work participation rate for women in rural areas was 30.79 per cent as compared to 11.88 per cent in the urban areas. In the rural areas, women are mainly involved as cultivators and agricultural labourers. In the urban areas, almost 80 per cent of the women workers are working in the unorganized sectors such as household industries, petty trades and services, buildings and construction. According to 68th round NSS 2011-12, the WPR as per usual status (principal and subsidiary) for women of all ages in the rural area was 24.8%. It was 14.7% in the urban area and 21.9% at the national level.
In the organized sector, women workers constituted 20.4 percent of the
total organized sector employment in the country in 2010 comprising 17.9% in the public sector and 24.5% in the private sector. As on 31st March 2010, there were 58.59 lakh women workers employed in the organised sector comprising 31.96 lakh in public sector and 26.63 lakh in private sector.
Table 11: Labour Force Participation Rate (LFPR) and Work Force
Participation Rate (WFPR) during 2011-12 (Per cent)
Status LFPR WFPR
Male Female Person Male Female Person
Usual Principal Status 55.0 16.8 36.4 53.7 16.1 35.4
Usual Status (Principal+Subsdiary)
55.6 22.5 39.5 54.4 21.9 38.6
Current Weekly Status 54.9 19.6 37.7 53.0 18.8 36.4
Current Daily Status 54.0 16.8 35.9 51.1 15.6 33.9
Source: Key Indicators of Employment and Unemployment in India, 68th Round NSS, 2011-12.
The mean age at marriage for women was 19.5 years in 1992 which
marginally increased to 19.9 years in 2001 and to 21.0 years in 2010. Nearly half of women age 18-29 (46 percent) and more than one-quarter of men age 21-29 (27 percent) marry before reaching the legal minimum age at marriage, which is 18 years for women and 21 years for men.
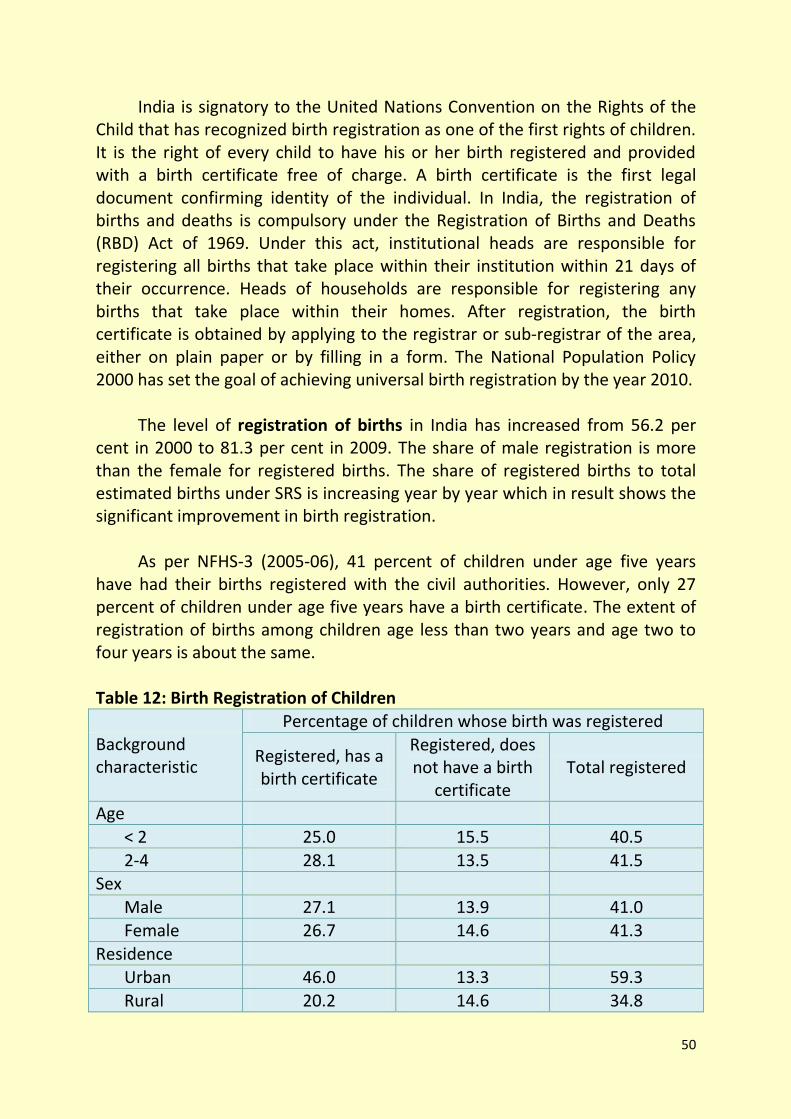
50
India is signatory to the United Nations Convention on the Rights of the Child that has recognized birth registration as one of the first rights of children. It is the right of every child to have his or her birth registered and provided with a birth certificate free of charge. A birth certificate is the first legal document confirming identity of the individual. In India, the registration of births and deaths is compulsory under the Registration of Births and Deaths (RBD) Act of 1969. Under this act, institutional heads are responsible for registering all births that take place within their institution within 21 days of their occurrence. Heads of households are responsible for registering any births that take place within their homes. After registration, the birth certificate is obtained by applying to the registrar or sub-registrar of the area, either on plain paper or by filling in a form. The National Population Policy 2000 has set the goal of achieving universal birth registration by the year 2010.
The level of registration of births in India has increased from 56.2 per
cent in 2000 to 81.3 per cent in 2009. The share of male registration is more than the female for registered births. The share of registered births to total estimated births under SRS is increasing year by year which in result shows the significant improvement in birth registration.
As per NFHS-3 (2005-06), 41 percent of children under age five years have had their births registered with the civil authorities. However, only 27 percent of children under age five years have a birth certificate. The extent of registration of births among children age less than two years and age two to four years is about the same. Table 12: Birth Registration of Children
Background characteristic
Percentage of children whose birth was registered
Registered, has a birth certificate
Registered, does not have a birth
certificate Total registered
Age
< 2 25.0 15.5 40.5
2-4 28.1 13.5 41.5 Sex
Male 27.1 13.9 41.0 Female 26.7 14.6 41.3
Residence Urban 46.0 13.3 59.3
Rural 20.2 14.6 34.8
51
Source: National Family Health Survey - 3, 2005-06.
According to SRS 2011, the sex ratio at birth (number of female per
1000 male) for the country for the period 2009-11 (3-year average) has been
estimated at 906. It varies from 907 in rural area to 900 in urban area. The sex
ratio at birth was 880 (rural 882, urban 872) during 2003-05 which increased to
892 (rural 895, urban 881) during 2004-06, 901 (rural 904, urban 891) during
2005-07, 904 (rural 907, urban 894) during 2006-08, to 906 (rural 909, urban
897) during 2007-09 and to 905 (rural 907, urban 898) during 2008-10.
52
Goal 7 Ensure Access to Affordable Justice
SDGs Indicators
1. Average time required in disposal of legal disputes 2. Access to alternate disputes resolution 3. Access to free legal aid for the poor (marginalized group)
As on 30th November 2011, there were 54,106 cases pending in the Supreme Court of India. As on 30th June 2009, 40,18,914 cases were pending in various High Courts and 2,71,20,108 cases were pending in the Subordinate Courts. The average pendency of cases in the country is 15 years. To reduce the pendency of cases in the courts, Government has encouraged alternative modes of dispute resolution like negotiation, mediation, arbitration, Lok Adalats and setting up of special tribunals like Central Administrative Tribunals, State Administrative Tribunals, Income Tax Appellate Tribunals, Family Courts an Labour Courts.
Lok Adalat is a forum where the disputes/cases pending in the court of
law or at pre-litigation stage are settled/compromised amicably. The Lok Adalat has been given statutory status under the Legal Services Authorities Act, 1987. Under this Act, an award made by a Lok Adalat is deemed to be a decree of a civil court and is final and binding on all parties and no appeal lies against thereto before any court. Upto 30th September 2009, 7.79 lakh Lok Adalats have been held throughout the country in which more than 2.79 crore cases have been settled. In about 17.26 lakh Motor Accident Claim cases, more than `7895.96 crore has been awarded as compensation.
Article 39A of the Constitution of India provides for free legal aid to the
poor and weaker sections of the society and ensures justice for all. Articles 14 and 22(1) of the Constitution also make it obligatory for the State to ensure equality before law and a legal system which promotes justice on the basis of equal opportunity to all. In 1987, the Legal Services Authorities Act was enacted by the Parliament which came into force on 9th November 1995 to establish a nationwide uniform network for providing free and competent legal services to the weaker sections of the society on the basis of equal opportunity. The National Legal Services Authority (NALSA) has been
53
constituted under the Legal Services Authority Act, 1987 to monitor and evaluate implementation of legal aid programmes and to lay down policies and principles for making legal services available under the Act.
In every State, a State Legal Services Authority and in every High Court, a High Court Legal Services Committee have been constituted. District Legal Services Authorities and Taluk Legal Services Committees have been constituted in the Districts and most of the Taluks to give effect to the policies and directions of the NALSA and to provide free legal services to the people and conduct Lok Adalats in the State. Supreme Court Legal Services Committee has been constituted to administer and implement the legal services programme in so far as it relates to Supreme Court of India. The main functions of these Authorities and Committees are to (i) provide free legal services to the eligible persons, (ii) organize Lok Adlats for amicable settlement of disputes, and (iii) organize legal awareness camps in the rural areas. The free legal services include payment of court fee, process fee and all other charges payable or incurred in connection with any legal proceedings, providing advocate in legal proceedings, etc. Eligible persons for getting free legal services include women and children; members of SC/ST; industrial workmen, victims of mass disaster, violence, flood, drought, earthquake, industrial disaster; disabled persons; persons in custody; persons whose annual income does not exceed `50,000/-; and victims of trafficking in human beings or beggar. Upto 30th September 2009, 99.29 lakh persons have benefitted through legal aid and advice throughout the country in which 13.98 lakh persons belonged to SC and 4.74 lakh persons belonged to ST. More than 10.43 lakh women and about 2.49 lakh persons in custody were also benefitted.
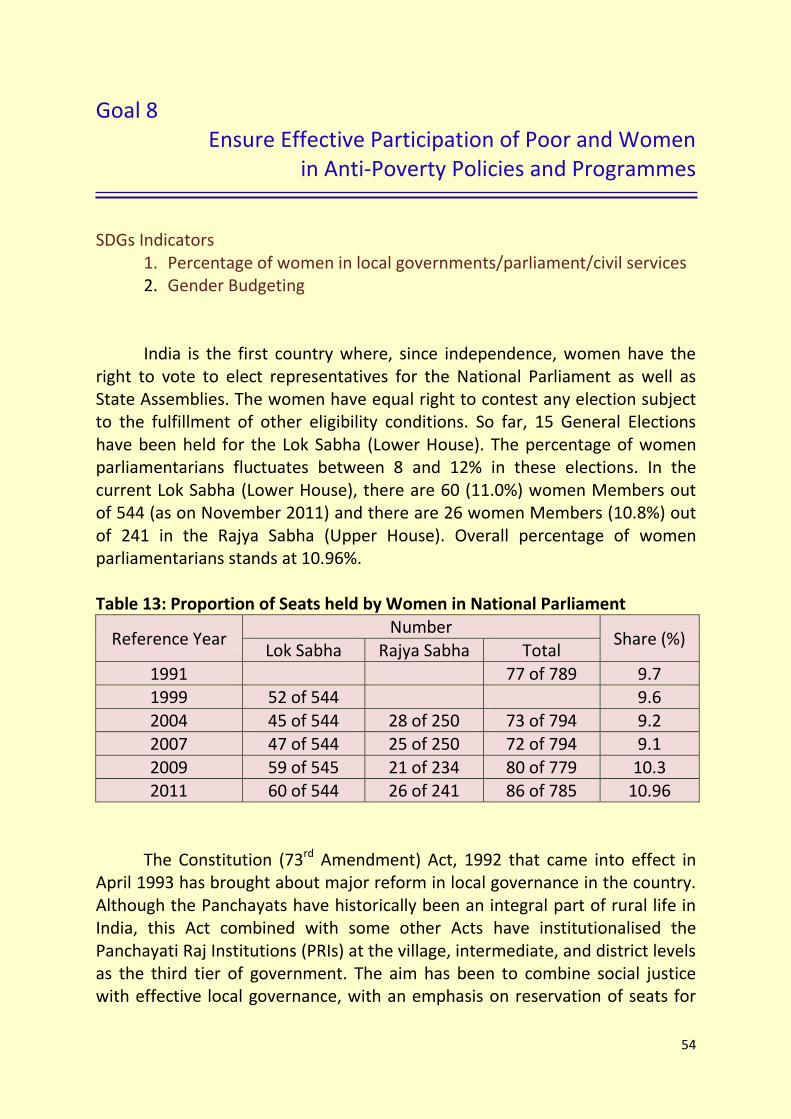
54
Goal 8 Ensure Effective Participation of Poor and Women
in Anti-Poverty Policies and Programmes
SDGs Indicators
1. Percentage of women in local governments/parliament/civil services 2. Gender Budgeting
India is the first country where, since independence, women have the right to vote to elect representatives for the National Parliament as well as State Assemblies. The women have equal right to contest any election subject to the fulfillment of other eligibility conditions. So far, 15 General Elections have been held for the Lok Sabha (Lower House). The percentage of women parliamentarians fluctuates between 8 and 12% in these elections. In the current Lok Sabha (Lower House), there are 60 (11.0%) women Members out of 544 (as on November 2011) and there are 26 women Members (10.8%) out of 241 in the Rajya Sabha (Upper House). Overall percentage of women parliamentarians stands at 10.96%. Table 13: Proportion of Seats held by Women in National Parliament
Reference Year Number
Share (%) Lok Sabha Rajya Sabha Total
1991 77 of 789 9.7 1999 52 of 544 9.6
2004 45 of 544 28 of 250 73 of 794 9.2 2007 47 of 544 25 of 250 72 of 794 9.1
2009 59 of 545 21 of 234 80 of 779 10.3 2011 60 of 544 26 of 241 86 of 785 10.96
The Constitution (73rd Amendment) Act, 1992 that came into effect in April 1993 has brought about major reform in local governance in the country. Although the Panchayats have historically been an integral part of rural life in India, this Act combined with some other Acts have institutionalised the Panchayati Raj Institutions (PRIs) at the village, intermediate, and district levels as the third tier of government. The aim has been to combine social justice with effective local governance, with an emphasis on reservation of seats for
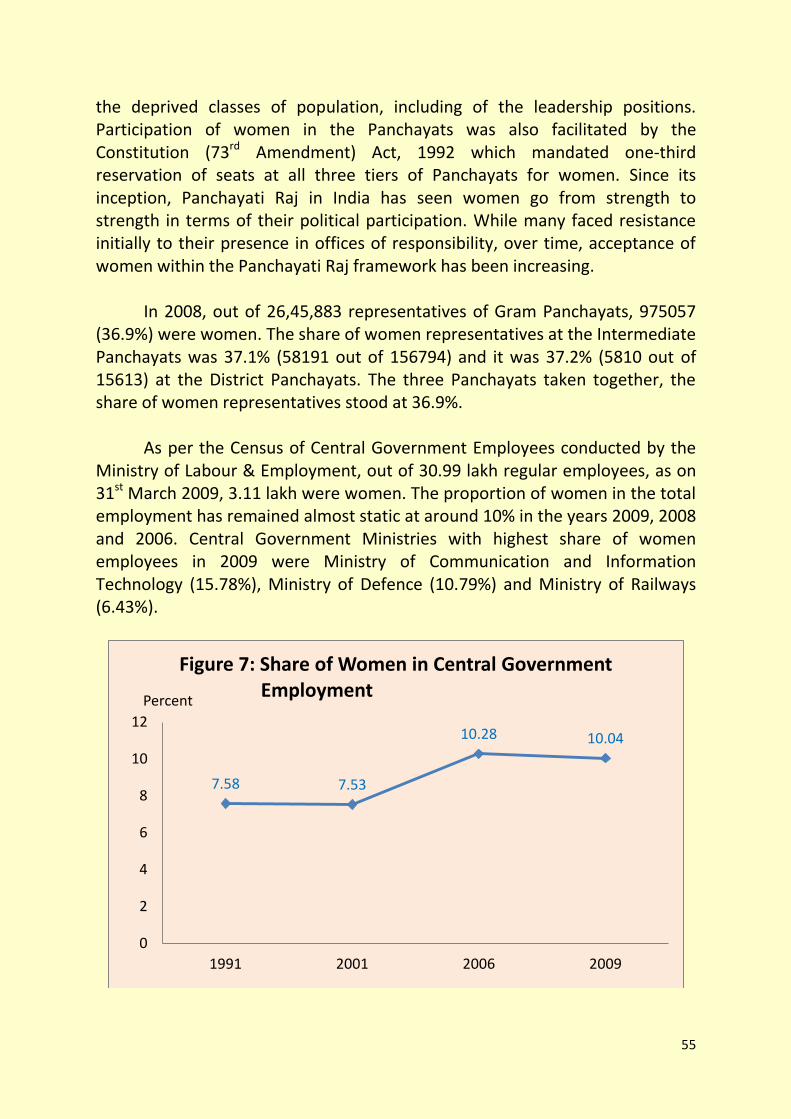
55
the deprived classes of population, including of the leadership positions. Participation of women in the Panchayats was also facilitated by the Constitution (73rd Amendment) Act, 1992 which mandated one-third reservation of seats at all three tiers of Panchayats for women. Since its inception, Panchayati Raj in India has seen women go from strength to strength in terms of their political participation. While many faced resistance initially to their presence in offices of responsibility, over time, acceptance of women within the Panchayati Raj framework has been increasing.
In 2008, out of 26,45,883 representatives of Gram Panchayats, 975057
(36.9%) were women. The share of women representatives at the Intermediate Panchayats was 37.1% (58191 out of 156794) and it was 37.2% (5810 out of 15613) at the District Panchayats. The three Panchayats taken together, the share of women representatives stood at 36.9%.
As per the Census of Central Government Employees conducted by the
Ministry of Labour & Employment, out of 30.99 lakh regular employees, as on 31st March 2009, 3.11 lakh were women. The proportion of women in the total employment has remained almost static at around 10% in the years 2009, 2008 and 2006. Central Government Ministries with highest share of women employees in 2009 were Ministry of Communication and Information Technology (15.78%), Ministry of Defence (10.79%) and Ministry of Railways (6.43%).
7.58 7.53
10.28 10.04
0
2
4
6
8
10
12
1991 2001 2006 2009
Percent
Figure 7: Share of Women in Central Government Employment
56
Even after over six decades of independence, a significant number of women in India face disparities in access and control over resources. These disparities get reflected in important social development indicators such as health, nutrition, literacy, educational attainments, skill levels, occupational status etc. In addition, there are a number of gender specific barriers that prevent women from gaining access to their rightful share in the flow of public goods and services. Unless these gender requirements and their felt needs are incorporated and mainstreamed in the planning and development process of the country, it is likely that the benefits of economic growth will completely bypass a significant section of the country's population.
Gender Budgeting is a process that entails maintaining a gender
perspective at various stages like programme/policy formulation, assessment of needs of target groups, review of extant policies and guidelines, allocation of resources, implementation of programmes, impact assessment, reprioritization of resources and so on. A gender responsive budget is the culmination of this process. Gender Budgeting involves dissection of the Government budget to establish its gender-differential impacts and to translate gender commitments into budgetary commitments. It does not seek to create a separate budget but to provide affirmative action to address the specific needs of women.
The Eleventh Five Year Plan (2007-12) states, 'gender equity requires
adequate provisions to be made in policies and schemes across Ministries and Departments. It also entails strict adherence to gender budgeting across the board'. The Twelfth Five Year Plan (2012-17) has also emphasised that the process of Gender Budgeting would be further strengthened and its reacg extended to all Ministries, Departments and State Governments. Allocations for women as reflected in the Gender Budget Statement shows gradual increase in the number of Central Government Ministries coming out separately with such statement as also the increasing trend in the allocations for women. Table 14: Allocations for women as reflected in the Gender Budget Statement
Year Number of Ministries Allocation (BE) (` Crore)
2005-06 9 14378.68 (2.79%)
2010-11 28 67749.80 (6.11%)
2011-12 29 78251.02 (6.22%)
2012-13 29 88142.80 (5.91%)
2013-14 30 97133.70 (5.83%)
Source: Annual Report 2012-13, Ministry of Women and Child Development
57
Health SDGs
Goal 9 Maternal health
Goal 10 Child health
Goal 11 Affordable health care
Goal 12 Improved hygiene and public health
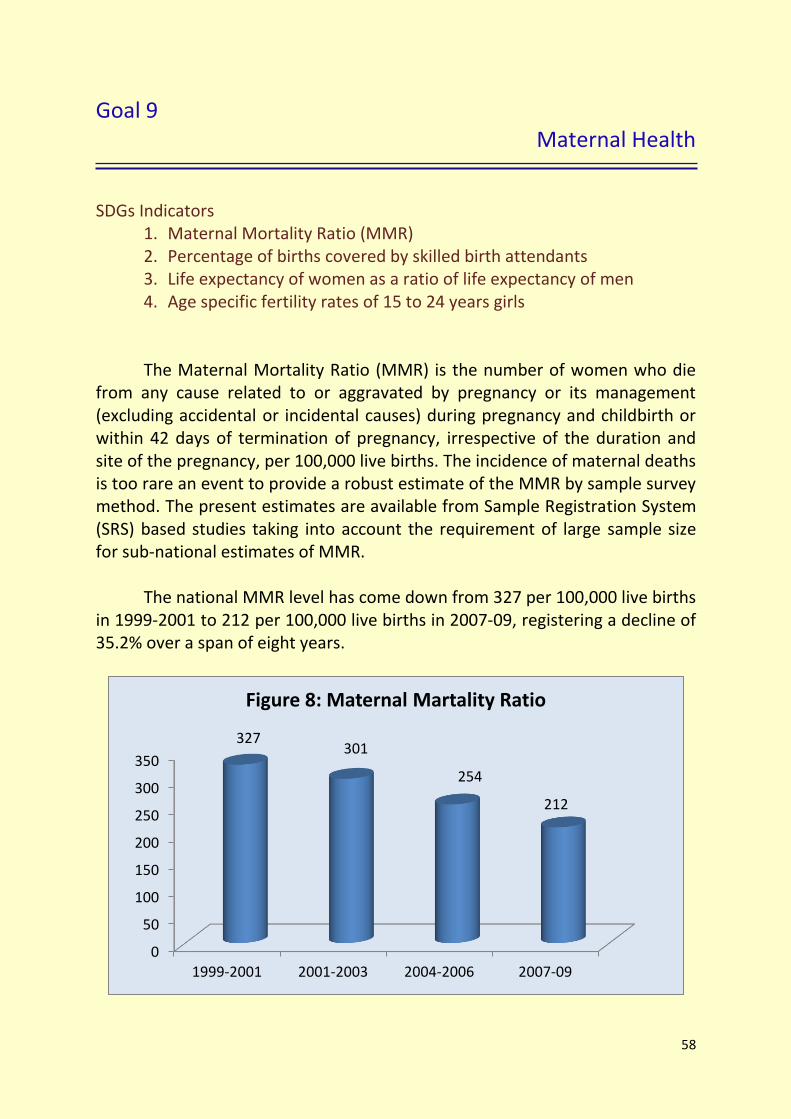
58
Goal 9 Maternal Health
SDGs Indicators
1. Maternal Mortality Ratio (MMR) 2. Percentage of births covered by skilled birth attendants 3. Life expectancy of women as a ratio of life expectancy of men 4. Age specific fertility rates of 15 to 24 years girls The Maternal Mortality Ratio (MMR) is the number of women who die
from any cause related to or aggravated by pregnancy or its management (excluding accidental or incidental causes) during pregnancy and childbirth or within 42 days of termination of pregnancy, irrespective of the duration and site of the pregnancy, per 100,000 live births. The incidence of maternal deaths is too rare an event to provide a robust estimate of the MMR by sample survey method. The present estimates are available from Sample Registration System (SRS) based studies taking into account the requirement of large sample size for sub-national estimates of MMR.
The national MMR level has come down from 327 per 100,000 live births in 1999-2001 to 212 per 100,000 live births in 2007-09, registering a decline of 35.2% over a span of eight years.
0
50
100
150
200
250
300
350
1999-2001 2001-2003 2004-2006 2007-09
327 301
254
212
Figure 8: Maternal Martality Ratio
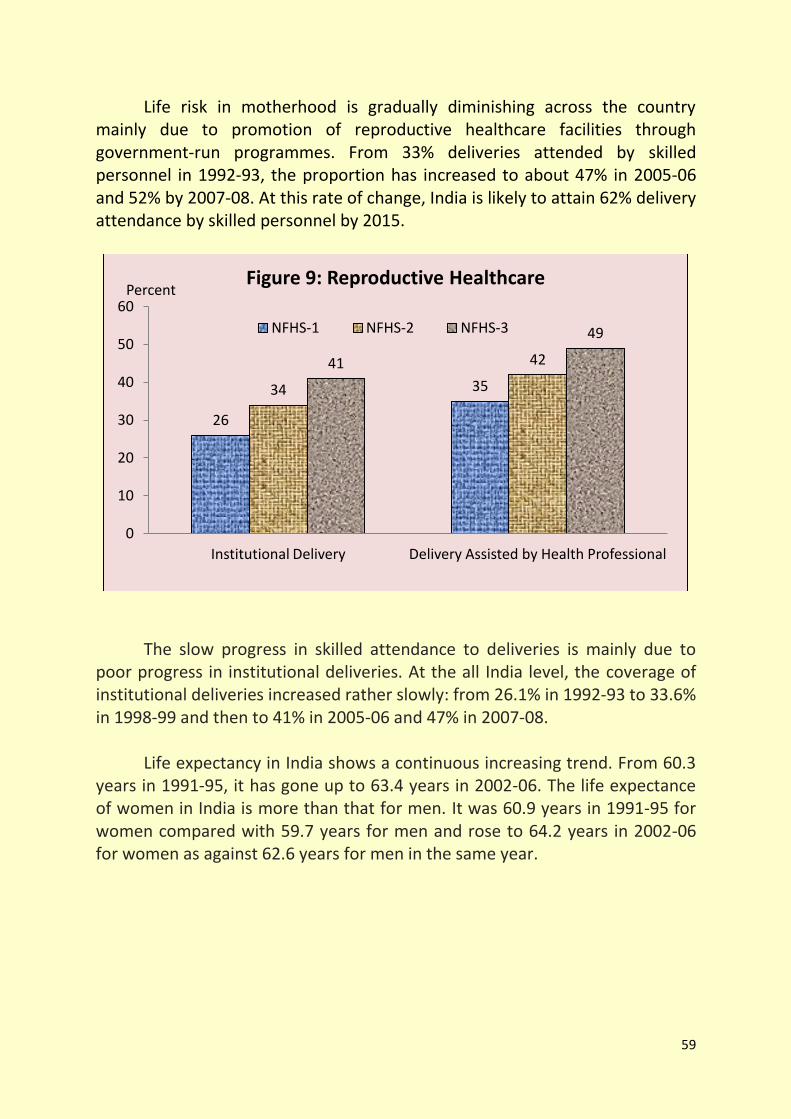
59
Life risk in motherhood is gradually diminishing across the country mainly due to promotion of reproductive healthcare facilities through government-run programmes. From 33% deliveries attended by skilled personnel in 1992-93, the proportion has increased to about 47% in 2005-06 and 52% by 2007-08. At this rate of change, India is likely to attain 62% delivery attendance by skilled personnel by 2015.
The slow progress in skilled attendance to deliveries is mainly due to
poor progress in institutional deliveries. At the all India level, the coverage of institutional deliveries increased rather slowly: from 26.1% in 1992-93 to 33.6% in 1998-99 and then to 41% in 2005-06 and 47% in 2007-08. Life expectancy in India shows a continuous increasing trend. From 60.3 years in 1991-95, it has gone up to 63.4 years in 2002-06. The life expectance of women in India is more than that for men. It was 60.9 years in 1991-95 for women compared with 59.7 years for men and rose to 64.2 years in 2002-06 for women as against 62.6 years for men in the same year.
26
35 34
42 41
49
0
10
20
30
40
50
60
Institutional Delivery Delivery Assisted by Health Professional
Percent Figure 9: Reproductive Healthcare
NFHS-1 NFHS-2 NFHS-3
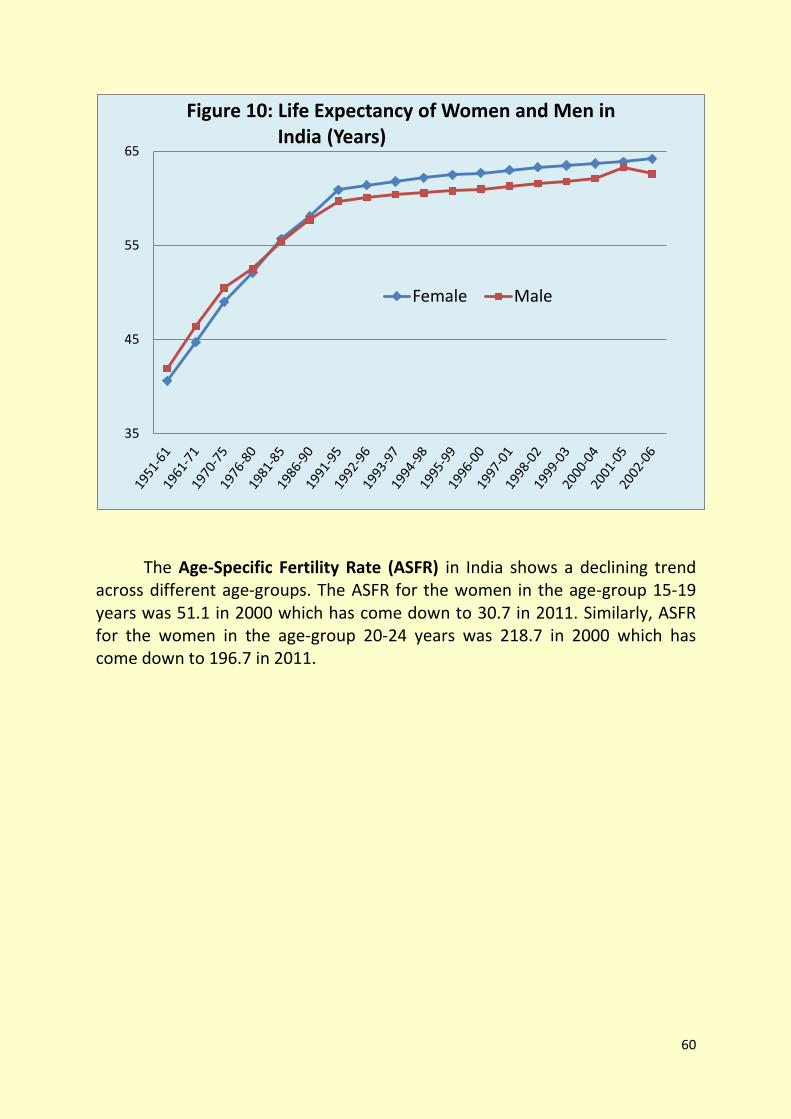
60
The Age-Specific Fertility Rate (ASFR) in India shows a declining trend
across different age-groups. The ASFR for the women in the age-group 15-19 years was 51.1 in 2000 which has come down to 30.7 in 2011. Similarly, ASFR for the women in the age-group 20-24 years was 218.7 in 2000 which has come down to 196.7 in 2011.
35
45
55
65
Figure 10: Life Expectancy of Women and Men in India (Years)
Female Male
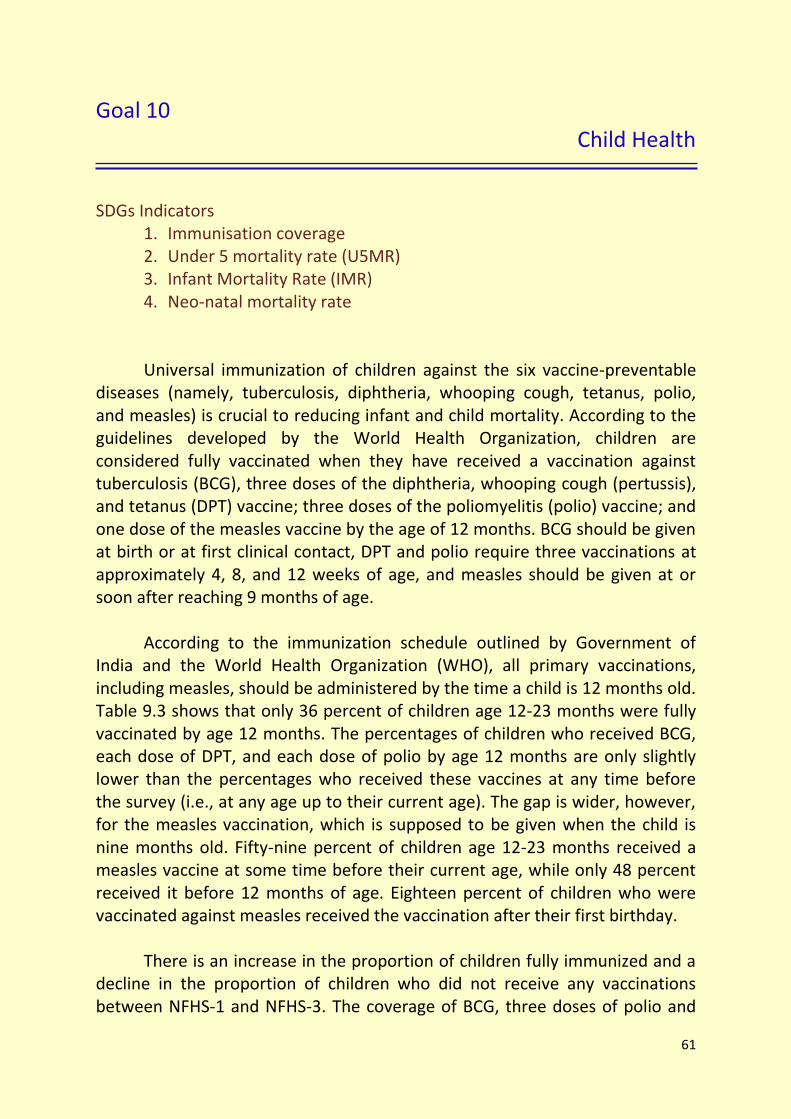
61
Goal 10 Child Health
SDGs Indicators
1. Immunisation coverage 2. Under 5 mortality rate (U5MR) 3. Infant Mortality Rate (IMR) 4. Neo-natal mortality rate
Universal immunization of children against the six vaccine-preventable
diseases (namely, tuberculosis, diphtheria, whooping cough, tetanus, polio, and measles) is crucial to reducing infant and child mortality. According to the guidelines developed by the World Health Organization, children are considered fully vaccinated when they have received a vaccination against tuberculosis (BCG), three doses of the diphtheria, whooping cough (pertussis), and tetanus (DPT) vaccine; three doses of the poliomyelitis (polio) vaccine; and one dose of the measles vaccine by the age of 12 months. BCG should be given at birth or at first clinical contact, DPT and polio require three vaccinations at approximately 4, 8, and 12 weeks of age, and measles should be given at or soon after reaching 9 months of age.
According to the immunization schedule outlined by Government of India and the World Health Organization (WHO), all primary vaccinations, including measles, should be administered by the time a child is 12 months old. Table 9.3 shows that only 36 percent of children age 12-23 months were fully vaccinated by age 12 months. The percentages of children who received BCG, each dose of DPT, and each dose of polio by age 12 months are only slightly lower than the percentages who received these vaccines at any time before the survey (i.e., at any age up to their current age). The gap is wider, however, for the measles vaccination, which is supposed to be given when the child is nine months old. Fifty-nine percent of children age 12-23 months received a measles vaccine at some time before their current age, while only 48 percent received it before 12 months of age. Eighteen percent of children who were vaccinated against measles received the vaccination after their first birthday.
There is an increase in the proportion of children fully immunized and a decline in the proportion of children who did not receive any vaccinations between NFHS-1 and NFHS-3. The coverage of BCG, three doses of polio and
62
measles has also improved considerably since NFHS-1. Nevertheless, gains in full vaccination coverage and in the coverage of each individual vaccine were greater between NFHS-1 and NFHS-2, than between NFHS-2 and NFHS-3. The very limited progress in coverage of full immunization between NFHS-2 and NFHS-3 is mainly due to the coverage of the third dose of DPT, which has remained almost constant between NFHS-2 and NFHS-3 (55 percent). The trends in vaccination coverage between NFHS-2 and NFHS-3 in urban and rural areas show that there is greater improvement in the coverage of full immunization, as well as in most vaccines, in rural areas than in urban areas. In fact, there is a nearly two percentage point decline in full immunization coverage in urban areas between NFHS-2 and NFHS-3. Further, coverage for each of the three doses of DPT also declined in urban areas between the two surveys. The proportion of children receiving three doses of DPT declined from 73 percent in NFHS-2 to 69 percent in NFHS-3. These data indicate that India still lags far behind the goal of universal immunization coverage for children.
The Under-Five Mortality Rate (U5MR) is the probability (expressed as a
rate per 1000 live births) of a child born in a specified year dying before reaching the age of five if subjected to current age-specific mortality rates. According to SRS 2010, U5MR at national level stood at 55 in 2011 compared to 59 in 2010.
62
54 52
42
25
72
63
55 51
42
78 78
55 59
44
0
10
20
30
40
50
60
70
80
90
BCG 3 Polio 3 DPT Measles All
% children aged 12-23 months
Figure 11: Trends in Vaccination
NFHS-1 (1992-93) NFHS-2 (1998-99)
NFHS-3 (2005-06)
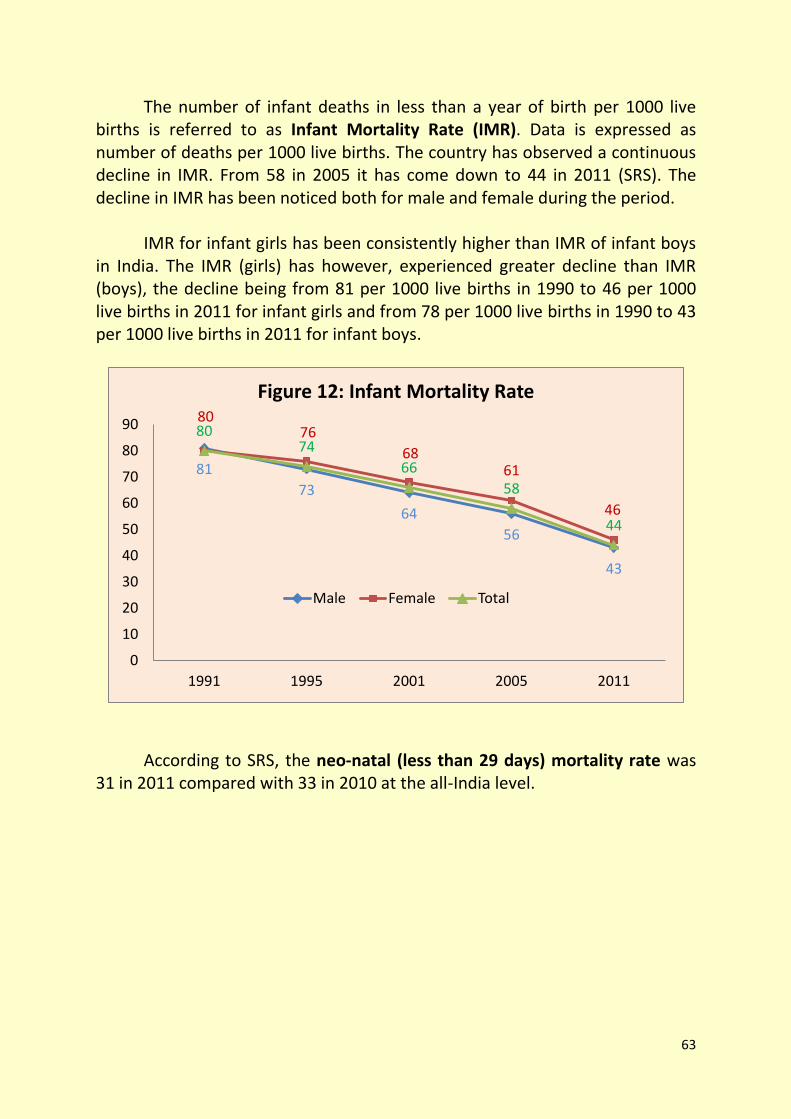
63
The number of infant deaths in less than a year of birth per 1000 live births is referred to as Infant Mortality Rate (IMR). Data is expressed as number of deaths per 1000 live births. The country has observed a continuous decline in IMR. From 58 in 2005 it has come down to 44 in 2011 (SRS). The decline in IMR has been noticed both for male and female during the period.
IMR for infant girls has been consistently higher than IMR of infant boys
in India. The IMR (girls) has however, experienced greater decline than IMR (boys), the decline being from 81 per 1000 live births in 1990 to 46 per 1000 live births in 2011 for infant girls and from 78 per 1000 live births in 1990 to 43 per 1000 live births in 2011 for infant boys.
According to SRS, the neo-natal (less than 29 days) mortality rate was
31 in 2011 compared with 33 in 2010 at the all-India level.
81
73
64
56
43
80 76
68 61
46
80 74
66
58
44
0
10
20
30
40
50
60
70
80
90
1991 1995 2001 2005 2011
Figure 12: Infant Mortality Rate
Male Female Total

64
Goal 11 Affordable Healthcare
SDGs Indicators
1. Out of pocket expenditure on health as percent of total household expenditure
2. Total government expenditure on health as a percent of GDP 3. Share of budget allocated to primary health care vis-à-vis total health
budget 4. Number of doctors per 1000 population
The country has a well structured 3-tier public health infrastructure,
comprising Community Health Centres, Primary Health Centres and Sub-Centres spread across rural and semi-urban areas and tertiary medical care providing multi-speciality hospitals and medical colleges located almost exclusively in the urban areas. Improvements in health indicators can be attributed, in part to this network of health infrastructure. However, the progress has been quite uneven across the regions (large scale inter-State variations), gender (male-female differences) as well as across space (with significant rural-urban differences).
The General Government (Central and State Governments combined)
expenditure on health was 1.36% of the GDP in 2012-13 (budget estimate). As per cent of total expenditure, the expenditure on health was 4.8% and as per cent of social services expenditure, the expenditure on health was 19.2% in 2012-13.
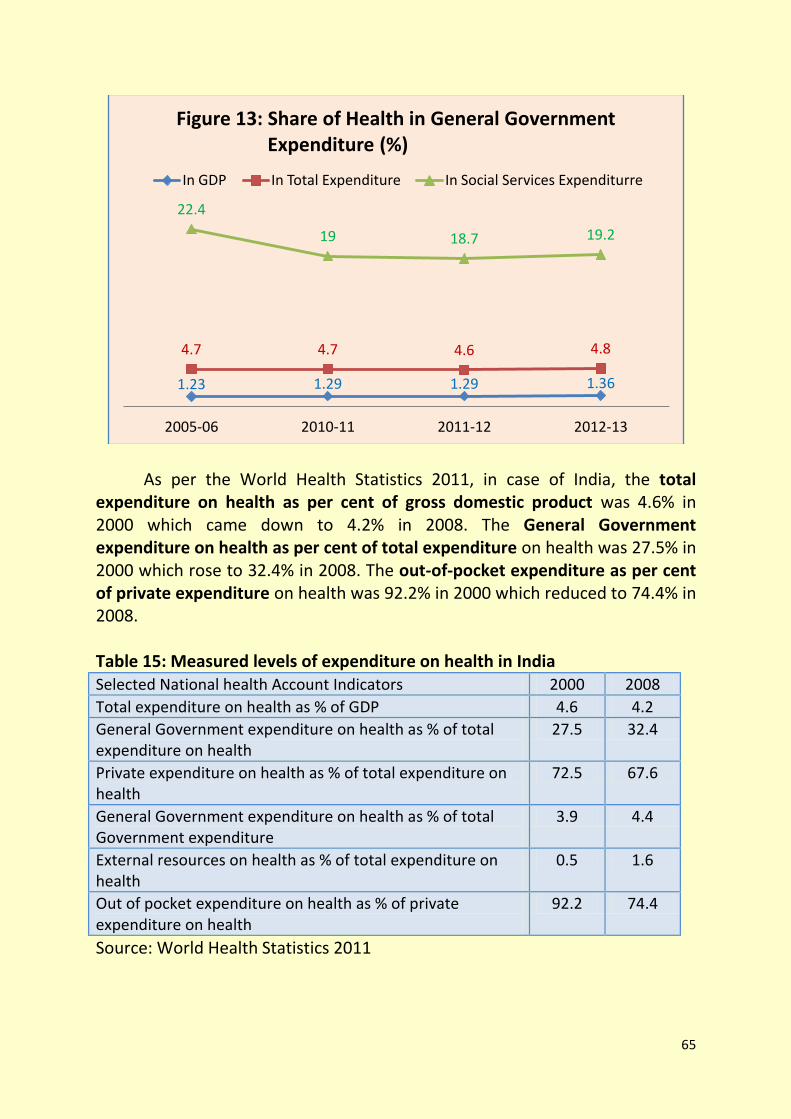
65
As per the World Health Statistics 2011, in case of India, the total
expenditure on health as per cent of gross domestic product was 4.6% in 2000 which came down to 4.2% in 2008. The General Government expenditure on health as per cent of total expenditure on health was 27.5% in 2000 which rose to 32.4% in 2008. The out-of-pocket expenditure as per cent of private expenditure on health was 92.2% in 2000 which reduced to 74.4% in 2008. Table 15: Measured levels of expenditure on health in India Selected National health Account Indicators 2000 2008
Total expenditure on health as % of GDP 4.6 4.2
General Government expenditure on health as % of total expenditure on health
27.5 32.4
Private expenditure on health as % of total expenditure on health
72.5 67.6
General Government expenditure on health as % of total Government expenditure
3.9 4.4
External resources on health as % of total expenditure on health
0.5 1.6
Out of pocket expenditure on health as % of private expenditure on health
92.2 74.4
Source: World Health Statistics 2011
1.23 1.29 1.29 1.36
4.7 4.7 4.6 4.8
22.4
19 18.7 19.2
2005-06 2010-11 2011-12 2012-13
Figure 13: Share of Health in General Government Expenditure (%)
In GDP In Total Expenditure In Social Services Expenditurre
66
As per the National Health Profile 2011, the population served per allopathic doctor in India was 1312.32 whereas there was one AYUSH doctor available per 1699.42 persons. The population served per allopathic and AYUSH doctor was 740.1. Also, one dental surgeon, nurse and pharmacist each were available for a population of 10271.1, 638.64 and 1841.35 respectively.
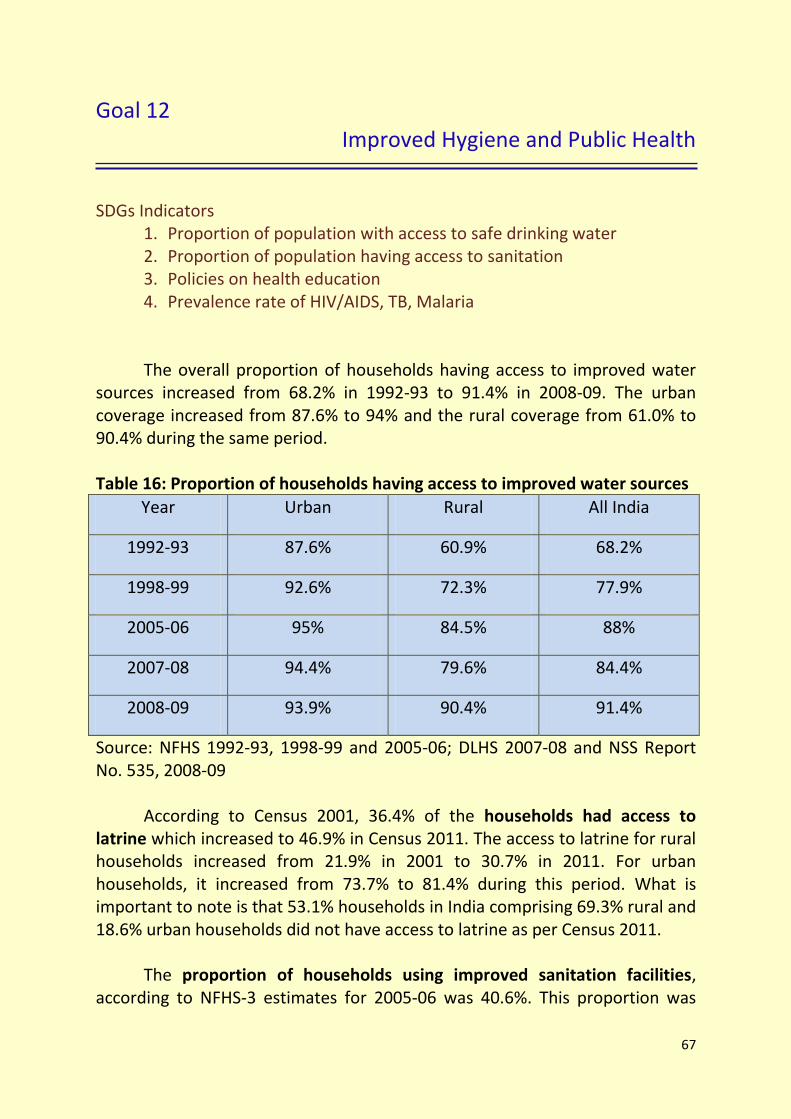
67
Goal 12 Improved Hygiene and Public Health
SDGs Indicators
1. Proportion of population with access to safe drinking water 2. Proportion of population having access to sanitation 3. Policies on health education 4. Prevalence rate of HIV/AIDS, TB, Malaria
The overall proportion of households having access to improved water sources increased from 68.2% in 1992-93 to 91.4% in 2008-09. The urban coverage increased from 87.6% to 94% and the rural coverage from 61.0% to 90.4% during the same period.
Table 16: Proportion of households having access to improved water sources
Year Urban Rural All India
1992-93 87.6% 60.9% 68.2%
1998-99 92.6% 72.3% 77.9%
2005-06 95% 84.5% 88%
2007-08 94.4% 79.6% 84.4%
2008-09 93.9% 90.4% 91.4%
Source: NFHS 1992-93, 1998-99 and 2005-06; DLHS 2007-08 and NSS Report No. 535, 2008-09 According to Census 2001, 36.4% of the households had access to latrine which increased to 46.9% in Census 2011. The access to latrine for rural households increased from 21.9% in 2001 to 30.7% in 2011. For urban households, it increased from 73.7% to 81.4% during this period. What is important to note is that 53.1% households in India comprising 69.3% rural and 18.6% urban households did not have access to latrine as per Census 2011.
The proportion of households using improved sanitation facilities, according to NFHS-3 estimates for 2005-06 was 40.6%. This proportion was
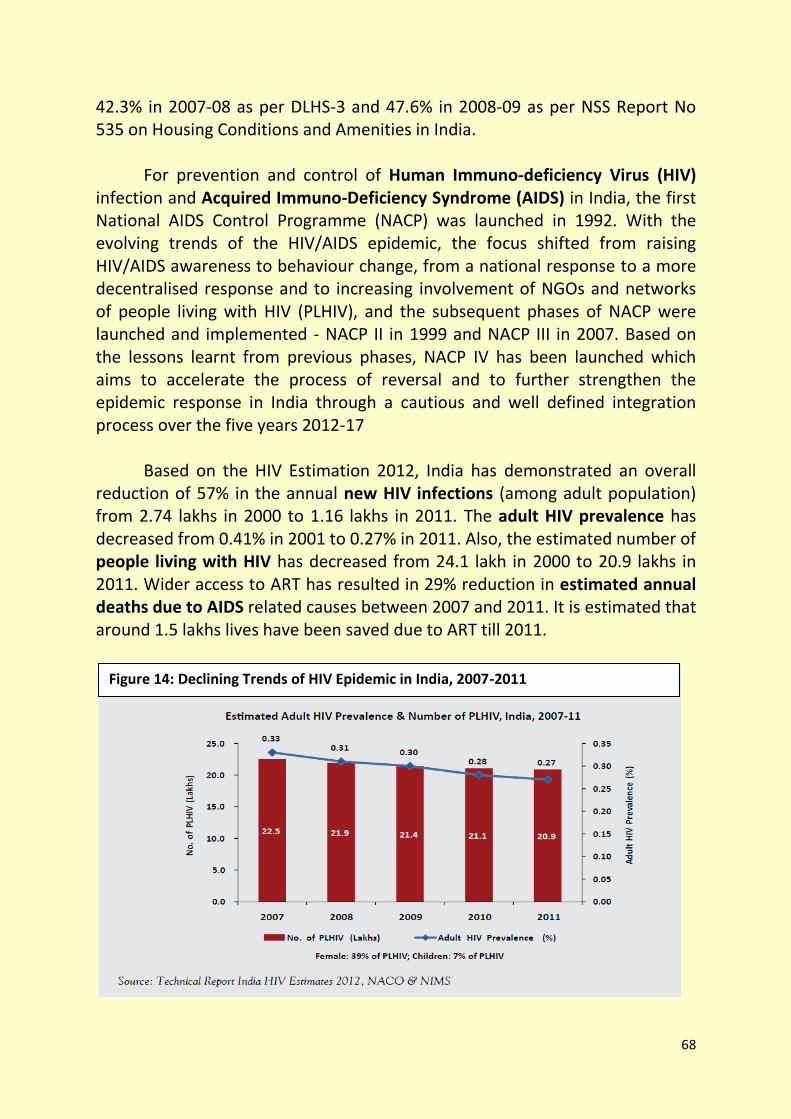
68
42.3% in 2007-08 as per DLHS-3 and 47.6% in 2008-09 as per NSS Report No 535 on Housing Conditions and Amenities in India.
For prevention and control of Human Immuno-deficiency Virus (HIV)
infection and Acquired Immuno-Deficiency Syndrome (AIDS) in India, the first National AIDS Control Programme (NACP) was launched in 1992. With the evolving trends of the HIV/AIDS epidemic, the focus shifted from raising HIV/AIDS awareness to behaviour change, from a national response to a more decentralised response and to increasing involvement of NGOs and networks of people living with HIV (PLHIV), and the subsequent phases of NACP were launched and implemented - NACP II in 1999 and NACP III in 2007. Based on the lessons learnt from previous phases, NACP IV has been launched which aims to accelerate the process of reversal and to further strengthen the epidemic response in India through a cautious and well defined integration process over the five years 2012-17
Based on the HIV Estimation 2012, India has demonstrated an overall
reduction of 57% in the annual new HIV infections (among adult population) from 2.74 lakhs in 2000 to 1.16 lakhs in 2011. The adult HIV prevalence has decreased from 0.41% in 2001 to 0.27% in 2011. Also, the estimated number of people living with HIV has decreased from 24.1 lakh in 2000 to 20.9 lakhs in 2011. Wider access to ART has resulted in 29% reduction in estimated annual deaths due to AIDS related causes between 2007 and 2011. It is estimated that around 1.5 lakhs lives have been saved due to ART till 2011.
Figure 14: Declining Trends of HIV Epidemic in India, 2007-2011
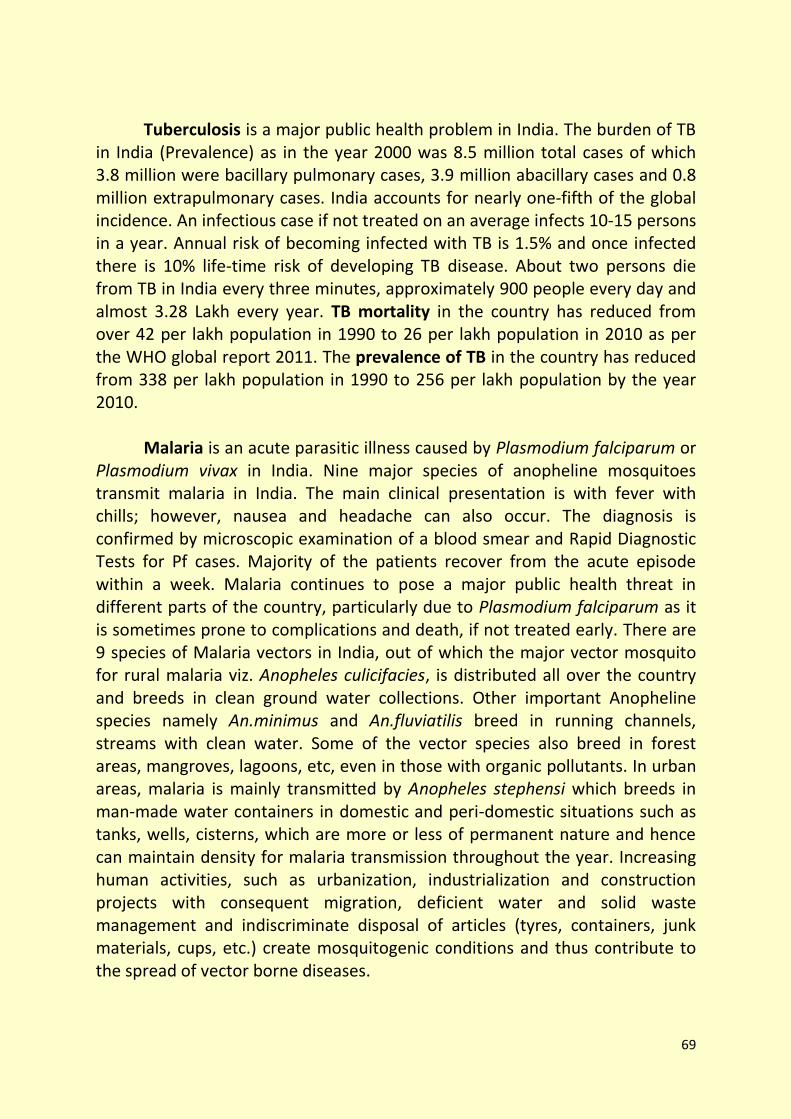
69
Tuberculosis is a major public health problem in India. The burden of TB
in India (Prevalence) as in the year 2000 was 8.5 million total cases of which 3.8 million were bacillary pulmonary cases, 3.9 million abacillary cases and 0.8 million extrapulmonary cases. India accounts for nearly one-fifth of the global incidence. An infectious case if not treated on an average infects 10-15 persons in a year. Annual risk of becoming infected with TB is 1.5% and once infected there is 10% life-time risk of developing TB disease. About two persons die from TB in India every three minutes, approximately 900 people every day and almost 3.28 Lakh every year. TB mortality in the country has reduced from over 42 per lakh population in 1990 to 26 per lakh population in 2010 as per the WHO global report 2011. The prevalence of TB in the country has reduced from 338 per lakh population in 1990 to 256 per lakh population by the year 2010.
Malaria is an acute parasitic illness caused by Plasmodium falciparum or
Plasmodium vivax in India. Nine major species of anopheline mosquitoes transmit malaria in India. The main clinical presentation is with fever with chills; however, nausea and headache can also occur. The diagnosis is confirmed by microscopic examination of a blood smear and Rapid Diagnostic Tests for Pf cases. Majority of the patients recover from the acute episode within a week. Malaria continues to pose a major public health threat in different parts of the country, particularly due to Plasmodium falciparum as it is sometimes prone to complications and death, if not treated early. There are 9 species of Malaria vectors in India, out of which the major vector mosquito for rural malaria viz. Anopheles culicifacies, is distributed all over the country and breeds in clean ground water collections. Other important Anopheline species namely An.minimus and An.fluviatilis breed in running channels, streams with clean water. Some of the vector species also breed in forest areas, mangroves, lagoons, etc, even in those with organic pollutants. In urban areas, malaria is mainly transmitted by Anopheles stephensi which breeds in man-made water containers in domestic and peri-domestic situations such as tanks, wells, cisterns, which are more or less of permanent nature and hence can maintain density for malaria transmission throughout the year. Increasing human activities, such as urbanization, industrialization and construction projects with consequent migration, deficient water and solid waste management and indiscriminate disposal of articles (tyres, containers, junk materials, cups, etc.) create mosquitogenic conditions and thus contribute to the spread of vector borne diseases.
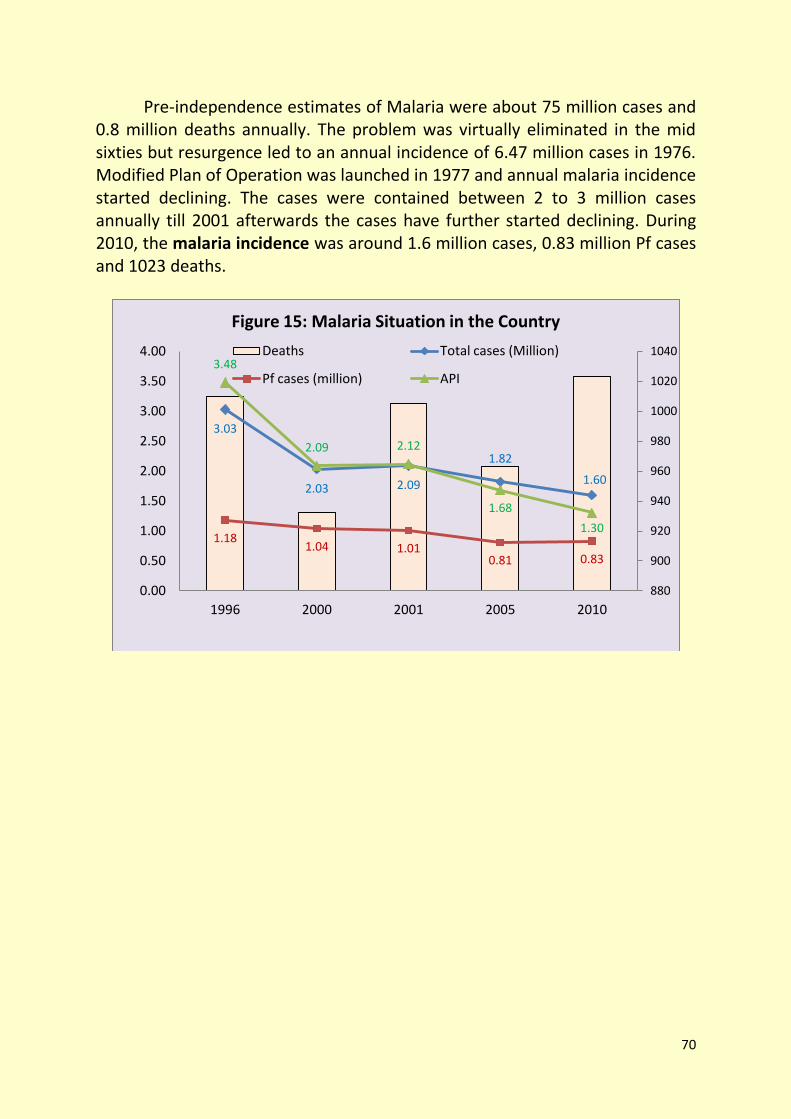
70
Pre-independence estimates of Malaria were about 75 million cases and 0.8 million deaths annually. The problem was virtually eliminated in the mid sixties but resurgence led to an annual incidence of 6.47 million cases in 1976. Modified Plan of Operation was launched in 1977 and annual malaria incidence started declining. The cases were contained between 2 to 3 million cases annually till 2001 afterwards the cases have further started declining. During 2010, the malaria incidence was around 1.6 million cases, 0.83 million Pf cases and 1023 deaths.
3.03
2.03 2.09
1.82
1.60
1.18 1.04 1.01
0.81 0.83
3.48
2.09 2.12
1.68
1.30
880
900
920
940
960
980
1000
1020
1040
0.00
0.50
1.00
1.50
2.00
2.50
3.00
3.50
4.00
1996 2000 2001 2005 2010
Figure 15: Malaria Situation in the Country
Deaths Total cases (Million)
Pf cases (million) API
71
Education SDGs
Goal 13 Access to primary/community schools for all children, boys and girls
Goal 14 Completion of primary education cycle
Goal 15 Universal functional literacy
Goal 16 Quality education at primary, secondary and vocational levels
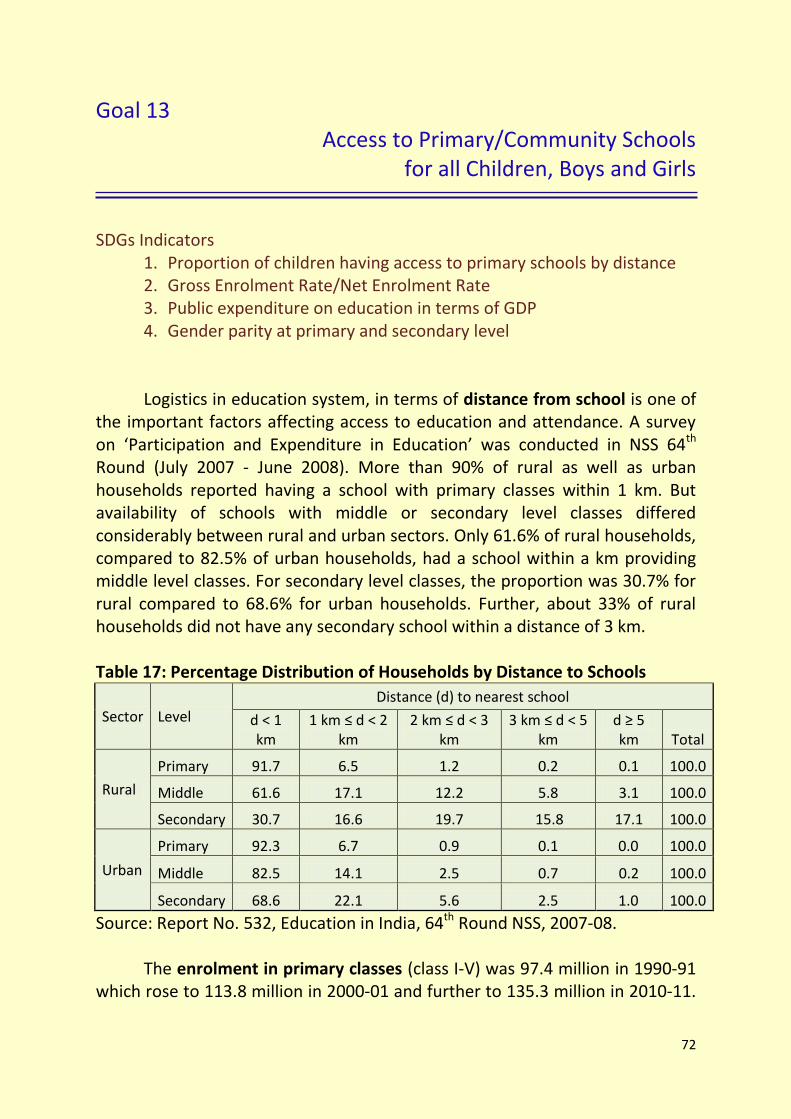
72
Goal 13 Access to Primary/Community Schools
for all Children, Boys and Girls
SDGs Indicators
1. Proportion of children having access to primary schools by distance 2. Gross Enrolment Rate/Net Enrolment Rate 3. Public expenditure on education in terms of GDP 4. Gender parity at primary and secondary level Logistics in education system, in terms of distance from school is one of
the important factors affecting access to education and attendance. A survey on ‘Participation and Expenditure in Education’ was conducted in NSS 64th Round (July 2007 - June 2008). More than 90% of rural as well as urban households reported having a school with primary classes within 1 km. But availability of schools with middle or secondary level classes differed considerably between rural and urban sectors. Only 61.6% of rural households, compared to 82.5% of urban households, had a school within a km providing middle level classes. For secondary level classes, the proportion was 30.7% for rural compared to 68.6% for urban households. Further, about 33% of rural households did not have any secondary school within a distance of 3 km. Table 17: Percentage Distribution of Households by Distance to Schools
Sector Level Distance (d) to nearest school
d < 1 km
1 km ≤ d < 2 km
2 km ≤ d < 3 km
3 km ≤ d < 5 km
d ≥ 5 km Total
Rural
Primary 91.7 6.5 1.2 0.2 0.1 100.0
Middle 61.6 17.1 12.2 5.8 3.1 100.0
Secondary 30.7 16.6 19.7 15.8 17.1 100.0
Urban
Primary 92.3 6.7 0.9 0.1 0.0 100.0
Middle 82.5 14.1 2.5 0.7 0.2 100.0
Secondary 68.6 22.1 5.6 2.5 1.0 100.0
Source: Report No. 532, Education in India, 64th Round NSS, 2007-08.
The enrolment in primary classes (class I-V) was 97.4 million in 1990-91 which rose to 113.8 million in 2000-01 and further to 135.3 million in 2010-11.
73
The enrolment in middle/upper primary classes (class VI-VIII) was 34.0 million in 1990-91 which increased to 42.8 million in 2000-01 and then to 62.1 million in 2010-11.
The Gross Enrolment Ratio (GER) at the primary level was 83.8 in 1990-
91 and it increased to 95.7 in 2000-01 and to 116.0 in 2010-11. For the middle/upper primary level, the GER was 66.7 in 1990-91 which declined to 58.6 in 2000-01 and then gradually increased to 85.5 in 2010-11.
The Net Enrolment Rate (NER) for primary grade, which is the
proportion of students of official school age of 6-10 years enrolled in Grades I-V to the population of children of age group 6-10 years, is the indicator for primary enrolment. NER figures are available from District Information System on Education (DISE). These results over the years have improved in coverage and age specific reporting of enrolment in all States. As a result, it is possible to estimate all India NER for temporal comparison. As per DISE 2011-12, there has been a 15.36% increase in national NER between 2005-06 and 2010-11: from 84.53% in 2005-06 to 99.89% in 2010-11.
Gender Parity Index (GPI) in enrolment at primary and secondary levels is the ratio of the number of female students enrolled at primary and secondary levels in public and private schools to the number of male students. A GPI of 1 indicates parity between the sexes or no gender disparity. A GPI that varies between 0 and 1 typically means a disparity in favour of males whereas a GPI greater than 1 indicates a disparity in favour of females. In general, at the national level, the number of girls enrolled in primary and secondary education is less than their counterparts. However, the female-male ratio in education has been steadily improving over the years. In primary education, the GPI has gone up from 0.76 in 1990-91 to 1.01 in 2010-11 and in secondary education the increase is from 0.60 in 1990-91 to 0.87 in 2010-11.
74
Goal 14 Completion of Primary Education Cycle
SDGs Indicators
1. Survival/retention rate
2. Drop-out rate
Non-enrolment and dropping out are two critical issues plaguing the education system of our country. In the NSS 61st Round (2004-05), all persons in the age-group 5-29, currently not attending any educational institute, were first asked whether they had ever been enrolled in any institution. If the answer was in the negative, it was considered a case of non-enrolment and information was obtained on the reasons thereof as well as on the current activity status of such persons. Those who answered in the affirmative were further asked about the level of last enrolment and whether they had completed the level successfully or not. About 14% of population in the age-group 5-29 years had not entered the education system at all, while another 34% were found to have been enrolled at some time but currently not attending any educational institution. In rural areas, the proportion of never enrolled was 15.8%, while in urban areas it was much lower – 8%. Again, about 18% of females and 10% of males of age 5-29 years were never enrolled.
Among persons in the age-group 5-29 years, 29% in rural areas and 12%
in urban areas – were found to have never been enrolled. In both sectors the percentage drops steadily as one move along the age-groups 18-24, 14-17, 10-13, etc. This is an encouraging pattern because it indicates a positive development – diminishing phenomenon of non-enrolment. Clearly, the percentage of never-enrolled persons in the age-group 10-13, 14-17, or 18-24, must be shrinking over time. Thus a significant improvement in the enrolment status of population over the last 2 to 3 decades is discernible. The higher percentages of never enrolled children at ages 10 and lower do not affect this conclusion, being obviously due to late entry of many children into the educational system, particularly in rural India.
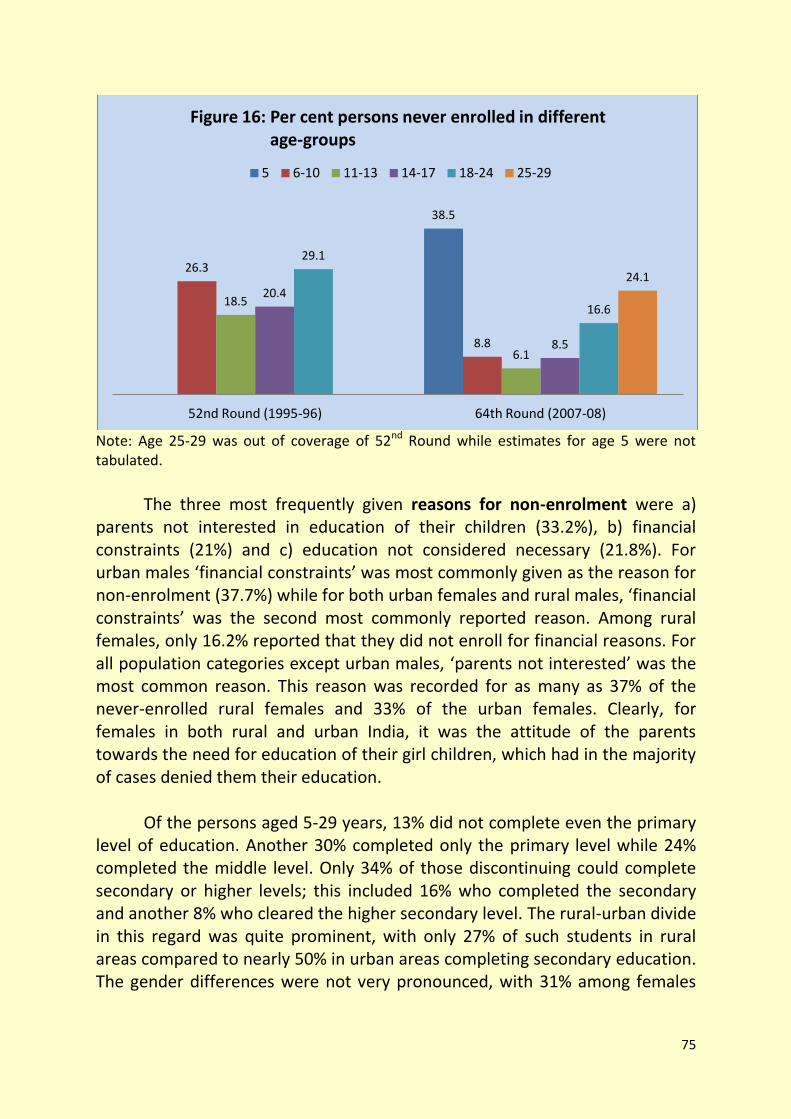
75
Note: Age 25-29 was out of coverage of 52nd Round while estimates for age 5 were not tabulated.
The three most frequently given reasons for non-enrolment were a)
parents not interested in education of their children (33.2%), b) financial constraints (21%) and c) education not considered necessary (21.8%). For urban males ‘financial constraints’ was most commonly given as the reason for non-enrolment (37.7%) while for both urban females and rural males, ‘financial constraints’ was the second most commonly reported reason. Among rural females, only 16.2% reported that they did not enroll for financial reasons. For all population categories except urban males, ‘parents not interested’ was the most common reason. This reason was recorded for as many as 37% of the never-enrolled rural females and 33% of the urban females. Clearly, for females in both rural and urban India, it was the attitude of the parents towards the need for education of their girl children, which had in the majority of cases denied them their education.
Of the persons aged 5-29 years, 13% did not complete even the primary
level of education. Another 30% completed only the primary level while 24% completed the middle level. Only 34% of those discontinuing could complete secondary or higher levels; this included 16% who completed the secondary and another 8% who cleared the higher secondary level. The rural-urban divide in this regard was quite prominent, with only 27% of such students in rural areas compared to nearly 50% in urban areas completing secondary education. The gender differences were not very pronounced, with 31% among females
38.5
26.3
8.8
18.5
6.1
20.4
8.5
29.1
16.6
24.1
52nd Round (1995-96) 64th Round (2007-08)
Figure 16: Per cent persons never enrolled in different age-groups
5 6-10 11-13 14-17 18-24 25-29
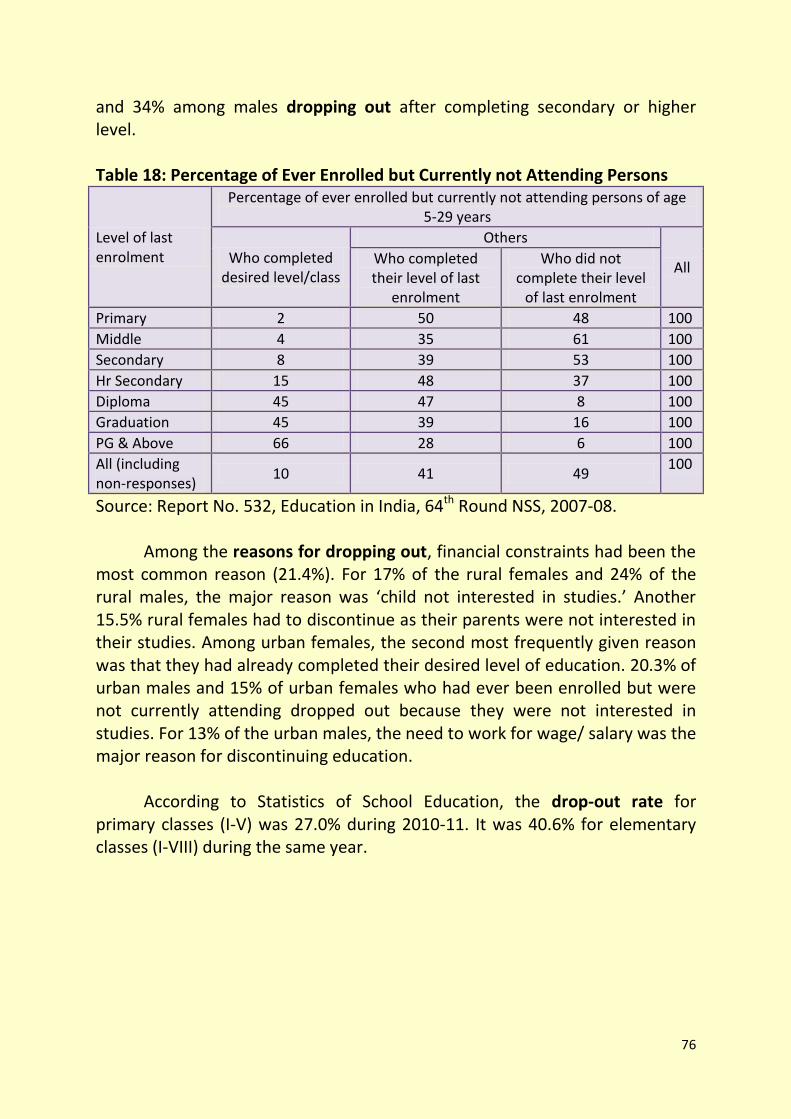
76
and 34% among males dropping out after completing secondary or higher level.
Table 18: Percentage of Ever Enrolled but Currently not Attending Persons
Level of last enrolment
Percentage of ever enrolled but currently not attending persons of age 5-29 years
Who completed desired level/class
Others
All Who completed their level of last
enrolment
Who did not complete their level
of last enrolment
Primary 2 50 48 100
Middle 4 35 61 100
Secondary 8 39 53 100
Hr Secondary 15 48 37 100
Diploma 45 47 8 100
Graduation 45 39 16 100
PG & Above 66 28 6 100
All (including non-responses)
10 41 49 100
Source: Report No. 532, Education in India, 64th Round NSS, 2007-08. Among the reasons for dropping out, financial constraints had been the most common reason (21.4%). For 17% of the rural females and 24% of the rural males, the major reason was ‘child not interested in studies.’ Another 15.5% rural females had to discontinue as their parents were not interested in their studies. Among urban females, the second most frequently given reason was that they had already completed their desired level of education. 20.3% of urban males and 15% of urban females who had ever been enrolled but were not currently attending dropped out because they were not interested in studies. For 13% of the urban males, the need to work for wage/ salary was the major reason for discontinuing education.
According to Statistics of School Education, the drop-out rate for
primary classes (I-V) was 27.0% during 2010-11. It was 40.6% for elementary classes (I-VIII) during the same year.
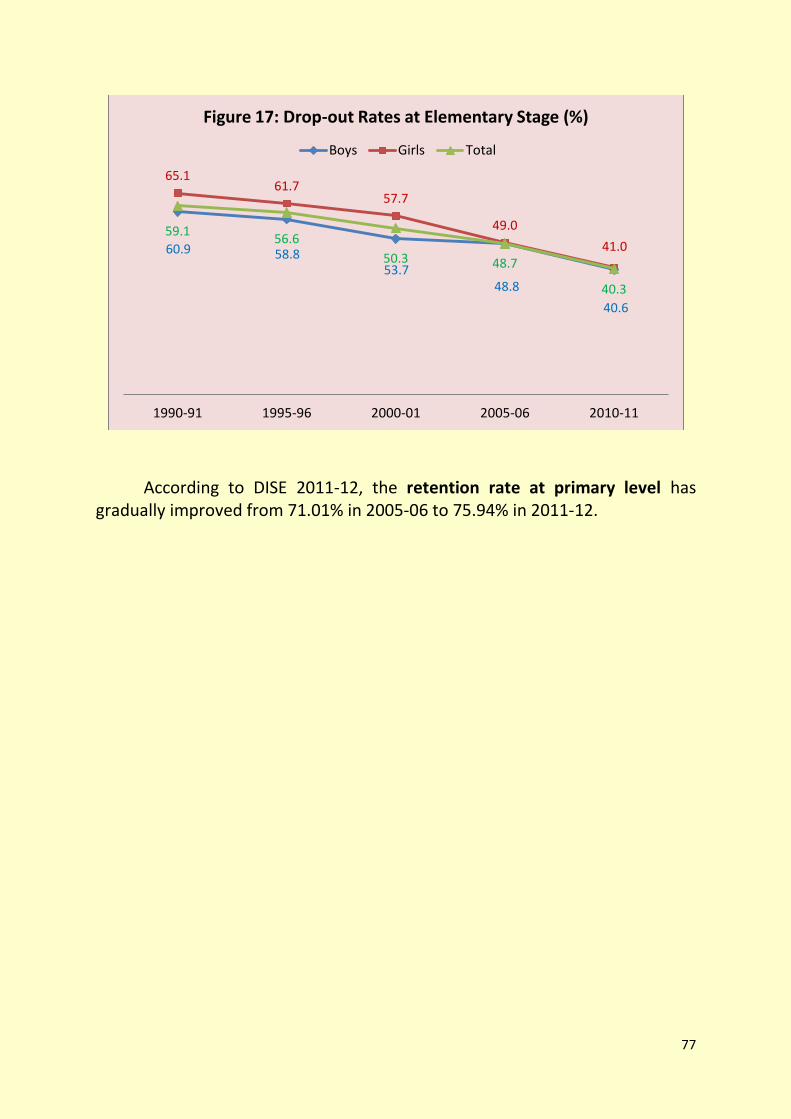
77
According to DISE 2011-12, the retention rate at primary level has gradually improved from 71.01% in 2005-06 to 75.94% in 2011-12.
59.1 56.6
50.3 48.7
40.3
65.1 61.7
57.7
49.0
41.0 60.9 58.8 53.7
48.8
40.6
1990-91 1995-96 2000-01 2005-06 2010-11
Figure 17: Drop-out Rates at Elementary Stage (%)
Boys Girls Total
78
Goal 15 Universal Functional Literacy
SDGs Indicators
1. Adult literacy rate
The proportion of literates among various age-groups of the population,
with rural-urban and male-female classification, serve as key indicators of the socio-economic progress of the country. The survey estimates indicate that in 2007-08, less than two-thirds (64.5%) of the population of all ages were literate. The overall disparity in literacy across the population is heightened by the presence of both rural-urban and male-female disparity. However, the survey results over the years also reveal the diminishing of disparities across the segments. The literacy rate (i.e. percentage of literates) for all ages among rural female, rural male, urban female and urban male populations was found to be 51.1%, 68.4%, 71.6% and 82.2% respectively. The corresponding rates two decades ago as estimated in NSS 42nd round (1986-87) were 24.8%, 47.6%, 59.1% and 74.0% respectively. Thus there has been quantum leap in the female literacy rates over the last two decades, with the rural female rate having more than doubled, although nearly half the female population of rural India still remains illiterate.
As per Census, the adult (population of age 15 & above) literacy rate in
India was 48.2% in 1991 which increased to 61.0% in 2001. The NSS estimates indicate that 66.0% of the country’s adult population was literate in 2007-08. Among rural females, rural males, urban females and urban males, the adult literacy rates were 47.5%, 71.8%, 74.6% and 88.7% respectively. Comparison with past NSS rounds indicates that both the rural-urban and the male-female disparities have reduced over time but nevertheless remain significant.
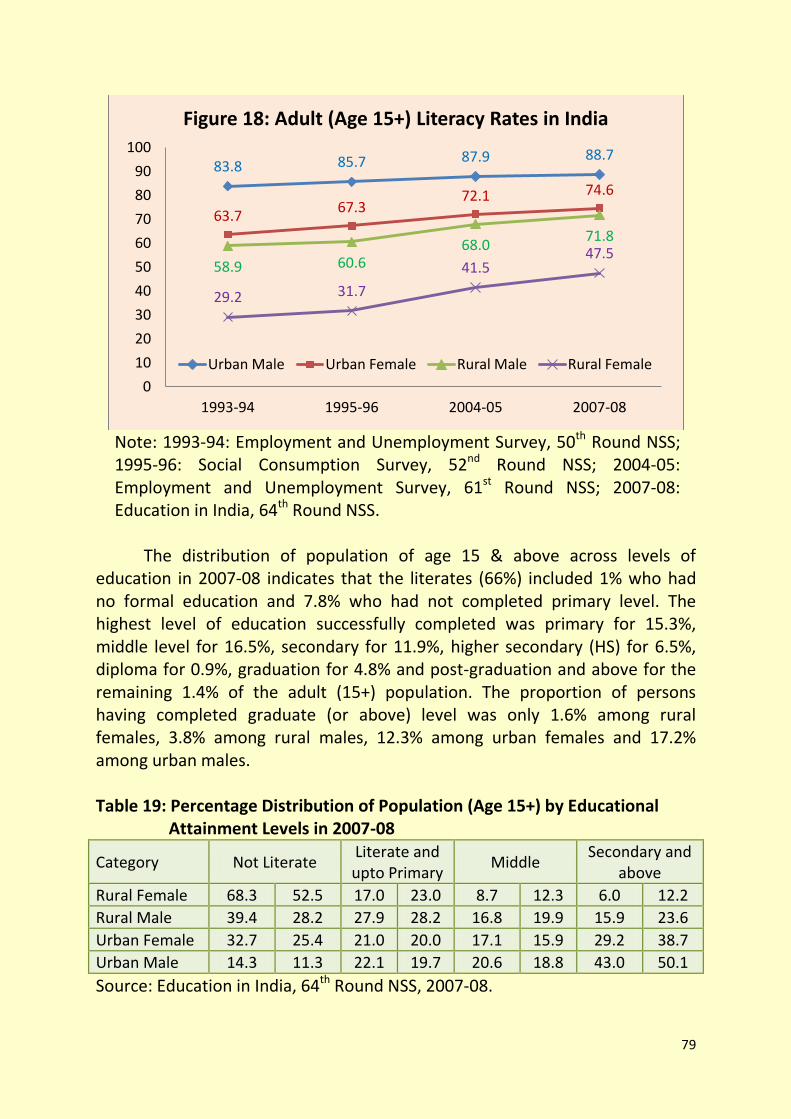
79
Note: 1993-94: Employment and Unemployment Survey, 50th Round NSS; 1995-96: Social Consumption Survey, 52nd Round NSS; 2004-05: Employment and Unemployment Survey, 61st Round NSS; 2007-08: Education in India, 64th Round NSS.
The distribution of population of age 15 & above across levels of
education in 2007-08 indicates that the literates (66%) included 1% who had no formal education and 7.8% who had not completed primary level. The highest level of education successfully completed was primary for 15.3%, middle level for 16.5%, secondary for 11.9%, higher secondary (HS) for 6.5%, diploma for 0.9%, graduation for 4.8% and post-graduation and above for the remaining 1.4% of the adult (15+) population. The proportion of persons having completed graduate (or above) level was only 1.6% among rural females, 3.8% among rural males, 12.3% among urban females and 17.2% among urban males.
Table 19: Percentage Distribution of Population (Age 15+) by Educational
Attainment Levels in 2007-08
Category Not Literate Literate and upto Primary
Middle Secondary and
above
Rural Female 68.3 52.5 17.0 23.0 8.7 12.3 6.0 12.2
Rural Male 39.4 28.2 27.9 28.2 16.8 19.9 15.9 23.6
Urban Female 32.7 25.4 21.0 20.0 17.1 15.9 29.2 38.7
Urban Male 14.3 11.3 22.1 19.7 20.6 18.8 43.0 50.1
Source: Education in India, 64th Round NSS, 2007-08.
83.8 85.7 87.9 88.7
63.7 67.3
72.1 74.6
58.9 60.6 68.0
71.8
29.2 31.7
41.5 47.5
0
10
20
30
40
50
60
70
80
90
100
1993-94 1995-96 2004-05 2007-08
Figure 18: Adult (Age 15+) Literacy Rates in India
Urban Male Urban Female Rural Male Rural Female

80
Goal 16 Quality Education at Primary, Secondary
and Vocational Levels
SDGs Indicators
1. Percentage of trained teachers 2. Student teacher ratio 3. Percentage of schools with toilets for girls
The percentage of trained teachers in primary schools was 86% in 2005-
06 and it increased to 90% in 2010-11. It was 87% for upper primary schools in 2005-06 and 90% in 2010-11. The percentage of trained teachers in secondary schools was 89% in 2005-06 and it marginally increased to 90% in 2010-11. For senior secondary schools, the percentage of trained teachers was 90% in 2005-06 and it rose by 1 percentage point to 91% in 2010-11.
The pupil (student) teacher ratio was 43 for primary schools, 37 for
upper primary schools and 31 for secondary/senior secondary schools in 1990-91. This ratio stood at 46, 34 and 33 in 2005-06 and 43, 33 and 34 in 2010-11 for primary schools, upper primary schools and secondary/senior secondary schools respectively.
Table 20: Pupil Teacher Ratio
Year Primary Schools
Upper Primary Schools
Secondary/Senior Secondary Schools
1990-91 43 37 31
2000-01 43 38 32
2005-06 46 34 33
2010-11 43 33 34
Source: Statistics of School Education, 2010-11. According to DISE, the percentage of schools (all schools) having girls’ toilet (in addition, schools may also have boys’ and common toilets in co-educational schools) increased from 37.42% in 2005-06 to 72.16% in 2011-12. The schools with functional girls’ toilet were 84.68% in 2011-12. The percentage of primary schools with girls’ toilet stood at 41.95% in 2007-08, 44.37% in 2008-09, 50.99% in 2009-10, 52.23% in 2010-11 and 65.40% in 2011-12.
81
Environment SDGs
Goal 17 Acceptable level of forest cover
Goal 18 Acceptable level of water and soil quality
Goal 19 Acceptable level of air quality
Goal 20 Conservation of bio-diversity
Goal 21 Wetland conservation
Goal 22 Ban on dumping of hazardous waste, including radio-active waste
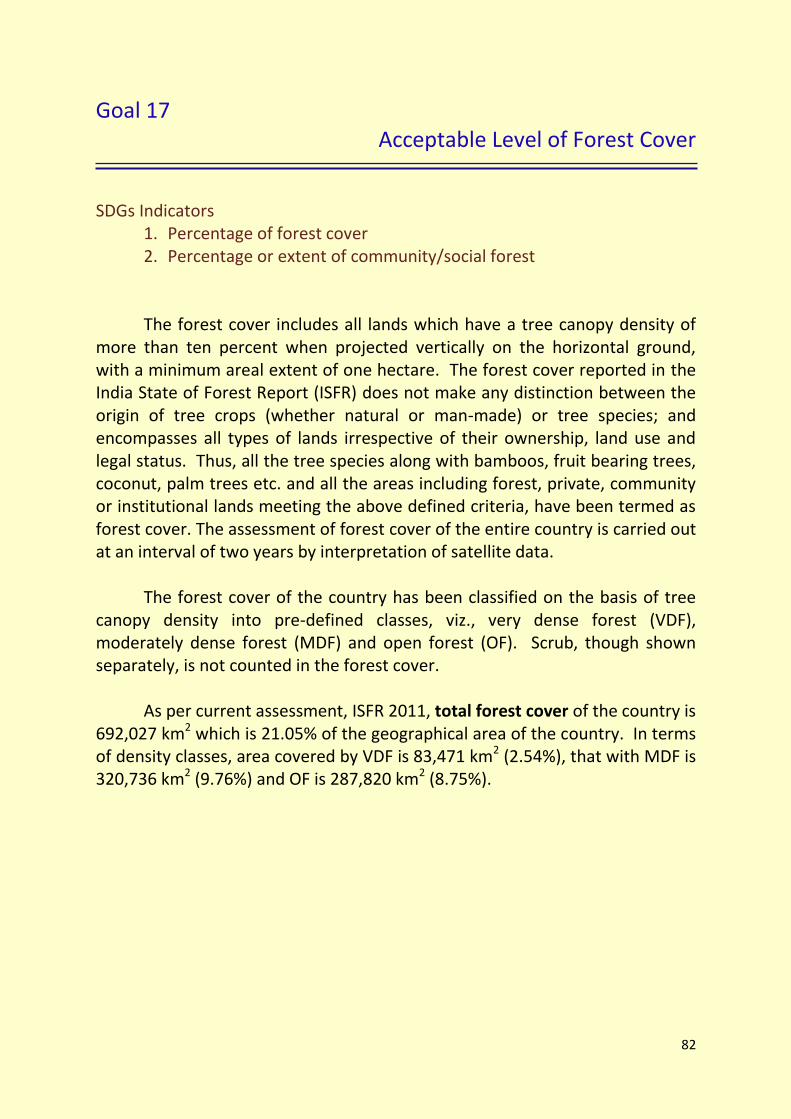
82
Goal 17 Acceptable Level of Forest Cover
SDGs Indicators
1. Percentage of forest cover 2. Percentage or extent of community/social forest The forest cover includes all lands which have a tree canopy density of
more than ten percent when projected vertically on the horizontal ground, with a minimum areal extent of one hectare. The forest cover reported in the India State of Forest Report (ISFR) does not make any distinction between the origin of tree crops (whether natural or man-made) or tree species; and encompasses all types of lands irrespective of their ownership, land use and legal status. Thus, all the tree species along with bamboos, fruit bearing trees, coconut, palm trees etc. and all the areas including forest, private, community or institutional lands meeting the above defined criteria, have been termed as forest cover. The assessment of forest cover of the entire country is carried out at an interval of two years by interpretation of satellite data.
The forest cover of the country has been classified on the basis of tree canopy density into pre-defined classes, viz., very dense forest (VDF), moderately dense forest (MDF) and open forest (OF). Scrub, though shown separately, is not counted in the forest cover.
As per current assessment, ISFR 2011, total forest cover of the country is
692,027 km2 which is 21.05% of the geographical area of the country. In terms of density classes, area covered by VDF is 83,471 km2 (2.54%), that with MDF is 320,736 km2 (9.76%) and OF is 287,820 km2 (8.75%).
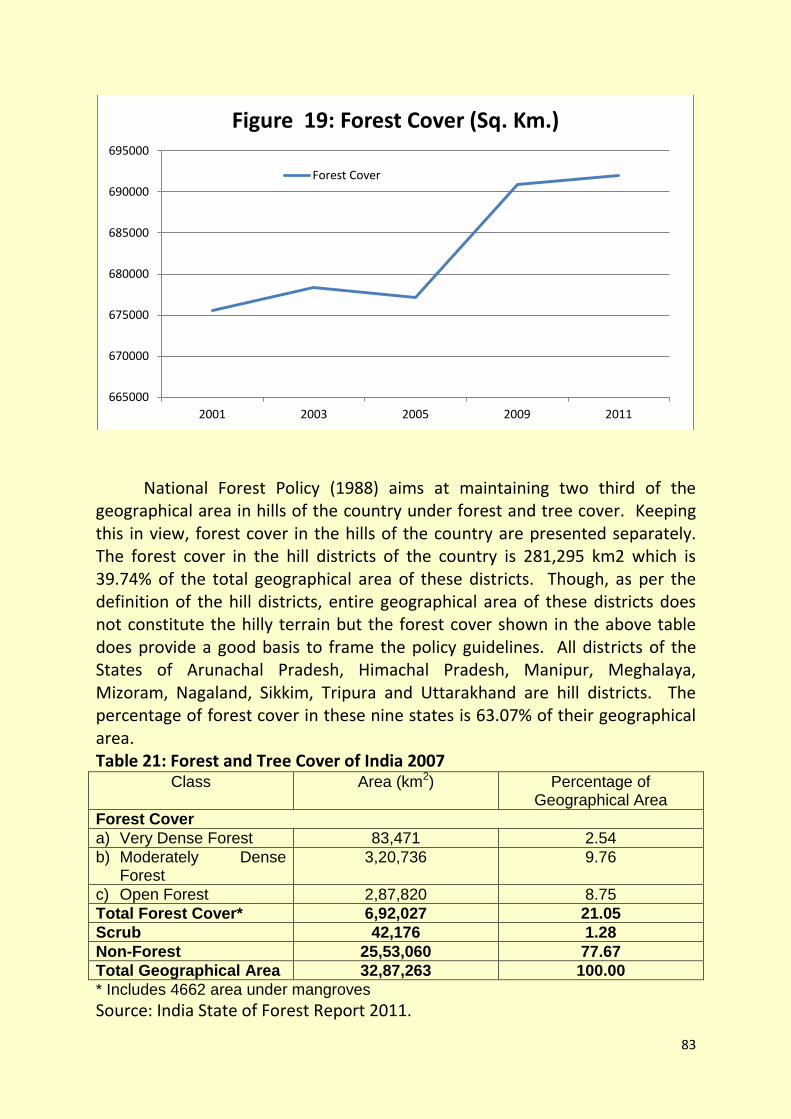
83
National Forest Policy (1988) aims at maintaining two third of the geographical area in hills of the country under forest and tree cover. Keeping this in view, forest cover in the hills of the country are presented separately. The forest cover in the hill districts of the country is 281,295 km2 which is 39.74% of the total geographical area of these districts. Though, as per the definition of the hill districts, entire geographical area of these districts does not constitute the hilly terrain but the forest cover shown in the above table does provide a good basis to frame the policy guidelines. All districts of the States of Arunachal Pradesh, Himachal Pradesh, Manipur, Meghalaya, Mizoram, Nagaland, Sikkim, Tripura and Uttarakhand are hill districts. The percentage of forest cover in these nine states is 63.07% of their geographical area. Table 21: Forest and Tree Cover of India 2007
Class Area (km2) Percentage of Geographical Area
Forest Cover
a) Very Dense Forest 83,471 2.54
b) Moderately Dense Forest
3,20,736 9.76
c) Open Forest 2,87,820 8.75
Total Forest Cover* 6,92,027 21.05
Scrub 42,176 1.28
Non-Forest 25,53,060 77.67
Total Geographical Area 32,87,263 100.00
* Includes 4662 area under mangroves
Source: India State of Forest Report 2011.
665000
670000
675000
680000
685000
690000
695000
2001 2003 2005 2009 2011
Figure 19: Forest Cover (Sq. Km.)
Forest Cover
84
Figure 20: Total Forest Cover
The total area covered under national parks and wildlife sanctuaries,
which constitute major part of the protected areas in India, has increased from 155,961.06 sq km in 1999 to 155,980.15 sq km in 2006 (4.74% of country’s geographical area). The total area protected through national parks, wildlife sanctuaries, conservation reserves and community reserves stands at 1,58,745 sq km as of March 2009 (4.83% of country’s geographical area). The country is on track in increasing the protection network for arresting the biodiversity losses and for maintaining ecological balance.
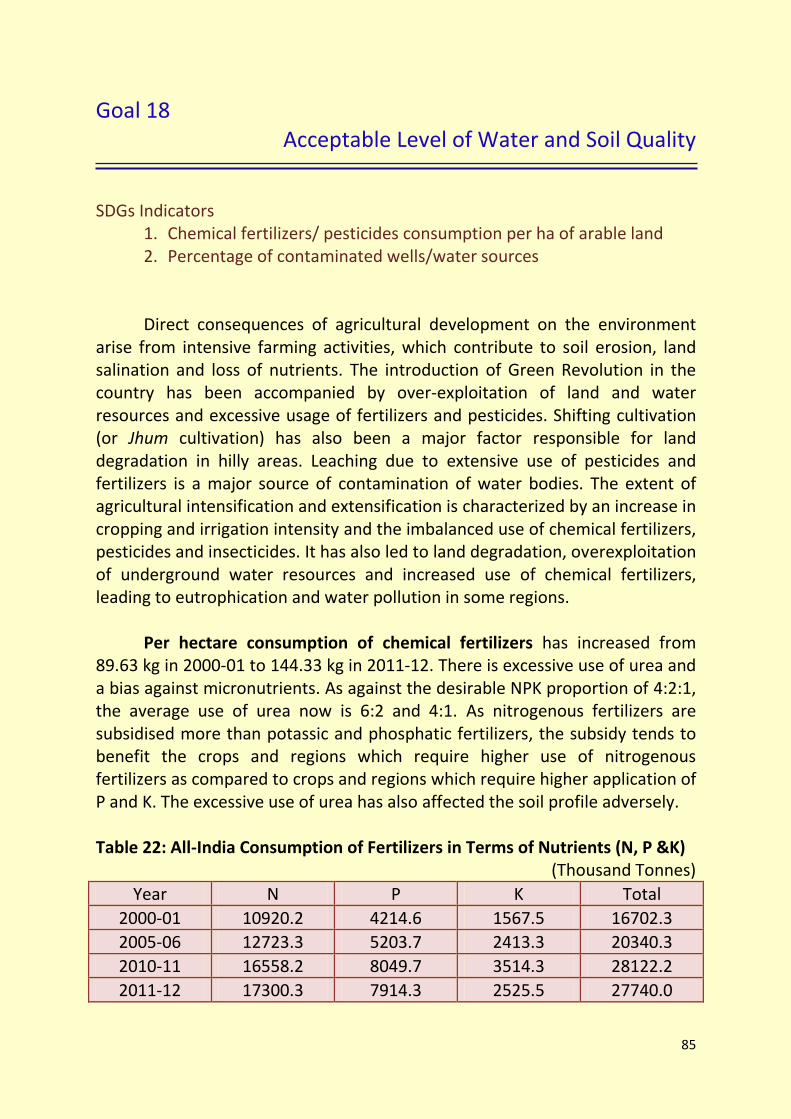
85
Goal 18 Acceptable Level of Water and Soil Quality
SDGs Indicators
1. Chemical fertilizers/ pesticides consumption per ha of arable land 2. Percentage of contaminated wells/water sources Direct consequences of agricultural development on the environment
arise from intensive farming activities, which contribute to soil erosion, land salination and loss of nutrients. The introduction of Green Revolution in the country has been accompanied by over-exploitation of land and water resources and excessive usage of fertilizers and pesticides. Shifting cultivation (or Jhum cultivation) has also been a major factor responsible for land degradation in hilly areas. Leaching due to extensive use of pesticides and fertilizers is a major source of contamination of water bodies. The extent of agricultural intensification and extensification is characterized by an increase in cropping and irrigation intensity and the imbalanced use of chemical fertilizers, pesticides and insecticides. It has also led to land degradation, overexploitation of underground water resources and increased use of chemical fertilizers, leading to eutrophication and water pollution in some regions.
Per hectare consumption of chemical fertilizers has increased from
89.63 kg in 2000-01 to 144.33 kg in 2011-12. There is excessive use of urea and a bias against micronutrients. As against the desirable NPK proportion of 4:2:1, the average use of urea now is 6:2 and 4:1. As nitrogenous fertilizers are subsidised more than potassic and phosphatic fertilizers, the subsidy tends to benefit the crops and regions which require higher use of nitrogenous fertilizers as compared to crops and regions which require higher application of P and K. The excessive use of urea has also affected the soil profile adversely.
Table 22: All-India Consumption of Fertilizers in Terms of Nutrients (N, P &K)
(Thousand Tonnes)
Year N P K Total
2000-01 10920.2 4214.6 1567.5 16702.3
2005-06 12723.3 5203.7 2413.3 20340.3
2010-11 16558.2 8049.7 3514.3 28122.2
2011-12 17300.3 7914.3 2525.5 27740.0
86
Source: Agricultural Statistics At A Glance, 2012, Ministry of Agruculture.
Soil is a unique non-renewable natural resource that supports life on planet Earth. It is estimated that one-sixth of the world's soil has already been degraded by water and wind erosion. In India, approximately 130 Mha. of land area (or 45 percent of the total geographical area) is affected by serious soil erosion through ravines and gullies, shifting cultivation, cultivated wastelands, sandy areas, deserts and water logging (Govt. of India, 1989). Excessive soil erosion with consequent high rate of sedimentation in the reservoirs and decreased fertility has created serious environmental problems with disastrous economic consequences. In India, erosion rates range from 5 to 20 tonnes per hectare, sometimes going up to 100 tonnes per hectare. Nearly 93.68 million hectares are affected by water erosion and another 9.48 million hectares are affected by wind erosion annually in India. Thus, erosion leads to impoverished soil on one hand, and silting up of reservoirs and water tanks on the other.
From the East to the West and from the North to the South, water has
defined life in the Indian subcontinent for thousands of years. On an average, the combination of rainfall, surface and groundwater resources have been sufficient for providing adequate water to the Indian population. India is blessed with many rivers. Twelve major river systems drain the subcontinent along with a number of smaller rivers and streams and form a total catchment area of approximately 252.8 Mha. Of the major rivers, the Ganga-Brahmaputra-Meghna system is the biggest, with a combined catchment area of about 110 Mha which is more than 43 per cent of the catchment area of all the major rivers in the country. Other major rivers with a catchment area of more than 10 Mha are Indus (32.1 Mha), Godavari (31.3 Mha), Krishna, (25.9 Mha) and Mahanadi (14.2 Mha).
Groundwater represents one of the most important water sources in
India. Total replenishable groundwater potential of the country has been estimated by the Ministry of Water Resources as 431 Km3 per year. Excluding the water reserved for drinking, industrial and other purposes (other than irrigation), which is about 16 per cent of the total potential, the potential available for irrigation is 360 Km3 per year. The figure for net draft of groundwater considering the present utilization indicates that a substantial portion of the total potential (about 68 per cent) still remains untapped.
Water pollution is a serious problem in India as almost 70 per cent of its
surface water resources and a growing percentage of its groundwater reserves
87
are contaminated by biological, toxic, organic and inorganic pollutants. In many cases, these sources have been rendered unsafe for human consumption as well as for other activities such as irrigation and industrial needs. This illustrates that degraded water quality can contribute to water scarcity as it limits its availability for both human use and the ecosystem. In 1995, the Central Pollution Control Board identified severely polluted stretches on 18 major rivers in India. Not surprisingly, the majority of these stretches were found in and around large urban areas. The high incidence of severe contamination near urban areas indicates that the industrial and domestic sector's contribution to water pollution is much higher than their relative importance, implied in the Indian economy. Despite this, agricultural activities still dominate in terms of overall impact on water quality.
Besides rapidly depleting groundwater table, the country faces another
major problem on the water front – groundwater contamination - a problem which has affected many states in the country.
CPCB in collaboration with concerned SPCBs/PCCs has established a
nationwide network of water quality monitoring comprising 2500 stations in 28 States and 6 Union Territories. The monitoring is done on monthly or quarterly basis in surface waters and on half yearly basis in case of ground water. The monitoring network covers 445 Rivers, 154 Lakes, 12 Tanks, 78 Ponds, 41 Creeks/Seawater, 25 Canals, 45 Drains, 10 Water Treatment Plant (Raw Water) and 807 Wells. Among the 2500 stations, 1275 are on rivers, 190 on lakes, 45 on drains, 41 on canals, 12 on tanks, 41 on creeks/seawater, 79 on ponds, 10 Water Treatment Plant (Raw Water) and 807 are groundwater stations.
The water quality data on rivers, lakes, ponds, tanks and groundwater
locations being monitored under the network is evaluated against the water quality criteria and the monitoring locations in exceedence with respect to one or more parameters are identified as polluted, which requires action for restoration of water quality.
The water quality monitoring results obtained during 1995 to 2011
indicate that the organic and bacterial contamination continue to be critical in water bodies. This is mainly due to discharge of domestic wastewater mostly in untreated form from the urban centres of the country. The municipal corporations at large are not able to treat increasing the load of municipal sewage flowing into water bodies without treatment.
88
Secondly the receiving water bodies also do not have adequate water for dilution. Therefore, the oxygen demand and bacterial pollution is increasing day by day. This is mainly responsible for water borne diseases.
The water quality monitoring results were analysed with respect to
indicator of oxygen consuming substances (Bio-chemical demand) and indicator of pathogenic bacteria (total colliform and faecal colliform). The result of such analysis shows that there is gradual degradation in water quality. The number of observations having BOD and coliform density has increased during 1995 to 2011.
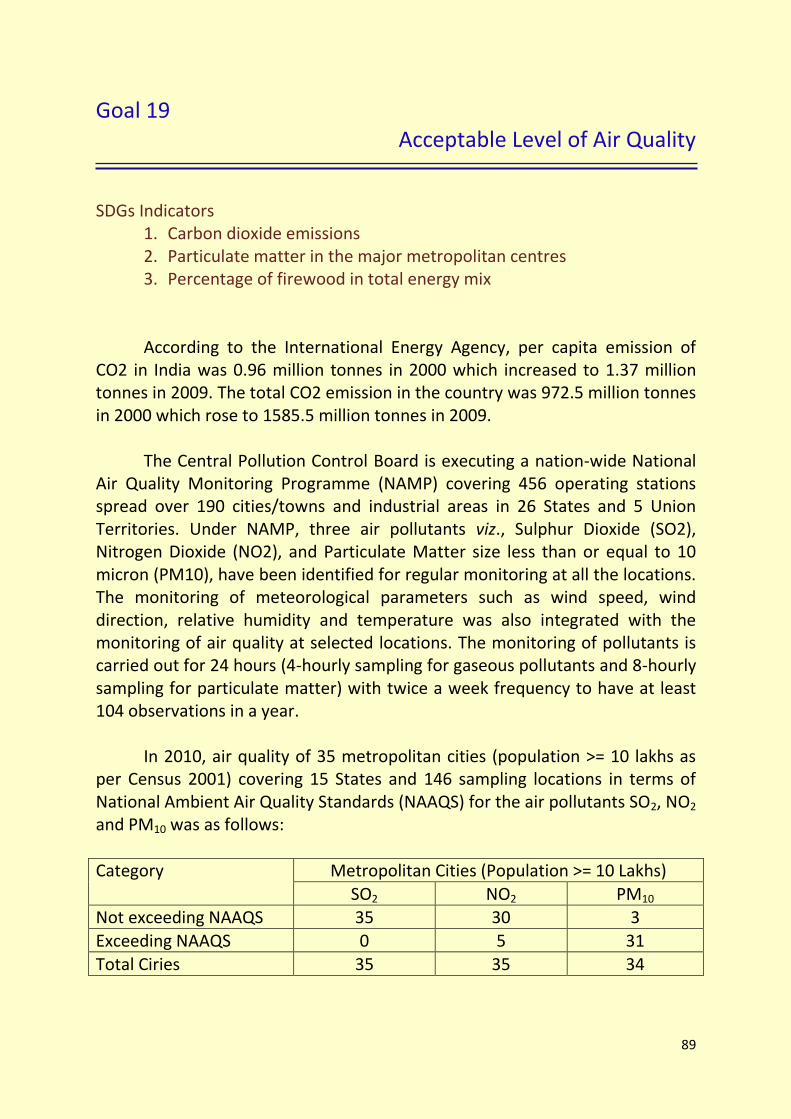
89
Goal 19 Acceptable Level of Air Quality
SDGs Indicators
1. Carbon dioxide emissions 2. Particulate matter in the major metropolitan centres 3. Percentage of firewood in total energy mix According to the International Energy Agency, per capita emission of
CO2 in India was 0.96 million tonnes in 2000 which increased to 1.37 million tonnes in 2009. The total CO2 emission in the country was 972.5 million tonnes in 2000 which rose to 1585.5 million tonnes in 2009.
The Central Pollution Control Board is executing a nation-wide National
Air Quality Monitoring Programme (NAMP) covering 456 operating stations spread over 190 cities/towns and industrial areas in 26 States and 5 Union Territories. Under NAMP, three air pollutants viz., Sulphur Dioxide (SO2), Nitrogen Dioxide (NO2), and Particulate Matter size less than or equal to 10 micron (PM10), have been identified for regular monitoring at all the locations. The monitoring of meteorological parameters such as wind speed, wind direction, relative humidity and temperature was also integrated with the monitoring of air quality at selected locations. The monitoring of pollutants is carried out for 24 hours (4-hourly sampling for gaseous pollutants and 8-hourly sampling for particulate matter) with twice a week frequency to have at least 104 observations in a year.
In 2010, air quality of 35 metropolitan cities (population >= 10 lakhs as
per Census 2001) covering 15 States and 146 sampling locations in terms of National Ambient Air Quality Standards (NAAQS) for the air pollutants SO2, NO2 and PM10 was as follows:
Category Metropolitan Cities (Population >= 10 Lakhs)
SO2 NO2 PM10 Not exceeding NAAQS 35 30 3
Exceeding NAAQS 0 5 31
Total Ciries 35 35 34
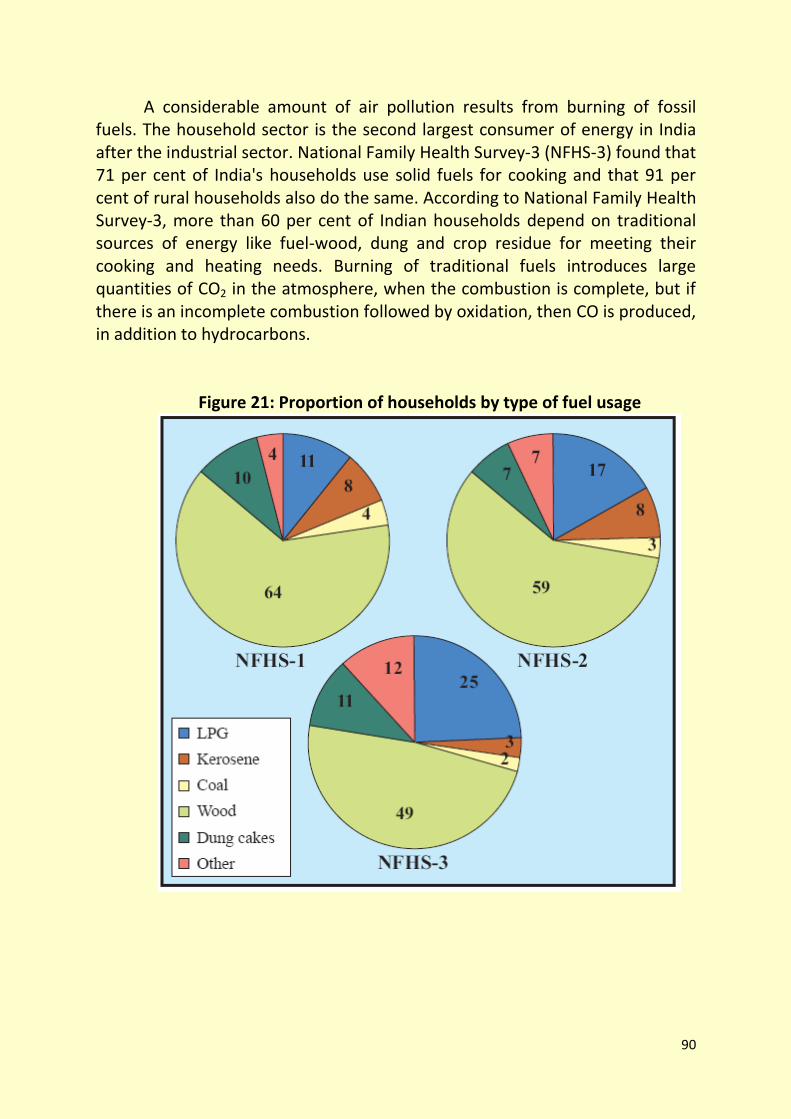
90
A considerable amount of air pollution results from burning of fossil fuels. The household sector is the second largest consumer of energy in India after the industrial sector. National Family Health Survey-3 (NFHS-3) found that 71 per cent of India's households use solid fuels for cooking and that 91 per cent of rural households also do the same. According to National Family Health Survey-3, more than 60 per cent of Indian households depend on traditional sources of energy like fuel-wood, dung and crop residue for meeting their cooking and heating needs. Burning of traditional fuels introduces large quantities of CO2 in the atmosphere, when the combustion is complete, but if there is an incomplete combustion followed by oxidation, then CO is produced, in addition to hydrocarbons.
Figure 21: Proportion of households by type of fuel usage
91
Goal 20 Conservation of Bio-Diversity
SDGs Indicators
1. Proportion and number of protected areas out of the total land area 2. Number of protected species India is situated at a tri-junction of the Afro-tropical, the Indo-Malayan
and the Palaeo-Arctic realm, which displays significant biodiversity. Being one of the 17 identified mega diverse countries, it is home to 8.58% of mammalians, 13.66% of avians, 7.91% of reptilians, 4.66% of amphibians, 11.72% of fish, and 11.80% of plant species documented so far. Of the 2,356 known species of amphibians, birds, reptiles and mammals of India, 18.4% are endemic, meaning they exist in no other country, and 10.8% are endangered. India is home to at least 18,664 species of vascular plants, of which 26.8% are endemic.
India is a mega diverse country with only 2.4% of the land area
accounting for 7-8% of the recorded species of the world, including over 45,500 species of plants and 91,000 species of animals.
The network of protected areas presently covers about 4.83% of the
country’s total land area under International Union for Conservation of Nature
(IUCN) categories I-V and includes 100 national parks, 514 wildlife sanctuaries,
43 conservation reserves and 4 community reserves (all together 661
protected areas). These cover both terrestrial and freshwater ecosystems, cold
deserts and nine coastal and marine protected areas.
92
Goal 21 Wetland Conservation
SDGs Indicators
1. Number and percentage of protected wetlands
Wetlands in India are distributed in different geographical regions, ranging from the Himalaya to the Deccan plateau. The variability in climatic conditions and topography is responsible for significant diversity. There are in all 104 identified wetlands under the National Wetland Conservation & Management Programme (NWCMP).
India is a signatory to the Ramsar Convention and plays an important
role in conservation and wise use of wetlands. On the basis of the country's initiatives in the field of wetland conservation, India was nominated as a member of the Standing Committee from 1993-1996 and from 1999-2002. So far, 25 sites from India have been identified as Ramsar sites of international importance, covering an area of 6.77 lakh hectares, and six new sites are under process of designation.
As per the India State of Forest Report 2011), forests cover 21.05 per
cent of India's total geographic area which excludes 2.76% of tree cover. Area under grasslands is about 3.9 per cent and deserts cover about 2 per cent. It is estimated that India has about 4.1 million hectares of wetlands (excluding paddy fields and mangroves).
93
Goal 22 Ban on Dumping of Hazardous Waste,
Including Radioactive Waste
SDGs Indicators
1. Solid waste generation per capita 2. Percentage of waste treated 3. Regulatory framework for hazardous waste treatment in place
Total quantity of waste generated in the country (based on weighment exercise by local bodies) is not reported. However, Ministry of Urban Development, in its manual on solid waste management (year 2000), has estimated a waste generation of 1,00,000 MT.
MSW generation in Indian cities (around 5,100 ULBs) is estimated to
have increased from 6 million MB in 2006. In addition, Indian consumption of plastics is around 4 MTPA (million tonnes per annum). About 60 per cent of this comprises polyolefin which is primarily used as packaging material. About 2.0 MTPA of the total consumption is generated as plastic waste, of which around 70 per cent is recycled, mostly by the informal sector. The decadal growth in consumption of plastics during 1991-2001 was around 14 per cent. Although the quantity of plastic waste reaching disposal sites is fairly low (0.62 per cent on dry weight basis), testifying to a high rate of recycling and reuse, the management of thin plastic bags remains a matter of concern due to low collection efficiency, which therefore needs to be strengthened. There is an increased trend in the percentage of recyclables, accompanied by a decrease in the percentage of biodegradable matter in the waste stream.
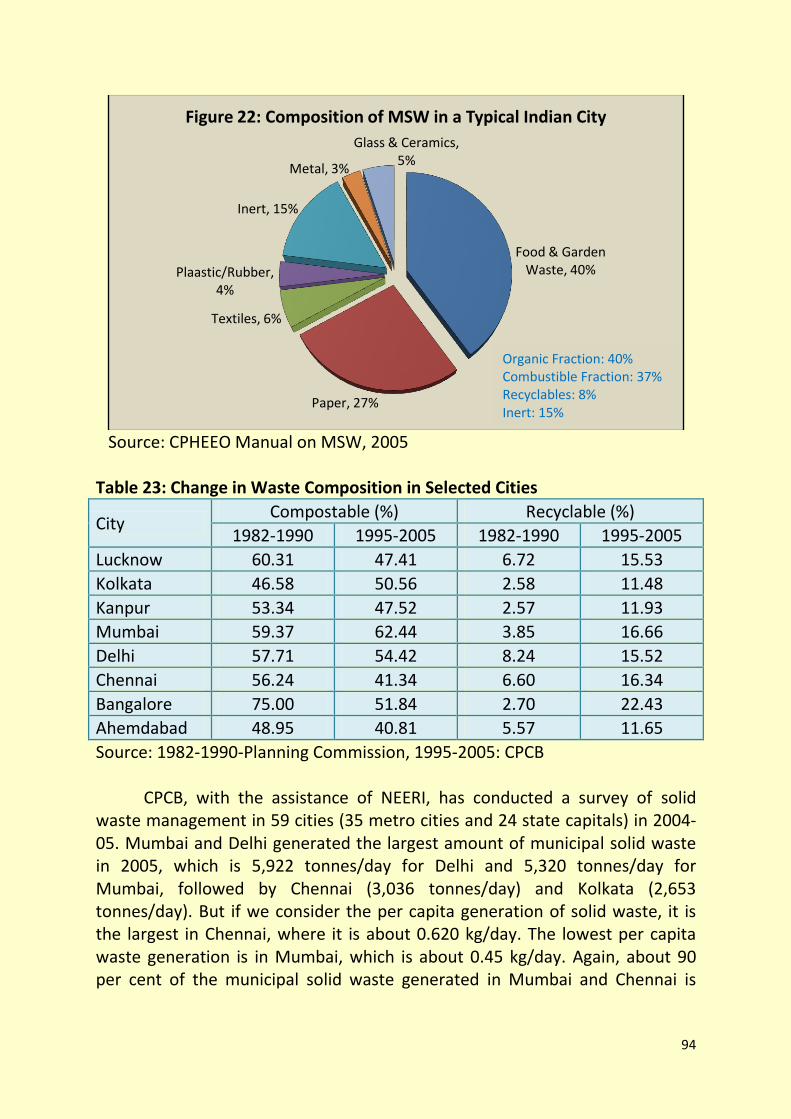
94
Source: CPHEEO Manual on MSW, 2005 Table 23: Change in Waste Composition in Selected Cities
City Compostable (%) Recyclable (%)
1982-1990 1995-2005 1982-1990 1995-2005
Lucknow 60.31 47.41 6.72 15.53
Kolkata 46.58 50.56 2.58 11.48
Kanpur 53.34 47.52 2.57 11.93
Mumbai 59.37 62.44 3.85 16.66
Delhi 57.71 54.42 8.24 15.52
Chennai 56.24 41.34 6.60 16.34
Bangalore 75.00 51.84 2.70 22.43
Ahemdabad 48.95 40.81 5.57 11.65
Source: 1982-1990-Planning Commission, 1995-2005: CPCB CPCB, with the assistance of NEERI, has conducted a survey of solid waste management in 59 cities (35 metro cities and 24 state capitals) in 2004-05. Mumbai and Delhi generated the largest amount of municipal solid waste in 2005, which is 5,922 tonnes/day for Delhi and 5,320 tonnes/day for Mumbai, followed by Chennai (3,036 tonnes/day) and Kolkata (2,653 tonnes/day). But if we consider the per capita generation of solid waste, it is the largest in Chennai, where it is about 0.620 kg/day. The lowest per capita waste generation is in Mumbai, which is about 0.45 kg/day. Again, about 90 per cent of the municipal solid waste generated in Mumbai and Chennai is
Food & Garden Waste, 40%
Paper, 27%
Textiles, 6%
Plaastic/Rubber, 4%
Inert, 15%
Metal, 3%
Glass & Ceramics, 5%
Figure 22: Composition of MSW in a Typical Indian City
Organic Fraction: 40% Combustible Fraction: 37% Recyclables: 8% Inert: 15%
95
being collected. However, in Delhi there is no adequate system of collection as only 77 per cent of the municipal solid waste generated is collected. Table 24: Status of Municipal Solid Waste Management in Selected Metro
Cities 2004-05
Particulars Kolkata Chennai Delhi Mumbai
Area (Sq Km) 187.33 174.00 1484.46 437.71
Population (Census 2001)
45,72,645 43,43,645 1,03,06,452 1,19,78,450
MSW Generation (Tonnes/day)
2653 3036 5922 5320
MSW Generation Rate (Kg/c/day)
0.58 0.62 0.57 0.45
Source: CPCB 2006. The hazardous waste generated in the country is about 4.4 million tonnes, out of which 38.3 per cent is recyclable, 4.3 per cent is incinerable and the remaining 57.4 per cent is disposable in secured landfills. Twelve states of the country account for 87 of total waste generation. The top five waste generating states are Maharashtra, Gujarat, Andhra Pradesh, Rajasthan and West Bengal.
The growth of e-waste has significant environmental, economic and social impact. The increase of electrical and electronic products, consumption rates and higher obsolescence rates lead to higher generation of e-waste. The increasing obsolescence rate of electronic products also adds to the huge import of used electronics products. The e-waste inventory based on the obsolescence rate in India for the year 2005 has been estimated to be 1,46,180 tonnes, and is expected to exceed 8,00,000 tonnes by 2012. There is no large scale organized e-waste recycling facility in India, whereas there are two small e-waste dismantling facilities functioning in Chennai and Bangalore, while most of the e-waste recycling units are operating in the un-organized sector.
Considering the pathetic situation of Solid Waste Management practices
being adopted by the Urban Local Bodies in the country, in September, 2000, Ministry of Environment & Forests notified the 'Municipal Solid Waste (Management and Handling) Rules, 2000', making it mandatory for ULBs to improve the systems of waste management as envisaged in the rules, in a given time frame ending 31st December, 2003. These rules lay out procedures
96
for waste collection, segregation, storage, transportation, processing and disposal.
In India, there are no specific environmental laws or guidelines for e-
waste. None of the existing environmental laws have any direct reference to electronic waste or reference to its handling as hazardous in nature. However, several provisions of these laws may apply to various aspects of electronic wastes. Since e-waste or its constituents fall under the category of 'hazardous' and 'nonhazardous waste', they shall be covered under the purview of 'The Hazardous Waste Management Rules, 2003'.
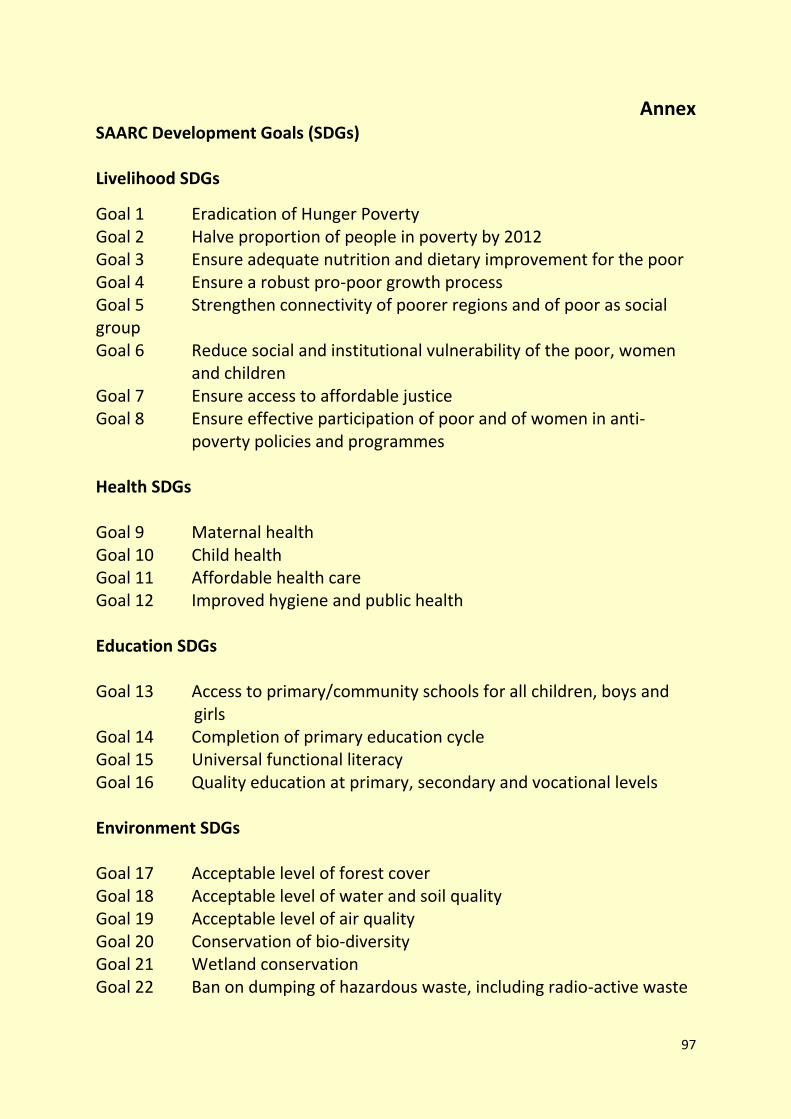
97
Annex SAARC Development Goals (SDGs) Livelihood SDGs
Goal 1 Eradication of Hunger Poverty Goal 2 Halve proportion of people in poverty by 2012 Goal 3 Ensure adequate nutrition and dietary improvement for the poor Goal 4 Ensure a robust pro-poor growth process Goal 5 Strengthen connectivity of poorer regions and of poor as social group Goal 6 Reduce social and institutional vulnerability of the poor, women
and children Goal 7 Ensure access to affordable justice Goal 8 Ensure effective participation of poor and of women in anti-
poverty policies and programmes Health SDGs Goal 9 Maternal health Goal 10 Child health Goal 11 Affordable health care Goal 12 Improved hygiene and public health Education SDGs Goal 13 Access to primary/community schools for all children, boys and
girls Goal 14 Completion of primary education cycle Goal 15 Universal functional literacy Goal 16 Quality education at primary, secondary and vocational levels Environment SDGs Goal 17 Acceptable level of forest cover Goal 18 Acceptable level of water and soil quality Goal 19 Acceptable level of air quality Goal 20 Conservation of bio-diversity Goal 21 Wetland conservation Goal 22 Ban on dumping of hazardous waste, including radio-active waste
98
References
1. Annual Report 2012-13, Ministry of Environment and Forests, Government of India
2. Annual Report 2012-13, Ministry of Road Transport and Highways, Government of India
3. Annual Report 2012-13, Ministry of Women and Child Development, Government of India
4. Annual Report, 2012-13, National AIDS Control Organisation, Department of AIDS Control. Ministry of Health and Family Welfare, Government of India
5. Economic Survey, 2012-13, Department of Economic Affairs, Ministry of Finance, Government of India
6. Annual Report 2011-12, Ministry of Power, Government of India 7. Annual Report 2011-12, Ministry of Panchayati Raj, Government of
India 8. Annual Report, 2011-12, Telecom Regulatory Authority of India 9. India State of Forests Report, 2011, Forest Survey of India, Ministry of
Environment and Forests, Government of India 10. Basic Road Statistics of India, 2010-11, Ministry of Road Transport
and Highways, Government of India 11. Annual Report, 2010-11, Central Pollution Control Board, Ministry of
Environment and Forests, Government of India 12. Press Note on Poverty Estimates 2011-12, Planning Commission,
Government of India 13. National Health Profile, 2009, Central Bureau of Health Intelligence,
Ministry of Health and Family Welfare, Government of India 14. Sample Registration System Statistical Report, 2011, Office of
Registrar General of India, Ministry of Home Affairs, Government of India
15. 66th and 68th Round Reports of the National Sample Survey Office, Ministry of Statistics and Programme Implementation, Government of India
16. National Family Health Survey -1, 2 &3, Ministry of Health and Family Welfare, Government of India
17. District Level Health and Facility Survey -1, 2 &3, Ministry of Health and Family Welfare, Government of India
18. Flash Statistics, District Information System for Education, 2011-12, National University of Educational Planning and Administration
Related Documents