FFIS Special Analysis 15-01 Special Analysis 15-01, February 26, 2015 The Role of Federal Funds in State Spending Contact: Marcia Howard • 202-624-5848 • [email protected] Summary Over the years—most often during periods of federal budget retrenchment—analysts have considered whether the federal government and states should “swap” responsibilities. That is, whether the federal government should reduce or eliminate its grants in one program area, and redirect those resources into another. Such sorting out holds the promise of allowing the entity with full funding responsibility over an area to improve its efficiency and effectiveness. For states, it could provide flexibility that federal oversight typically precludes, and reduce or eliminate costly and often-burdensome requirements that accompany most federal assistance. During the Reagan administration, it was suggested that states assume full funding responsibility for the major welfare program (Aid to Families with Dependent Children) while the federal government would take full responsibility for Medicaid. In retrospect, this would have been an excellent deal for states, but it never gained traction. We are now in another period of federal budget retrenchment. Due to efforts to reduce the federal budget deficit, most federal grant programs outside those designated as “mandatory” have seen level funding at best, and sometimes significant reductions, especially in inflation-adjusted terms. The prospect of swapping greater federal responsibility in one program area for greater state responsibility in another is gaining renewed interest. To understand the potential impact of federal-state responsibility swaps, it is necessary to consider the importance of federal funding in each of the major categories of public spending. This Special Analysis examines the major areas of state-federal fiscal relations, and provides background information on states’ reliance on federal funds in a host of program areas. How Important are Federal Funds? In fiscal year (FY) 2012, intergovernmental revenue accounted for about one- third of state general revenue (32.8%). The vast majority of that intergovernmental revenue came from the federal government (31.6%). This makes the federal government the single largest source of state general revenue. The table on the next page lists the share of each state’s general revenue provided by federal or local governments. States vary greatly in their reliance on intergovernmental funds, with such funds accounting for 45.8% of general revenues in Mississippi and 20% in Alaska. The relative importance of federal funding to a state is determined

Welcome message from author
This document is posted to help you gain knowledge. Please leave a comment to let me know what you think about it! Share it to your friends and learn new things together.
Transcript
FFIS Special Analysis 15-01
Special Analysis 15-01, February 26, 2015
The Role of Federal Funds in State Spending Contact: Marcia Howard • 202-624-5848 • [email protected]
Summary Over the years—most often during periods of federal budget retrenchment—analysts have considered whether the federal government and states should “swap” responsibilities. That is, whether the federal government should reduce or eliminate its grants in one program area, and redirect those resources into another. Such sorting out holds the promise of allowing the entity with full funding responsibility over an area to improve its efficiency and effectiveness. For states, it could provide flexibility that federal oversight typically precludes, and reduce or eliminate costly and often-burdensome requirements that accompany most federal assistance.
During the Reagan administration, it was suggested that states assume full funding responsibility for the major welfare program (Aid to Families with Dependent Children) while the federal government would take full responsibility for Medicaid. In retrospect, this would have been an excellent deal for states, but it never gained traction.
We are now in another period of federal budget retrenchment. Due to efforts to reduce the federal budget deficit, most federal grant programs outside those designated as “mandatory” have seen level funding at best, and sometimes significant reductions, especially in inflation-adjusted terms. The prospect of swapping greater federal responsibility in one program area for greater state responsibility in another is gaining renewed interest.
To understand the potential impact of federal-state responsibility swaps, it is necessary to consider the importance of federal funding in each of the major categories of public spending. This Special Analysis examines the major areas of state-federal fiscal relations, and provides background information on states’ reliance on federal funds in a host of program areas.
How Important are Federal Funds?
In fiscal year (FY) 2012, intergovernmental revenue accounted for about one-third of state general revenue (32.8%). The vast majority of that intergovernmental revenue came from the federal government (31.6%). This makes the federal government the single largest source of state general revenue. The table on the next page lists the share of each state’s general revenue provided by federal or local governments.
States vary greatly in their reliance on intergovernmental funds, with such funds accounting for 45.8% of general revenues in Mississippi and 20% in Alaska. The relative importance of federal funding to a state is determined

FFIS Special Analysis 15-01 Page 2
by two factors: how much a state collects in general revenue overall, and how it performs in its fiscal relationship with the federal government (i.e., how much it gets back for every dollar it sends to Washington).
While the federal government is an important player in state fiscal policy, its involvement is concentrated in certain areas. The pie chart on the next page shows the allocation of federal grant funds in FY 2012, according to budget documents from the Office of Management and Budget (OMB). Health programs constituted the largest share (49%); followed by income security (19%); education, training, employment, and social services (13%); and transportation (11%). Other program areas play only minor roles.
Rank State Percent Rank State Percent
1 Mississippi 45.8% 27 Michigan 34.1%
2 Louisiana 44.3 28 North Carolina 33.9
3 South Dakota 41.5 29 Indiana 33.2
4 Tennessee 41.3 United States 32.8
5 Missouri 40.8 30 Florida 32.6
6 Wyoming 39.7 31 New Hampshire 32.1
7 Arizona 39.4 32 Utah 31.7
8 Georgia 38.9 33 Maryland 31.3
9 Montana 38.5 34 Pennsylvania 30.9
10 New Mexico 37.9 35 Massachusetts 29.6
11 New York 37.7 36 Washington 29.4
12 Alabama 37.0 37 Colorado 29.2
13 Maine 36.6 38 Wisconsin 28.9
14 Oklahoma 36.2 39 California 28.8
15 Oregon 36.2 40 Minnesota 28.5
16 Ohio 35.9 41 New Jersey 27.5
17 Kentucky 35.8 42 Nevada 27.5
18 West Virginia 35.5 43 Kansas 27.2
19 Idaho 35.2 44 Illinois 26.2
20 Texas 35.1 45 Delaware 25.4
21 Nebraska 34.9 46 Virginia 24.8
22 Vermont 34.9 47 Connecticut 23.7
23 Iowa 34.8 48 Hawaii 23.6
24 Arkansas 34.5 49 North Dakota 21.0
25 South Carolina 34.5 50 Alaska 20.0
26 Rhode Island 34.5
Source: Census Bureau, State Government Finances
Intergovernmental Revenue as a Percent of State General Revenue, FY 2012

FFIS Special Analysis 15-01 Page 3
Evaluating the State-Federal Fiscal Relationship
The prospect for states and the federal government to swap certain programs can be better evaluated with an understanding of the current fiscal relationship. To provide that baseline, federal grant funding was evaluated in the following program areas:
Education
Welfare/Hospitals
Highways
Natural resources/Recreation
Health
Police/Corrections
Unemployment insurance
Two primary sources provided data on the role of federal funding:
The Census Bureau’s State Government Finances in 2012, which reports on state spending in a variety of general expenditure functions.
FFIS’s database, which includes 240+ programs accounting for about 90% of total grant funding flowing to state and local governments.
Together, these two sources allow comparisons of how important a role federal funds play in major state spending areas. That said, the Census Bureau codes state spending in ways that differ from other federal and state practices, so a crosswalk between the two data sources had to be developed. Moreover, programs were excluded from the analysis if:
The program flows directly to an individual, such as Pell Grants and Supplemental Nutrition Assistance Program (SNAP) benefits.
The program flows directly to local governments, such as several programs in the Department of Housing and Urban Development and the Federal Transit Administration.
Program funding is based on a share of federal revenues or fees, such as mineral leasing payments and crime victim assistance.
Census excludes the program from its categories (and reports them in “other spending”), such as workforce investment programs and environmental revolving loan programs.
Energy, Natural Resources,
Environment, $12 (2%)
Agriculture, $1 (0%)
Community and Regional
Development, $20 (4%)
Transportation, $61 (11%)
Education, Training Employment, and
Social Services, $68 (13%)
Health, $268 (49%)
Income Security, $103 (19%)
Justice, $5 (1%)
Other, $7 (1%)
Grants to State and Local Governments, FY 2012($ in billions)

FFIS Special Analysis 15-01 Page 4
To provide a sense of perspective, the table below lists the amount of federal funds each state received in FY 2012 in the program areas included in the analysis.
State Education
Welfare/
Hospitals Highways
Natural Resources/
Recreation Health
Police/
Corrections
Unemployment
Insurance Total
Alabama $839,252 $4,584,844 $624,709 $57,898 $323,269 $16,840 $47,716 $6,494,528
Alaska 166,371 1,079,061 476,661 45,224 105,962 8,518 34,803 1,916,600
Arizona 1,052,476 6,720,517 701,185 28,476 362,415 28,499 53,983 8,947,551
Arkansas 564,241 3,653,690 503,713 36,870 204,073 13,784 31,744 5,008,115
California 6,079,469 36,897,186 3,559,072 83,166 2,571,910 194,267 542,354 49,927,423
Colorado 606,341 3,115,751 521,695 41,599 277,252 20,231 58,933 4,641,802
Connecticut 454,406 3,731,103 483,532 17,887 188,909 14,302 68,288 4,958,427
Delaware 164,243 990,417 167,706 16,328 64,828 9,293 14,023 1,426,837
Florida 2,771,519 13,401,478 1,810,578 55,084 1,060,059 66,007 137,222 19,301,947
Georgia 1,782,703 7,034,445 1,224,285 47,270 636,949 30,663 99,339 10,855,653
Hawaii 192,976 1,119,847 167,325 14,695 95,762 9,673 20,493 1,620,770
Idaho 242,159 1,468,425 275,512 24,164 108,818 10,315 28,235 2,157,628
Illinois 2,103,016 9,667,707 1,377,034 70,882 737,308 50,088 209,710 14,215,745
Indiana 1,032,462 6,222,813 910,622 52,790 313,311 19,879 66,430 8,618,307
Iowa 414,833 2,812,646 470,920 36,892 155,232 13,117 35,405 3,939,045
Kansas 444,575 2,101,857 372,039 29,109 143,469 13,297 28,207 3,132,552
Kentucky 794,893 5,151,134 604,750 102,233 268,434 14,735 43,702 6,979,880
Louisiana 924,707 5,999,869 682,628 37,861 331,310 17,095 43,090 8,036,560
Maine 208,879 1,757,312 182,720 20,414 84,856 9,583 22,216 2,285,979
Maryland 742,718 4,754,084 570,955 30,329 328,029 23,231 81,076 6,530,421
Massachusetts 890,200 8,399,560 595,244 21,651 328,641 25,116 84,802 10,345,215
Michigan 1,702,223 10,532,190 1,022,081 56,088 514,903 30,719 173,095 14,031,300
Minnesota 688,212 5,973,513 633,983 49,448 255,955 17,688 61,404 7,680,203
Mississippi 665,898 4,539,563 464,266 34,100 244,459 12,726 31,880 5,992,892
Missouri 920,243 6,889,611 913,516 51,658 314,410 19,750 56,562 9,165,750
Montana 170,022 1,006,855 394,907 43,462 75,793 9,108 15,404 1,715,551
Nebraska 294,485 1,420,478 284,162 24,596 102,933 11,026 23,816 2,161,495
Nevada 359,822 1,282,962 351,561 18,734 140,769 16,879 43,396 2,214,123
New Hampshire 167,060 854,760 162,154 14,870 61,938 9,782 19,595 1,290,158
New Jersey 1,191,330 7,929,316 962,878 25,016 431,662 36,519 144,455 10,721,176
New Mexico 425,005 3,467,845 355,594 28,874 171,190 12,373 22,428 4,483,310
New York 3,394,222 37,401,720 1,630,223 51,879 1,274,336 129,395 250,605 44,132,380
North Carolina 1,505,546 9,414,543 973,336 59,720 529,434 30,666 86,208 12,599,453
North Dakota 132,759 615,333 244,666 24,831 48,179 8,280 13,784 1,087,833
Ohio 1,838,772 14,185,970 1,272,615 67,455 550,365 32,227 136,629 18,084,034
Oklahoma 657,498 3,922,124 616,068 42,567 219,490 15,562 35,775 5,509,085
Oregon 549,166 3,805,843 488,372 32,128 228,435 16,831 64,565 5,185,340
Pennsylvania 1,810,610 14,635,832 1,488,453 131,805 616,201 37,197 184,835 18,904,933
Rhode Island 182,900 1,404,231 216,036 13,569 80,617 9,705 18,374 1,925,432
South Carolina 811,771 4,281,530 599,689 35,350 300,219 18,428 44,992 6,091,980
South Dakota 158,206 676,189 274,763 21,758 60,650 8,511 11,648 1,211,724
Tennessee 1,048,443 7,206,493 791,139 50,184 346,948 22,025 54,645 9,519,877
Texas 5,081,130 21,803,222 3,022,378 92,675 1,507,028 86,758 206,757 31,799,948
Utah 414,405 1,812,337 313,316 28,863 146,488 13,086 35,023 2,763,518
Vermont 132,673 1,005,580 200,683 13,501 51,101 8,222 11,482 1,423,243
Virginia 1,014,780 4,755,763 945,129 56,627 351,853 26,783 66,887 7,217,821
Washington 876,015 5,581,444 665,206 36,610 424,112 24,552 128,204 7,736,144
West Virginia 360,144 2,579,128 384,832 101,780 132,568 10,447 22,479 3,591,378
Wisconsin 817,993 5,257,638 722,219 49,593 267,117 18,863 87,835 7,221,258
Wyoming 123,077 395,505 248,661 171,609 38,111 7,978 13,607 998,549
State Subtotal 49,966,850 315,301,268 36,925,770 2,300,169 18,178,060 1,310,616 3,818,141 427,800,874
District of Columbia 139,823 1,779,330 158,443 6,221 89,779 9,480 15,023 2,198,100
Puerto Rico 1,013,483 3,285,015 155,811 22,760 452,785 14,332 29,055 4,973,241
Virgin Islands 43,570 51,106 17,511 6,788 20,942 3,315 3,437 146,669
American Samoa 27,679 23,068 5,511 6,475 14,058 2,838 0 79,629
Guam 51,220 49,007 17,511 6,948 19,989 3,750 328 148,753
Northern Mariana Islands 16,713 23,920 4,937 6,006 12,208 2,613 0 66,397
Unallocated 597,313 7,666,858 101,953 96,257 2,163,859 345,057 59,906 11,031,202
National Total $51,856,650 $328,179,572 $37,387,447 $2,451,625 $20,951,681 $1,692,000 $3,925,890 $446,444,864
Federal Grants Flowing to States in Major Programs, FY 2012
(dollars in thousands)

FFIS Special Analysis 15-01 Page 5
While the preceding table provides a sense of the dollars in play in various federal grant areas, the table below lists the share of total federal funding each state receives. This share is listed along with the state’s share of the national population for comparison.
State Education
Welfare/
Hospitals Highways
Natural Resources/
Recreation Health
Police/
Corrections
Unemployment
Insurance Total Population
Alabama 1.7% 1.5% 1.7% 2.5% 1.8% 1.3% 1.2% 1.5% 1.5%
Alaska 0.3% 0.3% 1.3% 2.0% 0.6% 0.6% 0.9% 0.4% 0.2%
Arizona 2.1% 2.1% 1.9% 1.2% 2.0% 2.2% 1.4% 2.1% 2.1%
Arkansas 1.1% 1.2% 1.4% 1.6% 1.1% 1.1% 0.8% 1.2% 0.9%
California 12.2% 11.7% 9.6% 3.6% 14.1% 14.8% 14.2% 11.7% 12.1%
Colorado 1.2% 1.0% 1.4% 1.8% 1.5% 1.5% 1.5% 1.1% 1.7%
Connecticut 0.9% 1.2% 1.3% 0.8% 1.0% 1.1% 1.8% 1.2% 1.1%
Delaware 0.3% 0.3% 0.5% 0.7% 0.4% 0.7% 0.4% 0.3% 0.3%
Florida 5.5% 4.3% 4.9% 2.4% 5.8% 5.0% 3.6% 4.5% 6.2%
Georgia 3.6% 2.2% 3.3% 2.1% 3.5% 2.3% 2.6% 2.5% 3.2%
Hawaii 0.4% 0.4% 0.5% 0.6% 0.5% 0.7% 0.5% 0.4% 0.4%
Idaho 0.5% 0.5% 0.7% 1.1% 0.6% 0.8% 0.7% 0.5% 0.5%
Illinois 4.2% 3.1% 3.7% 3.1% 4.1% 3.8% 5.5% 3.3% 4.1%
Indiana 2.1% 2.0% 2.5% 2.3% 1.7% 1.5% 1.7% 2.0% 2.1%
Iowa 0.8% 0.9% 1.3% 1.6% 0.9% 1.0% 0.9% 0.9% 1.0%
Kansas 0.9% 0.7% 1.0% 1.3% 0.8% 1.0% 0.7% 0.7% 0.9%
Kentucky 1.6% 1.6% 1.6% 4.4% 1.5% 1.1% 1.1% 1.6% 1.4%
Louisiana 1.9% 1.9% 1.8% 1.6% 1.8% 1.3% 1.1% 1.9% 1.5%
Maine 0.4% 0.6% 0.5% 0.9% 0.5% 0.7% 0.6% 0.5% 0.4%
Maryland 1.5% 1.5% 1.5% 1.3% 1.8% 1.8% 2.1% 1.5% 1.9%
Massachusetts 1.8% 2.7% 1.6% 0.9% 1.8% 1.9% 2.2% 2.4% 2.1%
Michigan 3.4% 3.3% 2.8% 2.4% 2.8% 2.3% 4.5% 3.3% 3.2%
Minnesota 1.4% 1.9% 1.7% 2.1% 1.4% 1.3% 1.6% 1.8% 1.7%
Mississippi 1.3% 1.4% 1.3% 1.5% 1.3% 1.0% 0.8% 1.4% 1.0%
Missouri 1.8% 2.2% 2.5% 2.2% 1.7% 1.5% 1.5% 2.1% 1.9%
Montana 0.3% 0.3% 1.1% 1.9% 0.4% 0.7% 0.4% 0.4% 0.3%
Nebraska 0.6% 0.5% 0.8% 1.1% 0.6% 0.8% 0.6% 0.5% 0.6%
Nevada 0.7% 0.4% 1.0% 0.8% 0.8% 1.3% 1.1% 0.5% 0.9%
New Hampshire 0.3% 0.3% 0.4% 0.6% 0.3% 0.7% 0.5% 0.3% 0.4%
New Jersey 2.4% 2.5% 2.6% 1.1% 2.4% 2.8% 3.8% 2.5% 2.8%
New Mexico 0.9% 1.1% 1.0% 1.3% 0.9% 0.9% 0.6% 1.0% 0.7%
New York 6.8% 11.9% 4.4% 2.3% 7.0% 9.9% 6.6% 10.3% 6.3%
North Carolina 3.0% 3.0% 2.6% 2.6% 2.9% 2.3% 2.3% 2.9% 3.1%
North Dakota 0.3% 0.2% 0.7% 1.1% 0.3% 0.6% 0.4% 0.3% 0.2%
Ohio 3.7% 4.5% 3.4% 2.9% 3.0% 2.5% 3.6% 4.2% 3.7%
Oklahoma 1.3% 1.2% 1.7% 1.9% 1.2% 1.2% 0.9% 1.3% 1.2%
Oregon 1.1% 1.2% 1.3% 1.4% 1.3% 1.3% 1.7% 1.2% 1.2%
Pennsylvania 3.6% 4.6% 4.0% 5.7% 3.4% 2.8% 4.8% 4.4% 4.1%
Rhode Island 0.4% 0.4% 0.6% 0.6% 0.4% 0.7% 0.5% 0.5% 0.3%
South Carolina 1.6% 1.4% 1.6% 1.5% 1.7% 1.4% 1.2% 1.4% 1.5%
South Dakota 0.3% 0.2% 0.7% 0.9% 0.3% 0.6% 0.3% 0.3% 0.3%
Tennessee 2.1% 2.3% 2.1% 2.2% 1.9% 1.7% 1.4% 2.2% 2.1%
Texas 10.2% 6.9% 8.2% 4.0% 8.3% 6.6% 5.4% 7.4% 8.3%
Utah 0.8% 0.6% 0.8% 1.3% 0.8% 1.0% 0.9% 0.6% 0.9%
Vermont 0.3% 0.3% 0.5% 0.6% 0.3% 0.6% 0.3% 0.3% 0.2%
Virginia 2.0% 1.5% 2.6% 2.5% 1.9% 2.0% 1.8% 1.7% 2.6%
Washington 1.8% 1.8% 1.8% 1.6% 2.3% 1.9% 3.4% 1.8% 2.2%
West Virginia 0.7% 0.8% 1.0% 4.4% 0.7% 0.8% 0.6% 0.8% 0.6%
Wisconsin 1.6% 1.7% 2.0% 2.2% 1.5% 1.4% 2.3% 1.7% 1.8%
Wyoming 0.2% 0.1% 0.7% 7.5% 0.2% 0.6% 0.4% 0.2% 0.2%
State Total 100.0% 100.0% 100.0% 100.0% 100.0% 100.0% 100.0% 100.0% 100.0%
State Shares of Federal Grant Funds and of National Population, FY 2012
FFIS Special Analysis 15-01 Page 6
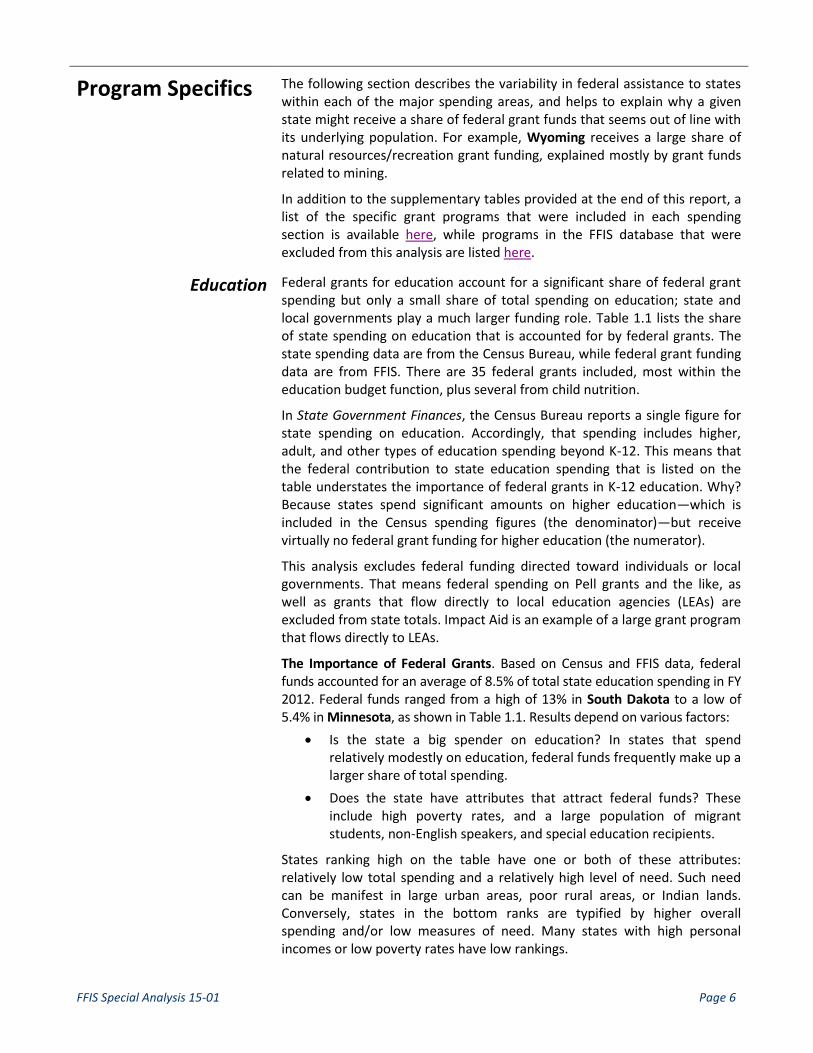
Program Specifics The following section describes the variability in federal assistance to states within each of the major spending areas, and helps to explain why a given state might receive a share of federal grant funds that seems out of line with its underlying population. For example, Wyoming receives a large share of natural resources/recreation grant funding, explained mostly by grant funds related to mining.
In addition to the supplementary tables provided at the end of this report, a list of the specific grant programs that were included in each spending section is available here, while programs in the FFIS database that were excluded from this analysis are listed here.
Education Federal grants for education account for a significant share of federal grant spending but only a small share of total spending on education; state and local governments play a much larger funding role. Table 1.1 lists the share of state spending on education that is accounted for by federal grants. The state spending data are from the Census Bureau, while federal grant funding data are from FFIS. There are 35 federal grants included, most within the education budget function, plus several from child nutrition.
In State Government Finances, the Census Bureau reports a single figure for state spending on education. Accordingly, that spending includes higher, adult, and other types of education spending beyond K-12. This means that the federal contribution to state education spending that is listed on the table understates the importance of federal grants in K-12 education. Why? Because states spend significant amounts on higher education—which is included in the Census spending figures (the denominator)—but receive virtually no federal grant funding for higher education (the numerator).
This analysis excludes federal funding directed toward individuals or local governments. That means federal spending on Pell grants and the like, as well as grants that flow directly to local education agencies (LEAs) are excluded from state totals. Impact Aid is an example of a large grant program that flows directly to LEAs.
The Importance of Federal Grants. Based on Census and FFIS data, federal funds accounted for an average of 8.5% of total state education spending in FY 2012. Federal funds ranged from a high of 13% in South Dakota to a low of 5.4% in Minnesota, as shown in Table 1.1. Results depend on various factors:
Is the state a big spender on education? In states that spend relatively modestly on education, federal funds frequently make up a larger share of total spending.
Does the state have attributes that attract federal funds? These include high poverty rates, and a large population of migrant students, non-English speakers, and special education recipients.
States ranking high on the table have one or both of these attributes: relatively low total spending and a relatively high level of need. Such need can be manifest in large urban areas, poor rural areas, or Indian lands. Conversely, states in the bottom ranks are typified by higher overall spending and/or low measures of need. Many states with high personal incomes or low poverty rates have low rankings.

FFIS Special Analysis 15-01 Page 7
Federal Funds Per Capita. While federal funds as a share of total state spending vary, based partly on how much a state spends in total, federal funding per capita allows an apples-to-apples comparison of the variation in state receipts of federal funds. Table 1.2 shows the state detail, with the average state receiving $159 per capita in federal education grants. Alaska receives the most, $228 per capita, and Colorado receives the least, $117 per capita.
States with small populations often do well on such measures because grant programs sometimes contain a “small-state minimum” that provides a state a larger share of total funding than it would otherwise receive. States with high child poverty rates also do well, not only because many education programs target such populations, but also because child nutrition programs do the same.
Many of the states with relatively high per capita incomes are clustered at the bottom of the table, suggesting that federal education programs are somewhat redistributive.
Public Welfare/ Hospitals
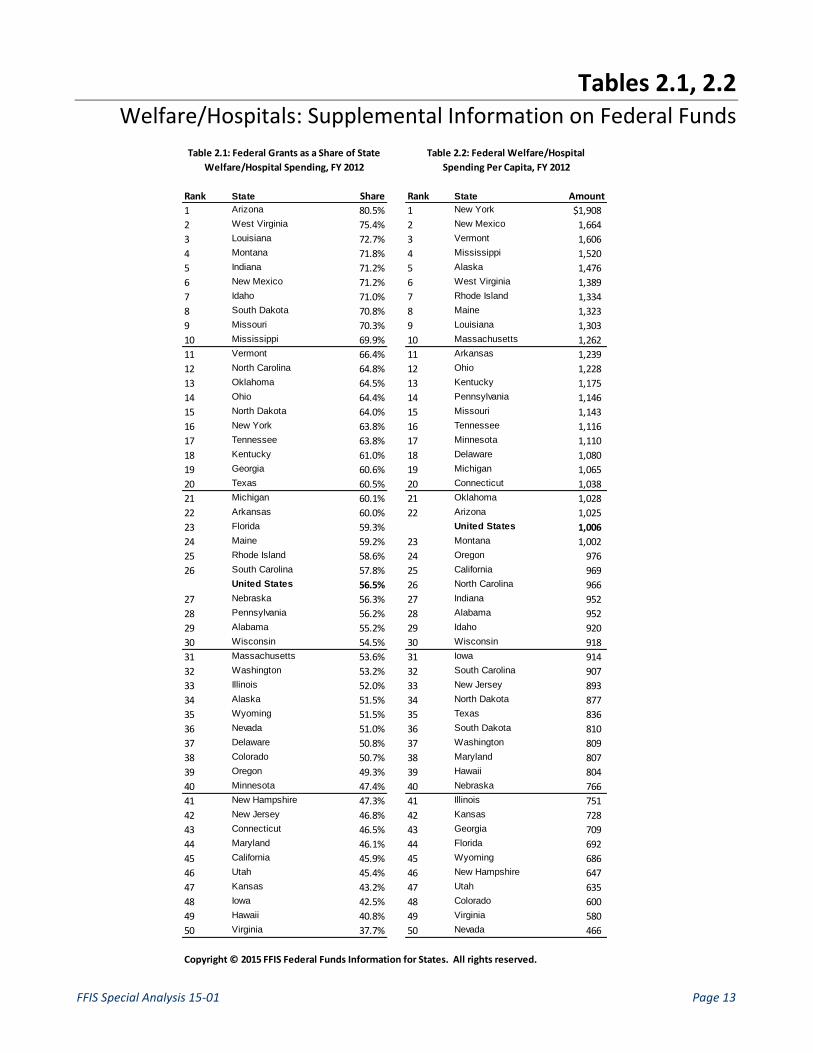
Evaluating the role of federal funds in public welfare and hospitals requires a shift in conventional thinking about what constitutes public welfare. In contrast to both state and federal budgeting practices, the Census Bureau does not assign state spending for Medicaid and the Children’s Health Insurance Program (CHIP) to health, but instead to public welfare or hospitals, depending on the nature of the expenditure. In addition, the Census category for public welfare includes more traditional income security programs, such as child nutrition programs that are not school-based, adoption and foster care assistance, Temporary Assistance for Needy Families (TANF), and programs for the elderly. As a result, the Census figure for public welfare expenditures is very large, representing 49 programs and almost three-fourths of the federal grant funds included in this analysis (73.7%).
On average (and in 38 states), federal funds constitute the majority of state spending on public hospitals and welfare. Table 2.1 shows the state detail, with federal funds accounting for a high of 80.5% of spending in Arizona and a low of 37.7% in Virginia. As with education, state outcomes reflect both state spending and state characteristics. Given the importance of Medicaid vendor payments in determining overall results (representing $249 billion out of $315 billion in total federal welfare grants), both the breadth of a state’s Medicaid program and its federal matching rate are important.
Equally important is whether a state elects to spend its own funds on other welfare programs and hospitals. Unlike education, where most states face constitutional requirements to provide education services—and many face judicial mandates to fund education at “adequate” levels—requirements for welfare programs typically have their origins in federal statute. As such, states may be required to match federal spending or provide maintenance-of-effort spending for certain grant programs.
The Importance of Federal Grants. As Table 2.1 shows, federal grants are an important component of most states’ spending on welfare and hospital programs. If states limit such programs to those mandated by federal law, and
FFIS Special Analysis 15-01 Page 8
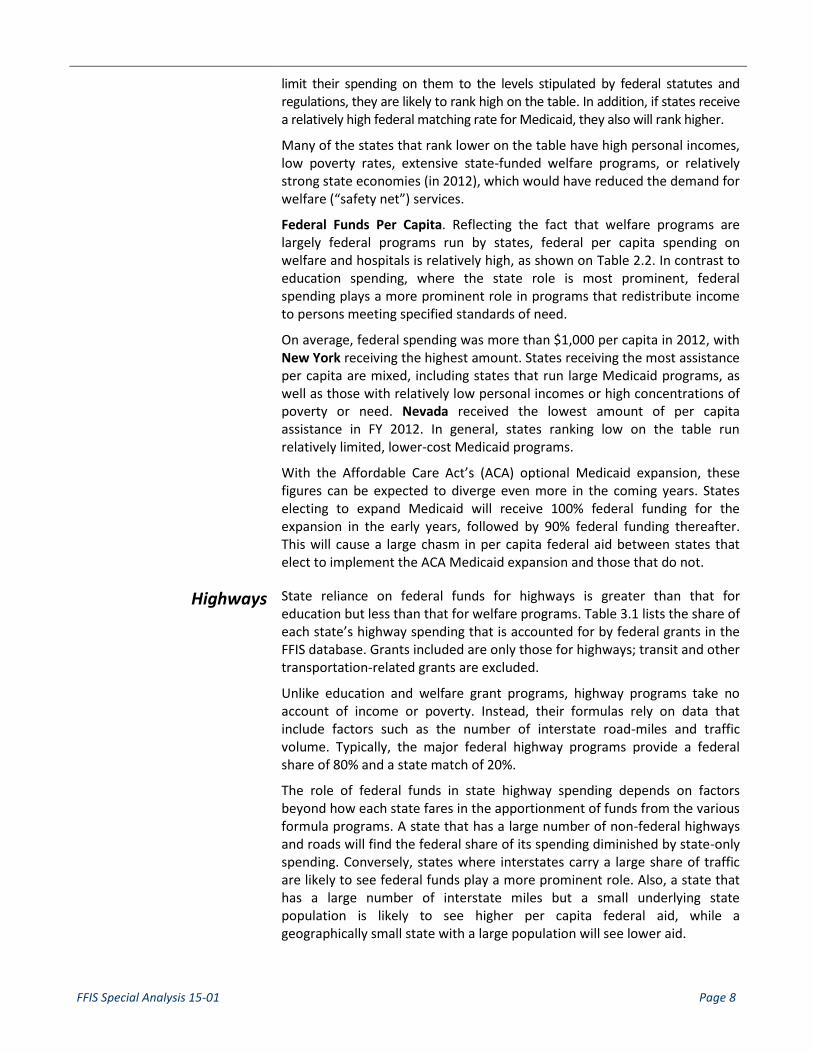
limit their spending on them to the levels stipulated by federal statutes and regulations, they are likely to rank high on the table. In addition, if states receive a relatively high federal matching rate for Medicaid, they also will rank higher.
Many of the states that rank lower on the table have high personal incomes, low poverty rates, extensive state-funded welfare programs, or relatively strong state economies (in 2012), which would have reduced the demand for welfare (“safety net”) services.
Federal Funds Per Capita. Reflecting the fact that welfare programs are largely federal programs run by states, federal per capita spending on welfare and hospitals is relatively high, as shown on Table 2.2. In contrast to education spending, where the state role is most prominent, federal spending plays a more prominent role in programs that redistribute income to persons meeting specified standards of need.
On average, federal spending was more than $1,000 per capita in 2012, with New York receiving the highest amount. States receiving the most assistance per capita are mixed, including states that run large Medicaid programs, as well as those with relatively low personal incomes or high concentrations of poverty or need. Nevada received the lowest amount of per capita assistance in FY 2012. In general, states ranking low on the table run relatively limited, lower-cost Medicaid programs.
With the Affordable Care Act’s (ACA) optional Medicaid expansion, these figures can be expected to diverge even more in the coming years. States electing to expand Medicaid will receive 100% federal funding for the expansion in the early years, followed by 90% federal funding thereafter. This will cause a large chasm in per capita federal aid between states that elect to implement the ACA Medicaid expansion and those that do not.
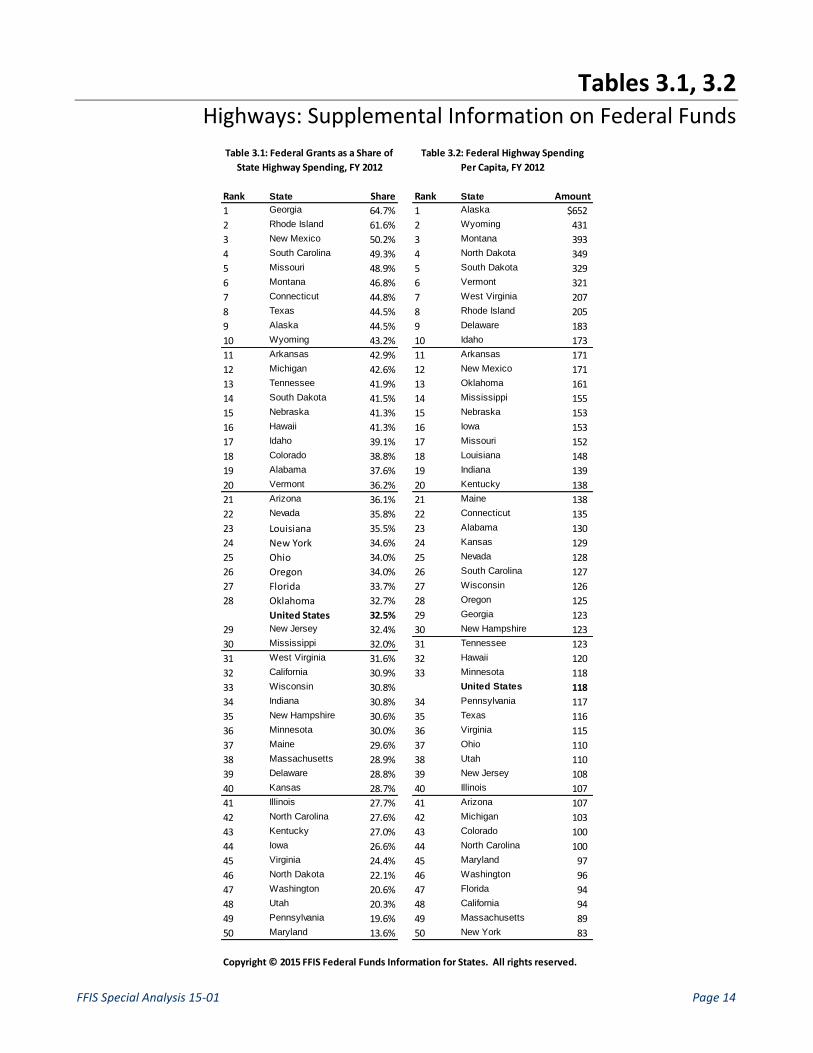
Highways State reliance on federal funds for highways is greater than that for education but less than that for welfare programs. Table 3.1 lists the share of each state’s highway spending that is accounted for by federal grants in the FFIS database. Grants included are only those for highways; transit and other transportation-related grants are excluded.
Unlike education and welfare grant programs, highway programs take no account of income or poverty. Instead, their formulas rely on data that include factors such as the number of interstate road-miles and traffic volume. Typically, the major federal highway programs provide a federal share of 80% and a state match of 20%.
The role of federal funds in state highway spending depends on factors beyond how each state fares in the apportionment of funds from the various formula programs. A state that has a large number of non-federal highways and roads will find the federal share of its spending diminished by state-only spending. Conversely, states where interstates carry a large share of traffic are likely to see federal funds play a more prominent role. Also, a state that has a large number of interstate miles but a small underlying state population is likely to see higher per capita federal aid, while a geographically small state with a large population will see lower aid.

FFIS Special Analysis 15-01 Page 9
The Importance of Federal Grants. Nationally, federal grants accounted for 32.5% of state highway spending in FY 2012, ranging from 64.7% in Georgia to 13.6% in Maryland. Table 3.1 shows the detail. States ranking at the top of the table are diverse, representing rural and urban states in all geographic regions with large and small populations. The same can be said of bottom-ranking states, making it difficult to generalize about factors that explain state results.
Federal Funds Per Capita. In contrast to the difficulty of generalizing about the importance of federal funds in total state highway spending, it is easy to generalize about per capita federal funding. As shown on Table 3.2, states received an average of $118 per capita in federal highway funds in FY 2012, but the range was enormous, especially on the high side. Alaska, a huge state with a very small population, received $652 per capita, while New York, which ranks #30 in land area but #4 in population, received $83. In general, states with small populations do very well on this measure and states with denser populations do worse. An anomaly is Utah, which one would expect to rank higher given its large geography and small population.
Also important is the fact that highly urbanized states—which are clustered at the bottom of the table—are more likely to receive federal transit assistance, which is not reflected in the figures reported here.
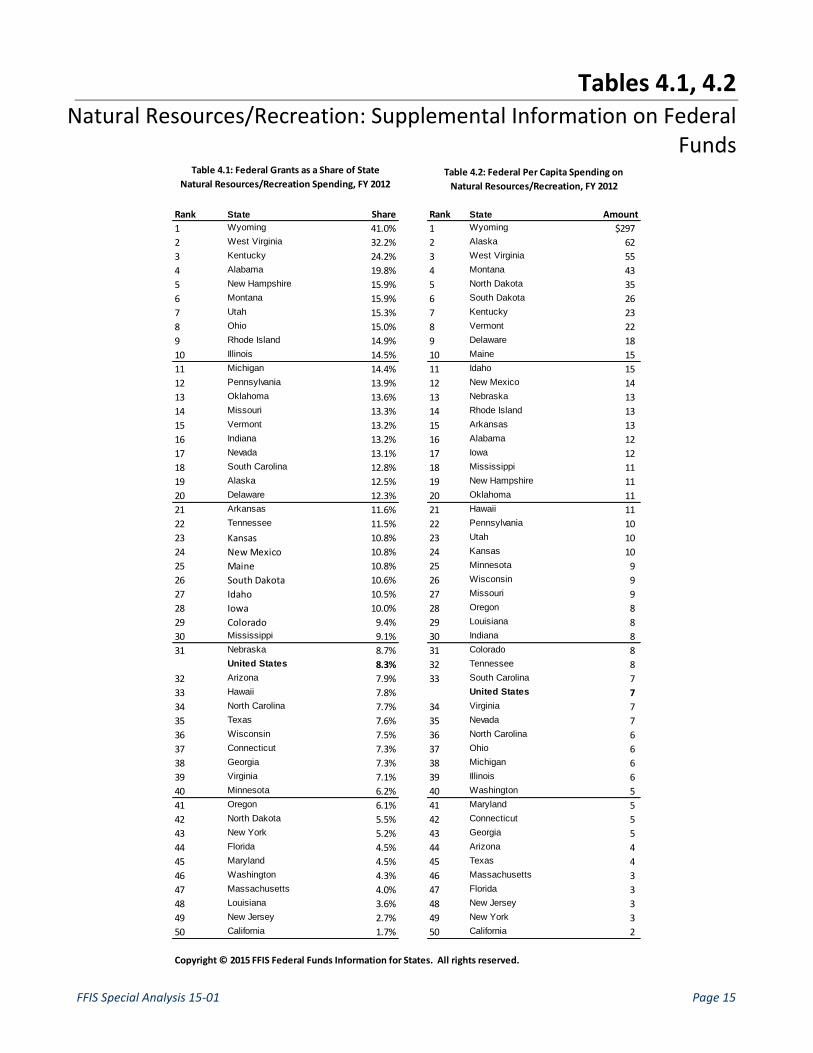
Natural Resources/ Parks and Recreation
On the grants side, federal spending in this category ranges from programs in the Department of the Interior that fund hunting and fishing, to watershed and resource conservation activities in the Department of Agriculture. Extension and cooperative research activities are included, as is historic preservation, boating safety, and mine reclamation. In other words, it covers a lot of area.
On the state spending side, the category combines Census data for two spending categories: natural resources, and parks and recreation. As with every other category, state outcomes depend both on how much a state receives in federal funds and how much it elects to spend in state funds.
The Importance of Federal Grants. Table 4.1 lists the share of state spending on natural resources/parks and recreation that is accounted for by federal grant funds in the FFIS database. On average, federal grants represent 8.3% of total spending, ranging from 41% in Wyoming to just 1.7% in California. Wyoming’s top ranking owes largely to its receipts under the Abandoned Mine Reclamation Fund; it received almost one-third of funding for that program in FY 2012. West Virginia and Kentucky also receive large payments from the program.
Federal Funds Per Capita. The relative importance of the abandoned mine program is reflected in the per capita spending figures listed in Table 4.2. While the average state received $7 per capita in federal funding for the spending included in this category, Wyoming received $297 per capita in FY 2012. The combination of high payments and a small population makes the state an outlier.
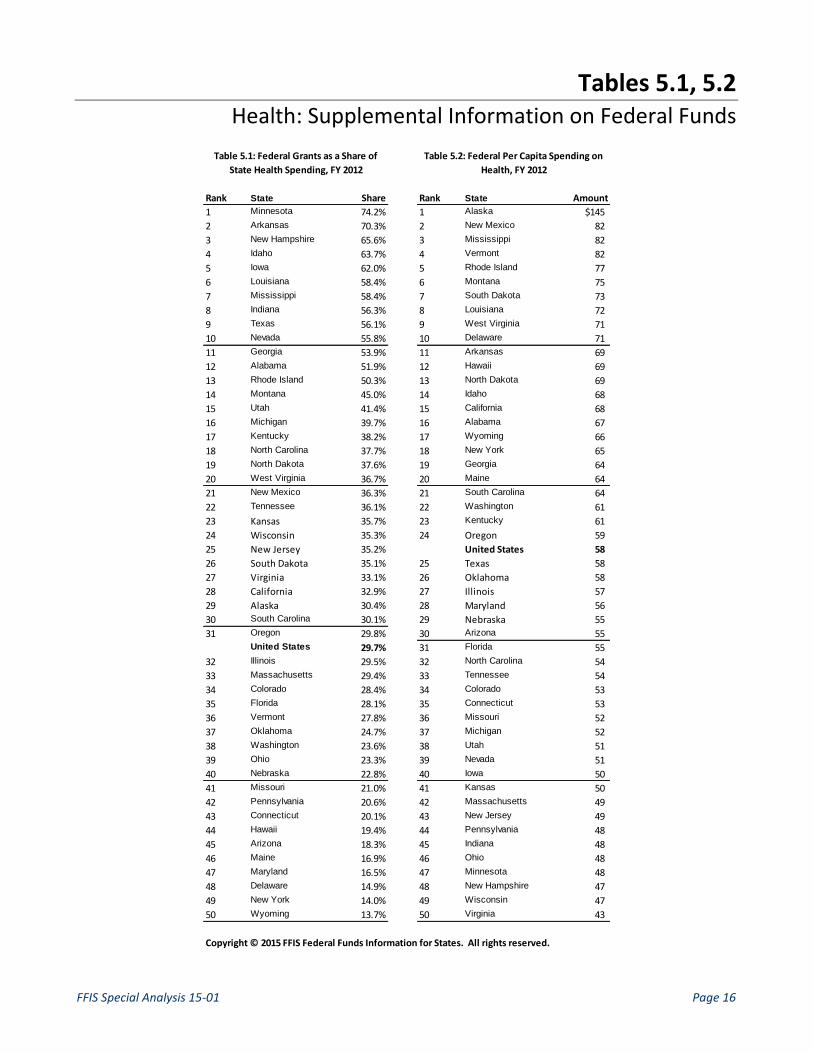
Health In addition to non-Medicaid health programs funded by the Department of Health and Human Services (e.g., Preventive Health Block Grant, Maternal

FFIS Special Analysis 15-01 Page 10
and Child Health Block Grant), this category includes spending that benefits public health, including many Environmental Protection Agency (EPA) programs. It also includes the Supplemental Feeding Program for Women, Infants, and Children (WIC).
The Importance of Federal Grants. Table 5.1 lists the share of each state’s total spending on health that is accounted for by federal grants. Such grants accounted for 29.7% of the average state’s spending in FY 2012, with a range extending from 74.2% in Minnesota to 13.7% in Wyoming. Minnesota is reported as having unusually low total spending. Colorado, for example, has about the same population as Minnesota but Colorado spent almost three times more on health in 2012, according to Census. Given the varied collection of programs that Census groups into this category, it’s possible that the crosswalk from state spending categories and definitions to Census classifications led to this anomalous result.
Federal Funds Per Capita. In per capita terms, the average state received $58 in federal funds for health programs in FY 2012. The amounts range from a high of $145 in Alaska to a low of $43 in Virginia, as shown on Table 5.2. The disparate types of spending included in this category make it difficult to discern what explains state differences.
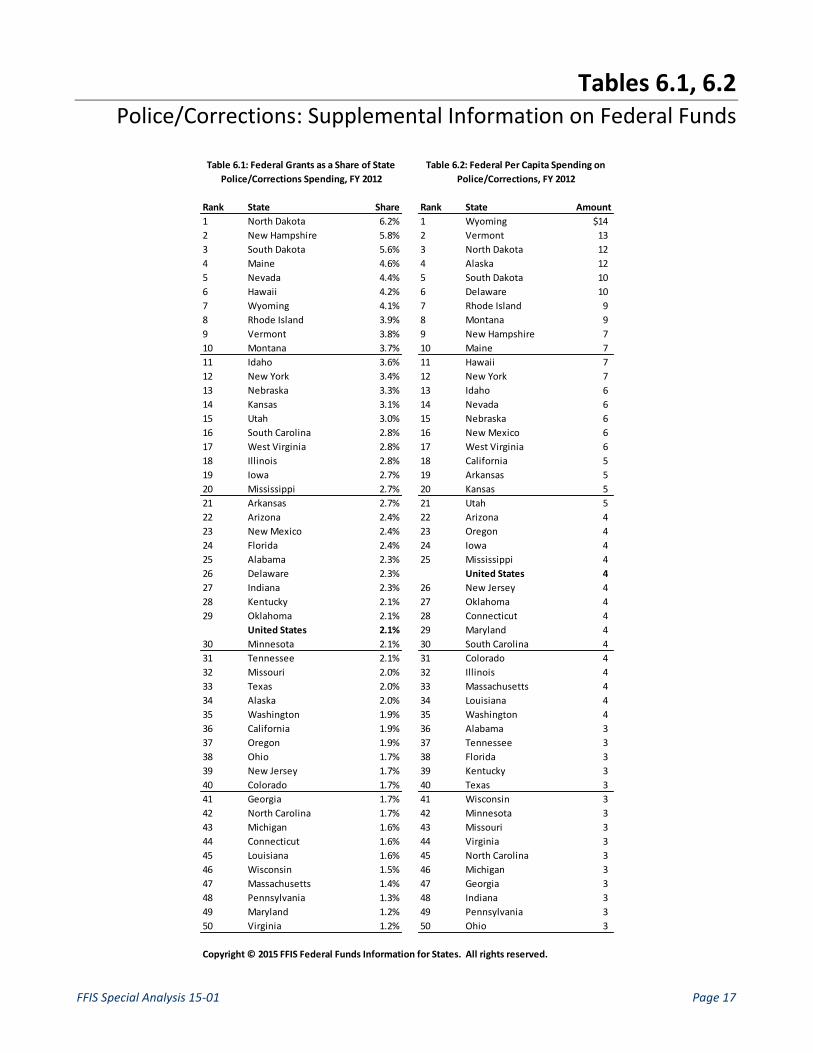
Police/Corrections The federal role in state spending for police and corrections is very small, both in terms of its share of total spending and its per capita amounts. The major funding included in this area is for juvenile justice grants, Violence Against Women Grants, Justice Assistance Grants, and the State Criminal Alien Assistance Program. Table 6.1 lists federal grants as a share of state spending and Table 6.2 lists federal grants per capita.
The Importance of Federal Grants. Federal grants represent just 2.1% of total state spending on police and corrections, with grants in North Dakota representing the highest share of spending (6.2%) and those in Maryland and Virginia accounting for the smallest share (1.2%).
Federal Funds Per Capita. The per capita grant payments each state received in FY 2012 are small, averaging just $4 and ranging from $14 in Wyoming to $3 in a number of states. Given the concentration of states with small populations at the top of the list, it follows that there is a small-state minimum in one or more program formula. Such a provision would tend to benefit states with lower relative populations.
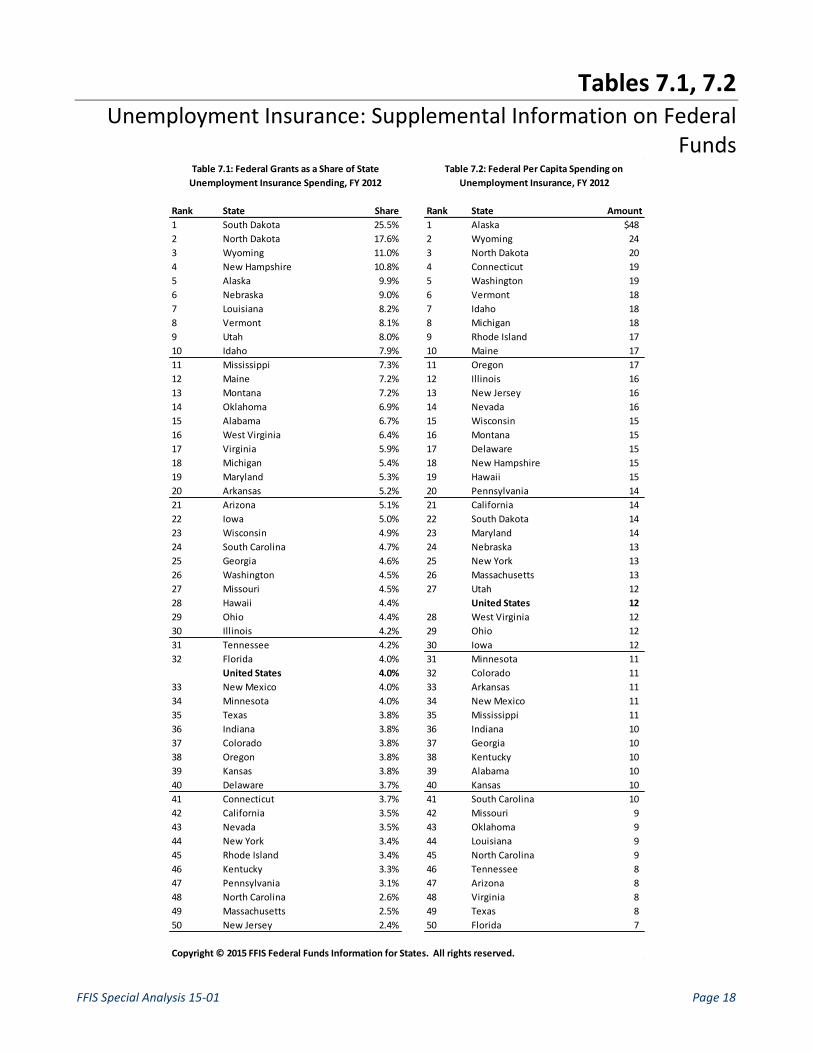
Unemployment Insurance
Finally, federal aid for unemployment insurance (UI) consists of grants for state administration of UI and employment service state grants. Census reports spending for unemployment compensation systems as insurance trust expenditures (in contrast to general expenditures, which describe all the other categories reported here).
The Importance of Federal Grants. Table 7.1 shows that federal grants accounted for an average of 4% of the total amount states spent on unemployment insurance systems in FY 2012. At one extreme, federal grants provided 25.5% of South Dakota’s total spending, while at the other, they provided just 2.4% of New Jersey’s.

FFIS Special Analysis 15-01 Page 11
Federal Funds Per Capita. Table 7.2 reports the per capita information, with the average state receiving $12 in federal funds per capita for unemployment compensation systems. Alaska received the most in FY 2012, $48 per capita, and Florida the least, $7.
Next Steps In 1992, an earlier period of federal retrenchment, Alice Rivlin authored Reviving the American Dream: The Economy, the States, and the Federal Government. It laid out a proposal for state-federal swaps that FFIS reviewed in State Policy Reports, Volume 30, Issue 22.
In contrast, this analysis makes no effort to identify program areas that might be appropriate for federal-state swaps. It merely identifies how important a role federal funding plays in a given program area and how much each state receives in grants relative to its population. This approach highlights areas where certain states—or groups of states—might have an interest in preserving the status quo, while others might be more willing to entertain some type of swap.
Copyright © 2015 FFIS Federal Funds Information for States. All rights reserved.

FFIS Special Analysis 15-01 Page 12
Tables 1.1, 1.2
Education: Supplemental Information on Federal Funds
Rank State Share Rank State Amount
1 South Dakota 13.0% 1 Alaska $228
2 Illinois 12.2% 2 Mississippi 223
3 Florida 12.1% 3 Wyoming 213
4 Mississippi 12.0% 4 Vermont 212
5 Arizona 11.5% 5 New Mexico 204
6 Tennessee 10.6% 6 Louisiana 201
7 Texas 10.4% 7 Texas 195
8 Georgia 10.3% 8 West Virginia 194
9 Louisiana 10.3% 9 Arkansas 191
10 Maine 10.0% 10 South Dakota 190
11 South Carolina 10.0% 11 North Dakota 189
12 Missouri 9.9% 12 Kentucky 181
13 Rhode Island 9.4% 13 Georgia 180
14 Montana 9.4% 14 Delaware 179
15 Idaho 9.2% 15 Alabama 174
16 Nebraska 8.9% 16 Rhode Island 174
17 Oklahoma 8.9% 17 New York 173
18 Ohio 8.7% 18 Oklahoma 172 United States 8.5% 19 Michigan 172
19 Nevada 8.4% 20 South Carolina 172
20 California 8.4% 21 Montana 169
21 Kentucky 8.3% 22 Illinois 163
22 West Virginia 8.3% 23 Tennessee 162
23 Pennsylvania 8.2% 24 Arizona 161
24 Alabama 8.1% 25 California 160
25 New York 8.1% United States 159
26 New Mexico 8.0% 26 Ohio 159
27 New Hampshire 7.9% 27 Nebraska 159
28 North Carolina 7.7% 28 Indiana 158
29 Oregon 7.6% 29 Maine 157
30 Michigan 7.4% 30 North Carolina 154
31 Arkansas 7.4% 31 Kansas 154
32 Kansas 7.4% 32 Missouri 153
33 Wyoming 7.3% 33 Idaho 152
34 Wisconsin 7.3% 34 Utah 145
35 North Dakota 7.2% 35 Florida 143
36 New Jersey 7.1% 36 Wisconsin 143
37 Indiana 7.0% 37 Pennsylvania 142
38 Massachusetts 6.9% 38 Oregon 141
39 Connecticut 6.8% 39 Hawaii 139
40 Virginia 6.7% 40 Iowa 135
41 Iowa 6.6% 41 New Jersey 134
42 Delaware 6.5% 42 Massachusetts 134
43 Colorado 6.5% 43 Nevada 131
44 Maryland 6.4% 44 Minnesota 128
45 Alaska 6.4% 45 Washington 127
46 Utah 6.1% 46 New Hampshire 126
47 Washington 5.8% 47 Connecticut 126
48 Vermont 5.7% 48 Maryland 126
49 Hawaii 5.5% 49 Virginia 124
50 Minnesota 5.4% 50 Colorado 117
Copyright © 2015 FFIS Federal Funds Information for States. All rights reserved.
Table 1.2: Federal Education Spending Per
Capita, FY 2012
Table 1.1: Federal Grants as a Share of State
Education Spending, FY 2012
FFIS Special Analysis 15-01 Page 13
Tables 2.1, 2.2
Welfare/Hospitals: Supplemental Information on Federal Funds
Rank State Share Rank State Amount
1 Arizona 80.5% 1 New York $1,908
2 West Virginia 75.4% 2 New Mexico 1,664
3 Louisiana 72.7% 3 Vermont 1,606
4 Montana 71.8% 4 Mississippi 1,520
5 Indiana 71.2% 5 Alaska 1,476
6 New Mexico 71.2% 6 West Virginia 1,389
7 Idaho 71.0% 7 Rhode Island 1,334
8 South Dakota 70.8% 8 Maine 1,323
9 Missouri 70.3% 9 Louisiana 1,303
10 Mississippi 69.9% 10 Massachusetts 1,262
11 Vermont 66.4% 11 Arkansas 1,239
12 North Carolina 64.8% 12 Ohio 1,228
13 Oklahoma 64.5% 13 Kentucky 1,175
14 Ohio 64.4% 14 Pennsylvania 1,146
15 North Dakota 64.0% 15 Missouri 1,143
16 New York 63.8% 16 Tennessee 1,116
17 Tennessee 63.8% 17 Minnesota 1,110
18 Kentucky 61.0% 18 Delaware 1,080
19 Georgia 60.6% 19 Michigan 1,065
20 Texas 60.5% 20 Connecticut 1,038
21 Michigan 60.1% 21 Oklahoma 1,028
22 Arkansas 60.0% 22 Arizona 1,025
23 Florida 59.3% United States 1,006
24 Maine 59.2% 23 Montana 1,002
25 Rhode Island 58.6% 24 Oregon 976
26 South Carolina 57.8% 25 California 969United States 56.5% 26 North Carolina 966
27 Nebraska 56.3% 27 Indiana 952
28 Pennsylvania 56.2% 28 Alabama 952
29 Alabama 55.2% 29 Idaho 920
30 Wisconsin 54.5% 30 Wisconsin 918
31 Massachusetts 53.6% 31 Iowa 914
32 Washington 53.2% 32 South Carolina 907
33 Illinois 52.0% 33 New Jersey 893
34 Alaska 51.5% 34 North Dakota 877
35 Wyoming 51.5% 35 Texas 836
36 Nevada 51.0% 36 South Dakota 810
37 Delaware 50.8% 37 Washington 809
38 Colorado 50.7% 38 Maryland 807
39 Oregon 49.3% 39 Hawaii 804
40 Minnesota 47.4% 40 Nebraska 766
41 New Hampshire 47.3% 41 Illinois 751
42 New Jersey 46.8% 42 Kansas 728
43 Connecticut 46.5% 43 Georgia 709
44 Maryland 46.1% 44 Florida 692
45 California 45.9% 45 Wyoming 686
46 Utah 45.4% 46 New Hampshire 647
47 Kansas 43.2% 47 Utah 635
48 Iowa 42.5% 48 Colorado 600
49 Hawaii 40.8% 49 Virginia 580
50 Virginia 37.7% 50 Nevada 466
Copyright © 2015 FFIS Federal Funds Information for States. All rights reserved.
Table 2.1: Federal Grants as a Share of State
Welfare/Hospital Spending, FY 2012
Table 2.2: Federal Welfare/Hospital
Spending Per Capita, FY 2012
FFIS Special Analysis 15-01 Page 14
Tables 3.1, 3.2
Highways: Supplemental Information on Federal Funds
Rank State Share Rank State Amount
1 Georgia 64.7% 1 Alaska $652
2 Rhode Island 61.6% 2 Wyoming 431
3 New Mexico 50.2% 3 Montana 393
4 South Carolina 49.3% 4 North Dakota 349
5 Missouri 48.9% 5 South Dakota 329
6 Montana 46.8% 6 Vermont 321
7 Connecticut 44.8% 7 West Virginia 207
8 Texas 44.5% 8 Rhode Island 205
9 Alaska 44.5% 9 Delaware 183
10 Wyoming 43.2% 10 Idaho 173
11 Arkansas 42.9% 11 Arkansas 171
12 Michigan 42.6% 12 New Mexico 171
13 Tennessee 41.9% 13 Oklahoma 161
14 South Dakota 41.5% 14 Mississippi 155
15 Nebraska 41.3% 15 Nebraska 153
16 Hawaii 41.3% 16 Iowa 153
17 Idaho 39.1% 17 Missouri 152
18 Colorado 38.8% 18 Louisiana 148
19 Alabama 37.6% 19 Indiana 139
20 Vermont 36.2% 20 Kentucky 138
21 Arizona 36.1% 21 Maine 138
22 Nevada 35.8% 22 Connecticut 135
23 Louisiana 35.5% 23 Alabama 130
24 New York 34.6% 24 Kansas 129
25 Ohio 34.0% 25 Nevada 128
26 Oregon 34.0% 26 South Carolina 127
27 Florida 33.7% 27 Wisconsin 126
28 Oklahoma 32.7% 28 Oregon 125
United States 32.5% 29 Georgia 123
29 New Jersey 32.4% 30 New Hampshire 123
30 Mississippi 32.0% 31 Tennessee 123
31 West Virginia 31.6% 32 Hawaii 120
32 California 30.9% 33 Minnesota 118
33 Wisconsin 30.8% United States 118
34 Indiana 30.8% 34 Pennsylvania 117
35 New Hampshire 30.6% 35 Texas 116
36 Minnesota 30.0% 36 Virginia 115
37 Maine 29.6% 37 Ohio 110
38 Massachusetts 28.9% 38 Utah 110
39 Delaware 28.8% 39 New Jersey 108
40 Kansas 28.7% 40 Illinois 107
41 Illinois 27.7% 41 Arizona 107
42 North Carolina 27.6% 42 Michigan 103
43 Kentucky 27.0% 43 Colorado 100
44 Iowa 26.6% 44 North Carolina 100
45 Virginia 24.4% 45 Maryland 97
46 North Dakota 22.1% 46 Washington 96
47 Washington 20.6% 47 Florida 94
48 Utah 20.3% 48 California 94
49 Pennsylvania 19.6% 49 Massachusetts 89
50 Maryland 13.6% 50 New York 83
Copyright © 2015 FFIS Federal Funds Information for States. All rights reserved.
Table 3.1: Federal Grants as a Share of
State Highway Spending, FY 2012
Table 3.2: Federal Highway Spending
Per Capita, FY 2012
FFIS Special Analysis 15-01 Page 15
Tables 4.1, 4.2 Natural Resources/Recreation: Supplemental Information on Federal
Funds
Rank State Share Rank State Amount
1 Wyoming 41.0% 1 Wyoming $297
2 West Virginia 32.2% 2 Alaska 62
3 Kentucky 24.2% 3 West Virginia 55
4 Alabama 19.8% 4 Montana 43
5 New Hampshire 15.9% 5 North Dakota 35
6 Montana 15.9% 6 South Dakota 26
7 Utah 15.3% 7 Kentucky 23
8 Ohio 15.0% 8 Vermont 22
9 Rhode Island 14.9% 9 Delaware 18
10 Illinois 14.5% 10 Maine 15
11 Michigan 14.4% 11 Idaho 15
12 Pennsylvania 13.9% 12 New Mexico 14
13 Oklahoma 13.6% 13 Nebraska 13
14 Missouri 13.3% 14 Rhode Island 13
15 Vermont 13.2% 15 Arkansas 13
16 Indiana 13.2% 16 Alabama 12
17 Nevada 13.1% 17 Iowa 12
18 South Carolina 12.8% 18 Mississippi 11
19 Alaska 12.5% 19 New Hampshire 11
20 Delaware 12.3% 20 Oklahoma 11
21 Arkansas 11.6% 21 Hawaii 11
22 Tennessee 11.5% 22 Pennsylvania 10
23 Kansas 10.8% 23 Utah 10
24 New Mexico 10.8% 24 Kansas 10
25 Maine 10.8% 25 Minnesota 9
26 South Dakota 10.6% 26 Wisconsin 9
27 Idaho 10.5% 27 Missouri 9
28 Iowa 10.0% 28 Oregon 8
29 Colorado 9.4% 29 Louisiana 8
30 Mississippi 9.1% 30 Indiana 8
31 Nebraska 8.7% 31 Colorado 8 United States 8.3% 32 Tennessee 8
32 Arizona 7.9% 33 South Carolina 7
33 Hawaii 7.8% United States 7
34 North Carolina 7.7% 34 Virginia 7
35 Texas 7.6% 35 Nevada 7
36 Wisconsin 7.5% 36 North Carolina 6
37 Connecticut 7.3% 37 Ohio 6
38 Georgia 7.3% 38 Michigan 6
39 Virginia 7.1% 39 Illinois 6
40 Minnesota 6.2% 40 Washington 5
41 Oregon 6.1% 41 Maryland 5
42 North Dakota 5.5% 42 Connecticut 5
43 New York 5.2% 43 Georgia 5
44 Florida 4.5% 44 Arizona 4
45 Maryland 4.5% 45 Texas 4
46 Washington 4.3% 46 Massachusetts 3
47 Massachusetts 4.0% 47 Florida 3
48 Louisiana 3.6% 48 New Jersey 3
49 New Jersey 2.7% 49 New York 3
50 California 1.7% 50 California 2
Copyright © 2015 FFIS Federal Funds Information for States. All rights reserved.
Table 4.1: Federal Grants as a Share of State
Natural Resources/Recreation Spending, FY 2012Table 4.2: Federal Per Capita Spending on
Natural Resources/Recreation, FY 2012
FFIS Special Analysis 15-01 Page 16
Tables 5.1, 5.2 Health: Supplemental Information on Federal Funds
Rank State Share Rank State Amount
1 Minnesota 74.2% 1 Alaska $145
2 Arkansas 70.3% 2 New Mexico 82
3 New Hampshire 65.6% 3 Mississippi 82
4 Idaho 63.7% 4 Vermont 82
5 Iowa 62.0% 5 Rhode Island 77
6 Louisiana 58.4% 6 Montana 75
7 Mississippi 58.4% 7 South Dakota 73
8 Indiana 56.3% 8 Louisiana 72
9 Texas 56.1% 9 West Virginia 71
10 Nevada 55.8% 10 Delaware 71
11 Georgia 53.9% 11 Arkansas 69
12 Alabama 51.9% 12 Hawaii 69
13 Rhode Island 50.3% 13 North Dakota 69
14 Montana 45.0% 14 Idaho 68
15 Utah 41.4% 15 California 68
16 Michigan 39.7% 16 Alabama 67
17 Kentucky 38.2% 17 Wyoming 66
18 North Carolina 37.7% 18 New York 65
19 North Dakota 37.6% 19 Georgia 64
20 West Virginia 36.7% 20 Maine 64
21 New Mexico 36.3% 21 South Carolina 64
22 Tennessee 36.1% 22 Washington 61
23 Kansas 35.7% 23 Kentucky 61
24 Wisconsin 35.3% 24 Oregon 59
25 New Jersey 35.2% United States 58
26 South Dakota 35.1% 25 Texas 58
27 Virginia 33.1% 26 Oklahoma 58
28 California 32.9% 27 Illinois 57
29 Alaska 30.4% 28 Maryland 56
30 South Carolina 30.1% 29 Nebraska 55
31 Oregon 29.8% 30 Arizona 55 United States 29.7% 31 Florida 55
32 Illinois 29.5% 32 North Carolina 54
33 Massachusetts 29.4% 33 Tennessee 54
34 Colorado 28.4% 34 Colorado 53
35 Florida 28.1% 35 Connecticut 53
36 Vermont 27.8% 36 Missouri 52
37 Oklahoma 24.7% 37 Michigan 52
38 Washington 23.6% 38 Utah 51
39 Ohio 23.3% 39 Nevada 51
40 Nebraska 22.8% 40 Iowa 50
41 Missouri 21.0% 41 Kansas 50
42 Pennsylvania 20.6% 42 Massachusetts 49
43 Connecticut 20.1% 43 New Jersey 49
44 Hawaii 19.4% 44 Pennsylvania 48
45 Arizona 18.3% 45 Indiana 48
46 Maine 16.9% 46 Ohio 48
47 Maryland 16.5% 47 Minnesota 48
48 Delaware 14.9% 48 New Hampshire 47
49 New York 14.0% 49 Wisconsin 47
50 Wyoming 13.7% 50 Virginia 43
Copyright © 2015 FFIS Federal Funds Information for States. All rights reserved.
Table 5.1: Federal Grants as a Share of
State Health Spending, FY 2012
Table 5.2: Federal Per Capita Spending on
Health, FY 2012
FFIS Special Analysis 15-01 Page 17
Tables 6.1, 6.2 Police/Corrections: Supplemental Information on Federal Funds
Rank State Share Rank State Amount
1 North Dakota 6.2% 1 Wyoming $14
2 New Hampshire 5.8% 2 Vermont 13
3 South Dakota 5.6% 3 North Dakota 12
4 Maine 4.6% 4 Alaska 12
5 Nevada 4.4% 5 South Dakota 10
6 Hawaii 4.2% 6 Delaware 10
7 Wyoming 4.1% 7 Rhode Island 9
8 Rhode Island 3.9% 8 Montana 9
9 Vermont 3.8% 9 New Hampshire 7
10 Montana 3.7% 10 Maine 7
11 Idaho 3.6% 11 Hawaii 7
12 New York 3.4% 12 New York 7
13 Nebraska 3.3% 13 Idaho 6
14 Kansas 3.1% 14 Nevada 6
15 Utah 3.0% 15 Nebraska 6
16 South Carolina 2.8% 16 New Mexico 6
17 West Virginia 2.8% 17 West Virginia 6
18 Illinois 2.8% 18 California 5
19 Iowa 2.7% 19 Arkansas 5
20 Mississippi 2.7% 20 Kansas 5
21 Arkansas 2.7% 21 Utah 5
22 Arizona 2.4% 22 Arizona 4
23 New Mexico 2.4% 23 Oregon 4
24 Florida 2.4% 24 Iowa 4
25 Alabama 2.3% 25 Mississippi 4
26 Delaware 2.3% United States 4
27 Indiana 2.3% 26 New Jersey 4
28 Kentucky 2.1% 27 Oklahoma 4
29 Oklahoma 2.1% 28 Connecticut 4
United States 2.1% 29 Maryland 4
30 Minnesota 2.1% 30 South Carolina 4
31 Tennessee 2.1% 31 Colorado 4
32 Missouri 2.0% 32 Illinois 4
33 Texas 2.0% 33 Massachusetts 4
34 Alaska 2.0% 34 Louisiana 4
35 Washington 1.9% 35 Washington 4
36 California 1.9% 36 Alabama 3
37 Oregon 1.9% 37 Tennessee 3
38 Ohio 1.7% 38 Florida 3
39 New Jersey 1.7% 39 Kentucky 3
40 Colorado 1.7% 40 Texas 3
41 Georgia 1.7% 41 Wisconsin 3
42 North Carolina 1.7% 42 Minnesota 3
43 Michigan 1.6% 43 Missouri 3
44 Connecticut 1.6% 44 Virginia 3
45 Louisiana 1.6% 45 North Carolina 3
46 Wisconsin 1.5% 46 Michigan 3
47 Massachusetts 1.4% 47 Georgia 3
48 Pennsylvania 1.3% 48 Indiana 3
49 Maryland 1.2% 49 Pennsylvania 3
50 Virginia 1.2% 50 Ohio 3
Copyright © 2015 FFIS Federal Funds Information for States. All rights reserved.
Table 6.1: Federal Grants as a Share of State
Police/Corrections Spending, FY 2012
Table 6.2: Federal Per Capita Spending on
Police/Corrections, FY 2012
FFIS Special Analysis 15-01 Page 18
Tables 7.1, 7.2 Unemployment Insurance: Supplemental Information on Federal
Funds
Rank State Share Rank State Amount
1 South Dakota 25.5% 1 Alaska $48
2 North Dakota 17.6% 2 Wyoming 24
3 Wyoming 11.0% 3 North Dakota 20
4 New Hampshire 10.8% 4 Connecticut 19
5 Alaska 9.9% 5 Washington 19
6 Nebraska 9.0% 6 Vermont 18
7 Louisiana 8.2% 7 Idaho 18
8 Vermont 8.1% 8 Michigan 18
9 Utah 8.0% 9 Rhode Island 17
10 Idaho 7.9% 10 Maine 17
11 Mississippi 7.3% 11 Oregon 17
12 Maine 7.2% 12 Illinois 16
13 Montana 7.2% 13 New Jersey 16
14 Oklahoma 6.9% 14 Nevada 16
15 Alabama 6.7% 15 Wisconsin 15
16 West Virginia 6.4% 16 Montana 15
17 Virginia 5.9% 17 Delaware 15
18 Michigan 5.4% 18 New Hampshire 15
19 Maryland 5.3% 19 Hawaii 15
20 Arkansas 5.2% 20 Pennsylvania 14
21 Arizona 5.1% 21 California 14
22 Iowa 5.0% 22 South Dakota 14
23 Wisconsin 4.9% 23 Maryland 14
24 South Carolina 4.7% 24 Nebraska 13
25 Georgia 4.6% 25 New York 13
26 Washington 4.5% 26 Massachusetts 13
27 Missouri 4.5% 27 Utah 12
28 Hawaii 4.4% United States 12
29 Ohio 4.4% 28 West Virginia 12
30 Illinois 4.2% 29 Ohio 12
31 Tennessee 4.2% 30 Iowa 12
32 Florida 4.0% 31 Minnesota 11
United States 4.0% 32 Colorado 11
33 New Mexico 4.0% 33 Arkansas 11
34 Minnesota 4.0% 34 New Mexico 11
35 Texas 3.8% 35 Mississippi 11
36 Indiana 3.8% 36 Indiana 10
37 Colorado 3.8% 37 Georgia 10
38 Oregon 3.8% 38 Kentucky 10
39 Kansas 3.8% 39 Alabama 10
40 Delaware 3.7% 40 Kansas 10
41 Connecticut 3.7% 41 South Carolina 10
42 California 3.5% 42 Missouri 9
43 Nevada 3.5% 43 Oklahoma 9
44 New York 3.4% 44 Louisiana 9
45 Rhode Island 3.4% 45 North Carolina 9
46 Kentucky 3.3% 46 Tennessee 8
47 Pennsylvania 3.1% 47 Arizona 8
48 North Carolina 2.6% 48 Virginia 8
49 Massachusetts 2.5% 49 Texas 8
50 New Jersey 2.4% 50 Florida 7
Copyright © 2015 FFIS Federal Funds Information for States. All rights reserved.
Table 7.1: Federal Grants as a Share of State
Unemployment Insurance Spending, FY 2012
Table 7.2: Federal Per Capita Spending on
Unemployment Insurance, FY 2012
Related Documents