Nutritional assessment – an overweight case study Deborah J Savin February 2011 Page 1 Nutritional assessment – an overweight case study Deborah Savin, Exercise & Nutrition Science MSc Programme, Chester University INTRODUCTION The subject of this case study is “Jack”, a 52‐year‐old Caucasian male, former‐smoker, living and working in Hong Kong. Jack has recently set up a consultancy company, having worked for many years within large organisations. This change is allowing him more time to focus on other aspects of his life (family and friends, health and wellbeing, study and travel) and to create a better work‐life balance. Jack is running his business from home. In the last four years Jack has become a long distance runner, competing in the London marathon in 2009 and the Paris marathon in 2010. Without a marathon in his schedule, Jack is finding it hard to stay motivated to train. His current weight is 81kg, which is 4kg heavier than his racing weight of 77kg. He confesses to not having changed his eating patterns despite not training or working with the same intensity as before. Jack’s objective is to reduce his body mass by 5% and return to 77kg quickly but safely. Although the ideal would be to experience weight‐loss entirely as a result of reduction in body fat, Jack is at risk of losing fat‐free mass and hence power. Any modifications to his diet must be made with this in mind. METHOD Energy intake and dietary assessment Jack completed a three‐day weighed food diary (two week‐days, one weekend day), recording everything that he consumed in a pre‐prepared spreadsheet. Where possible he recorded the information provided by food labels, particularly for branded foods and pre‐packaged meals. Jack weighed food using digital kitchen scales (Soehnle, Germany) and took into account the weight of food prepared for but not eaten during a meal. The diary was reviewed with Jack to ensure correct interpretation. A nutritional assessment was conducted to determine Jack’s typical daily energy intake and nutrient composition. Information about the nutritional composition of the food consumed by Jack was taken from food labels or sourced from the USDA (2010) National Nutrient Database for Standard Reference via www.nutritiondata.com . To validate this assessment, a secondary analysis was conducted using the WinDiets nutritional analysis software (Univation Ltd, Aberdeen). Jack’s nutrient composition was compared with the advice of the dietary reference values panel set out in the UK’s Department of Health Report on Health and Social Subjects No 41 (Department of Health [DoH], 1991). Daily energy expenditure Jack compiled a three‐day activity journal in a pre‐prepared spreadsheet, recording how he spent his time in blocks of 15mins. The activity journal was completed alongside the food diary and reviewed with Jack to ensure correct interpretation. A physical activity ratio (PAR) was assigned to each 15‐minute block to reflect the level of energy required to complete the specified activity. The PARs were taken from DoH (1991). Jack’s total energy expenditure (TEE) on each day was estimated using a two‐step approach. First, an estimation of his basal metabolic rate (BMR; MJ/day) was made using a predictive equation based on gender, age, height and body mass. Second, the estimated BMR was converted into a basal metabolic rate per 15‐minute block (15 × BMR/1.44; kJ/15mins), and the resulting figure multiplied by the sum of the day’s 96 assigned PARs to give TEE.

Welcome message from author
This document is posted to help you gain knowledge. Please leave a comment to let me know what you think about it! Share it to your friends and learn new things together.
Transcript

Nutritional assessment – an overweight case study Deborah J Savin
February 2011 Page 1
Nutritional assessment – an overweight case study
Deborah Savin, Exercise & Nutrition Science MSc Programme, Chester University
INTRODUCTION
The subject of this case study is “Jack”, a 52‐year‐old Caucasian male, former‐smoker, living and working in Hong
Kong.
Jack has recently set up a consultancy company, having worked for many years within large organisations. This
change is allowing him more time to focus on other aspects of his life (family and friends, health and wellbeing, study
and travel) and to create a better work‐life balance. Jack is running his business from home.
In the last four years Jack has become a long distance runner, competing in the London marathon in 2009 and the
Paris marathon in 2010. Without a marathon in his schedule, Jack is finding it hard to stay motivated to train. His
current weight is 81kg, which is 4kg heavier than his racing weight of 77kg. He confesses to not having changed his
eating patterns despite not training or working with the same intensity as before.
Jack’s objective is to reduce his body mass by 5% and return to 77kg quickly but safely. Although the ideal would be to
experience weight‐loss entirely as a result of reduction in body fat, Jack is at risk of losing fat‐free mass and hence
power. Any modifications to his diet must be made with this in mind.
METHOD
Energy intake and dietary assessment
Jack completed a three‐day weighed food diary (two week‐days, one weekend day), recording everything that he
consumed in a pre‐prepared spreadsheet. Where possible he recorded the information provided by food labels,
particularly for branded foods and pre‐packaged meals. Jack weighed food using digital kitchen scales (Soehnle,
Germany) and took into account the weight of food prepared for but not eaten during a meal. The diary was reviewed
with Jack to ensure correct interpretation.
A nutritional assessment was conducted to determine Jack’s typical daily energy intake and nutrient composition.
Information about the nutritional composition of the food consumed by Jack was taken from food labels or sourced
from the USDA (2010) National Nutrient Database for Standard Reference via www.nutritiondata.com. To validate
this assessment, a secondary analysis was conducted using the WinDiets nutritional analysis software (Univation Ltd,
Aberdeen).
Jack’s nutrient composition was compared with the advice of the dietary reference values panel set out in the UK’s
Department of Health Report on Health and Social Subjects No 41 (Department of Health [DoH], 1991).
Daily energy expenditure
Jack compiled a three‐day activity journal in a pre‐prepared spreadsheet, recording how he spent his time in blocks of
15mins. The activity journal was completed alongside the food diary and reviewed with Jack to ensure correct
interpretation.
A physical activity ratio (PAR) was assigned to each 15‐minute block to reflect the level of energy required to complete
the specified activity. The PARs were taken from DoH (1991).
Jack’s total energy expenditure (TEE) on each day was estimated using a two‐step approach. First, an estimation of his
basal metabolic rate (BMR; MJ/day) was made using a predictive equation based on gender, age, height and body
mass.
Second, the estimated BMR was converted into a basal metabolic rate per 15‐minute block (15 × BMR/1.44;
kJ/15mins), and the resulting figure multiplied by the sum of the day’s 96 assigned PARs to give TEE.

Nutritional assessment – an overweight case study Deborah J Savin
February 2011 Page 2
BMR is the amount of energy expended when at rest, in a post‐absorptive state and following eight hours of sleep,
typically in a controlled environment. The closely associated resting metabolic rate (RMR; MJ/day) does not place
such restrictive conditions on the subject, and is therefore arguably more reflective of “normal” conditions in a
person’s life. Both metabolic rates can be measured in a laboratory using direct or indirect calorimetry. However, in a
clinical setting, predictive equations are more likely to be used. The literature does not always state clearly whether a
predictive equation has been validated against BMR or RMR.
In clinical practice the four most commonly used equations are:
1. Harris‐Benedict equation (Frankenfield, Muth & Rowe, 1998)
2. Mifflin‐St.Jeor equation (Mifflin, St.Jeor, Hill, Scott, Daugherty & Koh, 1990)
3. Owen equation (Owen et al., 1986 & 1987)
4. Schofield equation adopted by the UK’s Department of Health (Schofield, 1985; DoH, 1991)
These equations are shown in Table A1a of the Appendix.
Frankenfield, Roth‐Yousey and Compher (2005) conducted a systematic review of 38 articles pertaining to the
accuracy of predictive equations to determine the most accurate when applied on an individual basis to healthy non‐
obese or obese adults. The authors defined predictive accuracy as the percentage of individuals in a study group
whose BMR was predicted to within ±10% of measured BMR. The results of the review for all four equations are
shown in Table A1b of the Appendix.
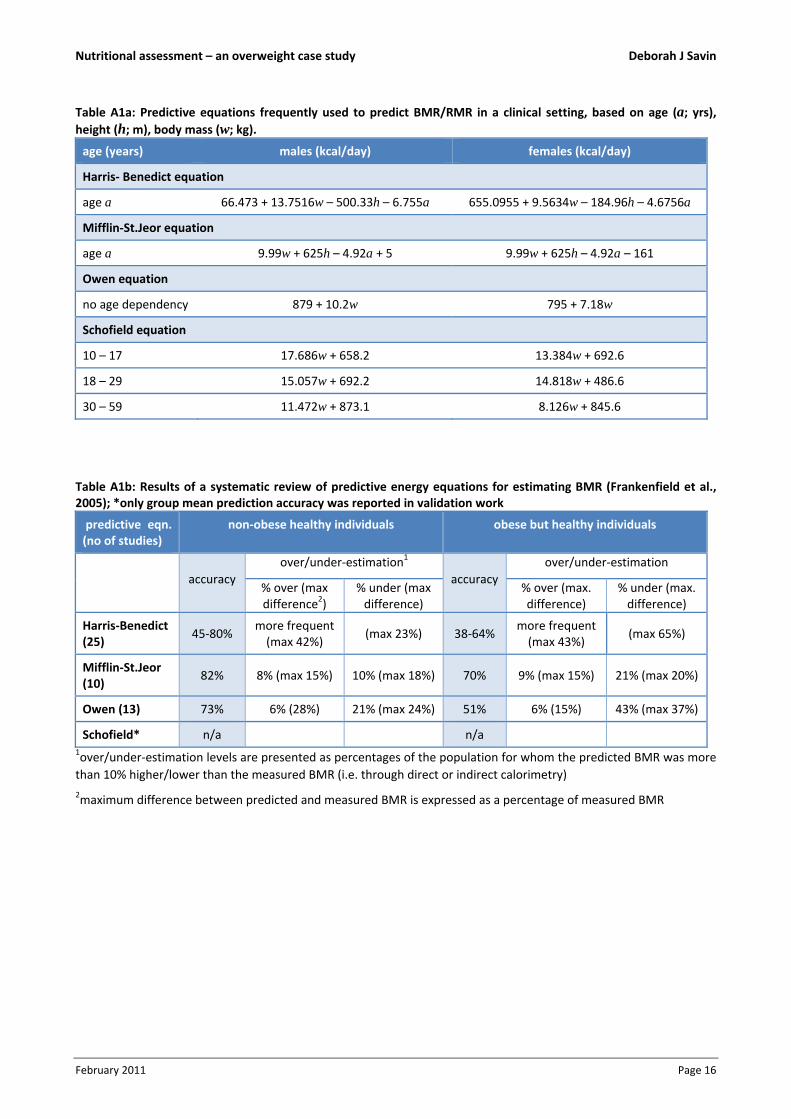
Demonstrating 82% accuracy in non‐obese and 70% in obese, the Mifflin‐St.Jeor equation was found to be the most
appropriate when applied to a single healthy adult. It was also the equation that presented the narrowest error range
(Table A1b). The Harris‐Benedict equation systematically over‐estimated measured BMR by at least 5%, while the
Owen equation tended to under‐estimate. For the Schofield equation, group mean and not individual predictive
accuracy has been validated.
Jack is a healthy, non‐obese adult, and therefore to predict his BMR, the Mifflin‐St.Jeor equation was chosen,
accepting the 18% chance of a result which is more than 10% above or below “real” BMR.
Body composition
Jack’s body mass (w; kg) and height (h; m) were measured. Body mass was measured on each of the three days at the
same time and under the same conditions; before eating, but after bladder and bowels were voided. From body mass
and height measurements, body mass index (BMI) was calculated as shown in Eq.1.
2BMI
h
w (kg/m2) Eq.1
The BMI classification which has been adopted by WHO (2000) is based on the international standards developed for
adults with European decent (Table 1), and would therefore be regarded as appropriate for Jack.
Table 1: Classification of weight by BMI (WHO, 2000)
classification BMI (kg/m2) risk of co‐morbidities
underweight < 18.5 low (but possible increased risk of other clinical problems)
normal 18.5 – 24.9 average
overweight 25.0 – 29.9 increased
obese I 30.0 – 34.9 moderate
obese II 35.0 – 39.9 severe
obese III 40.0 very severe

Nutritional assessment – an overweight case study Deborah J Savin
February 2011 Page 3
However, there are limitations to this measurement (see Discussion), and hence additional measurements were taken
to assess Jack’s body composition.
Waist circumference is a good indicator of progress during a weight‐loss programme, with a 1cm reduction in waist
equating to 1kg of body fat loss (Campbell & Haslam, 2005). The correct measurement of waist circumference
(laterally at the midpoint between the lowest part of the ribs and highest point of the iliac crest) was demonstrated to
Jack so that he can use it to measure his progress.
There is a growing body of evidence to suggest that waist circumference alone may be sufficient as a measure of
central obesity (Australia’s National Health and Medical Research Council [NHMRC], 2003) with high predictive validity
and less potential for error. Han, van Leer, Seidell and Lean (1995) used previously defined waist circumference
“action levels” in their study of the frequency of cardiovascular risk factors (high total cholesterol, low HDL
cholesterol, hypertension) in 2,183 men and 2,698 women aged 20‐59yrs.
The results of the study suggest that action levels based on waist measurements (Table 2) may provide a valuable and
simple method for alerting people at increased risk of cardiovascular disease and who might benefit from weight
management.
Janssen, Heymsfield, Allison, Kotler and Ross (2002) went a step further to demonstrate that BMI and waist
circumference independently contribute to the prediction of non‐abdominal, abdominal subcutaneous and visceral
fat, placing importance on the use of both measurements in a clinical setting.
Table 2: Waist circumference and risk of metabolic complications associated with obesity in Caucasian men and women (Han et al., 1995; WHO, 2000)
action level waist circumference of men (cm)
waist circumference of women (cm)
risk of metabolic complications
1 94 80 increased
2 102 88 substantially increased
Given the invasive nature of hip circumference measurement (removal of trousers to access the great trochanters),
Jack’s waist‐to‐hip ratio was not calculated. This decision was backed by the findings of Pouliot, Després, Lemieux,
Moorjanii, Bouchard, Tremblay et al. (1994) who concluded that waist circumference is at least as accurate as the
waist‐to‐hip ratio at predicting intra‐abdominal fat, and those of Han et al. (1995) who demonstrated the measure’s
ability to predict levels of cardiovascular risk factors and disease as accurately as BMI and waist‐to‐hip ratio.
In an earlier study focusing on the correct classification of body mass in adults, Lean, Han and Morrison (1995)
determined and validated the action levels (Table 2) now adopted by the WHO. Given the simplicity of the
measurement and its relation to both body mass and fat distribution, the authors suggest waist circumference might
replace BMI and waist‐to‐hip ratio in the classification of overweight and obese adults.

Nutritional assessment – an overweight case study Deborah J Savin
February 2011 Page 4
RESULTS
Body composition
Jack stands 1.76m tall and over the three days for which data was collected, his body mass fluctuated only slightly;
81.1kg, 80.9kg and 81.0kg respectively. This implies an average BMI of 26.1kg/m2, placing him in the “overweight”
category of the BMI scale (Table 1).
To achieve a BMI classified of “normal”, Jack’s body mass should be 77.1kg. This is in line with his target running
weight and hence should be achievable with appropriate lifestyle changes.
Jack’s waist circumference was measured in triplicate on the first day, with average 89.7cm. This value is below
“action level 1”.
Energy intake and dietary assessment
Jack completed the weighed food diary on three consecutive days (Thursday, Friday, Saturday), following as closely as
possible his normal pattern of eating. The information on food labels and packaging was noted down to provide
accurate nutritional information.
A full account of the food consumed by Jack is shown in Tables A2a‐c of the Appendix, but summary information is
provided in Table 3.
Table 3: Daily energy intake (MJ, kcal) and macronutrient analysis
day carbohydrate fat protein alcohol total
g MJ (kcal)
% of intake
g MJ (kcal)
% of intake
g MJ (kcal)
% of intake
MJ (kcal)
% of intake
MJ (kcal)
Thursday 382 6.40
(1,528)
43% 134 5.04 (1,204)
34% 111 1.85 (442)
12% 1.52 (364)
10% 14.82 (3,539)
Friday 244 4.09
(976)
36% 113 4.25 (1,014)
37% 99 1.66 (397)
15% 1.47 (350)
13% 11.46 (2,737)
Saturday 315 5.28 (1,261)
40% 122 4.58 (1,095)
35% 111 1.85 (443)
14% 1.47
(350)
11% 13.18 (3,148)
average 13.15 (3,141)
Jack’s average energy intake was 13.15MJ/day, but this figure masks the significant variability (+13%, ‐13%) that
occurs over the three days.
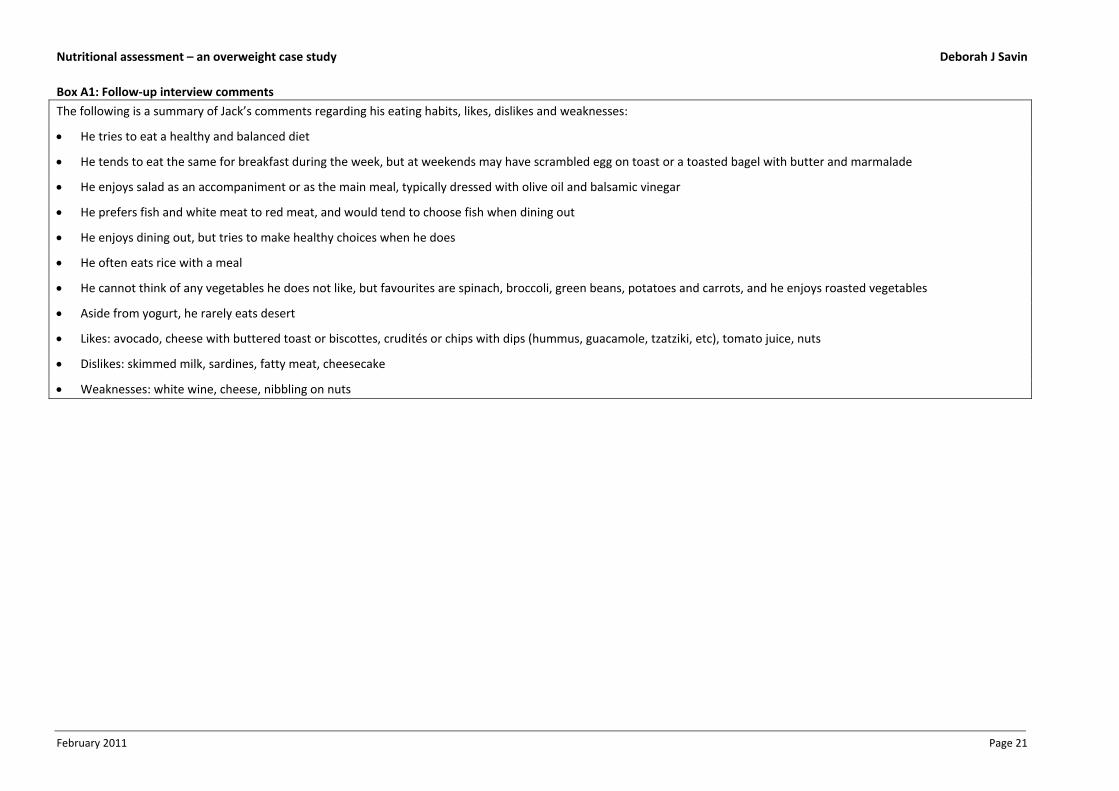
In a subsequent follow‐up interview, Jack provided a brief summary of his food likes and dislikes and where he felt his
“weaknesses” lie. His comments are summarised in Box A1 of the Appendix and taken into consideration in the
preparation of a weight management programme.
The secondary analysis of Jack’s food diary, conducted using WinDiets, produced similar figures on two of the three
days (Table 4). Differences occurred when generic food items were selected in the software package in place of
unknown ingredients (e.g. branded sandwiches).
Nutritional assessment – an overweight case study Deborah J Savin
February 2011 Page 5
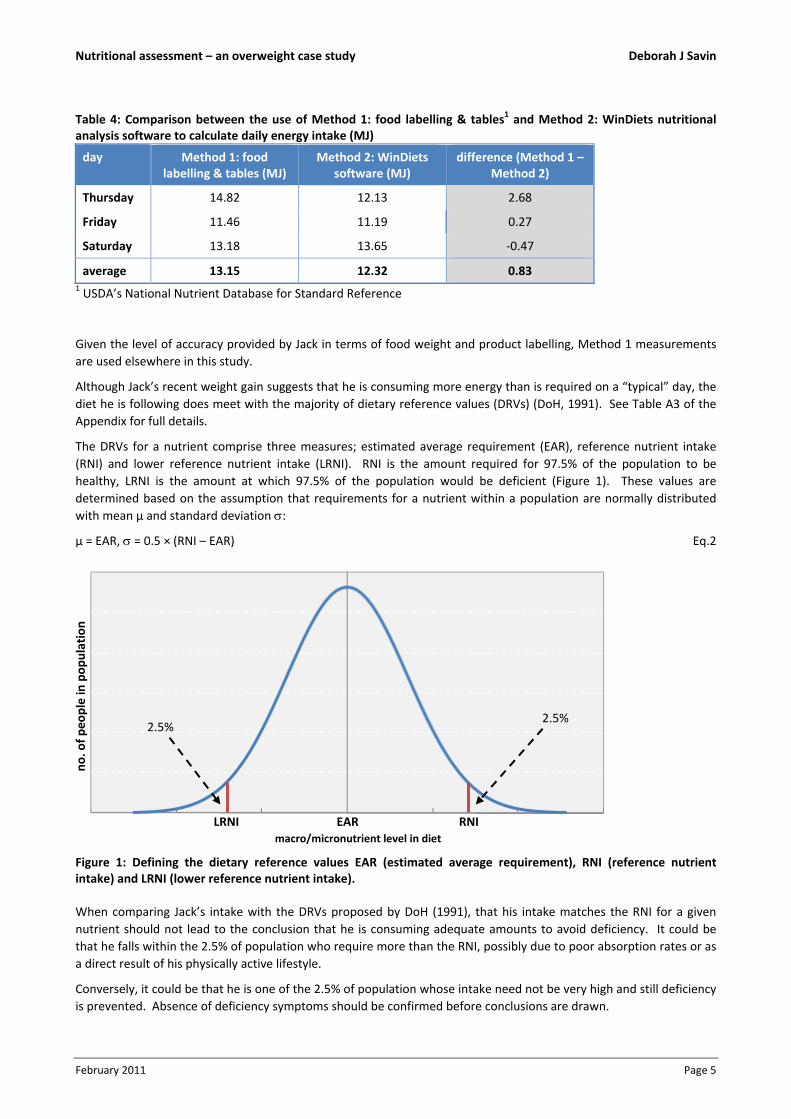
Table 4: Comparison between the use of Method 1: food labelling & tables1 and Method 2: WinDiets nutritional analysis software to calculate daily energy intake (MJ)
day Method 1: food labelling & tables (MJ)
Method 2: WinDiets software (MJ)
difference (Method 1 – Method 2)
Thursday 14.82 12.13 2.68
Friday 11.46 11.19 0.27
Saturday 13.18 13.65 ‐0.47
average 13.15 12.32 0.83 1 USDA’s National Nutrient Database for Standard Reference
Given the level of accuracy provided by Jack in terms of food weight and product labelling, Method 1 measurements
are used elsewhere in this study.
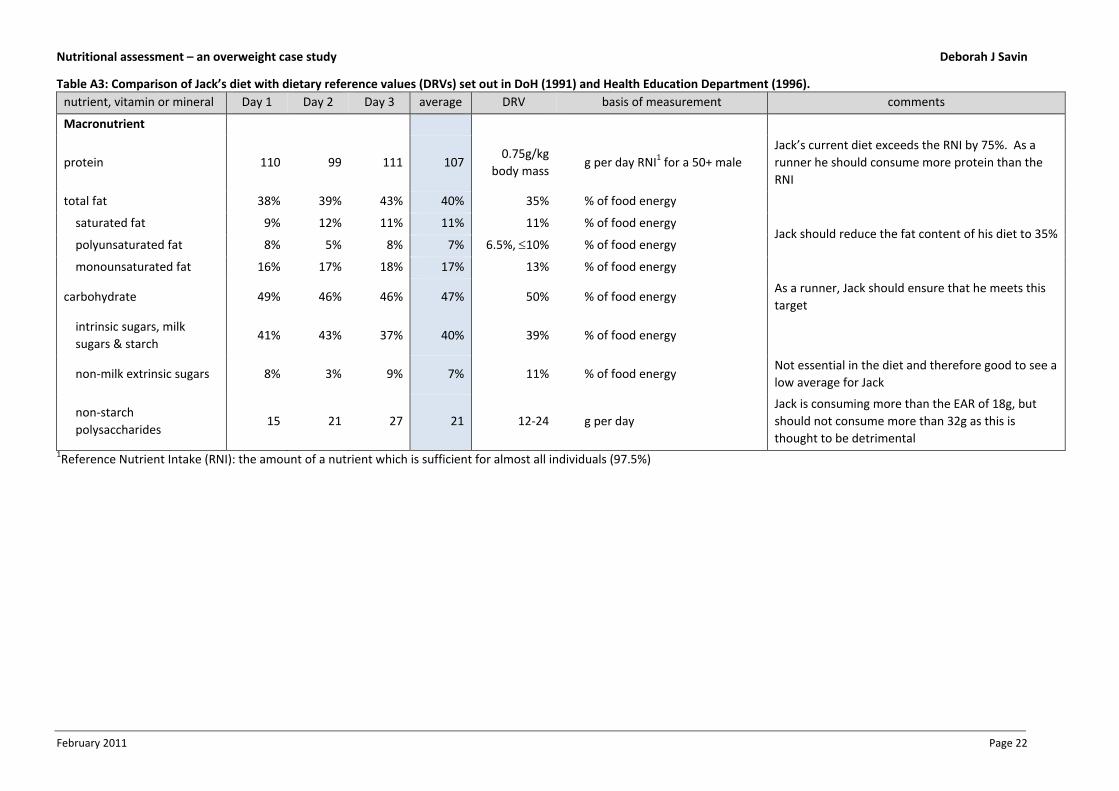
Although Jack’s recent weight gain suggests that he is consuming more energy than is required on a “typical” day, the
diet he is following does meet with the majority of dietary reference values (DRVs) (DoH, 1991). See Table A3 of the
Appendix for full details.
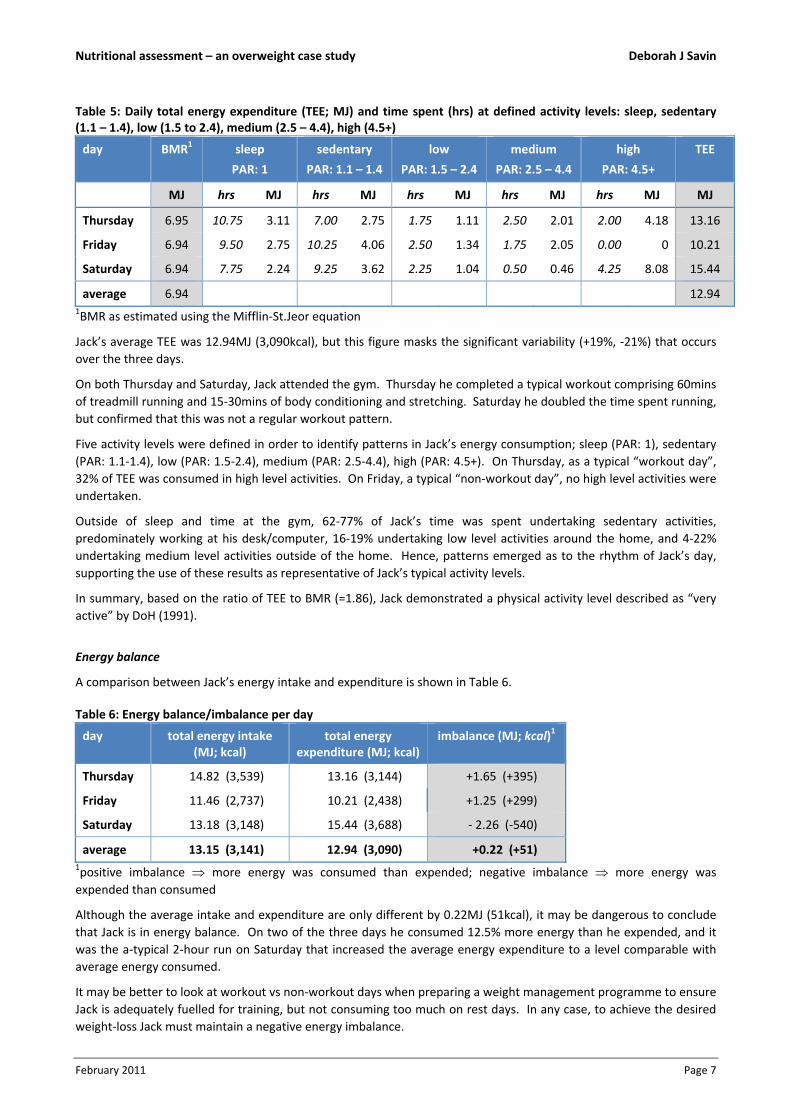
The DRVs for a nutrient comprise three measures; estimated average requirement (EAR), reference nutrient intake
(RNI) and lower reference nutrient intake (LRNI). RNI is the amount required for 97.5% of the population to be
healthy, LRNI is the amount at which 97.5% of the population would be deficient (Figure 1). These values are
determined based on the assumption that requirements for a nutrient within a population are normally distributed
with mean µ and standard deviation :
µ = EAR, = 0.5 × (RNI – EAR) Eq.2
Figure 1: Defining the dietary reference values EAR (estimated average requirement), RNI (reference nutrient intake) and LRNI (lower reference nutrient intake).
When comparing Jack’s intake with the DRVs proposed by DoH (1991), that his intake matches the RNI for a given
nutrient should not lead to the conclusion that he is consuming adequate amounts to avoid deficiency. It could be
that he falls within the 2.5% of population who require more than the RNI, possibly due to poor absorption rates or as
a direct result of his physically active lifestyle.
Conversely, it could be that he is one of the 2.5% of population whose intake need not be very high and still deficiency
is prevented. Absence of deficiency symptoms should be confirmed before conclusions are drawn.
RNI EAR LRNI
2.5% 2.5%
no. o
f peo
ple in
population
macro/micronutrient level in diet

Nutritional assessment – an overweight case study Deborah J Savin
February 2011 Page 6
Fat
Total fat made up 40% of food energy consumed by Jack. This figure should be closer to the 35% EAR. Jack consumed
the appropriate proportion of saturated fats (SFA; 11%) and polyunsaturated fats (PUFA: 7%), but slightly more
monounsaturated fats (MUFA: 17%) than the EAR of 13%. This reflects the amount of olive oil, nuts and avocado in
his diet.
Protein
Based on a weight of 81kg, the corresponding protein RNI value for a male of 52yrs is 60.75g per day. Jack consumed
an average of 106g over the three days which exceeds the RNI by 75%.
The ideal would be for Jack to experience weight‐loss entirely as a result of reduction in body fat. However, he is at
risk of losing fat‐free mass if energy intake is restricted. Consuming a protein‐rich diet will help guard against this,
ensuring sufficient amino acid levels to repair and rebuild muscle damaged during training.
Carbohydrate
Total carbohydrates made up 47% of food energy consumed by Jack. This should be closer to the EAR of 50%,
especially given the amount of exercise he undertakes.
Without sufficient carbohydrate intake, during long bouts of exercise Jack’s protein stores will be tapped for energy
production, a metabolic process that takes precedence over tissue building. Adequate intake of carbohydrate will
provide a protein‐sparing effect which is critical if Jack is to maintain fat‐free mass.
The level of non‐milk extrinsic sugars in Jack’s diet was favourably low and therefore what was being consumed was
“good” carbohydrate. He consumed an average of 21g of non‐starch polysaccharides which is inside the
recommended range of 12‐24g and above the 18g EAR.
Micronutrients and alcohol
Jack consumed almost twice the RNI for sodium (3.1g vs 1.6g), which if maintained could lead to increased blood
pressure.
He gained 11% of his total energy from alcohol.
Daily energy expenditure
Jack completed the activity journal on the same three days as the food diary. In the follow‐up interview clarification
was sought on the activities listed to ensure the most appropriate PAR was applied. The activities and associated PARs
are shown in Table A4 of the Appendix.
Using the Mifflin‐St.Jeor equation, Jack’s BMR was estimated to be 6.94MJ (1,658kcal). This implies Jack uses
4.82kJ/min when at complete rest. After applying PARs, Jack’s TEE for each of the three days was estimated as shown
in Table 5.
The PAR values given in DoH (1991) reflect the energy cost of completing tasks or activities over a period of a half to
one hour. These figures may not always reflect the intensity with which Jack is completing a task if undertaken for a
shorter time when fewer rests are taken.
Nutritional assessment – an overweight case study Deborah J Savin
February 2011 Page 7
Table 5: Daily total energy expenditure (TEE; MJ) and time spent (hrs) at defined activity levels: sleep, sedentary (1.1 – 1.4), low (1.5 to 2.4), medium (2.5 – 4.4), high (4.5+)
day BMR1 sleep
PAR: 1
sedentary
PAR: 1.1 – 1.4
low
PAR: 1.5 – 2.4
medium
PAR: 2.5 – 4.4
high
PAR: 4.5+
TEE
MJ hrs MJ hrs MJ hrs MJ hrs MJ hrs MJ MJ
Thursday 6.95 10.75 3.11 7.00 2.75 1.75 1.11 2.50 2.01 2.00 4.18 13.16
Friday 6.94 9.50 2.75 10.25 4.06 2.50 1.34 1.75 2.05 0.00 0 10.21
Saturday 6.94 7.75 2.24 9.25 3.62 2.25 1.04 0.50 0.46 4.25 8.08 15.44
average 6.94 12.94 1BMR as estimated using the Mifflin‐St.Jeor equation
Jack’s average TEE was 12.94MJ (3,090kcal), but this figure masks the significant variability (+19%, ‐21%) that occurs
over the three days.
On both Thursday and Saturday, Jack attended the gym. Thursday he completed a typical workout comprising 60mins
of treadmill running and 15‐30mins of body conditioning and stretching. Saturday he doubled the time spent running,
but confirmed that this was not a regular workout pattern.
Five activity levels were defined in order to identify patterns in Jack’s energy consumption; sleep (PAR: 1), sedentary
(PAR: 1.1‐1.4), low (PAR: 1.5‐2.4), medium (PAR: 2.5‐4.4), high (PAR: 4.5+). On Thursday, as a typical “workout day”,
32% of TEE was consumed in high level activities. On Friday, a typical “non‐workout day”, no high level activities were
undertaken.
Outside of sleep and time at the gym, 62‐77% of Jack’s time was spent undertaking sedentary activities,
predominately working at his desk/computer, 16‐19% undertaking low level activities around the home, and 4‐22%
undertaking medium level activities outside of the home. Hence, patterns emerged as to the rhythm of Jack’s day,
supporting the use of these results as representative of Jack’s typical activity levels.
In summary, based on the ratio of TEE to BMR (=1.86), Jack demonstrated a physical activity level described as “very
active” by DoH (1991).
Energy balance
A comparison between Jack’s energy intake and expenditure is shown in Table 6.
Table 6: Energy balance/imbalance per day
day total energy intake (MJ; kcal)
total energy expenditure (MJ; kcal)
imbalance (MJ; kcal)1
Thursday 14.82 (3,539) 13.16 (3,144) +1.65 (+395)
Friday 11.46 (2,737) 10.21 (2,438) +1.25 (+299)
Saturday 13.18 (3,148) 15.44 (3,688) ‐ 2.26 (‐540)
average 13.15 (3,141) 12.94 (3,090) +0.22 (+51) 1positive imbalance more energy was consumed than expended; negative imbalance more energy was
expended than consumed
Although the average intake and expenditure are only different by 0.22MJ (51kcal), it may be dangerous to conclude
that Jack is in energy balance. On two of the three days he consumed 12.5% more energy than he expended, and it
was the a‐typical 2‐hour run on Saturday that increased the average energy expenditure to a level comparable with
average energy consumed.
It may be better to look at workout vs non‐workout days when preparing a weight management programme to ensure
Jack is adequately fuelled for training, but not consuming too much on rest days. In any case, to achieve the desired
weight‐loss Jack must maintain a negative energy imbalance.

Nutritional assessment – an overweight case study Deborah J Savin
February 2011 Page 8
DISCUSSION
Body composition
The significant shift that Jack has made in his life away from an intense working pattern is allowing him more time to
focus on his health and wellbeing. He wants to run regularly, even without a race in his schedule, and reverse the
weight gain of 4kg that has occurred since he completed his last marathon less than a year ago. The desired weight‐
loss would also have health benefits for Jack since it would very likely reduce the proportion of his body mass made up
of adipose tissue.
The gold standard for establishing percentage of body fat has until recently been hydrodensitometry (underwater
weighing). Imaging techniques such as dual‐energy X‐ray absorption are now replacing hydrodensitometry as a
standard because of their high precision and simplicity for the subject (Willett, Dietz & Colditz, 1999). However, these
methods are largely confined to the research laboratory and not available in a clinical setting.
In assessing Jack’s body composition, alternatives measurements that serve as a proxy to body fat where chosen.
Both BMI (Berrington de Gonzalez et al., 2010; Adams et al., 2006) and waist circumference (Han et al., 1995) have
been established as predictors of cardiovascular disease, type‐2 diabetes and certain cancers.
In a prospective study of 527,265 persons aged 50‐71yrs at baseline, Adams et al. (2006) explored BMI in relation to
the risk of death from any cause. The maximum follow‐up period was 10 years. When their analysis was restricted to
non‐smokers and based on a recalled BMI value at 50yrs of age (a time of life reflecting typical adult weight and
largely unaffected by the onset of later diagnosed disease), the association between BMI and all‐cause mortality was
strongest. In particular, the risk among participants who were overweight at 50yrs was 20‐40% higher than among
participants who had a BMI of 23.5‐24.9kg/m2.
However, BMI, as the name suggests, measures body mass and not body fat. It is possible for an individual to have a
high BMI but a relatively low body fat mass, and several cases are documented (Campbell & Haslam, 2005). This may
indeed be true for Jack who as a runner could have a higher than average fat‐free mass for his height. It is important
to proceed with care when interpreting BMI measurement.
Han et al. (1995) reported that men and women with at least one cardiovascular risk factor (high total cholesterol,
LDL, systolic or diastolic BP) were identified by waist circumference measurement of action level 1 or 2 with
sensitivities of 57% and 62%, and specificities of 72% and 62% respectively.
In addition, Janssen et al. (2002) conducted a multiple regression analysis to determine whether the combination of
BMI and waist circumference explained a greater variance in total and regional body fat (non‐abdominal, abdominal
subcutaneous, visceral fat) as measured using MRI scans than either measure alone. In 341 white adults the authors
observed that:
variance in abdominal fat as explained by waist circumference is explained almost exclusively by the ability of the
measure to predict visceral fat (Figure 2)
waist circumference was only a modest predictor of non‐abdominal fat after controlling for BMI.
The authors concluded that BMI and waist circumference independently contribute to the prediction of body fat and
where it is deposited within the body, leading to the recommendation that healthcare practitioners use both
anthropometric variables to identify those at increased health risk.
Nutritional assessment – an overweight case study Deborah J Savin
February 2011 Page 9
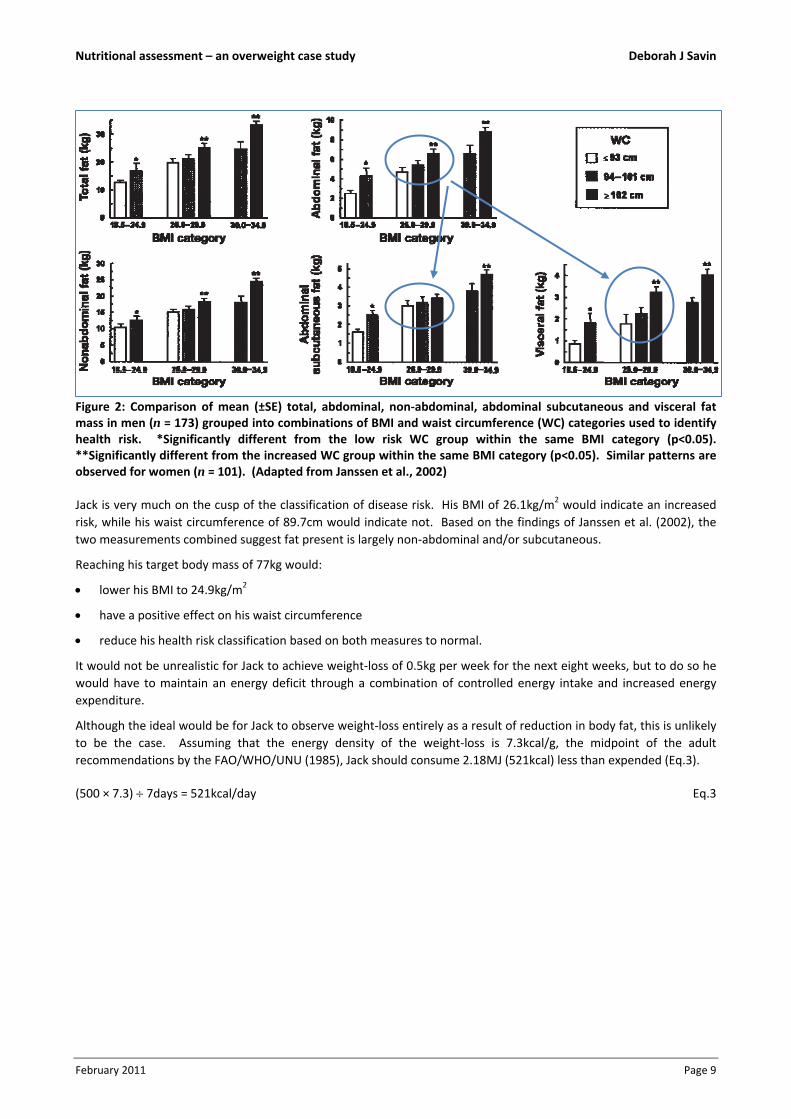
Figure 2: Comparison of mean (±SE) total, abdominal, non‐abdominal, abdominal subcutaneous and visceral fat mass in men (n = 173) grouped into combinations of BMI and waist circumference (WC) categories used to identify health risk. *Significantly different from the low risk WC group within the same BMI category (p<0.05). **Significantly different from the increased WC group within the same BMI category (p<0.05). Similar patterns are observed for women (n = 101). (Adapted from Janssen et al., 2002)
Jack is very much on the cusp of the classification of disease risk. His BMI of 26.1kg/m2 would indicate an increased
risk, while his waist circumference of 89.7cm would indicate not. Based on the findings of Janssen et al. (2002), the
two measurements combined suggest fat present is largely non‐abdominal and/or subcutaneous.
Reaching his target body mass of 77kg would:
lower his BMI to 24.9kg/m2
have a positive effect on his waist circumference
reduce his health risk classification based on both measures to normal.
It would not be unrealistic for Jack to achieve weight‐loss of 0.5kg per week for the next eight weeks, but to do so he
would have to maintain an energy deficit through a combination of controlled energy intake and increased energy
expenditure.
Although the ideal would be for Jack to observe weight‐loss entirely as a result of reduction in body fat, this is unlikely
to be the case. Assuming that the energy density of the weight‐loss is 7.3kcal/g, the midpoint of the adult
recommendations by the FAO/WHO/UNU (1985), Jack should consume 2.18MJ (521kcal) less than expended (Eq.3).
(500 × 7.3) 7days = 521kcal/day Eq.3

Nutritional assessment – an overweight case study Deborah J Savin
February 2011 Page 10
Energy intake and dietary assessment
There are several dietary assessment methods used regularly within research and in clinical practice; history method,
24‐hour recall, food frequency questionnaire and weighed food diary. These are briefly described in Table 7.
Table 7: Comparison of dietary assessment methods
assessment method description requirements for implementation
history method extensive interview designed to ascertain “usual” diet trained and experienced interviewer
24‐hour recall interview to establish what was consumed yesterday skilled but untrained interviewer
food frequency questionnaire
paper‐based questionnaire recording frequency with which foods and beverages are consumed
well‐planned questionnaire, cooperation of respondent(s)
weighed food diary record of everything that is consumed, typically over seven days
cooperation of fully briefed participant(s)
Validation in the context of dietary assessment methods is complex. First the issue of group vs individual must be
considered. Nutritionists and dieticians want a method to provide accurate results on an individual basis. The same
level of accuracy is not required for research conducted on groups of subjects, where group means are used rather
than individual results.
Second, validation requires a demonstration that the method measures what it is intended to measure, and this
requires the truth to be known. To fully validate a dietary assessment method which claims to measure usual intake
over a prolonged period, two questions must be answered:
Q1 Do the results accurately reflect what was eaten during the period being measured (e.g. yesterday in the case
of 24‐hour recall)?
Q2 Does the period of assessment represent the “usual” diet of the subject or group (e.g. are the last 24 hours
representative of usual eating patterns)?
Many studies address only one of these issues at a time and only to a degree. Q1 can be answered fully if all that is
consumed is directly observed by the investigator. However, many studies choose relative validation, i.e. validation
against another method; typically the seven‐day weighed food diary which has been widely accepted as a standard
(Block, 1982).
Q2 is more difficult and is often demonstrated by showing that the method can produce similar results on more than
one occasion. This sounds more like a test of reliability, and is also subject to complications. If two separated
measurements produce similar results, does this mean that the method is reliable because the diet being assessed has
not changed between the two observations, or unreliable because the diet has in fact changed over time? Conversely,
if the two measurements produce different results, does this mean that the method is unreliable because the diet
being assessed has not changed between the two observations, or reliable because it has detected changes in diet?
Attempts to validate the seven‐day weighed food diary have addressed both questions. Gersovitz, Madden and
Smiciklas‐Wright (1978) compared the measurements obtained in 44 diaries with actually consumption. The authors
reported good agreement for mean values and for individual values during the first few days. The latter result
supports the use of a shorter time period when working with individuals.
Morris, Marr, Heady, Mills and Pilkington (1963) compared the records provided by 76 male bank employees (40‐
55yrs) on two separate occasions, varying between one month and one year apart. The authors reported correlation
coefficients ranging from 0.62 to 0.91, with total energy intake at 0.73.
Jack was asked to complete a weighed food diary on only three days as opposed to seven in an attempt to lessen the
burden and avoid “reporting fatigue” (Gersovitz et al., 1978).
Nutritional assessment – an overweight case study Deborah J Savin
February 2011 Page 11
Krall and Dwyer (1987) compared the results of three‐day food diaries with actual consumption. This study only
addressed Q1 in the validation process since the diet being consumed by the 19 participants was prescribed by the
centre in which the two‐week study took place. Participants completed a three‐day food diary each week without the
use of scales, and the results were compared with what was actually consumed during the observation period.
Individuals omitted between 3 and 37 of the food items over the six days. The foods that were omitted from the
diaries tended to be those eaten in small amounts and so the resulting mean estimate of energy intake was lower but
not significantly different from actual mean intake (p<0.001). This result clearly points to validity in a group setting.
Individual estimates of energy intake varied between 81% and 118% of the actual amount.
Without a clear trend towards under or over‐estimation, it is difficult to comment on whether the results obtained
from Jack’s food diary are more likely to be lower or higher than his actual energy consumption. However, the use of
scales may improve upon the level of accuracy reported by Krall and Dwyer (1987).
Daily energy expenditure
The doubly‐labelled water (DLW) technique is regarded as the gold standard for measurement of activity levels,
estimating energy expenditure under free‐living conditions and over a period of up to 20 days. But high costs and the
complexities of implementation mean it is not frequently used in a clinical setting.
Nevertheless, the technique does provide a benchmark against which other methods of assessment can be validated.
Conway, Seale, Jacobs, Irwin and Ainsworth (2002) compared energy expenditure estimates from DLW (EEDLW) and
physical activity journals (EERecord) for 24 adults over a two‐week period while a diet to maintain body mass was
administered.
The authors reported that information derived from the physical activity journals over‐estimated free‐living EEDLW by
7.9±3.2% (0.91±0.42MJ) and this was significantly non‐zero (p=0.05). However, for 10 subjects the difference was less
than 10%, indicating that activity journals may be useful in assessing energy expenditure on an individual basis. The
sample size of the study population may have been a limiting factor.
Jack’s activity journal produced an average value of 12.94MJ/day which, based on the findings of Conway et al. (2002),
could be over‐estimating his real average TEE by approximately 1.0MJ/day.
Recommended lifestyle changes
To achieve the desired weight‐loss of 4kg in two months, Eq.3 suggests an average energy intake for Jack of
10.75MJ/day (~2,500kcal). Given the a‐typical workout undertaken on Saturday, this may be better prescribed as
11MJ (~2,600kcal) on workout days and 8MJ (~1,900kcal) on non‐work‐out days. Longer term monitoring of Jack’s
activity levels would produce more conclusive evidence on which to base this calorie restriction.
In a recent study Shai, Schwarzfuchs, Henkin, Shahar, Witkow, Greenberg et al. (2008) compared the effectiveness of
three weight‐loss diets; low‐fat restricted‐calorie, Mediterranean restricted‐calorie, or low‐carbohydrate non‐
restricted‐calorie. 322 adults (mean 52yrs) took part in the study, 86% were men.
All three diets produced significant weight‐loss within the first two months (Figure 3), representing 4% of initial body mass. Adherence to the two restricted‐calorie diets was significantly higher than to the low‐carbohydrate diet
(p=0.04), and those following the Mediterranean diet achieved a more stable weight after maximum weight‐loss.

Nutritional assessment – an overweight case study Deborah J Savin
February 2011 Page 12
Figure 3: Weight changes during two years according to diet group. (Adapted from Shai et al., 2008)
The authors observed additional and beneficial metabolic effects following the two alternative diets; Mediterranean
diet led to reductions in blood pressure and improvements in lipid profile, low‐carbohydrate diet led to improvements
in lipid profile. The Mediterranean diet group consumed the largest amounts of dietary fibre and had the highest
MUFA:SFA ratio (p<0.05).
They concluded that Mediterranean and low‐carbohydrate diets were effective alternatives to a low‐fat diet, and
appeared to be as safe. They also concluded that these dietary strategies might be applied in clinical practice,
providing an opportunity for diet individualisation according to personal preference and metabolic requirements.
The moderate‐fat, restricted‐calorie Mediterranean diet considered was:
rich in fruit and vegetables
low in red meat; beef and lamb replaced with poultry and fish
35% of energy from fats; main sources 30‐45g olive oil and <20g nuts.
On average participants consumed 33%, 50% and 19% of total energy from fat, carbohydrate and protein respectively,
closely matching the recommendations of DoH (1991).
In 2011, Gillingham, Harris‐Janz and Jones critically assessed the current evidence surrounding the efficacy of dietary
MUFA in the reduction of risk factors for cardiovascular disease.
The authors concluded that increasing MUFA in the diet, typically at the expense of other fats, has favourable effects
on blood lipids, blood pressure, glycemic response, insulin sensitivity and body composition in both healthy adults and
those with existing risk factors.
Considering Jack’s food diary (Tables A2a‐c), dietary preferences (Box A1) and activity levels, the Mediterranean diet
may be suitable for the following reasons:
1. No restriction is placed on carbohydrate intake, essential for its protein‐sparing effect.
2. Contains a high proportion of MUFA (16‐20% of energy), a natural choice for Jack and one which has been shown
to prevent or reverse the progression of cardiovascular disease risk factors.
3. Accompanied by a restriction in calories, the diet appears to be a safe and effective approach to weight‐loss in the
timeframe required.
Although the Mediterranean diet specifies moderate consumption of wine, Jack should aim to reduce his intake by at
least 50%.
Nutritional assessment – an overweight case study Deborah J Savin
February 2011 Page 13
Recommended maintenance programme and future monitoring
Once the desired weight‐loss has been achieved, Jack will need to switch to energy balance. Figure 3 shows good
results for weight‐loss maintenance when following a Mediterranean‐style diet.
Since training may produce an increase in fat‐free mass, Jack should focus on reduction in waist circumference rather
than in total body mass as an assessment of progress. He was shown how to measure waist circumference correctly,
and informed of its correlation with reduction in visceral fat.

Nutritional assessment – an overweight case study Deborah J Savin
February 2011 Page 14
CONCLUSION
Jack has a clearly defined goal to lose 4kg, ideally through a reduction in body fat mass. His recent weight gain may be
putting him at risk of developing cardiovascular disease risk factors, as indicated by a BMI of 26.1kg/m2, and
assessment of his blood lipid profile and blood pressure would provide further clarification.
In completing a food diary that closely reflects his normal eating pattern, Jack has received confirmation that his diet
is healthy and meets the majority of UK Government guidelines. However, he needs to create a temporary negative
energy imbalance if weight‐loss is to be achieved.
Provided the conclusions drawn from his activity journal are correct, a daily average intake of 10.75MJ/day
(~2,500kcal) would produce a 0.5kg body mass reduction per week. The average TEE derived in this study may be an
over‐estimation, a possibility supported by Conway et al. (2002) and Jack’s own admission that Saturday’s was an a‐
typical workout. Even if this is the case, the proposed reduction in energy intake should still produce results, albeit at
a slower rate.
Nutritional assessment – an overweight case study Deborah J Savin
February 2011 Page 15
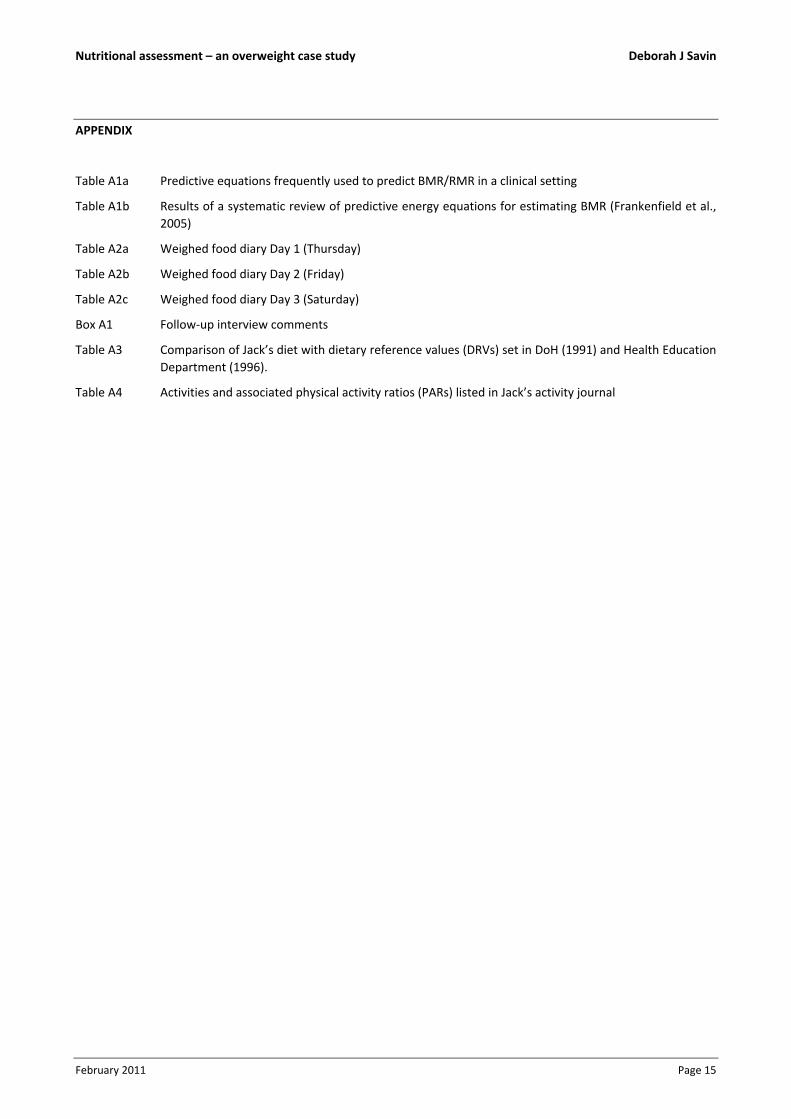
APPENDIX
Table A1a Predictive equations frequently used to predict BMR/RMR in a clinical setting
Table A1b Results of a systematic review of predictive energy equations for estimating BMR (Frankenfield et al.,
2005)
Table A2a Weighed food diary Day 1 (Thursday)
Table A2b Weighed food diary Day 2 (Friday)
Table A2c Weighed food diary Day 3 (Saturday)
Box A1 Follow‐up interview comments
Table A3 Comparison of Jack’s diet with dietary reference values (DRVs) set in DoH (1991) and Health Education
Department (1996).
Table A4 Activities and associated physical activity ratios (PARs) listed in Jack’s activity journal
Nutritional assessment – an overweight case study Deborah J Savin
February 2011 Page 16
Table A1a: Predictive equations frequently used to predict BMR/RMR in a clinical setting, based on age (a; yrs), height (h; m), body mass (w; kg).
age (years) males (kcal/day) females (kcal/day)
Harris‐ Benedict equation
age a 66.473 + 13.7516w – 500.33h – 6.755a 655.0955 + 9.5634w – 184.96h – 4.6756a
Mifflin‐St.Jeor equation
age a 9.99w + 625h – 4.92a + 5 9.99w + 625h – 4.92a – 161
Owen equation
no age dependency 879 + 10.2w 795 + 7.18w
Schofield equation
10 – 17 17.686w + 658.2 13.384w + 692.6
18 – 29 15.057w + 692.2 14.818w + 486.6
30 – 59 11.472w + 873.1 8.126w + 845.6
Table A1b: Results of a systematic review of predictive energy equations for estimating BMR (Frankenfield et al., 2005); *only group mean prediction accuracy was reported in validation work
predictive eqn. (no of studies)
non‐obese healthy individuals obese but healthy individuals
accuracy
over/under‐estimation1
accuracy
over/under‐estimation
% over (max difference2)
% under (max difference)
% over (max. difference)
% under (max. difference)
Harris‐Benedict (25)
45‐80% more frequent (max 42%)
(max 23%) 38‐64% more frequent (max 43%)
(max 65%)
Mifflin‐St.Jeor (10)
82% 8% (max 15%) 10% (max 18%) 70% 9% (max 15%) 21% (max 20%)
Owen (13) 73% 6% (28%) 21% (max 24%) 51% 6% (15%) 43% (max 37%)
Schofield* n/a n/a 1over/under‐estimation levels are presented as percentages of the population for whom the predicted BMR was more
than 10% higher/lower than the measured BMR (i.e. through direct or indirect calorimetry)
2maximum difference between predicted and measured BMR is expressed as a percentage of measured BMR

Nutritional assessment – an overweight case study Deborah J Savin
February 2011 Page 17
Table A2a: Weighed food diary Day 1 (Thursday)
meal description
carbohydrate protein fat alcohol total Cholesterol
total (g) dietary
fibre (g) kcal total (g) kcal total (g)
saturated
(g)
trans fat
(g) kcal kcal kcal mg
Breakfast
cafe latte (218g whole milk) 10.0 0.0 40.1 7.2 28.8 8.1 5.5 0.0 72.6 0.0 141.5 15.3
115g fruit & nut muesli, 135g
semi‐skimmed milk 79.2 7.8 316.7 16.0 64.1 11.5 3.9 0.0 103.7 0.0 484.5 9.5
subtotals 89.2 7.8 356.8 23.2 92.9 19.6 9.4 0.0 176.3 0.0 626.0 24.7
(57%) (15%) (28%) (0%) (100%)
Lunch
M&S mixed sandwiches 72.1 7.2 288.4 25.0 100.0 55.2 8.5 0.0 496.8 0.0 885.2 102.0
150g Yeo Valley strawberry
yogurt 17.4 0.2 69.6 6.3 25.2 5.6 3.6 0.0 50.0 0.0 144.8 19.5
450ml V8 vegetable juice 18.8 3.8 75.0 3.8 15.0 0.0 0.0 0.0 0.0 0.0 90.0 0.0
subtotals 108.3 11.2 433.0 35.1 140.2 60.8 12.1 0.0 546.8 0.0 1,120.0 121.5
(39%) (13%) (49%) (0%) (100%)
Snack
75g dried fruit, nuts & seeds 26.4 5.3 105.6 10.7 42.6 26.3 4.5 0.0 236.3 0.0 384.5 0.0
260ml white wine 7.8 0.0 31.2 0.3 1.0 0.0 0.0 0.0 0.0 182.0 214.2 0.0
subtotals 34.2 5.3 136.8 11.0 43.6 26.3 4.5 0.0 236.3 182.0 598.7 0.0
(23%) (7%) (39%) (30%) (100%)
Dinner
40g chips and 75g guacamole 25.3 3.2 101.4 3.8 15.3 20.7 3.9 6.9 186.6 0.0 303.3 0.0
100g poached salmon & 150g
white (low GI) rice 117.3 0.8 469.2 37.2 148.8 6.5 1.0 0.0 58.5 0.0 676.5 70.0
260ml white wine 7.8 0.0 31.2 0.3 1.0 0.0 0.0 0.0 0.0 182.0 214.2 0.0
subtotals 150.4 3.9 601.8 41.3 165.2 27.2 4.9 0.0 245.1 182.0 1,194.1 70.0
(50%) (14%) (21%) (15%) (100%)
daily total 382.1 28.1 1,528.4 110.6 441.9 133.8 30.9 6.9 1,204.4 364.0 3,538.7 216.2
(43%) (12%) (8%)1 (2%)2 (34%) (10%) (100%) 61.13

Nutritional assessment – an overweight case study Deborah J Savin
February 2011 Page 18
Table A2b: Weighed food diary Day 2 (Friday)
meal description
carbohydrate protein fat alcohol total cholesterol
total (g) dietary
fibre (g) kcal total (g) kcal total (g)
saturated
(g)
trans fat
(g) kcal kcal kcal mg
Breakfast
cafe latte (218g whole milk) 10.0 0.0 40.1 7.2 28.8 8.1 5.5 0.0 72.6 0.0 141.5 15.3
115g fruit & nut muesli, 135g
semi‐skimmed milk 79.2 7.8 316.7 16.0 64.1 11.5 3.9 0.0 103.7 0.0 484.5 9.5
subtotals 89.2 7.8 356.8 23.2 92.9 19.6 9.4 0.0 176.3 0.0 626.0 24.7
(57%) (15%) (28%) (0%) (100%)
Snack
58g banana 13.3 1.5 53.4 0.6 2.3 0.0 0.0 0.0 0.0 0.0 55.7 0.0
subtotals 13.3 1.5 53.4 0.6 2.3 0.0 0.0 0.0 0.0 0.0 55.7 0.0
(96%) (4%) (0%) (0%) (100%)
Lunch
Pret avocado & pine nut wrap 36.0 7.0 144.0 12.0 48.0 30.0 6.0 0.0 270.0 0.0 462.0 125.0
5 slices of Ryvita 33.5 9.0 134.0 5.5 22.0 3.0 0.5 0.0 27.0 0.0 183.0 0.0
500ml diet coke 0.0 0.0 0.0 0.0 0.0 0.0 0.0 0.0 0.0 0.0 0.0 0.0
subtotals 69.5 16.0 278.0 17.5 70.0 33.0 6.5 0.0 297.0 0.0 645.0 125.0
(43%) (11%) (46%) (0%) (100%)
Dinner
200g roast chicken (with skin) 0.0 0.0 0.0 48.0 192.0 26.8 7.4 0.0 241.2 0.0 433.2 152.0
250g mashed potato, mustard 43.6 3.9 174.4 6.2 24.6 12.5 5.4 0.3 112.5 0.0 311.5 27.5
80g cooked broccoli 5.8 2.6 23.0 1.9 7.7 0.3 0.1 0.0 2.9 0.0 33.6 0.0
tomato & red onion salad 7.6 2.0 30.3 1.4 5.6 20.5 2.9 0.0 184.3 0.0 220.2 0.0
500ml white wine 15.0 0.0 60.0 0.5 2.0 0.0 0.0 0.0 0.0 350.0 412.0 0.0
subtotals 71.9 8.5 287.7 58.0 231.9 60.1 15.7 0.3 540.9 350.0 1,410.5 179.5
(20%) (16%) (38%) (25%) (100%)
daily total 244.0 33.8 975.9 99.3 397.1 112.7 31.6 0.3 1,014.1 350 2,737.1 329.2
(36%) (15%) (10%)1 (0%)2 (37%) (13%) (100%) 120.33

Nutritional assessment – an overweight case study Deborah J Savin
February 2011 Page 19
Table A2c: Weighed food diary Day 3 (Saturday)
meal description
carbohydrate protein fat alcohol total cholesterol
total (g) dietary
fibre (g) kcal total (g) kcal total (g)
saturated
(g)
trans fat
(g) kcal kcal kcal mg
Breakfast
cafe latte (218g whole milk) 10.0 0.0 40.1 7.2 28.8 8.1 5.5 0.0 72.6 0.0 141.5 15.3
115g fruit & nut muesli, 135g
semi‐skimmed milk 79.2 7.8 316.7 16.0 64.1 11.5 3.9 0.0 103.7 0.0 484.5 9.5
subtotals 89.2 7.8 356.8 23.2 92.9 19.6 9.4 0.0 176.3 0.0 626.0 24.7
(57%) (15%) (28%) (0%) (100%)
Lunch
110g multi‐seed toast with
20g butter, 40g cheese, 40g
cherry tomatoes
50.2 11.0 200.8 21.9 87.5 33.2 14.4 0.2 298.4 0.0 586.7 64.2
120g banana 27.6 3.1 110.4 1.2 4.8 0.0 0.0 0.0 0.0 0.0 115.2 0.0
240ml pink grapefruit juice 22.0 0.0 88.0 1.0 4.0 0.0 0.0 0.0 0.0 0.0 92.0 0.0
subtotals 99.8 14.2 399.2 24.1 96.3 33.2 14.4 0.2 298.4 0.0 793.9 64.2
(50%) (12%) (38%) (0%) (100%)
Snack
500ml V8 vegetable juice 20.8 4.2 83.3 4.2 16.7 0.0 0.0 0.0 0.0 0.0 100.0 0.0
30g almonds 5.8 3.5 23.2 6.6 26.5 15.8 1.2 0.0 142.6 0.0 192.2 0.0
subtotals 26.6 7.7 106.5 10.8 43.2 15.8 1.2 0.0 142.6 0.0 292.2 0.0
(36%) (15%) (49%) (0%) (100%)

Nutritional assessment – an overweight case study Deborah J Savin
February 2011 Page 20
meal description
carbohydrate protein fat alcohol total cholesterol
total (g) dietary
fibre (g) kcal total (g) kcal total (g)
saturated
(g)
trans fat
(g) kcal kcal kcal mg
Dinner
90g fresh avocado 7.7 6.0 30.6 1.8 7.2 13.2 1.9 0.0 119.1 0.0 156.9 0.0
125g smoked mackerel 0.0 0.0 0.0 32.5 130.0 22.3 5.3 0.0 200.3 0.0 330.3 93.8
260g baked potato with 20g
butter 54.7 5.7 218.8 7.9 31.6 12.0 4.7 0.2 108.0 0.0 358.4 22.2
12 spears of asparagus lightly
cooked 4.8 3.6 19.2 3.6 14.4 0.0 0.0 0.0 0.0 0.0 33.6 0.0
500ml white wine 15.0 0.0 60.0 0.5 2.0 0.0 0.0 0.0 0.0 350.0 412.0 0.0
150g Yeo Valley strawberry
yogurt 17.4 0.2 69.6 6.3 25.2 5.6 3.6 0.0 50.0 0.0 144.8 19.5
subtotals 99.6 15.5 398.2 52.6 210.4 53.0 15.5 0.2 477.3 350.0 1,435.9 135.5
(28%) (15%) (33%) (24%) (100%)
daily total 315.2 45.2 1,260.7 110.7 442.8 121.6 40.4 0.4 1,094.5 350.0 3,148.0 224.4
(40%) (14%) (12%)1 (0%)2 (35%) (11%) (100%) 71.33 1, 2percentage of total energy consumed in the day
3the level of cholesterol expressed as mg per 1,000kcal consumed in the day
Nutritional assessment – an overweight case study Deborah J Savin
February 2011 Page 21
Box A1: Follow‐up interview comments
The following is a summary of Jack’s comments regarding his eating habits, likes, dislikes and weaknesses:
He tries to eat a healthy and balanced diet
He tends to eat the same for breakfast during the week, but at weekends may have scrambled egg on toast or a toasted bagel with butter and marmalade
He enjoys salad as an accompaniment or as the main meal, typically dressed with olive oil and balsamic vinegar
He prefers fish and white meat to red meat, and would tend to choose fish when dining out
He enjoys dining out, but tries to make healthy choices when he does
He often eats rice with a meal
He cannot think of any vegetables he does not like, but favourites are spinach, broccoli, green beans, potatoes and carrots, and he enjoys roasted vegetables
Aside from yogurt, he rarely eats desert
Likes: avocado, cheese with buttered toast or biscottes, crudités or chips with dips (hummus, guacamole, tzatziki, etc), tomato juice, nuts
Dislikes: skimmed milk, sardines, fatty meat, cheesecake
Weaknesses: white wine, cheese, nibbling on nuts
Nutritional assessment – an overweight case study Deborah J Savin
February 2011 Page 22
Table A3: Comparison of Jack’s diet with dietary reference values (DRVs) set out in DoH (1991) and Health Education Department (1996).
nutrient, vitamin or mineral Day 1 Day 2 Day 3 average DRV basis of measurement comments
Macronutrient
protein 110 99 111 107 0.75g/kg
body mass g per day RNI1 for a 50+ male
Jack’s current diet exceeds the RNI by 75%. As a
runner he should consume more protein than the
RNI
total fat 38% 39% 43% 40% 35% % of food energy
Jack should reduce the fat content of his diet to 35% saturated fat 9% 12% 11% 11% 11% % of food energy
polyunsaturated fat 8% 5% 8% 7% 6.5%, 10% % of food energy
monounsaturated fat 16% 17% 18% 17% 13% % of food energy
carbohydrate 49% 46% 46% 47% 50% % of food energy As a runner, Jack should ensure that he meets this
target
intrinsic sugars, milk
sugars & starch 41% 43% 37% 40% 39% % of food energy
non‐milk extrinsic sugars 8% 3% 9% 7% 11% % of food energy Not essential in the diet and therefore good to see a
low average for Jack
non‐starch
polysaccharides 15 21 27 21 12‐24 g per day
Jack is consuming more than the EAR of 18g, but
should not consume more than 32g as this is
thought to be detrimental 1Reference Nutrient Intake (RNI): the amount of a nutrient which is sufficient for almost all individuals (97.5%)
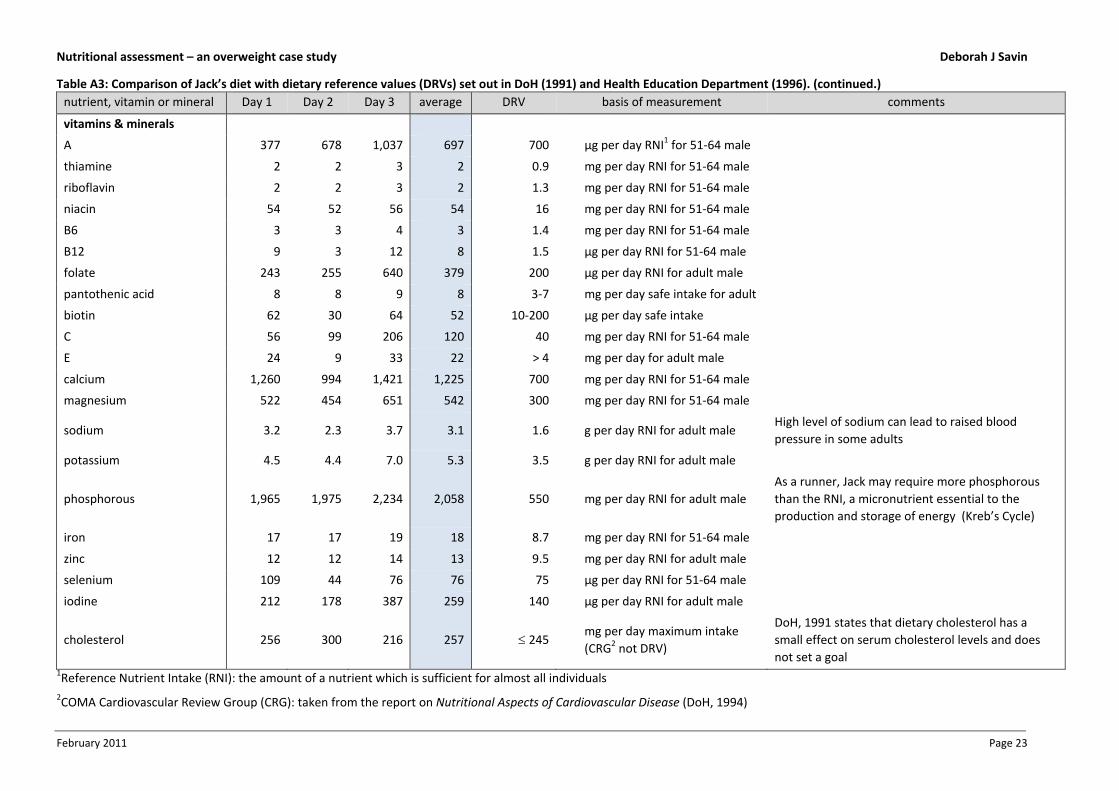
Nutritional assessment – an overweight case study Deborah J Savin
February 2011 Page 23
Table A3: Comparison of Jack’s diet with dietary reference values (DRVs) set out in DoH (1991) and Health Education Department (1996). (continued.)
nutrient, vitamin or mineral Day 1 Day 2 Day 3 average DRV basis of measurement comments
vitamins & minerals
A 377 678 1,037 697 700 µg per day RNI1 for 51‐64 male
thiamine 2 2 3 2 0.9 mg per day RNI for 51‐64 male
riboflavin 2 2 3 2 1.3 mg per day RNI for 51‐64 male
niacin 54 52 56 54 16 mg per day RNI for 51‐64 male
B6 3 3 4 3 1.4 mg per day RNI for 51‐64 male
B12 9 3 12 8 1.5 µg per day RNI for 51‐64 male
folate 243 255 640 379 200 µg per day RNI for adult male
pantothenic acid 8 8 9 8 3‐7 mg per day safe intake for adult
biotin 62 30 64 52 10‐200 µg per day safe intake
C 56 99 206 120 40 mg per day RNI for 51‐64 male
E 24 9 33 22 > 4 mg per day for adult male
calcium 1,260 994 1,421 1,225 700 mg per day RNI for 51‐64 male
magnesium 522 454 651 542 300 mg per day RNI for 51‐64 male
sodium 3.2 2.3 3.7 3.1 1.6 g per day RNI for adult male High level of sodium can lead to raised blood
pressure in some adults
potassium 4.5 4.4 7.0 5.3 3.5 g per day RNI for adult male
phosphorous 1,965 1,975 2,234 2,058 550 mg per day RNI for adult male
As a runner, Jack may require more phosphorous
than the RNI, a micronutrient essential to the
production and storage of energy (Kreb’s Cycle)
iron 17 17 19 18 8.7 mg per day RNI for 51‐64 male
zinc 12 12 14 13 9.5 mg per day RNI for adult male
selenium 109 44 76 76 75 µg per day RNI for 51‐64 male
iodine 212 178 387 259 140 µg per day RNI for adult male
cholesterol 256 300 216 257 245 mg per day maximum intake
(CRG2 not DRV)
DoH, 1991 states that dietary cholesterol has a
small effect on serum cholesterol levels and does
not set a goal 1Reference Nutrient Intake (RNI): the amount of a nutrient which is sufficient for almost all individuals
2COMA Cardiovascular Review Group (CRG): taken from the report on Nutritional Aspects of Cardiovascular Disease (DoH, 1994)

Nutritional assessment – an overweight case study Deborah J Savin
February 2011 Page 24
Table A4: Activities and associated physical activity ratios (PARs) listed in Jack’s activity journal
activity PAR range4 PAR value
assigned
Sleep 1.0 1.0
Sedentary
relaxing 1.2 (1.0 – 1.4) 1.2
reading 1.2 (1.0 – 1.4) 1.2
watching TV 1.2 (1.0 – 1.4) 1.2
eating (sitting to eat breakfast, lunch, dinner) 1.2 (1.0 – 1.4) 1.4
working at desk/computer 1.2 (1.0 – 1.4) 1.4
getting dressed 1.2 (1.0 – 1.4) 1.4
Low
drinking/talking in a bar 1.6 (1.5 – 1.8) 1.5
cooking 1.6 (1.5 – 1.8) 1.6
driving 1.6 (1.5 – 1.8) 1.6
washing up 1.6 (1.5 – 1.8) 1.7
tidying up 2.1 (1.9 – 2.4) 2.4
getting dressed 2.1 (1.9 – 2.4) 2.4
showering & dressing 2.1 (1.9 – 2.4) 2.4
Medium
shopping 2.8 (2.5 – 3.3) 2.6
walking in town 2.8 (2.5 – 3.3) 3.2
purposeful walking 3.8 (3.4 – 4.4) 4.4
High
walking home (uphill) 5.1 (4.5 – 5.9) 4.8
dancing 5.1 (4.5 – 5.9) 5.1
body conditioning & stretching 6.7 (6.0 – 7.9) 6.2
long distance running 6.7 (6.0 – 7.9) 7.9
sprint running 9.0 (8.0 – 10.6) 10.0 4 adapted from the ranges set out in the Report on Health and Social Subjects No 41 (DoH, 1991)
Nutritional assessment – an overweight case study Deborah J Savin
February 2011 Page 25
REFERENCES
Adams, K. F., Schatzkin, A., Harris, T. B., Kipnis, V., Mouw, T., Ballard‐Barbash, R., et al. (2006). Overweight, obesity,
and mortality in a large prospective cohort of persons 50 to 71 years old. The New England Journal of Medicine,
335(8), 763‐778.
Berrington de Gonzalez, A., Hartge, P., Cerhan, J. R., Flint, A. J., Hannan, L., MacInnis, R. J., et al. (2010). Body‐mass
index and mortality among 1.46 million white adults. The New England Journal of Medicine, 363(23), 2211‐2219.
Block, G. (1982). A review of validation of dietary assessment methods. American Journal of Epidemiology, 115(4),
492‐505.
Campbell, I. W., & Haslam, D. W. (2005). Obesity: your questions answered. London: Elsevier.
Conway, J. M., Seale, J. L., Jacobs, D. R., Irwin, M. L., & Ainsworth, B. E. (2002). Comparison of energy expenditure
estimates from doubly labelled water, a physical activity questionnaire, and a physical activity records. The
American Journal of Clinical Nutrition, 75(3), 519‐525.
Department of Health (1991). Dietary reference values for food energy and nutrients for the United Kingdom. (Report
on Health and Social Subjects No 41). London: HMSO.
Department of Health (1994). Nutritional aspects of cardiovascular disease. (Report on Health and Social Subjects No
46). London: HMSO.
Food and Agricultural Organization/World Health Organization/United Nations University. (1985). Energy and protein
requirements. Retrieved from the Web site: http://www.fao.org/docrep/003/aa040e/AA040E15.htm#an4
Frankenfield, D. C., Muth, E. R., & Rowe, W. A. (1998). The Harris‐Benedict studies of human basal metabolism:
history and limitations. Journal of the American Dietetic Association, 98(4), 439‐445.
Frankenfield, D. C., Roth‐Yousey, L., & Compher, C. (2005). Comparison of predictive equations for resting metabolic
rate in healthy non‐obese and obese adults: a systematic review. Journal of the American Dietetic Association,
105(5), 775‐789.
Gersovitz, M., Madden, J. P., & Smiciklas‐Wright, H. (1978). Validity of the 24‐hr. dietary recall and seven‐day record
for group comparisons. Journal of the American Dietetic Association, 73(1), 48‐55.
Gillingham, L. G., Harris‐Janz, S., & Jones, P. J. H. (2011). Monounsaturated fatty acids are protective against
metabolic syndrome and cardiovascular disease risk factors. Lipids. [Electronic publication ahead of print]
Han, T. S., van Leer, E. M., Seidell, J. C., & Lean, M. E. J. (1995). Waist circumference action levels in the identification
of cardiovascular risk factors: prevalence study in a random sample. British Medical Journal, 311(7017), 1401‐
1405.
Health Education Department. (1996). The scientific basis of nutrition education: a synopsis of dietary reference
values. (Briefing paper based on the Report of the Panel of Dietary Reference Values). Melksham: Cromwell Press.
Janssen, I., Heymsfield, S. B., Allison, D. B., Kotler, D. P., & Ross, R. (2002). Body mass index and waist circumference
independently contribute to the prediction of non‐abdominal, abdominal subcutaneous and visceral fat. The
American Journal of Clinical Nutrition, 75(4), 683‐688.
Krall, E. A., & Dwyer, J. T. (1987). Validity of a food frequency questionnaire and a food diary in a short‐term recall
situation. Journal of the American Dietetic Association, 87(10), 1374‐1373.
Lean, M. E. J., Han, T. S., & Morrison, C. E. (1995). Waist circumference as a measure for indicating need for weight
management. British Medical Journal, 311(6998), 158‐161.
Mifflin, M. D., St. Jeor, S. T., Hill, L. A., Scott, B. J., Daugherty, S. A., & Koh, Y. O. (1990). A new predictive equation for
resting energy expenditure in healthy individuals. The American Journal of Clinical Nutrition, 51(2), 241‐247.
Morris, J. N., Marr, J. W., Heady, J. A., Mills, G. L., & Pilkington, T. R. E. (1963). Diet and plasma cholesterol in 99 bank
men. British Medical Journal, 1(5330), 571‐576.

Nutritional assessment – an overweight case study Deborah J Savin
February 2011 Page 26
National Health and Medical Research Council. (2003). Clinical practice guidelines for the management of overweight
and obesity in adults. Retrieved from the Australian Government Department of Health and Aging Web site:
http://www.health.gov.au/internet/main/publishing.nsf/Content/obesityguidelines‐index.htm
Owen, O. E., Kavle, E., Owen, R. S., Polansky, M., Caprio, S., Mozzoli, M. A., et al. (1986). A reappraisal of caloric
requirements in healthy women. The American Journal of Clinical Nutrition, 44(1), 1‐19.
Owen, O. E., Holup, J., D’Alessio, D. A., Craig, E. S., Polansky, M., Smalley, K. J., et al. (1987). A reappraisal of the
caloric requirements of men. The American Journal of Clinical Nutrition, 46(6), 875‐885.
Pouliot, M‐C., Després, J‐P., Lemieux, S., Moorjanii, S., Bouchard, C., Tremblay, A., et al. (1994). Best simple
anthropometric indexes of abdominal visceral adipose tissue accumulation and related cardiovascular risk in men
and women. The American Journal of Cardiology, 73(7), 460‐468.
Schofield, W.N. (1985). Predicting basal metabolic rate, new standards and review of previous work. Human
Nutrition, Clinical Nutrition, 39C(suppl. 1), 5‐41.
Shai, I., Schwarzfuchs, D., Henkin, Y., Shahar, D. R., Witkow, S., Greenberg, I., et al. (2008). Weight loss with a low‐
carbohydrate, Mediterranean or low‐fat diet. The New England Journal of Medicine, 359(3), 229‐241.
US Department of Agriculture, Agricultural Research Service (2010). USDA National Nutrient Database for Standard
Reference, Release 23. Retrieved from the Web site: http://www.nutritiondata.com
Willett, W. C., Dietz, W. H., & Colditz, G. A. (1999). Primary care: guidelines for healthy weight. The New England
Journal of Medicine, 341(6), 427‐434.
World Health Organization (2000). Obesity: preventing and managing the global epidemic. WHO Technical Report
Series, 894(3), i–xii, 1–253.
Related Documents