S2 Chapter 2: Poisson Distribution Dr J Frost ([email protected]) www.drfrostmaths.com Last modified: 20 th September 2015

S2 Chapter 2: Poisson Distribution Dr J Frost ([email protected]) Last modified: 20 th September 2015.
Dec 13, 2015
Welcome message from author
This document is posted to help you gain knowledge. Please leave a comment to let me know what you think about it! Share it to your friends and learn new things together.
Transcript
S2 Chapter 2: Poisson Distribution
Dr J Frost ([email protected])www.drfrostmaths.com
Last modified: 20th September 2015

What is the Poisson Distribution?
The number of “successes” out of trials, each with a probability of success.
Description Outcomes
Number of successes
Name
Binomial
How many events occur within some period of time, given an average rate (“lambda”) at which they occur.
Number of events
(since technically any non-negative number of events occur)
Poisson
? ?
? ?
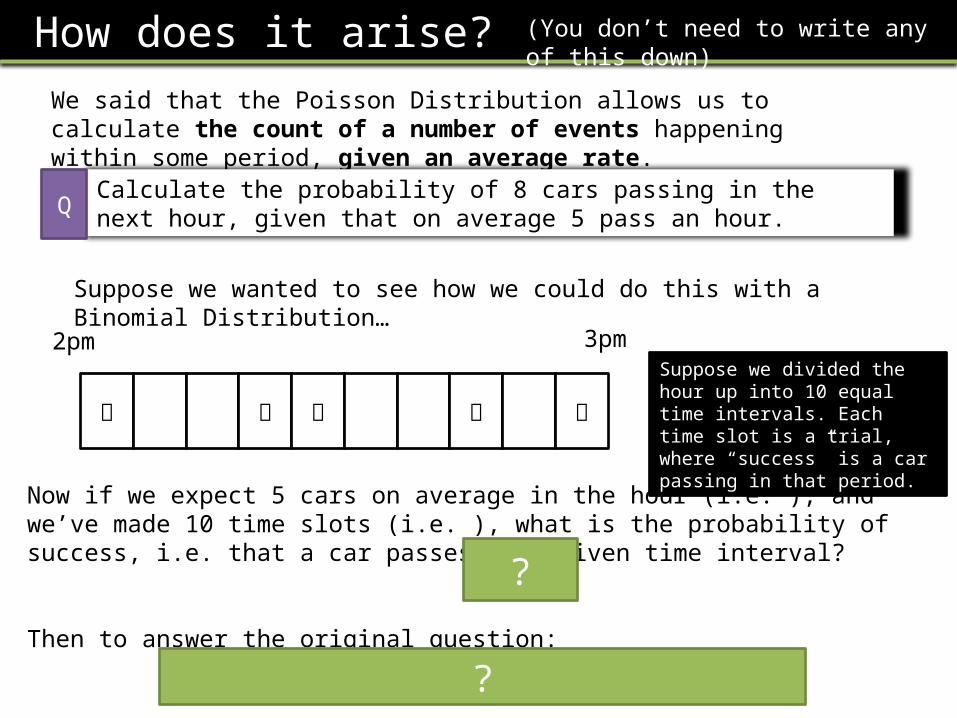
How does it arise?We said that the Poisson Distribution allows us to calculate the count of a number of events happening within some period, given an average rate.
Calculate the probability of 8 cars passing in the next hour, given that on average 5 pass an hour.Q
Suppose we wanted to see how we could do this with a Binomial Distribution…
Now if we expect 5 cars on average in the hour (i.e. ), and we’ve made 10 time slots (i.e. ), what is the probability of success, i.e. that a car passes in a given time interval?
Then to answer the original question:
2pm 3pmSuppose we divided the hour up into 10 equal time intervals. Each time slot is a trial, where “success” is a car passing in that period.
?
?
(You don’t need to write any of this down)
How does it arise?
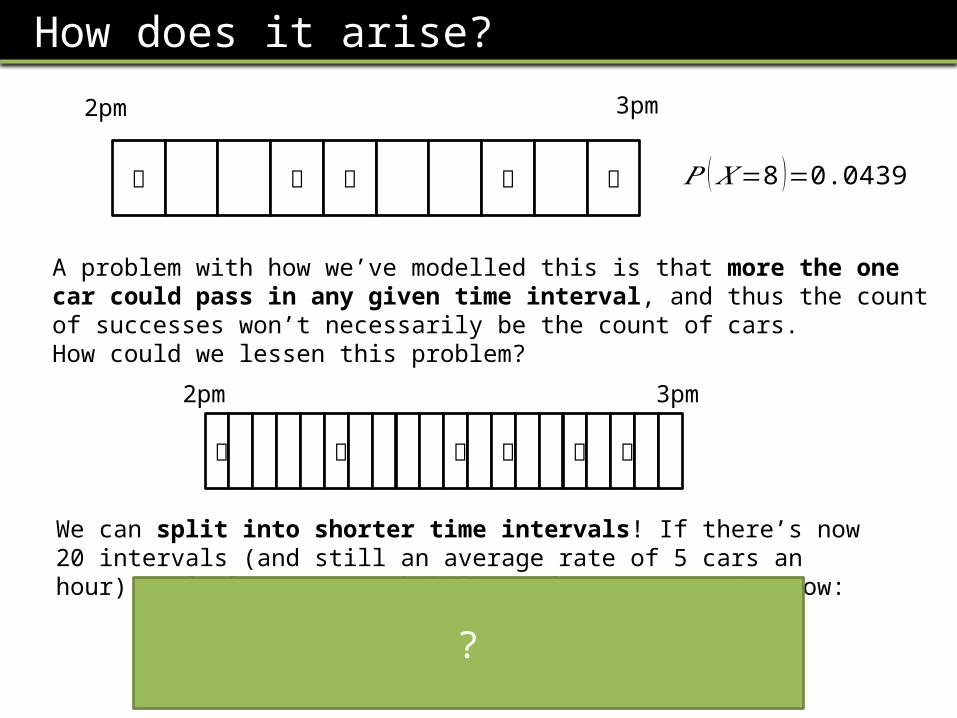
A problem with how we’ve modelled this is that more the one car could pass in any given time interval, and thus the count of successes won’t necessarily be the count of cars.How could we lessen this problem?
2pm 3pm
We can split into shorter time intervals! If there’s now 20 intervals (and still an average rate of 5 cars an hour), calculate the probability of 8 cars passing now:
2pm 3pm
𝑃 (𝑋=8 )=0.0439
?

How does it arise?
We can gradually increase the number of time intervals we’ve split the hour interval into, until we get infinitely small slivers of time, where only one event can occur in any time sliver, and thus it is acceptable to have “success” and “failure”, where the count of successes will now indeed be the count of cars.
The proof of this is quite complicated!
?
! The Poisson Distribution is a distribution over the number of events which occur within a period of time, given an average rate .

Examples
, findQ
?
?
?
Exercise 2A
Given that www.drfrostmaths.com receives 25 hits an hour on average, determine the probability it receives 20 hits in the next hour.
Q
?
Given find Given find Given find1 3 4??
?
??
??
??

Mean and Variance
!
If the average rate of events is (say per hour), then what is the expected number of events that occur say next hour?
??
Using TablesAgain, we can use tables for the Cumulative Distribution Function of a Poisson Distribution.
On average 8 cars come down a country road an hour. What’s the probability that:a) Less than 5 cars pass in the next hour?
b) At least 3 cars pass? c) Between 2 and 5 (inclusive) cars.
??
?
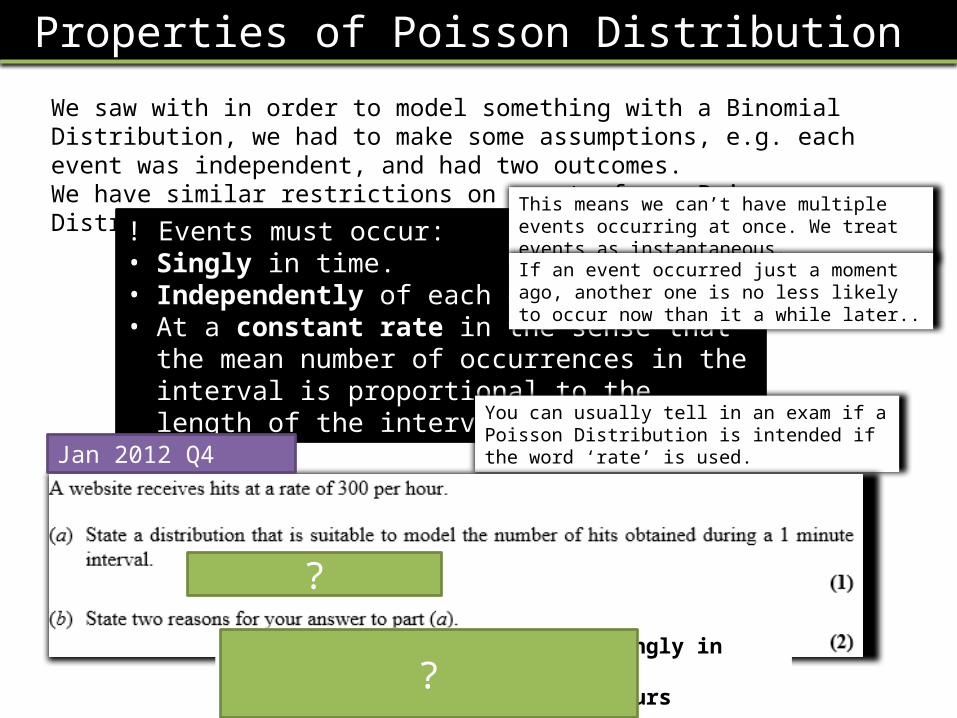
Properties of Poisson Distribution
We saw with in order to model something with a Binomial Distribution, we had to make some assumptions, e.g. each event was independent, and had two outcomes.We have similar restrictions on events for a Poisson Distribution:
! Events must occur:• Singly in time.• Independently of each other.• At a constant rate in the sense that the mean number
of occurrences in the interval is proportional to the length of the interval.
This means we can’t have multiple events occurring at once. We treat events as instantaneous.
If an event occurred just a moment ago, another one is no less likely to occur now than it a while later..
You can usually tell in an exam if a Poisson Distribution is intended if the word ‘rate’ is used.
Jan 2012 Q4
Poisson (or )
(From mark scheme) Hits occur singly in timeHits are independent or hits occurs randomlyHits occur at a constant rate
?
?
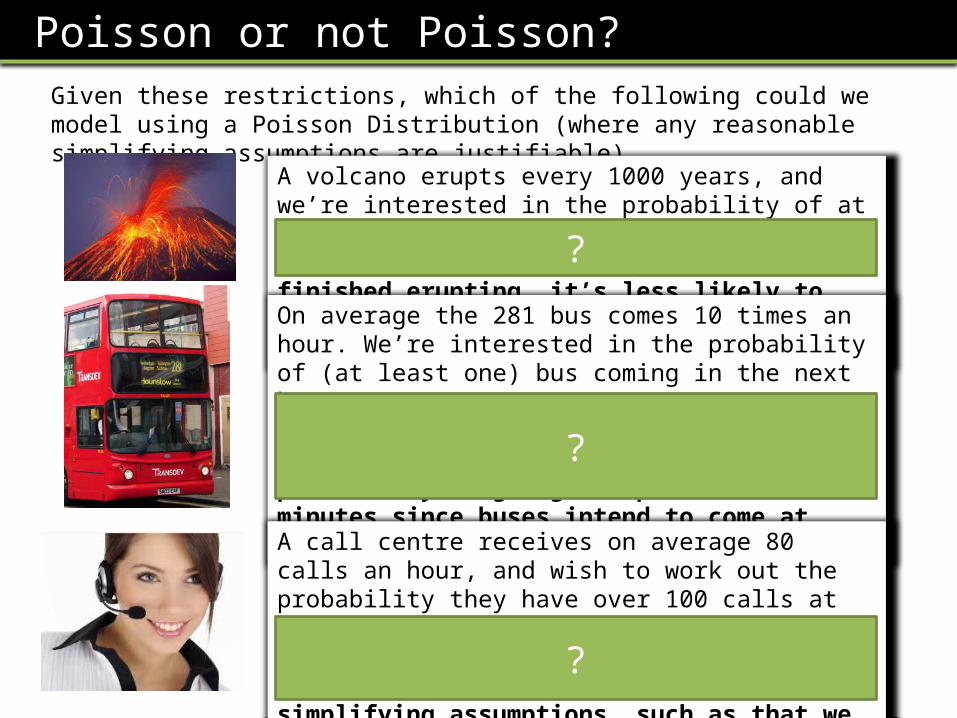
Poisson or not Poisson?Given these restrictions, which of the following could we model using a Poisson Distribution (where any reasonable simplifying assumptions are justifiable)
A volcano erupts every 1000 years, and we’re interested in the probability of at least one eruption next year.If a volcano erupted today and then finished erupting, it’s less likely to erupt next year. So events are not independent.On average the 281 bus comes 10 times an hour. We’re interested in the probability of (at least one) bus coming in the next hour.Definitely not. Buses aren’t equally likely to come at any moment – the probability is going to spike each 6 minutes since buses intend to come at regular intervals, not randomly.
A call centre receives on average 80 calls an hour, and wish to work out the probability they have over 100 calls at some hour in the day.Yes, justified, provided that the average rate is constant. We’re making some simplifying assumptions, such as that we don’t have repeat calls from the same customer.
?
?
?
General Questions
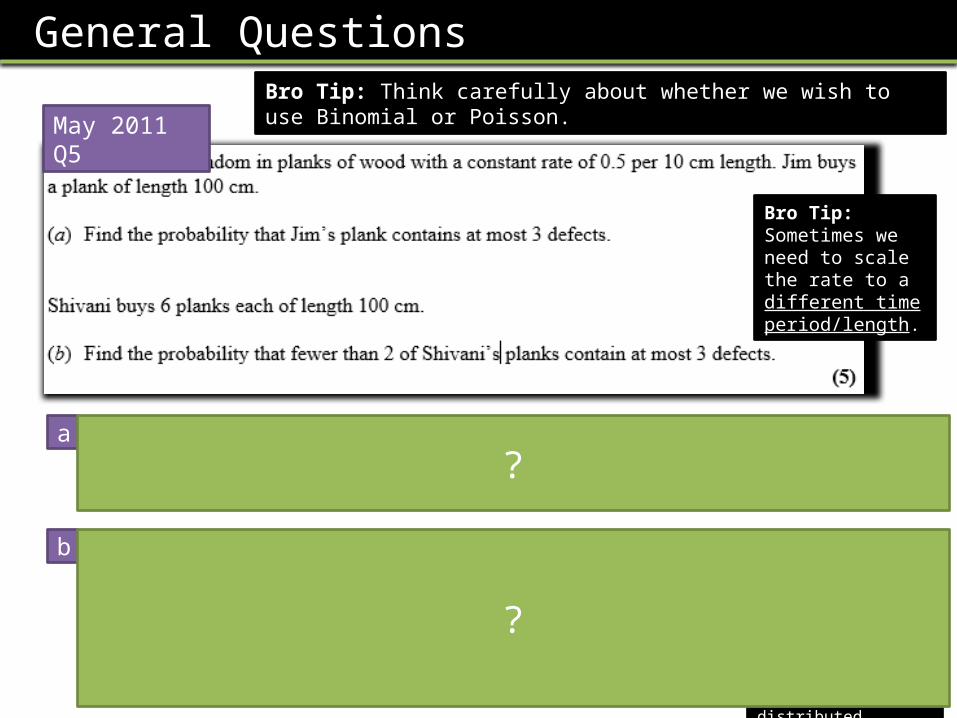
May 2011 Q5
If 0.5 defects occur per 10cm, 5 defects occur per 100cm
From (a), the probability that any given blank has at most 3 defects is 0.2650. We have 6 planks, and a Binomial Distribution over the count of how many are defective out of 6.Let be the number of defective planks.
a
b
Bro Tip: Think carefully about whether we wish to use Binomial or Poisson.
Bro Tip: You should be clear about what your random variables are and how they’re distributed.
?
?
Bro Tip: Sometimes we need to scale the rate to a different time period/length.

Test Your Understanding
A shop sells radios at a rate of 2.5 per week.a) Find the probability that in a two-week period the shop sells at least 7 radios.b) Deliveries of these radios come every 4 weeks. Find the probability of selling fewer
than 12 radios in a four-week period.c) The manager wishes to make sure that the probability of the shop running out of
radios during a four-week period is less than 0.01. Find the smallest number of radios the manager should have in stock immediately after the delivery.
the number of radios sold in a two-week period
the number of radios sold in a four-week period
Let the number the manager should have in stock Using the table, we find .
Bro Tip: The method/principle her is exactly the same as with Binomial questions.
a
b
c
?
?
?

Exercise 2Bob makes on average 5 burgers and hour. He makes burgers across a 2 hour period.a) Calculate the probability he makes 8 burgers in
this period.
b) Calculate the probability he makes at least 3 burgers.
c) What is the most burgers he can make such that there is at most a 5% chance of making less than this number of burgers?
Using table, So
Chelsea dates on average 6 men a week. She considers it a ‘good week’ if she dated at least 4 men.d) Calculate the probability it’s been a good week.
e) She considers it a ‘good month’ if she’s had at least 3 good weeks out of 4. Calculate the probability she’s had a good month. count of good weeks,
1
2
For each 10 lines of programming there’s 0.6 bugs.a) If I write a program 50 lines long, what’s the
probability I make at least 5 bugs?
b) Mike the IT boss wants to downsize his company. He wants to fire as many people as possible but is not allowed to exceed 1%. Every employee writes a 50 line program. What the number of bugs he should set such that they will be sacked if they make at least this number?
Fred gets a bonus each day if makes more than 11 sales that day. On average he makes 8.5 sales a day. He can take his kids to Disneyland if across the next month (30 days) he makes a bonus on at least 2 days. Calculate the probability that he gains the respect of his kids and saves his marriage. sales each day,
days bonus made
3
4
?
?
?
?
?
?
?
?

Approximating a Binomial using a Poisson
Earlier we saw how we could solve problems involving rates using a Binomial Distribution, where we’d split up the time period into intervals where in each the event either happened or it didn’t, where .
2pm 3pm
We saw that the Poisson Distribution is obtained when we divided time into more and more chunks (i.e. where became infinitely large). Note also that is small because in a very short time interval, the probability of the event occurring is low. This naturally leads us to:
! If and: is large is smallThen can be approximated by Generally if then a Poisson is suitable enough approximation, but in an exam, use the original Binomial unless instructed to approximate.

Why would we want to approximate?
For the Binomial Distribution, the probability involves When is really large, calculating is really horrid.
However, the probability function for the Poisson Distribution doesn’t involve so avoids the problem. Note also that is not too large (as is small) and so is not too difficult to compute.
𝑋 𝐵 (𝑛 ,𝑝 ) 𝑋 𝑃𝑜 (𝑛𝑝)

QuickfireState whether you would use a Poisson Approximation for each Binomial (recall: ), and state the distribution used as the approximation.
𝑋 𝐵 (100 ,0.1) 𝑋 𝑃𝑜 (10 )
𝑋 𝐵 (50 ,0.5) Poisson approximation not appropriate as .
𝑋 𝐵 (40 ,0.02) 𝑋 𝑃𝑜 (8 )
𝑋 𝐵 (300 ,0.2) Poisson approximation not appropriate as .
?
?
?
?

Exercise 3
May 2013 Q7d
so use
Jan 2013 Q1b
𝑿 𝑷𝒐 (𝟏𝟎 )June 2009 Q1
?
?
?

Summary of S2 so far…
Description Name Params Outcomes Prob FuncA Bell-shaped distribution around some known mean with a known variance.
Normal Distribution
Mean Variance (Any real value) Oddly, this is in your S1 formula
sheet, but you never used it!
We count the number of ‘successes’ after a number of trials, each with two outcomes (‘success’ and ‘failure’). e.g. Number of heads after 10 throws of an unfair coin.
Binomial Distribution
Number of trials
Probability of success in each trial
Counting the number of events which occur within a fixed time, given some known rate.
Poisson Distribution
Average rate (including 0)
These are all based on the parameters we set.
? ? ? ? ? ?
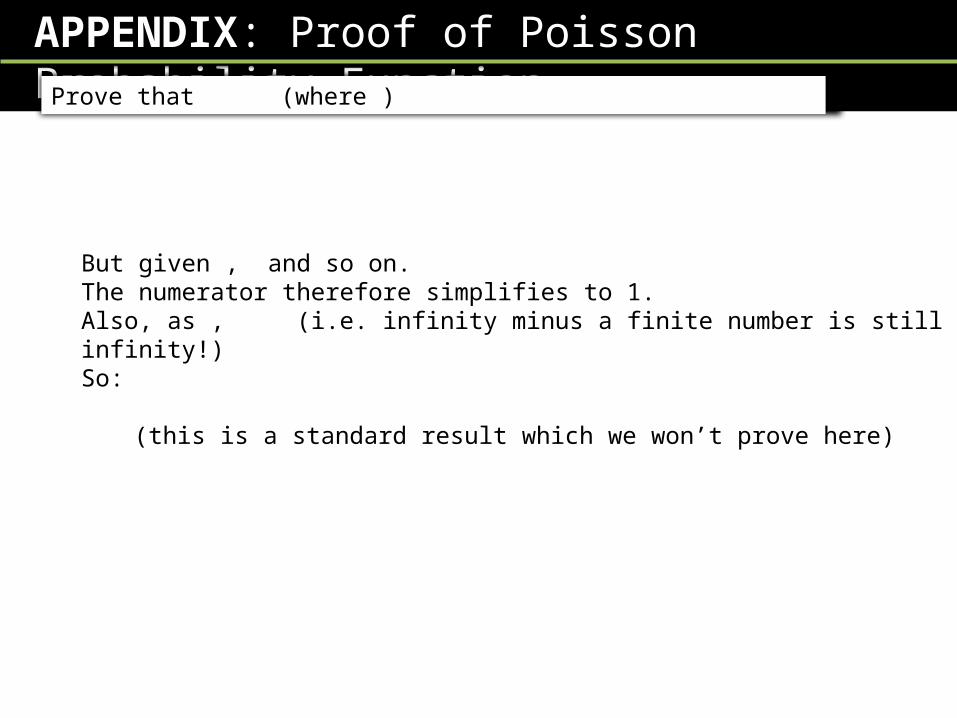
APPENDIX: Proof of Poisson Probability FunctionProve that (where )
But given , and so on.The numerator therefore simplifies to 1.Also, as , (i.e. infinity minus a finite number is still infinity!)So:
(this is a standard result which we won’t prove here)
Related Documents