846 Am J Clin Pathol 2009;132:846-856 846 DOI: 10.1309/AJCPTK87EMMIKPFS © American Society for Clinical Pathology Anatomic Pathology / S100A1 in Ovarian Cancer S100A1 Expression in Ovarian and Endometrial Endometrioid Carcinomas Is a Prognostic Indicator of Relapse-Free Survival Melissa S. DeRycke, MS, 1 John D. Andersen, 1 Katherine M. Harrington, 1 Stefan E. Pambuccian, MD, 1 Steve E. Kalloger, 2 Kristin L.M. Boylan, PhD, 1 Peter A. Argenta, MD, 3 and Amy P.N. Skubitz, PhD 1 Key Words: S100A1; Ovarian cancer; Tissue microarray; Endometrioid subtype; Gene expression DOI: 10.1309/AJCPTK87EMMIKPFS Abstract We sought to investigate the expression levels of S100A1 in ovarian cancer cell lines and tissues to correlate S100A1 with subtype, stage, grade, and relapse-free survival. S100A1 messenger RNA and protein were up-regulated in ovarian cancer cell lines and tumors compared with normal ovarian cell lines and tissues by gene microarray analysis, reverse transcriptase–polymerase chain reaction, quantitative reverse transcriptase–polymerase chain reaction, and Western immunoblotting. In the study, 63.7% of serous, 21.2% of clear cell, 11.2% of endometrioid, and 3% of mucinous ovarian (1/31) cancers were S100A1+ by immunohistochemical staining of tissue microarrays (n = 500). S100A1 expression increased with increasing Silverberg grade but not stage in serous tumors. Endometrial tissue microarrays (n = 127) were 9.4% S100A1+; no correlation with stage or grade and S100A1 was found. In the endometrioid subtype of ovarian and endometrial cancers, relapse-free survival was decreased for patients with S100A1+ tumors. These data suggest that S100A1 is a marker for poor prognosis of endometrioid subtypes of cancer. Ovarian cancer is the fifth leading cause of cancer-related death in women in the United States, with more than 22,000 new cases anticipated annually. 1 The 5-year survival rate, which exceeds 80% in early-stage disease, drops to less than 30% for disease diagnosed in later stages. 1 Symptoms of early-stage ovarian cancer are subtle, and neither the serum CA-125 level nor ultrasound is predictive enough to be cost- effective in screening the general population. As a result, diagnosis typically occurs in later stages of disease, highlight- ing the need for novel tumor markers. 2-4 Our group previously reported a gene microarray analysis of ovarian cancer and more than 400 normal and diseased tissues. 4 In that study, we identified 66 genes that were up- regulated 2-fold or more in ovarian cancer relative to normal ovarian tissue; these genes, including S100A1, may poten- tially serve as tumor markers. 4 Immunohistochemical staining confirmed S100A1 protein expression as 100% sensitive and 60% specific to a small sampling of ovarian cancer tissues. 4 In this study, we report a comprehensive analysis of the expression of S100A1 messenger RNA (mRNA) and protein in a wide spectrum of ovarian cancer tissues and cell lines in an effort to validate our previous observation that S100A1 expression is elevated in ovarian cancer. We have also exam- ined the implications of elevated S100A1 with regard to clini- cal specificity, disease progression, and outcomes. Materials and Methods Reagents Cell culture media and supplements were purchased from Invitrogen (Carlsbad, CA). Chemicals were purchased from Sigma Chemical (St Louis, MO). Downloaded from https://academic.oup.com/ajcp/article/132/6/846/1760546 by guest on 07 August 2022

Welcome message from author
This document is posted to help you gain knowledge. Please leave a comment to let me know what you think about it! Share it to your friends and learn new things together.
Transcript

846 Am J Clin Pathol 2009;132:846-856846 DOI: 10.1309/AJCPTK87EMMIKPFS
© American Society for Clinical Pathology
Anatomic Pathology / S100A1 in Ovarian Cancer
S100A1 Expression in Ovarian and Endometrial Endometrioid Carcinomas Is a Prognostic Indicator of Relapse-Free Survival
Melissa S. DeRycke, MS,1 John D. Andersen,1 Katherine M. Harrington,1 Stefan E. Pambuccian, MD,1 Steve E. Kalloger,2 Kristin L.M. Boylan, PhD,1 Peter A. Argenta, MD,3 and Amy P.N. Skubitz, PhD1
Key Words: S100A1; Ovarian cancer; Tissue microarray; Endometrioid subtype; Gene expression
DOI: 10.1309/AJCPTK87EMMIKPFS
A b s t r a c tWe sought to investigate the expression levels
of S100A1 in ovarian cancer cell lines and tissues to correlate S100A1 with subtype, stage, grade, and relapse-free survival. S100A1 messenger RNA and protein were up-regulated in ovarian cancer cell lines and tumors compared with normal ovarian cell lines and tissues by gene microarray analysis, reverse transcriptase–polymerase chain reaction, quantitative reverse transcriptase–polymerase chain reaction, and Western immunoblotting. In the study, 63.7% of serous, 21.2% of clear cell, 11.2% of endometrioid, and 3% of mucinous ovarian (1/31) cancers were S100A1+ by immunohistochemical staining of tissue microarrays (n = 500). S100A1 expression increased with increasing Silverberg grade but not stage in serous tumors. Endometrial tissue microarrays (n = 127) were 9.4% S100A1+; no correlation with stage or grade and S100A1 was found. In the endometrioid subtype of ovarian and endometrial cancers, relapse-free survival was decreased for patients with S100A1+ tumors. These data suggest that S100A1 is a marker for poor prognosis of endometrioid subtypes of cancer.
Ovarian cancer is the fifth leading cause of cancer-related death in women in the United States, with more than 22,000 new cases anticipated annually.1 The 5-year survival rate, which exceeds 80% in early-stage disease, drops to less than 30% for disease diagnosed in later stages.1 Symptoms of early-stage ovarian cancer are subtle, and neither the serum CA-125 level nor ultrasound is predictive enough to be cost-effective in screening the general population. As a result, diagnosis typically occurs in later stages of disease, highlight-ing the need for novel tumor markers.2-4
Our group previously reported a gene microarray analysis of ovarian cancer and more than 400 normal and diseased tissues.4 In that study, we identified 66 genes that were up-regulated 2-fold or more in ovarian cancer relative to normal ovarian tissue; these genes, including S100A1, may poten-tially serve as tumor markers.4 Immunohistochemical staining confirmed S100A1 protein expression as 100% sensitive and 60% specific to a small sampling of ovarian cancer tissues.4
In this study, we report a comprehensive analysis of the expression of S100A1 messenger RNA (mRNA) and protein in a wide spectrum of ovarian cancer tissues and cell lines in an effort to validate our previous observation that S100A1 expression is elevated in ovarian cancer. We have also exam-ined the implications of elevated S100A1 with regard to clini-cal specificity, disease progression, and outcomes.
Materials and Methods
Reagents
Cell culture media and supplements were purchased from Invitrogen (Carlsbad, CA). Chemicals were purchased from Sigma Chemical (St Louis, MO).
Dow
nloaded from https://academ
ic.oup.com/ajcp/article/132/6/846/1760546 by guest on 07 August 2022

Am J Clin Pathol 2009;132:846-856 847847 DOI: 10.1309/AJCPTK87EMMIKPFS 847
© American Society for Clinical Pathology
Anatomic Pathology / Original Article
Cell LinesOvarian cancer cell lines SKOV3, ES-2, NIH:OVCAR3,
HEY, C13, OV2008, OVCA429, OVCA433, A2780-s, and A2780-cp (provided by Barbara Vanderhyden, PhD, University of Ottawa, Ottawa, Canada); NIH:OVCAR5 (provided by Judah Folkman, MD, Department of Vascular Biology, Boston Children’s Hospital, Boston, MA); MA148 (provided by Sundaram Ramakrishnan, PhD, University of Minnesota, Minneapolis); and CAOV3 (provided by Robert Bast Jr, MD, University of Texas, Houston) were maintained as previously described.5-8 Immortalized nor-mal ovarian surface epithelial (IOSE) cell lines 1816-575, 1816-686, HIO117, IMCC3, HIO3173-11, and HIO135 (pro-vided by Patricia Kruk, PhD, University of South Florida, Tampa); and IOSE-VAN and IOSE-MAR (provided by Nelly Auersperg, MD, PhD, Department of Obstetrics and Gynecology, University of British Columbia, Vancouver, Canada) were also maintained as described.9,10
Tissue SamplesSnap-frozen tissues and formalin-fixed, paraffin-
embedded tissue blocks were obtained from the University of Minnesota Tissue Procurement Facility (Minneapolis) after institutional review board approval and patient con-sent. Snap-frozen tissue was obtained from 49 serous papil-lary ovarian cancers, 24 serous papillary ovarian cancer metastases to the omentum, 24 serous papillary ovarian cancer metastases to areas other than the omentum, 24 benign ovarian tumors, 59 normal ovaries, 441 normal tis-sues, 255 diseased tissues, and 148 other cancerous tissues, as listed in ❚Figure 1A❚.11 Tumor and normal samples were identified, dissected to ensure the presence of viable tumor or tissue, and snap-frozen in liquid nitrogen within 30 min-utes of excision. Diagnoses were determined by the surgical pathologist and confirmed by 2 independent pathologists.
Gene Expression AnalysisRNA was prepared and gene expression determined
at Gene Logic, Gaithersburg, MD, using the Affymetrix HU_133 array (Affymetrix, Santa Clara, CA).11 Gene expression analysis was performed with the Gene Logic Genesis Enterprise System Software, using the Gene Logic normalization algorithm.4,11 The mean expression of S100A1 for each tissue type was calculated using the normalized expression values for Affymetrix probe 205334_at.
Reverse Transcriptase–Polymerase Chain ReactionTotal RNA was extracted from 7 serous ovarian
cancer and 7 normal ovarian tissue homogenates using the RNeasy Midi Kit (Qiagen, Valencia, CA). One-step reverse transcriptase–polymerase chain reaction (RT-PCR) using the Access RT-PCR kit (Promega, Madison, WI)
was performed using S100A1 primers (294-forward, 5′-GAGCTAGACGAGAATGGAGAC; 497-reverse, 5′-GGGTTATGGAGAGGGATAAGT) and β-actin prim-ers (680-forward, 5′-GGCCACGGCTGCTTC; 887-reverse, 5′-GTTGGCGTACAGGTCTTTGC). Cycling conditions were as follows: 45°C, 45 minutes; 94°C, 1 minute; 35 cycles of 94°C for 1 minute, 54°C for 1 minute, and 72°C for 30 seconds; followed by an extension at 72°C for 3 minutes. Samples were separated on an agarose gel and visualized with ethidium bromide.
Quantitative Real-Time PCRReal-time quantification of S100A1 was performed
using the SYBR Green assay (Bio-Rad Laboratories, Hercules, CA) and the iQ5 Real-Time PCR thermo-cycler (Bio-Rad). Two microliters of complementa-ry DNA was amplified in a 25-μL reaction containing 13 μL of iQ SYBR Green Supermix (Bio-Rad), 1 μL each of S100A1 forward and reverse primers (353-for-ward, 5′-TGCTCTCACAGTGGCCTGTA; 481-reverse, 5′-TAAGTGGGGTGAGGTGGAAG), and 8 μL of nucle-ase-free water. Following an initial denaturation step of 95°C for 3 minutes, 40 cycles of PCR were performed with the following conditions: 95°C, 10 seconds (denaturation); and 57°C, 30 seconds (annealing/extension). Product size was verified by gel electrophoresis. Threshold cycle (Ct) values were calculated according to the iQ5 real-time detec-tion software. Standard curves for S100A1 and β-actin were generated by plotting Ct vs the log of the initial starting amount of RNA in nanograms.12 Each sample was normal-ized to the amount of β-actin mRNA present in the sample, and the relative amount of each sample was determined as a fold-change increase over the lowest expressing cell line (IOSE-MAR).
Western Immunoblotting
Protein ExtractionProtein was extracted from snap-frozen tissues in
T-PER Tissue Protein Extraction Reagent (Thermo-Fisher Scientific, Waltham, MA) containing a protease inhibi-tor cocktail (Roche Applied Science, Basel, Switzerland). Protein concentration was determined using the BCA Protein Assay (Thermo-Fisher Scientific).
ImmunoblottingFifty micrograms of protein was separated on a 10% to
20% gradient Tricine gel (Invitrogen) and then transferred onto a polyvinylidene difluoride membrane. The membrane was blocked overnight and then incubated with primary antibody at 1 μg/mL: rabbit-antihuman S100α polyclonal antibody (Abcam, Cambridge, MA), mouse-antihuman
Dow
nloaded from https://academ
ic.oup.com/ajcp/article/132/6/846/1760546 by guest on 07 August 2022
848 Am J Clin Pathol 2009;132:846-856848 DOI: 10.1309/AJCPTK87EMMIKPFS
© American Society for Clinical Pathology
DeRycke et al / S100A1 in Ovarian Cancer
β-actin monoclonal antibody (clone AC-74, Sigma-Aldrich), rabbit IgG (Thermo-Fisher Scientific), or mouse IgG (Equitech-Bio, Kerrville, TX). After washing, the membrane was incubated with a horseradish-peroxidase–conjugated secondary antibody diluted 1:5,000. Proteins were visualized using SuperSignal West Femto Maximum Sensitivity substrates (Thermo-Fisher Scientific) and exposed to autoradiography film (Midwest Scientific, Valley Park, MO).
Tissue Sections
Individual Tissue SectionsFormalin-fixed, paraffin-embedded normal ovary (n = 7),
borderline ovarian tumor (n = 5), and serous epithelial ovarian cancer (n = 37) tissues were cut, adhered onto slides, and dried at 30°C overnight and for 30 minutes at 60°C immediately before staining to remove any residual water. Sections of nor-mal ovary were included in analysis only if surface epithelium cells were present.
Normal ovary (59)
Normal omentum (9)
Benign ovary tumors (24)
Malignant ovary tumors (49)
Ovca omentum (24)
Ovca secondary sites (24)
Adipose (28)
Bladder cancer (7)
Gallbladder cholecystitis (18)
Normal breast (4)
Breast cancer (4)
Normal cervix (19)
Cervical cancer (4)
Normal myometrium (90)
Leiomyoma (26)
Malignant endometrium (13)
Normal uterus (19)
Uterine cancer (8)
Normal placenta (18)
Normal skeletal muscle (27)
Normal skin (12)
Normal spleen (5)
Normal small intestine (13)
Normal stomach (7)
Normal thymus (66)
Diseased synovium (7)
Tonsil hyperplasia (59)
Normal bone (8)
Benign bone structure (5)
Osteoarthritis bone (36)
Bone cancer (13)
Benign brain tumors (11)
Malignant brain tumors (12)
Normal rectum (7)
Normal colon (54)
Diseased colon (6)
Colon cancer (32)
Normal kidney (25)
Malignant kidney (19)
Normal liver (25)
Diseased liver (43)
Liver cancer (9)
Normal lung (36)
Diseased lung (30)
Lung cancer (22)
Normal thyroid (4)
Diseased thyroid (14)
Malignant thyroid (5)
Mean Expression
Tis
su
e t
yp
e (
n)
0 200 400 600 800 1,000 1,200 1,400
A
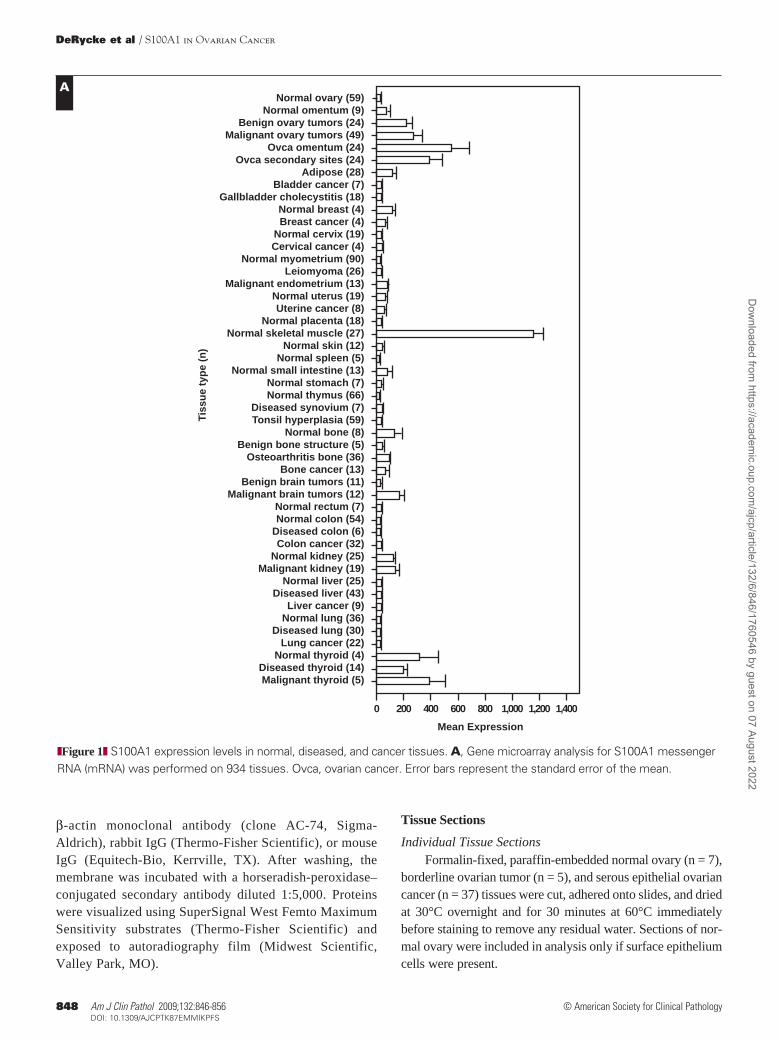
❚Figure 1❚ S100A1 expression levels in normal, diseased, and cancer tissues. A, Gene microarray analysis for S100A1 messenger RNA (mRNA) was performed on 934 tissues. Ovca, ovarian cancer. Error bars represent the standard error of the mean.
Dow
nloaded from https://academ
ic.oup.com/ajcp/article/132/6/846/1760546 by guest on 07 August 2022

Am J Clin Pathol 2009;132:846-856 849849 DOI: 10.1309/AJCPTK87EMMIKPFS 849
© American Society for Clinical Pathology
Anatomic Pathology / Original Article
Immunohistochemical Staining of TissuesTissue sections were deparaffinized and rehydrated
through a series of xylene and ethanol washes. Antigen retrieval was performed in a citrate buffer (Biocare, Concord, CA), and endogenous peroxidase activity was blocked with hydrogen peroxide. Slides were incubated with mouse-antihuman S100A1 monoclonal antibody (clone DAK-S100A1/1; DakoCytomation, Glostrup, Denmark) or normal mouse IgG1 (clone 3-5D1-C9; Abcam) overnight at 1:2,000. Slides were washed and then incubated with biotinylated horse-antimouse secondary antibody (Vector Laboratories, Burlingame, CA), followed with an avidin-biotin com-plex (Vector Laboratories). Staining was visualized with 3,3′-diaminobenzidine (Biocare). Slides were examined by a pathologist (S.E.P.) and assigned a score of 0 (no staining), 1 (<10% of neoplastic cells staining), 2 (10%-50% of neoplas-tic cells staining), or 3 (>50% of neoplastic cells staining). For analysis, scores of 1, 2, and 3 were grouped and consid-ered positive. Cardiac muscle was used as a positive control sample for antibody staining.
Tissue MicroarraysTissue microarray (TMA) slides of 500 cases of ovar-
ian cancer and 127 cases of endometrial cancer (containing 0.6-mm duplicate core samples for each patient) were pro-vided by the Cheryl Brown Ovarian Cancer Outcomes Unit (Vancouver, Canada). Patients whose samples were included
in the TMA were chosen based on the fact that their tumors were optimally debulked at initial surgery and patients had no macroscopic residual disease, thereby increasing the proportion of early-stage cases on the TMA relative to the general population. None of the patients received neoadju-vant therapy, but all received platinum-based chemotherapy following surgery. Because the 500 cases included in the ovarian TMA were originally diagnosed up to 18 years ago and the classification of ovarian cancer histologies has shifted over the years, care was taken to ensure that the cur-rent diagnostic criteria for subclassification of ovarian carci-noma based on cell type were uniformly applied.13,14 H&E-stained slides for all cases were reviewed by a gynecologic pathologist to confirm diagnosis, stage, tumor cell type, and grade before TMA inclusion; samples displaying multiple cell types (mixed tumors) were excluded from the study. Complete details about the cohort used for these TMAs are provided in ❚Table 1❚ and ❚Table 2❚ and in Gilks et al.15 Patients were followed up for a median of 4.6 years (0.1-18 years) after the initial surgery. Relapse was defined by vis-ible disease progression by a variety of diagnostic modalities including radiology and physical examination.
Endometrial TMAs were composed of duplicate cores of 127 endometrial samples. Complete details about the cohort have been previously reported by Weichert et al.16
TMA slides were treated and stained in a manner identi-cal to that described for the individual tissue sections.
C8
S100A1
β-actin
C7 C6 C5 C9 C10 C11 N8 N9 N10 N11 N12
Cancer Normal
Tissue Protein Extracts
–RNA
Tissue RNA Extracts
Malignant Normal
–RT C1 C2 C3 C4 C5 C6 C7 N1 N2 N3 N4 N5 N6 N7
S100A1
β-actin *
BHIO135
1816-686
IOSE-VAN
HIO117
IMCC3
IOSE-MAR
A2780s
A2780cp
OVC A429
MA148
HEY
SKOV3
C13
OVC AR3
OV2008
ES-2
OVC AR5
CAOV3
Fold Increase
No
rma
lC
an
ce
r
35
,00
03
6,0
00
37
,00
03
8,0
00
39
,00
04
0,0
00
0
10
20
30
40
50
50
01
,00
01
,50
02
,00
02
,50
0
C
D
B, mRNA expression of S100A1 in ovarian cancer (C1-C7) and normal (N1-N7) ovary tissues was examined by reverse transcriptase–polymerase chain reaction (RT-PCR). * Reaction not run. C, Quantitative real time PCR expression of S100A1 mRNA in ovarian cancer and immortalized normal ovarian surface epithelial (IOSE) cell lines as a function of fold increase relative to IOSE-MAR. D, Western immunoblot of protein extracts from ovarian cancer (C5-C11) and normal (N8-N12) ovary tissues to detect S100A1 protein.
Dow
nloaded from https://academ
ic.oup.com/ajcp/article/132/6/846/1760546 by guest on 07 August 2022

850 Am J Clin Pathol 2009;132:846-856850 DOI: 10.1309/AJCPTK87EMMIKPFS
© American Society for Clinical Pathology
DeRycke et al / S100A1 in Ovarian Cancer
Tissue GradingThree-tiered grading of ovarian cancer tissues was done
using the Silverberg grading system on the ovarian TMAs.17 Serous carcinomas were additionally divided into low- and high-grade lesions, as reported by Malpica et al.18 Endometrial tissues were graded by using the International Federation of Gynecology and Obstetrics grading system.17
Statistical AnalysisSignificance of differential expression for S100A1 across
the histopathologic subtypes was quantified with the Pearson χ2 statistic. Univariable relapse-free survival for the entire cohort and each histopathologic subtype was examined with Kaplan-Meier survival curves. Results significant in uni-variable analysis were subjected to multivariable relapse-free
survival analysis using the Cox proportional hazards test. The level of significance for all comparisons was a P value of less than .05. All statistical calculations were computed with JMP, version 6.0.3 (SAS Institute, Cary, NC).
Results
Gene Expression
To determine the tissue specificity of S100A1 mRNA expression, we extended our previous gene microarray analy-sis to include 934 samples.4,11 S100A1 mRNA expression was increased in ovarian tumors and ovarian cancer metasta-ses compared with normal ovaries and more than 95% of the 844 other normal, diseased, and cancerous tissues examined (Figure 1A). It is interesting that S100A1 was not up-regulat-ed in normal or cancerous cervix, myometrium, endometrium, uterus, intestine, colon, liver, or lung. Expression of S100A1 mRNA was high in normal skeletal muscle and in normal and diseased thyroid, as previously described (Figure 1A).19
RT-PCRS100A1 mRNA was highly expressed in 5 of 7 serous
ovarian cancer tissues relative to all 7 normal ovarian tissues examined ❚Figure 1B❚. However, surface epithelial cells, a postulated origin for ovarian cancer, compose only a minute fraction of the entire normal ovary.20,21 Thus, even if the normal ovarian surface epithelial cells had high levels of S100A1 mRNA, it may be masked by low or no expression of S100A1 in the ovarian stroma. It would therefore be difficult to detect S100A1 mRNA in normal ovarian surface epithelia
❚Table 1❚Subtype, Stage, Silverberg Grade, and S100A1 Score for Tissue Microarrays in Ovarian Cancer*
Median (Range) Median (Range) Preoperative Serum Silverberg S100A1+ Age (y) CA-125 (U/mL) Stage N S100A1+ Grade N S100A1+ Overall
Serous High-grade (n = 200) 60.0 (37.6-86.0) 150 (0-23,000) I 49 34 (69) 1 0 0 (0) 132 (66.0) II 86 54 (63) 2 56 28 (50) III 65 44 (68) 3 144 104 (72) Low-grade (n = 12) 59.2 (33.5-81.6) 65 (6-325) I 1 1 (100) 1 12 3 (25) 3 (25) II 7 2 (29) 2 0 0 (0) III 4 0 (0) 3 0 0 (0) Endometrioid (n = 125) 54.1 (29.4-88.1) 130 (8-13,000) I 69 8 (12) 1 82 8 (10) 14 (11.2) II 50 5 (10) 2 35 5 (14) III 6 1 (17) 3 8 1 (13) Clear cell (n = 132) 55.0 (28.1-89.0) 64 (4-7,750) I 68 19 (28) 1 0† N/A 28 (21.2) II 56 7 (13) 2 0† N/A III 8 2 (25) 3 132 28 (21.2) Mucinous (n = 31) 56.4 (25.4-76.7) 45 (7-650) I 18 0 (0) 1 11 0 (0) 1 (3) II 12 0 (0) 2 18 1 (6) III 1 1 (100) 3 2 0 (0) Total (n = 500) 56.6 (25.4-89.0) 98 (0-23,000) I 205 62 (30.2) 1 105 11 (10.5) 178 (35.6) II 211 68 (32.2) 2 109 34 (31.2) III 84 48 (57) 3 286 133 (46.5)
* Data are given as number (percentage) unless otherwise indicated.† All clear cell carcinomas are considered high-grade.
❚Table 2❚Subtype, Stage, FIGO Grade, and S100A1 Score for Tissue Microarrays in Endometrial Cancer*
Mean ± SD S100A1+ Age (y) S100A1+ Overall
Endometrioid (n = 127)† 63.0 ± 13 12 (9.4) Stage I/II (n = 119) 63.9 ± 12.4 12 (10) III (n = 7) 59.1 ± 13.9 0 (0) FIGO grade 1 (n = 81) 63.6 ± 12.0 7 (9) 2 (n = 17) 63.0 ± 15.2 1 (6) 3 (n = 29) 63.9 ± 12.1 4 (14)
FIGO, International Federation of Gynecology and Obstetrics.* Data are given as number (percentage) unless otherwise indicated. The preoperative
serum CA-125 level was not done.† One sample was not staged.
Dow
nloaded from https://academ
ic.oup.com/ajcp/article/132/6/846/1760546 by guest on 07 August 2022

Am J Clin Pathol 2009;132:846-856 851851 DOI: 10.1309/AJCPTK87EMMIKPFS 851
© American Society for Clinical Pathology
Anatomic Pathology / Original Article
by RT-PCR when using an entire piece of normal ovary. For this reason, quantitative RT-PCR was performed on IOSE and ovarian cancer cell lines to better compare levels of expres-sion in normal and cancerous epithelial cells, without concern for other contaminating cell types.
Real-Time PCRWe evaluated 12 ovarian cancer cell lines and 6 IOSE
cell lines by using quantitative real time PCR to quantify their expression levels of S100A1 mRNA ❚Figure 1C❚. Overall, the serous cell lines (A2780-s, A2780-cp, MA148, HEY, OVCAR3, OVCAR5, and CAOV3) expressed the highest levels of S100A1 mRNA among the ovarian cancer subtypes, with a mean 5,779-fold increase (range, 5-37,884) in S100A1 mRNA over the lowest expressing cell line (IOSE-MAR). S100A1 mRNA levels in clear cell carcinoma cell lines (OVCA429, SKOV3, and ES-2) showed a mean 153-fold increase (range, 7-418), whereas a mean 18-fold increase (range, 12-25) was observed in endometrioid subtype cell lines (C13 and OV2008). IOSE cell lines (HIO135, 1816-686, IOSE-VAN, HIO117, and IMCC3) had only a mean 9-fold increase (range, 1-32) in S100A1 mRNA compared with the lowest expressing cell line (Figure 1C).
Western ImmunoblottingTo confirm that mRNA levels correlated with S100A1
protein expression, protein extracts from 7 serous papillary ovarian cancer tissues and 5 normal ovaries were analyzed by Western immunoblotting ❚Figure 1D❚. Of the 7 cancer tissues, 6 had detectable S100A1 protein, while none of 5 normal ovarian tissues expressed S100A1 protein (Figure 1D).
Immunohistochemical StainingImmunohistochemical staining for S100A1 was opti-
mized in 49 individual formalin-fixed, paraffin-embedded tis-sue samples consisting of 7 normal ovaries and 5 borderline, 4 stage I, 1 stage II, and 32 stage III serous subtype ovarian carcinomas. Staining was observed in the nucleus and cyto-plasm ❚Image 1A❚, as our group and others have reported previously.4,22,23 Of the ovarian cancer samples, 3 of 4 stage I, the 1 stage II, and 29 of 32 stage III tumors stained positively for S100A1, resulting in a sensitivity of 89%. Of the 5 cases of borderline tumor, 1 was positive. Of the 7 normal ovary tissues, 6 were negative for S100A1 expression ❚Image 1B❚, resulting in a specificity of 85.7%.
Several patient samples were analyzed by multiple techniques, and similar results were found, corroborating the results. For example, ovarian cancer tissue C5 had low levels of S100A1 mRNA expression by RT-PCR (Figure 1B), and the tissue was negative for S100A1 protein by Western immu-noblot (Figure 1D) and immunohistochemical analysis (not shown). Ovarian cancer tissue C7 expressed high levels of
S100A1 mRNA by RT-PCR (Figure 1B) and S100A1 protein by Western immunoblot (Figure 1D) and immunohistochemi-cal analysis (not shown). Similarly, normal ovarian tissues, N8 and N9, did not express protein by Western immunoblot (Figure 1D) or immunohistochemical analysis.
To determine whether our immunohistochemical findings in serous ovarian tumors could be expanded and extrapolated to other histologic subtypes, TMAs composed of 500 ovarian cancer cases were stained for S100A1. Representative exam-ples of the staining and scoring observed in the TMAs are shown in ❚Image 1C❚. Differential expression was observed among the 4 major subtypes of ovarian cancer (serous, clear cell, endometrioid, and mucinous; P < .0001; Table 1). We found that 63.7% of the serous subtype stained positively for S100A1, while only 21.2% of clear cell, 11.2% of endometri-oid, and 3% of mucinous subtypes (1/31) stained positively ❚Figure 2A❚.
S100A1 Expression by Cancer Grade and StageExpression of S100A1 increased significantly with
increasing Silverberg grade in ovarian serous tumors, escalat-ing from 25% to 50% and, finally, to 72% for grades 1, 2, and 3, respectively ❚Figure 2B❚ (P < .0029). No clear correlation was observed between grade and S100A1 expression in the other ovarian histologic subtypes. Likewise, S100A1 expres-sion did not vary with stage in any histologic subtype; for example, in serous tumors, S100A1 expression ranged from 60% to 70%, regardless of stage ❚Figure 2C❚.
S100A1 Expression and Time to Disease Recurrence and Death
The medical records of the patients whose tissues were incorporated into the TMAs were examined to determine how long the patients remained disease-free before relapse or death occurred. In the ovarian cancer cohort, relapse-free survival inversely correlated with S100A1 protein expression. Median relapse-free survival in patients with tumors not expressing S100A1 was 17.1 years, compared with 7.3 years for patients with tumors expressing S100A1 (data not shown). This find-ing is largely due to the subtype-specific differential expres-sion of S100A1.
In histologic subtype-specific relapse-free survival analy-sis, the S100A1-associated decrease in relapse-free survival time was found to exist only in the endometrioid subtype ❚Figure 3A❚ (P = .004). Of 14 patients with S100A1+ endo-metrioid ovarian cancer, 7 (50%) had recurrent ovarian cancer 11 years after the primary diagnosis. In contrast, 87.4% of patients with S100A1– endometrioid ovarian cancer (97/111) remained disease-free up to 16 years (Figure 3A). No correla-tion between S100A1 expression and relapse-free survival was observed for clear cell, mucinous, or serous subtypes of ovarian cancer (Figure 3A). In multivariable analysis of the
Dow
nloaded from https://academ
ic.oup.com/ajcp/article/132/6/846/1760546 by guest on 07 August 2022

852 Am J Clin Pathol 2009;132:846-856852 DOI: 10.1309/AJCPTK87EMMIKPFS
© American Society for Clinical Pathology
DeRycke et al / S100A1 in Ovarian Cancer
B
C
A
❚Image 1❚ Immunohistochemical staining of ovarian cancer and normal ovary tissue for S100A1. S100A1 stains the nucleus (A, black arrows) and the cytoplasm, shown in a representative ovarian cancer tissue (A, ×200), but not normal ovary (B, ×200). C, Representative examples of tissue microarray sections stained for S100A1 with a score of negative (top panel) or positive (bottom 3 panels, range of staining shown). Slides were examined by a pathologist (S.E.P.) and assigned a score of 0, no staining; 1, <10% of neoplastic cells staining; 2, 10%-50% of neoplastic cells staining; or 3, >50% of neoplastic cells staining (×200).
Dow
nloaded from https://academ
ic.oup.com/ajcp/article/132/6/846/1760546 by guest on 07 August 2022

Am J Clin Pathol 2009;132:846-856 853853 DOI: 10.1309/AJCPTK87EMMIKPFS 853
© American Society for Clinical Pathology
Anatomic Pathology / Original Article
endometrioid carcinomas, the relapse-free survival time was significantly decreased in endometrial endometrioid cancers that were S100A1+ (P = .0367) ❚Figure 3B❚. Thus, we have shown that 2 gynecologic cancers with suspected similar origins have similar S100A1-dependent outcomes, making it highly unlikely that the results are due to chance partitioning.
Discussion
In this comprehensive study, expression of S100A1 was found to be increased at the mRNA and protein levels in ovarian cancer tissues and cell lines as detected by several techniques, whereas expression in normal ovarian tissues and cell lines was low.
We also examined S100A1 expression on TMAs and correlated the results with tumor stage, grade, and survival. In the small subset of endometrioid subtype of ovarian cancers that expressed S100A1, relapse-free survival was significantly shorter. Half of the patients with S100A1+ endometrioid tumors had recurrent ovarian cancer within 11 years of diagnosis, whereas fewer than 20% of patients with S100A1–
endometrioid subtype of ovarian cancer by stage, grade, and S100A1 expression, only stage and S100A1 expression remained significant ❚Table 3❚. This finding indicates that S100A1 expression is of independent prognostic significance.
S100A1 Expression in Endometrial CancerThe small number of positive samples in the endometri-
oid subset of ovarian cancer (14 of 125) raised the possi-bility that the results were coincidental. To investigate the trend more thoroughly, we performed immunohistochemical analysis on a TMA containing 127 cases of endometrial cancer of the endometrioid subtype. Endometrioid ovarian and endometrioid endometrial cancers are suspected to have similar origins.17,24 Thus, we hypothesized that the correlation between S100A1 expression and relapse-free survival may be similar in both types of cancer. Similar to endometrioid ovar-ian cancers, only a small percentage (ie, 9.4% [12/127 cases]) of endometrioid endometrial cancers expressed S100A1 (Table 2). No correlation was found between S100A1 expres-sion and stage or grade in endometrial endometrioid cancer (data not shown). It is important to note that, as in ovarian
Serous
Papillary
Clear
Cell
Subtype of Ovarian Cancer
% S
10
0A
1 P
os
itiv
e
Endometrioid Mucinous
0
10
20
30
40
50
60
70
80
90
100
I II
Stage: Serous Subtype
% S
10
0A
1 P
os
itiv
e
III
0
10
20
30
40
50
60
70
80
90
100
1 2
Silverberg Grade: Serous Subtype
% S
10
0A
1 P
os
itiv
e
3
0
10
20
30
40
50
60
70
80
90
100
A B
C❚Figure 2❚ S100A1 staining of ovarian cancer tissue microarrays. Percentage of tissues staining positively by subtype (A), Silverberg grade of serous subtype (B), and stage of serous subtype (C).
Dow
nloaded from https://academ
ic.oup.com/ajcp/article/132/6/846/1760546 by guest on 07 August 2022

854 Am J Clin Pathol 2009;132:846-856854 DOI: 10.1309/AJCPTK87EMMIKPFS
© American Society for Clinical Pathology
DeRycke et al / S100A1 in Ovarian Cancer
0.00
0.20
0 5 10 15 20Time (y)
Clear Cell
0.40
0.60
0.80
1.00
Rela
pse-
Free
Sur
viva
l
expression could represent a way to predict which patients will have earlier relapse.
Previous studies have found a correlation between the presence of intraepithelial CD8+ T cells and improved survival in ovarian cancer.26,27 By using the same ovarian TMAs that we used in this study, Clarke et al28 stained for T cells using antibodies against CD3 (a pan–T-cell marker), CD4, and CD8 (T-cell subset-specific markers). They found that although the presence of CD3+ intraepithelial T cells improved disease-specific survival in the serous subtype, only the presence of CD8+ intraepithelial T cells correlated with improved disease-specific survival in the entire cohort, includ-ing serous, endometrioid, and clear cell subtypes.28 When the T-cell marker results were analyzed in conjunction with our S100A1 endometrioid ovarian cancer data, an inverse cor-relation between CD3+ T cells and S100A1 expression was found to be significant (P = .004). Thus, S100A1+ tumors tended to lack CD3+ T cells, which may partially explain the shorter relapse-free survival of the patients. When expression of S100A1 and the presence of CD8+ T cells were analyzed, however, there was no significant correlation (P = .527).
Recent studies using the same TMAs have found type 1 histone deacetylases (HDACs) to be markers of poor prognosis
endometrioid tumors had recurrent ovarian cancer at the end of the study (18 years). These findings were recapitulated in S100A1+ endometrial endometrioid cancers as well, strength-ening the results. Overall, the survival rates for endometrioid ovarian cancer are superior to those of other ovarian cancer subtypes.25 Our findings in this study suggest that S100A1
0.00
0.20
0 5 10 15 20
Time (y)
Re
lap
se
-Fre
e S
urv
iva
l
0.40
0.60
0.80
1.00
0.00
0.20
0 5 10 15 20
Time (y)
0.40
0.60
0.80
1.00
Serous
Re
lap
se
-Fre
e S
urv
iva
l
0.00
0.20
0 5 10 15 20
Time (y)
0.40
0.60
0.80
1.00
EndometrioidRe
lap
se
-Fre
e S
urv
iva
l
0.00
0.20
0 5 10 15
Time (y)
Mucinous
0.40
0.60
0.80
1.00
Re
lap
se
-Fre
e S
urv
iva
l
A B
❚Figure 3❚ Kaplan-Meier relapse-free survival comparison of S100A1+ and S100A1– ovarian and endometrial cancer tissues. A, Relapse-free survival time plotted as a function of S100A1 staining of ovarian cancer tissues by subtype, as labeled. Endometrioid subtype, P = .004; other subtypes, not significant. B, Relapse-free survival time plotted as a function of S100A1 staining of endometrial endometrioid cancer. P = .0367. S100A1+, solid line; S100A1–, dashed line.
❚Table 3❚Multivariable Relapse-Free Survival Analysis of the 125 Cases of Endometrioid Subtype of Ovarian Cancer as Indicated by the Cox Proportional Hazards Model
Confidence Limits
Variable Risk Ratio Lower Upper P
Stage .0017 I 0.2886 0.1378 0.5682 II 0.8262 0.4491 1.5265 III 1.0000 1.0000 1.0000 Silverberg grade .3560 1 0.6811 0.2682 1.3975 2 0.6183 0.2682 1.3975 3 1.0000 1.0000 1.0000 Age at diagnosis 0.9999 0.9998 1.0000 .8840Immunohistochemical .0131 S100A1 expression + 4.0586 1.3782 10.7851 – 1.0000 1.0000 1.0000
Dow
nloaded from https://academ
ic.oup.com/ajcp/article/132/6/846/1760546 by guest on 07 August 2022

Am J Clin Pathol 2009;132:846-856 855855 DOI: 10.1309/AJCPTK87EMMIKPFS 855
© American Society for Clinical Pathology
Anatomic Pathology / Original Article
Whether S100A1 will be an exploitable therapeutic target is unclear. Our seemingly discordant observations that S100A1-expressing serous ovarian cancer tumors were of higher grade but similar prognosis, whereas among endo-metrioid histologies, S100A1 expression did not correlate with grade or stage but appeared to impart a significantly worsened prognosis, may be the coincidental result of subgroup analysis or overmatching. However, the results from the endometrial TMAs recapitulate the results from the endometrioid ovarian carcinomas, making this highly unlikely. Alternatively, the observed survival difference may represent a true decrease in the normally superior survival of endometrioid carcinomas in the group overexpressing S100A1 (to the level expected for serous or clear cell tumors), whereas the subset not expressing S100A1 retains a relatively favorable prognosis.25
This is the first report demonstrating that S100A1 is specifically and frequently overexpressed in ovarian cancer. Although expression did not uniformly correlate with known prognostic indicators such as stage, it was associated with worsened cytologic features in serous tumors and worse clini-cal outcomes for patients with endometrioid ovarian cancer. Given our findings of worsened overall prognosis in a subset of patients, the role of S100A1 in ovarian cancer biology and tumor surveillance merits further study.
From the 1Department of Laboratory Medicine and Pathology, University of Minnesota, Minneapolis; 2Cheryl Brown Ovarian Cancer Outcomes Unit, British Columbia Cancer Agency, Vancouver, Canada; and 3Division of Gynecologic Oncology, Department of Obstetrics and Gynecology, University of Minnesota.
Supported by grant R01-CA106878 from the National Institutes of Health/National Cancer Institute, Bethesda, MD, and grants from Minnesota Ovarian Cancer Alliance, Minneapolis, the Minnesota Medical Foundation, Minneapolis, CanCurables, Edina, MN, and the Minnesota Supercomputing Institute, Minneapolis.
Address reprint requests to Dr Skubitz: Dept of Laboratory Medicine and Pathology, MMC 609, 420 Delaware Street, SE, Minneapolis, MN 55455.
Acknowledgments: We thank Blake C. Gilks, MD (University of British Columbia, Vancouver, Canada), for help procuring the TMAs and critical review of the manuscript; Kaylee Schwertfeger, PhD (University of Minnesota, Minneapolis), for use of laboratory equipment and helpful discussions; Sarah Bowell, Diane Rauch, and Marissa Makey (University of Minnesota Tissue Procurement Facility, Minneapolis) for providing tissue samples; and the staff of Gene Logic, Gaithersburg, MD, for performing the gene expression experiments with the human tissue samples.
References 1. Jemal A, Siegel R, Ward E, et al. Cancer statistics, 2008. CA
Cancer J Clin. 2008;58:71-96. 2. Verheijen RHM, von Mensdorff-Pouilly S, van Kamp GJ, et al.
CA 125: fundamental and clinical aspects. Semin Cancer Biol. 1999;9:117-124.
3. Bast RC Jr, Urban N, Shridhar V, et al. Early detection of ovarian cancer: promise and reality. Cancer Treat Res. 2002;107:61-97.
in endometrioid ovarian cancer.16 Specifically, expression of HDAC1 in multivariable survival analysis inversely cor-related with relapse-free survival.16 A similar trend toward worse prognosis with HDAC1 expression in endometrioid endometrial cancers was also found.16 When analyzed with our immunohistochemical data for S100A1 staining, no significant correlation between the S100A1 and HDAC1 expression was found. Thus, the 2 markers identify different subsets of endo-metrioid ovarian cancer patients with decreased relapse-free survival. In prospective clinical trials, one could envision that tissues from patients with the endometrioid subset of ovarian cancer would be tested by immunohistochemical staining for HDAC1 and S100A1. The patients whose tissues stained posi-tively for either marker would be monitored more closely for recurrence or could be candidates for additional therapy owing to the likelihood of a decreased relapse-free survival time.
High-grade serous tumors had increased S100A1 stain-ing (66.0%) compared with low-grade serous tumors (25%). Although not fully understood, it is proposed that low- and high-grade serous tumors have different routes to pathogen-esis. Malpica et al18 found that although 60% of low-grade serous tumors were associated with a serous neoplasm of low malignant potential, only 2% of high-grade serous tumors had a similar association. Although they have similar histologic features, low- and high-grade tumors likely arise from differ-ent molecular mechanisms, which could explain the differ-ence in staining that we found in the TMAs.
The S100 family of proteins consists of more than 20 calcium-binding proteins. Binding of calcium induces a conformational change, allowing interaction with target pro-teins.29 Increased expression of S100 family members, includ-ing S100A1, has been reported in several tumors. Several groups have identified increased S100A1 expression in renal cell carcinoma, and although the functional significance is not well understood, expression may be useful in differential diagnosis among renal cell carcinoma subtypes.23,30-32 In other tissues, S100A1 is involved in muscle contraction,33-35 metabolism,36,37 and cell structure.38
The role of S100A1 in ovarian cancer is unknown, but potentiation of antiapoptotic pathways represents one possible mechanism. Exogenous S100A1 can activate the receptor for advanced glycation end products, resulting in activation of the NF-κB signaling pathway, increasing the antiapoptotic protein bcl-2 and survival.39 S100A1 can also activate the Erk1/2 sig-naling cascade, resulting in increased resistance to apoptosis.
To date, there have been no reports of S100A1 being secreted in cancer. However, bulky tumors harbor areas of central necrosis with relative hypoxemia.40,41 Necrotic cells could release S100A1, providing it to nearby cells, prevent-ing apoptosis, and imparting a survival advantage. Likewise, ovarian cancer cells are able to survive the relative hypoxia of ascitic fluid, which may provide a similar stress stimulus.42
Dow
nloaded from https://academ
ic.oup.com/ajcp/article/132/6/846/1760546 by guest on 07 August 2022

856 Am J Clin Pathol 2009;132:846-856856 DOI: 10.1309/AJCPTK87EMMIKPFS
© American Society for Clinical Pathology
DeRycke et al / S100A1 in Ovarian Cancer
24. Bell DA. Origins and molecular pathology of ovarian cancer. Mod Pathol. 2005;18(suppl 2):S19-S32.
25. Storey DJ, Rush R, Stewart M, et al. Endometrioid epithelial ovarian cancer. Cancer. 2008;112:2211-2220.
26. Sato E, Olson SH, Ahn J, et al. Intraepithelial CD8+ tumor-infiltrating lymphocytes and a high CD8+/regulatory T cell ratio are associated with favorable prognosis in ovarian cancer. Proc Natl Acad Sci U S A. 2005;102:18538-18543.
27. Hamanishi J, Mandai M, Iwasaki M, et al. Programmed cell death 1 ligand 1 and tumor-infiltrating CD8+ T lymphocytes are prognostic factors of human ovarian cancer. Proc Natl Acad Sci U S A. 2007;104:3360-3365.
28. Clarke B, Tinker AV, Lee C-H, et al. Intraepithelial T cells and prognosis in ovarian carcinoma: novel associations with stage, tumor type, and BRCA1 loss. Mod Pathol. 2008;22:393-402.
29. Donato R. S100: a multigenic family of calcium-modulated proteins of the EF-hand type with intracellular and extracellular functional roles. Int J Biochem Cell Biol. 2001;33:637-668.
30. Teratani T, Watanabe T, Kuwahara F, et al. Induced transcriptional expression of calcium-binding protein S100A1 and S100A10 genes in human renal cell carcinoma. Cancer Lett. 2002;175:71-77.
31. Li G, Gentil-Perret A, Lambert C, et al. S100A1 and KIT gene expressions in common subtypes of renal tumors. Eur J Surg Oncol. 2005;31:299-303.
32. Rocca PC, Brunelli M, Gobbo S, et al. Diagnostic utility of S100A1 expression in renal cell neoplasms: an immunohistochemical and quantitative RT-PCR study. Mod Pathol. 2007;20:722-728.
33. Baudier J, Bergeret E, Bertacchi N, et al. Interactions of myogenic bHLH transcription factors with calcium-binding calmodulin and S100a (aa) proteins. Biochemistry. 1995;34:7834-7846.
34. Heierhorst J, Kobe B, Feil SC, et al. Ca2+/S100 regulation of giant protein kinases. Nature. 1996;380:636-639.
35. Yamasaki R, Berri M, Wu Y, et al. Titin-actin interaction in mouse myocardium: passive tension modulation and its regulation by calcium/S100A1. Biophys J. 2001;81:2297-2313.
36. Zimmer DB, Van Eldik LJ. Identification of a molecular target for the calcium-modulated protein S100: Fructose-1,6-bisphosphate aldolase. J Biol Chem. 1986;261:11424-11428.
37. Zimmer DB, Dubuisson JG. Identification of an S100 target protein: glycogen phosphorylase. Cell Calcium. 1993;14:323-332.
38. Sorci G, Agneletti AL, Donato R. Effects of S100A1 and S100B on microtubule stability: an in vitro study using triton-cytoskeletons from astrocyte and myoblast cell lines. Neuroscience. 2000;99:773-783.
39. Huttunen HJ, Kuja-Panula J, Sorci G, et al. Coregulation of neurite outgrowth and cell survival by amphoterin and S100 proteins through receptor for advanced glycation end products (RAGE) activation. J Biol Chem. 2000;275:40096-40105.
40. Harris AL. Hypoxia: a key regulatory factor in tumour growth. Nat Rev Cancer. 2002;2:38-47.
41. Helmlinger G, Yuan F, Dellian M, et al. Interstitial pH and po2 gradients in solid tumors in vivo: high-resolution measurements reveal a lack of correlation. Nat Med. 1997;3:177-182.
42. Kim K-S, Sengupta S, Berk M, et al. Hypoxia enhances lysophosphatidic acid responsiveness in ovarian cancer cells and lysophosphatidic acid induces ovarian tumor metastasis in vivo. Cancer Res. 2006;66:7983-7990.
4. Hibbs K, Skubitz KM, Pambuccian SE, et al. Differential gene expression in ovarian carcinoma: identification of potential biomarkers. Am J Pathol. 2004;165:397-414.
5. Shaw TJ, Senterman MK, Dawson K, et al. Characterization of intraperitoneal, orthotopic, and metastatic xenograft models of human ovarian cancer. Mol Ther. 2004;10:1032-1042.
6. Burleson KM, Hansen LK, Skubitz APN. Ovarian carcinoma spheroids disaggregate on type I collagen and invade live human mesothelial cell monolayers. Clin Exp Metastasis. 2004;21:685-697.
7. Subramanian IV, Bui Nguyen TM, Truskinovsky AM, et al. Adeno-associated virus-mediated delivery of a mutant endostatin in combination with carboplatin treatment inhibits orthotopic growth of ovarian cancer and improves long-term survival. Cancer Res. 2006;66:4319-4328.
8. Skubitz APN, Campbell KD, Goueli S, et al. Association of [beta]1 integrin with protein kinase activity in large detergent resistant complexes. FEBS Lett. 1998;426:386-391.
9. Nicosia SV, Wilbanks GD, Saunders B, et al. Cytology of human ovarian surface epithelial brushings. Cancer. 2004;102:1-10.
10. Kruk PK, Maines-Bandiera S, Auersperg N. A simplified method to culture human ovarian surface epithelium. Lab Invest. 1990;63:132-136.
11. Skubitz APN, Pambuccian SE, Argenta PA, et al. Differential gene expression identifies subgroups of ovarian carcinoma. Transl Res. 2006;148:223-248.
12. Fronhoffs S, Totzke G, Stier S, et al. A method for the rapid construction of cRNA standard curves in quantitative real-time reverse transcription polymerase chain reaction. Mol Cell Probes. 2002;16:99-110.
13. Soslow RA. Histologic subtypes of ovarian carcinoma: an overview. Int J Gynecol Pathol. 2008;27:161-174.
14. McCluggage WG. My approach to and thoughts on the typing of ovarian carcinomas. J Clin Pathol. 2008;61:152-163.
15. Gilks CB, Ionescu DN, Kalloger SE, et al. Tumor cell type can be reproducibly diagnosed and is of independent prognostic significance in patients with maximally debulked ovarian carcinoma. Hum Pathol. 2008;39:1239-1251.
16. Weichert W, Denkert C, Noske A, et al. Expression of class I histone deacetylases indicates poor prognosis in endometrioid subtypes of ovarian and endometrial carcinomas. Neoplasia. 2008;10:1021-1027.
17. Silverberg SG. Histopathologic grading of ovarian carcinoma: a review and proposal. Int J Gynecol Pathol. 2000;19:7-15.
18. Malpica A, Deavers MT, Lu K, et al. Grading ovarian serous carcinoma using a two-tier system. Am J Surg Pathol. 2004;28:496-504.
19. Delys L, Detours V, Franc B, et al. Gene expression and the biological phenotype of papillary thyroid carcinomas. Oncogene. 2007;26:7894-7903.
20. Dubeau L. The cell of origin of ovarian epithelial tumors and the ovarian surface epithelium dogma: does the emperor have no clothes? Gynecol Oncol. 1999;72:437-442.
21. Dubeau L. The cell of origin of ovarian epithelial tumours. Lancet Oncol. 2008;9:1191-1197.
22. Boni R, Burg G, Doguoglu A, et al. Immunohistochemical localization of the Ca2+ binding S100 proteins in normal human skin and melanocytic lesions. Br J Dermatol. 1997;137:39-43.
23. Li G, Barthelemy A, Feng G, et al. S100A1: a powerful marker to differentiate chromophobe renal cell carcinoma from renal oncocytoma. Histopathology. 2007;50:642-647.
Dow
nloaded from https://academ
ic.oup.com/ajcp/article/132/6/846/1760546 by guest on 07 August 2022
Related Documents