University of St Mark and St John Sports Science Workshop Date: ………………………….

Welcome message from author
This document is posted to help you gain knowledge. Please leave a comment to let me know what you think about it! Share it to your friends and learn new things together.
Transcript

University ofSt Mark and St John
Sports Science WorkshopDate: ………………………….

Name: …………………………………………………………………………………………
1. Speed and Acceleration
Speed is one component of an individual’s power generating capacity and can be defined as the ability of the whole body, or a specific segment of the body, to generate the greatest possible velocity within a movement. Speed is a crucial factor in virtually all sports, especially explosive activities such as sprint running, long jump, javelin throwing, boxing and even golf.
Warm-up - A stringent warm-up must be undertaken before performing the sprint tests. This should last for at least 5 minutes and should include the following:
General warm up – Slow relaxed jogging. Dynamic stretching – Lunges, high knees, butt kickers, inchworms and power
skips. Sprint specific warm up – Series of moderate speed sprints that get
progressively faster. Recovery period– Active rest in preparation for all-out sprint tests.
Test protocol & data analysis
1. The participant should start from one metre behind the first timing gate, and sprint through both gates as fast as possible without decelerating before the final gate.
2. Record the time taken to cover the 20m distance to the nearest tenth of a second, and calculate speed using the following formula (speed = distance / time) (Table 1).
3. Recover for 3 minutes before initiating the next sprint, allowing energy systems replenishment.
4. Repeat stages 1-3 a further two times, to complete three trials in total.Trial Distance (m) Time (s) Speed (m/s)1 202 203 20Mean 20
Table 1
5. Multiply your body mass (kg) by 9.81 (gravity’s speed) to convert your body mass to Newtons (N). Body mass = .............................. (N)
2

6. Using the above answer, and the mean velocity from Table 1, calculate horizontal power using the following equation (power = body mass (N) x speed). Power = ........................... (N/m/s)
7. Using the following equation, calculate your acceleration (acceleration = (final speed – initial speed) / time). Acceleration = ............................. (m/s2)
8. Finally, compare your sprint time to normative data: Male 20m time = 3.01 (s) Female 20m time = 3.29 (s)
3

2. Reaction Time
The aim of this experiment is to measure simple reaction time to visual and audible signals. Reaction time is essential in nearly all sports. Simple reaction time is defined by Schmidt & Wrisberg (2000) as “The interval of time that elapses from the presentation of an unanticipated stimulus to the beginning of a person’s response”. The Batak Board can be used to measure reaction time, co-ordination and stamina.
Test protocol
Once the Batak Board is turned on press the 1 button then the E button, this will begin the Accumulator programme. Within this program random targets will light up for 60 seconds you should press the targets in the order in which they light up. The aim is to strike as many targets as possible in 60 seconds. The final score is shown on the ‘SCORE’ LED display.
Data collection and analysis
1. Record your final score below in Table 2.2. Recover for 3 minutes, and then complete a second trial.
Table 2
Trial Score12Mean
3. Calculate your mean score across the two trials and compare to normative data:
0-20 = Very poor 20-40 = Poor 40-60 = Average 60-80 = Good 80+ = Excellent
4

3. Anaerobic Peak Power
The maximum capacity of human muscle to exert force and generate power during short term dynamic exercise is of great importance for many situations. Various methods are available for the measurement of human power output, each with their own advantages and disadvantages. Simple jump mat tests can be used to estimate power output in the field situation. There are various different types of jumps that can be performed and that are performed in different sports. Most commonly used are:
A. Static jump – Start in a stationary, held squat position prior to jumping vertically
B. Countermovement jump – Start with a rapid downwards movement prior to jumping vertically.
Test protocol & data analysis1. Step on the mat and assume a position in which feet are shoulder width apart
with hands on hips.2. Depending upon the jump variation, either squat and hold the bottom
position for a count of three seconds (static) or rapidly dip hips and legs (countermovement) prior to pushing off the ground to jump as high as possible whilst keeping legs straight.
3. Bend knees on landing to absorb landing forces.4. Rest for 1-2 minutes between repetitions, completing three of each jump
variation.5. Record the flight time achieved during each jump in Table 3 and Table 4.6. Using the equation in column three, calculate the height jumped within each
trial.
Table 3 – Static jumpTrial Flight
time (s)Calculation of jump height
(9.81 x flight time x flight time) / 8 = Height (cm)123Mean
Table 4 – Countermovement jumpTrial Flight
time (s)Calculation of jump height
(9.81 x flight time x flight time) / 8 = Height (cm)123Mean
5

7. With the mean jump height for each variation, calculate peak power (W) using the following equation (peak power = 60.7 x jump height + 45.3 x body mass – 2055).
Static jump peak power = ...........................(W)Countermovement jump peak power = ................................(W)
8. Finally, compare your countermovement jump height score to normative data overleaf (Table 5).
Table 5 - Normative values for countermovement jump height
4. Strength Testing
Test protocols
A. Leg press 1. Lift bar so that it is clear of the knees at full flexion.2. Back must be tall and straight and always in contact with the backrest.3. Start with knees at 90°, press legs to full extension then slowly return to 90°
bend at knees.4. Pause before each repetition, complete 3 warm-ups followed by 3 maximal
reps.
B. Chest press1. Feet should be placed to each side, flat on the floor.2. The back must keep contact with the backrest throughout each repetition.3. The bar must be at the centre of the chest, thereby allowing a straight push.4. Start with bar touching chest. Press arms to full extension then slowly bring
back to touch chest.5. Pause before each repetition, complete 3 warm-ups followed by 3 maximal
reps.
C. Back pull
6
Rating Male (cm) Female (cm) excellent > 70 > 60
very good 61-70 51-60
above average 51-60 41-50
average 41-50 31-40
below average 31-40 21-30
poor 21-30 11-20
very poor < 21 < 11

1. Feet should be placed behind the bar on the floor under the seat to discourage use of the body.
2. Handle height should be set to allow a straight pull to the lower ribs and handles held vertically.
3. The chest should remain in contact with the bench throughout the exercise.4. Start with arms out stretched. Pull handles as far back as is comfortable then
slowly push back to full arm extension.5. Pause before each repetition, complete 3 warm-ups followed by 3 maximal
reps.
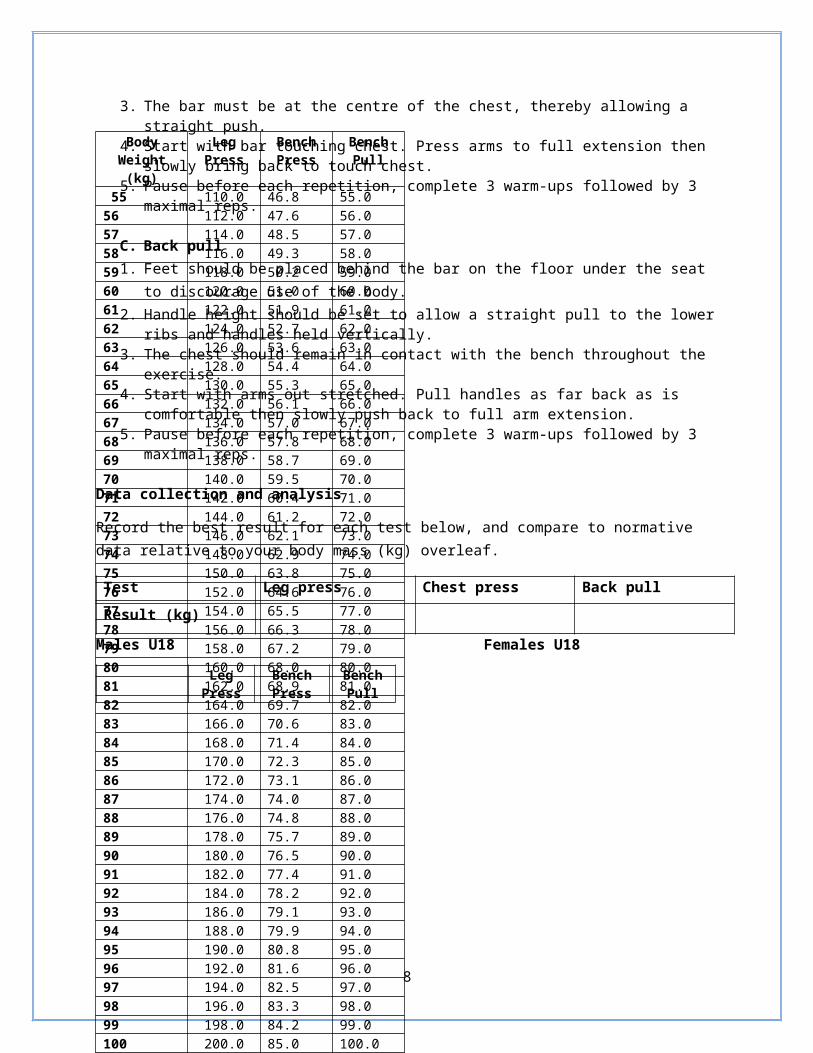
Data collection and analysis
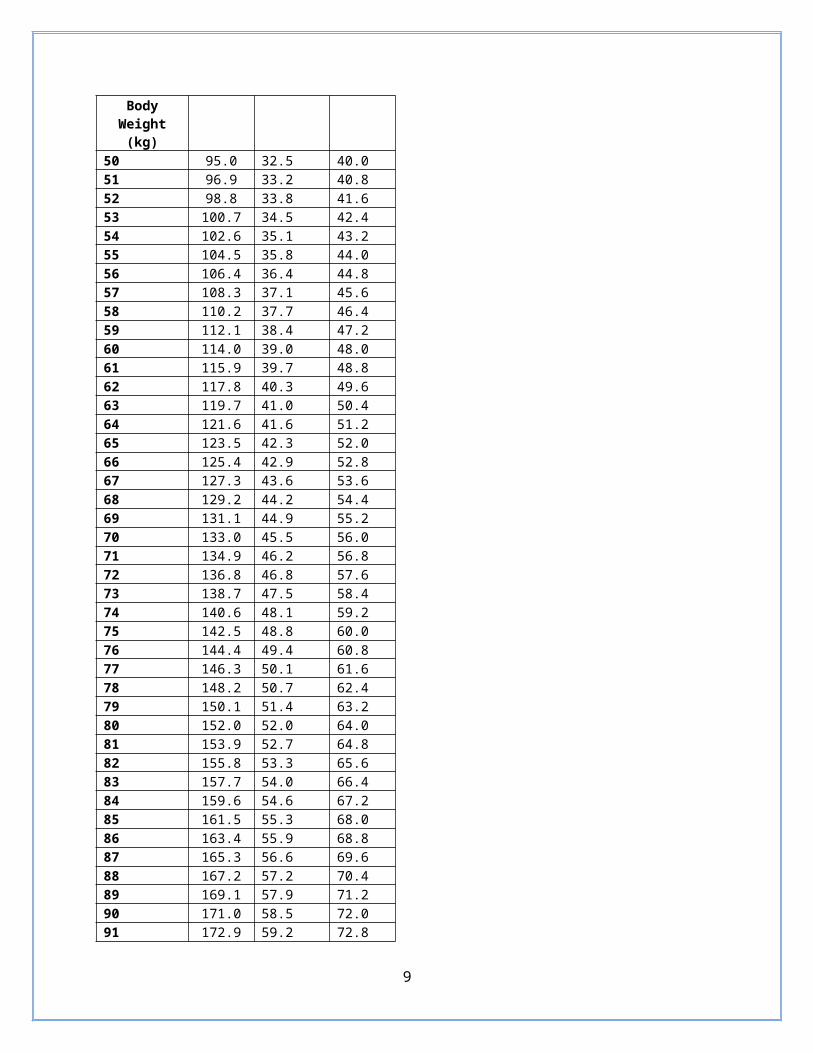
Record the best result for each test below, and compare to normative data relative to your body mass (kg) overleaf.
Test Leg press Chest press Back pullResult (kg)
Males U18 Females U18Leg
PressBench Press
Bench Pull
7
Body Weight
(kg)
Leg Press
Bench Press
Bench Pull
55 110.0 46.8 55.056 112.0 47.6 56.057 114.0 48.5 57.058 116.0 49.3 58.059 118.0 50.2 59.060 120.0 51.0 60.061 122.0 51.9 61.062 124.0 52.7 62.063 126.0 53.6 63.064 128.0 54.4 64.065 130.0 55.3 65.066 132.0 56.1 66.067 134.0 57.0 67.068 136.0 57.8 68.069 138.0 58.7 69.070 140.0 59.5 70.071 142.0 60.4 71.072 144.0 61.2 72.073 146.0 62.1 73.074 148.0 62.9 74.075 150.0 63.8 75.076 152.0 64.6 76.077 154.0 65.5 77.078 156.0 66.3 78.079 158.0 67.2 79.080 160.0 68.0 80.081 162.0 68.9 81.082 164.0 69.7 82.083 166.0 70.6 83.084 168.0 71.4 84.085 170.0 72.3 85.086 172.0 73.1 86.087 174.0 74.0 87.088 176.0 74.8 88.089 178.0 75.7 89.090 180.0 76.5 90.091 182.0 77.4 91.092 184.0 78.2 92.093 186.0 79.1 93.094 188.0 79.9 94.095 190.0 80.8 95.096 192.0 81.6 96.097 194.0 82.5 97.098 196.0 83.3 98.099 198.0 84.2 99.0100 200.0 85.0 100.0
Body Weight
(kg)50 95.0 32.5 40.051 96.9 33.2 40.852 98.8 33.8 41.653 100.7 34.5 42.454 102.6 35.1 43.255 104.5 35.8 44.056 106.4 36.4 44.857 108.3 37.1 45.658 110.2 37.7 46.459 112.1 38.4 47.260 114.0 39.0 48.061 115.9 39.7 48.862 117.8 40.3 49.663 119.7 41.0 50.464 121.6 41.6 51.265 123.5 42.3 52.066 125.4 42.9 52.867 127.3 43.6 53.668 129.2 44.2 54.469 131.1 44.9 55.270 133.0 45.5 56.071 134.9 46.2 56.872 136.8 46.8 57.673 138.7 47.5 58.474 140.6 48.1 59.275 142.5 48.8 60.076 144.4 49.4 60.877 146.3 50.1 61.678 148.2 50.7 62.479 150.1 51.4 63.280 152.0 52.0 64.081 153.9 52.7 64.882 155.8 53.3 65.683 157.7 54.0 66.484 159.6 54.6 67.285 161.5 55.3 68.086 163.4 55.9 68.887 165.3 56.6 69.688 167.2 57.2 70.489 169.1 57.9 71.290 171.0 58.5 72.091 172.9 59.2 72.892 174.8 59.8 73.693 176.7 60.5 74.494 178.6 61.1 75.295 180.5 61.8 76.0
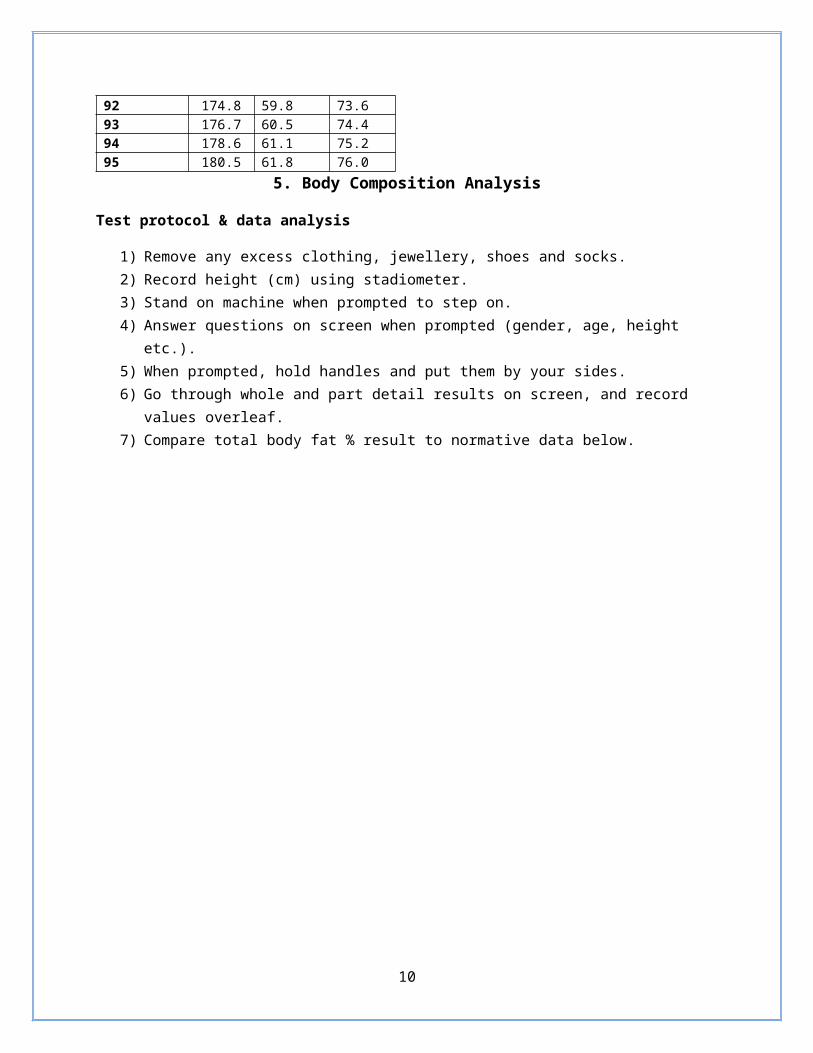
5. Body Composition Analysis
Test protocol & data analysis
8
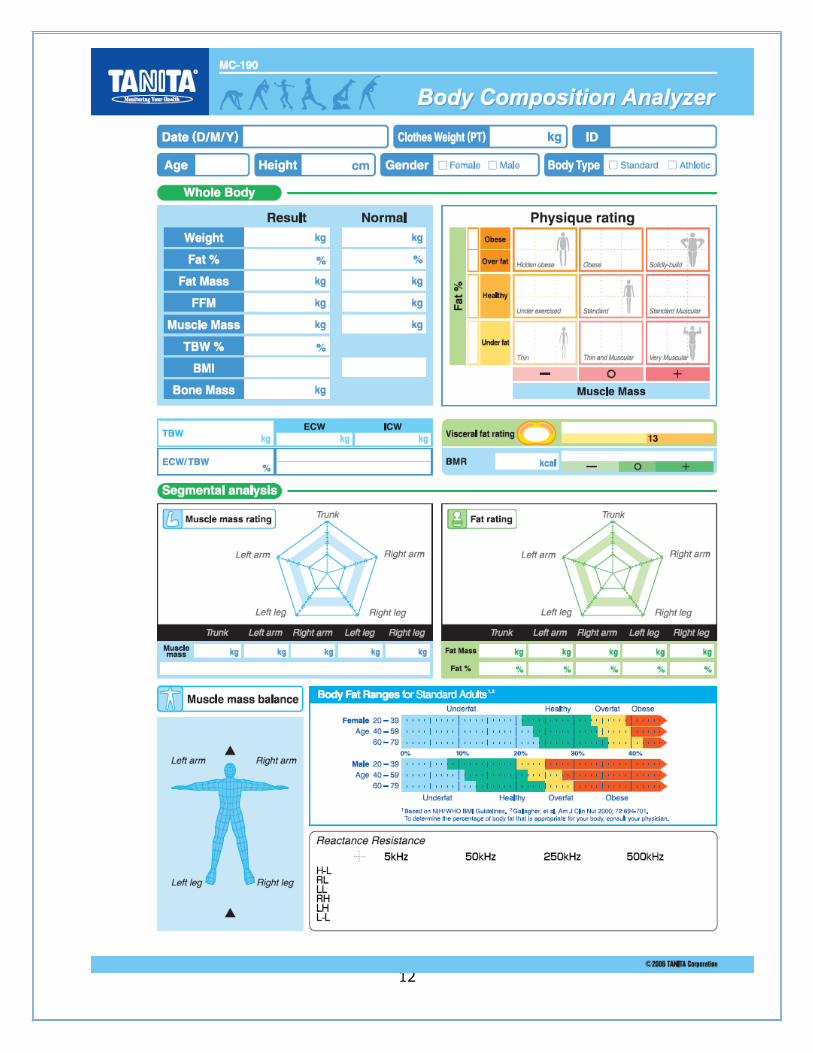
1) Remove any excess clothing, jewellery, shoes and socks.2) Record height (cm) using stadiometer.3) Stand on machine when prompted to step on.4) Answer questions on screen when prompted (gender, age, height etc.).5) When prompted, hold handles and put them by your sides.6) Go through whole and part detail results on screen, and record values
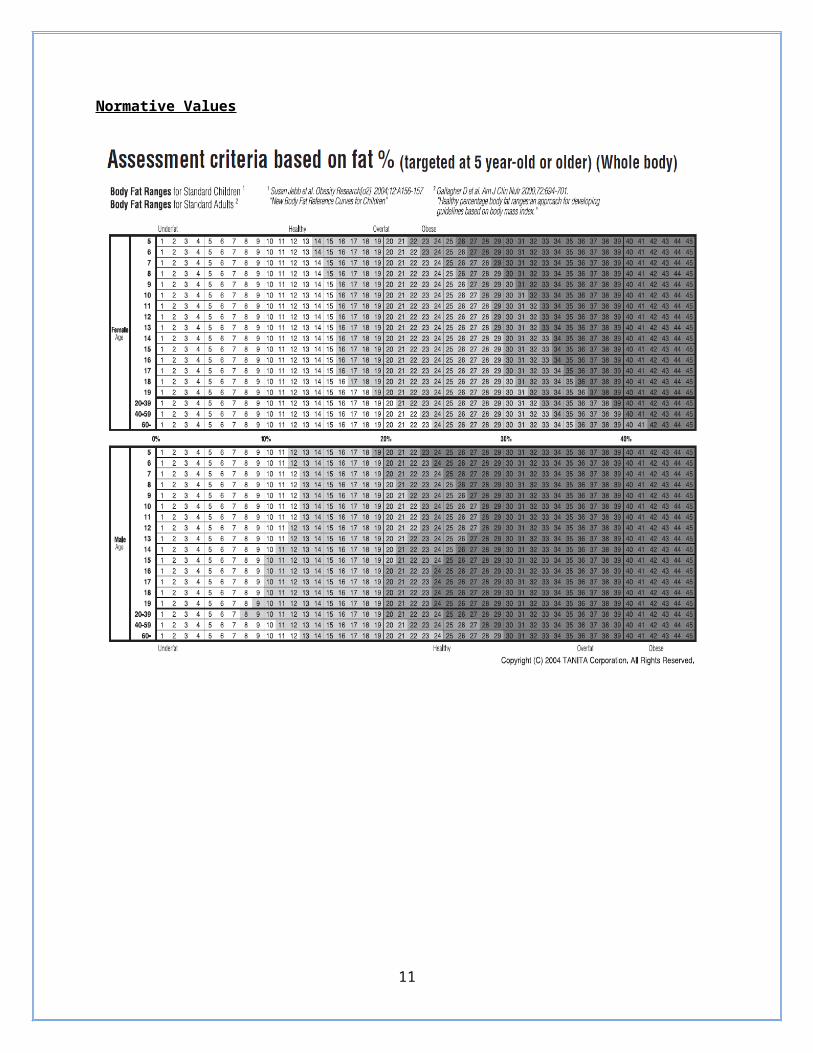
overleaf.7) Compare total body fat % result to normative data below.
Normative Values
9
10
6. The Wingate Test (WAnT) – Anaerobic capacity
Introduction
Despite advances in testing anaerobic power and the common acceptance by coaches and scientists that efforts of short duration and maximum intensity are highly dependent on anaerobic energy production mechanisms, routine testing is not a common feature in the sports science lab.
The rate at which anaerobic metabolism can supply power is dependent upon time as a factor:
Short term anaerobic performance capacity (~10s) ATP-CP (alactic) system. Intermediate anaerobic performance capacity (~30s) (lactic 70% alactic 15%
and aerobic 15%). Long term anaerobic performance (~90s). Supported similarly by anaerobic and
aerobic systems.
Test protocol & data analysis
1. Record subject’s height (cm) and mass (kg)2. Complete a 3 minute warm-up against ~20% of the resistance to be used for the
test, at the end of each minute perform a 5 second sprint.3. The subject should then rest or slowly cycle against minimal resistance for 2
minutes.4. With the command “start” subjects pedal as fast as possible against a low
resistance to overcome inertial resistance etc of flywheel.5. The full load (7.5% of body mass) is then applied to start the test.6. The subject is then required to maximally cycle for 30 seconds.7. Following the test, to prevent dizziness etc. pedal against light resistance for 2-3
min.8. Record individual results into Table 6 below, and compare to normative values
for peak power and mean power overleaf.
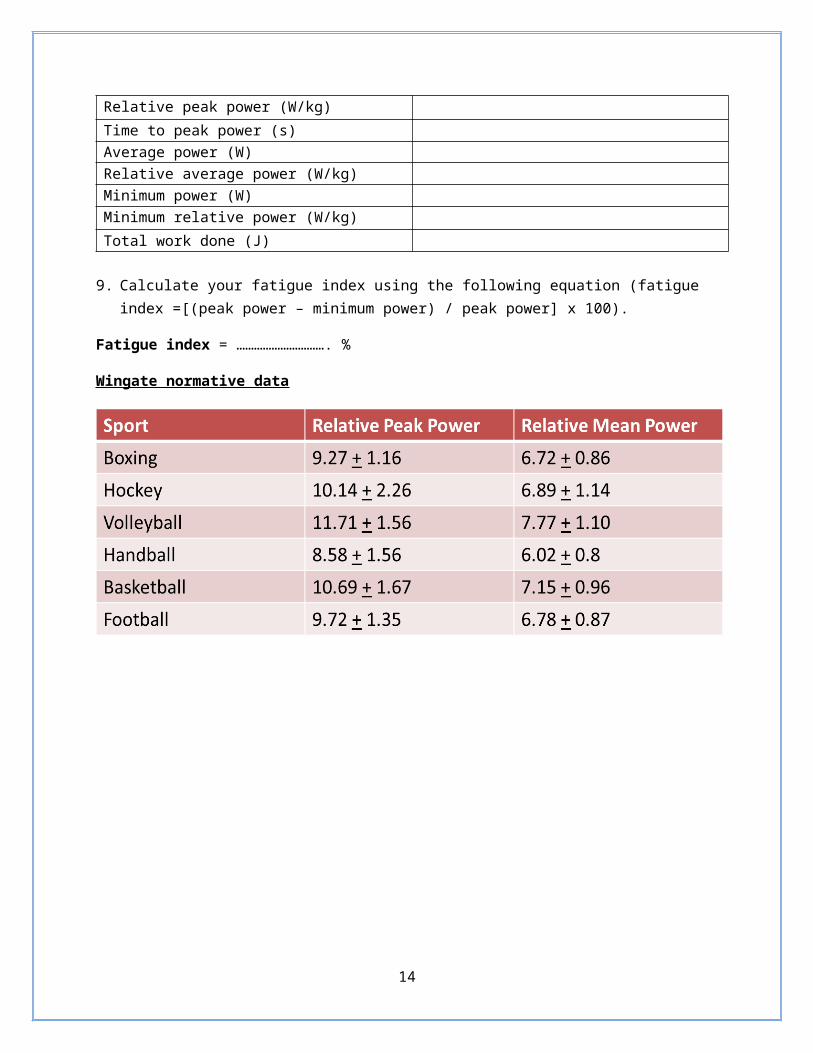
Table 6
Measure ResultPeak power (W)Relative peak power (W/kg)Time to peak power (s)Average power (W)Relative average power (W/kg)Minimum power (W)Minimum relative power (W/kg)Total work done (J)
11
9. Calculate your fatigue index using the following equation (fatigue index =[(peak power – minimum power) / peak power] x 100).
Fatigue index = …………………………. %
Wingate normative data
12

7. Maximal Aerobic Capacity (VO2max)
Maximal aerobic capacity (VO2max) is regarded as one of the best single indicators of cardio-respiratory performance. The rate at which aerobic metabolism can supply power is dependent on two factors:
The chemical ability of the tissues to use oxygen for substrate utilisation The abilities of several mechanisms (pulmonary, cardiac, vascular and
cellular) to transport oxygen to active skeletal musculature
Evaluating aerobic capacity can help determine the following:
The current readiness/suitability of an athlete to perform a given event The emphasis that should be placed on aerobic or other types of training The type of aerobic training that should be performed
Test protocol
The protocol is continuous whereby the subject will run at a constant speed throughout the test. The test demands should be such that exhaustion is achieved within 9 – 15 minutes of continuous exercise.
1. Record height and weight.2. Put on heart rate (HR) monitor.3. Put on mask, ensuring no expired air can escape, and let participant familiarise
themselves with breathing through the mask.4. Participant warms up at a speed of 8km.h-1 and 0% incline for approximately 3-4
minutes.5. Following the warm-up, the treadmill should be set to the initial test speed
(which is dependent on the participant) and at an incline grade of 0%.6. At the end of each 2 minute stage, record HR, RPE, VO2, RER, and VE.7. The work gradient increases every 2 minutes by 2.5% until the participant
reaches the point of exhaustion, or when no further increases in oxygen uptake are observed, i.e. VO2 plateau for at least 1 minute.
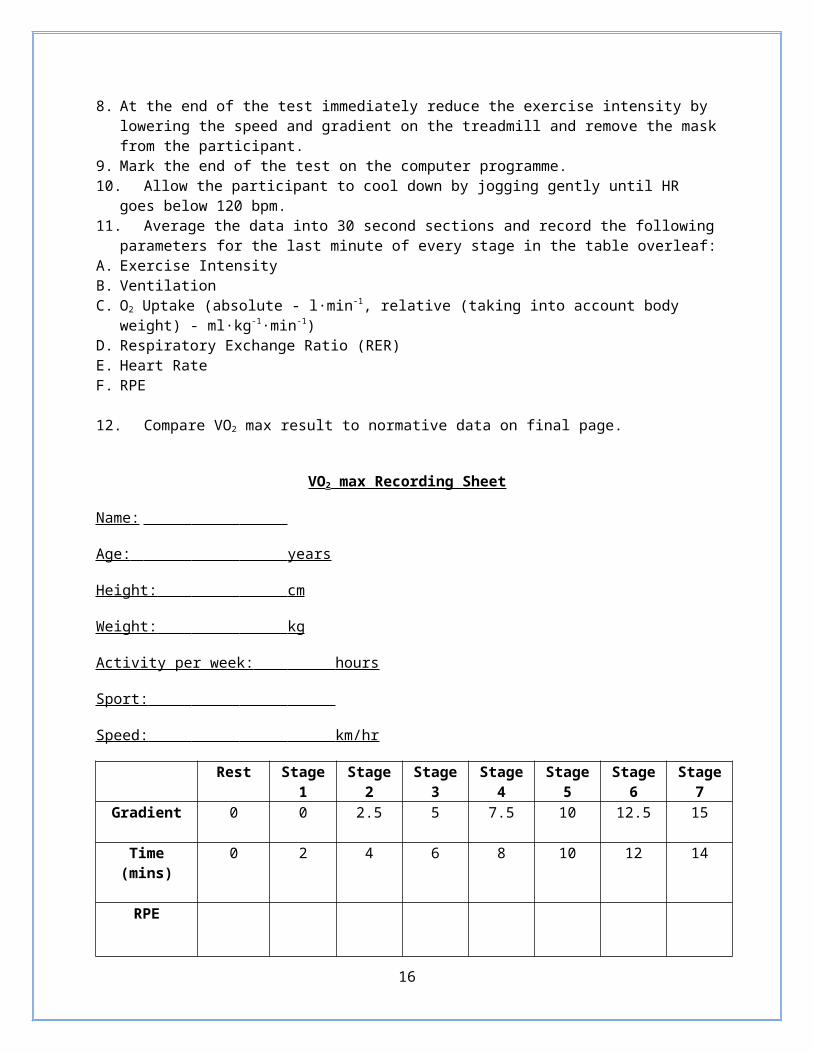
8. At the end of the test immediately reduce the exercise intensity by lowering the speed and gradient on the treadmill and remove the mask from the participant.
9. Mark the end of the test on the computer programme.10.Allow the participant to cool down by jogging gently until HR goes below 120
bpm.11.Average the data into 30 second sections and record the following parameters
for the last minute of every stage in the table overleaf:A. Exercise IntensityB. VentilationC. O2 Uptake (absolute - l·min-1, relative (taking into account body weight) - ml·kg-
1·min-1)D. Respiratory Exchange Ratio (RER)E. Heart RateF. RPE
13
12.Compare VO2 max result to normative data on final page.
VO2 max Recording Sheet
Name:
Age: years
Height: cm
Weight: kg
Activity per week: hours
Sport:
Speed: km/hr
Rest Stage 1
Stage 2
Stage 3
Stage 4
Stage 5
Stage 6
Stage 7
Gradient 0 0 2.5 5 7.5 10 12.5 15
Time (mins)
0 2 4 6 8 10 12 14
RPE
HR (bpm)
Ventilation
VO2(ml·kg-
1·min-1)RER
VO2 max test - Termination criteria
In order to be satisfied the subject has reached VO2 max, they must meet the following criteria:
1. A final respiratory exchange ratio (RER) of 1.15 or above.
14

2. A final heart rate of within 10 beats·min-1 of the predicted age-related maximum. (Maximum heart rate can be estimated from the formula: Maximal Heart Rate = 220-age (years)).
3. A post-exercise blood lactate concentration of 8mmol·l-1 or more.4. Subjective signs of fatigue and volitional exhaustion.5. A rating of perceived exertion (RPE) of 19 or 20 on the Borg scale.
15
Normative data - VO2 max
Normative data – VO2 max relative to different sports
Ranges (ml·kg-1·min-1)SPORT MALES FEMALES
Nordic SkiingMiddle distance runningDistance runningRowing CyclingSwimmingFootballFigure skatingWrestlingGymnasticsIce hockeyField hockeyBasketballAmerican FootballBaseball
69-9570-8665-8058-7456-7254-7050-70
-50-7048-7445-6539-4945-6540-6040-60
56-74-
55-7248-68
-48-68
-42-54
-38-48
--
42-54--
16
Related Documents