o l u m b i a R i v e r C r o s s I n g F e a s i b i l i t y S t u d y SR-35 Crossing Public Opinion SR-35 Crossing Public Opinion Survey Results Survey Results December 6, 2001 December 6, 2001

S R – 3 5 C o l u m b i a R i v e r C r o s s I n g F e a s i b i l i t y S t u d y SR-35 Crossing Public Opinion Survey Results December 6, 2001.
Dec 18, 2015
Welcome message from author
This document is posted to help you gain knowledge. Please leave a comment to let me know what you think about it! Share it to your friends and learn new things together.
Transcript

S R – 3 5 C o l u m b i a R i v e r C r o s s I n g F e a s i b i l i t y S t u d y
SR-35 Crossing Public Opinion SR-35 Crossing Public Opinion Survey ResultsSurvey Results
December 6, 2001December 6, 2001

P u b l i c O p i n i o n S u r v e yP u b l i c O p i n i o n S u r v e yS R – 3 5 C o l u m b i a R i v e r C r o s s I n g F e a s i b i l i t S R – 3 5 C o l u m b i a R i v e r C r o s s I n g F e a s i b i l i t
y S t u d yy S t u d y
Survey PurposeSurvey Purpose
Scientifically valid sample of public Scientifically valid sample of public opinionopinion
Measure perceived need for a new or Measure perceived need for a new or improved crossingimproved crossing
Determine location preference for new Determine location preference for new or improved crossing or improved crossing
Assess opinions on tolls and financing Assess opinions on tolls and financing optionsoptions

P u b l i c O p i n i o n S u r v e yP u b l i c O p i n i o n S u r v e yS R – 3 5 C o l u m b i a R i v e r C r o s s I n g F e a s i b i l i t S R – 3 5 C o l u m b i a R i v e r C r o s s I n g F e a s i b i l i t
y S t u d yy S t u d y
Research MethodologyResearch Methodology
Two survey efforts: Two survey efforts: – Motorist Intercept Study (255 respondents over 2 Motorist Intercept Study (255 respondents over 2
days - Sunday and Monday) days - Sunday and Monday)
– Telephone Survey (200 OR and 200 WA Telephone Survey (200 OR and 200 WA respondents)respondents)
Both surveys conducted in October 2001Both surveys conducted in October 2001
Phone survey respondents randomly Phone survey respondents randomly sampledsampled
Very high cooperation rates for both studiesVery high cooperation rates for both studies
Captured bridge users and non-usersCaptured bridge users and non-users

P u b l i c O p i n i o n S u r v e yP u b l i c O p i n i o n S u r v e yS R – 3 5 C o l u m b i a R i v e r C r o s s I n g F e a s i b i l i t S R – 3 5 C o l u m b i a R i v e r C r o s s I n g F e a s i b i l i t
y S t u d yy S t u d y
Research Summary HighlightsResearch Summary Highlights
Majority of those surveyed want an Majority of those surveyed want an improved crossingimproved crossing
Support for new crossing is higher in Support for new crossing is higher in Washington than in OregonWashington than in Oregon
Support for new crossing increases Support for new crossing increases with existing bridge frequency of usewith existing bridge frequency of use

P u b l i c O p i n i o n S u r v e yP u b l i c O p i n i o n S u r v e yS R – 3 5 C o l u m b i a R i v e r C r o s s I n g F e a s i b i l i t S R – 3 5 C o l u m b i a R i v e r C r o s s I n g F e a s i b i l i t
y S t u d yy S t u d y
Research Summary HighlightsResearch Summary Highlights
Mixed opinions on where new crossing Mixed opinions on where new crossing should go; highest support for current should go; highest support for current locationlocation
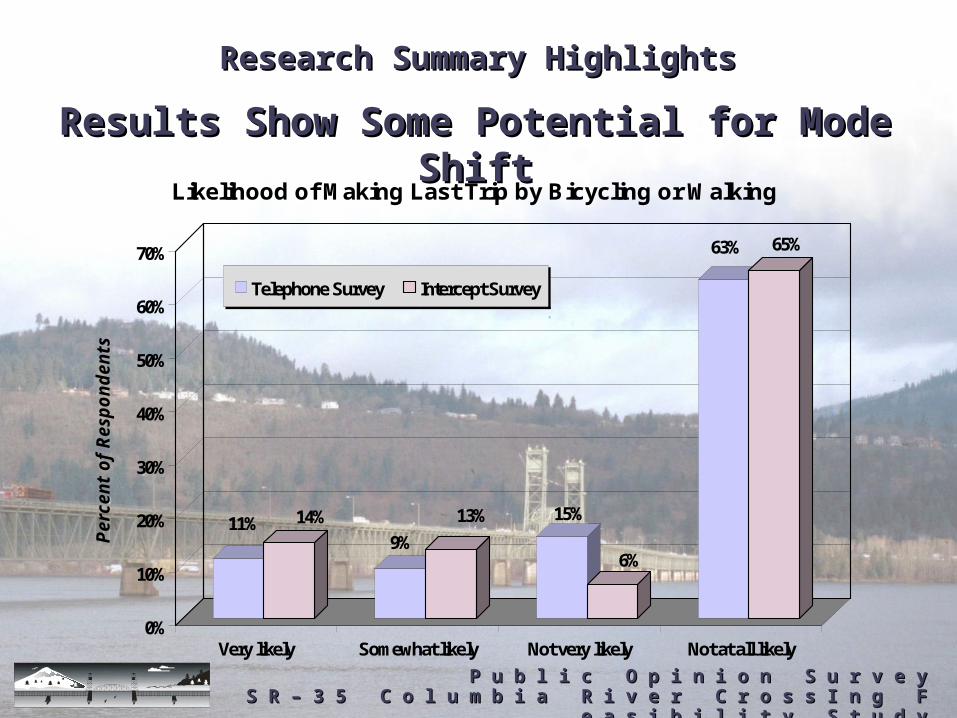
Majority stated they would not have Majority stated they would not have made last bridge trip by walking or bikingmade last bridge trip by walking or biking– Yet 10-20% may likely have traveled by Yet 10-20% may likely have traveled by
bike/pedestrian modes if given the bike/pedestrian modes if given the opportunityopportunity
Many bridge trips are for non-work Many bridge trips are for non-work purposespurposes

P u b l i c O p i n i o n S u r v e yP u b l i c O p i n i o n S u r v e yS R – 3 5 C o l u m b i a R i v e r C r o s s I n g F e a s i b i l i t S R – 3 5 C o l u m b i a R i v e r C r o s s I n g F e a s i b i l i t
y S t u d yy S t u d y
Public Supports a New CrossingPublic Supports a New Crossing
63%61%
25% 23%
3%7% 7%
6%2% 3%
0%
10%
20%
30%
40%
50%
60%
70%
Per
cen
t o
f R
esp
on
den
ts
Great need Somewhat of aneed
Not much of aneed
No need at all Don't know
Perceived Need for a New or Improved Crossing
Intercept survey Telephone survey
Research Summary HighlightsResearch Summary Highlights
P u b l i c O p i n i o n S u r v e yP u b l i c O p i n i o n S u r v e yS R – 3 5 C o l u m b i a R i v e r C r o s s I n g F e a s i b i l i t S R – 3 5 C o l u m b i a R i v e r C r o s s I n g F e a s i b i l i t
y S t u d yy S t u d y
Results Show Some Potential for Mode Results Show Some Potential for Mode ShiftShift
11% 14%
9%
13% 15%
6%
63% 65%
0%
10%
20%
30%
40%
50%
60%
70%
Perc
en
t o
f R
esp
on
den
ts
Very likely Somewhat likely Not very likely Not at all likely
Likelihood of Making Last Trip by Bicycling or Walking
Telephone Survey Intercept Survey
Research Summary HighlightsResearch Summary Highlights

P u b l i c O p i n i o n S u r v e yP u b l i c O p i n i o n S u r v e yS R – 3 5 C o l u m b i a R i v e r C r o s s I n g F e a s i b i l i t S R – 3 5 C o l u m b i a R i v e r C r o s s I n g F e a s i b i l i t
y S t u d yy S t u d y
Tolls and Financing OptionsTolls and Financing Options
All respondents asked about All respondents asked about willingness to pay a higher toll for most willingness to pay a higher toll for most recent triprecent trip
Phone survey respondents received Phone survey respondents received additional questions on tollsadditional questions on tolls
Phone survey respondents also asked Phone survey respondents also asked whether they support combinations of whether they support combinations of taxes and tollstaxes and tolls
Research Summary HighlightsResearch Summary Highlights

P u b l i c O p i n i o n S u r v e yP u b l i c O p i n i o n S u r v e yS R – 3 5 C o l u m b i a R i v e r C r o s s I n g F e a s i b i l i t S R – 3 5 C o l u m b i a R i v e r C r o s s I n g F e a s i b i l i t
y S t u d yy S t u d y
Willingness by All to Pay Higher Willingness by All to Pay Higher TollsTolls
100% 100%
88%
76%
62%
48% 50%
38%
0%
10%
20%
30%
40%
50%
60%
70%
80%
90%
100%
Perc
en
t o
f R
esp
on
den
ts
$0.75(Existing Toll)
$1.00 $1.50 $2.00
Intercepted Bridge Users (current trip) vs. Phone Survey Respondents (most recent trip)
Intercept Respondents
Phone Survey Trip Makers*
*Note: Excludes those whom had not used the bridge in the past week
Research Summary HighlightsResearch Summary Highlights

P u b l i c O p i n i o n S u r v e yP u b l i c O p i n i o n S u r v e yS R – 3 5 C o l u m b i a R i v e r C r o s s I n g F e a s i b i l i t S R – 3 5 C o l u m b i a R i v e r C r o s s I n g F e a s i b i l i t
y S t u d yy S t u d y
Willingness to Pay Tolls by Frequency of Willingness to Pay Tolls by Frequency of UseUse
— 100% —
89%
77%
88%
75%
62%
49%
61%
46%50%
38%
50%
40%
0%
10%
20%
30%
40%
50%
60%
70%
80%
90%
100%
Perc
en
t o
f R
esp
on
den
ts
$0.75(Existing Toll)
$1.00 $1.50 $2.00
Willingness to Pay Tolls by Trip Frequency:Motorist Intercept vs. Phone Survey Respondents
1-9 crossings/week (Intercept Survey)
1-9 crossings/week (Phone Survey)*
10+ crossings/week (Intercept Survey)
10+ crossings/week (Phone Survey)*
*Note: 1/3 of phone respondents had not used the bridge in the past week
Research Summary HighlightsResearch Summary Highlights

P u b l i c O p i n i o n S u r v e yP u b l i c O p i n i o n S u r v e yS R – 3 5 C o l u m b i a R i v e r C r o s s I n g F e a s i b i l i t S R – 3 5 C o l u m b i a R i v e r C r o s s I n g F e a s i b i l i t
y S t u d yy S t u d y
Intercept and Phone Survey Intercept and Phone Survey Toll Opinion DifferencesToll Opinion Differences
Respondents from both surveys have Respondents from both surveys have about about equalequal willingness to pay higher tolls for most willingness to pay higher tolls for most recent triprecent trip
Trip frequency does not impact willingness to Trip frequency does not impact willingness to paypay
WA WA phonephone respondents respondents less willing less willing to pay higher to pay higher tolls for tolls for most recent tripmost recent trip than OR respondents than OR respondents
No difference No difference in willingness to pay higher tolls in willingness to pay higher tolls between WA and OR between WA and OR interceptedintercepted bridge users bridge users
PhonePhone respondents using the bridge in the past respondents using the bridge in the past week were week were less willingless willing to have paid a higher toll to have paid a higher toll than than interceptedintercepted bridge users. bridge users.

S R – 3 5 C o l u m b i a R i v e r C r o s s I n g F e a s i b i l i t y S t u d y
Motorist Intercept Study Motorist Intercept Study FindingsFindings

P u b l i c O p i n i o n S u r v e yP u b l i c O p i n i o n S u r v e yS R – 3 5 C o l u m b i a R i v e r C r o s s I n g F e a s i b i l i t S R – 3 5 C o l u m b i a R i v e r C r o s s I n g F e a s i b i l i t
y S t u d yy S t u d y
Motorist Intercept StudyMotorist Intercept Study
Conducted over two days:Conducted over two days:– Sunday October 21 Sunday October 21
– Monday October 22Monday October 22
Bridge users intercepted in both Bridge users intercepted in both directionsdirections
Respondents given free trip for Respondents given free trip for participationparticipation
P u b l i c O p i n i o n S u r v e yP u b l i c O p i n i o n S u r v e yS R – 3 5 C o l u m b i a R i v e r C r o s s I n g F e a s i b i l i t S R – 3 5 C o l u m b i a R i v e r C r o s s I n g F e a s i b i l i t
y S t u d yy S t u d y
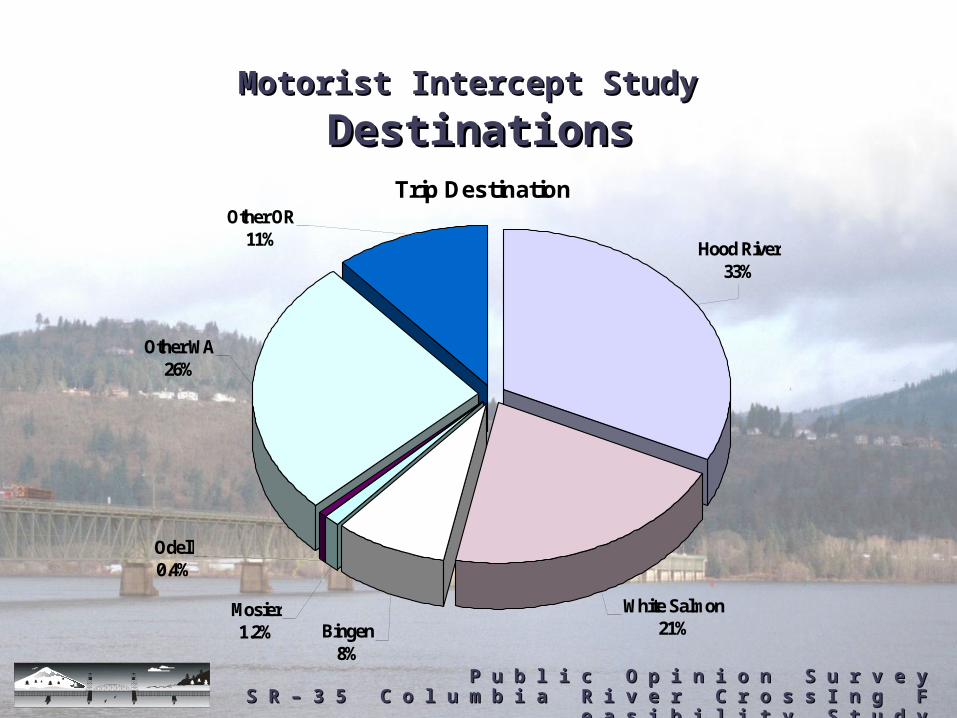
Motorist Intercept Survey
Trip Destination
Other WA26%
Hood River33%
White Salmon21%Bingen
8%
Mosier1.2%
Odell0.4%
Other OR11%
Motorist Intercept StudyMotorist Intercept Study DestinationsDestinations

P u b l i c O p i n i o n S u r v e yP u b l i c O p i n i o n S u r v e yS R – 3 5 C o l u m b i a R i v e r C r o s s I n g F e a s i b i l i t S R – 3 5 C o l u m b i a R i v e r C r o s s I n g F e a s i b i l i t
y S t u d yy S t u d y
Motorist Intercept StudyMotorist Intercept Study Destinations by PurposeDestinations by Purpose
35%
32%
23%
19%
13%
6%
1% 1% 0% 0.6%
18%
30%
9%12%
0%
5%
10%
15%
20%
25%
30%
35%
40%
Per
cen
t o
f R
esp
on
den
ts
Hood River WhiteSalmon
Bingen Mosier Odell Other WA Other OR
Trip Destination by Trip Purpose
Commute/business Shopping/visit/leisure

P u b l i c O p i n i o n S u r v e yP u b l i c O p i n i o n S u r v e yS R – 3 5 C o l u m b i a R i v e r C r o s s I n g F e a s i b i l i t S R – 3 5 C o l u m b i a R i v e r C r o s s I n g F e a s i b i l i t
y S t u d yy S t u d y
Motorist Intercept StudyMotorist Intercept Study Destinations by UsageDestinations by Usage
27%
38%
14%
28%
10%
6%7%
2% 0% 0.8%
34%
18%14%
7%
0%
5%
10%
15%
20%
25%
30%
35%
40%
45%
Per
cen
t o
f R
esp
on
den
ts
Hood River WhiteSalmon
Bingen Mosier Odell Other WA Other OR
Trip Destination by Trip Frequency
1-9 one-way trips per week
10+ one-way trips per week

P u b l i c O p i n i o n S u r v e yP u b l i c O p i n i o n S u r v e yS R – 3 5 C o l u m b i a R i v e r C r o s s I n g F e a s i b i l i t S R – 3 5 C o l u m b i a R i v e r C r o s s I n g F e a s i b i l i t
y S t u d yy S t u d y
Motorist Intercept StudyMotorist Intercept Study
Bridge Users Want a New Bridge Users Want a New CrossingCrossing
63%
25%
3%
7%2%
0%
10%
20%
30%
40%
50%
60%
70%
Perc
en
t o
f R
esp
on
den
ts
Great need Somewhatof a need
Not much ofa need
No need atall
Don't know
Perceived Need for a New Crossing

P u b l i c O p i n i o n S u r v e yP u b l i c O p i n i o n S u r v e yS R – 3 5 C o l u m b i a R i v e r C r o s s I n g F e a s i b i l i t S R – 3 5 C o l u m b i a R i v e r C r o s s I n g F e a s i b i l i t
y S t u d yy S t u d y
Motorist Intercept StudyMotorist Intercept Study Support From Frequent & Non-Frequent Support From Frequent & Non-Frequent
UsersUsers
71%
55%
21%
28%
2%5%
7% 8%
0% 3%
0%
10%
20%
30%
40%
50%
60%
70%
80%
Per
cen
t o
f R
esp
on
den
ts
Great need Somewhat of aneed
Not much of aneed
No need at all Don't know
Perceived Need for a New/Improved Crossing by Usage
10+ one-way trips per week1-9 one-way trips per week

P u b l i c O p i n i o n S u r v e yP u b l i c O p i n i o n S u r v e yS R – 3 5 C o l u m b i a R i v e r C r o s s I n g F e a s i b i l i t S R – 3 5 C o l u m b i a R i v e r C r o s s I n g F e a s i b i l i t
y S t u d yy S t u d y
Motorist Intercept StudyMotorist Intercept Study Mixed Opinions from Intercepted Users as Mixed Opinions from Intercepted Users as
to Where New Crossing Should Goto Where New Crossing Should Go
23% 23%
42%
12%
0%
5%
10%
15%
20%
25%
30%
35%
40%
45%
Perc
en
t o
f R
esp
on
den
ts
1/2 mile west 3/4 mile east same location don't know
Location Preference for a New Crossing

P u b l i c O p i n i o n S u r v e yP u b l i c O p i n i o n S u r v e yS R – 3 5 C o l u m b i a R i v e r C r o s s I n g F e a s i b i l i t S R – 3 5 C o l u m b i a R i v e r C r o s s I n g F e a s i b i l i t
y S t u d yy S t u d y
Motorist Intercept StudyMotorist Intercept Study Less-Frequent Users Support Current Less-Frequent Users Support Current
LocationLocation
21%25%
15%
32%
49%
35%
15%
8%
0%
5%
10%
15%
20%
25%
30%
35%
40%
45%
50%
Per
cen
t o
f R
esp
on
den
ts
1/2 mile west 3/4 mile east same location don't know
Location Preference for a New Crossing by Usage
1-9 one-way trips per week
10+ one-way trips per week

P u b l i c O p i n i o n S u r v e yP u b l i c O p i n i o n S u r v e yS R – 3 5 C o l u m b i a R i v e r C r o s s I n g F e a s i b i l i t S R – 3 5 C o l u m b i a R i v e r C r o s s I n g F e a s i b i l i t
y S t u d yy S t u d y
MMotorist Intercept Studyotorist Intercept Study Weekday Users More Likely to Pay Weekday Users More Likely to Pay
Higher TollHigher Toll
100% 100%
84%
94%
57%
68%
42%
60%
0%
10%
20%
30%
40%
50%
60%
70%
80%
90%
100%
Per
cen
t o
f R
esp
on
den
ts
$0.75(Existing Toll)
$1.00 $1.50 $2.00
Willingness to Pay a Higher Toll for Current Trip by Survey Day (Weekday/Weekend)
Sunday Monday

P u b l i c O p i n i o n S u r v e yP u b l i c O p i n i o n S u r v e yS R – 3 5 C o l u m b i a R i v e r C r o s s I n g F e a s i b i l i t S R – 3 5 C o l u m b i a R i v e r C r o s s I n g F e a s i b i l i t
y S t u d yy S t u d y
Motorist Intercept StudyMotorist Intercept Study Willingness to Pay Tolls About Same by Willingness to Pay Tolls About Same by
StateState
100% 100%
86%91%
63%60%
51%49%
0%
10%
20%
30%
40%
50%
60%
70%
80%
90%
100%
Per
cen
t o
f R
esp
on
den
ts
$0.75(Existing Toll)
$1.00 $1.50 $2.00
Willingness to Pay a Higher Toll for Current Trip by State of Residence
WA Residents (Intercept Survey)
OR Residents (Intercept Survey)

P u b l i c O p i n i o n S u r v e yP u b l i c O p i n i o n S u r v e yS R – 3 5 C o l u m b i a R i v e r C r o s s I n g F e a s i b i l i t S R – 3 5 C o l u m b i a R i v e r C r o s s I n g F e a s i b i l i t
y S t u d yy S t u d y
Motorist Intercept StudyMotorist Intercept Study Higher Willingness to Pay for Work Higher Willingness to Pay for Work
PurposesPurposes
— 100% —
95%
85%
68%
58%62%
44%
0%
10%
20%
30%
40%
50%
60%
70%
80%
90%
100%
Per
cen
t o
f R
esp
on
den
ts
$0.75(Existing Toll)
$1.00 $1.50 $2.00
Willingness to Pay Tolls by Trip Purpose
Commute/ Business
Shopping/ Visiting/ Leisure

S R – 3 5 C o l u m b i a R i v e r C r o s s I n g F e a s i b i l i t y S t u d y
Telephone Survey FindingsTelephone Survey Findings

P u b l i c O p i n i o n S u r v e yP u b l i c O p i n i o n S u r v e yS R – 3 5 C o l u m b i a R i v e r C r o s s I n g F e a s i b i l i t S R – 3 5 C o l u m b i a R i v e r C r o s s I n g F e a s i b i l i t
y S t u d yy S t u d y
Telephone SurveyTelephone Survey
Conducted during October 2001Conducted during October 2001
Randomly sampled 400 area residents Randomly sampled 400 area residents from Oregon and Washingtonfrom Oregon and Washington
Similar sample sizes in OR and WASimilar sample sizes in OR and WA
Bridge users and non-users includedBridge users and non-users included– About 1/3 of phone respondents had not About 1/3 of phone respondents had not
used the bridge in the past weekused the bridge in the past week

P u b l i c O p i n i o n S u r v e yP u b l i c O p i n i o n S u r v e yS R – 3 5 C o l u m b i a R i v e r C r o s s I n g F e a s i b i l i t S R – 3 5 C o l u m b i a R i v e r C r o s s I n g F e a s i b i l i t
y S t u d yy S t u d y
Telephone SurveyTelephone Survey
Residence LocationsResidence LocationsRespondent Place of Residence
White Salmon36%
Other OR0.2%
Odell2%
Mosier3% Hood River
46%
Other WA0.7%
Underwood3%
Bingen7%
Trout Lake2%
P u b l i c O p i n i o n S u r v e yP u b l i c O p i n i o n S u r v e yS R – 3 5 C o l u m b i a R i v e r C r o s s I n g F e a s i b i l i t S R – 3 5 C o l u m b i a R i v e r C r o s s I n g F e a s i b i l i t
y S t u d yy S t u d y
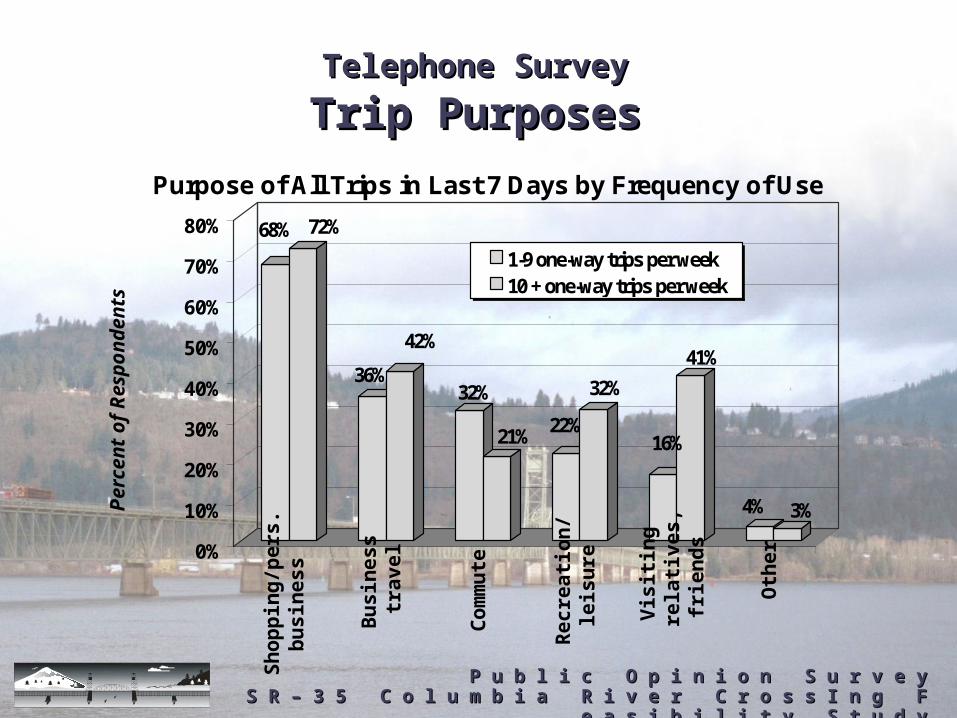
Telephone SurveyTelephone Survey Trip PurposesTrip Purposes
68% 72%
36%
42%
32%
21% 22%
32%
16%
41%
4% 3%
0%
10%
20%
30%
40%
50%
60%
70%
80%
Per
cen
t o
f R
esp
on
den
ts
Shop
ping
/per
s.bu
sine
ss
Bus
ines
str
avel
Com
mut
e
Rec
reat
ion/
leis
ure
Visi
ting
rela
tives
,fr
iend
s
Oth
er
Purpose of All Trips in Last 7 Days by Frequency of Use
1-9 one-way trips per week10 + one-way trips per week

P u b l i c O p i n i o n S u r v e yP u b l i c O p i n i o n S u r v e yS R – 3 5 C o l u m b i a R i v e r C r o s s I n g F e a s i b i l i t S R – 3 5 C o l u m b i a R i v e r C r o s s I n g F e a s i b i l i t
y S t u d yy S t u d y
Telephone SurveyTelephone Survey General Public Supports New General Public Supports New
CrossingCrossing
61%
23%
7% 6%
3%
0%
10%
20%
30%
40%
50%
60%
70%
Per
cen
t o
f R
esp
on
den
ts
Great need Somewhat ofa need
Not much ofa need
No need at all Don't know
Perceived Need for a New Crossing

P u b l i c O p i n i o n S u r v e yP u b l i c O p i n i o n S u r v e yS R – 3 5 C o l u m b i a R i v e r C r o s s I n g F e a s i b i l i t S R – 3 5 C o l u m b i a R i v e r C r o s s I n g F e a s i b i l i t
y S t u d yy S t u d y
Telephone SurveyTelephone Survey General Support from Frequent, General Support from Frequent,
Infrequent and Non-UsersInfrequent and Non-Users
56%
76%
26%
14%
7% 8% 7%
2%4%
0%
0%
10%
20%
30%
40%
50%
60%
70%
80%
Per
cen
t o
f R
esp
on
den
ts
Great need Somewhat of aneed
Not much of aneed
No need at all Don't know
Perceived Need for a New/Improved Crossing by Usage
No trips or <10 one-way trips per week
10+ one-way trips per week

P u b l i c O p i n i o n S u r v e yP u b l i c O p i n i o n S u r v e yS R – 3 5 C o l u m b i a R i v e r C r o s s I n g F e a s i b i l i t S R – 3 5 C o l u m b i a R i v e r C r o s s I n g F e a s i b i l i t
y S t u d yy S t u d y
Telephone SurveyTelephone Survey Washington Residents See Great Washington Residents See Great
NeedNeed
47%
75%
33%
14%
9% 7% 7%5% 5%
0.5%
0%
10%
20%
30%
40%
50%
60%
70%
80%
Per
cen
t o
f R
esp
on
den
ts
Great need Somewhat of aneed
Not much of aneed
No need at all Don't know
Perceived Need for a New/Improved Crossing by State
Oregon
Washington

P u b l i c O p i n i o n S u r v e yP u b l i c O p i n i o n S u r v e yS R – 3 5 C o l u m b i a R i v e r C r o s s I n g F e a s i b i l i t S R – 3 5 C o l u m b i a R i v e r C r o s s I n g F e a s i b i l i t
y S t u d yy S t u d y
Telephone SurveyTelephone Survey WA Residents Less Likely to Pay Higher WA Residents Less Likely to Pay Higher
TollsTolls
100% 100%
71%
89%
45%
55%
36%45%
0%
10%
20%
30%
40%
50%
60%
70%
80%
90%
100%
Per
cen
t o
f R
esp
on
den
ts
$0.75(Existing Toll)
$1.00 $1.50 $2.00
Willingness to Pay a Higher Toll for Most Recent Trip by State of Residence
WA Residents (Phone Survey)
OR Residents (Phone Survey)

P u b l i c O p i n i o n S u r v e yP u b l i c O p i n i o n S u r v e yS R – 3 5 C o l u m b i a R i v e r C r o s s I n g F e a s i b i l i t S R – 3 5 C o l u m b i a R i v e r C r o s s I n g F e a s i b i l i t
y S t u d yy S t u d y
Telephone SurveyTelephone Survey Higher Willingness to Pay for Work Higher Willingness to Pay for Work
PurposesPurposes— 100% —
84%
72%
62%
40%
51%
33%
0%
10%
20%
30%
40%
50%
60%
70%
80%
90%
100%
Per
cen
t o
f R
esp
on
den
ts
$0.75(Existing Toll)
$1.00 $1.50 $2.00
Willingness to Pay Tolls by Trip Purpose
Commute/ Business
Shopping/ Visiting/ Leisure

P u b l i c O p i n i o n S u r v e yP u b l i c O p i n i o n S u r v e yS R – 3 5 C o l u m b i a R i v e r C r o s s I n g F e a s i b i l i t S R – 3 5 C o l u m b i a R i v e r C r o s s I n g F e a s i b i l i t
y S t u d yy S t u d y
Telephone SurveyTelephone Survey Only 1/3 Support Local Tax FundingOnly 1/3 Support Local Tax Funding
Preferences for Local Financing Options
User tollsonly44%
Combination of tolls &
local taxes25%
Localtaxesonly8%
No localor userfunding
15%
Did not know /
no answer8%
Related Documents