UNITED STATES SECURITIES AND EXCHANGE COMMISSION Washington, D.C. 20549 Form 6-K REPORT OF FOREIGN PRIVATE ISSUER PURSUANT TO RULE 13a-16 OR 15d-16 UNDER THE SECURITIES EXCHANGE ACT OF 1934 For the month of August 2021 Commission File Number 001-35466 GasLog Ltd. (Translation of registrant’s name into English) c/o GasLog LNG Services Ltd. 69 Akti Miaouli, 18537 Piraeus, Greece (Address of principal executive office) Indicate by check mark whether the registrant files or will file annual reports under cover of Form 20-F or Form 40-F. Form 20-F ☑ Form 40-F ☐ Indicate by check mark if the registrant is submitting the Form 6-K in paper as permitted by Regulation S-T Rule 101(b)(1): ☐ Indicate by check mark if the registrant is submitting the Form 6-K in paper as permitted by Regulation S-T Rule 101(b)(7): ☐

Welcome message from author
This document is posted to help you gain knowledge. Please leave a comment to let me know what you think about it! Share it to your friends and learn new things together.
Transcript
UNITED STATESSECURITIES AND EXCHANGE COMMISSION
Washington, D.C. 20549
Form 6-K
REPORT OF FOREIGN PRIVATE ISSUER PURSUANT TO RULE 13a-16 OR 15d-16 UNDER THE SECURITIESEXCHANGE ACT OF 1934
For the month of August 2021
Commission File Number 001-35466
GasLog Ltd.(Translation of registrant’s name into English)
c/o GasLog LNG Services Ltd.69 Akti Miaouli, 18537
Piraeus, Greece(Address of principal executive office)
Indicate by check mark whether the registrant files or will file annual reports under cover of Form 20-F or Form 40-F.
Form 20-F ☑ Form 40-F ☐
Indicate by check mark if the registrant is submitting the Form 6-K in paper as permitted by Regulation S-T Rule 101(b)(1): ☐
Indicate by check mark if the registrant is submitting the Form 6-K in paper as permitted by Regulation S-T Rule 101(b)(7): ☐
2
The financial report issued by GasLog Ltd. on August 5, 2021, relating to its results for the three and six-month periods endedJune 30, 2021, is attached hereto as Exhibits 99.1 – 99.2.
INCORPORATION BY REFERENCE
Exhibits 99.1 and 99.2 to this Report on Form 6-K shall be incorporated by reference into our registration statements on Form F-3(File Nos. 333-194894, 333-230205 and 333-239797), initially filed with the Securities and Exchange Commission (the “SEC”) onMarch 28, 2014, March 12, 2019 and July 10, 2020, respectively, as amended, and the registration statement on Form S-8 (File No. 333-187020), filed with the SEC on March 4, 2013, in each case to the extent not superseded by information subsequently filed or furnished(to the extent we expressly state that we incorporate such furnished information by reference) by us under the Securities Act of 1933 orthe Securities Exchange Act of 1934, in each case as amended.
EXHIBIT LIST
Exhibit Description
99.1 Financial Report for the Three and Six Months Ended June 30, 2021 Management’s Discussion and Analysis of Financial Condition and Results of Operation 99.2 Unaudited Condensed Consolidated Financial Statements
101.INS XBRL Instance Document
101.SCH XBRL Taxonomy Extension Schema
101.CAL XBRL Taxonomy Extension Scheme Calculation Linkbase
101.DEF XBRL Taxonomy Extension Scheme Definition Linkbase
101.LAB XBRL Taxonomy Extension Scheme Label Linkbase
101.PRE XBRL Taxonomy Extension Scheme Presentation Linkbase

3
SIGNATURES
Pursuant to the requirements of the Securities Exchange Act of 1934, the registrant has duly caused this report to be signed on itsbehalf by the undersigned, thereunto duly authorized.
Date: August 5, 2021
GASLOG LTD.,
by /s/ Paul WoganName: Paul WoganTitle: Chief Executive Officer
1
Exhibit 99.1
Financial Report for the Three and Six Months Ended June 30, 2021
Management’s Discussion and Analysis of Financial Condition and Results of Operation
The following is a discussion of our financial condition and results of operations for the three and six-month periods ended June 30, 2020 and June 30,2021. Unless otherwise specified herein, references to “GasLog”, the “Company”, the “Group”, “we”, “our” or “us” shall include GasLog Ltd. and itssubsidiaries. You should read this section in conjunction with our unaudited condensed consolidated financial statements and related notes includedelsewhere in this report. For additional information relating to our management’s discussion and analysis of financial condition and results of operations,please see our Annual Report on Form 20-F filed with the U.S. Securities and Exchange Commission (the “SEC”) on March 5, 2021. This discussionincludes forward-looking statements which, although based on assumptions that we consider reasonable, are subject to risks and uncertainties which couldcause actual events or conditions to differ materially from those currently anticipated and expressed or implied by such forward-looking statements. See alsodiscussion in the section entitled “Forward-Looking Statements” below.
Forward-Looking Statements
All statements in this report that are not statements of historical fact are “forward-looking statements” within the meaning of the U.S. Private SecuritiesLitigation Reform Act of 1995. Forward-looking statements include statements that address activities, events or developments that the Company expects,projects, believes or anticipates will or may occur in the future, particularly in relation to our operations, cash flows, financial position, liquidity and cashavailable for dividends or distributions, plans, strategies, business prospects and changes and trends in our business and the markets in which we operate. Wecaution that these forward-looking statements represent our estimates and assumptions only as of the date of this press release, about factors that are beyondour ability to control or predict and are not intended to give any assurance as to future results. Any of these factors or a combination of these factors couldmaterially affect future results of operations and the ultimate accuracy of the forward-looking statements. Accordingly, you should not unduly rely on anyforward-looking statements.
Factors that might cause future results and outcomes to differ include, but are not limited to, the following:
· general liquefied natural gas (“LNG”) shipping market conditions and trends, including spot and multi-year charter rates, ship values, factorsaffecting supply and demand of LNG and LNG shipping, including geopolitical events, technological advancements and opportunities for theprofitable operations of LNG carriers;
· fluctuations in charter hire rates, vessel utilization and vessel values;· increased exposure to the spot market and fluctuations in spot charter rates;· our ability to maximize the use of our vessels, including the re-deployment or disposition of vessels which are not under multi-year charters,
including the risk that certain of our vessels may no longer have the latest technology at such time which may impact our ability to secureemployment for such vessels as well as the rate at which we can charter such vessels;
· changes in our operating expenses, including crew wages, maintenance, dry-docking and insurance costs and bunker prices;· number of off-hire days and dry-docking requirements, including our ability to complete scheduled dry-dockings on time and within budget;· planned capital expenditures and availability of capital resources to fund capital expenditures;· our ability to maintain long-term relationships and enter into time charters with new and existing customers;· disruption to the LNG, LNG shipping and financial markets caused by global shutdown as a result of the COVID-19 pandemic;· business disruptions resulting from measures taken to reduce the spread of COVID-19, including possible delays due to the quarantine of vessels and
crew, as well as government-imposed shutdowns;· fluctuations in prices for crude oil, petroleum products and natural gas;· changes in the ownership of our charterers;· our customers’ performance of their obligations under our time charters and other contracts;· our future operating performance and expenses, financial condition, liquidity and cash available for dividends and distributions;· our ability to obtain debt and equity financing on acceptable terms to fund capital expenditures, acquisitions and other corporate activities, funding by
banks of their financial commitments, and our ability to meet our restrictive covenants and other obligations under our credit facilities;· future, pending or recent acquisitions of or orders for ships or other assets, business strategy, areas of possible expansion and expected capital
spending;· the time that it may take to construct and deliver newbuildings and the useful lives of our ships;· fluctuations in currencies and interest rates;· the expected cost of and our ability to comply with environmental and regulatory requirements, including with respect to emissions of air pollutants
and greenhouse gases, as well as future changes in such requirements or other actions taken by regulatory authorities, governmental organizations,classification societies and standards imposed by our charterers applicable to our business;
· risks inherent in ship operation, including the discharge of pollutants;· the impact of environmental liabilities on us and the shipping industry, including climate change;· our ability to retain key employees and the availability of skilled labour, ship crews and management;· potential disruption of shipping routes due to accidents, diseases, pandemics, political events, piracy or acts by terrorists;· potential liability from future litigation;· any malfunction or disruption of information technology systems and networks that our operations rely on or any impact of a possible cybersecurity
event; and

2
· other risks and uncertainties described in the Company’s Annual Report on Form 20-F filed with the SEC on March 5, 2021 and available athttp://www.sec.gov.
The declaration and payment of dividends are at all times subject to the discretion of our board of directors and will depend on, amongst other things,risks and uncertainties described above, restrictions in our credit and sale-and-leaseback facilities, the provisions of Bermuda law and such other factors asour board of directors may deem relevant.
We undertake no obligation to update or revise any forward-looking statements contained in this report, whether as a result of new information, futureevents, a change in our views or expectations or otherwise, except as required by applicable law. New factors emerge from time to time, and it is not possiblefor us to predict all these factors. Further, we cannot assess the impact of each such factor on our business or the extent to which any factor, or combinationof factors, may cause actual results to be materially different from those contained in any forward-looking statement.
Recent Developments
Delivery of the GasLog Wellington
On June 15, 2021, GasLog took delivery of the GasLog Wellington, a 180,000 cubic meters (“cbm”) LNG carrier with dual fuel medium speedpropulsion (“X-DF”) constructed by Samsung Heavy Industries Co., Ltd. (“Samsung”). Upon delivery, the vessel immediately commenced its seven-yearcharter with Cheniere Marketing International LLP, a wholly owned subsidiary of Cheniere Energy Inc. (“Cheniere”).
Dividend Declarations
On May 13, 2021, the board of directors declared a dividend on the Series A Preference Shares of $0.546875 per share, or $2.5 million in the aggregate,payable on July 1, 2021, to holders of record as of June 30, 2021. GasLog paid the declared dividend to the transfer agent on June 30, 2021.
On August 4, 2021, the board of directors declared a quarterly cash dividend of $0.15 per common share, or $14.3 million in the aggregate, payable onAugust 11, 2021, to shareholders of record as of August 9, 2021.
Completion of the transaction with BlackRock’s Global Energy & Power Infrastructure team (collectively, “GEPIF”)
GasLog announced on June 9, 2021, the completion of the transaction with GEPIF (the “Transaction”) following the special general meeting ofGasLog’s shareholders held virtually on June 4, 2021, where the Transaction and the related agreements (i) the previously announced Merger Agreement, (ii)the merger and (iii) the statutory merger agreement contemplated by the Merger Agreement, received the requisite approval of GasLog’s shareholdersrequired by the Agreement and Plan of Merger, dated as of February 21, 2021 (and subsequently amended on April 20, 2021).
Trading in GasLog’s common shares on the New York Stock Exchange (“NYSE”), was suspended with immediate effect and the delisting of thecommon shares from the NYSE became effective on June 21, 2021. GasLog’s 8.75% Series A Cumulative Redeemable Perpetual Preference Shares remainoutstanding and continue to trade in the NYSE.
Following the consummation of the Transaction on June 9, 2021, certain existing shareholders, including Blenheim Holdings, which is wholly owned bythe Livanos family, and a wholly owned affiliate of the Onassis Foundation, hold approximately 55.2% of the outstanding common shares of GasLog Ltd.and GEPIF holds approximately 44.8%.
New Charter Agreements
During the second quarter of 2021, GasLog entered into a one-year time charter agreement with Naturgy Aprovisionamientos SA. (“Naturgy”) for theMethane Lydon Volney, a 145,000 cbm steam turbine propulsion (“Steam”) LNG carrier built in 2006, which was operating in the spot market. In addition,the GasLog Singapore, which was operating in the spot market, was rechartered to RWE Supply & Trading GmbH (“RWE”) for approximately one year. Thecharterer has the option to extend the term of the time charter by either six or twelve months. The GasLog Singapore is a 155,000 cbm tri-fuel diesel electric(“TFDE”) LNG carrier built in 2010.
During the second quarter of 2021, GasLog Partners LP (“GasLog Partners” or the “Partnership”) entered into a one-year time charter agreement withTotalEnergies Gas & Power Limited, a wholly owned subsidiary of TotalEnergies SE (“TotalEnergies”) for the GasLog Sydney, a 155,000 cbm TFDE LNGcarrier, built in 2013. In addition, following the conclusion of the Solaris’ initial multi-year time charter with a subsidiary of Royal Dutch Shell plc (“Shell”)in late July 2021, its contract was extended for approximately eight months, through the end of the first quarter of 2022. The Solaris is a 155,000 cbm TFDELNG carrier built in 2014. Furthermore, a new time charter agreement was signed with Cheniere for the Methane Heather Sally, a 145,000 cbm steam LNGcarrier built in 2007. The charter has a minimum duration of one year, with Cheniere having the option, until late August, to extend the charter for anadditional one or two years at varying rates.
Post quarter-end, in July 2021, GasLog Partners rechartered an additional vessel with TotalEnergies, the 155,000 cbm TFDE vessel GasLog Seattle,built in 2013, again for a period of approximately twelve months.
3
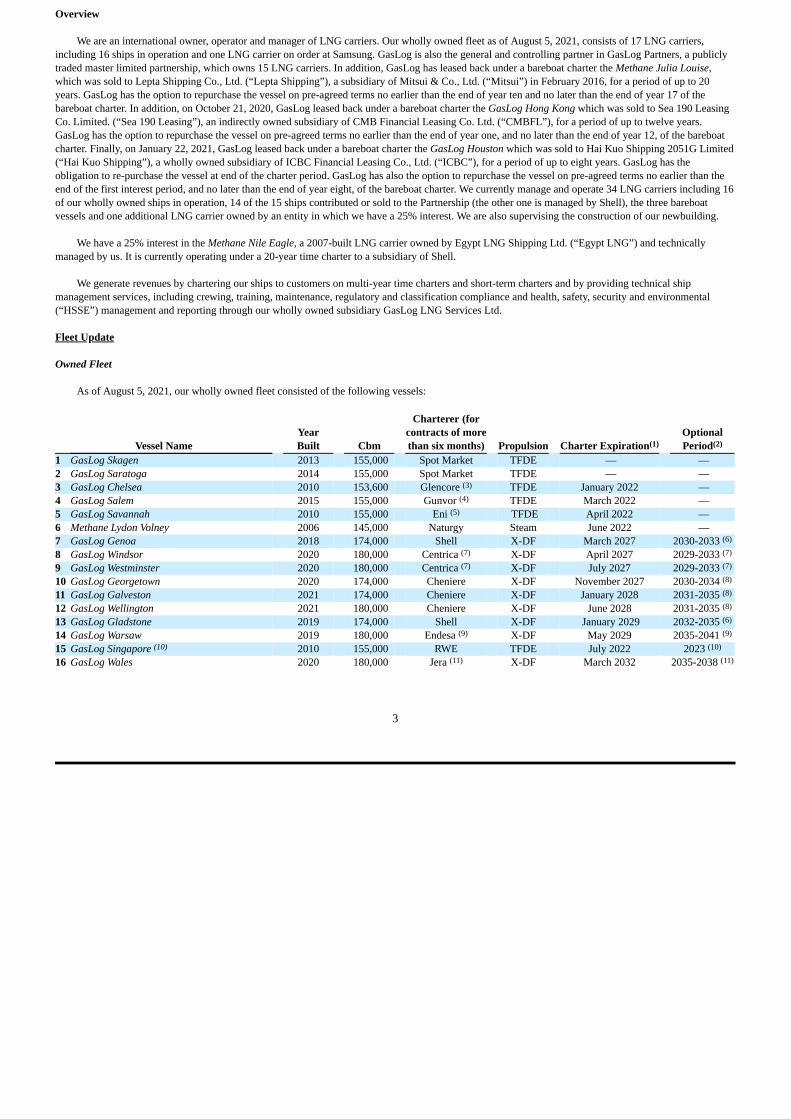
Overview
We are an international owner, operator and manager of LNG carriers. Our wholly owned fleet as of August 5, 2021, consists of 17 LNG carriers,including 16 ships in operation and one LNG carrier on order at Samsung. GasLog is also the general and controlling partner in GasLog Partners, a publiclytraded master limited partnership, which owns 15 LNG carriers. In addition, GasLog has leased back under a bareboat charter the Methane Julia Louise,which was sold to Lepta Shipping Co., Ltd. (“Lepta Shipping”), a subsidiary of Mitsui & Co., Ltd. (“Mitsui”) in February 2016, for a period of up to 20years. GasLog has the option to repurchase the vessel on pre-agreed terms no earlier than the end of year ten and no later than the end of year 17 of thebareboat charter. In addition, on October 21, 2020, GasLog leased back under a bareboat charter the GasLog Hong Kong which was sold to Sea 190 LeasingCo. Limited. (“Sea 190 Leasing”), an indirectly owned subsidiary of CMB Financial Leasing Co. Ltd. (“CMBFL”), for a period of up to twelve years.GasLog has the option to repurchase the vessel on pre-agreed terms no earlier than the end of year one, and no later than the end of year 12, of the bareboatcharter. Finally, on January 22, 2021, GasLog leased back under a bareboat charter the GasLog Houston which was sold to Hai Kuo Shipping 2051G Limited(“Hai Kuo Shipping”), a wholly owned subsidiary of ICBC Financial Leasing Co., Ltd. (“ICBC”), for a period of up to eight years. GasLog has theobligation to re-purchase the vessel at end of the charter period. GasLog has also the option to repurchase the vessel on pre-agreed terms no earlier than theend of the first interest period, and no later than the end of year eight, of the bareboat charter. We currently manage and operate 34 LNG carriers including 16of our wholly owned ships in operation, 14 of the 15 ships contributed or sold to the Partnership (the other one is managed by Shell), the three bareboatvessels and one additional LNG carrier owned by an entity in which we have a 25% interest. We are also supervising the construction of our newbuilding.
We have a 25% interest in the Methane Nile Eagle, a 2007-built LNG carrier owned by Egypt LNG Shipping Ltd. (“Egypt LNG”) and technicallymanaged by us. It is currently operating under a 20-year time charter to a subsidiary of Shell.
We generate revenues by chartering our ships to customers on multi-year time charters and short-term charters and by providing technical shipmanagement services, including crewing, training, maintenance, regulatory and classification compliance and health, safety, security and environmental(“HSSE”) management and reporting through our wholly owned subsidiary GasLog LNG Services Ltd.
Fleet Update
Owned Fleet
As of August 5, 2021, our wholly owned fleet consisted of the following vessels:
Charterer (forYear contracts of more Optional
Vessel Name Built Cbm than six months) Propulsion Charter Expiration(1) Period(2)
1 GasLog Skagen 2013 155,000 Spot Market TFDE — —2 GasLog Saratoga 2014 155,000 Spot Market TFDE — —3 GasLog Chelsea 2010 153,600 Glencore (3) TFDE January 2022 —4 GasLog Salem 2015 155,000 Gunvor (4) TFDE March 2022 —5 GasLog Savannah 2010 155,000 Eni (5) TFDE April 2022 —6 Methane Lydon Volney 2006 145,000 Naturgy Steam June 2022 —7 GasLog Genoa 2018 174,000 Shell X-DF March 2027 2030-2033 (6)
8 GasLog Windsor 2020 180,000 Centrica (7) X-DF April 2027 2029-2033 (7)
9 GasLog Westminster 2020 180,000 Centrica (7) X-DF July 2027 2029-2033 (7)
10 GasLog Georgetown 2020 174,000 Cheniere X-DF November 2027 2030-2034 (8)
11 GasLog Galveston 2021 174,000 Cheniere X-DF January 2028 2031-2035 (8)
12 GasLog Wellington 2021 180,000 Cheniere X-DF June 2028 2031-2035 (8)
13 GasLog Gladstone 2019 174,000 Shell X-DF January 2029 2032-2035 (6)
14 GasLog Warsaw 2019 180,000 Endesa (9) X-DF May 2029 2035-2041 (9)
15 GasLog Singapore (10) 2010 155,000 RWE TFDE July 2022 2023 (10)
16 GasLog Wales 2020 180,000 Jera (11) X-DF March 2032 2035-2038 (11)
4
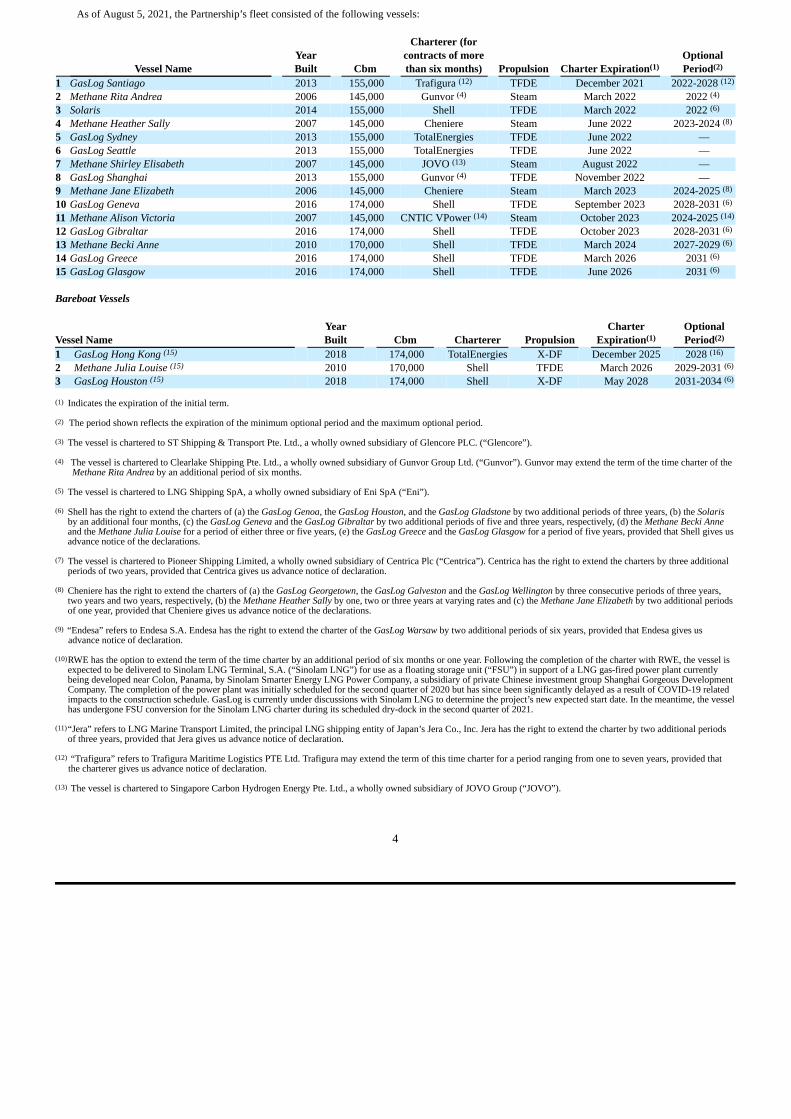
As of August 5, 2021, the Partnership’s fleet consisted of the following vessels:
Charterer (forYear contracts of more Optional
Vessel Name Built Cbm than six months) Propulsion Charter Expiration(1) Period(2)
1 GasLog Santiago 2013 155,000 Trafigura (12) TFDE December 2021 2022-2028 (12)
2 Methane Rita Andrea 2006 145,000 Gunvor (4) Steam March 2022 2022 (4)
3 Solaris 2014 155,000 Shell TFDE March 2022 2022 (6)
4 Methane Heather Sally 2007 145,000 Cheniere Steam June 2022 2023-2024 (8)
5 GasLog Sydney 2013 155,000 TotalEnergies TFDE June 2022 —6 GasLog Seattle 2013 155,000 TotalEnergies TFDE June 2022 —7 Methane Shirley Elisabeth 2007 145,000 JOVO (13) Steam August 2022 —8 GasLog Shanghai 2013 155,000 Gunvor (4) TFDE November 2022 —9 Methane Jane Elizabeth 2006 145,000 Cheniere Steam March 2023 2024-2025 (8)
10 GasLog Geneva 2016 174,000 Shell TFDE September 2023 2028-2031 (6)
11 Methane Alison Victoria 2007 145,000 CNTIC VPower (14) Steam October 2023 2024-2025 (14)
12 GasLog Gibraltar 2016 174,000 Shell TFDE October 2023 2028-2031 (6)
13 Methane Becki Anne 2010 170,000 Shell TFDE March 2024 2027-2029 (6)
14 GasLog Greece 2016 174,000 Shell TFDE March 2026 2031 (6)
15 GasLog Glasgow 2016 174,000 Shell TFDE June 2026 2031 (6)
Bareboat Vessels
Year Charter OptionalVessel Name Built Cbm Charterer Propulsion Expiration(1) Period(2)
1 GasLog Hong Kong (15) 2018 174,000 TotalEnergies X-DF December 2025 2028 (16)
2 Methane Julia Louise (15) 2010 170,000 Shell TFDE March 2026 2029-2031 (6)
3 GasLog Houston (15) 2018 174,000 Shell X-DF May 2028 2031-2034 (6)
(1) Indicates the expiration of the initial term.
(2) The period shown reflects the expiration of the minimum optional period and the maximum optional period.
(3) The vessel is chartered to ST Shipping & Transport Pte. Ltd., a wholly owned subsidiary of Glencore PLC. (“Glencore”).
(4) The vessel is chartered to Clearlake Shipping Pte. Ltd., a wholly owned subsidiary of Gunvor Group Ltd. (“Gunvor”). Gunvor may extend the term of the time charter of theMethane Rita Andrea by an additional period of six months.
(5) The vessel is chartered to LNG Shipping SpA, a wholly owned subsidiary of Eni SpA (“Eni”).
(6) Shell has the right to extend the charters of (a) the GasLog Genoa, the GasLog Houston, and the GasLog Gladstone by two additional periods of three years, (b) the Solarisby an additional four months, (c) the GasLog Geneva and the GasLog Gibraltar by two additional periods of five and three years, respectively, (d) the Methane Becki Anneand the Methane Julia Louise for a period of either three or five years, (e) the GasLog Greece and the GasLog Glasgow for a period of five years, provided that Shell gives usadvance notice of the declarations.
(7) The vessel is chartered to Pioneer Shipping Limited, a wholly owned subsidiary of Centrica Plc (“Centrica”). Centrica has the right to extend the charters by three additionalperiods of two years, provided that Centrica gives us advance notice of declaration.
(8) Cheniere has the right to extend the charters of (a) the GasLog Georgetown, the GasLog Galveston and the GasLog Wellington by three consecutive periods of three years,two years and two years, respectively, (b) the Methane Heather Sally by one, two or three years at varying rates and (c) the Methane Jane Elizabeth by two additional periodsof one year, provided that Cheniere gives us advance notice of the declarations.
(9) “Endesa” refers to Endesa S.A. Endesa has the right to extend the charter of the GasLog Warsaw by two additional periods of six years, provided that Endesa gives usadvance notice of declaration.
(10)RWE has the option to extend the term of the time charter by an additional period of six months or one year. Following the completion of the charter with RWE, the vessel isexpected to be delivered to Sinolam LNG Terminal, S.A. (“Sinolam LNG”) for use as a floating storage unit (“FSU”) in support of a LNG gas-fired power plant currentlybeing developed near Colon, Panama, by Sinolam Smarter Energy LNG Power Company, a subsidiary of private Chinese investment group Shanghai Gorgeous DevelopmentCompany. The completion of the power plant was initially scheduled for the second quarter of 2020 but has since been significantly delayed as a result of COVID-19 relatedimpacts to the construction schedule. GasLog is currently under discussions with Sinolam LNG to determine the project’s new expected start date. In the meantime, the vesselhas undergone FSU conversion for the Sinolam LNG charter during its scheduled dry-dock in the second quarter of 2021.
(11)“Jera” refers to LNG Marine Transport Limited, the principal LNG shipping entity of Japan’s Jera Co., Inc. Jera has the right to extend the charter by two additional periodsof three years, provided that Jera gives us advance notice of declaration.
(12) “Trafigura” refers to Trafigura Maritime Logistics PTE Ltd. Trafigura may extend the term of this time charter for a period ranging from one to seven years, provided thatthe charterer gives us advance notice of declaration.
(13) The vessel is chartered to Singapore Carbon Hydrogen Energy Pte. Ltd., a wholly owned subsidiary of JOVO Group (“JOVO”).

5
(14) The vessel is chartered to CNTIC VPower Energy Ltd. (“CNTIC VPower”), an independent Chinese energy company. CNTIC VPower may extend the term of the relatedcharter by two additional periods of one year, provided that the charterer gives us advance notice of declaration.
(15) GAS-twenty five Ltd., GAS-twenty six Ltd. and GAS-twenty four Ltd. have sold the GasLog Hong Kong to Sea 190 Leasing, the Methane Julia Louise to Lepta Shippingand the GasLog Houston to Hai Kuo Shipping, respectively, and leased them back for a period of up to twelve, 17 and eight years, respectively. GAS-twenty five Ltd. andGAS-twenty six Ltd. have the option and GAS-twenty four Ltd. has the option and the obligation to re-purchase the vessels on pre-agreed terms.
(16) TotalEnergies has the right to extend the charter for a period of three years, provided that TotalEnergies provides us with advance notice of declaration.
Under the omnibus agreement entered into with GasLog Partners and certain of its subsidiaries in connection with the Partnership’s initial publicoffering, as amended, GasLog has agreed, and has caused our controlled affiliates (other than GasLog Partners, its general partner and its subsidiaries) toagree, not to acquire, own, operate or charter any LNG carrier with a cargo capacity greater than 75,000 cbm engaged in oceangoing LNG transportationunder a charter for five full years or more without, within 30 calendar days after the consummation of the acquisition or the commencement of the operationsor charter of such a vessel, notifying and offering GasLog Partners the opportunity to purchase such a vessel at fair market value.
Results of Operations
Three-month period ended June 30, 2020, compared to the three-month period ended June 30, 2021
For the three months endedJune 30, June 30,
2020 2021Amounts in thousands of U.S. Dollars Revenues 158,861 173,010Voyage expenses and commissions (5,442) (5,681)Vessel operating and supervision costs (32,605) (40,688)Depreciation (43,647) (48,493)General and administrative expenses (11,154) (13,498)Loss on disposal of non-current assets (572) —Impairment loss on vessels (22,454) —Profit from operations 42,987 64,650Financial costs (43,557) (51,216)Financial income 177 34Loss on derivatives (13,467) (6,310)Share of profit of associates 522 553Total other expenses, net (56,325) (56,939)(Loss)/profit for the period (13,338) 7,711Non-controlling interests (8,010) (12,495)Loss attributable to owners of the Group (21,348) (4,784)
During the three-month period ended June 30, 2020, we had an average of 30.0 ships operating in our owned and bareboat fleet (including ships ownedby the Partnership), having 2,592 available days. During the three-month period ended June 30, 2021, we had an average of 33.2 ships operating in ourowned and bareboat fleet (including ships owned by the Partnership), having 2,864 available days.
Revenues:
Revenues increased by 8.9%, or $14.1 million, from $158.9 million during the three-month period ended June 30, 2020, to $173.0 million during thethree-month period ended June 30, 2021. The increase in revenues is attributable to an increase of $25.1 million due to the deliveries of the GasLog whollyowned vessels, the GasLog Wales, the GasLog Westminster, the GasLog Georgetown, the GasLog Galveston and the GasLog Wellington on May 11, 2020,July 15, 2020, November 16, 2020, January 4, 2021 and June 15, 2021, respectively, and a net increase of $6.6 million from the vessels of our spot fleet, asdefined below. These increases were partially offset by a net decrease of $10.3 million attributable to the expirations of the initial multi-year time charters(mainly of the Partnership’s vessels which were at higher rates compared to their current spot rates) and a decrease of $5.0 million due to increased off-hiredays for scheduled dry-dockings. The average daily hire rate decreased from $64,549 for the quarter ended June 30, 2020, to $63,958 for the quarter endedJune 30, 2021.
Management allocates vessel revenues to two categories: (a) spot fleet and (b) long-term fleet. The spot fleet category contains all vessels that havecontracts with initial duration of less than five years. The long-term fleet category contains all vessels that have charter party agreements with initial durationof more than five years. Both categories exclude optional periods.
6
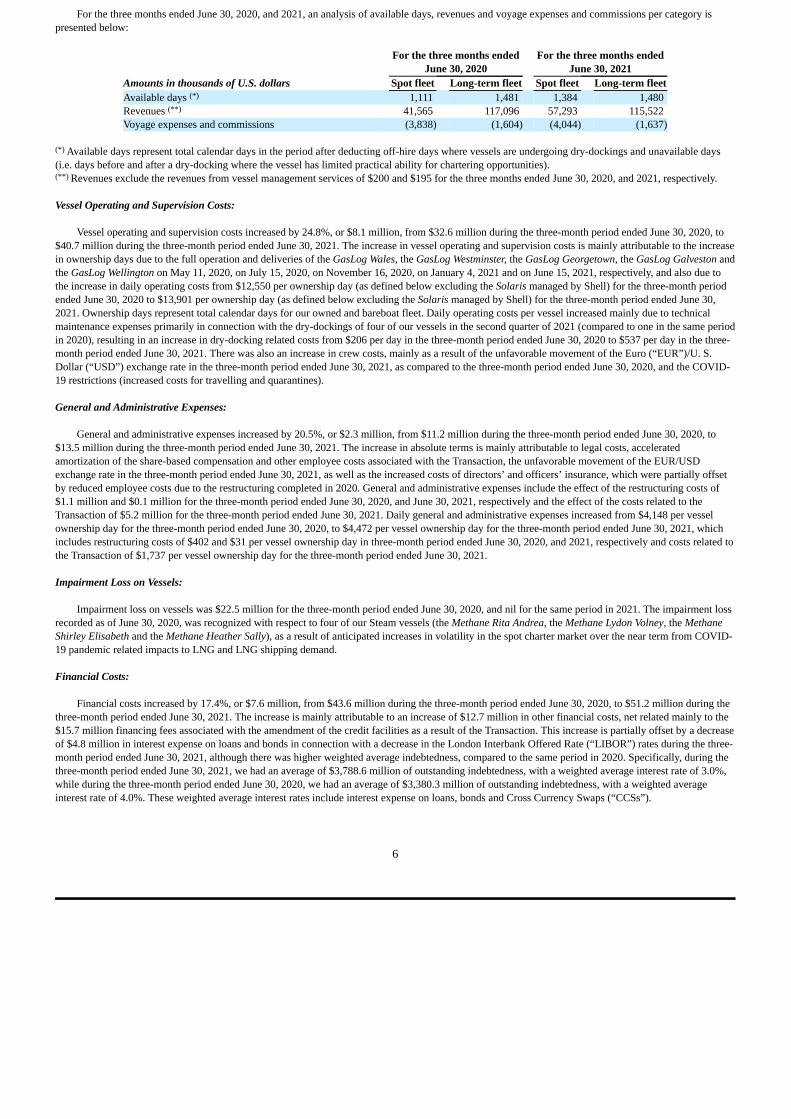
For the three months ended June 30, 2020, and 2021, an analysis of available days, revenues and voyage expenses and commissions per category ispresented below:
For the three months ended For the three months endedJune 30, 2020 June 30, 2021
Amounts in thousands of U.S. dollars Spot fleet Long-term fleet Spot fleet Long-term fleetAvailable days (*) 1,111 1,481 1,384 1,480Revenues (**) 41,565 117,096 57,293 115,522Voyage expenses and commissions (3,838) (1,604) (4,044) (1,637)
(*) Available days represent total calendar days in the period after deducting off-hire days where vessels are undergoing dry-dockings and unavailable days(i.e. days before and after a dry-docking where the vessel has limited practical ability for chartering opportunities).(**) Revenues exclude the revenues from vessel management services of $200 and $195 for the three months ended June 30, 2020, and 2021, respectively.
Vessel Operating and Supervision Costs:
Vessel operating and supervision costs increased by 24.8%, or $8.1 million, from $32.6 million during the three-month period ended June 30, 2020, to$40.7 million during the three-month period ended June 30, 2021. The increase in vessel operating and supervision costs is mainly attributable to the increasein ownership days due to the full operation and deliveries of the GasLog Wales, the GasLog Westminster, the GasLog Georgetown, the GasLog Galveston andthe GasLog Wellington on May 11, 2020, on July 15, 2020, on November 16, 2020, on January 4, 2021 and on June 15, 2021, respectively, and also due tothe increase in daily operating costs from $12,550 per ownership day (as defined below excluding the Solaris managed by Shell) for the three-month periodended June 30, 2020 to $13,901 per ownership day (as defined below excluding the Solaris managed by Shell) for the three-month period ended June 30,2021. Ownership days represent total calendar days for our owned and bareboat fleet. Daily operating costs per vessel increased mainly due to technicalmaintenance expenses primarily in connection with the dry-dockings of four of our vessels in the second quarter of 2021 (compared to one in the same periodin 2020), resulting in an increase in dry-docking related costs from $206 per day in the three-month period ended June 30, 2020 to $537 per day in the three-month period ended June 30, 2021. There was also an increase in crew costs, mainly as a result of the unfavorable movement of the Euro (“EUR”)/U. S.Dollar (“USD”) exchange rate in the three-month period ended June 30, 2021, as compared to the three-month period ended June 30, 2020, and the COVID-19 restrictions (increased costs for travelling and quarantines).
General and Administrative Expenses:
General and administrative expenses increased by 20.5%, or $2.3 million, from $11.2 million during the three-month period ended June 30, 2020, to$13.5 million during the three-month period ended June 30, 2021. The increase in absolute terms is mainly attributable to legal costs, acceleratedamortization of the share-based compensation and other employee costs associated with the Transaction, the unfavorable movement of the EUR/USDexchange rate in the three-month period ended June 30, 2021, as well as the increased costs of directors’ and officers’ insurance, which were partially offsetby reduced employee costs due to the restructuring completed in 2020. General and administrative expenses include the effect of the restructuring costs of$1.1 million and $0.1 million for the three-month period ended June 30, 2020, and June 30, 2021, respectively and the effect of the costs related to theTransaction of $5.2 million for the three-month period ended June 30, 2021. Daily general and administrative expenses increased from $4,148 per vesselownership day for the three-month period ended June 30, 2020, to $4,472 per vessel ownership day for the three-month period ended June 30, 2021, whichincludes restructuring costs of $402 and $31 per vessel ownership day in three-month period ended June 30, 2020, and 2021, respectively and costs related tothe Transaction of $1,737 per vessel ownership day for the three-month period ended June 30, 2021.
Impairment Loss on Vessels:
Impairment loss on vessels was $22.5 million for the three-month period ended June 30, 2020, and nil for the same period in 2021. The impairment lossrecorded as of June 30, 2020, was recognized with respect to four of our Steam vessels (the Methane Rita Andrea, the Methane Lydon Volney, the MethaneShirley Elisabeth and the Methane Heather Sally), as a result of anticipated increases in volatility in the spot charter market over the near term from COVID-19 pandemic related impacts to LNG and LNG shipping demand.
Financial Costs:
Financial costs increased by 17.4%, or $7.6 million, from $43.6 million during the three-month period ended June 30, 2020, to $51.2 million during thethree-month period ended June 30, 2021. The increase is mainly attributable to an increase of $12.7 million in other financial costs, net related mainly to the$15.7 million financing fees associated with the amendment of the credit facilities as a result of the Transaction. This increase is partially offset by a decreaseof $4.8 million in interest expense on loans and bonds in connection with a decrease in the London Interbank Offered Rate (“LIBOR”) rates during the three-month period ended June 30, 2021, although there was higher weighted average indebtedness, compared to the same period in 2020. Specifically, during thethree-month period ended June 30, 2021, we had an average of $3,788.6 million of outstanding indebtedness, with a weighted average interest rate of 3.0%,while during the three-month period ended June 30, 2020, we had an average of $3,380.3 million of outstanding indebtedness, with a weighted averageinterest rate of 4.0%. These weighted average interest rates include interest expense on loans, bonds and Cross Currency Swaps (“CCSs”).
7
Loss on Derivatives:
Loss on derivatives decreased by $7.2 million, from a loss of $13.5 million during the three-month period ended June 30, 2020, to a loss of $6.3 millionduring the three-month period ended June 30, 2021. The decrease in loss on derivatives is mainly attributable to a decrease of $13.2 million in loss frommarked-to-market valuation of our derivative financial instruments carried at fair value through profit or loss which reflected a loss of $9.1 million in thethree months ended June 30, 2020, as compared to a gain of $4.1 million in the three months ended June 30, 2021, partially offset by an increase of $6.2million in realized loss from interest rate swaps held for trading as a result of the decrease in LIBOR.
(Loss)/profit for the Period:
Loss for the period decreased by $21.0 million, from a loss of $13.3 million for the three-month period ended June 30, 2020, to a profit of $7.7 millionfor the three-month period ended June 30, 2021, as a result of the aforementioned factors.
Loss Attributable to Owners of the Group:
Loss attributable to owners of the Group decreased by $16.5 million, from a loss of $21.3 million for the three-month period ended June 30, 2020, to aloss of $4.8 million for the three-month period ended June 30, 2021. The decrease in loss attributable to the owners of GasLog resulted mainly from thedecrease in loss for the period mentioned above, partially offset by the increase in profit attributable to the non-controlling interests (non-controllingunitholders of GasLog Partners) following the increase in the Partnership’s profit.
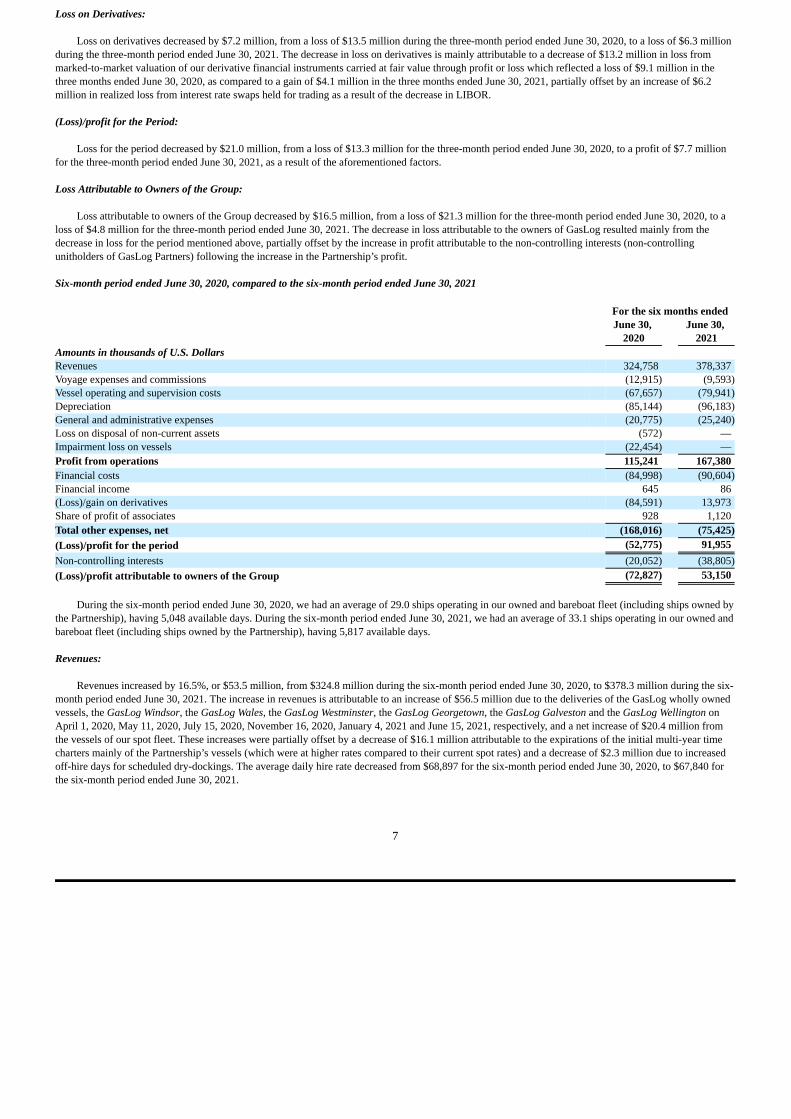
Six-month period ended June 30, 2020, compared to the six-month period ended June 30, 2021
For the six months endedJune 30, June 30,
2020 2021Amounts in thousands of U.S. Dollars Revenues 324,758 378,337Voyage expenses and commissions (12,915) (9,593)Vessel operating and supervision costs (67,657) (79,941)Depreciation (85,144) (96,183)General and administrative expenses (20,775) (25,240)Loss on disposal of non-current assets (572) —Impairment loss on vessels (22,454) —Profit from operations 115,241 167,380Financial costs (84,998) (90,604)Financial income 645 86(Loss)/gain on derivatives (84,591) 13,973Share of profit of associates 928 1,120Total other expenses, net (168,016) (75,425)(Loss)/profit for the period (52,775) 91,955Non-controlling interests (20,052) (38,805)(Loss)/profit attributable to owners of the Group (72,827) 53,150
During the six-month period ended June 30, 2020, we had an average of 29.0 ships operating in our owned and bareboat fleet (including ships owned bythe Partnership), having 5,048 available days. During the six-month period ended June 30, 2021, we had an average of 33.1 ships operating in our owned andbareboat fleet (including ships owned by the Partnership), having 5,817 available days.
Revenues:
Revenues increased by 16.5%, or $53.5 million, from $324.8 million during the six-month period ended June 30, 2020, to $378.3 million during the six-month period ended June 30, 2021. The increase in revenues is attributable to an increase of $56.5 million due to the deliveries of the GasLog wholly ownedvessels, the GasLog Windsor, the GasLog Wales, the GasLog Westminster, the GasLog Georgetown, the GasLog Galveston and the GasLog Wellington onApril 1, 2020, May 11, 2020, July 15, 2020, November 16, 2020, January 4, 2021 and June 15, 2021, respectively, and a net increase of $20.4 million fromthe vessels of our spot fleet. These increases were partially offset by a decrease of $16.1 million attributable to the expirations of the initial multi-year timecharters mainly of the Partnership’s vessels (which were at higher rates compared to their current spot rates) and a decrease of $2.3 million due to increasedoff-hire days for scheduled dry-dockings. The average daily hire rate decreased from $68,897 for the six-month period ended June 30, 2020, to $67,840 forthe six-month period ended June 30, 2021.
8
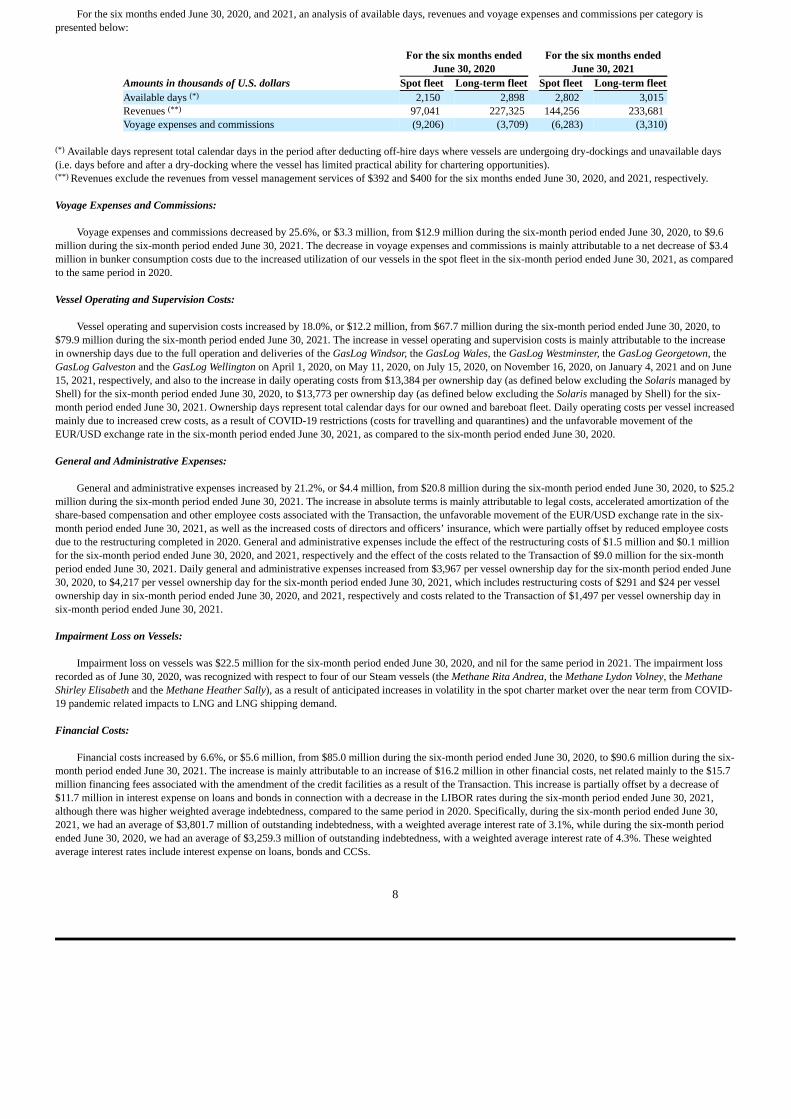
For the six months ended June 30, 2020, and 2021, an analysis of available days, revenues and voyage expenses and commissions per category ispresented below:
For the six months ended For the six months endedJune 30, 2020 June 30, 2021
Amounts in thousands of U.S. dollars Spot fleet Long-term fleet Spot fleet Long-term fleetAvailable days (*) 2,150 2,898 2,802 3,015Revenues (**) 97,041 227,325 144,256 233,681Voyage expenses and commissions (9,206) (3,709) (6,283) (3,310)
(*) Available days represent total calendar days in the period after deducting off-hire days where vessels are undergoing dry-dockings and unavailable days(i.e. days before and after a dry-docking where the vessel has limited practical ability for chartering opportunities).(**) Revenues exclude the revenues from vessel management services of $392 and $400 for the six months ended June 30, 2020, and 2021, respectively.
Voyage Expenses and Commissions:
Voyage expenses and commissions decreased by 25.6%, or $3.3 million, from $12.9 million during the six-month period ended June 30, 2020, to $9.6million during the six-month period ended June 30, 2021. The decrease in voyage expenses and commissions is mainly attributable to a net decrease of $3.4million in bunker consumption costs due to the increased utilization of our vessels in the spot fleet in the six-month period ended June 30, 2021, as comparedto the same period in 2020.
Vessel Operating and Supervision Costs:
Vessel operating and supervision costs increased by 18.0%, or $12.2 million, from $67.7 million during the six-month period ended June 30, 2020, to$79.9 million during the six-month period ended June 30, 2021. The increase in vessel operating and supervision costs is mainly attributable to the increasein ownership days due to the full operation and deliveries of the GasLog Windsor, the GasLog Wales, the GasLog Westminster, the GasLog Georgetown, theGasLog Galveston and the GasLog Wellington on April 1, 2020, on May 11, 2020, on July 15, 2020, on November 16, 2020, on January 4, 2021 and on June15, 2021, respectively, and also to the increase in daily operating costs from $13,384 per ownership day (as defined below excluding the Solaris managed byShell) for the six-month period ended June 30, 2020, to $13,773 per ownership day (as defined below excluding the Solaris managed by Shell) for the six-month period ended June 30, 2021. Ownership days represent total calendar days for our owned and bareboat fleet. Daily operating costs per vessel increasedmainly due to increased crew costs, as a result of COVID-19 restrictions (costs for travelling and quarantines) and the unfavorable movement of theEUR/USD exchange rate in the six-month period ended June 30, 2021, as compared to the six-month period ended June 30, 2020.
General and Administrative Expenses:
General and administrative expenses increased by 21.2%, or $4.4 million, from $20.8 million during the six-month period ended June 30, 2020, to $25.2million during the six-month period ended June 30, 2021. The increase in absolute terms is mainly attributable to legal costs, accelerated amortization of theshare-based compensation and other employee costs associated with the Transaction, the unfavorable movement of the EUR/USD exchange rate in the six-month period ended June 30, 2021, as well as the increased costs of directors and officers’ insurance, which were partially offset by reduced employee costsdue to the restructuring completed in 2020. General and administrative expenses include the effect of the restructuring costs of $1.5 million and $0.1 millionfor the six-month period ended June 30, 2020, and 2021, respectively and the effect of the costs related to the Transaction of $9.0 million for the six-monthperiod ended June 30, 2021. Daily general and administrative expenses increased from $3,967 per vessel ownership day for the six-month period ended June30, 2020, to $4,217 per vessel ownership day for the six-month period ended June 30, 2021, which includes restructuring costs of $291 and $24 per vesselownership day in six-month period ended June 30, 2020, and 2021, respectively and costs related to the Transaction of $1,497 per vessel ownership day insix-month period ended June 30, 2021.
Impairment Loss on Vessels:
Impairment loss on vessels was $22.5 million for the six-month period ended June 30, 2020, and nil for the same period in 2021. The impairment lossrecorded as of June 30, 2020, was recognized with respect to four of our Steam vessels (the Methane Rita Andrea, the Methane Lydon Volney, the MethaneShirley Elisabeth and the Methane Heather Sally), as a result of anticipated increases in volatility in the spot charter market over the near term from COVID-19 pandemic related impacts to LNG and LNG shipping demand.
Financial Costs:
Financial costs increased by 6.6%, or $5.6 million, from $85.0 million during the six-month period ended June 30, 2020, to $90.6 million during the six-month period ended June 30, 2021. The increase is mainly attributable to an increase of $16.2 million in other financial costs, net related mainly to the $15.7million financing fees associated with the amendment of the credit facilities as a result of the Transaction. This increase is partially offset by a decrease of$11.7 million in interest expense on loans and bonds in connection with a decrease in the LIBOR rates during the six-month period ended June 30, 2021,although there was higher weighted average indebtedness, compared to the same period in 2020. Specifically, during the six-month period ended June 30,2021, we had an average of $3,801.7 million of outstanding indebtedness, with a weighted average interest rate of 3.1%, while during the six-month periodended June 30, 2020, we had an average of $3,259.3 million of outstanding indebtedness, with a weighted average interest rate of 4.3%. These weightedaverage interest rates include interest expense on loans, bonds and CCSs.

9
(Loss)/gain on Derivatives:
Loss on derivatives decreased by $98.6 million, from a loss of $84.6 million during the six-month period ended June 30, 2020, to a gain of $14.0 millionduring the six-month period ended June 30, 2021. The decrease in loss on derivatives is mainly attributable to a decrease of $111.9 million in loss frommarked-to-market valuation of our derivative financial instruments carried at fair value through profit or loss which reflected a loss of $80.5 million in the sixmonths ended June 30, 2020, as compared to a gain of $31.4 million in the six months ended June 30, 2021, partially offset by an increase of $14.1 million inrealized loss from interest rate swaps held for trading as a result of the decrease in LIBOR.
(Loss)/profit for the Period:
Loss for the period decreased by $144.8 million, from a loss of $52.8 million for the six-month period ended June 30, 2020, to a profit of $92.0 millionfor the six-month period ended June 30, 2021, as a result of the aforementioned factors.
(Loss)/profit Attributable to Owners of the Group:
Loss attributable to owners of the Group decreased by $126.0 million, from a loss of $72.8 million for the six-month period ended June 30, 2020, to aprofit of $53.2 million for the six-month period ended June 30, 2021. The decrease in loss attributable to the owners of GasLog resulted mainly from thedecrease in loss for the period mentioned above, partially offset by the increase in profit attributable to the non-controlling interests (non-controllingunitholders of GasLog Partners) following the increase in the Partnership’s profit.
Liquidity and Capital Resources
Our primary liquidity needs are to fund our vessel operating costs and general and administrative expenses, to finance the purchase and construction ofour newbuildings and conversions, to purchase secondhand vessels, to service our existing debt and to pay dividends. In monitoring our working capitalneeds, we project our charter hire income and the vessels’ maintenance and running expenses, as well as debt service obligations, and seek to maintainadequate cash reserves in order to address revenue shortfalls or budget overruns, if any.
Our funding and treasury activities are intended to meet our operating and financing requirements while balancing investment returns to maintainappropriate liquidity. Cash and cash equivalents are held primarily in USD.
As of June 30, 2021, GasLog had $232.1 million of cash and cash equivalents. In addition, an amount of $8.2 million was held as cash collaterals withrespect to our swaps and is included in Other non-current assets and Prepayments and other current assets. An additional amount of $2.5 million of timedeposits with an original duration greater than three months was classified under short-term investments.
On January 22, 2021, GasLog’s subsidiary, GAS-twenty four Ltd., completed the sale and leaseback of the GasLog Houston with Hai Kuo Shipping, awholly owned subsidiary of ICBC. The vessel was sold to Hai Kuo Shipping. GasLog has leased back the vessel under a bareboat charter from Hai KuoShipping for a period of up to eight years. GasLog has the obligation to re-purchase the vessel at the end of the charter period. GasLog has also the option tore-purchase the vessel on pre-agreed terms no earlier than the first interest period and no later than the end of year eight of the bareboat charter. The vesselremains on its charter with Shell.
As of June 30, 2021, the total remaining balance of the contract price for the one LNG carrier on order was $150.9 million, all of which is due within 12months, and which will be funded under the facility signed on December 12, 2019, with an Export Credit Agency-backed debt financing of $1.1 billion with13 international banks to provide the debt funding for its current newbuilding program (the “Newbuilding Facility”). As of June 30, 2021, there was undrawnavailable capacity of $153.0 million under the Newbuilding Facility.
As of June 30, 2021, GasLog had an aggregate of $3.8 billion of indebtedness outstanding under its credit facilities and bond agreements, of which$555.8 million is repayable within one year ($315.0 million of which relating to the 8.875% senior unsecured notes due in 2022 (the “8.875% SeniorNotes”)), and $193.6 million of lease liabilities related to the sale and leaseback of the Methane Julia Louise, of which $10.0 million is payable within oneyear.
GasLog has hedged 44.1% of its expected floating interest rate exposure on its outstanding debt (excluding the lease liability and the 8.875% SeniorNotes) as of June 30, 2021.
In the three and six months ended June 30, 2021, GasLog Partners, under its ATM Common Equity Offering Programme, issued and received paymentfor 3,195,401 common units at a weighted average price of $3.19 per common unit for total gross proceeds of $10.2 million and net proceeds of $10.0million, after broker commissions. As of June 30, 2021, GasLog held a 33.3% ownership interest (including the 2% interest through general partner units) inGasLog Partners.
Our credit facilities are described in Note 13 of our annual audited consolidated financial statements included in our Annual Report on Form 20-F filedwith the SEC on March 5, 2021 and Note 7 of our unaudited condensed consolidated financial statements included elsewhere in this report.
10
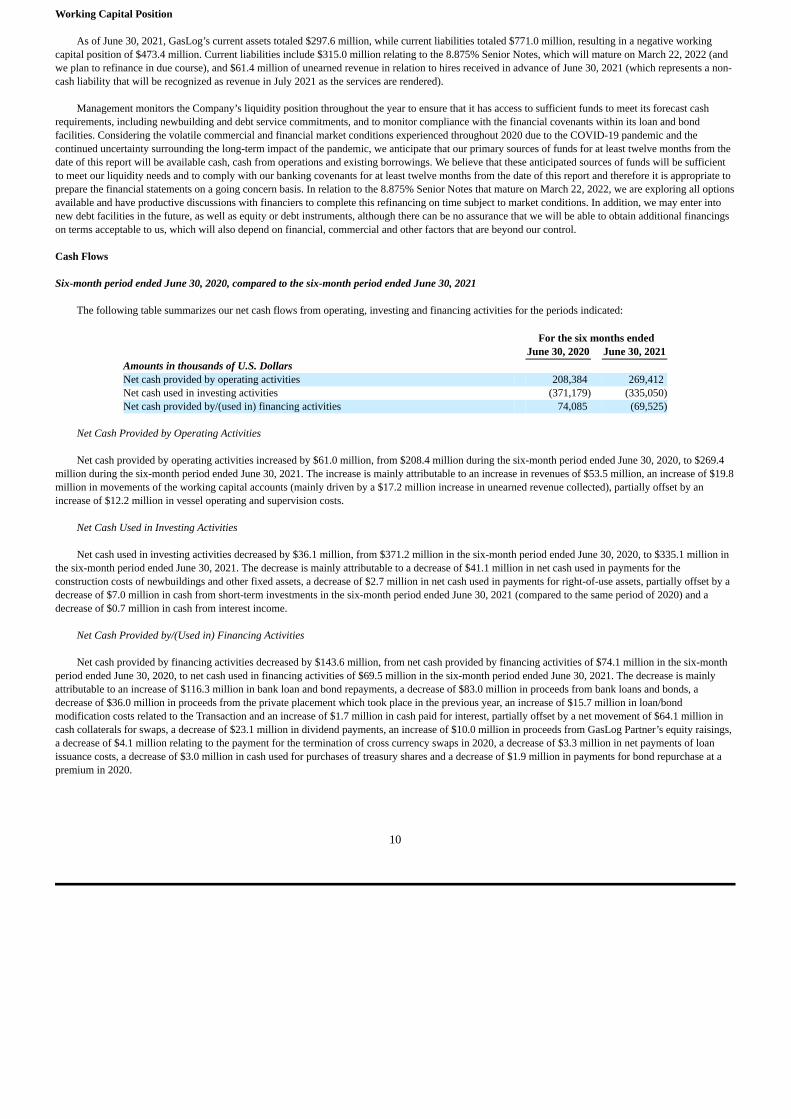
Working Capital Position
As of June 30, 2021, GasLog’s current assets totaled $297.6 million, while current liabilities totaled $771.0 million, resulting in a negative workingcapital position of $473.4 million. Current liabilities include $315.0 million relating to the 8.875% Senior Notes, which will mature on March 22, 2022 (andwe plan to refinance in due course), and $61.4 million of unearned revenue in relation to hires received in advance of June 30, 2021 (which represents a non-cash liability that will be recognized as revenue in July 2021 as the services are rendered).
Management monitors the Company’s liquidity position throughout the year to ensure that it has access to sufficient funds to meet its forecast cashrequirements, including newbuilding and debt service commitments, and to monitor compliance with the financial covenants within its loan and bondfacilities. Considering the volatile commercial and financial market conditions experienced throughout 2020 due to the COVID-19 pandemic and thecontinued uncertainty surrounding the long-term impact of the pandemic, we anticipate that our primary sources of funds for at least twelve months from thedate of this report will be available cash, cash from operations and existing borrowings. We believe that these anticipated sources of funds will be sufficientto meet our liquidity needs and to comply with our banking covenants for at least twelve months from the date of this report and therefore it is appropriate toprepare the financial statements on a going concern basis. In relation to the 8.875% Senior Notes that mature on March 22, 2022, we are exploring all optionsavailable and have productive discussions with financiers to complete this refinancing on time subject to market conditions. In addition, we may enter intonew debt facilities in the future, as well as equity or debt instruments, although there can be no assurance that we will be able to obtain additional financingson terms acceptable to us, which will also depend on financial, commercial and other factors that are beyond our control.
Cash Flows
Six-month period ended June 30, 2020, compared to the six-month period ended June 30, 2021
The following table summarizes our net cash flows from operating, investing and financing activities for the periods indicated:
For the six months ended June 30, 2020 June 30, 2021
Amounts in thousands of U.S. Dollars Net cash provided by operating activities 208,384 269,412Net cash used in investing activities (371,179) (335,050)Net cash provided by/(used in) financing activities 74,085 (69,525)
Net Cash Provided by Operating Activities
Net cash provided by operating activities increased by $61.0 million, from $208.4 million during the six-month period ended June 30, 2020, to $269.4million during the six-month period ended June 30, 2021. The increase is mainly attributable to an increase in revenues of $53.5 million, an increase of $19.8million in movements of the working capital accounts (mainly driven by a $17.2 million increase in unearned revenue collected), partially offset by anincrease of $12.2 million in vessel operating and supervision costs.
Net Cash Used in Investing Activities
Net cash used in investing activities decreased by $36.1 million, from $371.2 million in the six-month period ended June 30, 2020, to $335.1 million inthe six-month period ended June 30, 2021. The decrease is mainly attributable to a decrease of $41.1 million in net cash used in payments for theconstruction costs of newbuildings and other fixed assets, a decrease of $2.7 million in net cash used in payments for right-of-use assets, partially offset by adecrease of $7.0 million in cash from short-term investments in the six-month period ended June 30, 2021 (compared to the same period of 2020) and adecrease of $0.7 million in cash from interest income.
Net Cash Provided by/(Used in) Financing Activities
Net cash provided by financing activities decreased by $143.6 million, from net cash provided by financing activities of $74.1 million in the six-monthperiod ended June 30, 2020, to net cash used in financing activities of $69.5 million in the six-month period ended June 30, 2021. The decrease is mainlyattributable to an increase of $116.3 million in bank loan and bond repayments, a decrease of $83.0 million in proceeds from bank loans and bonds, adecrease of $36.0 million in proceeds from the private placement which took place in the previous year, an increase of $15.7 million in loan/bondmodification costs related to the Transaction and an increase of $1.7 million in cash paid for interest, partially offset by a net movement of $64.1 million incash collaterals for swaps, a decrease of $23.1 million in dividend payments, an increase of $10.0 million in proceeds from GasLog Partner’s equity raisings,a decrease of $4.1 million relating to the payment for the termination of cross currency swaps in 2020, a decrease of $3.3 million in net payments of loanissuance costs, a decrease of $3.0 million in cash used for purchases of treasury shares and a decrease of $1.9 million in payments for bond repurchase at apremium in 2020.

11
Contracted Charter Revenues and Days from Time Charters
The following table summarizes GasLog’s (including the vessels contributed or sold to GasLog Partners) contracted charter revenues and contract coverafter June 30, 2021.
Contracted Charter Revenues and Days from Time Charters After June 30, For the years ending December 31,
2021 2022 2023 2024 2025-2032 Total (in millions of U.S. dollars, except days and percentages)
Contracted time charter revenues(1) 362.2 604.4 498.0 422.0 1,188.9 3,075.5Total contracted days(1) 5,768 8,823 6,671 5,521 15,723 42,506Total available days(2) 6,311 12,775 12,535 12,690 100,530 144,841Total unfixed days(3) 543 3,952 5,864 7,169 84,807 102,335Percentage of total contracted days/total available days 91.4 % 69.1 % 53.2 % 43.5 % 15.6 % 29.3 %
After giving effect to the charter parties signed from June 30, 2021 until August 5, 2021, the contracted time charter revenues and the percentage of totalcontracted days to total available days for the remaining quarters of 2021 increased to $380.1 million and 95.6%, respectively.
(1) Reflects time charter revenues and contracted days for 16 of our currently wholly owned vessels, the 15 vessels owned by the Partnership, the three bareboat vessels and theone newbuilding on order for which we have secured time charters. Does not include charter revenues for the Methane Nile Eagle, in which we hold a 25% minority interest.Contracted revenue calculations assume: (a) 365 revenue days per annum, with 30 off-hire days when the ship undergoes scheduled dry-docking (every five years); (b) allLNG carriers on order are delivered on schedule; and (c) no exercise of any option to extend the terms of charters. For time charters that include a fixed operating costcomponent subject to annual escalation, revenue calculations include that fixed annual escalation. For time charters that give the charterer the option to set the charter hirerate at prevailing market rates during an initial portion of the time charter’s term, revenue calculations assume that the charterer does not elect such option. Revenuecalculations for such charters include an estimate of the amount of the operating cost component and the management fee component. For time charters that are based on avariable rate of hire within an agreed range during the charter period, the lower end of the range is used for this calculation.
(2) Available days represent total calendar days after deducting 30 off-hire days when the ship undergoes scheduled dry-docking. The available days for the vessels operating inthe spot/short-term market are included.
(3) Represents available days for ships after the expiration of existing charters (assuming charterers do not exercise any option to extend the terms of the charters) and theavailable days for the vessels operating in the spot/short-term market.
Other than the assumptions reflected in the footnotes to the table, including our assumption that our newbuilding is delivered on schedule, the table doesnot reflect events occurring after June 30, 2021. The table reflects only our contracted charter revenues for the ships in our owned fleet and bareboat fleet forwhich we have secured time charters, and it does not reflect the costs or expenses we will incur in fulfilling our obligations under the charters, nor does itinclude other revenues we may earn, such as revenues for technical management of customer-owned ships. In particular, the table does not reflect anyrevenues from any additional ships we may acquire in the future, nor does it reflect the options under our time charters that permit our charterers to extendthe time charter terms for successive multi-year periods. The entry into new time charter contracts for the vessels that are operating in the spot market andany additional ships we may acquire, or the exercise of options extending the terms of our existing charters, would result in an increase in the number ofcontracted days and the contracted revenue for our fleet in the future. Although the contracted charter revenues are based on contracted charter hire rateprovisions, they reflect certain assumptions, including assumptions relating to future ship operating costs. We consider the assumptions to be reasonable as ofthe date of this report, but if these assumptions prove to be incorrect, our actual time charter revenues could differ from those reflected in the table.Furthermore, any contract is subject to various risks, including performance by the counterparties or an early termination of the contract pursuant to its terms.If the charterers are unable or unwilling to make charter payments to us, or if we agree to renegotiate charter terms at the request of a charterer or if contractsare prematurely terminated for any reason, we would be exposed to prevailing market conditions at the time and our results of operations and financialcondition may be materially adversely affected. Please see the disclosure under the heading “Risk Factors” in our Annual Report on Form 20-F filed with theSEC on March 5, 2021. For these reasons, the contracted charter revenue information presented above is not fact and should not be relied upon as beingnecessarily indicative of future results and readers are cautioned not to place undue reliance on this information. Neither the Company’s independentauditors, nor any other independent accountants, have compiled, examined or performed any procedures with respect to the information presented in thetable, nor have they expressed any opinion or any other form of assurance on such information or its achievability and assume no responsibility for, anddisclaim any association with, the information in the table.
Significant Accounting Policies
For a description of all of our significant accounting policies, see Note 2 of our annual audited consolidated financial statements included in our AnnualReport on Form 20-F filed on March 5, 2021, and Note 2 of our unaudited condensed consolidated financial statements included elsewhere in this report.

Table of Contents
Exhibit 99.2
F-1
GASLOG LTD.INDEX TO UNAUDITED CONDENSED CONSOLIDATED FINANCIAL STATEMENTS
Page
Unaudited condensed consolidated statements of financial position as of December 31,2020 and June 30, 2021 F-2
Unaudited condensed consolidated statements of profit or loss for the three and six months ended June 30,2020 and 2021 F-3
Unaudited condensed consolidated statements of comprehensive income or loss for the three and six months endedJune 30,2020 and 2021 F-4
Unaudited condensed consolidated statements of changes in equity for the six months ended June 30,2020 and 2021 F-5
Unaudited condensed consolidated statements of cash flows for the six months ended June 30,2020 and 2021 F-6
Notes to the unaudited condensed consolidated financial statements F-8
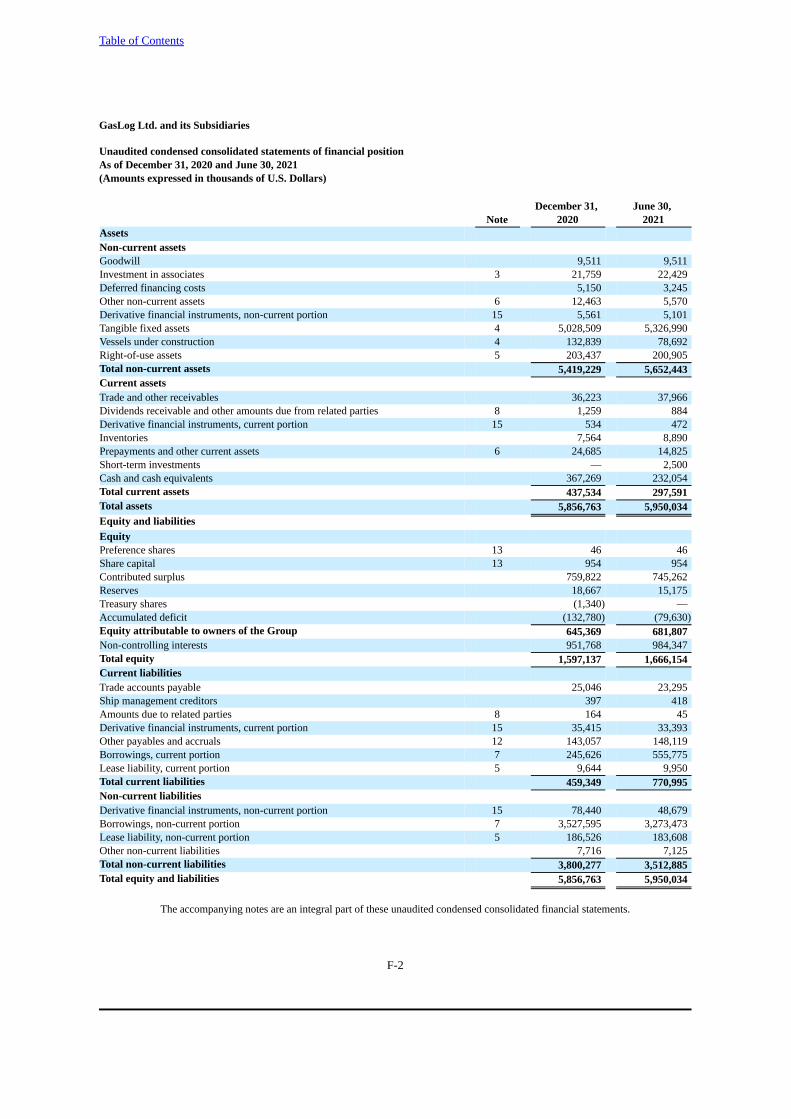
Table of Contents
F-2
GasLog Ltd. and its Subsidiaries
Unaudited condensed consolidated statements of financial positionAs of December 31, 2020 and June 30, 2021(Amounts expressed in thousands of U.S. Dollars)
December 31, June 30, Note 2020 2021
Assets Non-current assets Goodwill 9,511 9,511Investment in associates 3 21,759 22,429Deferred financing costs 5,150 3,245Other non-current assets 6 12,463 5,570Derivative financial instruments, non-current portion 15 5,561 5,101Tangible fixed assets 4 5,028,509 5,326,990Vessels under construction 4 132,839 78,692Right-of-use assets 5 203,437 200,905Total non-current assets 5,419,229 5,652,443Current assetsTrade and other receivables 36,223 37,966Dividends receivable and other amounts due from related parties 8 1,259 884Derivative financial instruments, current portion 15 534 472Inventories 7,564 8,890Prepayments and other current assets 6 24,685 14,825Short-term investments — 2,500Cash and cash equivalents 367,269 232,054Total current assets 437,534 297,591Total assets 5,856,763 5,950,034Equity and liabilitiesEquityPreference shares 13 46 46Share capital 13 954 954Contributed surplus 759,822 745,262Reserves 18,667 15,175Treasury shares (1,340) —Accumulated deficit (132,780) (79,630)Equity attributable to owners of the Group 645,369 681,807Non-controlling interests 951,768 984,347Total equity 1,597,137 1,666,154Current liabilitiesTrade accounts payable 25,046 23,295Ship management creditors 397 418Amounts due to related parties 8 164 45Derivative financial instruments, current portion 15 35,415 33,393Other payables and accruals 12 143,057 148,119Borrowings, current portion 7 245,626 555,775Lease liability, current portion 5 9,644 9,950Total current liabilities 459,349 770,995Non-current liabilitiesDerivative financial instruments, non-current portion 15 78,440 48,679Borrowings, non-current portion 7 3,527,595 3,273,473Lease liability, non-current portion 5 186,526 183,608Other non-current liabilities 7,716 7,125Total non-current liabilities 3,800,277 3,512,885Total equity and liabilities 5,856,763 5,950,034
The accompanying notes are an integral part of these unaudited condensed consolidated financial statements.
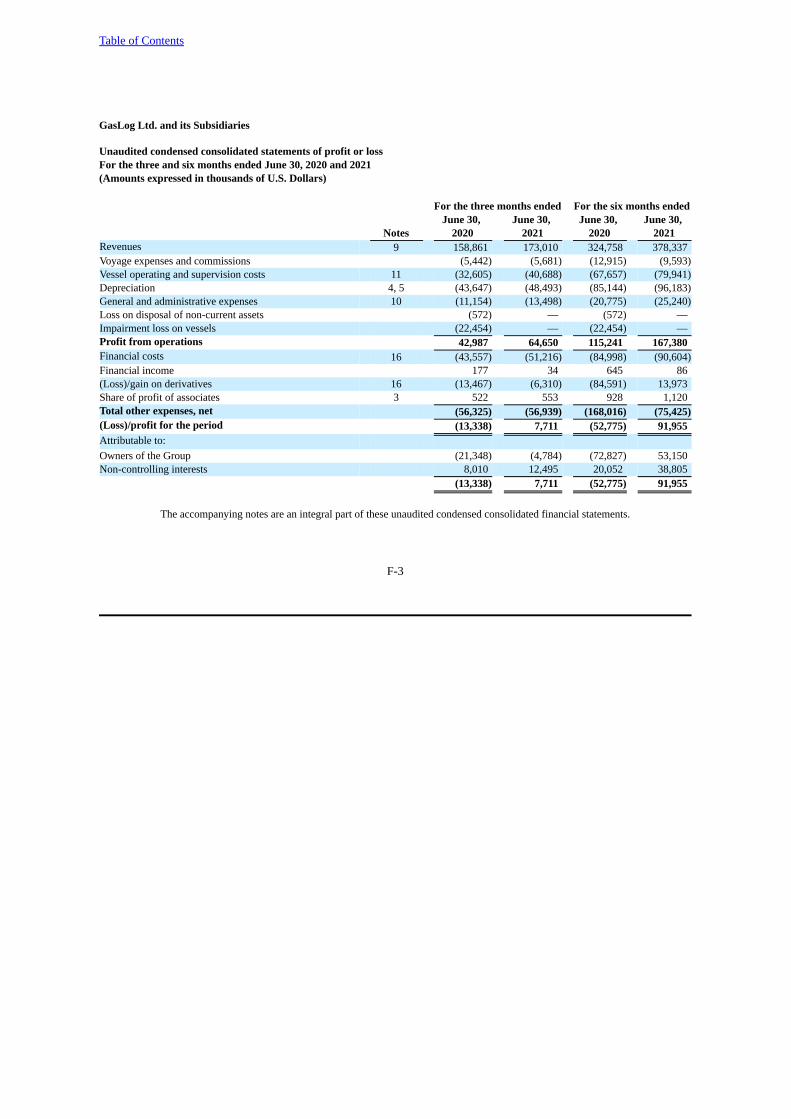
Table of Contents
F-3
GasLog Ltd. and its Subsidiaries
Unaudited condensed consolidated statements of profit or lossFor the three and six months ended June 30, 2020 and 2021(Amounts expressed in thousands of U.S. Dollars)
For the three months ended For the six months ended June 30, June 30, June 30, June 30,
Notes 2020 2021 2020 2021Revenues 9 158,861 173,010 324,758 378,337Voyage expenses and commissions (5,442) (5,681) (12,915) (9,593)Vessel operating and supervision costs 11 (32,605) (40,688) (67,657) (79,941)Depreciation 4, 5 (43,647) (48,493) (85,144) (96,183)General and administrative expenses 10 (11,154) (13,498) (20,775) (25,240)Loss on disposal of non-current assets (572) — (572) —Impairment loss on vessels (22,454) — (22,454) —Profit from operations 42,987 64,650 115,241 167,380Financial costs 16 (43,557) (51,216) (84,998) (90,604)Financial income 177 34 645 86(Loss)/gain on derivatives 16 (13,467) (6,310) (84,591) 13,973Share of profit of associates 3 522 553 928 1,120Total other expenses, net (56,325) (56,939) (168,016) (75,425)(Loss)/profit for the period (13,338) 7,711 (52,775) 91,955Attributable to: Owners of the Group (21,348) (4,784) (72,827) 53,150Non-controlling interests 8,010 12,495 20,052 38,805
(13,338) 7,711 (52,775) 91,955
The accompanying notes are an integral part of these unaudited condensed consolidated financial statements.
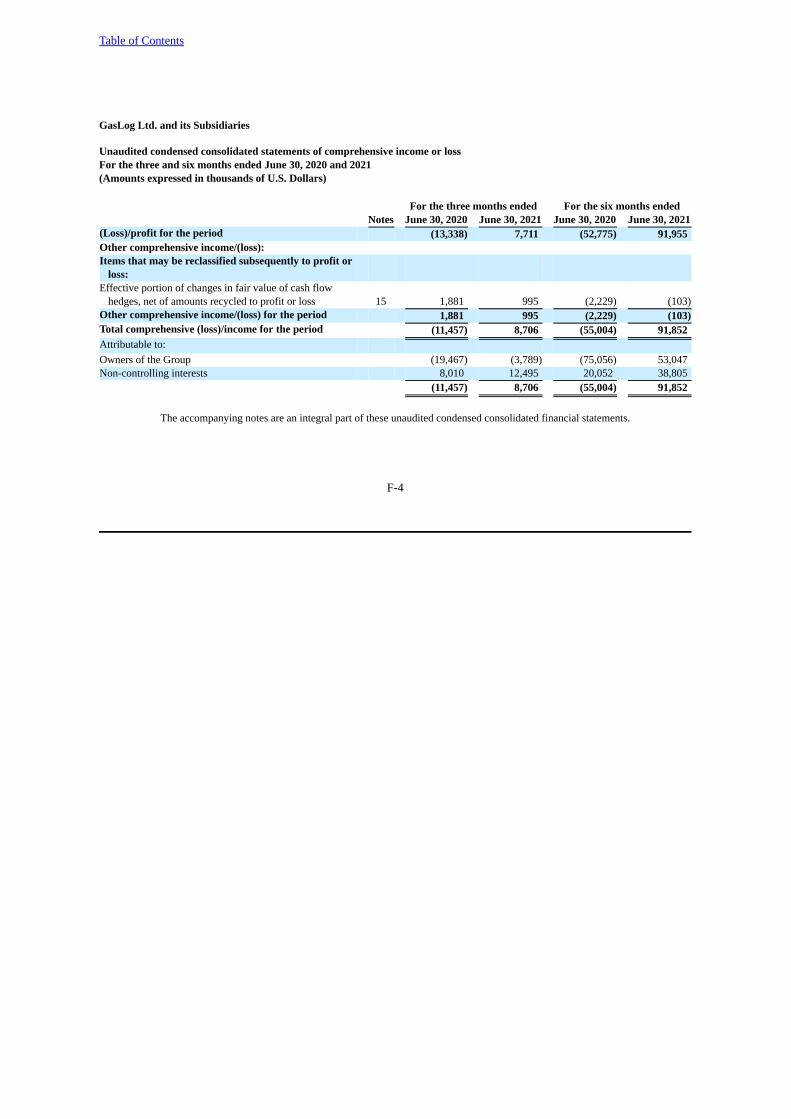
Table of Contents
F-4
GasLog Ltd. and its Subsidiaries
Unaudited condensed consolidated statements of comprehensive income or lossFor the three and six months ended June 30, 2020 and 2021(Amounts expressed in thousands of U.S. Dollars)
For the three months ended For the six months ended Notes June 30, 2020 June 30, 2021 June 30, 2020 June 30, 2021
(Loss)/profit for the period (13,338) 7,711 (52,775) 91,955Other comprehensive income/(loss): Items that may be reclassified subsequently to profit or
loss:Effective portion of changes in fair value of cash flow
hedges, net of amounts recycled to profit or loss 15 1,881 995 (2,229) (103)Other comprehensive income/(loss) for the period 1,881 995 (2,229) (103)Total comprehensive (loss)/income for the period (11,457) 8,706 (55,004) 91,852Attributable to: Owners of the Group (19,467) (3,789) (75,056) 53,047Non-controlling interests 8,010 12,495 20,052 38,805
(11,457) 8,706 (55,004) 91,852
The accompanying notes are an integral part of these unaudited condensed consolidated financial statements.
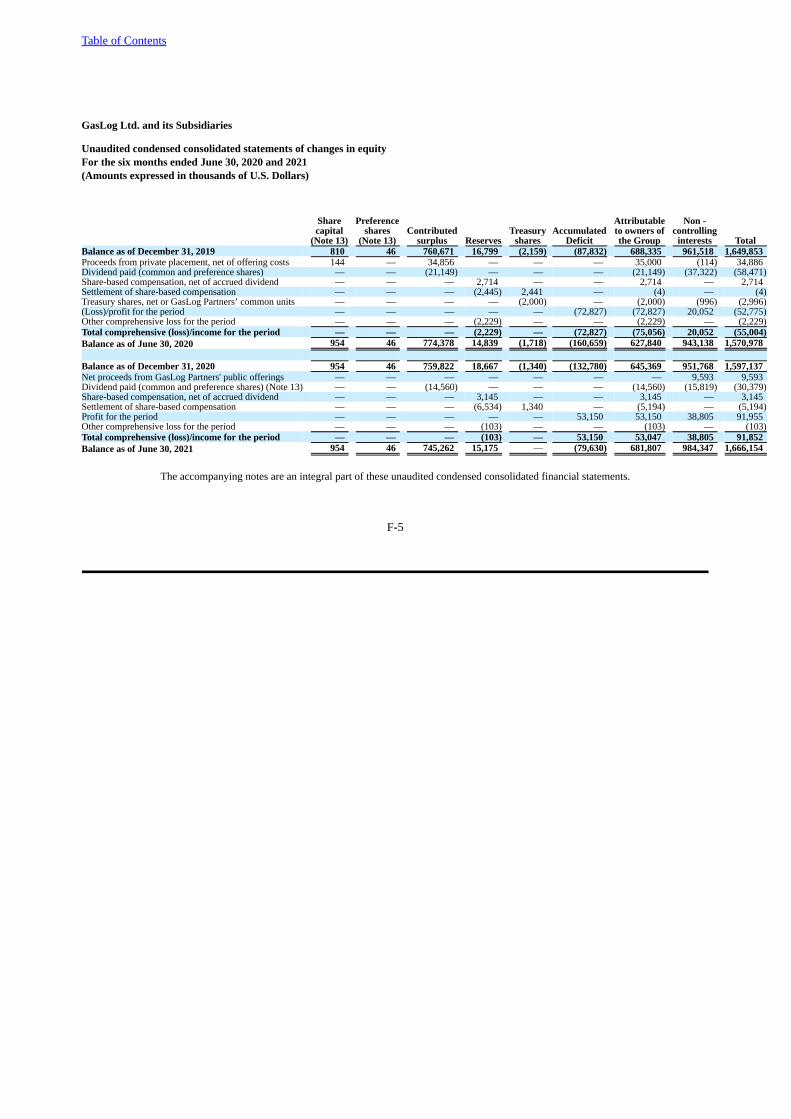
Table of Contents
F-5
GasLog Ltd. and its Subsidiaries
Unaudited condensed consolidated statements of changes in equityFor the six months ended June 30, 2020 and 2021(Amounts expressed in thousands of U.S. Dollars)
Share Preference Attributable Non -capital shares Contributed Treasury Accumulated to owners of controlling
(Note 13) (Note 13) surplus Reserves shares Deficit the Group interests TotalBalance as of December 31, 2019 810 46 760,671 16,799 (2,159) (87,832) 688,335 961,518 1,649,853Proceeds from private placement, net of offering costs 144 — 34,856 — — — 35,000 (114) 34,886Dividend paid (common and preference shares) — — (21,149) — — — (21,149) (37,322) (58,471)Share-based compensation, net of accrued dividend — — — 2,714 — — 2,714 — 2,714Settlement of share-based compensation — — — (2,445) 2,441 — (4) — (4)Treasury shares, net or GasLog Partners’ common units — — — — (2,000) — (2,000) (996) (2,996)(Loss)/profit for the period — — — — — (72,827) (72,827) 20,052 (52,775)Other comprehensive loss for the period — — — (2,229) — — (2,229) — (2,229)Total comprehensive (loss)/income for the period — — — (2,229) — (72,827) (75,056) 20,052 (55,004)Balance as of June 30, 2020 954 46 774,378 14,839 (1,718) (160,659) 627,840 943,138 1,570,978
Balance as of December 31, 2020 954 46 759,822 18,667 (1,340) (132,780) 645,369 951,768 1,597,137Net proceeds from GasLog Partners' public offerings — — — — — — — 9,593 9,593Dividend paid (common and preference shares) (Note 13) — — (14,560) — — — (14,560) (15,819) (30,379)Share-based compensation, net of accrued dividend — — — 3,145 — — 3,145 — 3,145Settlement of share-based compensation — — — (6,534) 1,340 — (5,194) — (5,194)Profit for the period — — — — — 53,150 53,150 38,805 91,955Other comprehensive loss for the period — — — (103) — — (103) — (103)Total comprehensive (loss)/income for the period — — — (103) — 53,150 53,047 38,805 91,852Balance as of June 30, 2021 954 46 745,262 15,175 — (79,630) 681,807 984,347 1,666,154
The accompanying notes are an integral part of these unaudited condensed consolidated financial statements.
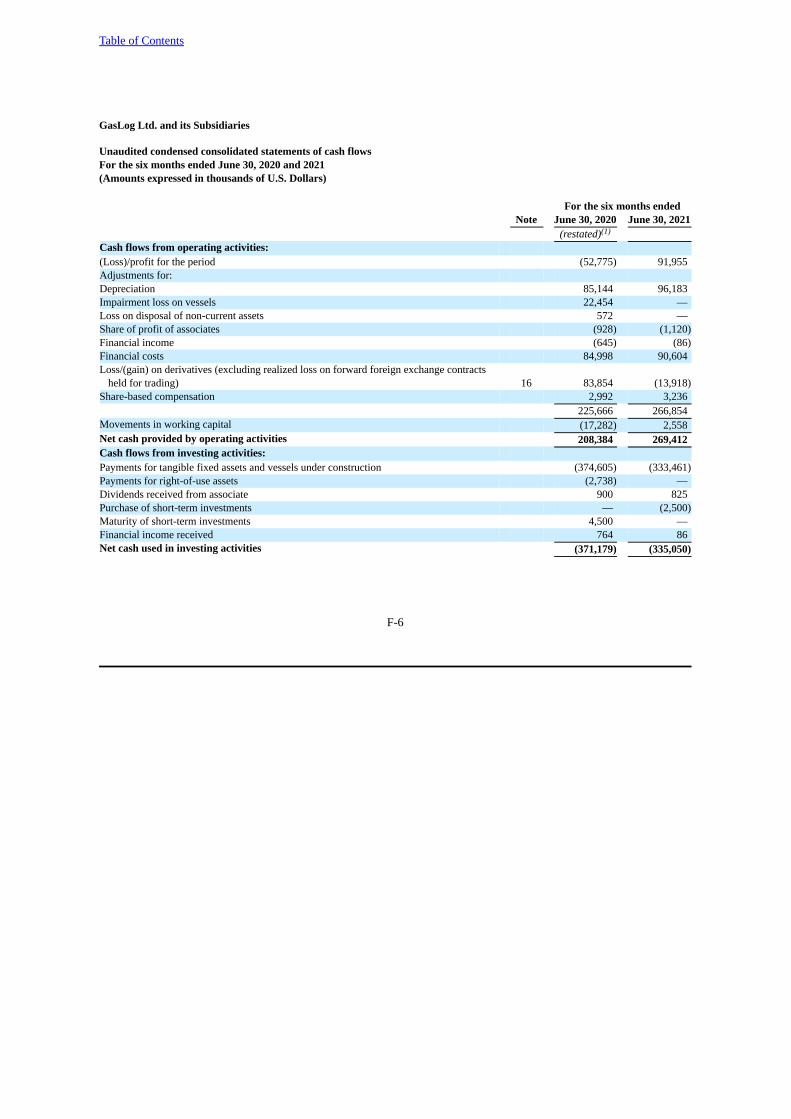
Table of Contents
F-6
GasLog Ltd. and its Subsidiaries
Unaudited condensed consolidated statements of cash flowsFor the six months ended June 30, 2020 and 2021(Amounts expressed in thousands of U.S. Dollars)
For the six months ended Note June 30, 2020 June 30, 2021
(restated)(1)
Cash flows from operating activities:(Loss)/profit for the period (52,775) 91,955Adjustments for:Depreciation 85,144 96,183Impairment loss on vessels 22,454 —Loss on disposal of non-current assets 572 —Share of profit of associates (928) (1,120)Financial income (645) (86)Financial costs 84,998 90,604Loss/(gain) on derivatives (excluding realized loss on forward foreign exchange contracts
held for trading) 16 83,854 (13,918)Share-based compensation 2,992 3,236
225,666 266,854Movements in working capital (17,282) 2,558Net cash provided by operating activities 208,384 269,412Cash flows from investing activities:Payments for tangible fixed assets and vessels under construction (374,605) (333,461)Payments for right-of-use assets (2,738) —Dividends received from associate 900 825Purchase of short-term investments — (2,500)Maturity of short-term investments 4,500 —Financial income received 764 86Net cash used in investing activities (371,179) (335,050)

Table of Contents
F-7
For the six months ended Note June 30, 2020 June 30, 2021
(restated)(1)
Cash flows from financing activities:Proceeds from loans 17 401,911 318,913Loan and bond repayments 17 (150,508) (266,770)Payment for bond repurchase at a premium 17 (1,937) —Payment for interest rate swaps termination 17 (10,811) —Proceeds from entering into interest rate swaps 17 10,770 —Interest paid (86,656) (88,407)Loan/bond modification costs related to the Transaction (as defined in Note 1) — (15,652)Payment of cash collaterals for swaps (80,530) (4,480)Release of cash collaterals for swaps 31,650 19,717Payment of loan and bond issuance costs 17 (7,605) (4,708)Loan issuance costs received 17 — 379Payment of equity raising costs (15) (124)Proceeds from GasLog Partners’ common unit offerings (net of underwriting discounts and
commissions) — 10,000Proceeds from private placement 36,000 —Dividends paid (55,955) (32,895)Payment for cross currency swaps’ (“CCS”) termination/modification 17 (4,051) —Purchase of treasury shares or GasLog Partners’ common units (2,996) —Payments for lease liability (5,182) (5,498)Net cash provided by/(used in) financing activities 74,085 (69,525)Effects of exchange rate changes on cash and cash equivalents (2,123) (52)Decrease in cash and cash equivalents (90,833) (135,215)Cash and cash equivalents, beginning of the period 263,747 367,269Cash and cash equivalents, end of the period 172,914 232,054
Non-cash investing and financing activities Capital expenditures included in liabilities at the end of the period 20,215 16,911Capital expenditures included in liabilities at the end of the period – Right-of-use assets 3,045 169Receivable from related parties - Disposal of non-current assets 2,457 —Equity raising costs included in liabilities at the end of the period 1,113 283Loan issuance costs included in liabilities at the end of the period 17 335 712Dividend declared included in liabilities at the end of the period 2,516 —Liabilities related to leases at the end of the period 336 3
(1) Restated so as to reflect a change in accounting policy introduced on January 1, 2021, with respect to the reclassification of interest paid andmovements of cash collaterals for swaps (Note 2).
The accompanying notes are an integral part of these unaudited condensed consolidated financial statements.
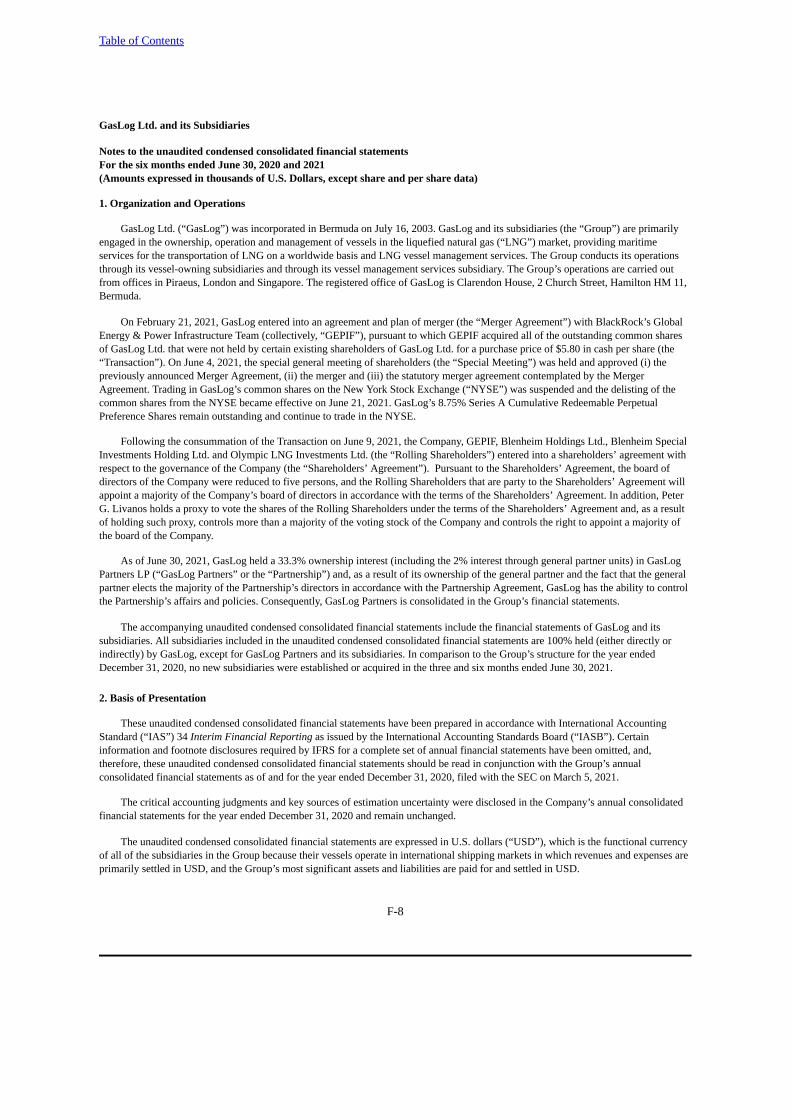
Table of Contents
F-8
GasLog Ltd. and its Subsidiaries
Notes to the unaudited condensed consolidated financial statementsFor the six months ended June 30, 2020 and 2021(Amounts expressed in thousands of U.S. Dollars, except share and per share data)
1. Organization and Operations
GasLog Ltd. (“GasLog”) was incorporated in Bermuda on July 16, 2003. GasLog and its subsidiaries (the “Group”) are primarilyengaged in the ownership, operation and management of vessels in the liquefied natural gas (“LNG”) market, providing maritimeservices for the transportation of LNG on a worldwide basis and LNG vessel management services. The Group conducts its operationsthrough its vessel-owning subsidiaries and through its vessel management services subsidiary. The Group’s operations are carried outfrom offices in Piraeus, London and Singapore. The registered office of GasLog is Clarendon House, 2 Church Street, Hamilton HM 11,Bermuda.
On February 21, 2021, GasLog entered into an agreement and plan of merger (the “Merger Agreement”) with BlackRock’s GlobalEnergy & Power Infrastructure Team (collectively, “GEPIF”), pursuant to which GEPIF acquired all of the outstanding common sharesof GasLog Ltd. that were not held by certain existing shareholders of GasLog Ltd. for a purchase price of $5.80 in cash per share (the“Transaction”). On June 4, 2021, the special general meeting of shareholders (the “Special Meeting”) was held and approved (i) thepreviously announced Merger Agreement, (ii) the merger and (iii) the statutory merger agreement contemplated by the MergerAgreement. Trading in GasLog’s common shares on the New York Stock Exchange (“NYSE”) was suspended and the delisting of thecommon shares from the NYSE became effective on June 21, 2021. GasLog’s 8.75% Series A Cumulative Redeemable PerpetualPreference Shares remain outstanding and continue to trade in the NYSE.
Following the consummation of the Transaction on June 9, 2021, the Company, GEPIF, Blenheim Holdings Ltd., Blenheim Special Investments Holding Ltd. and Olympic LNG Investments Ltd. (the “Rolling Shareholders”) entered into a shareholders’ agreement with respect to the governance of the Company (the “Shareholders’ Agreement”). Pursuant to the Shareholders’ Agreement, the board of directors of the Company were reduced to five persons, and the Rolling Shareholders that are party to the Shareholders’ Agreement willappoint a majority of the Company’s board of directors in accordance with the terms of the Shareholders’ Agreement. In addition, PeterG. Livanos holds a proxy to vote the shares of the Rolling Shareholders under the terms of the Shareholders’ Agreement and, as a resultof holding such proxy, controls more than a majority of the voting stock of the Company and controls the right to appoint a majority ofthe board of the Company.
As of June 30, 2021, GasLog held a 33.3% ownership interest (including the 2% interest through general partner units) in GasLogPartners LP (“GasLog Partners” or the “Partnership”) and, as a result of its ownership of the general partner and the fact that the generalpartner elects the majority of the Partnership’s directors in accordance with the Partnership Agreement, GasLog has the ability to controlthe Partnership’s affairs and policies. Consequently, GasLog Partners is consolidated in the Group’s financial statements.
The accompanying unaudited condensed consolidated financial statements include the financial statements of GasLog and itssubsidiaries. All subsidiaries included in the unaudited condensed consolidated financial statements are 100% held (either directly orindirectly) by GasLog, except for GasLog Partners and its subsidiaries. In comparison to the Group’s structure for the year endedDecember 31, 2020, no new subsidiaries were established or acquired in the three and six months ended June 30, 2021.
2. Basis of Presentation
These unaudited condensed consolidated financial statements have been prepared in accordance with International AccountingStandard (“IAS”) 34 Interim Financial Reporting as issued by the International Accounting Standards Board (“IASB”). Certaininformation and footnote disclosures required by IFRS for a complete set of annual financial statements have been omitted, and,therefore, these unaudited condensed consolidated financial statements should be read in conjunction with the Group’s annualconsolidated financial statements as of and for the year ended December 31, 2020, filed with the SEC on March 5, 2021.
The critical accounting judgments and key sources of estimation uncertainty were disclosed in the Company’s annual consolidatedfinancial statements for the year ended December 31, 2020 and remain unchanged.
The unaudited condensed consolidated financial statements are expressed in U.S. dollars (“USD”), which is the functional currencyof all of the subsidiaries in the Group because their vessels operate in international shipping markets in which revenues and expenses areprimarily settled in USD, and the Group’s most significant assets and liabilities are paid for and settled in USD.

Table of Contents
F-9
The financial statements are prepared on the historical cost basis, except for the revaluation of derivative financial instruments. Thesame accounting policies and methods of computation have been followed in these unaudited condensed consolidated financialstatements as were applied in the preparation of the Group’s financial statements for the year ended December 31, 2020.
Until December 31, 2020, interest paid and movements of cash collaterals for swaps were presented in the consolidated statement ofcash flows under cash provided by operating activities. IAS 7 Cash Flow Statement does not dictate how interest cash flows should beclassified, but rather allows an entity to determine the classification appropriate to its business. The standard permits entities to presentpayments for interest under either operating or financing activities, provided that the elected presentation is applied consistently fromperiod to period. In 2021, management, after reviewing the Exposure Draft General Presentation and Disclosures issued by the IASB inDecember 2019, elected to reclassify interest paid including cash paid for interest rate swaps held for trading and the movements of cashcollaterals related to the Group’s swaps under cash used in financing activities, in conformity with the proposal of the Exposure Draft toreduce presentation alternatives and classify interest paid as a cash flow arising from financing activities. Management believes that therevised classification provides more relevant information to users, as it better reflects management’s view of the financing nature of thesetransactions. Comparative figures have been retrospectively adjusted to reflect this change in policy in the statement of cash flows, asfollows:
Six months ended June 30, 2020 As previously reported Adjustments As restated
Net cash provided by operating activities 72,848 135,536 208,384Net cash used in investing activities (371,179) — (371,179)Net cash provided by financing activities 209,621 (135,536) 74,085Effects of exchange rate changes on cash and cash
equivalents (2,123) — (2,123)Decrease in cash and cash equivalents (90,833) — (90,833)
On August 5, 2021, GasLog’s board of directors authorized the unaudited condensed consolidated financial statements for issuance.
As of June 30, 2021, GasLog’s current assets totaled $297,591, while current liabilities totaled $770,995, resulting in a negativeworking capital position of $473,404. Current liabilities include $315,000 relating to the 8.875% senior unsecured notes due in 2022 (the“8.875% Senior Notes”) which will mature on March 22, 2022 (and we plan to refinance in due course) and $61,406 of unearnedrevenue in relation to hires received in advance of June 30, 2021 (which represents a non-cash liability that will be recognized as revenuein July as the services are rendered).
Management monitors the Company’s liquidity position throughout the year to ensure that it has access to sufficient funds to meetits forecast cash requirements, including newbuilding and debt service commitments, and to monitor compliance with the financialcovenants within its loan and bond facilities. Considering the volatile commercial and financial market conditions experiencedthroughout 2020 due to the COVID-19 pandemic and the continued uncertainty surrounding the long-term impact of the pandemic,management anticipates that our primary sources of funds for at least twelve months from the date of this report will be available cash,cash from operations and existing borrowings. Management believes that these anticipated sources of funds will be sufficient for theCompany to meet its liquidity needs and to comply with its banking covenants for at least twelve months from the date of this report andtherefore it is appropriate to prepare the financial statements on a going concern basis. In relation to the 8.875% Senior Notes that matureon March 22, 2022, the Company is exploring all options available and has productive discussions with financiers to complete thisrefinancing on time subject to market conditions. In addition, the Company may enter into new debt facilities in the future, as well asequity or debt instruments, although there can be no assurance that the Company will be able to obtain additional financings on termsacceptable to the Company, which will also depend on financial, commercial and other factors that are beyond the Company’s control.
Adoption of new and revised IFRS
(a) Standards and interpretations adopted in the current period
In August 2020, the IASB issued the Phase 2 amendments to IFRS 9 Financial Instruments, IFRS 7 Financial Instruments:Disclosures, IFRS 4 and IFRS 16 in connection with the Phase 2 of the interest rate benchmark reform. The amendments address theissues arising from the implementation of the reforms, including the replacement of one benchmark with an alternative one. Theamendment is effective for annual periods beginning on or after January 1, 2021. Management anticipates that this amendment will nothave a material impact on the Group’s consolidated financial statements.

Table of Contents
F-10
(b) Standards and amendments in issue not yet adopted
In January 2020, the IASB issued a narrow-scope amendment to IAS 1 Presentation of Financial Statements, to clarify thatliabilities are classified as either current or non-current, depending on the rights that exist at the end of the reporting period.Classification is unaffected by the expectations of the entity or events after the reporting date (for example, the receipt of a waiver or abreach of covenant). The amendment also defines the “settlement” of a liability as the extinguishment of a liability with cash, othereconomic resources or an entity’s own equity instruments. The amendment will be effective for annual periods beginning on or afterJanuary 1, 2022 and should be applied retrospectively in accordance with IAS 8 Accounting Policies, Changes in Accounting Estimatesand Errors. Earlier application is permitted. Management anticipates that this amendment will not have a material impact on the Group’sfinancial statements.
3. Investment in Associates
The movements in investment in associates are reported in the following table:
June 30, 2021As of January 1, 2021 21,759Share of profit of associates 1,120Dividend declared (450)As of June 30, 2021 22,429
4. Tangible Fixed Assets and Vessels Under Construction
The movements in tangible fixed assets and vessels under construction are reported in the following table:
Office property Totaland other tangible fixed Vessels under
Vessels tangible assets assets constructionCost As of January 1, 2021 6,078,041 33,380 6,111,421 132,839Additions 11,647 1,889 13,536 321,563Transfer from vessels under construction 375,710 — 375,710 (375,710)Fully amortized fixed assets (8,626) — (8,626) —As of June 30, 2021 6,456,772 35,269 6,492,041 78,692
Accumulated depreciationAs of January 1, 2021 1,076,867 6,045 1,082,912 —Depreciation expense 90,446 319 90,765 —Fully amortized fixed assets (8,626) — (8,626) —As of June 30, 2021 1,158,687 6,364 1,165,051 —
Net book valueAs of December 31, 2020 5,001,174 27,335 5,028,509 132,839As of June 30, 2021 5,298,085 28,905 5,326,990 78,692
Vessels with an aggregate carrying amount of $5,298,085 as of June 30, 2021 (December 31, 2020: $5,001,174) have been pledgedas collateral under the terms of the Group’s credit facilities.
As of June 30, 2021, the Company concluded that there were no events or circumstances triggering the existence of potentialimpairment or reversal of impairment of its vessels.

Table of Contents
F-11
Vessels under construction
As of June 30, 2021, GasLog has the following newbuilding on order at Samsung Heavy Industries Co., Ltd. (“Samsung”):
Cargo CapacityDate of Estimated cubic meters
LNG Carrier agreement delivery (“cbm”)Hull No. 2312 December 2018 Q3 2021 180,000
Vessels under construction represent scheduled advance payments to the shipyards as well as certain capitalized expenditures.
5. Leases
The movements in right-of-use assets are reported in the following table:
Vessels’Right-of-Use Assets Vessel Equipment Properties Other TotalAs of January 1, 2021 197,668 1,437 4,258 74 203,437Additions, net — 1,014 1,914 (42) 2,886Depreciation expense (4,110) (643) (651) (14) (5,418)As of June 30, 2021 193,558 1,808 5,521 18 200,905
An analysis of the lease liabilities is as follows:
Lease LiabilitiesAs of January 1, 2021 196,170Additions, net 2,886Lease charge (Note 16) 4,826Payments (10,324)As of June 30, 2021 193,558Lease liability, current portion 9,950Lease liability, non-current portion 183,608Total 193,558
6. Other Non-Current Assets
Other non-current assets consist of the following:
December 31, 2020 June 30, 2021Various guarantees 289 288Other long-term assets 5,378 5,069Cash collaterals on swaps 6,796 213Total 12,463 5,570
Cash collaterals on swaps represent cash deposited for the Group’s interest rate swaps and CCSs, being the difference between theirfair value and an agreed threshold. An amount of $8,017 of cash collaterals has been included in Prepayments and other current assets(December 31, 2020: $16,671).
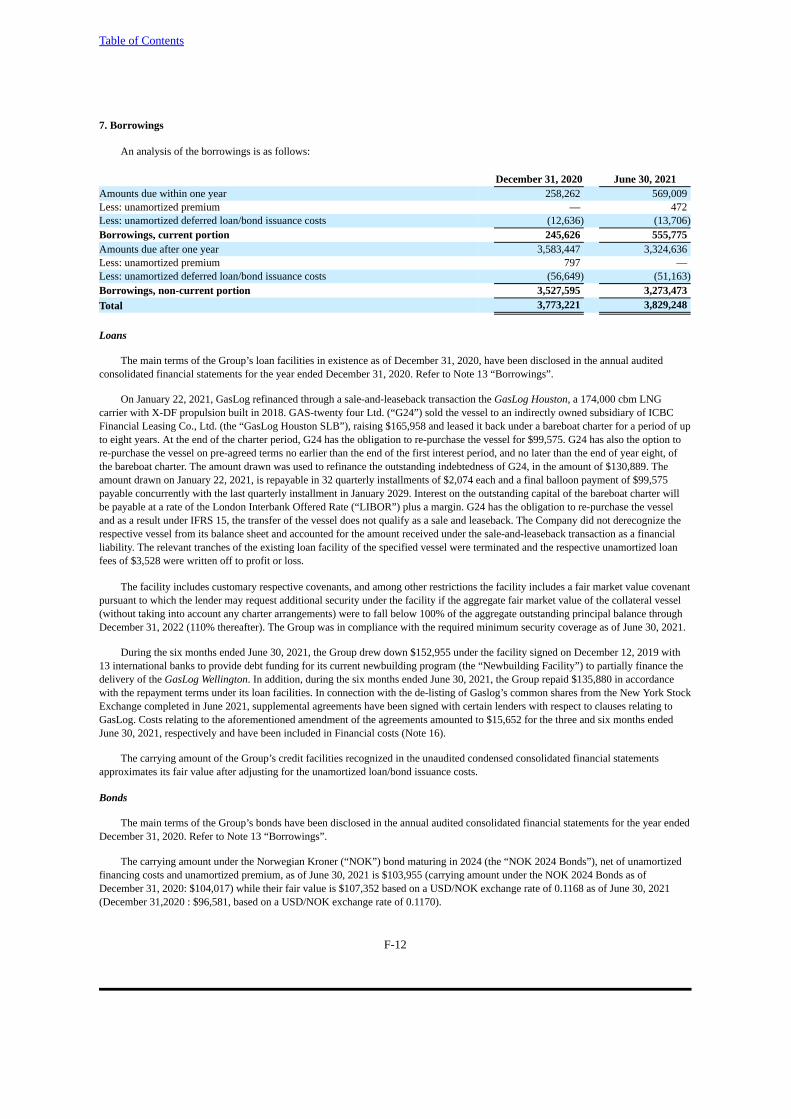
Table of Contents
F-12
7. Borrowings
An analysis of the borrowings is as follows:
December 31, 2020 June 30, 2021Amounts due within one year 258,262 569,009Less: unamortized premium — 472Less: unamortized deferred loan/bond issuance costs (12,636) (13,706)Borrowings, current portion 245,626 555,775Amounts due after one year 3,583,447 3,324,636Less: unamortized premium 797 —Less: unamortized deferred loan/bond issuance costs (56,649) (51,163)Borrowings, non-current portion 3,527,595 3,273,473Total 3,773,221 3,829,248
Loans
The main terms of the Group’s loan facilities in existence as of December 31, 2020, have been disclosed in the annual auditedconsolidated financial statements for the year ended December 31, 2020. Refer to Note 13 “Borrowings”.
On January 22, 2021, GasLog refinanced through a sale-and-leaseback transaction the GasLog Houston, a 174,000 cbm LNGcarrier with X-DF propulsion built in 2018. GAS-twenty four Ltd. (“G24”) sold the vessel to an indirectly owned subsidiary of ICBCFinancial Leasing Co., Ltd. (the “GasLog Houston SLB”), raising $165,958 and leased it back under a bareboat charter for a period of upto eight years. At the end of the charter period, G24 has the obligation to re-purchase the vessel for $99,575. G24 has also the option tore-purchase the vessel on pre-agreed terms no earlier than the end of the first interest period, and no later than the end of year eight, ofthe bareboat charter. The amount drawn was used to refinance the outstanding indebtedness of G24, in the amount of $130,889. Theamount drawn on January 22, 2021, is repayable in 32 quarterly installments of $2,074 each and a final balloon payment of $99,575payable concurrently with the last quarterly installment in January 2029. Interest on the outstanding capital of the bareboat charter willbe payable at a rate of the London Interbank Offered Rate (“LIBOR”) plus a margin. G24 has the obligation to re-purchase the vesseland as a result under IFRS 15, the transfer of the vessel does not qualify as a sale and leaseback. The Company did not derecognize therespective vessel from its balance sheet and accounted for the amount received under the sale-and-leaseback transaction as a financialliability. The relevant tranches of the existing loan facility of the specified vessel were terminated and the respective unamortized loanfees of $3,528 were written off to profit or loss.
The facility includes customary respective covenants, and among other restrictions the facility includes a fair market value covenantpursuant to which the lender may request additional security under the facility if the aggregate fair market value of the collateral vessel(without taking into account any charter arrangements) were to fall below 100% of the aggregate outstanding principal balance throughDecember 31, 2022 (110% thereafter). The Group was in compliance with the required minimum security coverage as of June 30, 2021.
During the six months ended June 30, 2021, the Group drew down $152,955 under the facility signed on December 12, 2019 with13 international banks to provide debt funding for its current newbuilding program (the “Newbuilding Facility”) to partially finance thedelivery of the GasLog Wellington. In addition, during the six months ended June 30, 2021, the Group repaid $135,880 in accordancewith the repayment terms under its loan facilities. In connection with the de-listing of Gaslog’s common shares from the New York StockExchange completed in June 2021, supplemental agreements have been signed with certain lenders with respect to clauses relating toGasLog. Costs relating to the aforementioned amendment of the agreements amounted to $15,652 for the three and six months endedJune 30, 2021, respectively and have been included in Financial costs (Note 16).
The carrying amount of the Group’s credit facilities recognized in the unaudited condensed consolidated financial statementsapproximates its fair value after adjusting for the unamortized loan/bond issuance costs.
Bonds
The main terms of the Group’s bonds have been disclosed in the annual audited consolidated financial statements for the year endedDecember 31, 2020. Refer to Note 13 “Borrowings”.
The carrying amount under the Norwegian Kroner (“NOK”) bond maturing in 2024 (the “NOK 2024 Bonds”), net of unamortizedfinancing costs and unamortized premium, as of June 30, 2021 is $103,955 (carrying amount under the NOK 2024 Bonds as ofDecember 31, 2020: $104,017) while their fair value is $107,352 based on a USD/NOK exchange rate of 0.1168 as of June 30, 2021(December 31,2020 : $96,581, based on a USD/NOK exchange rate of 0.1170).
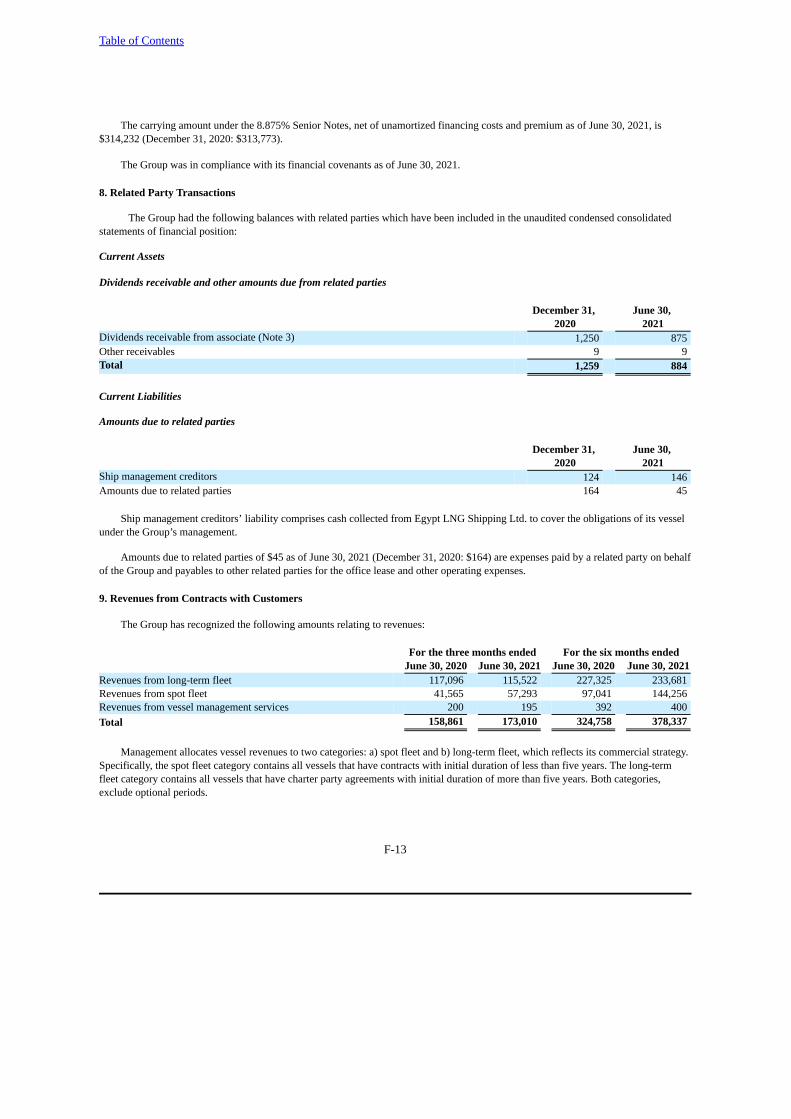
Table of Contents
F-13
The carrying amount under the 8.875% Senior Notes, net of unamortized financing costs and premium as of June 30, 2021, is$314,232 (December 31, 2020: $313,773).
The Group was in compliance with its financial covenants as of June 30, 2021.
8. Related Party Transactions
The Group had the following balances with related parties which have been included in the unaudited condensed consolidatedstatements of financial position:
Current Assets
Dividends receivable and other amounts due from related parties
December 31, June 30, 2020 2021
Dividends receivable from associate (Note 3) 1,250 875Other receivables 9 9Total 1,259 884
Current Liabilities
Amounts due to related parties
December 31, June 30, 2020 2021
Ship management creditors 124 146Amounts due to related parties 164 45
Ship management creditors’ liability comprises cash collected from Egypt LNG Shipping Ltd. to cover the obligations of its vesselunder the Group’s management.
Amounts due to related parties of $45 as of June 30, 2021 (December 31, 2020: $164) are expenses paid by a related party on behalfof the Group and payables to other related parties for the office lease and other operating expenses.
9. Revenues from Contracts with Customers
The Group has recognized the following amounts relating to revenues:
For the three months ended For the six months ended June 30, 2020 June 30, 2021 June 30, 2020 June 30, 2021
Revenues from long-term fleet 117,096 115,522 227,325 233,681Revenues from spot fleet 41,565 57,293 97,041 144,256Revenues from vessel management services 200 195 392 400Total 158,861 173,010 324,758 378,337
Management allocates vessel revenues to two categories: a) spot fleet and b) long-term fleet, which reflects its commercial strategy.Specifically, the spot fleet category contains all vessels that have contracts with initial duration of less than five years. The long-term fleet category contains all vessels that have charter party agreements with initial duration of more than five years. Both categories, exclude optional periods.
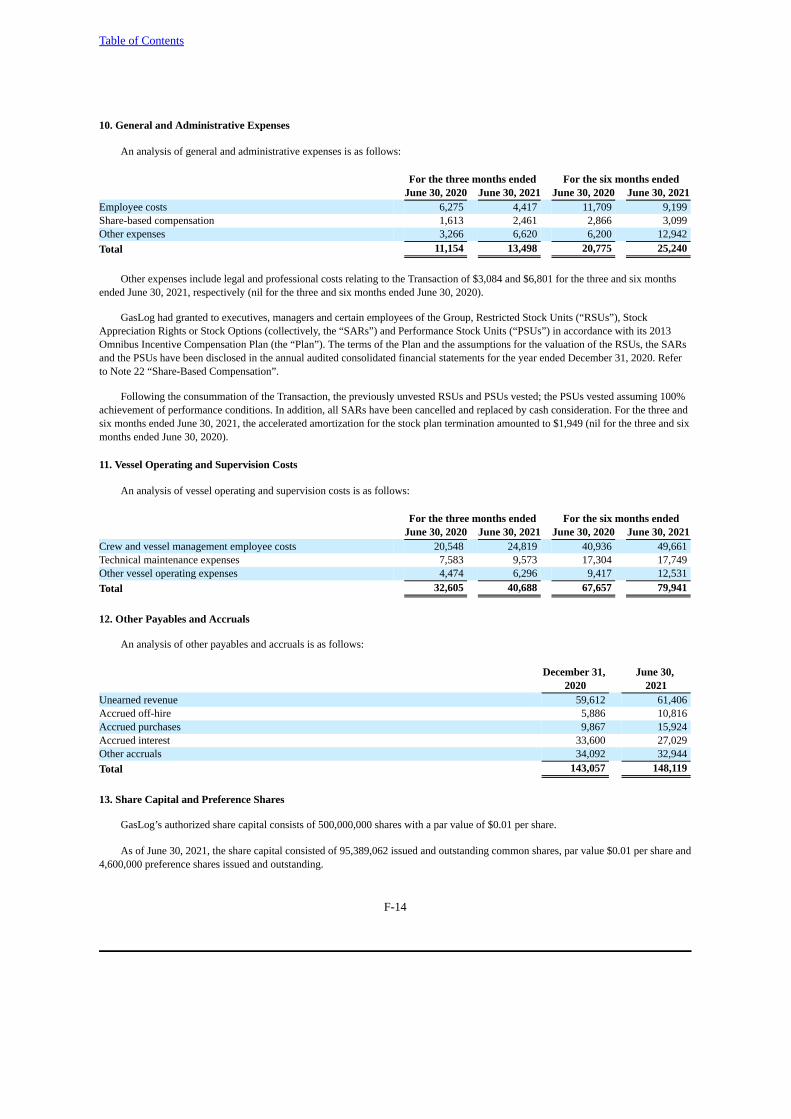
Table of Contents
F-14
10. General and Administrative Expenses
An analysis of general and administrative expenses is as follows:
For the three months ended For the six months ended June 30, 2020 June 30, 2021 June 30, 2020 June 30, 2021
Employee costs 6,275 4,417 11,709 9,199Share-based compensation 1,613 2,461 2,866 3,099Other expenses 3,266 6,620 6,200 12,942Total 11,154 13,498 20,775 25,240
Other expenses include legal and professional costs relating to the Transaction of $3,084 and $6,801 for the three and six monthsended June 30, 2021, respectively (nil for the three and six months ended June 30, 2020).
GasLog had granted to executives, managers and certain employees of the Group, Restricted Stock Units (“RSUs”), StockAppreciation Rights or Stock Options (collectively, the “SARs”) and Performance Stock Units (“PSUs”) in accordance with its 2013Omnibus Incentive Compensation Plan (the “Plan”). The terms of the Plan and the assumptions for the valuation of the RSUs, the SARsand the PSUs have been disclosed in the annual audited consolidated financial statements for the year ended December 31, 2020. Referto Note 22 “Share-Based Compensation”.
Following the consummation of the Transaction, the previously unvested RSUs and PSUs vested; the PSUs vested assuming 100%achievement of performance conditions. In addition, all SARs have been cancelled and replaced by cash consideration. For the three andsix months ended June 30, 2021, the accelerated amortization for the stock plan termination amounted to $1,949 (nil for the three and sixmonths ended June 30, 2020).
11. Vessel Operating and Supervision Costs
An analysis of vessel operating and supervision costs is as follows:
For the three months ended For the six months ended June 30, 2020 June 30, 2021 June 30, 2020 June 30, 2021
Crew and vessel management employee costs 20,548 24,819 40,936 49,661Technical maintenance expenses 7,583 9,573 17,304 17,749Other vessel operating expenses 4,474 6,296 9,417 12,531Total 32,605 40,688 67,657 79,941
12. Other Payables and Accruals
An analysis of other payables and accruals is as follows:
December 31, June 30, 2020 2021
Unearned revenue 59,612 61,406Accrued off-hire 5,886 10,816Accrued purchases 9,867 15,924Accrued interest 33,600 27,029Other accruals 34,092 32,944Total 143,057 148,119
13. Share Capital and Preference Shares
GasLog’s authorized share capital consists of 500,000,000 shares with a par value of $0.01 per share.
As of June 30, 2021, the share capital consisted of 95,389,062 issued and outstanding common shares, par value $0.01 per share and4,600,000 preference shares issued and outstanding.
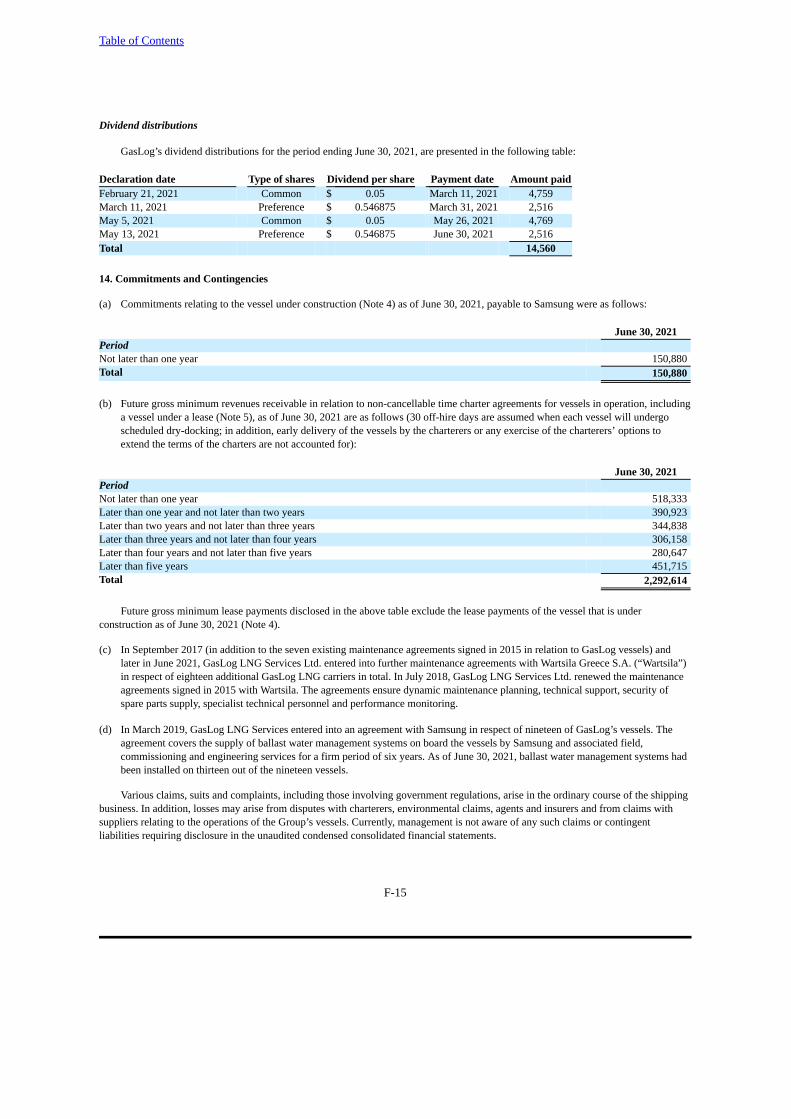
Table of Contents
F-15
Dividend distributions
GasLog’s dividend distributions for the period ending June 30, 2021, are presented in the following table:
Declaration date Type of shares Dividend per share Payment date Amount paidFebruary 21, 2021 Common $ 0.05 March 11, 2021 4,759March 11, 2021 Preference $ 0.546875 March 31, 2021 2,516May 5, 2021 Common $ 0.05 May 26, 2021 4,769May 13, 2021 Preference $ 0.546875 June 30, 2021 2,516Total 14,560
14. Commitments and Contingencies
(a) Commitments relating to the vessel under construction (Note 4) as of June 30, 2021, payable to Samsung were as follows:
June 30, 2021PeriodNot later than one year 150,880Total 150,880
(b) Future gross minimum revenues receivable in relation to non-cancellable time charter agreements for vessels in operation, includinga vessel under a lease (Note 5), as of June 30, 2021 are as follows (30 off-hire days are assumed when each vessel will undergoscheduled dry-docking; in addition, early delivery of the vessels by the charterers or any exercise of the charterers’ options toextend the terms of the charters are not accounted for):
June 30, 2021PeriodNot later than one year 518,333Later than one year and not later than two years 390,923Later than two years and not later than three years 344,838Later than three years and not later than four years 306,158Later than four years and not later than five years 280,647Later than five years 451,715Total 2,292,614
Future gross minimum lease payments disclosed in the above table exclude the lease payments of the vessel that is underconstruction as of June 30, 2021 (Note 4).
(c) In September 2017 (in addition to the seven existing maintenance agreements signed in 2015 in relation to GasLog vessels) andlater in June 2021, GasLog LNG Services Ltd. entered into further maintenance agreements with Wartsila Greece S.A. (“Wartsila”)in respect of eighteen additional GasLog LNG carriers in total. In July 2018, GasLog LNG Services Ltd. renewed the maintenanceagreements signed in 2015 with Wartsila. The agreements ensure dynamic maintenance planning, technical support, security ofspare parts supply, specialist technical personnel and performance monitoring.
(d) In March 2019, GasLog LNG Services entered into an agreement with Samsung in respect of nineteen of GasLog’s vessels. Theagreement covers the supply of ballast water management systems on board the vessels by Samsung and associated field,commissioning and engineering services for a firm period of six years. As of June 30, 2021, ballast water management systems hadbeen installed on thirteen out of the nineteen vessels.
Various claims, suits and complaints, including those involving government regulations, arise in the ordinary course of the shippingbusiness. In addition, losses may arise from disputes with charterers, environmental claims, agents and insurers and from claims withsuppliers relating to the operations of the Group’s vessels. Currently, management is not aware of any such claims or contingentliabilities requiring disclosure in the unaudited condensed consolidated financial statements.
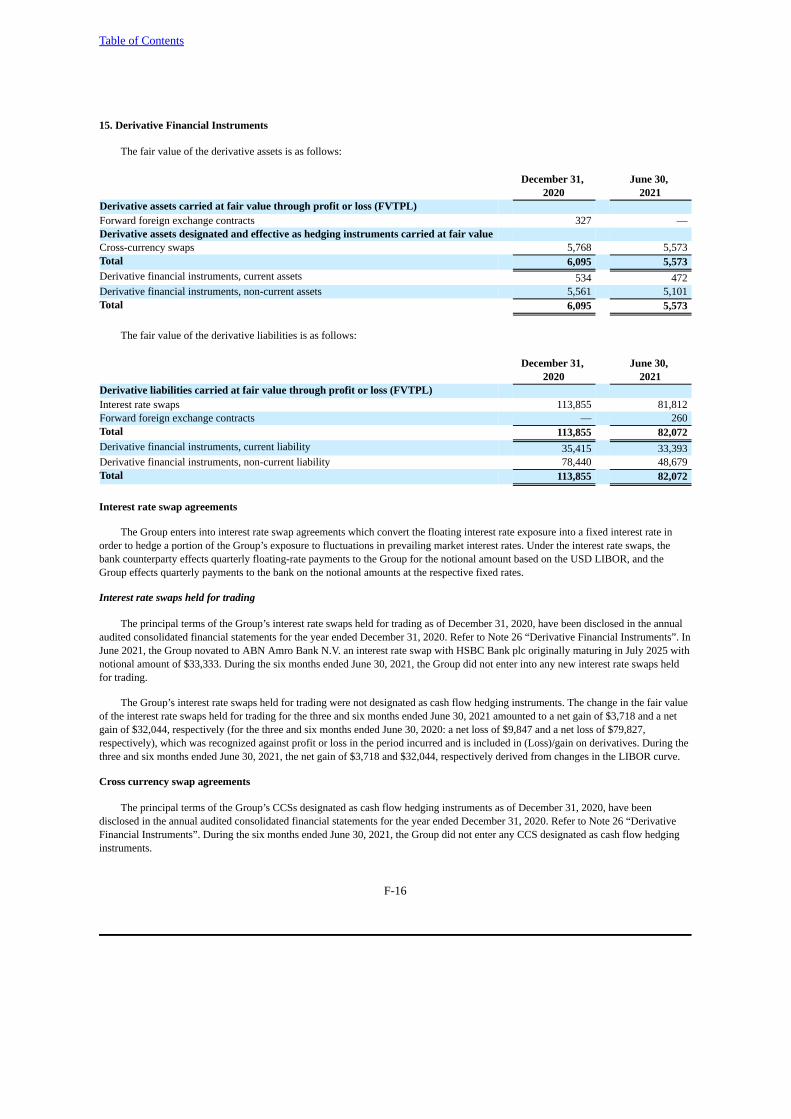
Table of Contents
F-16
15. Derivative Financial Instruments
The fair value of the derivative assets is as follows:
December 31, June 30, 2020 2021
Derivative assets carried at fair value through profit or loss (FVTPL) Forward foreign exchange contracts 327 —Derivative assets designated and effective as hedging instruments carried at fair value Cross-currency swaps 5,768 5,573Total 6,095 5,573Derivative financial instruments, current assets 534 472Derivative financial instruments, non-current assets 5,561 5,101Total 6,095 5,573
The fair value of the derivative liabilities is as follows:
December 31, June 30, 2020 2021
Derivative liabilities carried at fair value through profit or loss (FVTPL) Interest rate swaps 113,855 81,812Forward foreign exchange contracts — 260Total 113,855 82,072Derivative financial instruments, current liability 35,415 33,393Derivative financial instruments, non-current liability 78,440 48,679Total 113,855 82,072
Interest rate swap agreements
The Group enters into interest rate swap agreements which convert the floating interest rate exposure into a fixed interest rate inorder to hedge a portion of the Group’s exposure to fluctuations in prevailing market interest rates. Under the interest rate swaps, thebank counterparty effects quarterly floating-rate payments to the Group for the notional amount based on the USD LIBOR, and theGroup effects quarterly payments to the bank on the notional amounts at the respective fixed rates.
Interest rate swaps held for trading
The principal terms of the Group’s interest rate swaps held for trading as of December 31, 2020, have been disclosed in the annualaudited consolidated financial statements for the year ended December 31, 2020. Refer to Note 26 “Derivative Financial Instruments”. InJune 2021, the Group novated to ABN Amro Bank N.V. an interest rate swap with HSBC Bank plc originally maturing in July 2025 withnotional amount of $33,333. During the six months ended June 30, 2021, the Group did not enter into any new interest rate swaps heldfor trading.
The Group’s interest rate swaps held for trading were not designated as cash flow hedging instruments. The change in the fair valueof the interest rate swaps held for trading for the three and six months ended June 30, 2021 amounted to a net gain of $3,718 and a netgain of $32,044, respectively (for the three and six months ended June 30, 2020: a net loss of $9,847 and a net loss of $79,827,respectively), which was recognized against profit or loss in the period incurred and is included in (Loss)/gain on derivatives. During thethree and six months ended June 30, 2021, the net gain of $3,718 and $32,044, respectively derived from changes in the LIBOR curve.
Cross currency swap agreements
The principal terms of the Group’s CCSs designated as cash flow hedging instruments as of December 31, 2020, have beendisclosed in the annual audited consolidated financial statements for the year ended December 31, 2020. Refer to Note 26 “DerivativeFinancial Instruments”. During the six months ended June 30, 2021, the Group did not enter any CCS designated as cash flow hedginginstruments.

Table of Contents
F-17
For the three and six months ended June 30, 2021, the effective portion of changes in the fair value of CCSs amounting to a gain of$1,024 and a loss of $153, respectively, has been recognized in Other comprehensive income/(loss) (for the three and six months endedJune 30, 2020: a gain of $8,985 and a loss of $11,782, respectively). For the three and six months ended June 30, 2021, a gain of $106and $157, respectively, was recycled to profit or loss representing the realized gain on CCSs in relation to the interest expensescomponent of the hedge (for the three and six months ended June 30, 2020: a loss of $240 and $455, respectively). Additionally, for thethree and six months ended June 30, 2021, a gain of $77 and a gain of $207, respectively, was recognized in Other comprehensiveincome/(loss) in relation to the translation of the NOK Bonds in USD as of June 30, 2021 (for the three and six months ended June 30,2020: a loss of $7,344 and a gain of $9,098, respectively).
Forward foreign exchange contracts
The Group uses forward foreign exchange contracts to mitigate foreign exchange transaction exposures in Euros (“EUR”). Underthese forward foreign exchange contracts, the bank counterparty will effect fixed payments in EUR to the Group and the Group willeffect fixed payments in USD to the bank counterparty on the respective settlement dates. All forward foreign exchange contracts areconsidered by management to be part of economic hedge arrangements but have not been formally designated as such.
The principal terms of the forward foreign exchange contracts held for trading as of December 31, 2020, have been disclosed in theannual audited consolidated financial statements for the year ended December 31, 2020. Refer to Note 26 “Derivative FinancialInstruments”.
During the six months ended June 30, 2021, the Group entered the following forward foreign exchange contracts which remainunsettled as of June 30, 2021:
Fixed Total ExchangeNumber of Exchange Rate Amount
Company Counterparty Trade Date contracts Settlement Dates (USD/EUR) (in thousands)GasLog ABN Amro Bank N.V. March 2021 3 July-September 2021 1.1964-1.1980 € 7,500GasLog OCBC March 2021 3 October-December 2021 1.1988-1.2000 € 7,500GasLog DNB June 2021 5 August-December 2021 1.1973-1.2000 € 7,500GasLog Citibank Europe PLC UK June 2021 6 October 2021-March 2022 1.1913-1.1955 € 6,000
Total € 28,500
Apart from the abovementioned contracts the Group did not enter any other forward foreign exchange contracts, while 19 contractsexpired with staggered maturities from January to June 2021.
The Group’s forward foreign exchange contracts were not designated as cash flow hedging instruments as of June 30, 2021. Thechange in the fair value of these contracts for the three and six months ended June 30, 2021, amounted to a net gain of $331 and a netloss of $587, respectively (for the three and six months ended June 30, 2020: a net gain of $748 and a net loss of $604, respectively),which was recognized against profit or loss in the period incurred and is included in (Loss)/gain on derivatives.
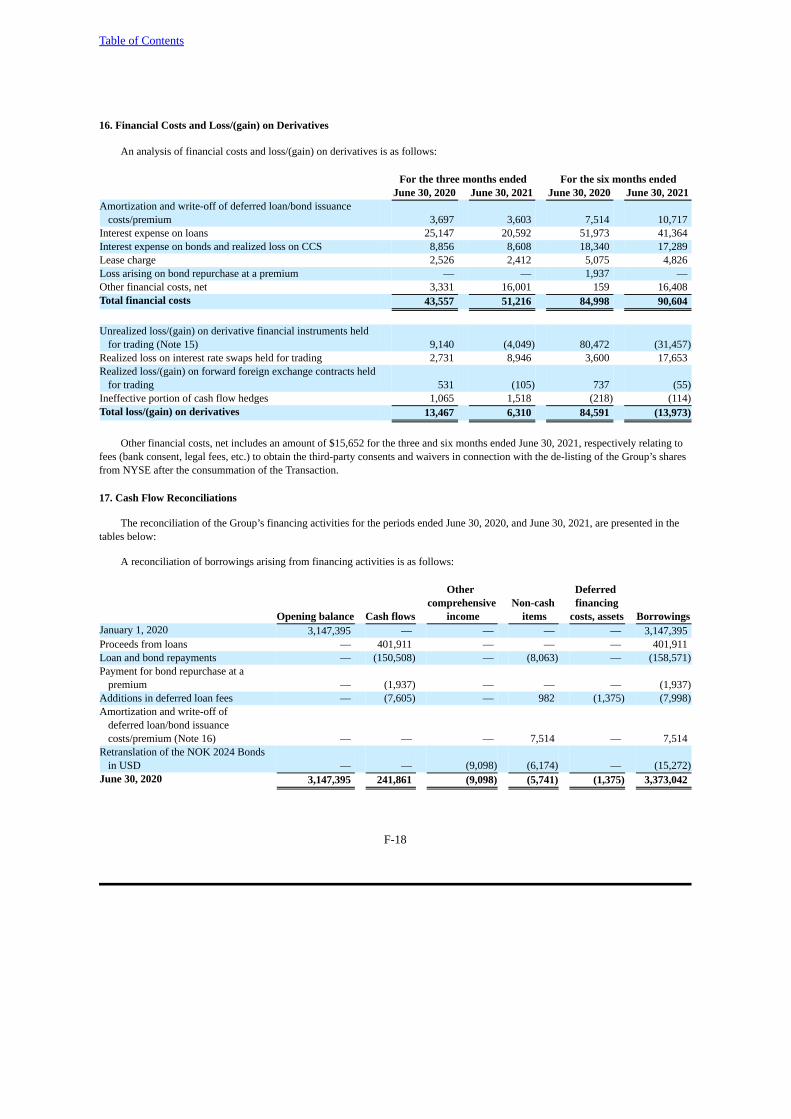
Table of Contents
F-18
16. Financial Costs and Loss/(gain) on Derivatives
An analysis of financial costs and loss/(gain) on derivatives is as follows:
For the three months ended For the six months ended June 30, 2020 June 30, 2021 June 30, 2020 June 30, 2021
Amortization and write-off of deferred loan/bond issuancecosts/premium 3,697 3,603 7,514 10,717
Interest expense on loans 25,147 20,592 51,973 41,364Interest expense on bonds and realized loss on CCS 8,856 8,608 18,340 17,289Lease charge 2,526 2,412 5,075 4,826Loss arising on bond repurchase at a premium — — 1,937 —Other financial costs, net 3,331 16,001 159 16,408Total financial costs 43,557 51,216 84,998 90,604
Unrealized loss/(gain) on derivative financial instruments heldfor trading (Note 15) 9,140 (4,049) 80,472 (31,457)
Realized loss on interest rate swaps held for trading 2,731 8,946 3,600 17,653Realized loss/(gain) on forward foreign exchange contracts held
for trading 531 (105) 737 (55)Ineffective portion of cash flow hedges 1,065 1,518 (218) (114)Total loss/(gain) on derivatives 13,467 6,310 84,591 (13,973)
Other financial costs, net includes an amount of $15,652 for the three and six months ended June 30, 2021, respectively relating tofees (bank consent, legal fees, etc.) to obtain the third-party consents and waivers in connection with the de-listing of the Group’s sharesfrom NYSE after the consummation of the Transaction.
17. Cash Flow Reconciliations
The reconciliation of the Group’s financing activities for the periods ended June 30, 2020, and June 30, 2021, are presented in thetables below:
A reconciliation of borrowings arising from financing activities is as follows:
Other Deferred comprehensive Non-cash financing
Opening balance Cash flows income items costs, assets BorrowingsJanuary 1, 2020 3,147,395 — — — — 3,147,395Proceeds from loans — 401,911 — — — 401,911Loan and bond repayments — (150,508) — (8,063) — (158,571)Payment for bond repurchase at a
premium — (1,937) — — — (1,937)Additions in deferred loan fees — (7,605) — 982 (1,375) (7,998)Amortization and write-off of
deferred loan/bond issuancecosts/premium (Note 16) — — — 7,514 — 7,514
Retranslation of the NOK 2024 Bondsin USD — — (9,098) (6,174) — (15,272)
June 30, 2020 3,147,395 241,861 (9,098) (5,741) (1,375) 3,373,042

Table of Contents
F-19
Other Deferredcomprehensive Non-cash financing costs,
Opening balance Cash flows income items assets BorrowingsJanuary 1, 2021 3,773,221 — — — — 3,773,221Proceeds from loans — 318,913 — — — 318,913Loan and bond repayments — (266,770) — — — (266,770)Additions in deferred loan fees — (4,329) — (392) (1,905) (6,626)Amortization and write-off of
deferred loan/bond issuancecosts/premium (Note 16) — — — 10,717 — 10,717
Retranslation of the NOK 2024Bonds in USD — — (207) — — (207)
June 30, 2021 3,773,221 47,814 (207) 10,325 (1,905) 3,829,248
A reconciliation of derivatives arising from financing activities is as follows:
Othercomprehensive Net derivative
Opening balance Cash flows loss Non-cash items liabilitiesJanuary 1, 2020 (45,931) — — — (45,931)Unrealized loss on derivative financial
instruments held for trading (Note 16) — — — (80,472) (80,472)Ineffective portion of cash flow hedges (Note
16) — — — 218 218Payment for interest rate swaps termination — 10,811 — — 10,811Proceeds from entering into interest rate
swaps — (10,770) — — (10,770)Payment for CCS termination/modification — 4,051 — (4,051) —Effective portion of changes in the fair value
of derivatives designated as cash flowhedging instruments — — (11,327) — (11,327)
June 30, 2020 (45,931) 4,092 (11,327) (84,305) (137,471)
OtherOpening comprehensive Net derivative
balance loss Non-cash items liabilitiesJanuary 1, 2021 (107,760) — — (107,760)Unrealized gain on derivative financial instruments
held for trading (Note 16) — — 31,457 31,457Ineffective portion of cash flow hedges (Note 16) — — 114 114Effective portion of changes in the fair value of
derivatives designated as cash flow hedginginstruments — (310) — (310)
June 30, 2021 (107,760) (310) 31,571 (76,499)
18. Subsequent Events
On August 4, 2021, the board of directors declared a quarterly cash dividend of $0.15 per common share payable on August 11,2021 to shareholders of record as of August 9, 2021.
Related Documents