S I M U L A T I O N M A N A G E M E N T Week3: Getting it together

S I M U L A T I O N M A N A G E M E N T Week3: Getting it together.
Dec 28, 2015
Welcome message from author
This document is posted to help you gain knowledge. Please leave a comment to let me know what you think about it! Share it to your friends and learn new things together.
Transcript

S I M U L A T I O N
M A N A G E M E N T
Week3: Getting it togetherWeek3: Getting it together
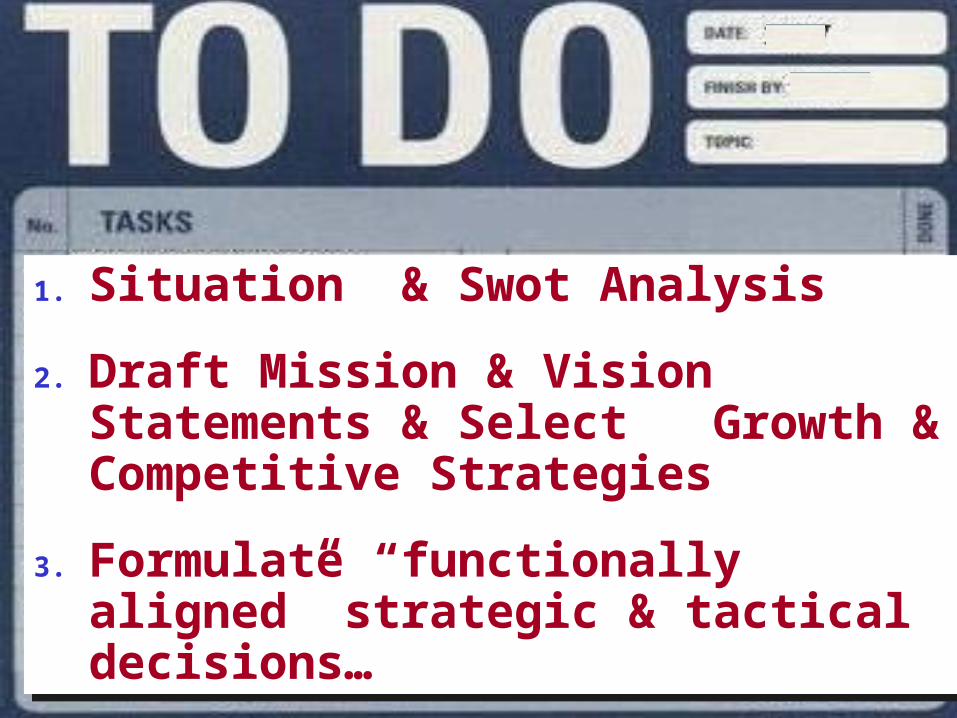
1. Situation & Swot Analysis
2. Draft Mission & Vision Statements & Select Growth & Competitive Strategies
3. Formulate “functionally aligned” strategic & tactical decisions…
1. Situation & Swot Analysis
2. Draft Mission & Vision Statements & Select Growth & Competitive Strategies
3. Formulate “functionally aligned” strategic & tactical decisions…

Process of Planning & Evaluating Strategy
Functional Planning:Functional Planning:Marketing Production
R&D, HRFinance
Market Research:Market Research:Situation & SWOTSituation & SWOT
AnalysisAnalysis
Corp. & SBUCorp. & SBUStrategyStrategy::
Mission & VisionGrowth &
Competitive Strategy
PerformancePerformanceAssessment:Assessment:
Success Measures& Financial Ratios
Performance
Assessment
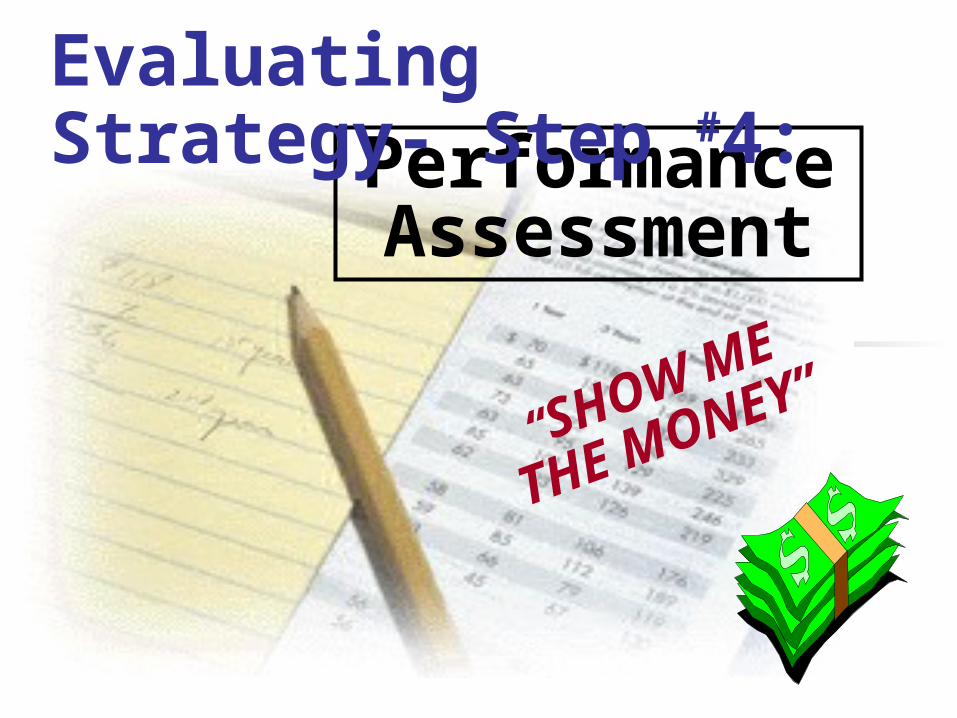
Evaluating Strategy- Step #4:
“SHOW ME
THE
MONEY”

Let’s Examine:
1.Ways to plan & evaluate your financial performance
2.Some Financial Planning guidelines

Financial Proformas & Reports
BalanceBalanceSheetSheet
Financial Financial RatiosRatios
CashCashFlowFlow IncomeIncome
StatementStatement

Shows cash movement in & out of organization
& how much cash is available
Shows cash movement in & out of organization
& how much cash is available

Compares revenues & expenses for the period
Indicates profitability
Compares revenues & expenses for the period
Indicates profitability
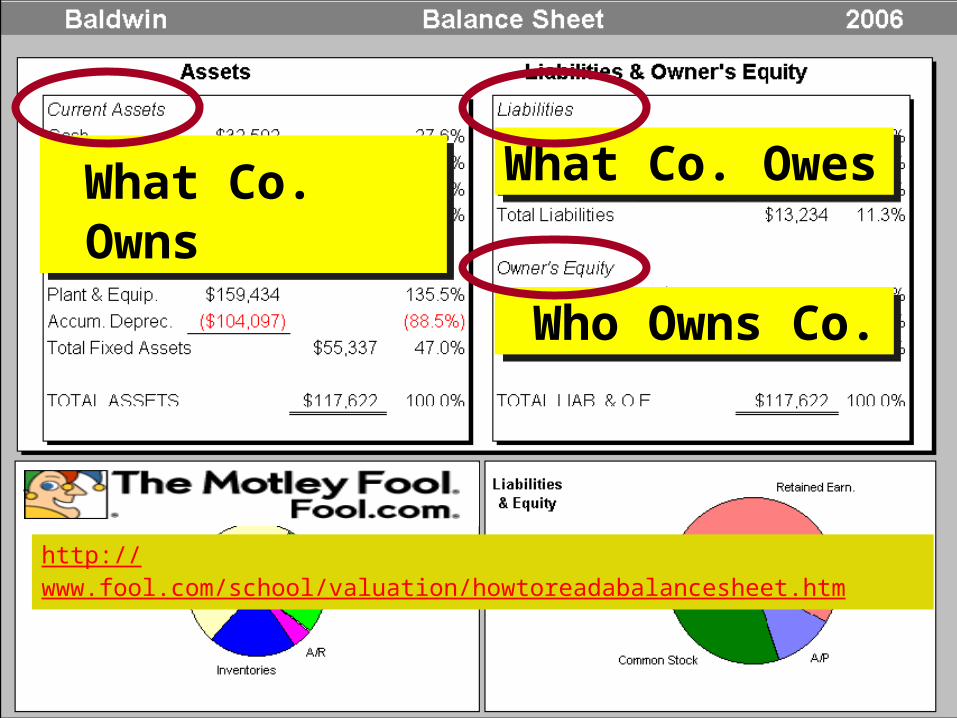
http://www.fool.com/school/valuation/howtoreadabalancesheet.htm
What Co. Owns
What Co. Owns
What Co. Owes
What Co. Owes
Who Owns Co.
Who Owns Co.
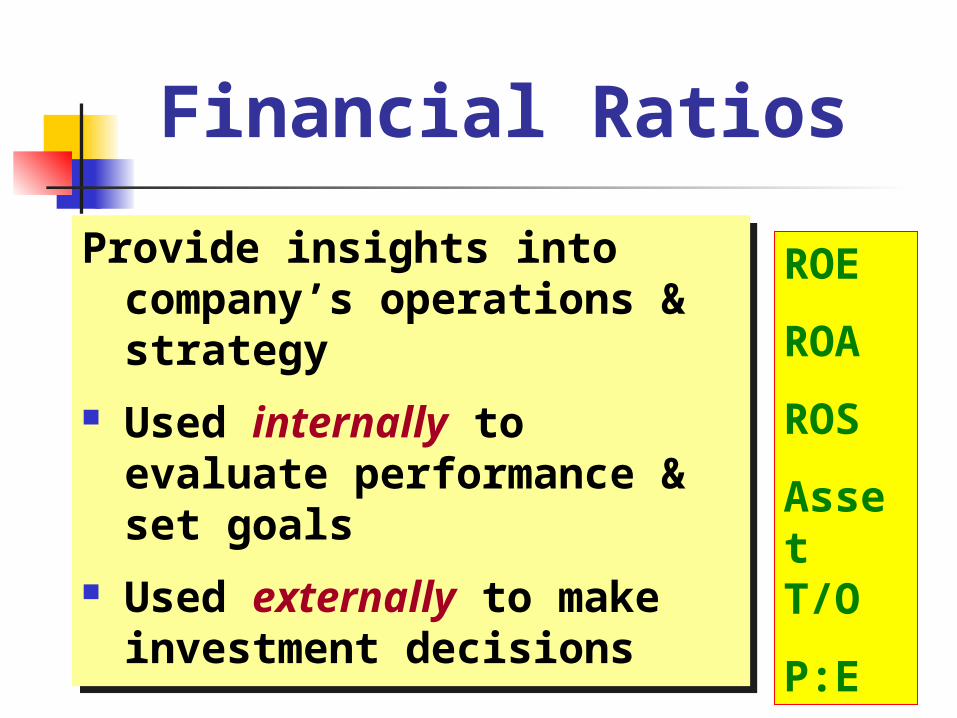
Provide insights into company’s operations & strategy
Used internally to evaluate performance & set goals
Used externally to make investment decisions
Provide insights into company’s operations & strategy
Used internally to evaluate performance & set goals
Used externally to make investment decisions
Financial Ratios
ROE
ROA
ROS
Asset T/O
P:E

Financial Ratios Answer 5 key
Questions
1) How liquid is your firm?2) How profitable is your Firm?3) How effectively are you utilizing
your assets ?4) How are you financing your assets?5) Are you providing your owners an
adequate return on their investment ?
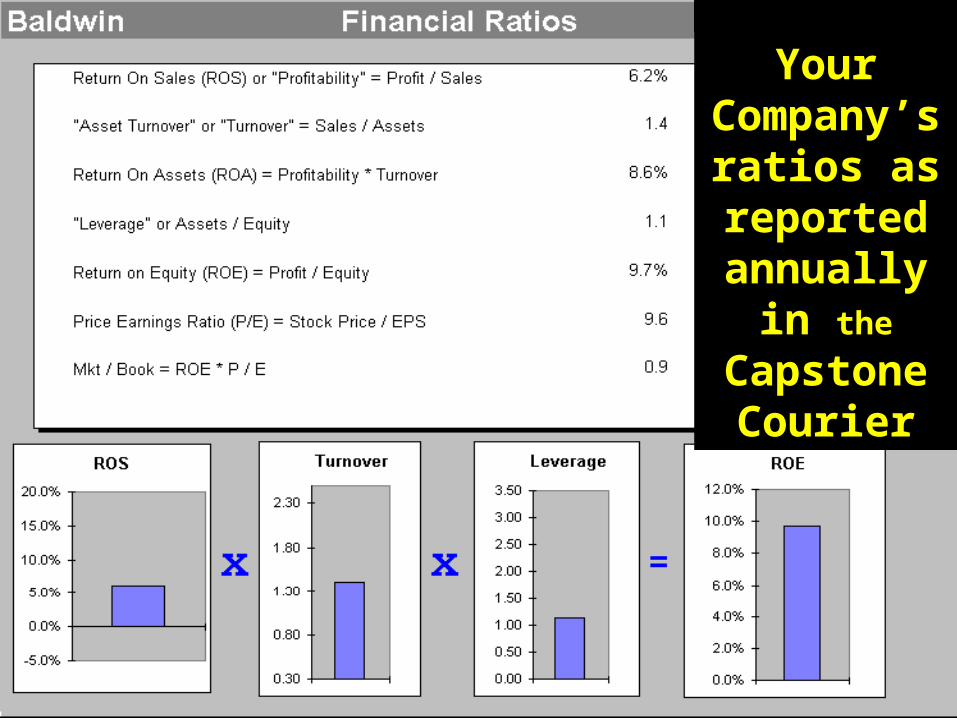
Your Company’s ratios
as reported annually
in the
Capstone Courier

Financial Guidelines Re: Liquidity
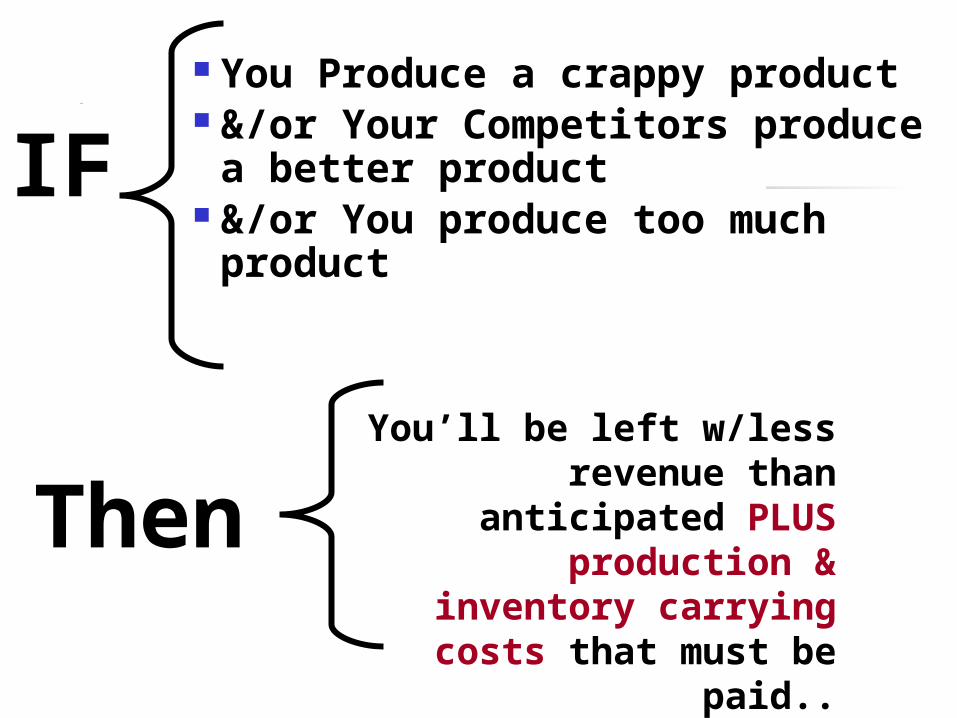
You’ll be left w/less revenue than
anticipated PLUS production &
inventory carrying costs that must be
paid..
IF You Produce a crappy product &/or Your Competitors produce a
better product &/or You produce too much product
Then

You’re left w/less revenue than anticipated and did not plan & allocate enough cash to cover your production & inventory carrying costs....
IF
Then
Big Al arrives -- pays your bills, and leaves you with a loan & a stiff interest payment
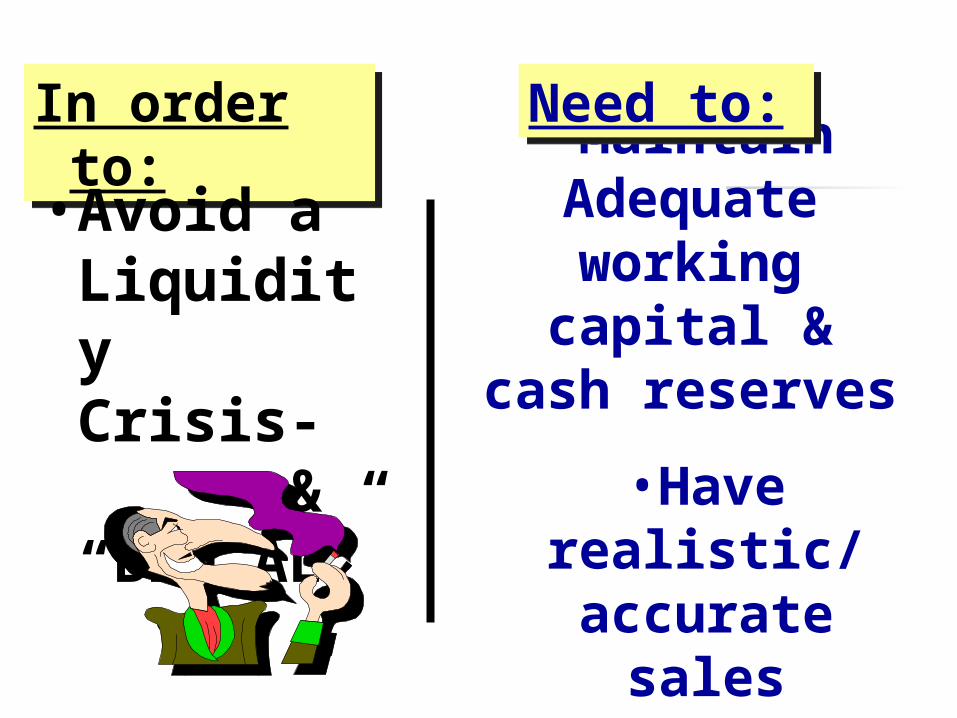
•Maintain Adequate working
capital & cash reserves
In order to:
In order to:
•Have realistic/ accurate
sales forecasts
•Avoid a Liquidity Crisis- & “Big AL”
Need to:Need to:
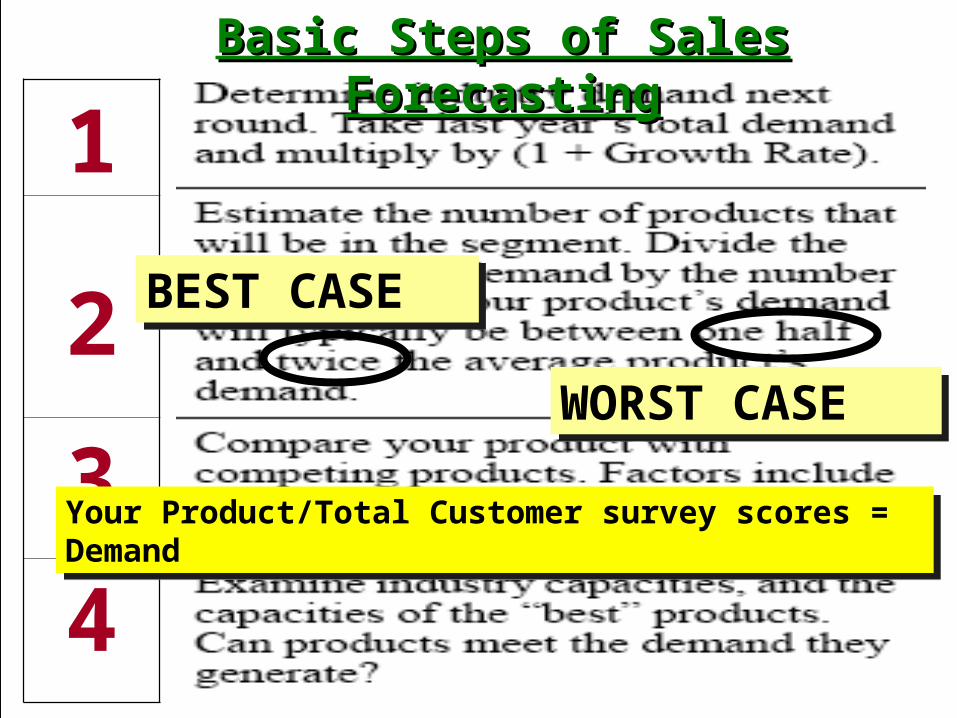
1
2
3
4
Basic Steps of Sales Basic Steps of Sales ForecastingForecasting
BEST CASEBEST CASE
WORST CASEWORST CASE
Your Product/Total Customer survey scores = DemandYour Product/Total Customer survey scores = Demand

•Enter WORSE case- in “your sales forecast” on marketing spreadsheet
•Enter BEST case- in “production schedule” on production spreadsheet
•Spread show up as inventory on proforma BALANCE SHEET

$0.00
In WORSE CASE: You should observe lots of Inventory
& little or no Cash.
In WORSE CASE: You should observe lots of Inventory
& little or no Cash.
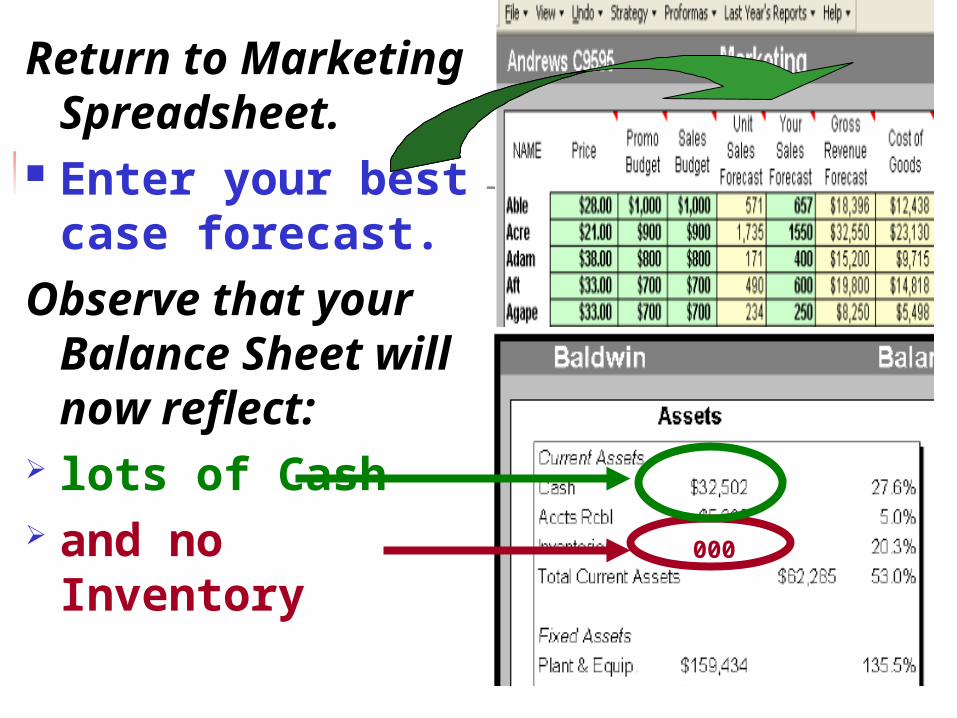
Return to Marketing Spreadsheet.
Enter your best case forecast.
Observe that your Balance Sheet will now reflect:
lots of Cash and no Inventory 000
Important Considerations re: BEST-WORST Scenario
Analyses
By adjusting your CASH POSITION according to your WORST CASE estimate– will avoid …
By adjusting your CASH POSITION according to your WORST CASE estimate– will avoid …

$0.00
In WORSE CASE: You will have lots of Inventory
& thus need to drive your cash position to the black…
In WORSE CASE: You will have lots of Inventory
& thus need to drive your cash position to the black…
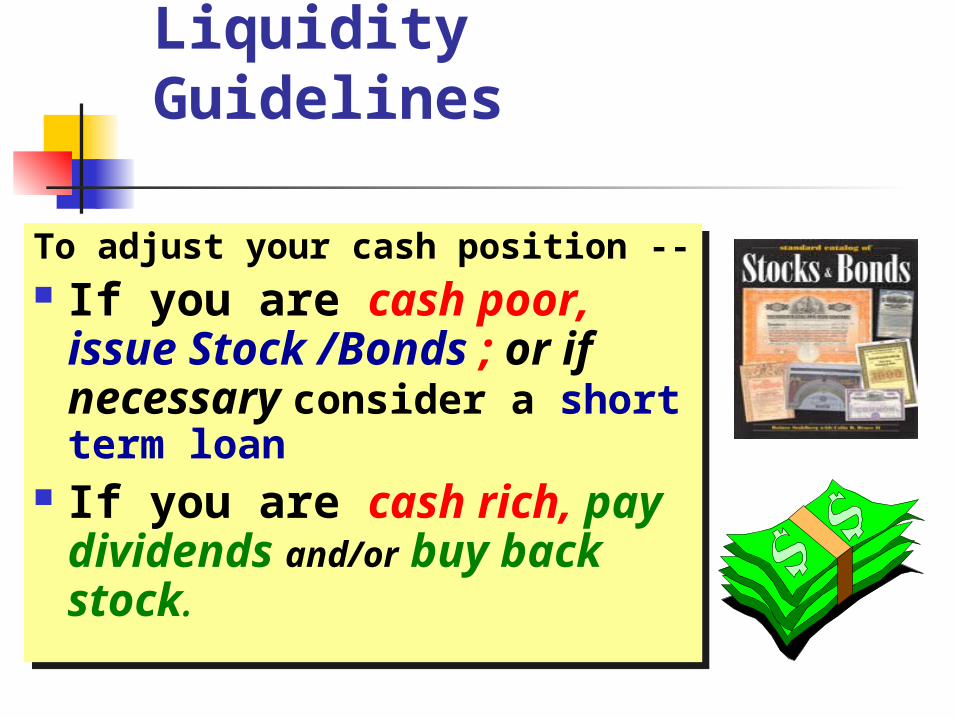
Liquidity Guidelines
To adjust your cash position -- If you are cash poor,
issue Stock /Bonds ; or if necessary consider a short term loan
If you are cash rich, pay dividends and/or buy back stock.
To adjust your cash position -- If you are cash poor,
issue Stock /Bonds ; or if necessary consider a short term loan
If you are cash rich, pay dividends and/or buy back stock.
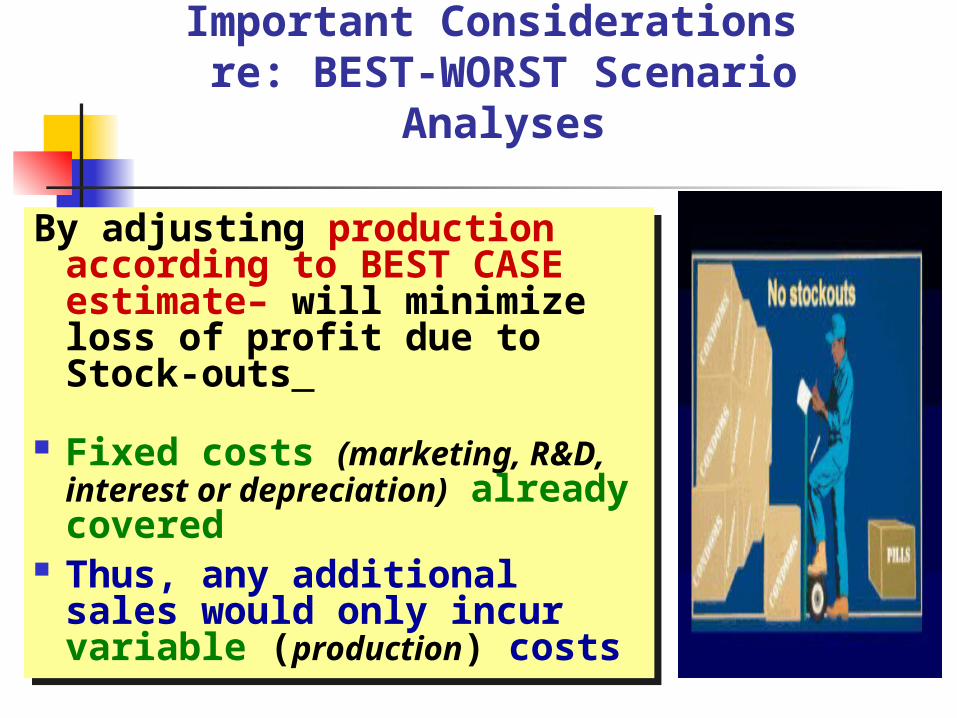
Important Considerations re: BEST-WORST Scenario
Analyses
By adjusting production according to BEST CASE estimate– will minimize loss of profit due to Stock-outs
Fixed costs (marketing, R&D, interest
or depreciation) already covered Thus, any additional sales would
only incur variable (production) costs
By adjusting production according to BEST CASE estimate– will minimize loss of profit due to Stock-outs
Fixed costs (marketing, R&D, interest
or depreciation) already covered Thus, any additional sales would
only incur variable (production) costs
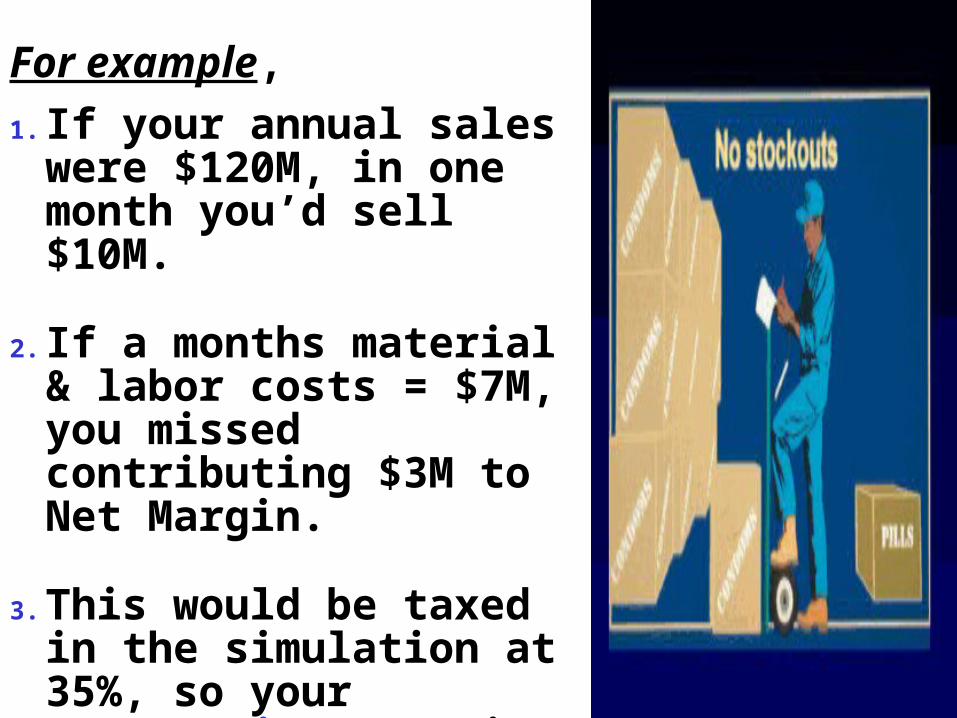
For example, 1. If your annual sales
were $120M, in one month you’d sell $10M.
2. If a months material & labor costs = $7M, you missed contributing $3M to Net Margin.
3. This would be taxed in the simulation at 35%, so your opportunity cost is a missed $2M in profit.
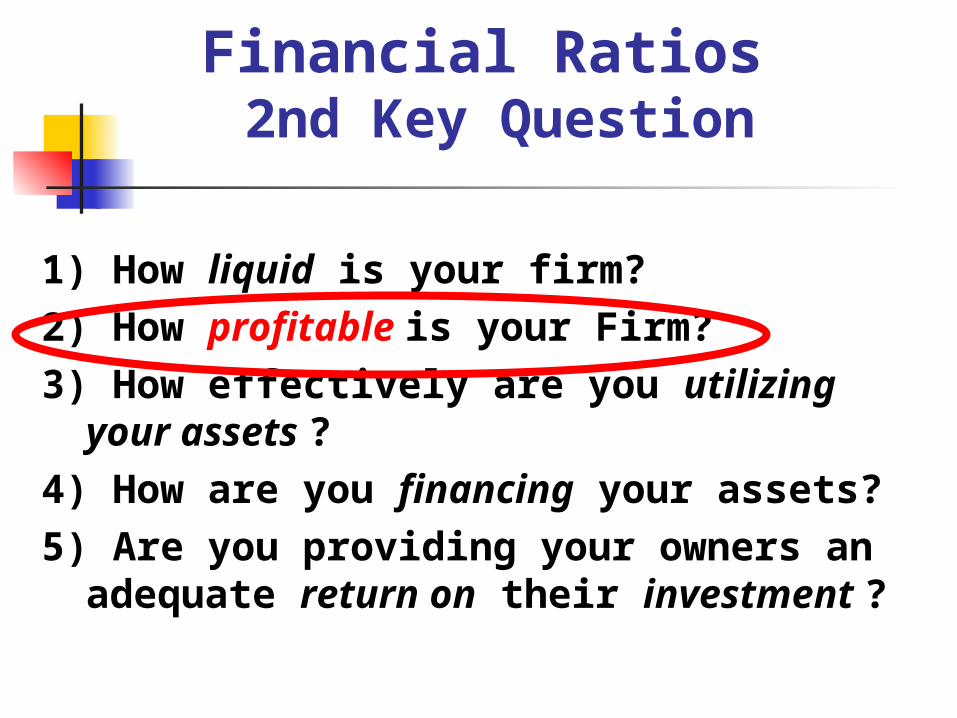
Financial Ratios 2nd Key Question
1) How liquid is your firm?2) How profitable is your Firm?3) How effectively are you utilizing
your assets ?4) How are you financing your assets?5) Are you providing your owners an
adequate return on their investment ?
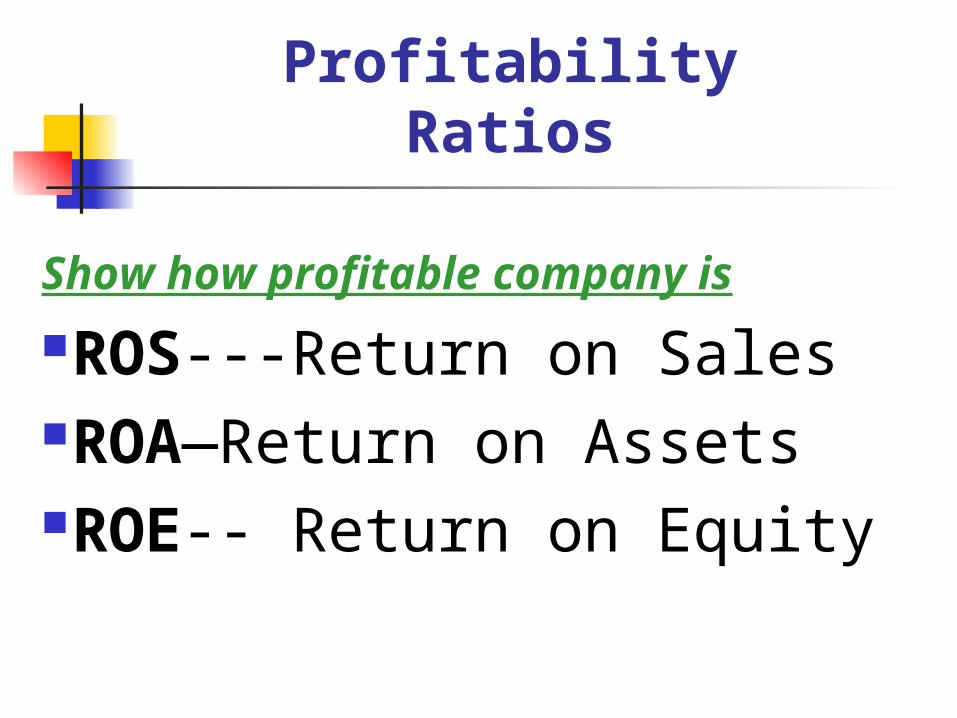
Profitability Ratios
Show how profitable company is
ROS---Return on SalesROA—Return on AssetsROE-- Return on Equity
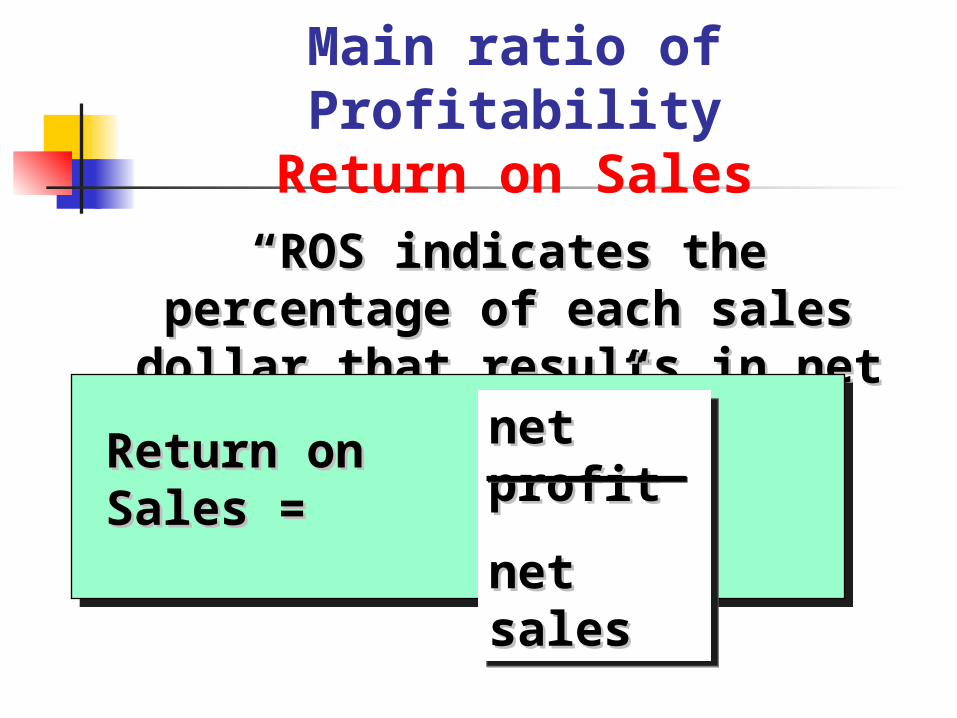
““ROS indicates the percentage of each ROS indicates the percentage of each sales dollar that results in net income.”sales dollar that results in net income.”
Main ratio of ProfitabilityReturn on Sales
Return on Sales =Return on Sales = net profitnet profit
net salesnet sales
net profitnet profit
net salesnet sales
Financial Guidelines:
Profitability

2) How Profitable is your Firm?
ROSROS
Contribution MarginContribution Margin
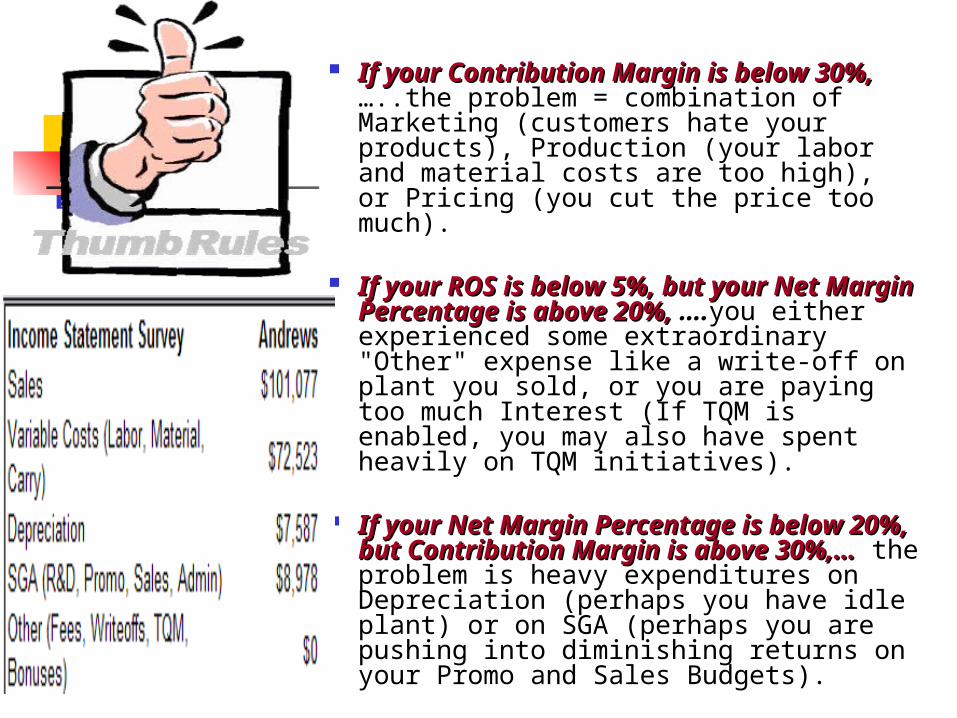
If your Contribution Margin is below 30%,If your Contribution Margin is below 30%, …..the problem = combination of Marketing (customers hate your products), Production (your labor and material costs are too high), or Pricing (you cut the price too much).
If your ROS is below 5%, but your Net If your ROS is below 5%, but your Net Margin Percentage is above 20%,Margin Percentage is above 20%, ….you either experienced some extraordinary "Other" expense like a write-off on plant you sold, or you are paying too much Interest (If TQM is enabled, you may also have spent heavily on TQM initiatives).
If your Net Margin Percentage is below 20%, If your Net Margin Percentage is below 20%, but Contribution Margin is above 30%,…but Contribution Margin is above 30%,… the problem is heavy expenditures on Depreciation (perhaps you have idle plant) or on SGA (perhaps you are pushing into diminishing returns on your Promo and Sales Budgets).
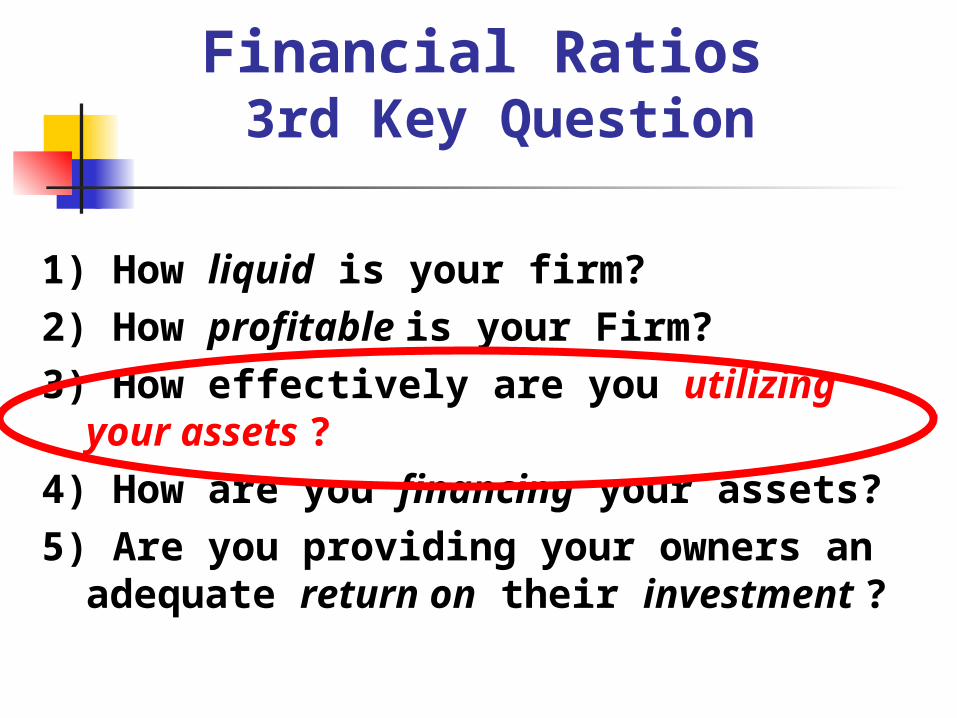
Financial Ratios 3rd Key Question
1) How liquid is your firm?2) How profitable is your Firm?3) How effectively are you utilizing
your assets ?4) How are you financing your assets?5) Are you providing your owners an
adequate return on their investment ?

Drive Asset Turnover
Reveals how effective assets are at generating sales revenue.
The higher the better= more efficient use of assets
Asset Turnover =sales
assets
sales
assets
$103,777/ $96,043 = 1.08
Firm can generate $1.08 in sales for every $1 assets

Drive- Return on Assets
Return on Assets = =net profit
assets
net profit
assets
““ROA measures company’s ability to use all its assets to generate earnings.”

Financial Ratios 4th Key Question
1) How liquid is your firm?2) How profitable is your Firm?3) How effectively are you utilizing
your assets ?4) How are you financing your assets?5) Are you providing your owners an
adequate return on their investment ?
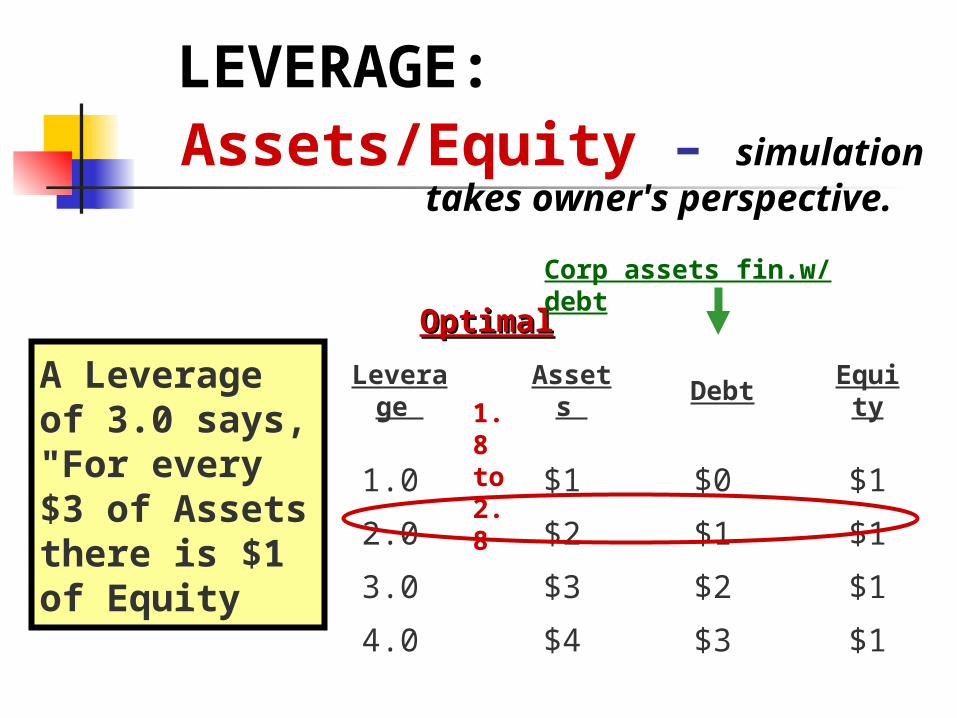
Assets/Equity – simulation takes owner's perspective.
A Leverage of 3.0 says, "For every $3 of Assets there is $1 of Equity
Leverage Assets Debt Equity
1.0 $1 $0 $1
2.0 $2 $1 $1
3.0 $3 $2 $1
4.0 $4 $3 $1
LEVERAGE:
1.8 to 2.8
OptimalOptimal
Corp assets fin.w/ debt
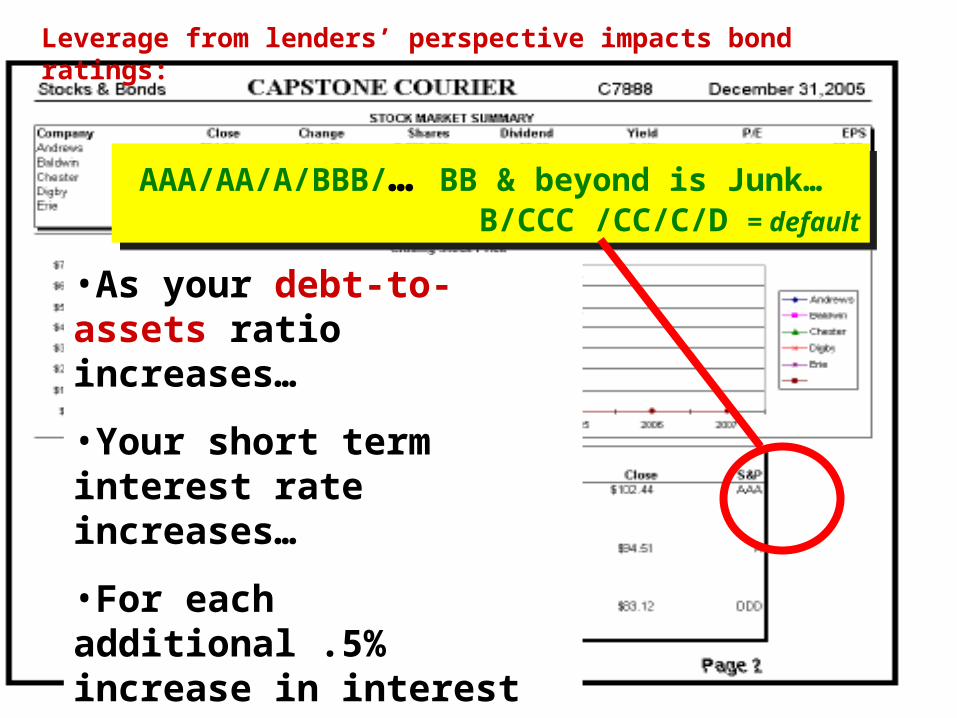
AAA/AA/A/BBB/… BB & beyond is Junk… B/CCC /CC/C/D = default
AAA/AA/A/BBB/… BB & beyond is Junk… B/CCC /CC/C/D = default
•As your debt-to-assets ratio increases…
•Your short term interest rate increases…
•For each additional .5% increase in interest
•You drop one category
Leverage from lenders’ perspective impacts bond ratings:

Last Key Question
Are you providing your owners an adequate return on their investment
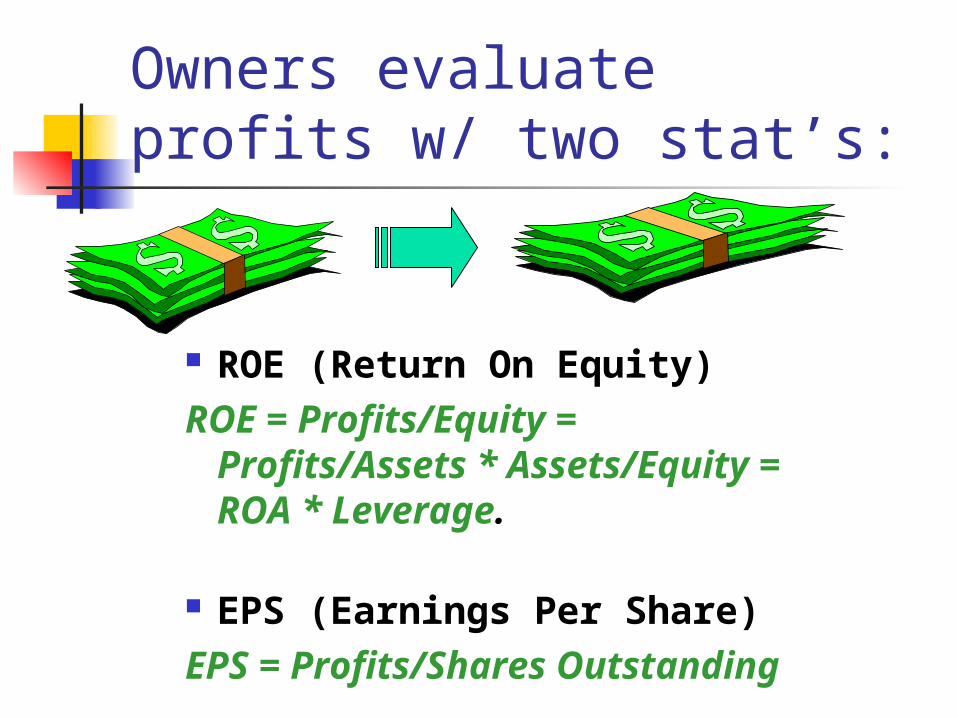
Owners evaluate profits w/ two stat’s:
ROE (Return On Equity) ROE = Profits/Equity = Profits/Assets *
Assets/Equity = ROA * Leverage.
EPS (Earnings Per Share) EPS = Profits/Shares Outstanding

STOCK PRICE Function of:
1.Book Value Equity/ # shares
issued2.Earnings per
Share (wgtg 2-3?) Net Profit/ Shares
3.Dividend Policy (wgtg 5-8?)

Encompasses the 3 main levers used
by mgt to generate return on investors
equity
Profitability * Asset Mgt * Leverage
ROE
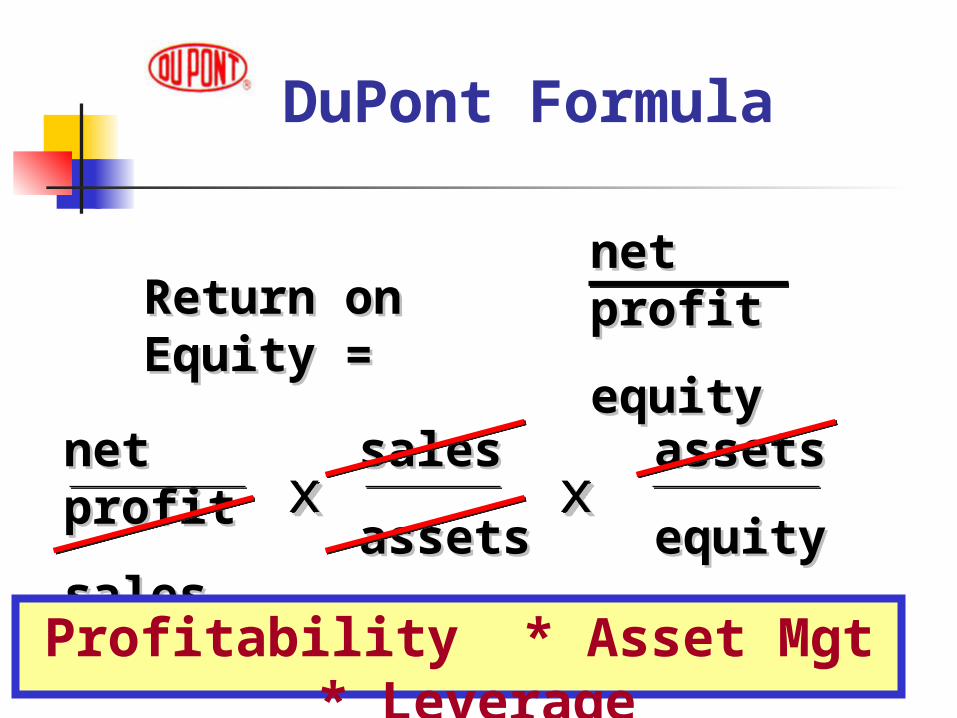
DuPont Formula
Return on Equity =Return on Equity =net profitnet profit
equityequity
net profitnet profit
salessales
salessales
assetsassets
assetsassets
equityequityxxxx xxxx
Profitability * Asset Mgt * Leverage
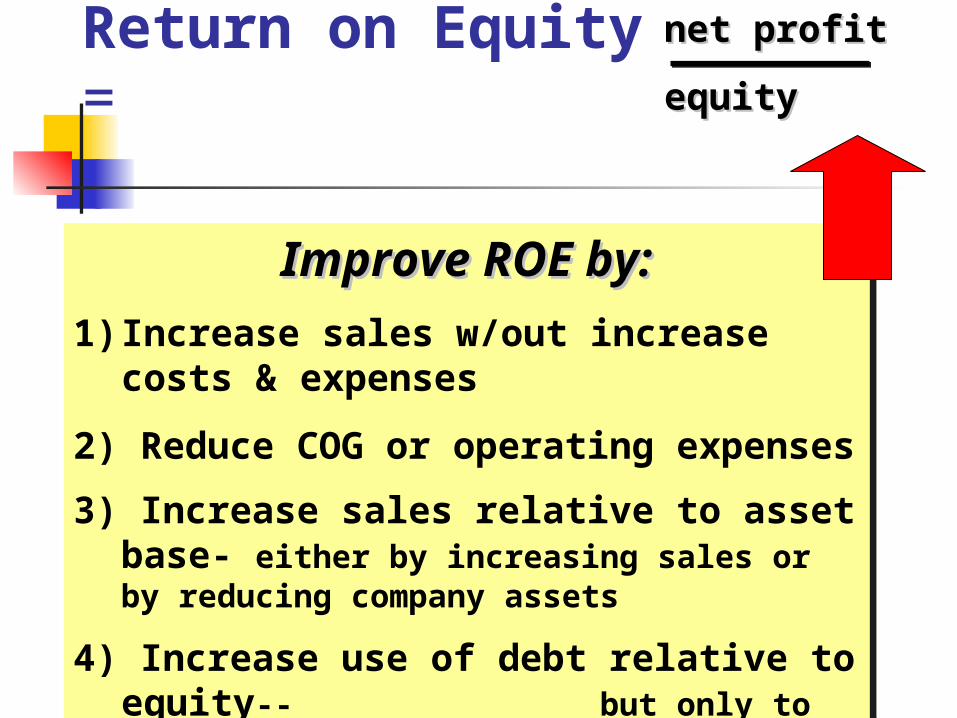
Return on Equity =
net profitnet profit
equityequity
Improve ROE by:Improve ROE by:
1) Increase sales w/out increase costs & expenses
2) Reduce COG or operating expenses
3) Increase sales relative to asset base- either by increasing sales or by reducing company assets
4) Increase use of debt relative to equity-- but only to extent it does not jeopardize firm’s financial position

Success Measures
Cumulative Profits Ending Market Share ROS Asset Turnovers ROA ROE Ending Stock Price Market Capitalization (Ave # Shares) * (Closing
Price)
Performance Measures- Defined Performance Measures-Dynamics

• Select Success Measures & Determine Relative Weightings
• Need to enter weightings – prior to round-1
• Select Success Measures & Determine Relative Weightings
• Need to enter weightings – prior to round-1
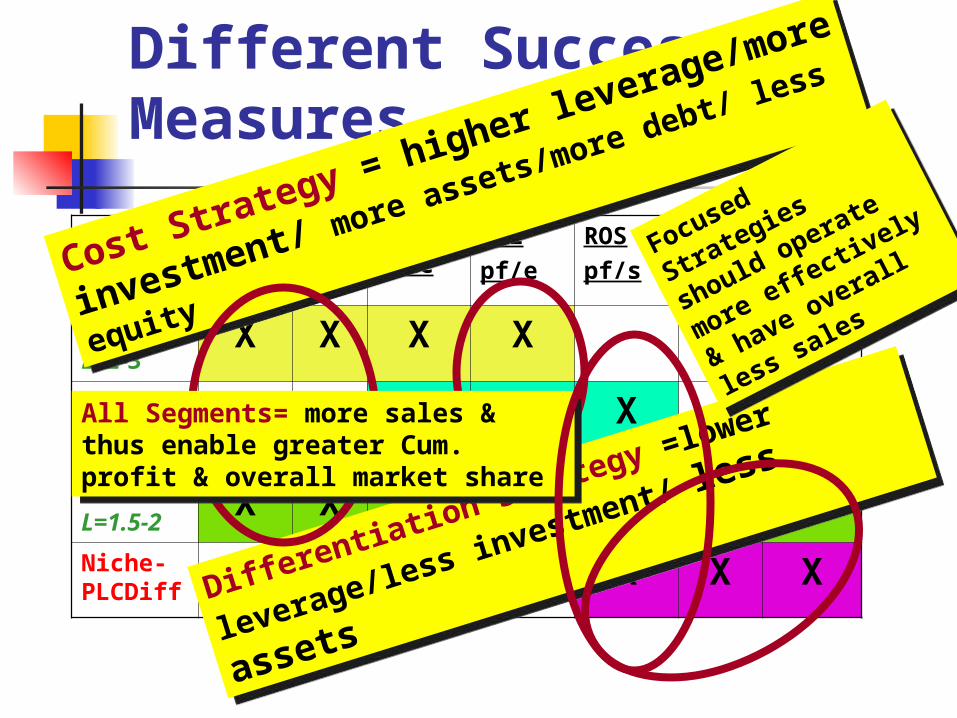
Diff Strategies Play into Different Success Measures
Profit MS SP & MC
ROEpf/e
ROSpf/s
ATs/a
ROApf/a
BCLL=2-3
X X X X
Cost- Niche & PLC
X X X
B-Diff L=1.5-2
X X X X
Niche-PLCDiff
X X X X
Cost Strategy = higher leverage/more
investment/ more assets/more debt/ le
ss
equity
Cost Strategy = higher leverage/more
investment/ more assets/more debt/ le
ss
equity
Differentiation Strategy =lower
leverage/less investment/ less assets
Differentiation Strategy =lower
leverage/less investment/ less assets All Segments= more sales & thus enable
greater Cum. profit & overall market share
All Segments= more sales & thus enable greater Cum. profit & overall market share
Focused
Strategies should
operate more
effectively &
have overall less
sales
Focused
Strategies should
operate more
effectively &
have overall less
sales
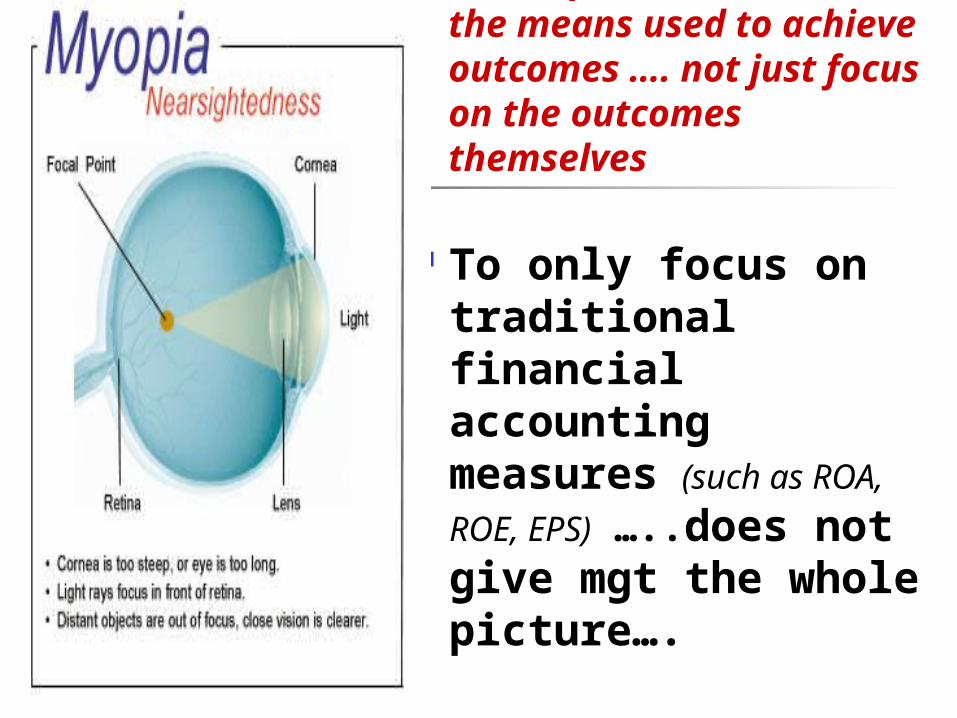
It is important to look at the means used to achieve outcomes …. not just focus on the outcomes themselves
To only focus on traditional financial accounting measures (such as
ROA, ROE, EPS) …..does not give mgt the whole picture….

M A R K E T I N G
M A N A G E M E N T Performance needs to be judged thru mix of both financial & non-financial measures….
As some nonnon--financialfinancial measures are driversdrivers of financial outcomes
Performance needs to be judged thru mix of both financial & non-financial measures….
As some nonnon--financialfinancial measures are driversdrivers of financial outcomes

M A R K E T I N G
M A N A G E M E N T
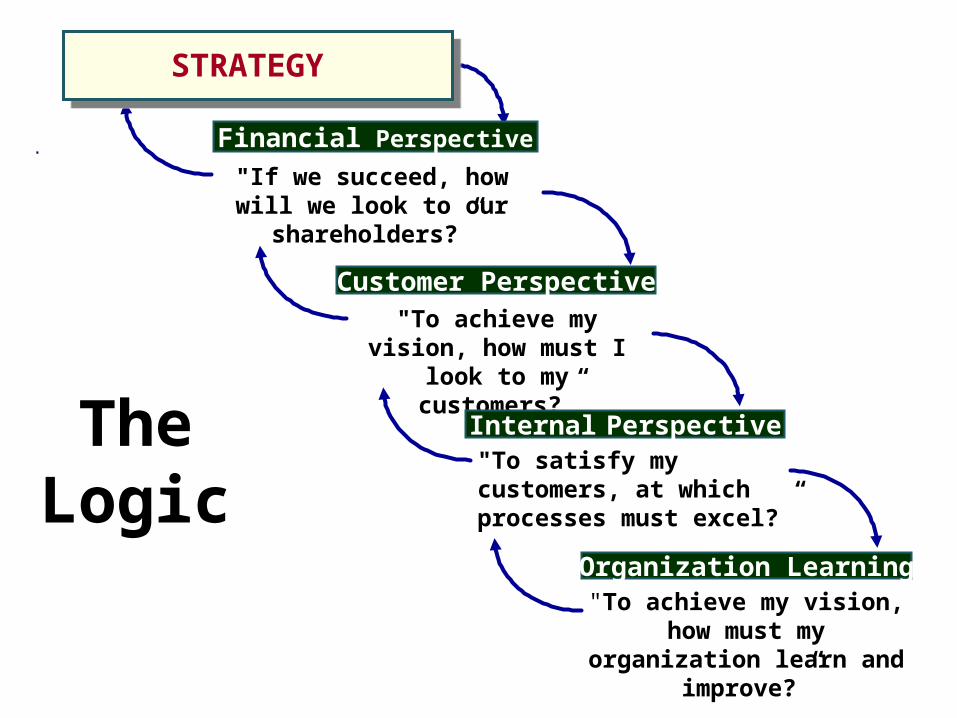
Management benefits from a multi-dimensional perspective which includes not only financial– but customer, internal & organizational learning/improvement perspectives as well…
Management benefits from a multi-dimensional perspective which includes not only financial– but customer, internal & organizational learning/improvement perspectives as well…
M A R K E T I N G
M A N A G E M E N T
The Logic
"If we succeed, how will we look to our
shareholders?”
Financial Perspective
"To achieve my vision, how must I look to my
customers?”
Customer Perspective
"To satisfy my customers, at which processes must excel?”
Internal Perspective
"To achieve my vision, how must my organization learn
and improve?”
Organization Learning
STRATEGY

M A R K E T I N G
M A N A G E M E N T
What is measured gets noticed
What is noticed gets acted on
What is acted on
gets improved
Today …
~ 70% of Fortune 1,000 companies utilize a Balanced Balanced ScorecardScorecard to help manage performance—
because…..
Today …
~ 70% of Fortune 1,000 companies utilize a Balanced Balanced ScorecardScorecard to help manage performance—
because…..

M A R K E T I N G
M A N A G E M E N T
Basic Scorecard Terminology(Southwest Airlines Example)
Objectives
• Fast ground turnaround
Objectives:What the
strategy is trying to achieve
Targets
• 30 Minutes• 90%
TargetsThe level of
performance or rate of
improvement needed
• Cycle time optimization
InitiativesKey action programs
required to achieve targets
InitiativesMeasures
• On Ground Time
• On-Time Departure
MeasuresHow
performance is measured
against objectives
Strategic Theme: Operating Efficiency
Profits and RONAFinancial
Learning
Ground crew alignment
Lowest prices
Fewer planes
Customer
Internal
Fast ground turnaround
Strategy Map
On-time Service
Attract & Retain More Customers
Grow Revenues

M A R K E T I N G
M A N A G E M E N T
• % Ground crew trained
• % Ground crew stockholders
A Complete Scorecard is a Program for Action
Objectives Measures
• # Customers• FAA On Time
Arrival Rating• Market Survey
• On Ground Time
• On-Time Departure
Strategic Theme:Operating Efficiency
Initiatives
• Cycle time optimization
• Ground crew training
• ESOP
•Customer loyalty program• Quality management
Targets
•30% +/yr
•20%
•5% • 12% growth• Ranked #1• Ranked #1
• 30 Minutes• 90%
• yr. 1 70%yr. 3 90%yr. 5 100%
• Profitability
• Grow Revenues
• Fewer planes
• More Customers
• Flight is on -time
• Lowest prices
• Fast ground turnaround
• Ground crew alignment
Strategic Theme:
Operations ExcellenceProfits and
RONAFinancial
Learning
Ground crew alignment
Fewer planes
Customer
Internal
Fast ground turnaround
Attract & Retain More Customers
Grow Revenues
Lowest prices
On-time Service
M A R K E T I N G
M A N A G E M E N T
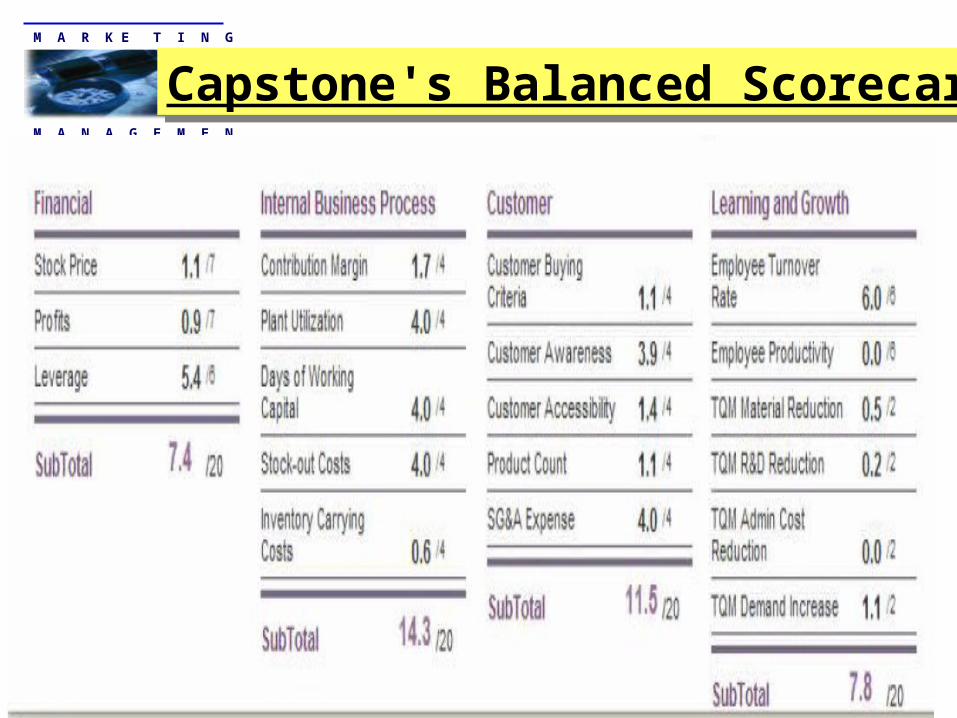
Capstone's Balanced Scorecard Capstone's Balanced Scorecard

M A R K E T I N G
M A N A G E M E N T
Your Business
Plan

BizPlan: Format & Contents- Guide
Related Documents