1 The VAMPIR and PARAVER The VAMPIR and PARAVER performance analysis performance analysis tools applied to a wet tools applied to a wet chemical etching chemical etching parallel algorithm parallel algorithm S. Boeriu 1 and J.C. Bruch, Jr. 2 1 Center for Computational Science and Engineering 2 Department of Mechanical and Environmental Engineering and Department of Mathematics University of California, Santa Barbara

S. Boeriu 1 and J.C. Bruch, Jr. 2 1 Center for Computational Science and Engineering
Jan 01, 2016
The VAMPIR and PARAVER performance analysis tools applied to a wet chemical etching parallel algorithm. S. Boeriu 1 and J.C. Bruch, Jr. 2 1 Center for Computational Science and Engineering 2 Department of Mechanical and Environmental Engineering and Department of Mathematics - PowerPoint PPT Presentation
Welcome message from author
This document is posted to help you gain knowledge. Please leave a comment to let me know what you think about it! Share it to your friends and learn new things together.
Transcript

1
The VAMPIR and PARAVER The VAMPIR and PARAVER performance analysis tools performance analysis tools applied to a wet chemical etching applied to a wet chemical etching parallel algorithmparallel algorithm
S. Boeriu1 and J.C. Bruch, Jr.2
1Center for Computational Science and Engineering2Department of Mechanical and Environmental Engineering
and Department of Mathematics
University of California, Santa Barbara
http://www.engineering.ucsb.edu/~hpscicom

2
AcknowledgementsAcknowledgements
This material is based upon work supported by the National Science Foundation under Grant #0086262. This research was conducted using the resources of the San Diego Supercomputer Center.
http://www.npaci.edu/Horizon/guide_linked/bh_tools_txt.html

3
Outline of PresentationOutline of Presentation
1. Introduction (Physical problem)2. Problem formulation3. Fixed domain formulation4. Numerical algorithm5. Test case6. Performance tools and considerations
a. VAMPIR b. PARAVER7. Diagnostic example8. Conclusions

4
Physical problemPhysical problem
A gap of width “2a” and length “L” is to be etched in a flat plate. The remainder of the plate is covered with a protective (photoresist) layer. Since it is assumed that L >>2a, the problem can be considered as two-dimensional.
Figure 1. Physical problem

5
Simplifying assumptionsSimplifying assumptions
i. There is no convection in the etching medium
ii. The etching process is isotropic
iii. The thickness of the photoresist layer is infinitely small
iv. Only one component of the etching liquid determines the process

6
Problem formulationProblem formulationMathematical model: The etching fluid (t) is bounded by the outer boundary 1 ; the photoresist layer (t); and the moving boundary S(t). D\ (t) denotes part of the solid.
Figure 2. Side view of physical problem showing mathematical problem setup.

7
Fixed domain formulationFixed domain formulation
Figure 3. Fixed domain mathematical formulation.

8
Numerical AlgorithmNumerical Algorithm
The basic numerical algorithm is:
2 2
( 1/ 2) 11 2 2 11 , , 1 , , 1( ) ( )
( ) ( ) {1 ( )ni j k i j kt tx y
w w
2
( 1) ( )11 1, , 1 1, ,( )
[( ) ( ) ]n ni j k i j kx
w w
2
( 1) ( )11 , 1, 1 , 1,( )
[( ) ( ) ]}n ni j k i j ky
w w
with
in (0) and
( 1) ( ) ( 1/ 2) ( )1 , , 1 , , 1 , , 1 , ,( ) ( ) [( ) ( ) ]n n n n
i j k i j k i j k i j kw w w w

9
Numerical algorithm (cont.)Numerical algorithm (cont.)
with
in (the rectangular region of the plate’s cross section)

10
Test caseTest case
Maxrow1 (# of rows in the top region) = 280
Maxcol1 (# of columns in the top region) = 321
Maxrow2 (# of rows in the bottom region) = 80
Maxcol2 (# of columns in the bottom region) = 161
Maxtime (# of time steps) = 5
t (size of time steps) = 1
(successive over-relaxation factor) = 1.935
B (non-dimensional number) = 10.0

11
Domain decompositionDomain decomposition
Figure 5. Domain decomposition of mathematical problem into sixteen subregions showing the flow of computations.

12
Load Load balancing information for the test casebalancing information for the test case
Processors 2 4 8 16 32 64
Bottom Processors
1 1 1 2 4 8
Bottom Points 12888 12888 12888 6440 3220 1610
Top Processors
1 3 7 14 28 56
Top Points89880 30174 12840 6420 3210 1605
Diff Points77000 17294 40 20 10 5

13
Figure 4. Ideal versus obtained speedup

14
Figure 6. Moving boundaries at various times.
15
Performance tools and Performance tools and considerationsconsiderations
The parallel program is monitored while
it is executed. Monitoring produces
performance data that is interpreted in
order to reveal areas of poor performance.
The program is then altered and the
process is repeated until an acceptable
level of performance is reached.

16
VAMPIRVAMPIR (Visualization and Analysis of MPI Resources – 2.0)(Visualization and Analysis of MPI Resources – 2.0)
VAMPIR 2.0 is a post-mortem trace visualization tool from Pallas GmbH
http://www.pallas.com
It uses the profile extensions to MPI and permits analysis of the message events where data is transmitted between processors during execution of a parallel program. It has a convenient user-interface and an excellent zooming and filtering. Global displays show all selected processes.

17
• Global Timeline: detailed application execution over time axis
• Activity Chart: presents per-process profiling information
• Summaric Chart: aggregated profiling information
• Communication Statistics: message statistics for each process pair
• Global Communication Statistics: collective operations statistics
• I/O Statistics: MPI I/O operation statistics
• Calling Tree: global dynamic calling tree

18

19

20

21

22

23

24

25

26

27
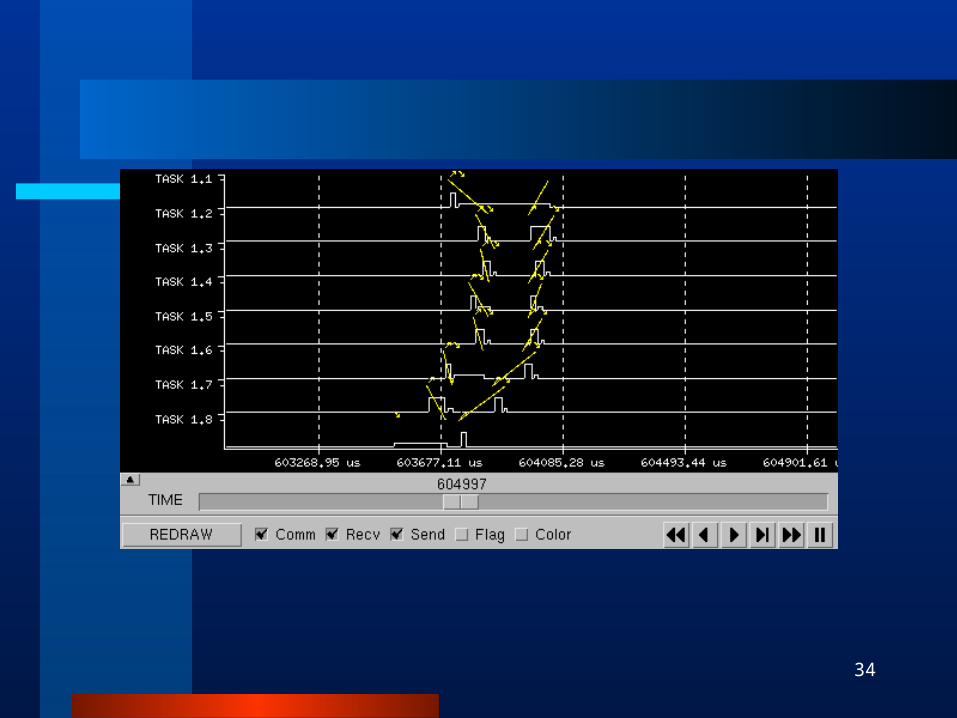
PARAVERPARAVER(Parallel Program Visualization and Analysis Tool)(Parallel Program Visualization and Analysis Tool)
PARAVER is a flexible parallel program visualization and analysis tool based on an easy-to-use Motif GUI (graphical user interface)
PARAVER was developed to respond to the basic need to have a qualitative perception of the application behavior by visual inspection and then to be able to focus on the detailed quantitative analysis of the problems.

28
Paraver Paraver (Parallel Program Visualization and Analysis Tool)(Parallel Program Visualization and Analysis Tool)
Powerful flexible parallel program visualization tool based on an easy-to-use Motif GUI (graphical user interface)
Developed by : European Center for Parallelism of
Barcelona (CEPBA) Universitat Politecnica de Catalunya http://www.cepba.upc.es/

29
Paraver is designed to visualize and analyze - Communication and load balance - Combining OpenMP and MPI - Hardware performance and counters
Usage- Compile programs with special libraries
- Run programs to produce trace files - View and analyze traces - Designed to help in program understanding and optimization

30

31

32

33
34

35

36

37

38
Inefficient programming exampleInefficient programming example
Load imbalance (inefficient memory use)
Cache misses and page faultsStride minimization (efficient
memory use)

39
Load imbalance - VAMPIRLoad imbalance - VAMPIR
Figure 7. Load imbalance in the plate region.

40
Load imbalance - PARAVERLoad imbalance - PARAVER
Figure 8. Load imbalance in the plate region.

41
The memory hierarchyThe memory hierarchy

42
Array AllocationArray Allocation

43
Example of codingExample of coding
Figure 9. A piece of the etching code (non-optimized on the left and optimized on the right).
c-c- calculate error in the top region and update
u1old do 370 i = iam*numrows1 + 1,lastrow do 380 j = 2,maxcol1 if (abs(u1new(i,j) - u1old(i,j)).gt.err)
then err = abs(u1new(i,j) - u1old(i,j)) endif u1old(i,j) = u1new(i,j)380 continue370 continuec-
c- do 380 j = 2,maxcol1 do 370 i = iam*numrows1 + 1,lastrow if ( abs(u1new(i,j) - u1old(i,j)) .gt. err)
then err = abs(u1new(i,j) - u1old(i,j))
endif u1old(i,j) = u1new(i,j)370 continue380 continuec-

44
Load balance - VAMPIRLoad balance - VAMPIR
Figure 10. Approximate load balance.

45
Load balance - PARAVERLoad balance - PARAVER
Figure 11. Approximate load balance.

46
ConclusionsConclusions
A significant factor that affects the performance of a parallel application is the balance between communication and workload. The challenge of the message passing model is in reducing message traffic over the interconnection network. To fully understand the
performance behavior of such applications, analysis and
visualization tools are needed. Two such tools, VAMPIR
and PARAVER, were used to analyze the performance of
the etching application. It was seen that optimization of
the parallel code can be carried out in an iterative process
involving these tools to investigate performance issues.

47
Web SitesWeb SitesProject site http://www.engineering.ucsb.edu/~hpscicom
San Diego Supercomputer Centerhttp://www.npaci.edu/Horizon/guide_linked/bh_tools_txt.html
VAMPIR http://www.pallas.comPARAVER
http://www.cepba.upc.es/
Related Documents