Comparison of Dual Comparison of Dual - - Polarization Polarization Radar Estimators of Rain Radar Estimators of Rain A. V. A. V. Ryzhkov Ryzhkov and D. S. and D. S. Zernic Zernic National Severe Storms Laboratory, NOAA / ERL, National Severe Storms Laboratory, NOAA / ERL, Norman, Oklahoma Norman, Oklahoma Journal of Atmospheric and Oceanic Technology, Journal of Atmospheric and Oceanic Technology, 1995 1995 Reviewed by Shane Motley Reviewed by Shane Motley 16 November 2004 16 November 2004

Welcome message from author
This document is posted to help you gain knowledge. Please leave a comment to let me know what you think about it! Share it to your friends and learn new things together.
Transcript

Comparison of DualComparison of Dual--Polarization Polarization Radar Estimators of RainRadar Estimators of Rain
A. V. A. V. RyzhkovRyzhkov and D. S. and D. S. ZernicZernicNational Severe Storms Laboratory, NOAA / ERL, National Severe Storms Laboratory, NOAA / ERL,
Norman, OklahomaNorman, Oklahoma
Journal of Atmospheric and Oceanic Technology, Journal of Atmospheric and Oceanic Technology, 19951995
Reviewed by Shane MotleyReviewed by Shane Motley16 November 200416 November 2004
OverviewOverviewMotivation and Background InfoMotivation and Background Info•• Motivation behind improved rainfall estimates.Motivation behind improved rainfall estimates.•• Past studiesPast studies
Relations between Relations between polarimetricpolarimetric variables and rain variables and rain amounts.amounts.•• Simulated drop size distributions (DSD)Simulated drop size distributions (DSD)
Compare different rain rate (R) and liquid water Compare different rain rate (R) and liquid water content (M) measurements.content (M) measurements.•• SimulationSimulation•• ErrorsErrors•• Comparison with rain gaugesComparison with rain gauges
ConclusionsConclusions
Motivation: Motivation:
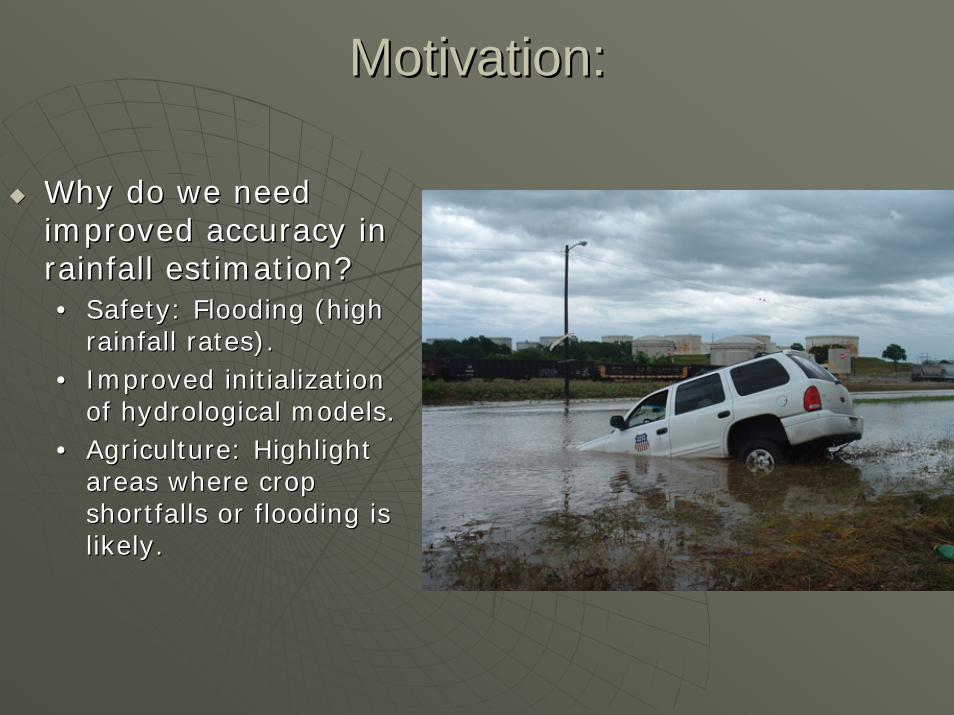
Why do we need Why do we need improved accuracy in improved accuracy in rainfall estimation?rainfall estimation?•• Safety: Flooding (high Safety: Flooding (high
rainfall rates).rainfall rates).•• Improved initialization Improved initialization
of hydrological models.of hydrological models.•• Agriculture: Highlight Agriculture: Highlight
areas where crop areas where crop shortfalls or flooding is shortfalls or flooding is likely. likely.
How is Rain Fall Measured?How is Rain Fall Measured?
Rain gages: Rain gages: •• Useful, but only serve as isolated point Useful, but only serve as isolated point
measurements. measurements. •• Gauge measurements are often Gauge measurements are often
assumed to represent the average assumed to represent the average rainfall rate over large areas.rainfall rate over large areas.
Therefore, it is necessary to identify Therefore, it is necessary to identify alternative rainfall measurement alternative rainfall measurement techniques.techniques.

How is Rain Fall Measured?How is Rain Fall Measured?WSRWSR--88D: 88D: •• Several studies have attempted to construct correlations Several studies have attempted to construct correlations
between the reflectivity factor (Z) and rainfall rate (R). between the reflectivity factor (Z) and rainfall rate (R). •• Useful for rainfall estimates over large areas for long Useful for rainfall estimates over large areas for long
periods of time. periods of time. •• Generally useless for hydrologic problems requiring good Generally useless for hydrologic problems requiring good
temporal and spatial resolution. temporal and spatial resolution.
Rain Rate vs Radar Radar Reflectivity
0
50
100
150
200
250
300
350
0 50000 100000 150000 200000 250000
R (m
m/h
r)
TRMM-LBA
WSR-88D default
WSR-88D Tropical
Pow er (TRMM-LBA)
Pow er (WSR-88Ddefault)
Pow er (WSR-88DTropical)
z = 250R1.2
z (mm6m3)
z = 300R1.4
z = 286.95R1.56

MotivationMotivation
WSRWSR--88D: 88D: Default: Z = 300RDefault: Z = 300R1.41.4
Tropical: Z = 250RTropical: Z = 250R1.21.2
Jameson (1991): Jameson (1991): One of the consistently One of the consistently worse parameters (largest worse parameters (largest εε where where ε ε is is standard deviation)standard deviation) for estimating nearly for estimating nearly instantaneous, point rainfall rates instantaneous, point rainfall rates appears to be the reflectivity factor (Z)appears to be the reflectivity factor (Z)
How can How can PolarimetricPolarimetric variables assist variables assist in precipitation estimation? in precipitation estimation?
BackgroundBackground
PolarimetricPolarimetric variables are not variables are not immune to errors.immune to errors.•• Methods involving radar reflectivity Methods involving radar reflectivity
require knowledge of absolute powers of require knowledge of absolute powers of radar system; therefore they are prone radar system; therefore they are prone to calibration issuesto calibration issues
•• Although Although KdpKdp is independent of radar is independent of radar calibrations it only has superior calibrations it only has superior accuracy at high rain rates.accuracy at high rain rates.

Errors in Radar Rainfall EstimatesErrors in Radar Rainfall Estimates
Variations of drop size distributions Variations of drop size distributions (DSD).(DSD).•• The uncertainty in the median drop The uncertainty in the median drop
diameter Ddiameter D00 is the main source of DSD is the main source of DSD induced errors in R(Kinduced errors in R(KDPDP).).
Solution: Find a factor that could Solution: Find a factor that could compensate for the effects of the variations compensate for the effects of the variations of Dof D00 such that R(Ksuch that R(KDPDP) is independent of ) is independent of DSDsDSDs. .
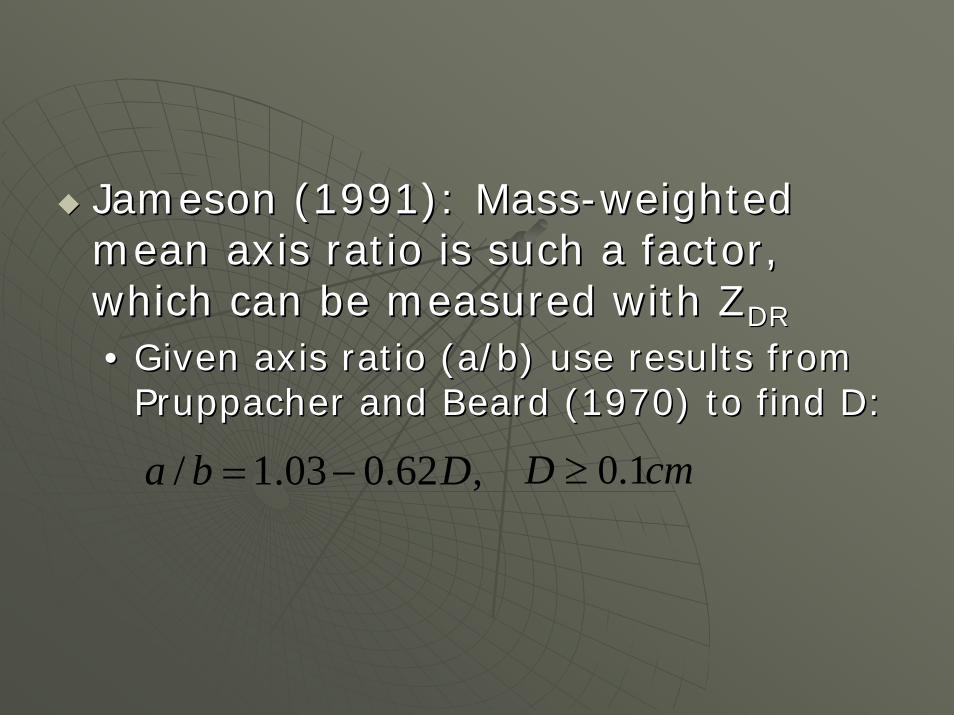
Jameson (1991): MassJameson (1991): Mass--weighted weighted mean axis ratio is such a factor, mean axis ratio is such a factor, which can be measured with Zwhich can be measured with ZDRDR
•• Given axis ratio (a/b) use results from Given axis ratio (a/b) use results from PruppacherPruppacher and Beard (1970) to find D:and Beard (1970) to find D:
,62.003.1/ Dba −= cmD 1.0≥
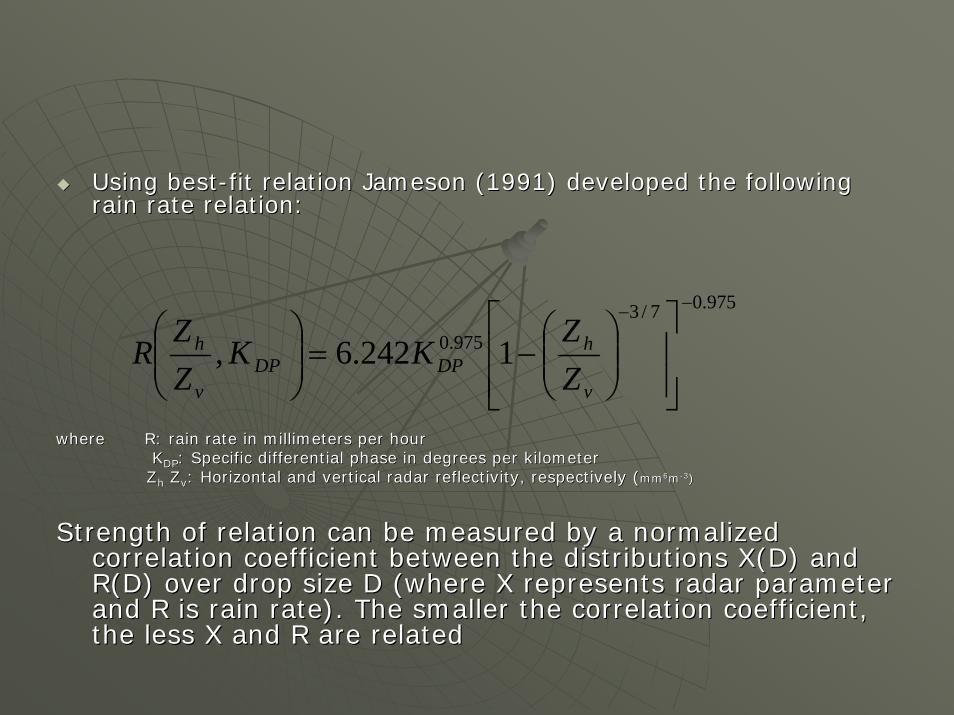
Using bestUsing best--fit relation Jameson (1991) developed the following fit relation Jameson (1991) developed the following rain rate relation:rain rate relation:
where R: rain rate in millimeters per hourwhere R: rain rate in millimeters per hourKKDPDP: Specific differential phase in degrees per kilometer: Specific differential phase in degrees per kilometer
ZZhh ZZvv: Horizontal and vertical radar reflectivity, respectively (: Horizontal and vertical radar reflectivity, respectively (mmmm66mm--33))
Strength of relation can be measured by a normalized Strength of relation can be measured by a normalized correlation coefficient between the distributions X(D) and correlation coefficient between the distributions X(D) and R(D) over drop size D (where X represents radar parameter R(D) over drop size D (where X represents radar parameter and R is rain rate). The smaller the correlation coefficient, and R is rain rate). The smaller the correlation coefficient, the less X and R are related the less X and R are related
975.07/3975.0 1242.6,
−−
⎥⎥⎦
⎤
⎢⎢⎣
⎡⎟⎟⎠
⎞⎜⎜⎝
⎛−=⎟⎟
⎠
⎞⎜⎜⎝
⎛
v
hDPDP
v
h
ZZ
KKZZ
R
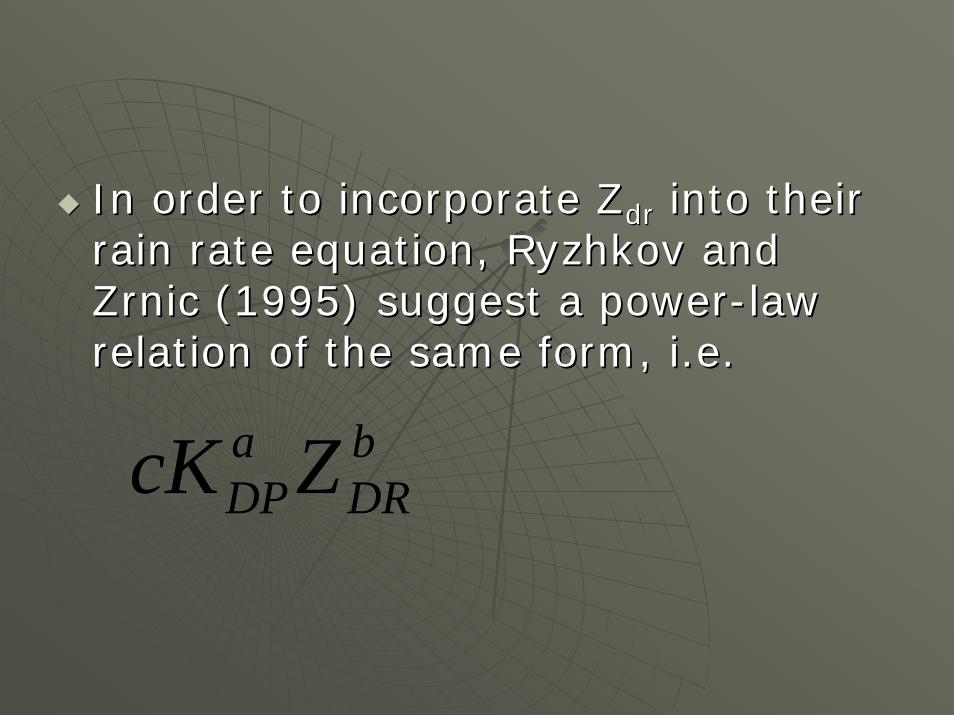
In order to incorporate In order to incorporate ZZdrdr into their into their rain rate equation, rain rate equation, RyzhkovRyzhkov and and ZrnicZrnic (1995) suggest a power(1995) suggest a power--law law relation of the same form, i.e. relation of the same form, i.e.
bDR
aDPZcK

First step in finding the First step in finding the desired powerdesired power--law relation law relation involved simulations of involved simulations of DSD variations using a DSD variations using a gamma distribution:gamma distribution:
DSDsDSDs were determined by were determined by varying the parameters varying the parameters within the following within the following intervals:intervals:
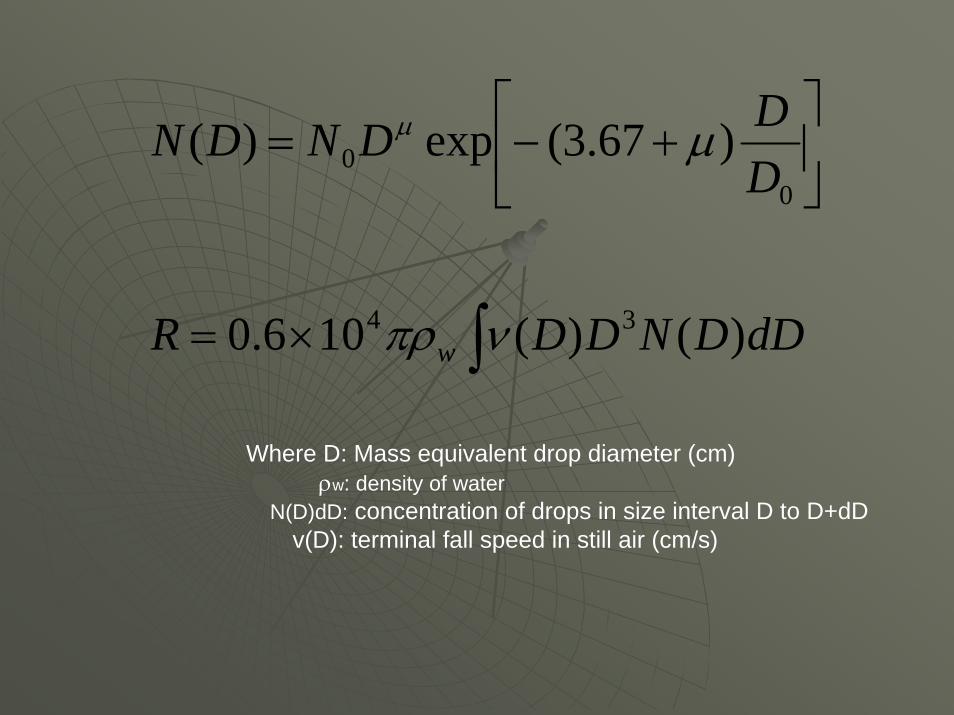
Gamma Distribution:Gamma Distribution:
Where NWhere N00: Concentration parameter: Concentration parameterµ: µ: Shape parameterShape parameterA: Slope parameterA: Slope parameterD: D: equivolumeequivolume drop diameter (max drop diameter (max
= 8 mm)= 8 mm)DD00: median drop diameter: median drop diameter
--1<1<µµ,<4, 0.5<D,<4, 0.5<D00(mm)<2.5,(mm)<2.5,
⎥⎦
⎤⎢⎣
⎡+−=
Α−=
00
0
)67.3(exp)(
)exp()(
DDDNDN
DDNDN
µµ
µ
)57.3exp(10)()8.2exp(10 5.4130
2.3 µµ µµµ −−−−− << mmmN
Ulbrich, 1983
dDDNDDR
DDDNDN
w )()(106.0
)67.3(exp)(
34
00
∫×=
⎥⎦
⎤⎢⎣
⎡+−=
νπρ
µµ
Where D: Mass equivalent drop diameter (cm)ρw: density of water
N(D)dD: concentration of drops in size interval D to D+dDv(D): terminal fall speed in still air (cm/s)
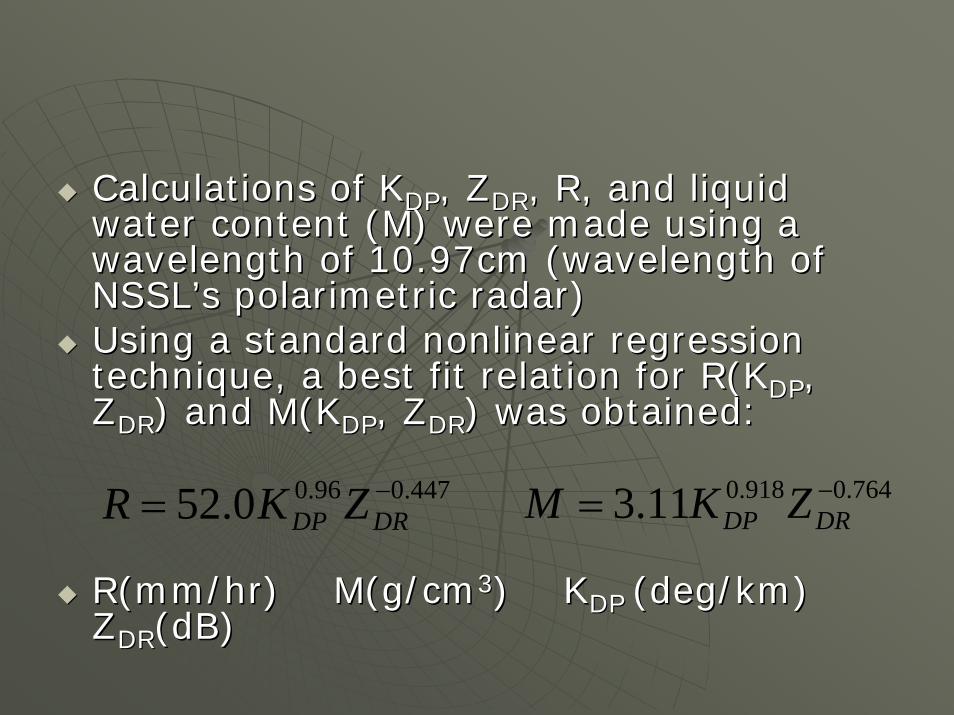
Calculations of KCalculations of KDPDP, Z, ZDRDR, R, and liquid , R, and liquid water content (M) were made using a water content (M) were made using a wavelength of 10.97cm (wavelength of wavelength of 10.97cm (wavelength of NSSL’sNSSL’s polarimetricpolarimetric radar)radar)Using a standard nonlinear regression Using a standard nonlinear regression technique, a best fit relation for R(Ktechnique, a best fit relation for R(KDPDP, , ZZDRDR) and M(K) and M(KDPDP, Z, ZDRDR) was obtained:) was obtained:
R(mmR(mm/hr) M(g/cm/hr) M(g/cm33) K) KDP DP (deg/km) (deg/km) ZZDRDR(dB(dB))
447.096.00.52 −= DRDP ZKR 764.0918.011.3 −= DRDP ZKM
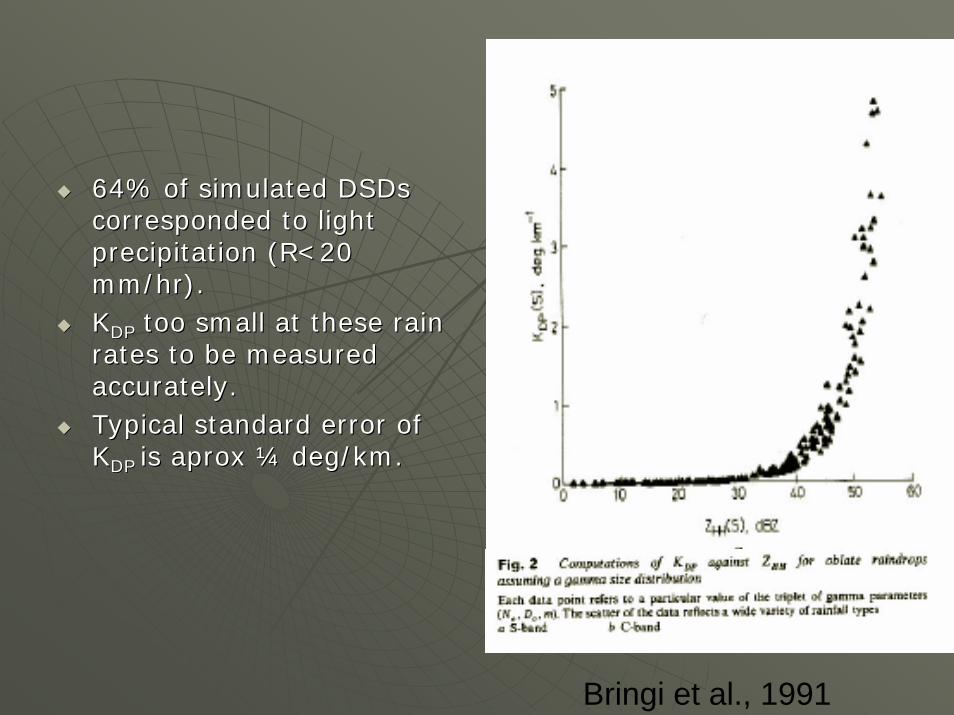
64% of simulated 64% of simulated DSDsDSDscorresponded to light corresponded to light precipitation (R<20 precipitation (R<20 mm/hr).mm/hr).KKDPDP too small at these rain too small at these rain rates to be measured rates to be measured accurately. accurately. Typical standard error of Typical standard error of KKDP DP is is aproxaprox ¼ deg/km. ¼ deg/km.
Bringi et al., 1991
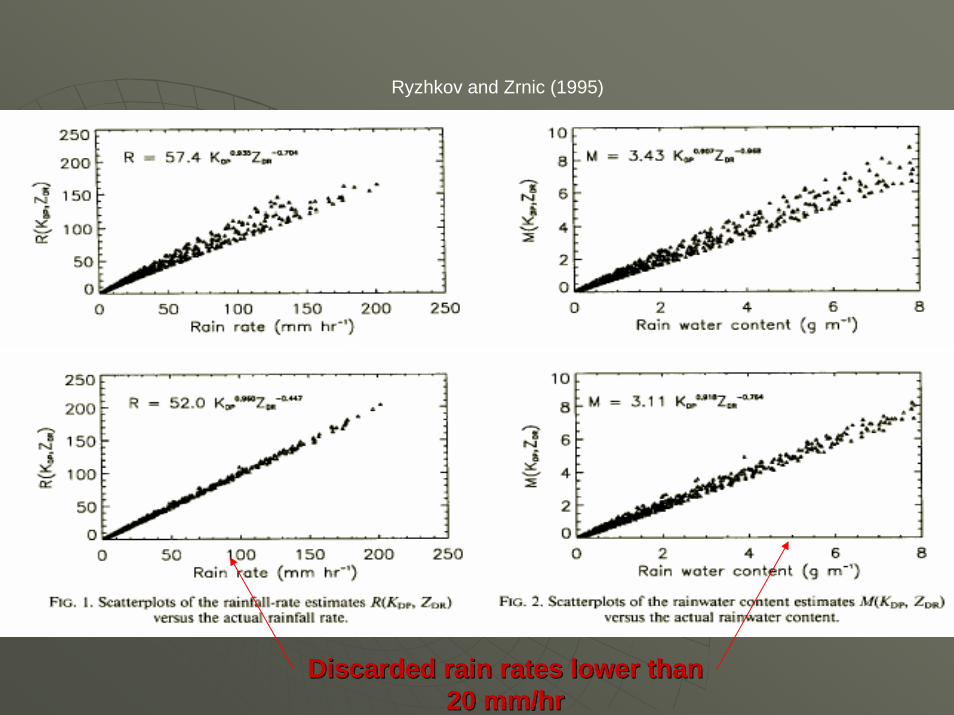
Ryzhkov and Zrnic (1995)
Discarded rain rates lower than Discarded rain rates lower than 20 mm/hr20 mm/hr
Discarding Discarding DSDsDSDs corresponding to corresponding to rain rates lower than 20 mm/hr rain rates lower than 20 mm/hr improves estimates of moderate and improves estimates of moderate and heavy rain at the expense of heavy rain at the expense of degrading the bias of light degrading the bias of light precipprecip..However, at an operational However, at an operational standpoint, higher rain rates are of standpoint, higher rain rates are of greater importance. greater importance.

Comparison of different R and M Comparison of different R and M estimatorsestimators
625.021065.31 hZR −×=86.486.331084.62 vh ZZR −−×=
866.056.403 DPKR =447.0960.00.524 −= DRDP ZKR 764.0918.011.34 −= DRDP ZKM
7/431044.31 hZM −×=18.432.331006.12 vh ZZM −−×=
76.063.13 DPKM =
R1 from Z=200R1.6
R2, R3 (Schidananda and Zrnic 1987)
M1 (Used in WSR-88D)M2, M3 (Doviak and Zrnic 1993)

Measurement errors impact on Measurement errors impact on estimator performanceestimator performance
Errors due to DSD and measurement errors.Errors due to DSD and measurement errors.Ryzhkov and Zrnic (1995)
Standard error of ZDR is a function of:1) Spectrum width2) Correlation coefficient (ρhv(0))3) Number of sample pairs 4) Signal to noise ratio
2/124,2
24,2 )( RRR DSD
tot ∆+∆=∆R(KDP,ZDR) still exhibit the bestperformance provided KDP,ZDR are smoothed over a 4km range (16 gates).
Comparison with rain gaugesComparison with rain gauges
9 June 1993, squall line passed over 9 June 1993, squall line passed over Washita River basin (42 rain gauges Washita River basin (42 rain gauges in a 603 kmin a 603 km22 area)area)Total rain accumulations at location Total rain accumulations at location of gauges computed from lowest of gauges computed from lowest scan of 0.4 degscan of 0.4 deg

Comparison with rain gaugesComparison with rain gaugesStatistical noise in Statistical noise in ZZhh was reduced by was reduced by averaging 4 successive range gates along averaging 4 successive range gates along radial (~1km). More needed for Kradial (~1km). More needed for KDPDP and and ZZDRDR. . Shifted radar rain field with respect to rain Shifted radar rain field with respect to rain gauges.gauges.Hail was present; therefore reflectivity Hail was present; therefore reflectivity values larger than 53 values larger than 53 dBZdBZ were truncated were truncated to 53 to 53 dBZdBZ (as in WSR(as in WSR--88D 88D precipprecipalgorithm). algorithm).
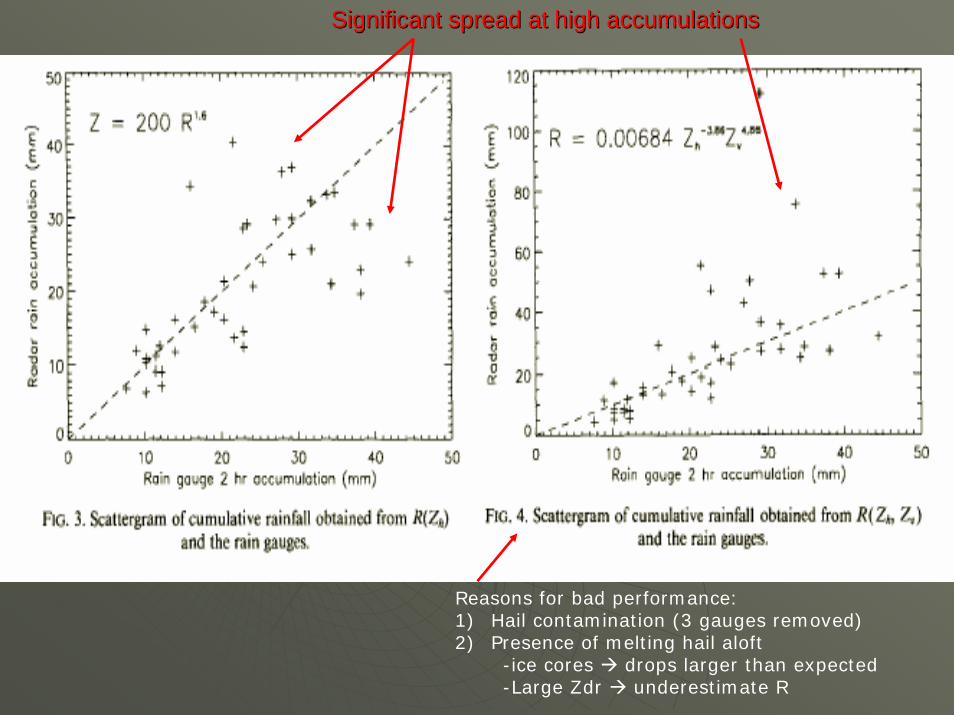
Significant spread at high accumulationsSignificant spread at high accumulations
Reasons for bad performance:1) Hail contamination (3 gauges removed) 2) Presence of melting hail aloft
-ice cores drops larger than expected-Large Zdr underestimate R

KDP>0.4 deg/km


ConclusionsConclusions
By varying parameters of a gamma By varying parameters of a gamma DSD, calculations were made relating DSD, calculations were made relating both rain rate and liquid water both rain rate and liquid water content to Kcontent to KDP DP and Zand ZDRDR
Simulations show a relation R(KSimulations show a relation R(KDPDP,,ZZDRDR) produces a standard error of ) produces a standard error of rain rate that is 2rain rate that is 2--3 times smaller 3 times smaller than than R(ZR(Zhh,Z,Zvv) for ) for moderate and moderate and heavyheavy precipitation. precipitation.
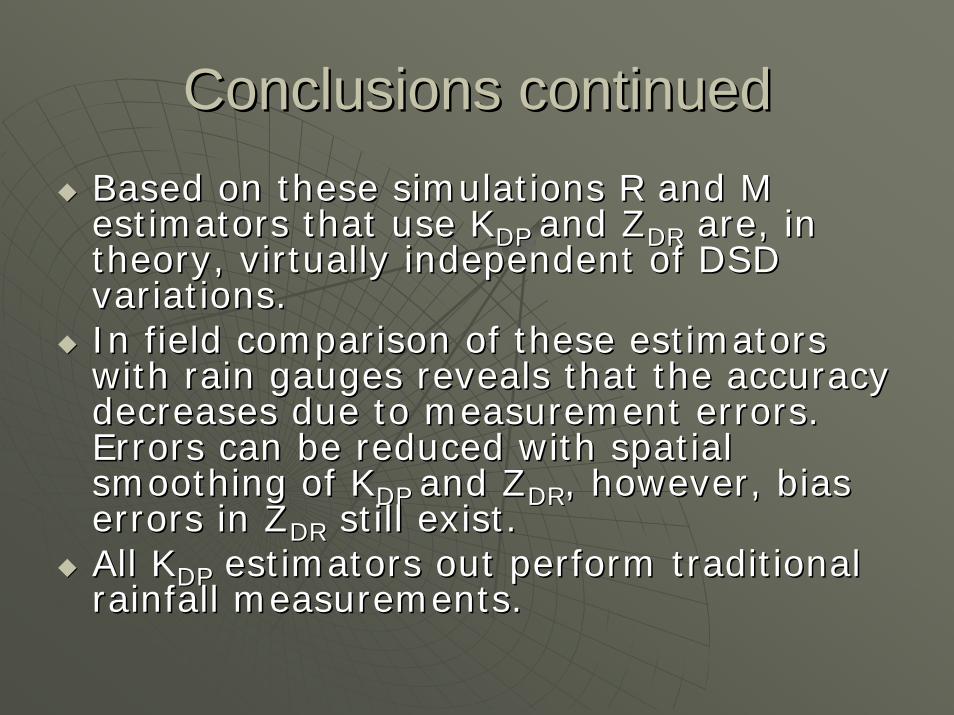
Conclusions continuedConclusions continuedBased on these simulations R and M Based on these simulations R and M estimators that use Kestimators that use KDP DP and Zand ZDRDR are, in are, in theory, virtually independent of DSD theory, virtually independent of DSD variations. variations. In field comparison of these estimators In field comparison of these estimators with rain gauges reveals that the accuracy with rain gauges reveals that the accuracy decreases due to measurement errors. decreases due to measurement errors. Errors can be reduced with spatial Errors can be reduced with spatial smoothing of Ksmoothing of KDP DP and Zand ZDRDR, however, bias , however, bias errors in Zerrors in ZDRDR still exist.still exist.All KAll KDPDP estimators out perform traditional estimators out perform traditional rainfall measurements. rainfall measurements.