RWE AG Utilities – Energy/Integrated 92 A geared play on innogy; upgrade to Buy Ironically, RWE is more geared to innogy than innogy is. This is due to the provisions and debt carried by RWE that make it, well, more sensitive to anything. We estimate that a 10% move in the innogy share price affects RWE’s valuation by 16%. RWE’s 76.8% stake in innogy is the key driver of RWE’s share price. innogy’s EV (€39bn) exceeds that of RWE (€35bn), more so when we look at market cap (€13.4bn versus €7.7bn respectively). Consequently, although mark to market suggests a fair value of €13.10 for RWE’s shares, because we see upside for innogy’s shares (see key investment point one), we believe RWE’s shares are worth €14.00. The 14% total return leads us to upgrade RWE to a Buy. Nuclear risk is reducing. The waste decommissioning debacle is now in the final stretch with the passing of a law due soon. RWE’s share of the waste decommissioning provision “nuclear premium” looks likely to be in the region of €1.8bn. That means RWE may decide to pay the bulk of this (c.€7bn) into the nuclear fund, probably in 2017. The good news is that the RWE already has c€13bn cash on the balance sheet (it has sold its DEA and a stake in innogy). So, not only can the group pay off its provisions but it also has the 76.8% stake remaining in innogy, worth €13.4bn should it need further sources of funds. EBITDA is well supported by predictable earnings. innogy is responsible for c80% of RWE’s EBITDA. Networks, retail (energy supply) and renewables form the three pillars of innogy’s business. As well as ticking the boxes of stable earnings, low CO2, low commodity risk and no nuclear exposure, these operations complement one another well in a modernising electricity market. EPS is highly sensitive to commodity price moves. A €5/MWh move in the power price (driven by the coal price) affects EPS by up to 40% once hedges roll off in 2019. A €5/MWh move in spreads affects EPS by up to 20% once hedges roll off in 2019. We are significantly ahead of consensus. Our estimates have been marked to current commodity prices, to which RWE’s earnings are highly sensitive. Bearing that in mind, we are -4%/-9%/+12%/+64% versus consensus EPS for 2016/17/18/19 respectively. For DPS, the respective numbers are +9%/- 1%/+3%/+10%. Forthcoming catalysts include the passing of the nuclear waste decommissioning law and potential compensation for nuclear taxes and early closures (neither of which are in our forecasts). 16 November 2016 BUY Current price Price target EUR11.91 EUR14.00 14/11/2016 XETRA Close Market cap (EURm) 7,319 Reuters RWEG.DE Bloomberg RWE GY Changes made in this note Rating: Buy (Hold) Price target: EUR14.00 (16.00) Estimates changes 2016E 2017E 2018E old % old % old % EBITD A 5,509 -0.5 6,110 -6.5 6,028 -4.0 EBIT 3,109 -0.9 3,687 -11.2 3,581 -5.5 EPS 1.04 -9.1 1.76 -43.6 1.85 -37.1 Source: Berenberg estimates Share data Shares outstanding (m) 615 Enterprise value (EURm) 33,544 Daily trading volume 4,134,878 Interactive model click here to explore * there may be a delay for the new estimates to be updated on the interactive model View all interactive models in Utilities Y/E 31/12., EURm 2014 2015 2016E 2017E 2018E 2019E 2020E EBITDA 7,131 7,017 5,483 5,711 5,785 6,058 5,889 EBIT 4,017 3,837 3,083 3,273 3,383 3,638 3,455 EPS 2.09 1.83 0.95 0.99 1.17 1.45 1.27 DPS 1.00 0.00 0.28 0.30 0.35 0.43 0.38 FCF per share 6.0 1.7 1.0 2.0 1.6 2.2 1.7 Y/E net debt (net cash) 30,972 25,126 20,508 21,555 21,050 20,177 19,623 EBITDA Growth -9.8% -1.6% -21.9% 4.2% 1.3% 4.7% -2.8% EPS Growth -44.4% -12.4% -48.3% 5.2% 17.2% 24.0% -12.4% DPS Growth 0.0% - 0.0% 5.2% 17.2% 24.0% -12.4% ROCE 8.4% 8.0% 6.3% 6.7% 6.8% 7.3% 6.9% EV/EBITDA 5.7x 5.1x 6.1x 6.1x 5.9x 5.5x 5.6x P/E 5.7x 6.5x 12.6x 12.0x 10.2x 8.2x 9.4x Dividend Yield 8.4% 0.0% 2.4% 2.5% 2.9% 3.6% 3.2% FCF Yield 50.1% 14.3% 8.7% 16.5% 13.1% 18.5% 14.7% Source: Company data, Berenberg Lawson Steele Analyst +44 20 3207 7887 [email protected] Andrew Fisher Analyst +44 20 3207 7937 [email protected] Neha Saxena Analyst +44 20 3753 3048 [email protected]

Welcome message from author
This document is posted to help you gain knowledge. Please leave a comment to let me know what you think about it! Share it to your friends and learn new things together.
Transcript

RWE AG
Utilities – Energy/Integrated
92
A geared play on innogy; upgrade to Buy
�� Ironically, RWE is more geared to innogy than innogy is. This is due to the provisions and debt carried by RWE that make it, well, more sensitive to anything. We estimate that a 10% move in the innogy share price affects RWE’s valuation by 16%. RWE’s 76.8% stake in innogy is the key driver of RWE’s share price. innogy’s EV (€39bn) exceeds that of RWE (€35bn), more so when we look at market cap (€13.4bn versus €7.7bn respectively). Consequently, although mark to market suggests a fair value of €13.10 for RWE’s shares, because we see upside for innogy’s shares (see key investment point one), we believe RWE’s shares are worth €14.00. The 14% total return leads us to upgrade RWE to a Buy.�
�� Nuclear risk is reducing. The waste decommissioning debacle is now in the final stretch with the passing of a law due soon. RWE’s share of the waste decommissioning provision “nuclear premium” looks likely to be in the region of €1.8bn. That means RWE may decide to pay the bulk of this (c.€7bn) into the nuclear fund, probably in 2017. The good news is that the RWE already has c€13bn cash on the balance sheet (it has sold its DEA and a stake in innogy). So, not only can the group pay off its provisions but it also has the 76.8% stake remaining in innogy, worth €13.4bn should it need further sources of funds.
�� EBITDA is well supported by predictable earnings. innogy is responsible for c80% of RWE’s EBITDA. Networks, retail (energy supply) and renewables form the three pillars of innogy’s business. As well as ticking the boxes of stable earnings, low CO2, low commodity risk and no nuclear exposure, these operations complement one another well in a modernising electricity market.
�� EPS is highly sensitive to commodity price moves. A €5/MWh move in the power price (driven by the coal price) affects EPS by up to 40% once hedges roll off in 2019. A €5/MWh move in spreads affects EPS by up to 20% once hedges roll off in 2019.
�� We are significantly ahead of consensus. Our estimates have been marked to current commodity prices, to which RWE’s earnings are highly sensitive. Bearing that in mind, we are -4%/-9%/+12%/+64% versus consensus EPS for 2016/17/18/19 respectively. For DPS, the respective numbers are +9%/-1%/+3%/+10%.
�� Forthcoming catalysts include the passing of the nuclear waste decommissioning law and potential compensation for nuclear taxes and early closures (neither of which are in our forecasts).
16 November 2016
BUY
Current price �
Price target
EUR 11.91 �
EUR 14.00�14/11/2016 XETRA Close
Market cap (EUR m)� 7,319�Reuters� RWEG.DE�Bloomberg� RWE GY�
Changes made in this note�
Rating:� Buy (Hold)�Price target:� EUR 14.00 (16.00)�
Estimates changes�
2016E 2017E 2018E
old � % old � % old � %
EBITD
A
5,509 -0.5 6,110 -6.5 6,028 -4.0
EBIT 3,109 -0.9 3,687 -11.2 3,581 -5.5
EPS 1.04 -9.1 1.76 -43.6 1.85 -37.1 Source: Berenberg estimates�
Share data�
Shares outstanding (m)� 615�Enterprise value (EUR m)� 33,544�Daily trading volume� 4,134,878�
Interactive model click here to explore
* there may be a delay for the new estimates to be
updated on the interactive model
View all interactive models in Utilities
Y/E 31/12., EUR m 2014 2015 2016E 2017E 2018E 2019E 2020E
EBITDA 7,131 7,017 5,483 5,711 5,785 6,058 5,889 EBIT 4,017 3,837 3,083 3,273 3,383 3,638 3,455 EPS 2.09 1.83 0.95 0.99 1.17 1.45 1.27 DPS 1.00 0.00 0.28 0.30 0.35 0.43 0.38 FCF per share 6.0 1.7 1.0 2.0 1.6 2.2 1.7 Y/E net debt (net cash) 30,972 25,126 20,508 21,555 21,050 20,177 19,623 EBITDA Growth -9.8% -1.6% -21.9% 4.2% 1.3% 4.7% -2.8% EPS Growth -44.4% -12.4% -48.3% 5.2% 17.2% 24.0% -12.4% DPS Growth 0.0% - 0.0% 5.2% 17.2% 24.0% -12.4% ROCE 8.4% 8.0% 6.3% 6.7% 6.8% 7.3% 6.9% EV/EBITDA 5.7x 5.1x 6.1x 6.1x 5.9x 5.5x 5.6x P/E 5.7x 6.5x 12.6x 12.0x 10.2x 8.2x 9.4x Dividend Yield 8.4% 0.0% 2.4% 2.5% 2.9% 3.6% 3.2% FCF Yield 50.1% 14.3% 8.7% 16.5% 13.1% 18.5% 14.7%
Source: Company data, Berenberg�
Lawson Steele Analyst +44 20 3207 7887 [email protected]
Andrew Fisher Analyst +44 20 3207 7937 [email protected]
Neha Saxena Analyst +44 20 3753 3048 [email protected]
RWE AG
Utilities – Energy/Integrated
93
BUY
Investment thesis
16 November 2016 Reuters RWEG.DE
�� Power prices have rallied significantly since February, which directly lifts profitability of RWE’s fixed-cost generation, ie nuclear and lignite plants, representing 80% of RWE’s German generation, c100TWh.
�� German utilities, including RWE, are close to an agreement with the government on nuclear waste provisions. The devil is in the final detail, but it looks like an estimated c€6.8bn risk premium may be the answer in RWE’s case.
�� innogy’s IPO depressurises the balance sheet, creating financing options not available to the likes of E.ON.
�� RWE management is doing what it does best: running an ever-tighter ship. Cost-cutting and efficiency improvements have been at the forefront of the current CEO and CFO’s strategy. The current programme calls for another €900m to be cut over 2016-18.
�� Part of this cost cutting will be aimed at innogy’s UK supply business that has suffered from a poor rollout of the new CRM system in 2015. With new management in place, we expect a recovery in profitability from 2017, and for it to be in the black by 2018.
�� Our valuation is based on a blend of metrics: a DCF SOTP, a dividend discount model and a target P/E and yield.
Bloomberg RWE GY
Current price Price target
EUR 11.91 EUR 14.00 Market cap (EUR m) 7,319
14/11/2016 XETRA Close EV (EUR m) 33,544
Trading volume 4,134,878
Free float 85.0%
Non-institutional shareholders Share performance
RW Energie-Beteilligungsgesellschaft: 15.0% High 52 weeks EUR 15.95
Low 52 weeks EUR 10.17
Business description Performance relative to
RWE generates, distributes and trades electricity to industrial and residential customers. The company also produces natural gas and oil, transports and distributes gas.
SXXP SX6P
1mth -15.2% -4.6%
3mth -22.3% -7.6%
12mth 15.5% 22.1%
�
Profit and loss summary
EURm 2014 2015 2016E 2017E 2018E
Revenues 48,468 48,599 47,215 47,785 48,530 EBITDA 7,131 7,017 5,483 5,711 5,785 EBITA 4,017 3,837 3,083 3,273 3,383 EBIT 4,017 3,837 3,083 3,273 3,383 Associates contribution 447 561 314 314 314 Net interest 1,848 1,589 1,673 1,517 1,410 Tax 553 603 352 439 533 Minorities 353 454 476 705 723 Net income adj. 1,282 1,125 581 611 717 EPS reported 2.77 -0.28 0.61 0.99 1.17 EPS adjusted 2.09 1.83 0.95 0.99 1.17 Year end shares 615 615 615 615 615 Average shares 615 615 615 615 615 DPS 1.00 0.00 0.28 0.30 0.35
Cash flow summary
EURm 2014 2015 2016E 2017E 2018E
Net income 1,693 -1,240 853 1,317 1,440 Depreciation 3,114 3,180 2,400 2,438 2,402 Working capital changes 1,860 281 232 -14 -109 Other non-cash items -559 1,800 0 250 0 Operating cash flow 6,368 3,214 3,485 3,991 3,734 Capex -2,703 -2,164 -2,847 -2,786 -2,779 FCFE 3,665 1,050 638 1,205 955 Acquisitions, disposals 364 4,161 5,326 0 0 Other investment CF 2,530 3,903 240 6,533 337 Dividends paid -1,061 -1,070 0 -174 -183 Buybacks, issuance 122 227 0 0 0 Change in net debt -779 -649 5,724 -5,502 435 Net debt 30,972 25,126 20,508 21,555 21,050 FCF per share 5.96 1.71 1.04 1.96 1.55
Growth and margins
2014 2015 2016E 2017E 2018E
Revenue growth -7.5% 0.3% -2.8% 1.2% 1.6% EBITDA growth -9.8% -1.6% -21.9% 4.2% 1.3% EBIT growth -25.2% -4.5% -19.7% 6.2% 3.4% EPS adj growth -44.4% -12.4% -48.3% 5.2% 17.2% FCF growth 74.0% -71.4% -39.3% 89.0% -20.7% EBITDA margin 14.7% 14.4% 11.6% 12.0% 11.9% EBIT margin 8.3% 7.9% 6.5% 6.8% 7.0% Net income margin 2.6% 2.3% 1.2% 1.3% 1.5% FCF margin 7.6% 2.2% 1.4% 2.5% 2.0%
Key ratios
2014 2015 2016E 2017E 2018E
Net debt / equity 263.1% 282.5% 239.0% 272.5% 238.4% Net debt / EBITDA 4.3x 3.6x 3.7x 3.8x 3.6x Avg cost of debt 6.1% 5.7% 7.3% 7.2% 6.6% Tax rate 20.9% 37.8% 25.0% 25.0% 27.0% Interest cover 2.2x 2.4x 1.8x 2.2x 2.4x Payout ratio 47.8% 0.0% 30.0% 30.0% 30.0% ROCE 8.4% 8.0% 6.3% 6.7% 6.8% Capex / sales 5.6% 4.5% 6.0% 5.8% 5.7% Capex / depreciation 86.8% 68.1% 118.6% 114.3% 115.7%
Valuation metrics
2014 2015 2016E 2017E 2018E
P / adjusted EPS 5.7x 6.5x 12.6x 12.0x 10.2x P / book value 0.6x 0.8x 0.9x 0.9x 0.8x FCF yield 50.1% 14.3% 8.7% 16.5% 13.1% Dividend yield 8.4% 0.0% 2.4% 2.5% 2.9% EV / sales 0.8x 0.7x 0.7x 0.7x 0.7x EV / EBITDA 5.7x 5.1x 6.1x 6.1x 5.9x EV / EBIT 10.2x 9.3x 10.9x 10.6x 10.1x EV / FCF 11.2x 34.1x 52.6x 28.8x 35.9x EV / cap. employed 0.7x 0.7x 0.6x 0.7x 0.7x
Key risks to our investment thesis
�� Power prices fall.
�� Nuclear provision agreement fails to materialise.
�� Interest rates rise.
�� innogy share price falls.
Lawson Steele Analyst +44 20 3207 7887 [email protected]
Andrew Fisher Analyst +44 20 3207 7937 [email protected]
Neha Saxena Analyst +44 20 3753 3048 [email protected]
RWE AG
Utilities – Energy/Integrated
94
RWE – investment thesis in pictures
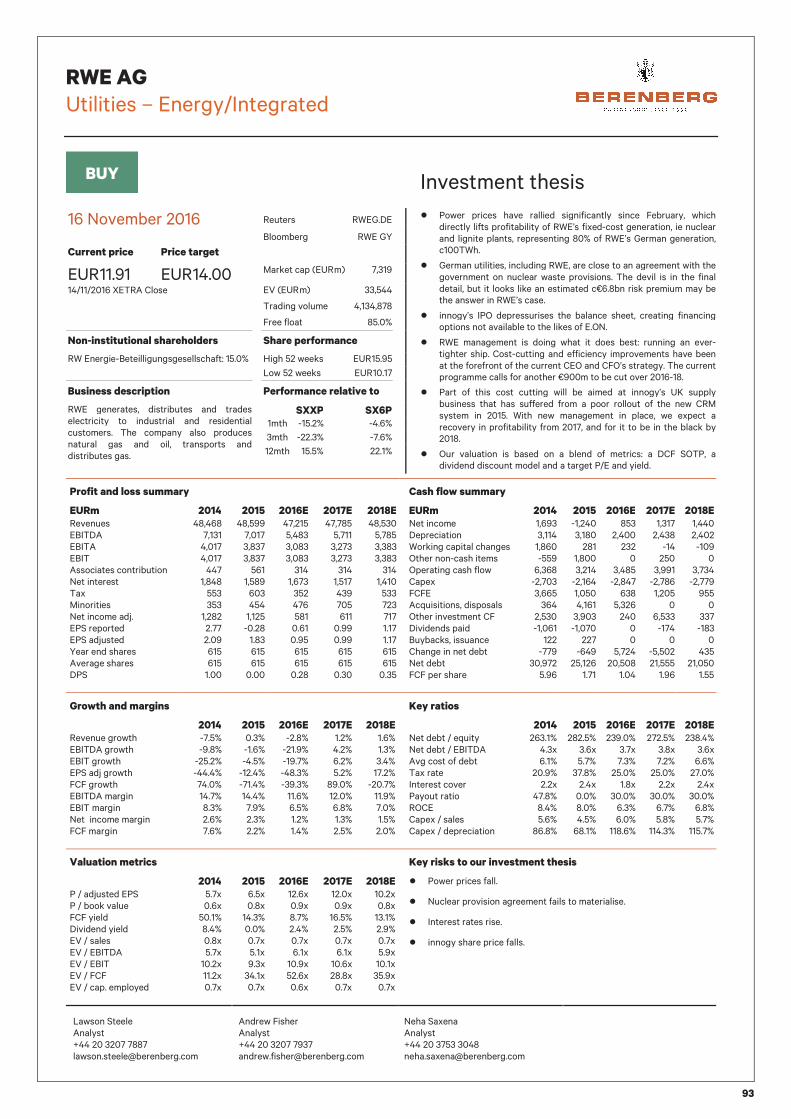
Chart 1: RWE is more geared to innogy than innogy itself (€m) Chart 2: innogy is the key contributor to RWE’s EBITDA (€m)
Source: Berenberg estimates Source: Bloomberg
Chart 3: EPS is highly sensitive to power price movements Chart 4: RWE valuation metrics (€ per share)
Source: Berenberg estimates Source: Berenberg estimates
Chart 5: P/E and EPS three-year CAGR versus sector – cheap
against the sector
Chart 6: DY and DPS three-year CAGR versus sector reflects low
payout
Source: Berenberg estimates Source: Berenberg estimates
34,316
39,211
7,666
13,440
-
5,000
10,000
15,000
20,000
25,000
30,000
35,000
40,000
45,000
RWE EV innogy EV RWE mkt cap innogy mkt cap (RWE stake)
7% 6%
14%
35%39%
(7%) (6%)(14%)
(35%) (39%)
(50%)
(40%)
(30%)
(20%)
(10%)
0%
10%
20%
30%
40%
50%
2016E 2017E 2018E 2019E 2020E
EPS with +€5/MWH pprice EPS with -€5/MWH pprice
�
����
����
����
����
����
����
����
����
����
�� ��� � �����
������ ���� ��
201720182019
2020
20212017
2018
2019
2020
2021
7.0
8.0
9.0
10.0
11.0
12.0
13.0
14.0
15.0
(10.0%) (5.0%) 0.0% 5.0% 10.0%
Sector Company
20172018
2019
2020 2021
20172018
2019
2020
2021
2.0%
2.5%
3.0%
3.5%
4.0%
4.5%
5.0%
5.5%
6.0%
6.5%
(10.0%) (5.0%) 0.0% 5.0% 10.0%
Sector Company
RWE AG
Utilities – Energy/Integrated
95
RWE – investment thesis
What’s new: We have updated our model following the spin-off of innogy and have marked to market our commodity assumptions.
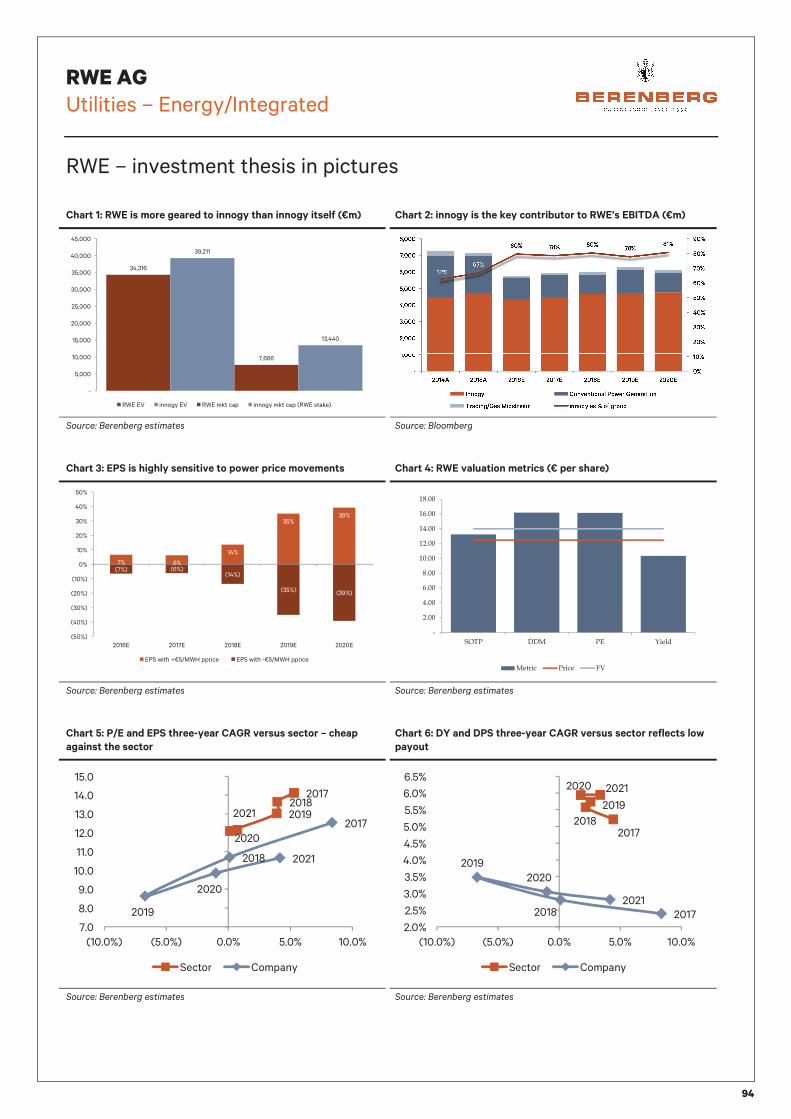
Key investment point one: innogy is key to RWE’s valuation
�� Key stat: RWE owns 76.8% of innogy. innogy’s EV is €39bn, which is greater than RWE’s €35bn. innogy’s total market cap is €17.5bn, and RWE’s stake in innogy is worth €13.4bn, dwarfing RWE’s €7.7bn.
�� The chart below shows innogy’s contribution to RWE’s valuation.
RWE/ innogy valuation breakdown
Source: Company reports, Berenberg estimates
�� We believe that innogy will be unencumbered by the burdens that weighed on RWE over the last decade. Combined with low commodity price exposure, no nuclear liabilities and c60% regulated quasi-regulated earnings, innogy has started life with a sensible capital structure underpinned by relatively reliable income. We believe that this is a platform for a high dividend payout; innogy intends to pay 70-80% of its adjusted net income as dividends (see full investment case in the innogy section of this note).
�� We estimate innogy will deliver 3% EBITDA CAGR from 2016-20, accounting for 75-

RWE AG
Utilities – Energy/Integrated
96
80% of RWE’s 2016-2020 EBITDA.
Innogy’s EBITDA dominates RWE (€m)
Source: Berenberg estimates
Key investment point two: RWE’s EPS is highly sensitive
�� Key stat: A €5/MWh move in the German power price, triggered by a coal (rather than carbon) price move, shifts EPS by 35-40% on unhedged earnings (2019 onwards). Significant hedging in 2016 and 2017 limits this to 6%.
�� RWE typically hedges forward most of its t, t+1, t+2 and some of t+3 outright generation (ie nuclear and lignite). In the short term, this mitigates the impact of power prices but ultimately years further out are naked and open to the full impact of power prices.
EPS is highly sensitive to power price moves (%)
Source: Berenberg estimates
7% 6%
14%
35%39%
(7%) (6%)(14%)
(35%) (39%)
(50%)
(40%)
(30%)
(20%)
(10%)
0%
10%
20%
30%
40%
50%
2016E 2017E 2018E 2019E 2020E
EPS with +€5/MWH pprice EPS with -€5/MWH pprice

RWE AG
Utilities – Energy/Integrated
97
�� Coal is the key driver of German power prices. The German electricity market is heavily over-supplied and, consequently, coal is the marginal fuel. The dynamics of the coal market are largely influenced by China. Chinese cutbacks were responsible for the strong coal rally, up 112% since the February low of $36pt. Since then, the Chinese government has attempted to put a dampener on capacity closures, but seemingly to little avail. Key points are as follows.
�� The threat of tight coal supply in China continues. Beijing struggles to make miners embrace loosening of capacity controls due to not just lower output but much higher-than-anticipated coal consumption since July.
�� The government called 22 major miners in late October to stress the need for output to be ramped up. Many miners are reticent to switch gear because of heavy costs of lifting output for a limited time, or due to safety risks (accidents are more common in winter).
�� There are some signs that producers are responding. Output at key state-owned mines in 10 major producing provinces rose 50% to 30.0mt between 11 and 20 October from the first 10 days of the month (CCTD data). Production from 1 to 20 October was 49.0mt, growing 13% from the same period in September, and +11% from August.
�� Increased winter demand and lower temperature looms. China’s six main power groups are already showing signs of strain, with inventory down and consumption up. They held combined stock of 12mt as of 27 October, down 8% yoy, while combined daily coal consumption was 0.6mt, +15% yoy.
�� Higher-than-expected heavy industry production, a spike in residential power consumption due to the hot summer and lacklustre hydro generation lifted thermal power production 4% yoy from April to September.
�� Capacity cuts in May cut 16% of China's coal mining capacity (annual working days from 330 to 276 days). Since then, Beijing has opened the door for over 800 mines to revert to a 330-day annual working schedule.
Key investment point three: reducing nuclear risk
�� Key stat: At €10.5bn end 2015, RWE’s German nuclear provisions represent 30% of its enterprise value. The waste management provisions account for €5.6bn (fuel elements €4.6bn, €1.0bn nuclear waste), with the remainder €4.9bn relating to costs for cooldown and plant decommissioning.
�� Government set to approve proposal on waste transfer soon: The deal will involve the handover of nuclear waste storage liabilities to a government fund, leaving RWE with an estimated c€7bn bill (including €1.5bn waste disposal risk premium). We expect the nuclear waste decommissioning liabilities and premium to be fully paid off in 2017, given management’s desire to take uncapped risk off the balance sheet. The legislation has now been passed to lower parliament for a final vote, which should come through in H1 2017.
�� No need for a capital raise: Unlike E.ON, RWE has sufficient balance sheet flexibility to pay the nuclear premium, even if that ultimately requires a sell down its 77% innogy stake. We believe that that is not only a feasible option, it will be politically acceptable as well. innogy’s strong asset base helps back RWE’s provisions, and selling down RWE’s stake in innogy would not destroy value but instead help reduce RWE’s leverage.
�� Still €5.5bn decommissioning liability sitting on the books: This includes estimated costs for the shutdown and dismantling of the reactors. Preventing any escalation of these provisions will be significant for RWE’s equity performance.
�� Financial expenses could benefit from nuclear waste repayments: 4.4% provisioning replaced with c1.5% debt cost. On a €5bn pay down, that could be worth c€150m.�
RWE AG
Utilities – Energy/Integrated
98
Valuation and sensitivity analysis
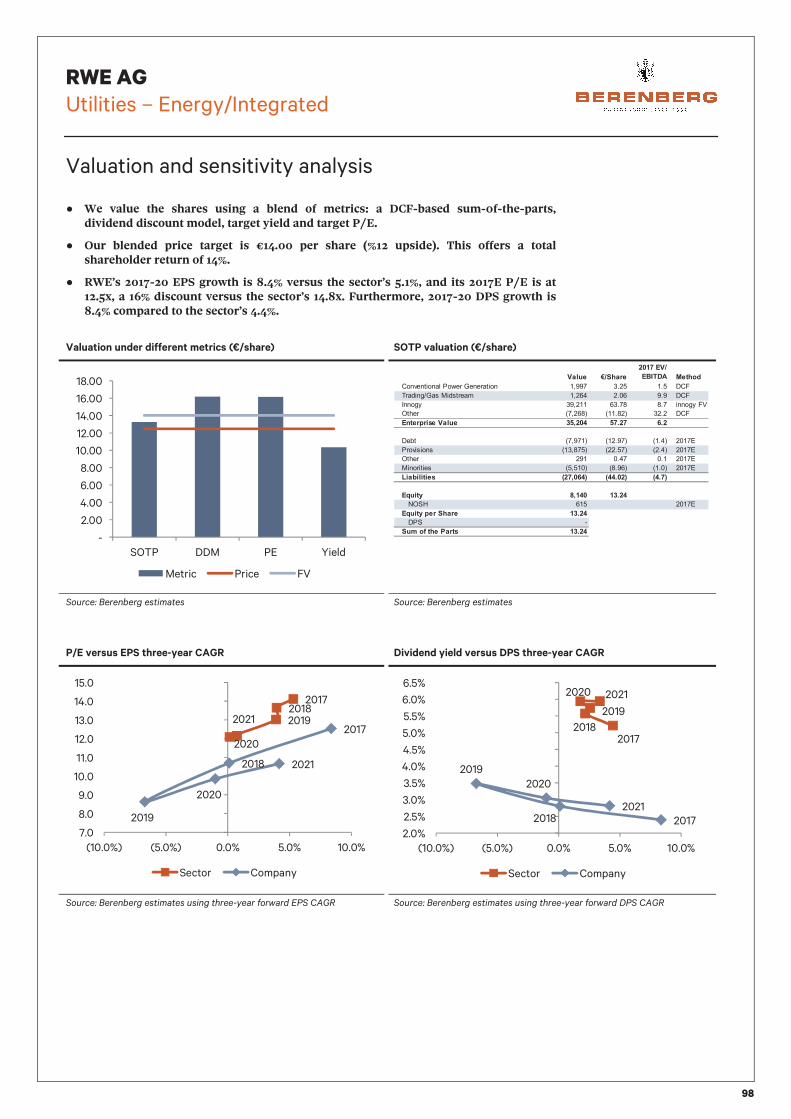
�� We value the shares using a blend of metrics: a DCF-based sum-0f-the-parts, dividend discount model, target yield and target P/E.
�� Our blended price target is €14.00 per share (%12 upside). This offers a total shareholder return of 14%.
�� RWE’s 2017-20 EPS growth is 8.4% versus the sector’s 5.1%, and its 2017E P/E is at 12.5x, a 16% discount versus the sector’s 14.8x. Furthermore, 2017-20 DPS growth is 8.4% compared to the sector’s 4.4%.
Valuation under different metrics (€/share) SOTP valuation (€/share)
Source: Berenberg estimates Source: Berenberg estimates
P/E versus EPS three-year CAGR Dividend yield versus DPS three-year CAGR
Source: Berenberg estimates using three-year forward EPS CAGR Source: Berenberg estimates using three-year forward DPS CAGR
-
2.00
4.00
6.00
8.00
10.00
12.00
14.00
16.00
18.00
SOTP DDM PE Yield
Metric Price FV
����� �����
� �������
������ �����
.�%3�%�$�% /�2�*���"�%�� �$�% ����� -�� �-� �.�
�� �$%';" !�4$�!��� < ���� �-�� �-� �.�
�%%�'= ����� �-�� �-� $%%�'=��>
1�(�� ������� ���-��� �-� �.�
���������������� "$�� � $�#�� !#�
��0� ������� ���-��� ��-� ����
2��3$!$�%! ������� ���-��� ��-� ����
1�(�� ��� �-� �-� ����
4$%��$�$�! ������� ��-��� ��-�� ����
&��'������� (��� !�) (��# �) (�#�)
�*���+ ��� �"#��
516& ��� ����
�*���+�������� �"#��
�26 �
�,��-����.���� �"#��
201720182019
2020
20212017
2018
2019
2020
2021
7.0
8.0
9.0
10.0
11.0
12.0
13.0
14.0
15.0
(10.0%) (5.0%) 0.0% 5.0% 10.0%
Sector Company
20172018
2019
2020 2021
20172018
2019
2020
2021
2.0%
2.5%
3.0%
3.5%
4.0%
4.5%
5.0%
5.5%
6.0%
6.5%
(10.0%) (5.0%) 0.0% 5.0% 10.0%
Sector Company
RWE AG
Utilities – Energy/Integrated
99
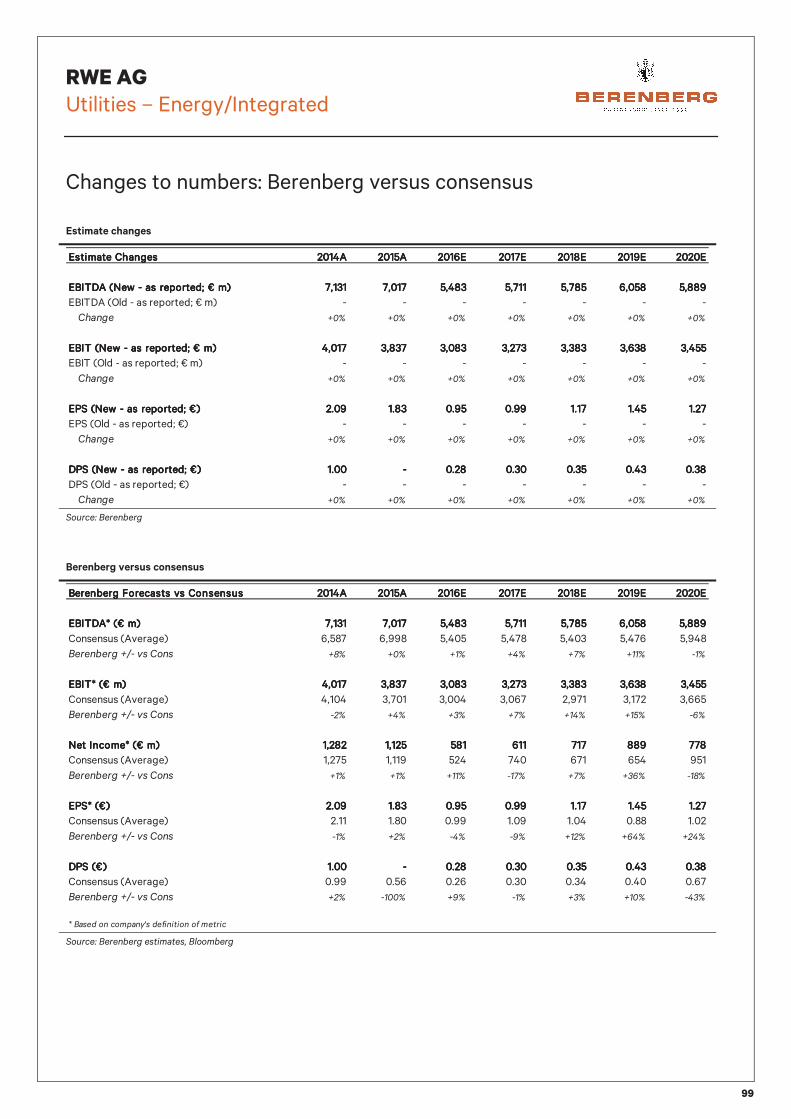
Changes to numbers: Berenberg versus consensus
Estimate changes
Source: Berenberg
Berenberg versus consensus
Source: Berenberg estimates, Bloomberg
Estimate ChangesEstimate ChangesEstimate ChangesEstimate Changes 2014A2014A2014A2014A 2015A2015A2015A2015A 2016E2016E2016E2016E 2017E2017E2017E2017E 2018E2018E2018E2018E 2019E2019E2019E2019E 2020E2020E2020E2020E
EBITDA (New - as reported; € m)EBITDA (New - as reported; € m)EBITDA (New - as reported; € m)EBITDA (New - as reported; € m) 7,1317,1317,1317,131 7,0177,0177,0177,017 5,4835,4835,4835,483 5,7115,7115,7115,711 5,7855,7855,7855,785 6,0586,0586,0586,058 5,8895,8895,8895,889
EBITDA (Old - as reported; € m) - - - - - - -
Change +0% +0% +0% +0% +0% +0% +0%
EBIT (New - as reported; € m)EBIT (New - as reported; € m)EBIT (New - as reported; € m)EBIT (New - as reported; € m) 4,0174,0174,0174,017 3,8373,8373,8373,837 3,0833,0833,0833,083 3,2733,2733,2733,273 3,3833,3833,3833,383 3,6383,6383,6383,638 3,4553,4553,4553,455
EBIT (Old - as reported; € m) - - - - - - -
Change +0% +0% +0% +0% +0% +0% +0%
EPS (New - as reported; €)EPS (New - as reported; €)EPS (New - as reported; €)EPS (New - as reported; €) 2.092.092.092.09 1.831.831.831.83 0.950.950.950.95 0.990.990.990.99 1.171.171.171.17 1.451.451.451.45 1.271.271.271.27
EPS (Old - as reported; €) - - - - - - -
Change +0% +0% +0% +0% +0% +0% +0%
DPS (New - as reported; €)DPS (New - as reported; €)DPS (New - as reported; €)DPS (New - as reported; €) 1.001.001.001.00 ---- 0.280.280.280.28 0.300.300.300.30 0.350.350.350.35 0.430.430.430.43 0.380.380.380.38
DPS (Old - as reported; €) - - - - - - -
Change +0% +0% +0% +0% +0% +0% +0%
Berenberg Forecasts vs ConsensusBerenberg Forecasts vs ConsensusBerenberg Forecasts vs ConsensusBerenberg Forecasts vs Consensus 2014A2014A2014A2014A 2015A2015A2015A2015A 2016E2016E2016E2016E 2017E2017E2017E2017E 2018E2018E2018E2018E 2019E2019E2019E2019E 2020E2020E2020E2020E
EBITDA* (€ m)EBITDA* (€ m)EBITDA* (€ m)EBITDA* (€ m) 7,1317,1317,1317,131 7,0177,0177,0177,017 5,4835,4835,4835,483 5,7115,7115,7115,711 5,7855,7855,7855,785 6,0586,0586,0586,058 5,8895,8895,8895,889
Consensus (Average) 6,587 6,998 5,405 5,478 5,403 5,476 5,948
Berenberg +/- vs Cons +8% +0% +1% +4% +7% +11% -1%
EBIT* (€ m)EBIT* (€ m)EBIT* (€ m)EBIT* (€ m) 4,0174,0174,0174,017 3,8373,8373,8373,837 3,0833,0833,0833,083 3,2733,2733,2733,273 3,3833,3833,3833,383 3,6383,6383,6383,638 3,4553,4553,4553,455
Consensus (Average) 4,104 3,701 3,004 3,067 2,971 3,172 3,665
Berenberg +/- vs Cons -2% +4% +3% +7% +14% +15% -6%
Net Income* (€ m)Net Income* (€ m)Net Income* (€ m)Net Income* (€ m) 1,2821,2821,2821,282 1,1251,1251,1251,125 581581581581 611611611611 717717717717 889889889889 778778778778
Consensus (Average) 1,275 1,119 524 740 671 654 951
Berenberg +/- vs Cons +1% +1% +11% -17% +7% +36% -18%
EPS* (€)EPS* (€)EPS* (€)EPS* (€) 2.092.092.092.09 1.831.831.831.83 0.950.950.950.95 0.990.990.990.99 1.171.171.171.17 1.451.451.451.45 1.271.271.271.27
Consensus (Average) 2.11 1.80 0.99 1.09 1.04 0.88 1.02
Berenberg +/- vs Cons -1% +2% -4% -9% +12% +64% +24%
DPS (€)DPS (€)DPS (€)DPS (€) 1.001.001.001.00 ---- 0.280.280.280.28 0.300.300.300.30 0.350.350.350.35 0.430.430.430.43 0.380.380.380.38
Consensus (Average) 0.99 0.56 0.26 0.30 0.34 0.40 0.67
Berenberg +/- vs Cons +2% -100% +9% -1% +3% +10% -43%
* Based on company's definition of metric

RWE AG
Utilities – Energy/Integrated
100
Sensitivity analysis
Sensitivity analysis
Source: Berenberg
SensitivitiesSensitivitiesSensitivitiesSensitivities 2014A2014A2014A2014A 2015A2015A2015A2015A 2016E2016E2016E2016E 2017E2017E2017E2017E 2018E2018E2018E2018E 2019E2019E2019E2019E 2020E2020E2020E2020E
EBITDA Sensitivity* toEBITDA Sensitivity* toEBITDA Sensitivity* toEBITDA Sensitivity* to
+/- 100 € m Cost savings 0% 0% 2% 2% 2% 2% 2%
+/- 5 €/MWh Power price driven by coal price 0% 0% 1% 1% 2% 7% 7%
+/- 5 €/MWh Spreads 0% 0% 0% 0% 1% 3% 3%
+/- 5 £/kW UK & Ger capacity payments 0% 0% 0% 1% 1% 1% 1%
+/- 0.25 % UK retail margin 0% 0% 2% 2% 2% 2% 2%
Net Income Sensitivity* toNet Income Sensitivity* toNet Income Sensitivity* toNet Income Sensitivity* to
+/- 100 € m Cost savings 0% 0% 13% 12% 10% 8% 9%
+/- 5 €/MWh Power price driven by coal price 0% 0% 7% 6% 14% 35% 39%
+/- 5 €/MWh Spreads 0% 0% 2% 2% 5% 14% 17%
+/- 5 £/kW UK & Ger capacity payments 0% 0% 0% 5% 4% 4% 4%
+/- 0.25 % UK retail margin 0% 0% 11% 11% 9% 8% 9%
* Ceteris Paribus; e.g. does not take account of hedged positions.

RWE AG
Utilities – Energy/Integrated
101
Key assumptions
Key assumptions
Source: Berenberg
Power Price ForecastsPower Price ForecastsPower Price ForecastsPower Price Forecasts 2014A2014A2014A2014A 2015A2015A2015A2015A 2016E2016E2016E2016E 2017E2017E2017E2017E 2018E2018E2018E2018E 2019E2019E2019E2019E 2020E2020E2020E2020E
CountryCountryCountryCountry UnitUnitUnitUnit
UK (Local) £/MWh 47.0 47.0 43.1 48.9 49.0 49.2 49.1
UK (EUR) EUR/MWh 58.5 62.1 52.6 54.0 53.6 53.3 52.6
Germany EUR/MWh 35.0 30.5 27.0 34.9 30.3 28.3 28.3
Nordic EUR/MWh 33.1 32.8 22.0 34.2 28.8 26.1 26.1
Italy EUR/MWh 52.9 46.0 40.8 47.3 43.9 43.8 43.3
Benelux EUR/MWh 47.0 40.0 32.0 42.7 40.3 38.9 38.6
France EUR/MWh 47.0 38.0 32.0 47.3 36.7 37.0 37.0
Spain/Portugal EUR/MWh 47.0 47.0 43.0 44.9 41.8 41.0 40.7
Fuel Price ForecastsFuel Price ForecastsFuel Price ForecastsFuel Price Forecasts 2014A2014A2014A2014A 2015A2015A2015A2015A 2016E2016E2016E2016E 2017E2017E2017E2017E 2018E2018E2018E2018E 2019E2019E2019E2019E 2020E2020E2020E2020E
FuelFuelFuelFuel UnitUnitUnitUnit
Oil (Brent) $/bbl 101.9 53.5 48.3 51.1 53.9 53.9 53.9
Coal $/t 78.3 53.3 49.5 74.4 65.8 62.0 62.0
Gas (Europe LTC) EUR/MWh 26.4 21.9 13.6 17.2 17.1 17.1 16.7
Gas (Italy) EUR/MWh 23.2 20.0 12.4 15.7 15.6 15.6 15.3
Gas (UK) £ £/MWh 14.1 12.0 9.3 11.9 12.0 12.1 12.0
Carbon UK floor £/t 14.3 20.0 22.0 23.6 23.7 23.8 23.9
US Gas Henry Hub $/MWh 14.7 8.7 9.5 10.2 9.8 10.0 10.2
Uranium EUR/MWh 8.5 8.5 8.5 8.5 8.5 8.5 8.5
Carbon EUR/t 6.0 7.8 5.5 6.2 6.3 6.3 6.3
Year end currency ratesYear end currency ratesYear end currency ratesYear end currency rates 2014A2014A2014A2014A 2015A2015A2015A2015A 2016E2016E2016E2016E 2017E2017E2017E2017E 2018E2018E2018E2018E 2019E2019E2019E2019E 2020E2020E2020E2020E
EURGBP 0.78 0.74 0.90 0.91 0.92 0.93 0.94
EURTRY 2.83 3.17 3.50 3.86 4.26 4.71 5.20
EURSEK 9.44 9.17 9.86 9.83 9.84 9.88 9.95
EURUSD 1.21 1.09 1.11 1.13 1.15 1.17 1.20
EURRUB 73.50 80.00 71.52 78.67 85.24 91.87 98.49
EURMXN 17.84 18.75 21.75 23.10 24.53 26.14 27.83
USDBRL 2.66 4.00 3.28 3.59 3.86 4.11 4.35
InflationInflationInflationInflation 2014A2014A2014A2014A 2015A2015A2015A2015A 2016E2016E2016E2016E 2017E2017E2017E2017E 2018E2018E2018E2018E 2019E2019E2019E2019E 2020E2020E2020E2020E
Central Europe 0.8% 0.1% 0.2% 1.4% 1.4% 1.4% 1.4%
Eastern Europe 5.8% 9.0% 5.4% 5.1% 5.1% 5.1% 5.1%
UK 1.5% 0.0% 0.9% 1.7% 1.7% 1.7% 1.7%
Nordic 0.5% -0.2% 0.6% 1.4% 1.4% 1.4% 1.4%
Spain/Portugal -0.2% -0.1% 0.1% 1.3% 1.3% 1.3% 1.3%
US 1.6% 0.1% 1.5% 2.4% 2.4% 2.4% 2.4%
RWE AG
Utilities – Energy/Integrated
102
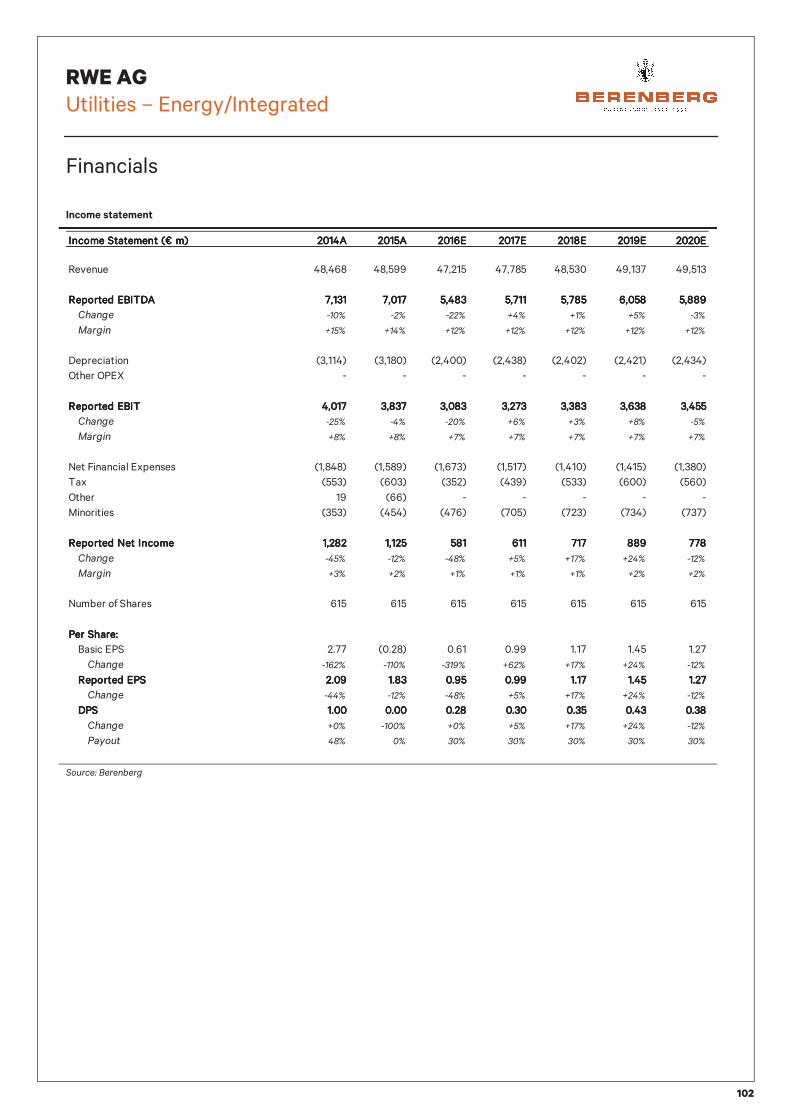
Financials
Income statement
Source: Berenberg
Income Statement (€ m)Income Statement (€ m)Income Statement (€ m)Income Statement (€ m) 2014A2014A2014A2014A 2015A2015A2015A2015A 2016E2016E2016E2016E 2017E2017E2017E2017E 2018E2018E2018E2018E 2019E2019E2019E2019E 2020E2020E2020E2020E
Revenue 48,468 48,599 47,215 47,785 48,530 49,137 49,513
Reported EBITDAReported EBITDAReported EBITDAReported EBITDA 7,1317,1317,1317,131 7,0177,0177,0177,017 5,4835,4835,4835,483 5,7115,7115,7115,711 5,7855,7855,7855,785 6,0586,0586,0586,058 5,8895,8895,8895,889
Change -10% -2% -22% +4% +1% +5% -3%
Margin +15% +14% +12% +12% +12% +12% +12%
Depreciation (3,114) (3,180) (2,400) (2,438) (2,402) (2,421) (2,434)
Other OPEX - - - - - - -
Reported EBITReported EBITReported EBITReported EBIT 4,0174,0174,0174,017 3,8373,8373,8373,837 3,0833,0833,0833,083 3,2733,2733,2733,273 3,3833,3833,3833,383 3,6383,6383,6383,638 3,4553,4553,4553,455
Change -25% -4% -20% +6% +3% +8% -5%
Margin +8% +8% +7% +7% +7% +7% +7%
Net Financial Expenses (1,848) (1,589) (1,673) (1,517) (1,410) (1,415) (1,380)
Tax (553) (603) (352) (439) (533) (600) (560)
Other 19 (66) - - - - -
Minorities (353) (454) (476) (705) (723) (734) (737)
Reported Net IncomeReported Net IncomeReported Net IncomeReported Net Income 1,2821,2821,2821,282 1,1251,1251,1251,125 581581581581 611611611611 717717717717 889889889889 778778778778
Change -45% -12% -48% +5% +17% +24% -12%
Margin +3% +2% +1% +1% +1% +2% +2%
Number of Shares 615 615 615 615 615 615 615
Per Share:Per Share:Per Share:Per Share:
Basic EPS 2.77 (0.28) 0.61 0.99 1.17 1.45 1.27
Change -162% -110% -319% +62% +17% +24% -12%
Reported EPSReported EPSReported EPSReported EPS 2.092.092.092.09 1.831.831.831.83 0.950.950.950.95 0.990.990.990.99 1.171.171.171.17 1.451.451.451.45 1.271.271.271.27
Change -44% -12% -48% +5% +17% +24% -12%
DPSDPSDPSDPS 1.001.001.001.00 0.000.000.000.00 0.280.280.280.28 0.300.300.300.30 0.350.350.350.35 0.430.430.430.43 0.380.380.380.38
Change +0% -100% +0% +5% +17% +24% -12%
Payout 48% 0% 30% 30% 30% 30% 30%
RWE AG
Utilities – Energy/Integrated
103
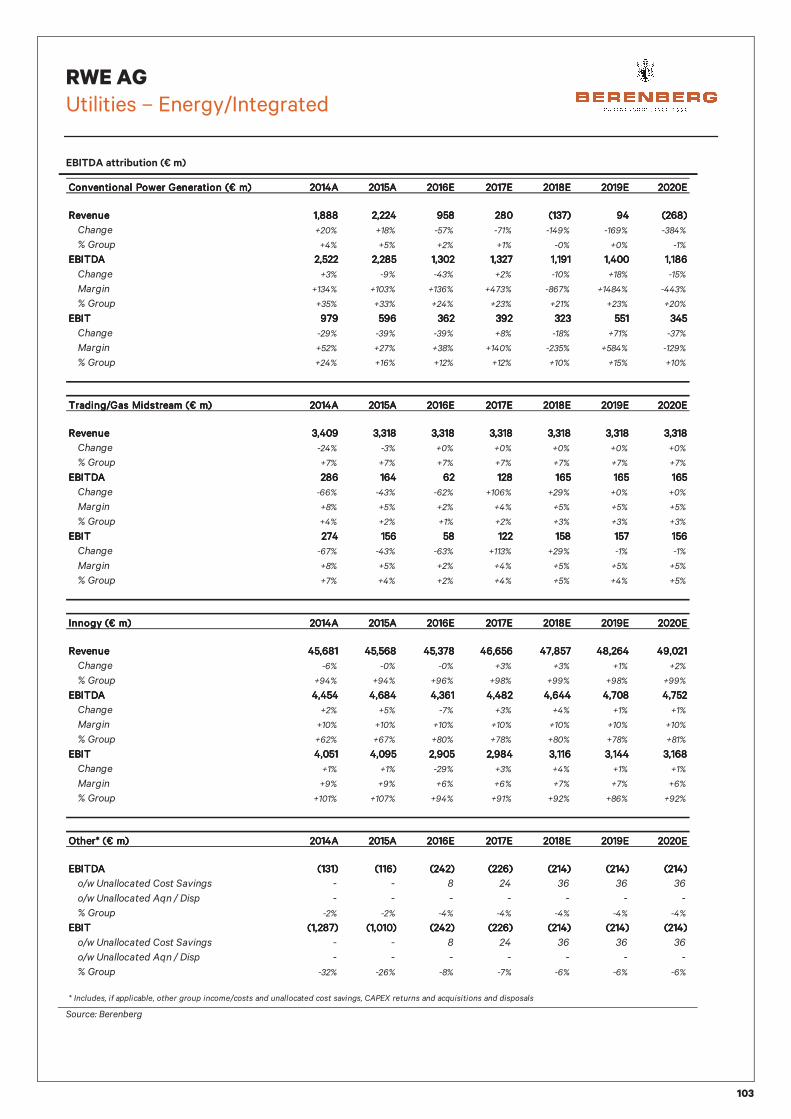
EBITDA attribution (€ m)
Source: Berenberg
Conventional Power Generation (€ m)Conventional Power Generation (€ m)Conventional Power Generation (€ m)Conventional Power Generation (€ m) 2014A2014A2014A2014A 2015A2015A2015A2015A 2016E2016E2016E2016E 2017E2017E2017E2017E 2018E2018E2018E2018E 2019E2019E2019E2019E 2020E2020E2020E2020E
RevenueRevenueRevenueRevenue 1,8881,8881,8881,888 2,2242,2242,2242,224 958958958958 280280280280 (137)(137)(137)(137) 94949494 (268)(268)(268)(268)
Change +20% +18% -57% -71% -149% -169% -384%
% Group +4% +5% +2% +1% -0% +0% -1%
EBITDAEBITDAEBITDAEBITDA 2,5222,5222,5222,522 2,2852,2852,2852,285 1,3021,3021,3021,302 1,3271,3271,3271,327 1,1911,1911,1911,191 1,4001,4001,4001,400 1,1861,1861,1861,186
Change +3% -9% -43% +2% -10% +18% -15%
Margin +134% +103% +136% +473% -867% +1484% -443%
% Group +35% +33% +24% +23% +21% +23% +20%
EBITEBITEBITEBIT 979979979979 596596596596 362362362362 392392392392 323323323323 551551551551 345345345345
Change -29% -39% -39% +8% -18% +71% -37%
Margin +52% +27% +38% +140% -235% +584% -129%
% Group +24% +16% +12% +12% +10% +15% +10%
Trading/Gas Midstream (€ m)Trading/Gas Midstream (€ m)Trading/Gas Midstream (€ m)Trading/Gas Midstream (€ m) 2014A2014A2014A2014A 2015A2015A2015A2015A 2016E2016E2016E2016E 2017E2017E2017E2017E 2018E2018E2018E2018E 2019E2019E2019E2019E 2020E2020E2020E2020E
RevenueRevenueRevenueRevenue 3,4093,4093,4093,409 3,3183,3183,3183,318 3,3183,3183,3183,318 3,3183,3183,3183,318 3,3183,3183,3183,318 3,3183,3183,3183,318 3,3183,3183,3183,318
Change -24% -3% +0% +0% +0% +0% +0%
% Group +7% +7% +7% +7% +7% +7% +7%
EBITDAEBITDAEBITDAEBITDA 286286286286 164164164164 62626262 128128128128 165165165165 165165165165 165165165165
Change -66% -43% -62% +106% +29% +0% +0%
Margin +8% +5% +2% +4% +5% +5% +5%
% Group +4% +2% +1% +2% +3% +3% +3%
EBITEBITEBITEBIT 274274274274 156156156156 58585858 122122122122 158158158158 157157157157 156156156156
Change -67% -43% -63% +113% +29% -1% -1%
Margin +8% +5% +2% +4% +5% +5% +5%
% Group +7% +4% +2% +4% +5% +4% +5%
Innogy (€ m)Innogy (€ m)Innogy (€ m)Innogy (€ m) 2014A2014A2014A2014A 2015A2015A2015A2015A 2016E2016E2016E2016E 2017E2017E2017E2017E 2018E2018E2018E2018E 2019E2019E2019E2019E 2020E2020E2020E2020E
RevenueRevenueRevenueRevenue 45,68145,68145,68145,681 45,56845,56845,56845,568 45,37845,37845,37845,378 46,65646,65646,65646,656 47,85747,85747,85747,857 48,26448,26448,26448,264 49,02149,02149,02149,021
Change -6% -0% -0% +3% +3% +1% +2%
% Group +94% +94% +96% +98% +99% +98% +99%
EBITDAEBITDAEBITDAEBITDA 4,4544,4544,4544,454 4,6844,6844,6844,684 4,3614,3614,3614,361 4,4824,4824,4824,482 4,6444,6444,6444,644 4,7084,7084,7084,708 4,7524,7524,7524,752
Change +2% +5% -7% +3% +4% +1% +1%
Margin +10% +10% +10% +10% +10% +10% +10%
% Group +62% +67% +80% +78% +80% +78% +81%
EBITEBITEBITEBIT 4,0514,0514,0514,051 4,0954,0954,0954,095 2,9052,9052,9052,905 2,9842,9842,9842,984 3,1163,1163,1163,116 3,1443,1443,1443,144 3,1683,1683,1683,168
Change +1% +1% -29% +3% +4% +1% +1%
Margin +9% +9% +6% +6% +7% +7% +6%
% Group +101% +107% +94% +91% +92% +86% +92%
Other* (€ m)Other* (€ m)Other* (€ m)Other* (€ m) 2014A2014A2014A2014A 2015A2015A2015A2015A 2016E2016E2016E2016E 2017E2017E2017E2017E 2018E2018E2018E2018E 2019E2019E2019E2019E 2020E2020E2020E2020E
EBITDAEBITDAEBITDAEBITDA (131)(131)(131)(131) (116)(116)(116)(116) (242)(242)(242)(242) (226)(226)(226)(226) (214)(214)(214)(214) (214)(214)(214)(214) (214)(214)(214)(214)
o/w Unallocated Cost Savings - - 8 24 36 36 36
o/w Unallocated Aqn / Disp - - - - - - -
% Group -2% -2% -4% -4% -4% -4% -4%
EBITEBITEBITEBIT (1,287)(1,287)(1,287)(1,287) (1,010)(1,010)(1,010)(1,010) (242)(242)(242)(242) (226)(226)(226)(226) (214)(214)(214)(214) (214)(214)(214)(214) (214)(214)(214)(214)
o/w Unallocated Cost Savings - - 8 24 36 36 36
o/w Unallocated Aqn / Disp - - - - - - -
% Group -32% -26% -8% -7% -6% -6% -6%
* Includes, if applicable, other group income/costs and unallocated cost savings, CAPEX returns and acquisitions and disposals
RWE AG
Utilities – Energy/Integrated
104
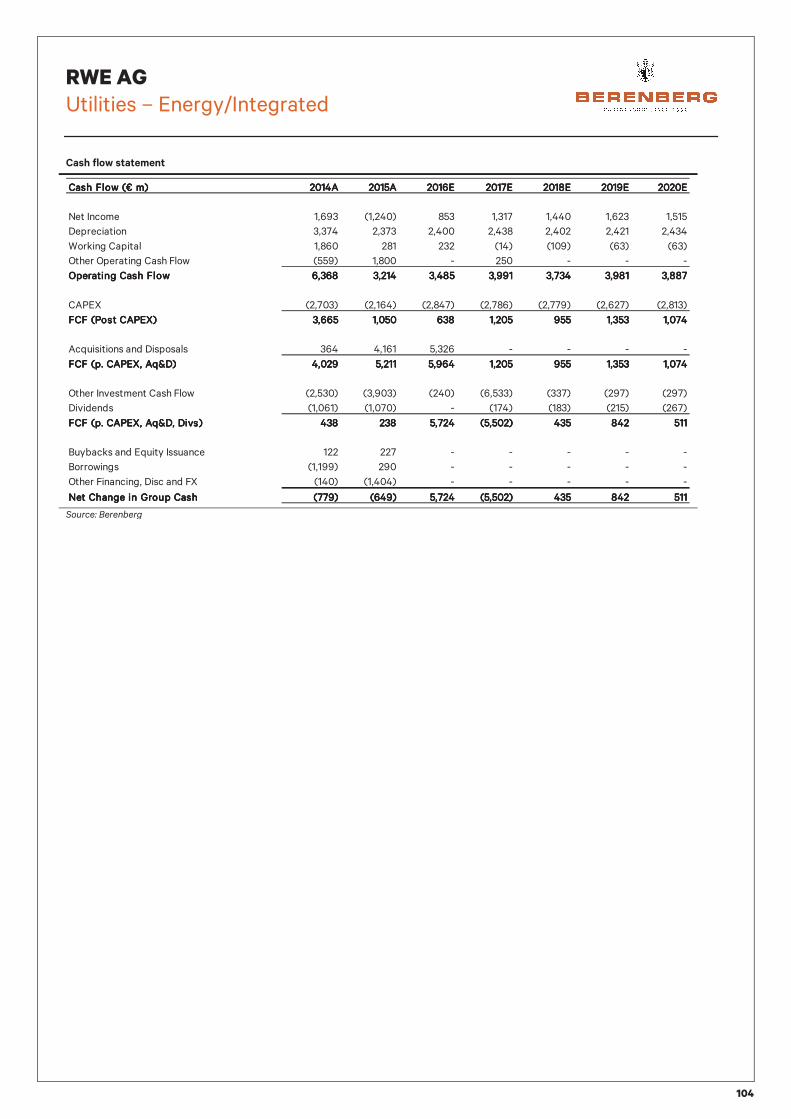
Cash flow statement
Source: Berenberg
Cash Flow (€ m)Cash Flow (€ m)Cash Flow (€ m)Cash Flow (€ m) 2014A2014A2014A2014A 2015A2015A2015A2015A 2016E2016E2016E2016E 2017E2017E2017E2017E 2018E2018E2018E2018E 2019E2019E2019E2019E 2020E2020E2020E2020E
Net Income 1,693 (1,240) 853 1,317 1,440 1,623 1,515
Depreciation 3,374 2,373 2,400 2,438 2,402 2,421 2,434
Working Capital 1,860 281 232 (14) (109) (63) (63)
Other Operating Cash Flow (559) 1,800 - 250 - - -
Operating Cash FlowOperating Cash FlowOperating Cash FlowOperating Cash Flow 6,3686,3686,3686,368 3,2143,2143,2143,214 3,4853,4853,4853,485 3,9913,9913,9913,991 3,7343,7343,7343,734 3,9813,9813,9813,981 3,8873,8873,8873,887
CAPEX (2,703) (2,164) (2,847) (2,786) (2,779) (2,627) (2,813)
FCF (Post CAPEX)FCF (Post CAPEX)FCF (Post CAPEX)FCF (Post CAPEX) 3,6653,6653,6653,665 1,0501,0501,0501,050 638638638638 1,2051,2051,2051,205 955955955955 1,3531,3531,3531,353 1,0741,0741,0741,074
Acquisitions and Disposals 364 4,161 5,326 - - - -
FCF (p. CAPEX, Aq&D)FCF (p. CAPEX, Aq&D)FCF (p. CAPEX, Aq&D)FCF (p. CAPEX, Aq&D) 4,0294,0294,0294,029 5,2115,2115,2115,211 5,9645,9645,9645,964 1,2051,2051,2051,205 955955955955 1,3531,3531,3531,353 1,0741,0741,0741,074
Other Investment Cash Flow (2,530) (3,903) (240) (6,533) (337) (297) (297)
Dividends (1,061) (1,070) - (174) (183) (215) (267)
FCF (p. CAPEX, Aq&D, Divs)FCF (p. CAPEX, Aq&D, Divs)FCF (p. CAPEX, Aq&D, Divs)FCF (p. CAPEX, Aq&D, Divs) 438438438438 238238238238 5,7245,7245,7245,724 (5,502)(5,502)(5,502)(5,502) 435435435435 842842842842 511511511511
Buybacks and Equity Issuance 122 227 - - - - -
Borrowings (1,199) 290 - - - - -
Other Financing, Disc and FX (140) (1,404) - - - - -
Net Change in Group CashNet Change in Group CashNet Change in Group CashNet Change in Group Cash (779)(779)(779)(779) (649)(649)(649)(649) 5,7245,7245,7245,724 (5,502)(5,502)(5,502)(5,502) 435435435435 842842842842 511511511511

RWE AG
Utilities – Energy/Integrated
105
Balance sheet statement
Source: Berenberg
Balance Sheet (€ m)Balance Sheet (€ m)Balance Sheet (€ m)Balance Sheet (€ m) 2014A2014A2014A2014A 2015A2015A2015A2015A 2016E2016E2016E2016E 2017E2017E2017E2017E 2018E2018E2018E2018E 2019E2019E2019E2019E 2020E2020E2020E2020E
Intangible Fixed Assets 12,797 13,215 13,215 13,215 13,215 13,215 13,215
PP&E 31,059 29,357 24,478 24,826 25,202 25,408 25,787
Other Non-Current Assets 10,368 8,881 8,881 8,881 8,881 8,881 8,881
Total Non-Current AssetsTotal Non-Current AssetsTotal Non-Current AssetsTotal Non-Current Assets 54,22454,22454,22454,224 51,45351,45351,45351,453 46,57446,57446,57446,574 46,92246,92246,92246,922 47,29847,29847,29847,298 47,50447,50447,50447,504 47,88347,88347,88347,883
Inventories and Receivables 10,587 8,634 8,388 8,489 8,622 8,730 8,796
Cash 3,171 2,522 8,246 2,744 3,178 4,020 4,531
Other Liquid Assets 4,410 7,437 7,437 7,437 7,437 7,437 7,437
Other Current Assets 13,924 9,288 9,288 9,288 9,288 9,288 9,288
Assets Held for Sale 5,540 41 - - - - -
Total Current AssetsTotal Current AssetsTotal Current AssetsTotal Current Assets 32,09232,09232,09232,092 27,88127,88127,88127,881 33,35933,35933,35933,359 27,95827,95827,95827,958 28,52528,52528,52528,525 29,47529,47529,47529,475 30,05230,05230,05230,052
Total AssetsTotal AssetsTotal AssetsTotal Assets 86,31686,31686,31686,316 79,33479,33479,33479,334 79,93379,93379,93379,933 74,88074,88074,88074,880 75,82375,82375,82375,823 76,97976,97976,97976,979 77,93577,93577,93577,935
Short-Term Debt (3,342) (2,362) (4,100) (4,100) (4,100) (4,100) (4,100)
Payables (6,309) (6,122) (5,948) (6,019) (6,113) (6,190) (6,237)
Provisions (5,504) (5,186) (5,191) (5,049) (5,047) (5,046) (5,044)
o/w Nuclear Liabilities (416) (334) (339) (197) (195) (194) (192)
o/w Pensions - - - - - - -
o/w Other Provisions (5,088) (4,852) (4,852) (4,852) (4,852) (4,852) (4,852)
Other Current Liabilities (10,430) (11,436) (11,436) (11,436) (11,436) (11,436) (11,436)
Liabilities of Businesses Held for Sale (2,635) (19) - - - - -
Total Current LiabilitiesTotal Current LiabilitiesTotal Current LiabilitiesTotal Current Liabilities (28,220)(28,220)(28,220)(28,220) (25,125)(25,125)(25,125)(25,125) (26,675)(26,675)(26,675)(26,675) (26,604)(26,604)(26,604)(26,604) (26,696)(26,696)(26,696)(26,696) (26,771)(26,771)(26,771)(26,771) (26,817)(26,817)(26,817)(26,817)
Long-Term Debt (15,224) (16,718) (14,051) (14,051) (14,051) (14,051) (14,051)
Provisions (27,540) (24,623) (26,652) (22,339) (22,271) (22,241) (22,199)
o/w Nuclear Liabilities (9,951) (10,120) (10,275) (5,962) (5,894) (5,864) (5,822)
o/w Pensions (7,871) (5,842) (7,716) (7,716) (7,716) (7,716) (7,716)
o/w Other Provisions (9,718) (8,661) (8,661) (8,661) (8,661) (8,661) (8,661)
Other Non-Current Liabilities (3,560) (3,974) (3,974) (3,974) (3,974) (3,974) (3,974)
Total Non-Current LiabilitiesTotal Non-Current LiabilitiesTotal Non-Current LiabilitiesTotal Non-Current Liabilities (46,324)(46,324)(46,324)(46,324) (45,315)(45,315)(45,315)(45,315) (44,677)(44,677)(44,677)(44,677) (40,364)(40,364)(40,364)(40,364) (40,296)(40,296)(40,296)(40,296) (40,266)(40,266)(40,266)(40,266) (40,224)(40,224)(40,224)(40,224)
Shareholders' Equity (7,388) (5,847) (3,154) (2,402) (3,209) (4,210) (5,064)
Minorities (4,384) (3,047) (5,427) (5,510) (5,622) (5,732) (5,830)
Total EquityTotal EquityTotal EquityTotal Equity (11,772)(11,772)(11,772)(11,772) (8,894)(8,894)(8,894)(8,894) (8,581)(8,581)(8,581)(8,581) (7,911)(7,911)(7,911)(7,911) (8,831)(8,831)(8,831)(8,831) (9,942)(9,942)(9,942)(9,942) (10,894)(10,894)(10,894)(10,894)
Total Liabilities and EquityTotal Liabilities and EquityTotal Liabilities and EquityTotal Liabilities and Equity (86,316)(86,316)(86,316)(86,316) (79,334)(79,334)(79,334)(79,334) (79,933)(79,933)(79,933)(79,933) (74,880)(74,880)(74,880)(74,880) (75,823)(75,823)(75,823)(75,823) (76,979)(76,979)(76,979)(76,979) (77,935)(77,935)(77,935)(77,935)
Net Debt (As Reported) 30,972 25,126 20,508 21,555 21,050 20,177 19,623
Economic Net Debt 30,972 25,126 20,508 21,555 21,050 20,177 19,623
Net Debt / EBITDA (As Reported) 4.3 3.6 3.7 3.8 3.6 3.3 3.3
Economic Net Debt / EBITDA 4.3 3.6 3.7 3.8 3.6 3.3 3.3
Related Documents