Economic Commission for Latin America and the Caribbean JOSÉ LUIS MACHINEA Executive Secretary ERNESTO OTTONE Acting Deputy Executive Secretary a.i.

Welcome message from author
This document is posted to help you gain knowledge. Please leave a comment to let me know what you think about it! Share it to your friends and learn new things together.
Transcript
Economic Commission for Latin America and the Caribbean
JOSé LuiS mAChinEA
Executive Secretary
ErnEStO OttOnE
Acting Deputy Executive Secretary a.i.

numBEr 93
DECEmBEr 2007
SAntiAGO, ChiLE
OSCAr ALtimirDirector
rEYnALDO BAJrAJDeputy Director
C E P A Leconomic
commission for
latin america
and
the caribbean
R e v i e w
The cepal Review was founded in 1976 and is published three times a year by the United Nations Economic Commission for Latin America and the Caribbean, which has its headquarters in Santiago, Chile. The Review, however, has full editorial independence and follows the usual academic procedures and criteria, including the review of articles by independent external referees. The Review is distributed to universities, research institutes and other international organizations, as well as to individual subscribers, and is also consulted extensively on the Internet.
The purpose of the Review is to contribute to the discussion of socio-economic development issues in the region by offering analytical and policy approaches and articles by economists and other social scientists working both within and outside the United Nations. Accordingly, the editorial board of the Review extends its readers an open invitation to submit for publication articles analysing various aspects of economic and social development in Latin America and the Caribbean.
The opinions expressed in the signed articles are those of the authors and do not necessarily reflect the views of the organization. The designations employed and the way in which data are presented do not imply the expression of any opinion whatsoever on the part of the secretariat concerning the legal status of any country, territory, city or area or its authorities, or concerning the delimitation of its frontiers or boundaries.
A subscription to the cepal Review in Spanish costs US$ 30 for one year (three issues) and US$ 50 for two years. A subscription to the English version costs US$ 35 or US$ 60, respectively. The price of a single issue in either Spanish or English is US$ 15, including postage and handling.
A subscription form can be found in the Review, just before the section “Recent eclac publications”, and on the eclac web site (www.cepal.org).
The complete text of the Review can also be downloaded free of charge from the above web site.
United Nations publicationISSN printed version 0251-2920 - ISSN online version 1684-0348ISBN 978-92-1-121665-3 LC/G.2347-PCopyright © United Nations, December 2007. All rights reserved.Printed in Santiago, Chile
Requests for authorization to reproduce this work in whole or in part should be sent to the Secretary of the Publications Board. Member States and their governmental institutions may reproduce this work without prior authorization, but are requested to mention the source and to inform the United Nations of such reproduction. In all cases, the United Nations remains the owner of the copyright and should be identified as such in reproductions with the expression “© United Nations 2005” (or other year as appropriate).
Explanatory notesThe following symbols are used in tables in the Review:… Three dots indicate that data are not available or are not separately reported.(–) A dash indicates that the amount is nil or negligible. A blank space in a table means that the item in question is not applicable.(-) A minus sign indicates a deficit or decrease, unless otherwise specified.(.) A point is used to indicate decimals.(/) A slash indicates a crop year or fiscal year; e.g., 2004/2005.(-) Use of a hyphen between years (e.g., 2004-2005) indicates reference to the complete period considered, including the beginning and end
years.
The word “tons” means metric tons and the word “dollars” means United States dollars, unless otherwise stated. References to annual rates of growth or variation signify compound annual rates. Individual figures and percentages in tables do not necessarily add up to the corresponding totals because of rounding.
5C E P A L r E v i E w 9 3
D E C E M B E r 2 0 0 7
S u m m a r y
The macroeconomics of the Latin American economic boom 7José Antonio Ocampo
The sustainability of monetary sterilization policies 29Roberto Frenkel
Public expenditure in Latin America: trends and key policy issues 37Benedict Clements, Christopher Faircloth and Marijn Verhoeven
inequality, institutions and progress: a debate between history and the present 61José Antonio Alonso
Latin America meets China and india: prospects and challenges for trade and investment 81Osvaldo Rosales and Mikio Kuwayama
is the phasing out of the Agreement on Textiles and Clothing eroding competitiveness in Central America and the Dominican republic? 105René A. Hernández
The comparative advantage fallacy and a rule for convergence 125Esteban Pérez Caldentey and Anesa Ali
A boom in a heterogeneous economy. Peru 2002-2006 137Norberto E. García
Pluriactivity and family farming in Brazil: the case of rio Grande do Sul 149Flávio Sacco dos Anjos and Nádia Velleda Caldas
Guidelines for contributors to the cepal Review 165
cepal Review on the internet 166
recent eclac publications 169
We inform our readers that cepal Review has been selected for coverage in the Social Sciences Citation Index (ssci), published by Thomson isi.

7
C E P A L R E V I E W 9 3 • D E C E M B E R 2 0 0 7
The macroeconomics of the Latin American economic boom
José Antonio Ocampo
This paper argues that the recent boom in the Latin American
economies can be explained by the conjunction of two external factors
not found together since the 1970s: strong commodity prices (more so
for hydrocarbons and mining products than for agricultural commodities)
and exceptional external financing conditions. Concerning the latter, the
key development was the massive influx of capital during two periods of
“exuberance” in international financial markets (between mid-2004 and April
2006, and between mid-2006 and mid-2007), particularly the second. It also
argues for the importance of spreading and consolidating Latin America’s
two great (and complementary) macroeconomic policy innovations of
recent years: countercyclical fiscal management (still confined to just a few
countries) and active intervention in currency markets. Such intervention
needs to be based on a growing recognition that the real exchange rate
ought to be an explicit goal of macroeconomic policy.
K E YW O R D S
Economic growth
Economic cond i t ions
Macroeconomy
Raw mater ia ls
Pr ices
Cap i ta l movements
In terna t iona l f inance
Fore ign exchange ra tes
Economic po l icy
Monetar y po l icy
Fisca l po l icy
Economic s ta t is t ics
La t in Amer ica
José Antonio Ocampo
Professor at Columbia University,
Former Executive Secretary of ECLAC
C E P A L R E V I E W 9 3 • D E C E M B E R 2 0 0 7
ThE MACRoEConoMICs of ThE LATIn AMERICAn EConoMIC BooM • José AnTonIo oCAMPo
8
IIntroduction
In 2007, Latin America will have had four consecutive years of rapid growth (ECLAC, 2007a). There has not been a period of such strong economic expansion in the region since the long post-war boom that culminated in the debt crisis (or a few years earlier in some countries). This situation has come, furthermore, after almost a quarter of a century of unsatisfactory performance marked by the “lost decade” of the 1980s, the “lost half-decade” of 1998-2002 and a period of weak performance between the two. What is more, the current situation is characterized by a combination of rapid growth and a large current account surplus that is exceptional in Latin America’s economic history, as well as by improved labour market, poverty and income distribution. The countries have also adopted a more explicit policy of intervening in currency
markets and increasing their external assets, while the tendency to follow procyclical macroeconomic policies has been corrected to some extent. So far, however, progress with the latter has been largely confined to just a few countries.
This paper analyses the current macroeconomic situation and seeks to identify its particular charac-teristics. After examining the main macroeconomic results and their relationship with world economic conditions (section II), it looks more closely at the effects of movements in international financial mar-kets (section III), analyses macroeconomic policy developments in the region’s seven largest economies (section IV) and ends with some brief conclusions (section V).
IIThe current situation and the international context
In the past few years, Latin America has at last retur-ned to the economic growth rates of the 1970s. Given that the two largest Latin American economies (Brazil and Mexico) have performed less well now than they did then, the indicators look even better when simple averages of GDP growth in the region’s countries are compared. If that is done, the situation now is an im-provement on the 1970s. Furthermore, since the rate of population increase has fallen sharply, the results look even more impressive when calculated in terms of per capita output growth.
The explanation for this is basically to be sought in the exceptional conditions prevailing in the international
economy over the last few years.1 Although, as we shall see later, some aspects of macroeconomic management have been more effective than in the past, this is not necessarily something that contributes to short-term growth. Indeed, it is possible that the countercyclical macroeconomic policies the Latin American countries have begun adopting, albeit very unevenly, might actually be sacrificing current demand growth to an improved ability to deal with adverse economic conditions in future. Nor can the improvement in performance be attributed to economic reforms, whose effects on the production structure and economic growth have been much debated and may actually have been more nega-tive than positive.2 From a Schumpeterian perspective of “creative destruction”, however, it might perhaps
1 See the recent essay by Izquierdo, Romero and Talvi (2007).2 For an ambivalent assessment from a perspective that is generally favourable to the reforms, see Kuczynski and Williamson (2003). A more critical evaluation can be found in Ocampo (2004).
A version of this paper was presented at the fourth economic forum of the Getulio Vargas Foundation on 17 September 2007. The author is grateful to Rudy Loo-Kung, Julio Marichal, Mariangela Parra, Helvia Velloso and Jürgen Weller for providing the necessary statistical information. Discussions with Guillermo Calvo and Osvaldo Kacef helped to clarify some of the ideas dealt with here.
C E P A L R E V I E W 9 3 • D E C E M B E R 2 0 0 7
ThE MACRoEConoMICs of ThE LATIn AMERICAn EConoMIC BooM • José AnTonIo oCAMPo
9
be said that the reform-led phase of destruction in the countries’ production capacity is now over, and that what should prevail from now on are rather the factors favouring the creation of new export capabilities. The absence or weakness of productive development poli-cies, however, is still one of the main shortcomings of economic policy in the region.
The current boom is basically due, then, to the conjunction of two favourable factors of external origin not seen together since the 1970s: strong commodity prices and exceptional external financing conditions. The economic history of Latin America shows that this combination leads infallibly to rapid economic growth. In the current circumstances, however, the transmission mechanisms for external financing have been somewhat different, mainly because governments have been far more circumspect in their use of such financing.
To these two favourable factors must be added a third: large remittances by Latin American migrants to their home countries. This factor has had a large effect on the economies that are closest geographically to the United States and, interestingly enough, has been particularly important in most of the small economies whose terms of trade have deteriorated in recent years because of high oil prices. Meanwhile, the boom in in-ternational trade has boosted growth in the manufactured goods and services exports on which the region (and especially the economies of Mexico, Central America and the Caribbean) increasingly depends.
It should be added that the external situation is also exceptional in another way: this is the first period in global economic history when per capita GDP has grown much faster in the developing countries than in the industrialized world, i.e., the first reversal of the tendency in global economic history for development levels in the two sets of countries to diverge (United Nations, 2006). However, it is still too soon to speak of true long-term convergence in these levels, except in the case of some Asian economies. Moreover, the current boom has encompassed every region of the developing world and, among them, Latin America has been in fact the weakest performer (United Nations, 2007).
The factors giving rise to this exceptional perfor-mance are well known. High raw material prices are mainly due to the heavy dependence of the Chinese economy on commodity imports. Exceptional finan-cing conditions, in turn, reflect a wide array of factors: (i) the tolerance of the monetary authorities in the world’s leading economies for low interest rates, owing to low inflation levels; (ii) major financial innovations that, combined with the search for higher returns, multiplied
the demand for and liquidity of riskier financial instru-ments; (iii) the consequent large reduction in the risk premiums of such securities, and (iv) the large build-up of developing countries’ international reserves, owing to the saving of exceptional foreign exchange surpluses and the demand for “self-insurance” that arose after the Asian crisis, when it became clear that there was no international mechanism for dealing with crises caused by sudden stops in external financing. Some of these conditions, particularly the second, are changing. Rising remittances, meanwhile, reflect growing move-ments of labour (both regular and irregular) from Latin America to the industrialized countries, partly because of very limited job creation in the region during the “lost half-decade”.
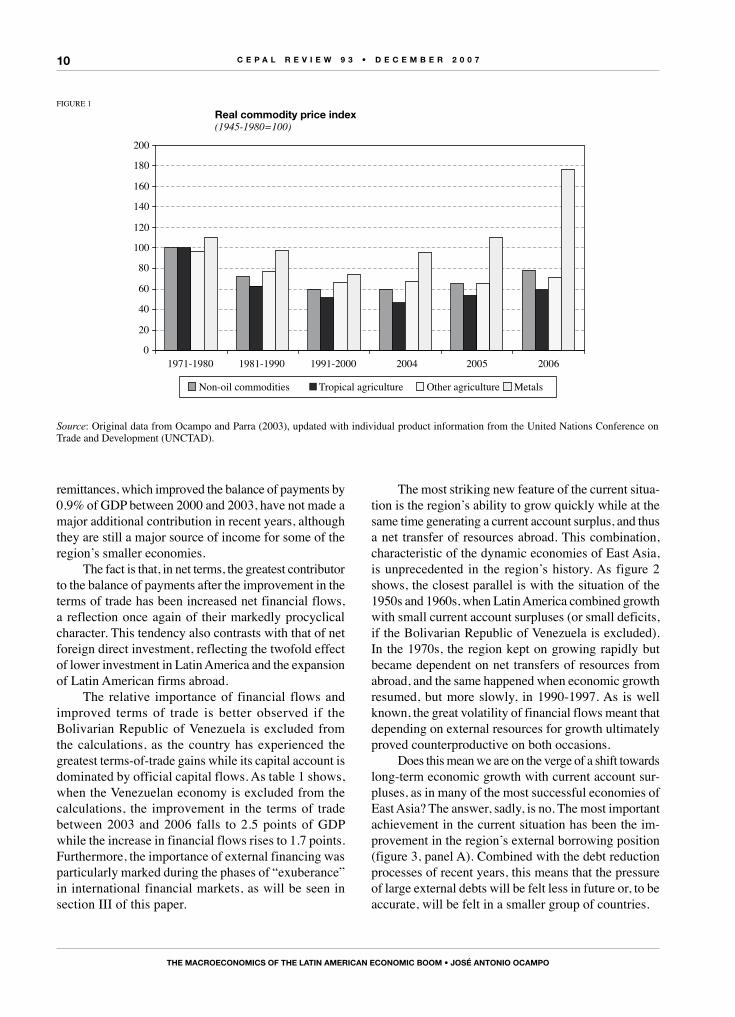
Figure 1 shows the long-term rise in commodity prices, taking the 1945-1980 period as the base. As it illustrates, this has been much less exceptional than is usually thought. Indeed, the drop in real prices for non-oil commodities in the 1980s and 1990s has yet to be reversed. In addition, the process has been very uneven, benefiting mining products more than agricultural ones. In real terms (deflated by a manufacturing price index), metal prices in 2006 stood 76% above the 1945-1980 average, an extraordinary level surpassed only in a few years in the early twentieth century. Conversely, prices for tropical and temperate zone agricultural products in 2006 were still 41% and 29%, respectively, below their 1945-1980 levels; some of these prices have risen in 2007, however, because of the biofuels boom. Price rises for oil and gas have come on top of those for mining products, although the oil price only very recently rose back to its 1970s level in real terms. Thus, the recent commodity price boom involves hydrocarbons and mining products more than agricultural commodities. It is still too soon to speak of long-term improvements in real prices reversing the downward trend in non-oil commodity prices seen over the twentieth century (Ocampo and Parra, 2003).
Among the factors helping Latin America’s current account balance over recent years, the dominant one has been the improvement in its terms of trade, amounting to the equivalent of 3.4% of gross domestic product (GDP) for the region as a whole between 2003 and 2006 (table 1). Some of these gains were automatically taken out in the form of profit remittances by foreign firms active in mining sectors. However, while this effect has been large in some countries, for the region as a whole the factor income balance trend has improved marginally as net production factor payments and the cost of foreign debt have fallen relative to GDP. Meanwhile, migrants’
C E P A L R E V I E W 9 3 • D E C E M B E R 2 0 0 7
ThE MACRoEConoMICs of ThE LATIn AMERICAn EConoMIC BooM • José AnTonIo oCAMPo
10
remittances, which improved the balance of payments by 0.9% of GDP between 2000 and 2003, have not made a major additional contribution in recent years, although they are still a major source of income for some of the region’s smaller economies.
The fact is that, in net terms, the greatest contributor to the balance of payments after the improvement in the terms of trade has been increased net financial flows, a reflection once again of their markedly procyclical character. This tendency also contrasts with that of net foreign direct investment, reflecting the twofold effect of lower investment in Latin America and the expansion of Latin American firms abroad.
The relative importance of financial flows and improved terms of trade is better observed if the Bolivarian Republic of Venezuela is excluded from the calculations, as the country has experienced the greatest terms-of-trade gains while its capital account is dominated by official capital flows. As table 1 shows, when the Venezuelan economy is excluded from the calculations, the improvement in the terms of trade between 2003 and 2006 falls to 2.5 points of GDP while the increase in financial flows rises to 1.7 points. Furthermore, the importance of external financing was particularly marked during the phases of “exuberance” in international financial markets, as will be seen in section III of this paper.
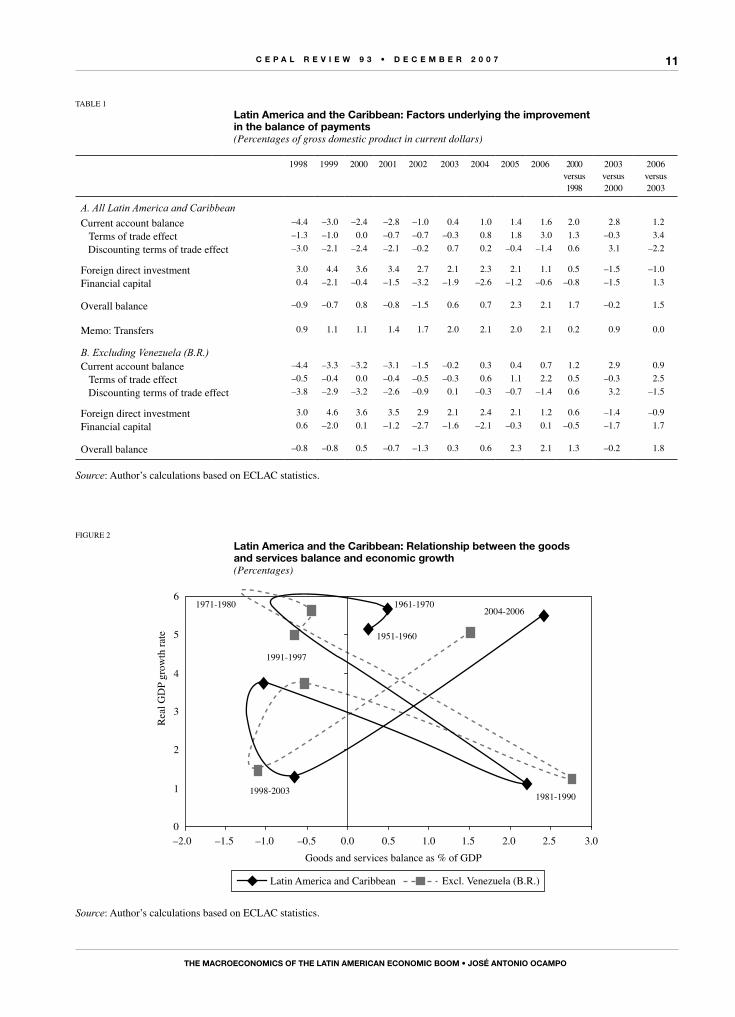
The most striking new feature of the current situa-tion is the region’s ability to grow quickly while at the same time generating a current account surplus, and thus a net transfer of resources abroad. This combination, characteristic of the dynamic economies of East Asia, is unprecedented in the region’s history. As figure 2 shows, the closest parallel is with the situation of the 1950s and 1960s, when Latin America combined growth with small current account surpluses (or small deficits, if the Bolivarian Republic of Venezuela is excluded). In the 1970s, the region kept on growing rapidly but became dependent on net transfers of resources from abroad, and the same happened when economic growth resumed, but more slowly, in 1990-1997. As is well known, the great volatility of financial flows meant that depending on external resources for growth ultimately proved counterproductive on both occasions.
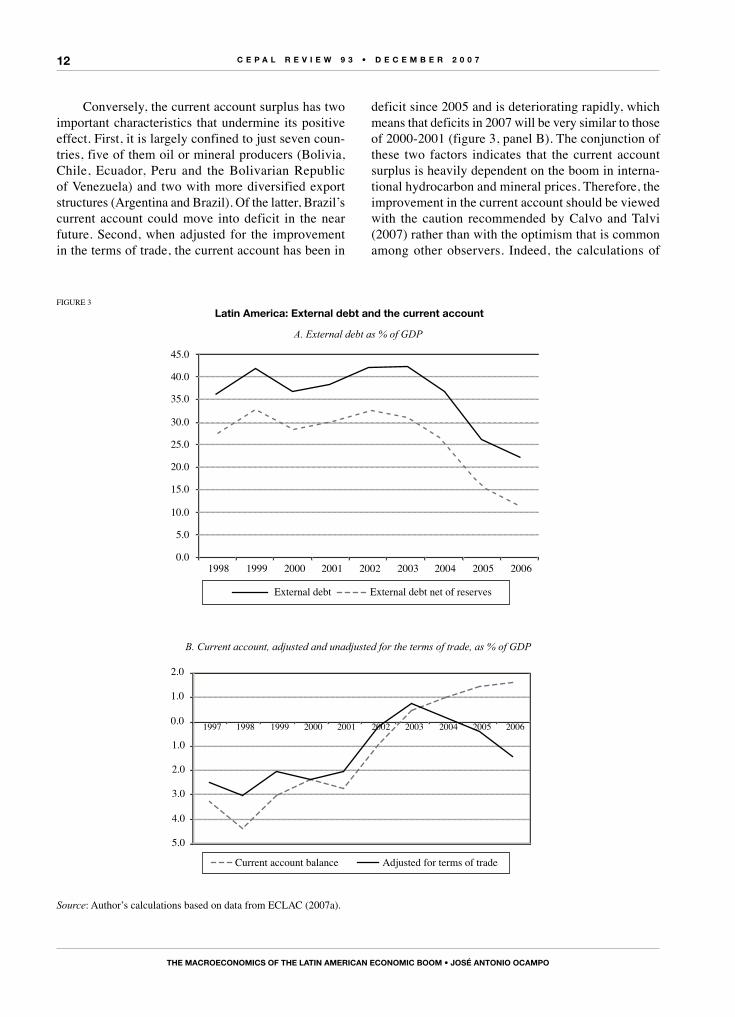
Does this mean we are on the verge of a shift towards long-term economic growth with current account sur-pluses, as in many of the most successful economies of East Asia? The answer, sadly, is no. The most important achievement in the current situation has been the im-provement in the region’s external borrowing position (figure 3, panel A). Combined with the debt reduction processes of recent years, this means that the pressure of large external debts will be felt less in future or, to be accurate, will be felt in a smaller group of countries.
FIGuRE 1
Real commodity price index(1945-1980=100)
0
20
40
60
80
100
120
140
160
180
200
1971-1980 1981-1990 1991-2000 2004 2005 2006
Non-oil commodities Tropical agriculture Other agriculture Metals
Source: Original data from Ocampo and Parra (2003), updated with individual product information from the united Nations Conference on Trade and Development (uNCTAD).
C E P A L R E V I E W 9 3 • D E C E M B E R 2 0 0 7
ThE MACRoEConoMICs of ThE LATIn AMERICAn EConoMIC BooM • José AnTonIo oCAMPo
11
TABLE 1
Latin America and the Caribbean: factors underlying the improvement in the balance of payments(Percentages of gross domestic product in current dollars)
1998 1999 2000 2001 2002 2003 2004 2005 2006 2000versus1998
2003versus2000
2006versus2003
A. All Latin America and Caribbean
Current account balance –4.4 –3.0 –2.4 –2.8 –1.0 0.4 1.0 1.4 1.6 2.0 2.8 1.2
Terms of trade effect –1.3 –1.0 0.0 –0.7 –0.7 –0.3 0.8 1.8 3.0 1.3 –0.3 3.4
Discounting terms of trade effect –3.0 –2.1 –2.4 –2.1 –0.2 0.7 0.2 –0.4 –1.4 0.6 3.1 –2.2
Foreign direct investment 3.0 4.4 3.6 3.4 2.7 2.1 2.3 2.1 1.1 0.5 –1.5 –1.0
Financial capital 0.4 –2.1 –0.4 –1.5 –3.2 –1.9 –2.6 –1.2 –0.6 –0.8 –1.5 1.3
Overall balance –0.9 –0.7 0.8 –0.8 –1.5 0.6 0.7 2.3 2.1 1.7 –0.2 1.5
Memo: Transfers 0.9 1.1 1.1 1.4 1.7 2.0 2.1 2.0 2.1 0.2 0.9 0.0
B. Excluding Venezuela (B.R.)Current account balance –4.4 –3.3 –3.2 –3.1 –1.5 –0.2 0.3 0.4 0.7 1.2 2.9 0.9
Terms of trade effect –0.5 –0.4 0.0 –0.4 –0.5 –0.3 0.6 1.1 2.2 0.5 –0.3 2.5
Discounting terms of trade effect –3.8 –2.9 –3.2 –2.6 –0.9 0.1 –0.3 –0.7 –1.4 0.6 3.2 –1.5
Foreign direct investment 3.0 4.6 3.6 3.5 2.9 2.1 2.4 2.1 1.2 0.6 –1.4 –0.9
Financial capital 0.6 –2.0 0.1 –1.2 –2.7 –1.6 –2.1 –0.3 0.1 –0.5 –1.7 1.7
Overall balance –0.8 –0.8 0.5 –0.7 –1.3 0.3 0.6 2.3 2.1 1.3 –0.2 1.8
Source: Author’s calculations based on ECLAC statistics.
FIGuRE 2
Latin America and the Caribbean: Relationship between the goods and services balance and economic growth(Percentages)
0
1
2
3
4
5
6
–2.0 –1.5 –1.0 –0.5 0.0 0.5 1.0 1.5 2.0 2.5 3.0Goods and services balance as % of GDP
Real
GD
P gr
owth
rate
0791-16910891-17912004-2006
1998-2003 1981-1990
1991-1997
1951-1960
Latin America and Caribbean Excl. Venezuela (B.R.)
Source: Author’s calculations based on ECLAC statistics.
C E P A L R E V I E W 9 3 • D E C E M B E R 2 0 0 7
ThE MACRoEConoMICs of ThE LATIn AMERICAn EConoMIC BooM • José AnTonIo oCAMPo
12
FIGuRE 3
Latin America: External debt and the current account
A. External debt as % of GDP
0.0
5.0
10.0
15.0
20.0
25.0
30.0
35.0
40.0
45.0
1998 1999 2000 2001 2002 2003 2004 2005 2006
External debt External debt net of reserves
B. Current account, adjusted and unadjusted for the terms of trade, as % of GDP
5.0
4.0
3.0
2.0
1.0
0.0
1.0
2.0
1997 1998 1999 2000 2001 2002 2003 2004 2005 2006
Current account balance Adjusted for terms of trade
Source: Author’s calculations based on data from ECLAC (2007a).
Conversely, the current account surplus has two important characteristics that undermine its positive effect. First, it is largely confined to just seven coun-tries, five of them oil or mineral producers (Bolivia, Chile, Ecuador, Peru and the Bolivarian Republic of Venezuela) and two with more diversified export structures (Argentina and Brazil). Of the latter, Brazil’s current account could move into deficit in the near future. Second, when adjusted for the improvement in the terms of trade, the current account has been in
deficit since 2005 and is deteriorating rapidly, which means that deficits in 2007 will be very similar to those of 2000-2001 (figure 3, panel B). The conjunction of these two factors indicates that the current account surplus is heavily dependent on the boom in interna-tional hydrocarbon and mineral prices. Therefore, the improvement in the current account should be viewed with the caution recommended by Calvo and Talvi (2007) rather than with the optimism that is common among other observers. Indeed, the calculations of
C E P A L R E V I E W 9 3 • D E C E M B E R 2 0 0 7
ThE MACRoEConoMICs of ThE LATIn AMERICAn EConoMIC BooM • José AnTonIo oCAMPo
13
those authors are much more unfavourable than those shown in figure 3, panel B.3
The above analysis indicates, then, that the situation of rapid growth with large current account surpluses is unlikely to continue in future and that the region’s balance of payments depends heavily on exceptional international prices for hydrocarbons and minerals. Although it is not impossible that this situation may persist if the Chinese economy continues its rapid expansion, the lesson from the
region’s economic history is that it is perilous to assume that high commodity prices will be permanent. Again, the severe turmoil in international financial markets in the third quarter of 2007 reminds us that this other source of the current boom – exceptional external financing conditions – may also weaken as time goes on. This is compounded, of course, by the uncertainty surrounding economic growth around the world, and especially in the United States, as a result of these events.
IIIThe effects of international
financial movement
Although commodity prices have recently played a decisive role in the macroeconomic dynamics of Latin America, the international financial markets have also had a major influence. The nature of financial flows has changed and so, consequently, have the transmission mechanisms. Indeed, every boom has its own specific features: in the 1970s, inflows derived essentially from lending by groups of banks (“syndicated loans”), but in the 1990s they came mainly from international bond issues.
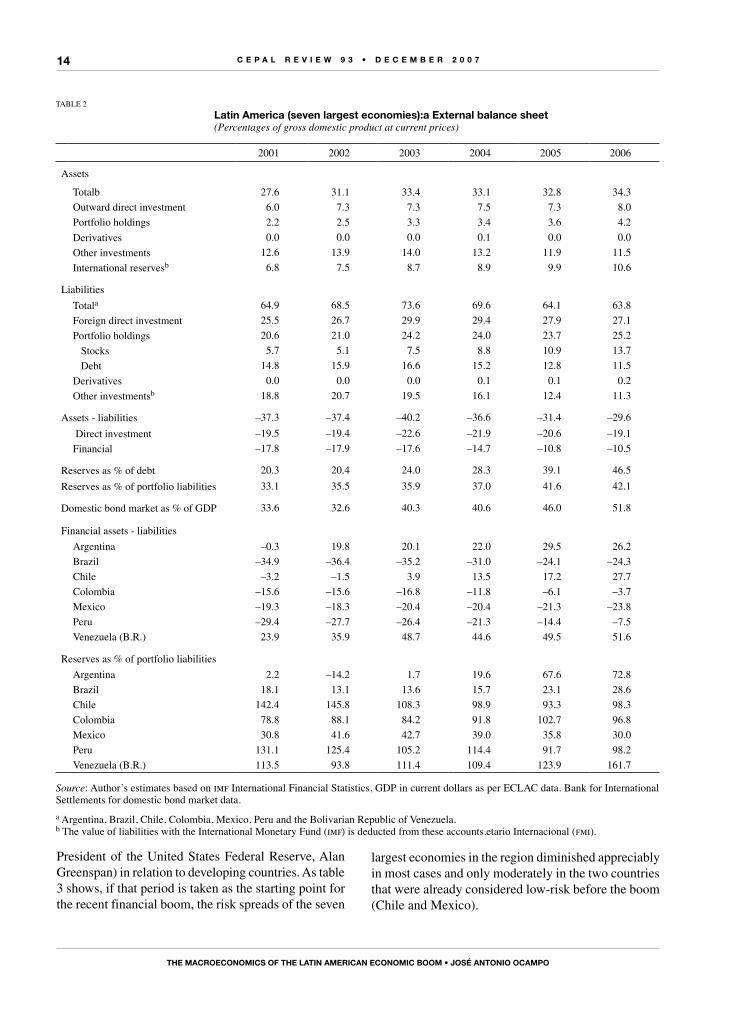
The nature of recent financial flows can be better appreciated from the external balance sheets shown in table 2. This table, which covers the seven largest Latin American economies, reveals two striking changes. The first is the increase in assets, particularly international reserves but also direct and portfolio investments abroad, which in all cases grew by even more than these seven economies’ GDP in current dollars (which itself rose by 65% between 2003 and 2006). The second is the large shift in the composition of liabilities, essentially driven by the reduction in borrowing and the rise of securities portfolio liabilities. The latter include investments in both the share and bond markets of the region’s countries by international investment funds. The counterpart to this shift in assets and liabilities, therefore, has been the boom in both domestic bond markets (table 2) and stock markets.
There are two further features of this balance sheet that are worth highlighting. First, net external liabilities have fallen sharply: by some 10 percentage points of GDP between 2003 and 2006, mostly in the net finan-cial position. This is true, furthermore, for six of the seven largest Latin American economies (the exception is Mexico). Three of them (Argentina, Chile and the Bolivarian Republic of Venezuela) now have a positive net financial position. Again, the reserves build-up looks extremely sound when compared with debt liabilities, but much less so if the comparison is with all portfolio liabilities. One way of looking at it, and this will become much clearer later, is that the build-up of reserves has been matched by a rise in portfolio liabilities. Indeed, reserves in the region’s two largest countries only cover a fairly small proportion of portfolio liabilities, while in three countries (especially Mexico, but also Chile and Peru, albeit from a much sounder position), reserves have increased by less than these liabilities.
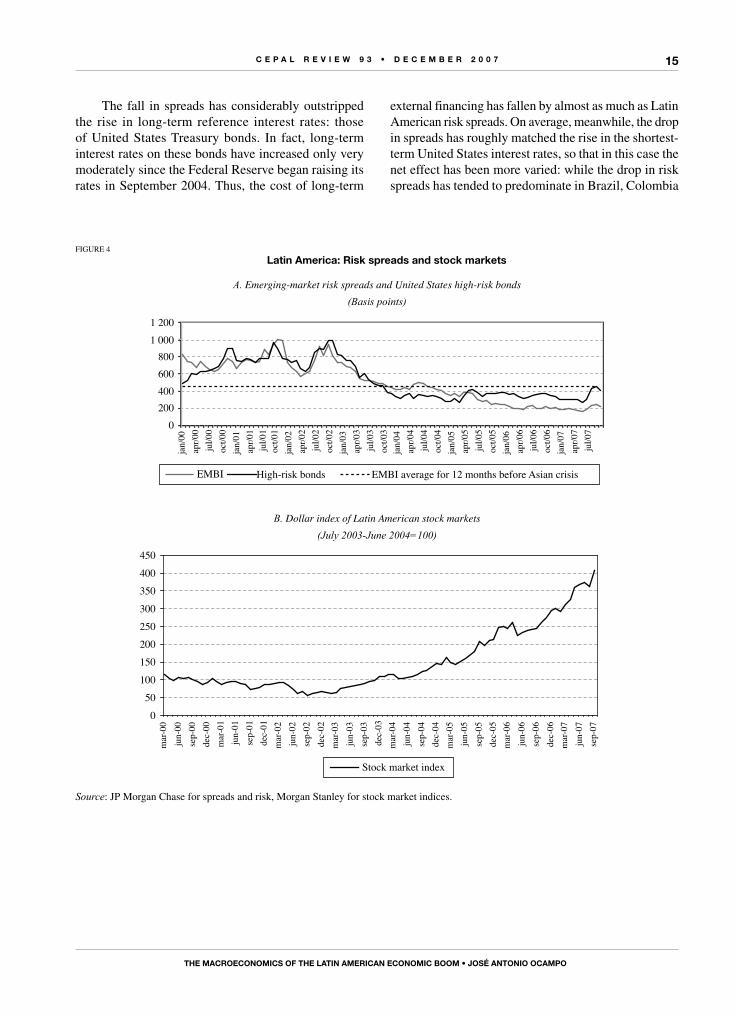
Figure 4, panel A, shows how exceptional the recent international financial situation has been. Emerging market risk spreads began to narrow dramatically in the last quarter of 2002; since the second half of 2004 they have been systematically lower than they were the year before the Asian crisis, and since mid-2005 they have been lower than those of high-risk bonds in the united States market. Latin America was something of a latecomer to this process, but has improved by more than the average since 2004. Thus, the second half of 2004 appears to mark the beginning of the “exuberance” in international financial markets (to use the term coined by the former 3 See also ECLAC (2006, pp. 20-21).
C E P A L R E V I E W 9 3 • D E C E M B E R 2 0 0 7
ThE MACRoEConoMICs of ThE LATIn AMERICAn EConoMIC BooM • José AnTonIo oCAMPo
14
TABLE 2
Latin America (seven largest economies):a External balance sheet(Percentages of gross domestic product at current prices)
2001 2002 2003 2004 2005 2006
Assets
Totalb 27.6 31.1 33.4 33.1 32.8 34.3
Outward direct investment 6.0 7.3 7.3 7.5 7.3 8.0
Portfolio holdings 2.2 2.5 3.3 3.4 3.6 4.2
Derivatives 0.0 0.0 0.0 0.1 0.0 0.0
Other investments 12.6 13.9 14.0 13.2 11.9 11.5
International reservesb 6.8 7.5 8.7 8.9 9.9 10.6
Liabilities
Totala 64.9 68.5 73.6 69.6 64.1 63.8
Foreign direct investment 25.5 26.7 29.9 29.4 27.9 27.1
Portfolio holdings 20.6 21.0 24.2 24.0 23.7 25.2
Stocks 5.7 5.1 7.5 8.8 10.9 13.7
Debt 14.8 15.9 16.6 15.2 12.8 11.5
Derivatives 0.0 0.0 0.0 0.1 0.1 0.2
Other investmentsb 18.8 20.7 19.5 16.1 12.4 11.3
Assets - liabilities –37.3 –37.4 –40.2 –36.6 –31.4 –29.6
Direct investment –19.5 –19.4 –22.6 –21.9 –20.6 –19.1
Financial –17.8 –17.9 –17.6 –14.7 –10.8 –10.5
Reserves as % of debt 20.3 20.4 24.0 28.3 39.1 46.5
Reserves as % of portfolio liabilities 33.1 35.5 35.9 37.0 41.6 42.1
Domestic bond market as % of GDP 33.6 32.6 40.3 40.6 46.0 51.8
Financial assets - liabilities
Argentina –0.3 19.8 20.1 22.0 29.5 26.2
Brazil –34.9 –36.4 –35.2 –31.0 –24.1 –24.3
Chile –3.2 –1.5 3.9 13.5 17.2 27.7
Colombia –15.6 –15.6 –16.8 –11.8 –6.1 –3.7
Mexico –19.3 –18.3 –20.4 –20.4 –21.3 –23.8
Peru –29.4 –27.7 –26.4 –21.3 –14.4 –7.5
Venezuela (B.R.) 23.9 35.9 48.7 44.6 49.5 51.6
Reserves as % of portfolio liabilities
Argentina 2.2 –14.2 1.7 19.6 67.6 72.8
Brazil 18.1 13.1 13.6 15.7 23.1 28.6
Chile 142.4 145.8 108.3 98.9 93.3 98.3
Colombia 78.8 88.1 84.2 91.8 102.7 96.8
Mexico 30.8 41.6 42.7 39.0 35.8 30.0
Peru 131.1 125.4 105.2 114.4 91.7 98.2
Venezuela (B.R.) 113.5 93.8 111.4 109.4 123.9 161.7
Source: Author’s estimates based on imf International Financial Statistics, GDP in current dollars as per ECLAC data. Bank for International Settlements for domestic bond market data.a Argentina, Brazil, Chile, Colombia, Mexico, Peru and the Bolivarian Republic of Venezuela.b The value of liabilities with the International Monetary Fund (imf) is deducted from these accounts.etario Internacional (fmi).
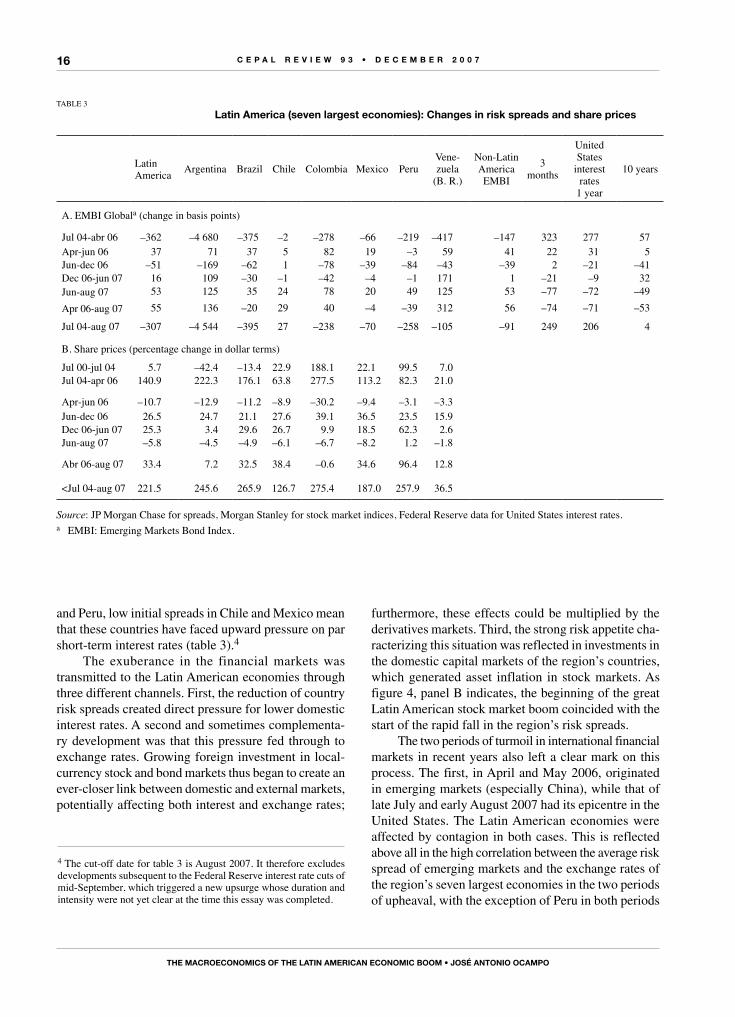
President of the united States Federal Reserve, Alan Greenspan) in relation to developing countries. As table 3 shows, if that period is taken as the starting point for the recent financial boom, the risk spreads of the seven
largest economies in the region diminished appreciably in most cases and only moderately in the two countries that were already considered low-risk before the boom (Chile and Mexico).
C E P A L R E V I E W 9 3 • D E C E M B E R 2 0 0 7
ThE MACRoEConoMICs of ThE LATIn AMERICAn EConoMIC BooM • José AnTonIo oCAMPo
15
The fall in spreads has considerably outstripped the rise in long-term reference interest rates: those of united States Treasury bonds. In fact, long-term interest rates on these bonds have increased only very moderately since the Federal Reserve began raising its rates in September 2004. Thus, the cost of long-term
external financing has fallen by almost as much as Latin American risk spreads. On average, meanwhile, the drop in spreads has roughly matched the rise in the shortest-term united States interest rates, so that in this case the net effect has been more varied: while the drop in risk spreads has tended to predominate in Brazil, Colombia
FIGuRE 4
Latin America: Risk spreads and stock markets
A. Emerging-market risk spreads and United States high-risk bonds(Basis points)
0200400600800
1 0001 200
jan/
00ap
r/00
jul/0
0oc
t/00
jan/
01ap
r/01
jul/0
1oc
t/01
jan/
02ap
r/02
jul/0
2oc
t/02
jan/
03ap
r/03
jul/0
3oc
t/03
jan/
04ap
r/04
jul/0
4oc
t/04
jan/
05ap
r/05
jul/0
5oc
t/05
jan/
06ap
r/06
jul/0
6oc
t/06
jan/
07ap
r/07
jul/0
7
EMBI High-risk bonds EMBI average for 12 months before Asian crisis
B. Dollar index of Latin American stock markets(July 2003-June 2004=100)
050
100150200250300350400450
mar
-00
jun-
00se
p-00
dec-
00m
ar-0
1ju
n-01
sep-
01de
c-01
mar
-02
jun-
02se
p-02
dec-
02m
ar-0
3ju
n-03
sep-
03de
c-03
mar
-04
jun-
04se
p-04
dec-
04m
ar-0
5ju
n-05
sep-
05de
c-05
mar
-06
jun-
06se
p-06
dec-
06m
ar-0
7ju
n-07
sep-
07
Stock market index
Source: JP Morgan Chase for spreads and risk, Morgan Stanley for stock market indices.
C E P A L R E V I E W 9 3 • D E C E M B E R 2 0 0 7
ThE MACRoEConoMICs of ThE LATIn AMERICAn EConoMIC BooM • José AnTonIo oCAMPo
16
and Peru, low initial spreads in Chile and Mexico mean that these countries have faced upward pressure on par short-term interest rates (table 3).4
The exuberance in the financial markets was transmitted to the Latin American economies through three different channels. First, the reduction of country risk spreads created direct pressure for lower domestic interest rates. A second and sometimes complementa-ry development was that this pressure fed through to exchange rates. Growing foreign investment in local-currency stock and bond markets thus began to create an ever-closer link between domestic and external markets, potentially affecting both interest and exchange rates;
furthermore, these effects could be multiplied by the derivatives markets. Third, the strong risk appetite cha-racterizing this situation was reflected in investments in the domestic capital markets of the region’s countries, which generated asset inflation in stock markets. As figure 4, panel B indicates, the beginning of the great Latin American stock market boom coincided with the start of the rapid fall in the region’s risk spreads.
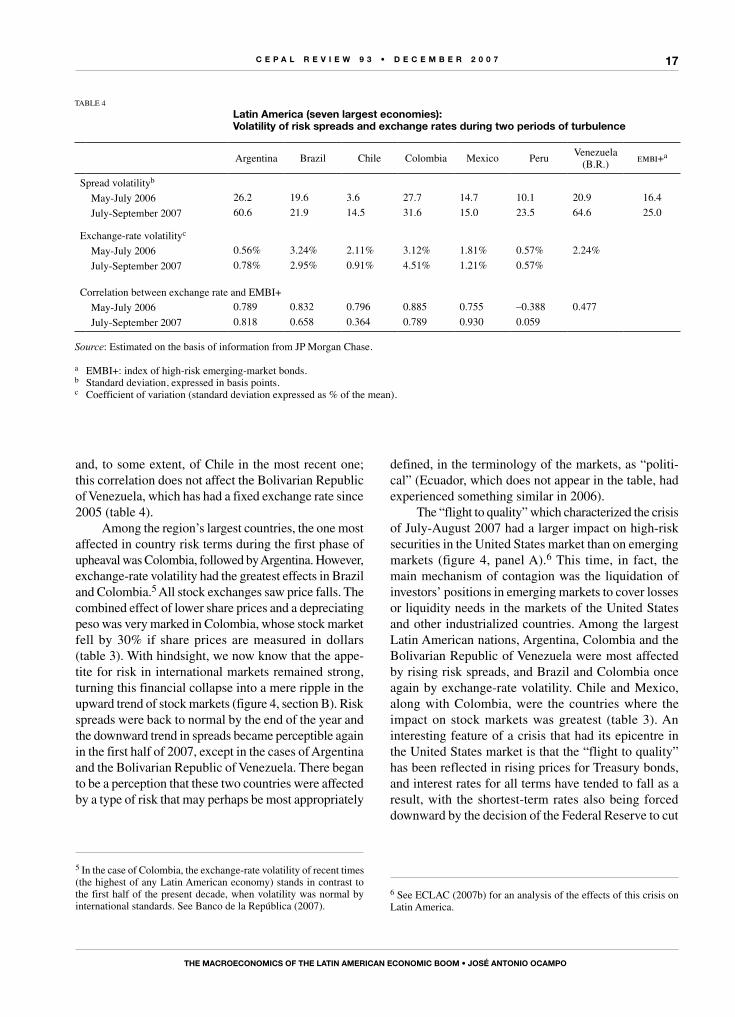
The two periods of turmoil in international financial markets in recent years also left a clear mark on this process. The first, in April and May 2006, originated in emerging markets (especially China), while that of late July and early August 2007 had its epicentre in the united States. The Latin American economies were affected by contagion in both cases. This is reflected above all in the high correlation between the average risk spread of emerging markets and the exchange rates of the region’s seven largest economies in the two periods of upheaval, with the exception of Peru in both periods
TABLE 3
Latin America (seven largest economies): Changes in risk spreads and share prices
Latin America Argentina Brazil Chile Colombia Mexico Peru
Vene-zuela
(B. R.)
Non-Latin America EMBI
3 months
united States
interest rates
1 year
10 years
A. EMBI Globala (change in basis points)
Jul 04-abr 06 –362 –4 680 –375 –2 –278 –66 –219 –417 –147 323 277 57Apr-jun 06 37 71 37 5 82 19 –3 59 41 22 31 5Jun-dec 06 –51 –169 –62 1 –78 –39 –84 –43 –39 2 –21 –41Dec 06-jun 07 16 109 –30 –1 –42 –4 –1 171 1 –21 –9 32Jun-aug 07 53 125 35 24 78 20 49 125 53 –77 –72 –49
Apr 06-aug 07 55 136 –20 29 40 –4 –39 312 56 –74 –71 –53
Jul 04-aug 07 –307 –4 544 –395 27 –238 –70 –258 –105 –91 249 206 4
B. Share prices (percentage change in dollar terms)
Jul 00-jul 04 5.7 –42.4 –13.4 22.9 188.1 22.1 99.5 7.0 Jul 04-apr 06 140.9 222.3 176.1 63.8 277.5 113.2 82.3 21.0
Apr-jun 06 –10.7 –12.9 –11.2 –8.9 –30.2 –9.4 –3.1 –3.3 Jun-dec 06 26.5 24.7 21.1 27.6 39.1 36.5 23.5 15.9 Dec 06-jun 07 25.3 3.4 29.6 26.7 9.9 18.5 62.3 2.6 Jun-aug 07 –5.8 –4.5 –4.9 –6.1 –6.7 –8.2 1.2 –1.8
Abr 06-aug 07 33.4 7.2 32.5 38.4 –0.6 34.6 96.4 12.8
<Jul 04-aug 07 221.5 245.6 265.9 126.7 275.4 187.0 257.9 36.5
Source: JP Morgan Chase for spreads, Morgan Stanley for stock market indices, Federal Reserve data for United States interest rates.a EMBI: Emerging Markets Bond Index.
4 The cut-off date for table 3 is August 2007. It therefore excludes developments subsequent to the Federal Reserve interest rate cuts of mid-September, which triggered a new upsurge whose duration and intensity were not yet clear at the time this essay was completed.
C E P A L R E V I E W 9 3 • D E C E M B E R 2 0 0 7
ThE MACRoEConoMICs of ThE LATIn AMERICAn EConoMIC BooM • José AnTonIo oCAMPo
17
and, to some extent, of Chile in the most recent one; this correlation does not affect the Bolivarian Republic of Venezuela, which has had a fixed exchange rate since 2005 (table 4).
Among the region’s largest countries, the one most affected in country risk terms during the first phase of upheaval was Colombia, followed by Argentina. However, exchange-rate volatility had the greatest effects in Brazil and Colombia.5 All stock exchanges saw price falls. The combined effect of lower share prices and a depreciating peso was very marked in Colombia, whose stock market fell by 30% if share prices are measured in dollars (table 3). With hindsight, we now know that the appe-tite for risk in international markets remained strong, turning this financial collapse into a mere ripple in the upward trend of stock markets (figure 4, section B). Risk spreads were back to normal by the end of the year and the downward trend in spreads became perceptible again in the first half of 2007, except in the cases of Argentina and the Bolivarian Republic of Venezuela. There began to be a perception that these two countries were affected by a type of risk that may perhaps be most appropriately
5 In the case of Colombia, the exchange-rate volatility of recent times (the highest of any Latin American economy) stands in contrast to the first half of the present decade, when volatility was normal by international standards. See Banco de la República (2007).
defined, in the terminology of the markets, as “politi-cal” (Ecuador, which does not appear in the table, had experienced something similar in 2006).
The “flight to quality” which characterized the crisis of July-August 2007 had a larger impact on high-risk securities in the united States market than on emerging markets (figure 4, panel A).6 This time, in fact, the main mechanism of contagion was the liquidation of investors’ positions in emerging markets to cover losses or liquidity needs in the markets of the united States and other industrialized countries. Among the largest Latin American nations, Argentina, Colombia and the Bolivarian Republic of Venezuela were most affected by rising risk spreads, and Brazil and Colombia once again by exchange-rate volatility. Chile and Mexico, along with Colombia, were the countries where the impact on stock markets was greatest (table 3). An interesting feature of a crisis that had its epicentre in the united States market is that the “flight to quality” has been reflected in rising prices for Treasury bonds, and interest rates for all terms have tended to fall as a result, with the shortest-term rates also being forced downward by the decision of the Federal Reserve to cut
6 See ECLAC (2007b) for an analysis of the effects of this crisis on Latin America.
TABLE 4
Latin America (seven largest economies): Volatility of risk spreads and exchange rates during two periods of turbulence
Argentina Brazil Chile Colombia Mexico PeruVenezuela
(B.R.)embi+a
Spread volatilityb
May-July 2006 26.2 19.6 3.6 27.7 14.7 10.1 20.9 16.4
July-September 2007 60.6 21.9 14.5 31.6 15.0 23.5 64.6 25.0
Exchange-rate volatilityc
May-July 2006 0.56% 3.24% 2.11% 3.12% 1.81% 0.57% 2.24%
July-September 2007 0.78% 2.95% 0.91% 4.51% 1.21% 0.57%
Correlation between exchange rate and EMBI+May-July 2006 0.789 0.832 0.796 0.885 0.755 –0.388 0.477
July-September 2007 0.818 0.658 0.364 0.789 0.930 0.059
Source: Estimated on the basis of information from JP Morgan Chase.
a EMBI+: index of high-risk emerging-market bonds.b Standard deviation, expressed in basis points.c Coefficient of variation (standard deviation expressed as % of the mean).
C E P A L R E V I E W 9 3 • D E C E M B E R 2 0 0 7
ThE MACRoEConoMICs of ThE LATIn AMERICAn EConoMIC BooM • José AnTonIo oCAMPo
18
the discount rate on 17 August and the federal funds rate on 18 September. Indeed, these cuts in reference rates were greater than the rise in the risk spreads of several Latin American countries, so that their par interest rates actually fell slightly during the crisis.
Although the debate about the implications of the recent financial market shock on economic growth in the united States and the world continues, the crisis had what may be a lasting effect on the behaviour of financial agents. Some developments in the united States over the last few months are very familiar to Latin American countries and the developing world from their own crises. Some examples are: the widening contagion of a problem that arose in one segment which everyone believed to suffer from problems specific to that segment rather than being more widely spread, the illiquidity of high-risk securities and debts, the lack of information about portfolio quality, and the “flight to quality” by all agents, including the main financial intermediaries. In any event, the market euphoria that followed the 18 September cut in the discount and federal funds rates was also reflected by the surge in Latin American stock markets, making the stock market turmoil of July and August look even more insignificant than that of the second quarter of 2006 (figure 4, panel B). The appreciating tendency of Latin American currencies had begun before 18 September and temporarily accelerated after that date.
One controversial issue has been the effect of fluc-tuations in international financial markets on the exchange rates of the Latin American countries. Machinea and Kacef (2007) prepared an analysis according to which changes in the real exchange rates of the Latin American countries (calculated as the ratio between real exchange rates in 2005 and the average for the 1990s) reflect the pressures from improvements in the terms of trade and the rise in remittances from Latin American workers abroad, rather than phenomena associated with the capital account. However, this analysis, valid if the 1990s are taken as the point of comparison, does not explain the dynamics of exchange rates during the recent boom or the strong upward pressure in real terms on the currencies of Brazil and Colombia, the two countries in Latin America where this tendency has been most striking in the last three years and where exchange-rate volatility has been greatest during periods of turmoil in the international financial markets.
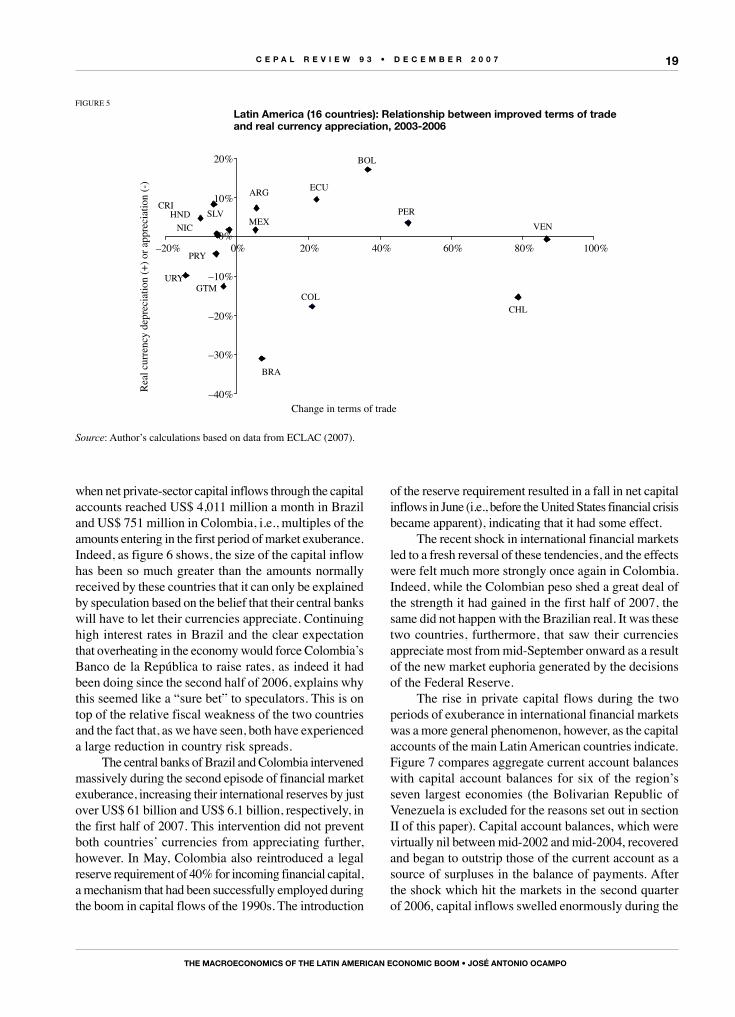
As figure 5 shows, there is no systematic relationship between improving terms of trade and movements in real exchange rates since 2004, a period that coincides with the commodity price boom. The chart bears this out. Among the larger countries, the great improvement in the terms of trade may have been responsible for the
real appreciation of the Chilean peso at an early stage, or of the Venezuelan bolívar more recently (although this currency does not show any real appreciation during the 2003-2006 period as a whole). But improved terms of trade certainly do not account for the large apprecia-tion that the Brazilian and Colombian currencies have experienced in real terms.
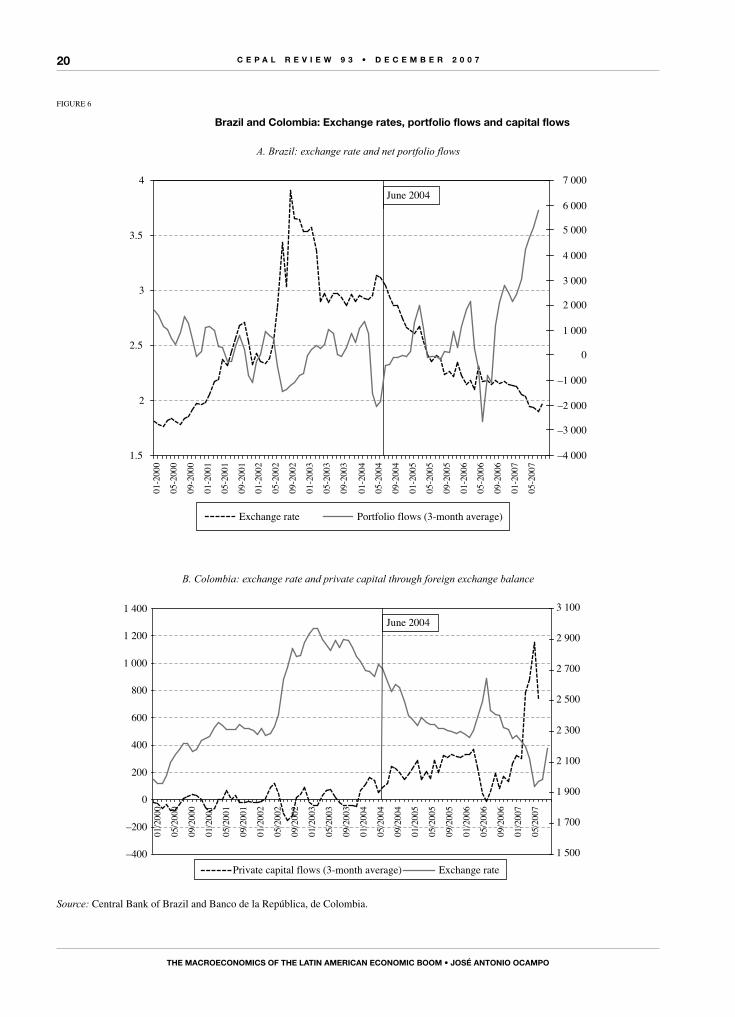
As figure 6 confirms, the dynamics of exchange rates in these last two countries is unequivocally associated with fluctuations in private-sector financial flows. Both countries had experienced a large devaluation in the third quarter of 2002, coinciding with rising emerging-market risk spreads (figure 4, panel A). In the case of Brazil this was also associated with market speculation during that year’s presidential elections. The exchange rate in Brazil strengthened and stabilized in the first half of 2003 while in Colombia it appreciated more gradually, but by mid-2004 neither of the two countries had returned to the levels of the first half of 2002.
Strong currency appreciation in Brazil and Colombia over recent years has exactly coincided with the two phases of exuberance in international financial markets, the first of which can be situated, on the basis of the pre-ceding analysis, between mid-2004 and April 2006, and the second between mid-2006 and mid-2007. Currency appreciation in both countries during these periods was clearly associated with capital flows, as is shown by the behaviour of net portfolio flows in the case of Brazil and net private-sector capital inflows in Colombia’s foreign exchange balance (i.e., flows involving movements of liquid resources). In the case of Brazil, net portfolio flows had averaged US$ 44 million a month in the four years prior to the first of these booms (i.e., between July 2000 and June 2004), rising to US$ 309 million a month between July 2004 and April 2006. In the case of Colombia, net inflows in the private-sector foreign exchange balance averaged US$ 232 million a month during this first phase of exuberance, having been slightly negative between July 2000 and June 2004. In both cases, the combination of larger inflows of short-term capital and lower risk spreads resulted in a large appreciation of the local currency. The central banks of both countries began intervening in the currency markets during this period but, as we shall see later, only to a modest extent.
The episode of April-May 2006 led to an outflow of capital from Colombia that had a considerable impact on net capital flows, exchange rates and, as we have seen, the stock market. The outflow of short-term capital was also large in Brazil, but the effects were smaller. Capital began to flow in again in the second half of 2006, and the flow became an avalanche in the first half of 2007,
C E P A L R E V I E W 9 3 • D E C E M B E R 2 0 0 7
ThE MACRoEConoMICs of ThE LATIn AMERICAn EConoMIC BooM • José AnTonIo oCAMPo
19
FIGuRE 5
Latin America (16 countries): Relationship between improved terms of trade and real currency appreciation, 2003-2006
–40%
–30%
–20%
–10%
0%
10%
20%
–20% 0% 20% 40% 60% 80% 100%
Change in terms of trade
Real
cur
renc
y de
prec
iatio
n (+
) or a
ppre
ciat
ion
(-)
CHL
BRA
COL
VENPER
MEX
ARG
BOL
ECU
GTM
CRISLVHND
NIC
PRY
URY
Source: Author’s calculations based on data from ECLAC (2007).
when net private-sector capital inflows through the capital accounts reached US$ 4,011 million a month in Brazil and US$ 751 million in Colombia, i.e., multiples of the amounts entering in the first period of market exuberance. Indeed, as figure 6 shows, the size of the capital inflow has been so much greater than the amounts normally received by these countries that it can only be explained by speculation based on the belief that their central banks will have to let their currencies appreciate. Continuing high interest rates in Brazil and the clear expectation that overheating in the economy would force Colombia’s Banco de la República to raise rates, as indeed it had been doing since the second half of 2006, explains why this seemed like a “sure bet” to speculators. This is on top of the relative fiscal weakness of the two countries and the fact that, as we have seen, both have experienced a large reduction in country risk spreads.
The central banks of Brazil and Colombia intervened massively during the second episode of financial market exuberance, increasing their international reserves by just over US$ 61 billion and US$ 6.1 billion, respectively, in the first half of 2007. This intervention did not prevent both countries’ currencies from appreciating further, however. In May, Colombia also reintroduced a legal reserve requirement of 40% for incoming financial capital, a mechanism that had been successfully employed during the boom in capital flows of the 1990s. The introduction
of the reserve requirement resulted in a fall in net capital inflows in June (i.e., before the United States financial crisis became apparent), indicating that it had some effect.
The recent shock in international financial markets led to a fresh reversal of these tendencies, and the effects were felt much more strongly once again in Colombia. Indeed, while the Colombian peso shed a great deal of the strength it had gained in the first half of 2007, the same did not happen with the Brazilian real. It was these two countries, furthermore, that saw their currencies appreciate most from mid-September onward as a result of the new market euphoria generated by the decisions of the Federal Reserve.
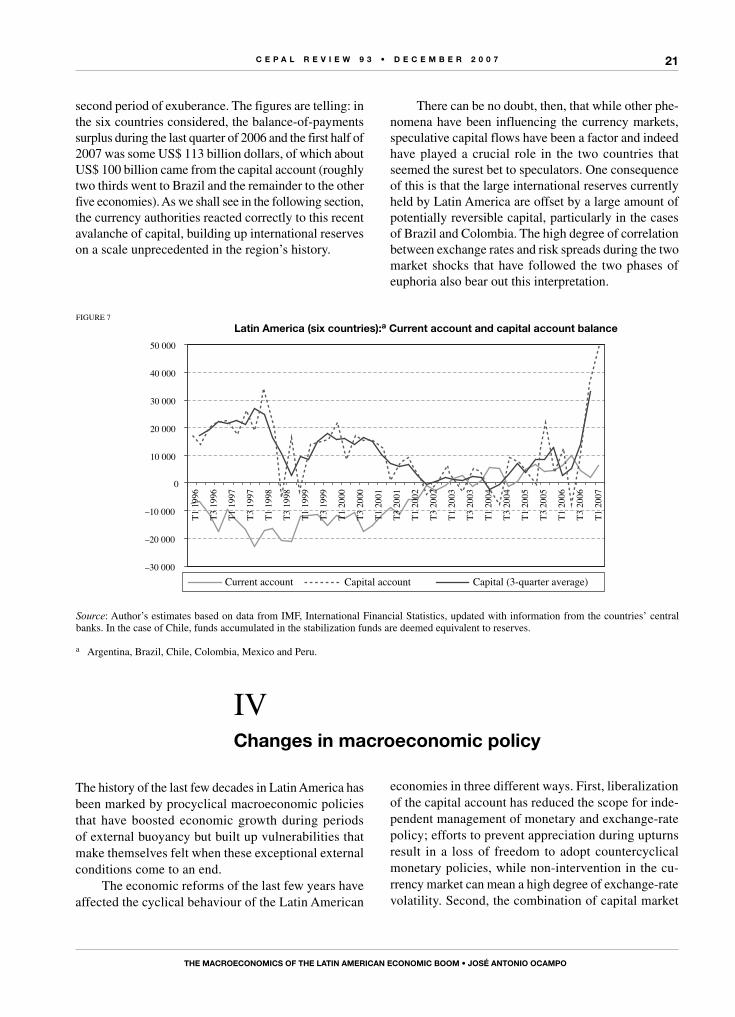
The rise in private capital flows during the two periods of exuberance in international financial markets was a more general phenomenon, however, as the capital accounts of the main Latin American countries indicate. Figure 7 compares aggregate current account balances with capital account balances for six of the region’s seven largest economies (the Bolivarian Republic of Venezuela is excluded for the reasons set out in section II of this paper). Capital account balances, which were virtually nil between mid-2002 and mid-2004, recovered and began to outstrip those of the current account as a source of surpluses in the balance of payments. After the shock which hit the markets in the second quarter of 2006, capital inflows swelled enormously during the
C E P A L R E V I E W 9 3 • D E C E M B E R 2 0 0 7
ThE MACRoEConoMICs of ThE LATIn AMERICAn EConoMIC BooM • José AnTonIo oCAMPo
20
FIGuRE 6
Brazil and Colombia: Exchange rates, portfolio flows and capital flows
A. Brazil: exchange rate and net portfolio flows
1.5
2
2.5
3
3.5
4
01-2
000
05-2
000
09-2
000
01-2
001
05-2
001
09-2
001
01-2
002
05-2
002
09-2
002
01-2
003
05-2
003
09-2
003
01-2
004
05-2
004
09-2
004
01-2
005
05-2
005
09-2
005
01-2
006
05-2
006
09-2
006
01-2
007
05-2
007
–4 000
–3 000
–2 000
–1 000
0
1 000
2 000
3 000
4 000
5 000
6 000
7 000June 2004
Exchange rate Portfolio flows (3-month average)
B. Colombia: exchange rate and private capital through foreign exchange balance
–400
–200
0
200
400
600
800
1 000
1 200
1 400
01/2
000
05/2
000
09/2
000
01/2
001
05/2
001
09/2
001
01/2
002
05/2
002
09/2
002
01/2
003
05/2
003
09/2
003
01/2
004
05/2
004
09/2
004
01/2
005
05/2
005
09/2
005
01/2
006
05/2
006
09/2
006
01/2
007
05/2
007
1 500
1 700
1 900
2 100
2 300
2 500
2 700
2 900
3 100
Private capital flows (3-month average) Exchange rate
June 2004
Source: Central Bank of Brazil and Banco de la República, de Colombia.
C E P A L R E V I E W 9 3 • D E C E M B E R 2 0 0 7
ThE MACRoEConoMICs of ThE LATIn AMERICAn EConoMIC BooM • José AnTonIo oCAMPo
21
second period of exuberance. The figures are telling: in the six countries considered, the balance-of-payments surplus during the last quarter of 2006 and the first half of 2007 was some uS$ 113 billion dollars, of which about uS$ 100 billion came from the capital account (roughly two thirds went to Brazil and the remainder to the other five economies). As we shall see in the following section, the currency authorities reacted correctly to this recent avalanche of capital, building up international reserves on a scale unprecedented in the region’s history.
There can be no doubt, then, that while other phe-nomena have been influencing the currency markets, speculative capital flows have been a factor and indeed have played a crucial role in the two countries that seemed the surest bet to speculators. One consequence of this is that the large international reserves currently held by Latin America are offset by a large amount of potentially reversible capital, particularly in the cases of Brazil and Colombia. The high degree of correlation between exchange rates and risk spreads during the two market shocks that have followed the two phases of euphoria also bear out this interpretation.
FIGuRE 7
Latin America (six countries):a Current account and capital account balance
–30 000
–20 000
–10 000
0
10 000
20 000
30 000
40 000
50 000
T1 1
996
T3 1
996
T1 1
997
T3 1
997
T1 1
998
T3 1
998
T1 1
999
T3 1
999
T1 2
000
T3 2
000
T1 2
001
T3 2
001
T1 2
002
T3 2
002
T1 2
003
T3 2
003
T1 2
004
T3 2
004
T1 2
005
T3 2
005
T1 2
006
T3 2
006
T1 2
007
Current account Capital (3-quarter average)Capital account
Source: Author’s estimates based on data from IMF, International Financial Statistics, updated with information from the countries’ central banks. In the case of Chile, funds accumulated in the stabilization funds are deemed equivalent to reserves.
a Argentina, Brazil, Chile, Colombia, Mexico and Peru.
economies in three different ways. First, liberalization of the capital account has reduced the scope for inde-pendent management of monetary and exchange-rate policy; efforts to prevent appreciation during upturns result in a loss of freedom to adopt countercyclical monetary policies, while non-intervention in the cu-rrency market can mean a high degree of exchange-rate volatility. Second, the combination of capital market
IVChanges in macroeconomic policy
The history of the last few decades in Latin America has been marked by procyclical macroeconomic policies that have boosted economic growth during periods of external buoyancy but built up vulnerabilities that make themselves felt when these exceptional external conditions come to an end.
The economic reforms of the last few years have affected the cyclical behaviour of the Latin American
C E P A L R E V I E W 9 3 • D E C E M B E R 2 0 0 7
ThE MACRoEConoMICs of ThE LATIn AMERICAn EConoMIC BooM • José AnTonIo oCAMPo
22
liberalization and domestic financial liberalization has reinforced the operation of the financial accelerator, which tends to increase lending, asset inflation and private expenditure during upturns only for the opposite to occur in downturns. Third, the increased income-elasticity of short-term import demand has made the current account more sensitive to the business cycle: the conjunction of higher demand growth and real currency appreciation results in a rapid deterioration of the current account during upturns, but this is also corrected more quickly during crises. Of these three mechanisms, only the last could be considered to have some countercyclical effects, insofar as the domestic effects of the procyclical behaviour of private spending are thereby smoothed. But the price for this is that it also contributes to these economies’ external vulne-rability during upturns.
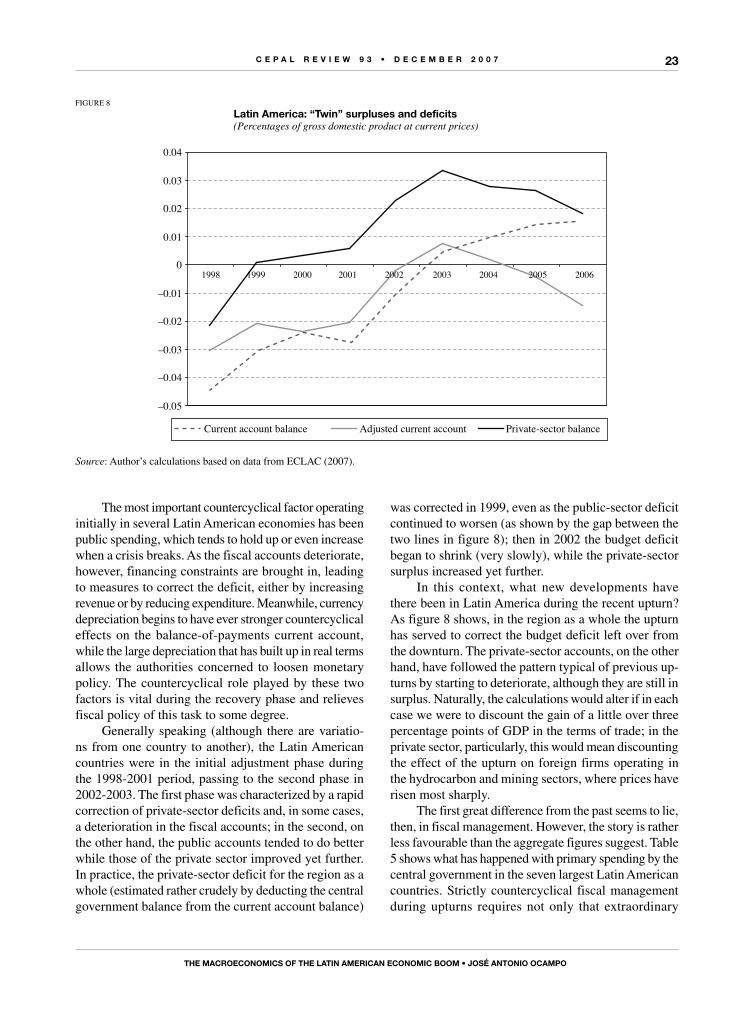
An interesting corollary of the cyclical behaviour of economies subject to procyclical inflows of external financing is that the “twin deficit” of current account variations is the private-sector balance, not the public-sector one. This can be clearly seen in figure 8: the large current account adjustment experienced by the Latin American economy between 1998 and 2003 resulted from an improvement in the private-sector balance; the deterioration in the current account over the last three years, when adjusted for the terms of trade, is the result of a deterioration in that same balance. This also seems to be a general characteristic of “successful” countries during upturns, as Marfán (2005) points out.
In this context, and in very open economies ge-nerally, it can be said that the only really autonomous policy instrument available to the economic authorities is fiscal policy. According to economic theory, this is also the most powerful instrument for affecting eco-nomic activity in economies whose capital markets have been liberalized. However, fiscal policy has also been subject to procyclical behaviour, for two diffe-rent reasons. The first is the direct effect generated by the availability of resources, whether tax revenues or financing: the abundance of resources during upturns tends to increase public spending, while lower revenues, combined with the higher cost of debt servicing, lead to cuts in primary spending during crises. The second concerns political pressures on economic policyma-king: after a period of public spending cutbacks, it is hard to convince the population of the virtues of a continuing programme of austerity. This is even truer if the justification for the austerity programme during
the upturn is the need to offset the exuberance of private spending (Marfán, 2005).
Analysis of the most recent Latin American cycle confirms the procyclical behaviour of private and public expenditure and of the monetary and credit variables, with some interesting variants. In economies with net foreign-currency liabilities, the tendency towards currency appreciation during upturns generates positive wealth effects which help to boost private demand.7 As already noted, the most important countercyclical element is the large rise in imports resulting from high income-elasticity and real currency appreciation, which shift a large portion of demand abroad. Thus, the effects of real appreciation on the current account are countercyclical, unlike wealth effects. The behaviour of imports does, however, pro-duce a rapid deterioration in the balance-of-payments current account, helping to create the conditions for the next downturn. The main “twin deficit” of the current account is the private deficit, as we have seen, but in the Latin American countries it has been common for public-sector deficits to increase at the same time.
Once the downturn has started, the most important development is the collapse of private spending, although the effects of this on aggregate demand are smoothed by the even faster decline in imports. During this phase, currency depreciation once again has a procyclical wealth effect (the loss of wealth associated with net liabilities denominated in foreign currencies) that contributes to the contraction of demand. It also sets up a countercyclical effect that operates through the balance-of-payments current account but takes time to make itself felt fully in the economy, partly because of the financial shocks that characterize the initial phase of the downturn. Monetary and credit policy also has procyclical effects to begin with, either because the authorities try to smooth the inflationary effects of depreciation by measures such as higher interest rates or credit restraint, or both, or simply because private-sector credit collapses while higher country risk spreads place pressure on domestic interest rates.
7 Note that when net financial balances turn positive, as they have now done in three of the region’s seven largest economies, this wealth effect becomes countercyclical in relation to the economy as a whole. To ascertain whether the argument remains valid, however, it would be necessary to calculate the net financial balance of the private sector. In most cases, it is the public sector that has built up a positive net financial balance (this is even true of Brazil, whose net financial balance is still negative).
C E P A L R E V I E W 9 3 • D E C E M B E R 2 0 0 7
ThE MACRoEConoMICs of ThE LATIn AMERICAn EConoMIC BooM • José AnTonIo oCAMPo
23
The most important countercyclical factor operating initially in several Latin American economies has been public spending, which tends to hold up or even increase when a crisis breaks. As the fiscal accounts deteriorate, however, financing constraints are brought in, leading to measures to correct the deficit, either by increasing revenue or by reducing expenditure. Meanwhile, currency depreciation begins to have ever stronger countercyclical effects on the balance-of-payments current account, while the large depreciation that has built up in real terms allows the authorities concerned to loosen monetary policy. The countercyclical role played by these two factors is vital during the recovery phase and relieves fiscal policy of this task to some degree.
Generally speaking (although there are variatio-ns from one country to another), the Latin American countries were in the initial adjustment phase during the 1998-2001 period, passing to the second phase in 2002-2003. The first phase was characterized by a rapid correction of private-sector deficits and, in some cases, a deterioration in the fiscal accounts; in the second, on the other hand, the public accounts tended to do better while those of the private sector improved yet further. In practice, the private-sector deficit for the region as a whole (estimated rather crudely by deducting the central government balance from the current account balance)
was corrected in 1999, even as the public-sector deficit continued to worsen (as shown by the gap between the two lines in figure 8); then in 2002 the budget deficit began to shrink (very slowly), while the private-sector surplus increased yet further.
In this context, what new developments have there been in Latin America during the recent upturn? As figure 8 shows, in the region as a whole the upturn has served to correct the budget deficit left over from the downturn. The private-sector accounts, on the other hand, have followed the pattern typical of previous up-turns by starting to deteriorate, although they are still in surplus. Naturally, the calculations would alter if in each case we were to discount the gain of a little over three percentage points of GDP in the terms of trade; in the private sector, particularly, this would mean discounting the effect of the upturn on foreign firms operating in the hydrocarbon and mining sectors, where prices have risen most sharply.
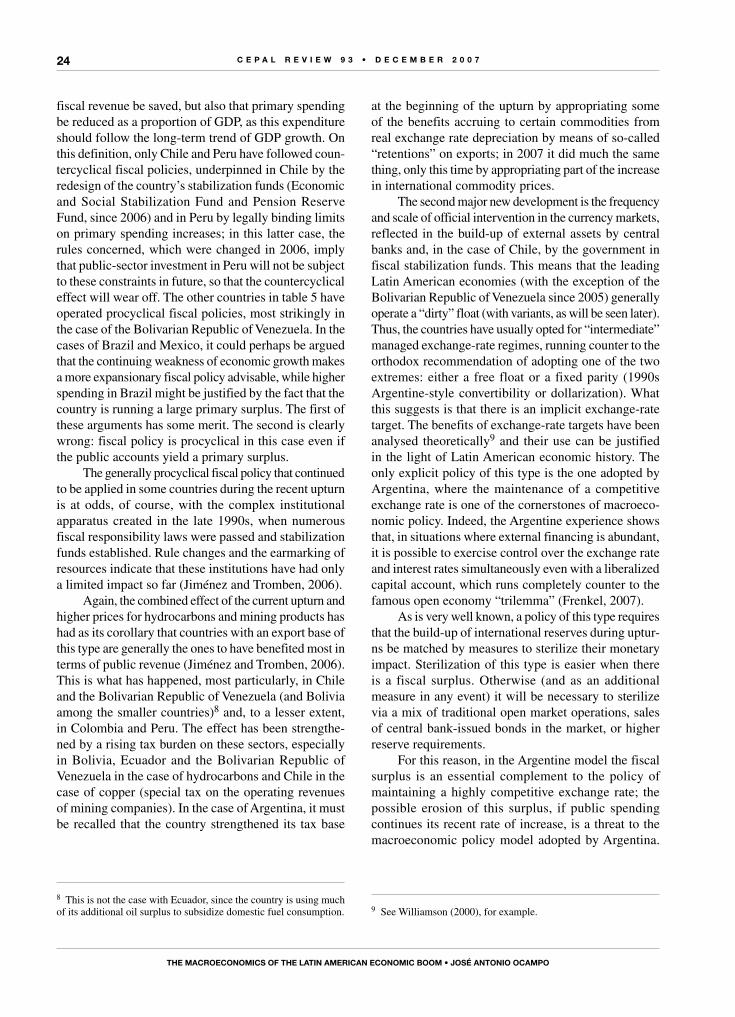
The first great difference from the past seems to lie, then, in fiscal management. However, the story is rather less favourable than the aggregate figures suggest. Table 5 shows what has happened with primary spending by the central government in the seven largest Latin American countries. Strictly countercyclical fiscal management during upturns requires not only that extraordinary
FIGuRE 8
Latin America: “Twin” surpluses and deficits(Percentages of gross domestic product at current prices)
–0.05
–0.04
–0.03
–0.02
–0.01
0
0.01
0.02
0.03
0.04
1998 1999 2000 2001 2002 2003 2004 2005 2006
Adjusted current account Private-sector balanceCurrent account balance
Source: Author’s calculations based on data from ECLAC (2007).
C E P A L R E V I E W 9 3 • D E C E M B E R 2 0 0 7
ThE MACRoEConoMICs of ThE LATIn AMERICAn EConoMIC BooM • José AnTonIo oCAMPo
24
fiscal revenue be saved, but also that primary spending be reduced as a proportion of GDP, as this expenditure should follow the long-term trend of GDP growth. On this definition, only Chile and Peru have followed coun-tercyclical fiscal policies, underpinned in Chile by the redesign of the country’s stabilization funds (Economic and Social Stabilization Fund and Pension Reserve Fund, since 2006) and in Peru by legally binding limits on primary spending increases; in this latter case, the rules concerned, which were changed in 2006, imply that public-sector investment in Peru will not be subject to these constraints in future, so that the countercyclical effect will wear off. The other countries in table 5 have operated procyclical fiscal policies, most strikingly in the case of the Bolivarian Republic of Venezuela. In the cases of Brazil and Mexico, it could perhaps be argued that the continuing weakness of economic growth makes a more expansionary fiscal policy advisable, while higher spending in Brazil might be justified by the fact that the country is running a large primary surplus. The first of these arguments has some merit. The second is clearly wrong: fiscal policy is procyclical in this case even if the public accounts yield a primary surplus.
The generally procyclical fiscal policy that continued to be applied in some countries during the recent upturn is at odds, of course, with the complex institutional apparatus created in the late 1990s, when numerous fiscal responsibility laws were passed and stabilization funds established. Rule changes and the earmarking of resources indicate that these institutions have had only a limited impact so far (Jiménez and Tromben, 2006).
Again, the combined effect of the current upturn and higher prices for hydrocarbons and mining products has had as its corollary that countries with an export base of this type are generally the ones to have benefited most in terms of public revenue (Jiménez and Tromben, 2006). This is what has happened, most particularly, in Chile and the Bolivarian Republic of Venezuela (and Bolivia among the smaller countries)8 and, to a lesser extent, in Colombia and Peru. The effect has been strengthe-ned by a rising tax burden on these sectors, especially in Bolivia, Ecuador and the Bolivarian Republic of Venezuela in the case of hydrocarbons and Chile in the case of copper (special tax on the operating revenues of mining companies). In the case of Argentina, it must be recalled that the country strengthened its tax base
8 This is not the case with Ecuador, since the country is using much of its additional oil surplus to subsidize domestic fuel consumption.
at the beginning of the upturn by appropriating some of the benefits accruing to certain commodities from real exchange rate depreciation by means of so-called “retentions” on exports; in 2007 it did much the same thing, only this time by appropriating part of the increase in international commodity prices.
The second major new development is the frequency and scale of official intervention in the currency markets, reflected in the build-up of external assets by central banks and, in the case of Chile, by the government in fiscal stabilization funds. This means that the leading Latin American economies (with the exception of the Bolivarian Republic of Venezuela since 2005) generally operate a “dirty” float (with variants, as will be seen later). Thus, the countries have usually opted for “intermediate” managed exchange-rate regimes, running counter to the orthodox recommendation of adopting one of the two extremes: either a free float or a fixed parity (1990s Argentine-style convertibility or dollarization). What this suggests is that there is an implicit exchange-rate target. The benefits of exchange-rate targets have been analysed theoretically9 and their use can be justified in the light of Latin American economic history. The only explicit policy of this type is the one adopted by Argentina, where the maintenance of a competitive exchange rate is one of the cornerstones of macroeco-nomic policy. Indeed, the Argentine experience shows that, in situations where external financing is abundant, it is possible to exercise control over the exchange rate and interest rates simultaneously even with a liberalized capital account, which runs completely counter to the famous open economy “trilemma” (Frenkel, 2007).
As is very well known, a policy of this type requires that the build-up of international reserves during uptur-ns be matched by measures to sterilize their monetary impact. Sterilization of this type is easier when there is a fiscal surplus. Otherwise (and as an additional measure in any event) it will be necessary to sterilize via a mix of traditional open market operations, sales of central bank-issued bonds in the market, or higher reserve requirements.
For this reason, in the Argentine model the fiscal surplus is an essential complement to the policy of maintaining a highly competitive exchange rate; the possible erosion of this surplus, if public spending continues its recent rate of increase, is a threat to the macroeconomic policy model adopted by Argentina.
9 See Williamson (2000), for example.
C E P A L R E V I E W 9 3 • D E C E M B E R 2 0 0 7
ThE MACRoEConoMICs of ThE LATIn AMERICAn EConoMIC BooM • José AnTonIo oCAMPo
25
TABLE 5
Latin America (seven largest economies): Monetary, credit and fiscal policy indicators(Percentages)
Argentina Brazil Chile Colombia Mexico PeruVenezuela
(B.R.)
A. Change in central government fiscal accounts as % of GDP, 2003-2006
Current revenuesa 1.2 2.4 5.2 2.2 0.6 2.5 6.7
Primary spending 0.7 2.1 –2.5 1.4 1.3 –0.5 4.9
Primary balance 0.6 –0.2 7.7 1.0 –0.7 3.0 1.8
B. Central government fiscal balance, 2006Primary balance 2.7 2.1 8.4 –0.3 0.1 3.2 2.1
Total balance 1.0 –3.1 7.7 –4.4 –2.0 1.4 0.0
C. Change in nominal interest rate, 2003-2006
Policyb –4.8 4.0 2.5 0.8 2.5
Interbank 3.5 –8.1 2.3 –0.5 0.7 2.0 –8.0
D. Real interest rate (deposits)
2003 –2.9 6.3 –0.1 0.6 –1.4 0.8 –10.62004 –1.7 8.3 0.9 1.8 –1.9 –1.2 –7.52005 –5.4 10.1 0.9 1.9 –0.5 1.0 –3.72006 –4.0 9.4 1.7 1.9 –0.3 1.2 –3.0
E. Change in balances as % of GDP, 2003-2006Monetary base –0.1 0.9 0.3 1.2 0.5 1.0 3.4
M1 1.9 1.1 0.6 1.7 0.9 1.8 M3 2.6 10.0 –7.8 5.0 5.8 1.1 8.7
Lending to the private sector 2.3 7.3 1.6 10.7 3.7 –3.0 3.9
Source: ECLAC for fiscal statistics, IMF International Financial Statistics for interest rates and monetary and credit variables (except in the case of the Bolivarian Republic of Venezuela, where they were estimated from ECLAC figures), JP Morgan Chase for basic policy rates.
a Total revenues in the case of Brazil and Mexico.b Between June 2004 and September 2007. The equivalent rate for the United States rose by 3.75%.
Precisely the opposite situation is found in Brazil and Colombia, since these two countries still have the largest overall fiscal deficits; this factor has unquestionably made them more vulnerable to currency speculation. Mexico has opted for a cleaner float. The same could be said of Chile, which operates a clean float from the exchange-rate policy standpoint, but whose government intervenes massively in the currency markets through the stabilization funds.
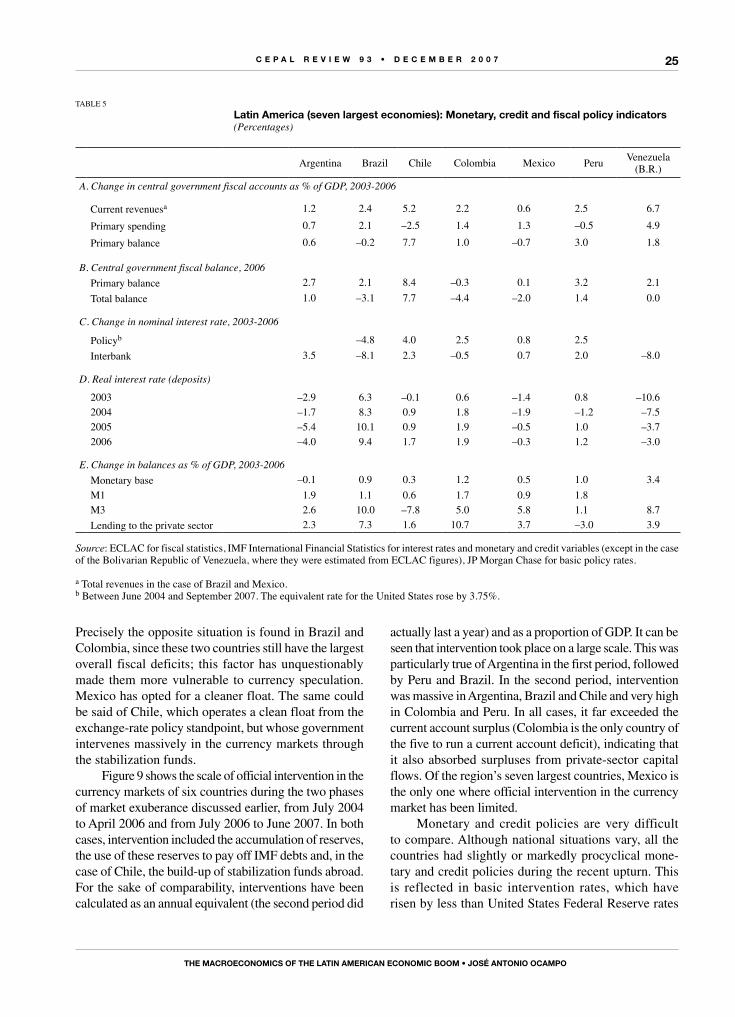
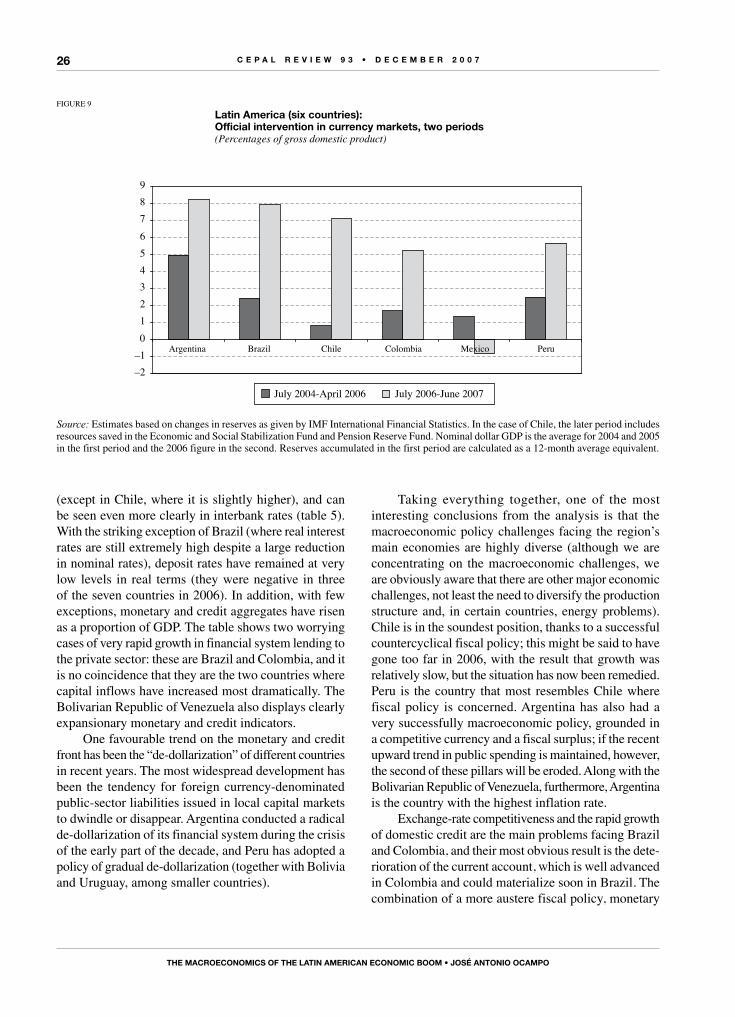
Figure 9 shows the scale of official intervention in the currency markets of six countries during the two phases of market exuberance discussed earlier, from July 2004 to April 2006 and from July 2006 to June 2007. In both cases, intervention included the accumulation of reserves, the use of these reserves to pay off IMF debts and, in the case of Chile, the build-up of stabilization funds abroad. For the sake of comparability, interventions have been calculated as an annual equivalent (the second period did
actually last a year) and as a proportion of GDP. It can be seen that intervention took place on a large scale. This was particularly true of Argentina in the first period, followed by Peru and Brazil. In the second period, intervention was massive in Argentina, Brazil and Chile and very high in Colombia and Peru. In all cases, it far exceeded the current account surplus (Colombia is the only country of the five to run a current account deficit), indicating that it also absorbed surpluses from private-sector capital flows. Of the region’s seven largest countries, Mexico is the only one where official intervention in the currency market has been limited.
Monetary and credit policies are very difficult to compare. Although national situations vary, all the countries had slightly or markedly procyclical mone-tary and credit policies during the recent upturn. This is reflected in basic intervention rates, which have risen by less than united States Federal Reserve rates
C E P A L R E V I E W 9 3 • D E C E M B E R 2 0 0 7
ThE MACRoEConoMICs of ThE LATIn AMERICAn EConoMIC BooM • José AnTonIo oCAMPo
26
(except in Chile, where it is slightly higher), and can be seen even more clearly in interbank rates (table 5). With the striking exception of Brazil (where real interest rates are still extremely high despite a large reduction in nominal rates), deposit rates have remained at very low levels in real terms (they were negative in three of the seven countries in 2006). In addition, with few exceptions, monetary and credit aggregates have risen as a proportion of GDP. The table shows two worrying cases of very rapid growth in financial system lending to the private sector: these are Brazil and Colombia, and it is no coincidence that they are the two countries where capital inflows have increased most dramatically. The Bolivarian Republic of Venezuela also displays clearly expansionary monetary and credit indicators.
One favourable trend on the monetary and credit front has been the “de-dollarization” of different countries in recent years. The most widespread development has been the tendency for foreign currency-denominated public-sector liabilities issued in local capital markets to dwindle or disappear. Argentina conducted a radical de-dollarization of its financial system during the crisis of the early part of the decade, and Peru has adopted a policy of gradual de-dollarization (together with Bolivia and uruguay, among smaller countries).
Taking everything together, one of the most interesting conclusions from the analysis is that the macroeconomic policy challenges facing the region’s main economies are highly diverse (although we are concentrating on the macroeconomic challenges, we are obviously aware that there are other major economic challenges, not least the need to diversify the production structure and, in certain countries, energy problems). Chile is in the soundest position, thanks to a successful countercyclical fiscal policy; this might be said to have gone too far in 2006, with the result that growth was relatively slow, but the situation has now been remedied. Peru is the country that most resembles Chile where fiscal policy is concerned. Argentina has also had a very successfully macroeconomic policy, grounded in a competitive currency and a fiscal surplus; if the recent upward trend in public spending is maintained, however, the second of these pillars will be eroded. Along with the Bolivarian Republic of Venezuela, furthermore, Argentina is the country with the highest inflation rate.
Exchange-rate competitiveness and the rapid growth of domestic credit are the main problems facing Brazil and Colombia, and their most obvious result is the dete-rioration of the current account, which is well advanced in Colombia and could materialize soon in Brazil. The combination of a more austere fiscal policy, monetary
FIGuRE 9
Latin America (six countries): official intervention in currency markets, two periods(Percentages of gross domestic product)
–2–10123456789
Argentina Brazil Chile Colombia Mexico Peru
July 2004-April 2006 July 2006-June 2007
Source: Estimates based on changes in reserves as given by IMF International Financial Statistics. In the case of Chile, the later period includes resources saved in the Economic and Social Stabilization Fund and Pension Reserve Fund. Nominal dollar GDP is the average for 2004 and 2005 in the first period and the 2006 figure in the second. Reserves accumulated in the first period are calculated as a 12-month average equivalent.
C E P A L R E V I E W 9 3 • D E C E M B E R 2 0 0 7
ThE MACRoEConoMICs of ThE LATIn AMERICAn EConoMIC BooM • José AnTonIo oCAMPo
27
and prudential measures to check credit growth and greater intervention in the currency markets (including the reserve requirement for external financing adopted by Colombia in May 2007) may be the right answer. As long as these measures are applied, Brazil’s high interest rates will continue to be a magnet for outside capital. Mexico, meanwhile, can be seen as an intermediate case in all the aspects analysed; its main problems concern competitiveness. This being so, it would not be illogical for this country to join the South American (and Asian)
VConclusions
trend towards more active exchange-rate management as part of its economic policy.
The Bolivarian Republic of Venezuela, lastly, has the most expansionary fiscal policy, while monetary and credit policy is also procyclical. Of the region’s largest countries, therefore, it is the only one still en-gaging in patterns of macroeconomic behaviour that were widespread in Latin America in the past and that will be sustainable only if conditions in the oil market remain exceptional.
markets, it is worth adopting preventive measures to check the inflow of capital. Chile and Colombia used these successfully in the 1990s. Colombia also adopted measures of this type during the recent boom, although only once the influx of capital and the appreciation of the currency had reached a very advanced stage.
Lastly, the two major (and complementary) ma-croeconomic policy developments that have occurred in Latin America in recent years need to be consoli-dated and applied more widely: countercyclical fiscal management, pioneered by Chile and to a lesser extent by Peru, and active currency market intervention, with the build-up of international reserves that this entails. The leading example of this latter policy is Argentina, where events have also underscored the complementary relationship between exchange-rate competitiveness and the maintenance of a fiscal surplus (although this risks being eroded because of the expansionary fiscal policy followed recently).
Where there is active intervention in currency markets, it may be worth acknowledging that the real exchange rate is a legitimate goal of macroeconomic policy, something that tends to be implicit rather than explicit in all countries but Argentina. The absence of an effective curb on currency appreciation can become a magnet for capital inflows in periods when private-sector agents are expecting this to occur. Brazil and Colombia have been obvious victims of the influx of speculative capital seeking to take advantage of these exchange-rate trends. There is an obvious risk in all the countries, but especially these two, that the flows may be reversed.
For this reason, it would not be illogical to move towards an asymmetrical currency regime designed to
The analysis carried out here points to three conclu-sions. The first is that the region has already reaped considerable benefits by using the current commodity price boom as an opportunity to reduce external liabi-lities and build up international reserves. The build-up of reserves looks less impressive, however, when set against the concomitant increase in portfolio liabilities, whose essential characteristic during the recent upturn has been the increased quantity of resources invested by international investment funds in local stock and bond markets. At the same time, the current account, adjusted for the terms of trade, is deteriorating, and this will ul-timately remove the most striking feature of the recent situation: the conjunction of a current account surplus with rapid economic growth. This combination, then, has its origin in an exceptional surge in hydrocarbon and mining product prices (more than agricultural prices) and does not reflect, as in East Asia, a high degree of international competitiveness.
The second conclusion is that we should remain aware of the potential of the international financial markets to deliver shocks like those occurring in a variety of forms over the past few years. The largest one was the massive influx of capital into the region’s larger countries during the two periods of exuberance in international financial markets (between mid-2004 and April 2006, and between mid-2006 and mid-2007), particularly the second. In the two countries most sensitive to this phenomenon, Brazil and Colombia, the massive inflow of capital was reflected in the rapid growth of financial system lending to the private sector and ex-cessive appreciation of the local currencies, the risks of which are now beginning to become clear. Insofar as the source of the disruption is the exuberance of financial
C E P A L R E V I E W 9 3 • D E C E M B E R 2 0 0 7
ThE MACRoEConoMICs of ThE LATIn AMERICAn EConoMIC BooM • José AnTonIo oCAMPo
28
compensate for the asymmetry affecting developing countries in the international capital markets, i.e., easy access in upturns and inadequate access in downturns. This regime would establish an exchange-rate ceiling (which could take the form of a crawling peg during upturns), but would allow currencies to float during downturns. The international reserves accumulated during upturns
would be used to intervene in currency markets during downturns to achieve an orderly exchange-rate adjustment and such other goals as the authorities may set themsel-ves, particularly in relation to interest rates. The reserves build-up during upturns obviously needs to be properly sterilized, something that is easier to do if there is a fiscal surplus, i.e., a countercyclical fiscal policy.
Bibliography
Banco de la República (2007): Volatilidad de la tasa de cambio, Documento SGMR-SGEE-017-01-J, Bogotá, D.C., January.
Calvo, G. and E. Talvi (2007): Current Account Surplus in Latin America: Recipe Against Capital Market Crises? Available at http://www.rgemonitor.com/latamblog/author/44//guillermo_calvo_and_ernesto_talvi.
ECLAC (Economic Commission for Latin America and the Caribbean) (2006): Economic Survey of Latin America and the Caribbean, 2005-2006, LC/G.2314-P, Santiago, Chile. United Nations publication, Sales No. E.06.II.G.2.
__________ (2007a): Economic Survey of Latin America and the Caribbean, 2006-2007, Briefing Paper, Santiago, Chile.
__________ (2007b): Confusion and uncertainty in credit markets, LC/WAS/R.47, Washington, D.C., ECLAC office in Washington, D.C., September.
Frenkel, R. (2007): La sostenibilidad de la política de esterilización, documento de trabajo, No. 7, Buenos Aires, Centro de Economía y Finanzas para el Desarrollo de Argentina, August.
Izquierdo, A., R. Romero and E. Talvi (2007): Business Cycles in Latin America: The Role of External Factors, Washington, D.C., Inter-American Development Bank/CERES, September.
Jiménez, J.P. and V. Tromben (2006): Fiscal policy and the commodities boom: the impact of higher prices for non-renewables in Latin America and the Caribbean, CEPAL Review, No. 90, LC/G.2323-P, Santiago, Chile, December.
Kuczynski, P.-P. and J. Williamson (eds.) (2003): After the Washington Consensus: Restarting Growth and Reform in Latin America, Washington, D.C., Institute for International Economics.
Machinea, J.L. and O. Kacef (2007): La coyuntura económica de América Latina: ¿hay lugar para el optimismo?, in J.L. Machinea and N. Serra (eds.), Hacia un nuevo pacto social. Políticas económicas para un desarrollo integral en América Latina, Santiago, Chile, Economic Commission for Latin America and the Caribbean (ECLAC)/Fundación CIDOB.
Marfán, M. (2005): La eficacia de la política fiscal y los déficit privados: un enfoque macroeconómico, in J.A. Ocampo (ed.), Más allá de las reformas: dinámica estructural y vulnerabilidad macroeconómica, Bogotá, D.C., Alfaomega/ECLAC.
Ocampo, J.A. (2004): Reconstruir el futuro: globalización, desarrollo y democracia en América Latina, Bogotá, D.C., Grupo Editorial Norma/ECLAC.
Ocampo, J.A. and M.A. Parra (2003): The terms of trade for commodities in the twentieth century, CEPAL Review, No. 79, LC/G.2200-P, Santiago, Chile, April.
United Nations (2006): World Economic and Social Survey 2006: Diverging Growth and Development, New York. United Nations publication, Sales No. 06.II.C.1.
__________ (2007): World Economic Situation and Prospects 2007, New York. United Nations publication, Sales No. 07.II.C.2.
Williamson, J. (2000): Exchange rate regimes for emerging markets: reviving the intermediate option, Policy Analyses in International Economics 60, Washington, D.C., Institute for International Economics.
(Original Spanish)
29
C E P A L R E V I E W 9 3 • D E C E M B E R 2 0 0 7
The sustainability of monetary sterilization policies
Roberto Frenkel
The focus of this paper is on policies that set out simultaneously to
control the exchange rate and monetary conditions (an instrument interest
rate, for example) in situations where capital mobility is unrestricted, there
is an excess supply of international currency and the central bank sets
targets for the exchange rate and interest rate. The paper calculates how
high the local interest rate can go at any time without rendering monetary
sterilization policy unsustainable, defines the degree of monetary autonomy
as the difference between this rate on the one hand and the sum of the
international interest rate and the rate of increase in the exchange rate on
the other, and analyses how the degree of autonomy evolves. Numerical
examples using data from Argentina and elsewhere suggest that sterilization
policy is sustainable and that a considerable degree of monetary autonomy
exists in contexts that are by no means unusual in many developing
economies.
K E YW O R D S
Capi ta l
Cap i ta l movements
Fore ign exchange ra tes
In teres t ra tes
Monetar y po l icy
Cent ra l banks
Argent ina
Roberto Frenkel
Principal Research Associate at the
Centro de Estudios
de Estado y Sociedad
(CEdES, Buenos Aires) and
Professor at the University of
Buenos Aires
C E P A L R E V I E W 9 3 • D E C E M B E R 2 0 0 7
ThE susTAInABILITy of MonETARy sTERILIzATIon PoLICIEs • RoBERTo fREnkEL
30
The author is grateful for the comments of Ramiro Albrieu, Eduardo Corso, Javier Okseniuk and Martín Rapetti.
IIntroduction
In a context of free capital mobility, the central bank can simultaneously control the exchange rate and the interest rate. This runs directly counter to what is claimed by the so-called “trilemma” of an economy open to capital movements. Here we argue that this trilemma is false in certain circumstances and, consequently, is false as a general theorem.
The condition for combining control of the exchan-ge rate with the preservation of monetary autonomy is the existence of an excess supply of international currency at the exchange rate targeted by the central bank. That is, the conditions in the current account and capital account are such that the local currency would appreciate if the bank did not intervene to hold down the exchange rate. In this context, the monetary authority can set the exchange rate by purchasing the excess supply in the currency market and can control the interest rate by sterilizing the monetary effects of this intervention, which it does by issuing treasury or central bank bonds in the money market. The central bank has two instruments for achieving its two goals: intervention in the foreign currency market to set the exchange rate and intervention in the money market to determine the interest rate.
An excess supply of currency, at the exchange rate targeted by the central bank and at the current interest rate, implies an excess demand for local assets. Fully sterilized intervention can be seen as a policy that is implemented in two stages. In the first, central bank intervention in the currency market leads to an increase in the monetary base. As a result there is a larger monetary base, an unaltered stock of local assets and an interest rate lower than the initial one. In the second stage, full sterilization completely offsets the change in the private-sector portfolio that occurred in the first stage. The central bank absorbs the increase in the monetary base and issues an amount of local assets equivalent to the initial excess demand for these assets (the excess supply of currency), returning the local interest rate to its previous level (Bofinger and Wollmershäuser, 2003).
An excess supply of international currency at the exchange rate targeted by the central bank is what invalidates the “trilemma” and empowers that bank to set the exchange rate and the interest rate. We believe that this idea is unfamiliar because the specialized literature dealing with monetary autonomy and with currency regimes and policies rarely addresses condi-tions in which there is an excess supply of international currency, mainly concentrating instead on situations of balance-of-payments deficit.
In situations of deficit, the “trilemma” does indeed usually hold true. In conditions of excess demand in the currency market, the ability even of powerful central banks to intervene in that market is ultimately limited by the available amount of reserves. In situations of excess demand for international currency, therefore, not even these central banks can adopt an exchange-rate target without affecting the interest rate. But there is no symmetry between situations of deficit and surplus in the balance of payments, however. The “trilemma” is valid in one case but not in the other (Frenkel, 2007).
Sterilized buying operations can be carried out at any time. But can this policy be applied continuously? Not in every circumstance. The sustainability of the policy depends on the interest rate earned by the international reserves, on the local interest rate, on the exchange-rate trend and on the evolution of the variables determining the supply of and demand for the monetary base. The main conclusion of this paper is that there is a maximum local interest rate above which the policy of sterilization becomes unsustainable. In conditions of excess supply of international currency at the targeted exchange rate, the central bank can set the exchange rate and is free to set a local interest rate no higher than that maximum without giving rise to an unsustainable trend. We set forth this conclusion in a previous paper (Frenkel, 2007). Here we present a formal model to justify it.
The paper is presented as follows. Following this introduction, section II describes the problem and defines the degree of monetary autonomy. Section III presents the model and defines and derives the sustainability condition; it also shows that this condition is equivalent to the central bank having non-negative financial results. Section IV discusses the dynamic of the sustainability condition. Section V defines and derives the condition
C E P A L R E V I E W 9 3 • D E C E M B E R 2 0 0 7
ThE susTAInABILITy of MonETARy sTERILIzATIon PoLICIEs • RoBERTo fREnkEL
31
for the permanence of the degree of monetary autonomy; both this section and section III include numerical exam-ples with data similar to those observed in Argentina in late 2006. Lastly, section VI presents two interesting
applications of the results obtained. Both are illustrated using numerical examples to show that the conditions for sustainability and permanence exist in situations that are by no means unusual.
IIThe cost of sterilization and the degree
of monetary autonomy
At any point in time, the unit cost of sterilization is s = i – r – e, where s is the cost of sterilization, i the local interest rate, r the international interest rate and e = dE/E (E = pesos / US$) the rate of increase in the price of the international currency. The sterilization cost s is nil if i = r + e, i.e., if the local interest rate is equal to the sum of the international interest rate and the rate of increase in the exchange rate. Or (which comes to the same thing) if the uncovered interest parity (uip) condition is strictly met (Bofinger and Wollmershäuser, 2003).
A policy of sterilization is obviously sustainable if the cost of sterilization is nil or negative. If this were the sustainability condition, the policy of sterilization would only be sustainable if i ≤ r + e, i.e., r + e would be the maximum value of the interest rate needed to keep the policy of sterilization sustainable.1 Rates higher than this would make the policy unsustainable.
In what follows we show that the condition referred to is not necessary for sustainability. We
demonstrate that the policy can be sustainable with local interest rates higher than r + e and we calcula-te the maximum rate at which sterilization remains sustainable. For this we formulate a simple model which takes account of the fact that, in addition to interest-bearing financial assets, the public demands and the central bank issues a monetary base which is not interest-bearing.
The above considerations suggest that the degree of monetary autonomy should be defined as the difference between the maximum local interest rate at which the policy of sterilization is sustainable and r + e. If this maximum rate is termed imax and the degree of monetary autonomy g, we get: g = imax – (r + e).
Given the international interest rate and the rate of increase in the exchange rate, then the higher the local interest rate that can be set without rendering the policy of sterilization unsustainable, the greater the degree of autonomy.
1 It may happen that i ≤ r + e (a) and there is still excess supply on the currency market. This can arise because capital flows are a function of i – (r + E(e)) (b), where E(e) is the expected rate of increase in the exchange rate. It can happen that E(e) < e for fairly long periods, so that expression b is positive even when expression a subsequently proves to hold true. For example, this situation has been present in recent years in China, where the local interest rate is lower than the sum of the United States Federal Reserve interest rate and the rate of increase in the exchange rate (see McKinnon and Schnabl, 2006).
C E P A L R E V I E W 9 3 • D E C E M B E R 2 0 0 7
ThE susTAInABILITy of MonETARy sTERILIzATIon PoLICIEs • RoBERTo fREnkEL
32
IIIThe sustainability condition
The central bank has international reserves as its only asset. In addition, it issues two liabilities, monetary base and sterilization bills yielding the local interest rate i. Thus, P = B + L, where P is the total stock of central bank liabilities, B the outstanding monetary base and L the stock of interest-bearing liabilities.
At interest rate i and exchange rate E there is an excess supply of international currency C in the currency market, which the central bank purchases. The increase in the bank’s total liabilities is
dP = dB + dL = C E + i L (1)
where C E is the peso value of flow C, while i L is the flow of interest the central bank has to pay on stock L of interest-bearing liabilities.
Let us suppose that dP > dB, so that dL > 0.The increase in monetary base demand is
dB = B β (p + y) (2)
where p is the inflation rate, y is the real GDP growth rate and β is the demand-elasticity of the monetary base to nominal GDP.
R is the central bank’s stock of international reserves (in international currency) and d(R E) is the increase in the peso value of these reserves. The international reserves yield r, the international interest rate. Therefore,
d(R E) = R dE + E dR = = R dE + E (C + r R) = = R dE + E C + E r R (3)
The sustainability condition for the sterilization policy is defined as dP ≤ d(R E). This condition means that the sterilization policy is sustainable if the ratio between the central bank’s total liabilities and the peso value of the international reserves P/(R E) does not increase.
Substituting (1) and (3) into the sustainability condition gives:
CE+iL≤RdE+EC+ErR iL≤RdE+ErR (4)
Dividing expression (4) by R E gives:
iL/RE≤e+ry i≤(e+r)/(L/RE) (5)
The sterilization policy is sustainable when local interest rates are no higher than the second term of expre-ssion (5). We use the term lR = L/R E for the ratio between the stock of interest-bearing central bank liabilities and the local-currency value of the international reserves, and formulate the sustainability condition as
i≤(e+r)/lR (6)
If lR < 1, then the level of local interest rates at which the sterilization policy remains sustainable can be higher than e + r, and the lower the lR ratio then the higher they can be. As was pointed out earlier, the operations of the central bank determine the local interest rate and the exchange rate at all times. The sustainability of these operations depends on the local and international rates, on lR and on the trend of the exchange rate over time.
The maximum local interest rate at which the steri-lization policy remains sustainable is imax = (r + e) / lR. Consequently, the degree of monetary autonomy is:
g = imax–(r+e)=
=(r+e)(1–lR)/lR
The degree of monetary autonomy, i.e., the diffe-rence between the highest sustainable local rate and r + e, is thus expressed as a proportion of r + e. The lower lR is, the higher the degree of autonomy.
The central bank’s financial (quasi-fiscal) result2
The central bank financial result is Cf ≈ R E (r + e) – i L. The condition of a non-negative financial result is Cf≈RE(r+e)–iL≥0 (7)
Dividing by R E gives Cf / R E ≈ r + e – i lR ≥ 0, whence
2 This point was suggested by Javier Okseniuk.
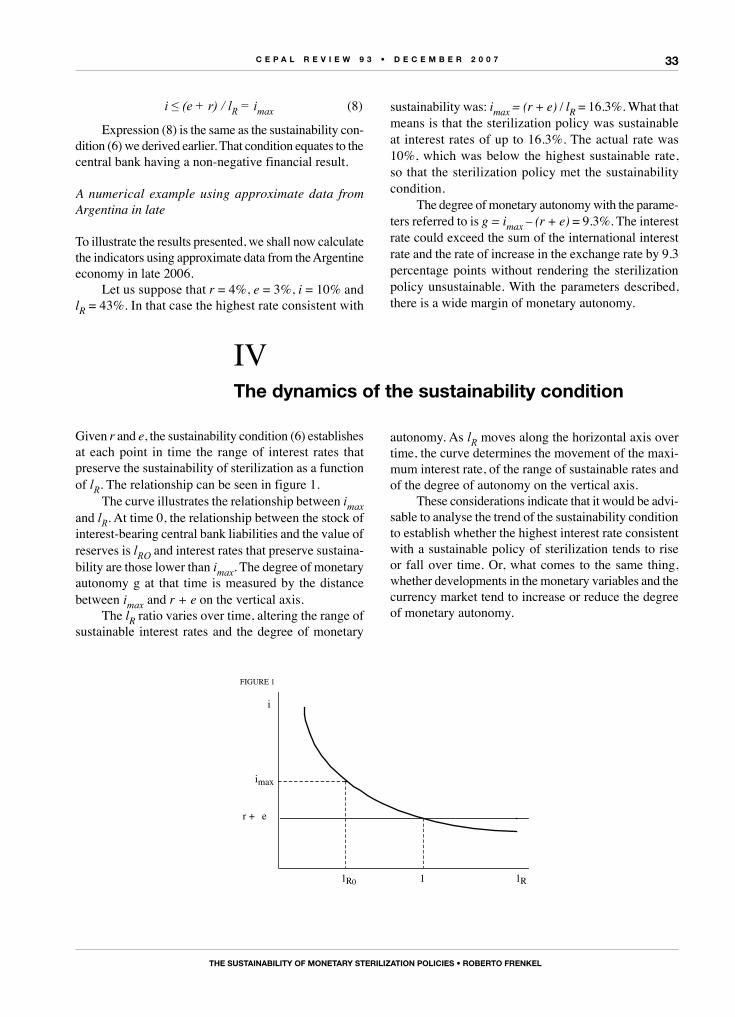
C E P A L R E V I E W 9 3 • D E C E M B E R 2 0 0 7
ThE susTAInABILITy of MonETARy sTERILIzATIon PoLICIEs • RoBERTo fREnkEL
33
i≤(e+r)/lR = imax (8)
Expression (8) is the same as the sustainability con-dition (6) we derived earlier. That condition equates to the central bank having a non-negative financial result.
A numerical example using approximate data from Argentina in late
To illustrate the results presented, we shall now calculate the indicators using approximate data from the Argentine economy in late 2006.
Let us suppose that r = 4%, e = 3%, i = 10% and lR = 43%. In that case the highest rate consistent with
sustainability was: imax = (r + e) / lR = 16.3%. What that means is that the sterilization policy was sustainable at interest rates of up to 16.3%. The actual rate was 10%, which was below the highest sustainable rate, so that the sterilization policy met the sustainability condition.
The degree of monetary autonomy with the parame-ters referred to is g = imax – (r + e) = 9.3%. The interest rate could exceed the sum of the international interest rate and the rate of increase in the exchange rate by 9.3 percentage points without rendering the sterilization policy unsustainable. With the parameters described, there is a wide margin of monetary autonomy.
IVThe dynamics of the sustainability condition
Given r and e, the sustainability condition (6) establishes at each point in time the range of interest rates that preserve the sustainability of sterilization as a function of lR. The relationship can be seen in figure 1.
The curve illustrates the relationship between imax and lR. At time 0, the relationship between the stock of interest-bearing central bank liabilities and the value of reserves is lRO and interest rates that preserve sustaina-bility are those lower than imax. The degree of monetary autonomy g at that time is measured by the distance between imax and r + e on the vertical axis.
The lR ratio varies over time, altering the range of sustainable interest rates and the degree of monetary
autonomy. As lR moves along the horizontal axis over time, the curve determines the movement of the maxi-mum interest rate, of the range of sustainable rates and of the degree of autonomy on the vertical axis.
These considerations indicate that it would be advi-sable to analyse the trend of the sustainability condition to establish whether the highest interest rate consistent with a sustainable policy of sterilization tends to rise or fall over time. Or, what comes to the same thing, whether developments in the monetary variables and the currency market tend to increase or reduce the degree of monetary autonomy.
FIGURE 1
lR0 1 lR
i
r + e
imax
C E P A L R E V I E W 9 3 • D E C E M B E R 2 0 0 7
ThE susTAInABILITy of MonETARy sTERILIzATIon PoLICIEs • RoBERTo fREnkEL
34
VThe permanence condition
For the purpose described, we define the permanence condition of the degree of monetary autonomy as:
d(L/RE)=dlR≤0 (9)
If the monetary and currency market variables meet condition (9), the highest sustainable interest rate and the degree of autonomy tend to remain stable or increa-se. If condition (9) is not met, the degree of autonomy tends to fall. We shall now express the permanence condition as a function of the monetary and currency market variables.
Equation (9) gives
d(L/R E) = [dL R E – L d(R E)] / (R E)2 ≤ 0 (10)
Considering that dL = dP – dB and substituting (1), (2) and (3) into (10), after some simplifications we get C E + i L – B β (p + y) – L (C/R + r + e) ≤ 0.
It is convenient to regroup the terms so as to leave on the left-hand side of the expression only those that include C, which is the flow of central bank foreign-currency purchases: C/(L/E) – C/R ≤ r + e – i + (B/L) β (p + y). Considering that lR = (L/E)/R and regrouping, we get:
C/R≤[lR/(1–lR)] ( B/L ) β (p + y) – [i–(r+e)] (11)
Given the interest rate and the exchange-rate trend, both of which it determines, the central bank does not control the excess supply of international currency in the exchange market. The degree of autonomy remains if the variables referred to meet condition (11). In this expression, the permanence condition is formulated as a restriction on the ratio between the flow of foreign currency purchased by the central bank and the stock of international reserves. If the sustainability condition is to remain stable or the degree of monetary autonomy increase, the C/R ratio must not be higher than the right-hand term of expression (11). A larger flow of purchases means that the degree of autonomy tends to fall.
The right-hand side of expression (11) includes all variables relating to the monetary structure and dynamic of the economy. The restriction depends positively on
lR, on the ratio between the outstanding monetary base and the stock of interest-bearing liabilities and on the rate of monetary base demand growth. The higher these variables, the more foreign exchange the central bank can purchase in the currency market without affecting the permanence of the sustainability condition. At the same time, the restriction depends negatively on the difference between the current local interest rate and r + e.
A further numerical example using approximate data from Argentina in late 2006
Let us suppose that in late 2006 B/L = 1.75, elasticity β = 1, i = 10%, r = 4%, e = 3%, lR = 43%, international reserves R = US$ 31 billion and the projected 2007 rate of growth in nominal GDP (p + y) = 19%. The term [lR / (1 – lR)] = 0.75.
With these inputs, expression (11) yields the follo-wing permanence condition: C/R ≤ 22.7%.
The permanence of the degree of monetary au-tonomy in late 2006 required that the flow of dollar purchases not exceed 22.7% of reserves, i.e., some US$ 7 billion a year. A larger flow of purchases would tend to reduce the maximum sustainable rate and the degree of monetary autonomy.
In fact, 2007 projections were for a flow of interna-tional currency purchases exceeding the maximum level that would preserve the degree of monetary autonomy. This is not too alarming as, given the other parameters, the consequent rise in lR has a relatively small effect on the maximum sustainable interest rate and the degree of autonomy. In fact, dlR can be calculated directly from equation (10) and the values of the parameters given. If it is assumed, for example, that C/R = 40%, then lR rises by 10 percentage points in a year (from 43% to 53%) and, given the other parameters, the maximum sustainable rate falls by 0.7% (from 16.3% to 15.6%).
At the same time, it is worth stressing the sensiti-vity of the maximum sustainable rate and the degree of autonomy to the trend of the exchange rate. For example, when lR = 43%, every percentage point increase (decrease) in the exchange rate increases (reduces) the maximum sustainable interest rate by 1% / 0.43 = 2.33%. If the rate of increase in e is zero instead of 3% a year, the maximum interest rate falls by seven percentage points, from 16.3% to 9.3%.
C E P A L R E V I E W 9 3 • D E C E M B E R 2 0 0 7
ThE susTAInABILITy of MonETARy sTERILIzATIon PoLICIEs • RoBERTo fREnkEL
35
VITwo interesting cases
We shall now look at two interesting applications of the sustainability and permanence conditions derived above, illustrating the degree of monetary autonomy in different circumstances. In both cases monetary policy keeps the real exchange rate constant. In both, consequently, e = p – p*, where p* is the international inflation rate.
Case 1
In this case, the local inflation rate is the same as the international one, p = p*, so that e = 0. Substituting into (6), the sustainability condition in this case comes out as:i≤r/lR = imax. If lR < 1, there is some degree of monetary autonomy even if the rate of variation in the exchange rate is nil.
The permanence condition in this case is:
C/R≤[lR/(1–lR)] [(B/L) β (p + y) – (i – r)] (12)
The central bank can purchase international curren-cy and retain its degree of monetary autonomy as long as the flow of purchases meets condition (12) and the expression is positive. That is: (B/L) β (p + y) > (i – r). The condition states that the increase in monetary base demand (function of the inflation rate and the growth rate), in proportion to the stock of interest-bearing lia-bilities, must be greater than the difference between the local interest rate and the international rate.
There is nothing remarkable about this condition. To illustrate the point quantitatively, we assign arbitrary but plausible values to the parameters, in order to simplify the calculations. Let lR = 0.5; (B/L) = 1 and β = 1. With the value of lR referred to, the maximum sustainable rate is twice the international rate. With these parameters, the permanence condition is: C/R ≤ p + y – (i – r). Or to put it another way, i – r ≤ p + y – C/R.
Let us suppose, for example, that the inflation rate is p = p* = 3%, the growth rate y = 6% and the international interest rate r = 5%. With these figures the degree of autonomy is permanent, for example, when i exceeds r by no more than two percentage points while annual purchases by the central bank do not represent more than 7% of reserves. In this example, the maximum sustainable rate is imax = 10%. Larger purchases will
gradually reduce it but will not render the sterilization policy unsustainable in the short term.
Case 2
In this case, the inflation rate in the economy is higher than the international rate, p > p*, so that e = p – p* > 0. The central bank, meanwhile, applies an inflation targeting policy, using a truncated Taylor rule (not taking account of the gap between actual and potential output):
i = γ p (13)
where γ > 1 is the parameter of the rule. Now we wish to determine the highest sustainable value of the policy parameter.
Substituting the exchange rate into expression (6), the sustainability condition of the sterilization policy is: i≤(r+p–p*)/lR = imax.. Substituting (13) into this expression, we get: γ p ≤ (r + p – p*) / lR, whence:
γ ≤[1 + (r–p*)/p)]/lR (14)
The right-hand term of expression (14) is the maxi-mum value of the policy rule parameter that preserves the sustainability of the sterilization policy. The term in square brackets is 1 plus the ratio between the real international interest rate and the local inflation rate. If lR < 1, values of γ well in excess of 1 are clearly sustainable.
Substituting the exchange rate into (11), the per-manence condition comes out as: C/R ≤ [lR / (1 – lR)] ( B/L ) β (p + y) – [ i – (r + p – p*)], and substituting the policy rule (13) and grouping gives:
C/R≤[lR/(1–lR)] ( B/L ) β (p + y) – [(γ–1)p–(r–p*)] (15)
The permanence of the sustainability condition holds provided that international currency purchases meet condition (15) and the expression is positive. In other words, (B/L) β (p + y) > (γ – 1) p – (r – p*). The condition states that the increase in monetary base demand as a proportion of the stock of interest-bearing liabilities must be greater than the difference between
C E P A L R E V I E W 9 3 • D E C E M B E R 2 0 0 7
ThE susTAInABILITy of MonETARy sTERILIzATIon PoLICIEs • RoBERTo fREnkEL
36
(OriginalSpanish)
the real local interest rate (γ – 1) p and the real interna-tional interest rate.
As in the previous case, we attributed arbitrary but plausible values to the parameters to provide a simple quantitative illustration of the results. Let lR = 0.5, (B/L) = 1 and β = 1. The permanence condition (15) then comes out as: C/R ≤ (p + y) – [(γ – 1) p – (r – p*)].
Let us suppose, for example, that the international inflation rate is p* = 3%, the international interest rate r = 5%, the local inflation rate p = 10%, the growth rate y = 6% and the policy parameter γ = 1.5 (consequently, interest rate i = 15%).
With these data, the maximum sustainable γ para-meter is 2.4 and the permanence of the sustainability condition holds if annual purchases of international currency do not represent more than 13% of reserves. As can be seen, there is a high degree of autonomy and this is preserved in conditions that are by no means out of the ordinary.
It might be interesting to consider a numerical example with a lower growth rate (implying a lower
rate of growth in monetary base demand) and a severer anti-inflation policy (implying a greater financial cost for sterilization), similar to those seen in Brazil in recent years. Suppose the growth rate y = 3% and the policy parameter γ = 2. In this numerical example the sterilization policy is also sustainable, but the degree of autonomy is preserved only when annual purchases by the central bank do not exceed 5% of reserves. It must be emphasized once again, however, that larger purchases do not mean that the sterilization policy is rendered rapidly unsustainable, but that the degree of autonomy is reduced gradually. If annual purchases by the central bank are higher than the figures given, once the expansion of the bank’s interest-bearing liabilities cancels out the difference between the maximum sus-tainable parameter and the parameter actually applied, the central bank must opt either to abandon the policy rule, which is becoming unsustainable, or to leave the real exchange rate to appreciate. In this example, the problem of sustainability arises because the growth rate is very low and the interest rate very high.
Bibliography
Bofinger, P. and T. Wollmershäuser (2003): Managed floating as a monetary policy strategy, Economics of Planning, vol. 36, No. 2, New York, Springer.
Frenkel, R. (2007): El esquema de “inflation targeting” y las economías en desarrollo, Política monetaria y estabilidad financiera. De la
teoría a la práctica, Jornadas Monetarias y Bancarias, Buenos Aires, Banco Central de la República Argentina.
McKinnon, R. and G. Schnabl (2006): China’s Exchange Rate and International Adjustment in Wages, Prices, and Interest Rates: Japan Déjà Vu?, CESifo Economic Studies, vol. 52, No. 2, Oxford, Oxford University Press.
37
C E P A L R E V I E W 9 3 • D E C E M B E R 2 0 0 7
Public expenditure in Latin America: trends and key policy issues
Benedict Clements, Christopher Faircloth and Marijn Verhoeven
This article examines trends in public spending in Latin America from
the mid-1990s to 2006. It also examines key policy issues, including the
cyclicality of spending, public investment, public employment and social
spending, finding that primary expenditures as a share of gross domestic
product have trended upward for the past ten years, driven by increases
in current spending, in particular for social expenditures. Fluctuations in
real spending have continued to follow a pro-cyclical pattern. The authors
conclude that there is substantial scope to improve the efficiency of public
investment, public employment and social spending.
K E YW O R D S
Publ ic expend i tures
Investments
Gross domest ic product
Economic growth
Employment
Pub l ic sector
Measurement
Eva lua t ion
Sta t is t ica l methodo logy
Sta t is t ica l da ta
La t in Amer ica
Benedict Clements
Division Chief,
Western Hemisphere Department,
International Monetary Fund
Christopher Faircloth
Economist,
Western Hemisphere Department,
International Monetary Fund
Marijn Verhoeven
Deputy Division Chief
Fiscal Affairs Department
International Monetary Fund
C E P A L R E V I E W 9 3 • D E C E M B E R 2 0 0 7
PuBLIC ExPEnDItuRE In LAtIn AMERICA: tREnDs AnD kEy PoLICy IssuEs •BEnEDICt CLEMEnts, ChRIstoPhER FAIRCLoth AnD MARIjn VERhoEVEn
38
IIntroduction
The role that public spending should play in fostering economic growth remains an important element in the policy debate in Latin America. Beyond their macroeconomic impact, expenditure policies can affect growth through a number of channels, including their effects on the development of physical and human capital.1 These policies have an especially important role in Latin America, given the wide disparities in living standards among the rich and the poor in the region (de Ferranti, Perry et al., 2004). Notwithstanding recent reductions, public debt ratios
1 For a more extensive overview of how fiscal policy and government expenditures affect growth, see Clements, Gupta and Inchauste (2004).
£ The authors would like to acknowledge the useful comments received from an anonymous referee, as well as those from Pablo Pereira, Roberto Steiner, and numerous colleagues in the imf Fiscal Affairs and Western Hemisphere Departments. Valuable research assistance was provided by Takahiro Atsuta, Priya Joshi and Victoria Gunnarsson.
remain high, limiting the ability of governments to meet social needs and bolster the region’s infrastructure.
This article assesses trends in public expenditures in Latin America and discusses key policy issues for the coming years. The analysis covers 17 countries and reviews trends in spending from the mid-1990s to 2006.2 In addition, the article examines several key expenditure policy issues, including: (i) the cyclicality of government spending, (ii) public investment, (iii) public employment and (iv) social expenditures.
IItrends in public spending
1. overview of fiscal trends
Fiscal balances generally weakened in the latter half of the 1990s. Rising primary spending tended to outpace increases in revenues, contributing to a deterioration in primary balances of over one percentage point of gdp (figure 1).3
Average primary balances fluctuated relatively little over the period, although there were significant differences across countries. Revenues rose by an average of about one percentage point of gdp in about half of the countries of the region.
Fiscal positions have improved this decade, thanks largely to the strengthening of revenues. After a slight decline in 2000–2002, average primary balances have trended upward, with primary surpluses in recent years substantially exceeding their mid-1990s levels. This is attributable largely to surging revenues, especially from export commodities. Revenues have risen by an average of about 3.5 percentage points of gdp since 2002, with oil producers experiencing a boost in receipts of over 4.5 percentage points.4 Bolivia, Chile and Peru have also benefited from the boom in metals prices and export-based revenues. In 2002, average non-commodity export revenues also rose in the 17 countries covered by the study, but the increase of about 1% of gdp was lower than that of commodity export revenues. Higher primary surpluses, together with improvements in macroeconomic
3 Figures based on the broadest definition of government available. For 14 of the 17 countries, expenditure data refer to the public sector or non-financial public sector (that is, general government spending, plus the capital expenditures of public enterprises). For Argentina and Mexico, expenditures also include the current outlays of public enterprises (e.g., wages), although in the case of the former country these outlays are very small. For Chile, the data cover general government.4 The oil-producing countries are Ecuador, Mexico and Venezuela (Bolivarian Republic of).
2 The 17 countries covered by the study are Argentina, Bolivia, Brazil, Chile, Colombia, Ecuador, Mexico, Peru, Paraguay, Uruguay and Venezuela (Bolivarian Republic of) (referred to collectively in the article as “South America and Mexico”) and Costa Rica, El Salvador, Guatemala, Honduras, Nicaragua and Panama (“Central America”). Figures for 2006 refer to imf estimates as of April 2007.
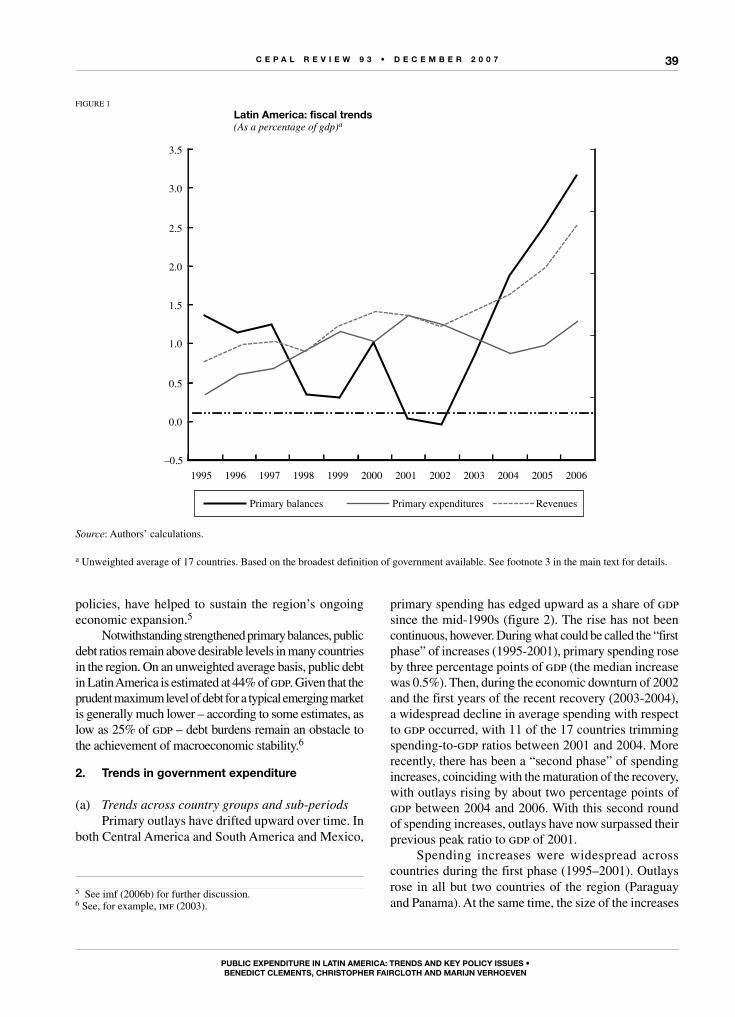
C E P A L R E V I E W 9 3 • D E C E M B E R 2 0 0 7
PuBLIC ExPEnDItuRE In LAtIn AMERICA: tREnDs AnD kEy PoLICy IssuEs •BEnEDICt CLEMEnts, ChRIstoPhER FAIRCLoth AnD MARIjn VERhoEVEn
39
policies, have helped to sustain the region’s ongoing economic expansion.5
Notwithstanding strengthened primary balances, public debt ratios remain above desirable levels in many countries in the region. On an unweighted average basis, public debt in Latin America is estimated at 44% of gdp. Given that the prudent maximum level of debt for a typical emerging market is generally much lower – according to some estimates, as low as 25% of gdp – debt burdens remain an obstacle to the achievement of macroeconomic stability.6
2. trends in government expenditure
(a) Trends across country groups and sub-periods Primary outlays have drifted upward over time. In
both Central America and South America and Mexico,
5 See imf (2006b) for further discussion.6 See, for example, imf (2003).
primary spending has edged upward as a share of gdp since the mid-1990s (figure 2). The rise has not been continuous, however. During what could be called the “first phase” of increases (1995-2001), primary spending rose by three percentage points of gdp (the median increase was 0.5%). Then, during the economic downturn of 2002 and the first years of the recent recovery (2003-2004), a widespread decline in average spending with respect to gdp occurred, with 11 of the 17 countries trimming spending-to-gdp ratios between 2001 and 2004. More recently, there has been a “second phase” of spending increases, coinciding with the maturation of the recovery, with outlays rising by about two percentage points of gdp between 2004 and 2006. With this second round of spending increases, outlays have now surpassed their previous peak ratio to gdp of 2001.
Spending increases were widespread across countries during the first phase (1995–2001). Outlays rose in all but two countries of the region (Paraguay and Panama). At the same time, the size of the increases
FIGURE 1
Latin America: fiscal trends(As a percentage of gdp)a
Primary balances Primary expenditures Revenues
–0.5
0.0
0.5
1.0
1.5
2.0
2.5
3.0
3.5
1995 1996 1997 1998 1999 2000 2001 2002 2003 2004 2005 200620
22
24
26
28
30
Source: Authors’ calculations.
a Unweighted average of 17 countries. Based on the broadest definition of government available. See footnote 3 in the main text for details.
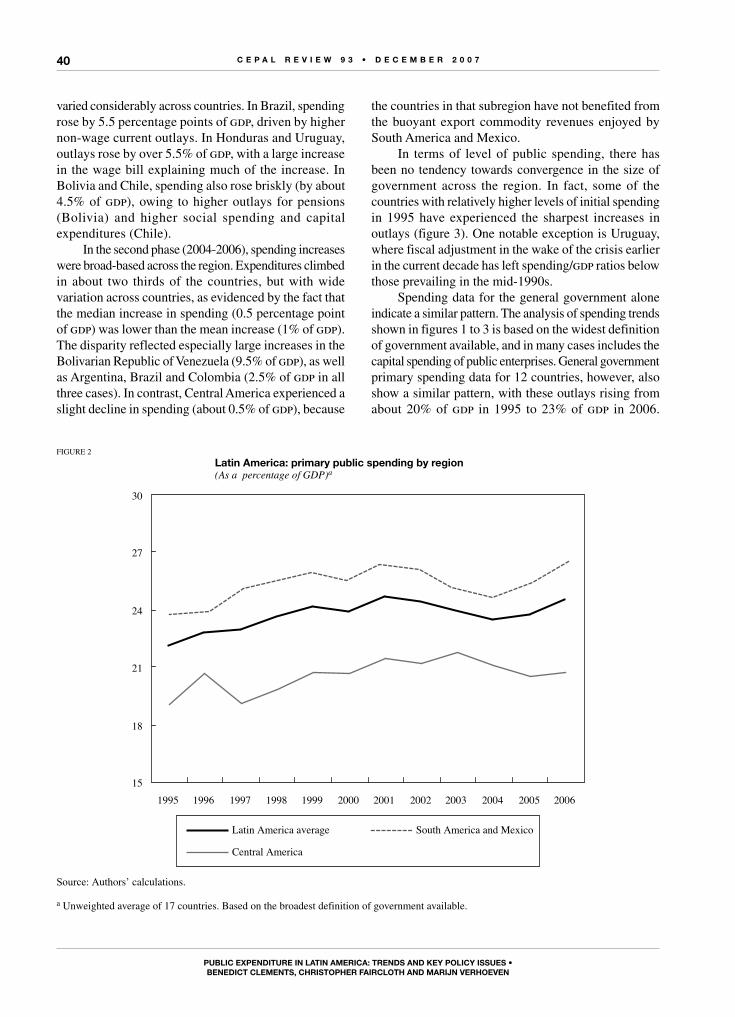
C E P A L R E V I E W 9 3 • D E C E M B E R 2 0 0 7
PuBLIC ExPEnDItuRE In LAtIn AMERICA: tREnDs AnD kEy PoLICy IssuEs •BEnEDICt CLEMEnts, ChRIstoPhER FAIRCLoth AnD MARIjn VERhoEVEn
40
varied considerably across countries. In Brazil, spending rose by 5.5 percentage points of gdp, driven by higher non-wage current outlays. In Honduras and Uruguay, outlays rose by over 5.5% of gdp, with a large increase in the wage bill explaining much of the increase. In Bolivia and Chile, spending also rose briskly (by about 4.5% of gdp), owing to higher outlays for pensions (Bolivia) and higher social spending and capital expenditures (Chile).
In the second phase (2004-2006), spending increases were broad-based across the region. Expenditures climbed in about two thirds of the countries, but with wide variation across countries, as evidenced by the fact that the median increase in spending (0.5 percentage point of gdp) was lower than the mean increase (1% of gdp). The disparity reflected especially large increases in the Bolivarian Republic of Venezuela (9.5% of gdp), as well as Argentina, Brazil and Colombia (2.5% of gdp in all three cases). In contrast, Central America experienced a slight decline in spending (about 0.5% of gdp), because
the countries in that subregion have not benefited from the buoyant export commodity revenues enjoyed by South America and Mexico.
In terms of level of public spending, there has been no tendency towards convergence in the size of government across the region. In fact, some of the countries with relatively higher levels of initial spending in 1995 have experienced the sharpest increases in outlays (figure 3). One notable exception is Uruguay, where fiscal adjustment in the wake of the crisis earlier in the current decade has left spending/gdp ratios below those prevailing in the mid-1990s.
Spending data for the general government alone indicate a similar pattern. The analysis of spending trends shown in figures 1 to 3 is based on the widest definition of government available, and in many cases includes the capital spending of public enterprises. General government primary spending data for 12 countries, however, also show a similar pattern, with these outlays rising from about 20% of gdp in 1995 to 23% of gdp in 2006.
FIGURE 2
Latin America: primary public spending by region(As a percentage of GDP)a
15
18
21
24
27
30
1995 1996 1997 1998 1999 2000 2001 2002 2003 2004 2005 2006
Latin America average
Central America
South America and Mexico
Source: Authors’ calculations.
a Unweighted average of 17 countries. Based on the broadest definition of government available.
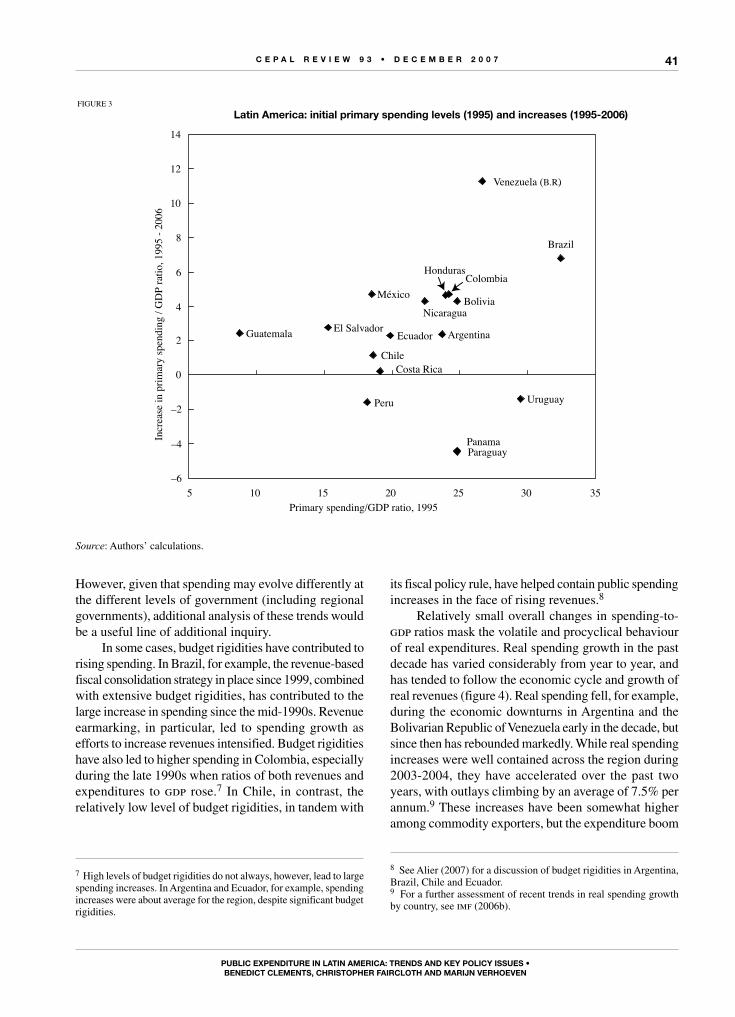
C E P A L R E V I E W 9 3 • D E C E M B E R 2 0 0 7
PuBLIC ExPEnDItuRE In LAtIn AMERICA: tREnDs AnD kEy PoLICy IssuEs •BEnEDICt CLEMEnts, ChRIstoPhER FAIRCLoth AnD MARIjn VERhoEVEn
41
However, given that spending may evolve differently at the different levels of government (including regional governments), additional analysis of these trends would be a useful line of additional inquiry.
In some cases, budget rigidities have contributed to rising spending. In Brazil, for example, the revenue-based fiscal consolidation strategy in place since 1999, combined with extensive budget rigidities, has contributed to the large increase in spending since the mid-1990s. Revenue earmarking, in particular, led to spending growth as efforts to increase revenues intensified. Budget rigidities have also led to higher spending in Colombia, especially during the late 1990s when ratios of both revenues and expenditures to gdp rose.7 In Chile, in contrast, the relatively low level of budget rigidities, in tandem with
7 High levels of budget rigidities do not always, however, lead to large spending increases. In Argentina and Ecuador, for example, spending increases were about average for the region, despite significant budget rigidities.
its fiscal policy rule, have helped contain public spending increases in the face of rising revenues.8
Relatively small overall changes in spending-to-gdp ratios mask the volatile and procyclical behaviour of real expenditures. Real spending growth in the past decade has varied considerably from year to year, and has tended to follow the economic cycle and growth of real revenues (figure 4). Real spending fell, for example, during the economic downturns in Argentina and the Bolivarian Republic of Venezuela early in the decade, but since then has rebounded markedly. While real spending increases were well contained across the region during 2003-2004, they have accelerated over the past two years, with outlays climbing by an average of 7.5% per annum.9 These increases have been somewhat higher among commodity exporters, but the expenditure boom
8 See Alier (2007) for a discussion of budget rigidities in Argentina, Brazil, Chile and Ecuador.9 For a further assessment of recent trends in real spending growth by country, see imf (2006b).
FIGURE 3
Latin America: initial primary spending levels (1995) and increases (1995-2006)
México
Argentina
Bolivia
Brazil
Chile
Colombia
Ecuador
Paraguay
Peru Uruguay
Venezuela (B.R.)
Costa Rica
El SalvadorGuatemala
Honduras
Nicaragua
Panama
–6
–4
–2
0
2
4
6
8
10
12
14
5 10 15 20 25 30 35Primary spending/GDP ratio, 1995
Incr
ease
in p
rimar
y sp
endi
ng /
GD
P ra
tio, 1
995
- 200
6
Source: Authors’ calculations.
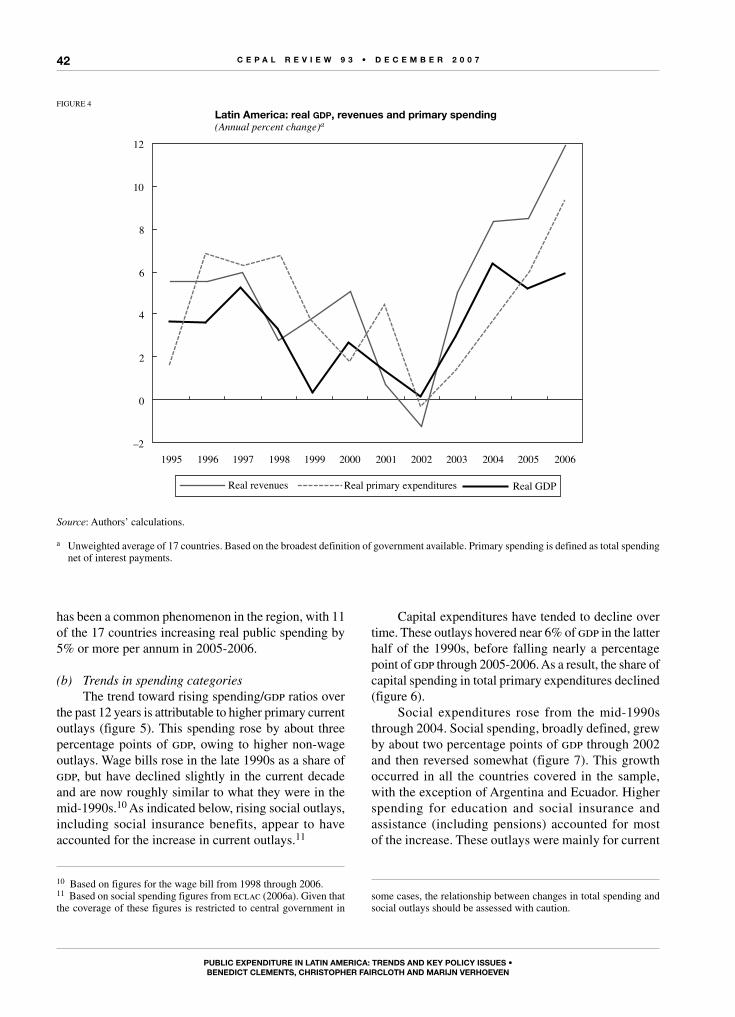
C E P A L R E V I E W 9 3 • D E C E M B E R 2 0 0 7
PuBLIC ExPEnDItuRE In LAtIn AMERICA: tREnDs AnD kEy PoLICy IssuEs •BEnEDICt CLEMEnts, ChRIstoPhER FAIRCLoth AnD MARIjn VERhoEVEn
42
has been a common phenomenon in the region, with 11 of the 17 countries increasing real public spending by 5% or more per annum in 2005-2006.
(b) Trends in spending categoriesThe trend toward rising spending/gdp ratios over
the past 12 years is attributable to higher primary current outlays (figure 5). This spending rose by about three percentage points of gdp, owing to higher non-wage outlays. Wage bills rose in the late 1990s as a share of gdp, but have declined slightly in the current decade and are now roughly similar to what they were in the mid-1990s.10 As indicated below, rising social outlays, including social insurance benefits, appear to have accounted for the increase in current outlays.11
10 Based on figures for the wage bill from 1998 through 2006.11 Based on social spending figures from eclac (2006a). Given that the coverage of these figures is restricted to central government in
Capital expenditures have tended to decline over time. These outlays hovered near 6% of gdp in the latter half of the 1990s, before falling nearly a percentage point of gdp through 2005-2006. As a result, the share of capital spending in total primary expenditures declined (figure 6).
Social expenditures rose from the mid-1990s through 2004. Social spending, broadly defined, grew by about two percentage points of gdp through 2002 and then reversed somewhat (figure 7). This growth occurred in all the countries covered in the sample, with the exception of Argentina and Ecuador. Higher spending for education and social insurance and assistance (including pensions) accounted for most of the increase. These outlays were mainly for current
some cases, the relationship between changes in total spending and social outlays should be assessed with caution.
FIGURE 4
Latin America: real gdp, revenues and primary spending(Annual percent change)a
Real revenues Real GDPReal primary expenditures
–2
0
2
4
6
8
10
12
1995 1996 1997 1998 1999 2000 2001 2002 2003 2004 2005 2006
Source: Authors’ calculations.
a Unweighted average of 17 countries. Based on the broadest definition of government available. Primary spending is defined as total spending net of interest payments.
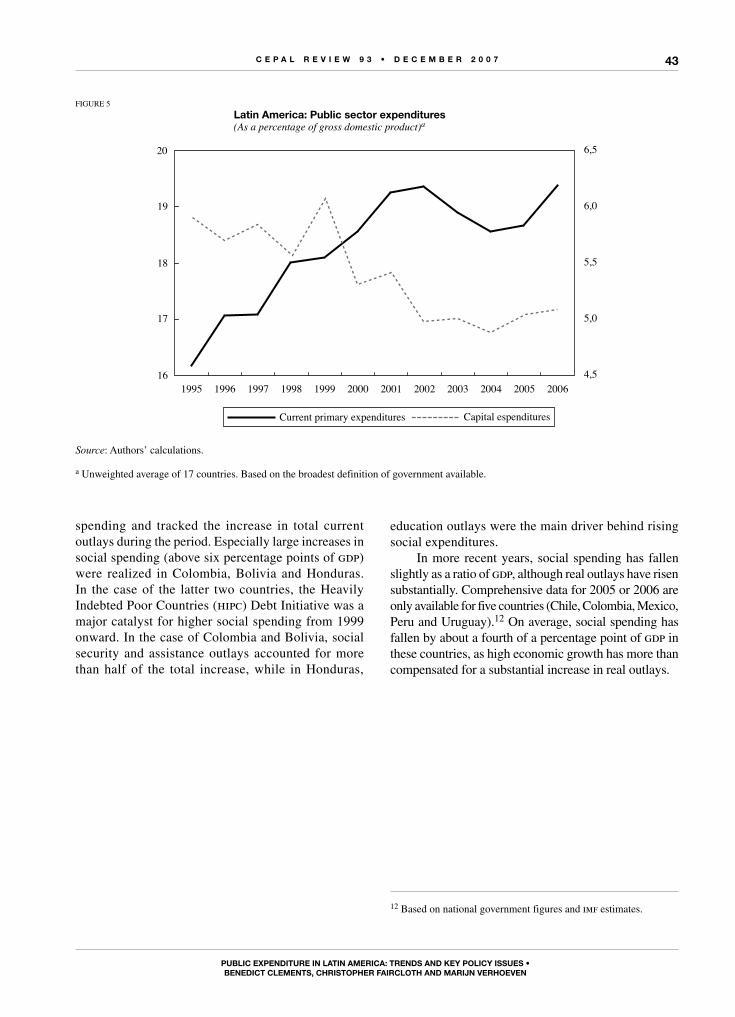
C E P A L R E V I E W 9 3 • D E C E M B E R 2 0 0 7
PuBLIC ExPEnDItuRE In LAtIn AMERICA: tREnDs AnD kEy PoLICy IssuEs •BEnEDICt CLEMEnts, ChRIstoPhER FAIRCLoth AnD MARIjn VERhoEVEn
43
spending and tracked the increase in total current outlays during the period. Especially large increases in social spending (above six percentage points of gdp) were realized in Colombia, Bolivia and Honduras. In the case of the latter two countries, the Heavily Indebted Poor Countries (hipc) Debt Initiative was a major catalyst for higher social spending from 1999 onward. In the case of Colombia and Bolivia, social security and assistance outlays accounted for more than half of the total increase, while in Honduras,
FIGURE 5
Latin America: Public sector expenditures(As a percentage of gross domestic product)a
Current primary expenditures
16
17
18
19
20
1995 1996 1997 1998 1999 2000 2001 2002 2003 2004 2005 20064,5
5,0
5,5
6,0
6,5
Capital espenditures
Source: Authors’ calculations.
a Unweighted average of 17 countries. Based on the broadest definition of government available.
education outlays were the main driver behind rising social expenditures.
In more recent years, social spending has fallen slightly as a ratio of gdp, although real outlays have risen substantially. Comprehensive data for 2005 or 2006 are only available for five countries (Chile, Colombia, Mexico, Peru and Uruguay).12 On average, social spending has fallen by about a fourth of a percentage point of gdp in these countries, as high economic growth has more than compensated for a substantial increase in real outlays.
12 Based on national government figures and imf estimates.
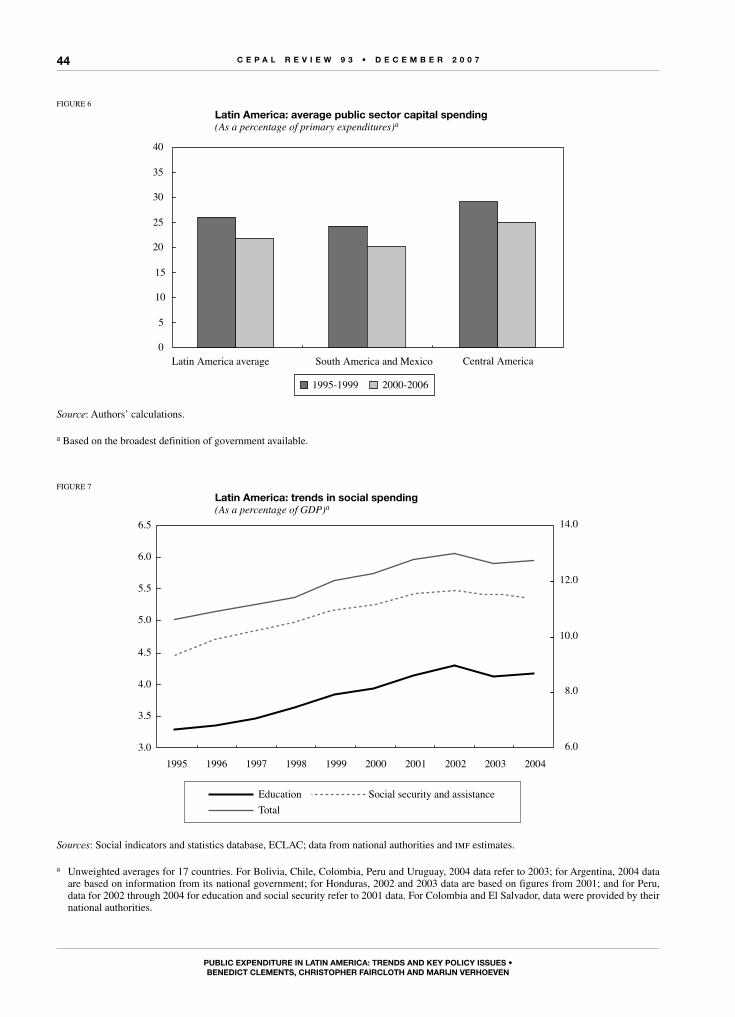
C E P A L R E V I E W 9 3 • D E C E M B E R 2 0 0 7
PuBLIC ExPEnDItuRE In LAtIn AMERICA: tREnDs AnD kEy PoLICy IssuEs •BEnEDICt CLEMEnts, ChRIstoPhER FAIRCLoth AnD MARIjn VERhoEVEn
44
FIGURE 6
Latin America: average public sector capital spending(As a percentage of primary expenditures)a
0
5
10
15
20
25
30
35
40
Latin America average South America and Mexico
1995-1999 2000-2006
Central America
Source: Authors’ calculations.
a Based on the broadest definition of government available.
FIGURE 7
Latin America: trends in social spending(As a percentage of GDP)a
3.0
3.5
4.0
4.5
5.0
5.5
6.0
6.5
1995 1996 1997 1998 1999 2000 2001 2002 2003 20046.0
8.0
10.0
12.0
14.0
TotalEducation Social security and assistance
Sources: Social indicators and statistics database, ECLAC; data from national authorities and imf estimates.
a Unweighted averages for 17 countries. For Bolivia, Chile, Colombia, Peru and Uruguay, 2004 data refer to 2003; for Argentina, 2004 data are based on information from its national government; for Honduras, 2002 and 2003 data are based on figures from 2001; and for Peru, data for 2002 through 2004 for education and social security refer to 2001 data. For Colombia and El Salvador, data were provided by their national authorities.
C E P A L R E V I E W 9 3 • D E C E M B E R 2 0 0 7
PuBLIC ExPEnDItuRE In LAtIn AMERICA: tREnDs AnD kEy PoLICy IssuEs •BEnEDICt CLEMEnts, ChRIstoPhER FAIRCLoth AnD MARIjn VERhoEVEn
45
IIIkey expenditure policy issues
The procyclical tendency of spending also varies across expenditure categories. Like Gavin and Perotti (1997), Akitoby, Clements et al. (2006) find that capital outlays appear to be the most procyclical. Excluding the extremely high estimate for Bolivia, the average coefficient for the statistically significant observations in table 1 is about 4.1, implying that a 1% shock to output boosts capital spending by about 4%. Spending on goods and services responds less markedly to shocks. Nevertheless, the average coefficient in most spending categories is higher than one for countries where there is a statistically significant relationship, indicating that spending responds more than proportionately to shocks.18
The cyclicality of spending is greater in the Latin American countries than in other developing countries. The share of countries where spending is procyclical is higher in Latin America than for developing countries as a whole (table 1), and average coefficient values are somewhat higher. Other studies also point to a more procyclical response of spending in Latin America. Singh and Cerisola (2006), for example, find that the correlation between the cyclical component of real spending and real gdp over the period 1990-2005 is much higher in Latin America than in Asia. Moreover, Gavin and Perotti (1997) find that government expenditure has been markedly more procyclical in Latin America than in industrialized countries.
There is no evidence that the reaction of expenditures to macroeconomic developments differs during economic upswings and downswings. Recent research has emphasized the asymmetrical behaviour of fiscal policy in developing countries (imf, 2007). To assess the importance of this phenomenon in Latin America, the relationship between changes in output gaps and spending during good times (when output is above potential) and bad times (when output is below potential) was assessed on the basis of data on government spending, using the broadest definition of government available. The logarithm (log) of the terms of trade was also added to the model to capture the effects of changes in the external environment. Results were estimated with both
18 The average coefficient (including for those estimates that were statistically insignificant) was generally lower, but still exceeded 1.0 for primary spending, other goods and services, and capital outlays.
A comprehensive examination of the entire range of expenditure policy issues, including those related to public pension systems, would be outside the scope of this article.13 In what follows below, we provide an overview of some of the key issues that are central to the debate on how to implement more pro-growth, pro-poor expenditure policies in the region.
1. Cyclicality of government spending
Procyclical fiscal policy has precluded a more rapid decline of public debt and reduction of vulnerabilities during economic recoveries. A number of studies have delineated the region’s propensity for procyclical expenditure policies.14 Spending trends in the recent recovery, notably the brisk acceleration of spending over the past two years, suggest that the region has not fully escaped its legacy of procyclical fiscal policy.
The cyclicality of spending varies across countries. Akitoby, Clements et al. (2006), for example, identify the short- and long-term relationship between real gdp growth and various categories of central government spending on a country-by-country basis. Their findings indicate that in about two thirds of Latin American countries, there is a statistically significant short-term relationship between gdp shocks and real primary expenditure, with spending and output moving procyclically – that is, in the same direction (table 1).15, 16 The results suggest that expenditure has been especially procyclical in Costa Rica, Guatemala and the Venezuela (Bolivarian Republic of).17
13 Recent works addressing this subject include Gill, Packard and Yermo (2005) and Roldos (2006).14 Among others, Gavin and Perotti (1997); Stein, Talvi and Grisanti (1998); Kaminsky, Reinhart and Végh (2004); Alesina and Tabellini (2005); Talvi and Végh (2005); Akitoby, Clements et al. (2006); Singh and Cerisola (2006); and Sahay and Goyal (2006).15 This differs from the traditional approach to defining and measuring cyclicality, which assesses the cyclical position of the economy more than output shocks. See appendix A for further details. 16 The possible endogeneity between spending and output was examined by performing a Durbin-Wu-Hausman test, using the first lag of output growth as an instrument. The figures reported in table 1 exclude any results where, based on this test, endogeneity might be a concern.17 See Kaminsky, Reinhart, and Végh (2004) and Sahay and Goyal (2006) for an assessment of the relationship between the growth of real spending and output by country.
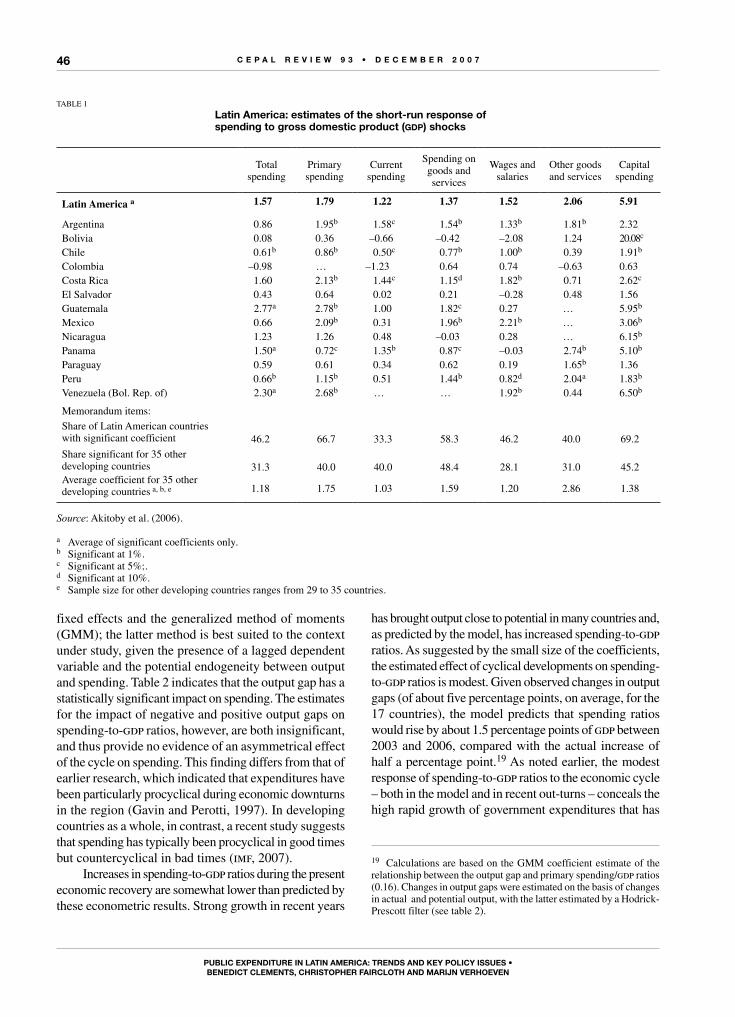
C E P A L R E V I E W 9 3 • D E C E M B E R 2 0 0 7
PuBLIC ExPEnDItuRE In LAtIn AMERICA: tREnDs AnD kEy PoLICy IssuEs •BEnEDICt CLEMEnts, ChRIstoPhER FAIRCLoth AnD MARIjn VERhoEVEn
46
fixed effects and the generalized method of moments (GMM); the latter method is best suited to the context under study, given the presence of a lagged dependent variable and the potential endogeneity between output and spending. Table 2 indicates that the output gap has a statistically significant impact on spending. The estimates for the impact of negative and positive output gaps on spending-to-gdp ratios, however, are both insignificant, and thus provide no evidence of an asymmetrical effect of the cycle on spending. This finding differs from that of earlier research, which indicated that expenditures have been particularly procyclical during economic downturns in the region (Gavin and Perotti, 1997). In developing countries as a whole, in contrast, a recent study suggests that spending has typically been procyclical in good times but countercyclical in bad times (imf, 2007).
Increases in spending-to-gdp ratios during the present economic recovery are somewhat lower than predicted by these econometric results. Strong growth in recent years
has brought output close to potential in many countries and, as predicted by the model, has increased spending-to-gdp ratios. As suggested by the small size of the coefficients, the estimated effect of cyclical developments on spending-to-gdp ratios is modest. Given observed changes in output gaps (of about five percentage points, on average, for the 17 countries), the model predicts that spending ratios would rise by about 1.5 percentage points of gdp between 2003 and 2006, compared with the actual increase of half a percentage point.19 As noted earlier, the modest response of spending-to-gdp ratios to the economic cycle – both in the model and in recent out-turns – conceals the high rapid growth of government expenditures that has
19 Calculations are based on the GMM coefficient estimate of the relationship between the output gap and primary spending/gdp ratios (0.16). Changes in output gaps were estimated on the basis of changes in actual and potential output, with the latter estimated by a Hodrick-Prescott filter (see table 2).
TABLE 1
Latin America: estimates of the short-run response of spending to gross domestic product (gdp) shocks
Total spending
Primary spending
Current spending
Spending on goods andservices
Wages and salaries
Other goods and services
Capital spending
Latin America a 1.57 1.79 1.22 1.37 1.52 2.06 5.91
Argentina 0.86 1.95b 1.58c 1.54b 1.33b 1.81b 2.32Bolivia 0.08 0.36 –0.66 –0.42 –2.08 1.24 20.08c
Chile 0.61b 0.86b 0.50c 0.77b 1.00b 0.39 1.91b
Colombia –0.98 … –1.23 0.64 0.74 –0.63 0.63Costa Rica 1.60 2.13b 1.44c 1.15d 1.82b 0.71 2.62c
El Salvador 0.43 0.64 0.02 0.21 –0.28 0.48 1.56Guatemala 2.77a 2.78b 1.00 1.82c 0.27 … 5.95b
Mexico 0.66 2.09b 0.31 1.96b 2.21b … 3.06b
Nicaragua 1.23 1.26 0.48 –0.03 0.28 … 6.15b
Panama 1.50a 0.72c 1.35b 0.87c –0.03 2.74b 5.10b
Paraguay 0.59 0.61 0.34 0.62 0.19 1.65b 1.36Peru 0.66b 1.15b 0.51 1.44b 0.82d 2.04a 1.83b
Venezuela (Bol. Rep. of) 2.30a 2.68b … … 1.92b 0.44 6.50b
Memorandum items:
Share of Latin American countries with significant coefficient 46.2 66.7 33.3 58.3 46.2 40.0 69.2
Share significant for 35 other developing countries 31.3 40.0 40.0 48.4 28.1 31.0 45.2Average coefficient for 35 other developing countries a, b, e 1.18 1.75 1.03 1.59 1.20 2.86 1.38
Source: Akitoby et al. (2006).
a Average of significant coefficients only.b Significant at 1%.c Significant at 5%;.d Significant at 10%.e Sample size for other developing countries ranges from 29 to 35 countries.
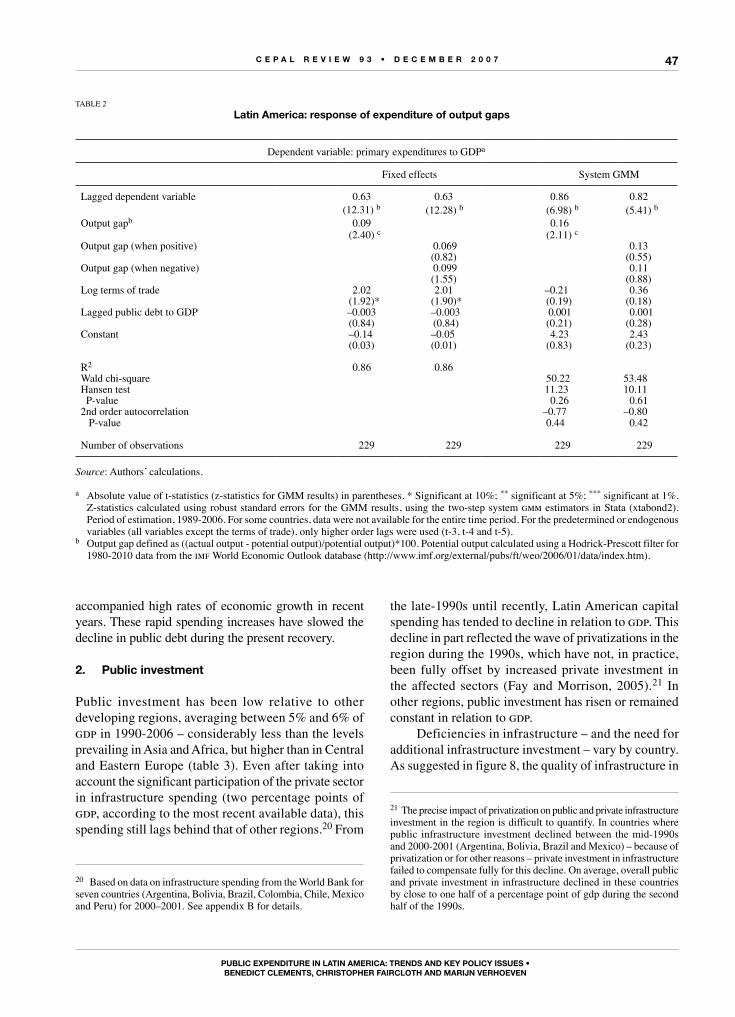
C E P A L R E V I E W 9 3 • D E C E M B E R 2 0 0 7
PuBLIC ExPEnDItuRE In LAtIn AMERICA: tREnDs AnD kEy PoLICy IssuEs •BEnEDICt CLEMEnts, ChRIstoPhER FAIRCLoth AnD MARIjn VERhoEVEn
47
accompanied high rates of economic growth in recent years. These rapid spending increases have slowed the decline in public debt during the present recovery.
2. Public investment
Public investment has been low relative to other developing regions, averaging between 5% and 6% of gdp in 1990-2006 – considerably less than the levels prevailing in Asia and Africa, but higher than in Central and Eastern Europe (table 3). Even after taking into account the significant participation of the private sector in infrastructure spending (two percentage points of gdp, according to the most recent available data), this spending still lags behind that of other regions.20 From
20 Based on data on infrastructure spending from the World Bank for seven countries (Argentina, Bolivia, Brazil, Colombia, Chile, Mexico and Peru) for 2000–2001. See appendix B for details.
the late-1990s until recently, Latin American capital spending has tended to decline in relation to gdp. This decline in part reflected the wave of privatizations in the region during the 1990s, which have not, in practice, been fully offset by increased private investment in the affected sectors (Fay and Morrison, 2005).21 In other regions, public investment has risen or remained constant in relation to gdp.
Deficiencies in infrastructure – and the need for additional infrastructure investment – vary by country. As suggested in figure 8, the quality of infrastructure in
21 The precise impact of privatization on public and private infrastructure investment in the region is difficult to quantify. In countries where public infrastructure investment declined between the mid-1990s and 2000-2001 (Argentina, Bolivia, Brazil and Mexico) – because of privatization or for other reasons – private investment in infrastructure failed to compensate fully for this decline. On average, overall public and private investment in infrastructure declined in these countries by close to one half of a percentage point of gdp during the second half of the 1990s.
TABLE 2
Latin America: response of expenditure of output gaps
Dependent variable: primary expenditures to gDPa
Fixed effects System gMM
Lagged dependent variable 0.63 0.63 0.86 0.82(12.31) b (12.28) b (6.98) b (5.41) b
Output gapb 0.09 0.16(2.40) c (2.11) c
Output gap (when positive) 0.069 0.13(0.82) (0.55)
Output gap (when negative) 0.099 0.11(1.55) (0.88)
Log terms of trade 2.02 2.01 –0.21 0.36(1.92)* (1.90)* (0.19) (0.18)
Lagged public debt to GDP –0.003 –0.003 0.001 0.001(0.84) (0.84) (0.21) (0.28)
Constant –0.14 –0.05 4.23 2.43(0.03) (0.01) (0.83) (0.23)
R2 0.86 0.86Wald chi-square 50.22 53.48Hansen test 11.23 10.11 P-value 0.26 0.612nd order autocorrelation –0.77 –0.80 P-value 0.44 0.42
Number of observations 229 229 229 229
Source: Authors’ calculations.
a Absolute value of t-statistics (z-statistics for gMM results) in parentheses. * Significant at 10%; ** significant at 5%; *** significant at 1%. Z-statistics calculated using robust standard errors for the gMM results, using the two-step system gmm estimators in Stata (xtabond2). Period of estimation, 1989-2006. For some countries, data were not available for the entire time period. For the predetermined or endogenous variables (all variables except the terms of trade), only higher order lags were used (t-3, t-4 and t-5).
b Output gap defined as ((actual output - potential output)/potential output)*100. Potential output calculated using a Hodrick-Prescott filter for 1980-2010 data from the imf World Economic Outlook database (http://www.imf.org/external/pubs/ft/weo/2006/01/data/index.htm).
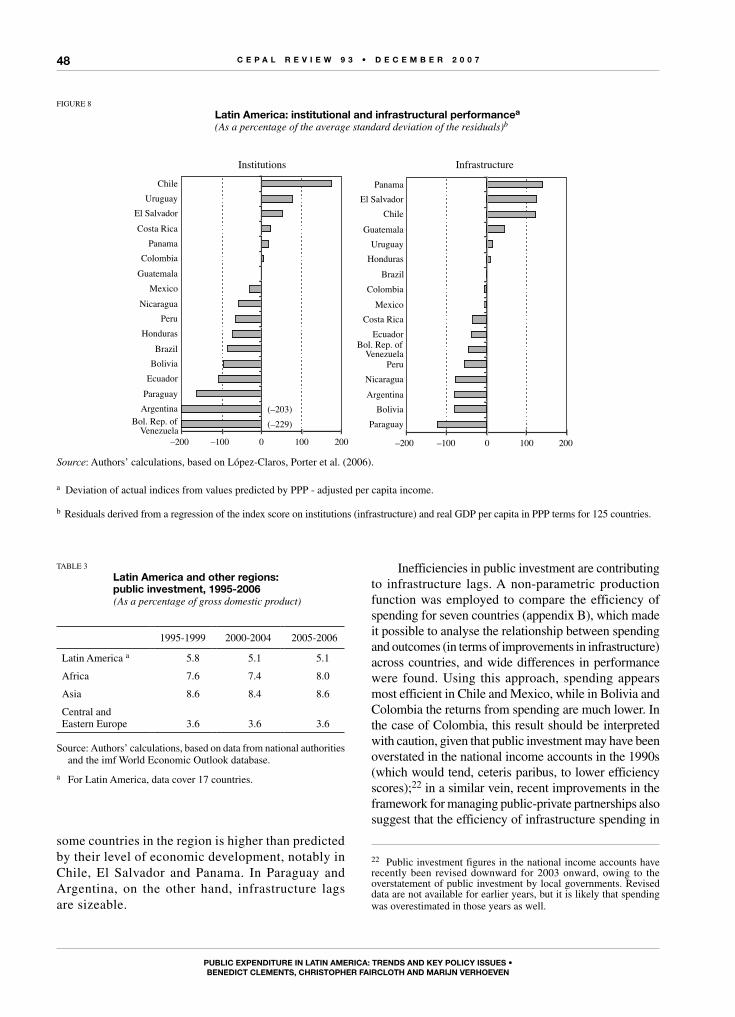
C E P A L R E V I E W 9 3 • D E C E M B E R 2 0 0 7
PuBLIC ExPEnDItuRE In LAtIn AMERICA: tREnDs AnD kEy PoLICy IssuEs •BEnEDICt CLEMEnts, ChRIstoPhER FAIRCLoth AnD MARIjn VERhoEVEn
48
some countries in the region is higher than predicted by their level of economic development, notably in Chile, El Salvador and Panama. In Paraguay and Argentina, on the other hand, infrastructure lags are sizeable.
FIGURE 8
Latin America: institutional and infrastructural performancea
(As a percentage of the average standard deviation of the residuals)b
ChileUruguay
El SalvadorCosta Rica
PanamaColombia
GuatemalaMexico
NicaraguaPeru
HondurasBrazil
BoliviaEcuador
ParaguayArgentina
Bol. Rep. ofVenezuela
–200 –100 0 100 200
Institutions
(–229)(–203)
PanamaEl Salvador
ChileGuatemala
UruguayHonduras
BrazilColombia
MexicoCosta Rica
EcuadorBol. Rep. of
VenezuelaPeru
NicaraguaArgentina
BoliviaParaguay
–200 –100 0 100 200
Infrastructure
Source: Authors’ calculations, based on López-Claros, Porter et al. (2006).
a Deviation of actual indices from values predicted by PPP - adjusted per capita income.
b Residuals derived from a regression of the index score on institutions (infrastructure) and real GDP per capita in PPP terms for 125 countries.
TABLE 3
Latin America and other regions: public investment, 1995-2006(As a percentage of gross domestic product)
1995-1999 2000-2004 2005-2006
Latin America a 5.8 5.1 5.1
Africa 7.6 7.4 8.0
Asia 8.6 8.4 8.6
Central and Eastern Europe 3.6 3.6 3.6
Source: Authors’ calculations, based on data from national authorities and the imf World Economic Outlook database.
a For Latin America, data cover 17 countries.
Inefficiencies in public investment are contributing to infrastructure lags. A non-parametric production function was employed to compare the efficiency of spending for seven countries (appendix B), which made it possible to analyse the relationship between spending and outcomes (in terms of improvements in infrastructure) across countries, and wide differences in performance were found. Using this approach, spending appears most efficient in Chile and Mexico, while in Bolivia and Colombia the returns from spending are much lower. In the case of Colombia, this result should be interpreted with caution, given that public investment may have been overstated in the national income accounts in the 1990s (which would tend, ceteris paribus, to lower efficiency scores);22 in a similar vein, recent improvements in the framework for managing public-private partnerships also suggest that the efficiency of infrastructure spending in
22 Public investment figures in the national income accounts have recently been revised downward for 2003 onward, owing to the overstatement of public investment by local governments. Revised data are not available for earlier years, but it is likely that spending was overestimated in those years as well.
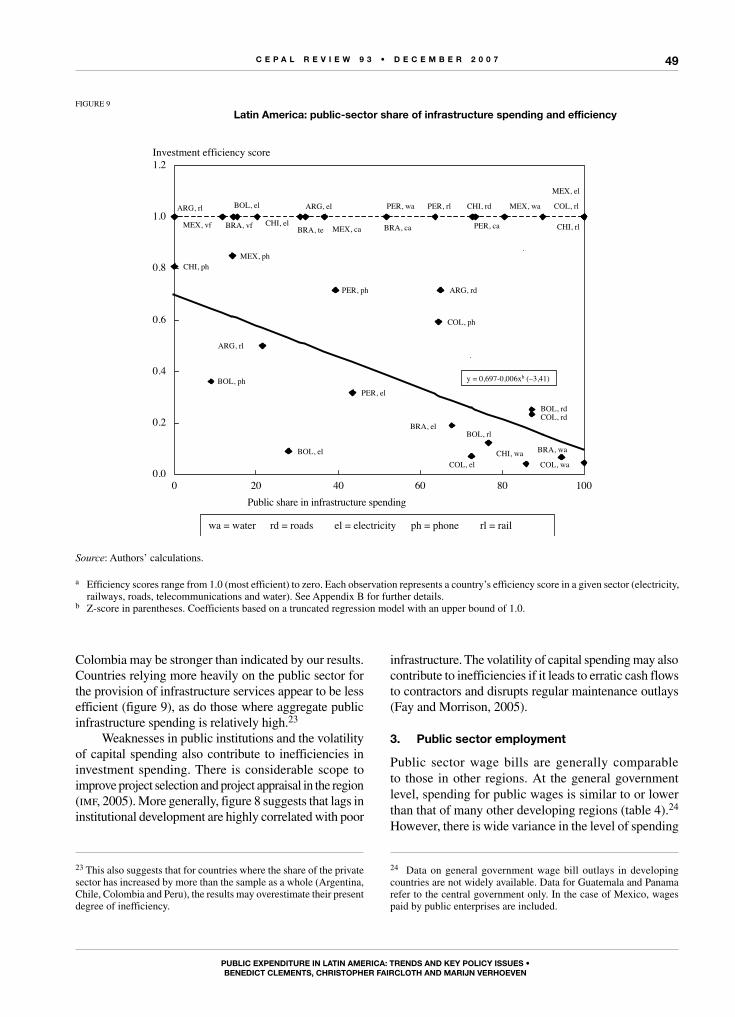
C E P A L R E V I E W 9 3 • D E C E M B E R 2 0 0 7
PuBLIC ExPEnDItuRE In LAtIn AMERICA: tREnDs AnD kEy PoLICy IssuEs •BEnEDICt CLEMEnts, ChRIstoPhER FAIRCLoth AnD MARIjn VERhoEVEn
49
Colombia may be stronger than indicated by our results. Countries relying more heavily on the public sector for the provision of infrastructure services appear to be less efficient (figure 9), as do those where aggregate public infrastructure spending is relatively high.23
Weaknesses in public institutions and the volatility of capital spending also contribute to inefficiencies in investment spending. There is considerable scope to improve project selection and project appraisal in the region (imf, 2005). More generally, figure 8 suggests that lags in institutional development are highly correlated with poor
23 This also suggests that for countries where the share of the private sector has increased by more than the sample as a whole (Argentina, Chile, Colombia and Peru), the results may overestimate their present degree of inefficiency.
infrastructure. The volatility of capital spending may also contribute to inefficiencies if it leads to erratic cash flows to contractors and disrupts regular maintenance outlays (Fay and Morrison, 2005).
3. Public sector employment
Public sector wage bills are generally comparable to those in other regions. At the general government level, spending for public wages is similar to or lower than that of many other developing regions (table 4).24 However, there is wide variance in the level of spending
24 Data on general government wage bill outlays in developing countries are not widely available. Data for Guatemala and Panama refer to the central government only. In the case of Mexico, wages paid by public enterprises are included.
FIGURE 9
Latin America: public-sector share of infrastructure spending and efficiency
CHI, ph
ARG, rl
BOL, ph
MEX, vf
MEX, ph
BRA, vf
BOL, el
CHI, el
ARG, rl
BOL, el
BRA, te
ARG, el
MEX, ca
PER, ph
PER, el
BRA, ca
PER, wa
COL, ph
ARG, rd
BRA, el
COL, el
PER, ca
PER, rl
BOL, rl
CHI, rd
CHI, wa
BOL, rd
MEX, wa
COL, rd
BRA, wa
COL, rl
CHI, rl
COL, wa
MEX, el
0.0
0.2
0.4
0.6
0.8
1.0
1.2
0 20 40 60 80 100Public share in infrastructure spending
Investment efficiency score
el = electricity ph = phonerd = roads rl = railwa = water
y = 0,697-0,006xb (–3,41)
Source: Authors’ calculations.
a Efficiency scores range from 1.0 (most efficient) to zero. Each observation represents a country’s efficiency score in a given sector (electricity, railways, roads, telecommunications and water). See Appendix B for further details.
b Z-score in parentheses. Coefficients based on a truncated regression model with an upper bound of 1.0.
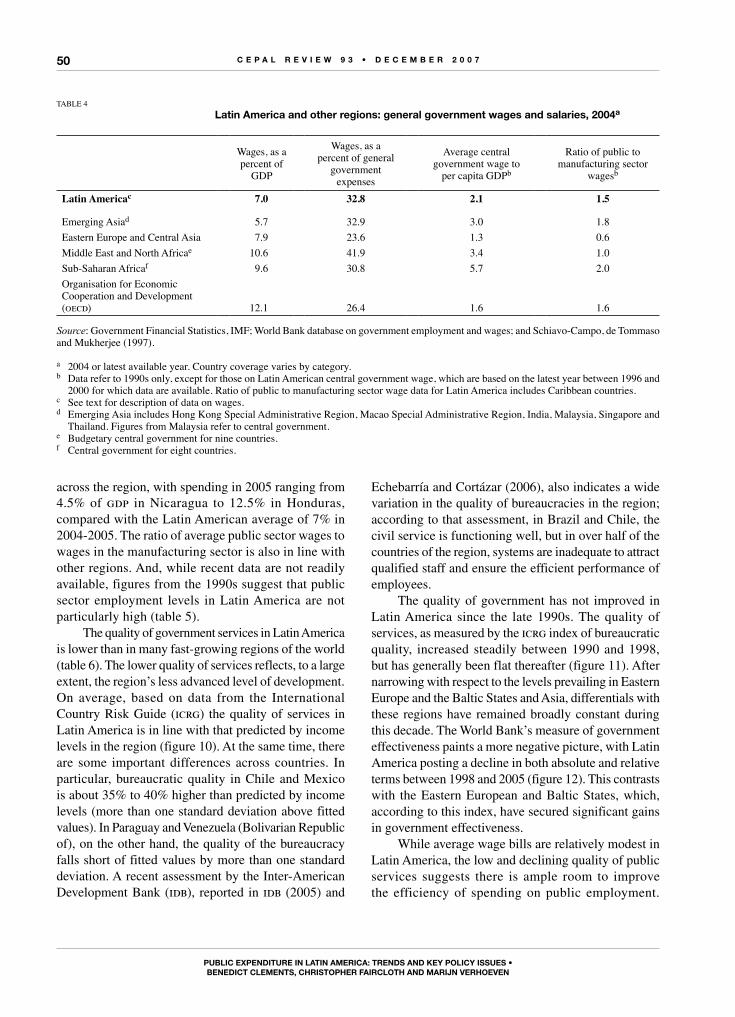
C E P A L R E V I E W 9 3 • D E C E M B E R 2 0 0 7
PuBLIC ExPEnDItuRE In LAtIn AMERICA: tREnDs AnD kEy PoLICy IssuEs •BEnEDICt CLEMEnts, ChRIstoPhER FAIRCLoth AnD MARIjn VERhoEVEn
50
across the region, with spending in 2005 ranging from 4.5% of gdp in Nicaragua to 12.5% in Honduras, compared with the Latin American average of 7% in 2004-2005. The ratio of average public sector wages to wages in the manufacturing sector is also in line with other regions. And, while recent data are not readily available, figures from the 1990s suggest that public sector employment levels in Latin America are not particularly high (table 5).
The quality of government services in Latin America is lower than in many fast-growing regions of the world (table 6). The lower quality of services reflects, to a large extent, the region’s less advanced level of development. On average, based on data from the International Country Risk Guide (icrg) the quality of services in Latin America is in line with that predicted by income levels in the region (figure 10). At the same time, there are some important differences across countries. In particular, bureaucratic quality in Chile and Mexico is about 35% to 40% higher than predicted by income levels (more than one standard deviation above fitted values). In Paraguay and Venezuela (Bolivarian Republic of), on the other hand, the quality of the bureaucracy falls short of fitted values by more than one standard deviation. A recent assessment by the Inter-American Development Bank (idb), reported in idb (2005) and
Echebarría and Cortázar (2006), also indicates a wide variation in the quality of bureaucracies in the region; according to that assessment, in Brazil and Chile, the civil service is functioning well, but in over half of the countries of the region, systems are inadequate to attract qualified staff and ensure the efficient performance of employees.
The quality of government has not improved in Latin America since the late 1990s. The quality of services, as measured by the icrg index of bureaucratic quality, increased steadily between 1990 and 1998, but has generally been flat thereafter (figure 11). After narrowing with respect to the levels prevailing in Eastern Europe and the Baltic States and Asia, differentials with these regions have remained broadly constant during this decade. The World Bank’s measure of government effectiveness paints a more negative picture, with Latin America posting a decline in both absolute and relative terms between 1998 and 2005 (figure 12). This contrasts with the Eastern European and Baltic States, which, according to this index, have secured significant gains in government effectiveness.
While average wage bills are relatively modest in Latin America, the low and declining quality of public services suggests there is ample room to improve the efficiency of spending on public employment.
TABLE 4
Latin America and other regions: general government wages and salaries, 2004a
Wages, as a percent of
gDP
Wages, as apercent of general
governmentexpenses
Average centralgovernment wage to
per capita gDPb
Ratio of public tomanufacturing sector
wagesb
Latin Americac 7.0 32.8 2.1 1.5
Emerging Asiad 5.7 32.9 3.0 1.8
Eastern Europe and Central Asia 7.9 23.6 1.3 0.6
Middle East and North Africae 10.6 41.9 3.4 1.0
Sub-Saharan Africaf 9.6 30.8 5.7 2.0
Organisation for Economic Cooperation and Development (oecd) 12.1 26.4 1.6 1.6
Source: government Financial Statistics, IMF; World Bank database on government employment and wages; and Schiavo-Campo, de Tommaso and Mukherjee (1997).
a 2004 or latest available year. Country coverage varies by category.b Data refer to 1990s only, except for those on Latin American central government wage, which are based on the latest year between 1996 and
2000 for which data are available. Ratio of public to manufacturing sector wage data for Latin America includes Caribbean countries.c See text for description of data on wages.d Emerging Asia includes Hong Kong Special Administrative Region, Macao Special Administrative Region, India, Malaysia, Singapore and
Thailand. Figures from Malaysia refer to central government.e Budgetary central government for nine countries.f Central government for eight countries.
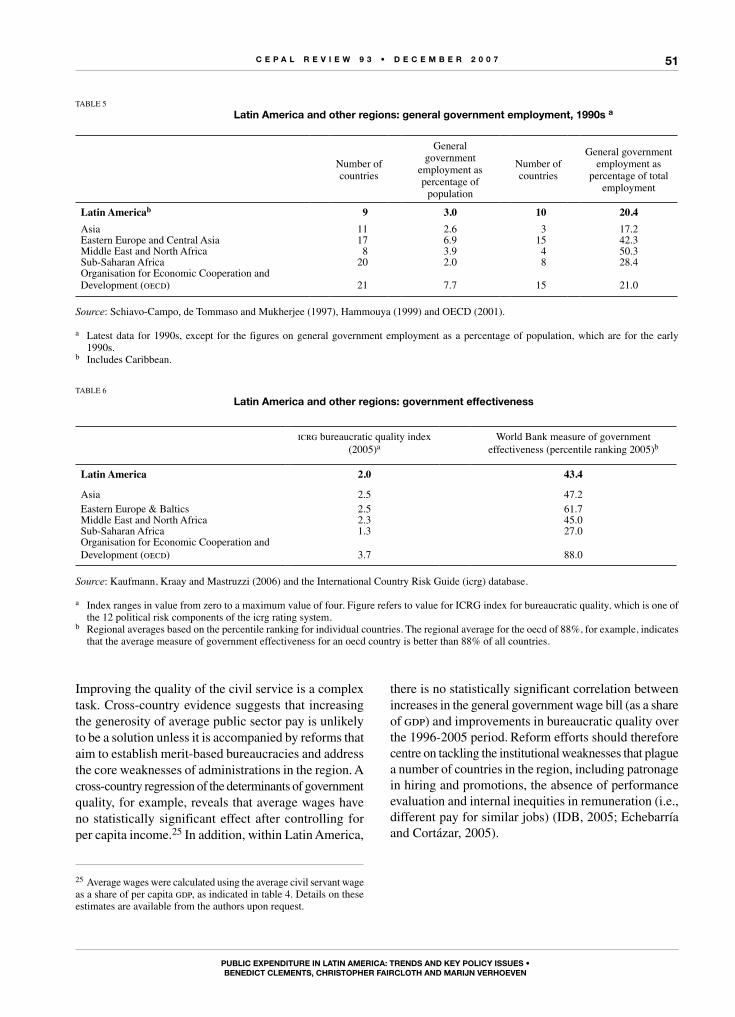
C E P A L R E V I E W 9 3 • D E C E M B E R 2 0 0 7
PuBLIC ExPEnDItuRE In LAtIn AMERICA: tREnDs AnD kEy PoLICy IssuEs •BEnEDICt CLEMEnts, ChRIstoPhER FAIRCLoth AnD MARIjn VERhoEVEn
51
TABLE 5
Latin America and other regions: general government employment, 1990s a
Number of countries
general government
employment as percentage of
population
Number of countries
general government employment as
percentage of total employment
Latin Americab 9 3.0 10 20.4Asia 11 2.6 3 17.2Eastern Europe and Central Asia 17 6.9 15 42.3Middle East and North Africa 8 3.9 4 50.3Sub-Saharan Africa 20 2.0 8 28.4Organisation for Economic Cooperation and Development (oecd) 21 7.7 15 21.0
Source: Schiavo-Campo, de Tommaso and Mukherjee (1997), Hammouya (1999) and OECD (2001).
a Latest data for 1990s, except for the figures on general government employment as a percentage of population, which are for the early 1990s.
b Includes Caribbean.
Improving the quality of the civil service is a complex task. Cross-country evidence suggests that increasing the generosity of average public sector pay is unlikely to be a solution unless it is accompanied by reforms that aim to establish merit-based bureaucracies and address the core weaknesses of administrations in the region. A cross-country regression of the determinants of government quality, for example, reveals that average wages have no statistically significant effect after controlling for per capita income.25 In addition, within Latin America,
25 Average wages were calculated using the average civil servant wage as a share of per capita gdp, as indicated in table 4. Details on these estimates are available from the authors upon request.
there is no statistically significant correlation between increases in the general government wage bill (as a share of gdp) and improvements in bureaucratic quality over the 1996-2005 period. Reform efforts should therefore centre on tackling the institutional weaknesses that plague a number of countries in the region, including patronage in hiring and promotions, the absence of performance evaluation and internal inequities in remuneration (i.e., different pay for similar jobs) (IDB, 2005; Echebarría and Cortázar, 2005).
TABLE 6
Latin America and other regions: government effectiveness
icrg bureaucratic quality index
(2005)aWorld Bank measure of government
effectiveness (percentile ranking 2005)b
Latin America 2.0 43.4
Asia 2.5 47.2Eastern Europe & Baltics 2.5 61.7Middle East and North Africa 2.3 45.0Sub-Saharan Africa 1.3 27.0Organisation for Economic Cooperation and Development (oecd) 3.7 88.0
Source: Kaufmann, Kraay and Mastruzzi (2006) and the International Country Risk guide (icrg) database.
a Index ranges in value from zero to a maximum value of four. Figure refers to value for ICRg index for bureaucratic quality, which is one of the 12 political risk components of the icrg rating system.
b Regional averages based on the percentile ranking for individual countries. The regional average for the oecd of 88%, for example, indicates that the average measure of government effectiveness for an oecd country is better than 88% of all countries.
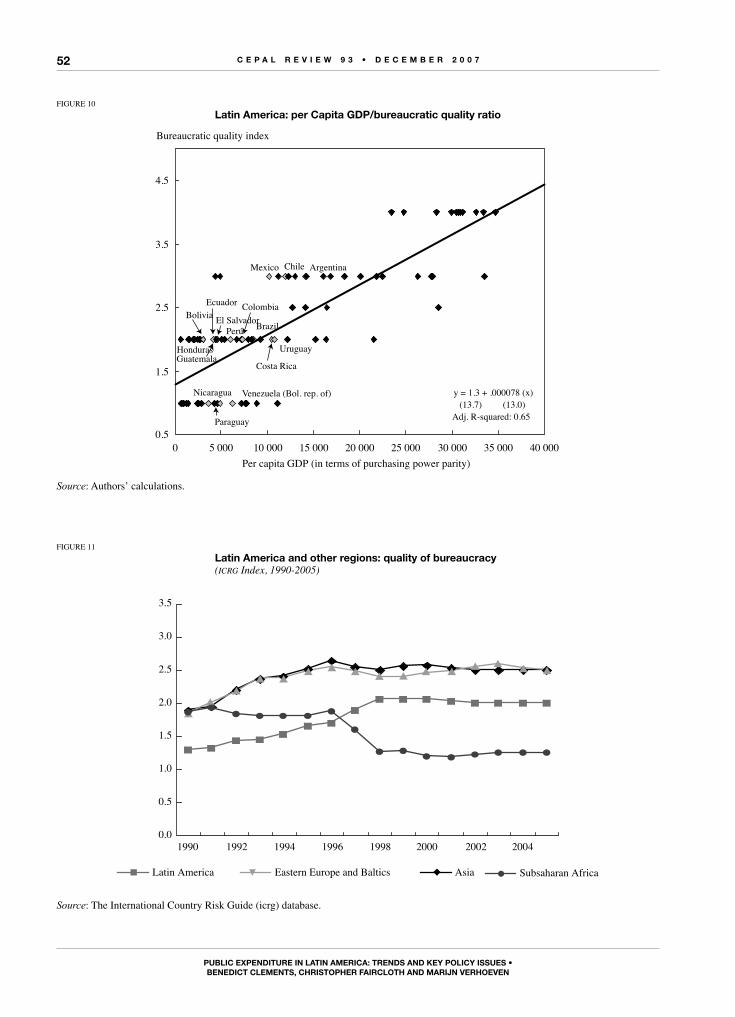
C E P A L R E V I E W 9 3 • D E C E M B E R 2 0 0 7
PuBLIC ExPEnDItuRE In LAtIn AMERICA: tREnDs AnD kEy PoLICy IssuEs •BEnEDICt CLEMEnts, ChRIstoPhER FAIRCLoth AnD MARIjn VERhoEVEn
52
FIGURE 10
Latin America: per Capita gdp/bureaucratic quality ratio
Bolivia
Uruguay
Venezuela (Bol. rep. of)
Perú
Paraguay
Argentina
Brazil
Chile
Colombia
Costa Rica
Ecuador
El Salvador
GuatemalaHonduras
Mexico
Nicaragua
0.5
1.5
2.5
3.5
4.5
0 5 000 10 000 15 000 20 000 25 000 30 000 35 000 40 000Per capita GDP (in terms of purchasing power parity)
Bureaucratic quality index
y = 1.3 + .000078 (x)(13.7) (13.0)
Adj. R-squared: 0.65
Source: Authors’ calculations.
FIGURE 11
Latin America and other regions: quality of bureaucracy(icrg Index, 1990-2005)
0.0
0.5
1.0
1.5
2.0
2.5
3.0
3.5
1990 1992 1994 1996 1998 2000 2002 2004
Latin America AsiaEastern Europe and Baltics Subsaharan Africa
Source: The International Country Risk Guide (icrg) database.
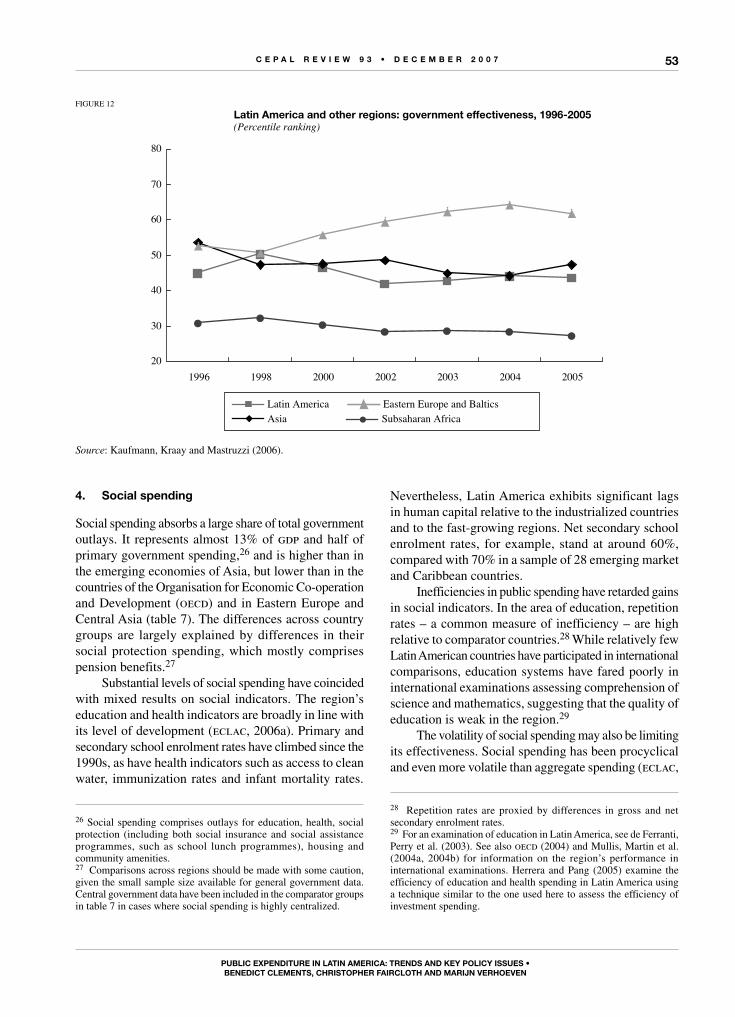
C E P A L R E V I E W 9 3 • D E C E M B E R 2 0 0 7
PuBLIC ExPEnDItuRE In LAtIn AMERICA: tREnDs AnD kEy PoLICy IssuEs •BEnEDICt CLEMEnts, ChRIstoPhER FAIRCLoth AnD MARIjn VERhoEVEn
53
FIGURE 12
Latin America and other regions: government effectiveness, 1996-2005(Percentile ranking)
Latin AmericaAsia
Eastern Europe and BalticsSubsaharan Africa
20
30
40
50
60
70
80
1996 1998 2000 2002 2003 2004 2005
Source: Kaufmann, Kraay and Mastruzzi (2006).
4. social spending
Social spending absorbs a large share of total government outlays. It represents almost 13% of gdp and half of primary government spending,26 and is higher than in the emerging economies of Asia, but lower than in the countries of the Organisation for Economic Co-operation and Development (oecd) and in Eastern Europe and Central Asia (table 7). The differences across country groups are largely explained by differences in their social protection spending, which mostly comprises pension benefits.27
Substantial levels of social spending have coincided with mixed results on social indicators. The region’s education and health indicators are broadly in line with its level of development (eclac, 2006a). Primary and secondary school enrolment rates have climbed since the 1990s, as have health indicators such as access to clean water, immunization rates and infant mortality rates.
26 Social spending comprises outlays for education, health, social protection (including both social insurance and social assistance programmes, such as school lunch programmes), housing and community amenities. 27 Comparisons across regions should be made with some caution, given the small sample size available for general government data. Central government data have been included in the comparator groups in table 7 in cases where social spending is highly centralized.
Nevertheless, Latin America exhibits significant lags in human capital relative to the industrialized countries and to the fast-growing regions. Net secondary school enrolment rates, for example, stand at around 60%, compared with 70% in a sample of 28 emerging market and Caribbean countries.
Inefficiencies in public spending have retarded gains in social indicators. In the area of education, repetition rates – a common measure of inefficiency – are high relative to comparator countries.28 While relatively few Latin American countries have participated in international comparisons, education systems have fared poorly in international examinations assessing comprehension of science and mathematics, suggesting that the quality of education is weak in the region.29
The volatility of social spending may also be limiting its effectiveness. Social spending has been procyclical and even more volatile than aggregate spending (eclac,
28 Repetition rates are proxied by differences in gross and net secondary enrolment rates.29 For an examination of education in Latin America, see de Ferranti, Perry et al. (2003). See also oecd (2004) and Mullis, Martin et al. (2004a, 2004b) for information on the region’s performance in international examinations. Herrera and Pang (2005) examine the efficiency of education and health spending in Latin America using a technique similar to the one used here to assess the efficiency of investment spending.
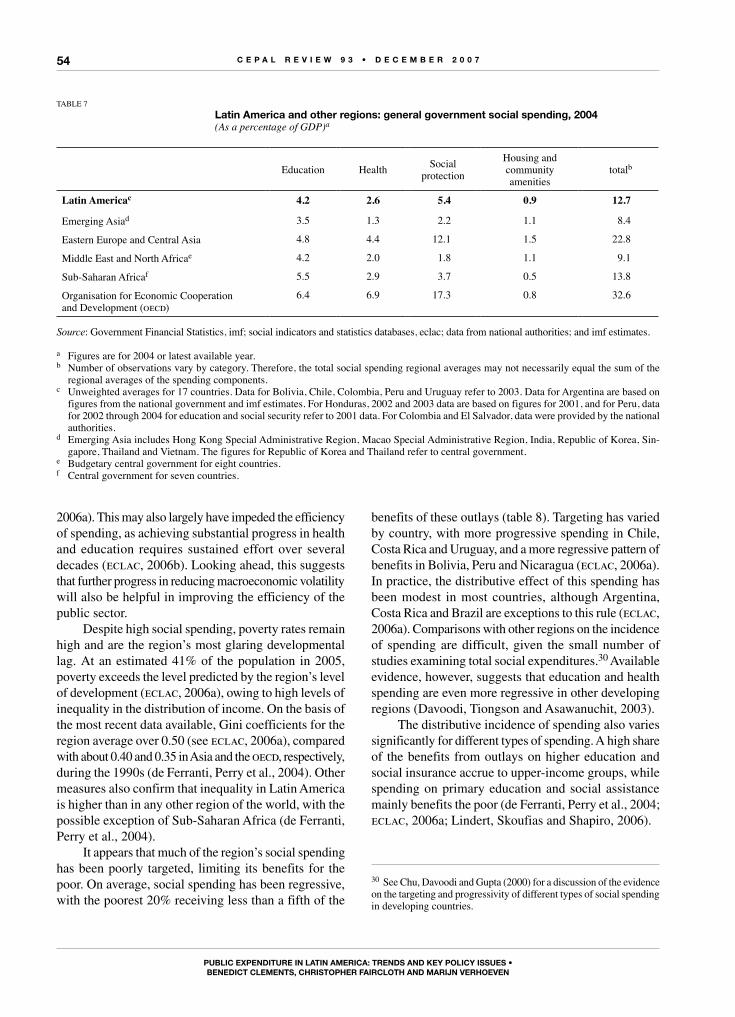
C E P A L R E V I E W 9 3 • D E C E M B E R 2 0 0 7
PuBLIC ExPEnDItuRE In LAtIn AMERICA: tREnDs AnD kEy PoLICy IssuEs •BEnEDICt CLEMEnts, ChRIstoPhER FAIRCLoth AnD MARIjn VERhoEVEn
54
2006a). This may also largely have impeded the efficiency of spending, as achieving substantial progress in health and education requires sustained effort over several decades (eclac, 2006b). Looking ahead, this suggests that further progress in reducing macroeconomic volatility will also be helpful in improving the efficiency of the public sector.
Despite high social spending, poverty rates remain high and are the region’s most glaring developmental lag. At an estimated 41% of the population in 2005, poverty exceeds the level predicted by the region’s level of development (eclac, 2006a), owing to high levels of inequality in the distribution of income. On the basis of the most recent data available, Gini coefficients for the region average over 0.50 (see eclac, 2006a), compared with about 0.40 and 0.35 in Asia and the oecd, respectively, during the 1990s (de Ferranti, Perry et al., 2004). Other measures also confirm that inequality in Latin America is higher than in any other region of the world, with the possible exception of Sub-Saharan Africa (de Ferranti, Perry et al., 2004).
It appears that much of the region’s social spending has been poorly targeted, limiting its benefits for the poor. On average, social spending has been regressive, with the poorest 20% receiving less than a fifth of the
benefits of these outlays (table 8). Targeting has varied by country, with more progressive spending in Chile, Costa Rica and Uruguay, and a more regressive pattern of benefits in Bolivia, Peru and Nicaragua (eclac, 2006a). In practice, the distributive effect of this spending has been modest in most countries, although Argentina, Costa Rica and Brazil are exceptions to this rule (eclac, 2006a). Comparisons with other regions on the incidence of spending are difficult, given the small number of studies examining total social expenditures.30 Available evidence, however, suggests that education and health spending are even more regressive in other developing regions (Davoodi, Tiongson and Asawanuchit, 2003).
The distributive incidence of spending also varies significantly for different types of spending. A high share of the benefits from outlays on higher education and social insurance accrue to upper-income groups, while spending on primary education and social assistance mainly benefits the poor (de Ferranti, Perry et al., 2004; eclac, 2006a; Lindert, Skoufias and Shapiro, 2006).
30 See Chu, Davoodi and Gupta (2000) for a discussion of the evidence on the targeting and progressivity of different types of social spending in developing countries.
TABLE 7
Latin America and other regions: general government social spending, 2004(As a percentage of GDP)a
Education Health Socialprotection
Housing and communityamenities
totalb
Latin Americac 4.2 2.6 5.4 0.9 12.7
Emerging Asiad 3.5 1.3 2.2 1.1 8.4
Eastern Europe and Central Asia 4.8 4.4 12.1 1.5 22.8
Middle East and North Africae 4.2 2.0 1.8 1.1 9.1
Sub-Saharan Africaf 5.5 2.9 3.7 0.5 13.8
Organisation for Economic Cooperation and Development (oecd)
6.4 6.9 17.3 0.8 32.6
Source: government Financial Statistics, imf; social indicators and statistics databases, eclac; data from national authorities; and imf estimates.
a Figures are for 2004 or latest available year.b Number of observations vary by category. Therefore, the total social spending regional averages may not necessarily equal the sum of the
regional averages of the spending components.c Unweighted averages for 17 countries. Data for Bolivia, Chile, Colombia, Peru and Uruguay refer to 2003. Data for Argentina are based on
figures from the national government and imf estimates. For Honduras, 2002 and 2003 data are based on figures for 2001, and for Peru, data for 2002 through 2004 for education and social security refer to 2001 data. For Colombia and El Salvador, data were provided by the national authorities.
d Emerging Asia includes Hong Kong Special Administrative Region, Macao Special Administrative Region, India, Republic of Korea, Sin-gapore, Thailand and Vietnam. The figures for Republic of Korea and Thailand refer to central government.
e Budgetary central government for eight countries.f Central government for seven countries.
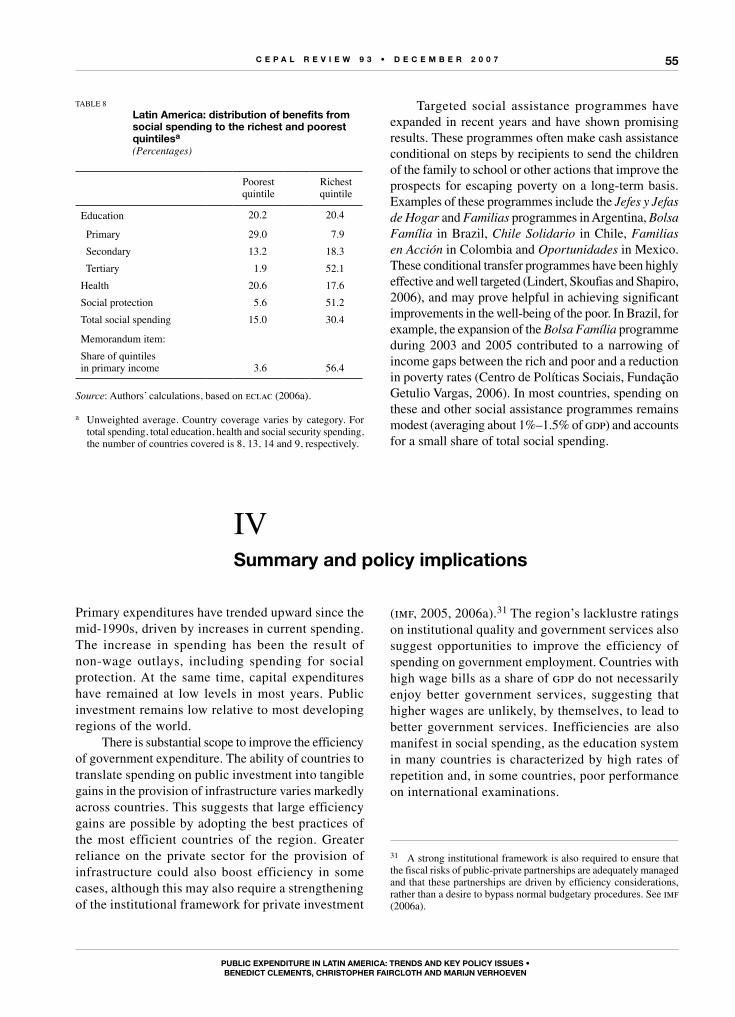
C E P A L R E V I E W 9 3 • D E C E M B E R 2 0 0 7
PuBLIC ExPEnDItuRE In LAtIn AMERICA: tREnDs AnD kEy PoLICy IssuEs •BEnEDICt CLEMEnts, ChRIstoPhER FAIRCLoth AnD MARIjn VERhoEVEn
55
Targeted social assistance programmes have expanded in recent years and have shown promising results. These programmes often make cash assistance conditional on steps by recipients to send the children of the family to school or other actions that improve the prospects for escaping poverty on a long-term basis. Examples of these programmes include the Jefes y Jefas de Hogar and Familias programmes in Argentina, Bolsa Família in Brazil, Chile Solidario in Chile, Familias en Acción in Colombia and Oportunidades in Mexico. These conditional transfer programmes have been highly effective and well targeted (Lindert, Skoufias and Shapiro, 2006), and may prove helpful in achieving significant improvements in the well-being of the poor. In Brazil, for example, the expansion of the Bolsa Família programme during 2003 and 2005 contributed to a narrowing of income gaps between the rich and poor and a reduction in poverty rates (Centro de Políticas Sociais, Fundação Getulio Vargas, 2006). In most countries, spending on these and other social assistance programmes remains modest (averaging about 1%–1.5% of gdp) and accounts for a small share of total social spending.
TABLE 8
Latin America: distribution of benefits from social spending to the richest and poorest quintilesa
(Percentages)
Poorest quintile
Richest quintile
Education 20.2 20.4
Primary 29.0 7.9
Secondary 13.2 18.3
Tertiary 1.9 52.1
Health 20.6 17.6
Social protection 5.6 51.2
Total social spending 15.0 30.4
Memorandum item:Share of quintilesin primary income 3.6 56.4
Source: Authors’ calculations, based on eclac (2006a).
a Unweighted average. Country coverage varies by category. For total spending, total education, health and social security spending, the number of countries covered is 8, 13, 14 and 9, respectively.
IVsummary and policy implications
Primary expenditures have trended upward since the mid-1990s, driven by increases in current spending. The increase in spending has been the result of non-wage outlays, including spending for social protection. At the same time, capital expenditures have remained at low levels in most years. Public investment remains low relative to most developing regions of the world.
There is substantial scope to improve the efficiency of government expenditure. The ability of countries to translate spending on public investment into tangible gains in the provision of infrastructure varies markedly across countries. This suggests that large efficiency gains are possible by adopting the best practices of the most efficient countries of the region. Greater reliance on the private sector for the provision of infrastructure could also boost efficiency in some cases, although this may also require a strengthening of the institutional framework for private investment
(imf, 2005, 2006a).31 The region’s lacklustre ratings on institutional quality and government services also suggest opportunities to improve the efficiency of spending on government employment. Countries with high wage bills as a share of gdp do not necessarily enjoy better government services, suggesting that higher wages are unlikely, by themselves, to lead to better government services. Inefficiencies are also manifest in social spending, as the education system in many countries is characterized by high rates of repetition and, in some countries, poor performance on international examinations.
31 A strong institutional framework is also required to ensure that the fiscal risks of public-private partnerships are adequately managed and that these partnerships are driven by efficiency considerations, rather than a desire to bypass normal budgetary procedures. See imf (2006a).
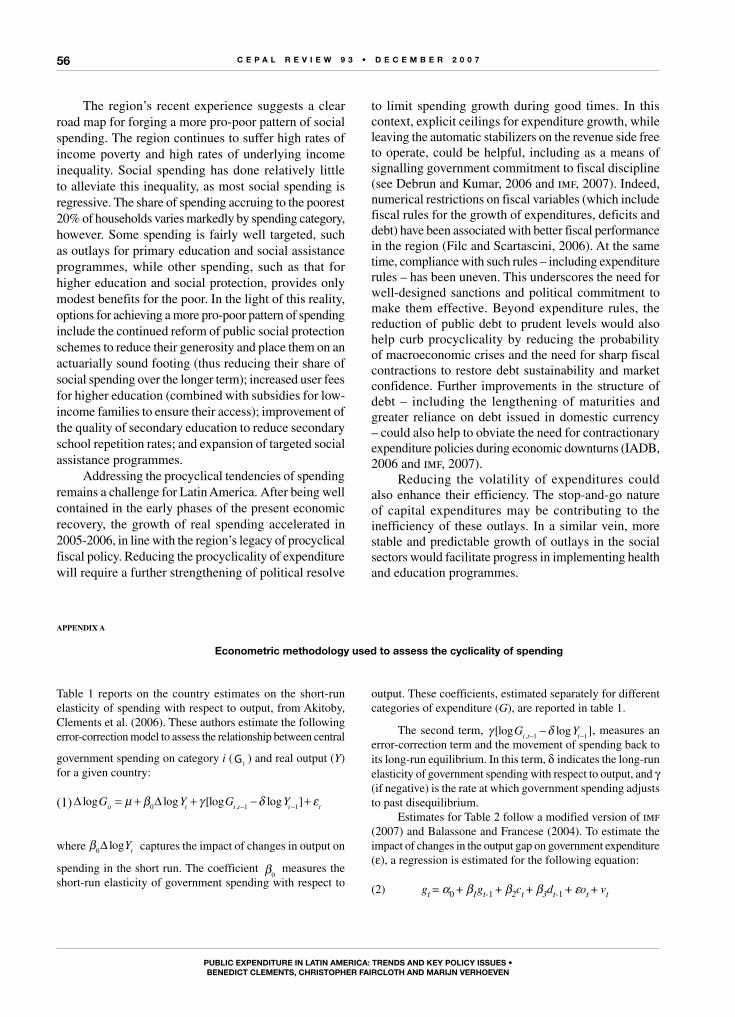
C E P A L R E V I E W 9 3 • D E C E M B E R 2 0 0 7
PuBLIC ExPEnDItuRE In LAtIn AMERICA: tREnDs AnD kEy PoLICy IssuEs •BEnEDICt CLEMEnts, ChRIstoPhER FAIRCLoth AnD MARIjn VERhoEVEn
56
The region’s recent experience suggests a clear road map for forging a more pro-poor pattern of social spending. The region continues to suffer high rates of income poverty and high rates of underlying income inequality. Social spending has done relatively little to alleviate this inequality, as most social spending is regressive. The share of spending accruing to the poorest 20% of households varies markedly by spending category, however. Some spending is fairly well targeted, such as outlays for primary education and social assistance programmes, while other spending, such as that for higher education and social protection, provides only modest benefits for the poor. In the light of this reality, options for achieving a more pro-poor pattern of spending include the continued reform of public social protection schemes to reduce their generosity and place them on an actuarially sound footing (thus reducing their share of social spending over the longer term); increased user fees for higher education (combined with subsidies for low-income families to ensure their access); improvement of the quality of secondary education to reduce secondary school repetition rates; and expansion of targeted social assistance programmes.
Addressing the procyclical tendencies of spending remains a challenge for Latin America. After being well contained in the early phases of the present economic recovery, the growth of real spending accelerated in 2005-2006, in line with the region’s legacy of procyclical fiscal policy. Reducing the procyclicality of expenditure will require a further strengthening of political resolve
to limit spending growth during good times. In this context, explicit ceilings for expenditure growth, while leaving the automatic stabilizers on the revenue side free to operate, could be helpful, including as a means of signalling government commitment to fiscal discipline (see Debrun and Kumar, 2006 and imf, 2007). Indeed, numerical restrictions on fiscal variables (which include fiscal rules for the growth of expenditures, deficits and debt) have been associated with better fiscal performance in the region (Filc and Scartascini, 2006). At the same time, compliance with such rules – including expenditure rules – has been uneven. This underscores the need for well-designed sanctions and political commitment to make them effective. Beyond expenditure rules, the reduction of public debt to prudent levels would also help curb procyclicality by reducing the probability of macroeconomic crises and the need for sharp fiscal contractions to restore debt sustainability and market confidence. Further improvements in the structure of debt – including the lengthening of maturities and greater reliance on debt issued in domestic currency – could also help to obviate the need for contractionary expenditure policies during economic downturns (IADB, 2006 and imf, 2007).
Reducing the volatility of expenditures could also enhance their efficiency. The stop-and-go nature of capital expenditures may be contributing to the inefficiency of these outlays. In a similar vein, more stable and predictable growth of outlays in the social sectors would facilitate progress in implementing health and education programmes.
AppENDIX A
Econometric methodology used to assess the cyclicality of spending
Table 1 reports on the country estimates on the short-run elasticity of spending with respect to output, from Akitoby, Clements et al. (2006). These authors estimate the following error-correction model to assess the relationship between central
government spending on category i ( iG ) and real output (Y) for a given country:
(1) ∆ ∆log log [log log ],G Y G Yit t i t t t= + + − +− −µ β γ δ ε0 1 1
where β0∆ logYt captures the impact of changes in output on
spending in the short run. The coefficient β0 measures the
short-run elasticity of government spending with respect to
output. These coefficients, estimated separately for different categories of expenditure (G), are reported in table 1.
The second term,
[log log ],G Yi t t1 1, measures an
error-correction term and the movement of spending back to its long-run equilibrium. In this term, δ indicates the long-run elasticity of government spending with respect to output, and γ (if negative) is the rate at which government spending adjusts to past disequilibrium.
Estimates for Table 2 follow a modified version of imf (2007) and Balassone and Francese (2004). To estimate the impact of changes in the output gap on government expenditure (ε), a regression is estimated for the following equation:
(2) gt = α0 + β1gt-1 + β2ct + β3dt-1 + εot + vt
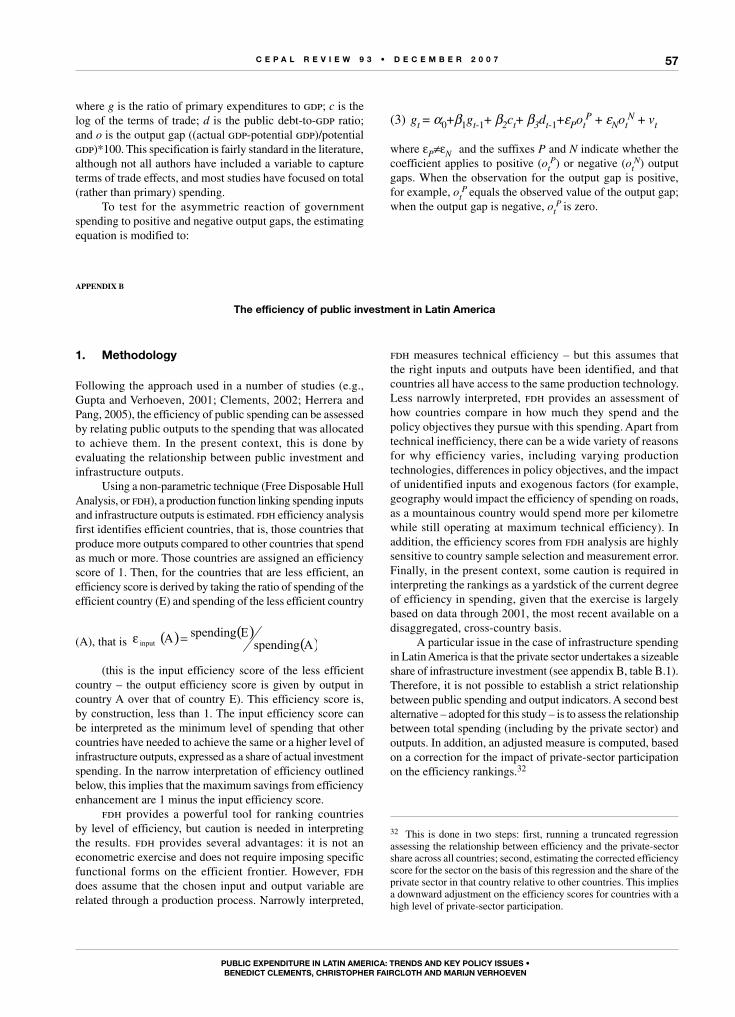
C E P A L R E V I E W 9 3 • D E C E M B E R 2 0 0 7
PuBLIC ExPEnDItuRE In LAtIn AMERICA: tREnDs AnD kEy PoLICy IssuEs •BEnEDICt CLEMEnts, ChRIstoPhER FAIRCLoth AnD MARIjn VERhoEVEn
57
(3) gt = α0+β1gt-1+ β2ct+ β3dt-1+εPotP + εNot
N + vt
where εP≠εN and the suffixes P and N indicate whether the coefficient applies to positive (ot
P) or negative (otN) output
gaps. When the observation for the output gap is positive, for example, ot
P equals the observed value of the output gap; when the output gap is negative, ot
P is zero.
where g is the ratio of primary expenditures to gdp; c is the log of the terms of trade; d is the public debt-to-gdp ratio; and o is the output gap ((actual gdp-potential gdp)/potential gdp)*100. This specification is fairly standard in the literature, although not all authors have included a variable to capture terms of trade effects, and most studies have focused on total (rather than primary) spending.
To test for the asymmetric reaction of government spending to positive and negative output gaps, the estimating equation is modified to:
AppENDIX B
the efficiency of public investment in Latin America
1. Methodology
Following the approach used in a number of studies (e.g., Gupta and Verhoeven, 2001; Clements, 2002; Herrera and Pang, 2005), the efficiency of public spending can be assessed by relating public outputs to the spending that was allocated to achieve them. In the present context, this is done by evaluating the relationship between public investment and infrastructure outputs.
Using a non-parametric technique (Free Disposable Hull Analysis, or fdh), a production function linking spending inputs and infrastructure outputs is estimated. fdh efficiency analysis first identifies efficient countries, that is, those countries that produce more outputs compared to other countries that spend as much or more. Those countries are assigned an efficiency score of 1. Then, for the countries that are less efficient, an efficiency score is derived by taking the ratio of spending of the efficient country (E) and spending of the less efficient country
(A), that is ( ) ( )( )Aspending
EspendingAinput =ε
(this is the input efficiency score of the less efficient country – the output efficiency score is given by output in country A over that of country E). This efficiency score is, by construction, less than 1. The input efficiency score can be interpreted as the minimum level of spending that other countries have needed to achieve the same or a higher level of infrastructure outputs, expressed as a share of actual investment spending. In the narrow interpretation of efficiency outlined below, this implies that the maximum savings from efficiency enhancement are 1 minus the input efficiency score.
fdh provides a powerful tool for ranking countries by level of efficiency, but caution is needed in interpreting the results. fdh provides several advantages: it is not an econometric exercise and does not require imposing specific functional forms on the efficient frontier. However, fdh does assume that the chosen input and output variable are related through a production process. Narrowly interpreted,
fdh measures technical efficiency – but this assumes that the right inputs and outputs have been identified, and that countries all have access to the same production technology. Less narrowly interpreted, fdh provides an assessment of how countries compare in how much they spend and the policy objectives they pursue with this spending. Apart from technical inefficiency, there can be a wide variety of reasons for why efficiency varies, including varying production technologies, differences in policy objectives, and the impact of unidentified inputs and exogenous factors (for example, geography would impact the efficiency of spending on roads, as a mountainous country would spend more per kilometre while still operating at maximum technical efficiency). In addition, the efficiency scores from fdh analysis are highly sensitive to country sample selection and measurement error. Finally, in the present context, some caution is required in interpreting the rankings as a yardstick of the current degree of efficiency in spending, given that the exercise is largely based on data through 2001, the most recent available on a disaggregated, cross-country basis.
A particular issue in the case of infrastructure spending in Latin America is that the private sector undertakes a sizeable share of infrastructure investment (see appendix B, table B.1). Therefore, it is not possible to establish a strict relationship between public spending and output indicators. A second best alternative – adopted for this study – is to assess the relationship between total spending (including by the private sector) and outputs. In addition, an adjusted measure is computed, based on a correction for the impact of private-sector participation on the efficiency rankings.32
32 This is done in two steps: first, running a truncated regression assessing the relationship between efficiency and the private-sector share across all countries; second, estimating the corrected efficiency score for the sector on the basis of this regression and the share of the private sector in that country relative to other countries. This implies a downward adjustment on the efficiency scores for countries with a high level of private-sector participation.
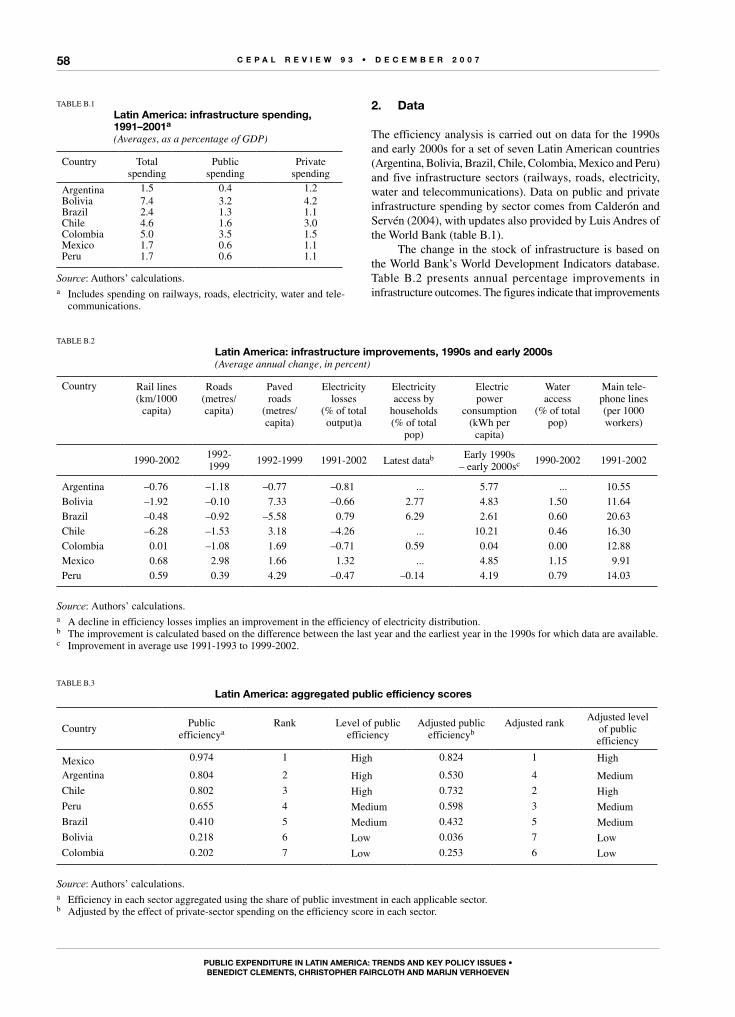
C E P A L R E V I E W 9 3 • D E C E M B E R 2 0 0 7
PuBLIC ExPEnDItuRE In LAtIn AMERICA: tREnDs AnD kEy PoLICy IssuEs •BEnEDICt CLEMEnts, ChRIstoPhER FAIRCLoth AnD MARIjn VERhoEVEn
58
2. Data
The efficiency analysis is carried out on data for the 1990s and early 2000s for a set of seven Latin American countries (Argentina, Bolivia, Brazil, Chile, Colombia, Mexico and Peru) and five infrastructure sectors (railways, roads, electricity, water and telecommunications). Data on public and private infrastructure spending by sector comes from Calderón and Servén (2004), with updates also provided by Luis Andres of the World Bank (table B.1).
The change in the stock of infrastructure is based on the World Bank’s World Development Indicators database. Table B.2 presents annual percentage improvements in infrastructure outcomes. The figures indicate that improvements
TABLE B.1
Latin America: infrastructure spending, 1991–2001a
(Averages, as a percentage of GDP)
Country Total spending
Public spending
Private spending
Argentina 1.5 0.4 1.2Bolivia 7.4 3.2 4.2Brazil 2.4 1.3 1.1Chile 4.6 1.6 3.0Colombia 5.0 3.5 1.5Mexico 1.7 0.6 1.1Peru 1.7 0.6 1.1
Source: Authors’ calculations.a Includes spending on railways, roads, electricity, water and tele-
communications.
TABLE B.2
Latin America: infrastructure improvements, 1990s and early 2000s(Average annual change, in percent)
Country Rail lines (km/1000
capita)
Roads (metres/ capita)
Paved roads
(metres/ capita)
Electricity losses
(% of total output)a
Electricity access by
households (% of total
pop)
Electricpower
consumption (kWh per
capita)
Water access
(% of total pop)
Main tele-phone lines(per 1000 workers)
1990-20021992-1999
1992-1999 1991-2002 Latest datab Early 1990s – early 2000sc 1990-2002 1991-2002
Argentina –0.76 –1.18 –0.77 –0.81 ... 5.77 ... 10.55Bolivia –1.92 –0.10 7.33 –0.66 2.77 4.83 1.50 11.64Brazil –0.48 –0.92 –5.58 0.79 6.29 2.61 0.60 20.63Chile –6.28 –1.53 3.18 –4.26 ... 10.21 0.46 16.30Colombia 0.01 –1.08 1.69 –0.71 0.59 0.04 0.00 12.88Mexico 0.68 2.98 1.66 1.32 ... 4.85 1.15 9.91Peru 0.59 0.39 4.29 –0.47 –0.14 4.19 0.79 14.03
Source: Authors’ calculations.a A decline in efficiency losses implies an improvement in the efficiency of electricity distribution.b The improvement is calculated based on the difference between the last year and the earliest year in the 1990s for which data are available.c Improvement in average use 1991-1993 to 1999-2002.
TABLE B.3
Latin America: aggregated public efficiency scores
Country Public efficiencya
Rank Level of public efficiency
Adjusted public efficiencyb
Adjusted rank Adjusted level of public efficiency
Mexico 0.974 1 High 0.824 1 HighArgentina 0.804 2 High 0.530 4 MediumChile 0.802 3 High 0.732 2 HighPeru 0.655 4 Medium 0.598 3 MediumBrazil 0.410 5 Medium 0.432 5 MediumBolivia 0.218 6 Low 0.036 7 LowColombia 0.202 7 Low 0.253 6 Low
Source: Authors’ calculations.a Efficiency in each sector aggregated using the share of public investment in each applicable sector.b Adjusted by the effect of private-sector spending on the efficiency score in each sector.
C E P A L R E V I E W 9 3 • D E C E M B E R 2 0 0 7
PuBLIC ExPEnDItuRE In LAtIn AMERICA: tREnDs AnD kEy PoLICy IssuEs •BEnEDICt CLEMEnts, ChRIstoPhER FAIRCLoth AnD MARIjn VERhoEVEn
59
Akitoby, Bernardin, Benedict Clements and others (2006): Public spending, voracity, and Wagner’s Law in developing countries, European Journal of Political Economy, vol. 22, Amsterdam, Elsevier.
Alesina, Alberto and Guido Tabellini (2005): Why Is Fiscal Policy So Often Procyclical?, NBER Working Paper, No. 11600, Cambridge, Massachusetts, National Bureau of Economic Research.
Alier, Max (2007): Measuring Budget Rigidities in Latin America, IMF Working Paper, Washington, D.C., International Monetary Fund, forthcoming.
Balassone, Fabrizio and Maura Francese (2004): Cyclical asymmetry in fiscal policy, debt accumulation, and the Treaty of Maastricht, Temi di discussione, No. 531, Rome, Banca d’Italia, December.
BID (Banco Interamericano de Desarrollo) (2005): The Politics of Policies, Washington, D.C.
__________ (2006): Living With Debt: How to Limit the Risks of Sovereign Debt, Washington, D.C.
Calderón, César and Luis Servén (2004): Trends in Infrastructure in Latin America, World Bank Policy Research Paper, No. 3401, Washington, D.C., World Bank.
Centro de Políticas Sociais, Fundação Getulio Vargas (2006): Poverty, inequality, and stability: the second real. Available in http://www.fgv.br/cps/pesquisas/site_ret_eng/.
Clements, Benedict (2002): How efficient is education spending in Europe?, European Review of Economics and Finance, vol. 1, Lisbon, Centro de Investigação sobre Economía Financeira.
Clements, Benedict, Sanjeev Gupta and Gabriela Inchauste (2004): Fiscal policy for development: an overview, in S. Gupta, B. Clements and G. Inchauste (eds.), Helping Countries Develop: The Role of Fiscal Policy, Washington, D.C., International Monetary Fund.
Chu, Ke-young, Hamid Davoodi and Sanjeev Gupta (2000): Income Distribution and Tax, and Government Social Spending Policies in Developing Countries, WIDER Working Paper, No. 214, Helsinki, World Institute for Development Economics Research.
Davoodi, Hamid, Erwin Tiongson and Sawitree Asawanuchit (2003): How Useful Are Benefit Incidence Analyses of Public Education and Health Spending?, IMF Working Paper, No. 03/227, Washington, D.C., International Monetary Fund.
Debrun, Xavier and Manmohan Kumar (2006): The Discipline-Enhancing Role of Fiscal Institutions: Theory and Empirical
Evidence, document presented at the Workshop “The Role of Fiscal Rules and Institutions in Shaping Budgetary Outcomes”, Brussels, November.
De Ferranti, David, Guillermo Perry and others (2003): Closing the Gap in Education and Technology, Washington, D.C., World Bank.
__________ (2004): Inequality in Latin America: Breaking with History?, Washington, D.C., World Bank.
Echebarría, Koldo and Juan Cortázar (2006): Public administration and public employment reform in Latin America, in Eduardo Lora (ed.), The State of State Reform in Latin America, Washington, D.C., Inter-American Development Bank.
ECLAC (Economic Commission for Latin America and the Caribbean) (2006a): Social Panorama of Latin America, LC/G.2326-P, Santiago, Chile. United Nations publication, Sales No. E.06.II.G.133.
__________ (2006b): Shaping the Future of Social Protection: Access, Financing and Solidarity, LC/G.2294(SES.31/3), Santiago, Chile.
Fay, Marianne and Mary Morrison (2005): Infrastructure in Latin America and the Caribbean: Recent Developments and Key Challenges, Washington, D.C., World Bank.
Filc, Gabriel and Carlos Scartascini (2006): Budgetary institutions, in Eduardo Lora (ed.), The State of State Reform in Latin America, Washington, D.C., Inter-American Development Bank.
Gavin, Michael and Roberto Perotti (1997): Fiscal policy in Latin America, NBER Macroeconomics Annual 1997, No. 12, Cambridge, Massachusetts, MIT Press.
Gill, Indermit, Truman Packard and Juan Yermo (2005): Keeping the Promise of Social Security in Latin America, Washington, D.C., World Bank.
Gupta, Sanjeev and Marijn Verhoeven (2001): The efficiency of government expenditure: experiences from Africa, Journal of Policy Modeling, vol. 23, Amsterdam, Elsevier.
Hammouya, Messaoud (1999): Statistics on Public Sector Employment, Methodology, Structure and Trends, Geneva, International Labour Office.
Herrera, Santiago and Gaobo Pang (2005): Efficiency of Public Spending in Developing Countries: An Efficiency Frontier Approach, World Bank Policy Research Working Paper, No. 3645, Washington, D.C., World Bank.
IDB (Inter-American Development Bank) (2005): The Politics of Policies, Washington, D.C.
in infrastructure have varied widely by country and sector, with the most noteworthy gains in roads, electricity and telephones achieved by Chile. The results also suggest that countries with relatively high levels of spending (e.g., Bolivia and Colombia) have not achieved the most rapid progress.
public sector investment spending. The results reveal a large amount of inefficiency, given the significant difference from the efficiency frontier (i.e., an efficiency score of 1.0) in many countries. Inefficiencies are especially noteworthy in Bolivia and Colombia, while Chile and Mexico are among the most efficient countries.33 In the case of Chile, the high level of efficiency is due to its substantial progress in improving infrastructure indicators, while in the case of Mexico, high efficiency is attributable to continued progress of output indicators in conjunction with low levels of expenditures. The adjustment of the efficiency scores for differing levels of private-sector participation has little effect on the country rankings.
(Original: English)
33 The results for Colombia, however, should be interpreted with caution for a number of reasons (see main text for further discussion).
3. Results
Table B.3 presents the results of the fdh analysis. The results are based on an aggregation of the efficiency scores matching spending and outputs in railways, roads, electricity, water and telecommunications. Each sector was weighted by its share in
Bibliography
C E P A L R E V I E W 9 3 • D E C E M B E R 2 0 0 7
PuBLIC ExPEnDItuRE In LAtIn AMERICA: tREnDs AnD kEy PoLICy IssuEs •BEnEDICt CLEMEnts, ChRIstoPhER FAIRCLoth AnD MARIjn VERhoEVEn
60
__________ (2006): Living With Debt: How to Limit the Risks of Sovereign Debt, Washington, D.C.
IMF (International Monetary Fund) (2003): World Economic Outlook: Public Debt in Emerging Markets, Washington, D.C., September.
__________ (2005): Public Investment and Fiscal Policy. Lessons from the Pilot Country Studies, Washington, D.C. Available in http://www.imf.org.
__________ (2006a): Public-Private Partnerships, Government Guarantees, and Fiscal Risk, Washington, D.C.
__________ (2006b): Regional Economic Outlook: Western Hemisphere, Washington, D.C., November.
__________ (2007): Promoting Fiscal Discipline, Occasional Paper, Washington, D.C., Fiscal Affairs Department, forthcoming.
Kaminsky, Graciela L., Carmen Reinhart and Carlos Végh (2004): When it Rains, it Pours: Procyclical Capital Flows and Macroeconomic Policies, NBER Working Paper, No. 10780, Cambridge, Massachusetts, National Bureau of Economic Research.
Kaufmann, Daniel, Aart Kraay and Massimo Mastruzzi (2006): Governance Matters V: Governance Indicators for 1996–2005, Washington, D.C., World Bank.
Lindert, Kathy, Emmanuel Skoufias and Joseph Shapiro (2006): Redistributing Income to the Poor and the Rich: Public Transfers in Latin America and the Caribbean , Washington, D.C., World Bank.
Lopez-Claros, Augusto, Michael E. Porter and others (2006): The Global Competitiveness Report 2006–2007: Creating an Improved Business Environment, Geneva, World Economic Forum.
Mullis, I.V.S., M.O. Martin and others (2004a): TIMSS 2003 International Mathematics Report, Chestnut Hill, TIMSS &
PIRLS International Study Center, Lynch School of Education, Boston College.
__________ (2004b): TIMSS 2003 International Science Report, Chestnut Hill, TIMSS & PIRLS International Study Center, Lynch School of Education, Boston College.
OECD (Organisation for Economic Co-operation and Development) (2001): Highlights of Public Sector Pay and Employment Trends, Paris.
__________ (2004): Learning for Tomorrow’s World: First Results from PISA 2003, Paris.
Roldos, Jorge (2006): Pension Reform and Macroeconomic Stability, unpublished.
Sahay, Ratna and Rishi Goyal (2006): Volatility and Growth in Latin America: An Episodic Approach, IMF Working Paper, No. 06/287, Washington, D.C., International Monetary Fund.
Singh, Anoop and Martin Cerisola (2006): Sustaining Latin America’s Resurgence: Some Historical Perspectives, IMF Working Paper, No. 06/252, Washington, D.C., International Monetary Fund.
Schiavo-Campo, Salvatore, Giulio de Tommaso and Amitabha Mukherjee (1997): An International Statistical Survey of Government Employment and Wages, Policy Research Working Paper, No. 1806, Washington, D.C., World Bank.
Stein, Ernesto, Ernesto Talvi and Alejandro Grisanti (1998): Institutional Arrangements and Fiscal Performance: The Latin American Experience, IADB Working Paper, No. 367, Washington, D.C., Inter-American Development Bank.
Talvi, Ernesto and Carlos Végh (2005): Tax base variability and procyclical fiscal policy, Journal of Development Economics, vol. 78, Amsterdam, Elsevier, October.
61
C E P A L R E V I E W 9 3 • D E C E M B E R 2 0 0 7
Inequality, institutions and progress: a debatebetween history and the present
José Antonio Alonso
T his article analyses current attempts to interpret the factors
underlying long-term economic growth, paying special attention to the Latin
American case. It discusses both the interpretations whose advocates claim
that geographic conditions have a decisive role in shaping the development
process and those according to which colonization is seen as giving rise
to an institutional framework ill-suited for development. The author -based
on his own estimates- emphasizes the importance of market access and
the effect of social fragmentation on the establishment of an efficient and
credible institutional framework. The article concludes with a discussion of
the impact of inequality on both the quality of institutions and the dynamics
of growth.
K E YW O R D S
Economic growth
Economic gap
Geography
Economic h is tor y
Po l i t i ca l aspects
Soc ia l aspects
Soc ia l mobi l i t y
Economic ana lys is
Ma themat ica l mode ls
La t in Amer ica
José Antonio Alonso
Professor of Applied Economics
Director, Instituto Complutense de
Estudios Internacionales (ICEI)
Madrid
C E P A L R E V I E W 9 3 • D E C E M B E R 2 0 0 7
InequalIty, InstItutIons and progress: a debate between hIstory and the present • José antonIo alonso
62
IIntroduction
Economic theory offers a relatively convincing view of the immediate factors that promote modern economic growth: the accumulation of physical and human capital and technological progress are said to be its main explanatory factors. However, these factors by themselves can hardly account for the extraordinary inequalities observed at the international level or explain the historical process of divergence underlying them (Pritchett, 1997). The stubborn persistence of underdevelopment defies a simple economic interpretation and highlights the need for a subsequent analysis in order to identify the forces that determine long-term economic growth. The purpose of such an exercise would be to explain what caused the immediate variables mentioned above to evolve so unevenly in different countries and regions. This compels us to analyse more fundamental factors and longer time spans in order to account for economic progress or, in other words, to look to the ultimate causes of long-term growth.
In the last few years, various contributions have been made in this regard, with economists, political scientists, naturalists and historians all weighing in on the subject. Their efforts go beyond mere historical inquiry, since they seek to identify the key factors that explain economic progress in the hope of finding an effective solution for underdevelopment. It is a debate between history and the present. Unfortunately, the urge to find a single, fundamental cause of development has led to many synthetic explanations and to overly broad interpretations of the secular trend which do not always account for the complexity of the dynamics of economic and social change which development entails. The purpose of this article is not to correct this lack, since such a task would lie far beyond this author’s capacities. This article simply aims to highlight some of the limitations of the dominant interpretations and to mention some additional factors that should be borne in mind when seeking to explain the development process.
IIInstitutions and geography
The recent literature offers two main hypotheses regarding the ultimate causes of development. The first stresses the decisive importance of geographic factors; it assumes that the soil, climate, environment and physical accessibility of a region determine the chances of progress (Gallup, Sachs and Mellinger, 1998; Sachs, 2001, or Diamond, 1998). Three variations of this tra c dition focus on different, though not incompatible, types of geographic influence: (i) climate, which conditions attitudes regarding effort and has an effect on people’s productivity; (ii) geography, which determines technological options, land productivity and conditions in terms of mobility and transportation; and (iii) the persistence of certain diseases influenced by the bio-physical conditions of the environment.
According to all of these theories, the factors that determine the possibilities of development are beyond human control, or at least relatively so. There are various
sorts of evidence that support this theory; the most cogent ones, however, refer to the difficulties that tropical or landlocked countries without navigable rivers have been implementing a successful development strategy. The costs of certain epidemic diseases and their prevalence in specific areas – which happen to be in the tropics – lend added weight to this approach by underscoring the difficulties that certain environmental conditions pose for life in general and for production activities in particular.
Notwithstanding the recognized importance of geographic aspects, the proponents of this thesis do not seem to have proven that the natural environment is the ultimate cause of economic backwardness. The relatively unchanging nature of geographic conditions makes them unlikely to explain the sudden economic shifts experienced by many countries at specific points in time (present-day China comes to mind). Nor can
C E P A L R E V I E W 9 3 • D E C E M B E R 2 0 0 7
InequalIty, InstItutIons and progress: a debate between hIstory and the present • José antonIo alonso
63
it explain the contrasting economic performance of neighbouring countries that share a similar geographic environment (Mexico and the United States, for example, or the Democratic People’s Republic of Korea and the Republic of Korea).
The strongest argument against this approach, however, lies in the regression suffered by certain societies that used to play a distinguished role in their region but which now lag behind their neighbours. This is the “reversal of fortune” to which the specialized literature refers. The clearest examples of this phenomenon are the Inca, Aztec or Mogol civilizations, which were noted for their complexity and wealth circa 1500, and are now part of the developing world. Acemoglu, Johnson and Robinson (2002) have attempted to show that these reversals of fortune are more than a string of isolated cases. Using urbanization as an indicator of prosperity for a sample group of developing countries, they have found a negative correlation between the percentage of the population living in urban areas five centuries ago and current gross domestic product (GDP). This finding evidences the differences existing between shifts in the relative position of these countries and their more permanent geographic conditions. However, the questionable quality of the data employed and the ratio’s high levels of dispersion cast doubt on the value of this exercise.
It should be noted that these critiques, although well founded, do not mean that environmental conditions cannot influence development processes. First of all, geographic conditions may not be as static as they appear; changing natural or environmental conditions may have contributed to the reversals mentioned above. Changes in climate caused by severe droughts or the degradation of fragile ecosystems, along with escalating clashes between groups over the control of resources, appear to have been behind the collapse of relatively advanced societies such as those of the Huari, Tiahuanaco, Calakmul or Cahokia peoples (Diamond, 2005, or Mann, 2006). Furthermore, it is possible that certain environmental characteristics may be of little significance in some contexts but may matter a great deal in others. For example, the location of certain Latin American capitals in the interior may have had little relevance at the time of their founding, when exchanges were few and defensive considerations were given top priority, but it may have become a hindrance to communication and transportation once their economies joined the world market. In this regard, the orientation of Latin America along a primarily vertical axis, the presence of mountain ranges which fragment the region and the absence of significant navigable rivers must have
been a major obstacle to the movement of people, crops, ideas and goods.1 Of course, the fact that geographic factors are important does not necessarily mean they are the cause of economic backwardness.
Hence the idea that institutions (not geography) determine development. By “institutions”, we mean a system of incentives (and penalties) that stem from society and that structure the interaction between agents, thus conditioning collective behaviour. Institutions help set expectations regarding the behaviour of the group, reducing society’s uncertainties and transaction costs. In generic terms, institutions help to establish incentives for investment in physical and human capital and thus determine the chances of aggregate growth (North, 1993).
The proponents of this idea suggest that the institutional framework of developing countries was determined by the type of colonization they experienced. The settlement and farming patterns adopted by colonists in conquered lands shaped the institutions they created. Thus, underdevelopment is not a result of factors which, like geography, are beyond human control, but rather of phenomena – such as institutions – which are genuine social creations, albeit ones which date back to the country’s forced insertion into the global economy.
Variations can also be found within this tradition. On the one hand, Acemoglu and Johnson (2003) or Acemoglu, Johnson and Robinson (2001, 2002 and 2006) argue that colonial settlement patterns can explain the type of institutions – private-property-based or extractive – that were established in conquered lands. In areas where the unhealthy conditions of the environment prevented Europeans from establishing settlements, where there were large populations that could be directly exploited, forced into servitude or otherwise coerced, or where little extractable wealth existed, Europeans made little effort to develop systems for increasing aggregate welfare by establishing primarily extractive institutions. In contrast, in places where colonization was based on the occupation of virgin lands and the exploitation of their resources, the colonists themselves tried to develop institutions – partly imported from their native countries – which protected private property, encouraged free markets and spurred growth. While environmental conditions – particularly endemic diseases – may also have influenced development, they did not do so directly, but rather through the colonization model they fostered. In areas with a high rate
1 For a weighted analysis of the impact of various geographic factors on Latin American development, see Gallup, Gaviria and Lora (2003).
C E P A L R E V I E W 9 3 • D E C E M B E R 2 0 0 7
InequalIty, InstItutIons and progress: a debate between hIstory and the present • José antonIo alonso
64
of deadly disease, Europeans avoided building settlements, choosing instead to establish extractive institutions that ultimately hindered development.
This same hypothesis has been used to explain reversals of fortune. The most populated and developed areas – that is, the wealthiest ones at the time of colonization – saw the establishment of extractive institutions that would later hamper their development. Conversely, in the least populated areas (originally the poorest ones), a settlement pattern predominated that would eventually lead to the creation of the type of market institutions that would ultimately drive their development. Thus, the reversal of fortune is actually a “reversal of institutions”.
Another variation on this approach has been suggested by Engerman and Sokoloff (1997, 2002, 2005 and 2006), who argue that initial factor endowments not only determine the distribution of income, but also give shape to institutions that match those patterns (Engerman, Haber and Sokoloff, 2000; Sokoloff and Engerman, 2000). Income distribution patterns were highly unequal in areas suited for large-scale agriculture which enjoyed substantial economies of scale and had access to slave labour (Brazil or the Caribbean, for
example), or in places where large indigenous populations could be exploited and forced into labour (Mexico or the Andean region). These environments generated exclusionary institutions that served a small elite and that had a limited capacity to generate effective results. Conversely, places with a small indigenous population and an environment better suited to family agriculture (certain parts of the east coast of the United States, for example) generated more democratic institutions which focused on providing public goods, protecting property rights and encouraging economic opportunities. Thus, initial factor endowments influence the level of social inequality and the resulting institutions; the institutions, in turn, affect the chances of growth.
Consequently, whether because of the nature of settlement patterns or as a result of initial factor endowments, institutions determine the development path. Institutions are shaped by distribution patterns and vice-versa. To the extent that Latin America is a reference point for these studies (particularly those of Engerman and Sokoloff), the hypothesis they suggest is a good starting point for the analysis of the region’s development agenda. Before reaching any conclusions, however, their arguments must be examined.
IIIHistory without “historic data”
The institutional explanation of development has found considerable support within academic circles and international organizations. Among the latter, it has become the dominant interpretation of the relationship among poverty, institutions and development, creating what appears to be a “new orthodoxy” on the subject (Dobado, 2007). Echoes of this view can be found in two World Bank studies on the relationship between inequality and development in Latin America: “Inequality in Latin America: Breaking with History?” (De Ferranti, Perry and others, 2004) and “Poverty Reduction and Growth: Virtuous and Vicious Circles” (Perry, Arias and others, 2006). It is also the basic premise of the “World Development Report 2006: Equity and Development” (World Bank, 2005).
There are several possible explanations for the strong support received by the institutional hypothesis. First of all, it is consistent with the basic principles
of liberal Anglo-Saxon philosophy – Locke, Smith or Stuart Mill – that informs a great part of economic doctrine and highlights the role that the liberal order and property rights play in laying the foundations of progress. Second, it relies neither on geographic determinism – which focuses on factors that are beyond human control (as Diamond, 2005, might suggest) – nor on Weberian culturalist approaches, which draw a distinction between good colonists and bad colonists (see Landes, 1998). Contrary to both positions, the institutional approach attributes underdevelopment to the social framework that shapes human conduct (in other words, to institutions) in an attempt to explain the phenomenon in endogenous terms. This effort to internalize institutions by means of these rather clever procedures is one of the unquestionable merits of these proposals. Finally, this vision is consistent with the messages that international organizations are attempting
C E P A L R E V I E W 9 3 • D E C E M B E R 2 0 0 7
InequalIty, InstItutIons and progress: a debate between hIstory and the present • José antonIo alonso
65
to promote regarding the role of institutional quality and social cohesion in national development strategies.
Are these hypotheses solidly supported by historical evidence? Not entirely. The historical data they cite do not fully support their claims. The evidence provided by Acemoglu, Johnson and Robinson (hereinafter referred to as AJR) and Engerman and Sokoloff (hereinafter referred to as ES) consists of so-called “natural experiments” arising from various colonization experiences. According to Engerman and Sokoloff (2006, p. 38), “the history of European colonization provides scholars with a rich supply of evidence, a research laboratory, that can be used to study economic performance and the evolution of institutions over the long run.” The available data, however, do not justify the generalizations they sometimes make, and their information is, at times, debatable.
The critics may base their arguments on the works of the economic historians themselves (particularly Latin Americanists), whose analyses and evidence that have little in common with the conclusions reached by AJR and ES. The following subsections cover the four main objections which can be raised in this regard.
1. Too many generalizations
First of all, the approaches of ES and AJR entail too many generalizations. This criticism can be divided into two complementary arguments: on the one hand, a single factor can hardly explain the many different situations in which developing countries currently find themselves; on the other, even the historical factors mentioned by these authors to illustrate their hypotheses are not applicable to all the countries considered.
With regard to the first point, the relevant question would be whether the disparate development paths followed by different countries can be explained by a vague and general description of colonization patterns. Is the dichotomy between extractive institutions and private property enough to explain the diversity of situations found in the developing world? Latin America is a good example, since few colonial systems generated an institutional framework as unified and homogeneous as the Spanish one (Elliott, 2006). How could a common institutional framework produce such diverse results in terms of development? As Coatsworth (2007) points out, in 1800 the differences in productivity between the richest and poorest Latin American colonies were almost as great as the differences between the richest and poorest regions of the world as a whole.
As for the second point, it is highly unlikely that the guidelines used to identify colonization models can
be applied across the board to every country studied. For example, it is doubtful whether an extractive colonization model can be attributed to all of Latin America, or that a market-based system can be attributed to all of the eastern United States (as AJR argues). In the first case, there are exceptions, at least in the Southern Cone of Latin America; in the second, there are also exceptions, in the states of Virginia and the Carolinas. Why didn’t this discrepancy result in clearly differentiated development paths? Moreover, the Southern Cone colonization model, which is more similar to that of the east coast of the United States, should have given rise (according to ES) to democratic, inclusive institutions; inequality levels in Chile, however, are among the highest in the region, and those of Argentina and Uruguay, although lower, are equally high in global terms.
Even the countries that had quite similar patterns of colonial exploitation followed very different development paths, contrary to what AJR and ES suggest. This was the case, for example, of Cuba and Brazil, where a similar colonization model of plantations and slave labour was applied. Nevertheless, while one of these countries – Cuba – became one of the richest societies in Latin America in the early nineteenth century, the other one – Brazil – became one of the poorest. Another clear example is that of Central America, where countries such as Guatemala or Nicaragua have low income levels and high degrees of inequality and yet were not colonized under the plantation-slave or forced-mining models typical of extractive institutions.
2. Lack of historical data
Another characteristic of the institutionalist interpretation is its use of history to explain the ultimate causes of underdevelopment. Its references to history are broad and lacking in details about actual “historical facts”; in their interpretations, AJR and ES include very few historical data, sequence analyses or detailed contextual studies. Instead, they offer broad interpretations of “metahistorical narratives” (Coatsworth, 2007, p. 2) that are constructed on a very limited empirical basis which, in the best of cases, suggests rather than demonstrates the hypotheses they are trying to defend. As noted by Dobado (2007), the economic history of Latin America or other former colonies is rarely mentioned in the writings of Engerman-Sokoloff or in those of Acemoglu-Johnson-Robinson. A quick glance at the bibliographies of their works is enough to corroborate this fact.
This lack of historical data would matter less if the analyses offered by AJR and ES were supported by
C E P A L R E V I E W 9 3 • D E C E M B E R 2 0 0 7
InequalIty, InstItutIons and progress: a debate between hIstory and the present • José antonIo alonso
66
evidence and findings from historical studies of the region. But that does not always seem to be the case. Firstly, as noted earlier, they seem to have made very little use of the research carried out by specialists in economic history, and they have not compensated for that shortcoming by providing their own reconstruction of history. But they also take for granted the existence of a reality which, in many cases, has been challenged by historical studies. This issue will be taken up later in this article; for now, suffice it to say that AJR speaks of the existence of a large indigenous population as a factor leading to the establishment of an extractive colonization model in Mexico or in the Andean region. Can this argument be maintained without modifications, when we know full well that 90% of the local population disappeared within just one century? Did not the demographic catastrophe that followed the arrival of the first Europeans have some impact on the type of institutions that arose during the colonial period? (Dobado, 2007).
3. Excessive confidence in historical inertia
One of the positive contributions of the institutional approach is that it has brought back the temporal sequence, or historic inertia. As noted by Banerjee and Iyer (2002, p. 2), “in the new institutionalist view, history matters because history shapes institutions and institutions shape the economy.”
Indeed, many of the obstacles to development are hard to understand without referring back to the historical processes from which they originated. It would be going too far, however, to say that the explanation for backwardness necessarily lies in the colonial era. Przeworski and Curvale (2005, p. 2) are right when they argue that “institutionalism is a mirror image of the dependency theory”; though in this case the institutions, shaped in their time by the colonial powers, are acting as determinants of development.
In regions such as Latin America, this means looking 500 years in the past to explain the shortcomings of the present. Has nothing important happened since then? That would be surprising, given that, in the interim, many historically significant events have occurred in the region, including (i) independence, which represented a crucial break in the patterns of international insertion, the structure and dynamics of society and the make-up of institutions in these countries; (ii) the transportation revolution of the mid-nineteenth century, which reduced potential agglomeration economies at a time when Latin America had not yet begun to industrialize; (iii) the rise in prices of raw materials during the intercentury period,
which accentuated the primary-export specialization of the region; (iv) the State-led industrialization policies of the second half of the twentieth century, which helped enhance manufacturing capabilities, but also led to significant imbalances in the management of national economies; and finally, (v) the debt crisis and the economic reforms of the 1980s, which influenced changes in the orientation of economic policy. These are all important events in the economic history of the region, but they are not even considered by the proponents of the institutional thesis.
4. Questionable interpretation
Disregard for historical research and a penchant for generalizations lead AJR and ES to interpretations of historical data that are not borne out by the findings of specialized studies. While there is no space here for an exhaustive list of their inconsistencies, some representative examples are listed below:(i) It is not clear that the backwardness of Latin America
originated during the time period mentioned by AJR and ES. Coatsworth (2005, p. 8) dates it much later, around the time of independence. He points out that Latin America was not underdeveloped by any conventional standard (such as per capita GDP) until some time between 1750 and 1850. Haber (1997) also traces the backwardness of the region to that period (nineteenth century), as does Bulmer-Thomas (1994). Prados de la Escosura (2005) compares the region not with the United States but with the rest of the members of the Organisation for Economic Co-operation and Development (OECD), and moves the date forward by almost a century: “Latin America’s retardation, vis-à-vis OECD countries, appears to be a late twentieth century phenomenon.”
(ii) Their emphasis on the encomienda as an example of an extractive institution established in Latin America appears to contradict the proven decline of that institution from the seventeenth century onward (Carmagnani, 2004). And neither can the hacienda model be generalized as the predominant form of agrarian exploitation in Latin America (Miño, 1991).
(iii) Contrary to the assertions of ES, forced labour in the mines does not appear to have been a standard recruitment procedure, except maybe during the early stages of colonization (Velasco, Flores and others, 1989). In fact, data on Mexico suggest that
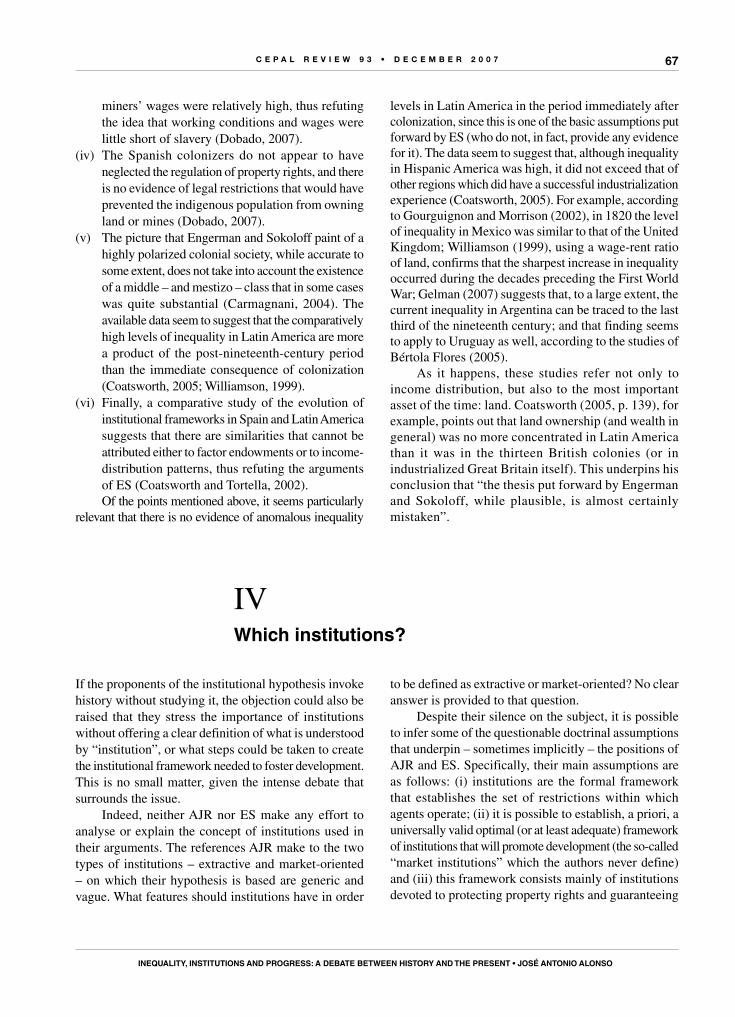
C E P A L R E V I E W 9 3 • D E C E M B E R 2 0 0 7
InequalIty, InstItutIons and progress: a debate between hIstory and the present • José antonIo alonso
67
miners’ wages were relatively high, thus refuting the idea that working conditions and wages were little short of slavery (Dobado, 2007).
(iv) The Spanish colonizers do not appear to have neglected the regulation of property rights, and there is no evidence of legal restrictions that would have prevented the indigenous population from owning land or mines (Dobado, 2007).
(v) The picture that Engerman and Sokoloff paint of a highly polarized colonial society, while accurate to some extent, does not take into account the existence of a middle – and mestizo – class that in some cases was quite substantial (Carmagnani, 2004). The available data seem to suggest that the comparatively high levels of inequality in Latin America are more a product of the post-nineteenth-century period than the immediate consequence of colonization (Coatsworth, 2005; Williamson, 1999).
(vi) Finally, a comparative study of the evolution of institutional frameworks in Spain and Latin America suggests that there are similarities that cannot be attributed either to factor endowments or to income-distribution patterns, thus refuting the arguments of ES (Coatsworth and Tortella, 2002).Of the points mentioned above, it seems particularly
relevant that there is no evidence of anomalous inequality
levels in Latin America in the period immediately after colonization, since this is one of the basic assumptions put forward by ES (who do not, in fact, provide any evidence for it). The data seem to suggest that, although inequality in Hispanic America was high, it did not exceed that of other regions which did have a successful industrialization experience (Coatsworth, 2005). For example, according to Gourguignon and Morrison (2002), in 1820 the level of inequality in Mexico was similar to that of the United Kingdom; Williamson (1999), using a wage-rent ratio of land, confirms that the sharpest increase in inequality occurred during the decades preceding the First World War; Gelman (2007) suggests that, to a large extent, the current inequality in Argentina can be traced to the last third of the nineteenth century; and that finding seems to apply to Uruguay as well, according to the studies of Bértola Flores (2005).
As it happens, these studies refer not only to income distribution, but also to the most important asset of the time: land. Coatsworth (2005, p. 139), for example, points out that land ownership (and wealth in general) was no more concentrated in Latin America than it was in the thirteen British colonies (or in industrialized Great Britain itself). This underpins his conclusion that “the thesis put forward by Engerman and Sokoloff, while plausible, is almost certainly mistaken”.
to be defined as extractive or market-oriented? No clear answer is provided to that question.
Despite their silence on the subject, it is possible to infer some of the questionable doctrinal assumptions that underpin – sometimes implicitly – the positions of AJR and ES. Specifically, their main assumptions are as follows: (i) institutions are the formal framework that establishes the set of restrictions within which agents operate; (ii) it is possible to establish, a priori, a universally valid optimal (or at least adequate) framework of institutions that will promote development (the so-called “market institutions” which the authors never define) and (iii) this framework consists mainly of institutions devoted to protecting property rights and guaranteeing
IVWhich institutions?
If the proponents of the institutional hypothesis invoke history without studying it, the objection could also be raised that they stress the importance of institutions without offering a clear definition of what is understood by “institution”, or what steps could be taken to create the institutional framework needed to foster development. This is no small matter, given the intense debate that surrounds the issue.
Indeed, neither AJR nor ES make any effort to analyse or explain the concept of institutions used in their arguments. The references AJR make to the two types of institutions – extractive and market-oriented – on which their hypothesis is based are generic and vague. What features should institutions have in order
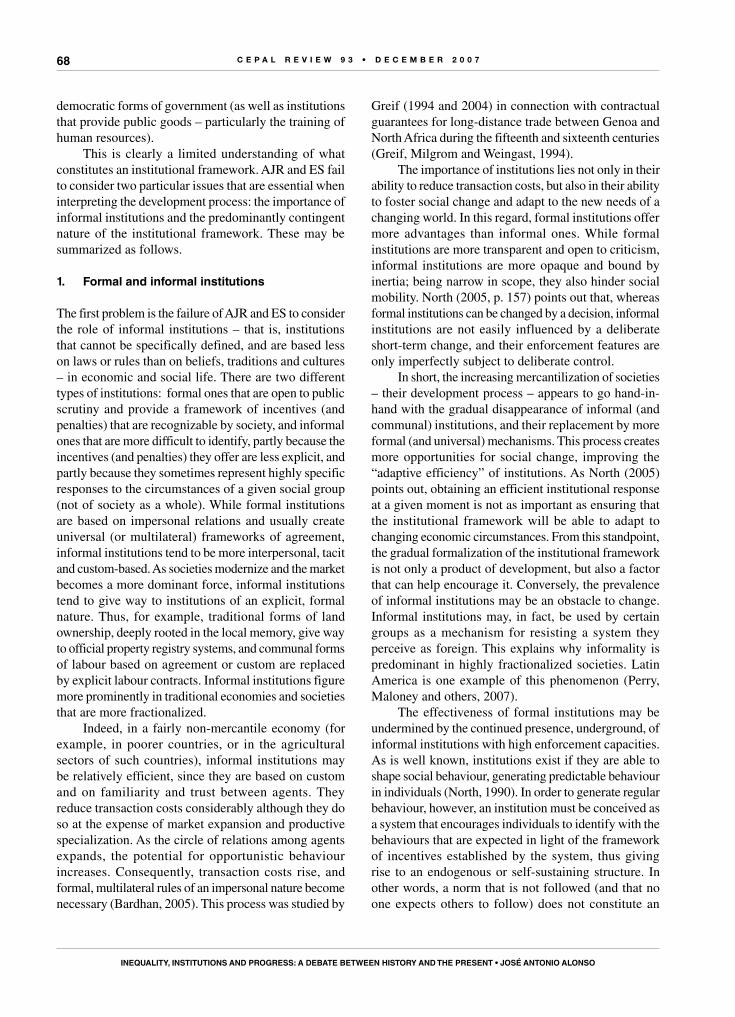
C E P A L R E V I E W 9 3 • D E C E M B E R 2 0 0 7
InequalIty, InstItutIons and progress: a debate between hIstory and the present • José antonIo alonso
68
democratic forms of government (as well as institutions that provide public goods – particularly the training of human resources).
This is clearly a limited understanding of what constitutes an institutional framework. AJR and ES fail to consider two particular issues that are essential when interpreting the development process: the importance of informal institutions and the predominantly contingent nature of the institutional framework. These may be summarized as follows.
1. Formal and informal institutions
The first problem is the failure of AJR and ES to consider the role of informal institutions – that is, institutions that cannot be specifically defined, and are based less on laws or rules than on beliefs, traditions and cultures – in economic and social life. There are two different types of institutions: formal ones that are open to public scrutiny and provide a framework of incentives (and penalties) that are recognizable by society, and informal ones that are more difficult to identify, partly because the incentives (and penalties) they offer are less explicit, and partly because they sometimes represent highly specific responses to the circumstances of a given social group (not of society as a whole). While formal institutions are based on impersonal relations and usually create universal (or multilateral) frameworks of agreement, informal institutions tend to be more interpersonal, tacit and custom-based. As societies modernize and the market becomes a more dominant force, informal institutions tend to give way to institutions of an explicit, formal nature. Thus, for example, traditional forms of land ownership, deeply rooted in the local memory, give way to official property registry systems, and communal forms of labour based on agreement or custom are replaced by explicit labour contracts. Informal institutions figure more prominently in traditional economies and societies that are more fractionalized.
Indeed, in a fairly non-mercantile economy (for example, in poorer countries, or in the agricultural sectors of such countries), informal institutions may be relatively efficient, since they are based on custom and on familiarity and trust between agents. They reduce transaction costs considerably although they do so at the expense of market expansion and productive specialization. As the circle of relations among agents expands, the potential for opportunistic behaviour increases. Consequently, transaction costs rise, and formal, multilateral rules of an impersonal nature become necessary (Bardhan, 2005). This process was studied by
Greif (1994 and 2004) in connection with contractual guarantees for long-distance trade between Genoa and North Africa during the fifteenth and sixteenth centuries (Greif, Milgrom and Weingast, 1994).
The importance of institutions lies not only in their ability to reduce transaction costs, but also in their ability to foster social change and adapt to the new needs of a changing world. In this regard, formal institutions offer more advantages than informal ones. While formal institutions are more transparent and open to criticism, informal institutions are more opaque and bound by inertia; being narrow in scope, they also hinder social mobility. North (2005, p. 157) points out that, whereas formal institutions can be changed by a decision, informal institutions are not easily influenced by a deliberate short-term change, and their enforcement features are only imperfectly subject to deliberate control.
In short, the increasing mercantilization of societies – their development process – appears to go hand-in-hand with the gradual disappearance of informal (and communal) institutions, and their replacement by more formal (and universal) mechanisms. This process creates more opportunities for social change, improving the “adaptive efficiency” of institutions. As North (2005) points out, obtaining an efficient institutional response at a given moment is not as important as ensuring that the institutional framework will be able to adapt to changing economic circumstances. From this standpoint, the gradual formalization of the institutional framework is not only a product of development, but also a factor that can help encourage it. Conversely, the prevalence of informal institutions may be an obstacle to change. Informal institutions may, in fact, be used by certain groups as a mechanism for resisting a system they perceive as foreign. This explains why informality is predominant in highly fractionalized societies. Latin America is one example of this phenomenon (Perry, Maloney and others, 2007).
The effectiveness of formal institutions may be undermined by the continued presence, underground, of informal institutions with high enforcement capacities. As is well known, institutions exist if they are able to shape social behaviour, generating predictable behaviour in individuals (North, 1990). In order to generate regular behaviour, however, an institution must be conceived as a system that encourages individuals to identify with the behaviours that are expected in light of the framework of incentives established by the system, thus giving rise to an endogenous or self-sustaining structure. In other words, a norm that is not followed (and that no one expects others to follow) does not constitute an
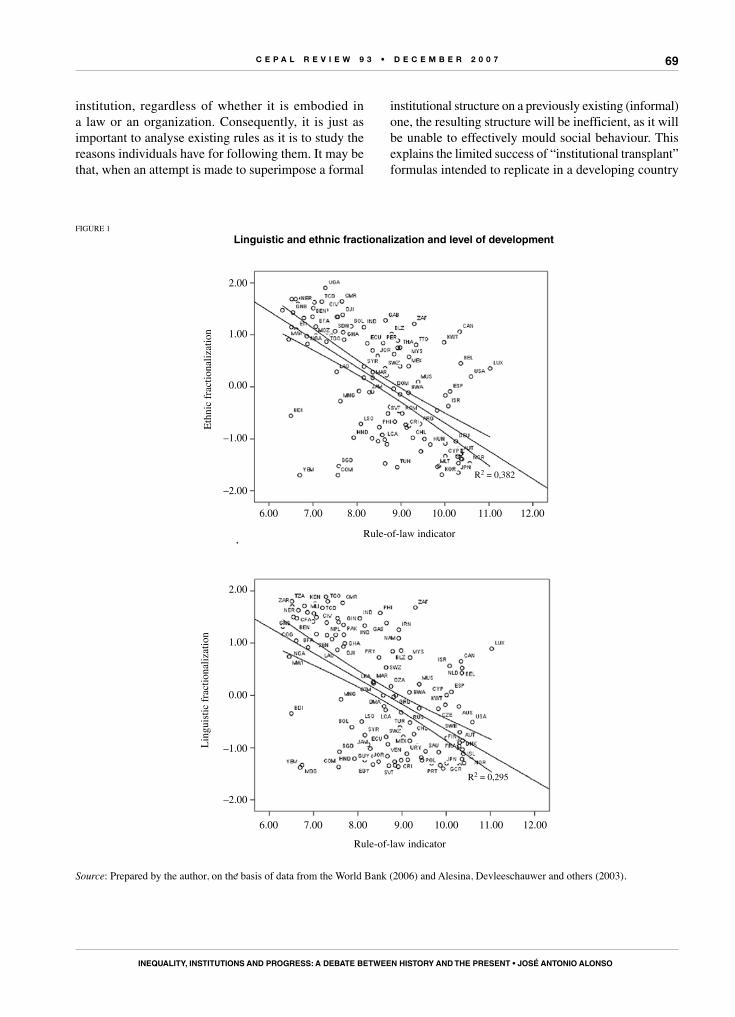
C E P A L R E V I E W 9 3 • D E C E M B E R 2 0 0 7
InequalIty, InstItutIons and progress: a debate between hIstory and the present • José antonIo alonso
69
institution, regardless of whether it is embodied in a law or an organization. Consequently, it is just as important to analyse existing rules as it is to study the reasons individuals have for following them. It may be that, when an attempt is made to superimpose a formal
institutional structure on a previously existing (informal) one, the resulting structure will be inefficient, as it will be unable to effectively mould social behaviour. This explains the limited success of “institutional transplant” formulas intended to replicate in a developing country
Source: Prepared by the author, on the basis of data from the World Bank (2006) and Alesina, Devleeschauwer and others (2003).
FIGURE 1Linguistic and ethnic fractionalization and level of development
2.00
1.00
0.00
–1.00
–2.00
6.00 7.00 8.00 9.00 10.00 11.00 12.00
2.00
1.00
0.00
–1.00
–2.00
6.00 7.00 8.00 9.00 10.00 11.00 12.00
R2 = 0,382
R2 = 0,295
Rule-of-law indicator
Rule-of-law indicator
Ethn
ic fr
actio
naliz
atio
nLi
ngui
stic
frac
tiona
lizat
ion
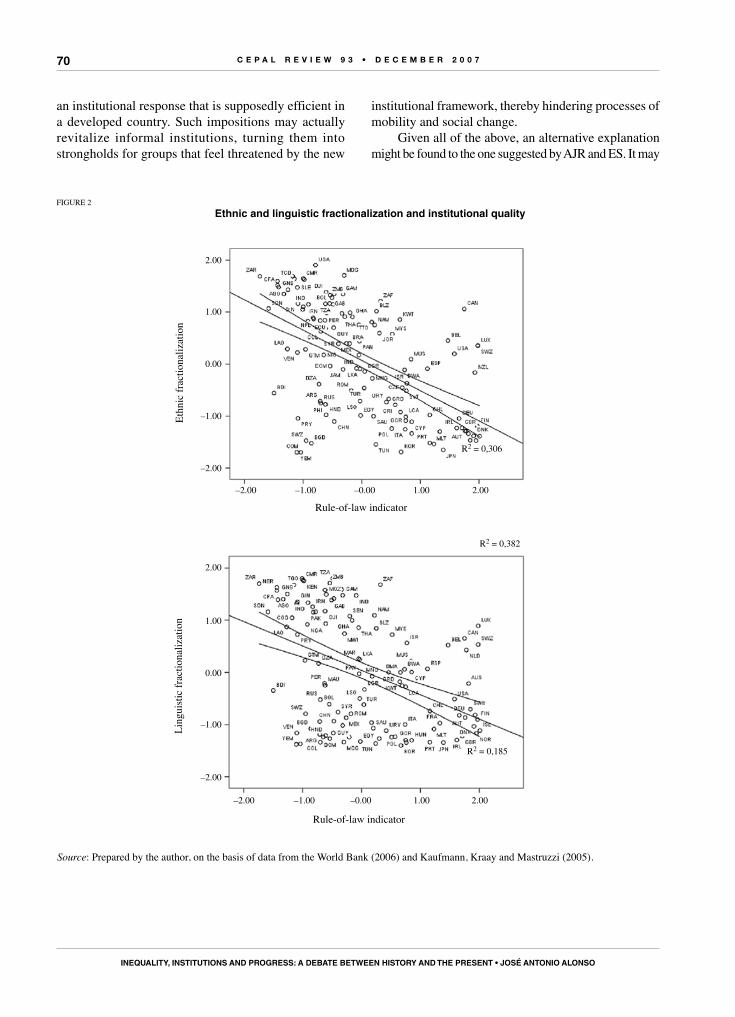
C E P A L R E V I E W 9 3 • D E C E M B E R 2 0 0 7
InequalIty, InstItutIons and progress: a debate between hIstory and the present • José antonIo alonso
70
an institutional response that is supposedly efficient in a developed country. Such impositions may actually revitalize informal institutions, turning them into strongholds for groups that feel threatened by the new
institutional framework, thereby hindering processes of mobility and social change.
Given all of the above, an alternative explanation might be found to the one suggested by AJR and ES. It may
FIGURE 2Ethnic and linguistic fractionalization and institutional quality
Source: Prepared by the author, on the basis of data from the World Bank (2006) and Kaufmann, Kraay and Mastruzzi (2005).
2.00
1.00
0.00
–1.00
–2.00
–2.00 –1.00 –0.00 1.00 2.00
Rule-of-law indicator
Rule-of-law indicator
–2.00 –1.00 –0.00 1.00 2.00
2.00
1.00
0.00
–1.00
–2.00
R2 = 0,382
R2 = 0,306
R2 = 0,185
Ethn
ic fr
actio
naliz
atio
nLi
ngui
stic
frac
tiona
lizat
ion
C E P A L R E V I E W 9 3 • D E C E M B E R 2 0 0 7
InequalIty, InstItutIons and progress: a debate between hIstory and the present • José antonIo alonso
71
be that, in countries where “land colonization” (settlement of virgin lands) was practised, formal institutions (partly imported from Europe) took hold, and, as a result, these countries were better prepared for mobility and social change, driven by changing market incentives. On the other hand, in countries where “people colonization” (with large indigenous groups) was practised, formal institutions overlapped (and sometimes clashed) with previously existing informal institutions, fostering social fractionalization and hindering the mobility and social change required by the market. According to this view, economic backwardness may have been caused less by colonial institutions themselves than by informal institutions’ resistance to change, in a setting of social disarticulation brought about by colonization itself.
It is not easy to gather information on the fabric of informal institutions, and even less so when those institutions are part of the historical past. Social fractionalization (ethnic or linguistic) may be a good yardstick for measuring this phenomenon. The durability of ethnic and linguistic fractionalization can be used to create variables that express the prevalence of informal institutions. There is clearly a negative correlation between the degree of linguistic and ethnic fractionalization (see Alesina, Devleeschauwer and others, 2003) and the level of development measured in terms of 2004 per capita GDP, at purchasing power parity (figure 1).
As mentioned above, formal institutions are likely to be less effective in social contexts where informality is high (estimated in terms of social fractionalization). As shown in figure 2, although the linkage is not as clear, there is also a negative correlation between ethnic and linguistic fractionalization and institutional quality (measured by the rule-of-law indicator). 2
2. Do optimal institutions exist?
The second problem with the interpretation offered by AJR and ES lies in the questionable assumption that it is possible to define what constitutes an optimal institutional framework without taking into account the social context of each country. The existence of multiple equilibria, the complementarity of institutions and the fact that the same institution might serve different purposes make it difficult to define a universal and optimal institutional response to any given problem. Moreover, even if there were consensus regarding an economic policy, there could
2 This indicator appears in a World Bank publication, and was deve-loped by Kaufman, Kraay and Mastruzzi (2005).
be a wide range of institutional options for achieving that policy objective. This does not mean that any institutional response is valid, or that alternative options should not be considered, but rather that there are many possible responses – all of them equally acceptable – in a given context. This underscores the importance of taking local conditions into account when determining whether or not an institution is appropriate (Islam and Montenegro, 2002).
The relative specificity of institutions explains the relative effectiveness of so-called transitional institutions (Quian, 2003): mechanisms designed to adjust the existing institutional framework to changes in circumstances. These institutions are not designed to meet the rigid standards of supposedly optimal institutions, but rather allow for the correction of inefficiencies through a dynamic, highly specific process. From an abstract perspective, these institutions could probably be considered inefficient. They make transition possible, however, by adjusting to local conditions and fostering changes that are consistent with a country’s development objectives. In this regard, the principle of “remediability” of institutional change cited by Williamson (1985) is worth remembering: an institution should not be considered inefficient unless a better, socially viable alternative exists. In other words, the efficiency of an institution should not be judged in terms of a supposedly universal design, but rather in light of the best options that are socially feasible.
For example, no one would point to China as an example of a market economy where property rights are protected (the two aspects of an institutional framework most valued by AJR); China, however, has been growing at average rates of nearly seven percent of per capita GDP for more than ten years. What is happening? Is it a successful economy trapped inside an inefficient institutional framework? A more likely explanation is that the country is generating highly specific institutional responses, which might be considered inefficient by the standards of an ideal market economy, but are highly conducive to change in the specific context of Chinese society. In this regard, the country’s institutions satisfy the criterion of adaptive efficiency mentioned above.
In short, while the formal institutions established in the Hispanic New World may have been inefficient, one cannot assume that this was because they fell short of an optimal universal model; any conclusion regarding inefficiency should be based on the study of the specific social conditions of the societies involved. It does not seem unreasonable, therefore, to take a closer look at history, to try to determine the appropriateness of institutions and their inertia over time.
C E P A L R E V I E W 9 3 • D E C E M B E R 2 0 0 7
InequalIty, InstItutIons and progress: a debate between hIstory and the present • José antonIo alonso
72
VEmpirical evidence of the importance
of institutions
indicator of market attraction would be , LnP PLi j
ij∑
where P represents the 1890 population, i and j the urban nuclei considered and L the distance between the two.
This formula was applied to both domestic and international markets, although with different criteria. Specifically, in the case of domestic markets, all cities with a population of over 30,000 in 1870 were analysed, and the distance used was that between each urban nucleus and the capital of the country. Thus, the more urbanized a country is, and the shorter the distances between its urban nuclei, the larger the actual size of its domestic market will be. The size of international markets was measured using only the populations of the capitals of countries located within a maximum radius of 3,000 kilometres, which is a reasonable way to define a relatively proximate regional market.
The trade integration variable is determined by three factors: firstly, in negative terms, it is determined by the size of the domestic market, since the existence of a large domestic market reduces the need for international trade. Secondly – also in negative terms – it is determined by a country’s size, measured by the population logarithm, which affects the measurement of openness. Finally, in positive terms, it is determined by the size of the proximate international market, which facilitates trade and improves the potential for international insertion.
The quality of institutions is determined by several factors. First of all, in a negative sense, it is determined by the level of fractionalization of a society, which reinforces the tendency of agents to resort to informal institutions, diminishing the effectiveness (and sometimes the credibility) of the formal institutional system. Social fractionalization can be expressed through two alternative variables, both of which produce similar results: linguistic fractionalization and ethnic fractionalization (both are discussed by Alesina, Devleeshauwer and others, 2003). Both variables express the probability of having two randomly selected individuals from the same country speaking different languages or having different ethnic origins. Secondly, institutional quality can also be influenced by a country’s location, measured as its
The above approaches could be transposed, even if only tentatively, to an empirical model that could be used to begin a discussion of the arguments outlined above. In simple terms, three basic options have been suggested to explain the development levels of countries: (i) Gallup, Sachs and Mellinger (1998) and Sachs (2001) stress the importance of geography (particularly access to the sea and distance from the tropics); (ii) Acemoglu, Johnson and Robinson (2002) emphasize the importance of institutions, shaped by a country’s colonization model; and (iii) Rodrik, Subramanian and Trebbi (2002) mention the potentially positive impact of trade, measured by the degree of trade liberalization. Nevertheless, despite their references to the instrumental variable developed by Frankel and Romer (1999), they did not find trade liberalization to be significant (and it figured with a negative sign).
Like Rodrik, Subramanian and Trebbi (2002), this article assumes that a country’s level of development may be influenced by geography (measured in terms of distance from the tropics), institutional quality (measured by the rule-of-law indicator developed by Kaufmann, Kraay and Mastruzzi) and trade integration (measured by the degree of trade liberalization). The problem, however, is that the latter two variables (institutional quality and trade integration) are endogenous, as they may be influenced by a country’s level of development. Suitable estimation tools must therefore be developed.
In this regard, and bearing in mind previous studies, emphasis will be placed on the role played by the size and accessibility of both the domestic and the proximate international markets. Market size determines the level of productive specialization and, sometimes, the use of the economies of scale involved in the industrialization process; while accessibility, measured by the inverse of distance, provides an estimate of the costs of trade. In order to convert this factor into a suitable estimation tool, the relative market size is calculated according to the populations of urban nuclei, since a country’s commercial activities are concentrated in its cities. Population figures for 1890 are used, since that was when the arc of international income distribution began its course. In other words, as with gravitation models, the
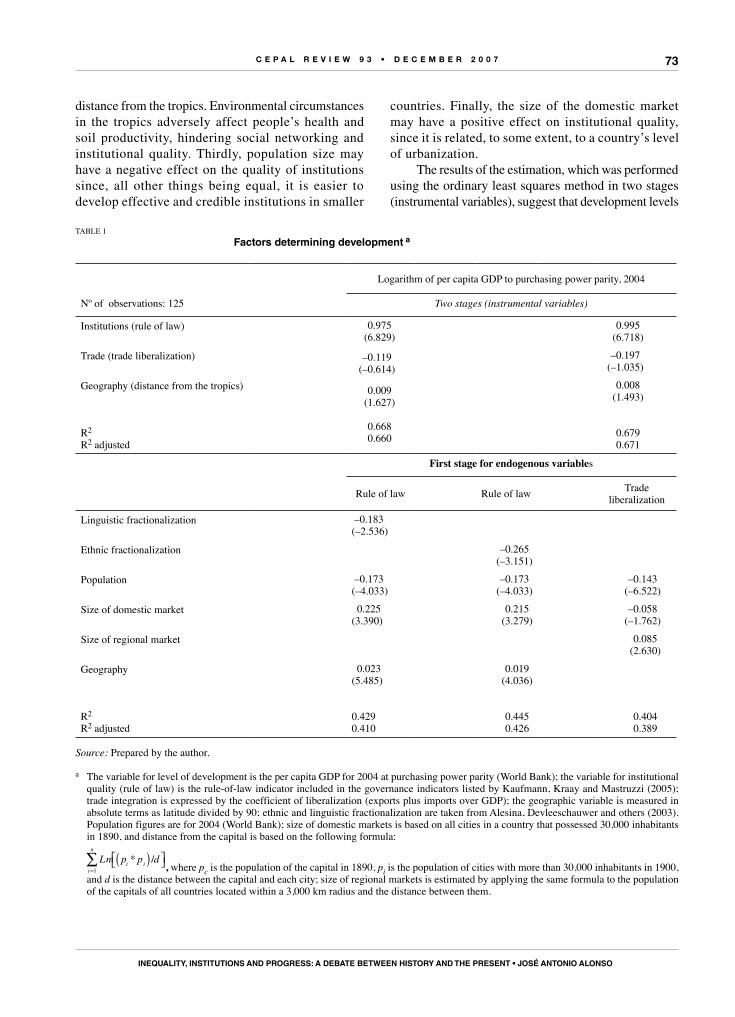
C E P A L R E V I E W 9 3 • D E C E M B E R 2 0 0 7
InequalIty, InstItutIons and progress: a debate between hIstory and the present • José antonIo alonso
73
distance from the tropics. Environmental circumstances in the tropics adversely affect people’s health and soil productivity, hindering social networking and institutional quality. Thirdly, population size may have a negative effect on the quality of institutions since, all other things being equal, it is easier to develop effective and credible institutions in smaller
countries. Finally, the size of the domestic market may have a positive effect on institutional quality, since it is related, to some extent, to a country’s level of urbanization.
The results of the estimation, which was performed using the ordinary least squares method in two stages (instrumental variables), suggest that development levels
TABLE 1Factors determining development a
Logarithm of per capita GDP to purchasing power parity, 2004
Nº of observations: 125 Two stages (instrumental variables)
Institutions (rule of law) 0.975(6.829)
–0.119(–0.614)
0.009(1.627)
0.6680.660
0.995(6.718)
Trade (trade liberalization) –0.197(–1.035)
Geography (distance from the tropics) 0.008(1.493)
R2
R2 adjusted0.6790.671
First stage for endogenous variables
Rule of law Rule of law Trade liberalization
Linguistic fractionalization –0.183(–2.536)
Ethnic fractionalization –0.265(–3.151)
Population –0.173(–4.033)
–0.173(–4.033)
–0.143(–6.522)
Size of domestic market 0.225(3.390)
0.215(3.279)
–0.058(–1.762)
Size of regional market 0.085(2.630)
Geography 0.023(5.485)
0.019(4.036)
R2
R2 adjusted0.4290.410
0.4450.426
0.4040.389
Source: Prepared by the author.
a The variable for level of development is the per capita GDP for 2004 at purchasing power parity (World Bank); the variable for institutional quality (rule of law) is the rule-of-law indicator included in the governance indicators listed by Kaufmann, Kraay and Mastruzzi (2005); trade integration is expressed by the coefficient of liberalization (exports plus imports over GDP); the geographic variable is measured in absolute terms as latitude divided by 90; ethnic and linguistic fractionalization are taken from Alesina, Devleeschauwer and others (2003). Population figures are for 2004 (World Bank); size of domestic markets is based on all cities in a country that possessed 30,000 inhabitants in 1890, and distance from the capital is based on the following formula:
Ln p p di ii
n
* ,( ) =∑ /
1 , where pc is the population of the capital in 1890, pi is the population of cities with more than 30,000 inhabitants in 1900, and d is the distance between the capital and each city; size of regional markets is estimated by applying the same formula to the population of the capitals of all countries located within a 3,000 km radius and the distance between them.
C E P A L R E V I E W 9 3 • D E C E M B E R 2 0 0 7
InequalIty, InstItutIons and progress: a debate between hIstory and the present • José antonIo alonso
74
can be explained, basically, by the institutional variable (table 1), thus supporting both Rodrik, Subramanian and Trebbi (2002) and the suggestions of AJR and ES. As noted in that study, the trade integration variable is not significant, and has a negative sign. The geographic variable operates with the right sign, and is almost significant. Nevertheless, geographic conditions also have a considerable impact on the quality of institutions, as was assumed in the model. Attention should also be paid to the explanatory capacity of variables constructed to measure the attraction potential of domestic and regional markets, which affect both economic openness and institutional quality.
The estimation results show that geography and institutions influence a country’s development potential. However, the quality of institutions is not necessarily determined by a country’s colonization model, but rather by the social fractionalization underlying its institutions. Where social fractionalization is high, institutions are of poorer quality, largely because there may still be a fractionalized network of informal institutions. At the same time, the existence of a network of proximate urban
nuclei on which to establish a market determines both a country’s potential for international insertion and the quality of its institutions. The latter is also influenced by the network of cities a country possesses; in addition to determining the size of the local market, such networks provide a basic idea of the level of urbanization. As for international insertion, what matters the most is that the country be located within a large and accessible regional environment.
Beyond the hypotheses supported by this empirical exercise, there is still the question of how individual countries have used the opportunities provided by each of the factors explained above. Why, for example, did Australia overcome the limited availability of regional markets, while Morocco failed to take advantage of that relative advantage? Or why did Canada overcome its relatively high linguistic fractionalization, while Madagascar failed to benefit from its greater homogeneity? These are questions that challenge the findings of historical research, and call for a study of the specific issues involved in each case.
1. Inequality and institutions
In the preceding pages, an effort has been made to explain some of the limitations of the institutional hypothesis, as presented by its most qualified proponents. Its main limitation is its fruitless attempt to find a single, universal cause for underdevelopment. No development strategy can be applied everywhere, nor is there a single diagnosis of the factors that cause economic backwardness. This is true even for specific regions.
In the case of Latin America, for example, economic backwardness was probably caused by a variety of different factors, including geographic conditions (problems with transportation and communication between and within countries), historical chance (postponing industrialization even as the transportation revolution was under way), institutional responses (particularly the dislocation of formal and informal institutions) and economic policy choices (Haber, 2000). To these factors must be added the impact over time of the momentum that seems to be associated
with rising productivity. It is hard to imagine that all of these factors could be reduced to a single cause.
The shortcomings found in the works of AJR and ES should not lead the reader to reject some of their hypotheses, which are highly suggestive. In other words, the baby should not be thrown out with the bath water.
Specifically, it seems plausible that inequality (in a broad sense, not just in terms of income) may determine the quality of collective action, and thus affect the efficiency and credibility of institutions; it is also reasonable to assume that these two issues – efficiency and credibility – influence economic results, as well as the willingness of a country to embark upon social change. Thus, there is no need to accept all the arguments made by ES to assume that “greater equality or homogeneity among the population led, over time, to more democratic political institutions, more investment in public goods and infrastructures, and to institutions that offered relatively broad access to property rights and economic opportunities.” (Engerman and Sokoloff,
VIInequality, institutions and the bath water
C E P A L R E V I E W 9 3 • D E C E M B E R 2 0 0 7
InequalIty, InstItutIons and progress: a debate between hIstory and the present • José antonIo alonso
75
2006, p. 41). Nevertheless, it is important to (i) study in greater depth how the suggested relationship between inequality, institutions and growth operates; and (ii) consider the process of institutional change from a broader and more complex historical perspective.
The second issue is beyond the scope of this article. Nonetheless, it is important to note that no broad and convincing theory of institutional change has yet been developed (Lin and Nugent, 1995). The idea that the process of change follows a self-selective dynamic (as suggested by evolutionists), and that the most efficient institutions survive spontaneously, does not appear to be grounded in reality; neither does the assumption that institutional change arises solely from conflicts between competing interests, or from the pursuit of income on the part of individual or group agents in the complex political market (as suggested by the public choice school). The process of institutional change appears to be much more complex, involving not only material factors but also the cultural factors (worldviews) that are prevalent in a given society (Chang and Evans, 2000). That is why it is difficult to transplant existing institutional models or generate institutional realities ex novo in a given country. Historians may therefore play a key role in furthering the understanding of institutional change.
Further progress is possible, however, in the analysis of the relationship between inequality and institutional quality. In principle, an institution may be defined as an intertemporal contract, the effectiveness of which depends on two factors: (i) its social efficiency and (ii) its credibility. Efficiency is understood as the capacity of an institutional framework to reduce transaction costs and generate behaviour that is compatible with efficiency incentives – i.e., that allows for equilibrium in the interplay of institutions, in such a way that, from a dynamic perspective, everyone can benefit (or, at least, winners can compensate losers). Credibility is understood as the capacity of the institutional framework to influence the behaviour of agents – that is, to define valid intertemporal contracts. Both criteria are necessary, inasmuch as there is no point in having a supposedly efficient institution if it does not shape social conduct. At the same time, there is no guarantee that having legitimate institutions will necessarily lead to socially optimal responses.
The relationship between inequality and collective action may be considered in the light of three arguments that are not necessarily incompatible.
(a) Inequality and collective actionOne of the basic reasons for building institutions is to
provide public goods (of different types) for society. Many of these public goods require cooperative contributions from different agents. The theory of collective action suggests two hypotheses that link, in a negative sense, the levels of provision of a public good with the levels of equality of the group concerned. Firstly, in the case of impure public goods, Olson (1965) argues that large contributors are “exploited” by small ones: the former tend to assume the costs of provision, even when small contributors do not cooperate, because they receive greater net benefits from the public good. Secondly, in the case of pure public goods (in the absence of corner solutions), Cornes and Sandler (1996) have shown that the principle of neutrality prevails: provision is independent from the distribution of effort among contributors. In both cases, modelling occurs under highly restrictive assumptions, using a static two-player model.
A somewhat more complex proposition might be suggested: Baland and Platteau (2007) and Bardhan (2005) explore the consequences of inequality in a game that is extended over time. Bardhan and Singh (2004) discuss the possibilities of a multi-player model that allows for the formation of coalitions. The results of these proposals differ from those mentioned above, and suggest the existence of a direct relationship between equality and efficiency in providing public goods.
Bardhan (2005), in particular, discusses the existence of inequality in a non-transferable good (private capital, for example), and accepts increases in efficiency brought about by technological advances in the production of inputs that are complementary to capital. Although incentives for cooperation are greater among the wealthier members of the community (all else being equal), the result may vary according to the coalition structures resulting from existing levels of inequality. Among their main findings, Bardhan and Singh (2004) point out that a reduction of inequality can increase the willingness to cooperate of those whose relative position improves (box 1). In other words, under conditions more similar to social dynamics, reducing inequality improves the willingness of agents to cooperate. This position has been the subject of empirical studies by Bardhan and Dayton-Johnson (2007) in water management communities in Mexico and south India, and by Cárdenas (2007) in the case of Colombia.
(b) Inequality and institutional instabilityThe previous section dealt with the correlation
between inequality and incentives for cooperative action.
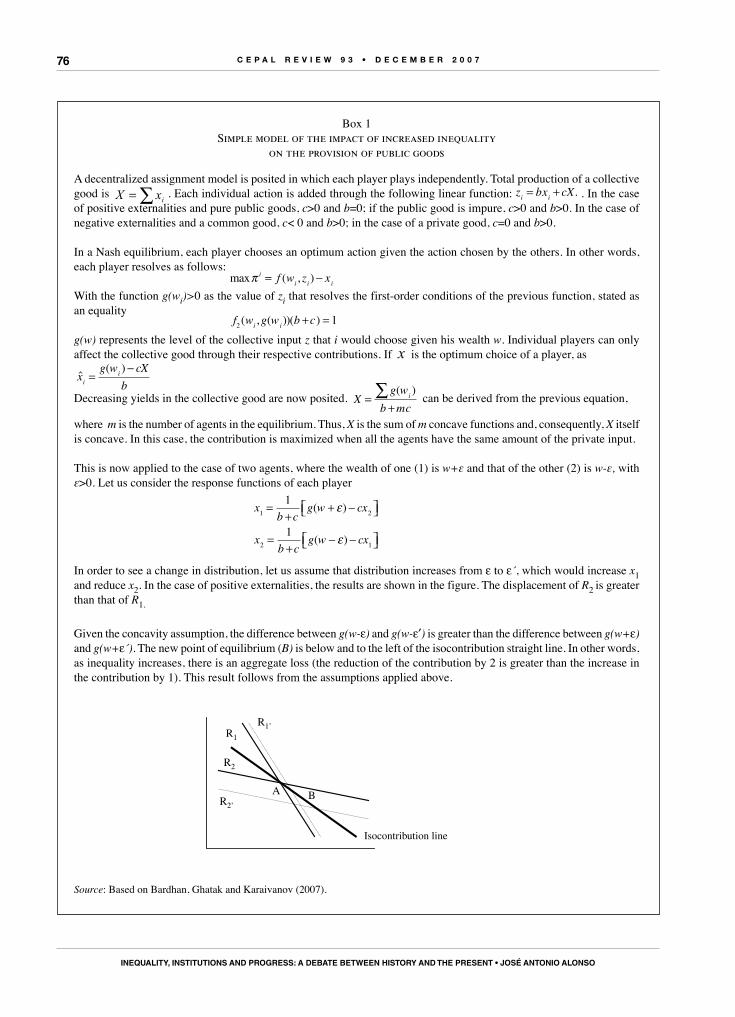
C E P A L R E V I E W 9 3 • D E C E M B E R 2 0 0 7
InequalIty, InstItutIons and progress: a debate between hIstory and the present • José antonIo alonso
76
Box 1Simple model of the impact of increased inequality
on the provision of public goods
A decentralized assignment model is posited in which each player plays independently. Total production of a collective good is ∑= ixX . Each individual action is added through the following linear function: z bx cXi i= + . . In the case of positive externalities and pure public goods, c>0 and b=0; if the public good is impure, c>0 and b>0. In the case of negative externalities and a common good, c< 0 and b>0; in the case of a private good, c=0 and b>0.
In a Nash equilibrium, each player chooses an optimum action given the action chosen by the others. In other words, each player resolves as follows: With the function g(wi)>0 as the value of zi that resolves the first-order conditions of the previous function, stated as an equality g(w) represents the level of the collective input z that i would choose given his wealth w. Individual players can only affect the collective good through their respective contributions. If x is the optimum choice of a player, as ˆ
( )x
g w cXbi
i=−
Decreasing yields in the collective good are now posited. X
g wb mc
i=+
∑ ( )can be derived from the previous equation,
where m is the number of agents in the equilibrium. Thus, X is the sum of m concave functions and, consequently, X itself is concave. In this case, the contribution is maximized when all the agents have the same amount of the private input.
This is now applied to the case of two agents, where the wealth of one (1) is w+ε and that of the other (2) is w-ε, with ε>0. Let us consider the response functions of each player
In order to see a change in distribution, let us assume that distribution increases from ε to ε´, which would increase x1 and reduce x2. In the case of positive externalities, the results are shown in the figure. The displacement of R2 is greater than that of R1.
Given the concavity assumption, the difference between g(w-ε) and g(w-ε′) is greater than the difference between g(w+ε) and g(w+ε´). The new point of equilibrium (B) is below and to the left of the isocontribution straight line. In other words, as inequality increases, there is an aggregate loss (the reduction of the contribution by 2 is greater than the increase in the contribution by 1). This result follows from the assumptions applied above.
A B
R2
R1
R1’
Línea de isocontribución
R2’
Source: Based on Bardhan, Ghatak and Karaivanov (2007).
Isocontribution line
max ( , )π ii i if w z x= −
f w g w b ci i2 1( , ( ))( )+ =
xb c
g w cx
xb c
g w cx
1 2
2 1
1
1
=+
+ −
=+
− −
( )
( )
ε
ε
C E P A L R E V I E W 9 3 • D E C E M B E R 2 0 0 7
InequalIty, InstItutIons and progress: a debate between hIstory and the present • José antonIo alonso
77
The same problem could be viewed from a political perspective. In principle, there are three basic mechanisms whereby an institution becomes self-replicating: tradition (one does what has always been done); coercion (one must do something to avoid a penalty); and shared willingness (one does what has been agreed because it is a reasonable solution to a coordination problem). While all these mechanisms may be effective, the last one is the least likely to elicit criticism, and the most likely to ensure the stability of the institutional framework.
Nevertheless, in order for this shared willingness to be possible, the institutional equilibrium must meet the expectations of the agents involved. They will not readily support an institutional framework that systematically produces a highly unequal distribution of the benefits arising from collective action (Easterly,
Ritzan and Woolcock, 2005). In such cases, the institutional equilibrium will be called into question, and attempts will be made to alter the rules of the game. This explains why there is a close association between marked inequality and institutional instability (Alesina and Perotti, 1996).
This proposition can be stated in more formal terms if institutions are understood in terms of a game extended over time – that is, a game based on repeated interaction between agents. The distribution of benefits arising from collective action is crucial to ensuring that the players are inclined to cooperate, even if the static structure of the game is that of the prisoner’s dilemma (box 2 and Alonso, 2006). This suggests that the credibility of institutions depends, to a large extent, on their ability to generate inclusive responses.
Box 2Possibilities for cooperation in dynamic games
From a dynamic perspective, the conclusions arising from the prisoner’s dilemma may be substantially altered by increasing opportunities for cooperation and efficiency. To illustrate this point, the structure of the prisoner’s dilemma can be applied to a case in which successive moves are allowed. Each agent has three possible strategies: the two already known – defection and cooperation – and a third – reciprocity – in which the response of one player is met in the same fashion by the other player. Since decisions have consequences over time, the existence of a discount rate must be considered, such that the present value of a given net benefit b will extend over an infinite number of years: b/(1-r). Let us assume the supply of public goods costs is 10, and the benefits obtained from those goods are eight for each agent. The following scenarios are possible:If both players choose reciprocity on the bases of cooperation, in the first round each player will obtain 6/(1-r) (box 1). The result is the same when one player decides to cooperate and the other acts reciprocally, or when both cooperate (boxes 2, 4 and 5). On the other hand, when one player chooses reciprocity and the other chooses defection, the first player will obtain a result of -2 in the first round and zero in the rest, while the second player will obtain 8 and 0, respectively (boxes 3 and 7). When one player systematically decides to cooperate and the other to defect, the first player will obtain -2/(1-r) and the second will obtain 8/(1-r) (boxes 6 and 8). Finally, if both decide not to cooperate in all rounds, they will both obtain 0 (box 9).The two players do not have a predominant strategy, but rather two Nash equilibria. One is the usual result of the prisoner’s dilemma (box 9), but the other one is an efficient solution (box 1). In other words, the simple act of introducing a dynamic perspective and allowing for the existence of a strategy of reciprocity is enough to create the possibility of an efficient response
Prisoner’s dilemma with infinite games
Reciprocity Cooperation Defection
Reciprocity (1) (2) (3)6/(1-r); 6/(1-r) 6/(1-r); 6/(1-r) –2,0; 8,0
Cooperation (4) (5) (6)
6/(1-r); 6/(1-r)) 6/(1-r); 6/(1-r) –2/(1-r); 8/(1-r)
Defection (7) (8) (9)–2,0; 8,0 –2/(1-r); 8/(1-r) 0; 0
Source: Prepared by the author.
C E P A L R E V I E W 9 3 • D E C E M B E R 2 0 0 7
InequalIty, InstItutIons and progress: a debate between hIstory and the present • José antonIo alonso
78
c) Inequality and informal institutionsFinally, social inequality can drive certain segments
of society to resort to informal institutions as defence mechanisms and for collective protection. These institutions are not always dysfunctional, but they are usually less coordinated with the market and more resistant to change, as noted above. Hence, this option seems to hamper the development and efficacy of formal institutions, as well as the flexibility and willingness to change of the existing institutional framework. In this case, inequality operates through its impact on the development of informality. This is not a forced assumption, given that the available data (still of poor quality) reveal a direct correlation between levels of inequality of countries and the relative weight of their informal sectors (as shown by Perry, Maloney and others, 2007).
2. Inequality and social mobility
Although inequality has been mentioned without going into detail, the arguments set forth – particularly in the last two cases – become more relevant when discussing horizontal inequality – that is, inequality between groups of people– in an environment of limited social mobility. Willingness to cooperate is more seriously jeopardized when inequality generates mechanisms of solidarity between affected groups. This is the case when horizontal inequality is high and social mobility is low. Likewise, the tendency to resort to informal institutions increases when social fractionalization is high, which occurs in situations of horizontal inequality and low social mobility.
Social mobility plays a significant role in this regard. To put it the other way around, even in a context of inequality, social mobility helps mitigate the tendency to question the existing institutional framework: the success of some underprivileged individuals encourages the rest (this is the “tunnel effect” suggested by Hirschman, 1981). The absence of personal success is viewed as a consequence of one’s own inability (others have succeeded), rather than as a limitation of the existing institutional order. The absence of social mobility in an environment of marked inequality feeds the tendency to question the existing institutional framework, increasing the level of instability and conflict within a society.
The analyses above are relevant when judging the case of Latin America, given that the region is characterized not only by a high level of vertical inequality, as shown by the Gini inequality index, but also by marked horizontal inequality and very low social mobility (although this characteristic is not universal, and has been less researched than others). Horizontal inequality is revealed by an analysis of vectors of poverty, which define the asymmetrical probabilities of being poor as a function of the population’s living in a rural or urban area or of its ethnic origin (indigenous, mestizo or white). Limited social mobility is reflected by the fact that the poverty of one generation (parents) is highly predictive of the poverty of the next (children). Thus, it is not surprising that institutional quality is a serious problem in Latin America. Overcoming it will entail not only improving the technical aspects of the institutional response, but also taking action on the social legitimacy of institutions themselves, which is closely tied to the distribution patterns with which they are associated.
VIIFinal remarks
The arguments set forth above lead to certain conclusions that may be helpful when considering a development agenda for Latin America. In short:1. The region is characterized by marked social
inequality. It is debatable, however, whether this feature can be traced back five hundred years to the colonial period. Historical studies seem to suggest that inequality (along with economic backwardness) is a much more recent phenomenon that arose in the late nineteenth century. Factors such as Latin America’s postcolonial model of international
insertion (based on the exploitation of natural resources), the massive influx of immigrants that preceded the First World War and the existence of institutions that were ill-suited to social change may have contributed to such a result.
2. This is not to say that institutions do not play a significant role in determining the dynamics of a country’s long-term growth. In fact, empirical analysis seems to support the proposition that institutional quality is important in the long run.
C E P A L R E V I E W 9 3 • D E C E M B E R 2 0 0 7
InequalIty, InstItutIons and progress: a debate between hIstory and the present • José antonIo alonso
79
Nevertheless, this factor must be considered along with others, such as market access.
3. Not enough is known, however, about the keys to institutional change, and there are well-founded doubts regarding whether an optimal institutional framework is even possible. On the contrary, there are probably sub-optimal solutions that can be effective under the specific conditions of a given economy. Consequently, local conditions must be taken into account when assessing the quality of institutions.
4. The institutional framework is made up of formal and informal institutions. Nevertheless, given their greater transparency, formal institutions are better suited to change, and allow for greater social mobility. In traditional or highly fractionalized societies, underprivileged sectors tend to resort to informal institutions. Such informality can hinder social change.
5. The quality of institutions depends on their efficiency and their credibility. Both factors can be affected
by the existing levels of inequality: efficiency, because the strategic game can lead to results that are not compatible with the framework of incentives; credibility, because the unequal distribution of the fruits of collective action can limit the willingness to cooperate of the social agents that have been harmed.
6. A closer look at the correlations mentioned above shows that inequality can influence the quality of institutions in at least three different ways: (i) it may limit the provision of public goods; (ii) it weakens confidence in the intertemporal contracts that institutions promote; and (iii) it encourages recourse to informal institutions. All of these factors can affect an economy’s potential for growth.
7. Finally, vertical inequality is not the only relevant issue; horizontal inequality and the lack of social mobility are also extremely important. These last two factors are key to understanding the relationship between distribution patterns and institutional quality.
(Original: Spanish)
Bibliography
Acemoglu, D. and S. Johnson (2003): Unbundling Institutions, NBER Working Paper, No. 9934, Cambridge, Massachusetts, National Bureau of Economic Research.
Acemoglu, D., S. Johnson and J.A. Robinson (2001): The colonial origins of comparative development: an empirical investigation, American Economic Review, vol. 91, No. 5, Nashville, Tennessee, American Economic Association, December.
__________ (2002): Reversal of fortunes: geography and institutions in the making of the modern world income distribution, Quarterly Journal of Economics, vol. 117, No. 4, Cambridge, Massachusetts, The MIT Press, November.
__________ (2006): Understanding prosperity and poverty: geography, institutions, and the reversal of the fortune, Understanding Poverty, A. Banerjee, R. Bénabou and D. Mookherjee (eds.), New York, Oxford University Press.
Acemoglu, D. and J. Robinson (2000): Why did the West extend the franchise? Democracy, inequality, and growth in historical perspective, Quarterly Journal of Economics, Cambridge, Massachusetts, The MIT Press.
__________ (2002): Economic Backwardness in Political Perspectives, NBER Working Paper, No. 8831, Cambridge, Massachusetts, National Bureau of Economic Research, March.
Alesina, A., A. Devleeschauwer and others (2003): Fractionalization, Journal of Economic Growth, vol. 8, No. 2, Amsterdam, Springer Netherlands.
Alesina, A. and R. Perotti (1996): Income distribution, political instability and investment, European Economic Review, vol. 40, No. 6, Amsterdam, Elsevier.
Alonso, J.A. (2006): International Public Goods for Economic Development, unpublished.
Baland, J.M. and J.PH. Platteau (2007): Collective action and the commons: the role of inequality, in J.M. Baland, P. Bardhan and S. Bowles (eds.), Inequality, Cooperation and Environmental Sustainability, Princeton, Princeton University Press.
Banerjee, A. and L. Iyes (2005): History, institutions and economic performance: the legacy of colonial land tenure system in
India, American Economic Review, vol. 95, No. 4, Nashville, Tennessee, American Economic Association.
Bardhan, P. (2005): Scarcity, Conflict, and Cooperation: Essays in the Political and Institutional Economics of Development, Cambridge, Cambridge University Press.
Bardhan, P. and J. Dayton-Johnson (2007): Inequality and the governance of water resources in Mexico and South India, in J.M. Baland, P. Bardhan and S. Bowles (eds.), Inequality, Cooperation and Environmental Sustainability, Princeton, Princeton University Press.
Bardhan, P. and N. Singh (2004): Inequality, coalitions, and collective action, unpublished.
Bardhan, P., M. Ghatak and A. Karainov (2007): Inequality and collective action, in J.M. Baland, P. Bardhan and S. Bowles (eds.), Inequality, Cooperation and Environmental Sustainability, Princeton, Princeton University Press.
Bértola Flores, L. (2005): A 50 años de la curva de Kuznets: crecimiento económico y distribución del ingreso en Uruguay y otras economías de nuevo asentamiento desde 1870, Investigaciones de historia económica, No. 3, Madrid, Asociación Española de Historia Económica.
Bourguignon, F. and Ch. Morrison (2002): The size distribution of income among world citizens, 1820-1990, American Economic Review, vol. 92, No. 4, Nashville, Tennessee, American Economic Association, September.
Bulmer-Thomas, V. (1994): The Economic History of Latin America since Independence, Cambridge, Cambridge University Press.
Cardenas, J.C. (2007): Wealth inequality and overexploitation of the commons: field experiments in Colombia, in J.M. Baland, P. Bardhan and S. Bowles, Inequality, Cooperation and Environmental Sustainability, Princeton, Princeton University Press.
Carmagnani, M. (2004): El otro Occidente. América Latina desde la invasión europea hasta la globalización, Mexico City, Fondo de Cultura Económica/Colegio de México.
Chang, H-J. and P. Evans (2000): The role of institutions in economic change, document prepared for “The Other Canon” Conference.
C E P A L R E V I E W 9 3 • D E C E M B E R 2 0 0 7
InequalIty, InstItutIons and progress: a debate between hIstory and the present • José antonIo alonso
80
Coatsworth, J.H. (2005): Structures, endowments, and institutions in the economic history of Latin America, Latin American Research Review, vol. 40, No. 3, Austin, Texas, University of Texas Press.
__________ (2007): Inequality, Institutions, and Economic Growth in Latin America, unpublished.
Coatsworth, J.H. and G. Tortella (2002): Institutions and Long-Run Economic Performance in Mexico and Spain, 1800-2000, document prepared for the XIII Congress of the International Economic History Association.
Cornes, R. and T. Sandler (1996): The Theory of Externalities, Public Goods, and Club Goods, Cambridge, Cambridge University Press.
De Ferranti, D., G. Perry and others (2004): Inequality in Latin America: Breaking with History? Washington, D.C., World Bank.
Diamond, J. (1998): Guns, Germs and Steel: the Fates of Human Societies, New York, W.W. Norton.
__________ (2005): Collapse, New York, Penguin Group.Dobado, R. (2007): Herencia colonial y desarrollo económico en
Iberoamérica, unpublished.Easterly, W., J. Ritzan and M. Woolcock (2005), Social cohesion,
institutions, and growth, Washington, D.C., Banco Mundial, unpublished.
Elliott, J.H. (2006): Imperios del mundo atlántico. España y Gran Bretaña en América (1492-1830), Madrid, Santillana Ediciones Generales.
Engerman, S.L. and K.L. Sokoloff (1997): Factor endowments: institutions and differential paths of growth among new world economies. A view from economic historians of the United States, in S. Haber, How Latin America Fell Behind: Essays on the Economic Histories of Brazil and Mexico, 1800-1914, Stanford, Stanford University Press.
__________ (2002): Factor Endowments, Inequality, and Paths of Development Among the New World Economies, NBER Working Paper, No. 9259, Cambridge, Massachusetts, National Bureau of Economic Research.
__________ (2005): Colonialism, Inequality, and Long-run Paths of Development, NBER Working Paper, No. 11057, Cambridge, Massachusetts, National Bureau of Economic Research,
__________ (2006): Colonialism, inequality, and long-run paths of development, in A.V. Banerjee, R. Bénabou and D. Mookherjee (eds.), Understanding Poverty, Oxford, Oxford University Press.
Engerman, S.L., S.H. Haber and K.L. Sokoloff (2000): Inequality, institutions, and differential paths of growth among new world economies, in C. Menard (ed.), Institutions, Contracts, and Organization, Cheltenham, Edward Elgar.
Frankel, J.A. and D. Romer (1999): Does trade cause growth?, American Economic Review, vol. 89, No. 3, Nashville, Tennessee, American Economic Association, June.
Gallup, J.L., A. Gaviria and E. Lora (2003): América Latina: ¿condenada por su geografía?, Bogotá, D.C., Inter-American Development Bank/Alfaomega Colombiana.
Gallup, J.L., J. Sachs and A. Mellinger (1998): Geography and Economic Development, NBER Working Paper, No. 6849, Cambridge, Massachusetts, National Bureau of Economic Research.
Gelman, J. (2007): ¿Crisis postcolonial en las economías sudamericanas? Los casos del Río de la Plata y Perú, unpublished.
Greif, A. (1994): Cultural beliefs and the organization of society: a historical and theoretical reflection on collectivist and individualist societies, Journal of Political Economy, vol. 102, Chicago, The University of Chicago Press.
__________ (2004): Institutions: Theory and History, unpublished.Greif, A., P. Milgrom and B. Weingast (1994): Coordination,
commitment and enforcement: the case of the merchant guild, Journal of Political Economy, vol. 102, Chicago, The University of Chicago Press.
Haber, S. (1997): How Latin America Fell Behind: Essays on the Economic Histories of Brazil and Mexico, 1800-1914, Stanford, Stanford University Press.
__________ (ed.) (2000): Political Institutions and Economic Growth in Latin America, Stanford, Hoover Institutions Press.
Hirschman, A.O. (1981): Essays in Trespassing, Cambridge, Cambridge University Press.
Islam, R. and C. Montenegro (2002): What Determines the Quality of Institutions?, Policy Research Working Paper Series, No. 2764, Washington, D.C., World Bank.
Kaufmann, D., A. Kraay and M. Mastruzzi (2005): Governance Matters IV: Governance Indicators for 1996-2004, Washington, D.C., World Bank.
Landes, D.S. (1998): The Wealth and Poverty of Nations: Why Some Are So Rich and Some So Poor, New York, W.W. Norton.
Lin, J.Y. and J.B. Nugent (1995): Institutions and economic development, in J. Behrman and T.N. Srinivasan (eds.), Handbook of Economic Development, vol. 3, Amsterdam, North-Holland.
Mann, Ch.C. (2006): 1491. Una nueva historia de las Américas antes de Colón, Bogotá, D.C., Taurus.
Miño, M. (1991): Obrajes y tejedores de Nueva España 1700-1810, Madrid, Instituto de Estudios Fiscales.
North, D.C. (1990): Institutions, Institutional Change and Economic Performance, New York, Cambridge University Press.
__________ (1993): The New Institutional Economics and Development, Saint Louis, Washington University.
__________ (2005): Understanding the Process of Economic Change, Princeton, Princeton University Press
Olson, M. (1965): The Logic of Collective Action. Public Goods and Theory of Groups, Cambridge, Cambridge University Press.
Perry, G., O. Arias and others (2006): Poverty Reduction and Growth: Virtuous and Vicious Circles, Washington, D.C., World Bank.
Perry, G., W. Maloney and others (2007): Informalidad: escape y exclusión, Washington, D.C., World Bank.
Prados de la Escosura, L. (2005): Growth Inequality and Poverty in Latin America: Historical Evidence, Controlled Conjectures, Working Papers in Economic History, No. 54104, Madrid, Universidad Carlos III.
Pritchett, L. (1997): Divergence, big time, Journal of Economic Perspectives, vol. 11 No. 3, Nashville, Tennessee, American Economic Association.
Przeworski, A. and C. Curvale (2005): Does politics explain the economic gap between the United States and Latin America?, New York, New York University, unpublished.
Quian, Y. (2003): How reform worked in China, in D. Rodrik (ed.), In Search of Prosperity. Analytic Narratives on Economic Growth, Princeton, Princeton University Press.
Rodrik, D., A. Subramanian and F. Trebbi (2002): Institutions Rule: The Primacy of Institutions Over Geography and Integration in Economic Development, IMF Working Paper, No. 02/189, Washington, D.C., International Monetary Fund.
Sachs, J. (2001): Tropical Underdevelopment, NBER Working Paper Series, No. 8119, Cambridge, Massachusetts, National Bureau of Economic Research.
Sokoloff, K. and S.L. Engerman (2000): Institutions, factor endowments, and paths of development in the new world, Journal of Economic Perspectives, vol. 14, No. 3, Nashville, Tennessee, American Economic Association.
Velasco, C., E. Flores and others (1988): Estado y minería en México, 1767-1910, Mexico City, Fondo de Cultura Económica.
Williamson, J. (1999): Real wages, inequality and globalization in Latin America before 1940, Revista de historia económica, vol. 17, Madrid, Fundación SEPI.
Williamson, O.E. (1985): Economic Institutions of Capitalism, New York, The Free Press.
World Bank (2005): World Development Report 2006: Equity and Development, Madrid, Mundi-Prensa Libros S.A.
__________ (2006): World Development Indicators, Washington, D.C.
81
C E P A L R E V I E W 9 3 • D E C E M B E R 2 0 0 7
Latin America meets China and India:prospects and challenges
for trade and investment
Osvaldo Rosales and Mikio Kuwayama
The high growth levels projected for China and India will make these
two countries the most important pole of the global economy for the next
few years, creating a market of great potential for Latin American and
Caribbean exports. These markets had remained largely untapped until
recently, with the exception of certain South American primary products.
Latin America should strengthen its ties with the two Asian countries, in
order to increase production synergies with them. Free trade agreements
and trade and investment partnerships should also be established, in
order to increase access to both markets and facilitate insertion into Asian
production and export chains.
K E YW O R D S
In te rna t iona l t rade
In terna t iona l economic re la t ions
Trea t ies
Free t rade
Expor ts
Impor ts
Trade s ta t is t ics
ASEAN
LAIA
La t in Amer ica
Ch ina
Ind ia
Osvaldo Rosales
Director of the Division of
International Trade and Integration,
ECLAC
Mikio Kuwayama,
Head of the International Trade Unit,
ECLAC
IIntroduction
< The authors take full responsibility for any errors or omissions, and wish to thank José Durán, José Carlos Mattos and Jaime Contador for their statistical input.
Asia is the most buoyant region in the world economy in terms of growth, international trade, foreign direct investment, technological innovation and the generation of the financial resources needed to maintain international balances. One important feature of its emergence as a centre of global economic activity is the dominant role played by China and India. The reordering of Asia’s economy and trade around these two countries is the most important process of its kind underway in the region. In
addition, both countries have expressed an unprecedented level of interest in establishing strategic relationships with Latin America and the Caribbean. Given their high projected growth levels, China and India will remain the most important driver of world economic growth in coming years, creating a market of great potential for exports from Latin America and the Caribbean. These markets had remained largely untapped until recently, with the exception of certain primary products.
IIChief characteristics and economic
and trade performance
1. China and India confirm trend toward rapid
growth
The past few years have witnessed a significant increase in the global economic importance of China. In terms of Gross Domestic Product (GDP), measured at current prices, China became the world’s fourth largest economy in 2005, after the United States, Japan and Germany. It has already surpassed the United Kingdom and France. In terms of purchasing power parity (PPP), its GDP is second only to that of the United States. China alone was responsible for over 27% of world GDP growth in 2005, in PPP terms – a contribution larger than that of the United States, the European Union and Japan combined (ECLAC, 2006), and one which has undoubtedly helped to maintain the global growth rate. The Chinese economy grew by 10.7% in 2006, thanks to buoyant domestic investment and exports, which makes for an average growth level approaching two digits over the last three decades. Growth during this period has been driven by the industrial sector. The share of services in GDP has also increased, while that of agriculture has dropped
(table 1). The buoyancy of the country’s export sector is also reflected by the favourable behaviour of its current account surplus.
India posted a growth rate of 9.2% in 2006, accompanied by a similar increase in consumption. The new economic programme implemented in 1991 –which focuses on economic liberalization and the correction of macroeconomic imbalances– enabled the country to achieve an average annual growth rate of 6.4% between 1995 and 2005. The Indian economy has been marked by significant structural change: the share of services in GDP has increased, while that of the agricultural sector has clearly diminished (table 1). Growth is expected to remain steady over the next few years, with the services sector driving economic development. The role of the manufacturing sector is not as prominent in India as it is in China; productivity in that sector has increased on a far more modest scale (UNCTAD, 2005). Inflation –a constant source of concern in India– is approximately 6%, notwithstanding an increase in oil prices. Unlike China, India has run a current account deficit for the past few years.
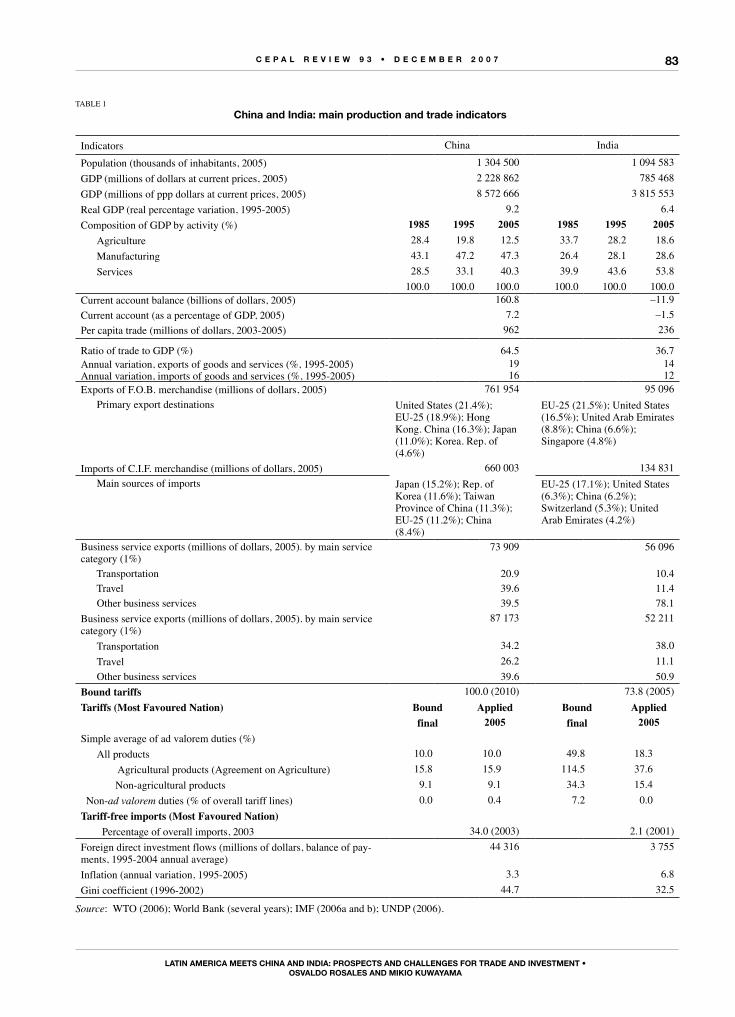
C E P A L R E V I E W 9 3 • D E C E M B E R 2 0 0 7
LAtIn AMERICA MEEts ChInA AnD InDIA: PRosPECts AnD ChALLEngEs foR tRADE AnD InVEstMEnt •osVALDo RosALEs AnD MIkIo kuWAyAMA
83
TAbLE 1
China and India: main production and trade indicators
Indicators China India
Population (thousands of inhabitants, 2005) 1 304 500 1 094 583
GDP (millions of dollars at current prices, 2005) 2 228 862 785 468
GDP (millions of ppp dollars at current prices, 2005) 8 572 666 3 815 553
Real GDP (real percentage variation, 1995-2005) 9.2 6.4
Composition of GDP by activity (%) 1985 1995 2005 1985 1995 2005 Agriculture 28.4 19.8 12.5 33.7 28.2 18.6
Manufacturing 43.1 47.2 47.3 26.4 28.1 28.6
Services 28.5 33.1 40.3 39.9 43.6 53.8
100.0 100.0 100.0 100.0 100.0 100.0Current account balance (billions of dollars, 2005) 160.8 –11.9
Current account (as a percentage of GDP, 2005) 7.2 –1.5
Per capita trade (millions of dollars, 2003-2005) 962 236
Ratio of trade to GDP (%) 64.5 36.7Annual variation, exports of goods and services (%, 1995-2005) 19 14Annual variation, imports of goods and services (%, 1995-2005) 16 12Exports of F.O.b. merchandise (millions of dollars, 2005) 761 954 95 096
Primary export destinations United States (21.4%); EU-25 (18.9%); Hong Kong. China (16.3%); Japan (11.0%); Korea. Rep. of (4.6%)
EU-25 (21.5%); United States (16.5%); United Arab Emirates (8.8%); China (6.6%); Singapore (4.8%)
Imports of C.I.F. merchandise (millions of dollars, 2005) 660 003 134 831
Main sources of imports Japan (15.2%); Rep. of Korea (11.6%); Taiwan Province of China (11.3%); EU-25 (11.2%); China (8.4%)
EU-25 (17.1%); United States (6.3%); China (6.2%); Switzerland (5.3%); United Arab Emirates (4.2%)
business service exports (millions of dollars, 2005). by main service category (1%)
73 909 56 096
Transportation 20.9 10.4 Travel 39.6 11.4 Other business services 39.5 78.1
Business service exports (millions of dollars, 2005). by main service category (1%)
87 173 52 211
Transportation 34.2 38.0
Travel 26.2 11.1
Other business services 39.6 50.9
Bound tariffs 100.0 (2010) 73.8 (2005)
Tariffs (Most Favoured Nation) Bound Applied Bound Applied final 2005 final 2005Simple average of ad valorem duties (%)
All products 10.0 10.0 49.8 18.3
Agricultural products (Agreement on Agriculture) 15.8 15.9 114.5 37.6
Non-agricultural products 9.1 9.1 34.3 15.4
Non-ad valorem duties (% of overall tariff lines) 0.0 0.4 7.2 0.0
Tariff-free imports (Most Favoured Nation)
Percentage of overall imports, 2003 34.0 (2003) 2.1 (2001)
Foreign direct investment flows (millions of dollars, balance of pay-ments, 1995-2004 annual average)
44 316 3 755
Inflation (annual variation, 1995-2005) 3.3 6.8
Gini coefficient (1996-2002) 44.7 32.5
Source: WTO (2006); World Bank (several years); IMF (2006a and b); UNDP (2006).
C E P A L R E V I E W 9 3 • D E C E M B E R 2 0 0 7
LAtIn AMERICA MEEts ChInA AnD InDIA: PRosPECts AnD ChALLEngEs foR tRADE AnD InVEstMEnt •osVALDo RosALEs AnD MIkIo kuWAyAMA
84
2. the growing role of China in the preservation of global macroeconomic balances
The importance of China is becoming abundantly clear, not only with regard to production and world trade, but also in terms of global finance. The country plays an increasingly active role in safeguarding global economic balances, and its plentiful supply of cheap goods helps keep demand high in developed countries without increasing inflation. It also provides the United States with cheap savings, keeps interest rates low and accumulates reserves through the purchase of Treasury bonds, thus helping to finance that country’s current account deficit.1 The slightest hint of action regarding these enormous reserves has immediate repercussions in global financial markets. India, on the contrary, plays a much smaller role in the world of international finance.2
Trade imbalances around the world continue to worsen. The current account deficit of the United States reached US$ 856.7 billion, or 6.5% of GDP, at the end of 2006. Sixty-three percent of this increase is attributed to a rise in imports from China; the current account deficit of the United States vis-à-vis China has risen from US$ 220.1 billion to US$ 261.7 billion. This enormous deficit is offset globally by the growing surpluses of emerging Asian nations (particularly China),3 oil-exporting countries and Latin American and Caribbean countries. The latter were responsible for almost 14% of the United States deficit in 2005. The United States ran a current account deficit with India approaching US$ 12 billion in both 2005 and 2006.
The behaviour of the Chinese yuan in 2006 did little to help the United States adjust to its external imbalances. After restrictions on the exchange rate were relaxed in July 2005, the yuan appreciated 7% until August 2007. While the consequences of a substantial revaluation of the yuan are impossible to predict, a revaluation of the exchange rate in China and in most other Asian countries would not be enough to bring the trade imbalance of the United States within a sustainable range. United States
1 As of December 2006, China held US$ 350 billion in United States Treasury bonds – over half the amount held by Japan (US$ 644 billion). As of that date, Chinese reserves exceeded US$ 1.066 billion, surpassing those of Japan (US$ 875 billion). Chinese reserves are equivalent to over 40% of GDP. 2 As of late 2006, the Reserve bank of India held reserves total-ling US$ 177 billion; it held only US$ 14 billion in United States Treasury bonds.3 China has become an important trading partner for the United States –so much so that, in 2005, it was responsible for 14.6% of total imports to that country, compared to a mere 3.2% for India.
authorities continue to pressure the Chinese government to liberalize its exchange regime, and legislation has been proposed to adopt retaliatory measures if it fails to do so. The Indian rupee has closely followed the trends set by international financial markets. In real terms, measured against other relevant currencies, its value is 6% higher than the average of the last 15 years. If the country’s slide toward a deficit in the current account persists, the real exchange rate may depreciate.
3. the rise of China and India in world trade
In 2006, the combined exports of China and India comprised 9.2% of the world total (compared to 4.5% in 2000). Chinese exports grew by 27%, reaching a total of US$ 969 billion, or 1.5 times the exports of Latin America and the Caribbean. Indian exports and imports in 2006 totalled US$ 120 billion and US$ 174 billion, respectively.
The United States and the European Union constitute important export markets for both China and India (table 1). Neighbouring Asia-Pacific countries also hold a significant share of Chinese trade; this is particularly true of the Hong Kong Special Administrative Region (SAR) of China and Taiwan Province of China, as well as Japan, the Republic of Korea and the countries that comprise the Association of Southeast Asian Nations (ASEAN). As will be explained below, many of China’s Asian neighbours are using it as a springboard for exports to the United States and Europe. These countries have also become important markets for India: Asia and Oceania together accounted for about 35% of total Indian exports and imports during the 2005/2006 fiscal year. Western Africa and the Middle East are also important markets for Indian products. The share of Latin America and the Caribbean in the trade of the two Asian nations amounts to only 3%.
China and India are among the world’s ten leading exporters and importers of business services. The buoyancy of Indian service exports is particularly striking; they have grown at over twice the rate of Chinese exports since 2003, rapidly approaching the levels of that country and those of Latin America and the Caribbean. The “Other business Services” category, which includes the subsectors that have displayed the highest levels of growth worldwide (for example, communication services, construction services, insurance services, computer and related services, royalties and licensing rights, personal services, cultural services, recreational services and other business services) accounts for 78% of Indian business-service exports, far surpassing the other two
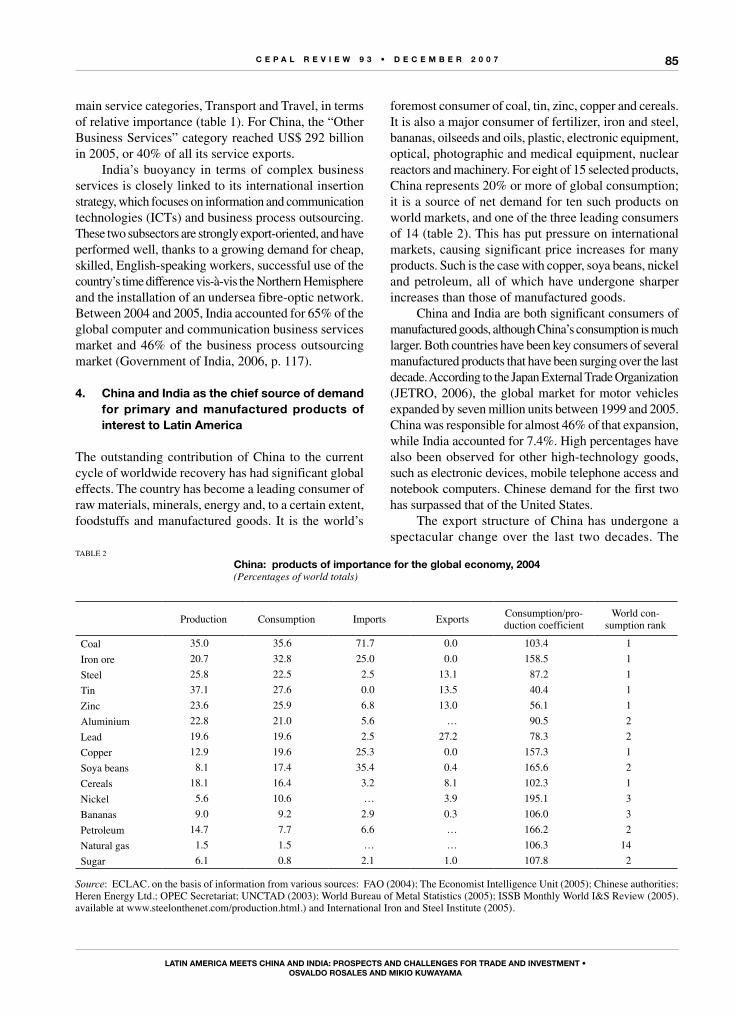
C E P A L R E V I E W 9 3 • D E C E M B E R 2 0 0 7
LAtIn AMERICA MEEts ChInA AnD InDIA: PRosPECts AnD ChALLEngEs foR tRADE AnD InVEstMEnt •osVALDo RosALEs AnD MIkIo kuWAyAMA
85
main service categories, Transport and Travel, in terms of relative importance (table 1). For China, the “Other business Services” category reached US$ 292 billion in 2005, or 40% of all its service exports.
India’s buoyancy in terms of complex business services is closely linked to its international insertion strategy, which focuses on information and communication technologies (ICTs) and business process outsourcing. These two subsectors are strongly export-oriented, and have performed well, thanks to a growing demand for cheap, skilled, English-speaking workers, successful use of the country’s time difference vis-à-vis the Northern Hemisphere and the installation of an undersea fibre-optic network. between 2004 and 2005, India accounted for 65% of the global computer and communication business services market and 46% of the business process outsourcing market (Government of India, 2006, p. 117).
4. China and India as the chief source of demand for primary and manufactured products of interest to Latin America
The outstanding contribution of China to the current cycle of worldwide recovery has had significant global effects. The country has become a leading consumer of raw materials, minerals, energy and, to a certain extent, foodstuffs and manufactured goods. It is the world’s
foremost consumer of coal, tin, zinc, copper and cereals. It is also a major consumer of fertilizer, iron and steel, bananas, oilseeds and oils, plastic, electronic equipment, optical, photographic and medical equipment, nuclear reactors and machinery. For eight of 15 selected products, China represents 20% or more of global consumption; it is a source of net demand for ten such products on world markets, and one of the three leading consumers of 14 (table 2). This has put pressure on international markets, causing significant price increases for many products. Such is the case with copper, soya beans, nickel and petroleum, all of which have undergone sharper increases than those of manufactured goods.
China and India are both significant consumers of manufactured goods, although China’s consumption is much larger. both countries have been key consumers of several manufactured products that have been surging over the last decade. According to the Japan External Trade Organization (JETRO, 2006), the global market for motor vehicles expanded by seven million units between 1999 and 2005. China was responsible for almost 46% of that expansion, while India accounted for 7.4%. High percentages have also been observed for other high-technology goods, such as electronic devices, mobile telephone access and notebook computers. Chinese demand for the first two has surpassed that of the United States.
The export structure of China has undergone a spectacular change over the last two decades. The
TAbLE 2
China: products of importance for the global economy, 2004(Percentages of world totals)
Production Consumption Imports Exports Consumption/pro-duction coefficient
World con-sumption rank
Coal 35.0 35.6 71.7 0.0 103.4 1
Iron ore 20.7 32.8 25.0 0.0 158.5 1
Steel 25.8 22.5 2.5 13.1 87.2 1
Tin 37.1 27.6 0.0 13.5 40.4 1
Zinc 23.6 25.9 6.8 13.0 56.1 1
Aluminium 22.8 21.0 5.6 … 90.5 2
Lead 19.6 19.6 2.5 27.2 78.3 2
Copper 12.9 19.6 25.3 0.0 157.3 1
Soya beans 8.1 17.4 35.4 0.4 165.6 2
Cereals 18.1 16.4 3.2 8.1 102.3 1
Nickel 5.6 10.6 … 3.9 195.1 3
Bananas 9.0 9.2 2.9 0.3 106.0 3
Petroleum 14.7 7.7 6.6 … 166.2 2
Natural gas 1.5 1.5 … … 106.3 14
Sugar 6.1 0.8 2.1 1.0 107.8 2
Source: ECLAC. on the basis of information from various sources: FAO (2004); The Economist Intelligence Unit (2005); Chinese authorities; Heren Energy Ltd.; OPEC Secretariat; UNCTAD (2003); World Bureau of Metal Statistics (2005); ISSB Monthly World I&S Review (2005). available at www.steelonthenet.com/production.html.) and International Iron and Steel Institute (2005).
C E P A L R E V I E W 9 3 • D E C E M B E R 2 0 0 7
LAtIn AMERICA MEEts ChInA AnD InDIA: PRosPECts AnD ChALLEngEs foR tRADE AnD InVEstMEnt •osVALDo RosALEs AnD MIkIo kuWAyAMA
86
country has been transformed from an exporter of crude and refined oil and wearing apparel into a source of electronic goods and information and communication technologies. This transformation does not imply, however, that China has become a leading producer and exporter of such goods. As branstetter and Lardy (2006) have noted, most of these products have become high-volume quasi-commodities (DVD players, notebook computers and mobile telephones). In addition, these booming sectors require high levels of imported inputs to increase their exports. Domestic value added is low, and accounts for only 15% of the value exported by the electronics and ICT sectors. China’s role in this regard remains that of an assembler relying on labour-intensive production processes.
Furthermore, most assembly work is handled not by Chinese firms, but rather by foreign companies –particularly Taiwanese firms– that use China as an export platform. This suggests that China is still far from transforming itself from a net importer into a net exporter of high-technology goods.
5. the role of foreign firms in production and foreign trade
The international insertion strategies of China and India differ considerably. China has structured its international expansion around the attraction of foreign direct investment (FDI) for export production, whereas India has, until recently, been wary of opening its economy to this type of investment. Of the various types of foreign enterprises active in China, wholly foreign-owned firms make the largest contribution in terms of FDI. Such firms accounted for 62% of all FDI in China in 2005, far surpassing joint ventures. Foreign firms, whether wholly foreign-owned or of mixed ownership, represent only 3% of all firms in China, but contribute 28.5% of the country’s total industrial value added, 20.5% of its tax revenue and 58% of its overall exports. They are also responsible for 89% of high-technology exports. Notwithstanding the tremendous export output of its foreign firms, China’s trade is concentrated in a relatively limited number of companies.
While China has been a major net recipient of FDI over the past two decades, lately it has been investing abroad itself. In fact, among developing countries, it is now the world’s sixth-largest source of FDI. As of late 2004, non-financial Chinese companies held a stock of US$ 33.2 billion abroad, of which US$ 2.85 billion was invested in 2003. Notwithstanding its relatively small role, China is emerging as a leading investor among
developing countries, with investments comparable to those of the Republic of Korea. Chinese FDI abroad was valued at US$ 5.5 billion in 2004, of which 32% (1.76 billion) was invested in Latin America and the Caribbean. The presence of Lenovo in the Mexican state of Chihuahua is one important example of Chinese FDI in the region. The firm has established four plants for the manufacture of spare parts and equipment in Chihuahua (Government of China, 2006). Latin American FDI in China has also increased. According to the Chinese Ministry of Commerce, Latin American firms had financed 17 956 projects in China, for a total of US$ 56.9 billion, as of late 2005.4
India has been slower to open its economy to FDI. Inflows of foreign capital during the 2005/2006 fiscal year amounted to only US$ 5.1 billion. This is the highest amount on record, however, and represents a 60% increase compared to the previous year. This surge in FDI appears to be a result of policies designed to attract investors. Such policies include the establishment of special economic areas.
6. Challenges and prospects
Another significant difference between China and India lies in the fact that trade liberalization has been less extensive in India than it has in China (table 1). Chinese tariffs are low and linear, whereas India clings to pockets of protection, particularly in the agricultural sector. China has adopted commitments in every sector of business services covered by the General Agreement on Trade in Services (GATS) –93 sectors, including the financial and telecommunication services subsectors– whereas India has adopted commitments in only 37 sectors (WTO, 2006). The reduction of tariffs and non-tariff barriers within the framework of the ASEAN trade agreement with China, as well as the trade agreement between China and India –which may enter into force in 2007, and covers both manufactured and agricultural products– may have a significant impact on the future of Latin American trade with the two Asian countries, particularly in terms of diversion of trade.
As mentioned above, India continues to develop, and displays great potential for further growth in the field of information and communication technologies and business process outsourcing. ICTs comprise only a small fraction of the overall services sector,
4 Information available at http://www.gov.cn/misc/2006-10/06/con-tent_405906.htm .
C E P A L R E V I E W 9 3 • D E C E M B E R 2 0 0 7
LAtIn AMERICA MEEts ChInA AnD InDIA: PRosPECts AnD ChALLEngEs foR tRADE AnD InVEstMEnt •osVALDo RosALEs AnD MIkIo kuWAyAMA
87
however. One significant impediment to the expansion of these services is the current lack of investment in technological and human capital, given the tremendous growth of these technologies. A strong link has yet to be forged between trade and FDI, as it has been in China. This not only hampers India’s insertion into global markets for commodities involving value added and knowledge, but also hinders its inclusion in the dynamic network of intra-industry and intra-firm trade in the Asian region.
The acceleration of China’s booming economy in 2006 and the first semester of 2007 spotlights the risk of uncontrolled growth, which, driven by the country’s enormous trade surplus, might lead to justified pressures to appreciate the yuan. In fact, there is no guarantee that growth will slow. As stated in the eleventh Five-Year Social and Economic Development Plan (2006-2010), the country must urgently address the structural weaknesses caused by its rapid industrialization and modernization. These weaknesses include idle capacity in certain sectors, deepening income inequality –particularly between urban and rural areas, and between the coast and the
interior– and serious environmental problems. The main objective of the Plan is to promote a more balanced, equitable and sustainable approach to growth, using strategies specifically designed to correct the problems in question. It may alter the composition of aggregate demand and slow economic growth, in order to make it more sustainable in the long term.
In the short-term, India’s prospects are promising: growth will continue at a rate of seven percent to nine percent over the next few years, with moderate inflation. In the medium term, however, the country will be faced with high public debt, a growing current account deficit and a need for reform. It is imperative that the government continue to strengthen its fiscal position, while also improving the country’s infrastructure (particularly its power supply and road network), in order to support industrial development. It must also promote the training of human resources in the services sector, and make the investments necessary to increase rural productivity.
IIIgrowing trade relations between Latin America
and the Caribbean and China and India
defence mechanisms, such as antidumping. To that end, it has worked to obtain the “market-economy status” awarded by 27 countries, seven of which are located in Latin America and the Caribbean (ECLAC, 2005).
1. trade between China and south America, Central America and Mexico
While the growth of China and its increasing demand for primary products have had a positive impact on the terms of trade, results have been uneven among the subregions of Latin America and the Caribbean. The countries of South America –particularly those which export oil and metal– have benefited from rising Chinese demand for commodities and the low prices of Chinese manufactures. The prices of these products have favoured terms of trade of these countries which encourage savings and fiscal accounts. On the other hand,
Trade between the countries of the region and China and India increased considerably between 1990 and 2005 –particularly during the last five years of that period. The patterns of exchange of the two Asian nations and those of the subregions of Latin America are strikingly similar. South America enjoys trade surpluses with both countries, while Mexico and Central America run growing deficits (table 3). The structure of the region’s exports to China and India is characterized by a predominance of natural resources and natural-resource-based manufactures. This stands in sharp contrast to the structure of intraregional Latin American trade, which is characterized by a high percentage of medium-technology products. China must ensure a supply of raw materials, foodstuffs and energy products to support its rapid growth. It is also seeking a favourable market for its exports, and wishes to quash allegations that it employs “abusive” trade
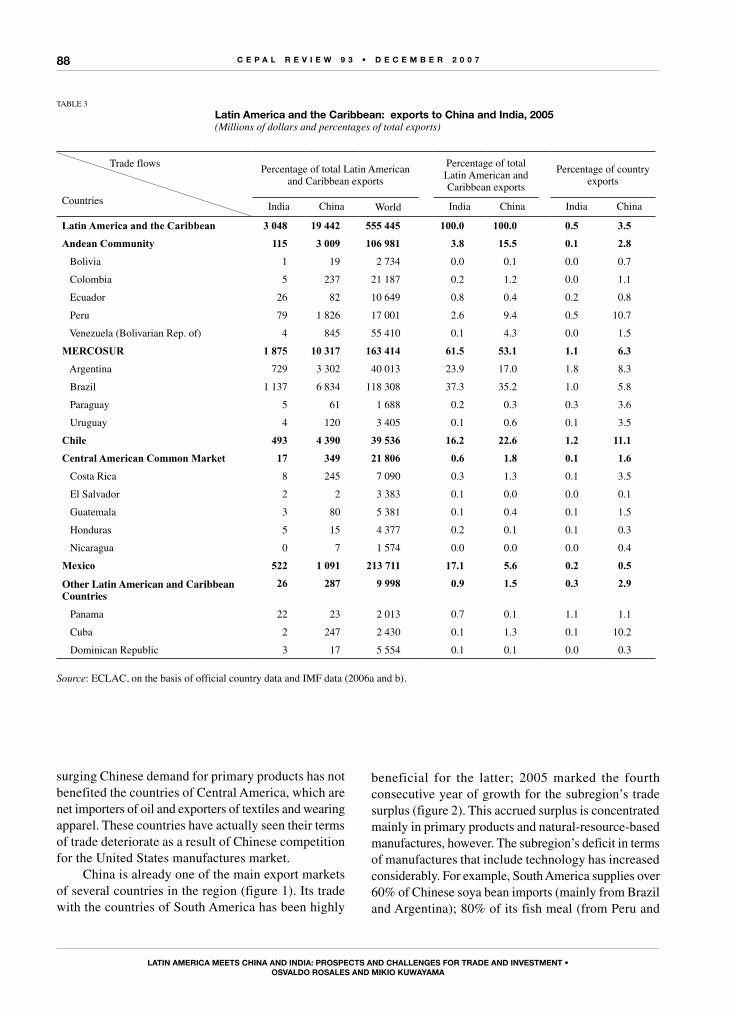
C E P A L R E V I E W 9 3 • D E C E M B E R 2 0 0 7
LAtIn AMERICA MEEts ChInA AnD InDIA: PRosPECts AnD ChALLEngEs foR tRADE AnD InVEstMEnt •osVALDo RosALEs AnD MIkIo kuWAyAMA
88
TAbLE 3
Latin America and the Caribbean: exports to China and India, 2005(Millions of dollars and percentages of total exports)
Trade flows
Countries
Percentage of total Latin American and Caribbean exports
Percentage of total Latin American and Caribbean exports
Percentage of country exports
India China World India China India China
Latin America and the Caribbean 3 048 19 442 555 445 100.0 100.0 0.5 3.5
Andean Community 115 3 009 106 981 3.8 15.5 0.1 2.8
bolivia 1 19 2 734 0.0 0.1 0.0 0.7
Colombia 5 237 21 187 0.2 1.2 0.0 1.1
Ecuador 26 82 10 649 0.8 0.4 0.2 0.8
Peru 79 1 826 17 001 2.6 9.4 0.5 10.7
Venezuela (bolivarian Rep. of) 4 845 55 410 0.1 4.3 0.0 1.5
MerCosur 1 875 10 317 163 414 61.5 53.1 1.1 6.3
Argentina 729 3 302 40 013 23.9 17.0 1.8 8.3
brazil 1 137 6 834 118 308 37.3 35.2 1.0 5.8
Paraguay 5 61 1 688 0.2 0.3 0.3 3.6
Uruguay 4 120 3 405 0.1 0.6 0.1 3.5
Chile 493 4 390 39 536 16.2 22.6 1.2 11.1
Central American Common Market 17 349 21 806 0.6 1.8 0.1 1.6
Costa Rica 8 245 7 090 0.3 1.3 0.1 3.5
El Salvador 2 2 3 383 0.1 0.0 0.0 0.1
Guatemala 3 80 5 381 0.1 0.4 0.1 1.5
Honduras 5 15 4 377 0.2 0.1 0.1 0.3
Nicaragua 0 7 1 574 0.0 0.0 0.0 0.4
Mexico 522 1 091 213 711 17.1 5.6 0.2 0.5
Other Latin American and Caribbean Countries
26 287 9 998 0.9 1.5 0.3 2.9
Panama 22 23 2 013 0.7 0.1 1.1 1.1
Cuba 2 247 2 430 0.1 1.3 0.1 10.2
Dominican Republic 3 17 5 554 0.1 0.1 0.0 0.3
Source: ECLAC, on the basis of official country data and IMF data (2006a and b).
surging Chinese demand for primary products has not benefited the countries of Central America, which are net importers of oil and exporters of textiles and wearing apparel. These countries have actually seen their terms of trade deteriorate as a result of Chinese competition for the United States manufactures market.
China is already one of the main export markets of several countries in the region (figure 1). Its trade with the countries of South America has been highly
beneficial for the latter; 2005 marked the fourth consecutive year of growth for the subregion’s trade surplus (figure 2). This accrued surplus is concentrated mainly in primary products and natural-resource-based manufactures, however. The subregion’s deficit in terms of manufactures that include technology has increased considerably. For example, South America supplies over 60% of Chinese soya bean imports (mainly from brazil and Argentina); 80% of its fish meal (from Peru and
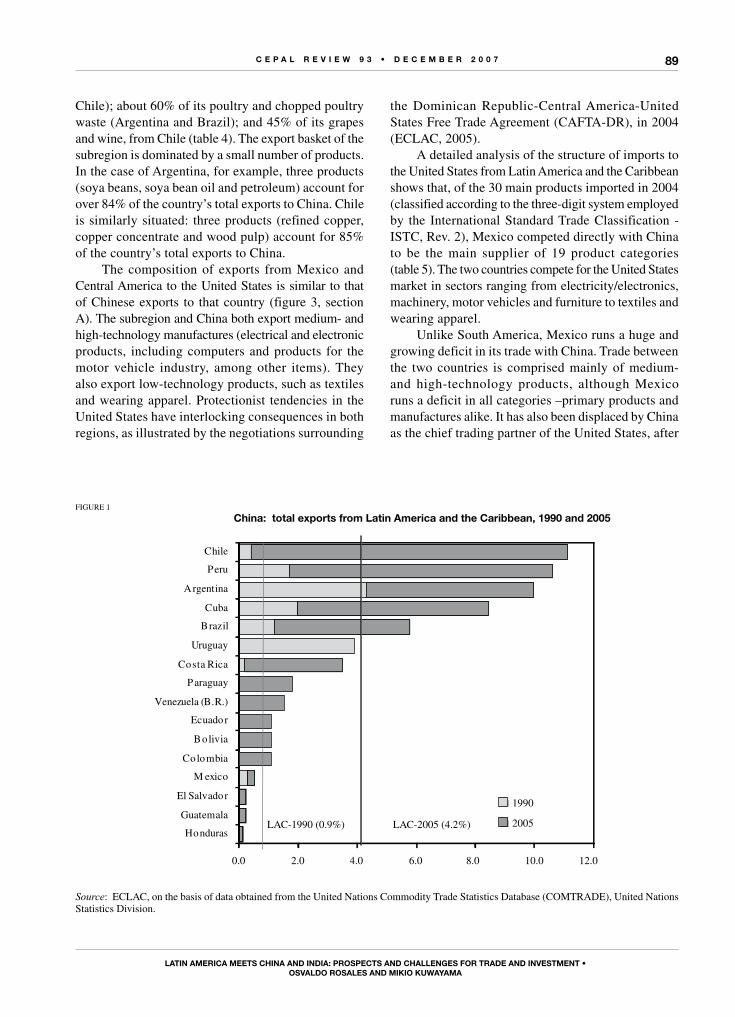
C E P A L R E V I E W 9 3 • D E C E M B E R 2 0 0 7
LAtIn AMERICA MEEts ChInA AnD InDIA: PRosPECts AnD ChALLEngEs foR tRADE AnD InVEstMEnt •osVALDo RosALEs AnD MIkIo kuWAyAMA
89
Chile); about 60% of its poultry and chopped poultry waste (Argentina and brazil); and 45% of its grapes and wine, from Chile (table 4). The export basket of the subregion is dominated by a small number of products. In the case of Argentina, for example, three products (soya beans, soya bean oil and petroleum) account for over 84% of the country’s total exports to China. Chile is similarly situated: three products (refined copper, copper concentrate and wood pulp) account for 85% of the country’s total exports to China.
The composition of exports from Mexico and Central America to the United States is similar to that of Chinese exports to that country (figure 3, section A). The subregion and China both export medium- and high-technology manufactures (electrical and electronic products, including computers and products for the motor vehicle industry, among other items). They also export low-technology products, such as textiles and wearing apparel. Protectionist tendencies in the United States have interlocking consequences in both regions, as illustrated by the negotiations surrounding
the Dominican Republic-Central America-United States Free Trade Agreement (CAFTA-DR), in 2004 (ECLAC, 2005).
A detailed analysis of the structure of imports to the United States from Latin America and the Caribbean shows that, of the 30 main products imported in 2004 (classified according to the three-digit system employed by the International Standard Trade Classification - ISTC, Rev. 2), Mexico competed directly with China to be the main supplier of 19 product categories (table 5). The two countries compete for the United States market in sectors ranging from electricity/electronics, machinery, motor vehicles and furniture to textiles and wearing apparel.
Unlike South America, Mexico runs a huge and growing deficit in its trade with China. Trade between the two countries is comprised mainly of medium- and high-technology products, although Mexico runs a deficit in all categories –primary products and manufactures alike. It has also been displaced by China as the chief trading partner of the United States, after
0.0 2.0 4.0 6.0 8.0 10.0 12.0
Honduras
Guatemala
El Salvador
M exico
Colombia
Bolivia
Ecuador
Venezuela (B.R.)
Paraguay
Costa Rica
Uruguay
Brazil
Cuba
Argentina
Peru
Chile
1990
2005LAC-1990 (0.9%) LAC-2005 (4.2%)
Source: ECLAC, on the basis of data obtained from the United Nations Commodity Trade Statistics Database (COMTRADE), United Nations Statistics Division.
FIGURE 1
China: total exports from Latin America and the Caribbean, 1990 and 2005
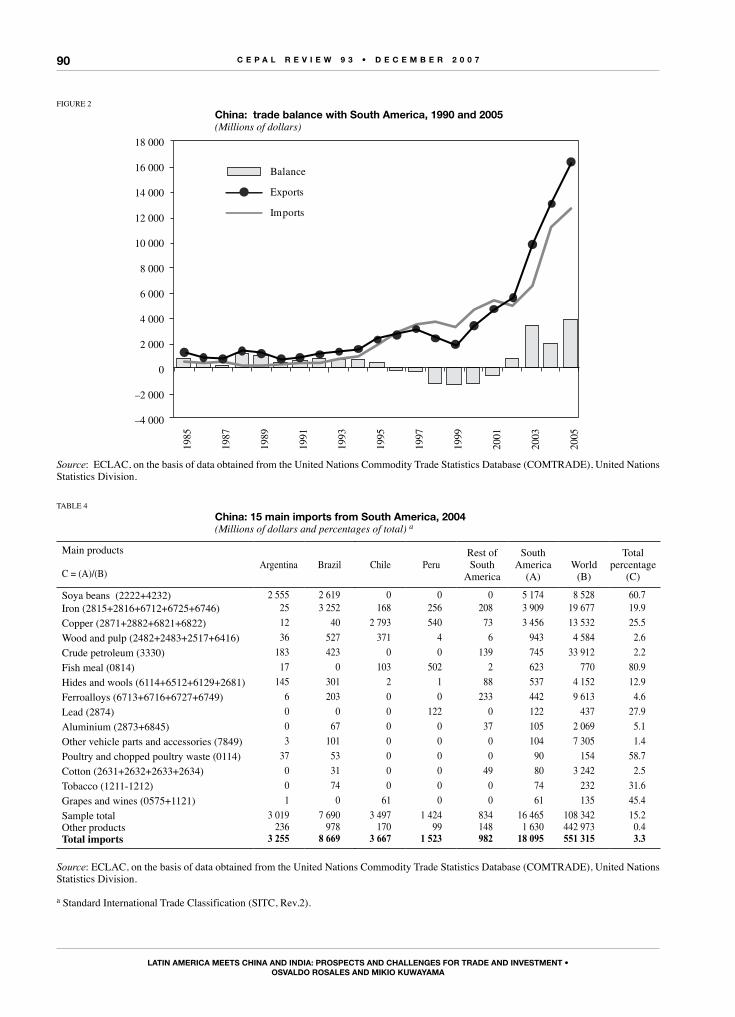
C E P A L R E V I E W 9 3 • D E C E M B E R 2 0 0 7
LAtIn AMERICA MEEts ChInA AnD InDIA: PRosPECts AnD ChALLEngEs foR tRADE AnD InVEstMEnt •osVALDo RosALEs AnD MIkIo kuWAyAMA
90
FIGURE 2
China: trade balance with south America, 1990 and 2005(Millions of dollars)
Source: ECLAC, on the basis of data obtained from the United Nations Commodity Trade Statistics Database (COMTRADE), United Nations Statistics Division.
TAbLE 4
China: 15 main imports from south America, 2004(Millions of dollars and percentages of total) a
Main products Argentina brazil Chile Peru
Rest of South
America
South America
(A)World
(b)
Total percentage
(C)C = (A)/(b)
Soya beans (2222+4232) 2 555 2 619 0 0 0 5 174 8 528 60.7Iron (2815+2816+6712+6725+6746) 25 3 252 168 256 208 3 909 19 677 19.9
Copper (2871+2882+6821+6822) 12 40 2 793 540 73 3 456 13 532 25.5
Wood and pulp (2482+2483+2517+6416) 36 527 371 4 6 943 4 584 2.6
Crude petroleum (3330) 183 423 0 0 139 745 33 912 2.2
Fish meal (0814) 17 0 103 502 2 623 770 80.9
Hides and wools (6114+6512+6129+2681) 145 301 2 1 88 537 4 152 12.9
Ferroalloys (6713+6716+6727+6749) 6 203 0 0 233 442 9 613 4.6
Lead (2874) 0 0 0 122 0 122 437 27.9
Aluminium (2873+6845) 0 67 0 0 37 105 2 069 5.1
Other vehicle parts and accessories (7849) 3 101 0 0 0 104 7 305 1.4
Poultry and chopped poultry waste (0114) 37 53 0 0 0 90 154 58.7
Cotton (2631+2632+2633+2634) 0 31 0 0 49 80 3 242 2.5
Tobacco (1211-1212) 0 74 0 0 0 74 232 31.6
Grapes and wines (0575+1121) 1 0 61 0 0 61 135 45.4
Sample total 3 019 7 690 3 497 1 424 834 16 465 108 342 15.2Other products 236 978 170 99 148 1 630 442 973 0.4Total imports 3 255 8 669 3 667 1 523 982 18 095 551 315 3.3
Source: ECLAC, on the basis of data obtained from the United Nations Commodity Trade Statistics Database (COMTRADE), United Nations Statistics Division.
a Standard International Trade Classification (SITC, Rev.2).
–4 000
–2 000
0
2 000
4 000
6 000
8 000
10 000
12 000
14 000
16 000
18 000
1985
1987
1989
1991
1993
1995
1997
1999
2001
2003
2005
Balance
Exports
Imports
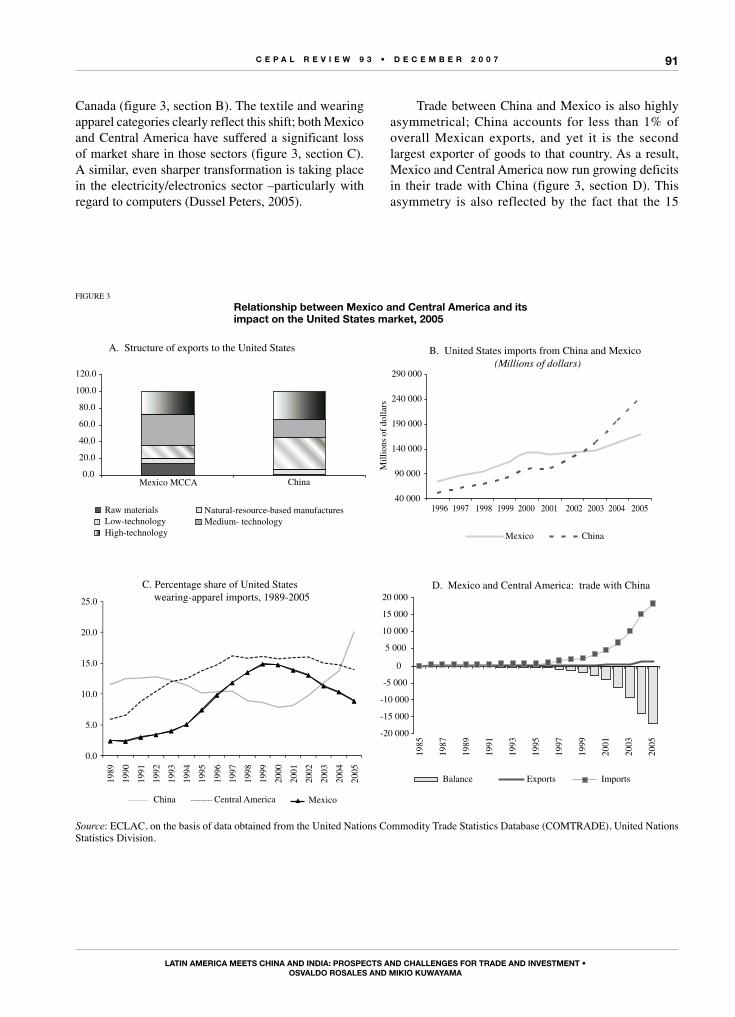
C E P A L R E V I E W 9 3 • D E C E M B E R 2 0 0 7
LAtIn AMERICA MEEts ChInA AnD InDIA: PRosPECts AnD ChALLEngEs foR tRADE AnD InVEstMEnt •osVALDo RosALEs AnD MIkIo kuWAyAMA
91
Canada (figure 3, section b). The textile and wearing apparel categories clearly reflect this shift; both Mexico and Central America have suffered a significant loss of market share in those sectors (figure 3, section C). A similar, even sharper transformation is taking place in the electricity/electronics sector –particularly with regard to computers (Dussel Peters, 2005).
Trade between China and Mexico is also highly asymmetrical; China accounts for less than 1% of overall Mexican exports, and yet it is the second largest exporter of goods to that country. As a result, Mexico and Central America now run growing deficits in their trade with China (figure 3, section D). This asymmetry is also reflected by the fact that the 15
FIGURE 3
Relationship between Mexico and Central America and its impact on the united states market, 2005
Source: ECLAC, on the basis of data obtained from the United Nations Commodity Trade Statistics Database (COMTRADE), United Nations Statistics Division.
0.0
5.0
10.0
15.0
20.0
25.0
1989
1990
1991
1992
1993
1994
1995
1996
1997
1998
1999
2000
2001
2002
2003
2004
2005
1985
1987
1989
1991
1993
1995
1997
1999
2001
2003
2005
China Central America Mexico
40 000
90 000
140 000
190 000
240 000
290 000
5002 4002 3002 2002 1002 0002 9991 8991 7991 6991
Mexico China
0.0
20.0
40.0
60.0
80.0
100.0
120.0
Raw materials
Mexico MCCA China
Natural-resource-based manufacturesLow-technology Medium- technologyHigh-technology
C. Percentage share of United States wearing-apparel imports, 1989-2005
D. Mexico and Central America: trade with China
Mill
ions
of
dolla
rs
-20 000
-15 000
-10 000
-5 000
0
5 000
10 000
15 000
20 000
Balance Exports Imports
A. Structure of exports to the United States B. United States imports from China and Mexico(Millions of dollars)
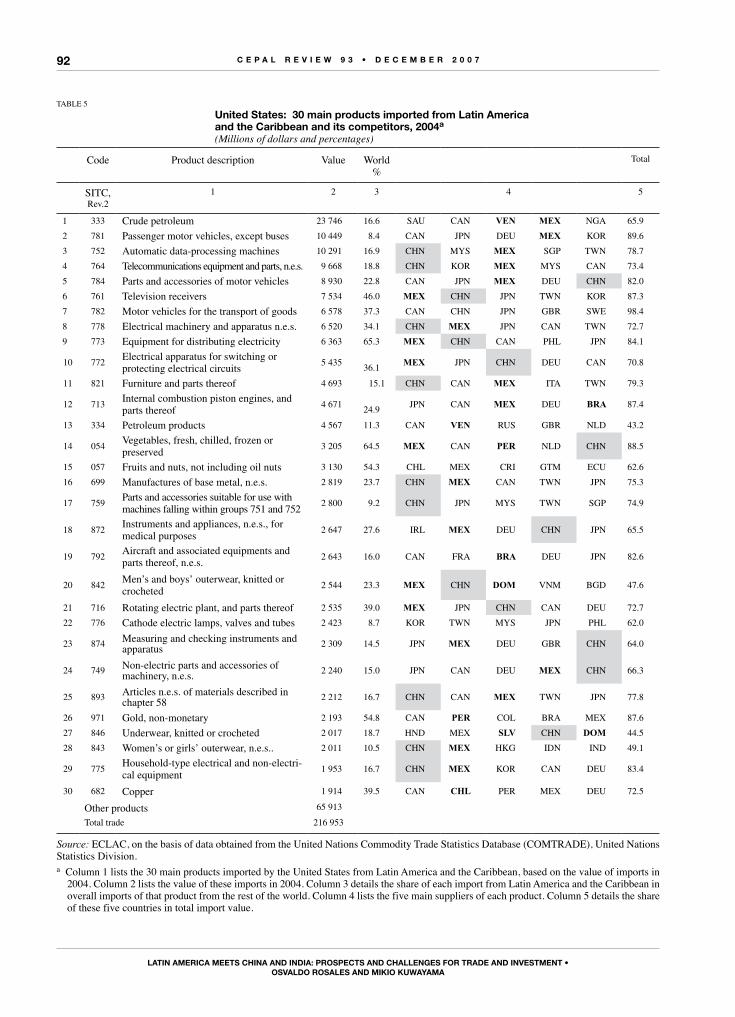
C E P A L R E V I E W 9 3 • D E C E M B E R 2 0 0 7
LAtIn AMERICA MEEts ChInA AnD InDIA: PRosPECts AnD ChALLEngEs foR tRADE AnD InVEstMEnt •osVALDo RosALEs AnD MIkIo kuWAyAMA
92
TAbLE 5
united states: 30 main products imported from Latin America and the Caribbean and its competitors, 2004a (Millions of dollars and percentages)
Code Product description Value World %
Total
SITC, Rev.2
1 2 3 4 5
1 333 Crude petroleum 23 746 16.6 SAU CAN VeN MeX NGA 65.9
2 781 Passenger motor vehicles, except buses 10 449 8.4 CAN JPN DEU MeX KOR 89.6
3 752 Automatic data-processing machines 10 291 16.9 CHN MYS MeX SGP TWN 78.7
4 764 Telecommunications equipment and parts, n.e.s. 9 668 18.8 CHN KOR MeX MYS CAN 73.4
5 784 Parts and accessories of motor vehicles 8 930 22.8 CAN JPN MeX DEU CHN 82.0
6 761 Television receivers 7 534 46.0 MeX CHN JPN TWN KOR 87.3
7 782 Motor vehicles for the transport of goods 6 578 37.3 CAN CHN JPN GbR SWE 98.4
8 778 Electrical machinery and apparatus n.e.s. 6 520 34.1 CHN MeX JPN CAN TWN 72.7
9 773 Equipment for distributing electricity 6 363 65.3 MeX CHN CAN PHL JPN 84.1
10 772Electrical apparatus for switching or protecting electrical circuits
5 435
36.1MeX JPN CHN DEU CAN 70.8
11 821 Furniture and parts thereof 4 693 15.1 CHN CAN MeX ITA TWN 79.3
12 713Internal combustion piston engines, and parts thereof
4 67124.9
JPN CAN MeX DEU BrA 87.4
13 334 Petroleum products 4 567 11.3 CAN VeN RUS GbR NLD 43.2
14 054Vegetables, fresh, chilled, frozen or preserved
3 205 64.5 MeX CAN Per NLD CHN 88.5
15 057 Fruits and nuts, not including oil nuts 3 130 54.3 CHL MEX CRI GTM ECU 62.6
16 699 Manufactures of base metal, n.e.s. 2 819 23.7 CHN MeX CAN TWN JPN 75.3
17 759Parts and accessories suitable for use with machines falling within groups 751 and 752
2 800 9.2 CHN JPN MYS TWN SGP 74.9
18 872Instruments and appliances, n.e.s., for medical purposes
2 647 27.6 IRL MeX DEU CHN JPN 65.5
19 792Aircraft and associated equipments and parts thereof, n.e.s.
2 643 16.0 CAN FRA BrA DEU JPN 82.6
20 842Men’s and boys’ outerwear, knitted or crocheted
2 544 23.3 MeX CHN DoM VNM bGD 47.6
21 716 Rotating electric plant, and parts thereof 2 535 39.0 MeX JPN CHN CAN DEU 72.7
22 776 Cathode electric lamps, valves and tubes 2 423 8.7 KOR TWN MYS JPN PHL 62.0
23 874 Measuring and checking instruments and apparatus 2 309 14.5 JPN MeX DEU GbR CHN 64.0
24 749 Non-electric parts and accessories of machinery, n.e.s. 2 240 15.0 JPN CAN DEU MeX CHN 66.3
25 893 Articles n.e.s. of materials described in chapter 58 2 212 16.7 CHN CAN MeX TWN JPN 77.8
26 971 Gold, non-monetary 2 193 54.8 CAN Per COL bRA MEX 87.6
27 846 Underwear, knitted or crocheted 2 017 18.7 HND MEX sLV CHN DoM 44.5
28 843 Women’s or girls’ outerwear, n.e.s.. 2 011 10.5 CHN MeX HKG IDN IND 49.1
29 775Household-type electrical and non-electri-cal equipment
1 953 16.7 CHN MeX KOR CAN DEU 83.4
30 682 Copper 1 914 39.5 CAN CHL PER MEX DEU 72.5
Other products 65 913
Total trade 216 953
Source: ECLAC, on the basis of data obtained from the United Nations Commodity Trade Statistics Database (COMTRADE), United Nations Statistics Division.a Column 1 lists the 30 main products imported by the United States from Latin America and the Caribbean, based on the value of imports in
2004. Column 2 lists the value of these imports in 2004. Column 3 details the share of each import from Latin America and the Caribbean in overall imports of that product from the rest of the world. Column 4 lists the five main suppliers of each product. Column 5 details the share of these five countries in total import value.
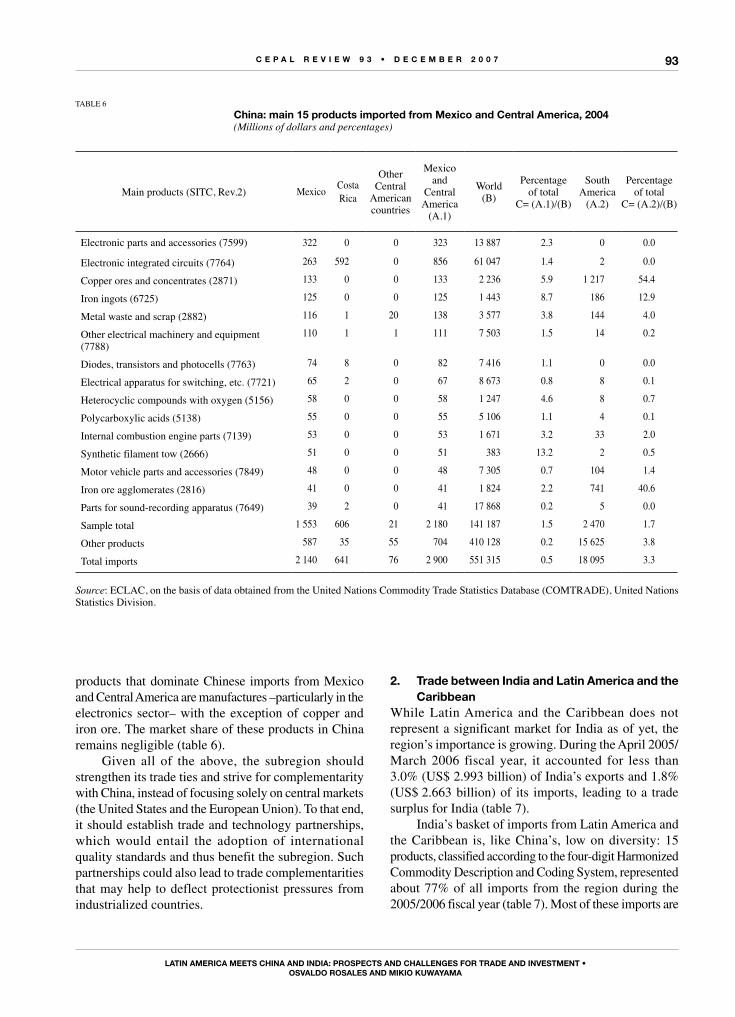
C E P A L R E V I E W 9 3 • D E C E M B E R 2 0 0 7
LAtIn AMERICA MEEts ChInA AnD InDIA: PRosPECts AnD ChALLEngEs foR tRADE AnD InVEstMEnt •osVALDo RosALEs AnD MIkIo kuWAyAMA
93
products that dominate Chinese imports from Mexico and Central America are manufactures –particularly in the electronics sector– with the exception of copper and iron ore. The market share of these products in China remains negligible (table 6).
Given all of the above, the subregion should strengthen its trade ties and strive for complementarity with China, instead of focusing solely on central markets (the United States and the European Union). To that end, it should establish trade and technology partnerships, which would entail the adoption of international quality standards and thus benefit the subregion. Such partnerships could also lead to trade complementarities that may help to deflect protectionist pressures from industrialized countries.
2. trade between India and Latin America and the Caribbean
While Latin America and the Caribbean does not represent a significant market for India as of yet, the region’s importance is growing. During the April 2005/ March 2006 fiscal year, it accounted for less than 3.0% (US$ 2.993 billion) of India’s exports and 1.8% (US$ 2.663 billion) of its imports, leading to a trade surplus for India (table 7).
India’s basket of imports from Latin America and the Caribbean is, like China’s, low on diversity: 15 products, classified according to the four-digit Harmonized Commodity Description and Coding System, represented about 77% of all imports from the region during the 2005/2006 fiscal year (table 7). Most of these imports are
TAbLE 6
China: main 15 products imported from Mexico and Central America, 2004(Millions of dollars and percentages)
Main products (SITC, Rev.2) MexicoCosta Rica
Other Central
American countries
Mexico and
Central America
(A.1)
World (B)
Percentage of total
C= (A.1)/(B)
South America
(A.2)
Percentage of total
C= (A.2)/(B)
Electronic parts and accessories (7599) 322 0 0 323 13 887 2.3 0 0.0
Electronic integrated circuits (7764) 263 592 0 856 61 047 1.4 2 0.0
Copper ores and concentrates (2871) 133 0 0 133 2 236 5.9 1 217 54.4
Iron ingots (6725) 125 0 0 125 1 443 8.7 186 12.9
Metal waste and scrap (2882) 116 1 20 138 3 577 3.8 144 4.0
Other electrical machinery and equipment (7788)
110 1 1 111 7 503 1.5 14 0.2
Diodes, transistors and photocells (7763) 74 8 0 82 7 416 1.1 0 0.0
Electrical apparatus for switching, etc. (7721) 65 2 0 67 8 673 0.8 8 0.1
Heterocyclic compounds with oxygen (5156) 58 0 0 58 1 247 4.6 8 0.7
Polycarboxylic acids (5138) 55 0 0 55 5 106 1.1 4 0.1
Internal combustion engine parts (7139) 53 0 0 53 1 671 3.2 33 2.0
Synthetic filament tow (2666) 51 0 0 51 383 13.2 2 0.5
Motor vehicle parts and accessories (7849) 48 0 0 48 7 305 0.7 104 1.4
Iron ore agglomerates (2816) 41 0 0 41 1 824 2.2 741 40.6
Parts for sound-recording apparatus (7649) 39 2 0 41 17 868 0.2 5 0.0
Sample total 1 553 606 21 2 180 141 187 1.5 2 470 1.7
Other products 587 35 55 704 410 128 0.2 15 625 3.8
Total imports 2 140 641 76 2 900 551 315 0.5 18 095 3.3
Source: ECLAC, on the basis of data obtained from the United Nations Commodity Trade Statistics Database (COMTRADE), United Nations Statistics Division.

C E P A L R E V I E W 9 3 • D E C E M B E R 2 0 0 7
LAtIn AMERICA MEEts ChInA AnD InDIA: PRosPECts AnD ChALLEngEs foR tRADE AnD InVEstMEnt •osVALDo RosALEs AnD MIkIo kuWAyAMA
94
primary products or natural-resource-based manufactures. Soya beans, copper and copper concentrates, other metals, wood and alcohol constitute the region’s main exports to India. India’s exports to Latin America are also low on diversity: 15 products account for about 60% of all exports. Petroleum, medicaments, motor cars, chemical products, textiles and wearing apparel are the main products in the country’s export basket (table 8).
3. China as the driver of trade between Asian countries
China’s striking economic growth has put it at the heart of Asia’s booming trade. The role of Asia as a supplier to China is well known: in 2005, Japan, Taiwan Province of China, the Republic of Korea and ASEAN supplied
half of all Chinese imports. China runs a deficit in its overall trade with these countries –particularly with the Republic of Korea and Japan– since they are the main suppliers of the capital goods and intermediate inputs that sustain its manufacturing industry. China exports its manufactures to its other trading partners –particularly the United States and the European Union– with whom it invariably runs its largest trade surpluses in terms of low, high and –to a lesser degree– medium-technology products (ECLAC, 2005). As a result, China’s trade deficit with Asia, which exceeded US$ 70 billion in 2005, has been more than offset by its large and growing trade surpluses with the United States (US$ 114 billion) and the European Union (US$ 70 billion).
ASEAN trade with China totalled US$ 114.3 billion, or 10.9% of the group’s overall trade, in 2005. During
TAbLE 7
India: main products imported from Latin America and the Caribbean, classified according to 2005/2006 fiscal year figures
(Millions of dollars and percentages)
Nº Code,HS a
Products 2004-2005 2005-2006 Growth%
1 1507 Soya beans 604.69 810.55 34.0
2 2603 Copper and concentrates 342.13 413.16 20.8
3 8901 Cruise ships 57.95 162.26 180.0
4 2207 Alcohol 111.69 134.31 20.3
5 8905 Light vessels, etc. 76.02 130.40 71.5
6 1701 Beet sugar, table sugar 193.11 118.81 –38.5
7 1512 Sunflower-seed, safflower oil, etc. 24.43 41.65 70.5
8 4403 Wood in the rough, etc. 50.37 40.65 –19.3
9 7204 Ferrous waste, etc. 23.83 32.24 35.3
10 8473 Parts and accessories used in groups 8469-8472 26.49 30.82 16.3
11 2613 Molybdenum ores and concentrates 24.27 29.38 21.0
12 8413 Pumps for liquids, liquid elevators 8.29 29.20 252.1
13 2601 Iron ore and concentrates 28.52 27.83 –2.4
14 2801 Fluorine, chlorine, bromine and iodine 13.68 27.13 98.3
15 4108 Tanned bovine leather and furskins 25.44 26.00 2.2
Subtotal, 15 main products (A) 1 610.91 2 054.39 27.5
Total imports from Latin America and the Caribbean (B) 2 054.80 2 662.75 29.6
Share of 15 main products in LAC total:(A)/(B)*100 (%) 78.4 77.2
Total imported from rest of the world (C) 111 517.44 149 162.73 33.8
Share of Latin America in imports from world: (A)/(C)*100 (%) 1.8 1.8
Source: Government of India, Ministry of Commerce & Industry, Department of Commerce, http://dgft.delhi.nic.in/. a HS: Harmonized Commodity Description and Coding System.
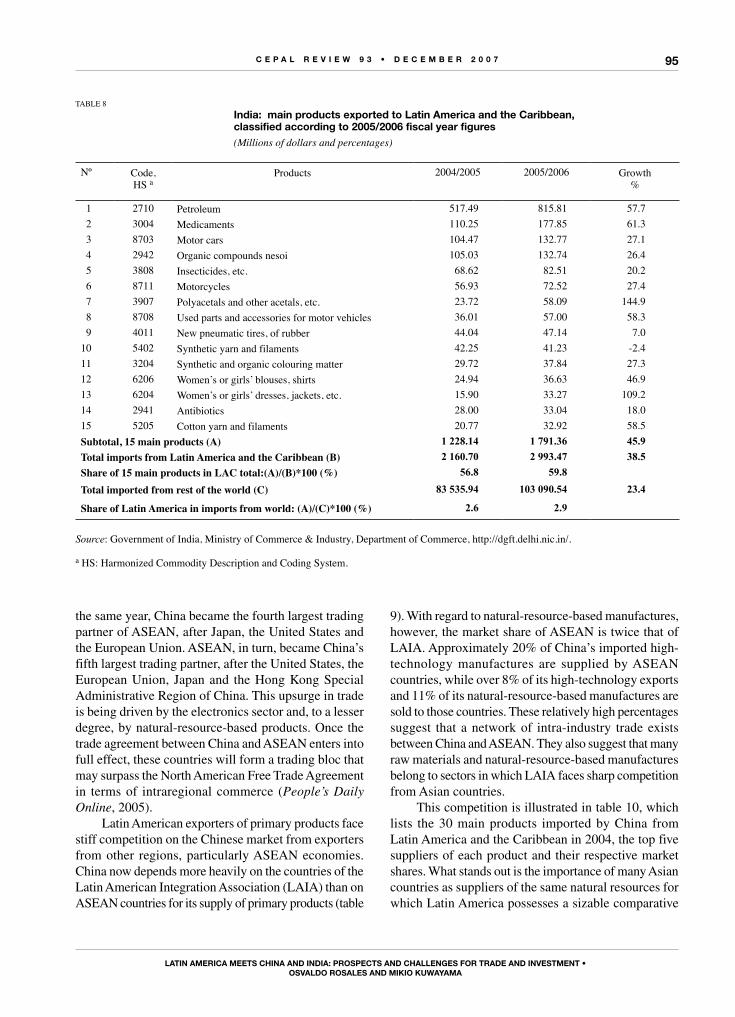
C E P A L R E V I E W 9 3 • D E C E M B E R 2 0 0 7
LAtIn AMERICA MEEts ChInA AnD InDIA: PRosPECts AnD ChALLEngEs foR tRADE AnD InVEstMEnt •osVALDo RosALEs AnD MIkIo kuWAyAMA
95
the same year, China became the fourth largest trading partner of ASEAN, after Japan, the United States and the European Union. ASEAN, in turn, became China’s fifth largest trading partner, after the United States, the European Union, Japan and the Hong Kong Special Administrative Region of China. This upsurge in trade is being driven by the electronics sector and, to a lesser degree, by natural-resource-based products. Once the trade agreement between China and ASEAN enters into full effect, these countries will form a trading bloc that may surpass the North American Free Trade Agreement in terms of intraregional commerce (People’s Daily Online, 2005).
Latin American exporters of primary products face stiff competition on the Chinese market from exporters from other regions, particularly ASEAN economies. China now depends more heavily on the countries of the Latin American Integration Association (LAIA) than on ASEAN countries for its supply of primary products (table
9). With regard to natural-resource-based manufactures, however, the market share of ASEAN is twice that of LAIA. Approximately 20% of China’s imported high-technology manufactures are supplied by ASEAN countries, while over 8% of its high-technology exports and 11% of its natural-resource-based manufactures are sold to those countries. These relatively high percentages suggest that a network of intra-industry trade exists between China and ASEAN. They also suggest that many raw materials and natural-resource-based manufactures belong to sectors in which LAIA faces sharp competition from Asian countries.
This competition is illustrated in table 10, which lists the 30 main products imported by China from Latin America and the Caribbean in 2004, the top five suppliers of each product and their respective market shares. What stands out is the importance of many Asian countries as suppliers of the same natural resources for which Latin America possesses a sizable comparative
TAbLE 8
India: main products exported to Latin America and the Caribbean, classified according to 2005/2006 fiscal year figures (Millions of dollars and percentages)
Nº Code,HS a
Products 2004/2005 2005/2006 Growth%
1 2710 Petroleum 517.49 815.81 57.7
2 3004 Medicaments 110.25 177.85 61.3
3 8703 Motor cars 104.47 132.77 27.1
4 2942 Organic compounds nesoi 105.03 132.74 26.4
5 3808 Insecticides, etc. 68.62 82.51 20.2
6 8711 Motorcycles 56.93 72.52 27.4
7 3907 Polyacetals and other acetals, etc. 23.72 58.09 144.9
8 8708 Used parts and accessories for motor vehicles 36.01 57.00 58.3
9 4011 New pneumatic tires, of rubber 44.04 47.14 7.0
10 5402 Synthetic yarn and filaments 42.25 41.23 -2.4
11 3204 Synthetic and organic colouring matter 29.72 37.84 27.3
12 6206 Women’s or girls’ blouses, shirts 24.94 36.63 46.9
13 6204 Women’s or girls’ dresses, jackets, etc. 15.90 33.27 109.2
14 2941 Antibiotics 28.00 33.04 18.0
15 5205 Cotton yarn and filaments 20.77 32.92 58.5
Subtotal, 15 main products (A) 1 228.14 1 791.36 45.9Total imports from Latin America and the Caribbean (B) 2 160.70 2 993.47 38.5Share of 15 main products in LAC total:(A)/(B)*100 (%) 56.8 59.8
Total imported from rest of the world (C) 83 535.94 103 090.54 23.4
Share of Latin America in imports from world: (A)/(C)*100 (%) 2.6 2.9
Source: Government of India, Ministry of Commerce & Industry, Department of Commerce, http://dgft.delhi.nic.in/.
a HS: Harmonized Commodity Description and Coding System.
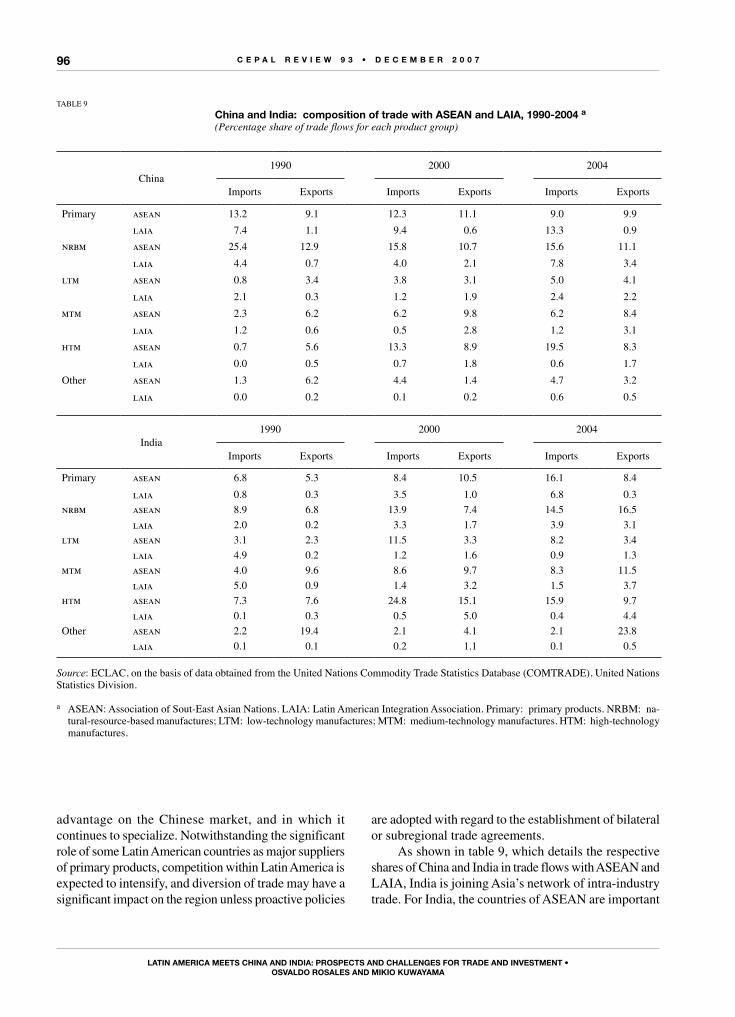
C E P A L R E V I E W 9 3 • D E C E M B E R 2 0 0 7
LAtIn AMERICA MEEts ChInA AnD InDIA: PRosPECts AnD ChALLEngEs foR tRADE AnD InVEstMEnt •osVALDo RosALEs AnD MIkIo kuWAyAMA
96
advantage on the Chinese market, and in which it continues to specialize. Notwithstanding the significant role of some Latin American countries as major suppliers of primary products, competition within Latin America is expected to intensify, and diversion of trade may have a significant impact on the region unless proactive policies
are adopted with regard to the establishment of bilateral or subregional trade agreements.
As shown in table 9, which details the respective shares of China and India in trade flows with ASEAN and LAIA, India is joining Asia’s network of intra-industry trade. For India, the countries of ASEAN are important
TAbLE 9
China and India: composition of trade with AsEAn and LAIA, 1990-2004 a(Percentage share of trade flows for each product group)
China1990 2000 2004
Imports Exports Imports Exports Imports Exports
Primary asean 13.2 9.1 12.3 11.1 9.0 9.9
laia 7.4 1.1 9.4 0.6 13.3 0.9
nrbm asean 25.4 12.9 15.8 10.7 15.6 11.1
laia 4.4 0.7 4.0 2.1 7.8 3.4
ltm asean 0.8 3.4 3.8 3.1 5.0 4.1
laia 2.1 0.3 1.2 1.9 2.4 2.2
mtm asean 2.3 6.2 6.2 9.8 6.2 8.4
laia 1.2 0.6 0.5 2.8 1.2 3.1
htm asean 0.7 5.6 13.3 8.9 19.5 8.3
laia 0.0 0.5 0.7 1.8 0.6 1.7
Other asean 1.3 6.2 4.4 1.4 4.7 3.2
laia 0.0 0.2 0.1 0.2 0.6 0.5
India1990 2000 2004
Imports Exports Imports Exports Imports Exports
Primary asean 6.8 5.3 8.4 10.5 16.1 8.4
laia 0.8 0.3 3.5 1.0 6.8 0.3
nrbm asean 8.9 6.8 13.9 7.4 14.5 16.5
laia 2.0 0.2 3.3 1.7 3.9 3.1
ltm asean 3.1 2.3 11.5 3.3 8.2 3.4
laia 4.9 0.2 1.2 1.6 0.9 1.3
mtm asean 4.0 9.6 8.6 9.7 8.3 11.5
laia 5.0 0.9 1.4 3.2 1.5 3.7
htm asean 7.3 7.6 24.8 15.1 15.9 9.7
laia 0.1 0.3 0.5 5.0 0.4 4.4
Other asean 2.2 19.4 2.1 4.1 2.1 23.8
laia 0.1 0.1 0.2 1.1 0.1 0.5
Source: ECLAC, on the basis of data obtained from the United Nations Commodity Trade Statistics Database (COMTRADE), United Nations Statistics Division.
a ASEAN: Association of Sout-East Asian Nations. LAIA: Latin American Integration Association. Primary: primary products. NRBM: na-tural-resource-based manufactures; LTM: low-technology manufactures; MTM: medium-technology manufactures. HTM: high-technology manufactures.
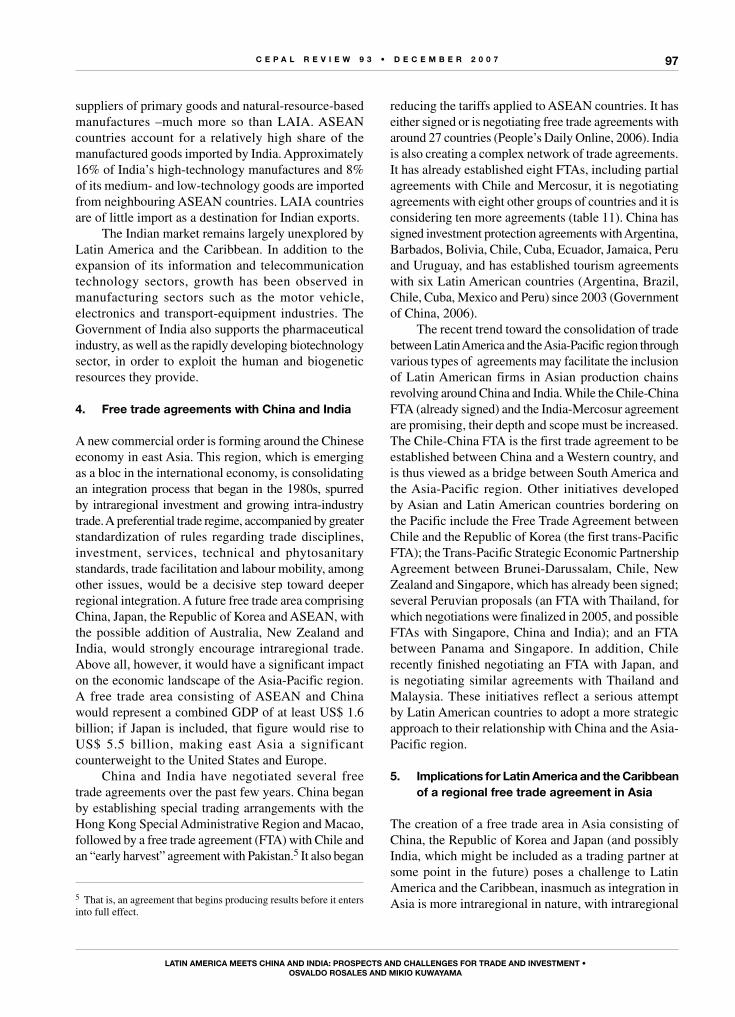
C E P A L R E V I E W 9 3 • D E C E M B E R 2 0 0 7
LAtIn AMERICA MEEts ChInA AnD InDIA: PRosPECts AnD ChALLEngEs foR tRADE AnD InVEstMEnt •osVALDo RosALEs AnD MIkIo kuWAyAMA
97
suppliers of primary goods and natural-resource-based manufactures –much more so than LAIA. ASEAN countries account for a relatively high share of the manufactured goods imported by India. Approximately 16% of India’s high-technology manufactures and 8% of its medium- and low-technology goods are imported from neighbouring ASEAN countries. LAIA countries are of little import as a destination for Indian exports.
The Indian market remains largely unexplored by Latin America and the Caribbean. In addition to the expansion of its information and telecommunication technology sectors, growth has been observed in manufacturing sectors such as the motor vehicle, electronics and transport-equipment industries. The Government of India also supports the pharmaceutical industry, as well as the rapidly developing biotechnology sector, in order to exploit the human and biogenetic resources they provide.
4. free trade agreements with China and India
A new commercial order is forming around the Chinese economy in east Asia. This region, which is emerging as a bloc in the international economy, is consolidating an integration process that began in the 1980s, spurred by intraregional investment and growing intra-industry trade. A preferential trade regime, accompanied by greater standardization of rules regarding trade disciplines, investment, services, technical and phytosanitary standards, trade facilitation and labour mobility, among other issues, would be a decisive step toward deeper regional integration. A future free trade area comprising China, Japan, the Republic of Korea and ASEAN, with the possible addition of Australia, New Zealand and India, would strongly encourage intraregional trade. Above all, however, it would have a significant impact on the economic landscape of the Asia-Pacific region. A free trade area consisting of ASEAN and China would represent a combined GDP of at least US$ 1.6 billion; if Japan is included, that figure would rise to US$ 5.5 billion, making east Asia a significant counterweight to the United States and Europe.
China and India have negotiated several free trade agreements over the past few years. China began by establishing special trading arrangements with the Hong Kong Special Administrative Region and Macao, followed by a free trade agreement (FTA) with Chile and an “early harvest” agreement with Pakistan.5 It also began
5 That is, an agreement that begins producing results before it enters into full effect.
reducing the tariffs applied to ASEAN countries. It has either signed or is negotiating free trade agreements with around 27 countries (People’s Daily Online, 2006). India is also creating a complex network of trade agreements. It has already established eight FTAs, including partial agreements with Chile and Mercosur, it is negotiating agreements with eight other groups of countries and it is considering ten more agreements (table 11). China has signed investment protection agreements with Argentina, barbados, bolivia, Chile, Cuba, Ecuador, Jamaica, Peru and Uruguay, and has established tourism agreements with six Latin American countries (Argentina, brazil, Chile, Cuba, Mexico and Peru) since 2003 (Government of China, 2006).
The recent trend toward the consolidation of trade between Latin America and the Asia-Pacific region through various types of agreements may facilitate the inclusion of Latin American firms in Asian production chains revolving around China and India. While the Chile-China FTA (already signed) and the India-Mercosur agreement are promising, their depth and scope must be increased. The Chile-China FTA is the first trade agreement to be established between China and a Western country, and is thus viewed as a bridge between South America and the Asia-Pacific region. Other initiatives developed by Asian and Latin American countries bordering on the Pacific include the Free Trade Agreement between Chile and the Republic of Korea (the first trans-Pacific FTA); the Trans-Pacific Strategic Economic Partnership Agreement between brunei-Darussalam, Chile, New Zealand and Singapore, which has already been signed; several Peruvian proposals (an FTA with Thailand, for which negotiations were finalized in 2005, and possible FTAs with Singapore, China and India); and an FTA between Panama and Singapore. In addition, Chile recently finished negotiating an FTA with Japan, and is negotiating similar agreements with Thailand and Malaysia. These initiatives reflect a serious attempt by Latin American countries to adopt a more strategic approach to their relationship with China and the Asia-Pacific region.
5. Implications for Latin America and the Caribbean of a regional free trade agreement in Asia
The creation of a free trade area in Asia consisting of China, the Republic of Korea and Japan (and possibly India, which might be included as a trading partner at some point in the future) poses a challenge to Latin America and the Caribbean, inasmuch as integration in Asia is more intraregional in nature, with intraregional
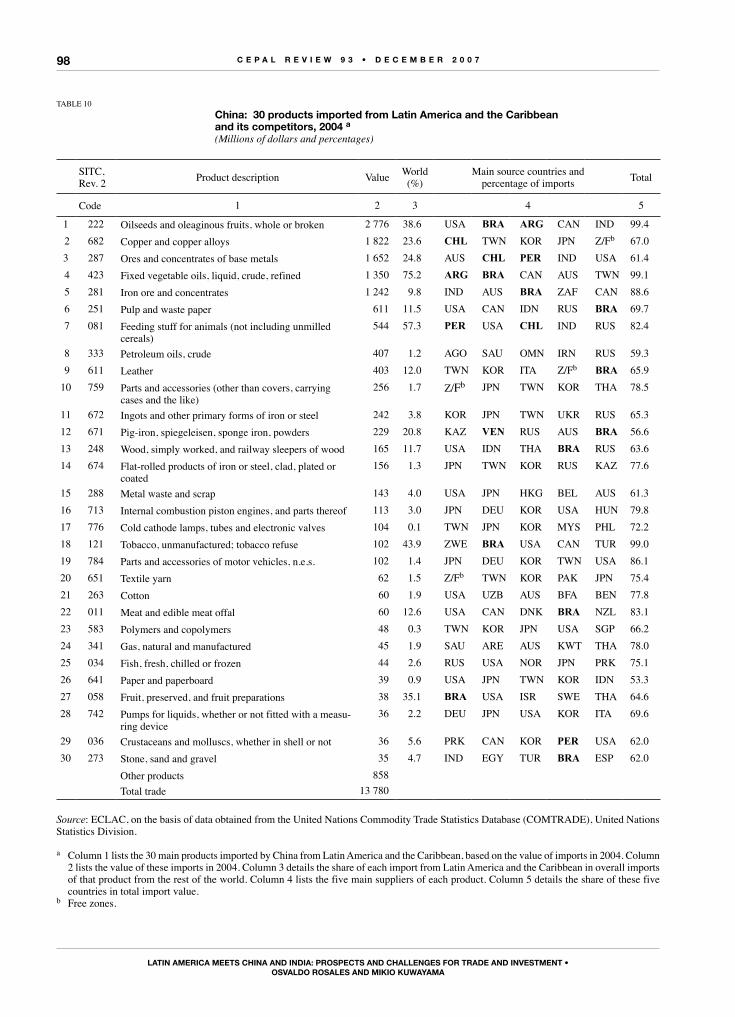
C E P A L R E V I E W 9 3 • D E C E M B E R 2 0 0 7
LAtIn AMERICA MEEts ChInA AnD InDIA: PRosPECts AnD ChALLEngEs foR tRADE AnD InVEstMEnt •osVALDo RosALEs AnD MIkIo kuWAyAMA
98
TAbLE 10
China: 30 products imported from Latin America and the Caribbean and its competitors, 2004 a(Millions of dollars and percentages)
SITC, Rev. 2 Product description Value World
(%)Main source countries and
percentage of imports Total
Code 1 2 3 4 5
1 222 Oilseeds and oleaginous fruits, whole or broken 2 776 38.6 USA BrA ArG CAN IND 99.4
2 682 Copper and copper alloys 1 822 23.6 CHL TWN KOR JPN Z/Fb 67.0
3 287 Ores and concentrates of base metals 1 652 24.8 AUS CHL Per IND USA 61.4
4 423 Fixed vegetable oils, liquid, crude, refined 1 350 75.2 ArG BrA CAN AUS TWN 99.1
5 281 Iron ore and concentrates 1 242 9.8 IND AUS BrA ZAF CAN 88.6
6 251 Pulp and waste paper 611 11.5 USA CAN IDN RUS BrA 69.7
7 081 Feeding stuff for animals (not including unmilled cereals)
544 57.3 Per USA CHL IND RUS 82.4
8 333 Petroleum oils, crude 407 1.2 AGO SAU OMN IRN RUS 59.3
9 611 Leather 403 12.0 TWN KOR ITA Z/Fb BrA 65.9
10 759 Parts and accessories (other than covers, carrying cases and the like)
256 1.7 Z/Fb JPN TWN KOR THA 78.5
11 672 Ingots and other primary forms of iron or steel 242 3.8 KOR JPN TWN UKR RUS 65.3
12 671 Pig-iron, spiegeleisen, sponge iron, powders 229 20.8 KAZ VeN RUS AUS BrA 56.6
13 248 Wood, simply worked, and railway sleepers of wood 165 11.7 USA IDN THA BrA RUS 63.6
14 674 Flat-rolled products of iron or steel, clad, plated or coated
156 1.3 JPN TWN KOR RUS KAZ 77.6
15 288 Metal waste and scrap 143 4.0 USA JPN HKG bEL AUS 61.3
16 713 Internal combustion piston engines, and parts thereof 113 3.0 JPN DEU KOR USA HUN 79.8
17 776 Cold cathode lamps, tubes and electronic valves 104 0.1 TWN JPN KOR MYS PHL 72.2
18 121 Tobacco, unmanufactured; tobacco refuse 102 43.9 ZWE BrA USA CAN TUR 99.0
19 784 Parts and accessories of motor vehicles, n.e.s. 102 1.4 JPN DEU KOR TWN USA 86.1
20 651 Textile yarn 62 1.5 Z/Fb TWN KOR PAK JPN 75.4
21 263 Cotton 60 1.9 USA UZb AUS bFA bEN 77.8
22 011 Meat and edible meat offal 60 12.6 USA CAN DNK BrA NZL 83.1
23 583 Polymers and copolymers 48 0.3 TWN KOR JPN USA SGP 66.2
24 341 Gas, natural and manufactured 45 1.9 SAU ARE AUS KWT THA 78.0
25 034 Fish, fresh, chilled or frozen 44 2.6 RUS USA NOR JPN PRK 75.1
26 641 Paper and paperboard 39 0.9 USA JPN TWN KOR IDN 53.3
27 058 Fruit, preserved, and fruit preparations 38 35.1 BrA USA ISR SWE THA 64.6
28 742 Pumps for liquids, whether or not fitted with a measu-ring device
36 2.2 DEU JPN USA KOR ITA 69.6
29 036 Crustaceans and molluscs, whether in shell or not 36 5.6 PRK CAN KOR Per USA 62.0
30 273 Stone, sand and gravel 35 4.7 IND EGY TUR BrA ESP 62.0
Other products 858
Total trade 13 780
Source: ECLAC, on the basis of data obtained from the United Nations Commodity Trade Statistics Database (COMTRADE), United Nations Statistics Division.
a Column 1 lists the 30 main products imported by China from Latin America and the Caribbean, based on the value of imports in 2004. Column 2 lists the value of these imports in 2004. Column 3 details the share of each import from Latin America and the Caribbean in overall imports of that product from the rest of the world. Column 4 lists the five main suppliers of each product. Column 5 details the share of these five countries in total import value.
b Free zones.
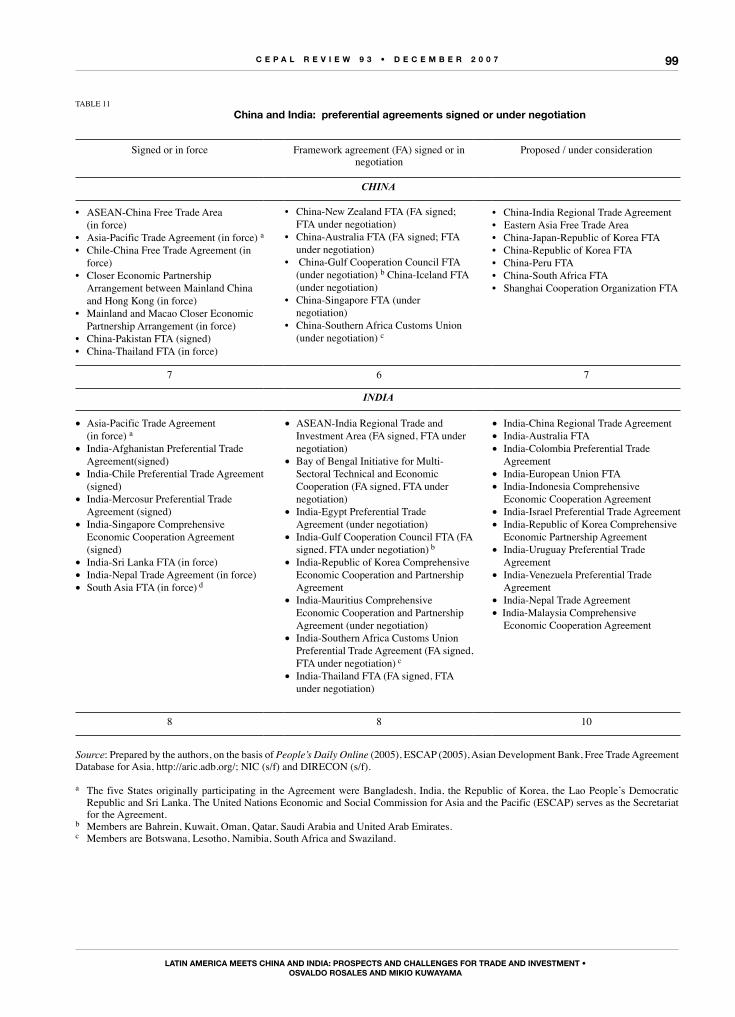
C E P A L R E V I E W 9 3 • D E C E M B E R 2 0 0 7
LAtIn AMERICA MEEts ChInA AnD InDIA: PRosPECts AnD ChALLEngEs foR tRADE AnD InVEstMEnt •osVALDo RosALEs AnD MIkIo kuWAyAMA
99
TAbLE 11
China and India: preferential agreements signed or under negotiation
Signed or in force Framework agreement (FA) signed or in negotiation
Proposed / under consideration
CHINA
• ASEAN-China Free Trade Area (in force)
• Asia-Pacific Trade Agreement (in force) a • Chile-China Free Trade Agreement (in
force)• Closer Economic Partnership
Arrangement between Mainland China and Hong Kong (in force)
• Mainland and Macao Closer Economic Partnership Arrangement (in force)
• China-Pakistan FTA (signed) • China-Thailand FTA (in force)
• China-NewZealandFTA(FAsigned;FTA under negotiation)
• China-Australia FTA (FA signed; FTA under negotiation)
• China-Gulf Cooperation Council FTA (under negotiation) b China-Iceland FTA (under negotiation)
• China-Singapore FTA (under negotiation)
• China-Southern Africa Customs Union (under negotiation) c
• China-India Regional Trade Agreement • Eastern Asia Free Trade Area• China-Japan-Republic of Korea FTA• China-Republic of Korea FTA• China-Peru FTA • China-South Africa FTA• Shanghai Cooperation Organization FTA
7 6 7
INDIA
• Asia-Pacific Trade Agreement (in force) a
• India-Afghanistan Preferential Trade Agreement(signed)
• India-Chile Preferential Trade Agreement (signed)
• India-Mercosur Preferential Trade Agreement (signed)
• India-Singapore Comprehensive Economic Cooperation Agreement (signed)
• India-Sri Lanka FTA (in force)• India-Nepal Trade Agreement (in force)• South Asia FTA (in force) d
• ASEAN-India Regional Trade and Investment Area (FA signed, FTA under negotiation)
• Bay of Bengal Initiative for Multi-Sectoral Technical and Economic Cooperation (FA signed, FTA under negotiation)
• India-Egypt Preferential Trade Agreement (under negotiation)
• India-Gulf Cooperation Council FTA (FA signed, FTA under negotiation) b
• India-Republic of Korea Comprehensive Economic Cooperation and Partnership Agreement
• India-Mauritius Comprehensive Economic Cooperation and Partnership Agreement (under negotiation)
• India-Southern Africa Customs Union Preferential Trade Agreement (FA signed, FTA under negotiation) c
• India-Thailand FTA (FA signed, FTA under negotiation)
• India-China Regional Trade Agreement • India-Australia FTA• India-Colombia Preferential Trade
Agreement• India-European Union FTA• India-Indonesia Comprehensive
Economic Cooperation Agreement • India-Israel Preferential Trade Agreement • India-Republic of Korea Comprehensive
Economic Partnership Agreement • India-Uruguay Preferential Trade
Agreement • India-Venezuela Preferential Trade
Agreement • India-Nepal Trade Agreement • India-Malaysia Comprehensive
Economic Cooperation Agreement
8 8 10
Source: Prepared by the authors, on the basis of People’s Daily Online (2005), ESCAP (2005), Asian Development Bank, Free Trade Agreement Database for Asia, http://aric.adb.org/; NIC (s/f) and DIRECON (s/f).
a The five States originally participating in the Agreement were Bangladesh, India, the Republic of Korea, the Lao People’s Democratic Republic and Sri Lanka. The United Nations Economic and Social Commission for Asia and the Pacific (ESCAP) serves as the Secretariat for the Agreement.
b Members are Bahrein, Kuwait, Oman, Qatar, Saudi Arabia and United Arab Emirates.c Members are Botswana, Lesotho, Namibia, South Africa and Swaziland.
C E P A L R E V I E W 9 3 • D E C E M B E R 2 0 0 7
LAtIn AMERICA MEEts ChInA AnD InDIA: PRosPECts AnD ChALLEngEs foR tRADE AnD InVEstMEnt •osVALDo RosALEs AnD MIkIo kuWAyAMA
100
exports playing a greater role in the region’s scheme of tariff preferences. As mentioned above, imports from Latin America and the Caribbean still consist mostly of primary products and natural resources, whereas imports from ASEAN countries are mainly comprised of high-technology goods, such as information and telecommunications. The tariffs applied to these products have dropped considerably over the past few years.
The countries of Latin America and the Caribbean would face less of a disadvantage as they compete with ASEAN for Chinese markets if they signed free trade agreements with that bloc. The strongest competition would arise in the primary- product and natural- resource-based manufacture sectors, where ASEAN countries will continue to enjoy comparative production advantages if effective tariffs remain high (table 12). The tariffs applied by ASEAN, China, Japan and the Republic of Korea (ASEAN + 3) to agricultural
products, textiles, wearing apparel and certain categories of machinery remain high; a lowering of these tariffs within the framework of the ASEAN + 3 agreement, the respective agreements between ASEAN and the three countries mentioned above or even the China-ASEAN or ASEAN-India agreement would benefit ASEAN countries at the expense of Latin America and the Caribbean.
These new agreements between ASEAN countries and trading partners outside of their own bloc are part of a second wave of preferential trade agreements –one which follows the Agreement on the Common Effective Preferential Tariff Scheme for the Establishment of the ASEAN Free Trade Area (AFTA). The main objective of this Agreement, which was approved in 1992 and entered into force in 1993, is to integrate the economies of ASEAN into a single production area, creating a vast market of 500 million people.
IVConclusions and recommendations
The economic, strategic and demographic importance of China and India has put them at the forefront of Asian countries. From an economic perspective, both countries –particularly China– have played a key role in the significant changes that have occurred in the level and structure of world demand, and have served as a significant source of financial resources for the preservation of international balances. Relations between the two countries and Latin America and the Caribbean are still in their infancy, however –although exchanges with China have recently increased, mainly as a result of that country’s interest in securing access to the natural resources of South America.
So far, South American exports to China and India have been dominated by natural-resource-based manufactures, while the region’s imports from the two countries have consisted mainly of low-, medium- and high-technology manufactures. China has become a major destination for exports from other Asian countries, which have gradually attained a higher degree of specialization, and now produce not only natural-resource-based manufactures but also more complex inputs.
Given the inter-industrial nature of trade between China and South America, the region should seek to create partnerships between its firms and successful
Asian companies, in order to gain access to supply chains that produce more complex, technologically sophisticated inputs for production units. The best approach may be to build partnerships around chains, in order to increase the sophistication of the natural-resource-based manufactures the region exports to Asia. Latin America should make optimal use of its natural resources, promoting long-term contracts, investment agreements and technological partnerships in the natural resources sector, as well as strategic production clusters among countries, firms and specific geographic areas in Asia. Strategic partnerships should also be created to increase value added throughout the production and marketing chain, and mutually beneficial technological partnerships should be developed (to apply advances in biotechnology to agro-industry, mining, forestry and fishery, for example).
As for strategic relations between Mexico-Central America and China, efforts should be made to ensure that the former plays a part in the integration of regional production –a process being driven by Asian markets, and one in which China plays an increasingly important role. This is an achievable goal, given the advantages the subregion enjoys in its relationship with the United States market, which include logistical efficiencies and
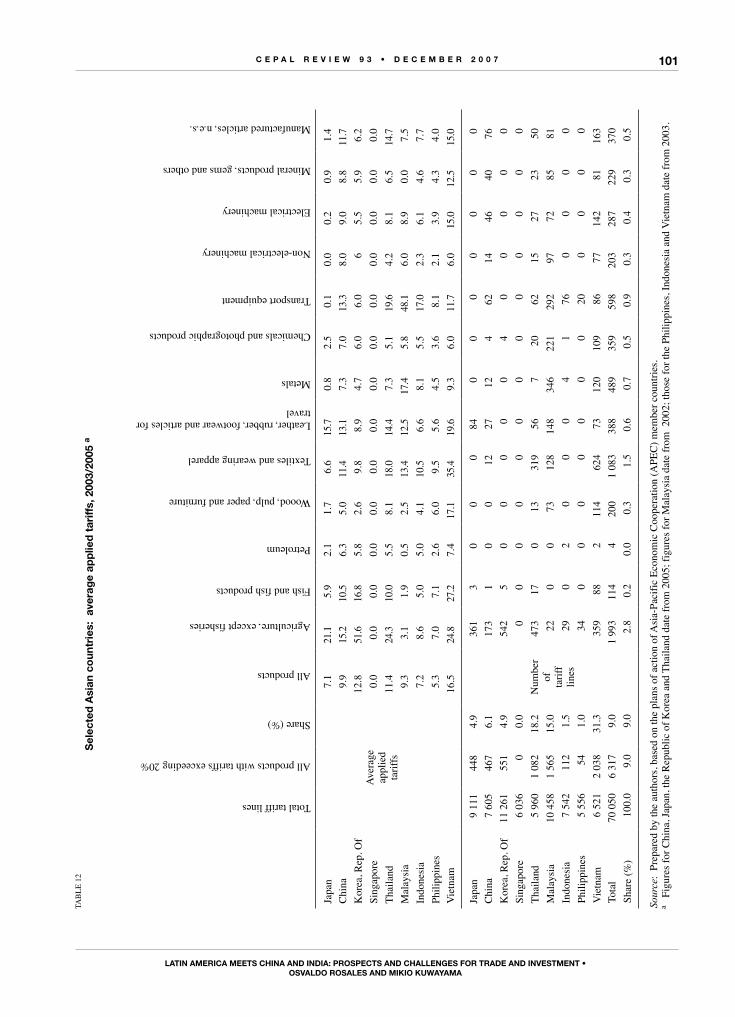
C E P A L R E V I E W 9 3 • D E C E M B E R 2 0 0 7
LAtIn AMERICA MEEts ChInA AnD InDIA: PRosPECts AnD ChALLEngEs foR tRADE AnD InVEstMEnt •osVALDo RosALEs AnD MIkIo kuWAyAMA
101TA
bL
E 1
2
sel
ecte
d A
sian
co
untr
ies:
ave
rag
e ap
plie
d t
ariff
s, 2
003/
2005
a
Total tariff lines
All products with tariffs exceeding 20%
Share (%)
All products
Agriculture, except fisheries
Fish and fish products
Petroleum
Woood, pulp, paper and furniture
Textiles and wearing apparel
Leather, rubber, footwear and articles for travel
Metals
Chemicals and photographic products
Transport equipment
Non-electrical machinery
Electrical machinery
Mineral products, gems and others
Manufactured articles, n.e.s.
Japa
n
Aver
age
appl
ied
tarif
fs
7.1
21.1
5.9
2.1
1.7
6.6
15.7
0.8
2.5
0.1
0.0
0.2
0.9
1.4
Chi
na9.
915
.210
.56.
35.
011
.413
.17.
37.
013
.38.
09.
08.
811
.7
Kor
ea, R
ep. O
f12
.851
.616
.85.
82.
69.
88.
94.
76.
06.
06
5.5
5.9
6.2
Sing
apor
e0.
00.
00.
00.
00.
00.
00.
00.
00.
00.
00.
00.
00.
00.
0
Thai
land
11.4
24.3
10.0
5.5
8.1
18.0
14.4
7.3
5.1
19.6
4.2
8.1
6.5
14.7
Mal
aysi
a9.
33.
11.
90.
52.
513
.412
.517
.45.
848
.16.
08.
90.
07.
5
Indo
nesi
a7.
28.
65.
05.
04.
110
.56.
68.
15.
517
.02.
36.
14.
67.
7
Phili
ppin
es5.
37.
07.
12.
66.
09.
55.
64.
53.
68.
12.
13.
94.
34.
0
Vie
tnam
16.5
24.8
27.2
7.4
17.1
35.4
19.6
9.3
6.0
11.7
6.0
15.0
12.5
15.0
Japa
n9
111
448
4.9
Num
ber
of
tarif
flin
es
361
30
00
840
00
00
00
Chi
na7
605
467
6.1
173
10
012
2712
462
1446
4076
Kor
ea, R
ep. O
f11
261
551
4.9
542
50
00
00
40
00
00
Sing
apor
e6
036
00.
00
00
00
00
00
00
00
Thai
land
5 96
01
082
18.2
473
170
1331
956
720
6215
2723
50
Mal
aysi
a10
458
1 56
515
.022
00
7312
814
834
622
129
297
7285
81
Indo
nesi
a7
542
112
1.5
290
20
00
41
760
00
0
Phili
ppin
es5
556
541.
034
00
00
00
020
00
00
Vie
tnam
6 52
12
038
31.3
359
882
114
624
7312
010
986
7714
281
163
Tota
l70
050
6 31
79.
01
993
114
420
01
083
388
489
359
598
203
287
229
370
Shar
e (%
)10
0.0
9.0
9.0
2.8
0.2
0.0
0.3
1.5
0.6
0.7
0.5
0.9
0.3
0.4
0.3
0.5
Sour
ce:
Prep
ared
by
the
auth
ors,
base
d on
the
plan
s of a
ctio
n of
Asi
a-Pa
cific
Eco
nom
ic C
oope
ratio
n (A
PEC
) mem
ber c
ount
ries.
a F
igur
es fo
r Chi
na, J
apan
, the
Rep
ublic
of K
orea
and
Tha
iland
dat
e fr
om 2
005;
figu
res f
or M
alay
sia
date
from
200
2; th
ose
for t
he P
hilip
pine
s, In
done
sia
and
Vie
tnam
dat
e fr
om 2
003.
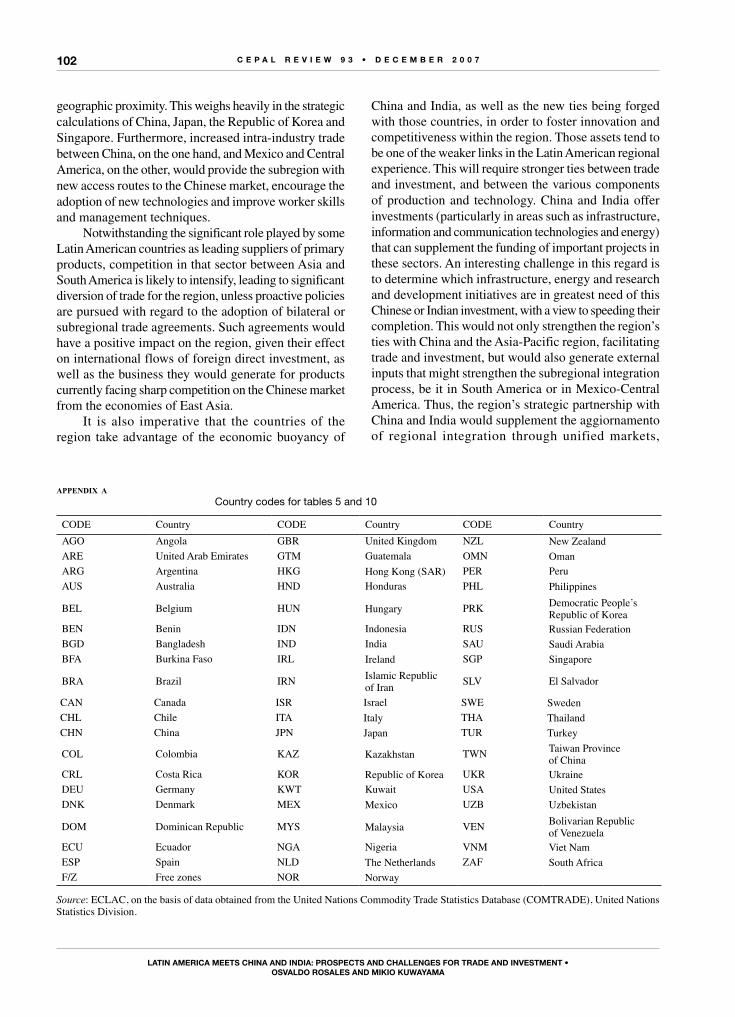
C E P A L R E V I E W 9 3 • D E C E M B E R 2 0 0 7
LAtIn AMERICA MEEts ChInA AnD InDIA: PRosPECts AnD ChALLEngEs foR tRADE AnD InVEstMEnt •osVALDo RosALEs AnD MIkIo kuWAyAMA
102
geographic proximity. This weighs heavily in the strategic calculations of China, Japan, the Republic of Korea and Singapore. Furthermore, increased intra-industry trade between China, on the one hand, and Mexico and Central America, on the other, would provide the subregion with new access routes to the Chinese market, encourage the adoption of new technologies and improve worker skills and management techniques.
Notwithstanding the significant role played by some Latin American countries as leading suppliers of primary products, competition in that sector between Asia and South America is likely to intensify, leading to significant diversion of trade for the region, unless proactive policies are pursued with regard to the adoption of bilateral or subregional trade agreements. Such agreements would have a positive impact on the region, given their effect on international flows of foreign direct investment, as well as the business they would generate for products currently facing sharp competition on the Chinese market from the economies of East Asia.
It is also imperative that the countries of the region take advantage of the economic buoyancy of
China and India, as well as the new ties being forged with those countries, in order to foster innovation and competitiveness within the region. Those assets tend to be one of the weaker links in the Latin American regional experience. This will require stronger ties between trade and investment, and between the various components of production and technology. China and India offer investments (particularly in areas such as infrastructure, information and communication technologies and energy) that can supplement the funding of important projects in these sectors. An interesting challenge in this regard is to determine which infrastructure, energy and research and development initiatives are in greatest need of this Chinese or Indian investment, with a view to speeding their completion. This would not only strengthen the region’s ties with China and the Asia-Pacific region, facilitating trade and investment, but would also generate external inputs that might strengthen the subregional integration process, be it in South America or in Mexico-Central America. Thus, the region’s strategic partnership with China and India would supplement the aggiornamento of regional integration through unified markets,
CODE Country CODE Country CODE Country
AGO Angola GbR United Kingdom NZL New ZealandARE United Arab Emirates GTM Guatemala OMN Oman ARG Argentina HKG Hong Kong (SAR) PER Peru
AUS Australia HND Honduras PHL Philippines
bEL belgium HUN Hungary PRK Democratic People’s Republic of Korea
bEN benin IDN Indonesia RUS Russian FederationbGD bangladesh IND India SAU Saudi Arabia bFA burkina Faso IRL Ireland SGP Singapore
bRA brazil IRN Islamic Republic of Iran SLV El Salvador
CAN Canada ISR Israel SWE SwedenCHL Chile ITA Italy THA ThailandCHN China JPN Japan TUR Turkey
COL Colombia KAZ Kazakhstan TWN Taiwan Province of China
CRL Costa Rica KOR Republic of Korea UKR Ukraine DEU Germany KWT Kuwait USA United StatesDNK Denmark MEX Mexico UZb Uzbekistan
DOM Dominican Republic MYS Malaysia VEN Bolivarian Republic of Venezuela
ECU Ecuador NGA Nigeria VNM Viet NamESP Spain NLD The Netherlands ZAF South AfricaF/Z Free zones NOR Norway
Source: ECLAC, on the basis of data obtained from the United Nations Commodity Trade Statistics Database (COMTRADE), United Nations Statistics Division.
APPeNDIX ACountry codes for tables 5 and 10
C E P A L R E V I E W 9 3 • D E C E M B E R 2 0 0 7
LAtIn AMERICA MEEts ChInA AnD InDIA: PRosPECts AnD ChALLEngEs foR tRADE AnD InVEstMEnt •osVALDo RosALEs AnD MIkIo kuWAyAMA
103
Bibliography
Asian Development Bank, Free Trade Agreement Database for Asia. Available in http://aric.adb.org.
Branstetter, Lee and Nicholas Lardy (2006): China’s Embrace of Globalization, NBER Working Paper Series, No. 12373, Cambridge, Massachusetts. Available in http://www.nber.org/ papers/w12373.
DIRECON (General Directorate for International Economic Affairs) (n/d): http://www.direcon.cl/documentos/India2/antecedentes_ generales_india.pdf.
Dussel Peters, Enrique (2005): Economic Opportunities and Challenges Posed by China for Mexico and Central America, Studies, No. 8, Bonn, Deutsche Institut fur Entwicklungspolitik.
ECLAC (Economic Commission for Latin America and the Caribbean) (2005): Latin America and the Caribbean in the World Economy 2004. Trends 2005 (LC/G.2283-P), Santiago, Chile, August. United Nations publication, Sales No. E.05.II.G.117.
__________ (2006): Latin America and the Caribbean in the World Economy, 2005-2006 (LC/G.2313-P), Santiago, Chile, August. United Nations publication, Sales No. E.06.II.G.67.
ESCAP (Economic and Social Commission for Asia and the Pacific) (2005): Asia-Pacific Preferential Trade and Investment Agreements Database (APTIADA), Bangkok, Asian Development Bank.
FAO (Food and Agriculture Organization of the United Nations) (2004): The State of Agricultural Commodity Markets, Rome.
Government of China (2006): China, Latin America forge closer links for win-win end. Available in http://www.gov.cn/misc/2006-10/06/content_405906.htm.
Government of India (2006): Economic Survey 2005-2006. Available in http://indiabudget.nic.in
IMF (International Monetary Fund) (2006a): World Economic Outlook, Washington, D.C., Direction of Trade Statistics, April.
__________ (2006b): World Economic Outlook, Washington, D.C., Direction of Trade Statistics, September.
India, Ministry of Commerce and Industry (2006): FDI inflows into India, Nota de prensa, Department of Commerce, 11 May.
International Iron and Steel Institute (2005): World Steel in Figures 2005. Available in http://www.worldsteel.org/?action=publicationdetail&id=54
ISSB Monthly World I&S Review (2005): Available in http://www.steelonthenet.com/production.html.
JETRO (Japan External Trade Organization) (2006): JETRO White Paper on Trade and Investment 2006, Tokyo.
NIC (National Informatics Center) (n/d): India’s trade: business opportunities. Available in http://www.indiainbusiness. nic.in/trade-india/fta-rta.htm.
People’s Daily Online (2005): China-ASEAN FTA to be one of world’s three pillars. Available in http://www.bilaterals.org/article.php3?id article=2674
__________ (2006): China accelerates pace on FTA establishment in past five years. Available in http://english.people.com.cn/200601/29/print20060129_239189.html.
The Economist Intelligence Unit (2005): BP Statistical Review of World Energy, London, June. Available in http://www.bp.com
__________ (2006): Global outlook, London, April.UNCTAD (United Nations Conference on Trade and Development)
(2003): Commodity Yearbook 2003, Geneva, United Nations. United Nations publication, Sales No. E/F.03.II.D.25.
__________ (2005): Trade and Development Report, 2005, UNCTAD/TDR/2005, Geneva. United Nations publication, Sales No. E.05.II.D.13.
UNDP (United Nations Development Programme) (2006): Asia-Pacific Human Development Report 2006, Colombo, Sri Lanka, Macmillan.
World Bank (various years): World Economic Indicators, Washington, D.C.
World Bureau of Metal Statistics (2005): World Metal Statistics Yearbook, 2005, London.
WTO (World Trade Organization) (2006): Trade Profiles 2006, Geneva.
increasingly standardized norms and greater legal certainty. There is no “Great Wall of China” standing between stronger economic ties with the Asia-Pacific region and increased regional integration. On the
contrary, given the proper policies and political will on both sides, dynamic complementarities can be built between both strategic possibilities.
(Original:Spanish)

105
C E P A L R E V I E W 9 3 • D E C E M B E R 2 0 0 7
Is the phasing out of the Agreement on Textiles and Clothing erodingcompetitiveness in Central America
and the Dominican Republic?
René A. Hernández
The Agreement on Textiles and Clothing (ATC) of the World Trade
Organization (WTO), and the restrictions deriving therefrom, expired on 1
January 2005. This article quantifies the expected effect of the phasing out
of ATC in the context of the free trade agreement between Central America,
the Dominican Republic and the United States (DR-CAFTA). We argue that,
other things equal, Central America and the Dominican Republic will obtain
a smaller share of the United States market, owing to stronger competition
from Asian countries, the consequent market reorganization, the rise of the
“full package” system, and the lesser competitive advantage afforded by low
wages in the value chain of the textile and clothing sectors. In the post-ATC
era, other factors, such as just-in-time production and specialization, are
the keys to competing advantageously on the international market, given
the trend of integration in the links of that chain.
K E YW O R D S
Text i le iundust r y
C lo th ing indust r y
Compet i t ion
Trea t ies
Free t rade
Economic ana lys is
Mathemat ica l mode ls
Cent ra l Amer ica
E l Sa lvador
Honduras
Uni ted Sta tes
René A. Hernández
Economic Affairs Officer,
Office of the Executive Secretary,
ECLAC
106
IIntroduction
This article puts forward a set of stylized facts describing the potential effects caused by the ending of the WTO Agreement on Textiles and Clothing (ATC) among the main exporters of these product lines in Central American countries, following the entry into force of the free trade agreement between Central America, the Dominican Republic and the United States (DR-CAFTA, hereinafter referred to as the Agreement). We attempt to quantify those effects through a partial equilibrium model using two approaches, one ex ante and the other ex post.
We argue that the supply pattern in the post-quota era will be determined not only by the cost of factors of production, but also by the capacity to supply highly specialized products (clear advantage for China) and “full package” solutions. Central America and the Dominican Republic recognize the overwhelming strength of Chinese garment making, but continue to pin their hopes largely
on the static benefits of the Agreement, rather than on vertical integration of the industry or the adoption of new supply facilitation, just-in-time production or flexible production models.
The article is divided into five sections. Following this introduction, a set of stylized facts summarize the main implications for DR-CAFTA signatory countries of the expiry of ATC (section II). This is followed by a brief review of the relevant empirical literature and the methodologies that are most widely used to analyse the impact of preferential agreements, free-trade treaties or regional integration arrangements (section III). A partial equilibrium analysis is then performed and its empirical results are presented, with a view to quantifying the potential impact of the expiry of ATC (section IV). Lastly, section V sets forth a number of final thoughts and comments.
II
The developing countries that signed the DR-CAFTA Agreement —Costa Rica, Dominican Republic, El Salvador, Guatemala, Honduras and Nicaragua— already enjoy preferential access to the United States market under the trade partnership agreement signed between that country and those of the Caribbean basin,1 which came into force on 1 October 2000.
1 US-Caribbean Basin Trade Partnership Act (CBTPA), which repre-sents a programme of preferential tariff benefits granted unilaterally by the United States to Central American and Caribbean basin countries (U.S. Customs Service, 2001). There are 24 beneficiary countries altogether.
In general, DR-CAFTA expanded benefits in the textile and clothing sector, while increasing imports of certain inputs for that sector from the United States, in compliance with rules of origin. Moreover, under the Agreement, Central American countries obtained tariff-free entry to the United States for their textile and clothing products, also subject to rules of origin, this measure operating retroactively as from 1 January 2004.
Inclusion of a “short supply” list also allows imports of inputs from countries that are signatories of the North American Free Trade Agreement (NAFTA), and countries that benefit from two pieces of United States legislation: the African Growth and Opportunity Act (AGOA) and the Andean Trade Preference Act (ATPA), for inclusion as originating products.
Both CBTPA and the Agreement seek to increase exports from beneficiary countries and exploit the advantages offered to sensitive sectors, such as textiles
< The author gratefully acknowledges comments from an anonymous referee and contributions by Indira Romero and Martha Cordero.
C E P A L R E V I E W 9 3 • D E C E M B E R 2 0 0 7
Is thE PhAsIng out of thE AgREEMEnt on tExtILEs AnD CLothIng ERoDIng CoMPEtItIVEnEss In CEntRAL AMERICA AnD thE DoMInICAn REPuBLIC? • REné A. hERnánDEz
107
and clothing. In this sense, the ending of ATC represents a sharp external shock for Central American countries, which largely depend on the United States market and the preferences that country grants them, to keep their exports competitive in those sectors.
2. the Agreement in the textile and clothing sectors
Since 1973, under the auspices of the General Agreement on Trade and Tariffs (GATT), the Multifibre Arrangement (MFA) governing international trade in textiles allowed a group of countries to impose quantitative restrictions on textile and clothing products that posed a threat to their domestic industry. Subsequently, in the Uruguay Round, WTO member countries signed ATC in 1993, which was designed to eliminate the quota-based protection system within 10 years and incorporate WTO rules.2 The “integration” process began in 1995 and ended in January 2005. The ATC agreement gave countries that imported and exported textile and clothing products a 10-year period to strengthen their domestic industries, once a gradual reduction in quotas had been agreed.3 Nonetheless, tariff elimination was concentrated in the final stage of ATC, for which reason countries have been waiting to see its potential effects, particularly when faced with competitors as strong as China and India, which were the major nations subject to quotas.4
Although the Central American countries and the Dominican Republic also face quotas established by the United States,5 like other countries that export textiles and garments, they were able to benefit from the Caribbean Basin Economic Recovery Act (CBERA) of 1984, also known as the Caribbean Basin Initiative (CBI), and subsequently from CBTPA as from 2000. As
2 Among WTO members, the United Sates, Canada, the European Community and Norway maintained quotas under MFA. 3 The ATC integration process was divided into four phases in which the products would gradually adopt normal GATT rules. The first phase started on 1 January 1995, the date on which each DR-CAFTA signatory had to select and add products to the schedule contained in the annex of the Agreement representing at least 16% of the total volume its textile and clothing imports in 1990. The second phase began on 1 January 1998 and had to encompass products representing at least an additional 17% of the country’s 1990 textile and clothing imports. The third stage began on 1 January 2002, covering at least a further 18%, and lastly, on 1 January 2005, the remaining 49% of products were integrated.4 Some parts of this article were published previously in Hernández, Romero and Cordero (2006). 5 Except for Nicaragua and Honduras, which have been free of quota control since the mid-1990s. On the competitiveness of maquila clothing manufacture in Central America, see Dussel (2001 and 2004).
noted above, these two instruments enabled beneficiary countries to export their textile and clothing products to the United States, free of tariffs and quota restrictions, provided they fulfilled the rules of origin and standards that those instruments imposed.
Preferential access to the United States market in an international setting of quotas and restrictions helped to diversify Central American and Dominican exports towards other non-agricultural product lines, but at the same time caused their external sales to become concentrated in that market. While just 0.25% of Nicaragua’s exports to the United States were sold to that country’s textile industry in 1990, by 2003 the figure was close to 63%. Similar trends occurred in Guatemala, El Salvador and Honduras, where the share of textile exports in 1990 was 26%, 29% and 24%, but by 2003 had risen to 60%, 87% and 78%, respectively. Thus the five countries of the Central American Common Market (CACM) generated roughly 75% of garment exports to the United States from all CBTPA-eligible countries between the mid-1990s and 2010. CBI countries were jointly ranked second after Mexico in terms of garment exports to the United States ( figures 1 and 2).
In the Dominican Republic, the textile industry share of total exports to the United States was similar to that recorded in Costa Rica (40% and 39%, respectively). But, after peaking in the early 1990s, this industry tended to decline and diversify its exports, particularly in the case of Costa Rica. In 2003, textile exports accounted for 49% of total Dominican exports to the United States, and 18% in the case of Costa Rica (figure 1).
The Central American countries and the Dominican Republic have focused on the second sector of the textile-clothing-distribution chain, i.e. cutting, grouping and assembly of the different garment parts, or else in just one of these activities. According to the United States Harmonized Tariff System, these exports include articles grouped under chapters 61 and 62 of the system: Articles of apparel and clothing accessories; and Articles of apparel and clothing accessories, not knitted or crocheted, respectively (figure 3). The yarn-textile-garment chain encompasses chapters 50 to 63 of the Harmonized System (figure 4).
Garment making uses large amounts of labour, not necessarily skilled; so its increasing weight in total exports has also meant greater employment, especially for women, but with lower wages to maintain competitiveness with the Asian countries. It should be noted that the textile and clothing sector in Nicaragua absorbs 30% of all persons employed in manufacturing activity; in
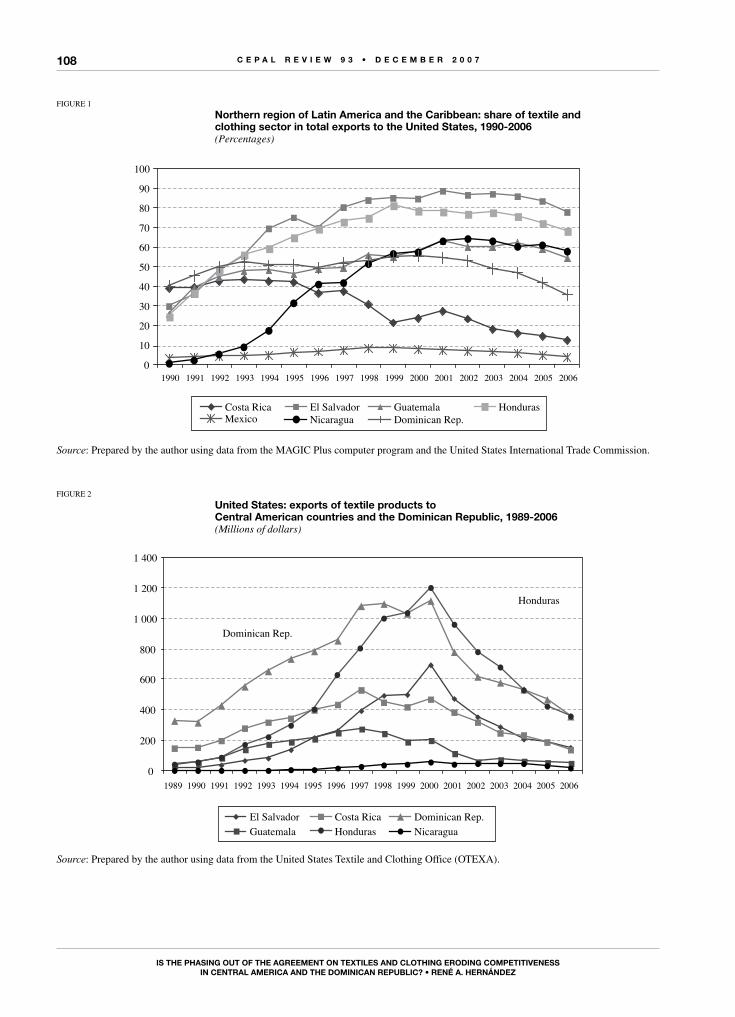
C E P A L R E V I E W 9 3 • D E C E M B E R 2 0 0 7
Is thE PhAsIng out of thE AgREEMEnt on tExtILEs AnD CLothIng ERoDIng CoMPEtItIVEnEss In CEntRAL AMERICA AnD thE DoMInICAn REPuBLIC? • REné A. hERnánDEz
108
FIGURE 1
northern region of Latin America and the Caribbean: share of textile and clothing sector in total exports to the united states, 1990-2006(Percentages)
0
10
20
30
40
50
60
70
80
90
100
1990 1991 1992 1993 1994 1995 1996 1997 1998 1999 2000 2001 2002 2003 2004 2005 2006
Costa RicaMexico
El Salvador Guatemala HondurasNicaragua Dominican Rep.
Source: Prepared by the author using data from the MAGIC Plus computer program and the United States International Trade Commission.
FIGURE 2
united states: exports of textile products toCentral American countries and the Dominican Republic, 1989-2006(Millions of dollars)
0
200
400
600
800
1 000
1 200
1 400
1989 1990 1991 1992 1993 1994 1995 1996 1997 1998 1999 2000 2001 2002 2003 2004 2005 2006
Dominican Rep.
Honduras
El Salvador Costa Rica Dominican Rep. Guatemala Honduras Nicaragua
Source: Prepared by the author using data from the United States Textile and Clothing Office (OTEXA).
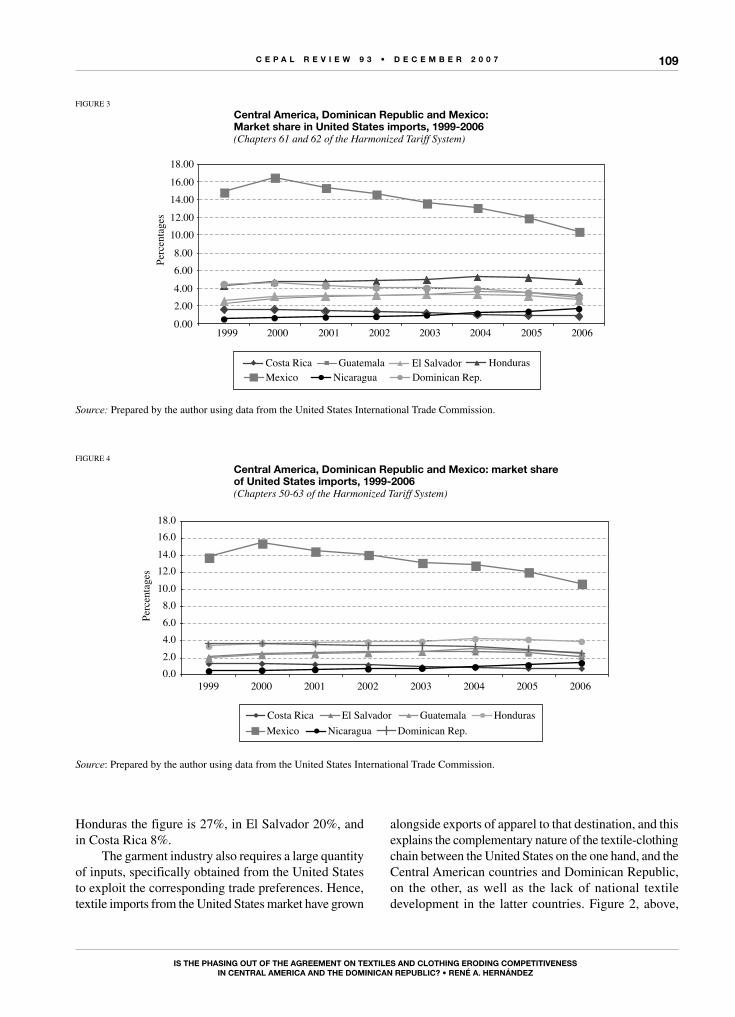
C E P A L R E V I E W 9 3 • D E C E M B E R 2 0 0 7
Is thE PhAsIng out of thE AgREEMEnt on tExtILEs AnD CLothIng ERoDIng CoMPEtItIVEnEss In CEntRAL AMERICA AnD thE DoMInICAn REPuBLIC? • REné A. hERnánDEz
109
Honduras the figure is 27%, in El Salvador 20%, and in Costa Rica 8%.
The garment industry also requires a large quantity of inputs, specifically obtained from the United States to exploit the corresponding trade preferences. Hence, textile imports from the United States market have grown
alongside exports of apparel to that destination, and this explains the complementary nature of the textile-clothing chain between the United States on the one hand, and the Central American countries and Dominican Republic, on the other, as well as the lack of national textile development in the latter countries. Figure 2, above,
FIGURE 3
Central America, Dominican Republic and Mexico: Market share in united states imports, 1999-2006(Chapters 61 and 62 of the Harmonized Tariff System)
0.002.004.006.008.00
10.0012.0014.0016.0018.00
1999 2000 2001 2002 2003 2004 2005 2006
Perc
enta
ges
Costa Rica Guatemala El Salvador HondurasMexico Nicaragua Dominican Rep.
Source: Prepared by the author using data from the United States International Trade Commission.
FIGURE 4
Central America, Dominican Republic and Mexico: market shareof united states imports, 1999-2006(Chapters 50-63 of the Harmonized Tariff System)
Costa Rica El Salvador Guatemala HondurasMexico Nicaragua Dominican Rep.
0.02.04.06.08.0
10.012.014.016.018.0
1999 2000 2001 2002 2003 2004 2005 2006
Perc
enta
ges
Source: Prepared by the author using data from the United States International Trade Commission.
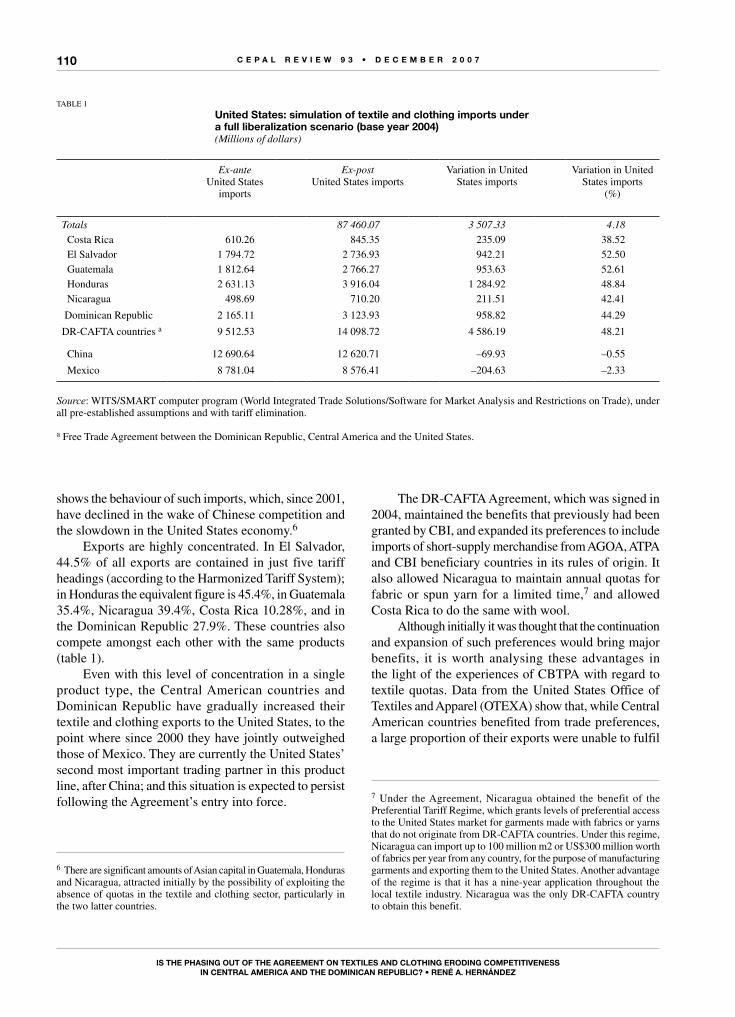
C E P A L R E V I E W 9 3 • D E C E M B E R 2 0 0 7
Is thE PhAsIng out of thE AgREEMEnt on tExtILEs AnD CLothIng ERoDIng CoMPEtItIVEnEss In CEntRAL AMERICA AnD thE DoMInICAn REPuBLIC? • REné A. hERnánDEz
110
shows the behaviour of such imports, which, since 2001, have declined in the wake of Chinese competition and the slowdown in the United States economy.6
Exports are highly concentrated. In El Salvador, 44.5% of all exports are contained in just five tariff headings (according to the Harmonized Tariff System); in Honduras the equivalent figure is 45.4%, in Guatemala 35.4%, Nicaragua 39.4%, Costa Rica 10.28%, and in the Dominican Republic 27.9%. These countries also compete amongst each other with the same products (table 1).
Even with this level of concentration in a single product type, the Central American countries and Dominican Republic have gradually increased their textile and clothing exports to the United States, to the point where since 2000 they have jointly outweighed those of Mexico. They are currently the United States’ second most important trading partner in this product line, after China; and this situation is expected to persist following the Agreement’s entry into force.
6 There are significant amounts of Asian capital in Guatemala, Honduras and Nicaragua, attracted initially by the possibility of exploiting the absence of quotas in the textile and clothing sector, particularly in the two latter countries.
The DR-CAFTA Agreement, which was signed in 2004, maintained the benefits that previously had been granted by CBI, and expanded its preferences to include imports of short-supply merchandise from AGOA, ATPA and CBI beneficiary countries in its rules of origin. It also allowed Nicaragua to maintain annual quotas for fabric or spun yarn for a limited time,7 and allowed Costa Rica to do the same with wool.
Although initially it was thought that the continuation and expansion of such preferences would bring major benefits, it is worth analysing these advantages in the light of the experiences of CBTPA with regard to textile quotas. Data from the United States Office of Textiles and Apparel (OTEXA) show that, while Central American countries benefited from trade preferences, a large proportion of their exports were unable to fulfil
7 Under the Agreement, Nicaragua obtained the benefit of the Preferential Tariff Regime, which grants levels of preferential access to the United States market for garments made with fabrics or yarns that do not originate from DR-CAFTA countries. Under this regime, Nicaragua can import up to 100 million m2 or US$300 million worth of fabrics per year from any country, for the purpose of manufacturing garments and exporting them to the United States. Another advantage of the regime is that it has a nine-year application throughout the local textile industry. Nicaragua was the only DR-CAFTA country to obtain this benefit.
TABLE 1
united states: simulation of textile and clothing imports under a full liberalization scenario (base year 2004)(Millions of dollars)
Ex-anteUnited States
imports
Ex-post United States imports
Variation in United States imports
Variation in United States imports
(%)
Totals 87 460.07 3 507.33 4.18 Costa Rica 610.26 845.35 235.09 38.52 El Salvador 1 794.72 2 736.93 942.21 52.50 Guatemala 1 812.64 2 766.27 953.63 52.61 Honduras 2 631.13 3 916.04 1 284.92 48.84 Nicaragua 498.69 710.20 211.51 42.41
Dominican Republic 2 165.11 3 123.93 958.82 44.29
DR-CAFTA countries a 9 512.53 14 098.72 4 586.19 48.21
China 12 690.64 12 620.71 –69.93 –0.55
Mexico 8 781.04 8 576.41 –204.63 –2.33
Source: WITS/SMART computer program (World Integrated Trade Solutions/Software for Market Analysis and Restrictions on Trade), under all pre-established assumptions and with tariff elimination.
a Free Trade Agreement between the Dominican Republic, Central America and the United States.
C E P A L R E V I E W 9 3 • D E C E M B E R 2 0 0 7
Is thE PhAsIng out of thE AgREEMEnt on tExtILEs AnD CLothIng ERoDIng CoMPEtItIVEnEss In CEntRAL AMERICA AnD thE DoMInICAn REPuBLIC? • REné A. hERnánDEz
111
the origin restrictions imposed, so they had to enter the United States market under the quotas modality.
With the ending of ATC, there will doubtless be major changes in the world textile and clothing market, particularly since the United States, the main importer of these product lines, left a large proportion of its products until the last stage of liberalization ending 1 January 2005. Thus, until now, China has been the country to benefit most from the ending of ATC — as also concluded by other research on this subject.8
The elimination of quotas by the United States could increase China’s share of its market by about 50%, at the expense of other countries that have enjoyed preferential access, including African and Latin American ones. Most analyses, particularly those using general equilibrium models, have found that China and India could jointly account for about 65% of textile and garment imports into the United States (International Trade Commission, 2004b and 2004c):9 China could triple its market share, and India stands to quadruple its share (Kyvik Nordas, 2004). Other studies estimated that the increase in China’s share of those imports would be somewhat smaller, around 28% in 2010 (OXFAM International, 2004).
What is clear is that China’s increased importance on the world market is undeniable. Nonetheless, with the imposition of quotas by the United States, those forecasts could prove exaggerated. In fact, Mayer (2004) states that predictions of a sharp increase in China’s share of the world textile and clothing market obtained through general equilibrium models are overstated, because such
8 See Kuwayama and Cordero (2005). See also a summary of the methodologies and results of other studies in the appendix. 9 The first of these studies mainly indicates the advantages and disadvantages of buying from one or other country and stresses the fact that both China and India could be the main United States choice after the ending of ATC.
models do not take account of the fact that buyers in the United States may choose to diversify their supplier portfolio to avoid reliance on just one or two countries. Another important factor that general equilibrium models omit is that they assume very rapid and unproblematic responses to changes in trade, particularly in developed countries (the countries that impose the quotas), which will probably invoke safeguard clauses or initiate anti-dumping measures to contain the growth of imports from China (Mayer, 2004).
Some of these results were visible in the first few months after the expiry of ATC: from January to August 2005, Agreement signatory countries displayed a slight decrease (nearly 0.6%) in exports to the United States in the yarn-textile-garment chain,10 whereas China posted an increase of about 62% and India one of around 28% with respect to the same period in the previous year. As was to be expected, the United States responded by imposing safeguard measures against China,11 which encompassed 10 product categories up to the end of October 2005.12
This justifies the interest of Central American countries in ascertaining what might happen in the textile and clothing sector when the Agreement enters into force. Although, in theory at least, the expiry of ATC brings to an end the imposition of quotas by countries such as the United States, Canada and members of the European Union, nations that do not have any preferential access or free trade agreement still face tariffs in this sector.
10 These correspond to chapters 50 to 63 of the Harmonized Tariff System.11 An exclusive safeguard for textile and clothing products from China, included within this country’s WTO admission protocol, whereby the United States may impose quotas on China to maintain this country’s textile shipments at a level no greater than 7.5%. 12 After three months of negotiations, on 9 November 2005 an agree-ment between China and the United States was signed in London, whereby the latter reimposes quotas for 34 product categories other than textiles and garments, representing 46% of China’s sales to the United States market. The agreement entered into force on 1 January 2006, and is set to expire on the last day of 2008.
C E P A L R E V I E W 9 3 • D E C E M B E R 2 0 0 7
Is thE PhAsIng out of thE AgREEMEnt on tExtILEs AnD CLothIng ERoDIng CoMPEtItIVEnEss In CEntRAL AMERICA AnD thE DoMInICAn REPuBLIC? • REné A. hERnánDEz
112
IIIPartial equilibrium analysis
Winters and Chang (2000) reached the following main conclusions: (i) regional integration has effects on relative prices between member and non-member countries both before the tariff and after it, and it lowers export prices in non-member countries; and (ii) tariff reductions stemming from preferences within trade blocs harm non-member countries.
Olarreaga and Ozden (2004) perform a similar exercise for AGOA countries, considering the effects of this preferential agreement on the garment segment only. Although in this case those authors agree with the second conclusion reported by Winters and Chang, they nonetheless find that AGOA countries do not fully benefit from the agreement, because of the market power of other importers or the high concentration of exports by AGOA beneficiary countries in the United States market. The impact of the ending of ATC in DR-CAFTA countries (which are also covered by CBTPA) is measured indirectly through its effect on the relative prices of those countries’ exports. The equation which is estimated for selected Central American countries (El Salvador and Honduras)15 adopts and modifies the econometric techniques used by Bulmer and others (2005), with two aims. Firstly, as El Salvador and Honduras are beneficiaries of a preferential agreement with the United States, the aim is to estimate the fraction of the tariff revenue or margin of preference that is actually captured by garment exporters, through the higher prices they receive as beneficiaries of the preferential agreement. The second aim is to quantify the effect of the ending of the quota system by the United States (the main destination of those countries’ garment exports), comparing the export prices of products that are free of quotas, with those that still face this type of quantitative restriction.
15 El Salvador and Honduras were selected because they are the two Central American countries with the largest share of garment exports to United States market and because of the preferential advantage they have obtained under CBTPA. The Dominican Republic is the other major competitor and has been analysed and included on the basis of the results of a recent study (Bulmer and others, 2005).
1. Methodological aspects
In stylized form, there are two basic approaches to analysing the impact of trade policy. The first consists of an ex-ante simulation of the change in trade policy, which makes it possible to project the future effect of a given set of economic variables. The second is ex-post analysis, which uses historical data to analyse the effects of a trade policy that has been adopted. Gravity models are in this second category and are widely used in empirical studies. Based on this initial typology, individual models may differ by being either static or dynamic, or general or partial equilibrium.
To quantify the effect of the ending of ATC in the context of the DR-CAFTA Agreement, both approaches were used, and in each case partial equilibrium models were adopted. A review of published studies on the ending of ATC the framework of the Agreement made it possible to identify two methodologies specifically used for this purpose. The first uses panel data estimation techniques to measure the impact of the ending of ATC in the framework of a preferential access programme. Thus the relative-price effects of implementing a preferential programme and the ending of ATC 13 are both estimated.
2. Ex post model
Drawing on the work of Winters and Chang (2000), Olarreaga and Ozden (2004) and Bulmer and others (2005),14 it was possible to identify and specify the model and perform the econometric estimation reported in this article (see appendix). After setting out the theoretical foundations for the results of granting preferential access and estimating the effects of Spain’s entry into the European Community (now the European Union),
13 In international trade theory, the best way to ascertain whether or not a preferential access programme is advantageous for the benefi-ciary countries is by measuring its impact on the terms of trade of the country in question. Many of the studies that have used this approach have only been able to calculate the impact on relative prices, either of exports or imports, between the beneficiary and non-beneficiary country/ies.14 Bulmer and others (2005) measure the impact of the ending of ATC in the case of the Dominican Republic.
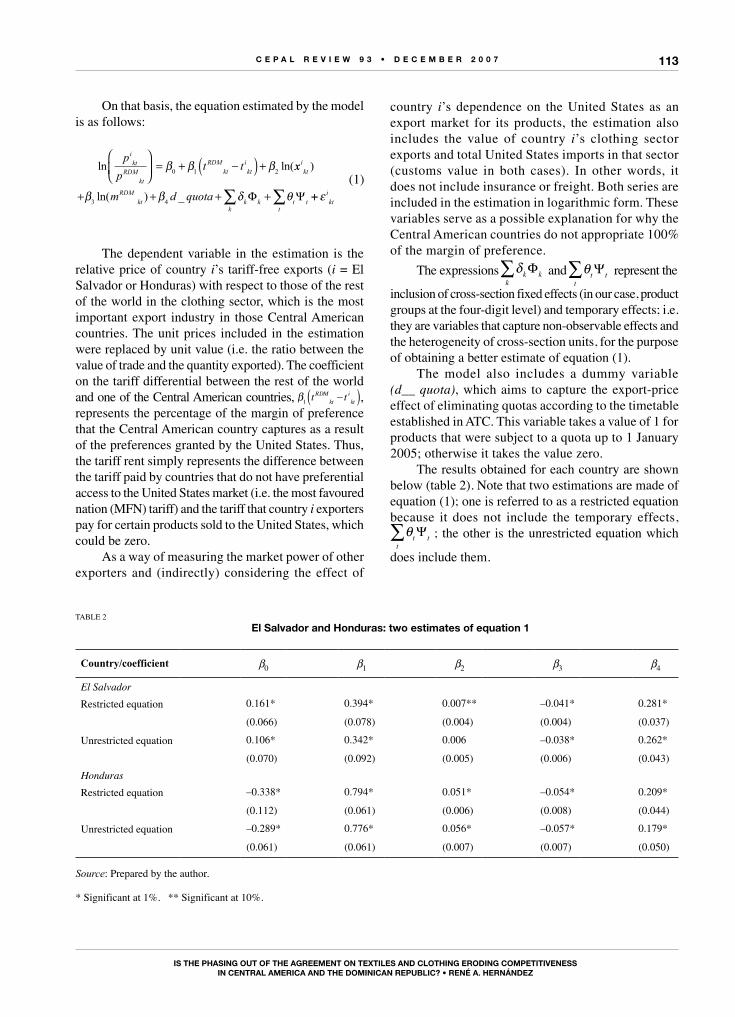
C E P A L R E V I E W 9 3 • D E C E M B E R 2 0 0 7
Is thE PhAsIng out of thE AgREEMEnt on tExtILEs AnD CLothIng ERoDIng CoMPEtItIVEnEss In CEntRAL AMERICA AnD thE DoMInICAn REPuBLIC? • REné A. hERnánDEz
113
On that basis, the equation estimated by the model is as follows:
ln ln(p
pt t
ikt
RDMkt
RDMkt
ikt
= + −( ) +β β β0 1 2 xx
m d quota
ikt
RDMkt k k
kt t
t
)
ln( ) _+ + + +∑ ∑β β δ θ3 4 Φ Ψ ++ ε ikt
The dependent variable in the estimation is the relative price of country i’s tariff-free exports (i = El Salvador or Honduras) with respect to those of the rest of the world in the clothing sector, which is the most important export industry in those Central American countries. The unit prices included in the estimation were replaced by unit value (i.e. the ratio between the value of trade and the quantity exported). The coefficient on the tariff differential between the rest of the world and one of the Central American countries, β1 t tRDM
ktikt−( ),
represents the percentage of the margin of preference that the Central American country captures as a result of the preferences granted by the United States. Thus, the tariff rent simply represents the difference between the tariff paid by countries that do not have preferential access to the United States market (i.e. the most favoured nation (MFN) tariff) and the tariff that country i exporters pay for certain products sold to the United States, which could be zero.
As a way of measuring the market power of other exporters and (indirectly) considering the effect of
TABLE 2
El salvador and honduras: two estimates of equation 1
Country/coefficient β0 β1 β2 β3 β4
El Salvador
Restricted equation 0.161* 0.394* 0.007** –0.041* 0.281*
(0.066) (0.078) (0.004) (0.004) (0.037)
Unrestricted equation 0.106* 0.342* 0.006 –0.038* 0.262*
(0.070) (0.092) (0.005) (0.006) (0.043)
Honduras
Restricted equation –0.338* 0.794* 0.051* –0.054* 0.209*
(0.112) (0.061) (0.006) (0.008) (0.044)
Unrestricted equation –0.289* 0.776* 0.056* –0.057* 0.179*
(0.061) (0.061) (0.007) (0.007) (0.050)
Source: Prepared by the author.
* Significant at 1%. ** Significant at 10%.
country i’s dependence on the United States as an export market for its products, the estimation also includes the value of country i’s clothing sector exports and total United States imports in that sector (customs value in both cases). In other words, it does not include insurance or freight. Both series are included in the estimation in logarithmic form. These variables serve as a possible explanation for why the Central American countries do not appropriate 100% of the margin of preference.
The expressions δk kk
Φ∑ and θt tt
Ψ∑ represent the
inclusion of cross-section fixed effects (in our case, product groups at the four-digit level) and temporary effects; i.e. they are variables that capture non-observable effects and the heterogeneity of cross-section units, for the purpose of obtaining a better estimate of equation (1).
The model also includes a dummy variable (d__ quota), which aims to capture the export-price effect of eliminating quotas according to the timetable established in ATC. This variable takes a value of 1 for products that were subject to a quota up to 1 January 2005; otherwise it takes the value zero.
The results obtained for each country are shown below (table 2). Note that two estimations are made of equation (1); one is referred to as a restricted equation because it does not include the temporary effects,
θt tt
Ψ∑ ; the other is the unrestricted equation which
does include them.
(1)
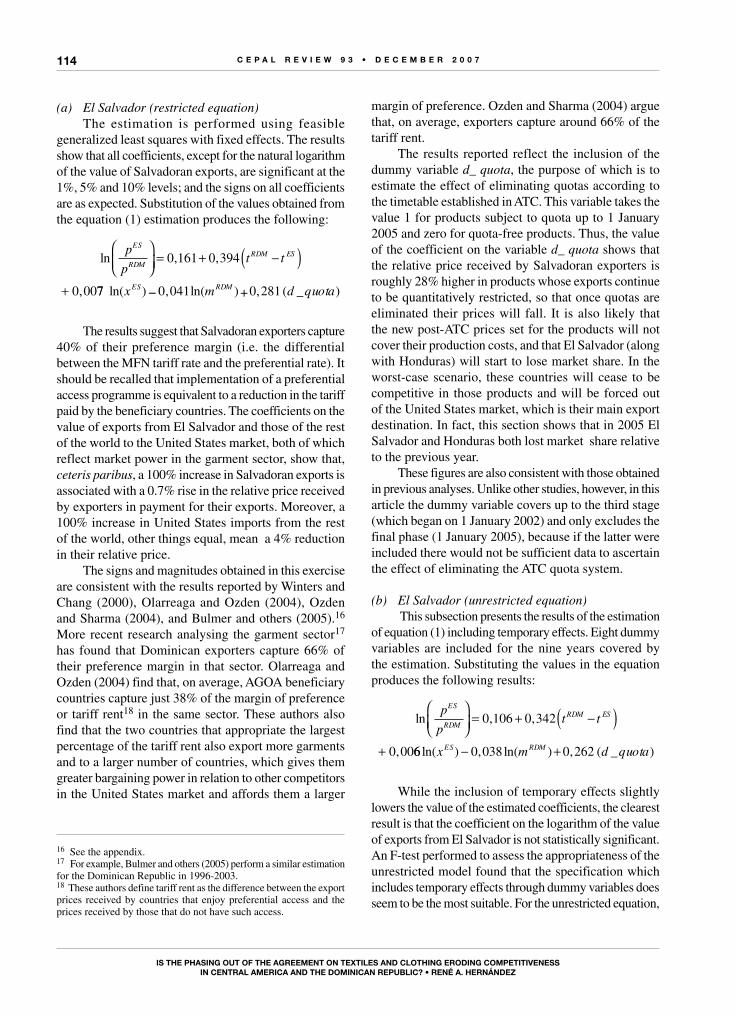
C E P A L R E V I E W 9 3 • D E C E M B E R 2 0 0 7
Is thE PhAsIng out of thE AgREEMEnt on tExtILEs AnD CLothIng ERoDIng CoMPEtItIVEnEss In CEntRAL AMERICA AnD thE DoMInICAn REPuBLIC? • REné A. hERnánDEz
114
(a) El Salvador (restricted equation)The estimation is performed using feasible
generalized least squares with fixed effects. The results show that all coefficients, except for the natural logarithm of the value of Salvadoran exports, are significant at the 1%, 5% and 10% levels; and the signs on all coefficients are as expected. Substitution of the values obtained from the equation (1) estimation produces the following:
ln , ,
,
pp
t tES
RDMRDM ES
= + −( )+
0 161 0 394
0 0077 0 041 0 281ln( ) , ln( ) , ( _ )x m d quotaES RDM− +
The results suggest that Salvadoran exporters capture 40% of their preference margin (i.e. the differential between the MFN tariff rate and the preferential rate). It should be recalled that implementation of a preferential access programme is equivalent to a reduction in the tariff paid by the beneficiary countries. The coefficients on the value of exports from El Salvador and those of the rest of the world to the United States market, both of which reflect market power in the garment sector, show that, ceteris paribus, a 100% increase in Salvadoran exports is associated with a 0.7% rise in the relative price received by exporters in payment for their exports. Moreover, a 100% increase in United States imports from the rest of the world, other things equal, mean a 4% reduction in their relative price.
The signs and magnitudes obtained in this exercise are consistent with the results reported by Winters and Chang (2000), Olarreaga and Ozden (2004), Ozden and Sharma (2004), and Bulmer and others (2005).16 More recent research analysing the garment sector17 has found that Dominican exporters capture 66% of their preference margin in that sector. Olarreaga and Ozden (2004) find that, on average, AGOA beneficiary countries capture just 38% of the margin of preference or tariff rent18 in the same sector. These authors also find that the two countries that appropriate the largest percentage of the tariff rent also export more garments and to a larger number of countries, which gives them greater bargaining power in relation to other competitors in the United States market and affords them a larger
16 See the appendix.17 For example, Bulmer and others (2005) perform a similar estimation for the Dominican Republic in 1996-2003.18 These authors define tariff rent as the difference between the export prices received by countries that enjoy preferential access and the prices received by those that do not have such access.
margin of preference. Ozden and Sharma (2004) argue that, on average, exporters capture around 66% of the tariff rent.
The results reported reflect the inclusion of the dummy variable d_ quota, the purpose of which is to estimate the effect of eliminating quotas according to the timetable established in ATC. This variable takes the value 1 for products subject to quota up to 1 January 2005 and zero for quota-free products. Thus, the value of the coefficient on the variable d_ quota shows that the relative price received by Salvadoran exporters is roughly 28% higher in products whose exports continue to be quantitatively restricted, so that once quotas are eliminated their prices will fall. It is also likely that the new post-ATC prices set for the products will not cover their production costs, and that El Salvador (along with Honduras) will start to lose market share. In the worst-case scenario, these countries will cease to be competitive in those products and will be forced out of the United States market, which is their main export destination. In fact, this section shows that in 2005 El Salvador and Honduras both lost market share relative to the previous year.
These figures are also consistent with those obtained in previous analyses. Unlike other studies, however, in this article the dummy variable covers up to the third stage (which began on 1 January 2002) and only excludes the final phase (1 January 2005), because if the latter were included there would not be sufficient data to ascertain the effect of eliminating the ATC quota system.
(b) El Salvador (unrestricted equation) This subsection presents the results of the estimation
of equation (1) including temporary effects. Eight dummy variables are included for the nine years covered by the estimation. Substituting the values in the equation produces the following results:
ln , ,
,
pp
t tES
RDMRDM ES
= + −( )+
0 106 0 342
0 0066 0 038 0 262ln( ) , ln( ) , ( _ )x m d quotaES RDM− +
While the inclusion of temporary effects slightly lowers the value of the estimated coefficients, the clearest result is that the coefficient on the logarithm of the value of exports from El Salvador is not statistically significant. An F-test performed to assess the appropriateness of the unrestricted model found that the specification which includes temporary effects through dummy variables does seem to be the most suitable. For the unrestricted equation,
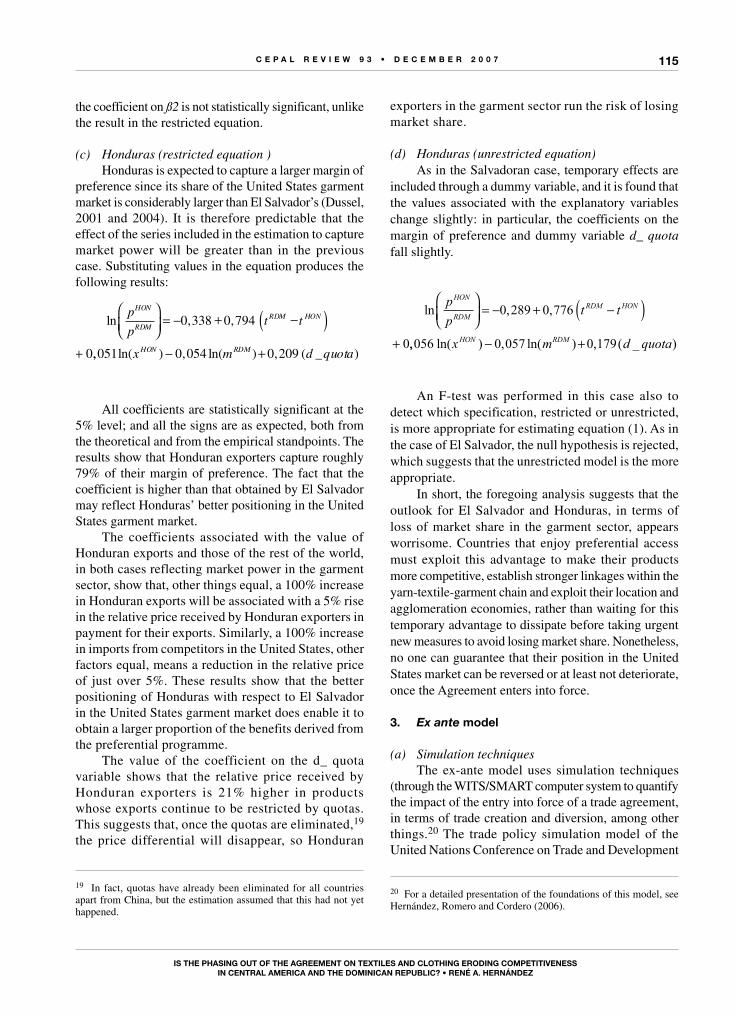
C E P A L R E V I E W 9 3 • D E C E M B E R 2 0 0 7
Is thE PhAsIng out of thE AgREEMEnt on tExtILEs AnD CLothIng ERoDIng CoMPEtItIVEnEss In CEntRAL AMERICA AnD thE DoMInICAn REPuBLIC? • REné A. hERnánDEz
115
the coefficient on ß2 is not statistically significant, unlike the result in the restricted equation.
(c) Honduras (restricted equation )Honduras is expected to capture a larger margin of
preference since its share of the United States garment market is considerably larger than El Salvador’s (Dussel, 2001 and 2004). It is therefore predictable that the effect of the series included in the estimation to capture market power will be greater than in the previous case. Substituting values in the equation produces the following results:
ln , ,pp
t tHON
RDMRDM HON
= − + −( )+
0 338 0 794
0,, ln( ) , ln( ) , ( _ )051 0 054 0 209x m d quotaHON RDM− +
All coefficients are statistically significant at the 5% level; and all the signs are as expected, both from the theoretical and from the empirical standpoints. The results show that Honduran exporters capture roughly 79% of their margin of preference. The fact that the coefficient is higher than that obtained by El Salvador may reflect Honduras’ better positioning in the United States garment market.
The coefficients associated with the value of Honduran exports and those of the rest of the world, in both cases reflecting market power in the garment sector, show that, other things equal, a 100% increase in Honduran exports will be associated with a 5% rise in the relative price received by Honduran exporters in payment for their exports. Similarly, a 100% increase in imports from competitors in the United States, other factors equal, means a reduction in the relative price of just over 5%. These results show that the better positioning of Honduras with respect to El Salvador in the United States garment market does enable it to obtain a larger proportion of the benefits derived from the preferential programme.
The value of the coefficient on the d_ quota variable shows that the relative price received by Honduran exporters is 21% higher in products whose exports continue to be restricted by quotas. This suggests that, once the quotas are eliminated,19 the price differential will disappear, so Honduran
19 In fact, quotas have already been eliminated for all countries apart from China, but the estimation assumed that this had not yet happened.
exporters in the garment sector run the risk of losing market share.
(d) Honduras (unrestricted equation)As in the Salvadoran case, temporary effects are
included through a dummy variable, and it is found that the values associated with the explanatory variables change slightly: in particular, the coefficients on the margin of preference and dummy variable d_ quota fall slightly.
ln , ,pp
t tHON
RDMRDM HON
= − + −( )
+
0 289 0 776
0 ,, ln( ) , ln( ) , ( _ )056 0 057 0 179x m d quotaHON RDM− +
An F-test was performed in this case also to detect which specification, restricted or unrestricted, is more appropriate for estimating equation (1). As in the case of El Salvador, the null hypothesis is rejected, which suggests that the unrestricted model is the more appropriate.
In short, the foregoing analysis suggests that the outlook for El Salvador and Honduras, in terms of loss of market share in the garment sector, appears worrisome. Countries that enjoy preferential access must exploit this advantage to make their products more competitive, establish stronger linkages within the yarn-textile-garment chain and exploit their location and agglomeration economies, rather than waiting for this temporary advantage to dissipate before taking urgent new measures to avoid losing market share. Nonetheless, no one can guarantee that their position in the United States market can be reversed or at least not deteriorate, once the Agreement enters into force.
3. Ex ante model
(a) Simulation techniques The ex-ante model uses simulation techniques
(through the WITS/SMART computer system to quantify the impact of the entry into force of a trade agreement, in terms of trade creation and diversion, among other things.20 The trade policy simulation model of the United Nations Conference on Trade and Development
20 For a detailed presentation of the foundations of this model, see Hernández, Romero and Cordero (2006).
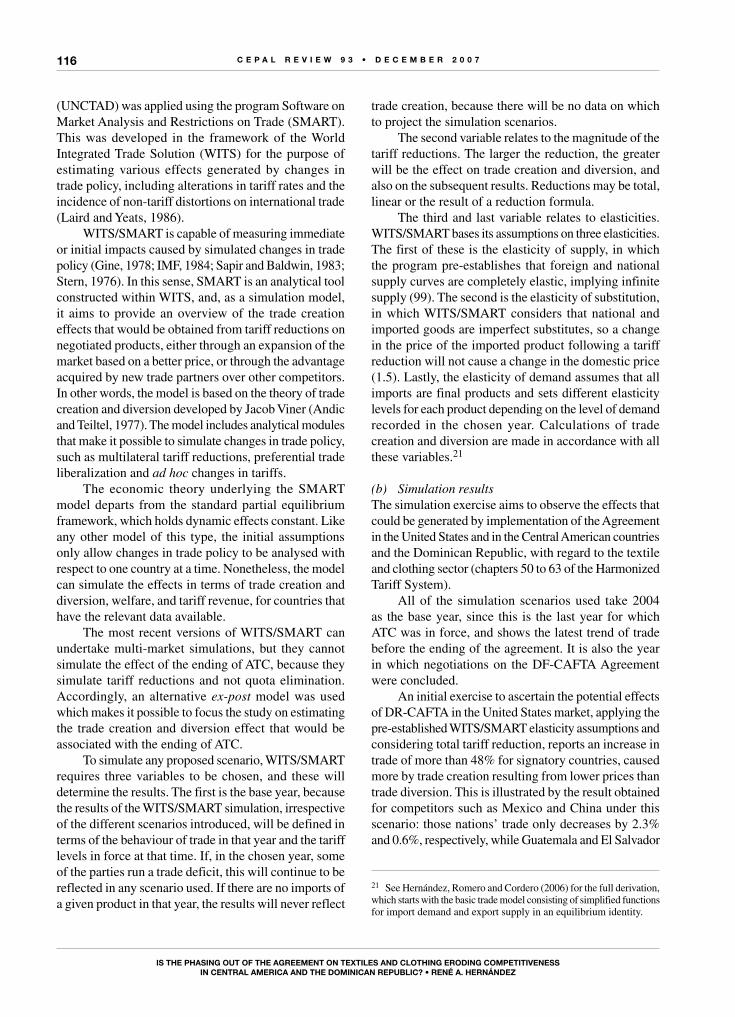
C E P A L R E V I E W 9 3 • D E C E M B E R 2 0 0 7
Is thE PhAsIng out of thE AgREEMEnt on tExtILEs AnD CLothIng ERoDIng CoMPEtItIVEnEss In CEntRAL AMERICA AnD thE DoMInICAn REPuBLIC? • REné A. hERnánDEz
116
(UNCTAD) was applied using the program Software on Market Analysis and Restrictions on Trade (SMART). This was developed in the framework of the World Integrated Trade Solution (WITS) for the purpose of estimating various effects generated by changes in trade policy, including alterations in tariff rates and the incidence of non-tariff distortions on international trade (Laird and Yeats, 1986).
WITS/SMART is capable of measuring immediate or initial impacts caused by simulated changes in trade policy (Gine, 1978; IMF, 1984; Sapir and Baldwin, 1983; Stern, 1976). In this sense, SMART is an analytical tool constructed within WITS, and, as a simulation model, it aims to provide an overview of the trade creation effects that would be obtained from tariff reductions on negotiated products, either through an expansion of the market based on a better price, or through the advantage acquired by new trade partners over other competitors. In other words, the model is based on the theory of trade creation and diversion developed by Jacob Viner (Andic and Teiltel, 1977). The model includes analytical modules that make it possible to simulate changes in trade policy, such as multilateral tariff reductions, preferential trade liberalization and ad hoc changes in tariffs.
The economic theory underlying the SMART model departs from the standard partial equilibrium framework, which holds dynamic effects constant. Like any other model of this type, the initial assumptions only allow changes in trade policy to be analysed with respect to one country at a time. Nonetheless, the model can simulate the effects in terms of trade creation and diversion, welfare, and tariff revenue, for countries that have the relevant data available.
The most recent versions of WITS/SMART can undertake multi-market simulations, but they cannot simulate the effect of the ending of ATC, because they simulate tariff reductions and not quota elimination. Accordingly, an alternative ex-post model was used which makes it possible to focus the study on estimating the trade creation and diversion effect that would be associated with the ending of ATC.
To simulate any proposed scenario, WITS/SMART requires three variables to be chosen, and these will determine the results. The first is the base year, because the results of the WITS/SMART simulation, irrespective of the different scenarios introduced, will be defined in terms of the behaviour of trade in that year and the tariff levels in force at that time. If, in the chosen year, some of the parties run a trade deficit, this will continue to be reflected in any scenario used. If there are no imports of a given product in that year, the results will never reflect
trade creation, because there will be no data on which to project the simulation scenarios.
The second variable relates to the magnitude of the tariff reductions. The larger the reduction, the greater will be the effect on trade creation and diversion, and also on the subsequent results. Reductions may be total, linear or the result of a reduction formula.
The third and last variable relates to elasticities. WITS/SMART bases its assumptions on three elasticities. The first of these is the elasticity of supply, in which the program pre-establishes that foreign and national supply curves are completely elastic, implying infinite supply (99). The second is the elasticity of substitution, in which WITS/SMART considers that national and imported goods are imperfect substitutes, so a change in the price of the imported product following a tariff reduction will not cause a change in the domestic price (1.5). Lastly, the elasticity of demand assumes that all imports are final products and sets different elasticity levels for each product depending on the level of demand recorded in the chosen year. Calculations of trade creation and diversion are made in accordance with all these variables.21
(b) Simulation resultsThe simulation exercise aims to observe the effects that could be generated by implementation of the Agreement in the United States and in the Central American countries and the Dominican Republic, with regard to the textile and clothing sector (chapters 50 to 63 of the Harmonized Tariff System).
All of the simulation scenarios used take 2004 as the base year, since this is the last year for which ATC was in force, and shows the latest trend of trade before the ending of the agreement. It is also the year in which negotiations on the DF-CAFTA Agreement were concluded.
An initial exercise to ascertain the potential effects of DR-CAFTA in the United States market, applying the pre-established WITS/SMART elasticity assumptions and considering total tariff reduction, reports an increase in trade of more than 48% for signatory countries, caused more by trade creation resulting from lower prices than trade diversion. This is illustrated by the result obtained for competitors such as Mexico and China under this scenario: those nations’ trade only decreases by 2.3% and 0.6%, respectively, while Guatemala and El Salvador
21 See Hernández, Romero and Cordero (2006) for the full derivation, which starts with the basic trade model consisting of simplified functions for import demand and export supply in an equilibrium identity.
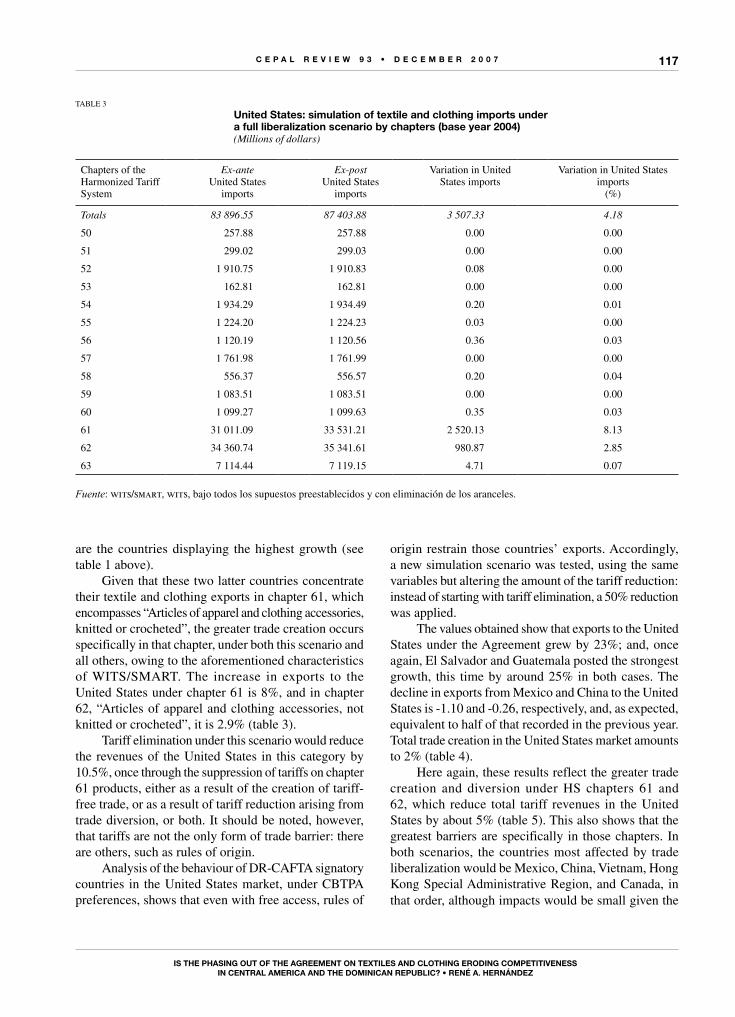
C E P A L R E V I E W 9 3 • D E C E M B E R 2 0 0 7
Is thE PhAsIng out of thE AgREEMEnt on tExtILEs AnD CLothIng ERoDIng CoMPEtItIVEnEss In CEntRAL AMERICA AnD thE DoMInICAn REPuBLIC? • REné A. hERnánDEz
117
are the countries displaying the highest growth (see table 1 above).
Given that these two latter countries concentrate their textile and clothing exports in chapter 61, which encompasses “Articles of apparel and clothing accessories, knitted or crocheted”, the greater trade creation occurs specifically in that chapter, under both this scenario and all others, owing to the aforementioned characteristics of WITS/SMART. The increase in exports to the United States under chapter 61 is 8%, and in chapter 62, “Articles of apparel and clothing accessories, not knitted or crocheted”, it is 2.9% (table 3).
Tariff elimination under this scenario would reduce the revenues of the United States in this category by 10.5%, once through the suppression of tariffs on chapter 61 products, either as a result of the creation of tariff-free trade, or as a result of tariff reduction arising from trade diversion, or both. It should be noted, however, that tariffs are not the only form of trade barrier: there are others, such as rules of origin.
Analysis of the behaviour of DR-CAFTA signatory countries in the United States market, under CBTPA preferences, shows that even with free access, rules of
origin restrain those countries’ exports. Accordingly, a new simulation scenario was tested, using the same variables but altering the amount of the tariff reduction: instead of starting with tariff elimination, a 50% reduction was applied.
The values obtained show that exports to the United States under the Agreement grew by 23%; and, once again, El Salvador and Guatemala posted the strongest growth, this time by around 25% in both cases. The decline in exports from Mexico and China to the United States is -1.10 and -0.26, respectively, and, as expected, equivalent to half of that recorded in the previous year. Total trade creation in the United States market amounts to 2% (table 4).
Here again, these results reflect the greater trade creation and diversion under HS chapters 61 and 62, which reduce total tariff revenues in the United States by about 5% (table 5). This also shows that the greatest barriers are specifically in those chapters. In both scenarios, the countries most affected by trade liberalization would be Mexico, China, Vietnam, Hong Kong Special Administrative Region, and Canada, in that order, although impacts would be small given the
TABLE 3
united states: simulation of textile and clothing imports under a full liberalization scenario by chapters (base year 2004)(Millions of dollars)
Chapters of the Harmonized Tariff System
Ex-anteUnited States
imports
Ex-post United States
imports
Variation in United States imports
Variation in United States imports
(%)
Totals 83 896.55 87 403.88 3 507.33 4.18
50 257.88 257.88 0.00 0.00
51 299.02 299.03 0.00 0.00
52 1 910.75 1 910.83 0.08 0.00
53 162.81 162.81 0.00 0.00
54 1 934.29 1 934.49 0.20 0.01
55 1 224.20 1 224.23 0.03 0.00
56 1 120.19 1 120.56 0.36 0.03
57 1 761.98 1 761.99 0.00 0.00
58 556.37 556.57 0.20 0.04
59 1 083.51 1 083.51 0.00 0.00
60 1 099.27 1 099.63 0.35 0.03
61 31 011.09 33 531.21 2 520.13 8.13
62 34 360.74 35 341.61 980.87 2.85
63 7 114.44 7 119.15 4.71 0.07
Fuente: wits/smart, wits, bajo todos los supuestos preestablecidos y con eliminación de los aranceles.
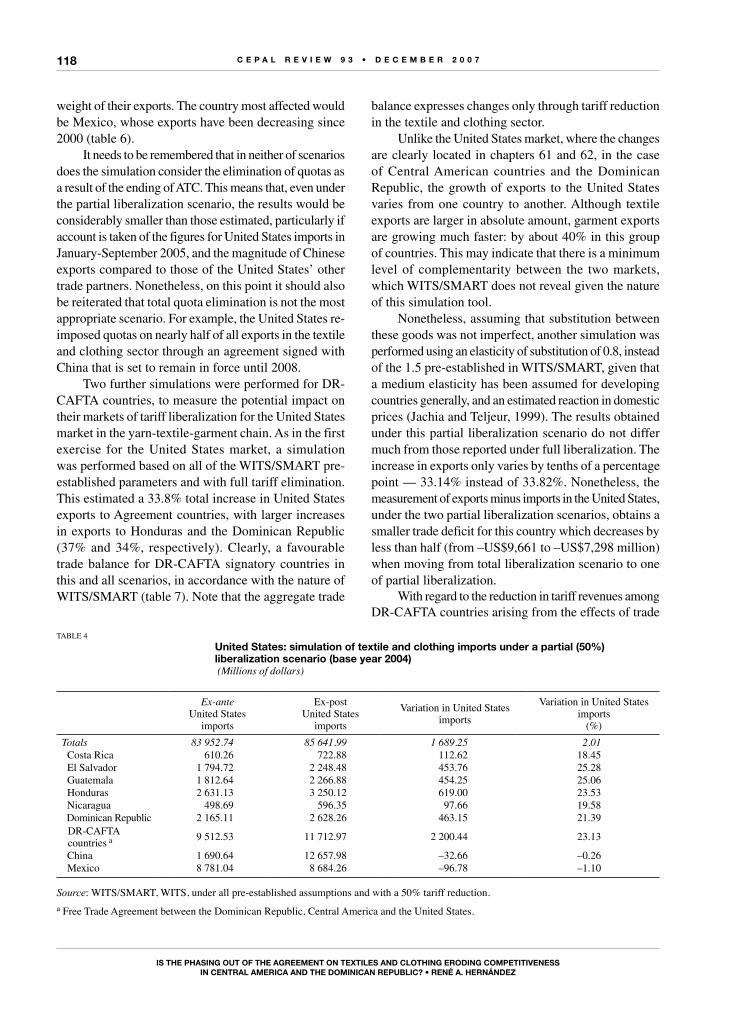
C E P A L R E V I E W 9 3 • D E C E M B E R 2 0 0 7
Is thE PhAsIng out of thE AgREEMEnt on tExtILEs AnD CLothIng ERoDIng CoMPEtItIVEnEss In CEntRAL AMERICA AnD thE DoMInICAn REPuBLIC? • REné A. hERnánDEz
118
weight of their exports. The country most affected would be Mexico, whose exports have been decreasing since 2000 (table 6).
It needs to be remembered that in neither of scenarios does the simulation consider the elimination of quotas as a result of the ending of ATC. This means that, even under the partial liberalization scenario, the results would be considerably smaller than those estimated, particularly if account is taken of the figures for United States imports in January-September 2005, and the magnitude of Chinese exports compared to those of the United States’ other trade partners. Nonetheless, on this point it should also be reiterated that total quota elimination is not the most appropriate scenario. For example, the United States re-imposed quotas on nearly half of all exports in the textile and clothing sector through an agreement signed with China that is set to remain in force until 2008.
Two further simulations were performed for DR-CAFTA countries, to measure the potential impact on their markets of tariff liberalization for the United States market in the yarn-textile-garment chain. As in the first exercise for the United States market, a simulation was performed based on all of the WITS/SMART pre-established parameters and with full tariff elimination. This estimated a 33.8% total increase in United States exports to Agreement countries, with larger increases in exports to Honduras and the Dominican Republic (37% and 34%, respectively). Clearly, a favourable trade balance for DR-CAFTA signatory countries in this and all scenarios, in accordance with the nature of WITS/SMART (table 7). Note that the aggregate trade
balance expresses changes only through tariff reduction in the textile and clothing sector.
Unlike the United States market, where the changes are clearly located in chapters 61 and 62, in the case of Central American countries and the Dominican Republic, the growth of exports to the United States varies from one country to another. Although textile exports are larger in absolute amount, garment exports are growing much faster: by about 40% in this group of countries. This may indicate that there is a minimum level of complementarity between the two markets, which WITS/SMART does not reveal given the nature of this simulation tool.
Nonetheless, assuming that substitution between these goods was not imperfect, another simulation was performed using an elasticity of substitution of 0.8, instead of the 1.5 pre-established in WITS/SMART, given that a medium elasticity has been assumed for developing countries generally, and an estimated reaction in domestic prices (Jachia and Teljeur, 1999). The results obtained under this partial liberalization scenario do not differ much from those reported under full liberalization. The increase in exports only varies by tenths of a percentage point — 33.14% instead of 33.82%. Nonetheless, the measurement of exports minus imports in the United States, under the two partial liberalization scenarios, obtains a smaller trade deficit for this country which decreases by less than half (from –US$9,661 to –US$7,298 million) when moving from total liberalization scenario to one of partial liberalization.
With regard to the reduction in tariff revenues among DR-CAFTA countries arising from the effects of trade
TABLE 4
united states: simulation of textile and clothing imports under a partial (50%) liberalization scenario (base year 2004) (Millions of dollars)
Ex-anteUnited States
imports
Ex-postUnited States
imports
Variation in United States imports
Variation in United States imports
(%)Totals 83 952.74 85 641.99 1 689.25 2.01 Costa Rica 610.26 722.88 112.62 18.45 El Salvador 1 794.72 2 248.48 453.76 25.28 Guatemala 1 812.64 2 266.88 454.25 25.06 Honduras 2 631.13 3 250.12 619.00 23.53 Nicaragua 498.69 596.35 97.66 19.58 Dominican Republic 2 165.11 2 628.26 463.15 21.39
DR-CAFTA countries a 9 512.53 11 712.97 2 200.44 23.13
China 1 690.64 12 657.98 –32.66 –0.26 Mexico 8 781.04 8 684.26 –96.78 –1.10
Source: WITS/SMART, WITS, under all pre-established assumptions and with a 50% tariff reduction.a Free Trade Agreement between the Dominican Republic, Central America and the United States.
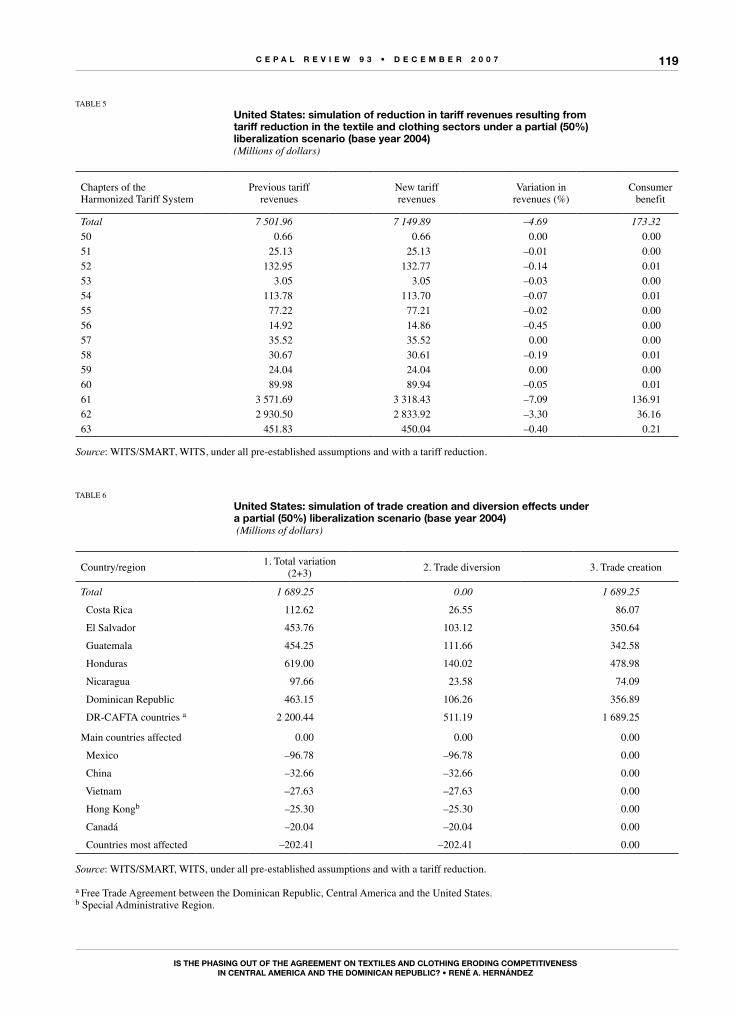
C E P A L R E V I E W 9 3 • D E C E M B E R 2 0 0 7
Is thE PhAsIng out of thE AgREEMEnt on tExtILEs AnD CLothIng ERoDIng CoMPEtItIVEnEss In CEntRAL AMERICA AnD thE DoMInICAn REPuBLIC? • REné A. hERnánDEz
119
TABLE 5
united states: simulation of reduction in tariff revenues resulting from tariff reduction in the textile and clothing sectors under a partial (50%) liberalization scenario (base year 2004)(Millions of dollars)
Chapters of the Harmonized Tariff System
Previous tariff revenues
New tariff revenues
Variation in revenues (%)
Consumer benefit
Total 7 501.96 7 149.89 –4.69 173.3250 0.66 0.66 0.00 0.0051 25.13 25.13 –0.01 0.0052 132.95 132.77 –0.14 0.0153 3.05 3.05 –0.03 0.0054 113.78 113.70 –0.07 0.0155 77.22 77.21 –0.02 0.0056 14.92 14.86 –0.45 0.0057 35.52 35.52 0.00 0.0058 30.67 30.61 –0.19 0.0159 24.04 24.04 0.00 0.0060 89.98 89.94 –0.05 0.0161 3 571.69 3 318.43 –7.09 136.9162 2 930.50 2 833.92 –3.30 36.1663 451.83 450.04 –0.40 0.21
Source: WITS/SMART, WITS, under all pre-established assumptions and with a tariff reduction.
TABLE 6
united states: simulation of trade creation and diversion effects under a partial (50%) liberalization scenario (base year 2004) (Millions of dollars)
Country/region 1. Total variation(2+3) 2. Trade diversion 3. Trade creation
Total 1 689.25 0.00 1 689.25
Costa Rica 112.62 26.55 86.07
El Salvador 453.76 103.12 350.64
Guatemala 454.25 111.66 342.58
Honduras 619.00 140.02 478.98
Nicaragua 97.66 23.58 74.09
Dominican Republic 463.15 106.26 356.89
DR-CAFTA countries a 2 200.44 511.19 1 689.25
Main countries affected 0.00 0.00 0.00
Mexico –96.78 –96.78 0.00
China –32.66 –32.66 0.00
Vietnam –27.63 –27.63 0.00
Hong Kongb –25.30 –25.30 0.00
Canadá –20.04 –20.04 0.00
Countries most affected –202.41 –202.41 0.00
Source: WITS/SMART, WITS, under all pre-established assumptions and with a tariff reduction.
a Free Trade Agreement between the Dominican Republic, Central America and the United States.b Special Administrative Region.
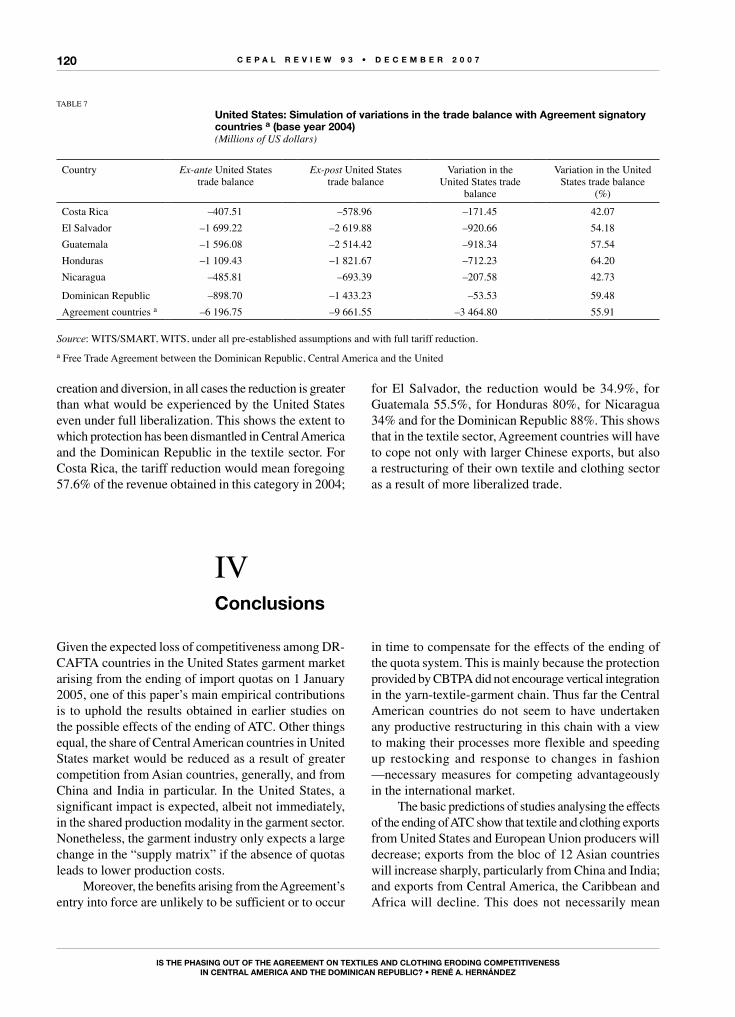
C E P A L R E V I E W 9 3 • D E C E M B E R 2 0 0 7
Is thE PhAsIng out of thE AgREEMEnt on tExtILEs AnD CLothIng ERoDIng CoMPEtItIVEnEss In CEntRAL AMERICA AnD thE DoMInICAn REPuBLIC? • REné A. hERnánDEz
120
creation and diversion, in all cases the reduction is greater than what would be experienced by the United States even under full liberalization. This shows the extent to which protection has been dismantled in Central America and the Dominican Republic in the textile sector. For Costa Rica, the tariff reduction would mean foregoing 57.6% of the revenue obtained in this category in 2004;
for El Salvador, the reduction would be 34.9%, for Guatemala 55.5%, for Honduras 80%, for Nicaragua 34% and for the Dominican Republic 88%. This shows that in the textile sector, Agreement countries will have to cope not only with larger Chinese exports, but also a restructuring of their own textile and clothing sector as a result of more liberalized trade.
TABLE 7
united states: simulation of variations in the trade balance with Agreement signatory countries a (base year 2004)(Millions of US dollars)
Country Ex-ante United States trade balance
Ex-post United States trade balance
Variation in the United States trade
balance
Variation in the United States trade balance
(%)
Costa Rica –407.51 –578.96 –171.45 42.07
El Salvador –1 699.22 –2 619.88 –920.66 54.18
Guatemala –1 596.08 –2 514.42 –918.34 57.54
Honduras –1 109.43 –1 821.67 –712.23 64.20
Nicaragua –485.81 –693.39 –207.58 42.73
Dominican Republic –898.70 –1 433.23 –53.53 59.48
Agreement countries a –6 196.75 –9 661.55 –3 464.80 55.91
Source: WITS/SMART, WITS, under all pre-established assumptions and with full tariff reduction.a Free Trade Agreement between the Dominican Republic, Central America and the United
IVConclusions
Given the expected loss of competitiveness among DR-CAFTA countries in the United States garment market arising from the ending of import quotas on 1 January 2005, one of this paper’s main empirical contributions is to uphold the results obtained in earlier studies on the possible effects of the ending of ATC. Other things equal, the share of Central American countries in United States market would be reduced as a result of greater competition from Asian countries, generally, and from China and India in particular. In the United States, a significant impact is expected, albeit not immediately, in the shared production modality in the garment sector. Nonetheless, the garment industry only expects a large change in the “supply matrix” if the absence of quotas leads to lower production costs.
Moreover, the benefits arising from the Agreement’s entry into force are unlikely to be sufficient or to occur
in time to compensate for the effects of the ending of the quota system. This is mainly because the protection provided by CBTPA did not encourage vertical integration in the yarn-textile-garment chain. Thus far the Central American countries do not seem to have undertaken any productive restructuring in this chain with a view to making their processes more flexible and speeding up restocking and response to changes in fashion —necessary measures for competing advantageously in the international market.
The basic predictions of studies analysing the effects of the ending of ATC show that textile and clothing exports from United States and European Union producers will decrease; exports from the bloc of 12 Asian countries will increase sharply, particularly from China and India; and exports from Central America, the Caribbean and Africa will decline. This does not necessarily mean
C E P A L R E V I E W 9 3 • D E C E M B E R 2 0 0 7
Is thE PhAsIng out of thE AgREEMEnt on tExtILEs AnD CLothIng ERoDIng CoMPEtItIVEnEss In CEntRAL AMERICA AnD thE DoMInICAn REPuBLIC? • REné A. hERnánDEz
121
that countries such as El Salvador, Honduras and the Dominican Republic, among others, will cease to be strong competitors in the garment sector. In fact, the forecasts contained in the studies do not fully agree over the magnitude of these effects, but they do share a general view of the direction and sign of the trends, at least at the regional level.
In estimations made for the 1996-2004 period, it was found that El Salvador and Honduras captured around 40% and 80% of their preference margin, respectively. With these estimations, progress has been made in applying the methodology, because an approximation has also been obtained for the expected effect of the ending of ATC on relative export prices (Honduras and El Salvador with respect to the rest of the world).
The results obtained suggest that the ending of ATC will cause a fall in the relative prices of export garments of around 20% for El Salvador and Honduras. Accordingly, if these nations do not adjust their prices to the international price (or cannot do so because their costs are uncompetitive), with the ending of ATC, other things equal, they will gradually lose market share, unless they seek to compete through different channels, such as the “full package” system or other forms of innovation in production processes.
The findings of this research are theoretically and empirically consistent with the results of previous studies and the direction of the trends identified in them. This article aims to move forward on key modalities, such as the “full package”, especially in chapter 61 of the Harmonized Tariff System; strengthen national strategies to attract investments into the textile sector,
especially for the manufacture of technical textiles; and improve links in the productive chain where value can be added, such as design, quality control, logistics, and retail distribution. This in turn requires appropriate education, qualification and training of human capital, together with good transport and telecommunications infrastructure.
The ending of ATC is also expected to reduce interest in shared production programmes (i.e. processing abroad under the various maquila modalities). In current circumstances, distance, location economies and “just-in-time” systems are decisive for defining the competitive advantage of the textile and clothing sector.
Before ATC expired on 1 January 2005, developing countries such as the Dominican Republic, El Salvador and Honduras had a clear advantage in the assembly and sewing of cloth pieces based on low wages. Nonetheless, with the ending of ATC and consequent reorganization of the market, along with the rise of the “full package system”, the competitive advantage obtained from low wages seems to represent only a small fraction of the value chain of the textile and clothing sectors. With the appearance of new forms of production and less accentuated diversification of the productive processes involved in garment manufacture, other factors, such as time, become more important for competing advantageously on the international market. Given the trend towards integration of the links of the productive chain, time intervals between one process and the next need to be minimized to respond effectively and rapidly to the demands of fashion.
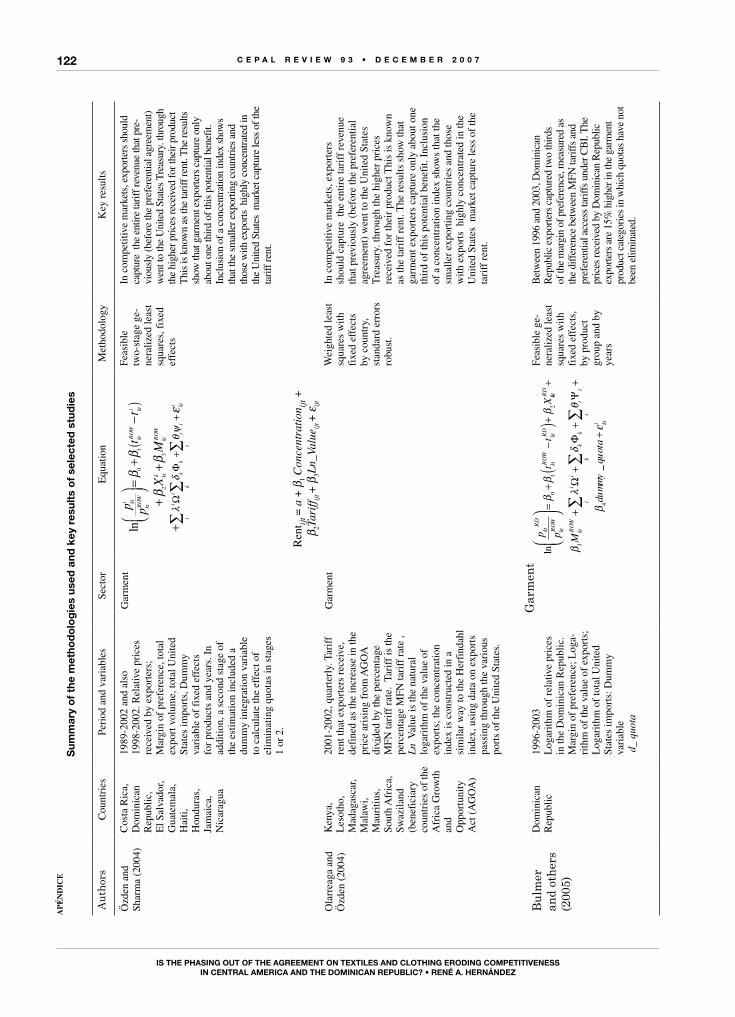
C E P A L R E V I E W 9 3 • D E C E M B E R 2 0 0 7
Is thE PhAsIng out of thE AgREEMEnt on tExtILEs AnD CLothIng ERoDIng CoMPEtItIVEnEss In CEntRAL AMERICA AnD thE DoMInICAn REPuBLIC? • REné A. hERnánDEz
122A
pén
dic
es
umm
ary
of
the
met
hod
olo
gie
s us
ed a
nd k
ey r
esul
ts o
f se
lect
ed s
tud
ies
Au
thor
sC
ount
ries
Perio
d an
d va
riabl
esSe
ctor
Equa
tion
Met
hodo
logy
Key
resu
lts
Özd
en a
nd
Shar
ma
(200
4)C
osta
Ric
a,
Dom
inic
an
Rep
ublic
, E
l Sal
vado
r,
Gua
tem
ala,
H
aiti,
H
ondu
ras,
Ja
mai
ca,
Nic
arag
ua
1989
-200
2 an
d al
so
1998
-200
2. R
elat
ive
pric
es
rece
ived
by
expo
rter
s;
Mar
gin
of p
refe
renc
e, to
tal
expo
rt v
olum
e, to
tal U
nite
d St
ates
impo
rts,
Dum
my
vari
able
of
fixe
d ef
fect
s fo
r pr
oduc
ts a
nd y
ears
. In
addi
tion,
a s
econ
d st
age
of
the
estim
atio
n in
clud
ed a
du
mm
y in
tegr
atio
n va
riab
le
to c
alcu
late
the
effe
ct o
f el
imin
atin
g qu
otas
in s
tage
s 1
or 2
.
Gar
men
tln
p pt
t
X
kti
ktROW
ktROW
kti
kt
()
=+
−
+
ββ
β
01
2ii
ktROW
ii
ik
kk
tt
kti
tM+
+ ∑∑
∑++
βε
λδ
θψ
3
ΩΦ
Feas
ible
tw
o-st
age
ge-
nera
lized
leas
t sq
uare
s, f
ixed
ef
fect
s
In c
ompe
titiv
e m
arke
ts, e
xpor
ters
sho
uld
capt
ure
the
entir
e ta
riff
reve
nue
that
pre
-vi
ousl
y (b
efor
e th
e pr
efer
entia
l agr
eem
ent)
w
ent t
o th
e U
nite
d St
ates
Tre
asur
y. th
roug
h th
e hi
gher
pri
ces
rece
ived
for t
heir
pro
duct
T
his
is k
now
n as
the
tari
ff re
nt. T
he re
sults
sh
ow th
at g
arm
ent e
xpor
ters
cap
ture
onl
y ab
out o
ne th
ird
of th
is p
oten
tial b
enef
it.
Incl
usio
n of
a c
once
ntra
tion
inde
x sh
ows
that
the
smal
ler e
xpor
ting
coun
trie
s an
d th
ose
with
exp
orts
hig
hly
conc
entr
ated
in
the
Uni
ted
Stat
es m
arke
t cap
ture
less
of t
he
tari
ff re
nt.
Ola
rrea
ga a
nd
Özd
en (2
004)
Ken
ya,
Les
otho
, M
adag
asca
r, M
alaw
i, M
auri
tius,
So
uth
Afr
ica,
Sw
azila
nd
(ben
efic
iary
co
untr
ies
of th
e A
fric
a G
row
th
and
O
ppor
tuni
ty
Act
(A
GO
A)
2001
-200
2, q
uart
erly
. Tar
iff
rent
that
exp
orte
rs r
ecei
ve,
defi
ned
as th
e in
crea
se in
the
pric
e ar
isin
g fr
om A
GO
A
divi
ded
by th
e pe
rcen
tage
M
FN ta
riff
rat
e. T
arif
f is
the
perc
enta
ge M
FN ta
riff
rat
e ,
Ln V
alue
is th
e na
tura
l lo
gari
thm
of
the
valu
e of
ex
port
s; th
e co
ncen
trat
ion
inde
x is
con
stru
cted
in a
si
mila
r w
ay to
the
Her
find
ahl
inde
x, u
sing
dat
a on
exp
orts
pa
ssin
g th
roug
h th
e va
riou
s po
rts
of th
e U
nite
d St
ates
.
Gar
men
tW
eigh
ted
leas
t sq
uare
s w
ith
fixe
d ef
fect
s by
cou
ntry
, st
anda
rd e
rror
s ro
bust
.
In c
ompe
titiv
e m
arke
ts, e
xpor
ters
sh
ould
cap
ture
the
ent
ire
tari
ff r
even
ue
that
pre
viou
sly
(bef
ore
the
pref
eren
tial
agre
emen
t) w
ent t
o th
e U
nite
d St
ates
T
reas
ury.
thro
ugh
the
high
er p
rice
s re
ceiv
ed f
or th
eir
prod
uct T
his
is k
now
n as
the
tari
ff r
ent.
The
res
ults
sho
w th
at
garm
ent e
xpor
ters
cap
ture
onl
y ab
out o
ne
thir
d of
this
pot
entia
l ben
efit.
Inc
lusi
on
of a
con
cent
ratio
n in
dex
show
s th
at th
e sm
alle
r ex
port
ing
coun
trie
s an
d th
ose
with
exp
orts
hig
hly
conc
entr
ated
in th
e U
nite
d St
ates
mar
ket c
aptu
re le
ss o
f th
e ta
riff
ren
t.
Bu
lmer
an
d ot
her
s (2
005)
Dom
inic
an
Rep
ublic
1996
-200
3L
ogar
ithm
of
rela
tive
pric
es
in th
e D
omin
ican
Rep
ublic
. M
argi
n of
pre
fere
nce;
Log
a-ri
thm
of
the
valu
e of
exp
orts
; L
ogar
ithm
of
tota
l Uni
ted
Stat
es im
port
s: D
umm
y va
riab
le
d_
quot
a
Gar
men
tln
p pt
tX
ktRD
ktROW
ktROW
ktRD
=+
−(
)+β
ββ
01
2kktRD
ktROW
ii
kk
tt
ki
tM
dumm
y
+
++
++
∑∑
∑β
λδ
θ
β
3
4
ΩΦ
Ψ
__qu
ota
kti+
ε
Feas
ible
ge-
nera
lized
leas
t sq
uare
s w
ith
fixe
d ef
fect
s,
by p
rodu
ct
grou
p an
d by
ye
ars
Bet
wee
n 19
96 a
nd 2
003,
Dom
inic
an
Rep
ublic
exp
orte
rs c
aptu
red
two
thir
ds
of th
e m
argi
n of
pre
fere
nce,
mea
sure
d as
th
e di
ffer
ence
bet
wee
n M
FN ta
riff
s an
d pr
efer
entia
l acc
ess
tari
ffs
unde
r CB
I. T
he
pric
es re
ceiv
ed b
y D
omin
ican
Rep
ublic
ex
port
ers
are
15%
hig
her i
n th
e ga
rmen
t pr
oduc
t cat
egor
ies
in w
hich
quo
tas
have
not
be
en e
limin
ated
.
C E P A L R E V I E W 9 3 • D E C E M B E R 2 0 0 7
Is thE PhAsIng out of thE AgREEMEnt on tExtILEs AnD CLothIng ERoDIng CoMPEtItIVEnEss In CEntRAL AMERICA AnD thE DoMInICAn REPuBLIC? • REné A. hERnánDEz
123
Bibliography
Andic, S. and S. Teiltel (1977): Integración económica, Lecturas, No. 19, Mexico City, Fondo de Cultura Económica.
Bulmer, E.R. and others (2005): Dominican Republic Review of Trade and Labor Competitiveness, Report No. 30542-DO, Washington, D.C., World Bank, March.
Dussel, E. (2001): Un análisis de la competitividad de las exportaciones de prendas de vestir en Centroamérica utilizando los programas y la metodología CAN y MAGIC, Estudios y perspectivas series, No. 1, LC/MEX/L.458, Mexico City, ECLAC Subregional Headquarters in Mexico, July.
__________ (2004): La competitividad de la industria maquiladora de exportación en Honduras. Condiciones y retos ante el CAFTA, LC/MEX/R.853, Mexico City, ECLAC Sugregional Headquarters in Mexico, February.
ECLAC (Economic Commission for Latin America and the Caribbean) (n/d): MAGIC (Module for the Análisis of Growth of International Commerce). Available in http://magic.un.org.mx
Gine, W.R (1978): Trade Negotiations in the Tokyo Round: A Quantitative Assessment, Washington, D.C., The Brookings Institution.
Hernández, R., I. Romero and M. Cordero (2006): ¿Se erosiona la competitividad de los países del DR-CAFTA ante el fin del Acuerdo de Textiles y Vestuario?, Estudios y perspectivas series, No. 50, LC/MEX/L.691/Rev.2, Mexico City, ECLAC Subregional Headquarters in Mexico, May. United Nations publication, Sales No. S.06.II.G.73.
IMF (International Monetary Fund) (1984): Effects of Increased Market Access on Selected Developing Country Export Earnings: an Illustrative Exercise, DM/84/54, Washington, D.C., August.
International Trade Commission (2004a): Textiles and Apparel: Assessment of the Competitiveness of Certain Foreign Suppliers to the U.S. Market, USITC Publication 3671, Washington, D.C., January.
__________ (2004b): U.S.-Central American-Dominican Republic Free Trade Agreement: Potential Economy Wide and Selected Sectoral Effects, USITC Publication 3717, Washington, D.C., August.
__________ (2004c): The Economic Effects of Significant U.S. Import Restraints, USITC Publication 3701, Washington, D.C., June.
Jachia, L. and E. Teljeur (1999): Free Trade between South Africa and the European Union. A Quantitative Analysis, UNCTAD
Discusion Paper, No. 141, UNCTAD/OSG/DP/141, New York, United Nations.
Kuwayama, M. and M. Cordero (2005): Implicancias del término del Acuerdo sobre los Textiles y el Vestido (ATV) para América Latina y El Caribe, Comercio Internacional series, No. 53, LC/L.2399-P, Santiago, Chile, Economic Commission for Latin America and the Caribbean (ECLAC), October. United Nations publication, Sales No. S.05.II.G.145.
Kyvik Nordas, H. (2004): The Global Textile and Clothing Industry Post the Agreement on Textiles and Clothing, Discussion Paper, No. 5, Geneva, World Trade Organization.
Laird, S. and A. Yeats (1986): The UNCTAD Trade Policy Simulation Model: A Note on the Methodology, Data and Uses, Discussion Paper, No. 19, Geneva, United Nations Conference on Trade and Development.
Mayer, J. (2004): Not Totally Naked: Textiles and Clothing Trade in a Quota Free Environment, Discussion Paper, No. 176, Geneva, United Nations Conference on Trade and Development, December.
Olarreaga, M. and C. Ozden (2004): AGOA and apparel: who captures the tariff rent in the presence of preferential market access?, document presented for the “Global Trade and Financial Arquitecture” project, financed by the Department for International Development (DFID).
OXFAM International (2004): Eight broken promises: why the WTO isn’t working for the world’s poor, Oxfam Briefing Paper, No. 9, London, May.
Ozden, C. and G. Sharma (2004): Price Effects of Preferential Market Access: The Caribbean Basin Initiative and the Apparel Sector, Policy Research Working Paper, No. 3244, Washington, D.C., World Bank, February.
Sapir, A. and R.E. Baldwin (1983): India and the Tokyo Round, World Development, vol. 2, No. 7, Amsterdam, Elsevier.
Stern, R. (1976): Evaluating alternative formulae for reducing industrial tariffs, Journal of World Trade Law, No. 10, London, Kluwer Law International, January-February.
U.S. Customs Service (2001): The U.S.-Caribbean Basin Trade Partnership Act, Washington, D.C., May.
Winters, A.L. and W. Chang (2000): Regional integrations and import prices: an empirical investigation, Journal of International Economics, No. 51, Amsterdam, Elsevier.
(Original: Spanish)

125
C E P A L R E V I E W 9 3 • D E C E M B E R 2 0 0 7
The comparative advantage fallacy and a rule for convergence
Esteban Pérez Caldentey and Anesa Ali
T he gains from trade argument is based on the principle of
comparative advantage. However, this principle is predicated on “tacit”
axioms, presenting an argument which supports a proposition different to
the one it purports to prove. This paper presents an alternative treatment,
using a leader-follower model to show that free trade can in fact accentuate
differences and growth disparities between countries. More importantly, it
argues that the follower economy can catch up with the leader economy
only if the ratio between the income-elasticity of the follower country’s
exports to the rest of the world and the income-elasticity of its imports is
greater than the ratio between the induced productivity of the leader and
that of the follower country. This is our rule for convergence.
.
K E YW O R D S
Free t rade
Economic growth
Economic gap
Economic convergence
Mathemat ica l mode ls
Esteban Pérez Caldentey
Economic Affairs Officer,
Development Studies Unit,
Economic Development Division,
EClAC
Anesa Ali
External Affairs Officer,
Division of Bilateral Relations,
Ministry of Foreign Affairs,
Trinidad and Tobago
126
IIntroduction
This paper argues that the guiding principle behind free trade theory, comparative advantage, is only valid for barter economies characterized by full employment and absence of uncertainty where differences in size and development level do not affect the final outcome, which in point of fact is a Pareto optimum. However, this does not imply that comparative advantage, or for that matter Say’s Law, can be applied to real-world economies.
This paper presents an alternative approach to the analysis of free trade using a leader-follower country model. The model is based on three pillars: cumulative causation, the technology gap, and the external constraint approach to growth. Using this framework, this paper presents a basic derivation of a rule for convergence.
This rule states that, given free trade, the follower economy can converge with the leader economy only if the ratio between the income-elasticity of demand for the follower country’s exports in the rest of the world and the income-elasticity of its demand for imports is greater than the ratio between the leader and follower country’s induced productivity.
The paper is structured in five sections. Following this introductory section, section II gives a brief presentation of the treatment of free trade in mainstream economic theory, including a summary explanation of
the main theorems underpinning the idea of comparative advantage in international trade and the implications of these. Section III critically examines the principle of comparative advantage as underpinned by three tacit core axioms, namely the neutral money axiom, the gross substitution axiom and the ergodic axiom, discussing their meaning and examining their relevance.1
The fourth section presents our alternative model. In essence, this model states that convergence between the leader and follower economy can be modelled by the difference in Verdoorn-type equations. Their interaction is captured by the introduction of Thirlwall’s Law and a technological spillover function.
Within the logic of our model, money is not neutral since monetary arrangements ultimately determine the framework within which real forces operate. It also gives primacy to income over substitution effects. In fact, the model presented here is explicitly different from other contributions to this type of approach in the literature because the role of relative prices is markedly absent from the analysis. Lastly, the model assumes away the existence of an ergodic environment where, by definition, ensemble, spatial and temporal statistical averages converge on the same mean.
1 The critique of comparative advantage is undertaken in terms of the assumptions underpinning this basic foreign trade principle. According to Keynes (1973b, p. 21), Say’s Law is the “classical theory’s ‘axiom of parallels.’ Granted this all the rest follows… the unqualified advan-tages of laissez-faire in respect to foreign trade and much else which we have to question.” As Davidson (1994 and 2002) explains, these three postulates (neutral money, gross substitution and the ergodic axiom) underlie Say’s Law. “Granted these all the rest follows.” The principle of comparative advantage is a special case of Say’s Law. There are other critiques of Say’s Law and comparative advantage based on internal consistency arguments or different methodological approaches. From the point of view of this paper’s authors, the “tacit assumptions” critique is the most potent of all those levelled at the principle of comparative advantage and at neo-classical theory more generally.
< The opinions expressed herein are the authors own and may not coincide with those of eclac or the Ministry of Foreign Affairs of Trinidad and Tobago. The authors are grateful for the comments of an anonymous referee. Comments are welcome and may be e-mailed to the authors.
C E P A L R E V I E W 9 3 • D E C E M B E R 2 0 0 7
ThE CoMPARATIVE ADVAnTAgE fALLACy AnD A RuLE foR ConVERgEnCE • EsTEBAn PéREz CALDEnTEy AnD AnEsA ALI
127
IIThe treatment of free trade in
mainstream economic theory
The Stolper-Samuelson theorem complements the above theorem by stating that the intensive use of a factor of production for export (i.e., the abundant factor) raises its rate of return above that of all other factors. In turn, the consequent increase in the supply of that factor of production will lead to an increase in the output of the commodity that is intensive in that factor of production (the Rybczynski theorem). Lastly, the factor price-equalization theorem, stating that trade equalizes factor returns across countries, wraps up the case for free trade.3
The introduction of dynamic factors such as spillover effects does not alter the validity of the basic analysis. Indeed, it can be shown that if knowledge is freely mobile and equally accessible among countries, patterns of specialization are determined by comparative advantage.4 That is, by construction in mainstream theory, static and dynamic trade theory are one and the same thing when free trade (implying laissez-faire and laissez-passer) prevails. There is absolutely no fundamental distinction between the two.
3 Under conditions of perfect competition, trade in goods acts as a substitute for factor mobility. Under conditions of imperfect competition, free trade does not result in the full equalization of commodity prices and factor returns across countries. However, free trade does reduce differentials and thus acts as a force for convergence.4 See Helpman (2004) and Grossman and Helpman (1996). The existence of economies of scale can lead to trade creation through production, consumption and cost reduction effects. The production effect allows the transfer of production to the lower-cost trading partner. The consumption effect refers to the gain in the consumer surplus due to lower prices. The cost reduction effect denotes a switch to cheaper sources of supply. Dunn and Muti (2000) identify three effects that can increase the efficiency of free trade: (i) a shift in output that increases its price by more than its average cost; (ii) a scale effect that reduces firms’ average costs of production when output expands; (iii) an increase in trade permitting greater diversification of the final goods and intermediate inputs being traded.
According to mainstream economic theory, free trade creates welfare gains by allowing consumers and firms to purchase from the cheapest source of supply. This ensures that production is located according to comparative advantage. In other words, free trade allows the principle of comparative advantage to operate by suppressing discrimination between such sources of supply as may exist.
The properties of the standard mainstream free trade model based on comparative advantage, the Heckscher-Ohlin or Heckscher-Ohlin-Samuelson model,2 are to be found in four well-known theorems: (i) the Heckscher-Ohlin theorem, (ii) the Stolper-Samuelson theorem, (iii) the Rybczynski theorem, and (iv) the factor-price equalization theorem.
The Heckscher-Ohlin theorem establishes a relationship between factor scarcity and factor embodiment in a commodity such that countries export the commodity which intensively uses the abundant factor. It provides the basis for the gains from trade argument, such gains consisting of the increase in output and real income for a given set of inputs or domestic resources resulting from trade.
2 The Heckscher-Ohlin (H-O) model was renamed Heckscher-Ohlin-Samuelson (H-O-S) after Samuelson formalized the basis properties of the H-O model.
C E P A L R E V I E W 9 3 • D E C E M B E R 2 0 0 7
ThE CoMPARATIVE ADVAnTAgE fALLACy AnD A RuLE foR ConVERgEnCE • EsTEBAn PéREz CALDEnTEy AnD AnEsA ALI
128
IIIComparative advantage and its tacit axioms
of change in relative prices is proportional to the excess demand function. In other words, it converges towards equilibrium and is globally stable as a result. This is expressed formally as:
(2) Lim p(t) = p*t
where p* is a vector of equilibrium prices.In the particular case of the Heckscher-Ohlin-
Samuelson model, the axiom of gross substitution is strengthened by the fact that it assumes production functions and factor quality to be the same across countries. In other words, the rate of marginal substitution among factors is the same.
Ergodicity implies that ensemble, spatial and temporal averages converge to the same mean. In other words, a given system converges towards a unique globally stable equilibrium irrespective of the initial conditions or the trajectory followed. It also implies homogeneity, that is, that every member of a given ensemble possesses the same statistical behaviour as the whole ensemble. As a result, the statistical behaviour of an ensemble can be deduced from the behaviour of one sample function. The behaviour of the sample function is representative of that of the whole ensemble.
Turning to the core of mainstream trade theory, the axioms of neutrality, gross substitution and ergodicity are what underpin the operation and validity of the comparative advantage principle.
Expenditure is directed towards the cheapest commodity, leading to changes in relative commodity prices, production levels, the demand for factors and their respective real remuneration rates. The process leads to price equalization, full employment and net welfare gains for all trading partners. In other words, “free trade is best”.
Moreover, the core axioms imply that initial conditions are irrelevant to the final outcome. That is, differences in the trading partners’ size and development level do not affect the final outcome. Trade affects all countries alike and development level and size are a non-issue. As a result, there is no need and no room in trade theory and policy for any type of asymmetrical treatment whatsoever. Instead, the sole aim of trade
The principle of comparative advantage and its purported benefits are based on three tacit axioms: neutral money, gross substitution and the ergodic axiom (Davidson, 1994, pp. 17-18; 2000, p. 171; 2002, pp. 43-44).5
A neutral economy is one where money is “a neutral link among real transactions and the effects of monetary changes on real transactions is transitory”.6 As a result, economic transactions taking place by virtue of each of these approaches are carried out in terms of physical goods and persons, whether consisting of trade in goods or factors of production and their remuneration, production processes involving a given level of technology, or the allocation of resources between alternative productive uses. Money does not in any way affect the economic process, which behaves like that of a barter economy.7 Money is inessential and does not enter in any way into decision-making.8
The axiom of gross substitution means that any good can be substituted for by any other. Two goods are said to be gross substitutes when
(1) z p > 0 z p > 01 2 2 1/ y /
where zi (p1, p2) is an excess demand function and p1 and p2 are the money prices of goods 1 and 2.
The axiom of gross substitution implies that a price path follows a process of adjustment such that the rate
5 Davidson (2000, p. 160) refers to open economy models of the 1960s which were developed using the core axioms above to “prove that free trade and optimum global economic growth required a laissez-faire approach”.6 See Rymes (1989, pp. 47-49). Keynes (1979, p. 78) defined a neutral economy as one “in which the factors are hired by entrepreneurs for money but where there is a mechanism of some kind to ensure that the exchange value of the money incomes of the factors is always equal in the aggregate to the proportion of current output which would have been the factor’s share in a co-operative economy”.7 Schumpeter (1954) also distinguished between real analysis and monetary analysis. The former denotes that part of monetary thinking which views and understands economic relationships in real terms, that is, in barter terms.8 See, for example, the attempt by Samuelson (1976, p. 640) to introduce monetary factors into a standard neoclassical model of international trade. He writes: “..it is shown that the original Ohlin position was right in its contention that there would be a tendency for free trade in goods to serve as a partial substitute for factor mobility and thereby serve to reduce but not wipe out difference in factor prices”. Hence money is an inessential addition to the mainstream framework.
C E P A L R E V I E W 9 3 • D E C E M B E R 2 0 0 7
ThE CoMPARATIVE ADVAnTAgE fALLACy AnD A RuLE foR ConVERgEnCE • EsTEBAn PéREz CALDEnTEy AnD AnEsA ALI
129
policy should be to ensure the fluid operation of free market mechanisms.9
The purported benefits of the Heckscher-Ohlin-Samuelson model and regional integration theory follow logically from a set of premises that automatically guarantee full employment and welfare improvements irrespective of the trading partners’ initial conditions and the strength of trade linkages between them. If the comparative advantage principle applies, free trade and “free trade areas” for that matter can only be “welfare improving areas”, irrespective of geographical extent. It is actually all a matter of degree. The greater their geographical extent, the greater the improvement in welfare.10
However, this does not mean that comparative advantage is welfare-improving in a world more akin to the real world where the axioms of neutrality, gross
9 The current drive for bilateral trading arrangements in the Americas is squarely based on these tacit axioms.10 See footnote 3 above.11 Ignoratio elenchi was first identified by Aristotle in On Sophistical Refutations. It translates literally as ignorance of what constitutes a refutation and consists in proving an argument wholly different from the one purportedly being proved. Keynes (1973b, p. 259) mentions the fallacy. According to Carabelli (1991, p. 123) it belongs to the informal fallacy of relevance category. An informal fallacy of rele-vance establishes a relationship between the relevance/irrelevance of the premises of arguments and their conclusions. Irrelevance means that the premises and the conclusion are not connected. The fallacy is explained by the fact that the key assumptions of neoclassical theory (and indeed the core axioms) are tacit. Keynes (1973a, p. 79) argues that “…you will search in vain for any express statements of the simplifications which have been introduced or for the relationship of its [the neutral economy’s] hypothetical conclusions to the facts of the real world”. (The square brackets in the citation were introduced by the authors of this paper). See Keynes (1979, pp. 408-411) for a similar argument.
substitution and ergodicity are not satisfied. Indeed, the application of orthodox trade principles to the “real world” raises the suspicion that the whole argument for free trade may fall prey to the fallacy of ignoratio elenchi, i.e., that of proving or supporting a proposition different to the one it is purporting to prove or support.11 It is thus not surprising that, for example, empirical studies analysing the welfare effects of the formation of free trade areas find that the evidence is decidedly ambiguous.12
Changing the core premises and introducing non-neutral money, income rather than substitution effects and a non-ergodic environment can radically alter the conclusions of mainstream trade theory and regional integration theory. This is shown in the next section, which presents a simple model for two economies of different sizes and development levels.
12 Panagariya (2000) distinguishes two approaches to this issue. The first is based on some type of general equilibrium model whereby, starting from a base model with a given structure and parameters, tariff barriers among trading partners are removed. The second is based on gravity equation estimates. Panagariya (2000, p. 326) writes: “Consider first the simulation approach. It is relatively easy to manipulate the structure of the model, functional forms and parameter values in these models to obtain one’s desired results.” Regarding gravity equation estimates, the criticism focuses on the fact that the success of regional trade agreements is based on aggregate trade creation or diversion, when in fact the question is to identify whether trade creation has occurred at the sectoral level, and this requires a great deal of in-formation that is difficult to obtain. Lastly, it is to be noted that the analytical exercise dealing with trade creation-trade diversion does not cover two aspects that are crucial for trade negotiations: trade in services, which is the main form of international trade for the smaller economies of the Caribbean, and the relationship between foreign direct investment and free trade areas.13 McCombie and Thirlwall (1994) and León-Ledesma (2002) extend the Kaldorian cumulative growth model to include the technological gap approach. For conceptual purposes, the cumulative and technolo-gical gap approach are treated as two different approaches to growth (see Castellacci, 2001).
IVAn alternative approach to free trade:
a simple two-country model
The model is built on three approaches to economic growth. The first is encapsulated in Kaldor’s notion of cumulative causation and its development in the work of McCombie and Thirlwall (1994) and McCombie, Pugno and Soro (2002).
The second follows the balance-of-payments constraint approach to growth as developed by Thirlwall (1979) and McCombie and Thirlwall (1994).13 Lastly, the third strand is the technological gap approach to growth.
C E P A L R E V I E W 9 3 • D E C E M B E R 2 0 0 7
ThE CoMPARATIVE ADVAnTAgE fALLACy AnD A RuLE foR ConVERgEnCE • EsTEBAn PéREz CALDEnTEy AnD AnEsA ALI
130
issue. As a result, countries’ export potential must be commensurate with their import capacity.
Over the long run, consequently, countries must maintain equilibrium in the balance of payments or at least in the basic balance, since in the long run they can only grow at rates compatible with their external position. It is in this sense that countries are said to be balance-of-payments-constrained.15
Within this framework, money is not neutral. A process of technological “catch-up” through imitation derived from a process of cumulative causation cannot occur if economies do not have the means to obtain the reserve currency. More to the point, the extent to which countries can benefit from a “catch-up” process depends on the extent to which they can access international liquidity. Accordingly, in our approach, by contrast with mainstream theory, monetary factors provide the framework for the operation and development of real forces, such as innovation.
The model postulates the existence of two economies, one developed and the other developing. By definition, the developing economy is also the smaller economy. The developed economy is termed the leader (denoted by subscript l) and the developing economy is the follower economy (denoted by subscript f).
The leader has higher levels of productivity and is technologically more advanced. The follower economy is assumed at this stage to be closely linked to the leader economy. It is furthermore assumed that the leader economy issues the international reserve currency, which is by definition also used by the follower economy. As a result, the follower country is balance-of-payments-constrained while the leader country is not.
The model begins by defining the technology gap (Gp) between the leader and the follower economy (Pl and Pf, respectively) in logarithmic terms such that the rate of growth of the gap (g) can be expressed as the difference between the rates of productivity change in the leader and follower country (McCombie and Thirlwall, 1994; Targetti and Foti, 1997). That is,
(3) G = Ln (P /P )p l f
(4) g = p - pfl
15 Countries are balance-of-payments-constrained in the sense that “their performance in overseas markets, and the response of the world financial markets to this performance, constrains the rate of growth of the economy to a rate which is below that which internal conditions would warrant” (McCombie and Thirlwall, 1999, p. 49).
The cumulative causation approach views growth as being internally generated. Technological innovation through the growth of embodied or disembodied productivity generates growth in demand which feeds back into productivity growth. The growth linkage between productivity and demand is explained by terms-of-trade effects, increased income and expenditure, and changes in income distribution. The linkage from demand to productivity is explained by returns to scale, specialization and market size, embodied technical progress and learning by doing (Castellacci, 2001). From this perspective, growth is generated internally through innovation activity.
This approach disparages the notion of equilibrium and thus of convergence and stability. However, it does not deal with technological spillovers between countries or the international diffusion that can occur through trade linkages, i.e., it does not address the issue of country interdependence. Such interdependence is one of the main hypotheses of the technological gap approach.
The technological gap approach asserts that a country’s growth rate depends on its level of technological development. It also states that countries whose technological level is below the world innovation frontier can increase their rate of growth through a process of “catching up” or imitation. Lastly, the absorptive capacity of such countries depends on their “ability to mobilize resources for transforming social, institutional and economic structures” (Fagerberg and Verspagen, 2001, p. 11). The technological gap approach recognizes that all countries are not alike, that development levels are an important determinant of growth and welfare and that not all countries benefit to a similar extent from trade and the transmission of trade linkages.
The third approach, the balance-of-payments constraint approach, asserts that trade performance, trade linkages and growth cannot be understood or analysed in real or “barter” terms. Trade and growth are intimately linked to the architecture and workings of the existing international financial order, and these are the main constraint on economic growth and development.14
International trade is not carried out in real, “barter” terms but in money terms and more precisely in terms of the international reserve currency or currencies. Countries can build up their economic infrastructure and develop by importing capital, raw materials, inputs and technology only if they are able to acquire the reserve currency or currencies, which the great majority of countries cannot
14 See Davidson (1992, pp. 93-96; 2002, pp. 158-161).
l
C E P A L R E V I E W 9 3 • D E C E M B E R 2 0 0 7
ThE CoMPARATIVE ADVAnTAgE fALLACy AnD A RuLE foR ConVERgEnCE • EsTEBAn PéREz CALDEnTEy AnD AnEsA ALI
131
The rates of productivity growth in the leader and follower economies are equal to the sum of the rates of growth of autonomous (exogenous) and induced productivities. That is, they are modelled according to Verdoorn’s Law.16 The interpretation of the autonomous and induced coefficients adopted in this paper is that of Dixon and Thirlwall (1975) and McCombie and Thirlwall (1994).17
As stated by McCombie and Thirlwall (1994, p. 464), autonomous productivity depends on “the autonomous rate of disembodied technical progress, the autonomous rate of capital accumulation, and the degree to which technical progress is embodied in capital accumulation”. For obvious reasons, the rate of autonomous productivity growth is higher in the leader economy than in the smaller country (i.e., pl > pf).
For its part, induced productivity is captured by the parameter λ, also known as the Verdoorn coefficient. Again as stated by McCombie and Thirlwall (1994), it is a function of “‘learning by doing’, the degree to which capital accumulation is induced by economic growth (yl and yf for the leader and follower economies, respectively) and the extent to which technical progress is embodied in capital accumulation”.18
Formally,
(5) p p yl la l l+
(6) p p yf fa f f+
Note that, as formulated, equations (5) and (6) capture the presence of increasing returns due to the greater specialization induced by economic growth.19 In turn, a greater degree of specialization entails a higher rate of growth, which permits the expansion of the
16 Verdoorn’s Law is a “statistical relationship between the long-run rate of growth of labour productivity and the rate of growth of output, usually in the industrial sector” (McCombie, Pugno and Soro, 2002, p. 1). This relationship was formulated by Verdoorn (1949) and restated as a law by Kaldor (1966).17 Soro (2002, pp. 45-53) considers three interpretations of Verdoorn’s Law. The first two were suggested by Verdoorn and are based on complementarity and perfect substitutability of the factors of pro-duction. The third, which is the one adopted in this paper, follows the Kaldorian interpretation. A key component of Kaldor’s interpretation is the existence of increasing returns to scale. Following Young (1928), Kaldor subscribed to a macroeconomic rather than microeconomic concept of increasing returns. See Soro (2002) and Chandra and Sandilands (2005).18 A value of λ > 0.5 indicates the presence of increasing returns.19 This means that increasing returns derive from specialization rather than scale. This is the position of Allyn Young and Nicholas Kaldor. See Young (1990).
potential for specialization. Hence, the process described by equations (5) and (6) is cumulative.
As stated earlier, the follower economy is balance-of-payments-constrained. That is, its rate of growth has to conform in the long run to the rate of growth consistent with balance-of-payments equilibrium. Such is not the case with the leader economy because it issues the international reserve currency.
In view of the ample empirical evidence corroborating balance-of-payments constraint models (Thirlwall and McCombie, 2004), the model postulates that income effects predominate over substitution effects and that the long-term growth rate of the follower economy (yf) is determined by Thirlwall’s Law. That is, the long-term growth rate of the follower economy (yf) is determined by the long-term growth rate of the leader economy (yl) multiplied by the income-elasticity ratio between the follower country’s exports to the rest of the world (π) and the income-elasticity of its demand for imports (ξ). Formally,
(7) y = y ( / )f l
Successive substitution of equation (7) into equation (6) and of equations (5) and (6) into equation (4) yields the following expression for the rate of change in the productivity gap:
(8) g = (p -p )+ y - ( / ) (p -p )+la fa l la fal f ly yy ( - ( / )l l f
Equation (8) shows that the rate of change in the productivity gap over time will depend on the following factors: (i) the differences in autonomous productivities; (ii) the rate of growth in the leader economy; (iii) the difference between the Verdoorn coefficient in the leader country and that in the follower country, augmented by the ratio between the income-elasticities of the leader country’s exports to the rest of the world and the income-elasticities of its imports. By contrast with other approaches found in the literature, relative prices do not play a role in the workings of Verdoorn’s law.20
20 The approach adopted in this paper follows the post-Keynesian tra-dition in emphasizing income over substitution effects (Davidson, 1992, p. 22). On this view, relative prices do not play a role in determining the long-run gdp growth rate or the productivity gap. See Dixon and Thirlwall (1975) and León-Ledesma (2002) for a different approach in which the effect of Verdoorn’s Law is captured through its effect on relative prices. Relative prices determine exports, which in turn determine the rate of output growth. If the price-elasticity of the export demand function is insignificant, then Verdoorn’s Law plays no role whatsoever in determining this rate. In other words, increasing returns
CEPAL REVIE W 93 • DECEMBER 2007
ThE CoMPARATIVE ADVAnTAgE fALLACy AnD A RuLE foR ConVERgEnCE • EsTEBAn PéREz CALDEnTEy AnD AnEsA ALI
132
According to equation (8), as long as π < ξ then the rate of growth in the productivity gap will increase (mainly because pla > pfa and λl > λl, leading to a process of divergence, and the follower country will not catch up with the leader economy. This finding holds for any given level of output growth in the leader economy.Moreover, equation (8) shows that when the leader economy’s growth rate approximates to zero, the rate of growth in the productivity gap (g) is equal to the difference between the autonomous productivities. According to equation (8), lastly, positive growth rates in the leader economy (yl) increase the growth rate of the follower economy (yf). In other words, growth in the leader economy is a force for convergence. This follows from Thirlwall’s Law (equation 7). But at the same time, growth in the leader economy increases the rate of growth of g, when π > ξ (equation 8).21 As a result, increases in yl constitute an additional force for divergence in g. That is,
(9) gy/ =(- (/ ya que > y(/l l f l f
) ) 11
Within the framework provided by equation (8), there is no inherent mechanism for convergence. Rather, the initial conditions (i.e., higher productivity in the leader country and the higher value added of its exports relative to its imports), and thus the principle of absolute advantage, are what will determine the outcome of a free trade agreement between the leader and follower countries.
A closer approximation to a convergence mechanism can be arrived at by assuming that the difference in autonomous productivities between the leader and follower economies is equal to zero (pla – pfa = 0). Taking this hypothesis, it can be shown that the rate of change in the gap will increase, decrease or be equal to zero depending on whether the ratio of the Verdoorn coefficients between the leader and follower economies is greater than, less than or equal to the ratio between the income-elasticity of the follower country’s exports to the rest of the world and the income-elasticity of its imports. That is,
and the process of cumulative causation are dependent on the workings of relative prices. Ultimately, therefore, these models rest the weight of the analysis on the validity of the gross substitution axiom.21 This result can be inferred from Thirlwall’s Law. See, for example, Moreno and Pérez Caldentey (2003). As is shown here, this result presupposes that the autonomous and induced productivities in the leader economy surpass those of the follower economy.
(10) >0 >0 >
g=0 y(-l l f
((/))=0 / = /
<0
l f
<0 <
In other words, excluding discrete changes in the Verdoorn coefficients, closing the induced productivity gap requires that the difference in induced productivity between the leader and follower economy be offset by improved external performance in the latter (that is, must increase and/or π ξmust decrease). Changes in these parameters may reflect demand factors only or rather the effects of specialization, allocative efficiency and embodied technology.22
Up to this point the development of the model assumed that the Verdoorn equations, and more specifically the induced productivities of the leader and follower countries, were independent of one another. However, when countries trade and become more integrated, their performance is influenced by each other’s level
22 There are three competing hypotheses in the balance-of-payments-constrained literature regarding the determinants of the income-elasticities of imports and exports. The first follows from Prebisch and Singer and relates the size of the elasticity parameters to the manufacturing and technological content of the products exported and imported. According to this reasoning, the income-elasticity of exports increases as external sales move up the value-added chain from commodities to semipro-cessed labour- and resource- intensive goods, then to manufactures with low, medium and high skill and technology content. In the case of developing economies, the income-elasticity of demand for their exports in the rest of the world is low and the income-elasticity of their demand for imports is high. Less developed countries exporting com-modities subject to Engel’s Law are usually in this category (Davidson, 1992). The main policy implication, following the logic of Thirlwall’s Law, is that unless countries undergo a process of structural change that alters the elasticity parameters, the cleavage between developed and developing economies will widen over time and less developed countries are condemned to poverty. The second hypothesis states that while the income-elasticity of a country’s demand for imports tends to remain more or less constant, the income-elasticity of its exports to the rest of the world varies over time with the level of development (Bairam, 1997). More specifically, the income-elasticity of demand for a country’s exports in the rest of the world is inversely related to its level of development and tends to decline as this level rises. As a result, increases in external demand or expansionary phases in the global cycle (or that of the country’s main trading partners) have a positive effect on developing countries’ external position. The third hypothesis maintains that changes in the said income-elasticities are brought about by shifts in commercial policy or measures designed to transfer liquidity between countries, or both. Changes in commercial policy involve changes in trade barriers (tariffs and quotas). Measures to recycle liquidity comprise increases in surplus nations’ imports and unilateral transfers from surplus to deficit nations (Davidson, 1992, p. 153). Thus far the empirical work shows that the income-elasticity of imports rises with trade liberalization and that the income-elasticity of exports depends on what the market and consumers and producers are demanding at a given time. Thus, while the income-elasticity of imports depends on institutional factors which include changes in commercial policy, as per the third hypothesis, there seems to be no clear core factor determining the income-elasticity of exports.
C E P A L R E V I E W 9 3 • D E C E M B E R 2 0 0 7
ThE CoMPARATIVE ADVAnTAgE fALLACy AnD A RuLE foR ConVERgEnCE • EsTEBAn PéREz CALDEnTEy AnD AnEsA ALI
133
of economic development. That is, interdependence generates spillover effects between countries. One of the most important channels for the transmission of economic development is the diffusion of knowledge.23
Within the setting of our model, the spillover effects of knowledge are transmitted from the bigger, more developed economy (the leader) to the smaller, less developed one (the follower) via the absorptive or learning capacity of the latter. This capacity is limited by the extent of the productivity gap between the two economies.24 The greater the absorptive capacity of the follower, the more powerful the knowledge spillover effect.25
Following Targetti and Foti (1997), induced productivity can be modelled as a non-linear function of the gap. Formally,
(11) f = a (1/ G ) (e ) = a e0-G/ -G/( )
where
a = factor of proportionality.ϕ = (1/G0) = inverse of the initial productivity gap and
0 < ϕ <1.θ = parameter reflecting the adaptability or learning
capacity of the follower economy.
According to equation (11), induced productivity in the follower country is proportional to the inverse of the initial productivity gap. That is, the greater (smaller) the initial productivity gap, the lower (higher) ϕ will be and, other things being equal, the weaker (stronger) the spillover effect.
Equation (11) is also a function of the extent to which the follower economy is able to acquire and incorporate knowledge from the leader economy (i.e., of the absorptive or learning capacity of the follower economy).26 This
23 See Helpman (2004, pp. 60-69) and Rogers (2004).24 See Nelson and Phelps (1966), Abramovitz (1986), Targetti and Foti (1997) and Rogers (2004).25 According to Abramovitz (1979, 1986 and 1995), countries can realize their catch-up potential if they exhibit “social capability” and “technological congruence” and possess natural resource endow-ments. The term “social capability” includes a wide variety of factors, including social attitudes and political institutions, educational attain-ment, organizational and commercial skills and adequate levels of infrastructure. The term “technological congruence” refers to the fact that technology in the leader economy may not always be appropriate for the follower economy (Verspagen and Los, 2002; Criscuolo and Narula, 2002).26 Absorptive capacity is defined by Dahlman and Nelson (1995) as “the ability to learn and implement the technologies and associated practices of already developed countries”. It is a narrower concept than
is captured by e-G/θ The basic mathematical properties of equation (11) are listed below and figure 1 plots the function.
(12) Lim = 0 Lim = a (1/ G )0f fy
00'( ) = a (1/G ) (G0f // (e ) >0
Lim = Lim =
2 -G/) y
yf f 0
0
“social capability”. According to Rogers (2004, p. 579), absorptive or learning capacity depends on “accessibility to overseas technol-ogy, learning ability, and the incentives or barriers to implementing new technologies”.
Induced productivity is an increasing function of the parameter θ. However, as θ increases, induced productivity tends to the limit (1/G0). That is, the extent to which the follower country is able to use its learning capacity to catch up with the leader economy is bounded by the initial productivity gap (G0). This is in fact the boundary of the country’s learning capacity. The greater the initial productivity gap, the lower the “learning capacity boundary”, as shown in figure 1 by the difference between the continuous straight line (corresponding to (G0) and the dashed straight line (corresponding to Gl0
and Gl0 > G0). Similarly, any increase in the actual
gap, whatever its initial size, reduces the follower’s induced productivity. This too is shown in figure 1, by the difference between the straight and dashed lines of induced productivities (λf and λf1, respectively), which correspond to different sizes of gap (G and Gl , respectively, where Gl > G).
Substituting equation (11) into equation (8) yields the following expression for the rate of change in the gap:
(13) g = (p - p ) + y - (a e y ( / ))la fa l-G/
ll
(p - p ) +y ( - (a e ( / ))la fa l-G/
l
Equation (13) shows several important features of the “gap dynamics”. First, for any given level of yl and of (π/ξ), the direction of change in the gap will depend on the difference between the rate of growth in autonomous productivities, the induced productivity of the leader and the extent to which the follower country can benefit from the spillover effects, which basically depends on its adaptability or learning capacity (θ).
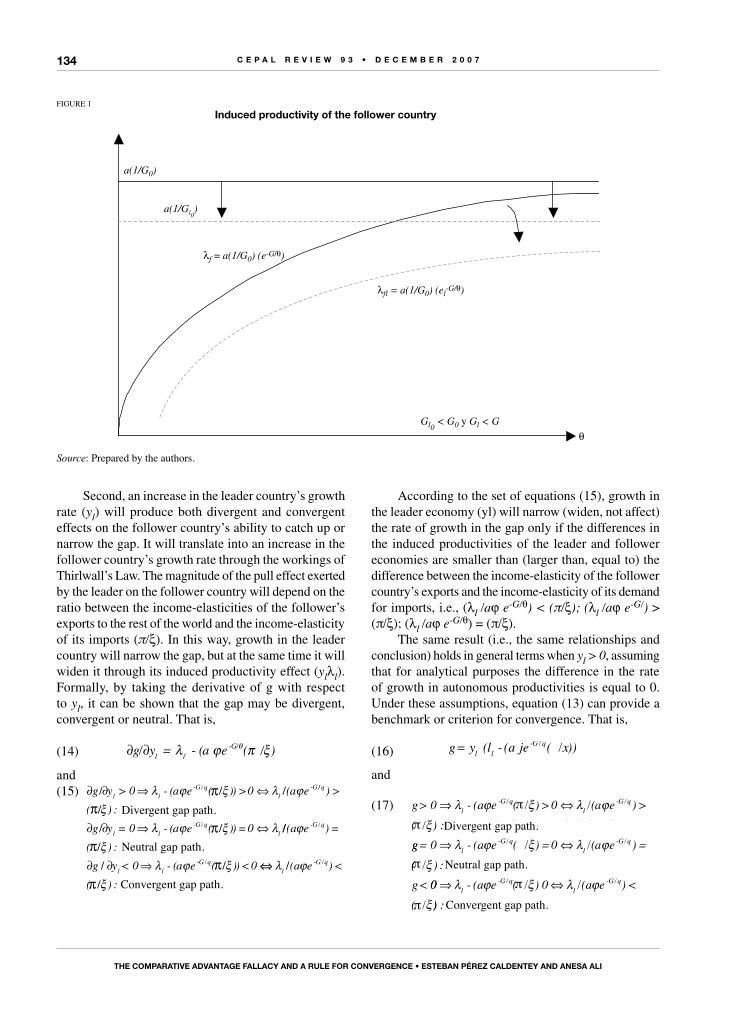
C E P A L R E V I E W 9 3 • D E C E M B E R 2 0 0 7
ThE CoMPARATIVE ADVAnTAgE fALLACy AnD A RuLE foR ConVERgEnCE • EsTEBAn PéREz CALDEnTEy AnD AnEsA ALI
134
Second, an increase in the leader country’s growth rate (yl) will produce both divergent and convergent effects on the follower country’s ability to catch up or narrow the gap. It will translate into an increase in the follower country’s growth rate through the workings of Thirlwall’s Law. The magnitude of the pull effect exerted by the leader on the follower country will depend on the ratio between the income-elasticities of the follower’s exports to the rest of the world and the income-elasticity of its imports (π/ξ). In this way, growth in the leader country will narrow the gap, but at the same time it will widen it through its induced productivity effect (ylλl). Formally, by taking the derivative of g with respect to yl, it can be shown that the gap may be divergent, convergent or neutral. That is,
(14) g/ y = - (a e ( / )l-G/
l
and(15) ∂ ∂ ⇒ ⇔g y > 0 - (a e ( )) >0 (a el l
-G/ql
-G/ / /λ ϕ ξ λ ϕ // q ) >( ) :π/ Trayectoria divergente de la bξ rrecha.
/ /∂ ∂ ⇒ ⇔g y = 0 - (a e ( )) =0l l-G/q
lλ ϕ ξ λ //
/ Trayectoria neutra de l
(a e ) =( ) :
-G/qϕξ aa brecha.
/∂ ∂ ⇒g y < 0 - (a e ( )) <0l l-G/q/ λ ϕ ξ ⇔⇔ λ ϕ
ξl
-G /q(a e ) <( ) :
/
/ Trayectoria convergennte de la brecha.
π
π
π
π
π
According to the set of equations (15), growth in the leader economy (yl) will narrow (widen, not affect) the rate of growth in the gap only if the differences in the induced productivities of the leader and follower economies are smaller than (larger than, equal to) the difference between the income-elasticity of the follower country’s exports and the income-elasticity of its demand for imports, i.e., (λl /aϕ e-G/θ) < (π/ξ); (λl /aϕ e-G/) > (π/ξ); (λl /aϕ e-G/θ) = (π/ξ).
The same result (i.e., the same relationships and conclusion) holds in general terms when yl > 0, assuming that for analytical purposes the difference in the rate of growth in autonomous productivities is equal to 0. Under these assumptions, equation (13) can provide a benchmark or criterion for convergence. That is,
(16) g= y (l - (a je ( x))l l-G /q /
and
(17) g> 0 - (a e ( ) >0 (a e ) >
(l
-G/ql
-G /q/ /) :/ Trayectoria divergente de la brecha.
gg= 0 - (a e ( ) =0 (a e ) =l-G/q
l-G /q/ /
(( ) :g<
/ Trayectoria neutra de la brecha.00 - (a e ( ) 0 (a e ) <
(l
-G/ql
-G /q/ // )) : Trayectoria convergente de la brecha.
FIGURE 1
Induced productivity of the follower country
Gl0 < G0 y Gl < G
θ
a(1/G0)
a(1/Gl0)
λfl = a(1/G0) (el-G/θ)
λf = a(1/G0) (e-G/θ)
Source: Prepared by the authors.
Divergent gap path.
Neutral gap path.
Convergent gap path.
Divergent gap path.
Neutral gap path.
Convergent gap path.
C E P A L R E V I E W 9 3 • D E C E M B E R 2 0 0 7
ThE CoMPARATIVE ADVAnTAgE fALLACy AnD A RuLE foR ConVERgEnCE • EsTEBAn PéREz CALDEnTEy AnD AnEsA ALI
135
Both sets of equations, (15) and (17), point to the fact that no parameter (whether it be learning capacity θ or the elasticity of exports or imports), and no policy aimed at a single objective, can guarantee convergence. As an example, policies to increase the relative elasticity of the leader country’s income-elasticity of exports (say,
policies to encourage the production of goods with high income-elasticity)27 may prove unsuccessful unless induced productivity differences can be offset (because complementary policies are in place to improve learning capacity or because the policies themselves have a positive effect on learning capacity in the follower country).
27 These may well be efficiency improvement policies.
VConclusion
The principle of comparative advantage is the cornerstone of mainstream trade theory. It is held to ensure the realization of welfare gains by allowing consumers and firms to purchase from the cheapest source of supply.
Comparative advantage forms the basis for the argument that free trade is best and that the gains from trade can only be realized under a laissez-faire regime. However, its underlying assumptions (the axioms of neutral money, gross substitution and ergodicity) make the entire argument prey to the ignoratio elenchi fallacy.
This paper presents an alternative framework for analysing the effects of free trade, exemplified at this stage of our work in progress by a two-country model consisting of a leader and a follower. The leader is more developed and also issues the international reserve currency.
Our framework is based on three approaches to economic growth: cumulative causation, the technological gap and balance-of-payments constraint.
Cumulative causation departs from the notion of equilibrium and convergence: differences in productivity and growth can persist and widen over time. According to this approach, the impetus for growth and the interrelationship between growth and productivity are generated internally. The technological gap formula addresses the issue of country interdependence and is a vehicle for analysing the spillovers from trade. The third approach complements the other two by providing the monetary context within which they operate.
According to the model presented, there is no mechanism that can guarantee the optimality of free
trade, convergence between countries or indeed any predictable outcome. The final outcome of free trade may depend on a variety of parameters and variables. It may even be shaped by history, critical decisions and unforeseen events.
The model suggests that the growth impetus of the leader economy has both a convergent and a divergent effect on the follower country. The convergent effect works through two channels: adaptive capacity and Thirlwall’s Law. The divergent effect works through the induced productivity and cumulative causation mechanisms.
In addition, it asserts that all the follower country can do is to take advantage (through spillover effects) of the productivity gains of the leader country. The extent to which the follower country can profit from spillovers depends on its adaptability (i.e., its learning capacity and its ability to earn reserve currency) and its initial conditions, including its stock of currency. As a result, monetary policies that soften the balance-of-payments constraint can be as important as educational policies aimed at improving human capital.
Lastly, the model states that the follower can narrow the gap with the leader country only if the difference in the elasticities ratio is greater than the difference in the induced productivity coefficients. Countries gain nothing in terms of convergence by improving their net export potential unless it offsets the induced productivity differential. This is a rule of convergence proposed and upheld in this article, and it should provide a benchmark and guideline for economic policy design.
(Original: English)
C E P A L R E V I E W 9 3 • D E C E M B E R 2 0 0 7
ThE CoMPARATIVE ADVAnTAgE fALLACy AnD A RuLE foR ConVERgEnCE • EsTEBAn PéREz CALDEnTEy AnD AnEsA ALI
136
Bibliography
Abramovitz, M. (1979): Rapid growth potential and its realisation: the experience of capitalist economies in the postwar period, in E. Malinvaud (ed.), Economic Growth and Resources: The Major Issues, London, Macmillan.
__________ (1986): Catching up, forging ahead, and falling behind, Journal of Economic History, vol. 46, No. 2, New York, Cambridge University Press, June.
__________ (1995): The elements of social capability, in D.H. Perkins and B.H. Koo (eds.), Social Capability and Long-Term Growth, Basingstoke, Macmillan Press.
Bairam, E.I. (1997): Levels of economic development and appropriate specification of the Harrod foreign-trade multiplier, Journal of Post Keynesian Economics, vol. 19, No. 3, New York, M.E. Sharpe.
Carabelli, A. (1991): The methodology of the critique of the classical theory: Keynes on organic interdependence, in J. Davis (ed.), Keynes and Philosophy, Aldershot, Edward Elgar.
Castellacci, F. (2001): A “technology-gap approach to cumulative growth”: toward an integrated model. Empirical evidence for Spain, 1960-1997, document presented at the Druid Academy Winter Conference (Copenhagen, 18-20 January).
Chandra, R. and R.J. Sandilands (2005): Does modern endogenous growth theory adequately represent Allyn Young?, Cambridge Journal of Economics, vol. 29, No. 3, Oxford, Oxford University Press, May.
Criscuolo, P. and R. Narula (2002): A Novel Approach to National Technological Accumulation and Absorptive Capacity: Aggregating Cohen and Levinthal, Research Memoranda, No. 18, Maastricht, Maastricht Economic Research Institute on Innovation and Technology.
Dahlman, C. and R. Nelson (1995): Social absorption capability, national innovation systems and economic development, in D.H. Perkins and B.H. Koo (eds.), Social Capability and Long-Term Growth, Basingstoke, Macmillan Press.
Davidson, P. (1992): International Money and the Real World, New York, St. Martin’s Press.
__________ (1994): Post Keynesian Macroeconomic Theory, Northampton, Edward Elgar.
__________ (2000): Commitment to full employment in a global economy, in A.W. Warner, in M. Forstater and S.M. Rosen (eds.), The Economics and Social Policy of Williams S. Vickrey, New York, M.E. Sharpe.
__________ (2002): Financial Markets, Money and the Real World, Northampton, Edward Elgar.
Dixon, R.J. and A.P. Thirlwall (1975): A model of regional growth rate differences on Kaldorian lines, Oxford Economic Papers, vol. 27, Oxford, Oxford University Press.
Dunn, R.M. and J.H. Muti (2000): International Economics, London, Routledge.
Fagerberg, J. and B. Verspagen (2001): Technology-Gaps, Innovation-Diffusion and Transformation: An Evolutionary Interpretation, TIK Working Paper, No. 11/01, Oslo, Centre for Technology, Innovation and Culture (TIK).
Grossman, G.M. and E. Helpman (1994): Technology and Trade, NBER Working Paper, No. 4926, Cambridge, Massachusetts, National Bureau of Economic Research.
Helpman, E. (2004): The Mystery of Economic Growth, Cambridge, The Belknap Press of Harvard University Press.
Kaldor, N. (1966): Causes of the Slow Rate of Economic Growth of the United Kingdom. An Inaugural Lecture, Cambridge, Cambridge University Press.
Keynes, J.M. (1973a): The Collected Writings of John Maynard Keynes, vol. 13, New York, Cambridge University Press.
__________ (1973b): The Collected Writings of John Maynard Keynes, vol. 7, New York, Macmillan Press.
__________ (1979): The Collected Writings of John Maynard Keynes, vol. 19, New York, Cambridge University Press.
León-Ledesma, M.A. (2002): Accumulation, innovation and catching-up: an extended cumulative growth model, Cambridge Journal of Economics, vol. 26, No. 2, Oxford, Oxford University Press.
McCombie, J.S.L., M. Pugno and B. Soro (2002): Productivity Growth and Economic Performance. Essays on Verdoorn’s Law, New York, Palgrave Macmillan.
McCombie, J.S.L. and A.P. Thirlwall (1994): Economic Growth and the Balance-of-Payments Constraint, New York, St. Martin’s Press.
__________ (1999): Growth in an international context: a post Keynesian view, in J. Deprez and J.T. Harvey (eds.), Foundations of International Economics. Post Keynesian Perspectives, New York, Routledge.
Moreno, J.C. and E. Pérez Caldentey (2003): Trade liberalization and economic growth in Central America, CEPAL Review, No. 81, LC/G.2216-P, Santiago, Chile, December.
Nelson, R.R. and E.S. Phelps (1966): Investment in humans, technological diffusion and economic growth, American Economic Review, vol. 56, No. 2, Nashville, Tennessee, American Economic Association.
Panagariya, A. (2000): Preferential trade liberalization: the traditional theory and new developments, Journal of Economic Literature, vol. 38, No. 2, Nashville, Tennessee, American Economic Association.
Rogers, M. (2004): Absorptive capability and economic growth: how do countries catch-up?, Cambridge Journal of Economics, vol. 28, No. 4, Oxford, Oxford University Press.
Rymes, T.K. (1989): Keynes’s Lectures, 1932-35. Notes of a Representative Student, Ann Arbor, The University of Michigan Press.
Samuelson, P.A. (1976): An exact Hume-Ricardo-Marshall model of international trade, in G.G. Judge and T. Takashi Takayama (eds.), Studies in Economic Planning over Space and Time, vol. 2, New York, North Holland Publishing Company.
Schumpeter, J. (1954): History of Economic Analysis, New York, Oxford University Press.
Soro, B. (2002): Fattori che regolano lo sviluppo della produttività del lavoro: fifty years on, in J. McCombie, M. Pugno and B. Soro (eds.), Productivity Growth and Economic Performance. Essays on Verdoorn’s Law, New York, Palgrave Macmillan.
Targetti, F. and A. Foti (1997): Growth and productivity: a model of cumulative growth and catching-up, Cambridge Journal of Economics, vol. 21, No. 1, Oxford, Oxford University Press.
Thirlwall, A.P. (1979): The Balance-of-Payments Constraint as an Explanation of International Growth Rate Differences, Banca Nazionale del Lavoro Quarterly Review, vol. 32, Rome, Banca Nazionale del Lavoro.
Thirlwall, T. and J.S.L. McCombie (2004): Essays on Balance of Payments Constrained Growth: Theory and Evidence, London, Routledge.
Verdoorn, P.J. (1949): Fattori che regolano lo sviluppo della produttivita del lavoro, L’industria, vol. 1. Translated by A.P. Thirlwall in D. Ironmonger, J. Perkins and T. Hoa (eds.), National Income and Economic Progress: Essays in Honour of Colin Clark, London, Macmillan, 1988.
Verspagen, B. and B. Los (2002): The Evolution of Productivity Gaps and Specialization Patterns, unpublished.
Young, A. (1928): Increasing returns and economic progress, Economic Journal, vol. 38, No. 152, Oxford, Royal Economic Society.
__________ (1990): Nicholas Kaldor’s notes on Allyn Young’s LSE lectures 1927-29, Journal of Economic Studies, vol. 17, No. 3/4, Bradford, United Kingdom, Emerald
137
C E P A L R E V I E W 9 3 • D E C E M B E R 2 0 0 7
A boom in a heterogeneous economy.Peru 2002-2006
Norberto E. García
One part of Peru’s population failed to benefit from the economic
boom in 2002-2006, among other reasons because of the deep- rooted
productive heterogeneity present in the Peruvian economy. In 2006,
microenterprises and self-employed persons with family workers accounted
for 53.4 % of total employment, but productivity and average labour
incomes were very low in that segment. As the corresponding incomes
grew very slowly between 2002 and 2006, the gain in well-being was
very slight despite the boom that was being experienced elsewhere in
the economy. Looking to the future, it will be essential to develop policies
targeted on microenterprises with competitive potential, to achieve rapid
productivity growth that raises the well-being of their employees. It will
also be necessary to recognize that the impacts of economic policy differ
between microenterprises and larger firms, so that specifically targeted
measures can be designed to improve microenterprise competitiveness.
K E YW O R D S
Economic cond i t ions
Economic po l icy
Employment
Labour market
Wages
Rura l a reas
Urban areas
Smal l enterpr ises
Medium enterpr ises
Peru
Norberto E. García
International consultant
C E P A L R E V I E W 9 3 • D E C E M B E R 2 0 0 7
A BooM In A hEtERogEnEous EConoMy. PERu 2002-2006 • noRBERto E. gARCíA
138
IIntroduction
This paper discusses why the economic boom in Peru in 2002-2007 was not perceived as such by a large proportion of the population. One reason is the Peruvian economy’s profound productive heterogeneity, which is associated with a very highly segmented labour market. This explains why the rapid growth and modernization of certain segments of the economy did not spread as quickly towards other segments.
Section II describes the backdrop to the boom that started in 2002. Section III considers the uneven
growth in employment and labour incomes in the various segments of the labour market, highlighting the importance of microenterprises for understanding how the country’s labour market operated. Section IV stresses the need to design policies targeting microenterprises that have greater competitive potential; it then analyses the range of current policies, and makes suggestions for the future. Section V sets out the main conclusions.
IIsetting
Between 2002 and 2006, Peru experienced the most vigorous economic upswing of its recent history, following the 1950-1955 boom fuelled by the Korean War. A rapid expansion in the external demand for minerals and other extractive products was accompanied by the impact Andean Trade Promotion and Drug Eradication Act (ATPDEA)1 in the United States, which, by lowering tariff barriers, stimulated the diversification of non-traditional exports to that country. Additional factors were the promotion of non-traditional exports to many other countries of the world and a macroeconomic policy that gave priority to stability.
Traditional and non-traditional export earnings grew rapidly during 2002-2006 (30% per year in current dollars) and 12 % at constant prices). The ratio of exports to gross domestic product (exports/GDP) at current prices rose from 14% in 2002 to 28% in 2006. All of this also generated a surge in tax revenues, which made it possible to expand public expenditure and reduce the fiscal deficit to a very small amount.
As a result, GDP growth accelerated from 3.9% in 2003 to 6.4% in 2005, 8.0% in 2006 and an estimated 8.9% for 2007. During the same period, total productivity
1 Andean Trade Promotion and Drug Eradication Act, of the United States.
recovered to grow at 2.5 - 3% per year for the first time since a brief interregnum in 1993-1996. Gross fixed investment tracked GDP growth, albeit with a lag, thus helping to create new jobs. In particular, the rate of growth of employment in urban establishments with 10 or more employees, accelerated from 3.0 percent in 2003 to 5.7 % in 2005, with figures above 8 percent per year estimated for 2006 and 2007.
One of the surprising features of the current Peruvian boom is that the way it is perceived by one part of the population seems to differ from the view held by economists. In 2003-2006, a large proportion of the population did not consider they had benefited from the economic success. In the 2006 presidential elections 47% of the electorate voted to abandon the successful economic model and return to old populist practices, including development of the domestic market and nationalizations.
Several factors converge to explain this mismatch between economic success and its perception by a very large fraction of the population. These include highly unequal access to opportunities at the outset; the lag with which economic growth affects employment and incomes; the concentration of exports in a relatively small number of firms; and the technological backwardness of the vast peasant economy in the Andean sierra region. This article aims to explore just one of those factors, namely
C E P A L R E V I E W 9 3 • D E C E M B E R 2 0 0 7
A BooM In A hEtERogEnEous EConoMy. PERu 2002-2006 • noRBERto E. gARCíA
139
the high degree of productive heterogeneity existing at the outset and its effects on the growth of employment, income and welfare among the population.
Peru has one of Latin America’s most productively heterogeneous economies. This is a feature of nearly all of its markets and productive sectors. In a given activity, alongside a large modern enterprise endowed with state-of-the-art technology, cutting-edge business management, highly qualified and experienced staff and a dynamic export market, there are also numerous microenterprises or small businesses that are extremely backward, displaying rudimentary technology, weak management capacity, inexperienced and unskilled workers, and a precarious positioning in local markets.
Heterogeneity causes segmentation in product and factor markets. These do not adjust like their homogeneous counterparts, but the various segments
adjust in different ways and at different speeds. If the Central Reserve Bank lowers the benchmark interest rate by half a point, credit becomes cheaper for organized and formal private enterprises, and this probably helps to increase their demand for credit. But the interest-rate cut does not produce the same effect among microenterprises, for which credit will remain rationed and very expensive.
The above is particularly true for a segmented labour market like that prevailing in Peru, in which the dynamism of modern sectors and the corresponding labour-market segments is not automatically and proportionally transmitted to those that are less structured. Segmentation does not mean that there are sealed compartments within the labour market, but obstacles, shortcomings and barriers that intermediate the effect that changes occurring in certain segments has on others.
IIIgrowth of employment and labour
income by establishment size
1. trends in 2002-2006
The first column of table 1 summarizes employment growth by labour-market segment in 2002-2006. As the table shows, employment grew very little in medium-sized enterprises (50 to 199 employees) and large firms (200 employees or more); in contrast, it grew at a rate of 6.4% per year in small businesses (10 to 49 employees) and by 5.0% per year in microenterprises (2 to 9 employees), according to data from the National Household Survey (fourth quarters, 2002-2006). The National Survey of Wages and Salaries, covering establishments with 10 or more employees, produces a more optimistic result: aggregate employment among small, medium-sized and large firms grew at 5.3% per year during the same period, accelerating to 5.7% in 2005 and 8.9% in 2006. The (national) open unemployment rate fell from 6.0% in 2002 to 4.5% in 2006.
With such strong job growth in formal segments of the labour market, how could the population at large not have perceived an intensive improvement in welfare? The answer can be found in the second column of table 1.
In 2006, despite the very rapid expansion of formal employment, 53.4% of all jobs were in microenterprises, and 16.2% corresponded to unskilled self-employment, thus in total encompassing almost 70% of jobs in the country. A large fraction of these two categories usually forms part of what many analysts refer to as “informal employment”. The International Labour Organization (ILO) measures informal urban employment as the aggregate of persons working in microenterprises with up to five employees, together with unskilled self-employed workers, unpaid family members, and persons in domestic service.
As a counterpart, after five years of rapid growth, employment in small, medium-sized and large enterprises accounted for just 17.2% of the country’s total employment in 2006. Consequently, despite significant growth of quality jobs in these categories, their contribution to total employment growth, and thus to aggregate welfare, was relatively small.
Moreover, in 2002-2006, the proportion of unskilled self-employed workers shrank —because of the faster growth of employment in establishments of all sizes—
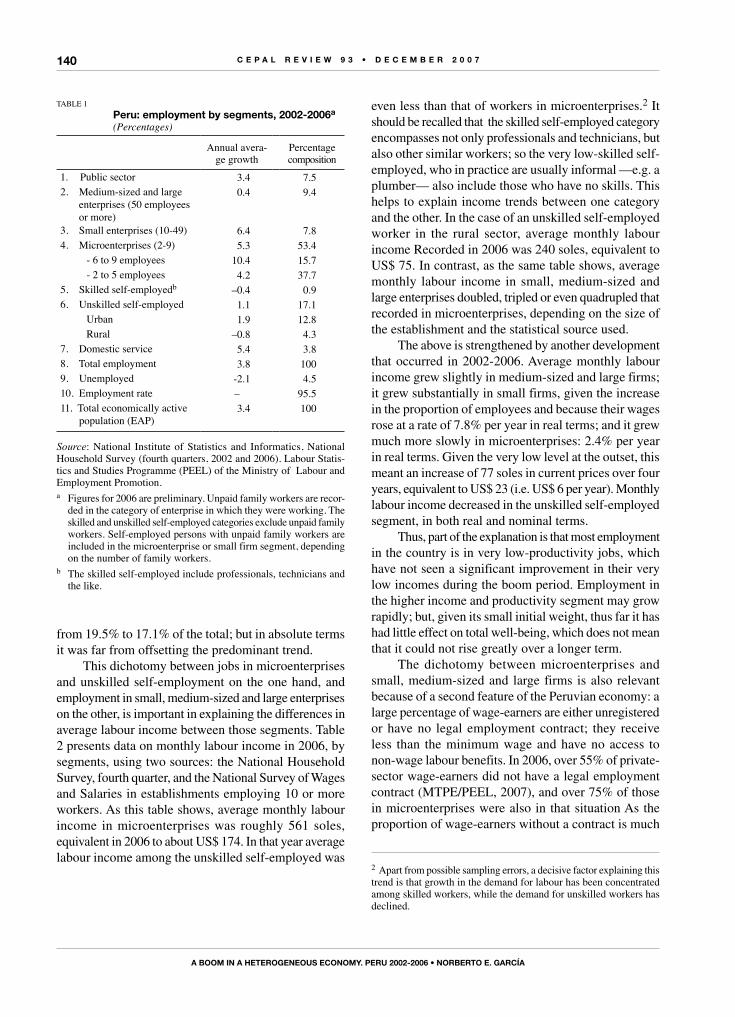
C E P A L R E V I E W 9 3 • D E C E M B E R 2 0 0 7
A BooM In A hEtERogEnEous EConoMy. PERu 2002-2006 • noRBERto E. gARCíA
140
from 19.5% to 17.1% of the total; but in absolute terms it was far from offsetting the predominant trend.
This dichotomy between jobs in microenterprises and unskilled self-employment on the one hand, and employment in small, medium-sized and large enterprises on the other, is important in explaining the differences in average labour income between those segments. Table 2 presents data on monthly labour income in 2006, by segments, using two sources: the National Household Survey, fourth quarter, and the National Survey of Wages and Salaries in establishments employing 10 or more workers. As this table shows, average monthly labour income in microenterprises was roughly 561 soles, equivalent in 2006 to about US$ 174. In that year average labour income among the unskilled self-employed was
even less than that of workers in microenterprises.2 It should be recalled that the skilled self-employed category encompasses not only professionals and technicians, but also other similar workers; so the very low-skilled self-employed, who in practice are usually informal —e.g. a plumber— also include those who have no skills. This helps to explain income trends between one category and the other. In the case of an unskilled self-employed worker in the rural sector, average monthly labour income Recorded in 2006 was 240 soles, equivalent to US$ 75. In contrast, as the same table shows, average monthly labour income in small, medium-sized and large enterprises doubled, tripled or even quadrupled that recorded in microenterprises, depending on the size of the establishment and the statistical source used.
The above is strengthened by another development that occurred in 2002-2006. Average monthly labour income grew slightly in medium-sized and large firms; it grew substantially in small firms, given the increase in the proportion of employees and because their wages rose at a rate of 7.8% per year in real terms; and it grew much more slowly in microenterprises: 2.4% per year in real terms. Given the very low level at the outset, this meant an increase of 77 soles in current prices over four years, equivalent to US$ 23 (i.e. US$ 6 per year). Monthly labour income decreased in the unskilled self-employed segment, in both real and nominal terms.
Thus, part of the explanation is that most employment in the country is in very low-productivity jobs, which have not seen a significant improvement in their very low incomes during the boom period. Employment in the higher income and productivity segment may grow rapidly; but, given its small initial weight, thus far it has had little effect on total well-being, which does not mean that it could not rise greatly over a longer term.
The dichotomy between microenterprises and small, medium-sized and large firms is also relevant because of a second feature of the Peruvian economy: a large percentage of wage-earners are either unregistered or have no legal employment contract; they receive less than the minimum wage and have no access to non-wage labour benefits. In 2006, over 55% of private-sector wage-earners did not have a legal employment contract (MTPE/PEEL, 2007), and over 75% of those in microenterprises were also in that situation As the proportion of wage-earners without a contract is much
2 Apart from possible sampling errors, a decisive factor explaining this trend is that growth in the demand for labour has been concentrated among skilled workers, while the demand for unskilled workers has declined.
TABLE 1
Peru: employment by segments, 2002-2006a
(Percentages)
Annual avera-ge growth
Percentage composition
1. Public sector 3.4 7.52. Medium-sized and large
enterprises (50 employees or more)
0.4 9.4
3. Small enterprises (10-49) 6.4 7.84. Microenterprises (2-9) 5.3 53.4 - 6 to 9 employees 10.4 15.7 - 2 to 5 employees 4.2 37.75. Skilled self-employedb –0.4 0.96. Unskilled self-employed 1.1 17.1 Urban 1.9 12.8 Rural –0.8 4.37. Domestic service 5.4 3.88. Total employment 3.8 1009. Unemployed -2.1 4.510. Employment rate – 95.511. Total economically active
population (EAP)3.4 100
Source: National Institute of Statistics and Informatics, National Household Survey (fourth quarters, 2002 and 2006). Labour Statis-tics and Studies Programme (PEEL) of the Ministry of Labour and Employment Promotion.a Figures for 2006 are preliminary. Unpaid family workers are recor-
ded in the category of enterprise in which they were working. The skilled and unskilled self-employed categories exclude unpaid family workers. Self-employed persons with unpaid family workers are included in the microenterprise or small firm segment, depending on the number of family workers.
b The skilled self-employed include professionals, technicians and the like.
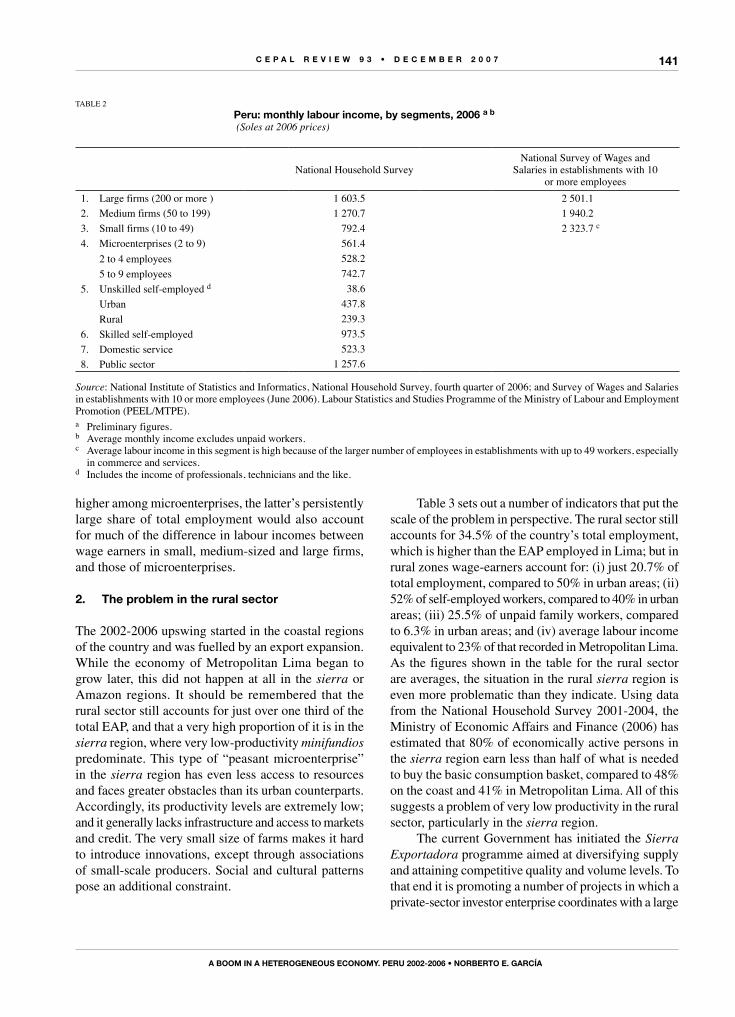
C E P A L R E V I E W 9 3 • D E C E M B E R 2 0 0 7
A BooM In A hEtERogEnEous EConoMy. PERu 2002-2006 • noRBERto E. gARCíA
141
higher among microenterprises, the latter’s persistently large share of total employment would also account for much of the difference in labour incomes between wage earners in small, medium-sized and large firms, and those of microenterprises.
2. the problem in the rural sector
The 2002-2006 upswing started in the coastal regions of the country and was fuelled by an export expansion. While the economy of Metropolitan Lima began to grow later, this did not happen at all in the sierra or Amazon regions. It should be remembered that the rural sector still accounts for just over one third of the total EAP, and that a very high proportion of it is in the sierra region, where very low-productivity minifundios predominate. This type of “peasant microenterprise” in the sierra region has even less access to resources and faces greater obstacles than its urban counterparts. Accordingly, its productivity levels are extremely low; and it generally lacks infrastructure and access to markets and credit. The very small size of farms makes it hard to introduce innovations, except through associations of small-scale producers. Social and cultural patterns pose an additional constraint.
Table 3 sets out a number of indicators that put the scale of the problem in perspective. The rural sector still accounts for 34.5% of the country’s total employment, which is higher than the EAP employed in Lima; but in rural zones wage-earners account for: (i) just 20.7% of total employment, compared to 50% in urban areas; (ii) 52% of self-employed workers, compared to 40% in urban areas; (iii) 25.5% of unpaid family workers, compared to 6.3% in urban areas; and (iv) average labour income equivalent to 23% of that recorded in Metropolitan Lima. As the figures shown in the table for the rural sector are averages, the situation in the rural sierra region is even more problematic than they indicate. Using data from the National Household Survey 2001-2004, the Ministry of Economic Affairs and Finance (2006) has estimated that 80% of economically active persons in the sierra region earn less than half of what is needed to buy the basic consumption basket, compared to 48% on the coast and 41% in Metropolitan Lima. All of this suggests a problem of very low productivity in the rural sector, particularly in the sierra region.
The current Government has initiated the Sierra Exportadora programme aimed at diversifying supply and attaining competitive quality and volume levels. To that end it is promoting a number of projects in which a private-sector investor enterprise coordinates with a large
TABLE 2
Peru: monthly labour income, by segments, 2006 a b
(Soles at 2006 prices)
National Household SurveyNational Survey of Wages and
Salaries in establishments with 10 or more employees
1. Large firms (200 or more ) 1 603.5 2 501.1
2. Medium firms (50 to 199) 1 270.7 1 940.2
3. Small firms (10 to 49) 792.4 2 323.7 c
4. Microenterprises (2 to 9) 561.4
2 to 4 employees 528.2
5 to 9 employees 742.7
5. Unskilled self-employed d 38.6
Urban 437.8
Rural 239.3
6. Skilled self-employed 973.5
7. Domestic service 523.3
8. Public sector 1 257.6 Source: National Institute of Statistics and Informatics, National Household Survey, fourth quarter of 2006; and Survey of Wages and Salaries in establishments with 10 or more employees (June 2006). Labour Statistics and Studies Programme of the Ministry of Labour and Employment Promotion (PEEL/MTPE).a Preliminary figures.b Average monthly income excludes unpaid workers.c Average labour income in this segment is high because of the larger number of employees in establishments with up to 49 workers, especially
in commerce and services.d Includes the income of professionals, technicians and the like.
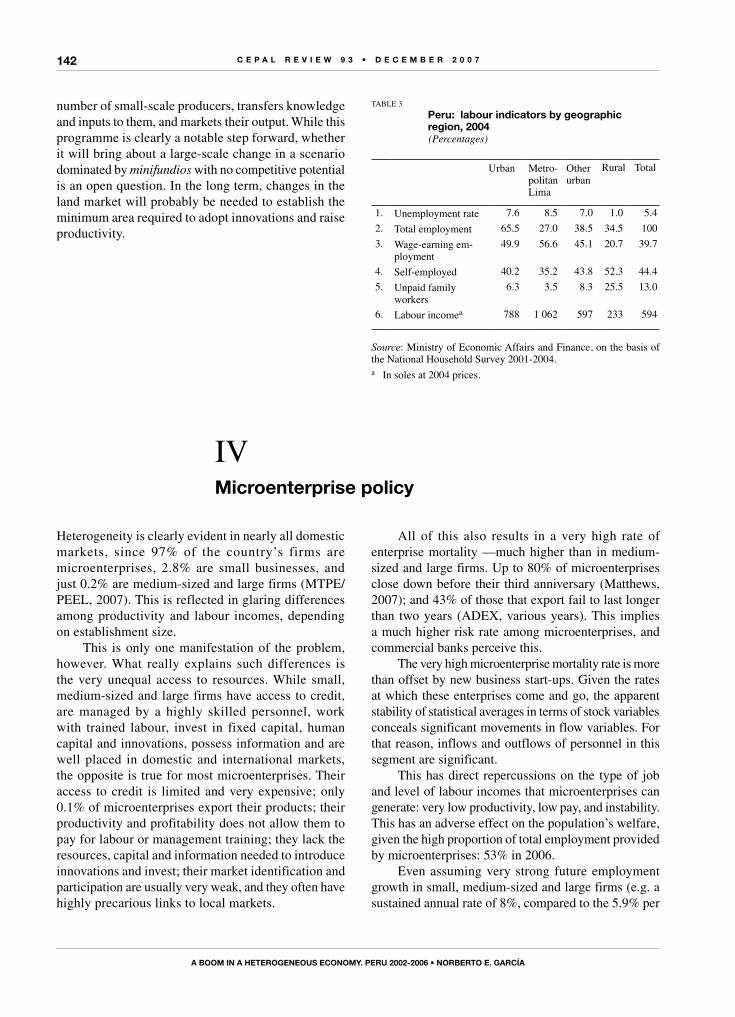
C E P A L R E V I E W 9 3 • D E C E M B E R 2 0 0 7
A BooM In A hEtERogEnEous EConoMy. PERu 2002-2006 • noRBERto E. gARCíA
142
number of small-scale producers, transfers knowledge and inputs to them, and markets their output. While this programme is clearly a notable step forward, whether it will bring about a large-scale change in a scenario dominated by minifundios with no competitive potential is an open question. In the long term, changes in the land market will probably be needed to establish the minimum area required to adopt innovations and raise productivity.
TABLE 3
Peru: labour indicators by geographic region, 2004(Percentages)
Urban Metro-politan Lima
Other urban
Rural Total
1. Unemployment rate 7.6 8.5 7.0 1.0 5.4
2. Total employment 65.5 27.0 38.5 34.5 100
3. Wage-earning em-ployment
49.9 56.6 45.1 20.7 39.7
4. Self-employed 40.2 35.2 43.8 52.3 44.4
5. Unpaid family workers
6.3 3.5 8.3 25.5 13.0
6. Labour incomea 788 1 062 597 233 594
Source: Ministry of Economic Affairs and Finance, on the basis of the National Household Survey 2001-2004.a In soles at 2004 prices.
IVMicroenterprise policy
Heterogeneity is clearly evident in nearly all domestic markets, since 97% of the country’s firms are microenterprises, 2.8% are small businesses, and just 0.2% are medium-sized and large firms (MTPE/PEEL, 2007). This is reflected in glaring differences among productivity and labour incomes, depending on establishment size.
This is only one manifestation of the problem, however. What really explains such differences is the very unequal access to resources. While small, medium-sized and large firms have access to credit, are managed by a highly skilled personnel, work with trained labour, invest in fixed capital, human capital and innovations, possess information and are well placed in domestic and international markets, the opposite is true for most microenterprises. Their access to credit is limited and very expensive; only 0.1% of microenterprises export their products; their productivity and profitability does not allow them to pay for labour or management training; they lack the resources, capital and information needed to introduce innovations and invest; their market identification and participation are usually very weak, and they often have highly precarious links to local markets.
All of this also results in a very high rate of enterprise mortality —much higher than in medium-sized and large firms. Up to 80% of microenterprises close down before their third anniversary (Matthews, 2007); and 43% of those that export fail to last longer than two years (ADEX, various years). This implies a much higher risk rate among microenterprises, and commercial banks perceive this.
The very high microenterprise mortality rate is more than offset by new business start-ups. Given the rates at which these enterprises come and go, the apparent stability of statistical averages in terms of stock variables conceals significant movements in flow variables. For that reason, inflows and outflows of personnel in this segment are significant.
This has direct repercussions on the type of job and level of labour incomes that microenterprises can generate: very low productivity, low pay, and instability. This has an adverse effect on the population’s welfare, given the high proportion of total employment provided by microenterprises: 53% in 2006.
Even assuming very strong future employment growth in small, medium-sized and large firms (e.g. a sustained annual rate of 8%, compared to the 5.9% per
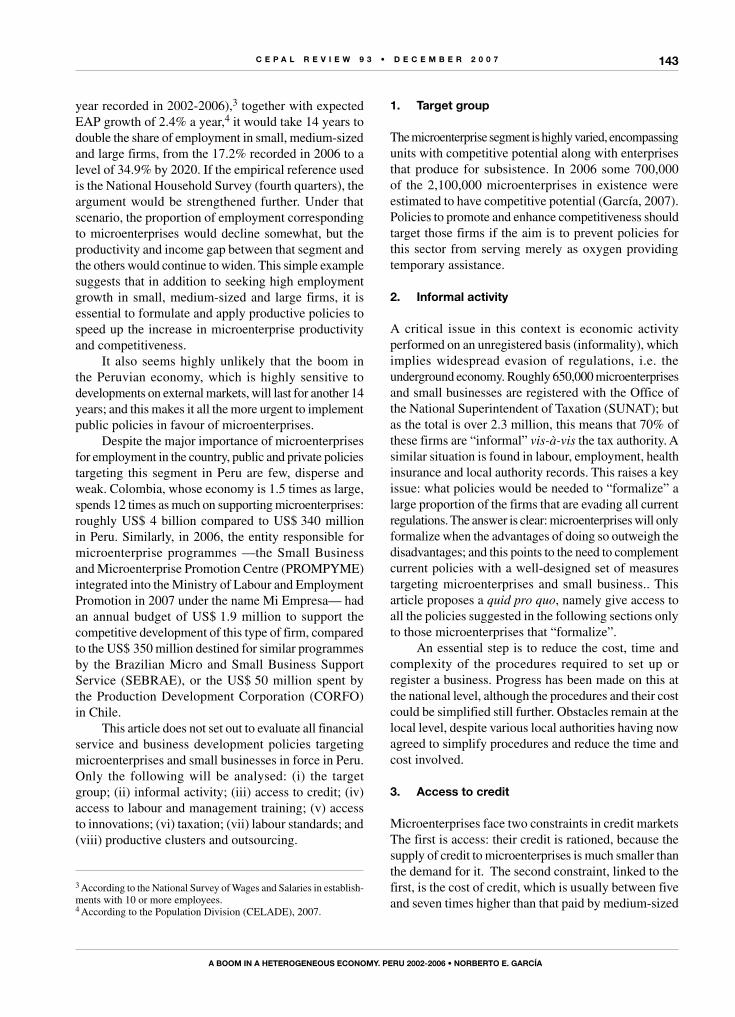
C E P A L R E V I E W 9 3 • D E C E M B E R 2 0 0 7
A BooM In A hEtERogEnEous EConoMy. PERu 2002-2006 • noRBERto E. gARCíA
143
year recorded in 2002-2006),3 together with expected EAP growth of 2.4% a year,4 it would take 14 years to double the share of employment in small, medium-sized and large firms, from the 17.2% recorded in 2006 to a level of 34.9% by 2020. If the empirical reference used is the National Household Survey (fourth quarters), the argument would be strengthened further. Under that scenario, the proportion of employment corresponding to microenterprises would decline somewhat, but the productivity and income gap between that segment and the others would continue to widen. This simple example suggests that in addition to seeking high employment growth in small, medium-sized and large firms, it is essential to formulate and apply productive policies to speed up the increase in microenterprise productivity and competitiveness.
It also seems highly unlikely that the boom in the Peruvian economy, which is highly sensitive to developments on external markets, will last for another 14 years; and this makes it all the more urgent to implement public policies in favour of microenterprises.
Despite the major importance of microenterprises for employment in the country, public and private policies targeting this segment in Peru are few, disperse and weak. Colombia, whose economy is 1.5 times as large, spends 12 times as much on supporting microenterprises: roughly US$ 4 billion compared to US$ 340 million in Peru. Similarly, in 2006, the entity responsible for microenterprise programmes —the Small Business and Microenterprise Promotion Centre (PROMPYME) integrated into the Ministry of Labour and Employment Promotion in 2007 under the name Mi Empresa— had an annual budget of US$ 1.9 million to support the competitive development of this type of firm, compared to the US$ 350 million destined for similar programmes by the Brazilian Micro and Small Business Support Service (SEBRAE), or the US$ 50 million spent by the Production Development Corporation (CORFO) in Chile.
This article does not set out to evaluate all financial service and business development policies targeting microenterprises and small businesses in force in Peru. Only the following will be analysed: (i) the target group; (ii) informal activity; (iii) access to credit; (iv) access to labour and management training; (v) access to innovations; (vi) taxation; (vii) labour standards; and (viii) productive clusters and outsourcing.
3 According to the National Survey of Wages and Salaries in establish-ments with 10 or more employees.4 According to the Population Division (CELADE), 2007.
1. target group
The microenterprise segment is highly varied, encompassing units with competitive potential along with enterprises that produce for subsistence. In 2006 some 700,000 of the 2,100,000 microenterprises in existence were estimated to have competitive potential (García, 2007). Policies to promote and enhance competitiveness should target those firms if the aim is to prevent policies for this sector from serving merely as oxygen providing temporary assistance.
2. Informal activity
A critical issue in this context is economic activity performed on an unregistered basis (informality), which implies widespread evasion of regulations, i.e. the underground economy. Roughly 650,000 microenterprises and small businesses are registered with the Office of the National Superintendent of Taxation (SUNAT); but as the total is over 2.3 million, this means that 70% of these firms are “informal” vis-à-vis the tax authority. A similar situation is found in labour, employment, health insurance and local authority records. This raises a key issue: what policies would be needed to “formalize” a large proportion of the firms that are evading all current regulations. The answer is clear: microenterprises will only formalize when the advantages of doing so outweigh the disadvantages; and this points to the need to complement current policies with a well-designed set of measures targeting microenterprises and small business.. This article proposes a quid pro quo, namely give access to all the policies suggested in the following sections only to those microenterprises that “formalize”.
An essential step is to reduce the cost, time and complexity of the procedures required to set up or register a business. Progress has been made on this at the national level, although the procedures and their cost could be simplified still further. Obstacles remain at the local level, despite various local authorities having now agreed to simplify procedures and reduce the time and cost involved.
3. Access to credit
Microenterprises face two constraints in credit markets The first is access: their credit is rationed, because the supply of credit to microenterprises is much smaller than the demand for it. The second constraint, linked to the first, is the cost of credit, which is usually between five and seven times higher than that paid by medium-sized
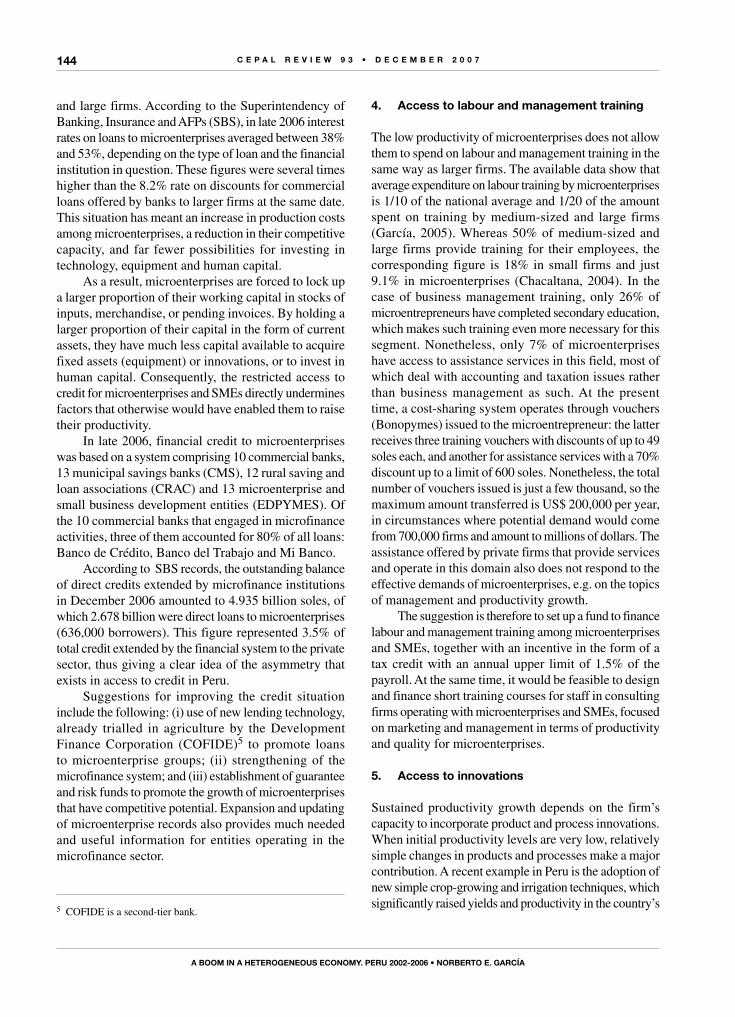
C E P A L R E V I E W 9 3 • D E C E M B E R 2 0 0 7
A BooM In A hEtERogEnEous EConoMy. PERu 2002-2006 • noRBERto E. gARCíA
144
and large firms. According to the Superintendency of Banking, Insurance and AFPs (SBS), in late 2006 interest rates on loans to microenterprises averaged between 38% and 53%, depending on the type of loan and the financial institution in question. These figures were several times higher than the 8.2% rate on discounts for commercial loans offered by banks to larger firms at the same date. This situation has meant an increase in production costs among microenterprises, a reduction in their competitive capacity, and far fewer possibilities for investing in technology, equipment and human capital.
As a result, microenterprises are forced to lock up a larger proportion of their working capital in stocks of inputs, merchandise, or pending invoices. By holding a larger proportion of their capital in the form of current assets, they have much less capital available to acquire fixed assets (equipment) or innovations, or to invest in human capital. Consequently, the restricted access to credit for microenterprises and SMEs directly undermines factors that otherwise would have enabled them to raise their productivity.
In late 2006, financial credit to microenterprises was based on a system comprising 10 commercial banks, 13 municipal savings banks (CMS), 12 rural saving and loan associations (CRAC) and 13 microenterprise and small business development entities (EDPYMES). Of the 10 commercial banks that engaged in microfinance activities, three of them accounted for 80% of all loans: Banco de Crédito, Banco del Trabajo and Mi Banco.
According to SBS records, the outstanding balance of direct credits extended by microfinance institutions in December 2006 amounted to 4.935 billion soles, of which 2.678 billion were direct loans to microenterprises (636,000 borrowers). This figure represented 3.5% of total credit extended by the financial system to the private sector, thus giving a clear idea of the asymmetry that exists in access to credit in Peru.
Suggestions for improving the credit situation include the following: (i) use of new lending technology, already trialled in agriculture by the Development Finance Corporation (COFIDE)5 to promote loans to microenterprise groups; (ii) strengthening of the microfinance system; and (iii) establishment of guarantee and risk funds to promote the growth of microenterprises that have competitive potential. Expansion and updating of microenterprise records also provides much needed and useful information for entities operating in the microfinance sector.
5 COFIDE is a second-tier bank.
4. Access to labour and management training
The low productivity of microenterprises does not allow them to spend on labour and management training in the same way as larger firms. The available data show that average expenditure on labour training by microenterprises is 1/10 of the national average and 1/20 of the amount spent on training by medium-sized and large firms (García, 2005). Whereas 50% of medium-sized and large firms provide training for their employees, the corresponding figure is 18% in small firms and just 9.1% in microenterprises (Chacaltana, 2004). In the case of business management training, only 26% of microentrepreneurs have completed secondary education, which makes such training even more necessary for this segment. Nonetheless, only 7% of microenterprises have access to assistance services in this field, most of which deal with accounting and taxation issues rather than business management as such. At the present time, a cost-sharing system operates through vouchers (Bonopymes) issued to the microentrepreneur: the latter receives three training vouchers with discounts of up to 49 soles each, and another for assistance services with a 70% discount up to a limit of 600 soles. Nonetheless, the total number of vouchers issued is just a few thousand, so the maximum amount transferred is US$ 200,000 per year, in circumstances where potential demand would come from 700,000 firms and amount to millions of dollars. The assistance offered by private firms that provide services and operate in this domain also does not respond to the effective demands of microenterprises, e.g. on the topics of management and productivity growth.
The suggestion is therefore to set up a fund to finance labour and management training among microenterprises and SMEs, together with an incentive in the form of a tax credit with an annual upper limit of 1.5% of the payroll. At the same time, it would be feasible to design and finance short training courses for staff in consulting firms operating with microenterprises and SMEs, focused on marketing and management in terms of productivity and quality for microenterprises.
5. Access to innovations
Sustained productivity growth depends on the firm’s capacity to incorporate product and process innovations. When initial productivity levels are very low, relatively simple changes in products and processes make a major contribution. A recent example in Peru is the adoption of new simple crop-growing and irrigation techniques, which significantly raised yields and productivity in the country’s
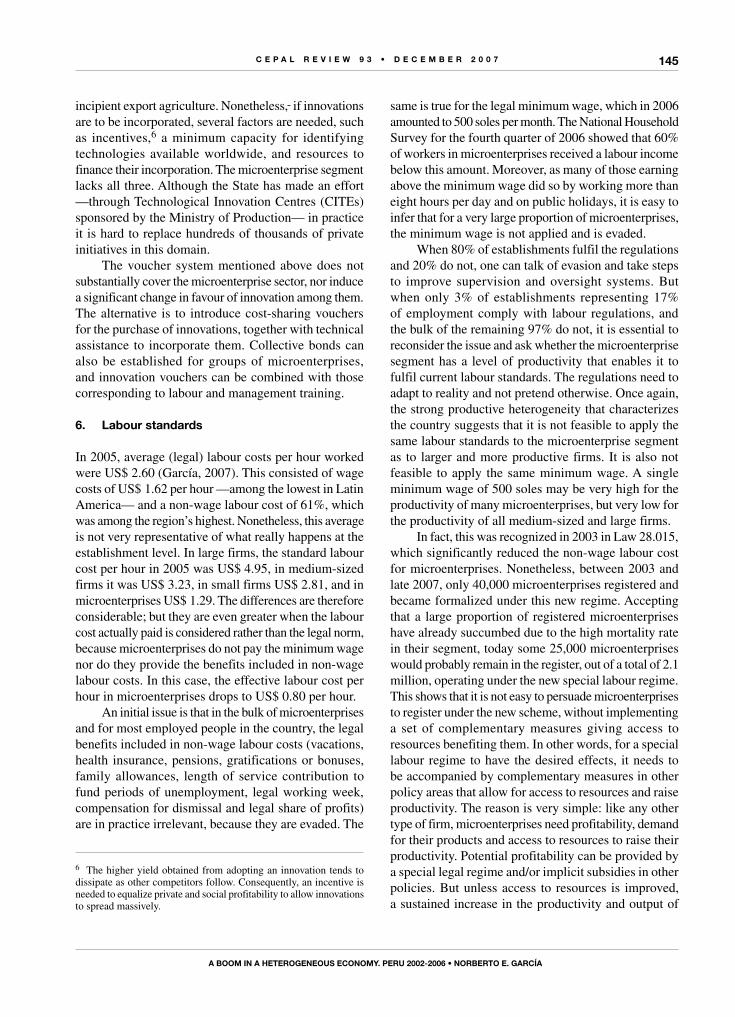
C E P A L R E V I E W 9 3 • D E C E M B E R 2 0 0 7
A BooM In A hEtERogEnEous EConoMy. PERu 2002-2006 • noRBERto E. gARCíA
145
incipient export agriculture. Nonetheless, if innovations are to be incorporated, several factors are needed, such as incentives,6 a minimum capacity for identifying technologies available worldwide, and resources to finance their incorporation. The microenterprise segment lacks all three. Although the State has made an effort —through Technological Innovation Centres (CITEs) sponsored by the Ministry of Production— in practice it is hard to replace hundreds of thousands of private initiatives in this domain.
The voucher system mentioned above does not substantially cover the microenterprise sector, nor induce a significant change in favour of innovation among them. The alternative is to introduce cost-sharing vouchers for the purchase of innovations, together with technical assistance to incorporate them. Collective bonds can also be established for groups of microenterprises, and innovation vouchers can be combined with those corresponding to labour and management training.
6. Labour standards
In 2005, average (legal) labour costs per hour worked were US$ 2.60 (García, 2007). This consisted of wage costs of US$ 1.62 per hour —among the lowest in Latin America— and a non-wage labour cost of 61%, which was among the region’s highest. Nonetheless, this average is not very representative of what really happens at the establishment level. In large firms, the standard labour cost per hour in 2005 was US$ 4.95, in medium-sized firms it was US$ 3.23, in small firms US$ 2.81, and in microenterprises US$ 1.29. The differences are therefore considerable; but they are even greater when the labour cost actually paid is considered rather than the legal norm, because microenterprises do not pay the minimum wage nor do they provide the benefits included in non-wage labour costs. In this case, the effective labour cost per hour in microenterprises drops to US$ 0.80 per hour.
An initial issue is that in the bulk of microenterprises and for most employed people in the country, the legal benefits included in non-wage labour costs (vacations, health insurance, pensions, gratifications or bonuses, family allowances, length of service contribution to fund periods of unemployment, legal working week, compensation for dismissal and legal share of profits) are in practice irrelevant, because they are evaded. The
6 The higher yield obtained from adopting an innovation tends to dissipate as other competitors follow. Consequently, an incentive is needed to equalize private and social profitability to allow innovations to spread massively.
same is true for the legal minimum wage, which in 2006 amounted to 500 soles per month. The National Household Survey for the fourth quarter of 2006 showed that 60% of workers in microenterprises received a labour income below this amount. Moreover, as many of those earning above the minimum wage did so by working more than eight hours per day and on public holidays, it is easy to infer that for a very large proportion of microenterprises, the minimum wage is not applied and is evaded.
When 80% of establishments fulfil the regulations and 20% do not, one can talk of evasion and take steps to improve supervision and oversight systems. But when only 3% of establishments representing 17% of employment comply with labour regulations, and the bulk of the remaining 97% do not, it is essential to reconsider the issue and ask whether the microenterprise segment has a level of productivity that enables it to fulfil current labour standards. The regulations need to adapt to reality and not pretend otherwise. Once again, the strong productive heterogeneity that characterizes the country suggests that it is not feasible to apply the same labour standards to the microenterprise segment as to larger and more productive firms. It is also not feasible to apply the same minimum wage. A single minimum wage of 500 soles may be very high for the productivity of many microenterprises, but very low for the productivity of all medium-sized and large firms.
In fact, this was recognized in 2003 in Law 28.015, which significantly reduced the non-wage labour cost for microenterprises. Nonetheless, between 2003 and late 2007, only 40,000 microenterprises registered and became formalized under this new regime. Accepting that a large proportion of registered microenterprises have already succumbed due to the high mortality rate in their segment, today some 25,000 microenterprises would probably remain in the register, out of a total of 2.1 million, operating under the new special labour regime. This shows that it is not easy to persuade microenterprises to register under the new scheme, without implementing a set of complementary measures giving access to resources benefiting them. In other words, for a special labour regime to have the desired effects, it needs to be accompanied by complementary measures in other policy areas that allow for access to resources and raise productivity. The reason is very simple: like any other type of firm, microenterprises need profitability, demand for their products and access to resources to raise their productivity. Potential profitability can be provided by a special legal regime and/or implicit subsidies in other policies. But unless access to resources is improved, a sustained increase in the productivity and output of
C E P A L R E V I E W 9 3 • D E C E M B E R 2 0 0 7
A BooM In A hEtERogEnEous EConoMy. PERu 2002-2006 • noRBERto E. gARCíA
146
potentially competitive microenterprises, and hence their real profitability, will remain unlikely. Special labour standards for this segment will be adopted by a larger number of microenterprises if at the same time complementary policies are formulated and applied that expand their access to resources.
This raises a crucial issue. As is well known, the labour-cost measure that is relevant for competitiveness is labour cost per unit produced, expressed in foreign currency, and not labour cost per hour. Labour cost per unit produced is defined as the ratio between labour cost per hour and hourly productivity, corrected by the exchange rate to express it in foreign currency. From this standpoint, microenterprises may have a low hourly labour cost and yet remain much less competitive than large firms if their productivity is very weak. An example can clarify this point. A large firm with a labour cost of US$ 5 per hour and productivity of US$ 12 per hour has a labour cost per unit produced of US$ 0.42 per hour (5/12). A microenterprise with a labour cost of US$ 1.29 per hour and productivity of US$ 2.1 per hour, has a labour cost per unit produced of US$ 0.61 per hour (1.29/2.1). Consequently, to be able to compete, it has to ignore labour standards and reduce its effective labour cost to US$ 0.86 per hour, so that, with a productivity of US$ 2.1 per hour, it operates with a labour cost per unit produced of US$ 0.41 per hour, which is slightly less than that of the large firm.7 This example shows very clearly the importance of access to resources in raising productivity levels among microenterprises and making them more competitive.
7. taxation
One of the reasons preventing a much larger number of microenterprises from registering in the special labour regime created in 2003 was the taxation cost they faced upon registration. If the non-wage labour cost is lowered from 61% to 30%, the total labour cost of microenterprises will be reduced by roughly 19%. Assuming that total labour costs represent 35% of total costs, the benefit provided by the special regime is equivalent to 0.19 x 0.35, i.e. less than 7% of total initial costs. But on registration, the microenterprise has to start paying taxes. The general sales tax rate is 19%. Income tax, depending on the profit level and the size of the firm, will fluctuate between 5% and 14% of profits, depending
7 The exchange rate in 2006 was 3.15 soles per dollar, and this that can be used to translate the example into soles.
on the special regime applied (RUS or RER),8 which is equivalent to approximately 1.7%-5% of sales. In short, when a microenterprise registers, taxation will raise its total cost by between 21% and 24%, in return for which it will obtain a benefit of less than 7%. Even correcting expected costs and benefits for a likelihood of detection of 33% (assuming a normal statistical distribution) in the event of continuing to evade, it is not worthwhile for the microenterprise to register in the special labour regime, because the benefit provided by it is less than or equal to the costs incurred by doing so. If one adds in the backdated tax debt that the microenterprise could be charged if it is found to have been operating for several years, it is unsurprising that so few microenterprises have registered in the special labour regime.
Tax laws currently provide a special regime for small productive units, consisting of a simplification of collateral requirements —records and account books— and the way in which income tax is calculated (RER and RUS). But the situation in reality suggests that it will be essential to provide a more attractive treatment, at least for a certain period of time, if the aim is to persuade the 700,000 or 800,000 potentially competitive microenterprises to register for tax purposes as part of their formalization process.
It therefore seems essential to establish a tax incentive or credit encouraging firms to formalize, with the aim of persuading microenterprises to register for tax purposes. The Office of the National Superintendent of Taxation (SUNAT) would not lose through this, because today it is not receiving taxes from microenterprises that evade the regulations.
8. Clusters and outsourcing
In practice it is hard for a microenterprise, using its own individual resources, to finance labour and management training, innovations, organizational improvements for competitiveness, market surveys, and similar matters. It is also very difficult to implement a selective policy in favour of potentially competitive microenterprises on a case-by-case basis. Consequently, both from the microenterprise standpoint and for reasons of public policy access, a crucial issue is to promote de facto partnership, i.e. to promote initiatives among microentrepreneurs to form clusters based on the practical needs of their firms. This would make it possible, for example, to set up technical assistance
8 RUS: Single simplified regime; RER: Special income tax regime
C E P A L R E V I E W 9 3 • D E C E M B E R 2 0 0 7
A BooM In A hEtERogEnEous EConoMy. PERu 2002-2006 • noRBERto E. gARCíA
147
services, labour and management training for a group of microenterprises, which would be much more viable and less costly than providing the same services case by case. The same is applicable to credit using cross-collateralization systems.
A similar scheme could be proposed for entry into more demanding markets, outsourcing, input supply for export chains, government procurement or
even export consortia. To improve chances of success, microenterprises can set up clusters enabling them to exploit the consequent economies of scale.
One way to promote partnership is to allow groups, consortia, associations or clusters of microenterprises that join, either on a de facto or legal basis, preferential access to the policies proposed above, thus enhancing their effects.
VConclusions
Over half of the active population, employed in very low-productivity and low-pay segments (urban and rural microenterprises and unskilled self-employed workers) did not enjoy any significant income growth in 2002-2006, even though they could see how the rest of the population was benefiting from the economic boom. This fact, evidenced in this analysis by the behaviour of labour markets in that period, is one of the factors explaining why in 2006 a large proportion of Peruvian voters were willing to abandon a successful economic growth model.
The Peruvian economy is essentially heterogeneous because of major differences in access to resources, which generates segmented product and factor markets. Segmented labour markets in practice operate very differently from what is assumed by economic theory developed for homogeneous markets. In such markets there are numerous obstacles, deficiencies and barriers that intermediate interactions between their various segments. In that setting, the rapid expansion of modern segments and employment and wages in small, medium-sized and large formal enterprises does not spread quickly and fully to urban and rural segments of microenterprises and unskilled self-employed workers, because: (i) rates of employment absorption in these segments remain high, which slows growth in their labour income; and (ii) microenterprises face shortcomings and access barriers in terms of the resources they need to grow competitively.
One of the features of segmented markets is that the process of adjustment in each of the segments, and its speed, differ from one to another. A given policy measure has different effects that make themselves felt at different speeds in each segment.
Economic policy is generally targeted on a country’s modern and structured segments. This is appropriate, for otherwise the country would not develop. But, what happens in situations such as that prevailing in Peru, where the degree of heterogeneity and market segmentation is extremely high? What happens when 70% of the population depends on events occurring in unstructured markets? What happens when employment in small, medium-sized and large firms only accounts for 17% of total employment, and 53% of the latter is in urban and rural microenterprises? Is it sufficient to promote growth in the highest productivity and income segment? Is it sufficient, in this setting, to propose an economic policy for the more modern and structured segments, together with a social policy to combat poverty among those who depend on the functioning of the less structured segments? Events in Peru over the last 30 years tend to confirm that it is not sufficient.
It is insufficient because of the very high proportion of unskilled self-employed jobs, and particularly those in microenterprises. Accordingly, policies to raise productivity should include potentially competitive microenterprises and promote greater access to the resources they need. From this perspective, it is essential to establish, among other policies, a special labour regime for microenterprises (labour standards and minimum wage) and a special transitory taxation regime; to more vigorously promote policies to improve microenterprise access to credit, markets, labour and management training, and innovation; and above all, to encourage the various forms of microenterprise clustering and size subcontracting. Such policies should target the roughly 700,000 potentially competitive microenterprises, and provide their benefits only to those
C E P A L R E V I E W 9 3 • D E C E M B E R 2 0 0 7
A BooM In A hEtERogEnEous EConoMy. PERu 2002-2006 • noRBERto E. gARCíA
148
that agree to “formalize”. As noted above, institutional changes —in labour and tax regulations— complement policies that expand access to resources. Consequently, implementing the former without the latter does not have the same chance of success as implementing both types of measure simultaneously.
Complementarity and interdependence between the policies listed is another reason for developing a set of policies in favour of microenterprises, rather than isolated actions. Thus, for example, without microenterprise management training or access to innovations, productivity growth will remain very slow; so the high microenterprise mortality rate will persist, impairing access to commercial credit. The most important thing, therefore, is to implement a set of policies that gradually but simultaneously eliminate the key constraints.
As a policy criterion, all of the measures set out above should focus on development of the respective markets —including those for training services, information and technical assistance, innovations and financial services— to gradually allow microenterprises
with higher competitive potential a better chance of accessing each of those markets. In this way, government intervention may be much more successful than direct State provision of the services in question.
The real economic policy challenge facing Peru is to design public policy measures that have the desired effect on the specific market segments being targeted. This does not mean that different economic policies have to be designed for different segments.,. It is more a question of incorporating into economic policy a recognition that its effects will differ between one segment and another, so the measures adopted should be able to selectively influence the different segments in the desired direction —e.g. enhancing competitiveness. This is a departure from the traditional conception of economic policy for homogeneous markets and comes closer to the reality of Peru —a heterogeneous economy with segmented markets. In other words, it moves economic policymaking away from an idealized blackboard model, and forces it to take account of the real world.
(Original: Spanish)
Bibliography
ADEX (Asociación de Exportadores) (various years): MYPEs y exportaciones. Available in http://www.adexperu.org.pe.
Chacaltana, J. (2004): La capacitación laboral proporcionada por las empresas: el caso peruano, Lima, Centro de Estudios para el Desarrollo y la Participación (CEDEP).
Population Division (CELADE) (Latin American and Caribbean Demographic Centre (CELADE) – Populatin Division of ECLAC): Estimaciones y proyecciones de población. Available in http://www.eclac.cl/celade/proyecciones
García, N. (2005): Competitividad y mercado laboral. Perú 1990-2004, Macroeconomía del desarrollo series, No. 41, LC/L.2440-P, Santiago, Chile, Economic Comisión for Latin America and
the Caribbean (ECLAC). United Nations publication, Sales No. S.05.II.G.186.
__________ (2007): Acceso a derechos laborales y recursos, preliminary draft, Lima, Ministerio de Trabajo y Promoción del Empleo.
Matthews, J. (2007): MYPE competitiva, Lima, Agencia Andina de Noticias, March.
Ministry of Economic Affaire and Finance (2006): Marco macroeconómico multianual 2007-09, Lima.
MTPE/PEEL (Ministerio de Trabajo y Promoción del Empleo/Programa de Estadísticas y Estudios Laborales) (2007): Base de datos del mercado laboral, Lima.
149
C E P A L R E V I E W 9 3 • D E C E M B E R 2 0 0 7
Pluriactivity and family farming in Brazil:the case of Rio Grande do Sul
Flávio Sacco dos Anjos and Nádia Velleda Caldas
This article analyses the phenomenon of pluriactivity in family farming
in the south of Brazil, based on a research project funded by the Brazilian
National Council for Research and Development. The methodology used
compares farms whose families live exclusively from agriculture, with those
whose social reproduction depends also on non-farm activities or who
practise “pluriactivity”. On the question of ownership succession, we found
that the phenomenon studied here does not alter traditional mechanisms
of succession and inheritance on the family farm. The farms that are most
under threat are those with the lowest incomes, whatever their situation
in terms of pluriactivity; but the latter is not necessarily a feature of the
economically weakest farms.
K E YW O R D S
Agr icu l ture
Smal l fa rms
Fami ly
Act iv i t ies
Rura l deve lopment
Case s tud ies
Agr icu l tura l s ta t i s t ics
Braz i l
Flávio Sacco dos Anjos
Professor, Postgraduate Programme in
Family Farming Systems,
Federal University of Pelotas,
Rio Grande do Sul,
and researcher at the National
Council for Scientific and
Technological Development
(CNPq), Brazil
Nádia Velleda Caldas
CNPq fellowship holder in the
Postgraduate Programme in
Family Farming Systems,
Federal University of Pelotas,
Rio Grande do Sul
IIntroduction
Brazilian social sciences have undergone major thematic renewal over the last decade. New issues have been incorporated into a research agenda that emerges, in particular, from society’s demands and the pressure exerted on the State by organized social groups. The latter include organizations representing agricultural and rural interests (professional associations, unions, cooperatives and others), and those that operate in urban spaces (consumers, ecologists and so forth). By way of synthesis, and to illustrate the thread of the argument pursued in this paper, three broad thematic areas can be identified, forming the new research agenda in the field of agrarian and rural studies: (i) consolidation of the family farm as an analytical category and target of public policy; (ii) incorporation of the principle of sustainability (due to the influence exerted by Brazilian and international organizations that are highly sensitive to the environmental and social problems caused by intensive farming models); and (iii) new rurality studies, which take account of the new dynamics observed in the Brazilian countryside in terms of the occupations
of people living in those zones (pluriactivity, rural non-farm employment, provision of services). These form a complex and heterogeneous social structure in which new social actors are emerging, apart from farmers, who increasingly depend on activities and incomes that have little or nothing to do with farming.
This paper focuses specifically on the third thematic area, and sets out to analyse the prevalence and characteristics of pluriactivity in the region of Rio Grande do Sul (RGS), Brazil’s most southerly state, which is home to one of the country’s most important family farming sectors.1 The article firstly outlines the history of the concept of pluriactivity, and sets forth the methodological framework for the empirical research that underlies it. Secondly, data showing the ways in which pluriactivity is manifested in the Brazilian rural sector are presented and analysed, revealing increasing loss of identity between family and farm. This trend is giving rise to the emergence in Brazil of a completely different scenario than that normally envisaged in the rural world, whether from the academic point of view or from the standpoint of public policy.
1 There are 2,055,157 family farms in the states of northeastern Brazil, compared to 907,635 in the south. Nonetheless, whereas in the former case 52.2% of farms are classified as “almost without income”, the equivalent figure in the southern states is 24.7%, while in Rio Grande do Sul just 21.1% of farms are in this situation. Although the universe of family farm properties is quantitatively much larger in northeastern Brazil than in the southern states, an overwhelming majority undertake subsistence agriculture with little or no market activity. On this point, see “O novo retrato da agricultura familiar”, available at http://200.252.80.30/sade/.
< The research that formed the empirical basis of this article began in 2002 and ended in 2004. It was undertaken with financial support from the Brazilian National Council for Scientific and Technological Development.
II
One of the premises of this article is that both part-time agriculture and pluriactivity are phenomena associated basically with family farming and form part of the survival strategies adopted by small-scale peasant farmers to ensure their families’ social reproduction. Such strategies have been developed through a combination of different activities (farming and non-farming) pursued either on or off the actual farm premises.
Although the two concepts relate to quite similar empirical realities, not only do they differ in their scope and importance, but they also reflect different historical phases of sociological research on agricultural and peasant
C E P A L R E V I E W 9 3 • D E C E M B E R 2 0 0 7
PLuRIACtIVIty AnD fAMILy fARMIng In BRAzIL: thE CAsE of RIo gRAnDE Do suL • fLáVIo sACCo Dos Anjos AnD náDIA VELLEDA CALDAs
151
development and the assessments made by sociologists and agrarian economists on the nature of this process and how it unfolds.2 The link between part-time farming and the industrialization process has often been noted, as broad peasant sectors have entered partially into the industrial and services economy, working part-time on their smallholding and part-time as wage earners in factories or service enterprises within their neighbourhood. All languages have words to refer to what is now a classical concept of the agrarian social landscape (campesino obrero, worker peasant, ouvrier-paysan, arbeiterbauer, operai-contadini, camponês-operário, etc.), thereby reflecting the growing unification of urban and rural labour markets (Etxezarreta, Cruz and others, 1995, p.78). Although there was and still is some controversy over the criteria to be used to define the concept of part-time farming, until the late 1970s and early 1980s most studies clearly saw it as a transition phenomenon (Kolankiewicz, 1979, p.67) that foreshadowed the eventual disappearance of small-scale peasant farms in modern agriculture. It was also interpreted as clear manifestation of the rural exodus process and one of the survival strategies used by peasant families with farms that had not modernized (Naredo, 1996, pp. 180-182; Arnalte, 1980, p.222).
Use of the term “pluriactivity” to identify a phenomenon that is similar to part-time agriculture not only reflected changes in perspective in the debates on agricultural development and the role of family farming, but also signalled a radical change of attitude towards this topic in the academic and political world. In the early 1980s, developed countries, particularly in the European Union, were really moving away from the paradigm of productivist modernization which had guided agrarian and rural thinking since the 1960s, to another (subsequently referred to as the paradigm of multifunctionality) which introduced new criteria for upgrading rural areas, redefining the function and status of agriculture within them, and giving direction to the new agrarian policies. These criteria highlighted the importance of crop and livestock activity for the territorial balance and dynamism of rural zones, in addition to the conservation of natural resources (Hervieu, 1996; Moyano, 1997). The changes were reflected both in the academic domain (Fuller, 1984 and 1990) and in key documents issued by the European Commission, such as the green paper entitled Perspectives for the
2 This conceptual transition has been expertly analysed by Fuller (1990).
Common Agricultural Policy or The Future of Rural Society (European Commission, 1985 and 1988). The corresponding climate of change elicited a far-reaching review of the treatment that part-time agriculture had received until then; and this intellectual and political course-correction adopted the new term “pluriactivity”. Thereafter, not only would the diversification of farmers’ activities and incomes (both on and off the farm) be recognized as an unquestionable phenomenon in European agriculture, but it would also be seen as a positive factor for rural development, as reflected in the Leader Initiative in the European Union and, more recently, in the new rural regulations that establish a single instrument for funding rural development policy in the European Union, namely the European Agricultural Fund for Rural Development (EAFRD).
From the analytical standpoint, conceptual change was equally important in the transition between the notion of part-time agriculture and that of pluriactivity. Studies on the first of these concepts, developed especially in member countries of the Organisation for Economic Co-operation and Development (OECD), classified the socio-employment status of farm owners in terms of the time they spent on agricultural tasks on their own farms. Based on this criterion, situations of full-time agriculture were compared with part-time farming, without considering the employment activity of other family members. It should be noted that the negative perception of part-time farming also permeated the labour-union and political world during the golden age of productivist modernization, thus revealing the antipathy towards it that was cultivated by the most influential union organizations in the European Economic Community (EEC), and the scant attention paid to it in institutions where the directions of European agricultural policy were being debated.
The emergence of pluriactivity coincides with an abandonment of the “work time”, criterion to classify farms.3 Moreover, as noted by Etxezarreta, Cruz and others (1995, p.416), the phenomenon is not only based on the activities of the farm owner alone, but encompasses all family members. It is no longer a question of measuring just stable and regular jobs, but labour activities of all types with the aim of ensuring remuneration for them. Whereas until the early 1980s, part-time agricultural work was treated with disdain, in subsequent decades, given the crisis of agricultural surpluses, pluriactivity
3 This definition suffered from classification difficulties and gave rise to a major international debate (see OECD, 1978).
C E P A L R E V I E W 9 3 • D E C E M B E R 2 0 0 7
PLuRIACtIVIty AnD fAMILy fARMIng In BRAzIL: thE CAsE of RIo gRAnDE Do suL • fLáVIo sACCo Dos Anjos AnD náDIA VELLEDA CALDAs
152
has been encouraged by providing incentives to the role of farmer-entrepreneur for the purpose of diversifying income sources (both agrarian and non-agrarian).
Nonetheless, most academic efforts to analyse this phenomenon have taken place in developed countries. Although there have been a number of pioneering studies in Africa and Latin America, such as those of Christodoulou (1982) and Okafor (1982), cited in Cavazzani and Fuller (1982), there has been little research on this issue from the standpoint of developing countries.
The search for work off the farm was seen as an unquestionable sign of the precarious nature of peasant life in Mexico (Stavenhagen, 1981, p.194) and in Latin America generally, i.e. as synonymous with “de-peasantization”. The role of complementary income sources has been analysed in other studies, such as Szekely (1977), as a response by communities to their predicted physical demise. The famous debate between “peasantists” and “de-peasantists” (Feder, 1981) concealed very different positions from those that would later place a higher value on the nature of the processes affecting family modes of production,4 i.e. pluriactivity.
In the first few years of the new millennium, several studies have appeared on rural non-farm employment, such as the work coordinated by Reardon, Berdegué
4 This perspective can also be seen in the classic study by Warman (1985) on what was then referred to as “off-farm incomes”.
and Escobar (2001), which analyses the importance of non-farm employment and income earned from non-agricultural activities in selected Latin American countries (Brazil, Chile, Colombia, Ecuador, El Salvador, Honduras, Mexico, Nicaragua and Peru).
In the case of Brazil, studies on part-time agriculture and pluriactivity have started to appear only very recently,5 with most research focusing on the southern region of the country (Rio Grande do Sul, Santa Catarina, Paraná) where this phenomenon is gaining considerable strength.
A major project in this field is Projeto Rurbano, which began in 1997 and is currently the most significant effort being made to analyse the trend of non-farm employment in Brazil.6 Nonetheless, an increase in the proportion of the population working in non-agricultural activities does not necessarily mean a rise in pluriactivity, although the combination of labour activities within families is not always clearly identified.
Before measuring the importance of pluriactivity, and with a view to identifying the elements that explain its characteristics in RGS, the next section will describe the methodological framework of the research that formed the empirical basis of this article.
5 On the topic of pluriactivity in Brazil, see Sacco dos Anjos (2001).6 The characteristics of the project and the materials produced can be consulted on the website: http://www.eco.inicamp.br/nea/rurbano/rur-bapre.html. See, Graziano da Silva (1999) among others.
IIIthe theoretical and methodological
framework ofthe research
This research studied how rural families adapt to changes in the different zones of RGS, and analysed the dynamic within which family farms operate under the economic, social, political and cultural forces impinging on them. Our research aimed firstly to analyse the importance of pluriactivity among the strategies of rural families in RGS; and secondly to understand the various ways in which the phenomenon appears as a response to the external setting and the opportunities this provides them. Two forms of pluriactivity therefore need to be distinguished: agrarian and non-agrarian.
Agrarian pluriactivity occurs in economic settings offering very few job opportunities outside the agricultural sector, so crop growing or livestock activities are almost the only income sources available to rural families; and farming basically sustains the dynamic of local development. In such contexts, small-scale farmers and their family members alternate activities on their own farm with work on other properties, either as wage
C E P A L R E V I E W 9 3 • D E C E M B E R 2 0 0 7
PLuRIACtIVIty AnD fAMILy fARMIng In BRAzIL: thE CAsE of RIo gRAnDE Do suL • fLáVIo sACCo Dos Anjos AnD náDIA VELLEDA CALDAs
153
earners or on a self-employed basis. In one variant of this type of agrarian pluriactivity, small-scale farmers and their families diversify their activities without leaving their farms, by exploiting the natural resources in their surroundings and adding new value to crops and livestock products obtained on their properties. This category is similar to what Gasson (1986) calls farm-based enterprises. An example of this variant would be a family that makes sausages, prepared foods or dairy products from produce obtained on their farm, to earn supplementary incomes. Pluriactivity does not include farms in which such complementary activities are intended for the family’s own consumption alone.
The second type of pluriactivity is non-agrarian and is associated with the unification of labour markets (agricultural and non-agricultural, rural and urban). This type includes situations in which members of rural families work on a regular and stable basis in firms (commerce, industry and services) located in the surrounding rural area or in urban zones relatively nearby. In this second case, pluriactivity is practised by family members and the incomes earned from such non-farming activities are used to finance the joint family project, rather than the individual projects of each of its members.
In this study, although family farms in RGS could have been analysed using a random sample covering the entire area of the state, it was decided to give priority to zones in which family farming is the predominant production model. Accordingly, four study zones were chosen, the south, northeast, northwest and north of the state; and a representative municipality was selected7 for each one (the exploratory phase of the research had previously revealed the number and location of family
7 The municipalities were chosen not only on the basis of the re-searchers’ prior knowledge of the conditions under which the family farming dynamic operates, to be representative of the reality of the zone with which they are associated, but also by ensuring a similar total number of farms to those in other municipalities (roughly 700 - 800 family farms).
farms in each municipality). Based on this information, we adopted the methodological strategy of “systematic sampling by community”, selecting at least 10% of all farms in each municipality. This essentially meant choosing a sample that covered the broad range of situations in which family farming is practised in southern Brazil. Large farms were eliminated from the sample (in this region those larger than 70 ha), along with farms in which the amount of labour hired (either temporary or permanent) to undertake the productive processes on the farm itself outweighed that provided by the family’s own labour force, taking the 2001/2002 agricultural season as a reference. Also excluded from the sample were so-called “chácaras” (small weekend chalets) and properties devoted exclusively to tourism or uses other than crop and livestock production.
The four study zones contain roughly 2,500 farms in all. From this universe we drew a sample of 238 family farms, which were subjected to a questionnaire containing closed-response questions. The replies was entered into a database which was then processed using a Statistical Package for the Social Sciences (SPSS) program containing some 1,200 variables. The methodological design aimed to gather data on farmers’ motivations, their expectations for the future, their social claims concerning the rural world and their opinions on the current state of agriculture. This study classified as “exclusively agricultural” any family in which all working-age members devote their entire activity to the farm’s production. The mere fact that a single person in the family group combines a non-agricultural activity simultaneously with work on the farm was sufficient for the family to be classified as pluriactive.
IVApproach to family farming in Rio grande do sul
Rio Grande do Sul is the most southerly state in Brazil, with a land area equivalent to about 56% of the area of Spain. To the northwest it borders with Argentina and to the southeast with Uruguay. The most recent population
census conducted in 2000 (IBGE, 2001) recorded a total population of 10.18 million, of whom just 18.3% were living in rural areas. While RGS accounts for 3.3% of national territory, its contribution to national wealth is much greater, since it is ranked third in terms of exports among the 26 states comprising the Federative Republic of Brazil. The state’s current export basket includes not only agricultural products (meat, cereals, fruit and oilseeds), but also industrial products such as footwear, automobiles, buses and others.
C E P A L R E V I E W 9 3 • D E C E M B E R 2 0 0 7
PLuRIACtIVIty AnD fAMILy fARMIng In BRAzIL: thE CAsE of RIo gRAnDE Do suL • fLáVIo sACCo Dos Anjos AnD náDIA VELLEDA CALDAs
154
For the purposes of the argument put forward in this article, it is interesting to note that RGS is home to one of the most important family farming sectors in Brazil, not only in terms of its quantitative significance, but also because of its economic and political weight compared to the other Brazilian states. Analysts generally agree that this development model has its roots in the flourishing of “colonial agriculture” (implemented by European colonists) and the resultant capital accumulation process — a phenomenon in which immigrant technical knowledge played a decisive role. The first three decades of the twentieth century coincided with the boom of this economic and social system, which later was profoundly altered by the green revolution and, in particular, the “conservative modernization” process implemented by Brazil’s military governments between 1965 and 1980.8 The scope of these changes seems to be closely related to the expansion of soybean cultivation, which today is the leading crop grown in RGS, in terms of both area cultivated and total output. In fact a majority of national soybean production is obtained there: every year about 3,000,000 ha are cultivated, generating roughly 6 million tons (20% of national production).
There are 429,958 farms in RGS, 92% of which are smaller than 100 ha, occupying 32% of the total agricultural area. Farms of under 50 ha produce 52.28% of the total value of the state’s agricultural output (61.51% of animal production and 46.71% of plant production). The share of large farms is growing only in activities such as extensive livestock breeding or grain production (rice and wheat), although soybeans are cultivated on both small and large farms.
8 Classifying this modernization process as “conservative” reflects the fact that it has served to maintain a highly concentrated agrarian structure, with no measures to redistribute land ownership. This has triggered an unprecedented rural exodus, a bias towards export crops (dominant among the large farms), and promotion of income and resource transfers to the urban-industrial sector. Woortmann (1999) attributes part of the process of change and the economic and survival problems faced by family farming to the exhaustion of possibilities for expanding the agricultural frontier, instead of (or as well as) conservative modernization, with the departure of family members who became “superfluous”, and a downsizing of farm areas through subdivisions caused by inheritance.
Nonetheless, for many years now, decisive changes have been unfolding in Brazilian agriculture, particularly in the southern states, following the intensification of the agro-export model and other related factors. In fact, as noted by Belik (1997), a new pattern of state intervention in agriculture has been introduced in Brazil since the mid-1980s. Among other things, this has transferred to markets the task of regulating agricultural prices, with a sharp withdrawal of state protection mechanisms against a backdrop of increasingly open trading arrangements and liberalization of agricultural imports. The specific and immediate result of this new intervention model has been a substantial reduction in the land area devoted to major crops (particularly rice, maize, wheat and cotton), together with a reduction in agricultural incomes and a sharp decline in the number of active farms.
Trade liberalization and successive multilateral agreements have merely exposed the Brazilian productive sector to international competition. Paradoxically, the decline in the area cultivated —especially visible in the southern states— has coincided with an increase in agricultural output, particularly in the so-called dynamic crops (i.e. those destined for export or import substitution). A “professionalization in agriculture” process has become well established, which exerts increasing pressure to achieve constant productivity increases, without this generating higher incomes: in fact the contrary. The current situation further deepens the productivist dynamic, insofar as this is possible, particularly as a result of the recent overvaluation of the national currency (the real) which is causing a sharp decline in agricultural incomes.
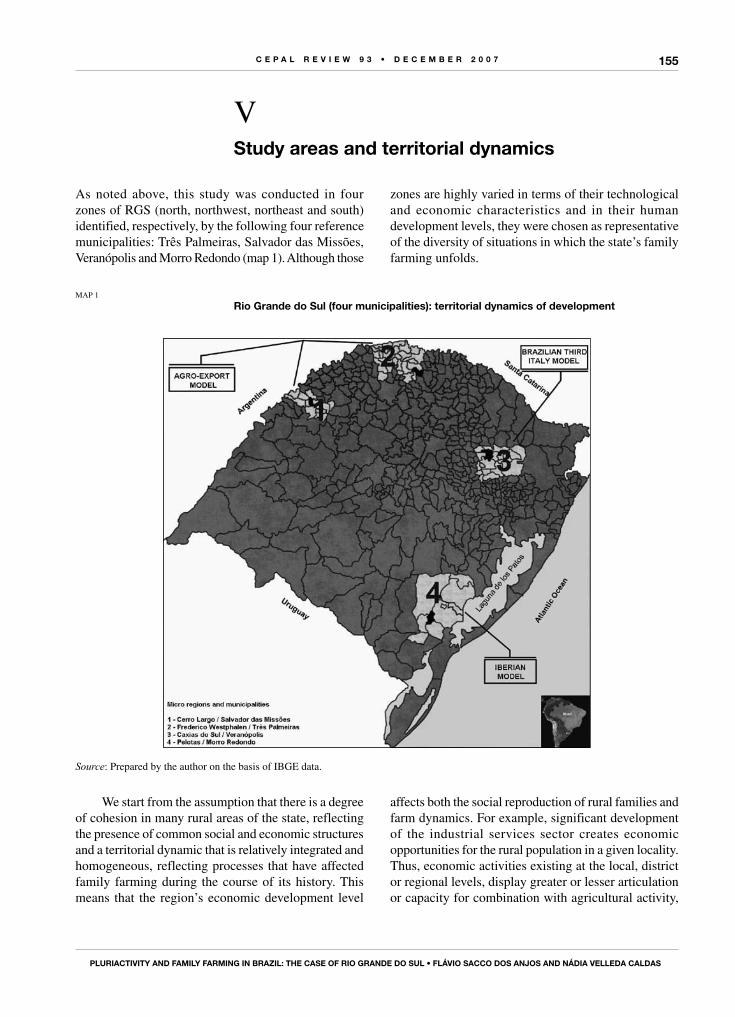
C E P A L R E V I E W 9 3 • D E C E M B E R 2 0 0 7
PLuRIACtIVIty AnD fAMILy fARMIng In BRAzIL: thE CAsE of RIo gRAnDE Do suL • fLáVIo sACCo Dos Anjos AnD náDIA VELLEDA CALDAs
155
As noted above, this study was conducted in four zones of RGS (north, northwest, northeast and south) identified, respectively, by the following four reference municipalities: Três Palmeiras, Salvador das Missões, Veranópolis and Morro Redondo (map 1). Although those
zones are highly varied in terms of their technological and economic characteristics and in their human development levels, they were chosen as representative of the diversity of situations in which the state’s family farming unfolds.
Vstudy areas and territorial dynamics
MAP 1
Rio grande do sul (four municipalities): territorial dynamics of development
Source: Prepared by the author on the basis of IBGE data.
We start from the assumption that there is a degree of cohesion in many rural areas of the state, reflecting the presence of common social and economic structures and a territorial dynamic that is relatively integrated and homogeneous, reflecting processes that have affected family farming during the course of its history. This means that the region’s economic development level
affects both the social reproduction of rural families and farm dynamics. For example, significant development of the industrial services sector creates economic opportunities for the rural population in a given locality. Thus, economic activities existing at the local, district or regional levels, display greater or lesser articulation or capacity for combination with agricultural activity,
C E P A L R E V I E W 9 3 • D E C E M B E R 2 0 0 7
PLuRIACtIVIty AnD fAMILy fARMIng In BRAzIL: thE CAsE of RIo gRAnDE Do suL • fLáVIo sACCo Dos Anjos AnD náDIA VELLEDA CALDAs
156
which, in the end, will influence how pluriactivity is (or could be) manifested in each study zone.
The four areas selected are not necessarily administratively defined zones, however, but have been identified specifically for this study, given our interest in the processes they have undergone or their organizational forms. Each of these areas is subject to the effects of a given “territorial development dynamic”, which reflects the way the region in question has historically participated in the broader setting, either through its physical, political and institutional conditions, or through the structure of opportunities it provides to the active population living there. It should be noted that a territorial dynamic is not exclusive from the standpoint of its effect in a given geographic space, and it could affect other zones that have not been included in this research. The term “territorial development dynamic” is understood to mean the macro-processes that affect the zone in question and, among other things, define the character of socio-productive relations, resource allocation, and producers’ expectations for the future. Below we describe the characteristics defining territorial development dynamics in the four study areas, identifying their most salient features.
1. the agro-export model
The defining feature of this dynamic is the key role played by agricultural commodities (particularly soybeans and wheat) in the development and sustenance of economic activities. The social and productive fabric is entirely dependent on the trend of these crops, such that in years of climatic disaster or low international prices, the regional economy is profoundly affected. Although soybean cultivation occurs almost throughout RGS, it is undoubtedly much more prevalent in the north-northeastern part of the state, including areas such as Missões and Alto Uruguay. The soybean boom (1965-1980) led to a number of changes, including an intensification of the commercialization process in rural areas. This meant that all available spaces were turned into an almost exclusive substrate for the production of these commodities. The globalization process has merely accentuated this trend in the state’s rural areas, with the result that the productive fabric is specialized and the labour market has less and less capacity to absorb local workers, thus generating intensive migration towards other areas of the state, either permanently or temporarily. The traditional model involving a combination of crop growing and livestock activities has been replaced by specialization, with results that include increased vulnerability in the regional
economies, concentration of land use and repeated job loss, since soybean cultivation uses little labour.
The pluriactivity that emerges in localities subject to this agro-export model, is closely linked to the dynamic of agrarian processes and corresponds to the agrarian pluriactivity category as described in the introduction to this article. The research detected two broad modes of agricultural pluriactivity. Firstly, that based on para-agricultural activities, i.e. practices involving the manufacture or transformation of agricultural produce on the farm itself (cheeses, sausages, processed foods, etc). We encountered that type of pluriactivity in Salvador das Missões (study area corresponding to the northwest of RGS, which reflects a feature of German colonization that has been relatively well preserved, despite the aforementioned impact of the spread of soybean cultivation (soya-ization).
The second type of agrarian pluriactivity is exemplified by the situation of medium-scale farm owners who may provide services on other farms. One modality is “contract work”, i.e. the hiring of another farmer’s services (on an hourly, daily or task basis), together with the machinery and equipment needed to undertake specific tasks (ploughing, harvesting and so forth). This type of pluriactivity reflects farmers’ efforts to make profitable use of their specialized machinery, and thus diversify their income. Sometimes farm owners and/or members of small-scale family farms work for other producers as temporary wage-earners. Each of these forms of pluriactivity has been found both in the north and in the northwest of Rio Grande do Sul, and reflect the adaptation capacity of family farming, particularly in areas affected by the expansion of commodities noted above. In keeping with the classic premise of Chayanov (1974), family farming strategies display a lot of flexibility in their use of available family labour, such that its productivity and economic return can be raised significantly by distributing the overall work force between agrarian and non-agrarian occupations throughout the year. Nonetheless, there is a paradox in family farming situations, because we find quite often that the roles of contractor and contracted party are reversed.
2. the Brazilian third Italy model
The so-called Brazilian Third Italy (the serra gaúcha)9 corresponds to a region in the northeast of RGS which is strongly influenced by Italian colonization. The productive
9 People and places in the state of Rio Grande do Sul are known as gaúchos.
C E P A L R E V I E W 9 3 • D E C E M B E R 2 0 0 7
PLuRIACtIVIty AnD fAMILy fARMIng In BRAzIL: thE CAsE of RIo gRAnDE Do suL • fLáVIo sACCo Dos Anjos AnD náDIA VELLEDA CALDAs
157
fabric is highly diversified, and social indicators show that the municipalities comprising it have the best development levels in the whole country. This is one of the most important national tourist destinations and includes municipalities that are important for wine production. There are many industries in the region, particularly metallurgy, footwear and agrifood. Agriculture includes poultry and wine production, in addition to pig breeding and fruit and vegetable growing. Output is marketed just 120 km away in the metropolitan region of Porto Alegre, the state capital. As a result, the labour market has considerable capacity to absorb local labour; and this is reflected in a heavy presence of peasant workers, i.e. a type of worker who combines family farming with work in local industries. This type of pluriactivity entails a form of employment relation that reflects the unification of the urban-rural labour market and is typical of non-agrarian pluriactivity. Nonetheless, this is where we find a strong presence of the fundamental features defined in the specialized literature as the “colonist ethos” - identified with the “myth of peasant autonomy”, in which certain family practices are preserved to guarantee abundant and self-sufficient food. Despite steeply sloping cultivated areas and the small size of farms, this zone of the study is where the highest incomes have been found among the four territories analysed, as a result of the highly diversified productive structure noted earlier.
3. the Iberian model: an eclipsed family farming
The southern part of the state of Rio Grande do Sul is closely identified with large estates (latifundios), engaging in extensive livestock breeding and irrigated rice production, over a wide ranging plane that stretches from the eastern portion of the state to the border with Uruguay. In the second half of the nineteenth century particularly, German, Italian and French immigrant
families settled in the small mountainous region that extends across eight municipalities to form the zone called Serra dos Tapes. Specifically, this is a type of family farming enclave in an area in which estate-based or business agriculture holds sway. Family farms represent a sector of gaúcha agriculture which enjoyed a period of relative economic prosperity until the 1970s producing peaches, asparagus, tomatoes and milk, and was well integrated into the region’s agrifood industries. Since then, however, economic liberalization and competition from other MERCOSUR countries have pushed it into a profound crisis. The declining importance of these family-based farming operations seems to be matched by a decrease in farming incomes, the disappearance of many farms and expansion of other crops such as tobacco in a system of vertical integration with transnational enterprises.
The term we have used to define this territorial development dynamic (eclipsed family farming) refers to the obstacles that family farms have historically faced in attempting to become the predominant form of production at the local and regional level. Family farming today has fewer alternatives for increasing its participants’ income in a context of market liberalization and economic deregulation; and social transfers are becoming increasingly important as a means of providing families with material sustenance. Given the scant productive diversification and considerable weight of extensive activities and crops (livestock breeding and rice growing), the regional labour market has very little capacity to absorb the local work force throughout the year. Unlike what happens in other parts of the state, family production in this zone has never managed to develop a specific place in the social structure in keeping with its demands and interests.
Having set out the aim and conceptual framework of the research, we now review the results that directed our thinking on pluriactivity and its manifestations in Rio Grande do Sul.
VIPluriactivity and family farming
in southern Brazil
In this research we decided to adopt a broad definition of pluriactivity, considering any rural family as pluriactive if it directly operates and manages a farm with its own labour, but not all of its working-age members devote their
entire productive potential to farming activities. Viewed in this way, pluriactivity is not defined exclusively by the activities of the farm owner, but takes account of the type of activity undertaken by all family members.
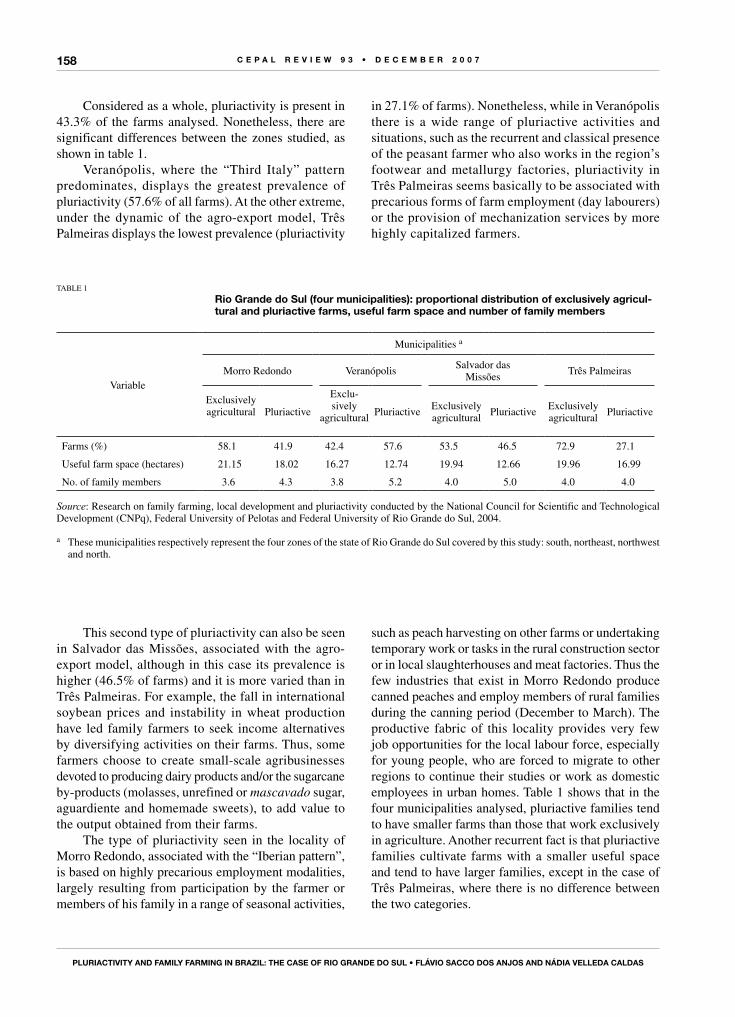
C E P A L R E V I E W 9 3 • D E C E M B E R 2 0 0 7
PLuRIACtIVIty AnD fAMILy fARMIng In BRAzIL: thE CAsE of RIo gRAnDE Do suL • fLáVIo sACCo Dos Anjos AnD náDIA VELLEDA CALDAs
158
Considered as a whole, pluriactivity is present in 43.3% of the farms analysed. Nonetheless, there are significant differences between the zones studied, as shown in table 1.
Veranópolis, where the “Third Italy” pattern predominates, displays the greatest prevalence of pluriactivity (57.6% of all farms). At the other extreme, under the dynamic of the agro-export model, Três Palmeiras displays the lowest prevalence (pluriactivity
in 27.1% of farms). Nonetheless, while in Veranópolis there is a wide range of pluriactive activities and situations, such as the recurrent and classical presence of the peasant farmer who also works in the region’s footwear and metallurgy factories, pluriactivity in Três Palmeiras seems basically to be associated with precarious forms of farm employment (day labourers) or the provision of mechanization services by more highly capitalized farmers.
This second type of pluriactivity can also be seen in Salvador das Missões, associated with the agro-export model, although in this case its prevalence is higher (46.5% of farms) and it is more varied than in Três Palmeiras. For example, the fall in international soybean prices and instability in wheat production have led family farmers to seek income alternatives by diversifying activities on their farms. Thus, some farmers choose to create small-scale agribusinesses devoted to producing dairy products and/or the sugarcane by-products (molasses, unrefined or mascavado sugar, aguardiente and homemade sweets), to add value to the output obtained from their farms.
The type of pluriactivity seen in the locality of Morro Redondo, associated with the “Iberian pattern”, is based on highly precarious employment modalities, largely resulting from participation by the farmer or members of his family in a range of seasonal activities,
such as peach harvesting on other farms or undertaking temporary work or tasks in the rural construction sector or in local slaughterhouses and meat factories. Thus the few industries that exist in Morro Redondo produce canned peaches and employ members of rural families during the canning period (December to March). The productive fabric of this locality provides very few job opportunities for the local labour force, especially for young people, who are forced to migrate to other regions to continue their studies or work as domestic employees in urban homes. Table 1 shows that in the four municipalities analysed, pluriactive families tend to have smaller farms than those that work exclusively in agriculture. Another recurrent fact is that pluriactive families cultivate farms with a smaller useful space and tend to have larger families, except in the case of Três Palmeiras, where there is no difference between the two categories.
TABLE 1
Rio grande do sul (four municipalities): proportional distribution of exclusively agricul-tural and pluriactive farms, useful farm space and number of family members
Variable
Municipalities a
Morro Redondo Veranópolis Salvador das Missões Três Palmeiras
Exclusively agricultural Pluri active
Exclu-sively
agricultural Pluri active Exclusively agricultural Pluri active Exclusively
agricultural Pluri active
Farms (%) 58.1 41.9 42.4 57.6 53.5 46.5 72.9 27.1
Useful farm space (hectares) 21.15 18.02 16.27 12.74 19.94 12.66 19.96 16.99
No. of family members 3.6 4.3 3.8 5.2 4.0 5.0 4.0 4.0
Source: Research on family farming, local development and pluriactivity conducted by the National Council for Scientific and Technological Development (CNPq), Federal University of Pelotas and Federal University of Rio Grande do Sul, 2004.
a These municipalities respectively represent the four zones of the state of Rio Grande do Sul covered by this study: south, northeast, northwest and north.
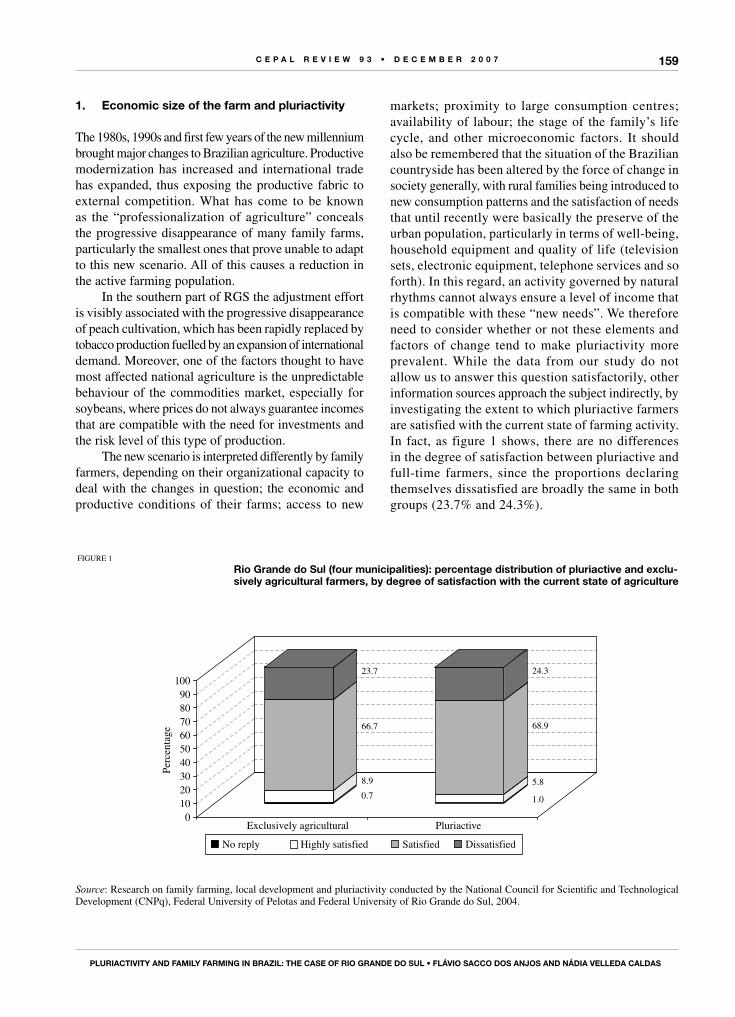
C E P A L R E V I E W 9 3 • D E C E M B E R 2 0 0 7
PLuRIACtIVIty AnD fAMILy fARMIng In BRAzIL: thE CAsE of RIo gRAnDE Do suL • fLáVIo sACCo Dos Anjos AnD náDIA VELLEDA CALDAs
159
1. Economic size of the farm and pluriactivity
The 1980s, 1990s and first few years of the new millennium brought major changes to Brazilian agriculture. Productive modernization has increased and international trade has expanded, thus exposing the productive fabric to external competition. What has come to be known as the “professionalization of agriculture” conceals the progressive disappearance of many family farms, particularly the smallest ones that prove unable to adapt to this new scenario. All of this causes a reduction in the active farming population.
In the southern part of RGS the adjustment effort is visibly associated with the progressive disappearance of peach cultivation, which has been rapidly replaced by tobacco production fuelled by an expansion of international demand. Moreover, one of the factors thought to have most affected national agriculture is the unpredictable behaviour of the commodities market, especially for soybeans, where prices do not always guarantee incomes that are compatible with the need for investments and the risk level of this type of production.
The new scenario is interpreted differently by family farmers, depending on their organizational capacity to deal with the changes in question; the economic and productive conditions of their farms; access to new
markets; proximity to large consumption centres; availability of labour; the stage of the family’s life cycle, and other microeconomic factors. It should also be remembered that the situation of the Brazilian countryside has been altered by the force of change in society generally, with rural families being introduced to new consumption patterns and the satisfaction of needs that until recently were basically the preserve of the urban population, particularly in terms of well-being, household equipment and quality of life (television sets, electronic equipment, telephone services and so forth). In this regard, an activity governed by natural rhythms cannot always ensure a level of income that is compatible with these “new needs”. We therefore need to consider whether or not these elements and factors of change tend to make pluriactivity more prevalent. While the data from our study do not allow us to answer this question satisfactorily, other information sources approach the subject indirectly, by investigating the extent to which pluriactive farmers are satisfied with the current state of farming activity. In fact, as figure 1 shows, there are no differences in the degree of satisfaction between pluriactive and full-time farmers, since the proportions declaring themselves dissatisfied are broadly the same in both groups (23.7% and 24.3%).
0.78.9
66.7
23.7
1.0
5.8
68.9
24.3
0102030405060708090
100
Exclusively agricultural
Perc
enta
ge
Pluriactive
No reply Highly satisfied Satisfied Dissatisfied
FIGURE 1
Rio grande do sul (four municipalities): percentage distribution of pluriactive and exclu-sively agricultural farmers, by degree of satisfaction with the current state of agriculture
Source: Research on family farming, local development and pluriactivity conducted by the National Council for Scientific and Technological Development (CNPq), Federal University of Pelotas and Federal University of Rio Grande do Sul, 2004.
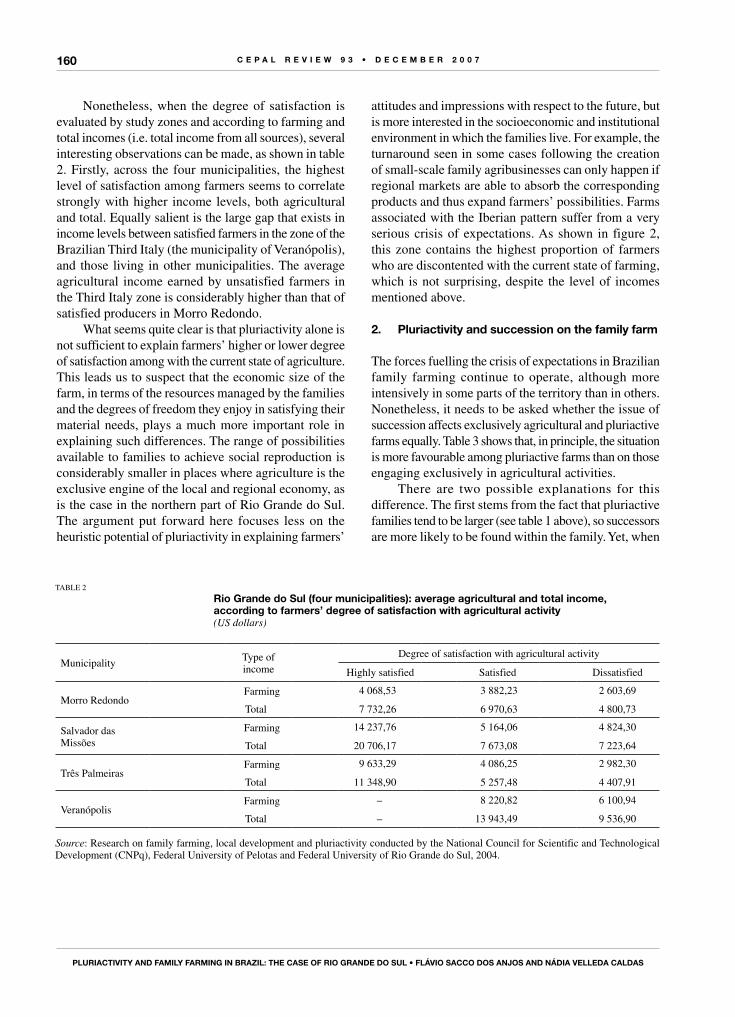
C E P A L R E V I E W 9 3 • D E C E M B E R 2 0 0 7
PLuRIACtIVIty AnD fAMILy fARMIng In BRAzIL: thE CAsE of RIo gRAnDE Do suL • fLáVIo sACCo Dos Anjos AnD náDIA VELLEDA CALDAs
160
Nonetheless, when the degree of satisfaction is evaluated by study zones and according to farming and total incomes (i.e. total income from all sources), several interesting observations can be made, as shown in table 2. Firstly, across the four municipalities, the highest level of satisfaction among farmers seems to correlate strongly with higher income levels, both agricultural and total. Equally salient is the large gap that exists in income levels between satisfied farmers in the zone of the Brazilian Third Italy (the municipality of Veranópolis), and those living in other municipalities. The average agricultural income earned by unsatisfied farmers in the Third Italy zone is considerably higher than that of satisfied producers in Morro Redondo.
What seems quite clear is that pluriactivity alone is not sufficient to explain farmers’ higher or lower degree of satisfaction among with the current state of agriculture. This leads us to suspect that the economic size of the farm, in terms of the resources managed by the families and the degrees of freedom they enjoy in satisfying their material needs, plays a much more important role in explaining such differences. The range of possibilities available to families to achieve social reproduction is considerably smaller in places where agriculture is the exclusive engine of the local and regional economy, as is the case in the northern part of Rio Grande do Sul. The argument put forward here focuses less on the heuristic potential of pluriactivity in explaining farmers’
attitudes and impressions with respect to the future, but is more interested in the socioeconomic and institutional environment in which the families live. For example, the turnaround seen in some cases following the creation of small-scale family agribusinesses can only happen if regional markets are able to absorb the corresponding products and thus expand farmers’ possibilities. Farms associated with the Iberian pattern suffer from a very serious crisis of expectations. As shown in figure 2, this zone contains the highest proportion of farmers who are discontented with the current state of farming, which is not surprising, despite the level of incomes mentioned above.
2. Pluriactivity and succession on the family farm
The forces fuelling the crisis of expectations in Brazilian family farming continue to operate, although more intensively in some parts of the territory than in others. Nonetheless, it needs to be asked whether the issue of succession affects exclusively agricultural and pluriactive farms equally. Table 3 shows that, in principle, the situation is more favourable among pluriactive farms than on those engaging exclusively in agricultural activities.
There are two possible explanations for this difference. The first stems from the fact that pluriactive families tend to be larger (see table 1 above), so successors are more likely to be found within the family. Yet, when
TABLE 2
Rio grande do sul (four municipalities): average agricultural and total income, according to farmers’ degree of satisfaction with agricultural activity (US dollars)
Municipality Type of income
Degree of satisfaction with agricultural activity
Highly satisfied Satisfied Dissatisfied
Morro RedondoFarming 4 068,53 3 882,23 2 603,69
Total 7 732,26 6 970,63 4 800,73
Salvador das Missões
Farming 14 237,76 5 164,06 4 824,30
Total 20 706,17 7 673,08 7 223,64
Três PalmeirasFarming 9 633,29 4 086,25 2 982,30
Total 11 348,90 5 257,48 4 407,91
VeranópolisFarming – 8 220,82 6 100,94
Total – 13 943,49 9 536,90
Source: Research on family farming, local development and pluriactivity conducted by the National Council for Scientific and Technological Development (CNPq), Federal University of Pelotas and Federal University of Rio Grande do Sul, 2004.
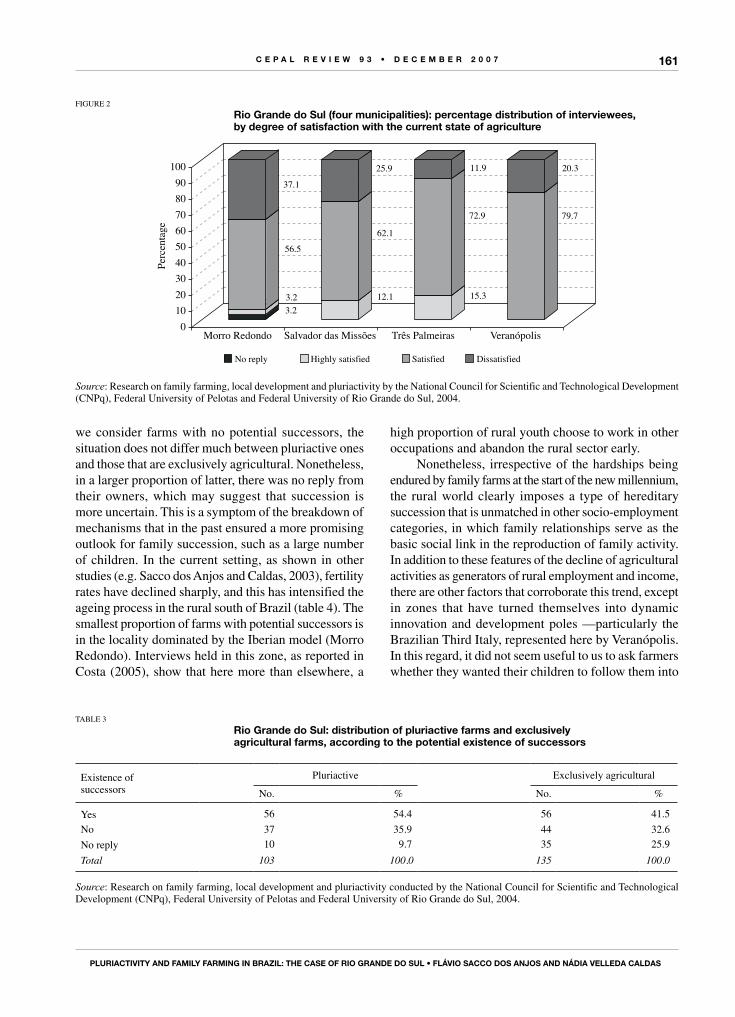
C E P A L R E V I E W 9 3 • D E C E M B E R 2 0 0 7
PLuRIACtIVIty AnD fAMILy fARMIng In BRAzIL: thE CAsE of RIo gRAnDE Do suL • fLáVIo sACCo Dos Anjos AnD náDIA VELLEDA CALDAs
161
we consider farms with no potential successors, the situation does not differ much between pluriactive ones and those that are exclusively agricultural. Nonetheless, in a larger proportion of latter, there was no reply from their owners, which may suggest that succession is more uncertain. This is a symptom of the breakdown of mechanisms that in the past ensured a more promising outlook for family succession, such as a large number of children. In the current setting, as shown in other studies (e.g. Sacco dos Anjos and Caldas, 2003), fertility rates have declined sharply, and this has intensified the ageing process in the rural south of Brazil (table 4). The smallest proportion of farms with potential successors is in the locality dominated by the Iberian model (Morro Redondo). Interviews held in this zone, as reported in Costa (2005), show that here more than elsewhere, a
high proportion of rural youth choose to work in other occupations and abandon the rural sector early.
Nonetheless, irrespective of the hardships being endured by family farms at the start of the new millennium, the rural world clearly imposes a type of hereditary succession that is unmatched in other socio-employment categories, in which family relationships serve as the basic social link in the reproduction of family activity. In addition to these features of the decline of agricultural activities as generators of rural employment and income, there are other factors that corroborate this trend, except in zones that have turned themselves into dynamic innovation and development poles —particularly the Brazilian Third Italy, represented here by Veranópolis. In this regard, it did not seem useful to us to ask farmers whether they wanted their children to follow them into
FIGURE 2
Rio grande do sul (four municipalities): percentage distribution of interviewees, by degree of satisfaction with the current state of agriculture
3.23.2
56.5
37.1
12.1
62.1
25.9
15.3
72.9
11.9
79.7
20.3
0102030405060708090
100
Morro Redondo
Perc
enta
ge
Salvador das Missões Três Palmeiras Veranópolis
No reply Highly satisfied Satisfied Dissatisfied
Source: Research on family farming, local development and pluriactivity by the National Council for Scientific and Technological Development (CNPq), Federal University of Pelotas and Federal University of Rio Grande do Sul, 2004.
TABLE 3
Rio grande do sul: distribution of pluriactive farms and exclusively agricultural farms, according to the potential existence of successors
Existence of successors
Pluriactive Exclusively agricultural
No. % No. %
Yes 56 54.4 56 41.5
No 37 35.9 44 32.6
No reply 10 9.7 35 25.9
Total 103 100.0 135 100.0
Source: Research on family farming, local development and pluriactivity conducted by the National Council for Scientific and Technological Development (CNPq), Federal University of Pelotas and Federal University of Rio Grande do Sul, 2004.
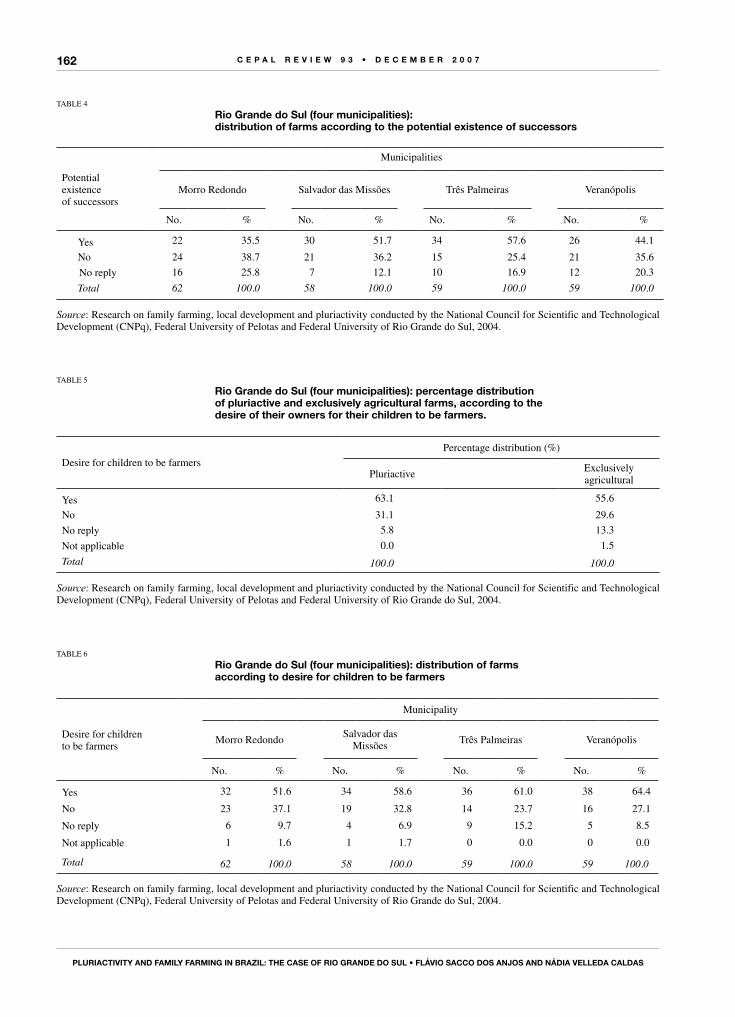
C E P A L R E V I E W 9 3 • D E C E M B E R 2 0 0 7
PLuRIACtIVIty AnD fAMILy fARMIng In BRAzIL: thE CAsE of RIo gRAnDE Do suL • fLáVIo sACCo Dos Anjos AnD náDIA VELLEDA CALDAs
162
TABLE 4
Rio grande do sul (four municipalities): distribution of farms according to the potential existence of successors
Potential existence of successors
Municipalities
Morro Redondo Salvador das Missões Três Palmeiras Veranópolis
No. % No. % No. % No. %
Yes 22 35.5 30 51.7 34 57.6 26 44.1
No 24 38.7 21 36.2 15 25.4 21 35.6
No reply 16 25.8 7 12.1 10 16.9 12 20.3
Total 62 100.0 58 100.0 59 100.0 59 100.0
Source: Research on family farming, local development and pluriactivity conducted by the National Council for Scientific and Technological Development (CNPq), Federal University of Pelotas and Federal University of Rio Grande do Sul, 2004.
TABLE 5
Rio grande do sul (four municipalities): percentage distribution of pluriactive and exclusively agricultural farms, according to the desire of their owners for their children to be farmers.
Desire for children to be farmers
Percentage distribution (%)
PluriactiveExclusively agricultural
Yes 63.1 55.6
No 31.1 29.6
No reply 5.8 13.3
Not applicable 0.0 1.5
Total 100.0 100.0
Source: Research on family farming, local development and pluriactivity conducted by the National Council for Scientific and Technological Development (CNPq), Federal University of Pelotas and Federal University of Rio Grande do Sul, 2004.
TABLE 6
Rio grande do sul (four municipalities): distribution of farmsaccording to desire for children to be farmers
Desire for children to be farmers
Municipality
Morro RedondoSalvador das
MissõesTrês Palmeiras Veranópolis
No. % No. % No. % No. %
Yes 32 51.6 34 58.6 36 61.0 38 64.4
No 23 37.1 19 32.8 14 23.7 16 27.1
No reply 6 9.7 4 6.9 9 15.2 5 8.5
Not applicable 1 1.6 1 1.7 0 0.0 0 0.0
Total 62 100.0 58 100.0 59 100.0 59 100.0
Source: Research on family farming, local development and pluriactivity conducted by the National Council for Scientific and Technological Development (CNPq), Federal University of Pelotas and Federal University of Rio Grande do Sul, 2004.
C E P A L R E V I E W 9 3 • D E C E M B E R 2 0 0 7
PLuRIACtIVIty AnD fAMILy fARMIng In BRAzIL: thE CAsE of RIo gRAnDE Do suL • fLáVIo sACCo Dos Anjos AnD náDIA VELLEDA CALDAs
163
farming. The data contained in table 5 do not reveal significant differences on this issue between pluriactive farmers and exclusively agricultural producers.
As table 6 shows, however, the municipality with the highest prevalence of pluriactivity (Veranópolis) also reports the largest proportion of parents interested in their children going into farming. We agree with the argument that pluriactivity cannot be seen as a departure from the way in which families recognize their socio-employment situation. In other words, the fact that they engage in activities other than agriculture, including stable factory jobs (in the metallurgy and footwear industries, for example), does not alter the criteria by which families are identified, or the way in which their future reproduction
projects are conceived. The major paradox seems to be that incomes earned off the farm (i.e. those obtained through pluriactivity) serve to strengthen family links with rurality and even with the status of farmer. But areas where agriculture is experiencing a crisis of expectations and there are few alternatives for increasing the family’s economic income either on or off the farm (i.e. where there are no possibilities for pluriactivity to develop), are where we most intensively perceive the loss of cultural roots and identification with the farming profession. Although pluriactivity among families continues to be analysed from the agricultural standpoint, it is clear that the farm and its dynamic cannot be used as exclusive analytical benchmarks.
VIIConclusions
There is increasing awareness of the complexity of pluriactivity and its implications. While in Brazil the issue has emerged only recently, differences of opinion have already emerged as to its importance as a subject of analysis or in relation to agrarian-rural public policies. It seemed worthwhile to us to pose the problem and perform this research, despite the insufficiency of statistical sources and the lack of studies based on primary data.
In this paper we have stressed that pluriactivity is highly heterogeneous and heavily conditioned both by the prevailing territorial dynamic and by macroeconomic conditions that may favour or discourage the prevalence of this phenomenon. In areas dominated by the agro-export pattern in the north-northwest of Rio Grande do Sul, pluriactivity seems to be associated with activities that are dependent on the pace of agriculture. Over the last 30 years, farms have made a major effort to modernize and adjust to the new production modality. The situation today is very different, given the fall in the international prices of agricultural commodities and a simultaneous rise in production costs. As a result, farmers are facing deteriorating incomes and increasing difficulties in meeting their financial commitments.
Modernization has fuelled a spectacular increase in output and decline in employment. Moreover, pluriactivity seems to be linked to para-agrarian activities and, to a considerable extent, to precarious occupations aimed at ensuring the satisfaction of family needs. In the southern
part of RGS, under the Iberian development pattern, a region that was quite prosperous until the start of the 1960s is now immersed in a profound crisis of expectations. Recent trends reveal an industrial economy in outright decline, with the closure of many agrifood enterprises not only in the locality studied but also regionwide, thereby considerably reducing job opportunities for the rural work force. This seems to show that pluriactivity depends less on farmers’ attitudes than on the specific opportunities provided by the labour market. It is no coincidence that the zone identified as the Brazilian Third Italy is the most pluriactive area of the study and has the highest agricultural and non-agricultural incomes among family farms.
It is also specifically in this zone that we obtained the highest proportion of affirmative replies regarding parents’ interest in their children going into farming. In fact, we agree with the view that pluriactivity cannot be seen as a break with the way in which families see their socio-employment situation. The fact that they engage in activities other than agriculture, sometimes even holding stable factory jobs, does not alter the frames of reference with which families are identified or the way in which they view their future reproduction projects. A salient fact is that off-farm incomes (i.e. those obtained through pluriactivity) serve to strengthen families’ links with rural life and even consolidate their status as farmers. Nonetheless, areas where agriculture is experiencing a
C E P A L R E V I E W 9 3 • D E C E M B E R 2 0 0 7
PLuRIACtIVIty AnD fAMILy fARMIng In BRAzIL: thE CAsE of RIo gRAnDE Do suL • fLáVIo sACCo Dos Anjos AnD náDIA VELLEDA CALDAs
164
crisis of expectations and there are few alternatives for increasing the family’s income either within or outside agriculture, are where we most intensively perceive the loss of cultural roots and identification with the status of farmer. Although pluriactivity among families continues to be analysed from the agricultural standpoint, it is clear that the farm and its dynamic cannot be used as exclusive analytical benchmarks.
When farms are considered as a whole, what one sees is that farm incomes are higher where the activities are exclusively agricultural than in cases of pluriactivity, a situation that is reversed when we analyse the sum of all incomes (farming and non-farming). With regard to the succession issue, we found that pluriactivity does not
alter traditional succession and inheritance mechanisms on the family farm.
The dichotomy in family farming is increasingly accentuated in southern Brazil: firstly, there are a few farms whose market share is being maintained or even increasing; and, secondly, a large proportion of farms basically depend on activities outside agriculture, or else social security, or both. Most of the cases studied point to the insufficiency of incomes generated by the farm as a reason for pluriactivity. Nonetheless, there are other very important aspects related to what we have referred to as the territorial dynamics of development, which affect not only the prevalence of pluriactivity, but also the characteristics of this system as an expression of rural families’ adaptation to ensure their members’ social reproduction.
Bibliography
Arnalte Alegre, E. (1980): Agricultura a tiempo parcial y transformaciones del campesinado, Agricultura y sociedad, No. 17, Madrid, Ministry of Agriculture, Fisheries and Food.
Belik, W. (1997): Changing patterns of state intervention in the Brazilian agro-industrial complex, Sociologia ruralis, vol. 37, Oxford, United Kingdom, Blackwell Publishing.
Cavazzani, A. and A. Fuller (1982): International perspectives on part-time farming: a review, GeoJournal, vol. 6, New York, Springer.
Costa, M.R.C. (2005): Agricultura familiar e sucessão hereditária: um estudo de caso no município de Morro Redondo, Universidad Federal de Pelotas.
Chayanov. A. V. (1974): La organización de la unidad económica campesina, Buenos Aires, Nueva Visión.
Christodoulou, D. (1982): Part-time farming in the developing world: a case of Hobson´s choice or the privilege of half a loaf, GeoJournal, vol. 6, No. 4, New York, Springer.
Etxezarreta, M., J. Cruz and others (1995): La agricultura familiar ante las nuevas políticas agrarias comunitarias, Madrid, Ministry of Agriculture, Fisheries and Food.
European Commission (1985): Libro verde sobre las perspectivas de la política agraria común, Brussels.
__________ (1988): The Future of Rural Society, COM (88) 501 final, Brussels.
Feder, E. (1981): Tres enfoques divergentes (no incompatibles) sobre la destrucción del campesinado, in A. García (org.), Desarrollo agrario y la América Latina, vol. 41, Mexico City, Fondo de Cultura Económica.
Fuller, A.M. (1984): Part-time farming: the enigmas and the realities, in H. Schwarzweller (comp.), Research in Rural Sociology and Development, Connecticut, Jai Press.
__________ (1990): From part-time farming to pluriactivity: a decade of change in rural Europe, Journal of Rural Studies, vol. 6, No. 4, Amsterdam, Elsevier.
Gasson, R. (1986): Farm Families with Other Gainful Activities, Wye College, Department of Agricultural Economics.
Graziano da Silva, J. (1999): O novo rural brasileiro, Campinas, Universidad Estadual de Campinas (UNICAMP)/Instituto de Economia.
Hervieu, B. (1996): Los campos del futuro, Madrid, Ministry of Agriculture, Fisheries and Food.
IBGE (Brazilian Geographical and Statistical Institute) (2001): Censo demográfico – 2000, Rio de Janeiro.
Kolankiewicz, G. (1979): Una nueva clase incómoda: el campesino a tiempo parcial en Polonia, Agricultura y sociedad, No. 13, Madrid, Ministry of Agriculture, Fisheries and Food.
Moyano Estrada, E. (1997): Por un cambio necesario en la agricultura europea, Madrid, Ministry of Agriculture, Fisheries and Food.
Naredo, J.M. (1996): La evolución de la agricultura en España (1940-1990), Granada, Servicio de Publicaciones de la Universidad de Granada.
OECD (Organisation for Economic Co-operation and Development) (1978): L´agriculture à temps partiel dans les pays de l´OCDE, Rapport General, vol. 1, Paris.
Okafor, F.C. (1982): Environmental constraints and part-time farming in Southeastern Nigeria, GeoJournal, vol. 6, No. 4, New York, Springer.
Reardon, T., J. Berdegué and G. Escobar (2001): Rural non farm employment and incomes in Latin America: overview and policy implications, World Development, vol. 29, No. 3, Amsterdam, Elsevier.
Sacco dos Anjos, F. (2001): Pluriactividad y desarrollo rural en el sur de Brasil, Revista internacional de sociología, vol. 28, Madrid, Consejo Superior de Investigaciones Científicas.
Sacco dos Anjos, F. and N.V. Caldas (2003): Cambios demográficos en el Brasil meridional: la masculinización, el envejecimiento y la desagrarización de la población rural, Perspectivas sociales, vol. 5, Mexico City.
Stavenhagen, R. (1981): Capitalismo e campesinado en México, in A. García (org.), Desarrollo agrario y la América Latina, vol. 41, Mexico City, Fondo de Cultura Económica.
Szekely, E.M. (1977): La organización colectiva para la producción rural. La acción promotora oficial y las reacciones e iniciativas de los campesinos, Comercio exterior, vol. 27, No. 12, Mexico City, December.
Warman, A. (1985): Estrategias de sobrevivencia de los campesinos mayas, Cuadernos de investigación social, No. 13, Mexico City, Instituto de Investigaciones Sociales, National Autonomous University of Mexico (UNAM).
Woortmann, E.F. (1999): De la transmisión legítima a la herencia legal. Tierra, trabajo e género en un contexto de cambio social (el sur del Brasil, 1824-1980), Estudios Latinoamericanos, Brasilia.
(Original: Spanish)
C E P A L R E V I E W 9 3 • D E C E M B E R 2 0 0 7
DECEMBER 2007
165C E P A L R E V I E W 9 3
D E C E M B E R 2 0 0 7
Guidelinesfor contributorsto the cepal Review
In order to facilitate the submission, consideration and publication of articles, the editorial board of the cepal Review has prepared the following information and suggestions to serve as a guide for future contributors.
The submission of an article implies an undertaking by the author not to submit it simultaneously to other publications. The copyright to all articles published in the Review shall be owned by the United Nations.
All articles will be submitted to external referees.
Papers should be submitted in the original language (English, French, Portuguese or Spanish). They will be translated into the appropriate language by the relevant eclac services.
Each article must be accompanied by a summary, no more than 150 words in length, giving a brief description of its subject matter and main conclusions.
Papers should be no longer than 10,000 words, including the summary, notes and bibliography. Shorter papers will also be considered.
Articles should be sent either by e-mail to: [email protected] or by regular mail, on cd or diskette, to: cepal Review, Casilla 179-D, Santiago, Chile. They should not be submitted in pdf format.
Style guide:
Titles should not be excessively long.
Footnotes
– It is recommended that footnotes be kept to a minimum.
– It is recommended that footnotes not be used to cite bibliographical references; such references should preferably be incorporated into the text.
– Footnotes should be numbered consecutively using superscript Arabic numerals.
Tables and figures
– It is recommended that tables and figures be kept to aminimum, avoiding any redundancy with the text.
– Tables, figures and other elements should be insertedat the end of the text in the format in which they were designed; they should not be inserted as “pictures”. Figures in Excel should include the corresponding worksheets.
– Thelocationoftablesandfiguresinthebodyofthearticleshould be indicated in the appropriate place as follows:
Insertfigure1Insert table 1
– Tablesandfiguresshouldincludeanexplicitandcompletereference to their sources.
– Tables should indicate the period covered at the end of the title, and should indicate the units in which the data are expressed in a subtitle (in italics and between brackets).
– The symbols referred to in the “Explanatory notes” which appear on the page preceding the table of contents should be taken into account in the preparation of tables and figures.
– Footnotes to tables and figures should be ordered consecutively using superscript lower-case letters.
– Figures should be prepared bearing in mind that they will be printed in black and white.
Acronyms and abbreviations
– Acronyms and abbreviations should not be used unless absolutely necessary, in which case the full name should bewrittenoutthefirsttimeitoccursinthearticle.
Bibliography
– Bibliographical references should be directly related to the content of the article and should not be excessively long.
– At the end of the article, under the title “Bibliography”, all the necessary information should be included accurately and in alphabetical order by author: name of author(s), year of publication, full name of article (if any) and publication (including any subtitle), city of publication, publisher and, in the case of a periodical, month of publication.
The editorial board of the Review reserves the right to make any necessary editorial changes in the articles, including their titles.
Authors will receive a one-year courtesy subscription to the Review, plus 30 offprints of their article in Spanish and 30 in English, at the time of publication in each language.
C E P A L R E V I E W 9 3 • D E C E M B E R 2 0 0 7
DECEMBER 2007
166 R E V I S T A D E L A C E P A L 8 5C E P A L R E V I E W 9 3
D E C E M B E R 2 0 0 7
cepal Review on the Internet
www.cepal.org www.eclac.org www.cepal.cl www.eclac.cl

C E P A L R E V I E W 9 3 • D E C E M B E R 2 0 0 7
DECEMBER 2007
167
por valor de CH$ / US$
in the amount of CH$ / US$

C E P A L R E V I E W 9 3 • D E C E M B E R 2 0 0 7
DECEMBER 2007
168
C E P A L R E V I E W 9 3 • D E C E M B E R 2 0 0 7
DECEMBER 2007
169
D E C E M B E R 2 0 0 7
C E P A L R E V I E W 9 3
Institutional periodical reports
Latin America and the Caribbean in the World Economy 2006, LC/G.2341-P/I. United Nations publication, eclac, Santiago, Chile, August 2007, 226 pages.
Chapter I analyses recent trends in the economies of the United States, the European Union, Japan and a number of emerging Asian countries; the determinants of the evolving imbalances between these economies, which are the leading risk factor in an otherwise positive global environment; the factors influencing the trade performance of Latin America and the Caribbean; and the region’s trade results and outlook in 2006 and 2007. The chapter concludes with an analysis of the testing Doha Round process and the vagaries of United States trade policy as they affect this.
Chapter II looks at the recent restructuring of the world economy around the Asia-Pacific region, especially China, and the regional integration that has been taking place there since the Asian crisis. This region has become not only the world’s most dynamic market, but also a major financing source that is facilitating international financial equilibrium. The analysis shows that, in practice, regional integration is revolving around China, which is playing an increasingly central role as an extraregional export platform for its neighbours.
Chapter III explores the strategic role of business services and the main trends in this sector, comparing Latin America and the Caribbean with a group of Asian countries. It analyses the success of some Latin American firms in this niche and the determinants of their export performance, including regulation, human capital and the adaptation of advanced technology, as well as the liberalization of trade in services that has taken place under the various trade agreements signed in the region.
Chapter IV looks at the current status of regional integration and of bilateral and plurilateral negotiations with countries outside the region that are influencing its development, and at milestone events in the integration of each subregion (mercosur, the Andean Community, the Central American Common Market, the Caribbean Community and the South American Community of Nations), considered as an effort to achieve complementarities and convergence in trade rules.
Chapter V examines the Asia-Pacific region’s integration process, which until recently consisted primarily of de facto integration in the sphere of production. This is now being complemented, however, by de jure integration under both intraregional and extraregional trade agreements. In view of these trends, the Latin America and Caribbean region should work to strengthen trade and investment links with Asia and the Pacific, enhance its production complementarities with that region and promote business and investment alliances that will provide it with broader access to these markets and help it position itself within Asian production and export chains. Trade agreements can be valuable tools insofar as they serve this purpose.
Chapter VI explores the various ways in which export deve-lopment and innovation are linked and these links are reflected in institutional strategies and institution-building. It discusses the cases
of Australia, Finland, Ireland, Malaysia, New Zealand, the Republic of Korea, Singapore and Sweden, countries that take innovation seriously and are better placed than most to compete in the global economy. It concludes with some policy recommendations based on this comparative analysis.
Economic Survey of Latin America and the Caribbean 2006-2007, LC/G.2338-P/I. United Nations publication, Sales No.: E.07.II.G.2, eclac, Santiago, Chile, July 2007, 161 pages.
ECLAC has now been publishing the Economic Survey for 59 years. The first edition of this report was published after eclac commissioned “an economic survey of Latin America” from its Executive Secretary at its first session. That document was the new Economic Commission’s first contribution to the knowledge and understanding of the region’s development process. The Commission thereby fulfilled one of the specific purposes for which it was created, that of “undertaking or sponsoring the collection, evaluation and dissemination of […] econo-mic, technological and statistical information”1 on the region. In fact, the former Director of the Central Bank of Argentina, Raúl Prebisch, arrived in Santiago as a consultant to work on the 1948 edition of the Economic Survey. Ever since then, the Survey has been a witness of and, increasingly, a leading actor in the economic development of Latin America and the Caribbean.
As the sixtieth anniversary of the Economic Survey of Latin America and the Caribbean approaches, this flagship eclac publica-tion, one of the most frequently cited in the region, which Alberto Hirschman once described as the “Latin American manifest”, has been restructured to enhance yet further its usefulness to readers. In a reformulation that partly restores the character of the Survey in its earlier years, from this issue onward the analysis of the current economic situation that is a long-standing feature of this publication will be supplemented by an additional section containing a number of studies on some major aspect of the region’s economic development, together with analyses from a longer-term perspective. The aim of this is to contribute to “the long and difficult task of preparing a complete and fully documented study of economic conditions”.2 The change is intended to contribute to the economic debate on ways of promoting rapid, sustainable growth that can create the right conditions for better living standards in Latin America and the Caribbean.
This change also reflects the recent evolution of the Survey’s “sister publication”, the Preliminary Overview of the Economies of Latin America and the Caribbean, which is published at the end of each year. Over recent years, thanks to the growing availability of information and to a major effort of analysis and synthesis, the Preliminary Overview has been providing an increasingly detailed and thorough analysis of the economic situation in the region. It is thus felt that the Overview now covers a large part of the information needs traditionally met by the Economic Survey.
Chapter I of this fifty-ninth edition, “Regional Panorama”, surveys the main features of the regional economy in 2006 and the first half of 2007 in the light of its recent economic performance. This chapter is supplemented by a statistical annex, presented at the end of the document, which is considerably more extensive than those of previous editions.
1 Resolution 106(VI) of the Economic and Social Council, 25 February 1948.2 Letter of Transmittal of the 1948 Economic Survey, September 1949.
Recent eclac publications
C E P A L R E V I E W 9 3 • D E C E M B E R 2 0 0 7
DECEMBER 2007
170
The next three chapters describe various aspects of the region’s economic growth dynamic. Chapter II explores the relationships between investment, saving and growth in the past few decades. Chapter III looks at economic growth patterns, concentrating most particularly on the transitions from one pattern to another and the role played in them by factors such as investment, saving and productivity. Chapter IV addresses some of the issues in the current debate about the problems and characteristics of economic growth in Latin America and the Caribbean, drawing on the observations made at a workshop on the subject held in June 2007.
Lastly, there is an analysis of the economic situation in the countries of Latin America and the Caribbean in 2006 and the first half of 2007. The country notes include tables showing trends in the main economic indicators. As in the previous edition of the Economic Survey, these notes, together with the statistical annexes for each of the countries, are presented in the cd-rom accompanying the printed publication and on the eclac web page (www.eclac.org). The tables in the statistical annex provide a rapid overview of recent years’ data and can be used to create spreadsheets. The other chapters are also on the cd-rom in electronic format.
The cut-off date for the statistical information in this publication was 30 June 2007.
Familias y políticas públicas en América Latina: Una historia de desencuentros, Libro de la cepal, No. 96, LC/G.2345-P, United Nations publication, Sales No.: S.07.II.G.97, eclac, Santiago, Chile, October 2007, 418 pages.
This new book from the Economic Commission for Latin America and the Caribbean (eclac) contains 19 studies by renowned specia-lists on transformations in family life and the need to adapt public policies to these changes.
The texts are grouped into two sections. The first, “Los grandes cambios del contexto familiar”, analyses the social, economic and cultural transformations that have affected families and looks at the main ways in which Latin American families have compensated for the shortcomings of State social welfare provision and at the new challenges confronting them as a result of global changes.
The second section, “Políticas orientadas a las familias latinoame-ricanas”, is divided into two parts. The first, “El marco de las políticas”, analyses the diversity of policies for the family and their effects in terms of social inclusion and welfare, legislative amendments, family care and the family-work balance, in a new public policy context. It also addresses the issues raised for family policy and social policies generally by the gender system and looks at the new challenges for intergenerational and social solidarity entailed by demographic, social and cultural change.
The second part, “Financiamiento y gestión de las políticas”, examines the difficulties of financing social policies, particular those aimed at the family. It also analyses the family as a unit of intervention, drawing on lessons from the implementation of poverty reduction programmes, and engages with the debate on the different forms that have been taken on by social protection, assistance and welfare policies. It concludes with a critical analysis of the way different policies have been applied in the countries and with proposals for democratic, civic policies that take account of the great changes in families and the environment within which they operate.
C E P A L R E V I E W 9 3 • D E C E M B E R 2 0 0 7
DECEMBER 2007
171
Publicaciones de la CEPAL / ECLAC publicationsComisión Económica para América Latina y el Caribe / Economic Commission for Latin America and the Caribbean
Casilla 179-D, Santiago de Chile. E-mail: [email protected] Véalas en: www.cepal.org/publicaciones
Publications may be accessed at: www.eclac.org
Revista de la CEPAL / CEPAL ReviewLa Revista se inició en 1976 como parte del Programa de Publicaciones de la Comisión Económica para América Latina y el Caribe, con el propósito de contribuir al examen de los problemas del desarrollo socioeconómico de la región. Las opiniones expresadas en los artículos firmados, incluidas las colaboraciones de los funcionarios de la Secretaría, son las de los autores y, por lo tanto, no reflejan necesariamente los puntos de vista de la Organización.
La Revista de la CEPAL se publica en español e inglés tres veces por año. Los precios de suscripción anual vigentes para 2006 son de US$ 30 para la versión en español y de US$ 35 para la versión en inglés. El
precio por ejemplar suelto es de US$ 15 para ambas versiones. Los precios de suscripción por dos años (2006-2007) son de US$ 50 para la versión español y de US$ 60 para la versión inglés.CEPAL Review first appeared in 1976 as part of the Publications Programme of the Economic Commission for Latin America and the Caribbean, its aim being to make a contribution to the study of the economic and social development problems of the region. The views expressed in signed articles, including those by Secretariat staff members, are those of the authors and therefore do not necessarily reflect the point of view of the Organization.
CEPAL Review is published in Spanish and English versions three times a year. Annual subscription costs for 2006 are US$ 30 for the Spanish version and US$ 35 for the English version. The price of single issues is
US$ 15 in both cases. The cost of a two-year subscription (2006-2007) is US$ 50 for Spanish-language version and US$ 60 for English.
Informes periódicos institucionales / Annual reportsTodos disponibles para años anteriores / Issues for previous years also available
Balance preliminar de las economías de América Latina y el Caribe, 2007, 180 p. Preliminary Overview of the Economies of Latin America and the Caribbean, 2007, 180 p. (en prensa/in press)Estudio económico de América Latina y el Caribe 2006-2007, 156 p.Economic Survey of Latin America and the Caribbean 2005-2006, 142 p.Panorama de la inserción internacional de América Latina y el Caribe, 2006. Tendencias 2007, 200 p.Latin America and the Caribbean in the World Economy, 2006. 2007 Trends, 198 p.Panorama social de América Latina, 2006, 432 p. Social Panorama of Latin America, 2006, 426 p.La inversión extranjera en América Latina y el Caribe, 2006, 218 p.
Foreign Investment of Latin America and the Caribbean, 2006, 200 p. Anuario estadístico de América Latina y el Caribe / Statistical Yearbook for Latin America and the Caribbean (bilingüe/bilingual),2006, 442 p.
Libros de la CEPAL 96 Familias y políticas públicas en América Latina: una historia de desencuentros, Irma Arriagada (coord.), 2007, 424 p. 93 Tributación en América Latina. En busca de una nueva agenda de reformas, Oscar Cetrángolo y Juan Carlos Gómez-Sabaini (comps.),
2007, 166 p. 94 América Latina y el Caribe: La propiedad intelectual después de los tratados de libre comercio, Álvaro Díaz, 2008, 248 p. 92 Fernando Fajnzylber. Una visión renovadora del desarrollo en América Latina, Miguel Torres Olivos (comp.), 2006, 422 p. 91 Cooperación financiera regional, José Antonio Ocampo (comp.), 2006, 274 p.
C E P A L R E V I E W 9 3 • D E C E M B E R 2 0 0 7
DECEMBER 2007
172
90 Financiamiento para el desarrollo. América Latina desde una perspectiva comparada, Barbara Stallings con la colaboración de Rogério Studart, 2006, 396 p.
89 Políticas municipales de microcrédito. Un instrumento para la dinamización de los sistemas productivos locales. Estudios de caso en América Latina, Paola Foschiatto y Giovanni Stumpo (comps.), 2006, 244 p.
88 Aglomeraciones en torno a los recursos naturales en América Latina y el Caribe: Políticas de articulación y articulación de políticas, 2006, 266 p. 87 Pobreza, desertificación y degradación de los recursos naturales, César Morales y Soledad Parada (eds.), 2006, 274 p. 86 Aprender de la experiencia. El capital social en la superación de la pobreza, Irma Arriagada (ed.), 2005, 250 p. 85 Política fiscal y medio ambiente. Bases para una agenda común, Jean Acquatella y Alicia Bárcena (eds.), 2005, 272 p. 84 Globalización y desarrollo: desafíos de Puerto Rico frente al siglo XXI, Jorge Mario Martínez, Jorge Máttar y Pedro Rivera (coords.), 2005, 342 p. 83 El medio ambiente y la maquila en México: un problema ineludible, Jorge Carrillo y Claudia Schatan (comps.), 2005, 304 p. 82 Fomentar la coordinación de las políticas económicas en América Latina. El método REDIMA para salir del dilema del prisionero,
Christian Ghymers, 2005, 190 p. 82 Fostering economic policy coordination in Latin America. The REDIMA approach to escaping the prisoner’s dilemma, Christian
Ghymers, 2005, 170 p. 81 Mondialisation et développement. Un regard de l’Amérique latine et des Caraïbes, José Antonio Ocampo et Juan Martin (éds.), 2005, 236 p. 80 Gobernabilidad e integración financiera: ámbito global y regional, José Antonio Ocampo, Andras Uthoff (comps.), 2004, 278 p. 79 Etnicidad y ciudadanía en América Latina. La acción colectiva de los pueblos indígenas, Álvaro Bello, 2004, 222 p. 78 Los transgénicos en América Latina y el Caribe: un debate abierto, Alicia Bárcena, Jorge Katz, César Morales, Marianne Schaper (eds.)
2004, 416 p. 77 Una década de desarrollo social en América Latina 1990-1999, 2004, 300 p. 77 A decade of social development in Latin America 1990-1999, 2004, 308 p. 77 Une décennie de développement social en Amérique latine 1990-1999, 2004, 300 p.
Copublicaciones recientes / Recent co-publicationsEconomic growth with equity. Challenges for Latin America, Ricardo Ffrench-Davis and José Luis Machinea (eds.), ECLAC/Palgrave
Macmillan, United Kingdom, 2007. Mujer y empleo. La reforma de la salud y la salud de la reforma en Argentina, María Nieves Rico y Flavia Marco (coords.), CEPAL/Siglo XXI,
Argentina, 2006. El estructuralismo latinoamericano, Octavio Rodríguez, CEPAL/Siglo XXI, México, 2006. Gobernabilidad corporativa, responsabilidad social y estrategias empresariales en América Latina, Germano M. de Paula, João Carlos
Ferraz y Georgina Núñez (comps.), CEPAL/Mayol, Colombia, 2006. Desempeño económico y política social en América Latina y el Caribe. Los retos de la equidad, el desarrollo y la ciudadanía, Ana Sojo y
Andras Uthoff (comps.), CEPAL/Flacso-México/ Fontamara, México, 2006. Política y políticas públicas en los procesos de reforma de América Latina, Rolando Franco y Jorge Lanzaro (coords.), CEPAL/Flacso-
México/Miño y Dávila, México, 2006. Finance for Development. Latin America in Comparative Perspective, Barbara Stallings with Rogério Studart, ECLAC/Brookings
Institution Press, USA, 2006. Los jóvenes y el empleo en América Latina. Desafíos y perspectivas ante el nuevo escenario laboral, Jürgen Weller (ed.), CEPAL/Mayol
Ediciones, Colombia, 2006. Condiciones y políticas de competencia en economías pequeñas de Centroamérica y el Caribe, Claudia Schatan y Marcos Ávalos (coords.),
CEPAL/Fondo de Cultura Económica, México, 2006. Aglomeraciones pesqueras en América Latina. Ventajas asociadas al enfoque de cluster, Massiel Guerra (comp.) CEPAL/Alfaomega, Colombia, 2006. Reformas para América Latina después del fundamentalismo neoliberal, Ricardo Ffrench-Davis, CEPAL/Siglo XXI, Argentina, 2006. Seeking growth under financial volatility, Ricardo Ffrench-Davis (ed.), ECLAC/Palgrave Macmillan, United Kingdom, 2005.Macroeconomía, comercio y finanzas para reformar las reformas en América Latina, Ricardo Ffrench-Davis (ed.), CEPAL/Mayol Ediciones,
Colombia, 2005. Beyond Reforms. Structural Dynamics and Macroeconomic Theory. José Antonio Ocampo (ed.), ECLAC/Inter-American Development
Bank/The World Bank/Stanford University Press, USA, 2003. Más allá de las reformas. Dinámica estructural y vulnerabilidad macroeconómica, José Antonio Ocampo (ed.), CEPAL/Alfaomega, Colombia, 2005. Gestión social. Cómo lograr eficiencia e impacto en las políticas sociales, Ernesto Cohen y Rolando Franco, CEPAL/Siglo XXI, México, 2005. Crecimiento esquivo y volatilidad financiera, Ricardo Ffrench-Davis (ed.), Mayol Ediciones, Colombia, 2005. Pequeñas y medianas empresas y eficiencia colectiva. Estudios de caso en América Latina, Marco Dini y Giovanni Stumpo (coords.),
CEPAL/Siglo XXI, México, 2005. En búsqueda de efectividad, eficiencia y equidad: las políticas del mercado de trabajo y los instrumentos de su evaluación, Jürgen Weller
(comp.), CEPAL/LOM, Chile, 2004. América Latina en la era global, José Antonio Ocampo y Juan Martin (coords.), CEPAL/Alfaomega. El desarrollo económico en los albores del siglo XXI, José Antonio Ocampo (ed.), CEPAL/Alfaomega, Colombia, 2004.Los recursos del desarrollo. Lecciones de seis aglomeraciones agroindustriales en América Latina, Carlos Guaipatín (comp.),
CEPAL/Alfaomega, Colombia, 2004.
C E P A L R E V I E W 9 3 • D E C E M B E R 2 0 0 7
DECEMBER 2007
173
Coediciones recientes / Recent co-editionsEspacios iberoamericanos: comercio e inversión, CEPAL/SEGIB, Santiago de Chile, 2007.Espaços Ibero-Americanos: comércio e investimento, CEPAL/SEGIB, Santiago do Chile, 2007. Visiones del desarrollo en América Latina, José Luis Machinea y Narcís Serra (eds.), CEPAL/CIDOB, España, 2007. Cohesión social: inclusión y sentido de pertenencia en América Latina y el Caribe, CEPAL/SEGIB, Santiago de Chile, 2007. Social Cohesion. Inclusion and a sense of belonging in Latin America and the Caribbean, ECLAC/SEGIB, Santiago, Chile, 2007. Espacios Iberoamericanos, CEPAL/SEGIB, Santiago de Chile, 2006. Espaços Ibero-Americanos, CEPAL/SEGIB, Santiago do Chile, 2006.
Cuadernos de la CEPAL 92 Estadísticas para la equidad de género: magnitudes y tendencias en América Latina, Vivian Milosavljevic, 2007, 186 pp. 91 Elementos conceptuales para la prevención y reducción de daños originados por amenazas naturales, Eduardo Chaparro y Matías
Renard (eds.), 2005, 144 p. 90 Los sistemas de pensiones en América Latina: un análisis de género, Flavia Marco (coord.), 2004, 270 p. 89 Energía y desarrollo sustentable en América Latina y el Caribe. Guía para la formulación de políticas energéticas, 2003, 240 p. 88 La ciudad inclusiva, Marcello Balbo, Ricardo Jordán y Daniela Simioni (comps.), CEPAL/Cooperazione Italiana, 2003, 322 p. 87 Traffic congestion. The problem and how to deal with it, Alberto Bull (comp.), 2004, 198 p. 87 Congestión de tránsito. El problema y cómo enfrentarlo, Alberto Bull (comp.), 2003, 114 p.
Cuadernos estadísticos de la CEPAL 34 Indicadores económicos del turismo. Solo disponible en CD, 2006. 33 América Latina y el Caribe. Balanza de pagos 1980-2005. Solo disponible en CD, 2006. 32 América Latina y el Caribe. Series regionales y oficiales de cuentas nacionales, 1950-2002. Solo disponible en CD, 2005. 31 Comercio exterior. Exportaciones e importaciones según destino y origen por principales zonas económicas. 1980, 1985, 1990, 1995-
2002. Solo disponible en CD, 2005.30 Clasificaciones estadísticas internacionales incorporadas en el banco de datos del comercio exterior de América Latina y el Caribe de la
CEPAL, 2004, 308 p. 29 América Latina y el Caribe: series estadísticas sobre comercio de servicios 1980-2001, 2003, 150 p.
Observatorio demográfico ex Boletín demográfico / Demographic Observatory formerlyDemographic Bulletin (bilingüe/bilingual)Edición bilingüe (español e inglés) que proporciona información estadística actualizada, referente a estimaciones y proyecciones de población de los países de América Latina y el Caribe. Incluye también indicadores demográficos de interés, tales como tasas de natalidad, mortalidad, esperanza de vida al nacer, distribución de la población, etc.
El Observatorio aparece dos veces al año, en los meses de enero y julio. Suscripción anual: US$ 20.00. Valor por cada ejemplar: US$ 15.00. Bilingual publication (Spanish and English) proving up-to-date estimates and projections of the populations of the Latin American and Caribbean countries. Also includes various demographic indicators of interest such as fertility and mortality rates, life expectancy, measures of population distribution, etc.
The Observatory appears twice a year in January and July. Annual subscription: US$ 20.00. Per issue: US$ 15.00.
Notas de población Revista especializada que publica artículos e informes acerca de las investigaciones más recientes sobre la dinámica demográfica en la región, en español, con resúmenes en español e inglés. También incluye información sobre actividades científicas y profesionales en el campo de población.
La revista se publica desde 1973 y aparece dos veces al año, en junio y diciembre. Suscripción anual: US$ 20.00. Valor por cada ejemplar: US$ 12.00.
Specialized journal which publishes articles and reports on recent studies of demographic dynamics in the region, in Spanish with abstracts in Spanish and English. Also includes information on scientific and professional activities in the field of population.
Published since 1973, the journal appears twice a year in June and December. Annual subscription: US$ 20.00. Per issue: US$ 12.00.
Series de la CEPAL Comercio internacional / Desarrollo productivo / Desarrollo territorial / Estudios estadísticos y prospectivos / Estudios y perspectivas (Bogotá, Brasilia, Buenos Aires, México, Montevideo) / Studies and Perspectives (The Caribbean, Washington) / Financiamiento del desarrollo /Gestión pública / Informes y estudios especiales / Macroeconomía del desarrollo / Manuales / Medio ambiente y desarrollo / Mujer y desarrollo / Población y desarrollo / Políticas sociales / Recursos naturales e infraestructura / Seminarios y conferencias.Véase el listado completo en: www.cepal.org/publicaciones / A complete listing is available at: www.cepal.org/publicaciones
C E P A L R E V I E W 9 3 • D E C E M B E R 2 0 0 7
DECEMBER 2007
174
Las publicaciones de la Comisión Económica para América Latina y el Caribe (CEPAL) y las del Instituto Latinoamericano y del Caribe de Planificación Económica y Social (ILPES) se pueden adquirir a los distribuidores locales o directamente a través de:
Publicaciones de las Naciones Unidas Publicaciones de las Naciones Unidas 2 United Nations Plaza, Room DC2-853 Sección de Ventas Nueva York, NY, 10017 Palais des Nations Estados Unidos 1211 Ginebra 10 Tel. (1 800)253-9646 Fax (1 212)963-3489 SuizaE-mail: [email protected] Tel. (41 22)917-2613 Fax (41 22)917-0027
Unidad de Distribución Comisión Económica para América Latina y el Caribe (CEPAL) Av. Dag Hammarskjöld 3477, Vitacura 7630412 Santiago
Chile Tel. (56 2)210-2056 Fax (56 2)210-2069 E-mail: [email protected]
Publications of the Economic Commission for Latin America and the Caribbean (ECLAC) and those of the Latin American and the Caribbean Institute for Economic and Social Planning (ILPES) can be ordered from your local distributor or directly through:
United Nations Publications United Nations Publications 2 United Nations Plaza, Room DC2-853 Sales Sections New York, NY, 10017 Palais des Nations USA 1211 Geneva 10 Tel. (1 800)253-9646 Fax (1 212)963-3489 SwitzerlandE-mail: [email protected] Tel. (41 22)917-2613 Fax (41 22)917-0027
Distribution Unit Economic Commission for Latin America and the Caribbean (ECLAC) Av. Dag Hammarskjöld 3477, Vitacura 7630412 Santiago
Chile Tel. (56 2)210-2056 Fax (56 2)210-2069 E-mail: [email protected]
REVISTA DE CIENCIAS SOCIALES DE LAUNIVERSIDAD AUTÓNOMA DE NUEVO LEÓN
Directora: Esthela Gutiérrez GarzaCodirector: José María Infante
Consejo Editorial: Luis Aguilar Villanueva, Robert Boyer, Dídimo Castillo, Mario Cerutti, EnriqueFlorescano, Joan Garcés, Gustavo Garza, Pablo González Casanova, Gilberto Guevara Niebla, Helena
Hirata, Michel Löwy, Elia Marúm Espinosa, Aníbal Quijano, Manuel Ribeiro, Pierre Salama, EnriqueSemo, Gregorio Vidal, René Villarreal.
Año IX Número 23 enero-abril de 2007
DOSSIER: PERFILES DE LA EMIGRACIÓN
Perspectivas indispensablesArun Kumar y Efrén Sandoval
EL mercado de las mujeres. Globalización, migración y tráfico de mujeres en MéxicoEl autor intenta analizar la situación del tráfico de mujeres en México en un contexto de globalización y migración.Arun Kumar Acharya
Las huellas de la red. Trayectoria de una familia de migrantes urbanosEl texto nos acerca a la manera en que el trayecto migratorio de una familia se intensifica y cambia de rumbocuando se desarrolla en redes urbanas.Efrén Sandoval
Rostros desconocidos. Perfil sociodemográfico de las indígenas en MonterreyLas autoras se concentran en el análisis de las mujeres indígenas inmigrantes en el mapa de la zona metropolitanade Monterrey, un universo ciertamente desconocido.Séverine Durin, Rebeca Moreno y Cecilia Sheridan
TEORÍARepensar la violencia. Tres propuestas para el siglo XXIUna breve revisión de tres propuestas teóricas sobre la violencia, que buscan el desarrollo de una teoría distinta apartir de su evaluación.Nelson Arteaga Botello
Anthony Giddens. Una interpretación de la globalizaciónLa obra de Giddens marca pautas específicas en la teoría social y en la acción de los científicos sociales.José María Infante
ÁMBITOAutoritarismo y modernización. La aceleración del desarrollo mediante regímenes dominantesUna reflexión en torno a los modelos autoritarios de modernización y la fascinación de las masas y losintelectuales, como dice el autor, ante este fenómeno tercermundista “importante y trágico”.H.C.F. Mansilla
Pensar la nueva universidad. Instituciones educativas, políticas públicas y académicosLas políticas públicas han demostrado ser un ámbito fértil para orientar los cambios de las institucioneseducativas.Rosa Martha Romo
MEMORIA VIVAPaulo Freire: esa presencia. Habla Ana María Araujo FreireEntrevistada por Marcia Aparecida Germano y Marcos Reigota
EL TRAYECTO DE LOS DÍASTransicionesSeymour Martin LipsetJean BaudrillardJuan Carlos Portantiero
José María Infante
Suscripciones: en México (pesos M.N.) $ 210.00 (individual), $ 250.00 (institucional). Números sueltos: $ 60.00.América del Norte y El Caribe: USD $ 51.00.
Europa y Sudamérica: USD $ 70.00. Resto del mundo: USD $ 89.00.Avenida Alfonso Reyes 4000, Monterrey, N. L. México, C. P. 64440. Teléfono y fax: (52 81) 8329 4237. Correo electrónico: [email protected]. Internet: w3.dsi.uanl.mx/publicaciones/trayectorias/
ESTUDIOSPÚBLICOS
SUSCRIPCIONES: Anual $ 9.000 • Bianual $ 13.500 • Estudiantes $ 5.000
www.cepchile.cl
CENTRO DE ESTUDIOS PÚBLICOSMonseñor Sótero Sanz 162, Santiago, Chile. Fono (56-2) 328-2400. Fax (56-2) 328-2440.
SumarioN° 107 Invierno 2007
América Latina en un mundo Vittorio Corboy globalizado: Desafíos futuros Andrea Tokman
El principio de acceso universal Lucas Sierra y la regulación de banda ancha
Sobrevivencia de las pyme Roberto Álvarez y en Chile Sebastián Vergara
Hacia una política de evaluación Claudio Agostini de fusiones horizontales
El PDC: Bases electorales, Mauricio Morales determinantes de adhesión e y Antonio Poveda impacto en las votaciones
de R. Lagos y M. Bachelet
El conservadurismo de Donald W. Livingston David Hume
La cultura de las teorías Aldo Mascareño de la cultura. Réplica
al comentario de Jorge Larraín
‘Meta-autobiografía’/ Alfonso de Toro ‘autobiografía transversal’
postmoderna o la imposibilidad
de una historia en primera
persona: Alain Robbe-Grillet,
Serge Doubrovsky,
Assia Djebar, Abdelkebir Khatibi
y Margarita Mateo
CUADERNOS DE ECONOMIALatin American Journal of Economics
Vol. 44 Mayo 2007 Nº 129
INSTITUTO DE ECONOMIAPONTIFICIA UNIVERSIDAD CATOLICA DE CHILE
INDICE/CONTENTS
Subastando la Energía Eléctrica para 3Clientes Regulados: equilibrio conInformación Completa y Aversión al Riesgo Francisco CaraviaEduardo Saavedra
Efectos Distributivos de la Reforma de la Seguridad Social. El Caso Uruguayo 31 Álvaro Forteza
¿Puede el Diseño de un Torneo Deportivo 59Afectar su Asistencia? Giorgo Sertsios
Convergencia y Estabilidad de los Tiposde Cambio Europeos: Una Aplicación deExponentes de Lyapunov 91Elena OlmedoRicardo GimenoLorenzo EscotRuth Mateos
Evidence of a Bank Lending Channel 109for Argentina and Colombia José Gómez-GonzálezFernando Grosz
Resúmenes en Español 127
JULIO-AGOSTO 2007
210
211
JULIO-AGOSTO 2007210
El Estado en reconstrucción
El Estado en reconstrucción
COYUNTURA: Javier del Rey Morató. El vuelo corto y rasantedel tero.Cultura política y constituciones en América Latina.Marcel Fortuna Biato. ¿Qué está haciendo Brasil por la gober-nabilidad global? Desafíos del multilateralismo afirmativo. APORTES: Wolf Grabendorff. América Latina hacia 2020.Escenarios posibles y el papel de Alemania en la región.TEMA CENTRAL: Oscar Oszlak. El Estado democrático enAmérica Latina. Hacia el desarrollo de líneas de investiga-ción. Fernando Escalante Gonzalbo. Baile de máscaras.Conjeturas sobre el Estado en América Latina. Andrés Pérez-Baltodano. Dios y el Estado. Dimensiones culturales deldesarrollo político e institucional de América Latina. DavidArellano Gault. Una cuestión de confianza. Retos e instru-mentos para una reforma del Estado en América Latina. LuizCarlos Bresser-Pereira. Estado y mercado en el nuevo desa-rrollismo. Bernardo Sorj. ¿Pueden las ONG reemplazar al Es-tado? Sociedad civil y Estado en América Latina. FernandoMires. Estado y política. La lucha por la democracia en Amé-rica Latina. Cristina Zurbriggen. La «falacia tecnocrática» yla reforma del Estado. A 10 años del Informe del Banco Mun-dial. Carlos Sojo. La reforma democrática del Estado en Cen-troamérica. Augusto Barrera G. Estado, sociedad y territorio.El debate actual sobre descentralización y autonomías en laregión andina. Fernando Coronil. El estado de América Latinay sus Estados. Siete piezas para un rompecabezas por armaren tiempos de izquierda. Carolina Nahón. El neoliberalismo endebate (reseña de Reformas para América Latina después delfundamentalismo neoliberal, de Ricardo Ffrench-Davis).
PAGOS: Solicite precios de suscripción y datos para elpago a <[email protected]> o <[email protected]>.
Director: Joachim KnoopJefe de redacción: José Natanson
Director: Joachim KnoopJefe de redacción: José Natanson
COYUNTURA: Javier del Rey Morató. El vuelo corto y rasante del tero.Cultura política y constitu-ciones en América Latina. Marcel Fortuna Biato. ¿Qué está haciendo Brasil por la gobernabilidadglobal? Desafíos del multilateralismo afirmativo. APORTES: Wolf Grabendorff. América Latina hacia 2020. Escenarios posibles y el papel de Ale-mania en la región.TEMA CENTRAL: Oscar Oszlak. El Estado democrático en América Latina. Hacia el desarrollo delíneas de investigación. Fernando Escalante Gonzalbo. Baile de máscaras. Conjeturas sobre elEstado en América Latina. Andrés Pérez-Baltodano. Dios y el Estado. Dimensiones culturalesdel desarrollo político e institucional de América Latina. David Arellano Gault. Una cuestión deconfianza. Retos e instrumentos para una reforma del Estado en América Latina. Luiz CarlosBresser-Pereira. Estado y mercado en el nuevo desarrollismo. Bernardo Sorj. ¿Pueden las ONG
reemplazar al Estado? Sociedad civil y Estado en América Latina. Fernando Mires. Estadoy política. La lucha por la democracia en América Latina. Cristina Zurbriggen. La «falacia tec-nocrática» y la reforma del Estado. A 10 años del Informe del Banco Mundial. Carlos Sojo. Lareforma democrática del Estado en Centroamérica. Augusto Barrera G. Estado, sociedad yterritorio. El debate actual sobre descentralización y autonomías en la región andina. FernandoCoronil. El estado de América Latina y sus Estados. Siete piezas para un rompecabezas porarmar en tiempos de izquierda. Carolina Nahón. El neoliberalismo en debate (reseña de Reformaspara América Latina después del fundamentalismo neoliberal, de Ricardo Ffrench-Davis).
PAGOS: Solicite precios de suscripción y datos para el pago a <[email protected]> o <[email protected]>.
En nuestro próximo número
Sindicalismo, trabajo y política En nuestro próximo número Sindicalismo, trabajo y política
w w w . n u s o . o r g
w w w . n u s o . o r g
211
SEPTIEMBRE-OCTUBRE 2007
211
212
SEPTIEMBRE-OCTUBRE 2007211
Transformacionesen el mundo sindical
Transformaciones en el mundo sindical
COYUNTURA: Roger Bartra. ¿Una especie en extin-ción? La izquierda mexicana tras la derrota. Fabián
Calle. Rambo, versión sudamericana. El impacto regio-nal del rearme de Venezuela y Chile.APORTES: Ernst Hillebrand. La izquierda después dela «tercera vía».TEMA CENTRAL: Achim Wachendorfer. ¿Hacia unanueva arquitectura sindical en América Latina? Oscar
Ermida Uriarte. La política laboral de los gobiernosprogresistas. Maria Silvia Portela de Castro. El sindi-calismo frente al Mercosur. Álvaro Padrón Carrau. Losacuerdos de asociación entre América Latina y laUnión Europea: el papel del movimiento sindical. Julio
Godio. La importancia estratégica de la PlataformaLaboral de las Américas. Svenja Blanke. El sindicalismomexicano: entre la marginación y la recomposición.Reiner Radermacher / Waldeli Melleiro. El sindicalismobajo el gobierno de Lula. Kjeld Jakobsen. ¿Cómopuede enfrentar el sindicalismo a las empresas multina-cionales? Didice Godinho Delgado. Sindicalismo y gé-nero. Experiencias y desafíos de la Central Única delos Trabajadores de Brasil.
PAGOS: Solicite precios de suscripción y datos para elpago a <[email protected]> o <[email protected]>.
Director: Joachim KnoopJefe de redacción: José Natanson
Director: Joachim KnoopJefe de redacción: José Natanson
COYUNTURA: Roger Bartra. ¿Una especie en extinción? La izquierda mexicana trasla derrota. Fabián Calle. Rambo, versión sudamericana. El impacto regional del rearmede Venezuela y Chile.APORTES: Ernst Hillebrand. La izquierda después de la «tercera vía».TEMA CENTRAL: Achim Wachendorfer. ¿Hacia una nueva arquitectura sindical enAmérica Latina? Oscar Ermida Uriarte. La política laboral de los gobiernos progre-sistas. Maria Silvia Portela de Castro. El sindicalismo frente al Mercosur. ÁlvaroPadrón Carrau. Los acuerdos de asociación entre América Latina y la Unión Euro-pea: el papel del movimiento sindical. Julio Godio. La importancia estratégica de laPlataforma Laboral de las Américas. Svenja Blanke. El sindicalismo mexicano: entre lamarginación y la recomposición. Reiner Radermacher / Waldeli Melleiro. El sindicalismobajo el gobierno de Lula. Kjeld Jakobsen. ¿Cómo puede enfrentar el sindicalismo alas empresas multinacionales? Didice Godinho Delgado. Sindicalismo y género.Experiencias y desafíos de la Central Única de los Trabajadores de Brasil.
PAGOS: Solicite precios de suscripción y datos para el pago a <[email protected]> o <[email protected]>.
En nuestro próximo número
Gobernar la ciudad En nuestro próximo número Gobernar la ciudad
w w w . n u s o . o r g
w w w . n u s o . o r g
212
Índice
Introducción 3
El nuevo regionalismo: causas y consecuencias Scott L. Baier, Jeffrey H. Bergstrand y Peter Egger 9
Una nueva evaluación del efecto de los acuerdos regionales sobre la estructura de comercio Lionel Fontagné y Soledad Zignago 33
Secuenciación de los acuerdos regionales de cooperación e integración comercial: descripción de un conjunto de datos para una nueva agenda de investigación Antoni Estevadeordal y Kati Suominen 57
Multinacionales, inversión extranjera directa y los nuevos regionalismos en las Américas Lorraine Eden 103
Redes profesionales, diseño institucional y gestión de los asuntos públicos globales. El ALCA y los profesionales del comercio exterior en las Américas Jacint Jordana y David Levi-Faur 133
¿Qué nos dice la integración institucional de Europa en relación con la integración comercial? Francesco Paolo Mongelli, Ettore Dorrucci e Itai Agur 159
Integración regional y desviación de comercio en Europa Ari Kokko, Thomas Mathä y Patrik Gustavsson Tingvall 213
Integración, convergencia e (in)cumplimientos del pacto de estabilidad y crecimiento: coordinación de políticas económicas en la Unión Europea José Ramón García Menéndez 261
Instituto para la Integración de América Latina y el CaribeEsmeralda 130, Pisos 16 y 17
C1035ABD Buenos Aires, República ArgentinaTel. (54 11) 4320-1850 /4320-1874Fax (54 11) 4320-1865 / 4320-1872
e-mail: int/[email protected]://www.iadb.org/intal
Registro de la PropiedadIntelectual: 561292
ISSN: 1026 - 0463Integración & Comercio es una publicación
del Instituto para la Integración de América Latina y el Caribe. Todos los derechos reservados.
ImpresiónAltuna Impresores
Buenos Aires, Argentina
Richard L. BernalAlbert Berry
Victor Bulmer-ThomasJuan José Echavarría
Albert FishlowEduardo LizanoAlister McIntyre
José Antonio OcampoMarcelo de Paiva Abreu
Rubens RicuperoGert Rosenthal
Javier Villanueva
Comité Editorial
Ricardo CarciofiAntoni Estevadeordal
Nohra Rey de MarulandaUziel Nogueira
Comité de Dirección
María de la Paz CovarrubiasMariana R. Eguaras Etchetto
Susana M. Filippa
Edición- Coordinación
N° 26 Año 11
Enero-Junio 2007
Las publicaciones de la Comisión Económica para América Latina y el Caribe (CEPAL) y las del Instituto Latinoamericano y del Caribe de Planificación Económica y Social (ILPES) se pueden adquirir a los distribuidores locales o directamente a través de:
Publicaciones de las Naciones Unidas Publicaciones de las Naciones Unidas 2 United Nations Plaza, Room DC2-853 Sección de Ventas Nueva York, NY, 10017 Palais des Nations Estados Unidos 1211 Ginebra 10 Tel. (1 800)253-9646 Fax (1 212)963-3489 SuizaE-mail: [email protected] Tel. (41 22)917-2613 Fax (41 22)917-0027
Unidad de Distribución Comisión Económica para América Latina y el Caribe (CEPAL) Av. Dag Hammarskjöld 3477, Vitacura 7630412 Santiago
Chile Tel. (56 2)210-2056 Fax (56 2)210-2069 E-mail: [email protected]
Publications of the Economic Commission for Latin America and the Caribbean (ECLAC) and those of the Latin American and the Caribbean Institute for Economic and Social Planning (ILPES) can be ordered from your local distributor or directly through:
United Nations Publications United Nations Publications 2 United Nations Plaza, Room DC2-853 Sales Sections New York, NY, 10017 Palais des Nations USA 1211 Geneva 10 Tel. (1 800)253-9646 Fax (1 212)963-3489 SwitzerlandE-mail: [email protected] Tel. (41 22)917-2613 Fax (41 22)917-0027
Distribution Unit Economic Commission for Latin America and the Caribbean (ECLAC) Av. Dag Hammarskjöld 3477, Vitacura 7630412 Santiago
Chile Tel. (56 2)210-2056 Fax (56 2)210-2069 E-mail: [email protected]

Related Documents


