1 RV568 suppresses COPD inflammation; pre-clinical models and clinical results Catherine E. Charron, Paul Russell, Kazuhiro Ito, Simon Lea, Yasuo Kizawa, Charlie Brindley, Dave Singh Online Data Supplement

Welcome message from author
This document is posted to help you gain knowledge. Please leave a comment to let me know what you think about it! Share it to your friends and learn new things together.
Transcript

1
RV568 suppresses COPD inflammation; pre-clinical models and clinical results
Catherine E. Charron, Paul Russell, Kazuhiro Ito, Simon Lea, Yasuo Kizawa, Charlie Brindley,
Dave Singh
Online Data Supplement

2
Materials and methods
Cell culture and stimulation
THP-1 cells were purchased from ATCC (Manassas, VA, USA), and maintained in 10 % v/v
foetal bovine serum (FBS), RPMI-1640 media (ThermoFisher Scientific, Waltham, MA, USA)
at 37 °C, 5 % CO2. Differentiation was done with 25 mM Vitamin D3 (Sigma Aldrich, St Louis,
MO, USA) for 7 days [S1]. RV568, Birb796 or fluticasone propionate (FP; Sigma Aldrich)
were prepared as 2 mg/ml solutions in neat DMSO and final DMSO assay concentration was
0.5%. Cells were treated with compound at non-toxic concentrations of inhibitors as
determined in separate experiments (data not shown) or vehicle and incubated for one or
two hours (37 °C, 5 % CO2) prior to stimulation. THP-1 cells were stimulated with 3 g/ml of
LPS (E. Coli 0111:B4; Sigma Aldrich) for 4 hrs and the supernatant collected for
determination of TNFconcentration. U937 cell differentiation and treatment were done as
described previously [S2]. Primary airway epithelial cells obtained from healthy subjects
were purchased from Asterand (Royston, UK) or Lonza (Basel, Switzerland), and maintained
in BEGM media (500 ml LHC8, 500 ml LHC9 (ThermoFisher Scientific), 3 l of 3 mg/ml
retinoic acid (Sigma Aldrich), 250 mg bovine serum albumin (BSA; ThermoFisher Scientific)).
Cells were treated with compound or vehicle at non-toxic concentrations of inhibitors as
determined in separate experiments (data not shown) and incubated for two hours (37 °C, 5
% CO2) prior to stimulation. The bronchial cells were stimulated with 50 ng/ml TNF and
incubated for 4 hrs at 37 °C and 5 % CO2 [S3]. BEAS2B, an immortalized bronchial cell line,
was obtained from ATCC and was maintained either in LHC8:RPMI-1640 medium or in
Minimal Essential Medium Eagle (ThermoFisher Scientific) (containing 10 % v/v FBS;
ThermoFisher Scientific); 2 mM L-Glutamine (ThermoFisher Scientific); 100 U/ml penicillin

3
and 100 µg/ml streptomycin (Sigma-Aldrich)). BEAS2Bs were stimulated with 1 µg/ml of Poly
I:C (InvivoGen, San Diego, CA, USA)-Oligofectamine (ThermoFisher Scientific) solution and
incubated for 20-24hrs at 37 °C and 5 % CO2 [S4].
Peripheral blood mononuclear cell (PBMC) isolation and treatment
PBMCs were isolated from healthy volunteers or COPD patients (GOLD Stages 3-4) using
ACCUSPIN System-Histopaque (Sigma Aldrich) as previously described [S5]. COPD patients
were recruited at the Brompton hospital and the study was approved by the Brompton
Harefield & NHLI Research Ethics Committee. Healthy volunteers were recruited at Quintiles
Drug Research Unit at Guy’s Hospital, the study approved by the local Ethics Committee and
blood samples were purchased by RespiVert Ltd. All subjects gave written informed consent.
PBMCs were seeded at a density of 5 x 10⁴ cells/well in 200 µl of RPMI-1640 medium
containing 5 % v/v FBS. Healthy PBMCs were stimulated with 0.1 μg/ml LPS and COPD
PBMCs with 1 μg/ml LPS for 4 hrs and the supernatant collected for determination of
cytokine concentration.
Cytokine and ICAM1 ELISAs
TNF, CXCL8 and IL-6 ELISAs were performed using Human Duoset ELISA Kits (R&D Systems,
Abingdon, UK), as per the manufacturer’s recommended protocol using an appropriate
dilution of the cell culture supernatants. Lower limits of detection were 15.6 pg/ml for
TNF, 32.5 pg/ml for CXCL8 and 9.375 pg/ml for IL-6. The inhibition of cytokine production
was calculated at each concentration by comparison with vehicle control. The 50%
inhibitory concentration (IC50) was determined from the resultant concentration-response
curves using XL-Fit (idbs, Guildford, UK). For the combination experiments, an analysis to
assess whether the combination of drugs results in a significantly greater maximal effect

4
than either compound alone as monotherapies was done using CalcuSyn 2.11 Software
(BioSoft, Cambridge, UK). The combination indexes (CI) are a quantitative measure of the
degree of drug interaction in terms of additive effect (CI = 1), synergism (CI < 1), or
antagonism (CI > 1) for a given endpoint of the effect measurement.
For the ICAM1 cell-based ELISA, the cells were fixed with 4 % formaldehyde in phosphate
buffered saline (PBS). After 20 min shaking at room temperature, the cells were washed 3
times with wash buffer (0.05 % tween-20 in PBS) with a multidispenser (Multidrop Combi
Reagent Dispenser, ThermoFisher Scientific, Waltham, MA). Endogenous peroxidases were
quenched with 100 µl of Quench buffer (0.1 % NaAzide, 1 % H2O2 in wash buffer) for 20 min.
Cells were washed and blocked for 1 hr at room temperature with 5 % milk in wash buffer.
Primary antibody (anti-CD54, Cell Signaling Technology, Danvers, MA) was then applied
overnight in 1 % BSA-PBS at 1:500 dilution. Cells were washed and secondary antibody was
applied (1:2000 anti-rabbit-HRP antibody, Dako UK Limited, Ely, UK, in 1% BSA-PBS) for 1 hr
at RT. Cells were washed 3 times in wash buffer, and washed once with PBS. 50 l of
development reagent (1:1 A and B solutions, R&D Systems) was applied, and upon colour
development, 50 l stop reagent (1N H2SO4) was added. Plates were read at 450 nm and
655 nm (reference wavelength) using Varioskan (ThermoFisher Scientific). After washing, a 2
% crystal violet solution in PBS (ThermoFisher Scientific) was added and incubated for 1 hr
at RT. Cells were washed 2 times with PBS and 1 % SDS solution was applied for 1 hr at RT.
Plates were read at 595 nm. Each corrected absorbance value (OD450-OD655) was
normalized to cell number by dividing by the crystal violet values ( (OD450-OD655)/OD595 )
The inhibition of ICAM1 was calculated at each concentration by comparison with mock
transfection control. The 50% inhibitory concentration (IC50) was determined from the
resultant concentration-response curve.
5
Sputum macrophage isolation and treatment
Severe COPD patients were defined by GOLD guideline (http://www.goldcopd.com). COPD
patients (GOLD Stages 3-4) were recruited at the Brompton hospital and the study was
approved by the Brompton Harefield & NHLI Research Ethics Committee. All subjects gave
written informed consent.
Sputum samples were homogenized and mixed vigorously using a vortex mixer to disperse
the cells in 0.01% dithiothreitol (DTT) in PBS followed by centrifugation at 1500 rpm at 4 °C
for 10 min to obtain sputum cell pellet. The pellet was washed twice with PBS. The sputum
cells were resuspended in macrophage serum-free medium (macrophage-SFM,
ThermoFisher Scientific) containing 20 U/ml penicillin, 0.02 mg/ml streptomycin and 5
μg/ml Amphotericin B and seeded on high bound 96-well plate, followed by incubation for 2
hrs at 37 °C, 5 % CO2 to allow macrophages to attach at the bottom of the plate. The cells
on the plate were washed with fresh macrophage-SFM to remove neutrophils. The
adherent cells (mainly sputum macrophages) on the plate were pre-incubated with
compounds or DMSO for 2 hrs at concentrations which were non-toxic (not shown), and
then LPS (1 µg/ml) was added, followed by 4 hrs incubation and the supernatant collected
for determination of cytokine concentration [S6].
LPS model and cigarette smoke mouse models
The LPS mouse model and the cigarette smoke mouse model were previously described
[S7]. For the biomarker analyses in the bronchoalveolar lavage supernatants, Quantikine
mouse ELISA kits from R&D Systems were used following the manufacturer’s instructions.
MMP12 was measured using MMP12 ELISA kit (USCN Life Science Inc., Houston, TX, USA)
6
and malondialdehyde (MDA) was measured with a fluorimetric assay (TBARS Assay kit, Cell
Biolabs Inc., San Diego, CA, USA).
Clinical trial
Exclusion criteria are listed in Supplementary Table S2; patients with significant medical
conditions in addition to COPD were excluded. The use of systemic corticosteroids, oral
beta-2 agonists, theophyllines, phosphodiesterase inhibitors, oral leukotriene inhibitors or
antibiotic therapies was prohibited throughout the study. All delivered doses were
administered using a Philips Respironics I-neb adaptive aerosol delivery (AAD) system as
described below. Subjects attended the research unit daily during the study periods. Pre-
defined criteria were used to withdraw subjects during the treatment period to ensure
safety: (a) exacerbations requiring treatment with oral corticosteroids and / or antibiotics,
(b) a decrease in post-bronchodilator FEV1 >20% or (c) FEV1 <35% predicted.
Clinical dose administration
RV568 or placebo was administered once daily for 14 days using the Philips Respironics I-
neb adaptive aerosol delivery (AAD) system using a single 400 µL aliquot of the appropriate
concentration for each dosing occasion. Inhalation continued until no further suspension
(RV568) /solution (placebo) was contained in the I-neb AAD system and all doses are
considered as ex device (delivered) doses.
Pharmacokinetic methods
Blood sampling
Blood samples were taken from each patient at the following times after single and
repeated doses of RV568 on Days 1 and 14: Pre-dose and at 0.25, 0.5, 0.75, 1, 2, 4, 6, 8, 10,

7
12 and 24 h post-end of inhalation (dose was administered as an inhalation over a period of
approximately 5 min). Pre-dose blood samples were taken from each patient on Day 4.
Blood samples were also taken from each patient on Day 7 at pre-dose and at 1 and 2 h
post-dose. An additional blood sample was taken from each patient on Days 21 and 28.
Analytical methods
Concentrations of RV568 were quantified in plasma using LC/MS/MS by Janssen Research
and Development, Beerse, Belgium. The lower limit of quantification of the assay was 5
pg/mL.
Pharmacokinetic parameters
Pharmacokinetic parameters were estimated for each patient using a fully validated version
of WinNonlin Pro (Version 5.2.1 2008, Pharsight Corporation Inc., Mountain View, CA, USA)
[S8]. The following parameters were derived, where appropriate, from the individual plasma
concentration versus time profiles:
Parameter Definition
Cmax The maximum observed concentration.
Cmin The minimum (trough) concentration within a dosing interval.
tmax The time at which Cmax was apparent.
AUC0-t The area under the concentration versus time curve from time zero to the
sampling time at the last quantifiable concentration (Ct) at tlast calculated by
the mixed linear/log trapezoidal trapezoidal rule.

8
AUC0- The area under the concentration versus time curve from time zero to 24 h
post-dose (the dosing interval), calculated by the mixed linear/log trapezoidal
trapezoidal rule (if a plasma concentration was not available at 24 h post-dose,
the value would be estimated by extrapolation from the last quantifiable
concentration.
λz The apparent terminal rate constant, estimated using the negative slope of the
least square regression analysis of the log concentration versus time data for
the terminal linear portion of the curve.
t½ The apparent terminal half-life, calculated from Loge 2 / λz.
AUC0- The area under the concentration-time curve estimated from time zero to
infinity as the sum of the two areas: AUC0-t and AUCextrap, where AUCextrap is
calculated as Ct / λz.
RO The extent of accumulation in plasma calculated as:
AUC0- (Day 14) / AUC0- (Day 1).
Consideration was given to the estimation of λz and corresponding t½ values. Three or more
points were required within the terminal phase for λz and t½ to be estimated. The following
additional variables were tabulated to aid identification of potentially unreliable estimates
of t½ and AUC0-:
Number data
points
The number of data points used in the calculation of λz.
λz lower The lower limit on time for values included in the calculation of λz.
λz higher The upper limit on time for values included in the calculation of λz.
λz period Estimated as (λz higher - λz lower) / t½. Values < 2 will indicate that
λz and corresponding t½ estimates are potentially unreliable [2].
Rsq The square of the correlation coefficient for the terminal elimination
phase regression line (adjusted for number of data points).
9
AUCextrap The extrapolated area from tlast to infinity estimated as
Ct/ λz.
Actual sampling times (post-start inhalation) were used for the PK analysis. Plasma
concentrations below the limit of quantification of the assay (BLQ) were taken as zero for
calculation of concentration summary statistics and all PK parameters. All calculations were
made using raw data.
Summary statistics
All individual plasma and PK parameter estimates were listed and summarized. Plasma
concentration data was summarized by sampling time, day of sampling and dose level, as
appropriate; PK parameters were summarized by dose level and day of sampling, as
appropriate. Summary statistics included the arithmetic mean, arithmetic standard
deviation (SD) and arithmetic coefficient of variation (CV). Summaries for the PK
parameters also displayed the median, minimum and maximum. Geometric mean and
geometric coefficient of variation ( 100*1)exp(2
ln SDCV , where SDln is the standard
deviation of the natural logarithmically transformed data) were reported for all PK
parameters except tmax and Cmin. Between-patient variability was based on geometric mean
CVs. Mean and individual plasma concentration versus time profiles were illustrated using
both linear-linear and logarithmic-linear scales.
Clinical trial sputum cell isolation and biomarker assays
Induced sputum was collected using nebulised 0.9 % saline based on a standard method
[S9]. Briefly, sputum plugs were weighed, mixed with 0.1 % dithiothreitol at 4 x the sputum
weight, and centrifuged at approximately 790 g for 10 minutes at 4 °C. The pellet and
10
supernatant were retained for analysis. The sputum supernatant was stored at –70 °C to –80
°C.
Sputum samples were analysed for cell counts (e.g., neutrophils, macrophages, lymphocytes
and eosinophils) and markers of inflammation and oxidative stress (CXCL8: interleukin [IL]-
8, IFN: interferon beta, IP10, MMP1, MDA: malondialdehyde).
For sputum supernatant biomarker analyses by luminex (IFN, Affymetrix; IP10,
ThermoFisher Scientific; CXCL8, Merck, Darmstadt, Germany; and MMP1, R&D Systems),
the samples were thawed on ice and centrifuged for 1 or 2 min at 4 °C, 13000 rpm, before
use. All samples were run together and the assays were set-up following manufacturer’s
instructions. Briefly, the magnetic or polystyrene antibody beads were incubated in 96-well
plates with standard, background solution or appropriate volume of sample, in duplicate.
These were incubated for 2 hours with shaking at RT or overnight at 4 °C. After washing
twice using a magnetic plate washer or vacuum manifold, the beads were incubated for one
hour with biotin solution with shaking at RT. A streptavidin solution was then added and
incubated further. After washing, the beads were re-suspended in buffer and analysed
immediately. The luminex system was set up for the correct bead numbers and suggested
bead count. The amount of each biomarker in the samples was calculated using Xcel Fit
software with 4- or 5-parameter equations using the appropriate standard curves.
For the MDA assay, 20 l of samples or standards were mixed and incubated with equal
volume of SDS lysis solution for 5 min at RT with shaking in PCR plates. TBA reagent was
then added and mixed with the samples and after 5-15 min at RT was set up for 1 hour at
100 C in a PCR cycler. The plates were then incubated for 15 min at 4 C in a refrigerator.
50 l of this solution was then transferred to a half-area 96-well black plate and MDA was
11
detected by fluorescence with 540 nm excitation and 590 nm emission. The amount of MDA
in the samples was calculated using Xcel Fit software with a 5-parameter equation using the
standard curve.
Results
Effects of RV568 in monocyte and macrophage cells
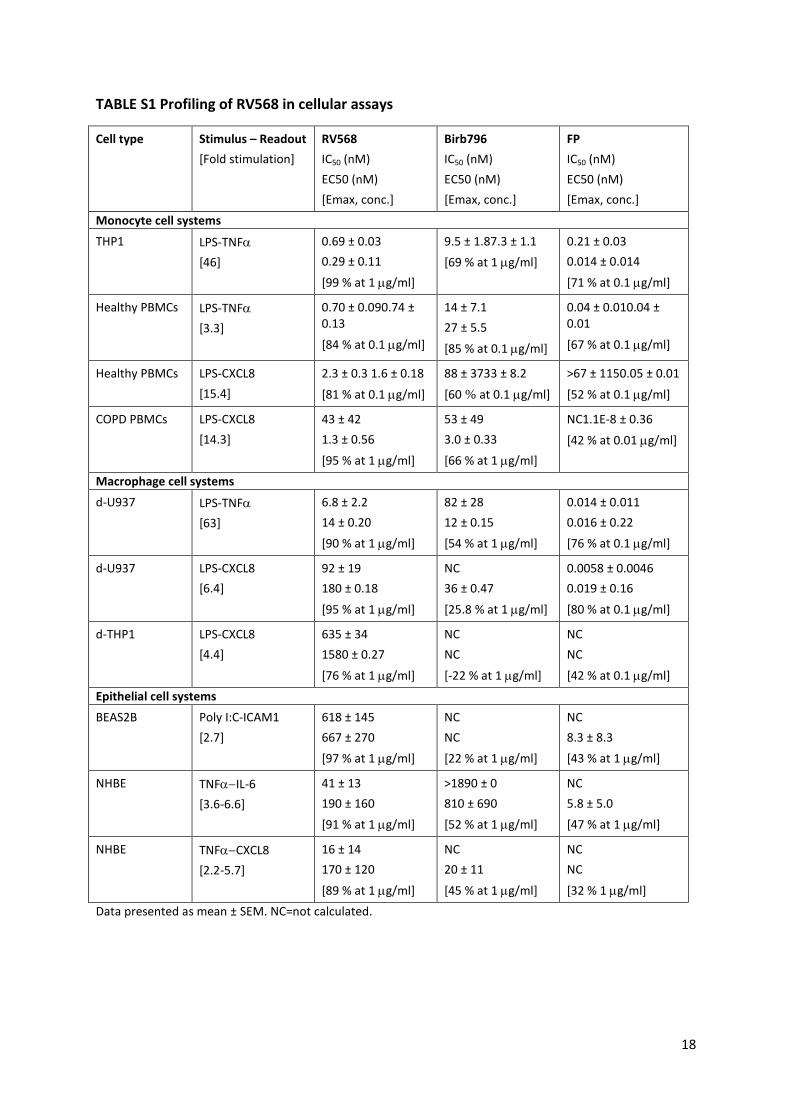
RV568, Birb796 and FP effects on LPS stimulated cytokine release in monocytic and
macrophage-like cells are summarised in Table S1. Using monocyte cell systems (THP1 cells
and PBMCs), FP demonstrated high potency for TNFα inhibition, with IC50 values 0.04 – 0.21
nM, and maximum inhibitory effect (Emax) 67-71%. Birb796 demonstrated similar Emax,
but was less potent with IC50 values 9.5-14 nM. RV568 showed approximately 10-fold
greater potency than Birb796 (IC50 values approximately 0.7 nM), with Emax values reaching
84-99% inhibition.
THP1 cells were differentiated into macrophage-like cells to examine LPS-induced CXCL8
release; Birb796 and FP had little effect on CXCL8 release, while RV568 caused
concentration-dependent inhibition.
The anti-inflammatory effects of RV568, Birb796 and FP on epithelial cell systems are
summarised in Table S1.
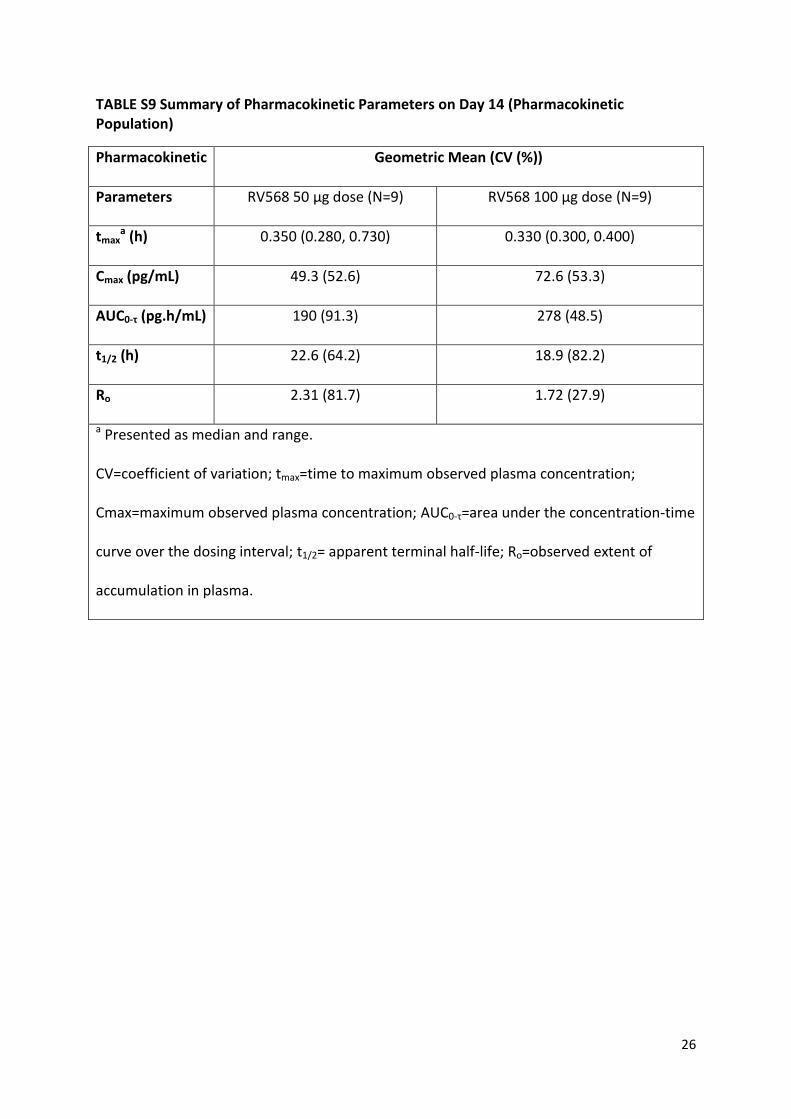
Clinical trial pharmacokinetics
Tmax was reached at approximately 20 mins. The terminal half-life was estimated at
approximately 19-23 hrs after 14 days, although the period over which the half-life was
calculated (24 hrs) does not allow for reliable estimation for half-lives >12 hrs. Systemic

12
exposure was 2.3 and 1.7 fold greater on day 14 compared to day 1 for the 50 g and 100
g doses respectively. The pre-dose concentrations suggested that steady state was reached
after 7 days. The extent of accumulation of RV568 in plasma and the time to attain steady
state was consistent with the estimated half-life (tables S8-S9).
13
Figures and tables
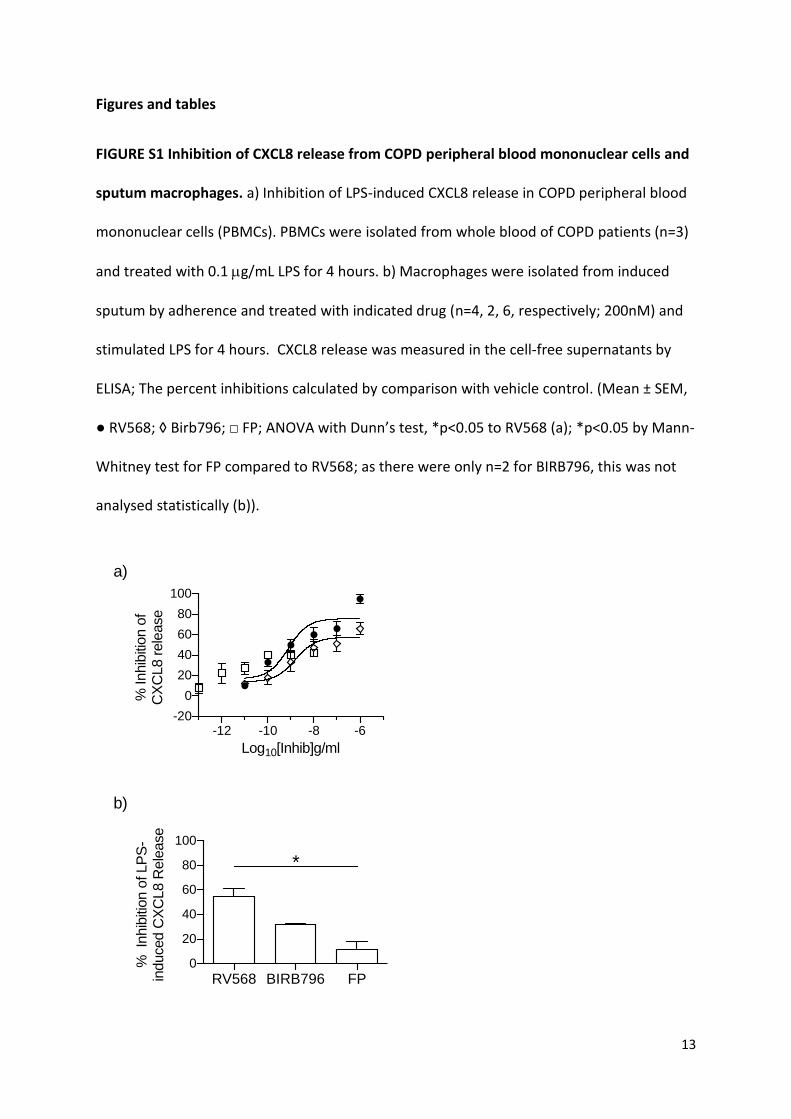
FIGURE S1 Inhibition of CXCL8 release from COPD peripheral blood mononuclear cells and
sputum macrophages. a) Inhibition of LPS-induced CXCL8 release in COPD peripheral blood
mononuclear cells (PBMCs). PBMCs were isolated from whole blood of COPD patients (n=3)
and treated with 0.1 g/mL LPS for 4 hours. b) Macrophages were isolated from induced
sputum by adherence and treated with indicated drug (n=4, 2, 6, respectively; 200nM) and
stimulated LPS for 4 hours. CXCL8 release was measured in the cell-free supernatants by
ELISA; The percent inhibitions calculated by comparison with vehicle control. (Mean ± SEM,
● RV568; ◊ Birb796; □ FP; ANOVA with Dunn’s test, *p<0.05 to RV568 (a); *p<0.05 by Mann-
Whitney test for FP compared to RV568; as there were only n=2 for BIRB796, this was not
analysed statistically (b)).
-12 -10 -8 -6-20
0
20
40
60
80
100
Log10[Inhib]g/ml
% Inhib
ition o
fC
XC
L8 r
ele
ase
a)
RV568 BIRB796 FP0
20
40
60
80
100
% In
hib
ition o
f LP
S-
induced C
XC
L8 R
ele
ase
b)
*

14
FIGURE S2 Inhibition of PolyIC-induced ICAM1 expression in BEAS2B cells. BEAS2B cells
(n=3) were stimulated with 1 g/ml PolyIC for 18 hours. ICAM1 expression was measured by
cell-based ELISA; The percent inhibitions calculated by comparison with vehicle controls.
(Mean ± SEM, ANOVA with Dunn’s test, *p<0.05 to RV568; ● RV568; ◊ Birb796; □ FP).
- 3 - 2 - 1 0
- 5 0
0
5 0
1 0 0
1 5 0
L o g 10 [ In h ib ]g /m l
% I
nh
ibit
ion
of
ICA
M1
ex
pre
ss
ion

15
FIGURE S3 Inhibition of Poly I:C-induced cytokine release in BEAS2B cells. Cells were pre-
incubated with dexamethasone alone, RV568 alone and both drugs combined at all
indicated concentrations for 1 hour prior to stimulation with Poly I:C. a) Inhibition of Poly
I:C-induced CXCL8. b) Inhibition of Poly I:C-induced IL-6. Cytokine release was measured in
the cell-free supernatants by ELISA; The percent inhibitions calculated by comparison with
vehicle control. (Mean ± SEM; n=8; ANOVA with Dunn’s test, *p<0.05 to RV568;
Dexamethasone; RV568; Dexamethasone + 3 nM RV568; Dexamethasone + 10 nM
RV568; Dexamethasone + 30 nM RV568; Dexamethasone + 100 nM RV568;
Dexamethasone + 300 nM RV568; Dexamethasone + 1000 nM RV568).
10 100 1000
-60
-40
-20
0
20
40
60
80
100
Drug (nM)
% Inhib
ition o
f P
oly
I:C
induced IL-6
b)
*p<0.05
10 100 1000
-60
-40
-20
0
20
40
60
80
100
Drug (nM)
% Inhib
ition o
f P
oly
I:C
induced C
XC
L8
a)
*p<0.05

16
FIGURE S4 RV568 inhibits LPS-induced neutrophilia in the mouse. Mice (n=8) were
intratracheally administered a solution of vehicle or RV568 2 hours prior to endotoxin
exposure via inhalation. BAL was collected 8 hours after the endotoxin challenge and
neutrophil influx measured. (Mean ± SEM, ANOVA with Dunnets test, *p<0.05 to vehicle
control).
0
1 0
2 0
3 0
4 0
Ne
utr
op
hil
s (
x1
05/m
l)
V e h ic le 1 4 2 0
R V 5 6 8
g /m o u s e
*
17
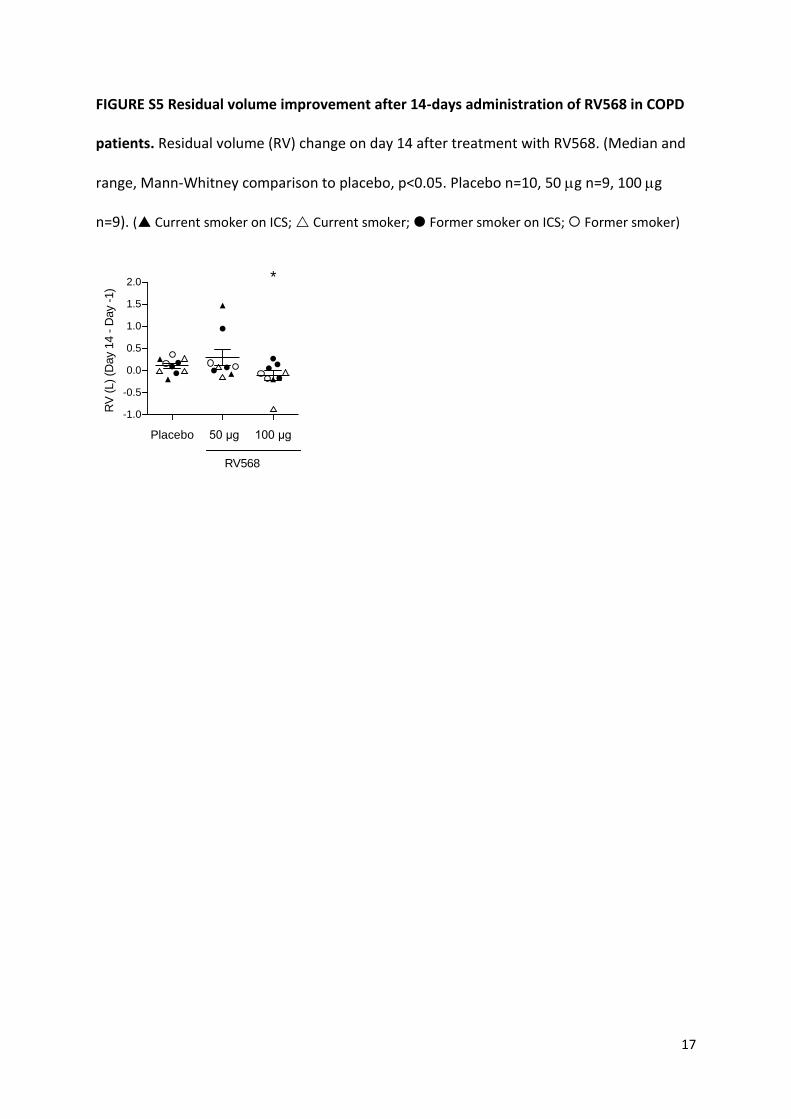
FIGURE S5 Residual volume improvement after 14-days administration of RV568 in COPD
patients. Residual volume (RV) change on day 14 after treatment with RV568. (Median and
range, Mann-Whitney comparison to placebo, p<0.05. Placebo n=10, 50 g n=9, 100 g
n=9). ( Current smoker on ICS; Current smoker; Former smoker on ICS; Former smoker)
Placebo 50 µg 100 µg
-1.0
-0.5
0.0
0.5
1.0
1.5
2.0
RV
(L)
(Day 1
4 -
Day -
1)
RV568
*
18
TABLE S1 Profiling of RV568 in cellular assays
Cell type Stimulus – Readout
[Fold stimulation]
RV568
IC50 (nM)
EC50 (nM)
[Emax, conc.]
Birb796
IC50 (nM)
EC50 (nM)
[Emax, conc.]
FP
IC50 (nM)
EC50 (nM)
[Emax, conc.]
Monocyte cell systems
THP1 LPS-TNF
[46]
0.69 ± 0.03
0.29 ± 0.11
[99 % at 1 g/ml]
9.5 ± 1.87.3 ± 1.1
[69 % at 1 g/ml]
0.21 ± 0.03
0.014 ± 0.014
[71 % at 0.1 g/ml]
Healthy PBMCs LPS-TNF
[3.3]
0.70 ± 0.090.74 ± 0.13
[84 % at 0.1 g/ml]
14 ± 7.1
27 ± 5.5
[85 % at 0.1 g/ml]
0.04 ± 0.010.04 ± 0.01
[67 % at 0.1 g/ml]
Healthy PBMCs LPS-CXCL8
[15.4]
2.3 ± 0.3 1.6 ± 0.18
[81 % at 0.1 g/ml]
88 ± 3733 ± 8.2
[60 % at 0.1g/ml]
>67 ± 1150.05 ± 0.01
[52 % at 0.1 g/ml]
COPD PBMCs LPS-CXCL8
[14.3]
43 ± 42
1.3 ± 0.56
[95 % at 1 g/ml]
53 ± 49
3.0 ± 0.33
[66 % at 1 g/ml]
NC1.1E-8 ± 0.36
[42 % at 0.01 g/ml]
Macrophage cell systems
d-U937 LPS-TNF
[63]
6.8 ± 2.2
14 ± 0.20
[90 % at 1 g/ml]
82 ± 28
12 ± 0.15
[54 % at 1 g/ml]
0.014 ± 0.011
0.016 ± 0.22
[76 % at 0.1 g/ml]
d-U937 LPS-CXCL8
[6.4]
92 ± 19
180 ± 0.18
[95 % at 1 g/ml]
NC
36 ± 0.47
[25.8 % at 1 g/ml]
0.0058 ± 0.0046
0.019 ± 0.16
[80 % at 0.1 g/ml]
d-THP1 LPS-CXCL8
[4.4]
635 ± 34
1580 ± 0.27
[76 % at 1 g/ml]
NC
NC
[-22 % at 1 g/ml]
NC
NC
[42 % at 0.1 g/ml]
Epithelial cell systems
BEAS2B Poly I:C-ICAM1
[2.7]
618 ± 145
667 ± 270
[97 % at 1 g/ml]
NC
NC
[22 % at 1 g/ml]
NC
8.3 ± 8.3
[43 % at 1 g/ml]
NHBE TNFIL-6
[3.6-6.6]
41 ± 13
190 ± 160
[91 % at 1 g/ml]
>1890 ± 0
810 ± 690
[52 % at 1 g/ml]
NC
5.8 ± 5.0
[47 % at 1 g/ml]
NHBE TNFCXCL8
[2.2-5.7]
16 ± 14
170 ± 120
[89 % at 1 g/ml]
NC
20 ± 11
[45 % at 1 g/ml]
NC
NC
[32 % 1 g/ml]
Data presented as mean ± SEM. NC=not calculated.

19
TABLE S2 Patient exclusion criteria
Exclusion criteria Number of subjects
Couldn’t follow protocol requirements 2
Alcohol intake > 21 units per week 2
Heart rate/blood pressure/ECG
abnormalities
13
Plethysmography 4
Spirometry 12
Laboratory parameters 12
Withdrew consent 4
Other medical condition/medical history 22
TABLE S3 Characteristics of COPD patients for in vitro experiments. Mean ± SEM.
PBMC donors Sputum macrophage donors
Age 67 ± 5.3 66 ± 5.6
Sex (F:M) 0:3 2:4
FEV1 (L) 1.07 ± 0.10 1.07 ± 0.12
FEV1 (%predicted) 33 ± 3.8 37 ± 3.3
FVC (L) 3.20 ± 0.30 2.92 ± 0.37
FVC (%) 76 ± 6.7 78 ± 7.0
FEV/FVC (%) 35 ± 6.9 38 ± 3.7
20
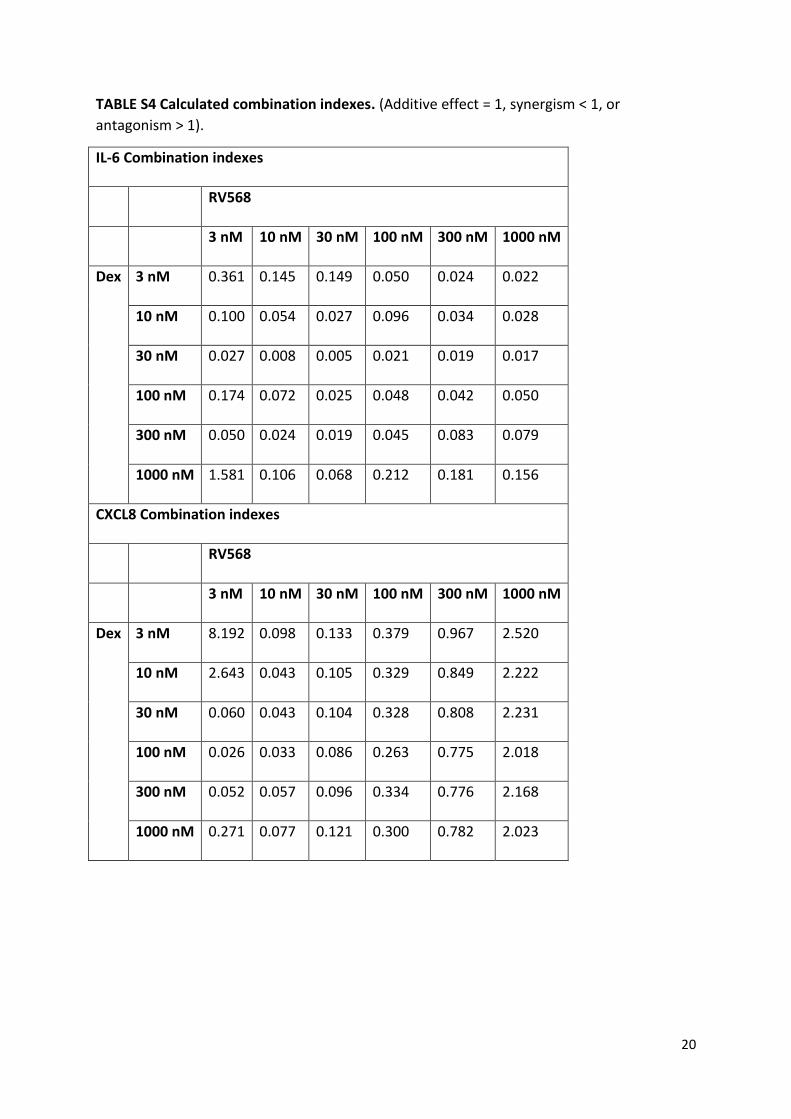
TABLE S4 Calculated combination indexes. (Additive effect = 1, synergism < 1, or
antagonism > 1).
IL-6 Combination indexes
RV568
3 nM 10 nM 30 nM 100 nM 300 nM 1000 nM
Dex 3 nM 0.361 0.145 0.149 0.050 0.024 0.022
10 nM 0.100 0.054 0.027 0.096 0.034 0.028
30 nM 0.027 0.008 0.005 0.021 0.019 0.017
100 nM 0.174 0.072 0.025 0.048 0.042 0.050
300 nM 0.050 0.024 0.019 0.045 0.083 0.079
1000 nM 1.581 0.106 0.068 0.212 0.181 0.156
CXCL8 Combination indexes
RV568
3 nM 10 nM 30 nM 100 nM 300 nM 1000 nM
Dex 3 nM 8.192 0.098 0.133 0.379 0.967 2.520
10 nM 2.643 0.043 0.105 0.329 0.849 2.222
30 nM 0.060 0.043 0.104 0.328 0.808 2.231
100 nM 0.026 0.033 0.086 0.263 0.775 2.018
300 nM 0.052 0.057 0.096 0.334 0.776 2.168
1000 nM 0.271 0.077 0.121 0.300 0.782 2.023

21
TABLE S5 RV568 with and without FP attenuates smoking-induced inflammatory mediator production in the mouse. Mean ± SEM, n=5 per group.
Concentration % Inhibition 1
(pg/mL) RV568 (μg/mouse)
FP (µg/mouse)
RV568 + FP (µg/mouse)
Air Smoke 0.07 0.7 7 1.75 0.07 +1.75
0.7 +1.75
CXCL1 10.03 ± 0.12 19.53 ± 0.32 18 ± 3.9
46 ± 1.8
68 ± 2.4
5 ± 5 52 ± 3.0
79 ± 1.3
MCP1 1.93 ± 0.08 6.62 ± 0.21 24 ± 4.9
48 ± 3.0
68 ± 2.3
-1 ± 5 53 ± 6.4
69 ± 6.3
TNF alpha 1.64 ± 0.07 3.89 ± 0.12 26 ± 3.6
47 ± 2.6
64 ± 4.6
4 ± 6 46 ± 3.8
73 ± 4.0
IL-17 1.29 ± 0.08 2.77 ± 0.07 25 ± 3.1
47 ± 3.0
71 ± 4.1
0 ± 7 54 ± 4.6
82 ± 3.7
Osteopontin 11.88 ± 0.16 21.96 ± 0.47 34 ± 3.4
57 ± 3.3
79 ± 3.2
-5 ± 5 60 ± 4.5
80 ± 4.1
MMP12 3.79 ± 0.27 16.57 ± 0.86 24 ± 4.7
38 ± 4.7
62 ± 5.0
-6 ± 7.1 49 ± 4.7
71 ±4.6
MDA2 0.29 ± 0.01 1.52 ± 0.10 28 ±
4.6 46 ± 4.4
73 ± 4.0
-2 ± 4.6 53 ± 3.2
77 ± 1.8
IFNβ3 1.98 ± 0.02 1.42 ± 0.11 34 ± 10 62 ±
9.1 79 ± 10
10 ± 17 47 ± 18
83 ± 20
1Percentage inhibition with respect to cigarette smoke control after subtracted air control value was calculated
individually, and mean values of percent inhibition are shown.
2MDA values reported in M
3As IFNβ was reduced by smoke, restoration % was calculated.

22
TABLE S6 Summary of Treatment Emergent Adverse Events (TEAEs) Reported in More Than One Subject (Safety Population)
System Organ
Class
Preferred Term Placebo RV568
50 µg
RV568
100 µg
All RV568-
Treated
Subjects
(N=10) (N=10) (N=10) (N=20)
n (%) n (%) n (%) n (%)
Number of subjects with TEAEs 6 (60) 8 (80) 8 (80) 16 (80)
Gastrointestinal disorders
Toothache 0 1 (10) 1 (10) 2 (10)
General disorders and administration site conditions
Catheter site haematoma 0 0 2 (20) 2 (10)
Chest discomfort 1 (10) 1 (10) 0 1 (5)
Infections and infestations
Oral herpes 0 1 (10) 1 (10) 2 (10)
Musculoskeletal and connective tissue disorders
Arthralgia 0 1 (10) 1 (10) 2 (10)
Back pain 1 (10) 0 2 (20) 2 (10)
Nervous system disorders
Headache 2 (20) 3 (30) 3 (30) 6 (30)
Dizziness 0 2 (20) 2 (20) 4 (20)
Respiratory, thoracic and mediastinal disorders
Cough 2 (20) 5 (50) 2 (20) 7 (35)
Rhinorrhoea 0 2 (20) 1 (10) 3 (15)
Chronic obstructive pulmonary
disease
3 (30) 1 (10) 1 (10) 2 (10)
Notes: TEAE=Treatment-emergent adverse event. A subject experiencing multiple occurrences of an
adverse event was counted, at most, once per system organ class and preferred term.

23
TABLE S7 Summary of Post-Hoc Analysis of Selected Sputum Biomarkers in 17 Paired Samples
Biomarker Time Point Statistic Placebo RV568 50 µg RV568 100 µg RV568 combined
IFN-β Baseline N 6 7 4 11 (pg/mL) GMean 24.689 25.390 9.574 17.809 Median 32.244 23.660 14.349 17.139 Min 2.629 13.195 2.629 2.629 Max 97.033 70.642 15.548 70.642 Day 14 N 6 7 4 11 (pg/mL) GMean 31.623 25.856 37.627 29.635 Median 40.179 20.808 42.742 36.373 Min 13.277 2.629 13.387 2.629 Max 58.390 125.991 82.138 125.991 Ratio N 6 7 4 11 GMean 1.281 1.018 3.930 1.664 Median 1.186 1.258 4.041 2.967 Min 0.525 0.111 2.967 0.111 Max 5.050 4.801 5.283 5.283 p-value 0.6780 0.2564 0.8321
CXCL8 Baseline N 6 7 4 11 (pg/mL) GMean 3122.570 2383.063 4286.767 2950.263 Median 3525.559 3627.745 8511.845 5405.155 Min 605.650 459.436 344.745 344.745 Max 7857.677 10623.014 15597.729 15597.729 Day 14 N 6 7 4 11 (pg/mL) GMean 3522.031 1394.314 2924.398 1825.298 Median 2442.714 2407.403 5475.683 2678.092 Min 646.072 260.778 350.987 260.778 Max 78448.697 4446.344 7849.390 7849.390 Ratio N 6 7 4 11 GMean 1.128 0.585 0.682 0.619 Median 0.908 0.568 0.744 0.568 Min 0.445 0.157 0.312 0.157 Max 9.984 3.505 1.452 3.505 p-value 0.1855 0.6455 0.2721
IP10 Baseline N 6 7 4 11 (pg/mL) GMean 50.907 38.622 29.888 35.184 Median 56.252 35.871 34.008 35.871 Min 2.580 7.182 5.442 5.442 Max 624.582 180.093 222.038 222.038 Day 14 N 6 7 4 11 (pg/mL) GMean 30.436 89.260 61.438 77.924 Median 69.198 149.633 69.375 104.945 Min 2.043 14.834 23.777 14.834 Max 255.869 675.186 168.909 675.186 Ratio N 6 7 4 11 GMean 0.598 2.311 2.056 2.215 Median 0.754 2.065 2.373 2.065 Min 0.033 0.831 0.761 0.761 Max 2.527 18.823 4.369 18.823 p-value 0.0748 0.1873 0.0583
Continued

24
TABLE S7 Summary of Post-Hoc Analysis of Selected Sputum Biomarkers in 17 Paired Samples (contd.)
Biomarker Time Point Statistic Placebo RV568 50 µg RV568 100 µg RV568 combined
MDA Baseline N 6 7 4 11 (µM) GMean 0.103 0.140 0.135 0.138 Median 0.141 0.144 0.139 0.141 Min 0.037 0.074 0.089 0.074 Max 0.177 0.240 0.191 0.240 Day 14 N 6 7 4 11 (µM) GMean 0.113 0.072 0.085 0.076 Median 0.128 0.062 0.093 0.076 Min 0.049 0.039 0.057 0.039 Max 0.243 0.127 0.111 0.127 Ratio N 6 7 4 11 GMean 1.095 0.510 0.633 0.552 Median 0.976 0.528 0.613 0.550 Min 0.800 0.339 0.550 0.339 Max 1.986 0.759 0.778 0.778 p-value 0.0008 0.0180 0.0009
MMP1 Baseline N 6 7 4 11 (pg/mL) GMean 31.578 27.057 36.517 30.174 Median 37.781 29.395 45.297 34.167 Min 10.175 10.365 16.255 10.365 Max 98.700 63.796 56.742 63.796 Day 14 N 6 7 4 11 (pg/mL) GMean 27.225 14.247 31.964 19.114 Median 52.818 12.376 43.560 14.696 Min 4.034 7.813 9.131 7.813 Max 116.113 30.610 62.741 62.741 Ratio N 6 7 4 11 GMean 0.862 0.527 0.875 0.633 Median 1.039 0.588 1.381 0.664 Min 0.078 0.199 0.161 0.161 Max 8.418 1.418 2.146 2.146 p-value 0.3163 0.8545 0.5372
No adjustments for multiplicity were made. All p-values are nominal. For MDA, IP10 and MMP1, an ANCOVA method was used to analyse the log-transformed data with screening values as a covariate. For IFN-β and IL-8, a rank analysis of covariance was conducted with log-transformed data with screening value as a covariate.

25
TABLE S8 Summary of Pharmacokinetic Parameters on Day 1 (Pharmacokinetic Population)
Pharmacokinetic Geometric Mean (CV (%))
Parameters RV568 50 μg dose (N=10) RV568 100 μg dose (N=10)
tmaxa (h) 0.330 (0.270, 0.370) 0.360 (0.300, 0.770)
Cmax (pg/mL) 50.4 (61.4) 67.2 (62.7)
AUC0-τ (pg.h/mL) 85.4 (95.0) 149 (52.2)
AUC0–∞
(pg.h/mL)
131 (69.2) 195 (49.8)
t1/2 (h) 4.07 (50.4) 5.02 (67.1)
a Presented as median and range.
CV=coefficient of variation; tmax=time to maximum observed plasma concentration;
Cmax=maximum observed plasma concentration; AUC0-τ=area under the concentration-time
curve over the dosing interval; AUC0–∞=AUC from time zero extrapolated to infinity;
t1/2=apparent terminal half-life.
26
TABLE S9 Summary of Pharmacokinetic Parameters on Day 14 (Pharmacokinetic Population)
Pharmacokinetic Geometric Mean (CV (%))
Parameters RV568 50 μg dose (N=9) RV568 100 μg dose (N=9)
tmaxa (h) 0.350 (0.280, 0.730) 0.330 (0.300, 0.400)
Cmax (pg/mL) 49.3 (52.6) 72.6 (53.3)
AUC0-τ (pg.h/mL) 190 (91.3) 278 (48.5)
t1/2 (h) 22.6 (64.2) 18.9 (82.2)
Ro 2.31 (81.7) 1.72 (27.9)
a Presented as median and range.
CV=coefficient of variation; tmax=time to maximum observed plasma concentration;
Cmax=maximum observed plasma concentration; AUC0-τ=area under the concentration-time
curve over the dosing interval; t1/2= apparent terminal half-life; Ro=observed extent of
accumulation in plasma.

27
Supplementary references
S1. Schwende H, Fitzke E, Ambs P, Dieter P. Differences in the state of differentiation of
THP-1 cells induced by phorbol ester and 1,25-dihydroxyvitamin D3. J Leukoc Biol 1996;
59 (4): 555-561.
S2. Onions ST, Ito K, Charron CE, Brown RJ, Colucci M, Frickel F, Hardy G, Joly K, King-
Underwood J, Kizawa Y, Knowles I, Murray PJ, Novak A, Rani A, Rapeport G, Smith A,
Strong P, Taddei DM, Williams JG. Discovery of narrow spectrum kinase inhibitors: new
therapeutic agents for the treatment of COPD and steroid-resistant asthma. J Med
Chem 2016; 59 (5): 1727-1746.
S3. Hozumi A, Nishimura Y, Nishiuma T, Kotani Y, Yokoyama M. Induction of MMP-9 in
normal human bronchial epithelial cells by TNF- via NF-B-mediated pathway. Am J
Physiol Lung Cell Mol Physiol 2001; 281: L1444-L1452.
S4. Guillot L, Le Goffic R, Bloch S, Escriou N, Akira S, Chignard M, Si-Tahar M. Involvement of
toll-like receptor 3 in the immune response of lung epithelial cells to double-stranded
RNA and influenza A virus. JBC 2005; 280 (7): 5571-5580.
S5. Mercado N, Hakim A, Kobayashi Y, Meah S, Usmani OS, Chung KF, Barnes PJ, Ito K.
Restoration of corticosteroid sensitivity by p38 mitogen activated kinase inhibition in
peripheral blood mononuclear cells from severe asthma. PLoS ONE 2012; 7 (7): e41582.
S6. Armstrong J, Harbron C, Lea S, Booth G, Cadden P, Wreggett KA, Singh D. Synergistic
effects of p38 mitogen-activated protein kinase inhibition with a corticosteroid in
alveolar macrophages from patients with chronic obstructive pulmonary disease.
Pharmacol Exp Ther 2011 Sep; 338 (3):732-740.

28
S7. To Y, Ito K, Kizawa Y, Failla M, Ito M, Kusama T, Elliott WM, Hogg JC, Adcock IM, Barnes
PJ. Targeting Phosphoinositide-3-Kinase-δ with Theophylline Reverses Corticosteroid
Insensitivity in Chronic Obstructive Pulmonary Disease. Am J Respir Crit Care Med 2010;
182: 897-904.
S8. Gough K, Hutchison M, Keene O, Byrom B, Ellis S, Lacey L, McKellar J. Assessment of
dose-proportionality: report from the statisticians in the pharmaceutical
industry/pharmacokinetics UK joint working party. Drug Inform J 1995; 29: 1039-1048.
S9. Pizzichini E, Pizzichini MM, Efthimiadis A, Evans S, Morris mM, Squillace D, Gelich GJ,
Dolovich J Hargreave FE. Indices of airway inflammation in induced sputum:
reproducibility and validity of cell and fluid-phase measurements. Am J Respir Crit Care
Med 1996; 154: 308–317.
Related Documents