Russian-speaking Users of Social Media’s Activity Report Researching of activity russian-speaking users relatively different types of content in Social Media for 2016 Based on Popsters.us data

Welcome message from author
This document is posted to help you gain knowledge. Please leave a comment to let me know what you think about it! Share it to your friends and learn new things together.
Transcript

Russian-speaking Users ofSocial Media’s Activity Report
Researching of activityrussian-speaking usersrelatively di�erent types of content in Social Media for 2016
Based on Popsters.us data

Methodology
The research is based on 25 million social
media posts by 17 thousands di�erent
pages were analyzed by our users in 6
social media’s for 2016:
Facebook, VK, OK, Instagram, Twitter и
YouTube.
Unrepresentative data were excluded
from the final calculation
2

§Relative Activity by Days of Week
1§
Methodology I
Average activity of published posts at specific day of week
Total of activity (reactions, shares, comments)
at specific day of week
Count of posts such type=
Percent of activity on average published posts at specific day of week
Average activity of published posts
at specific day of week
Total of average activities of posts by all
days of week
= × 100 %
Relative Activity by Days of Week§1 4
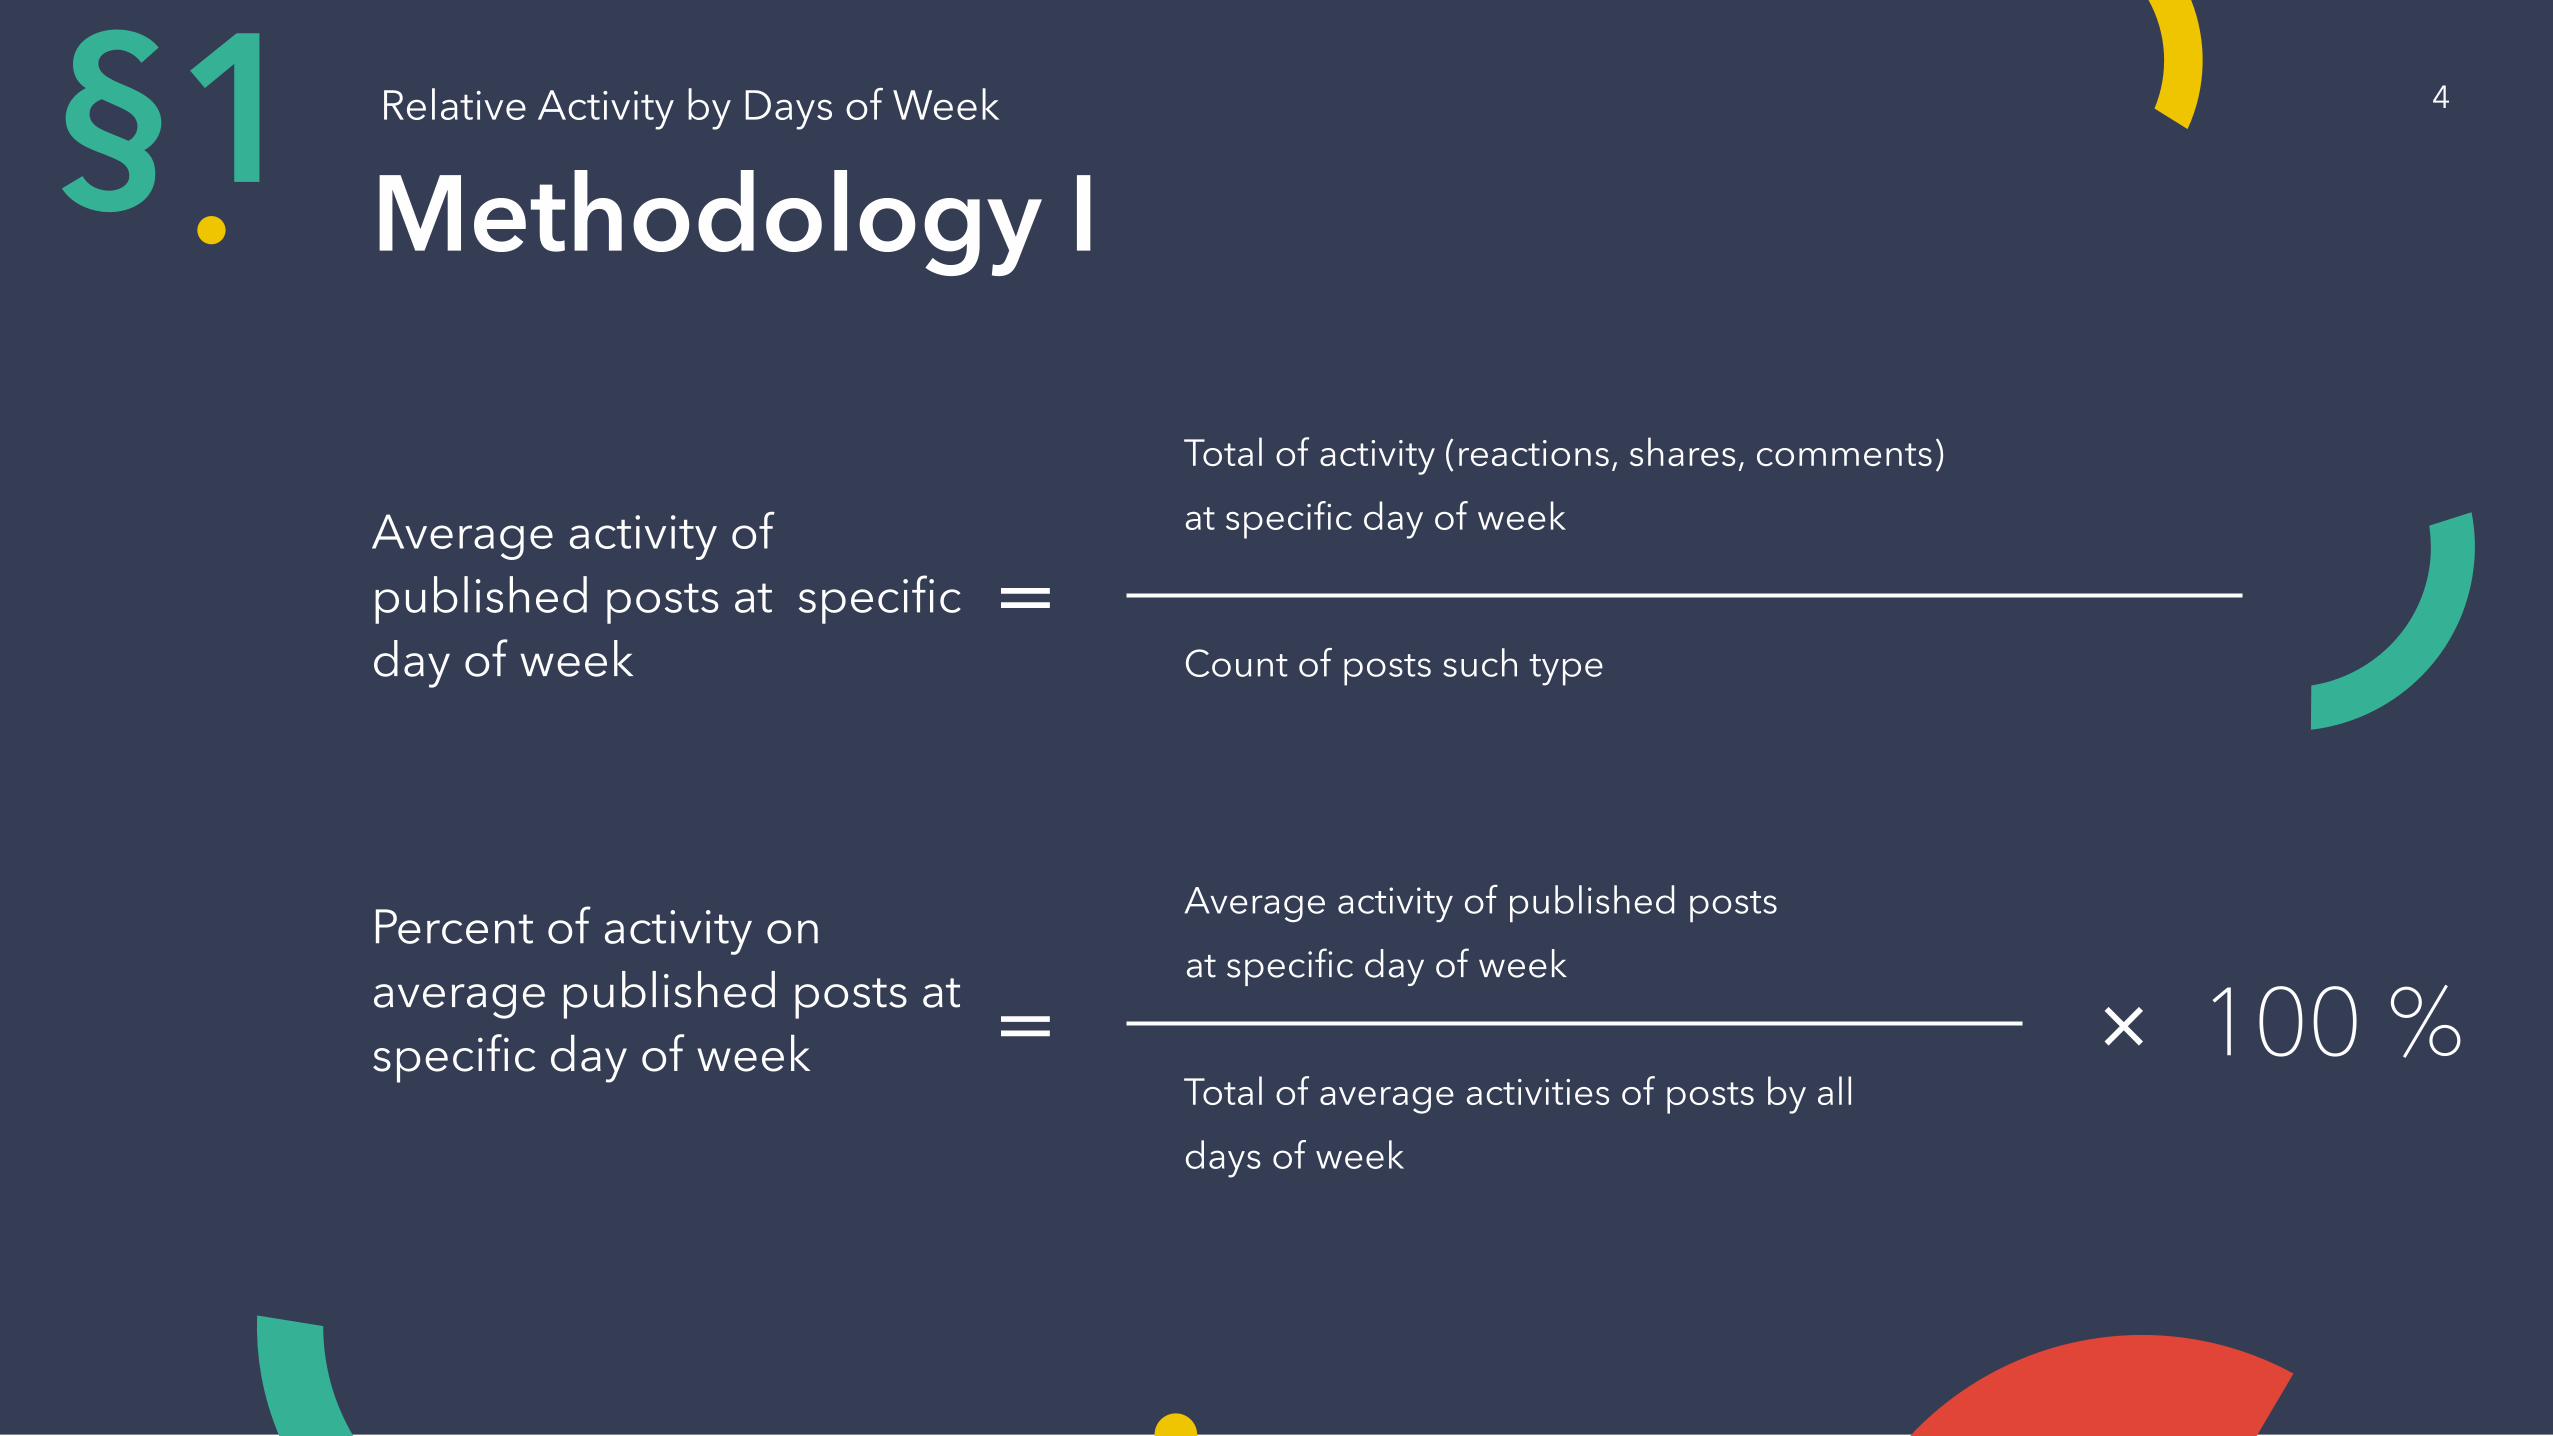
Methology II
Aggregation of data by di�erent pages
Total data by all analyzes at specific
time
Count of nonzero values=
Equalization of percent values accounting nonzero values
Average value for each day of week
Total of all average values=
Relative Activity by Days of Week§1 5
§1
12 %
13 %
14 %
15 %
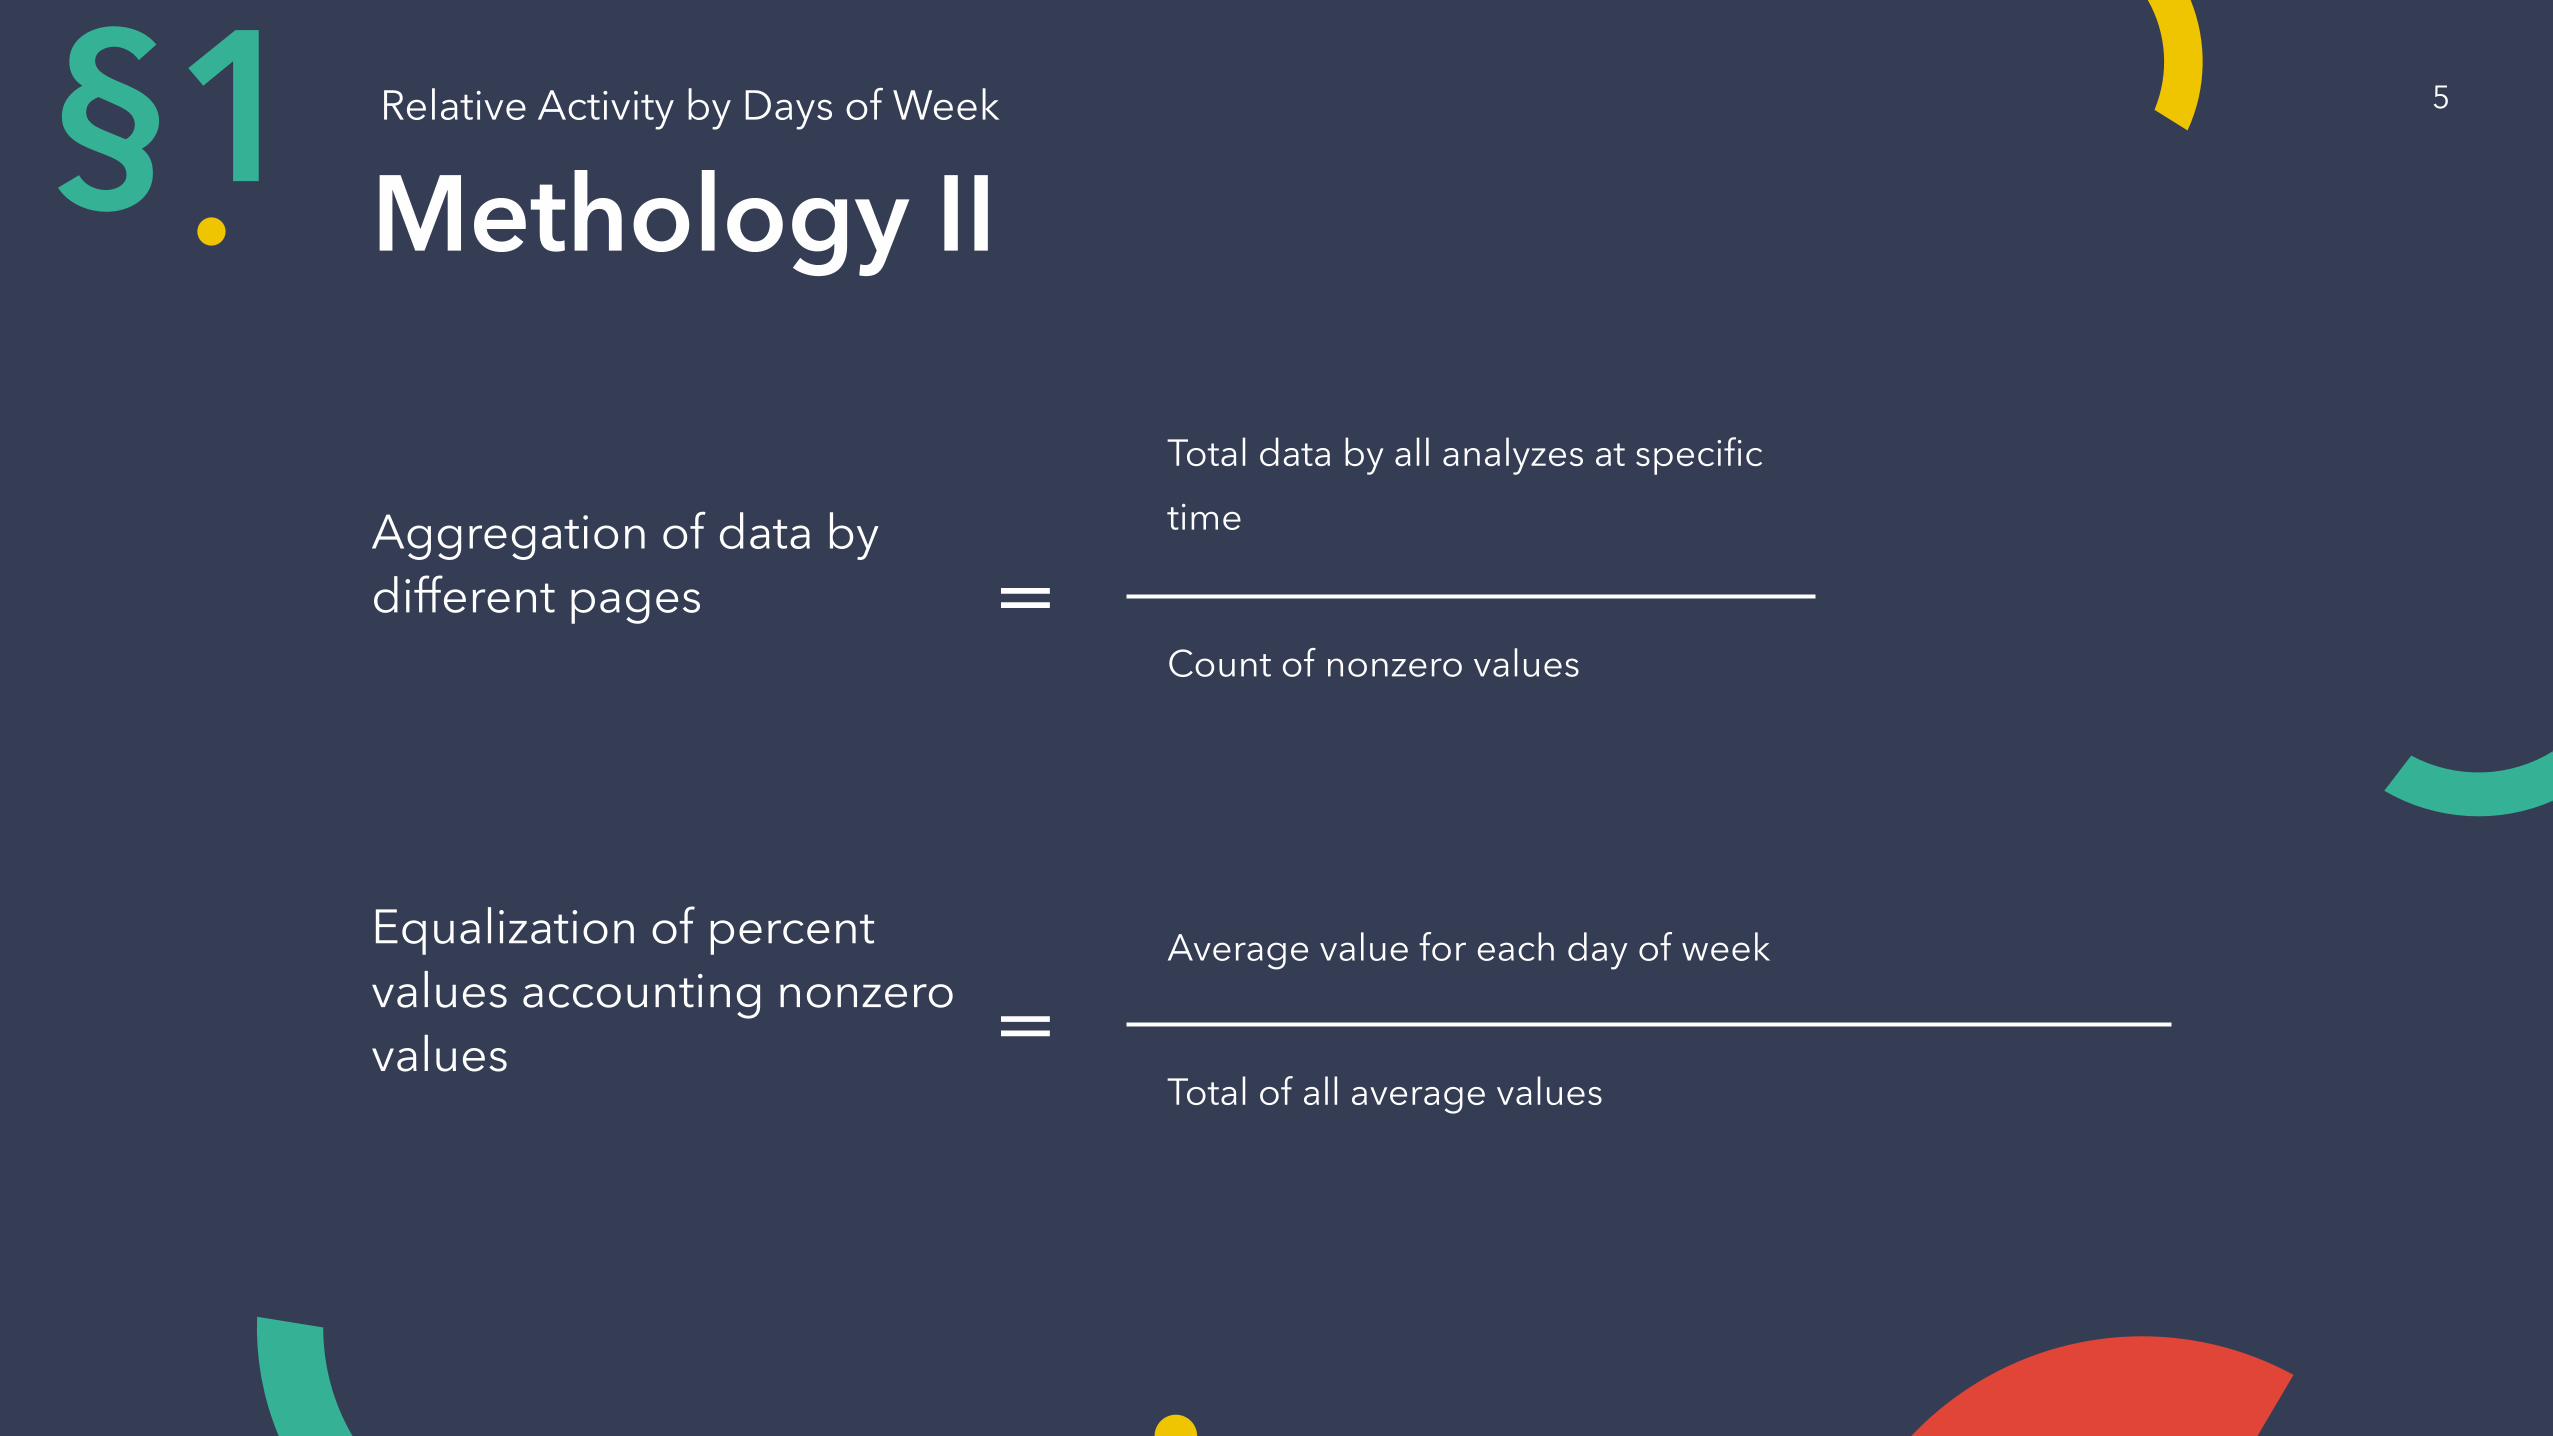
VKRelative Activity by Days of Week
Mon Tue Wed Thu Fri Sat Sun
14,8
14,6
14,3
14,1
14,414,3
13,5
6
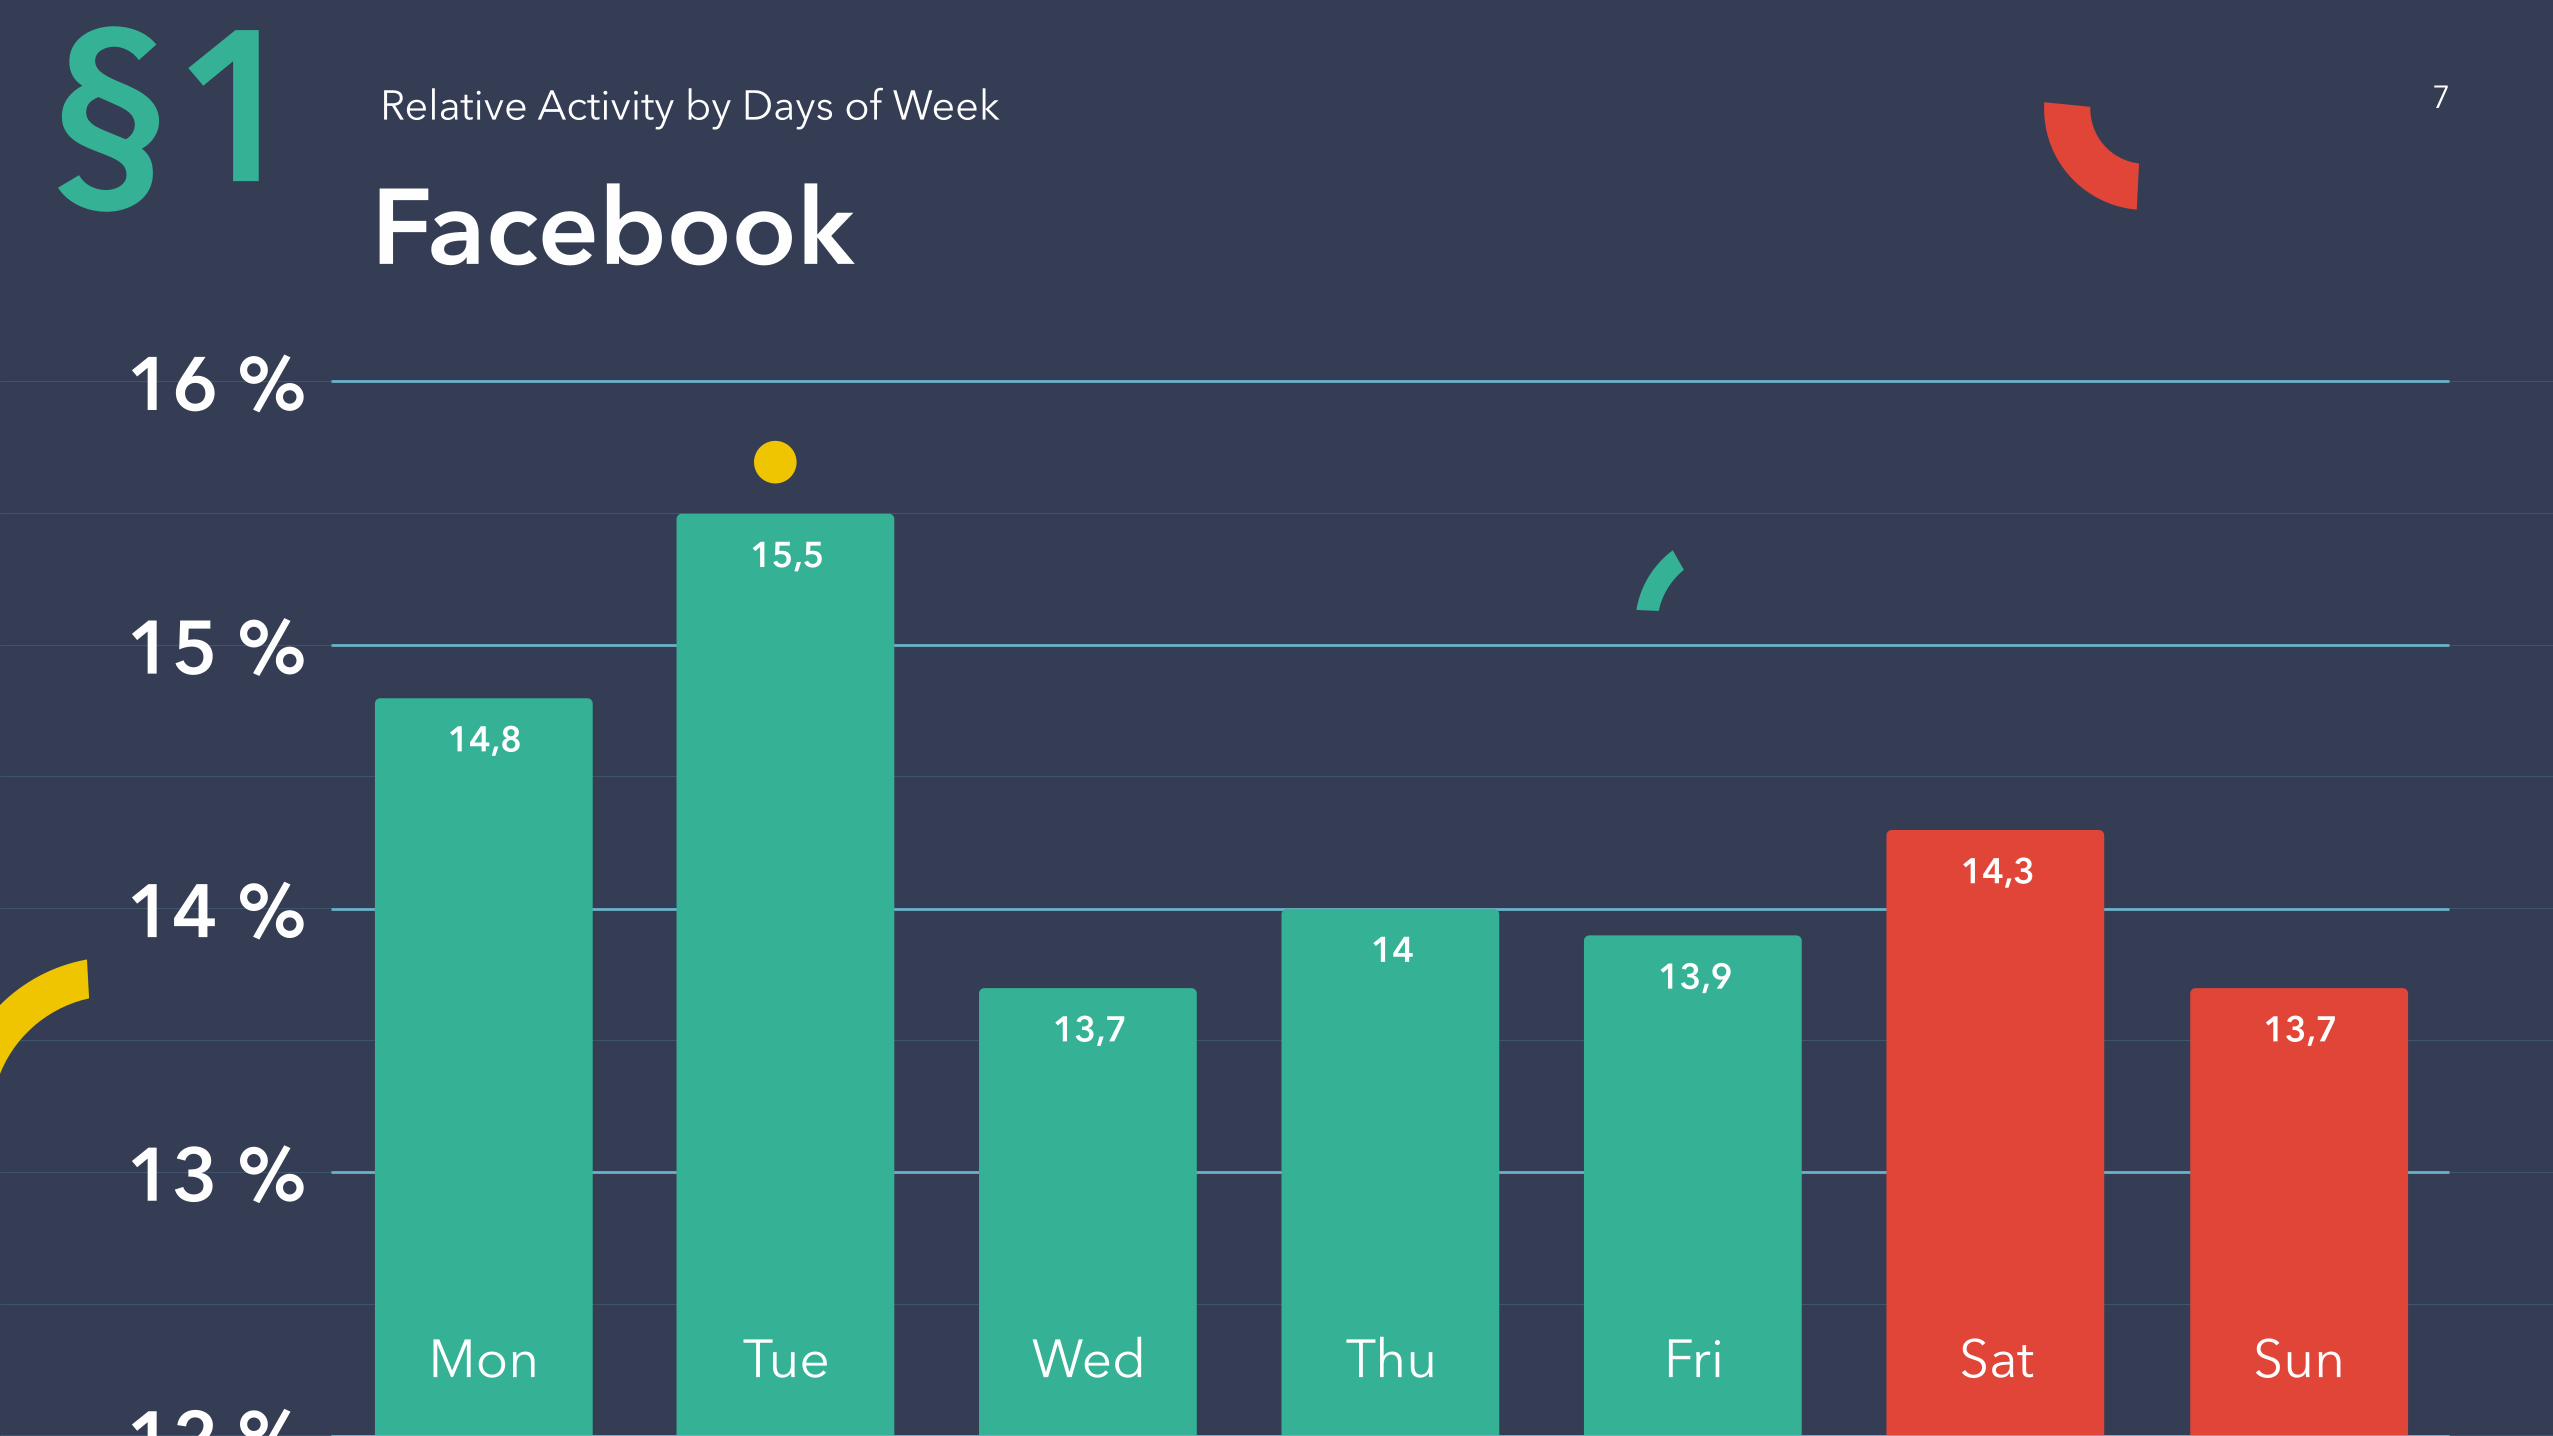
12 %
13 %
14 %
15 %
16 %
FacebookRelative Activity by Days of Week§1
14,8
15,5
13,7
1413,9
14,3
13,7
Mon Tue Wed Thu Fri Sat Sun
7
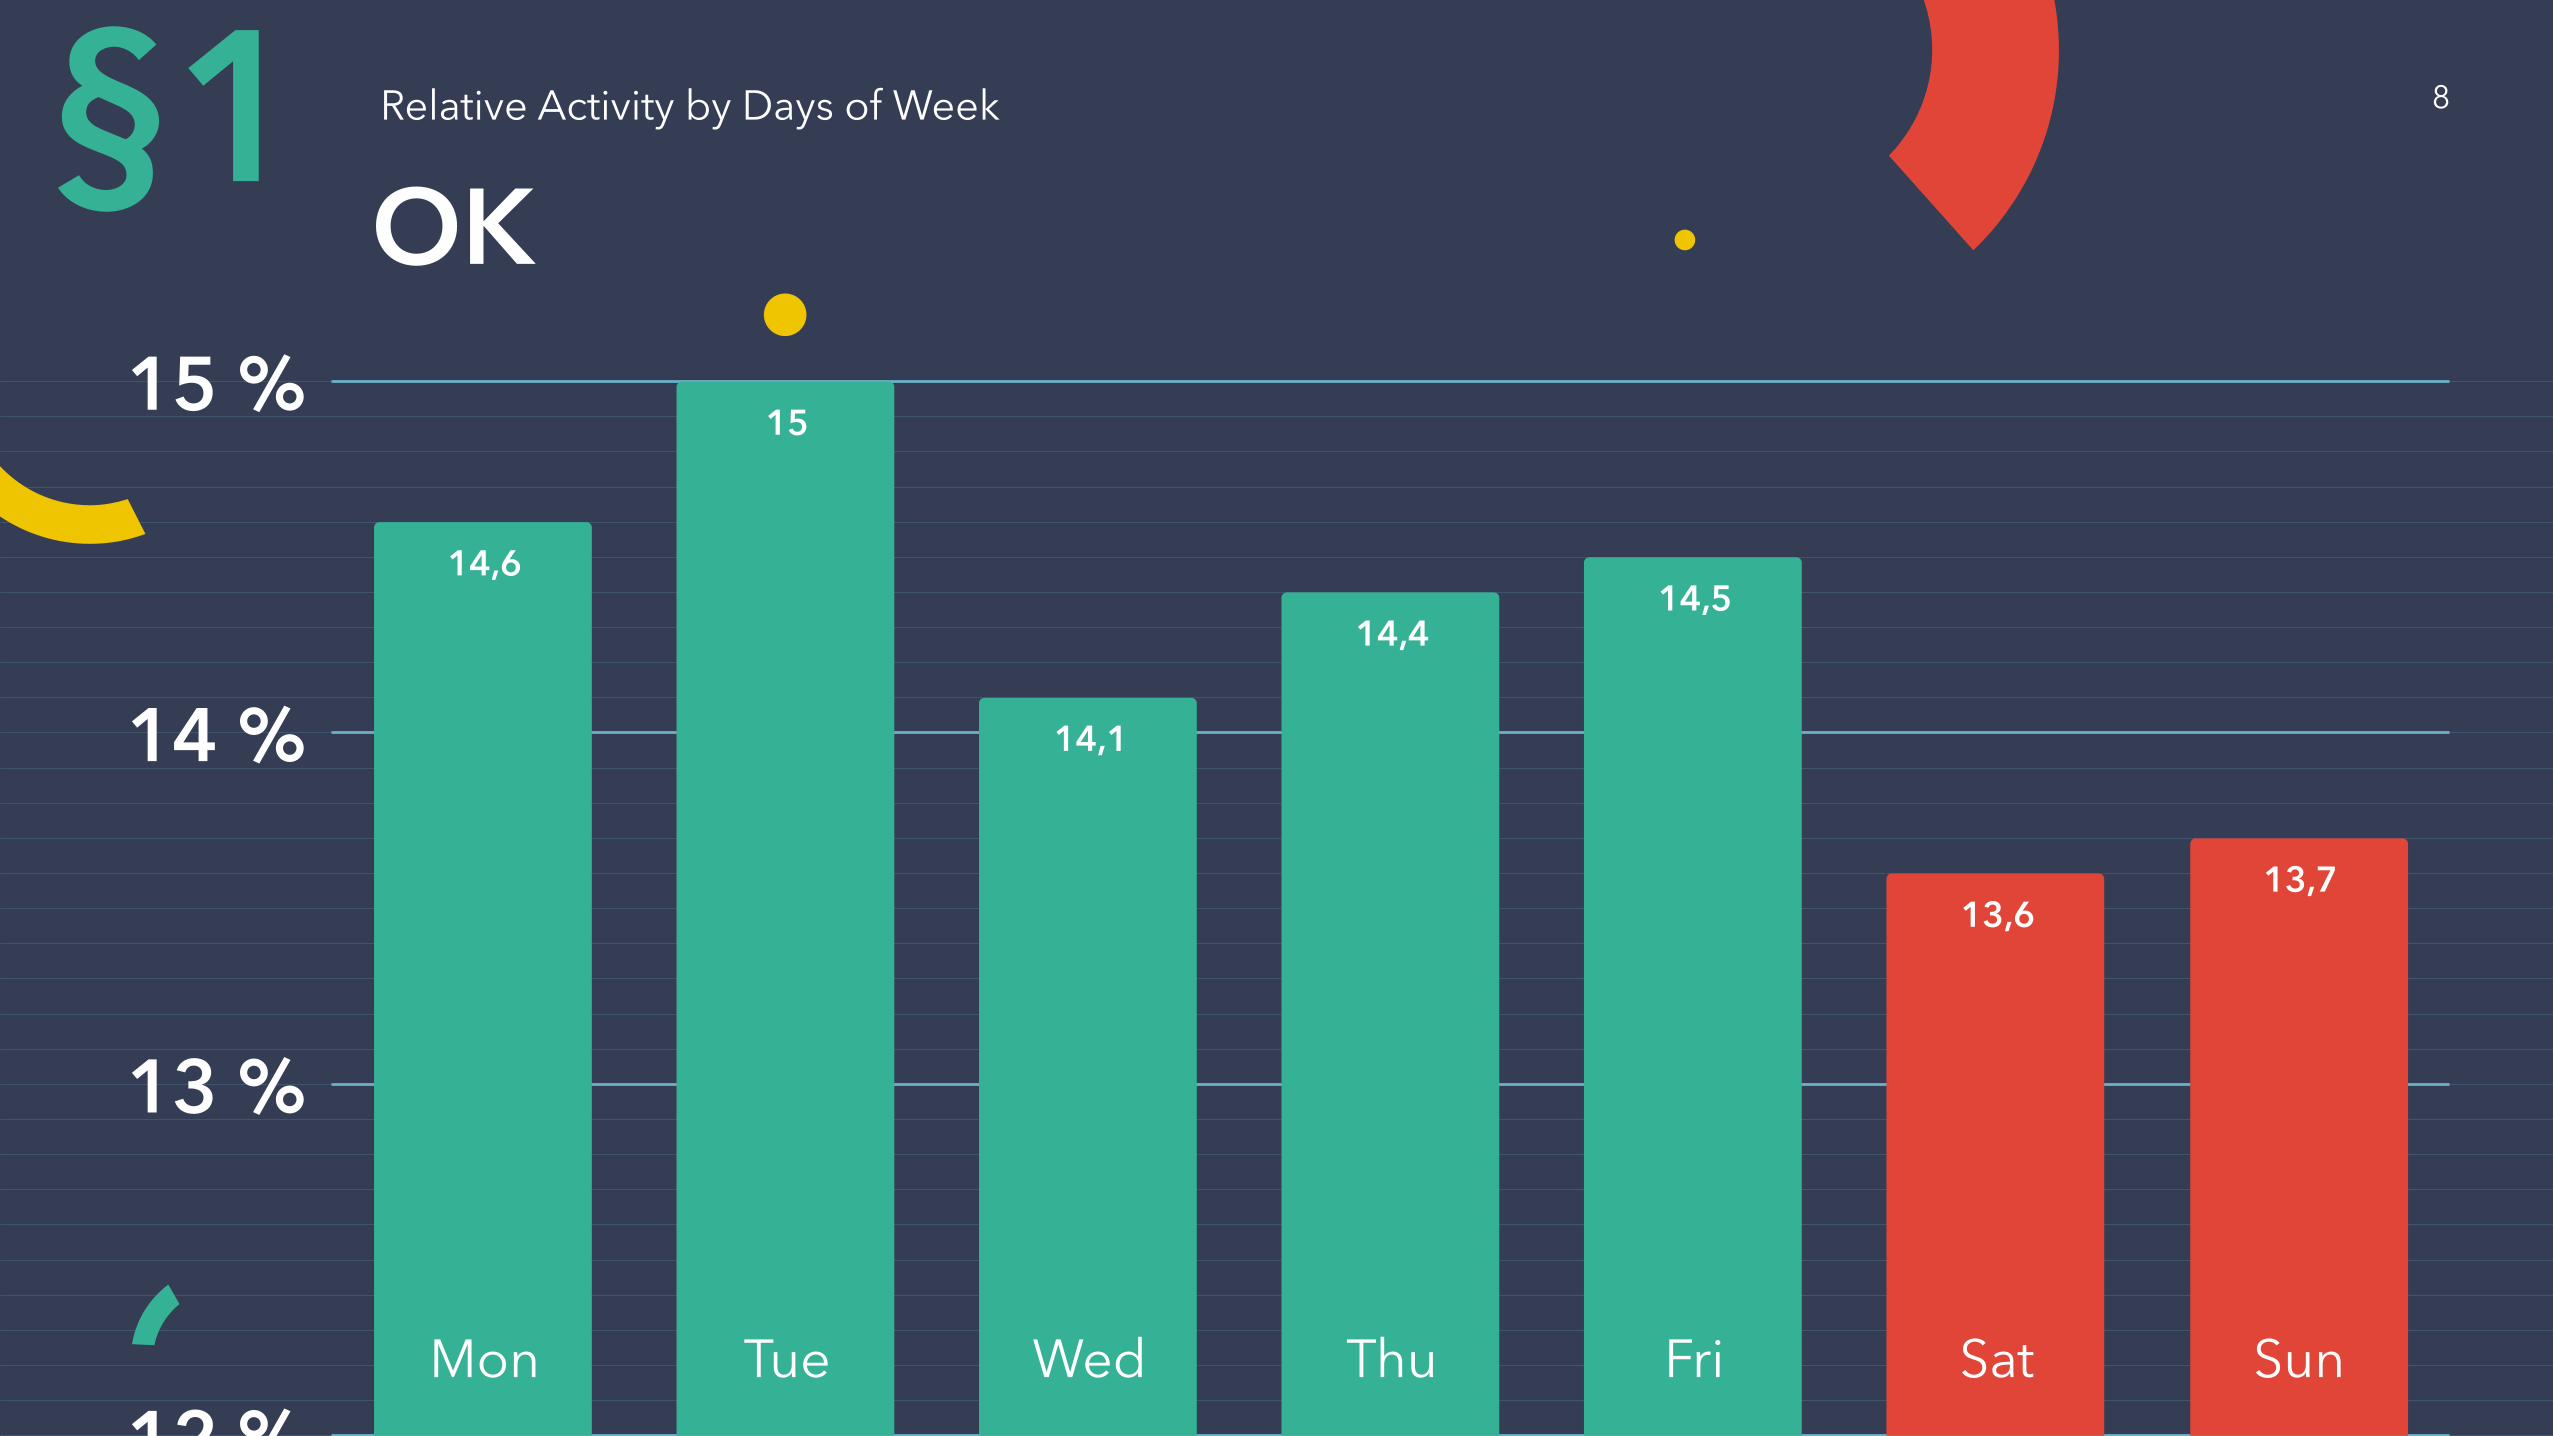
OKRelative Activity by Days of Week
12 %
13 %
14 %
15 %
§1
14,6
15
14,1
14,414,5
13,613,7
Mon Tue Wed Thu Fri Sat Sun
8
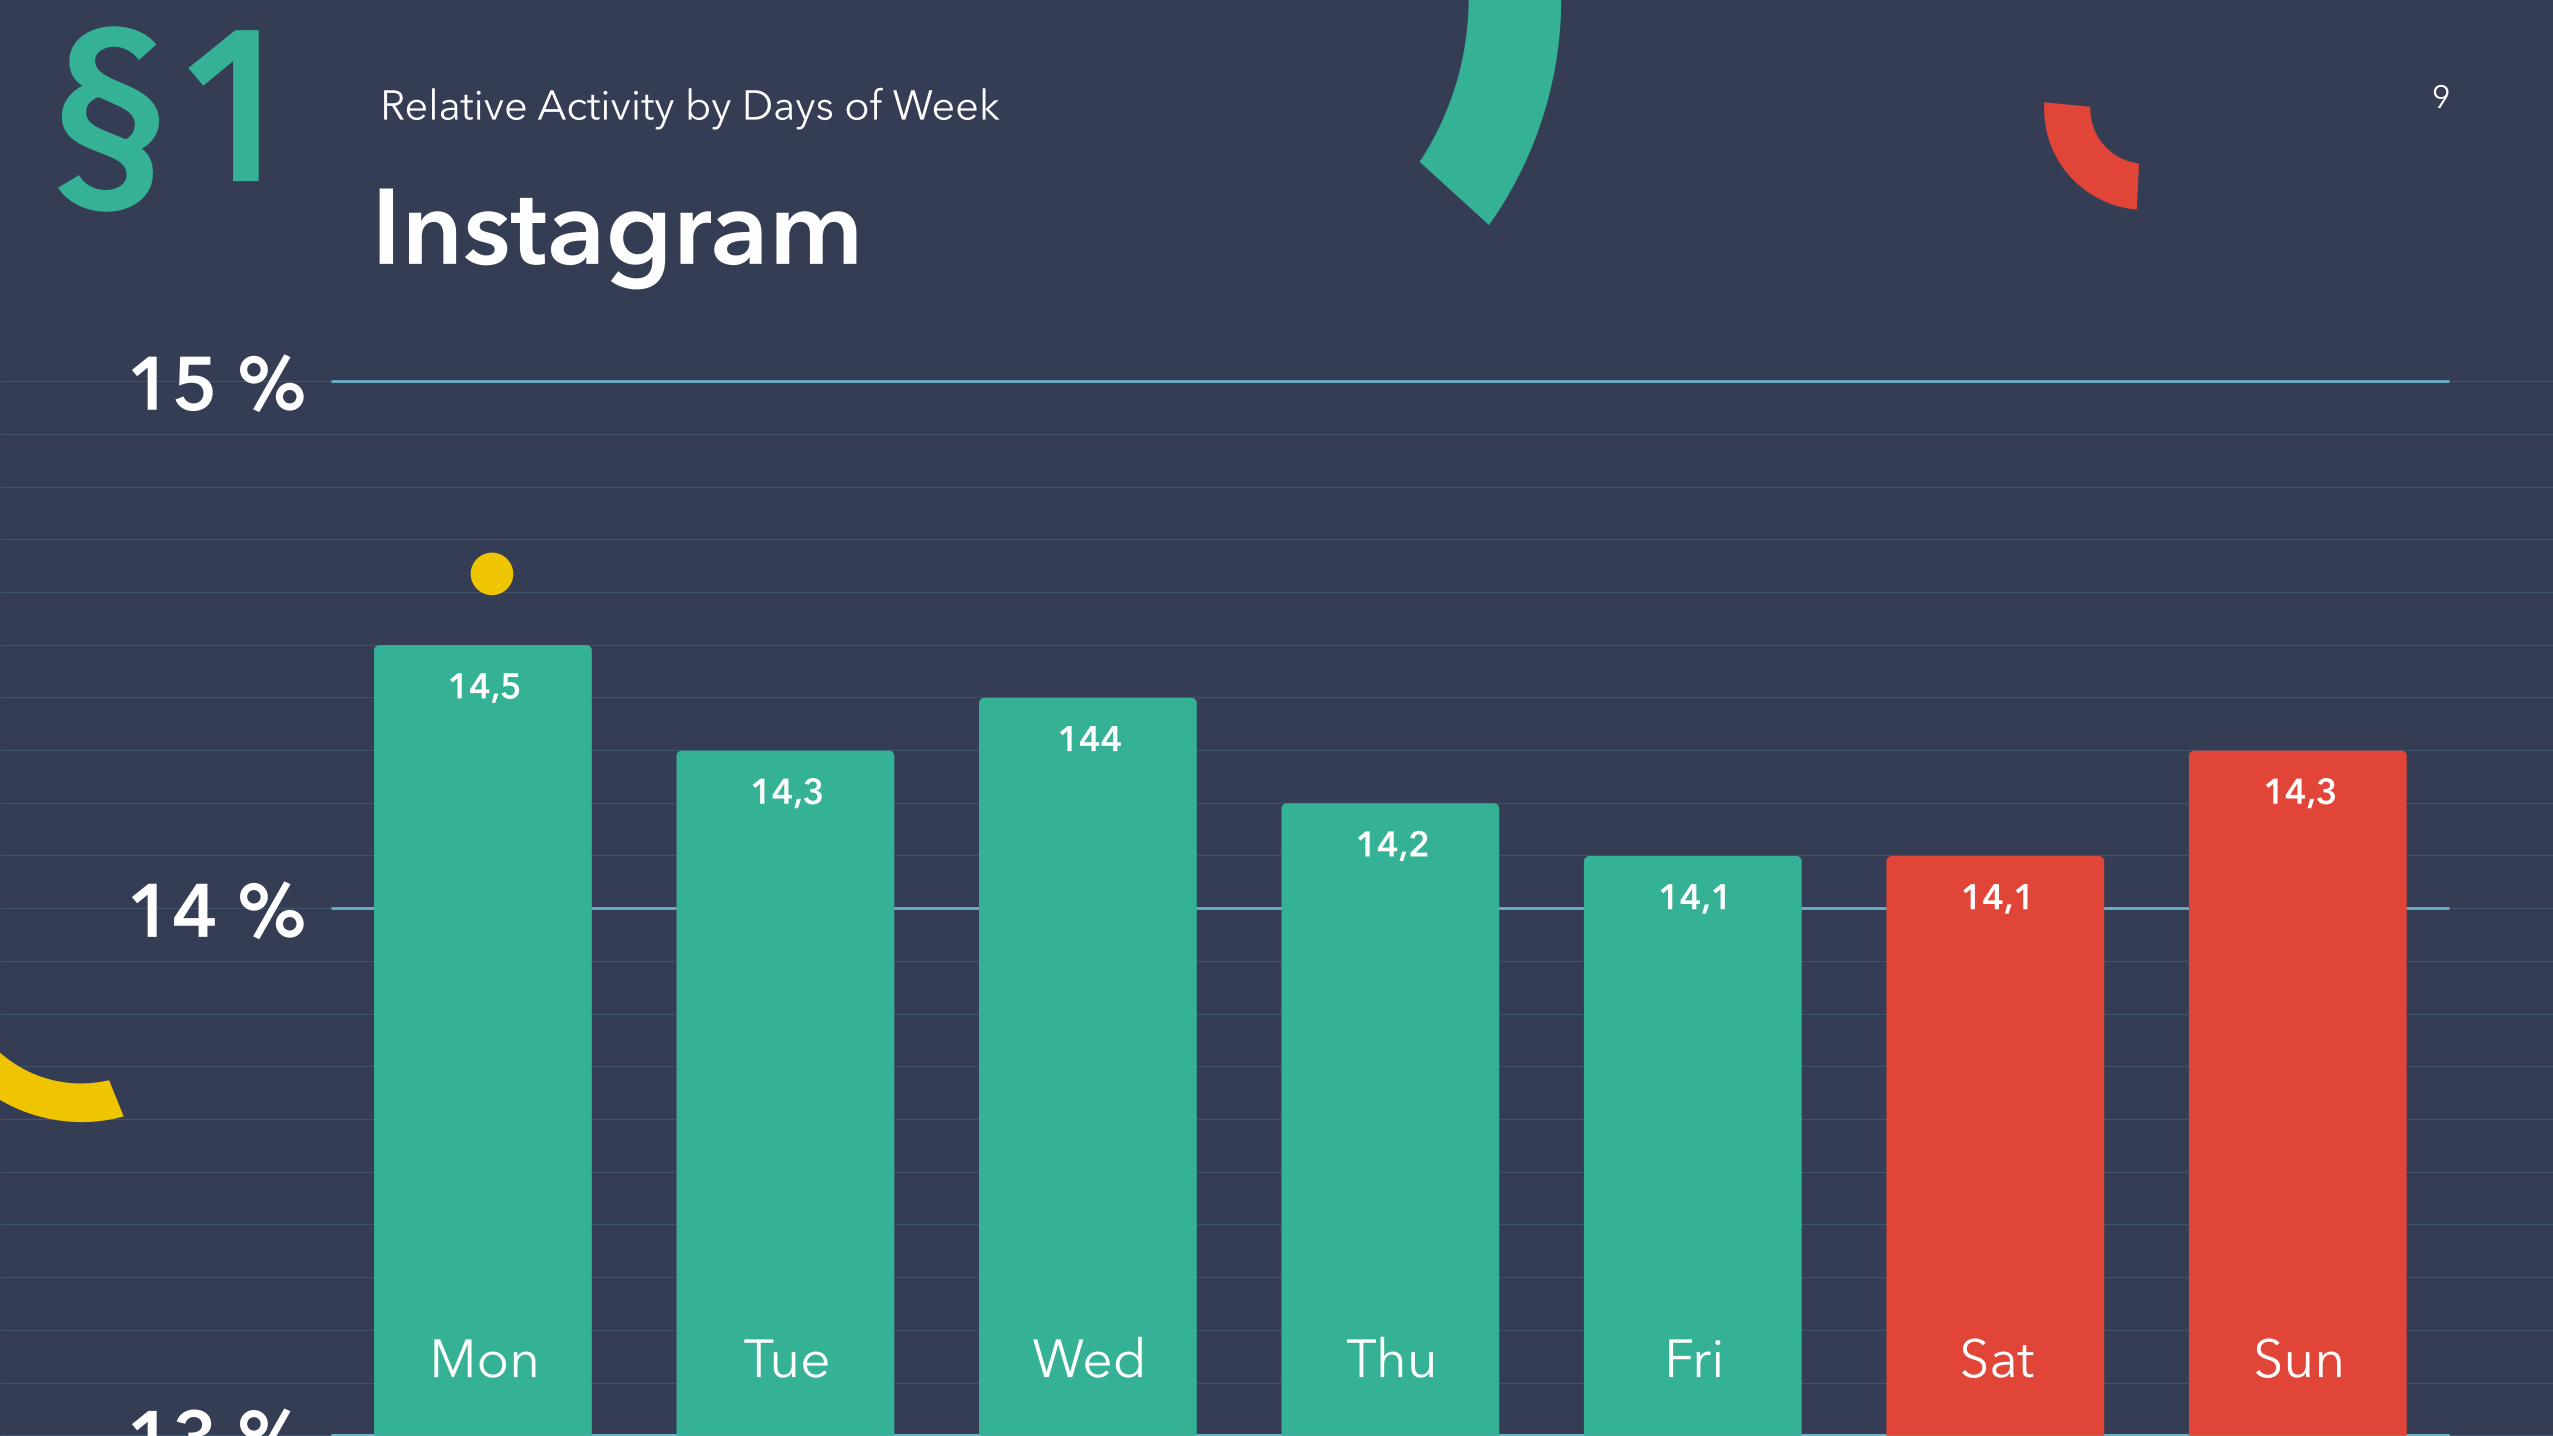
InstagramRelative Activity by Days of Week
13 %
14 %
15 %
§1
14,5
14,3144
14,214,1 14,1
14,3
Mon Tue Wed Thu Fri Sat Sun
9
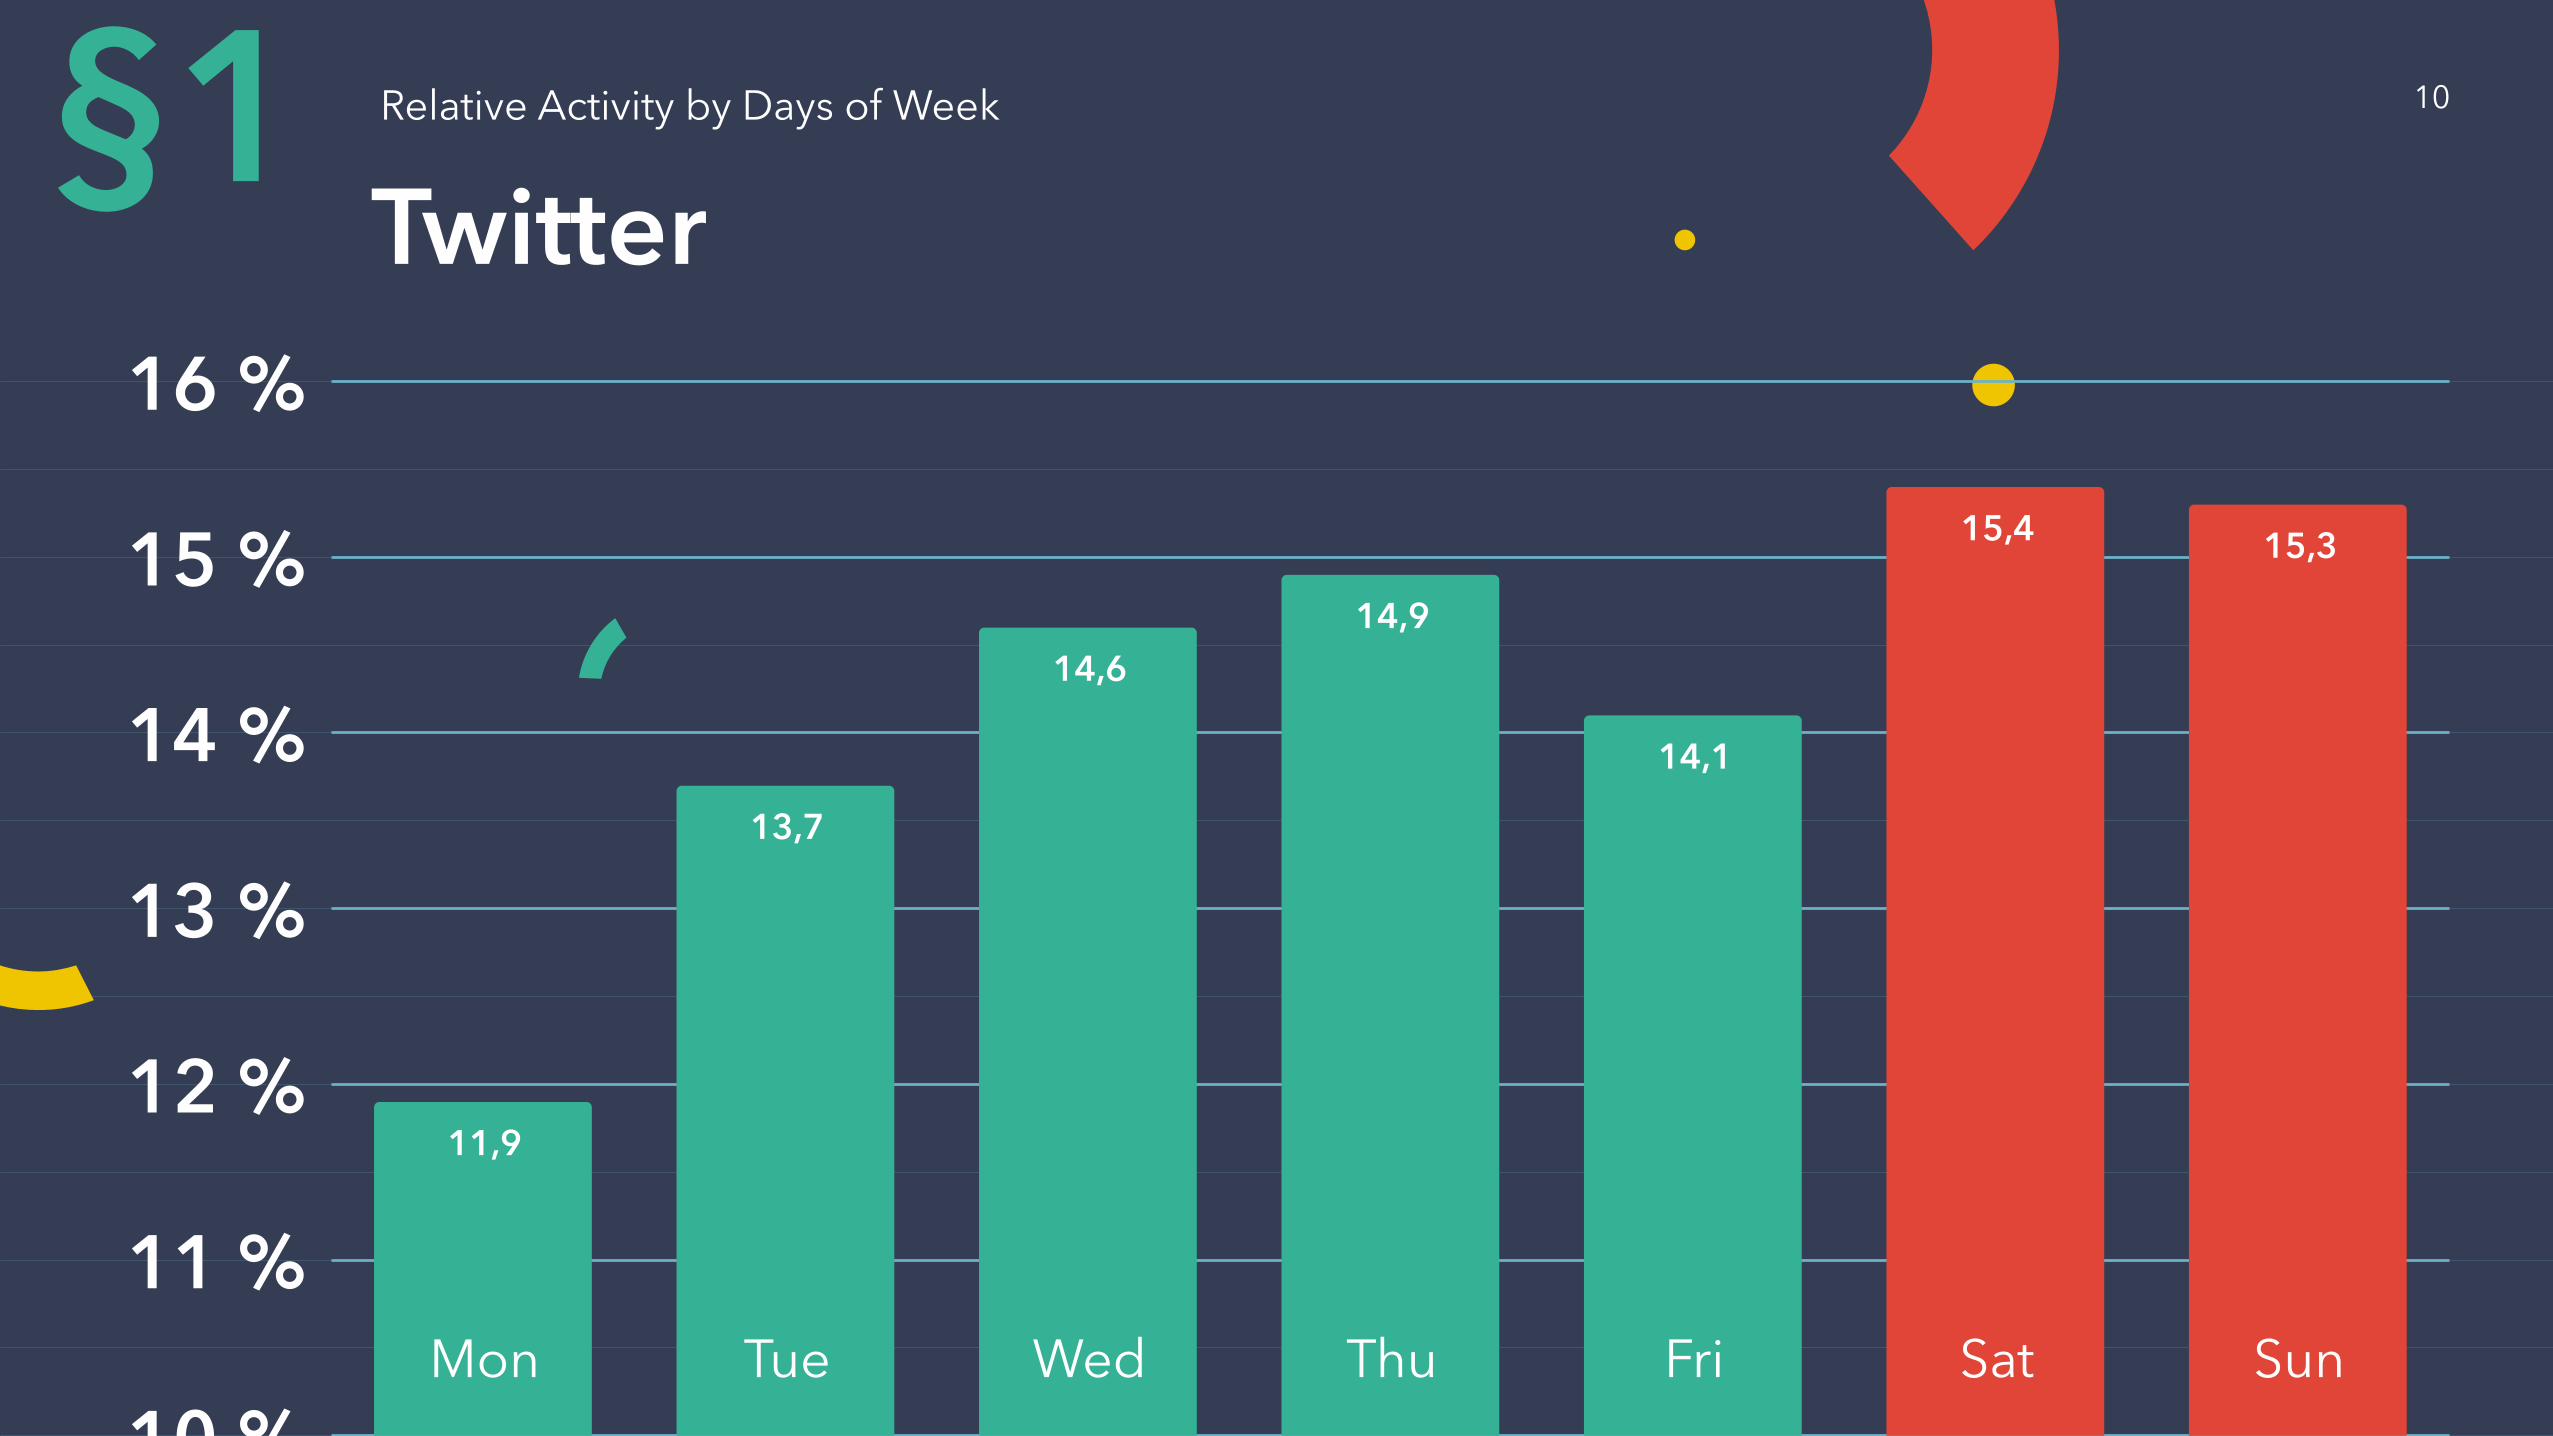
TwitterRelative Activity by Days of Week
10 %
11 %
12 %
13 %
14 %
15 %
16 %
§1
11,9
13,7
14,614,9
14,1
15,4 15,3
Mon Tue Wed Thu Fri Sat Sun
10
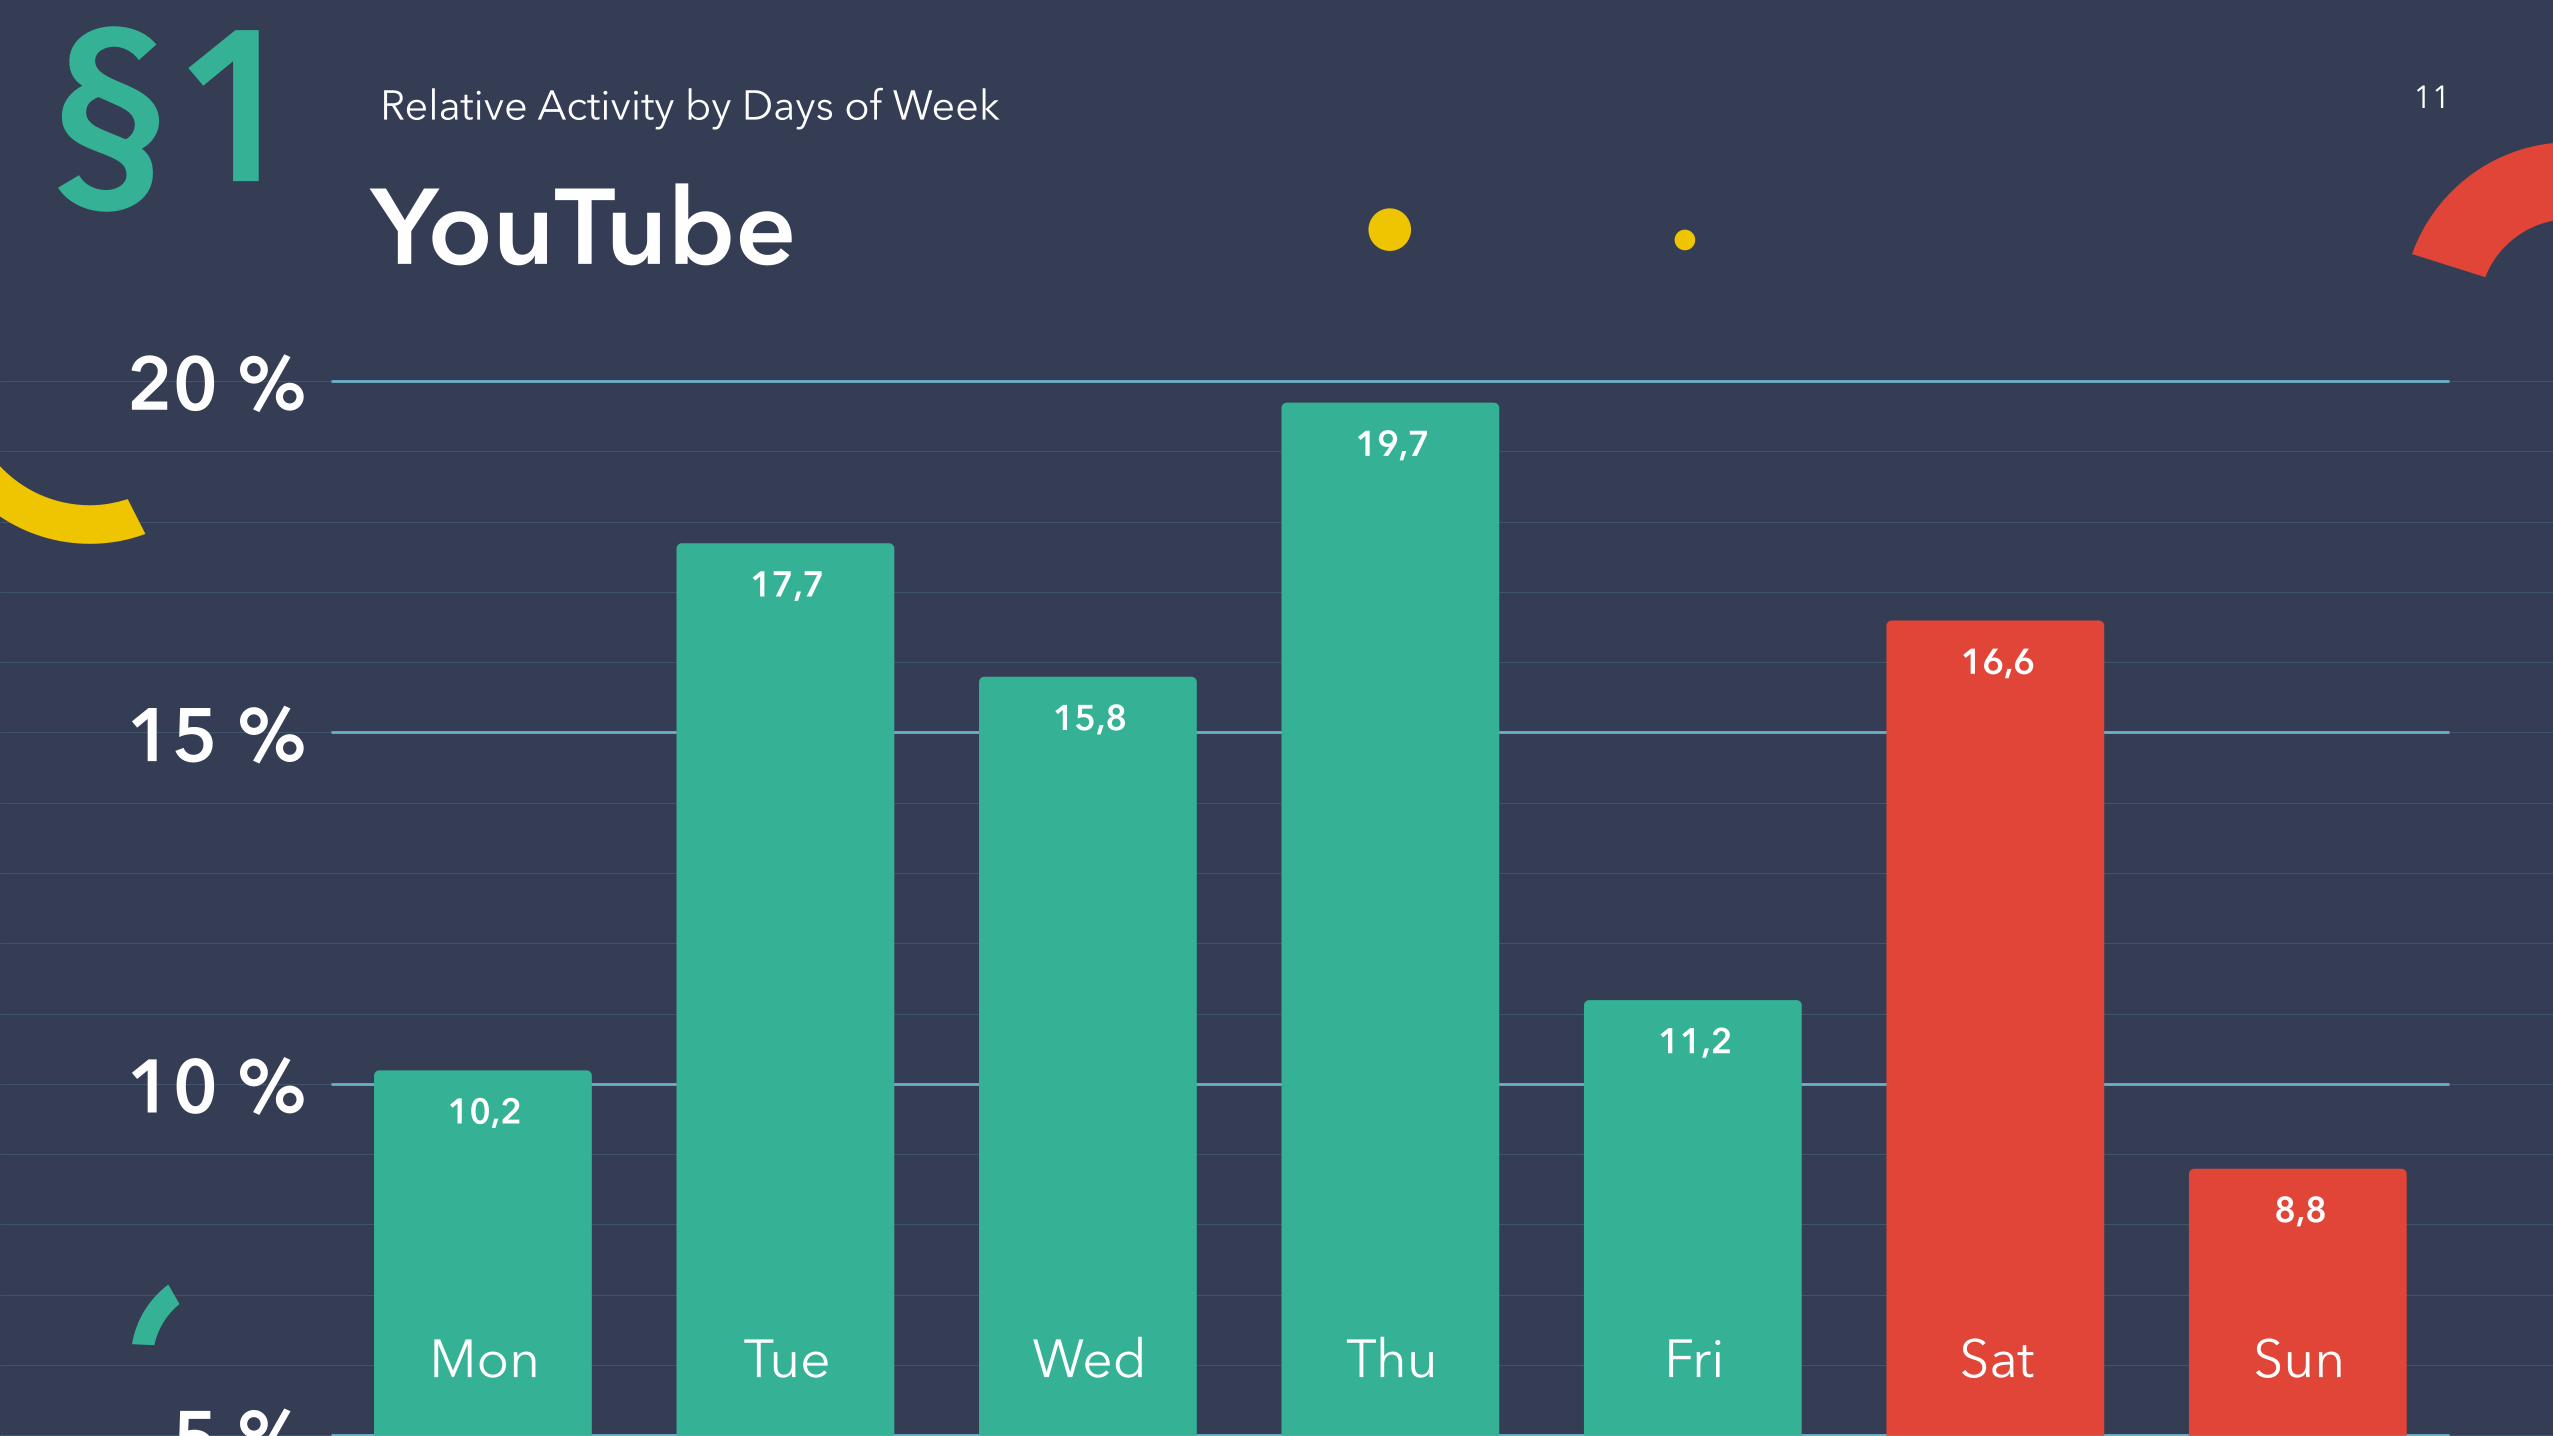
YouTubeRelative Activity by Days of Week
5 %
10 %
15 %
20 %
§1
10,2
17,7
15,8
19,7
11,2
16,6
8,8
Mon Tue Wed Thu Fri Sat Sun
11
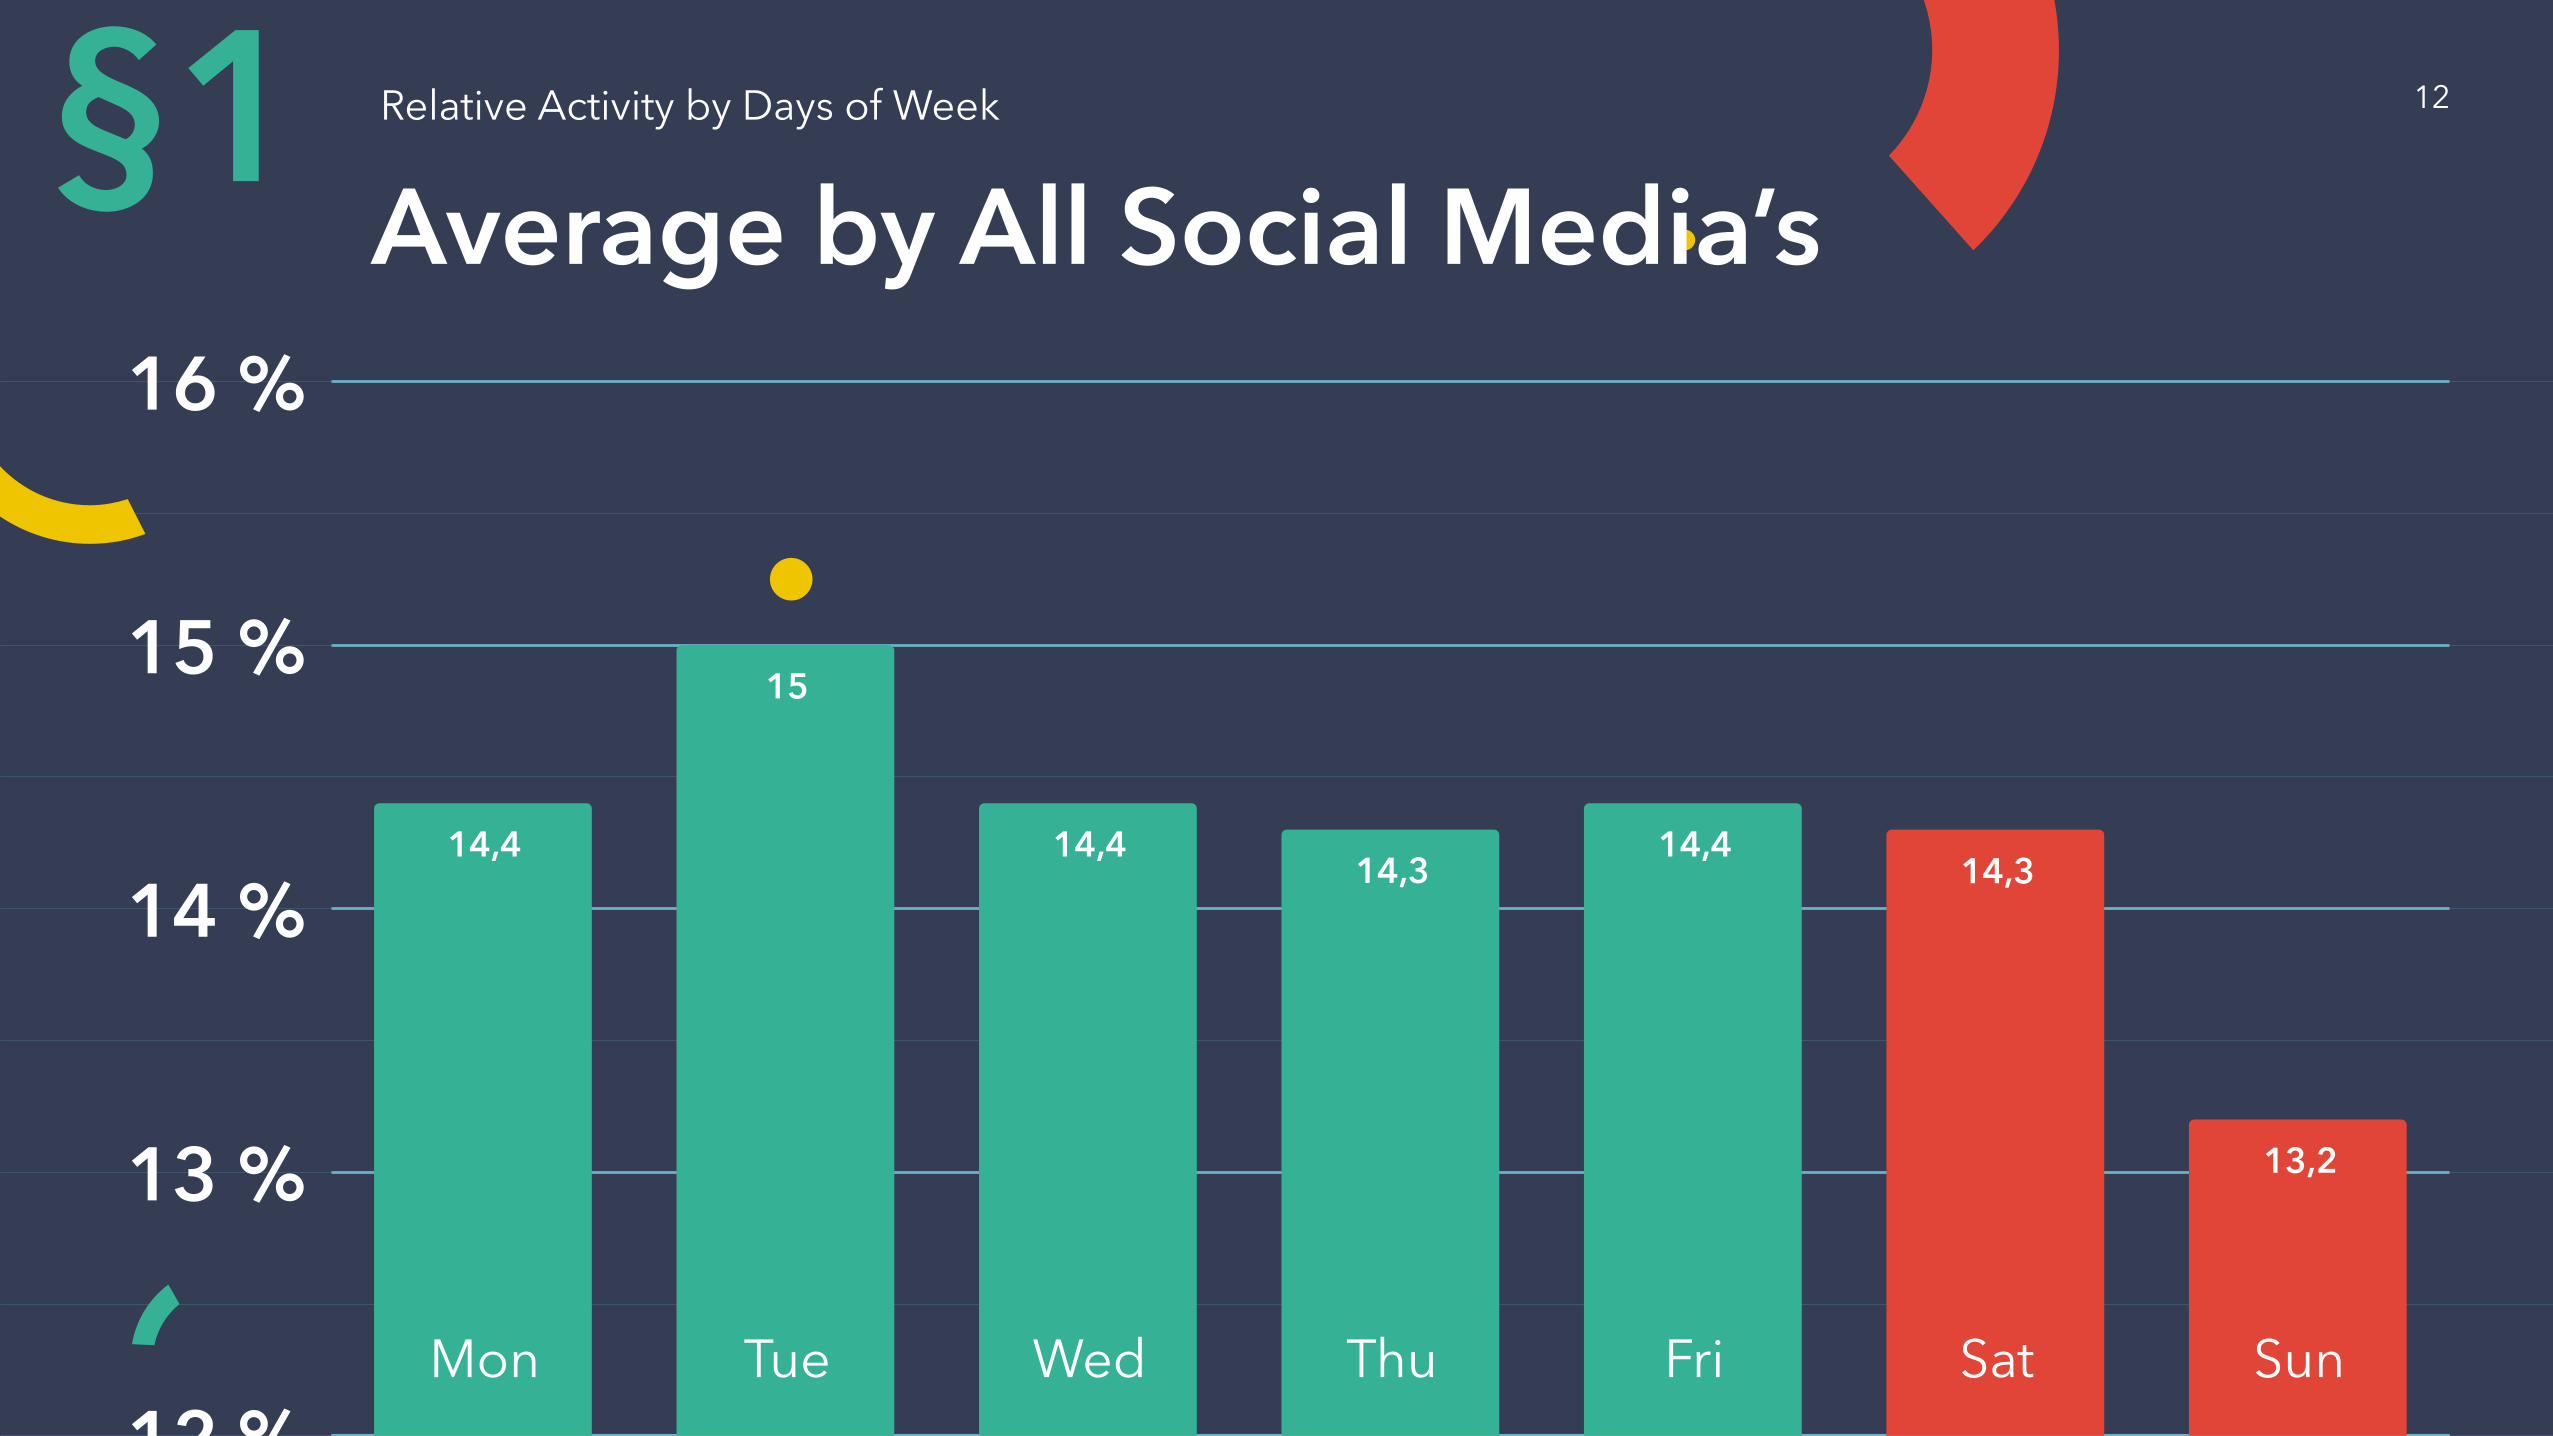
Average by All Social Media’sRelative Activity by Days of Week
12 %
13 %
14 %
15 %
16 %
§1
14,4
15
14,414,3
14,414,3
13,2
Mon Tue Wed Thu Fri Sat Sun
12

1§Relative Activity
by Hours of Day
2
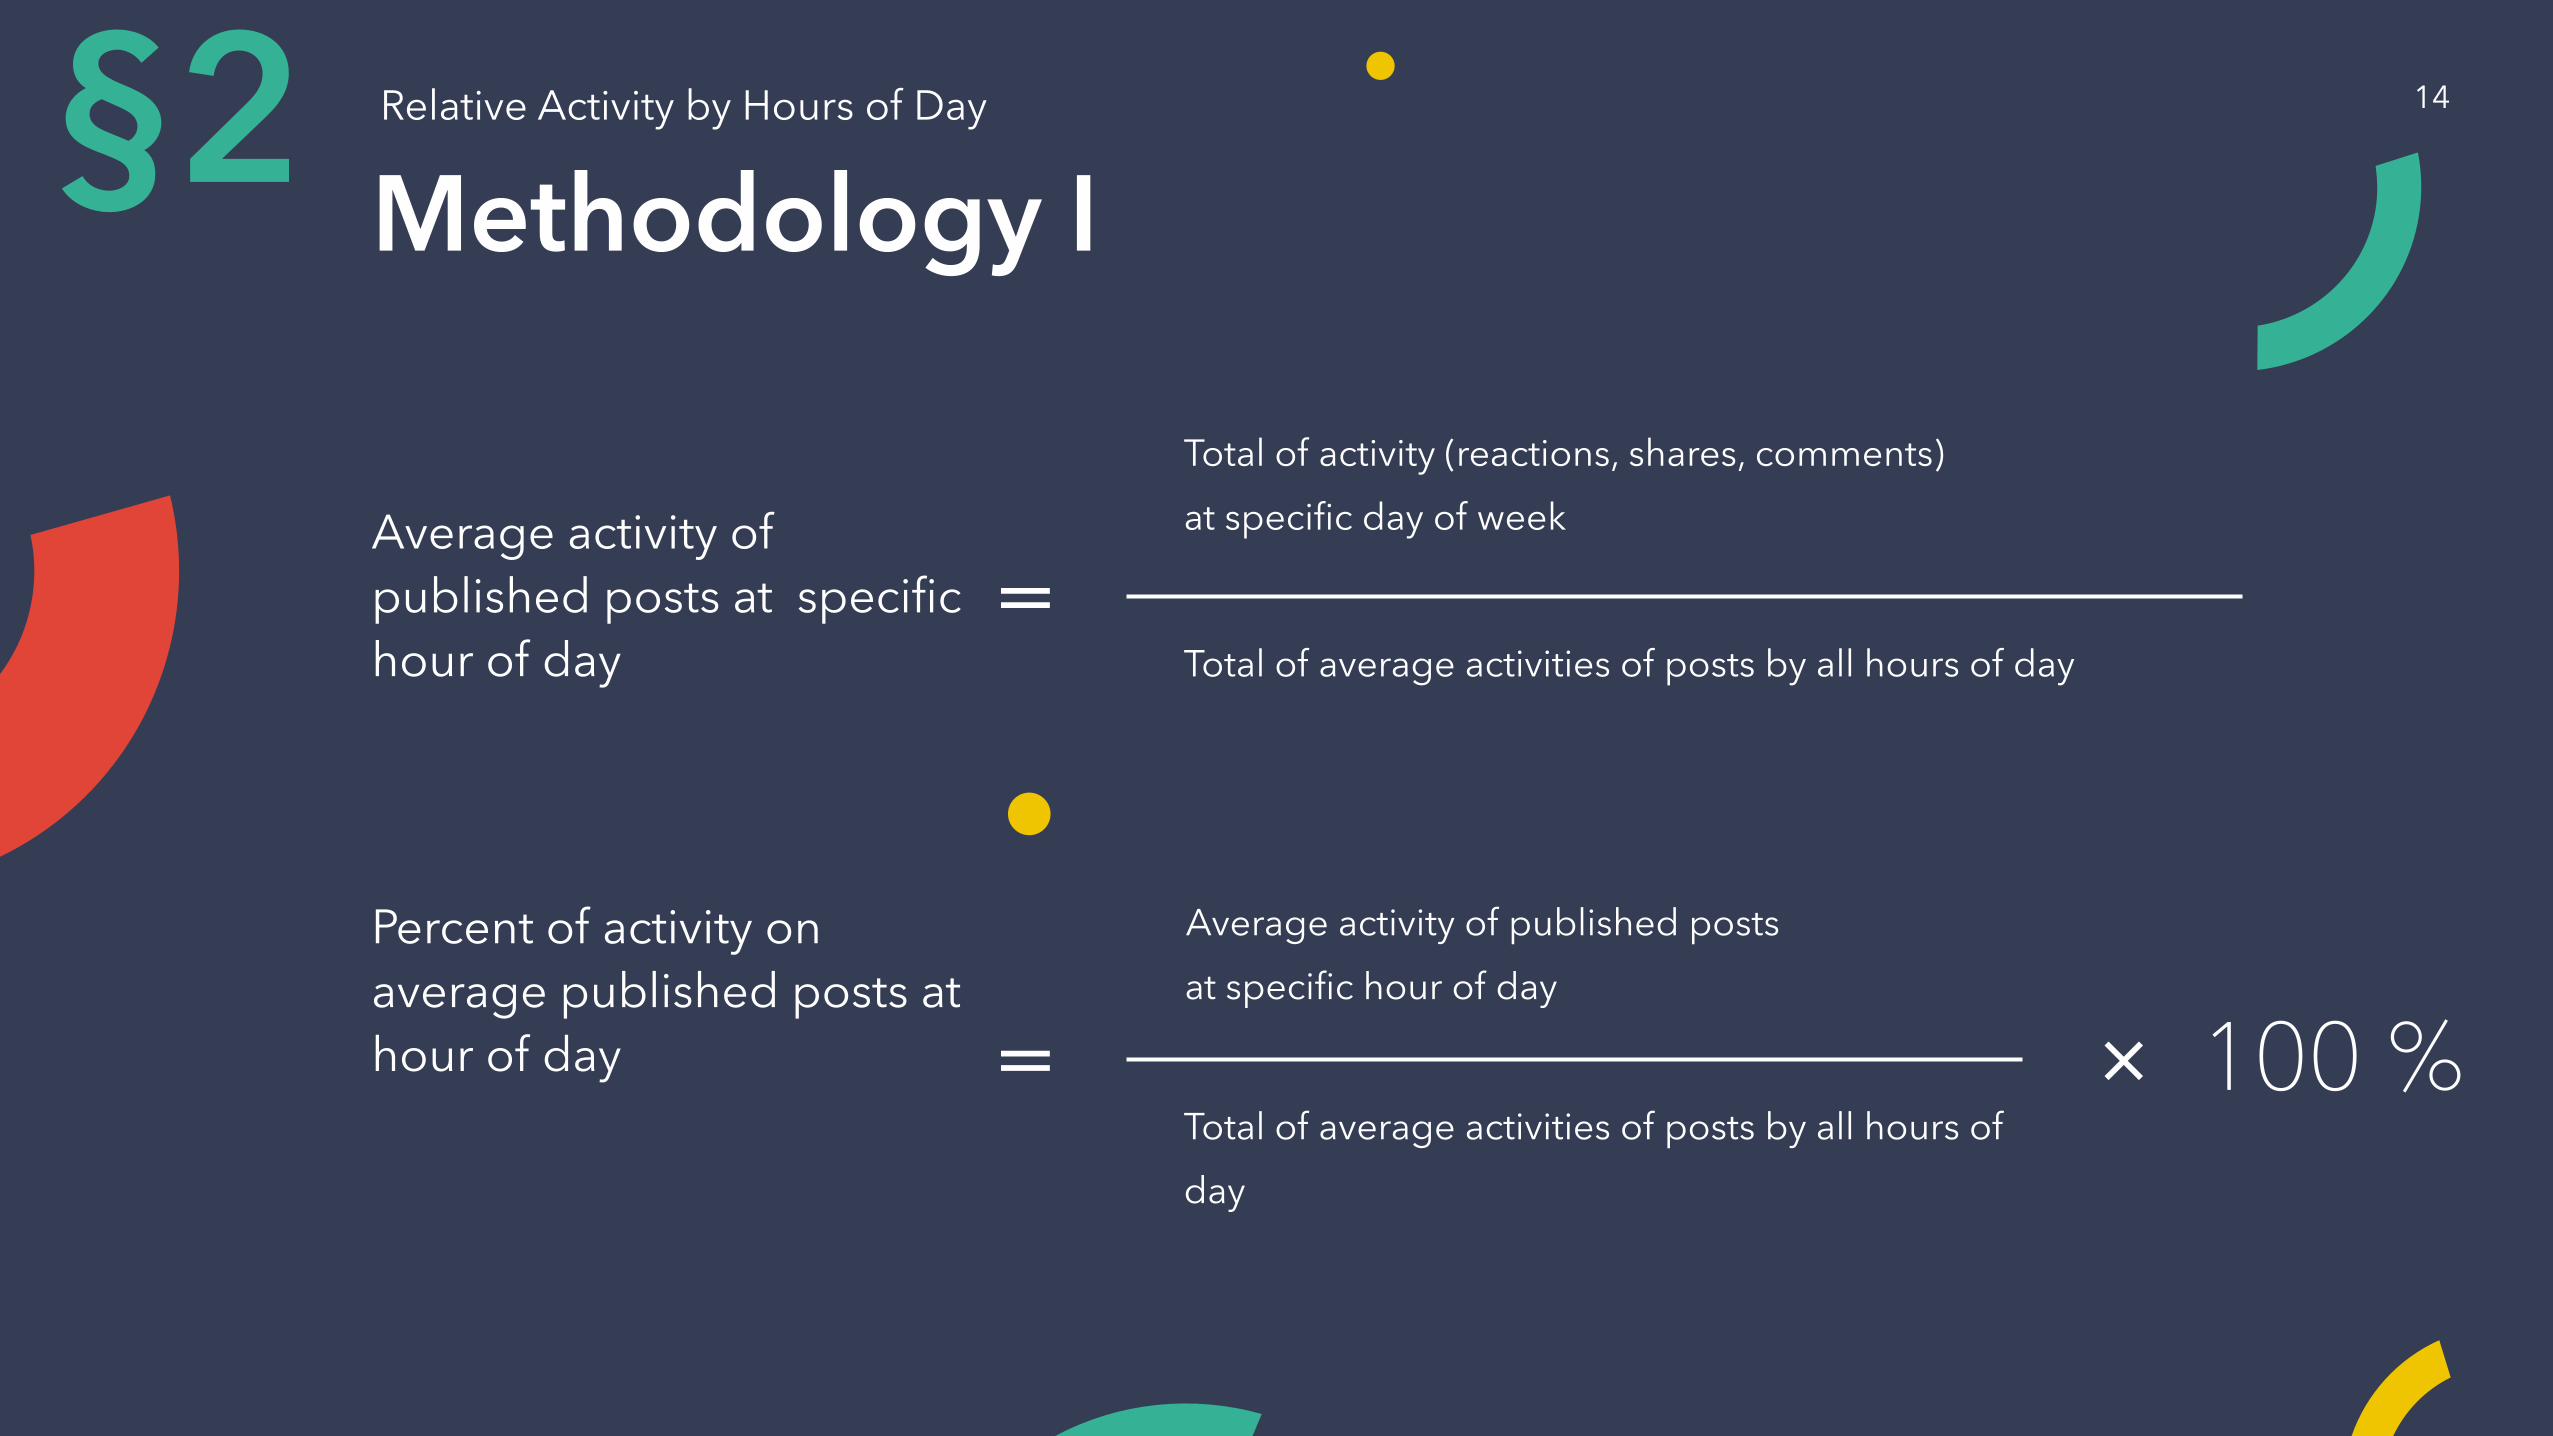
Methodology I
Average activity of published posts at specific hour of day
Total of activity (reactions, shares, comments)
at specific day of week
Total of average activities of posts by all hours of day=
Percent of activity on average published posts at hour of day
Average activity of published posts
at specific hour of day
Total of average activities of posts by all hours of
day
= × 100 %
Relative Activity by Hours of Day§2 14
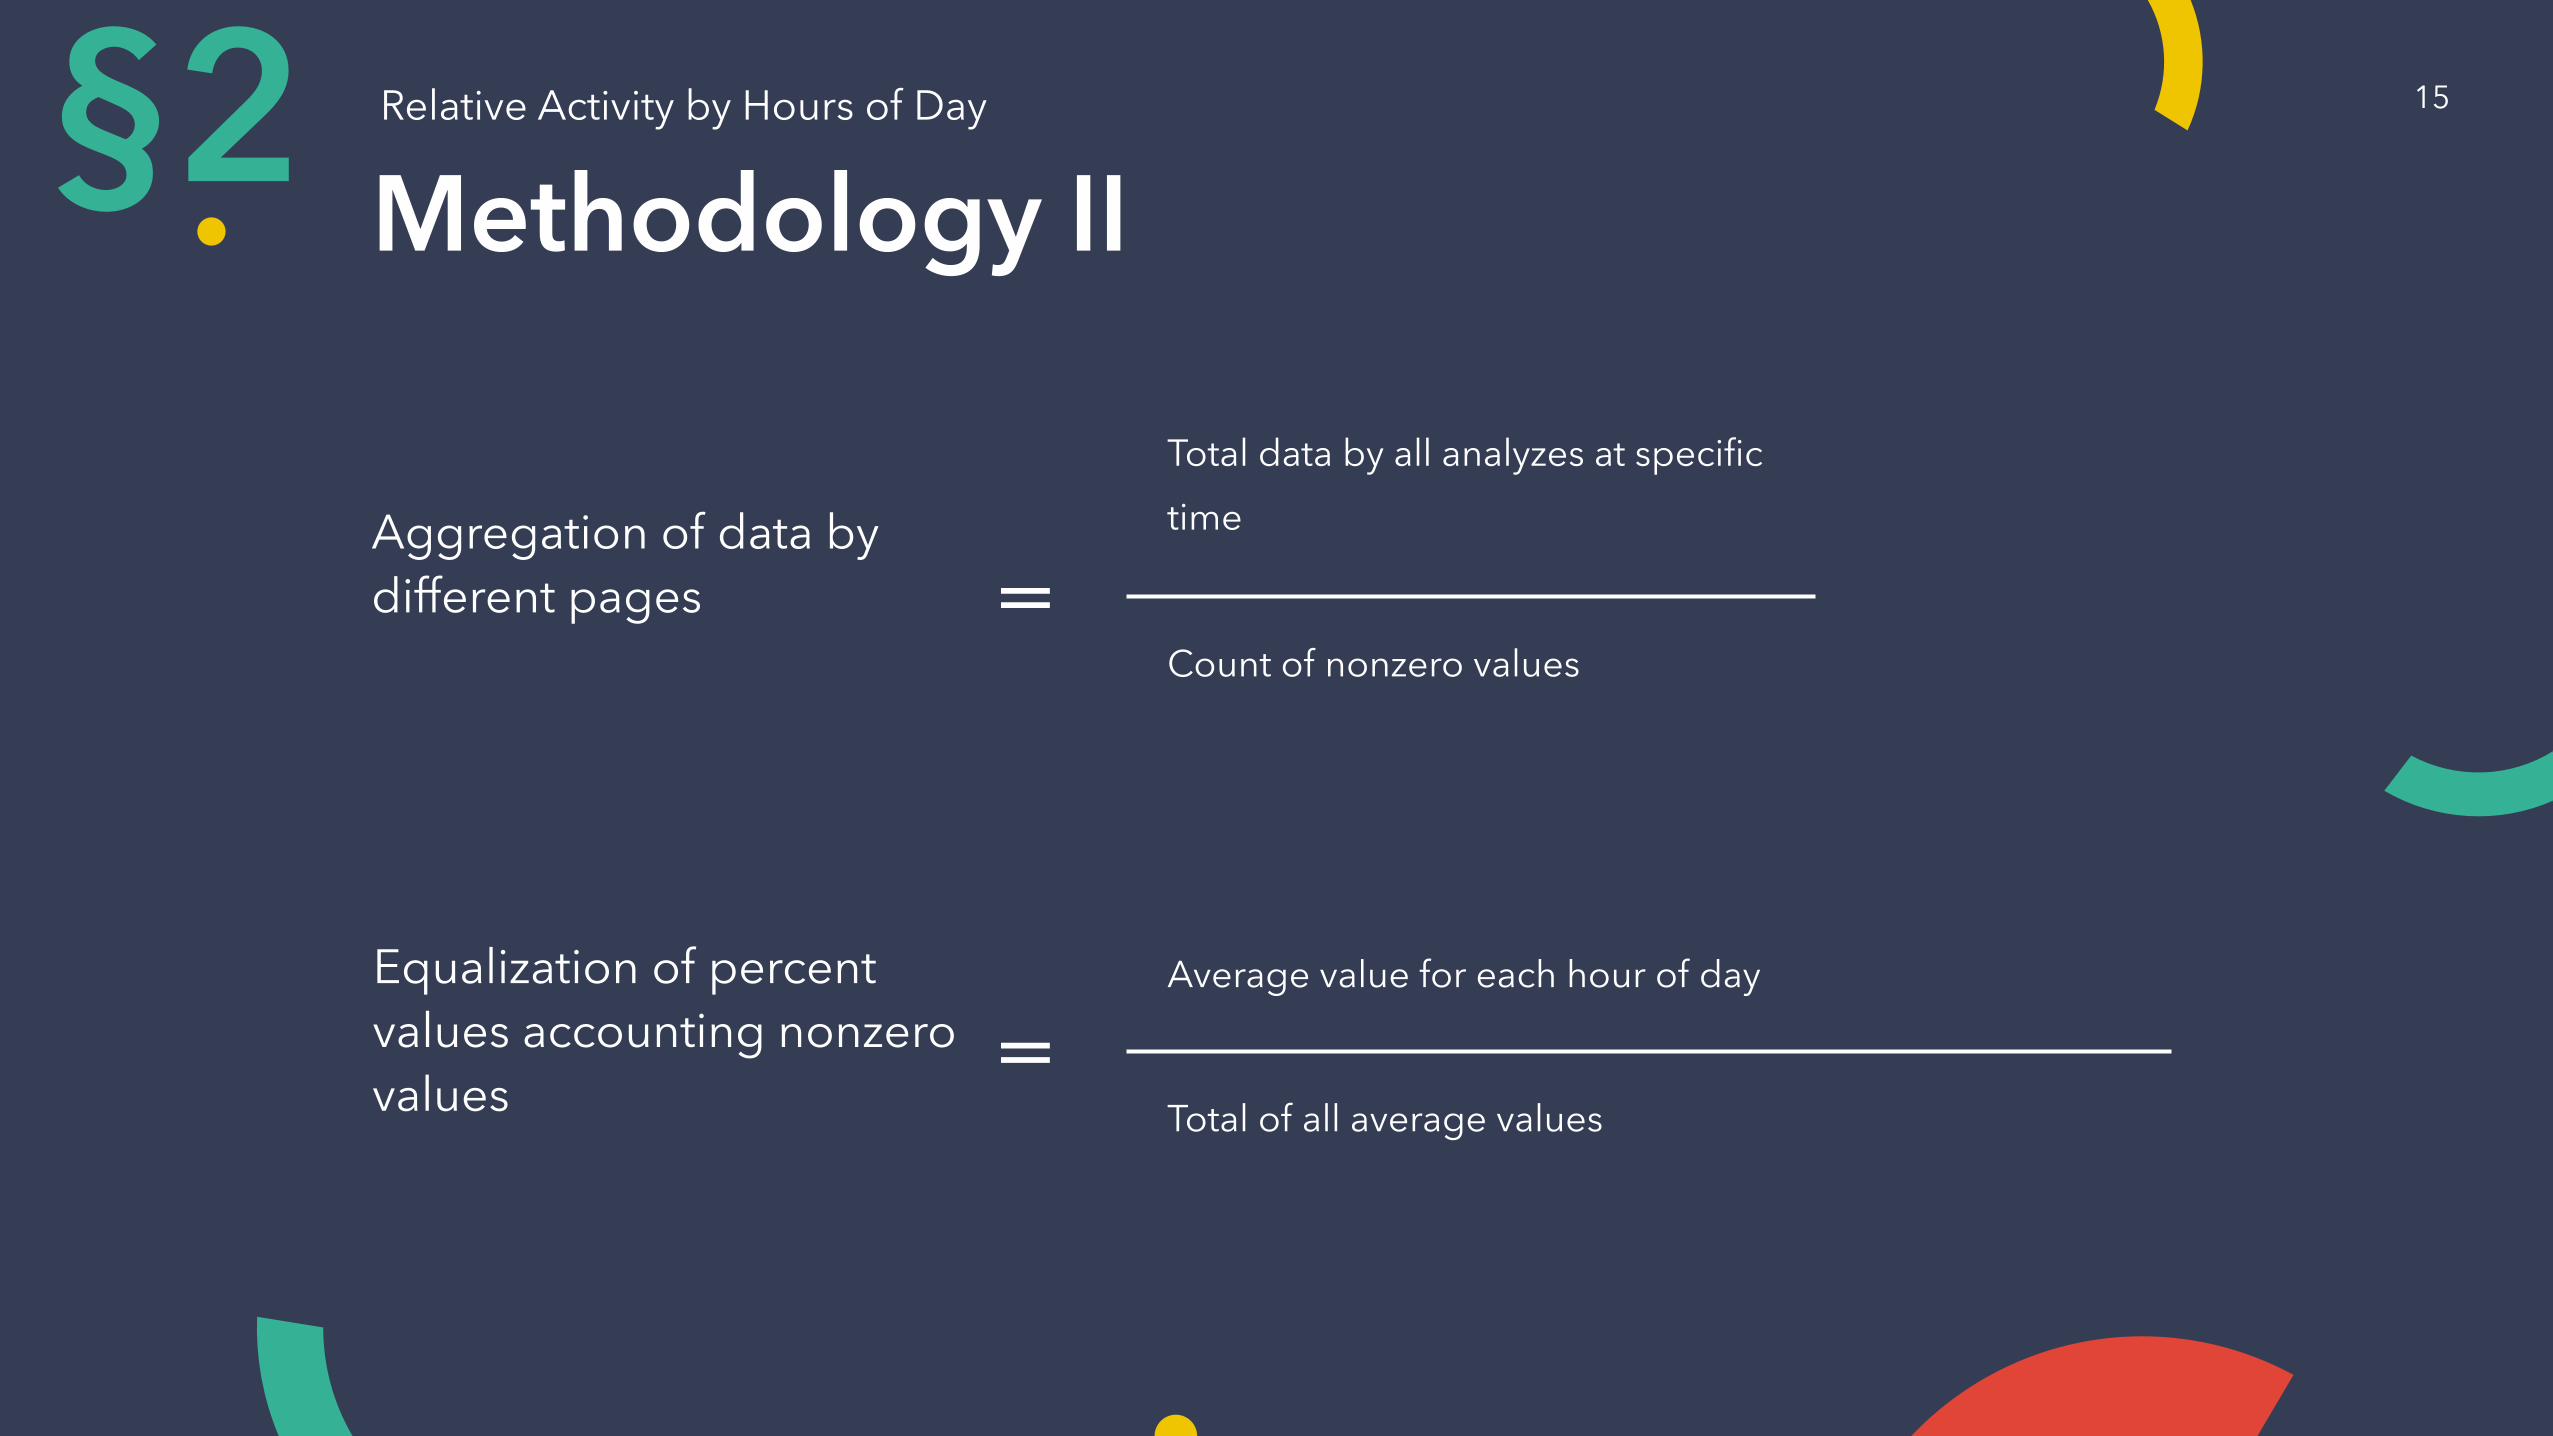
Methodology II
Aggregation of data by di�erent pages
Total data by all analyzes at specific
time
Count of nonzero values=
Equalization of percent values accounting nonzero values
Average value for each hour of day
Total of all average values=
Relative Activity by Hours of Day§2 15
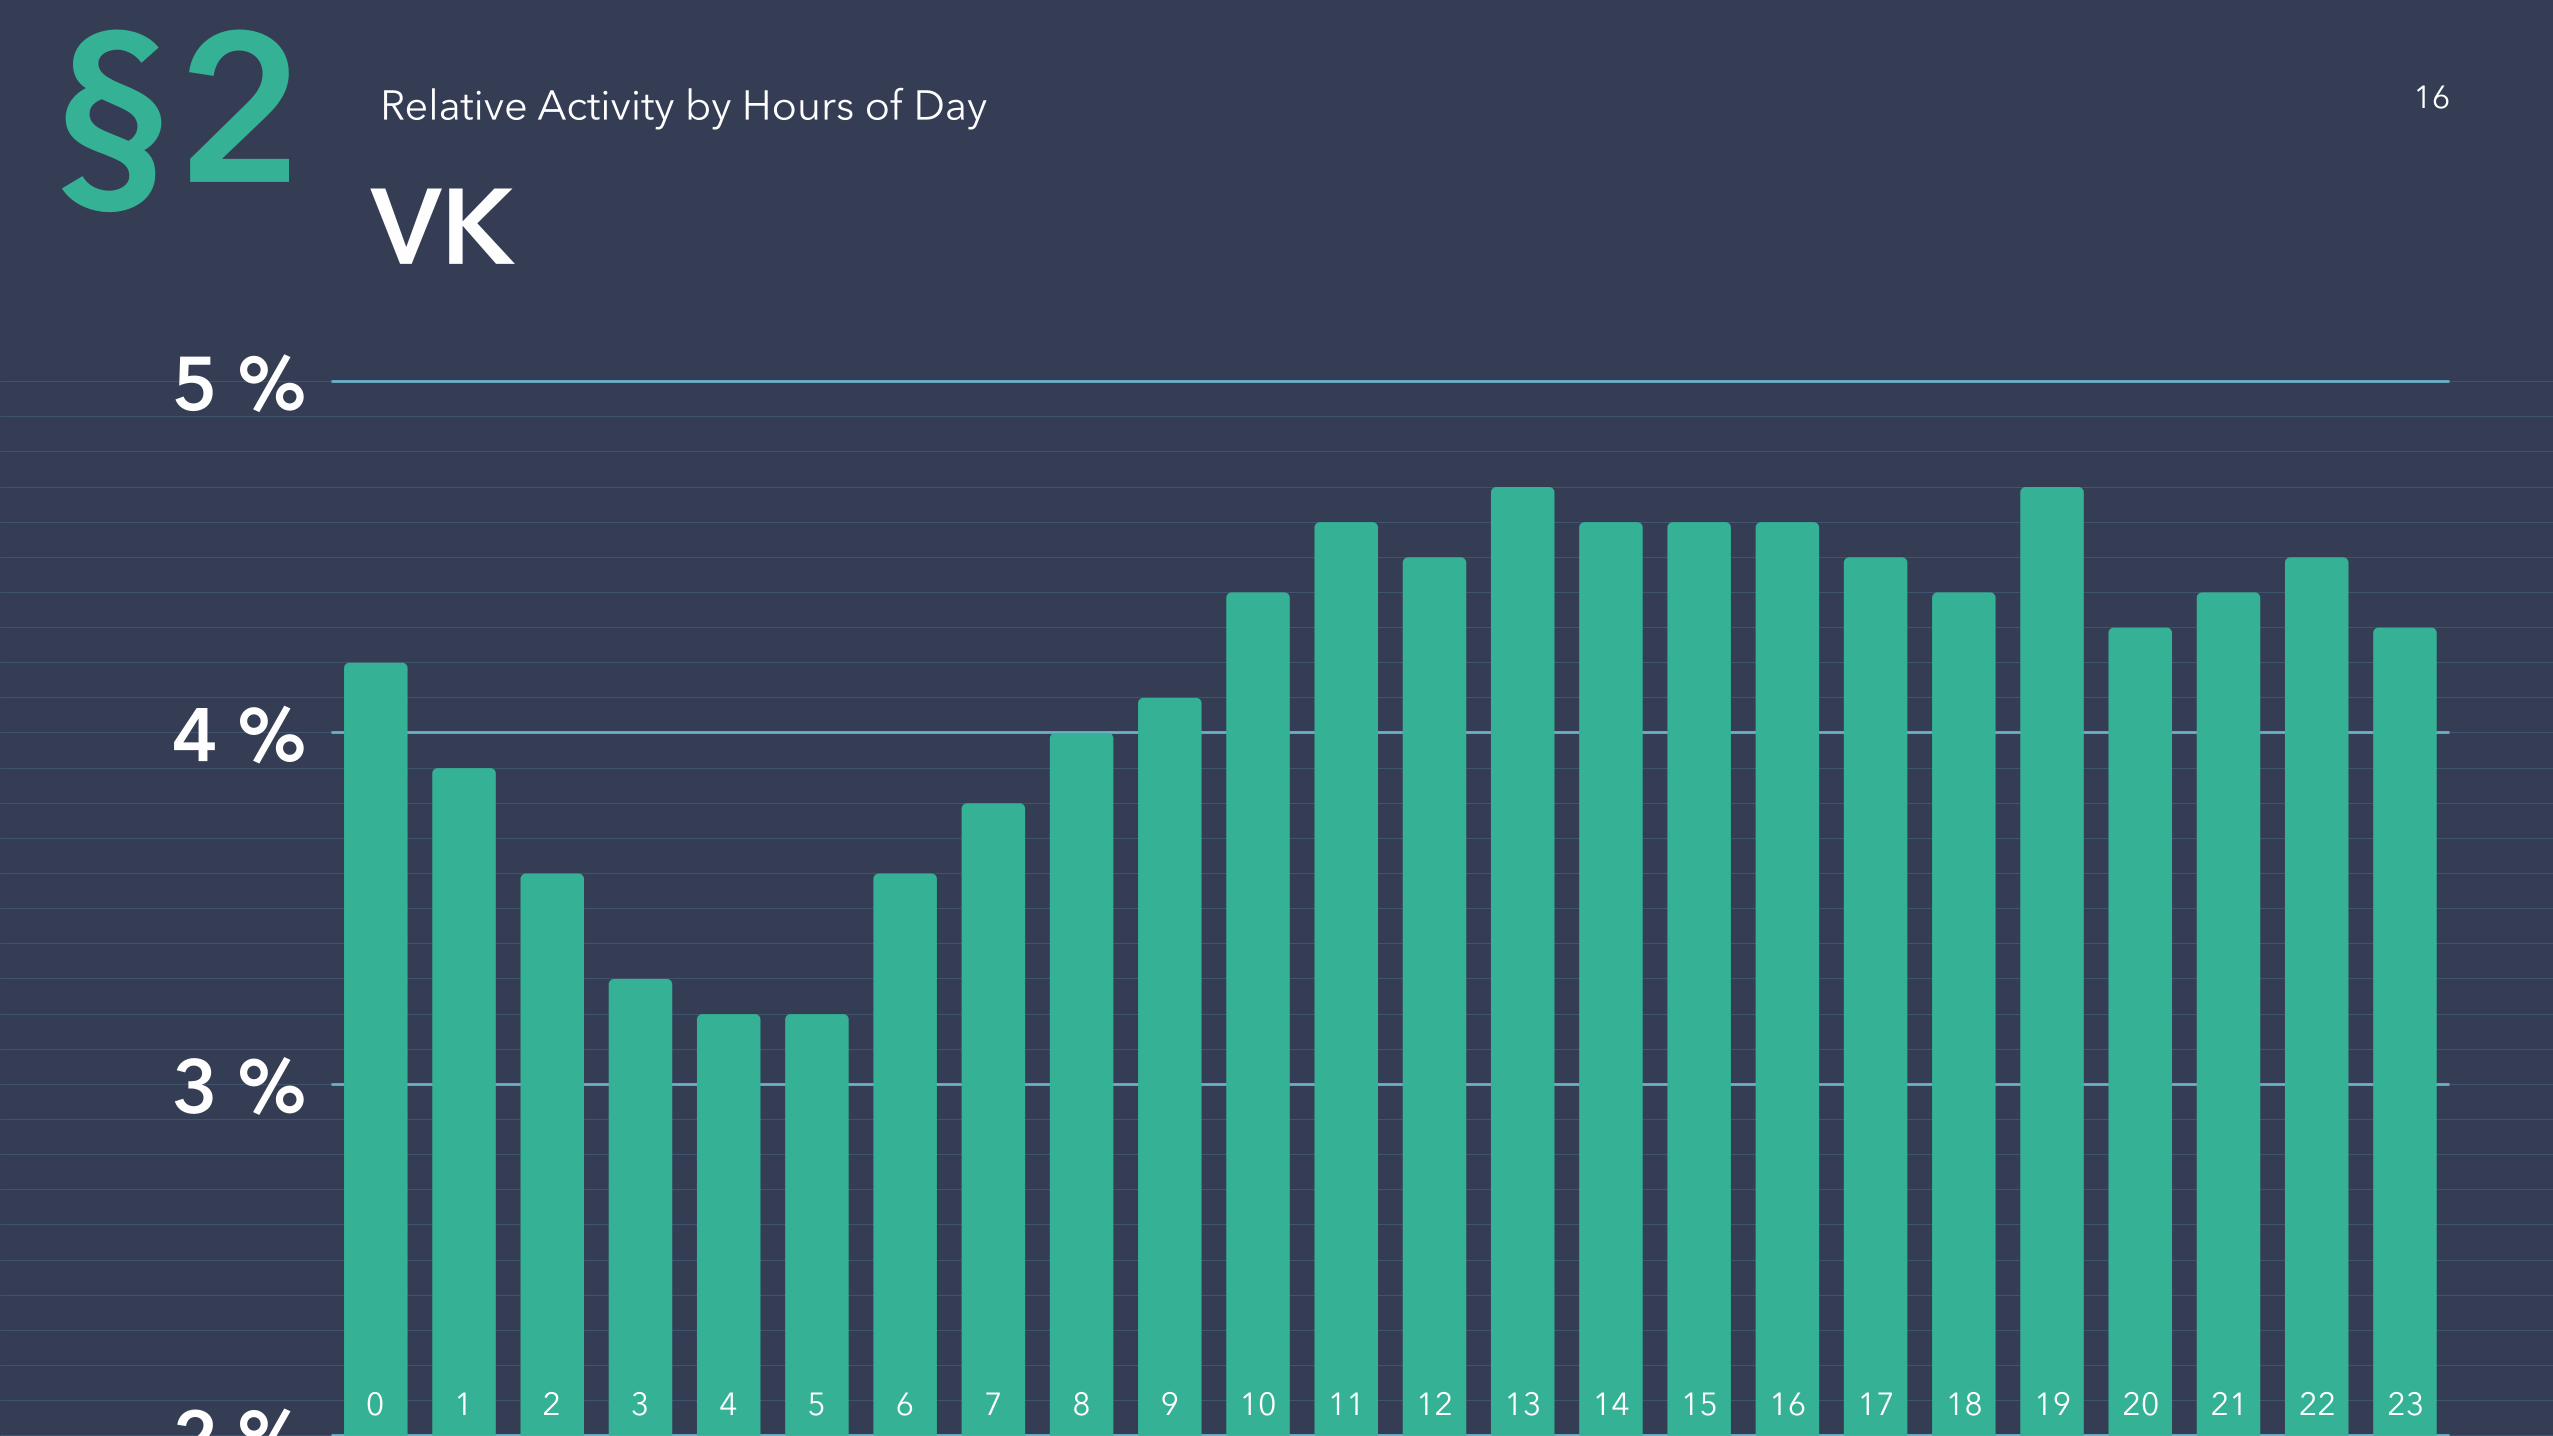
VKRelative Activity by Hours of Day
2 %
3 %
4 %
5 %
0 1 2 3 4 5 6 7 8 9 10 11 12 13 14 15 16 17 18 19 20 21 22 23
§2 16
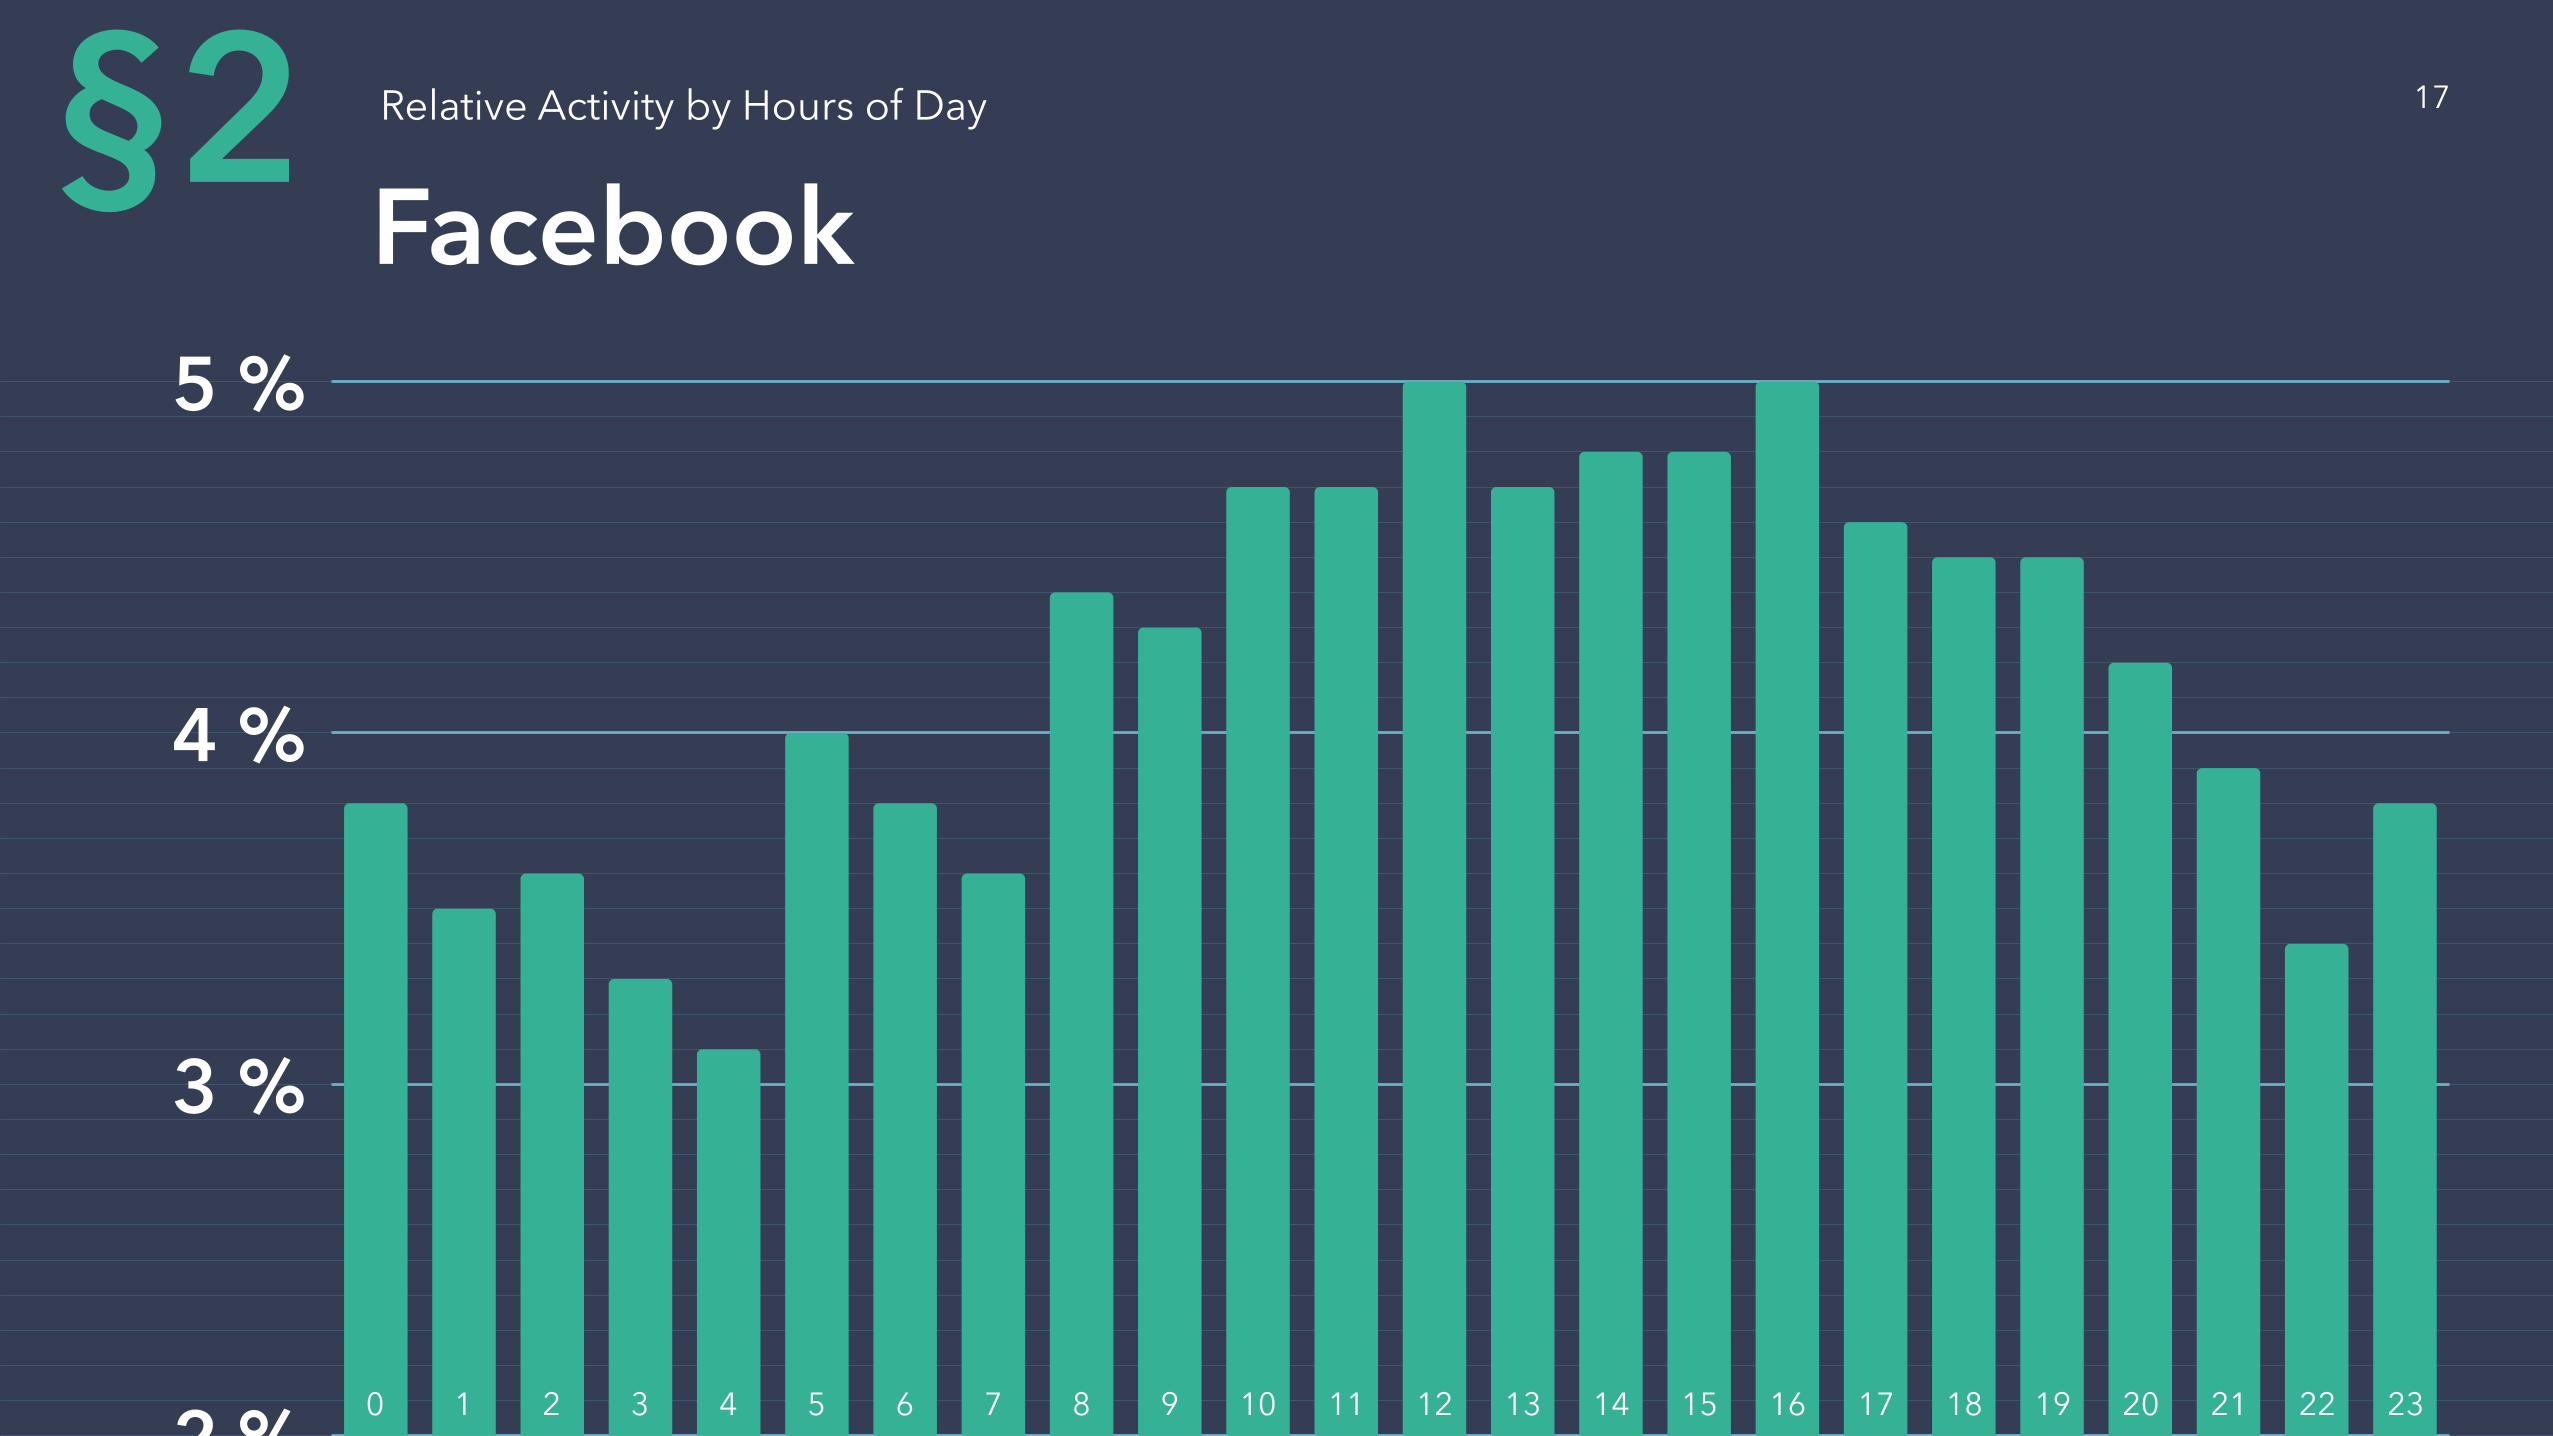
2 %
3 %
4 %
5 %
FacebookRelative Activity by Hours of Day
0 1 2 3 4 5 6 7 8 9 10 11 12 13 14 15 16 17 18 19 20 21 22 23
§2 17
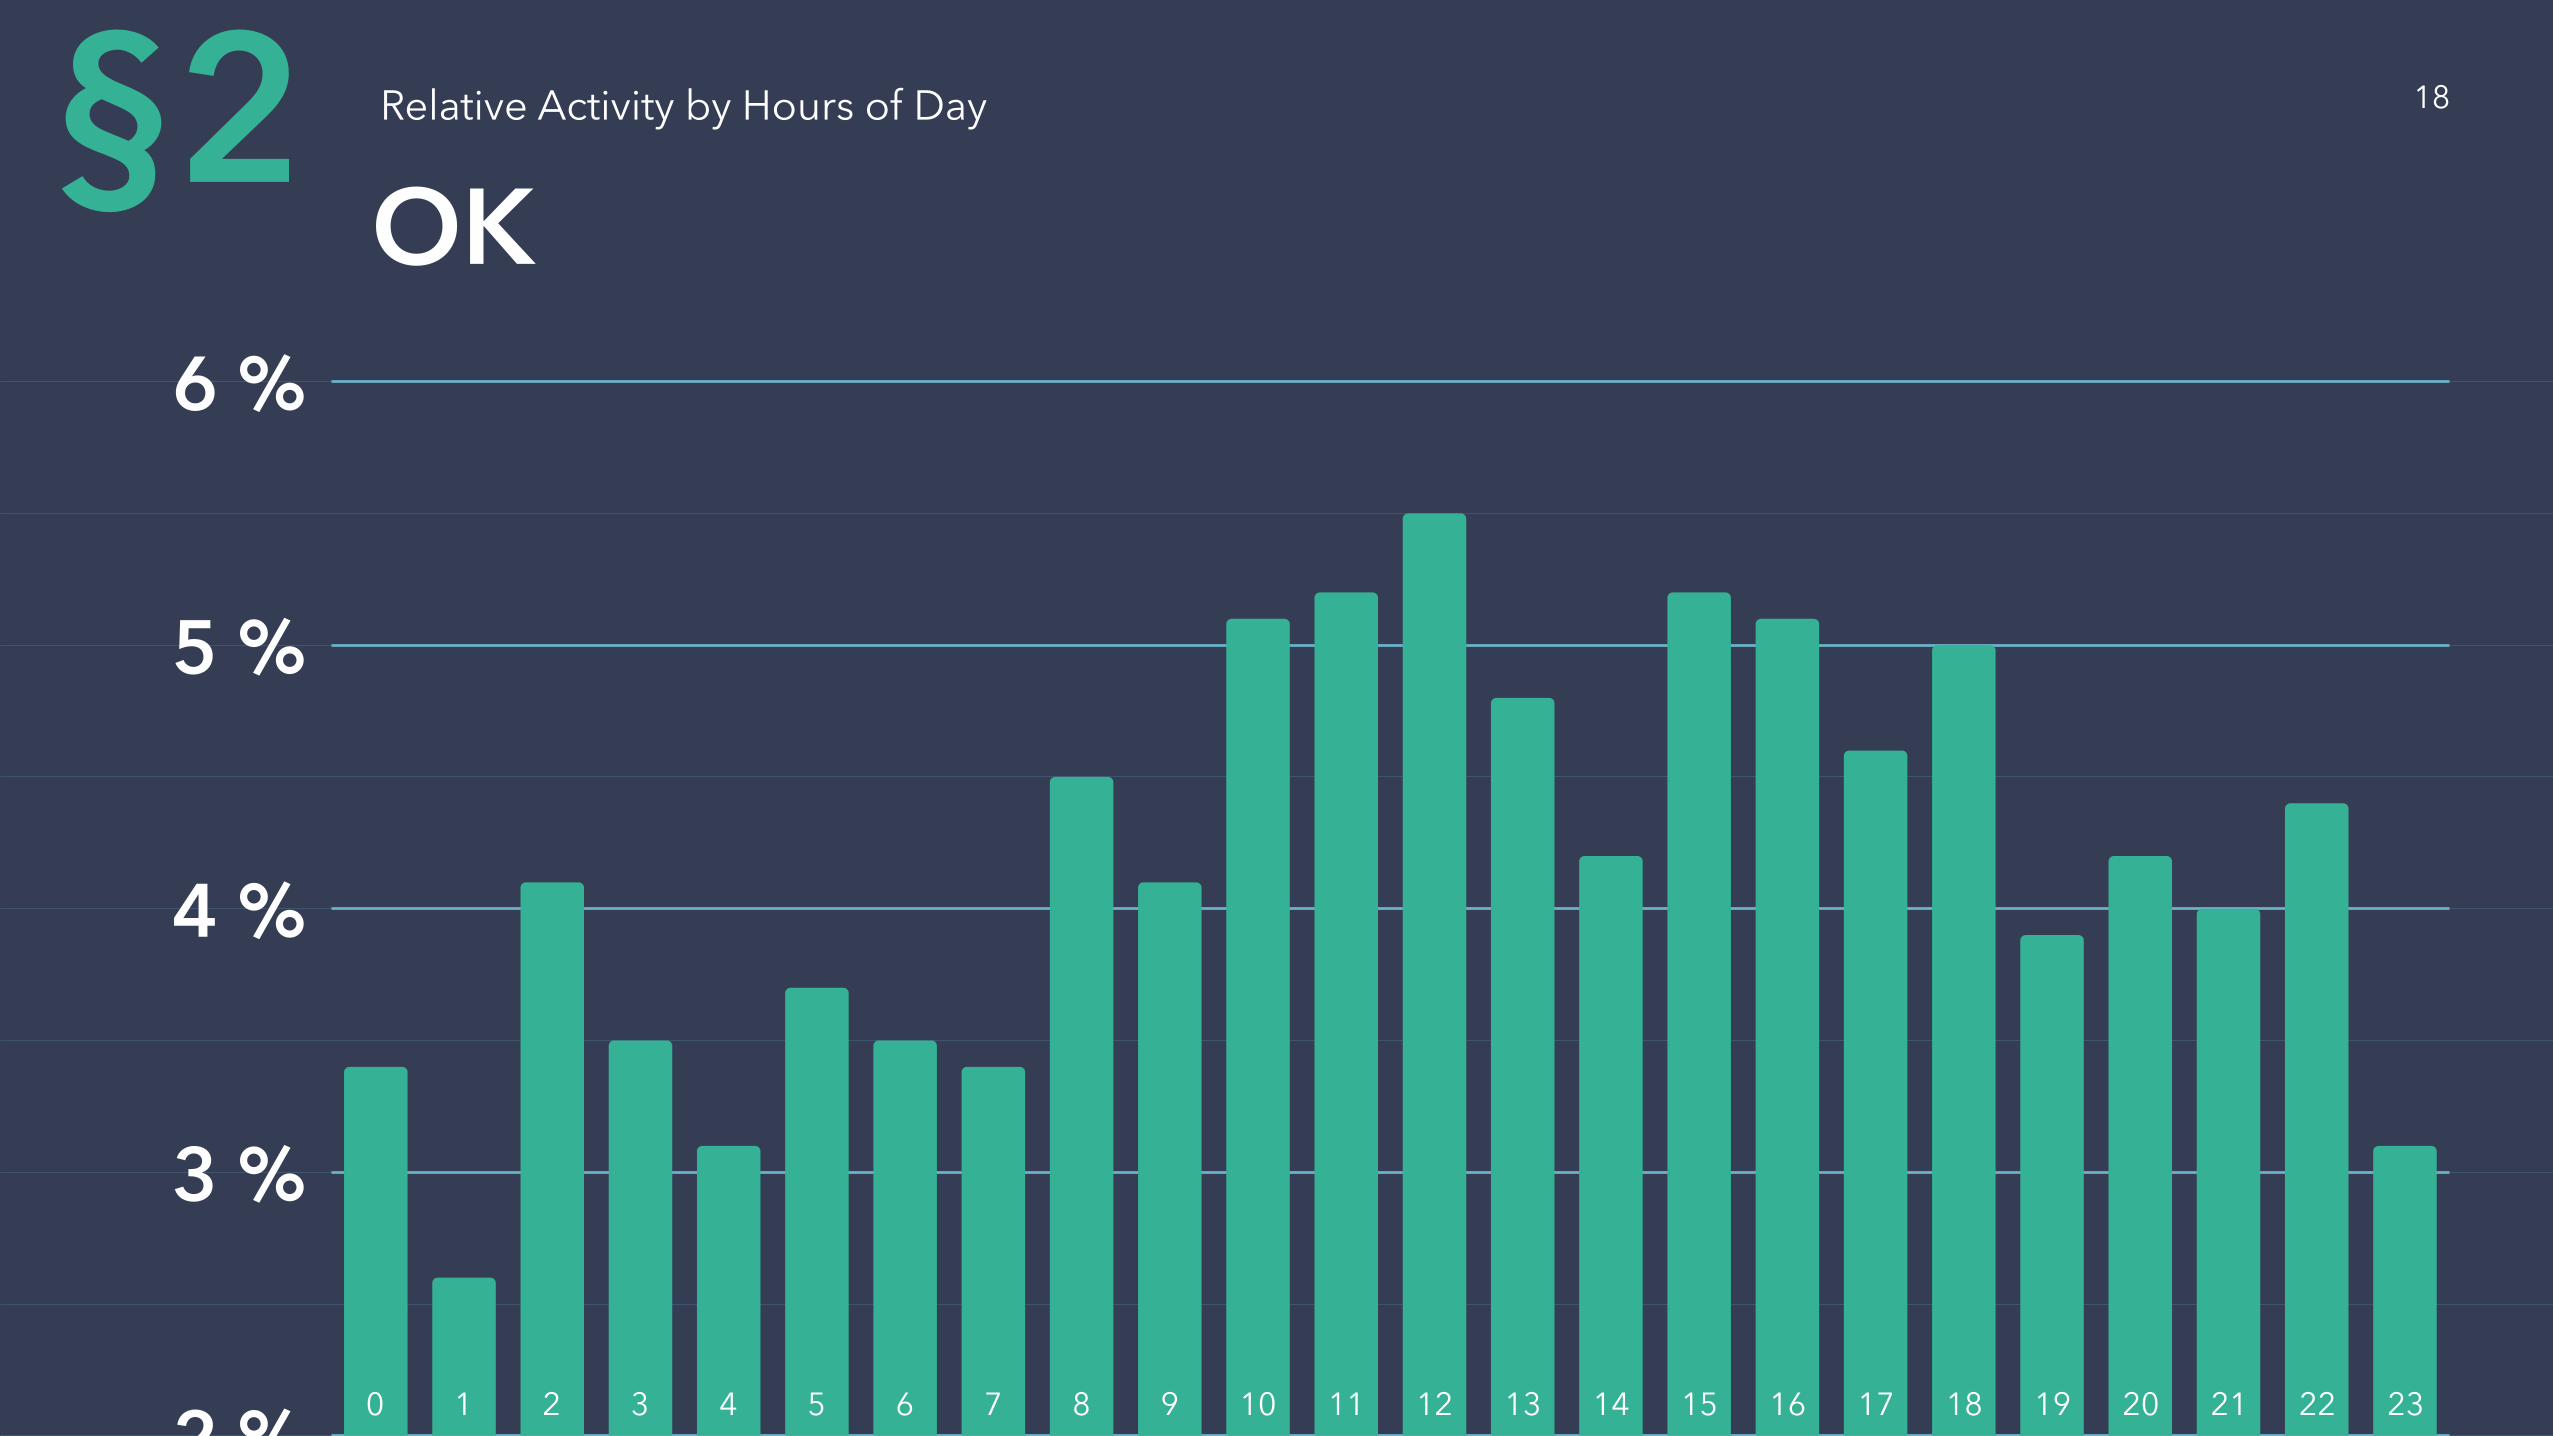
2 %
3 %
4 %
5 %
6 %
OKRelative Activity by Hours of Day
0 1 2 3 4 5 6 7 8 9 10 11 12 13 14 15 16 17 18 19 20 21 22 23
§2 18
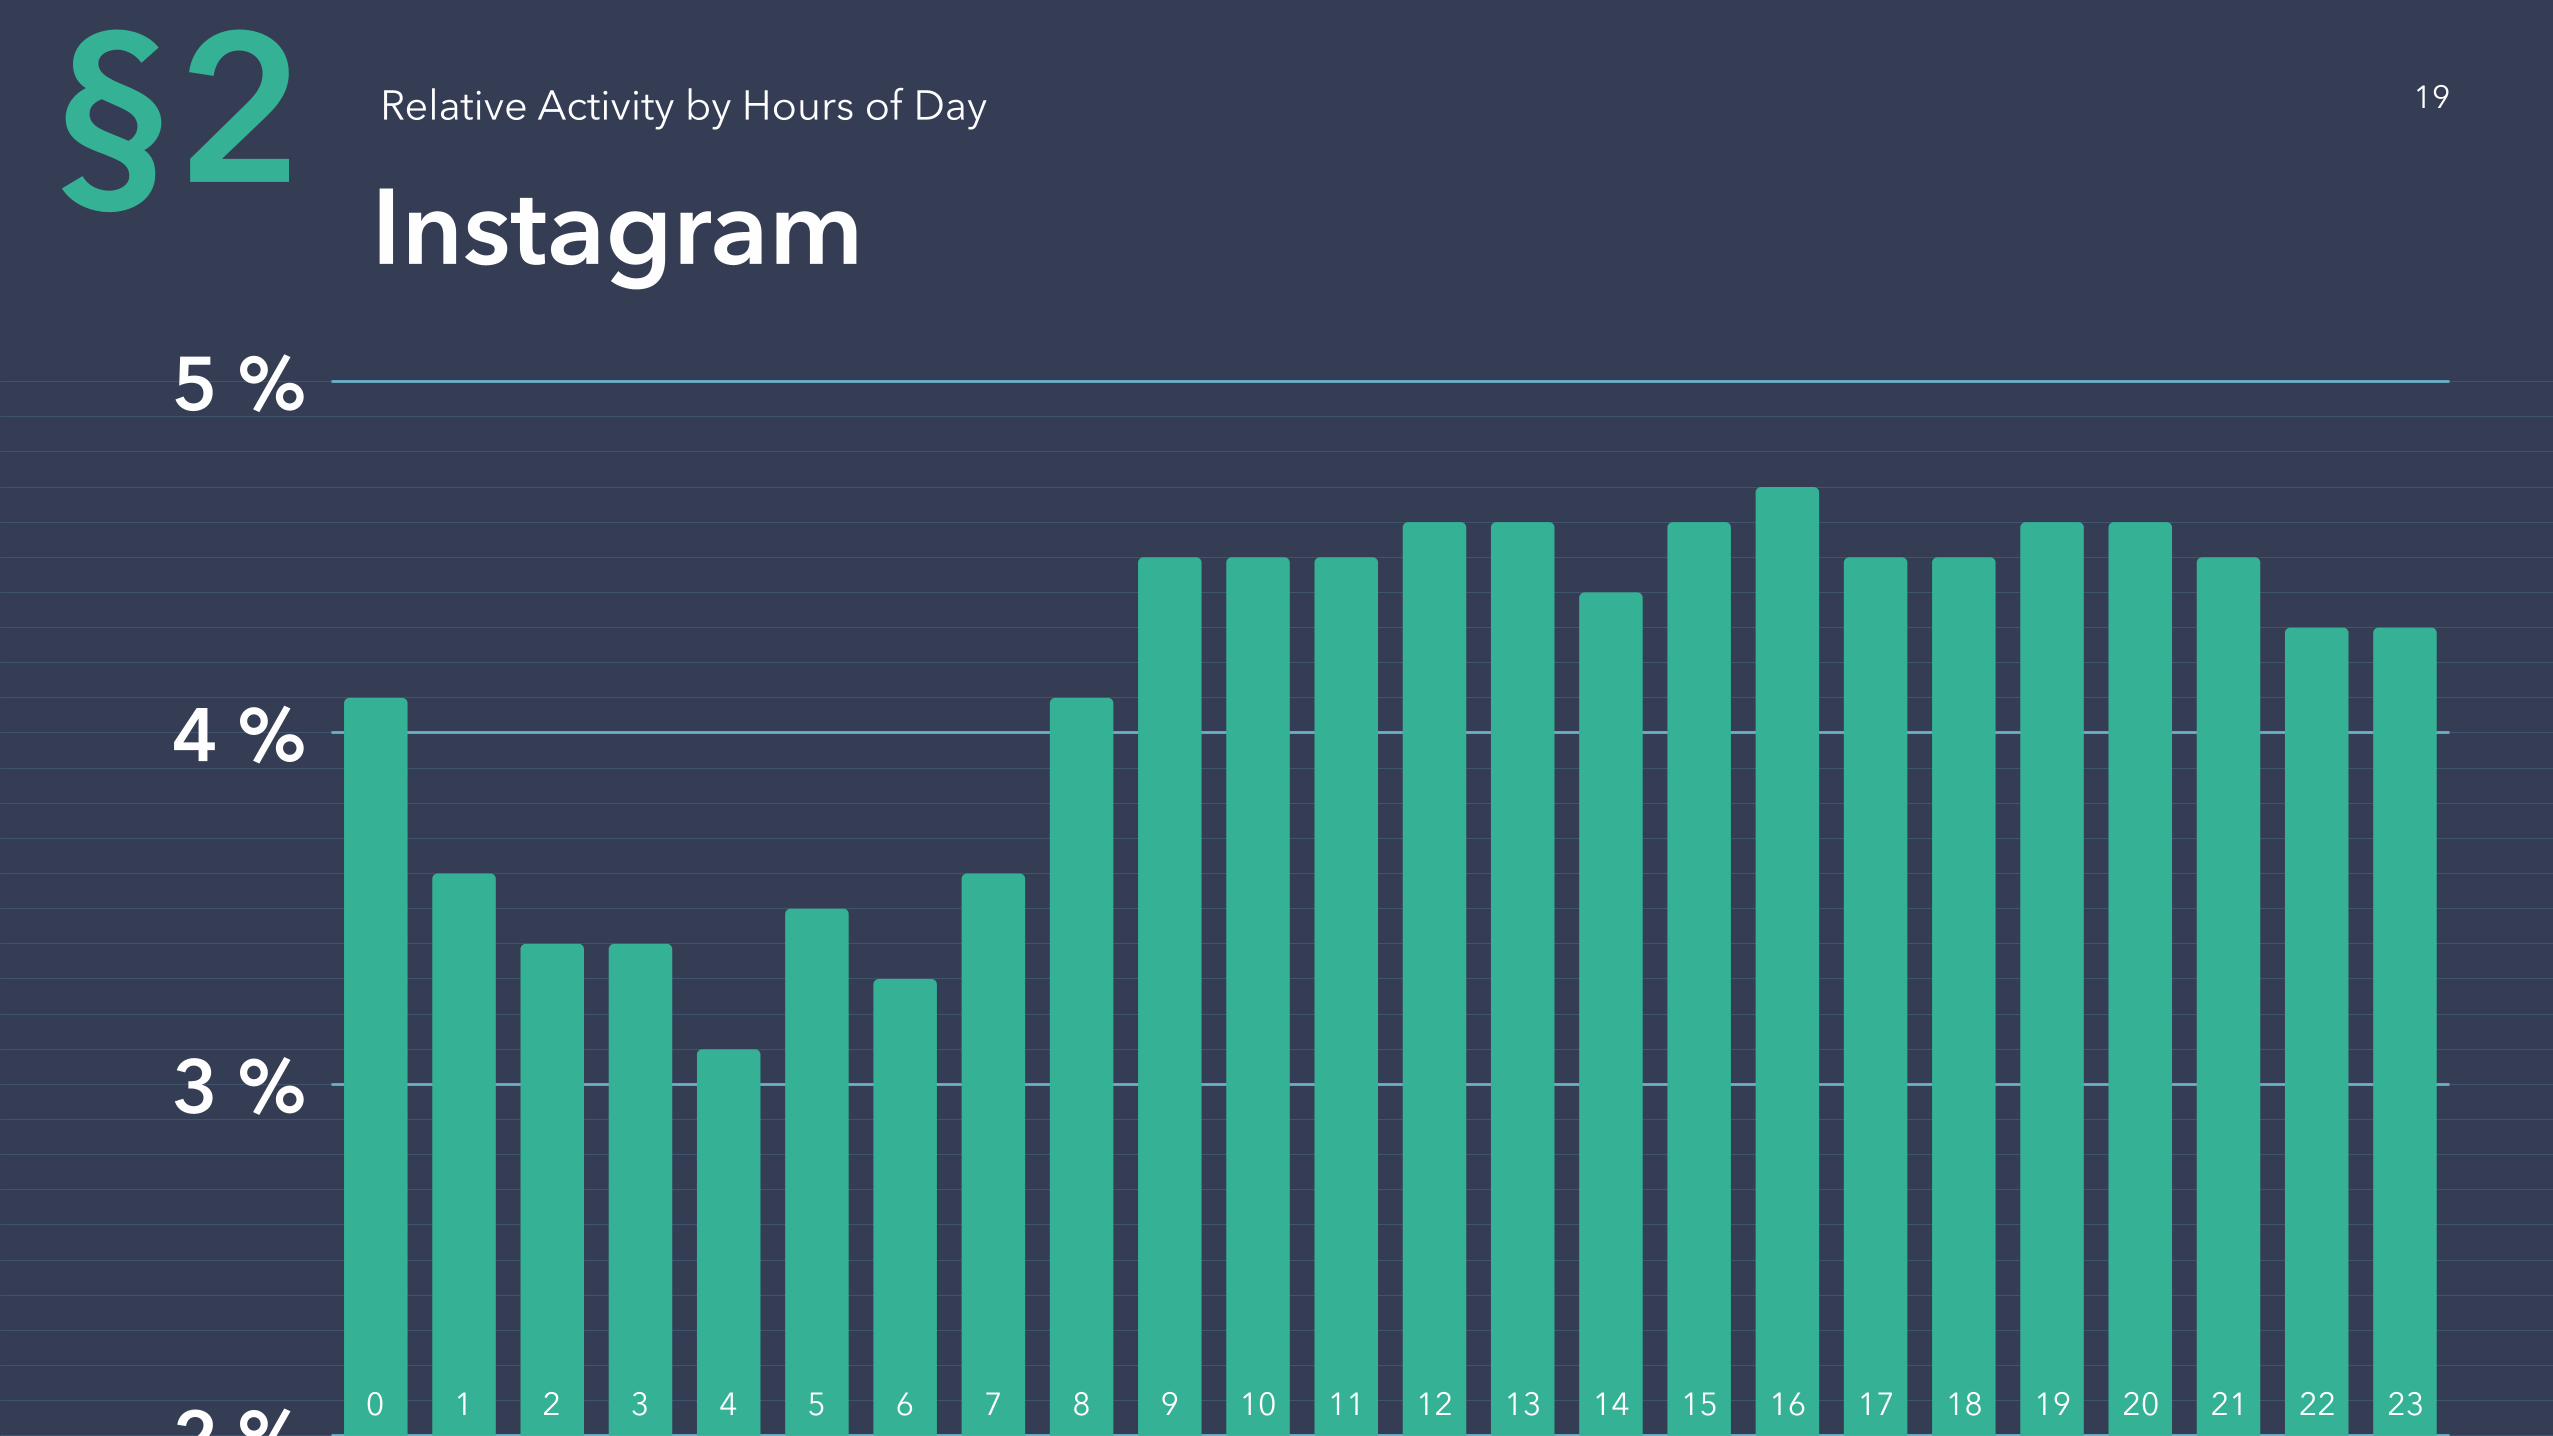
2 %
3 %
4 %
5 %
InstagramRelative Activity by Hours of Day
0 1 2 3 4 5 6 7 8 9 10 11 12 13 14 15 16 17 18 19 20 21 22 23
§2 19
1 %
2 %
3 %
4 %
5 %
6 %
7 %
8 %
9 %
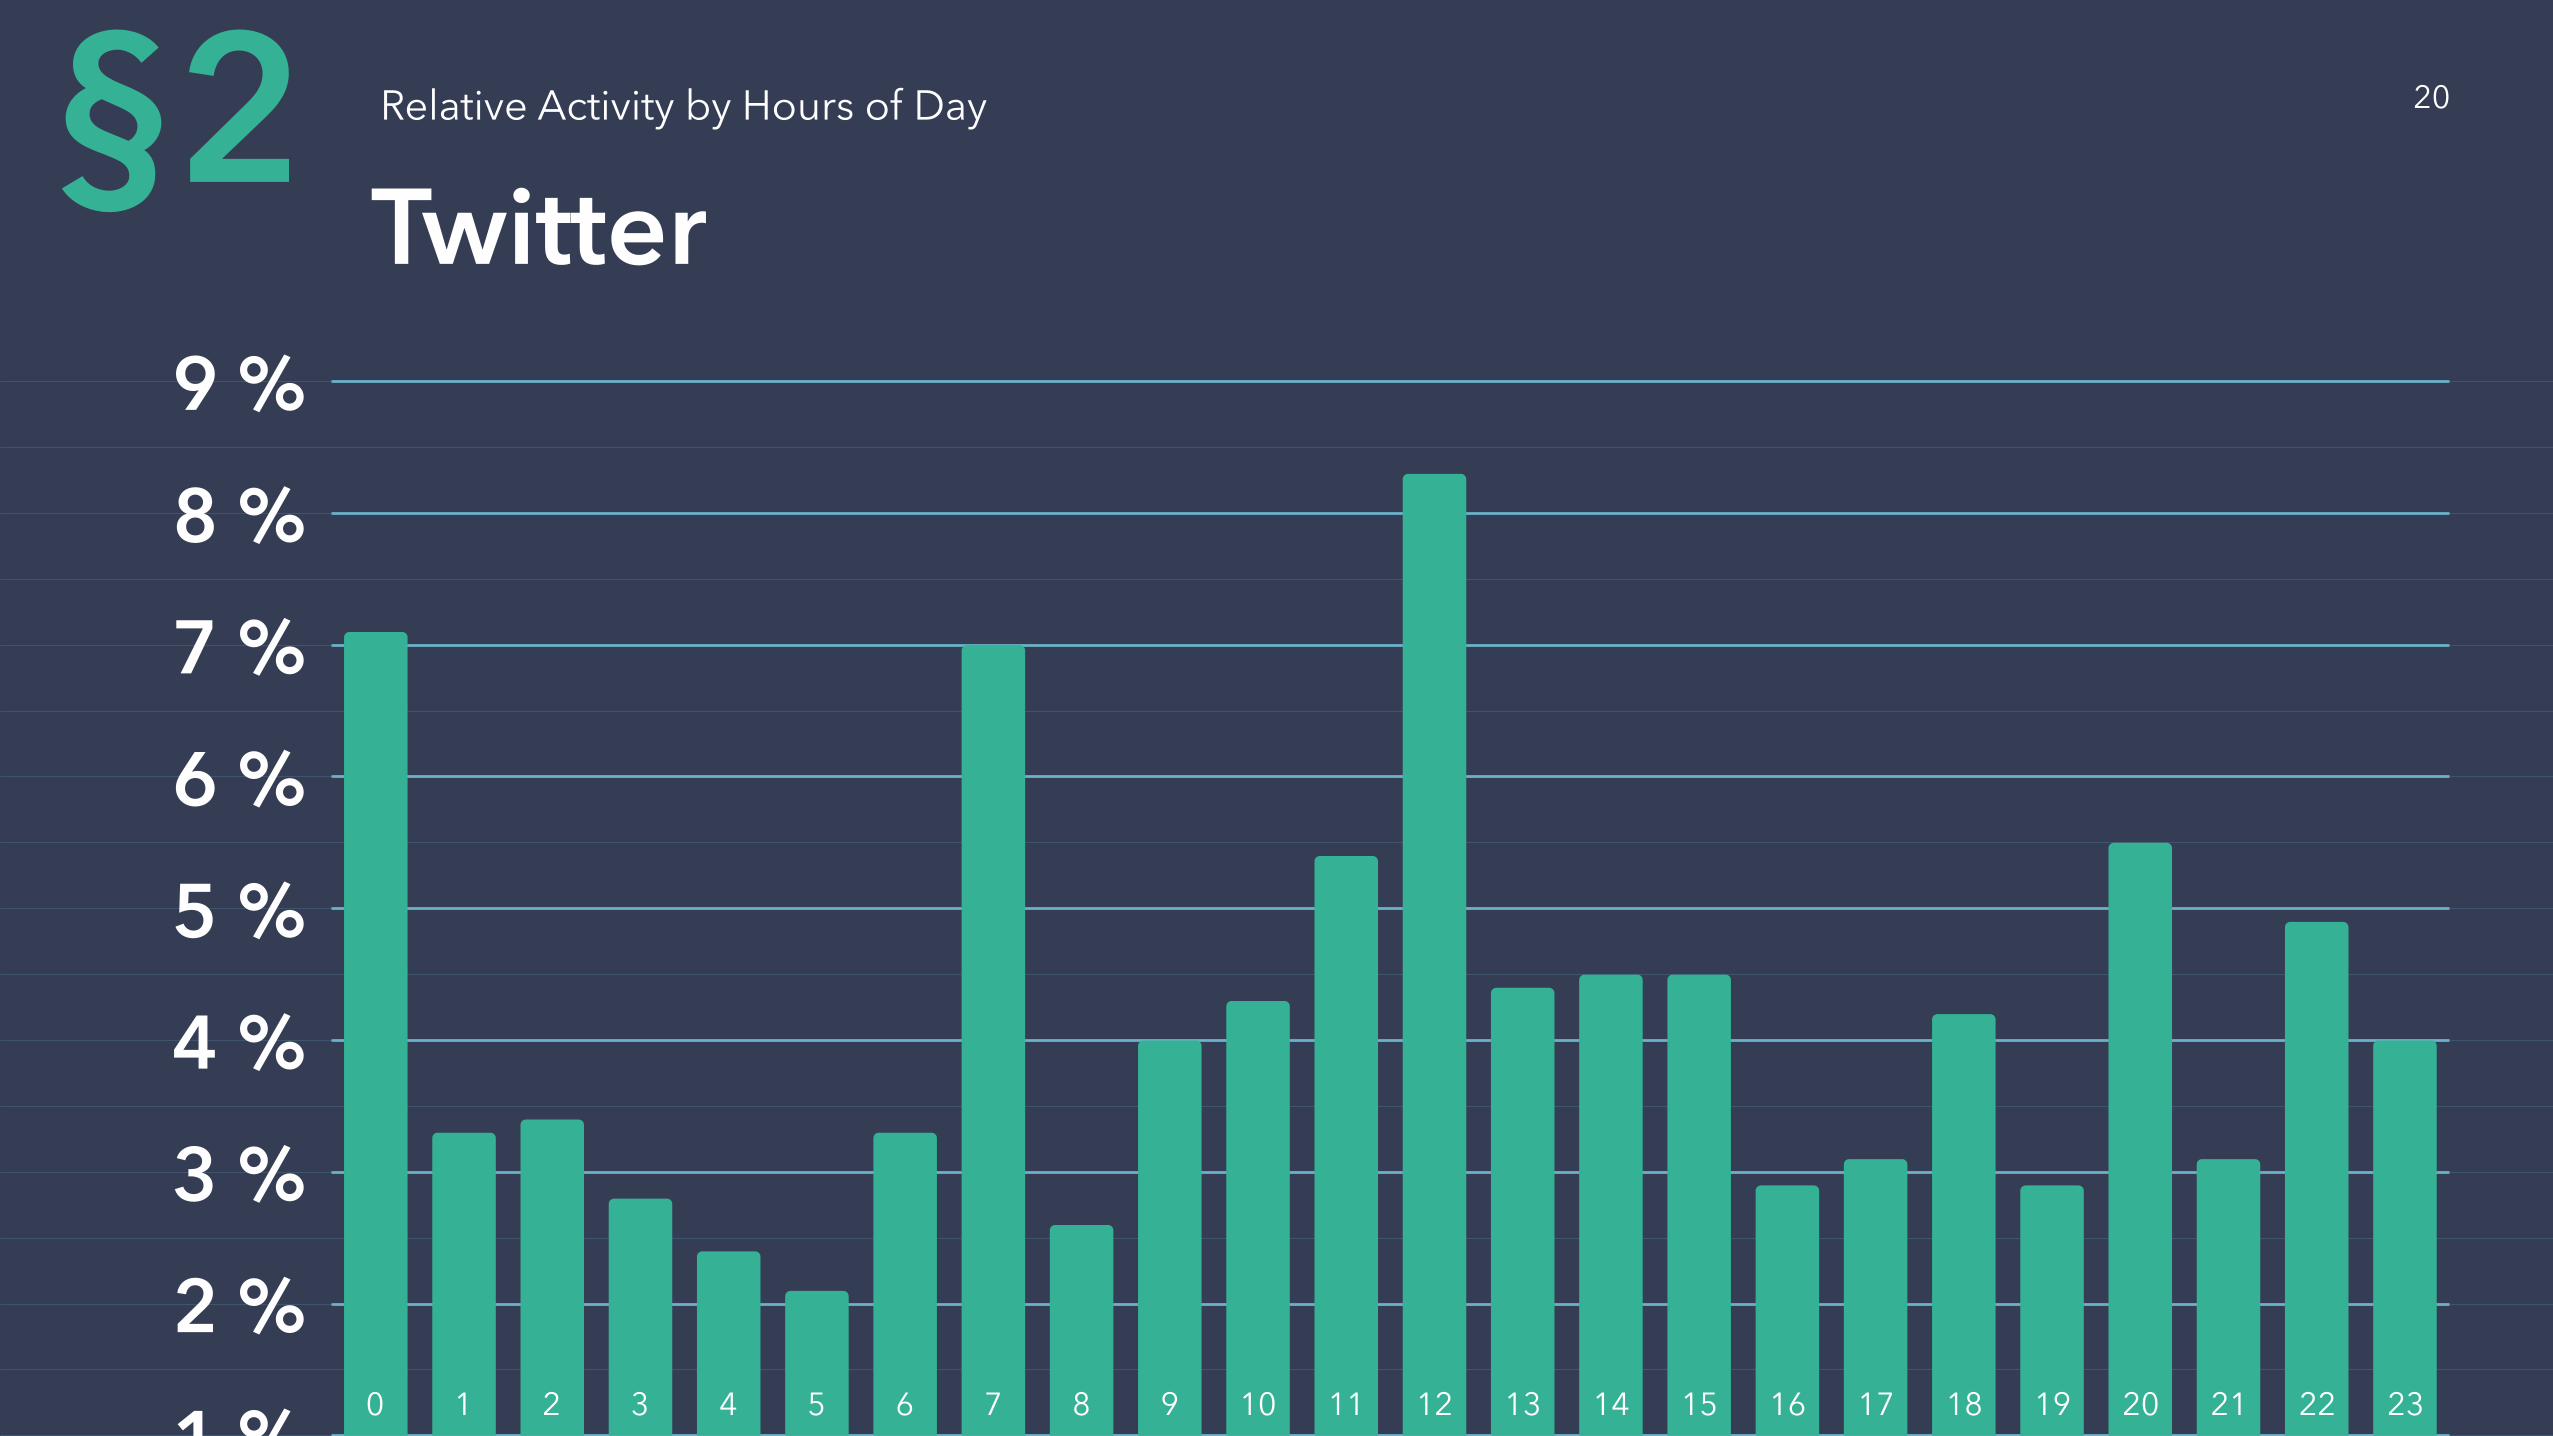
TwitterRelative Activity by Hours of Day
0 1 2 3 4 5 6 7 8 9 10 11 12 13 14 15 16 17 18 19 20 21 22 23
§2 20
0 %
5 %
10 %
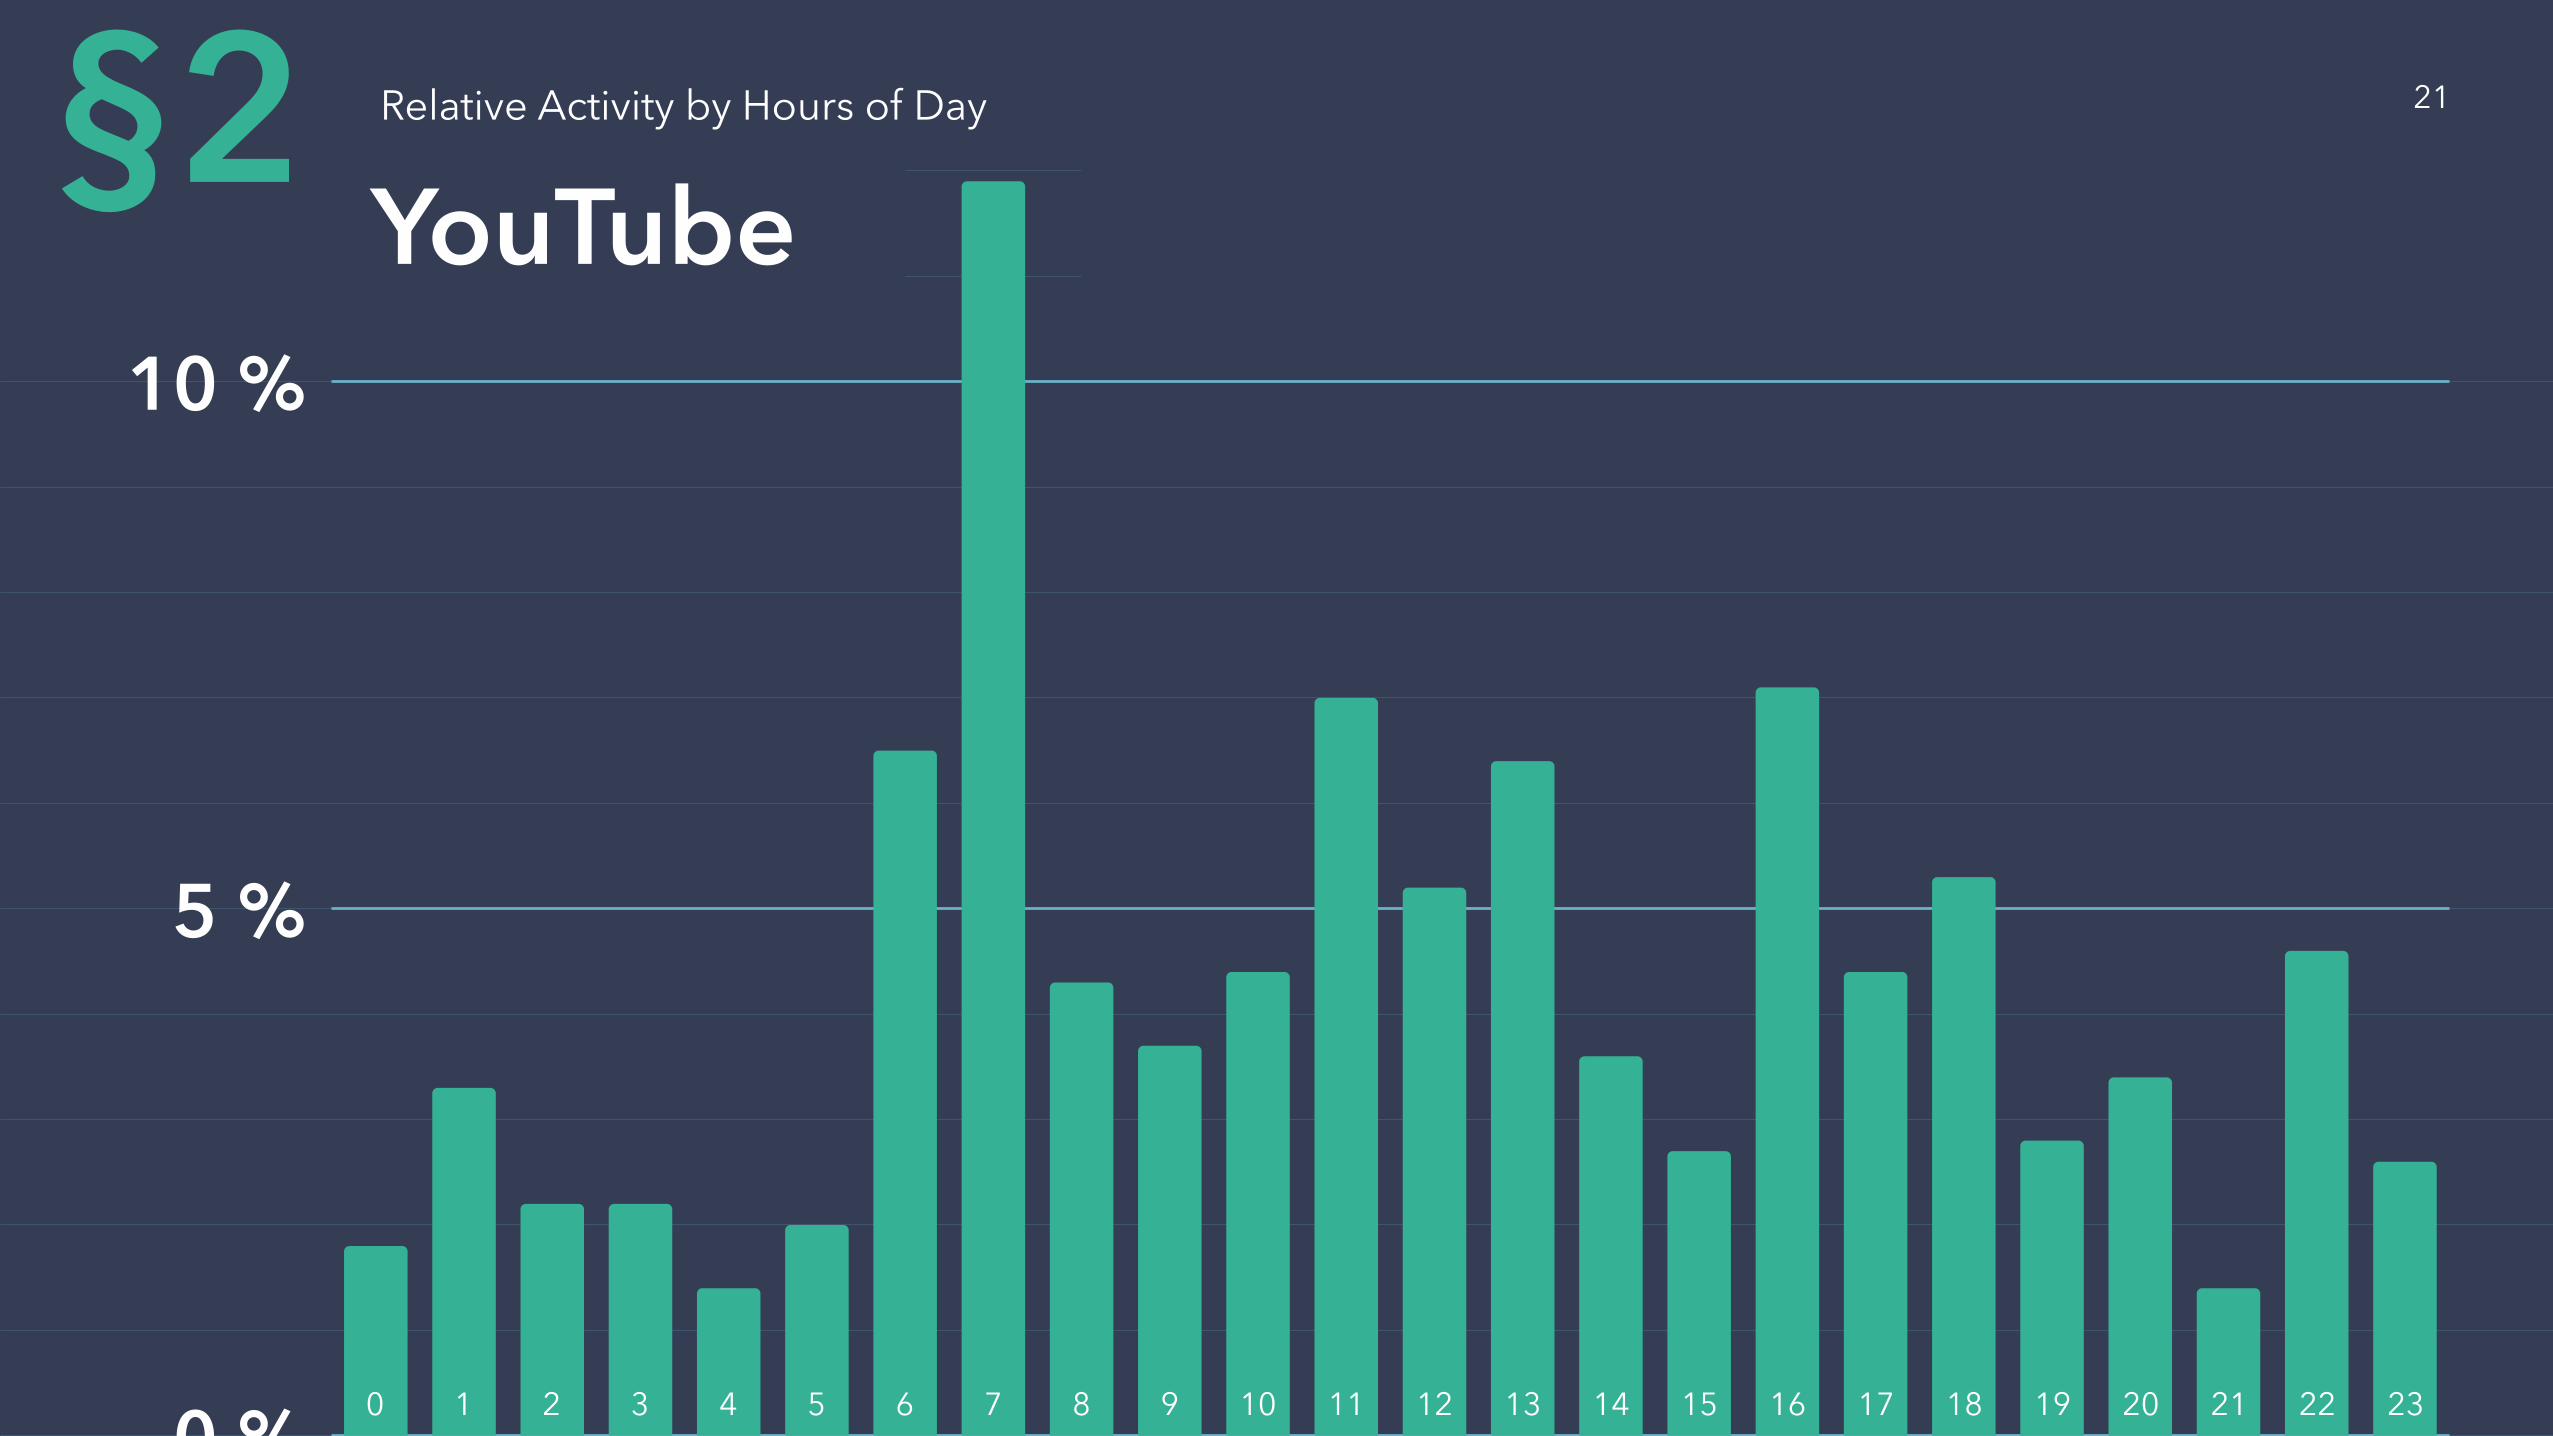
YouTubeRelative Activity by Hours of Day
0 1 2 3 4 5 6 7 8 9 10 11 12 13 14 15 16 17 18 19 20 21 22 23
§2 21

0 %
1 %
2 %
3 %
4 %
5 %
6 %
Average by All Social Media’sRelative Activity by Hours of Day
0 1 2 3 4 5 6 7 8 9 10 11 12 13 14 15 16 17 18 19 20 21 22 23
§2 22

§Relative Activity by Text Length in Posts
3
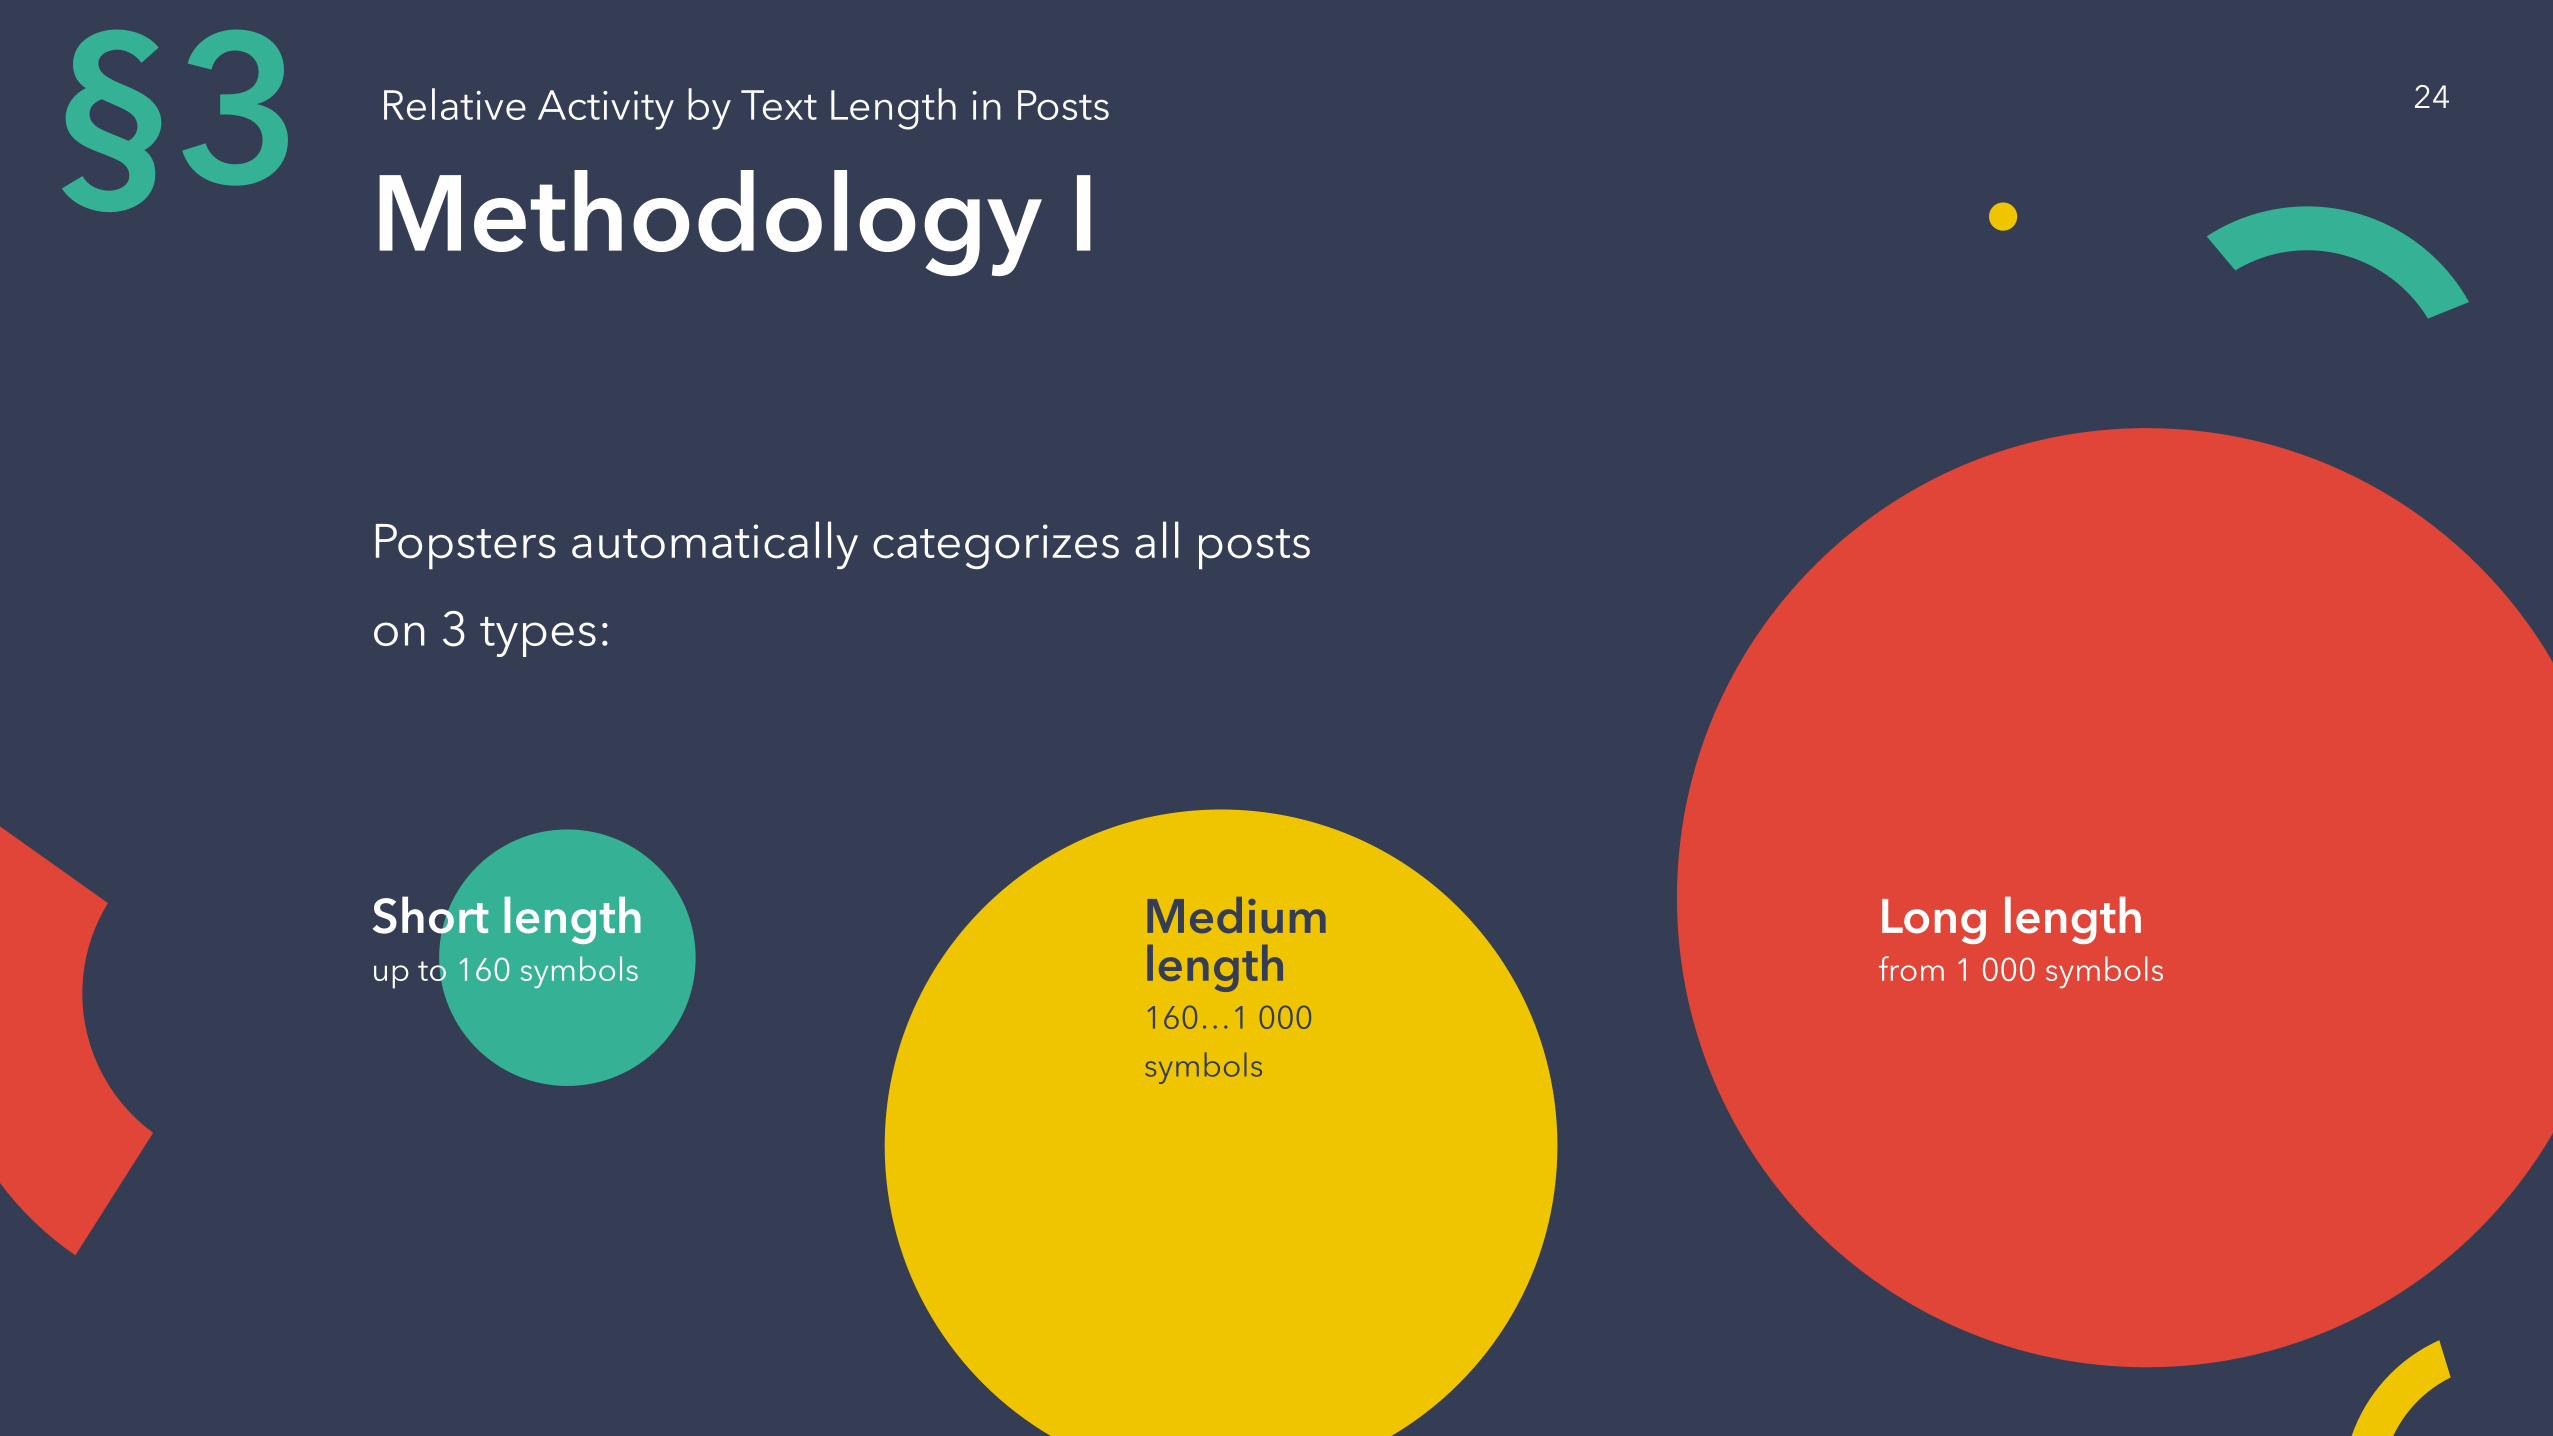
Methodology IRelative Activity by Text Length in Posts§3
Popsters automatically categorizes all posts
on 3 types:
Short lengthup to 160 symbols
Medium length160…1 000
symbols
Long lengthfrom 1 000 symbols
24
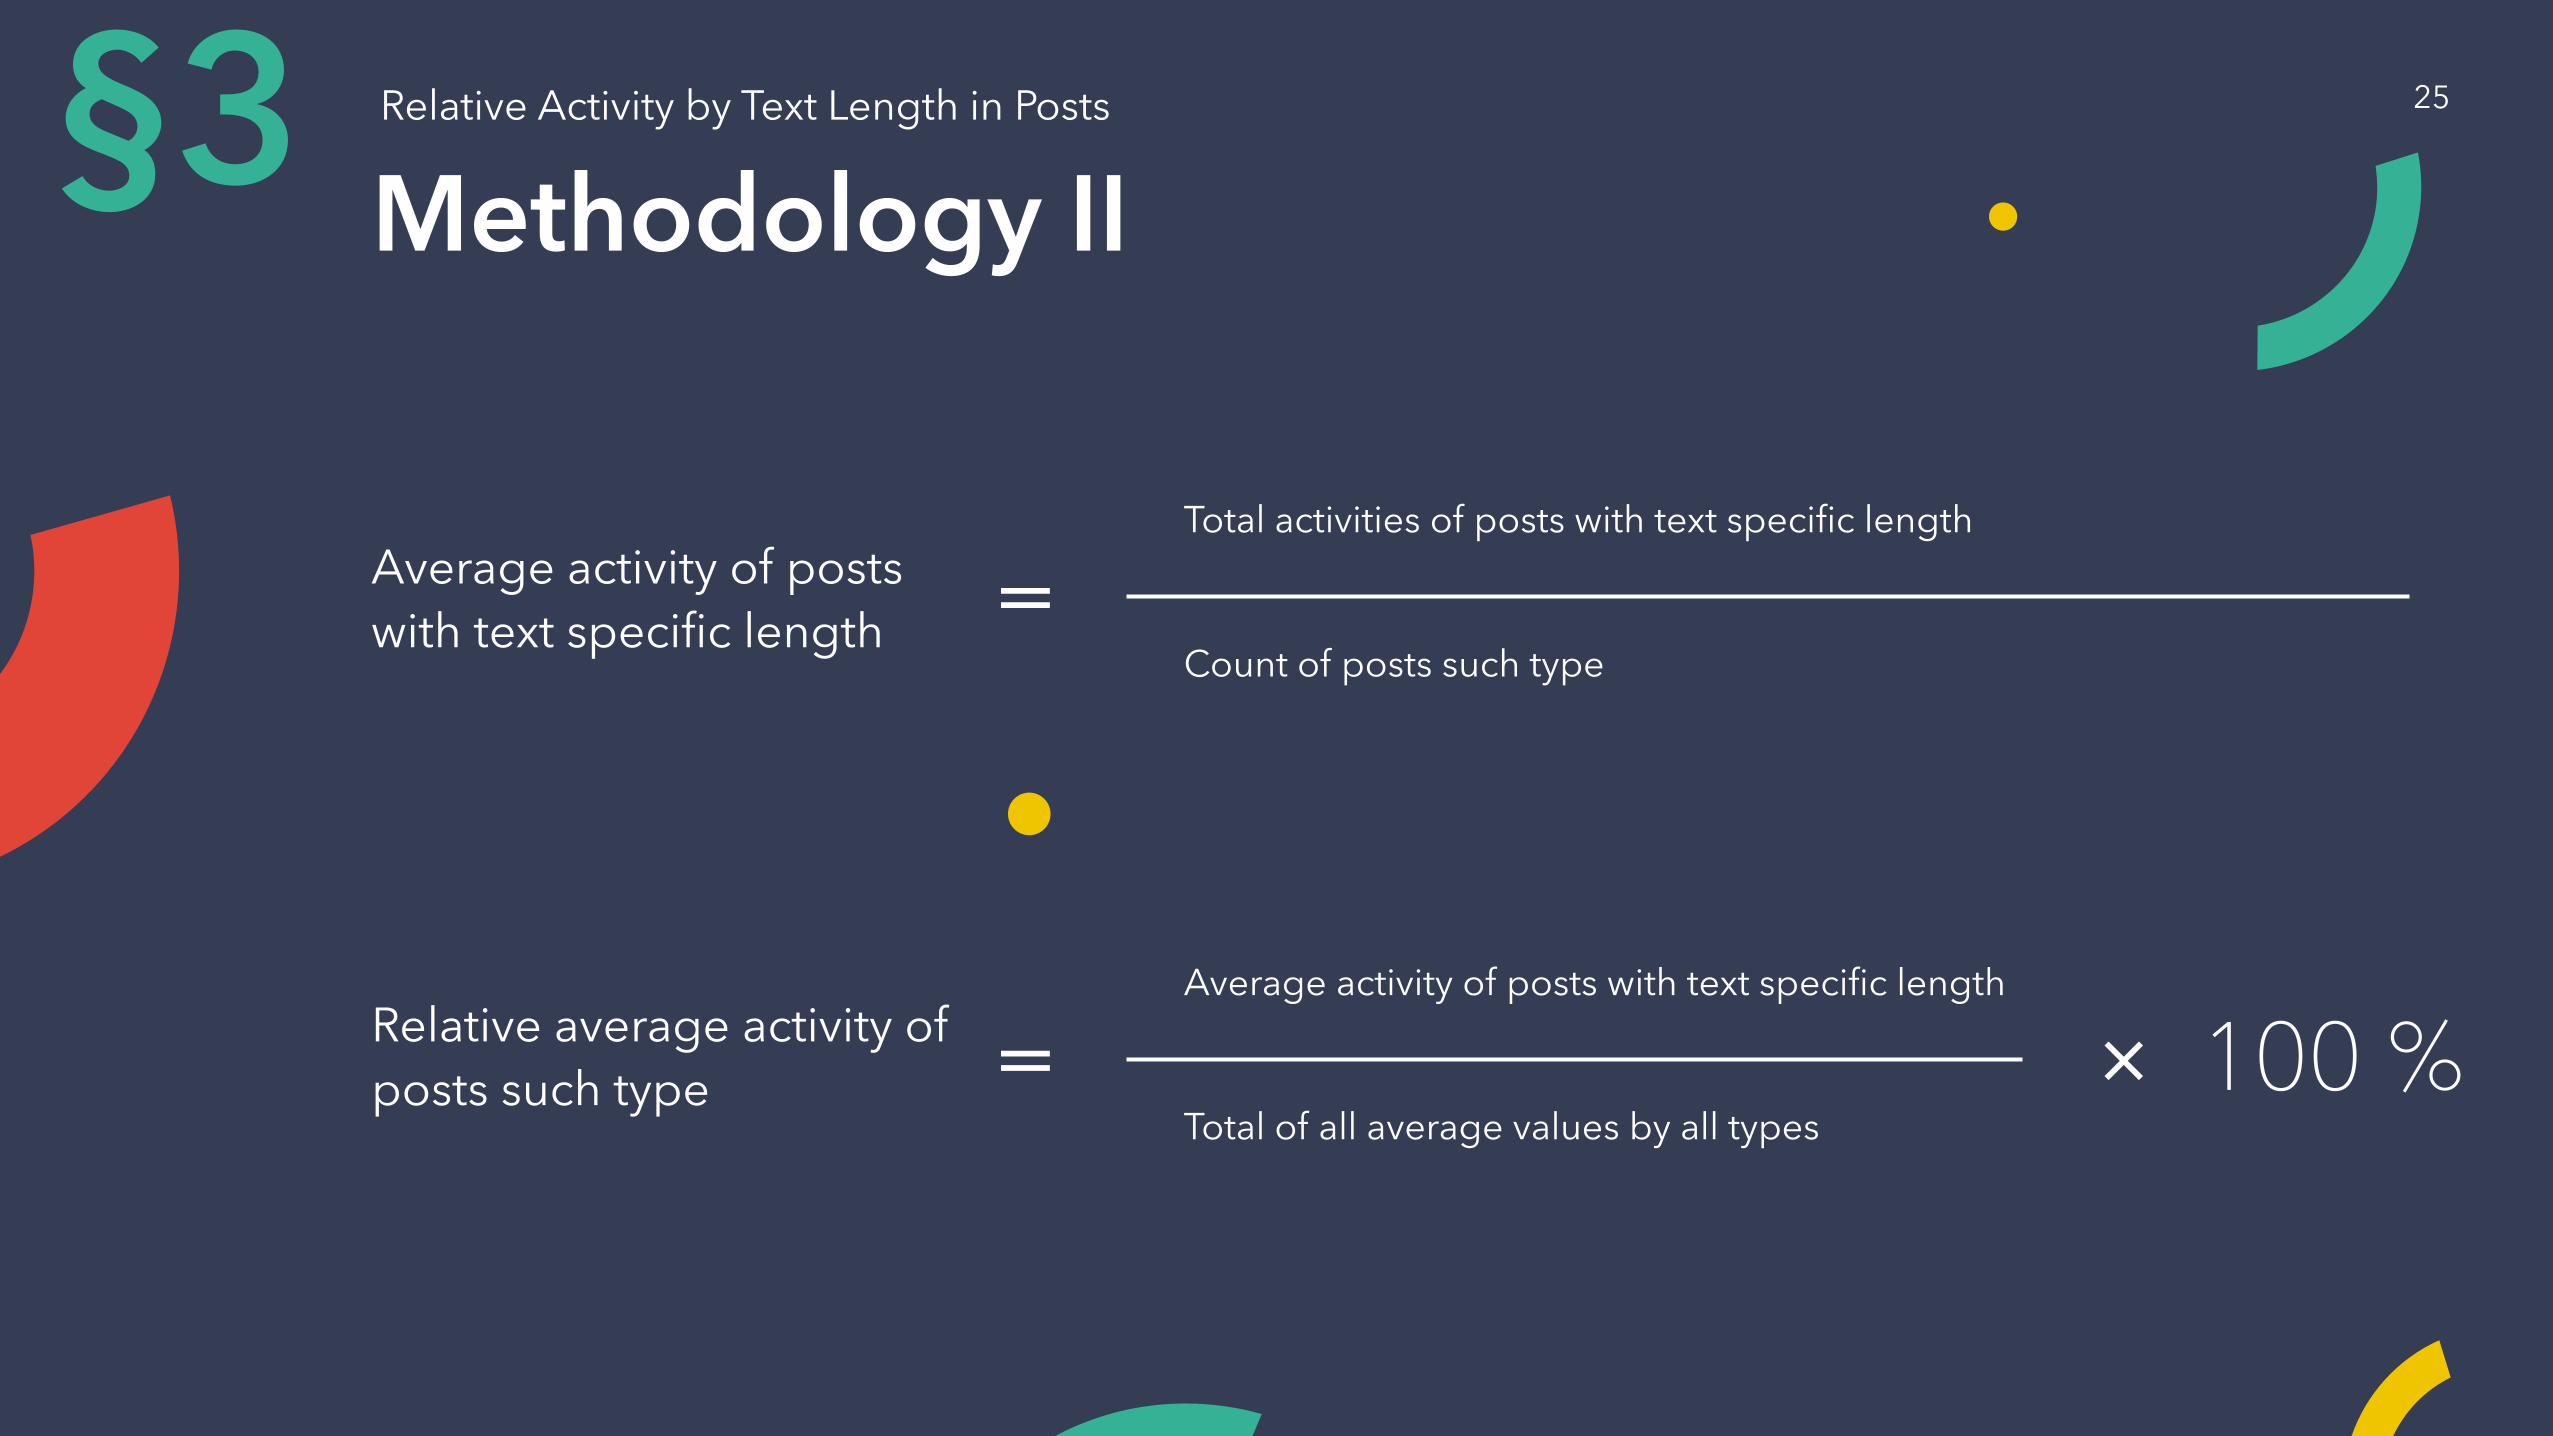
Methodology II
Average activity of posts with text specific length
Total activities of posts with text specific length
Count of posts such type=
Relative average activity of posts such type
Average activity of posts with text specific length
Total of all average values by all types= × 100 %
Relative Activity by Text Length in Posts§3 25
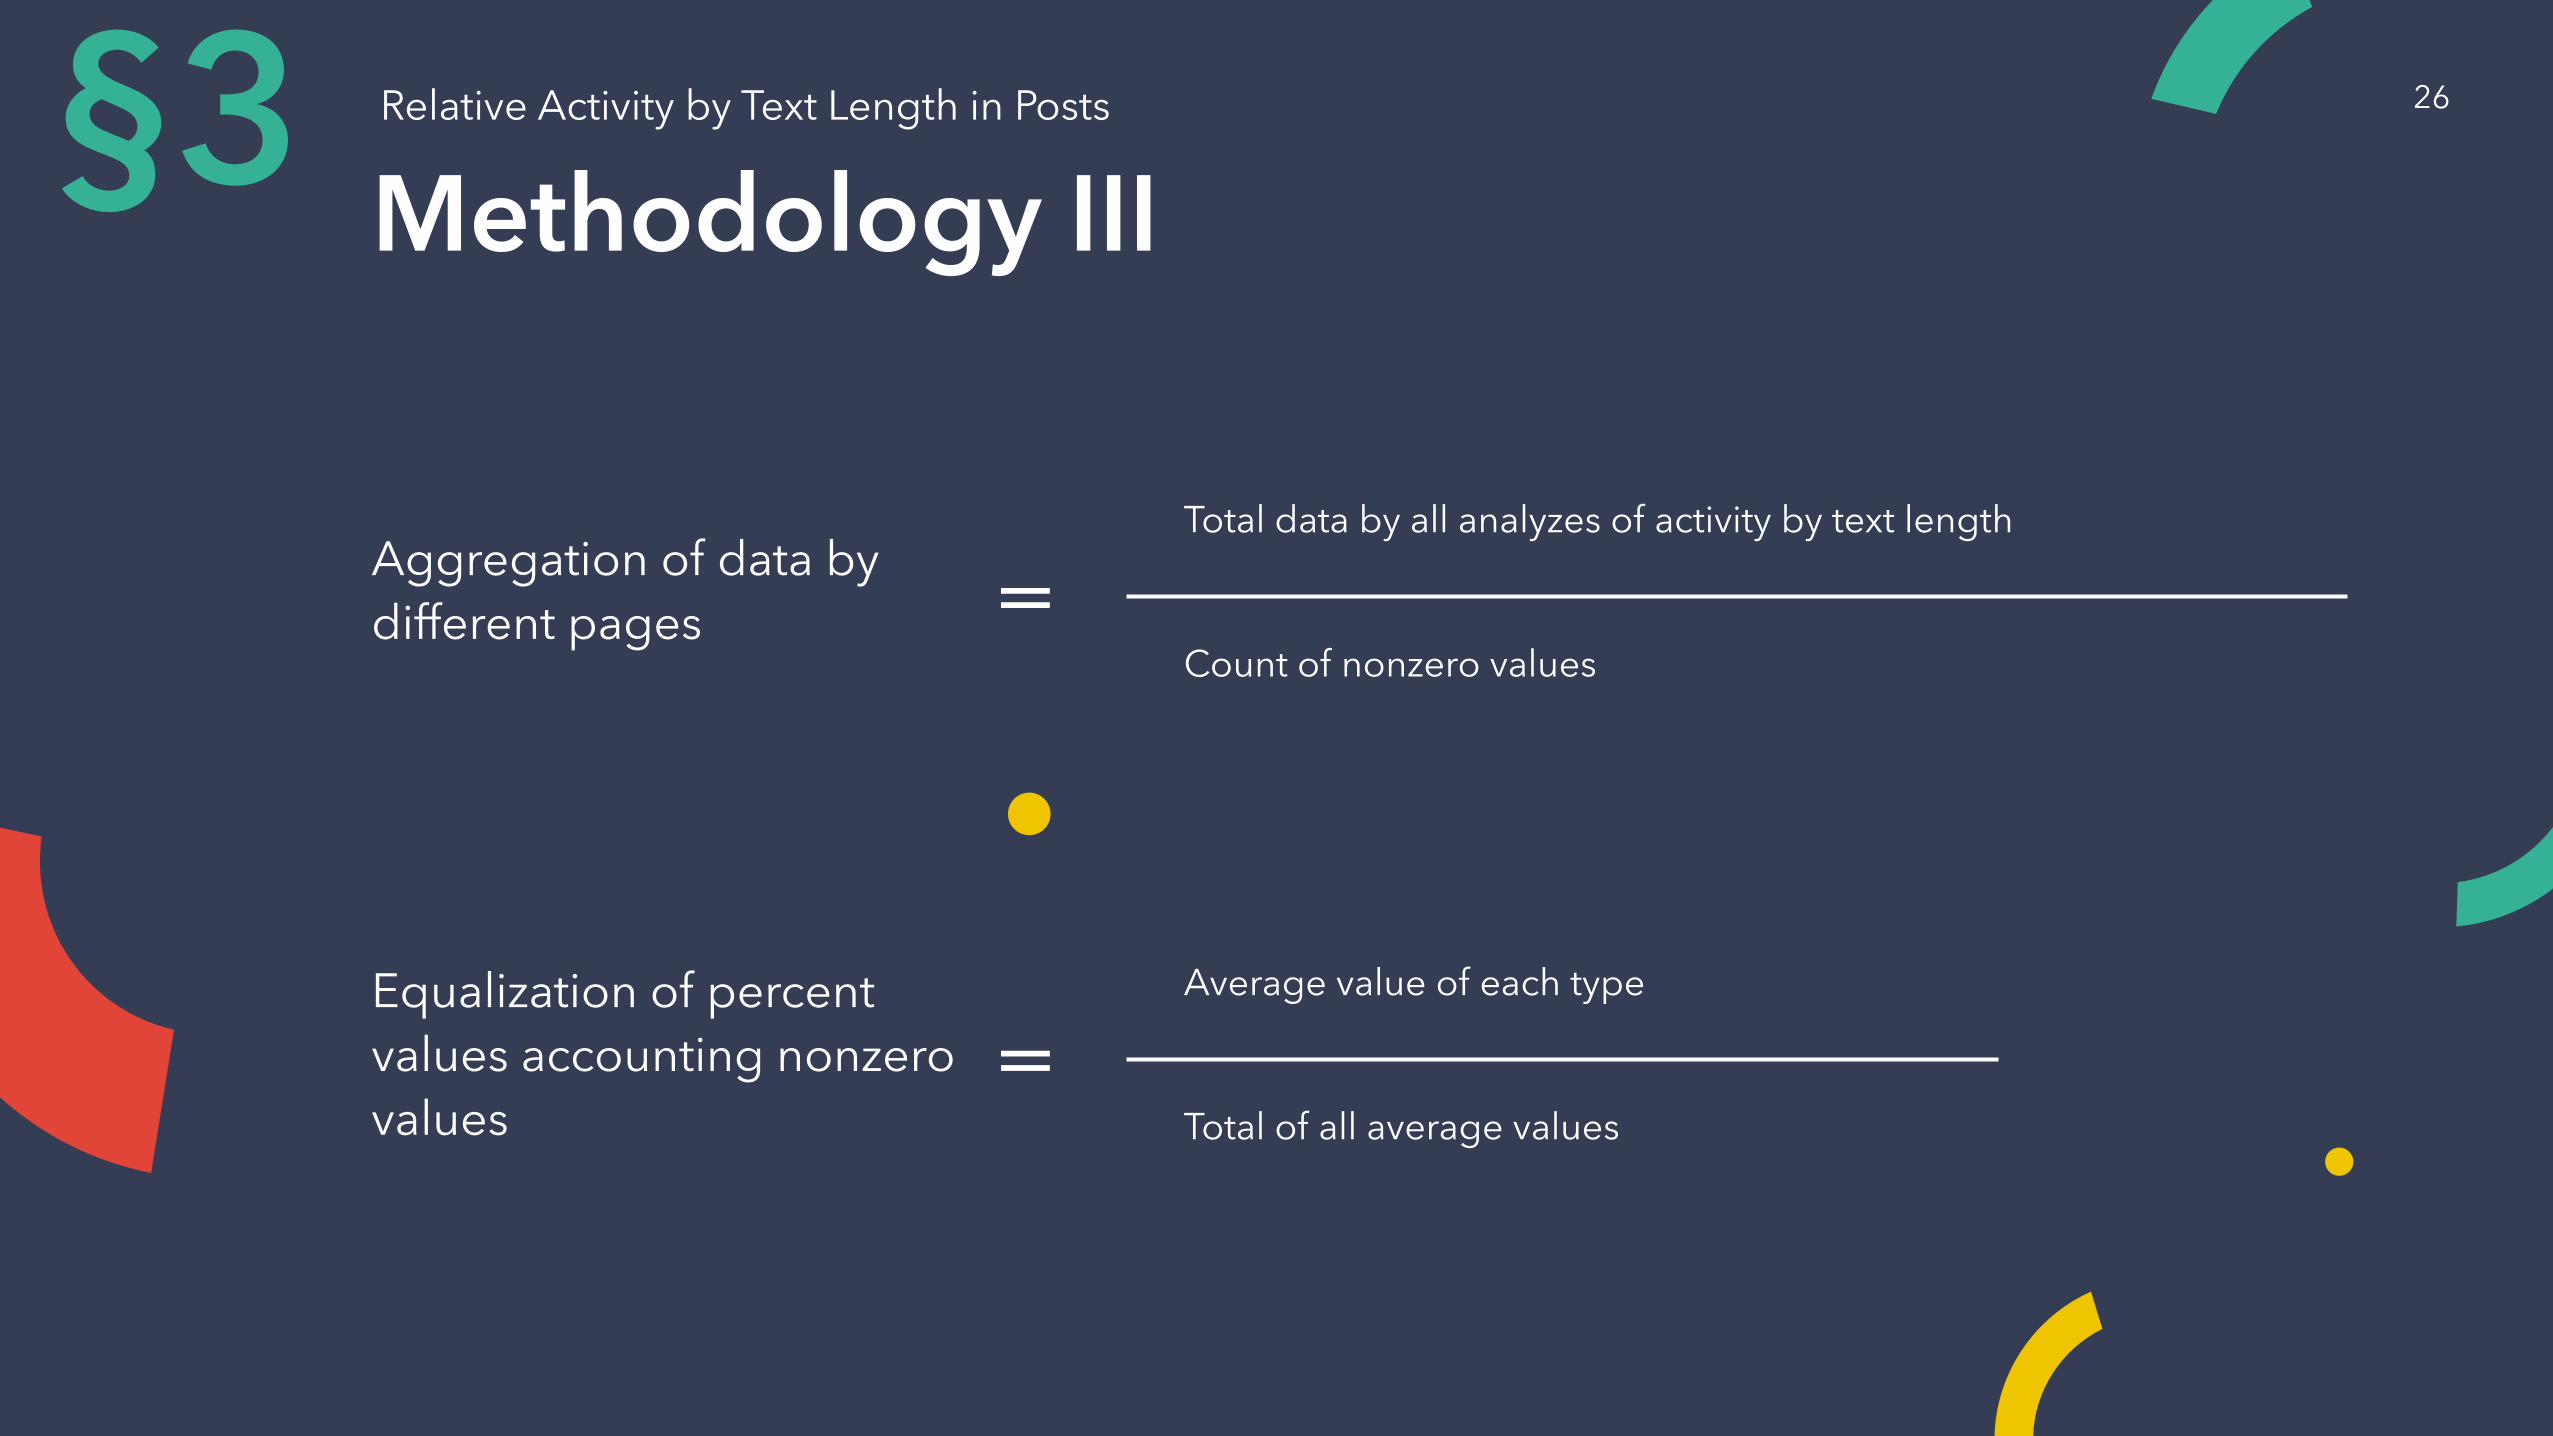
Methodology III
Aggregation of data by di�erent pages
Total data by all analyzes of activity by text length
Count of nonzero values=
Equalization of percent values accounting nonzero values
Average value of each type
Total of all average values=
Relative Activity by Text Length in Posts§3 26
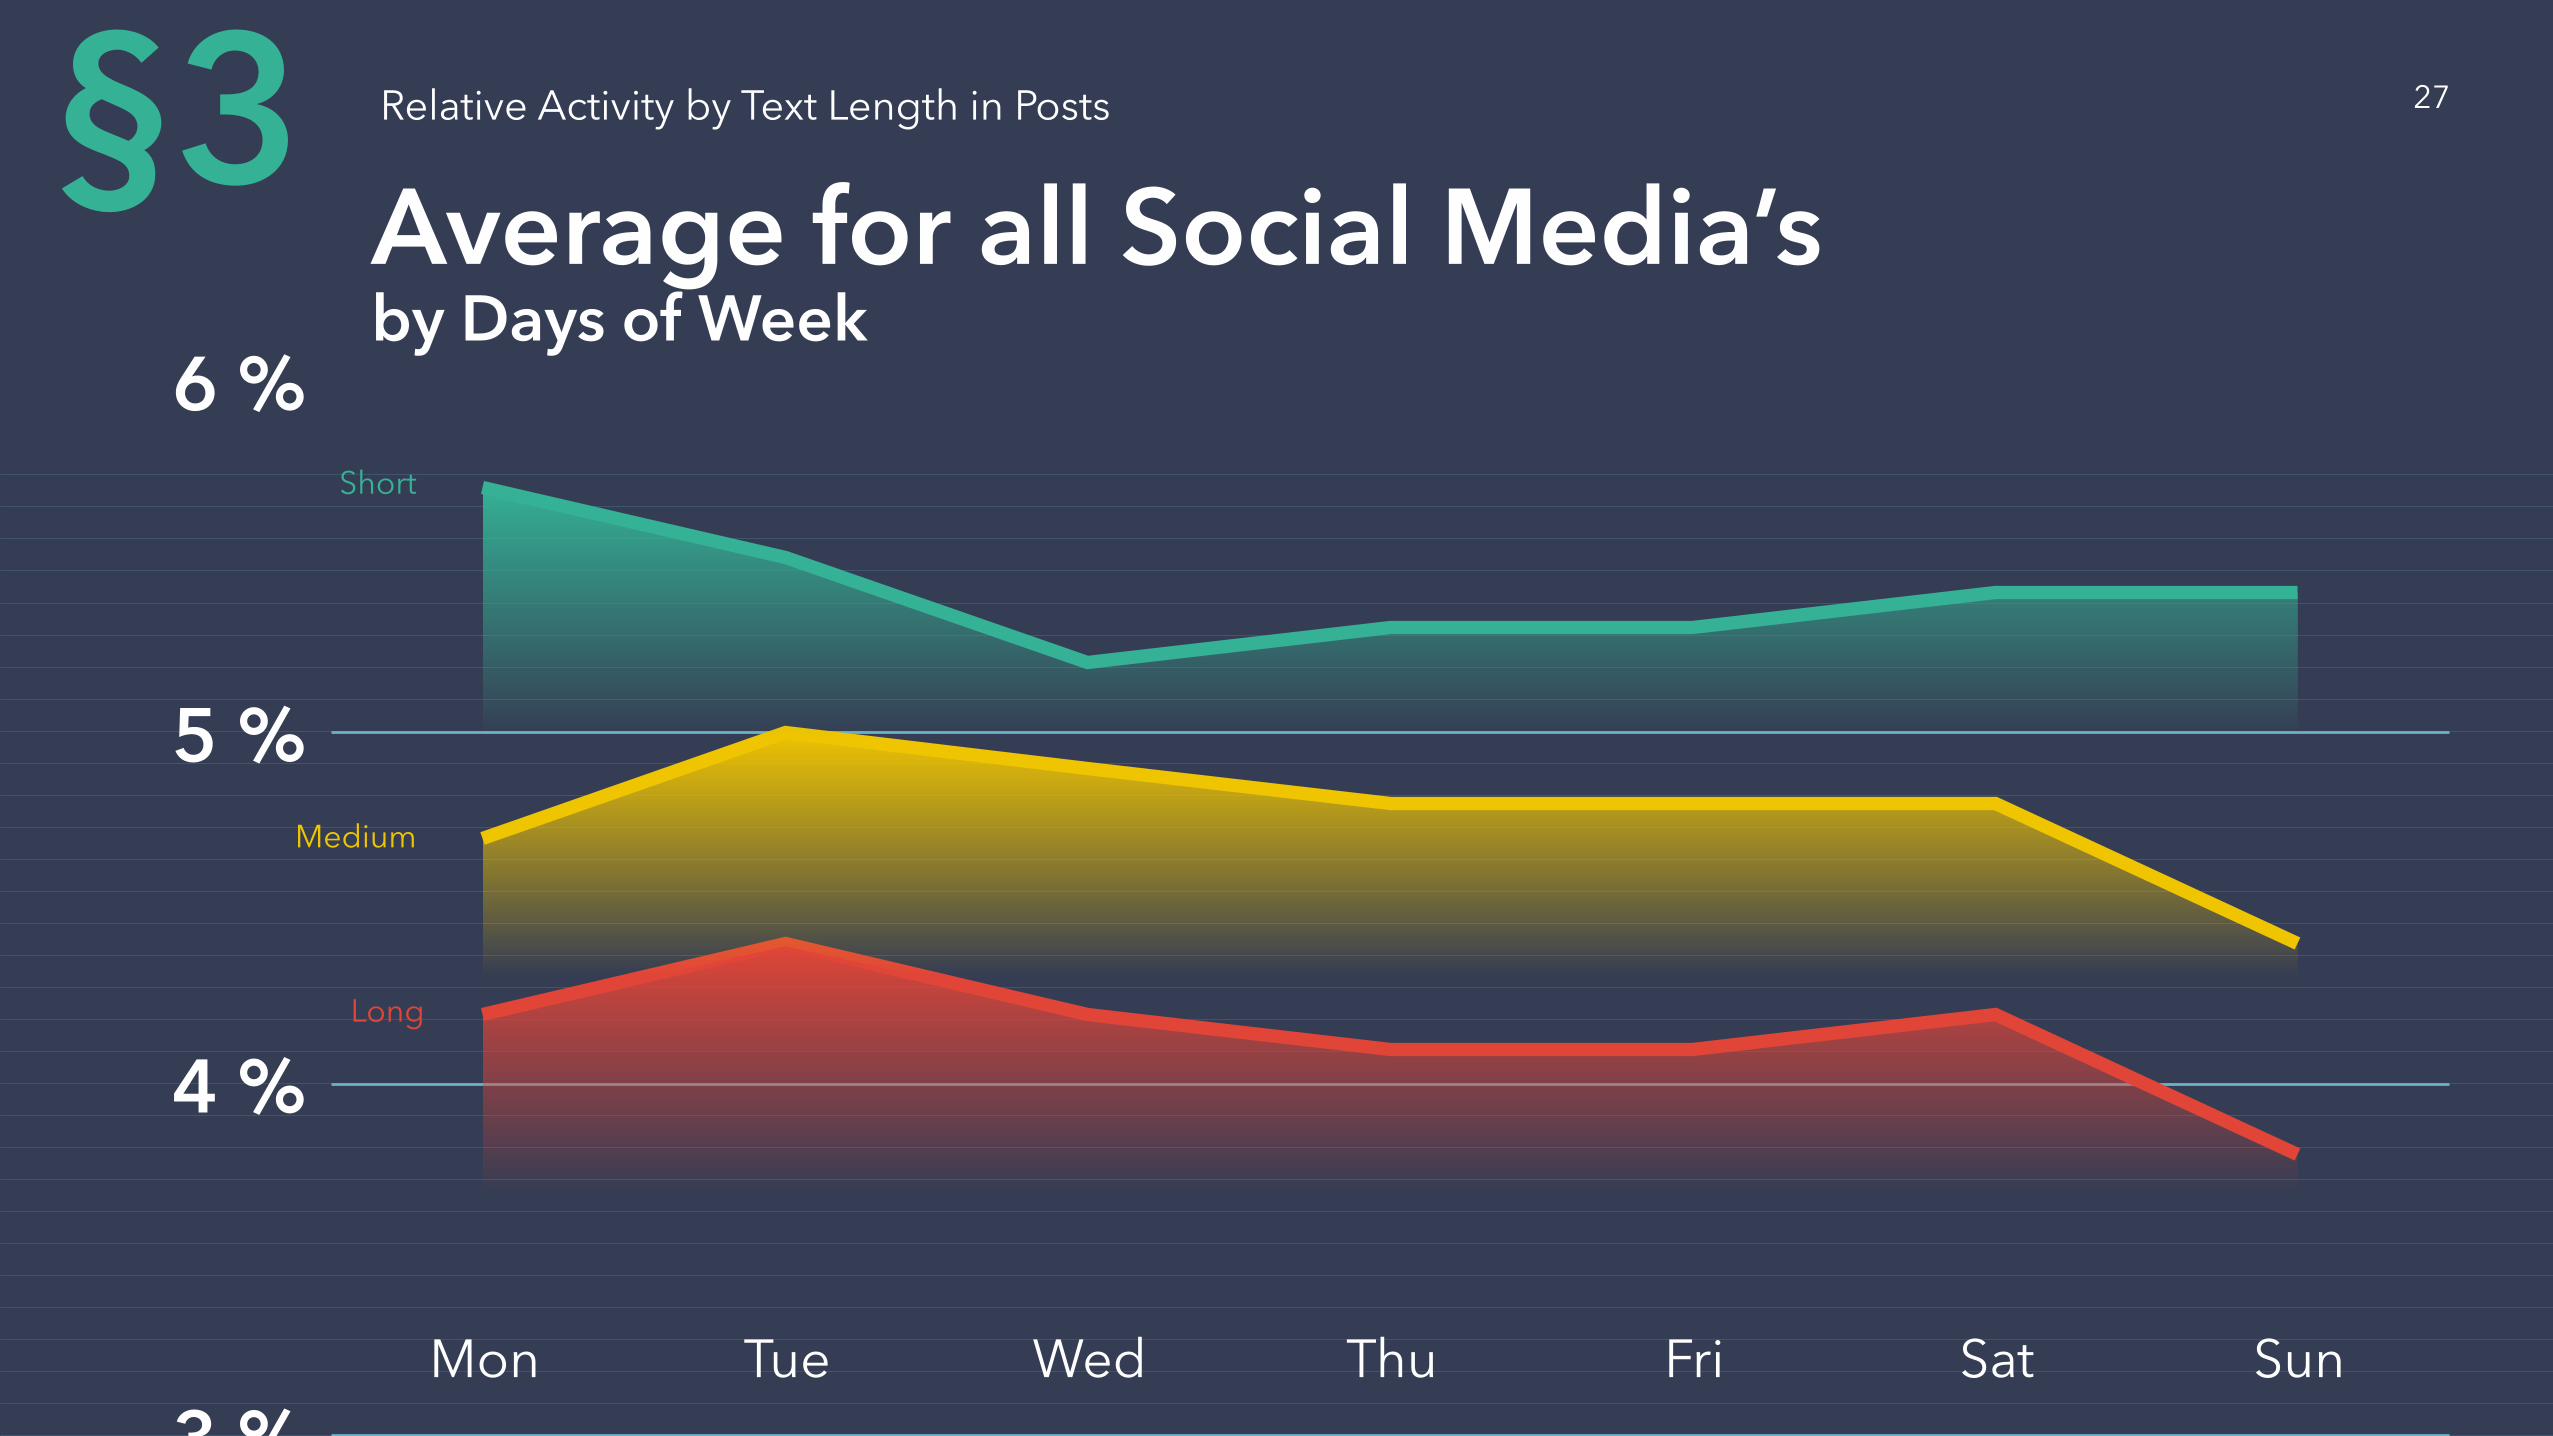
Relative Activity by Text Length in Posts
Average for all Social Media’s by Days of Week
3 %
4 %
5 %
6 %
Mon Tue Wed Thu Fri Sat Sun
§3Short
Medium
Long
27
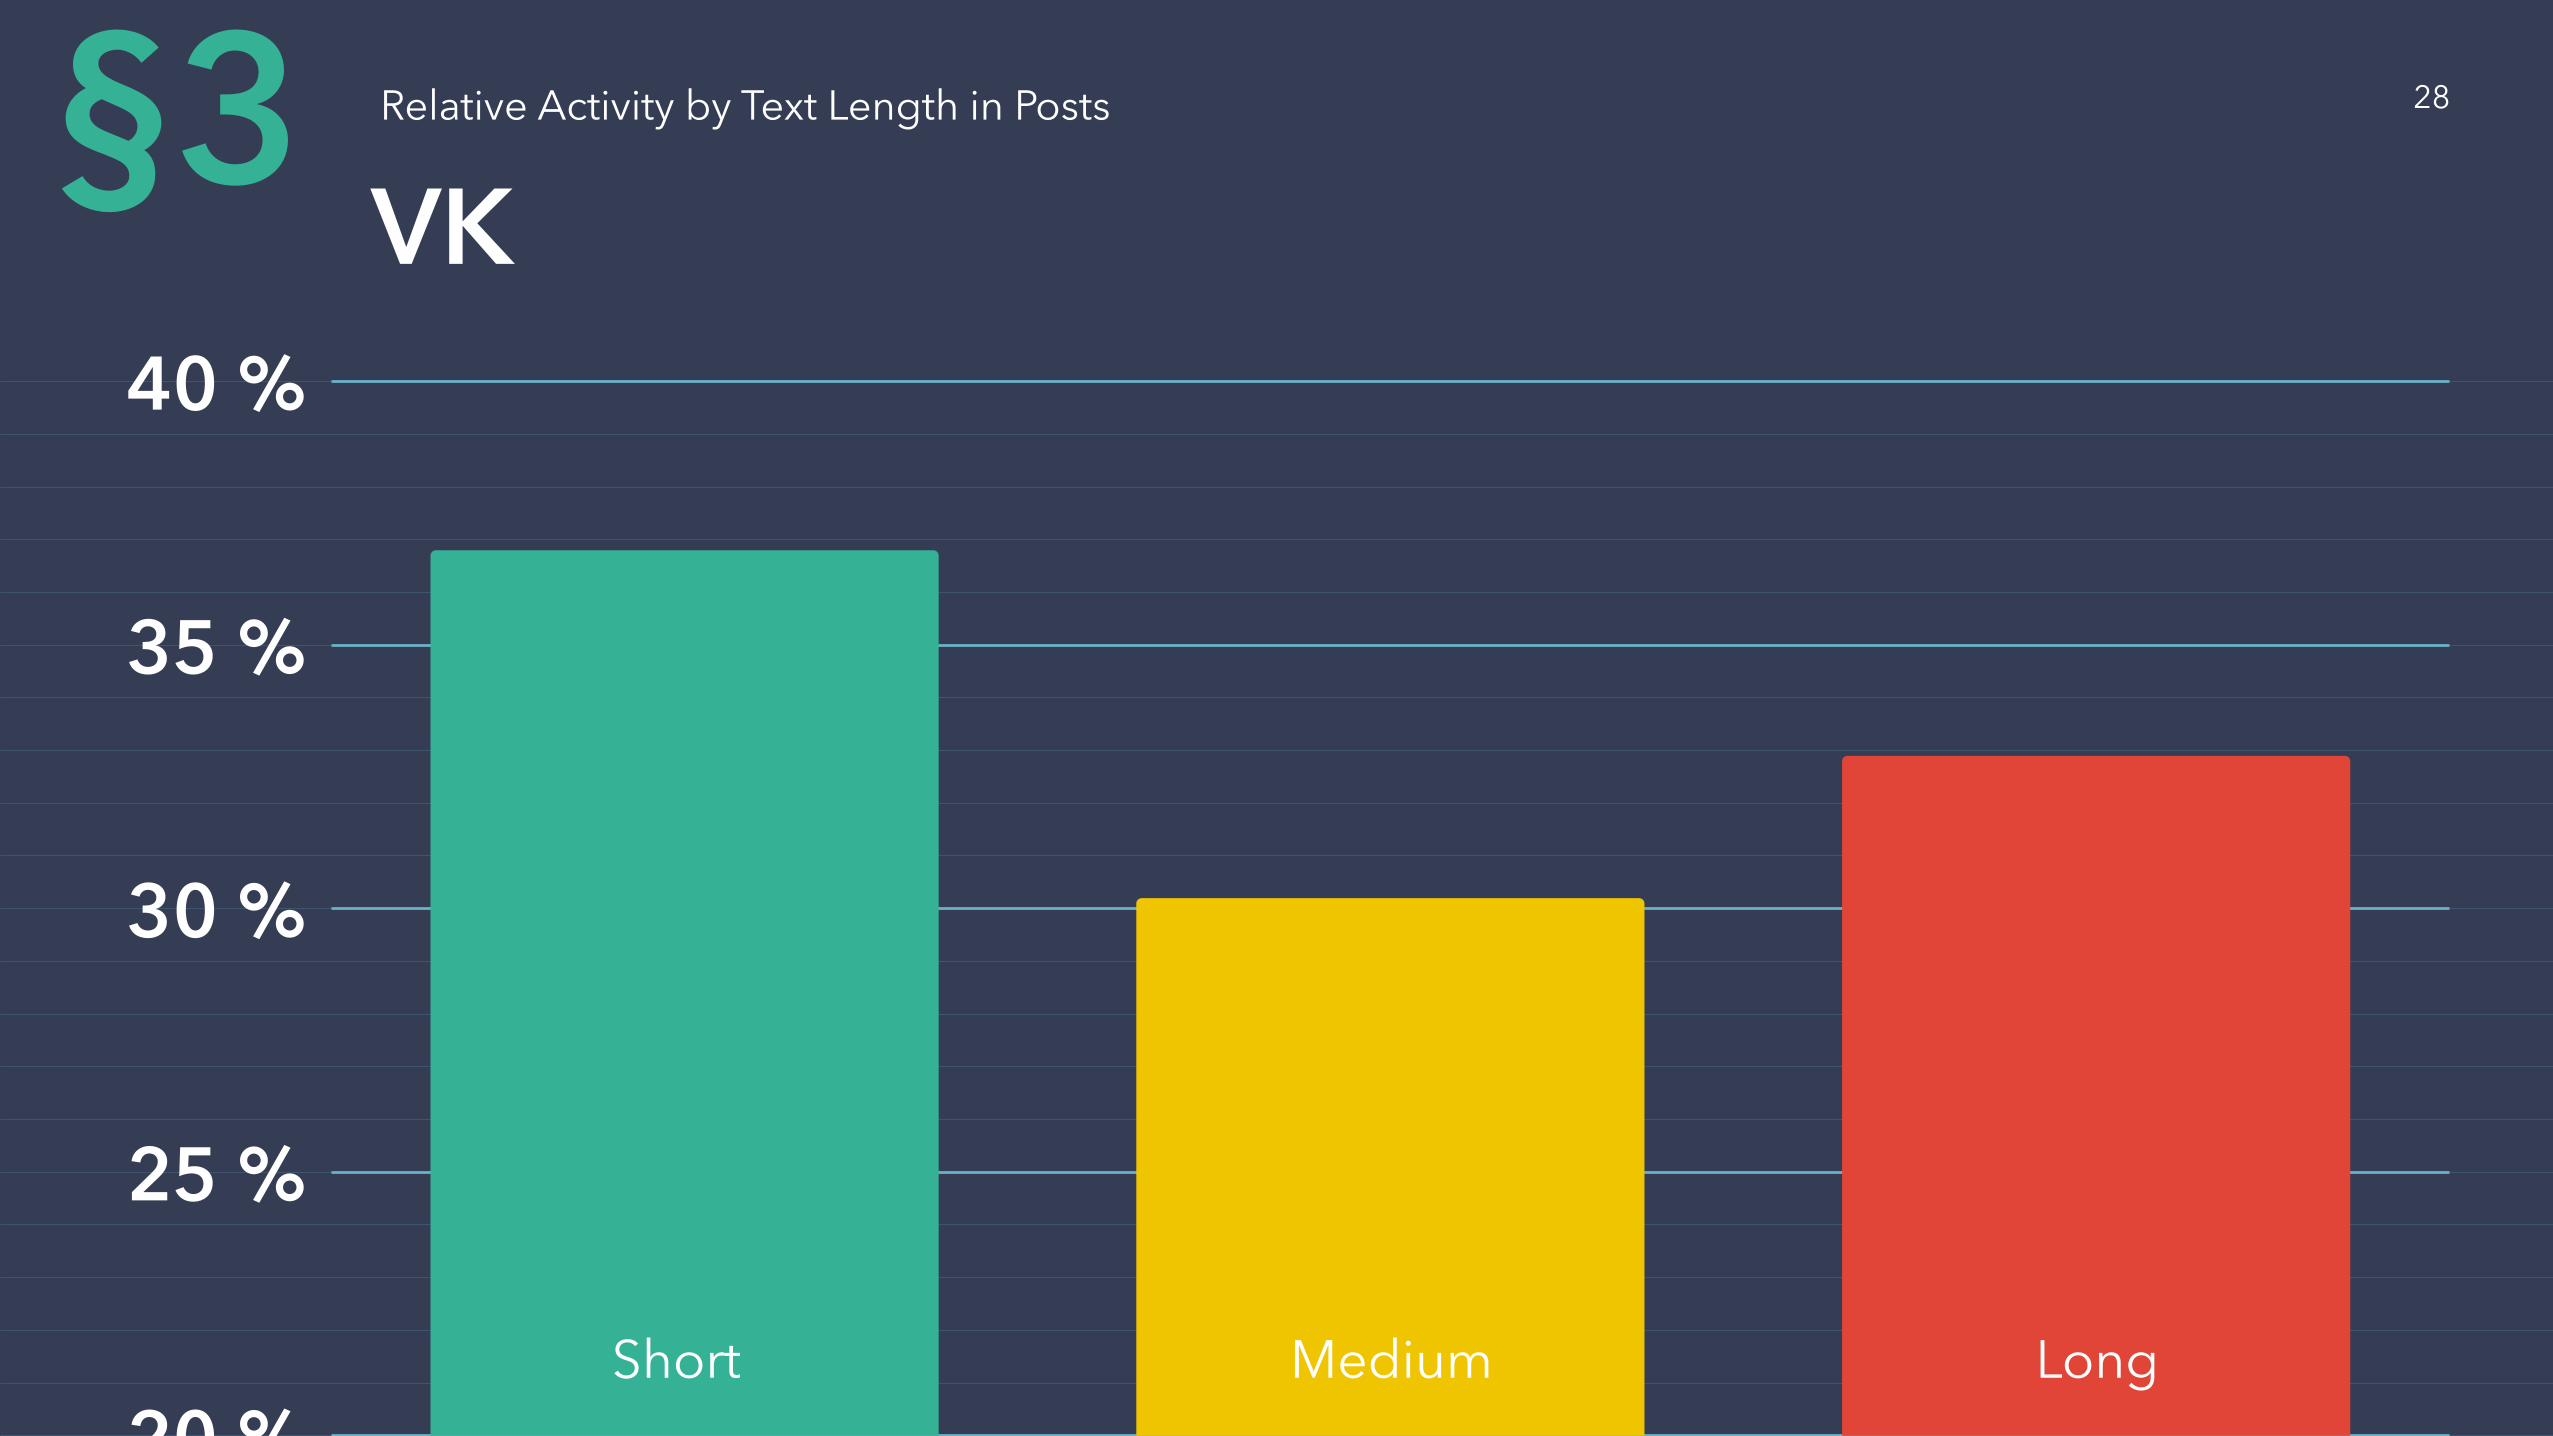
Relative Activity by Text Length in Posts
20 %
25 %
30 %
35 %
40 %
VK
Short Medium Long
§3 28
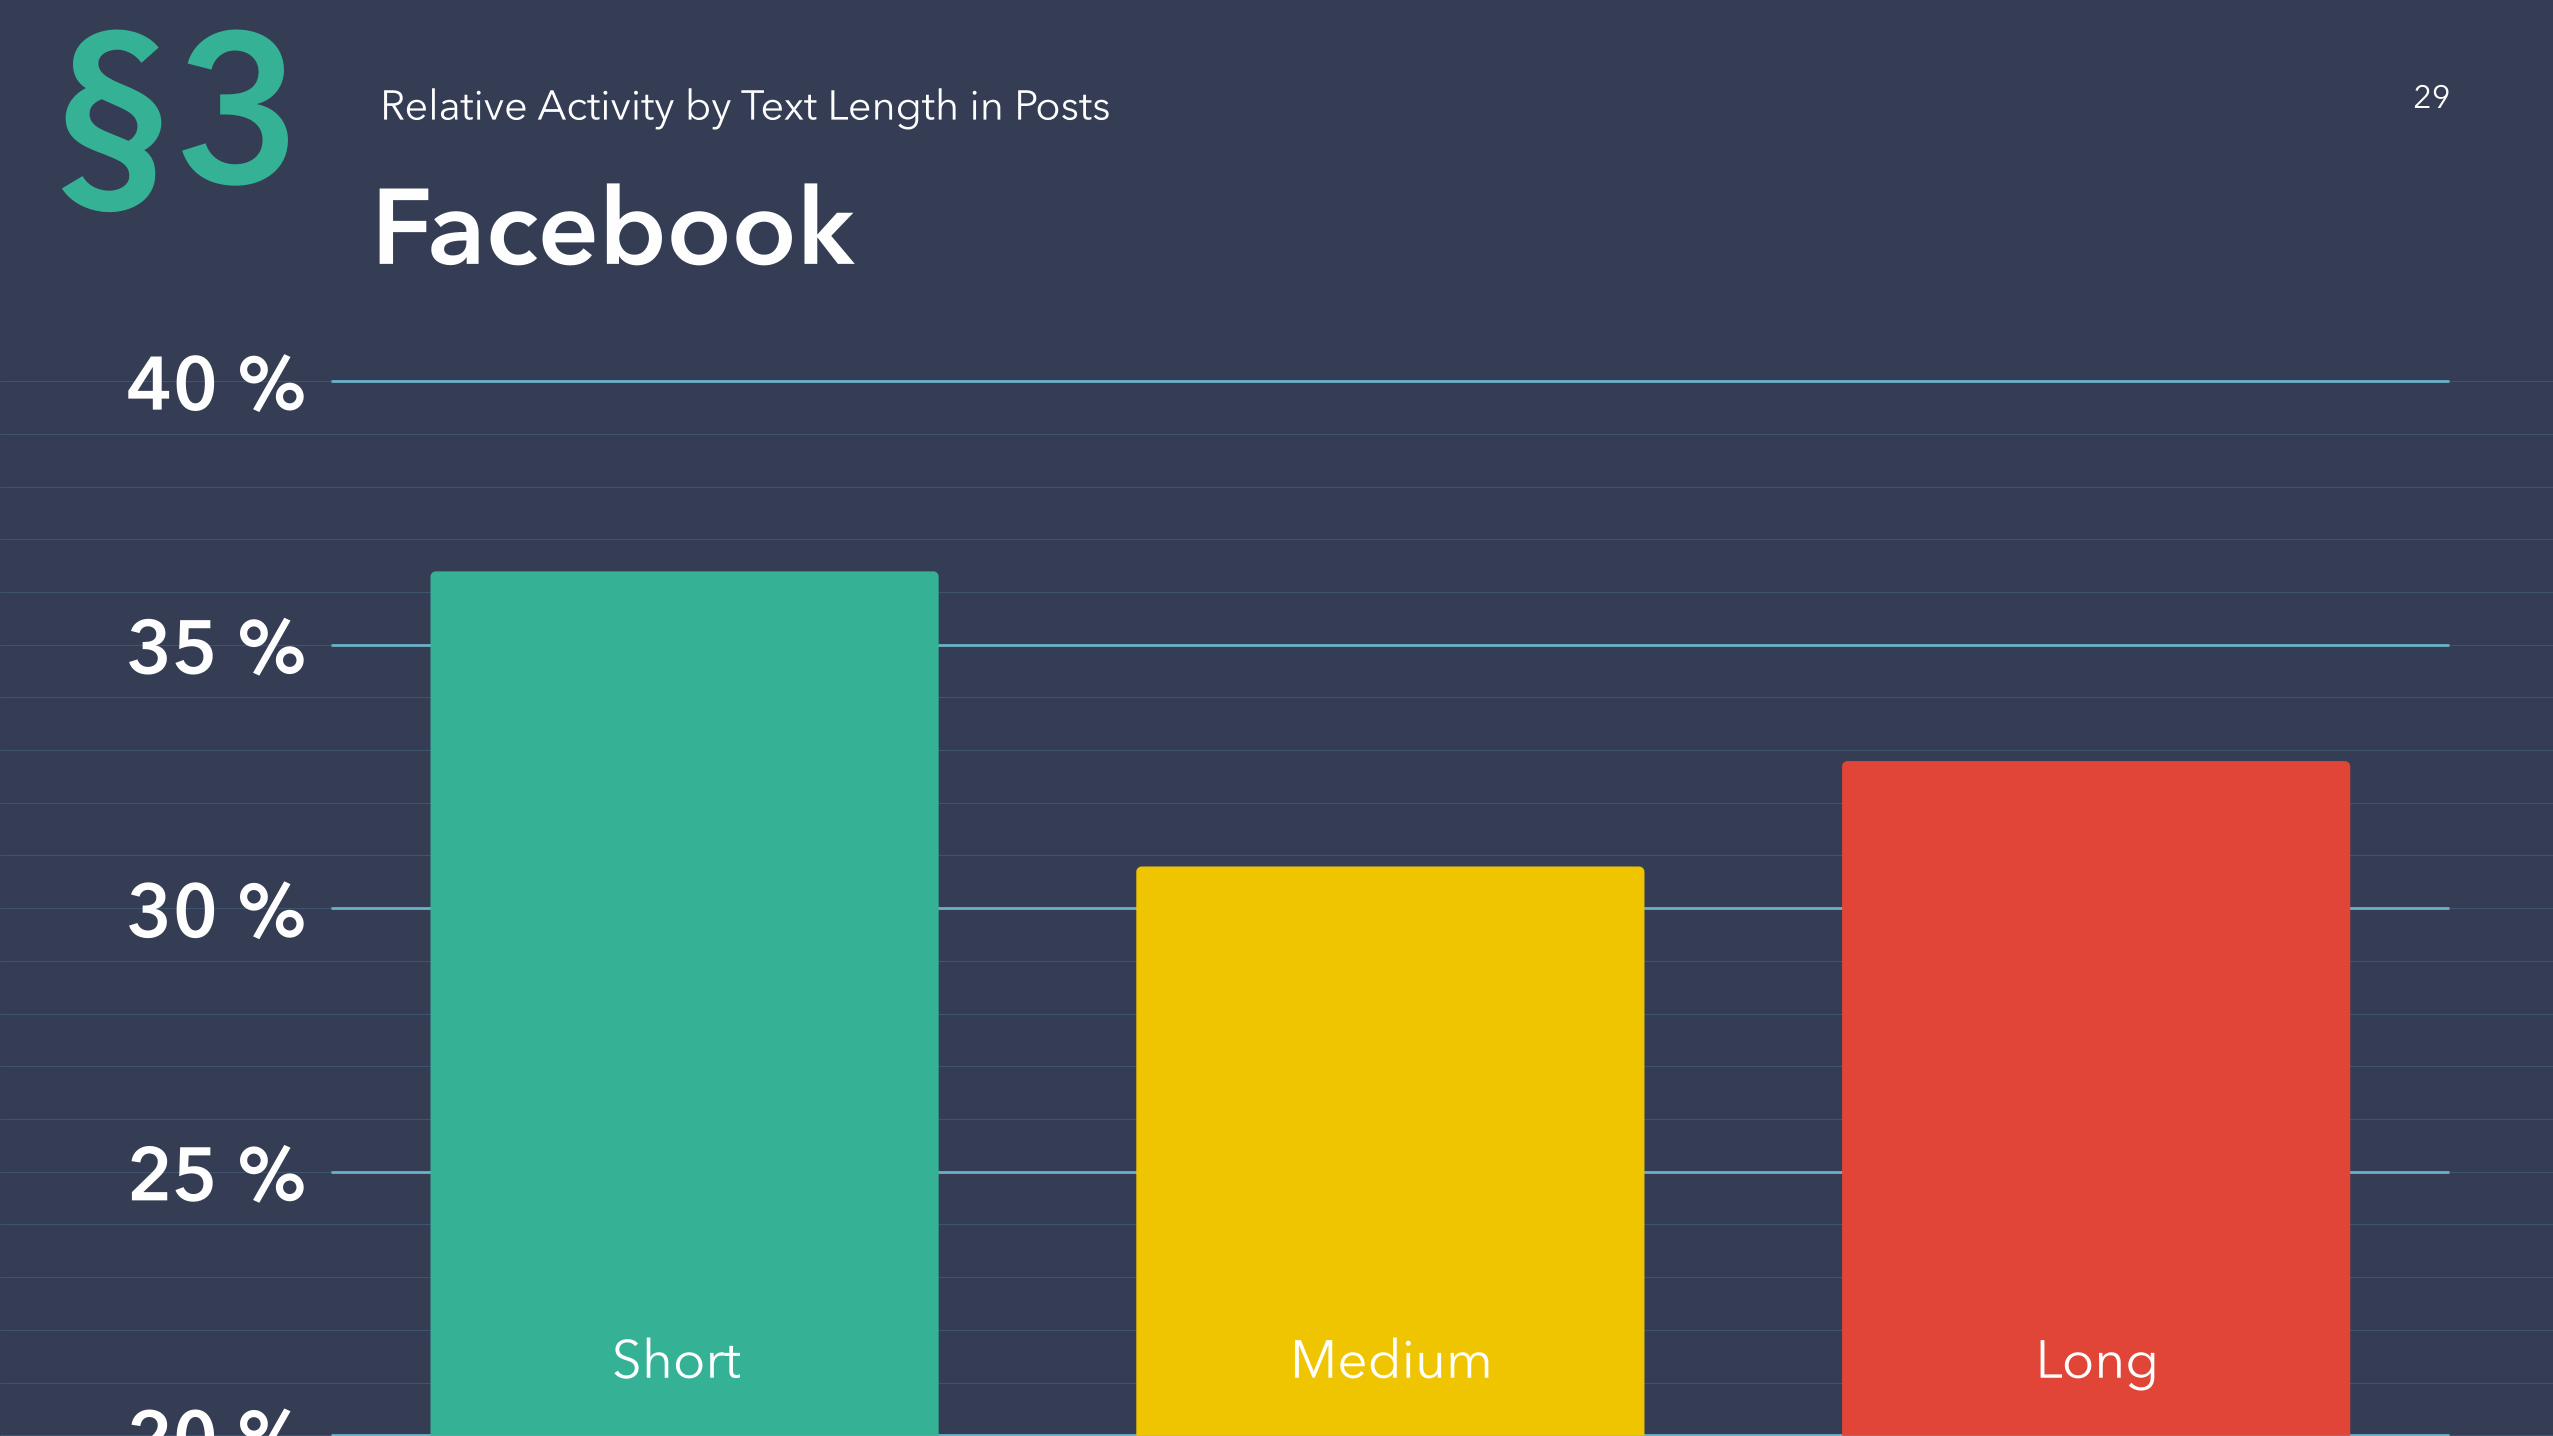
20 %
25 %
30 %
35 %
40 %
Relative Activity by Text Length in Posts
Facebook§3
Short Medium Long
29
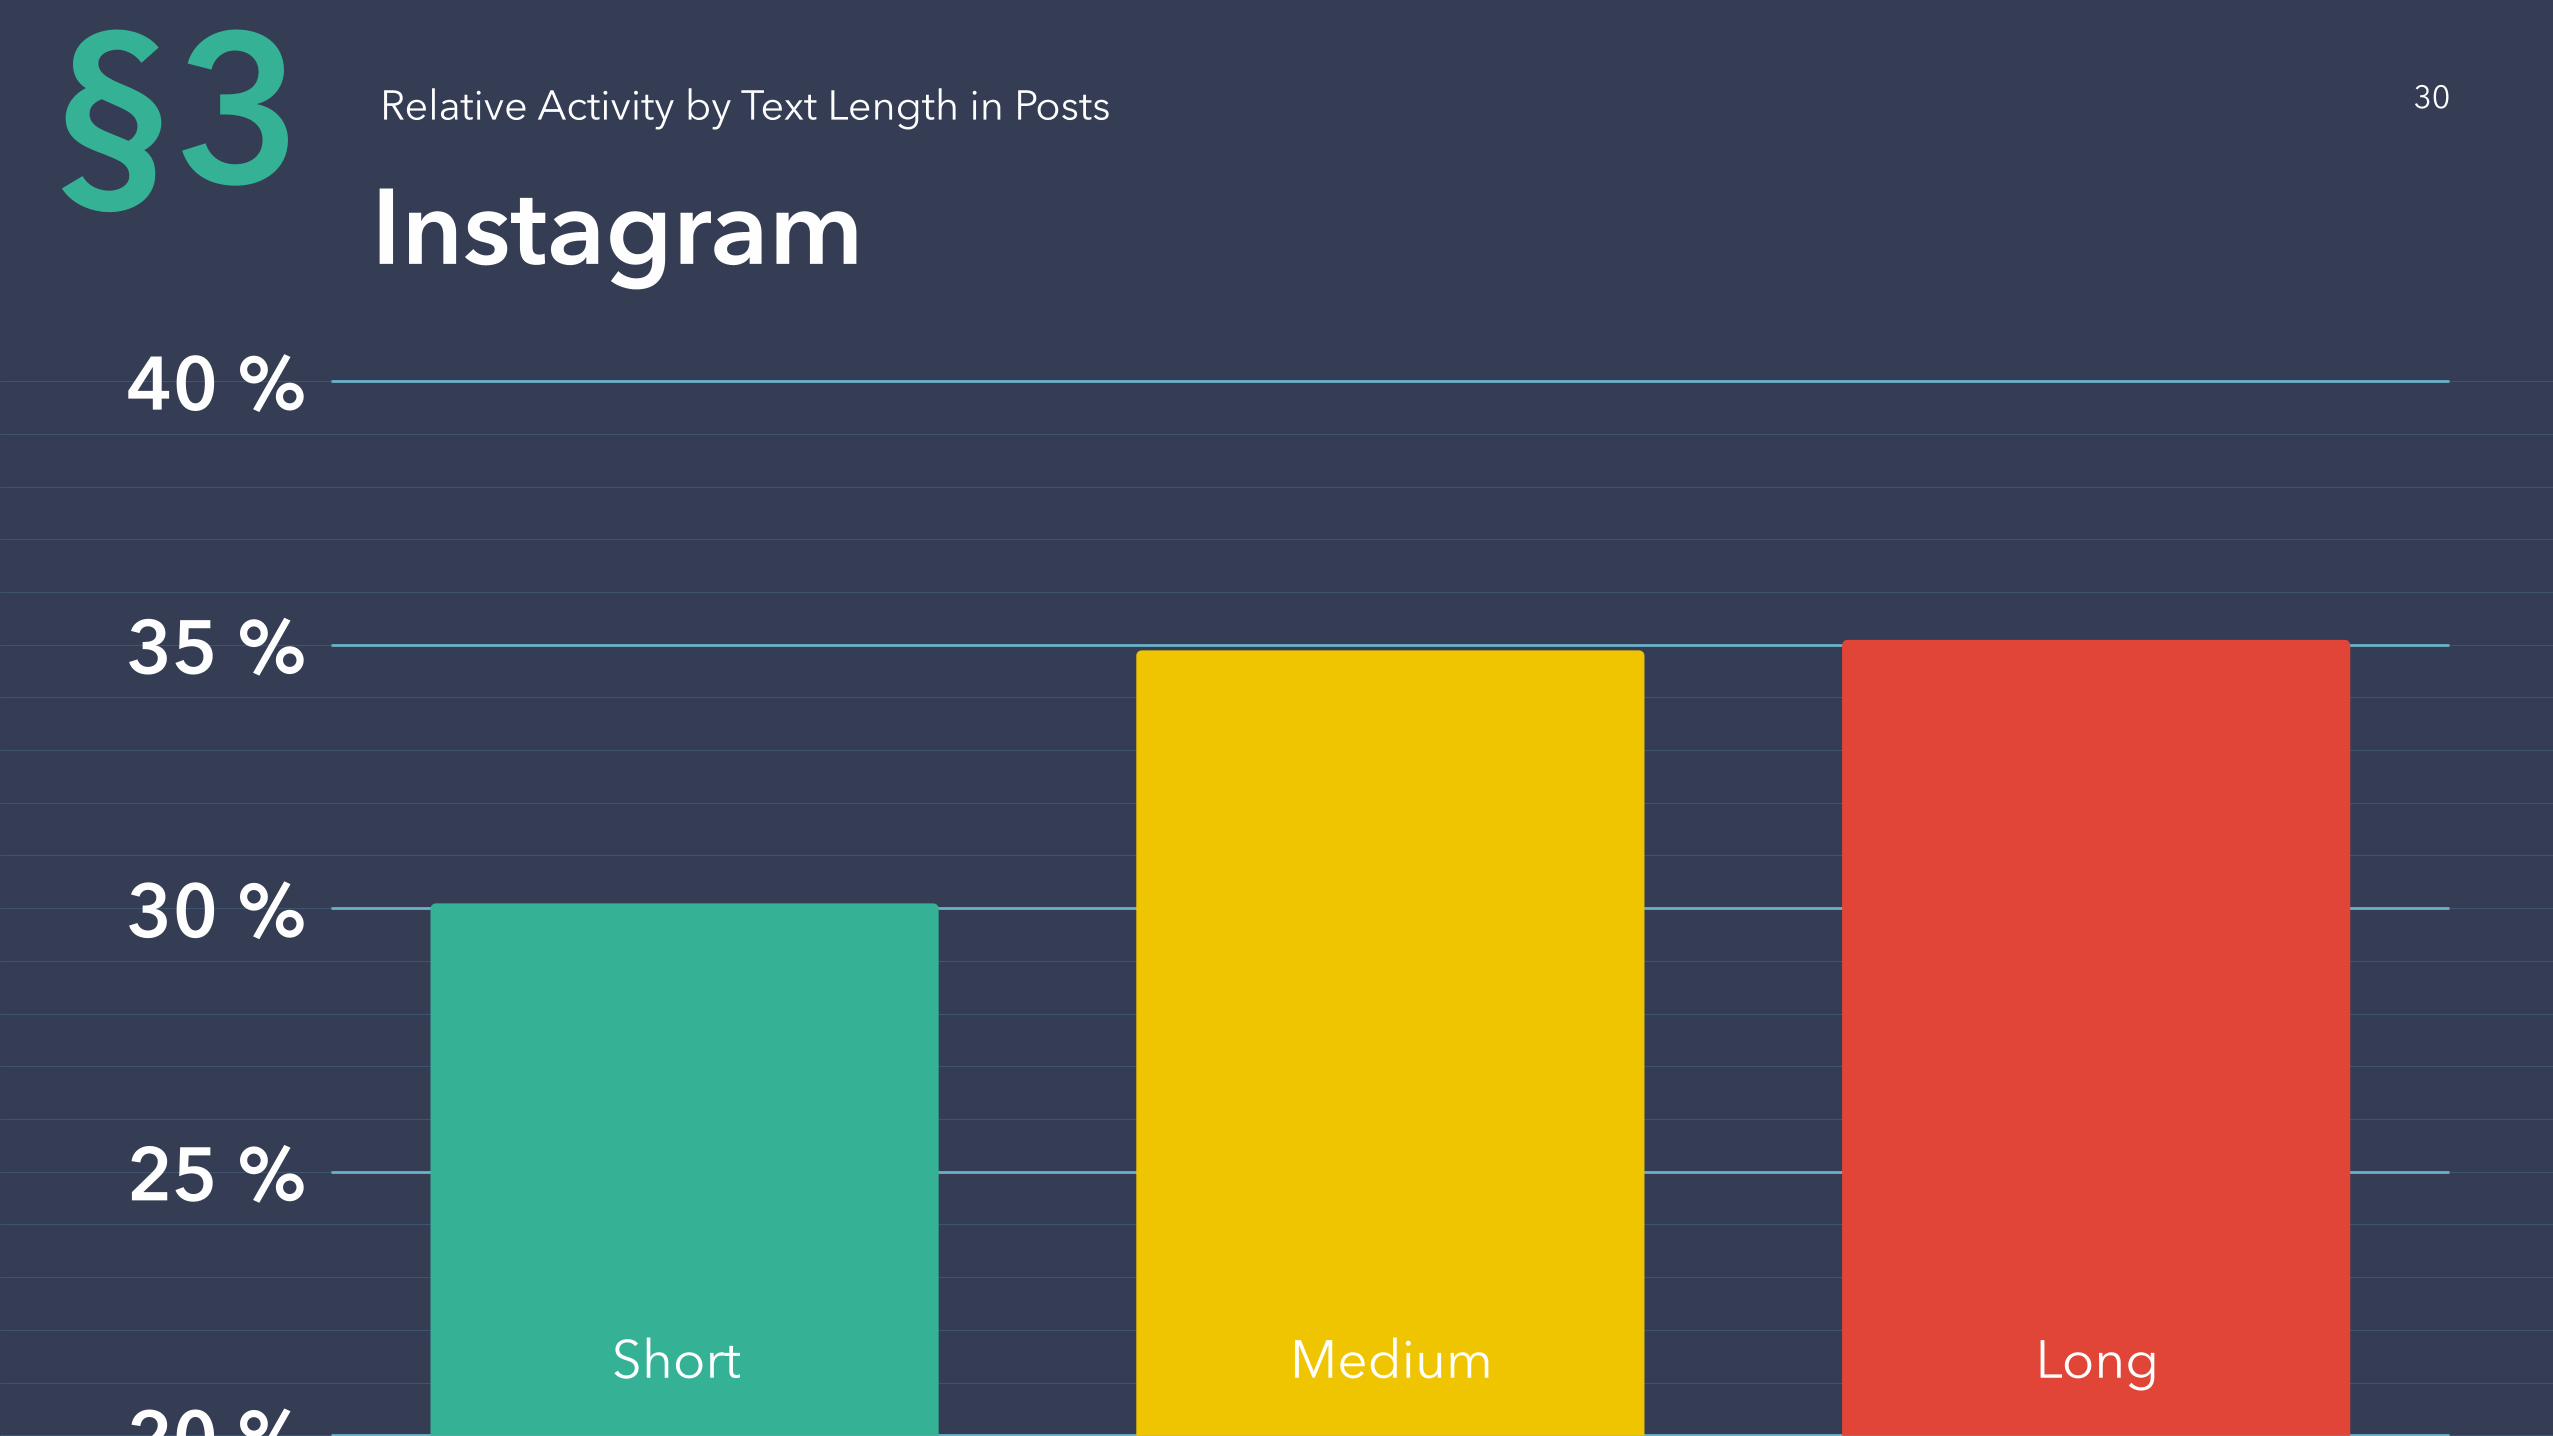
20 %
25 %
30 %
35 %
40 %
Relative Activity by Text Length in Posts
Instagram§3
Short Medium Long
30
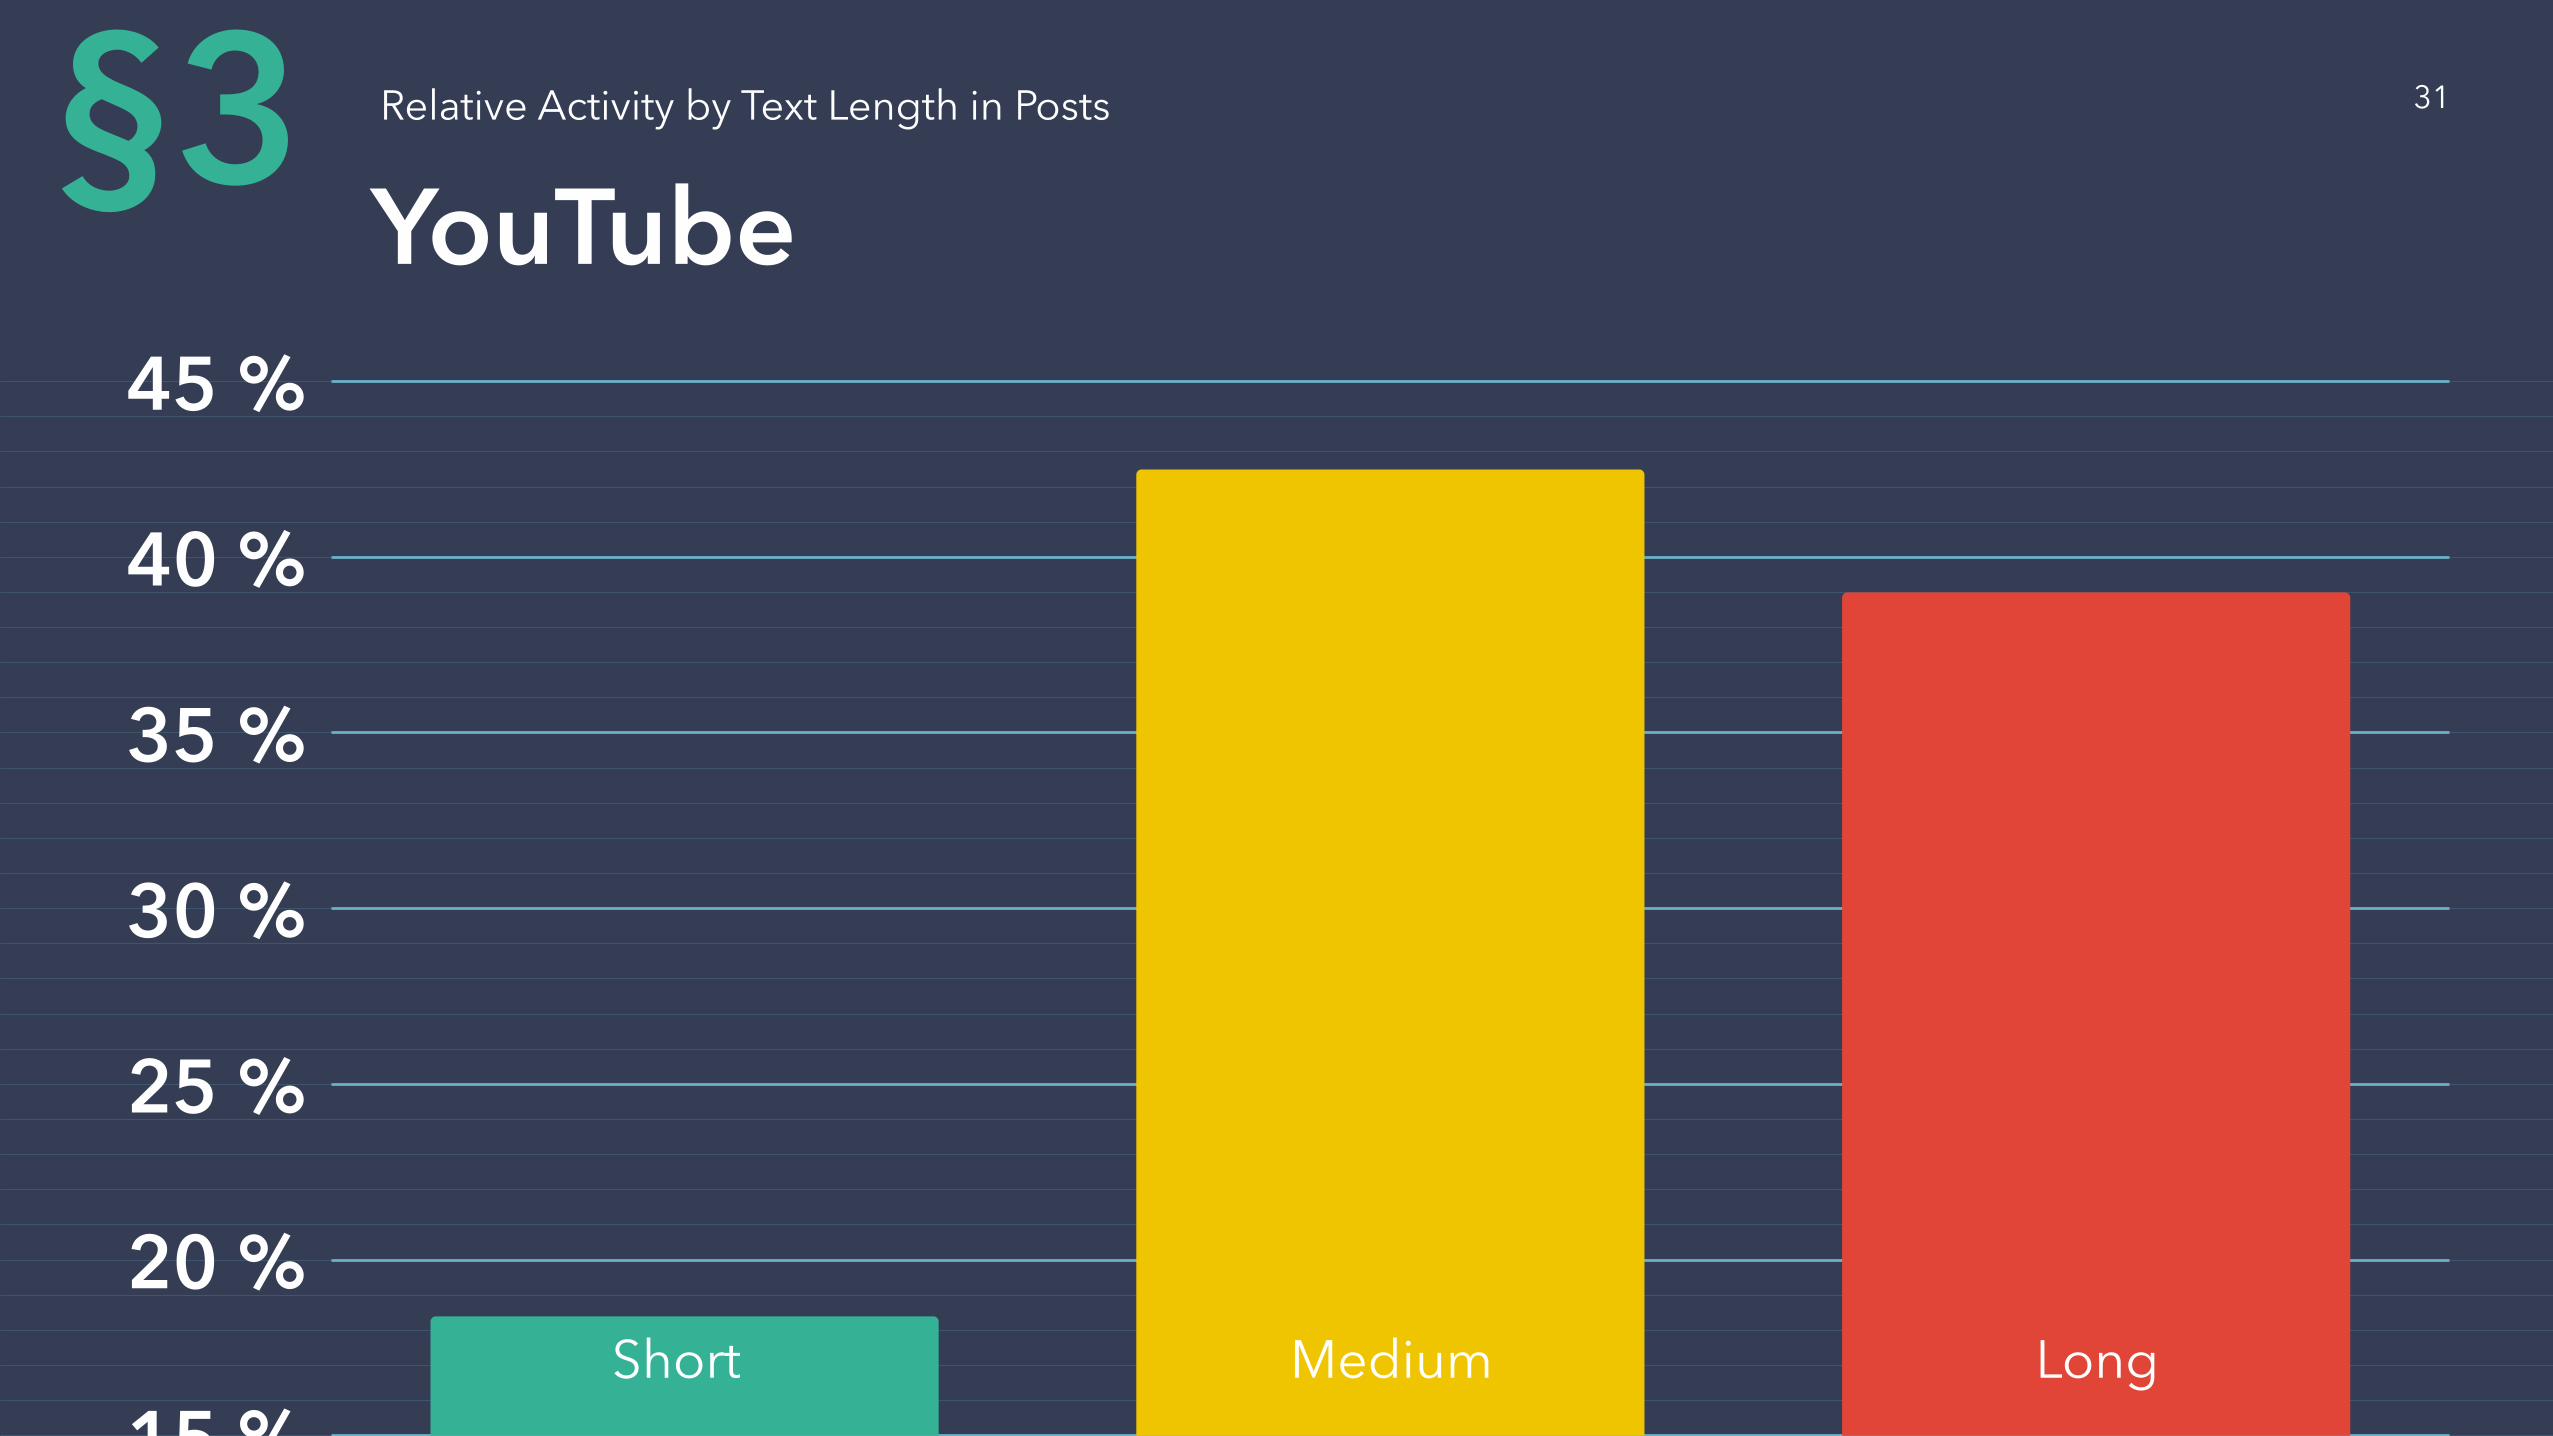
15 %
20 %
25 %
30 %
35 %
40 %
45 %
Relative Activity by Text Length in Posts
YouTube§3
Short Medium Long
31
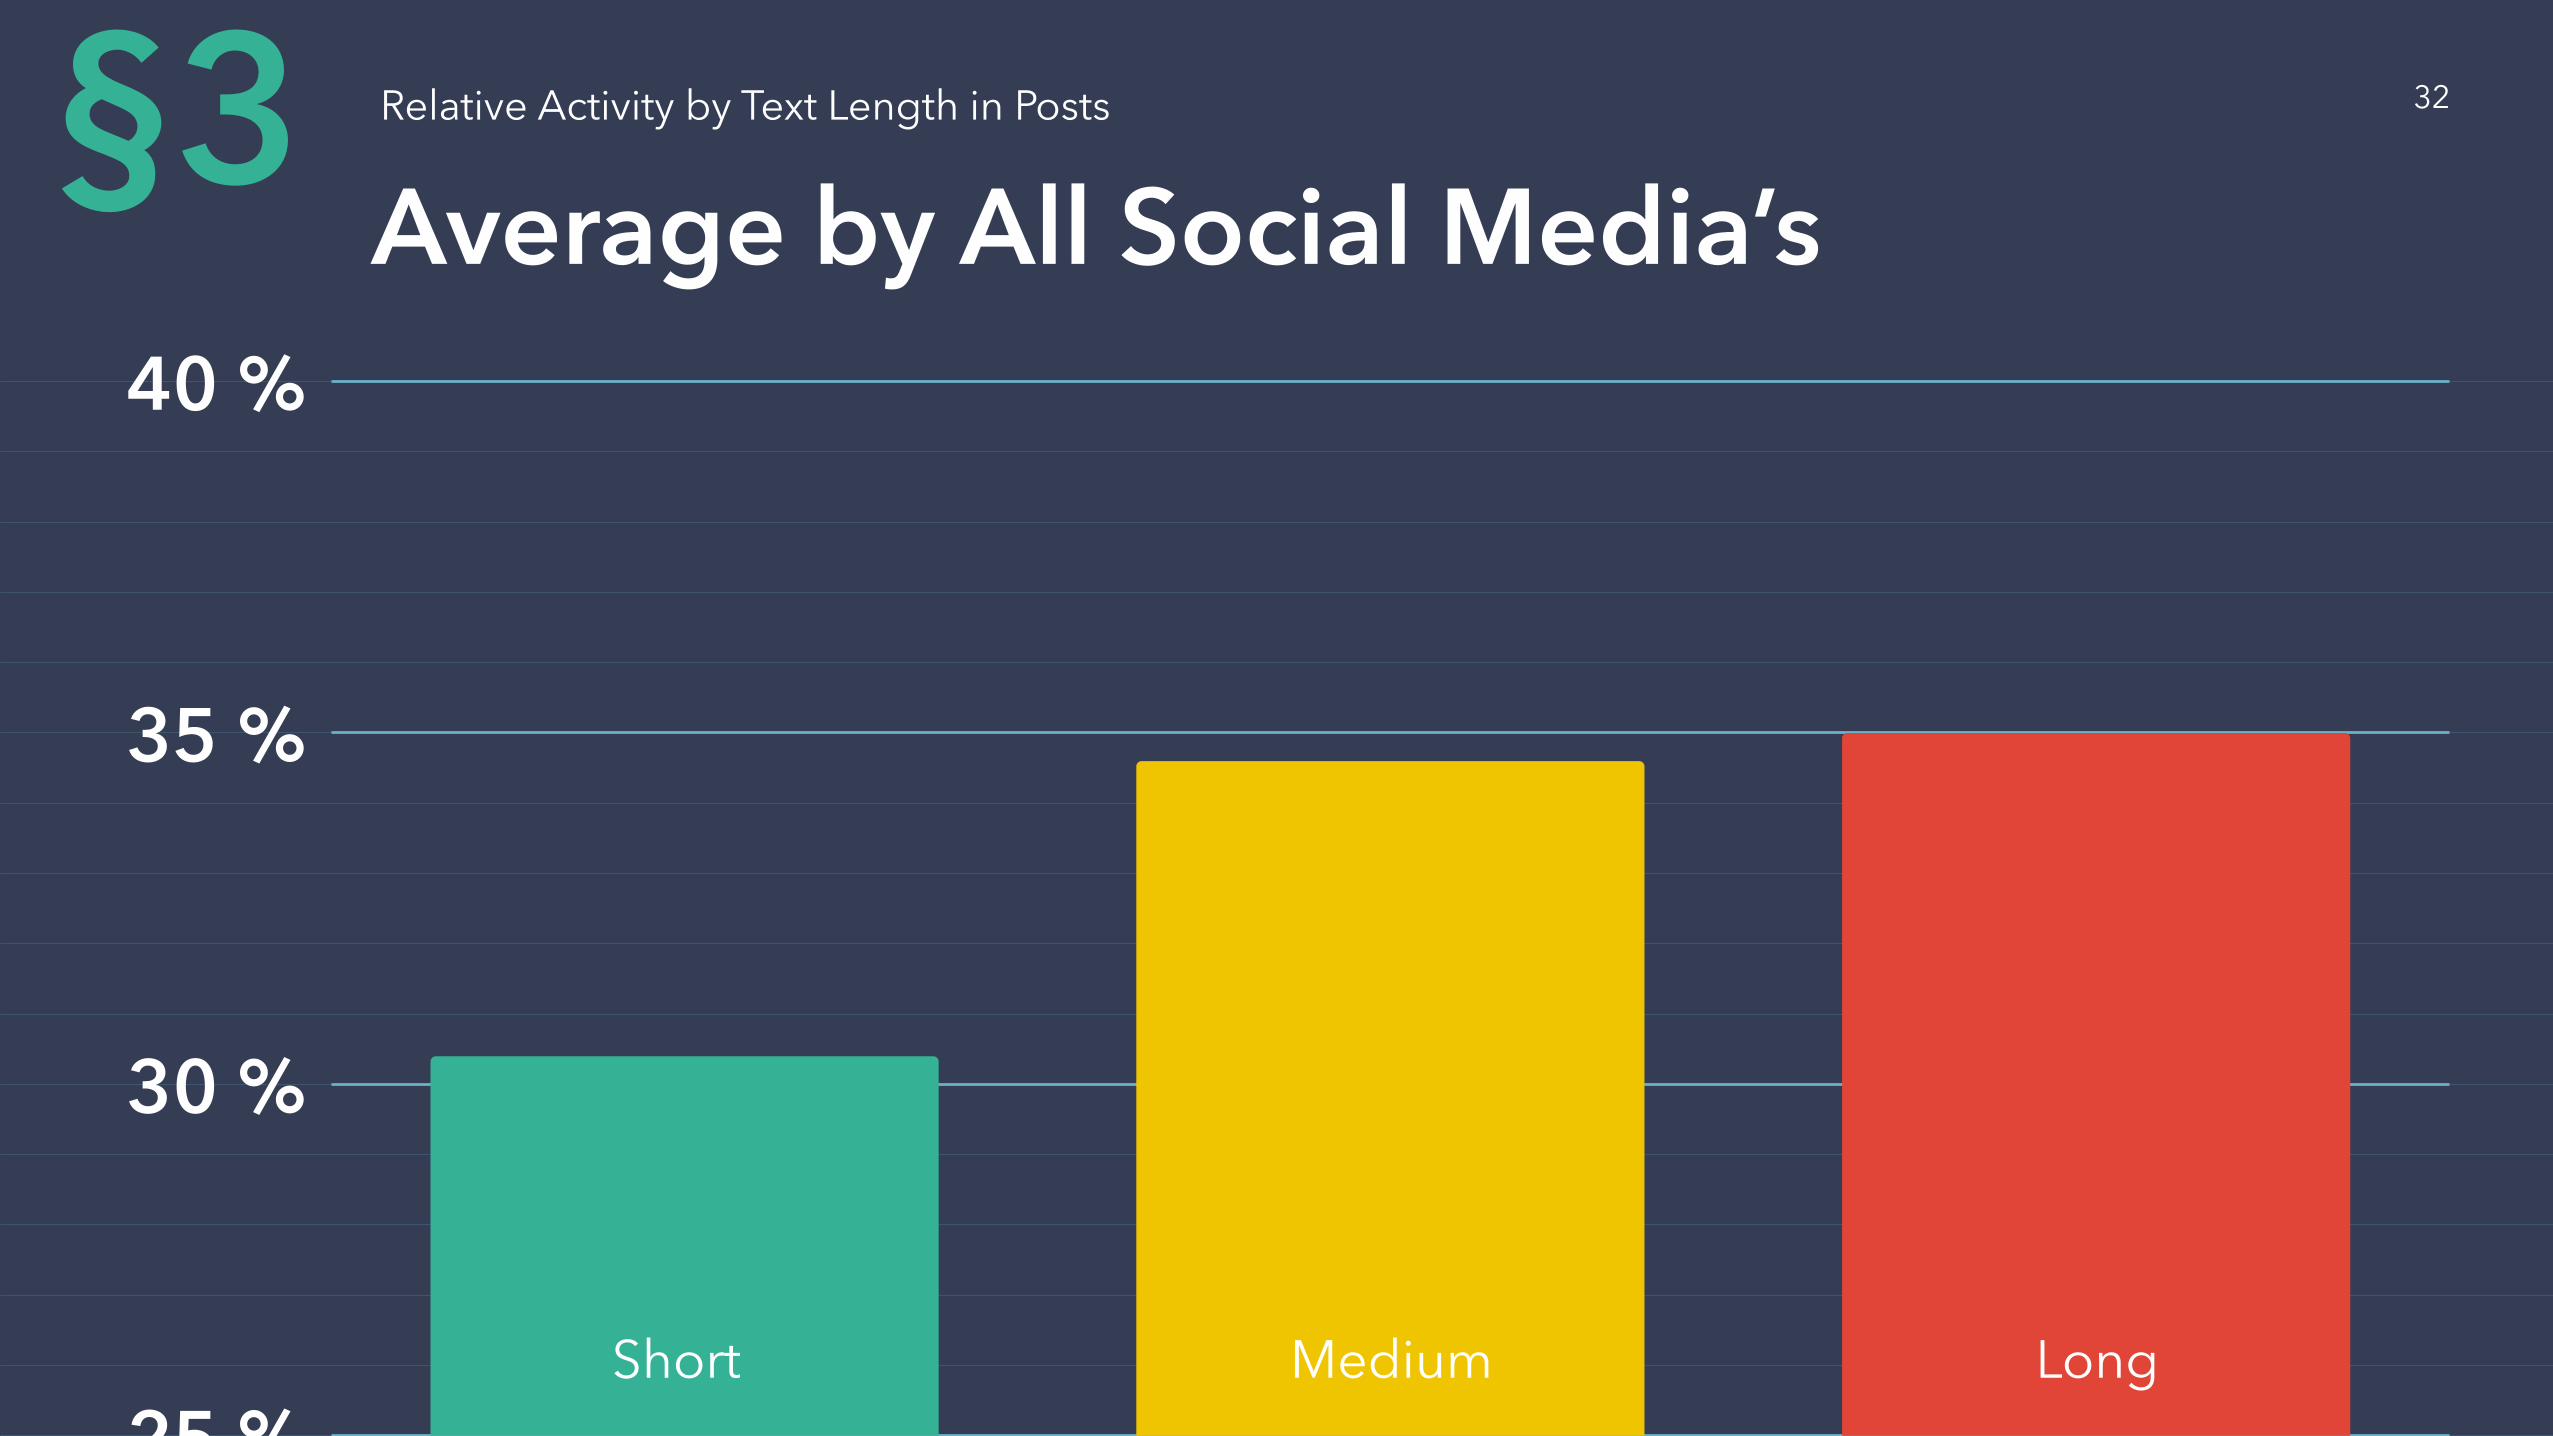
25 %
30 %
35 %
40 %
Relative Activity by Text Length in Posts
Average by All Social Media’s§3
Short Medium Long
32

§Relative Activityby Attachments in Posts
4

Methodology IRelative Activity by Attachments in Posts§4
Popsters automatically categorizes all posts
on 4 types by attachments:
Text Pics LinkVideo
34

Methodology II
Average activity of posts with specific attachments
Total activities of posts with specific
attachments
Count of posts such type=
Relative average activity of posts such type
Average activity of posts with specific attachments
Total of all average values by all types= × 100 %
Presence a few di�erent types of
attachments in a one post counted
as a few di�erent posts
Relative Activity by Attachments in Posts§4 35
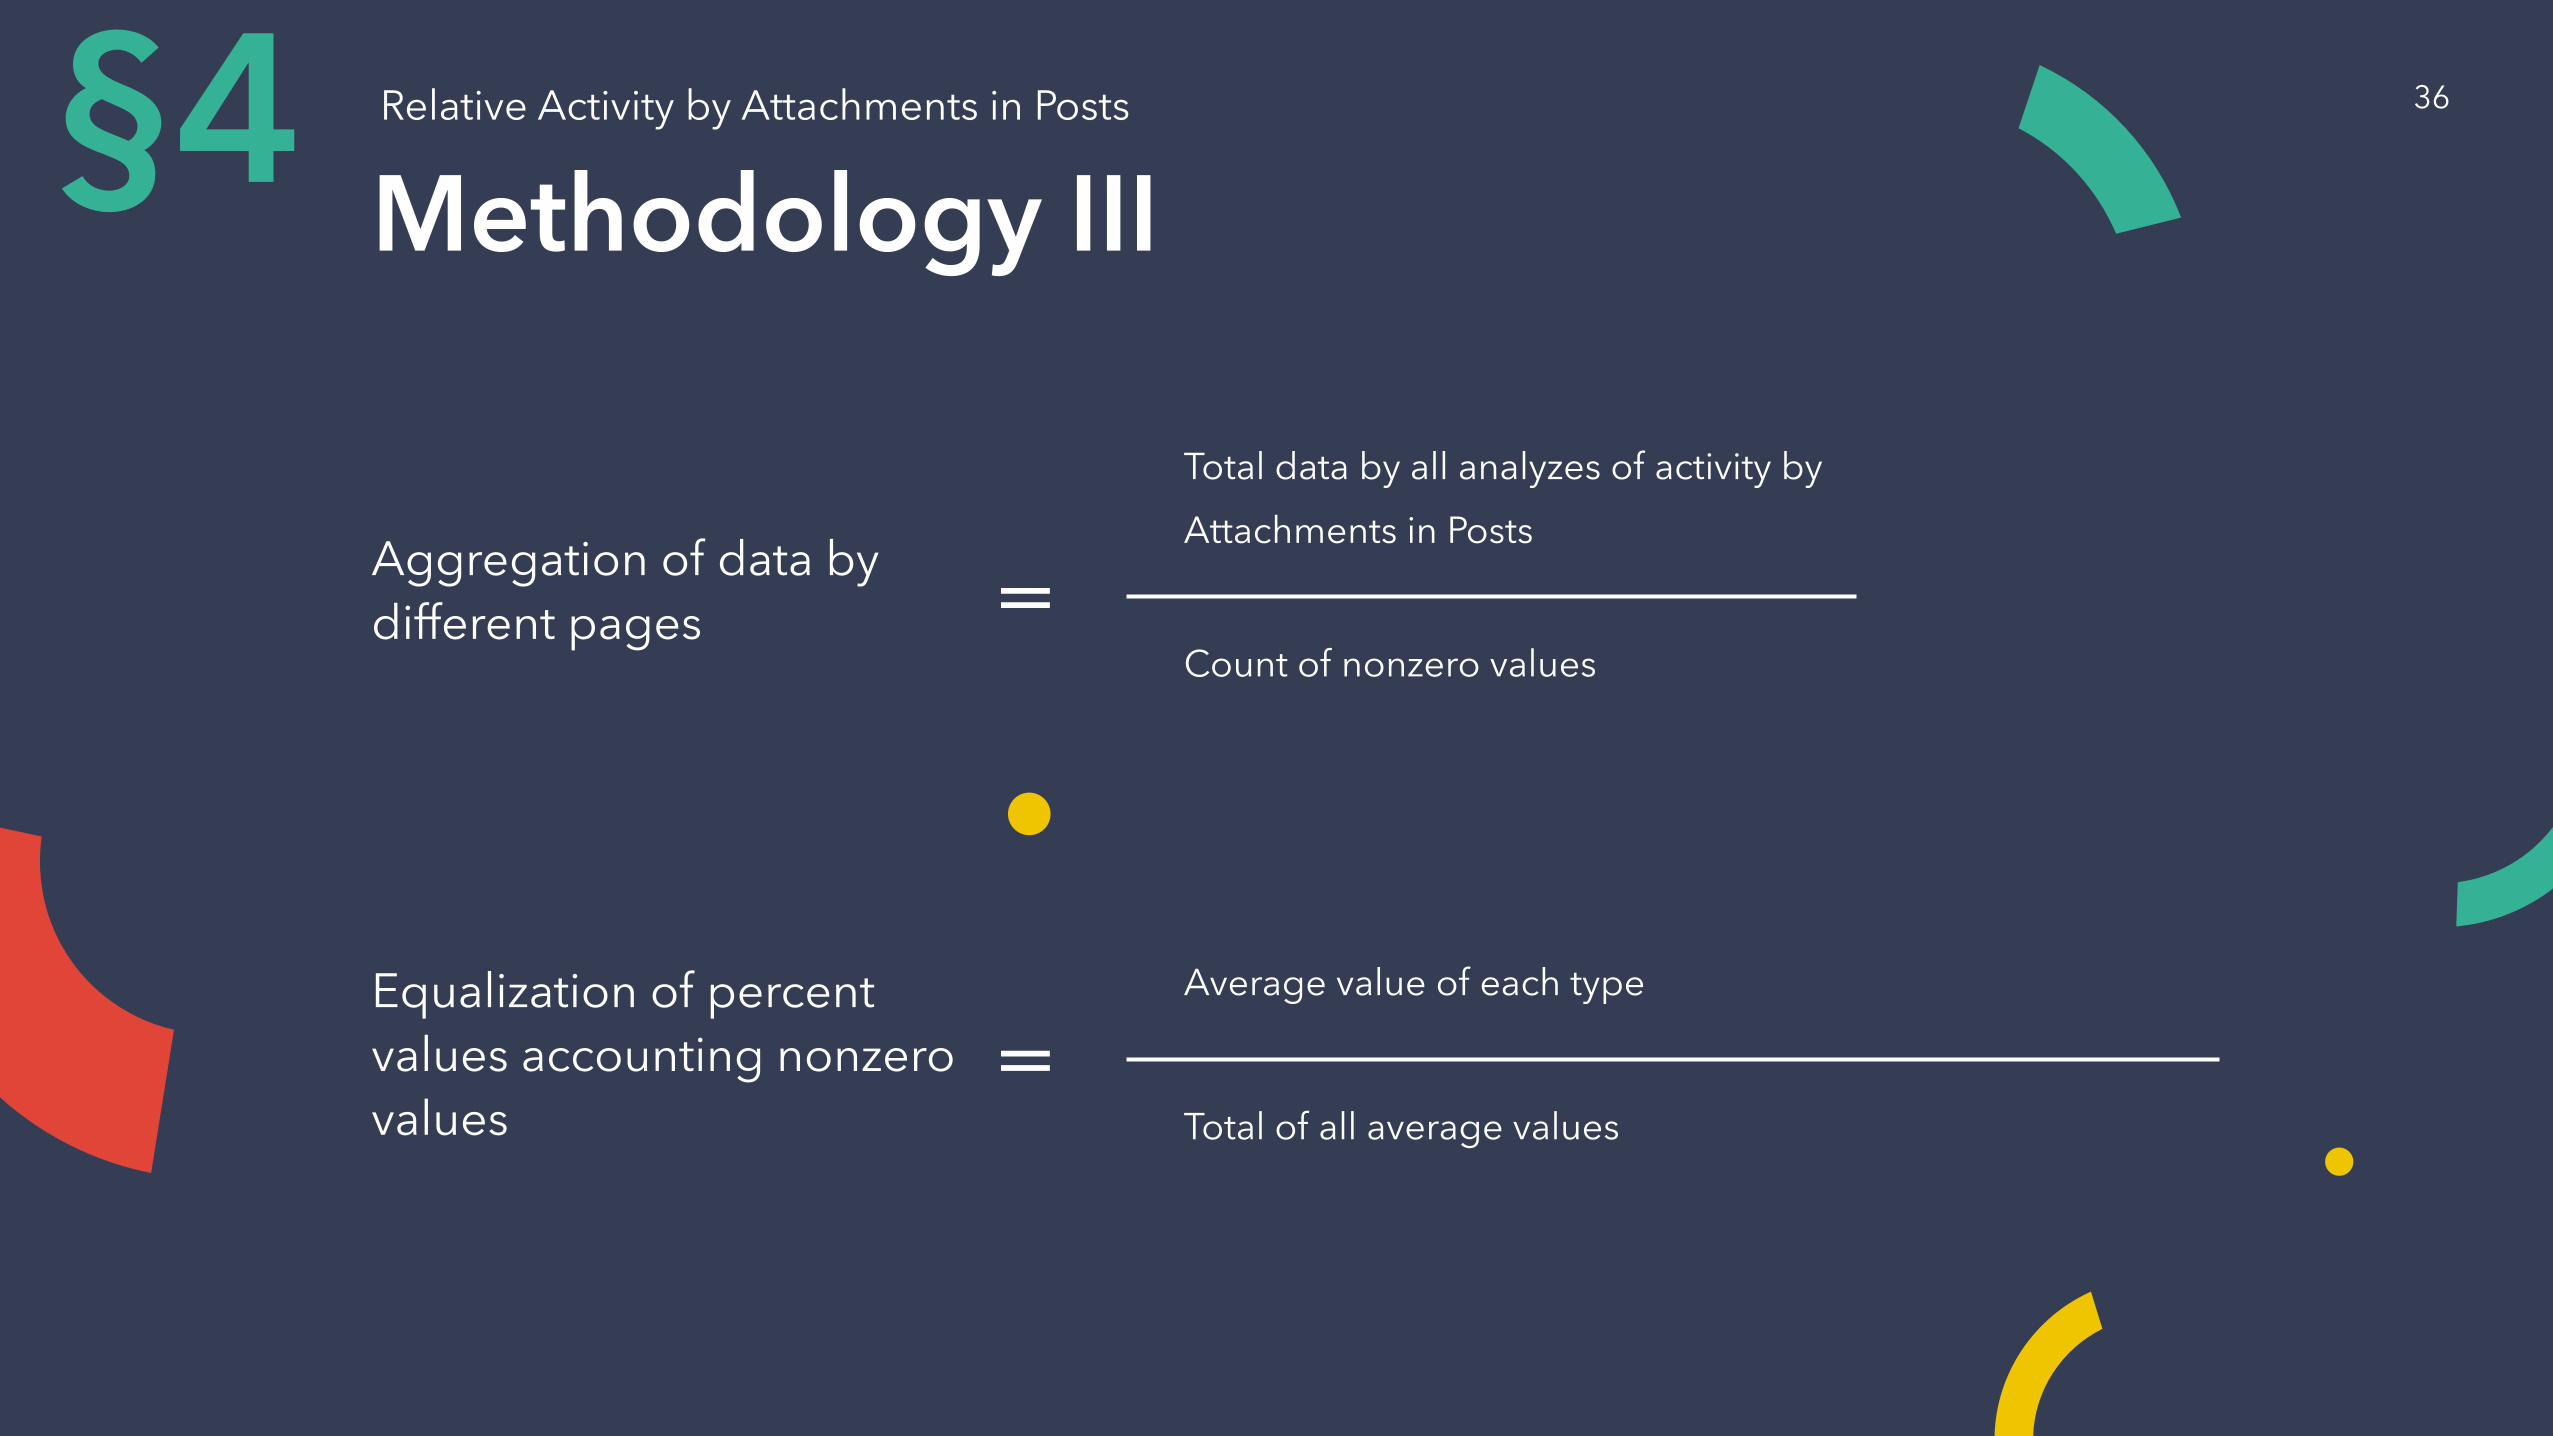
Methodology III
Aggregation of data by di�erent pages
Total data by all analyzes of activity by
Attachments in Posts
Count of nonzero values=
Equalization of percent values accounting nonzero values
Average value of each type
Total of all average values=
Relative Activity by Attachments in Posts§4 36
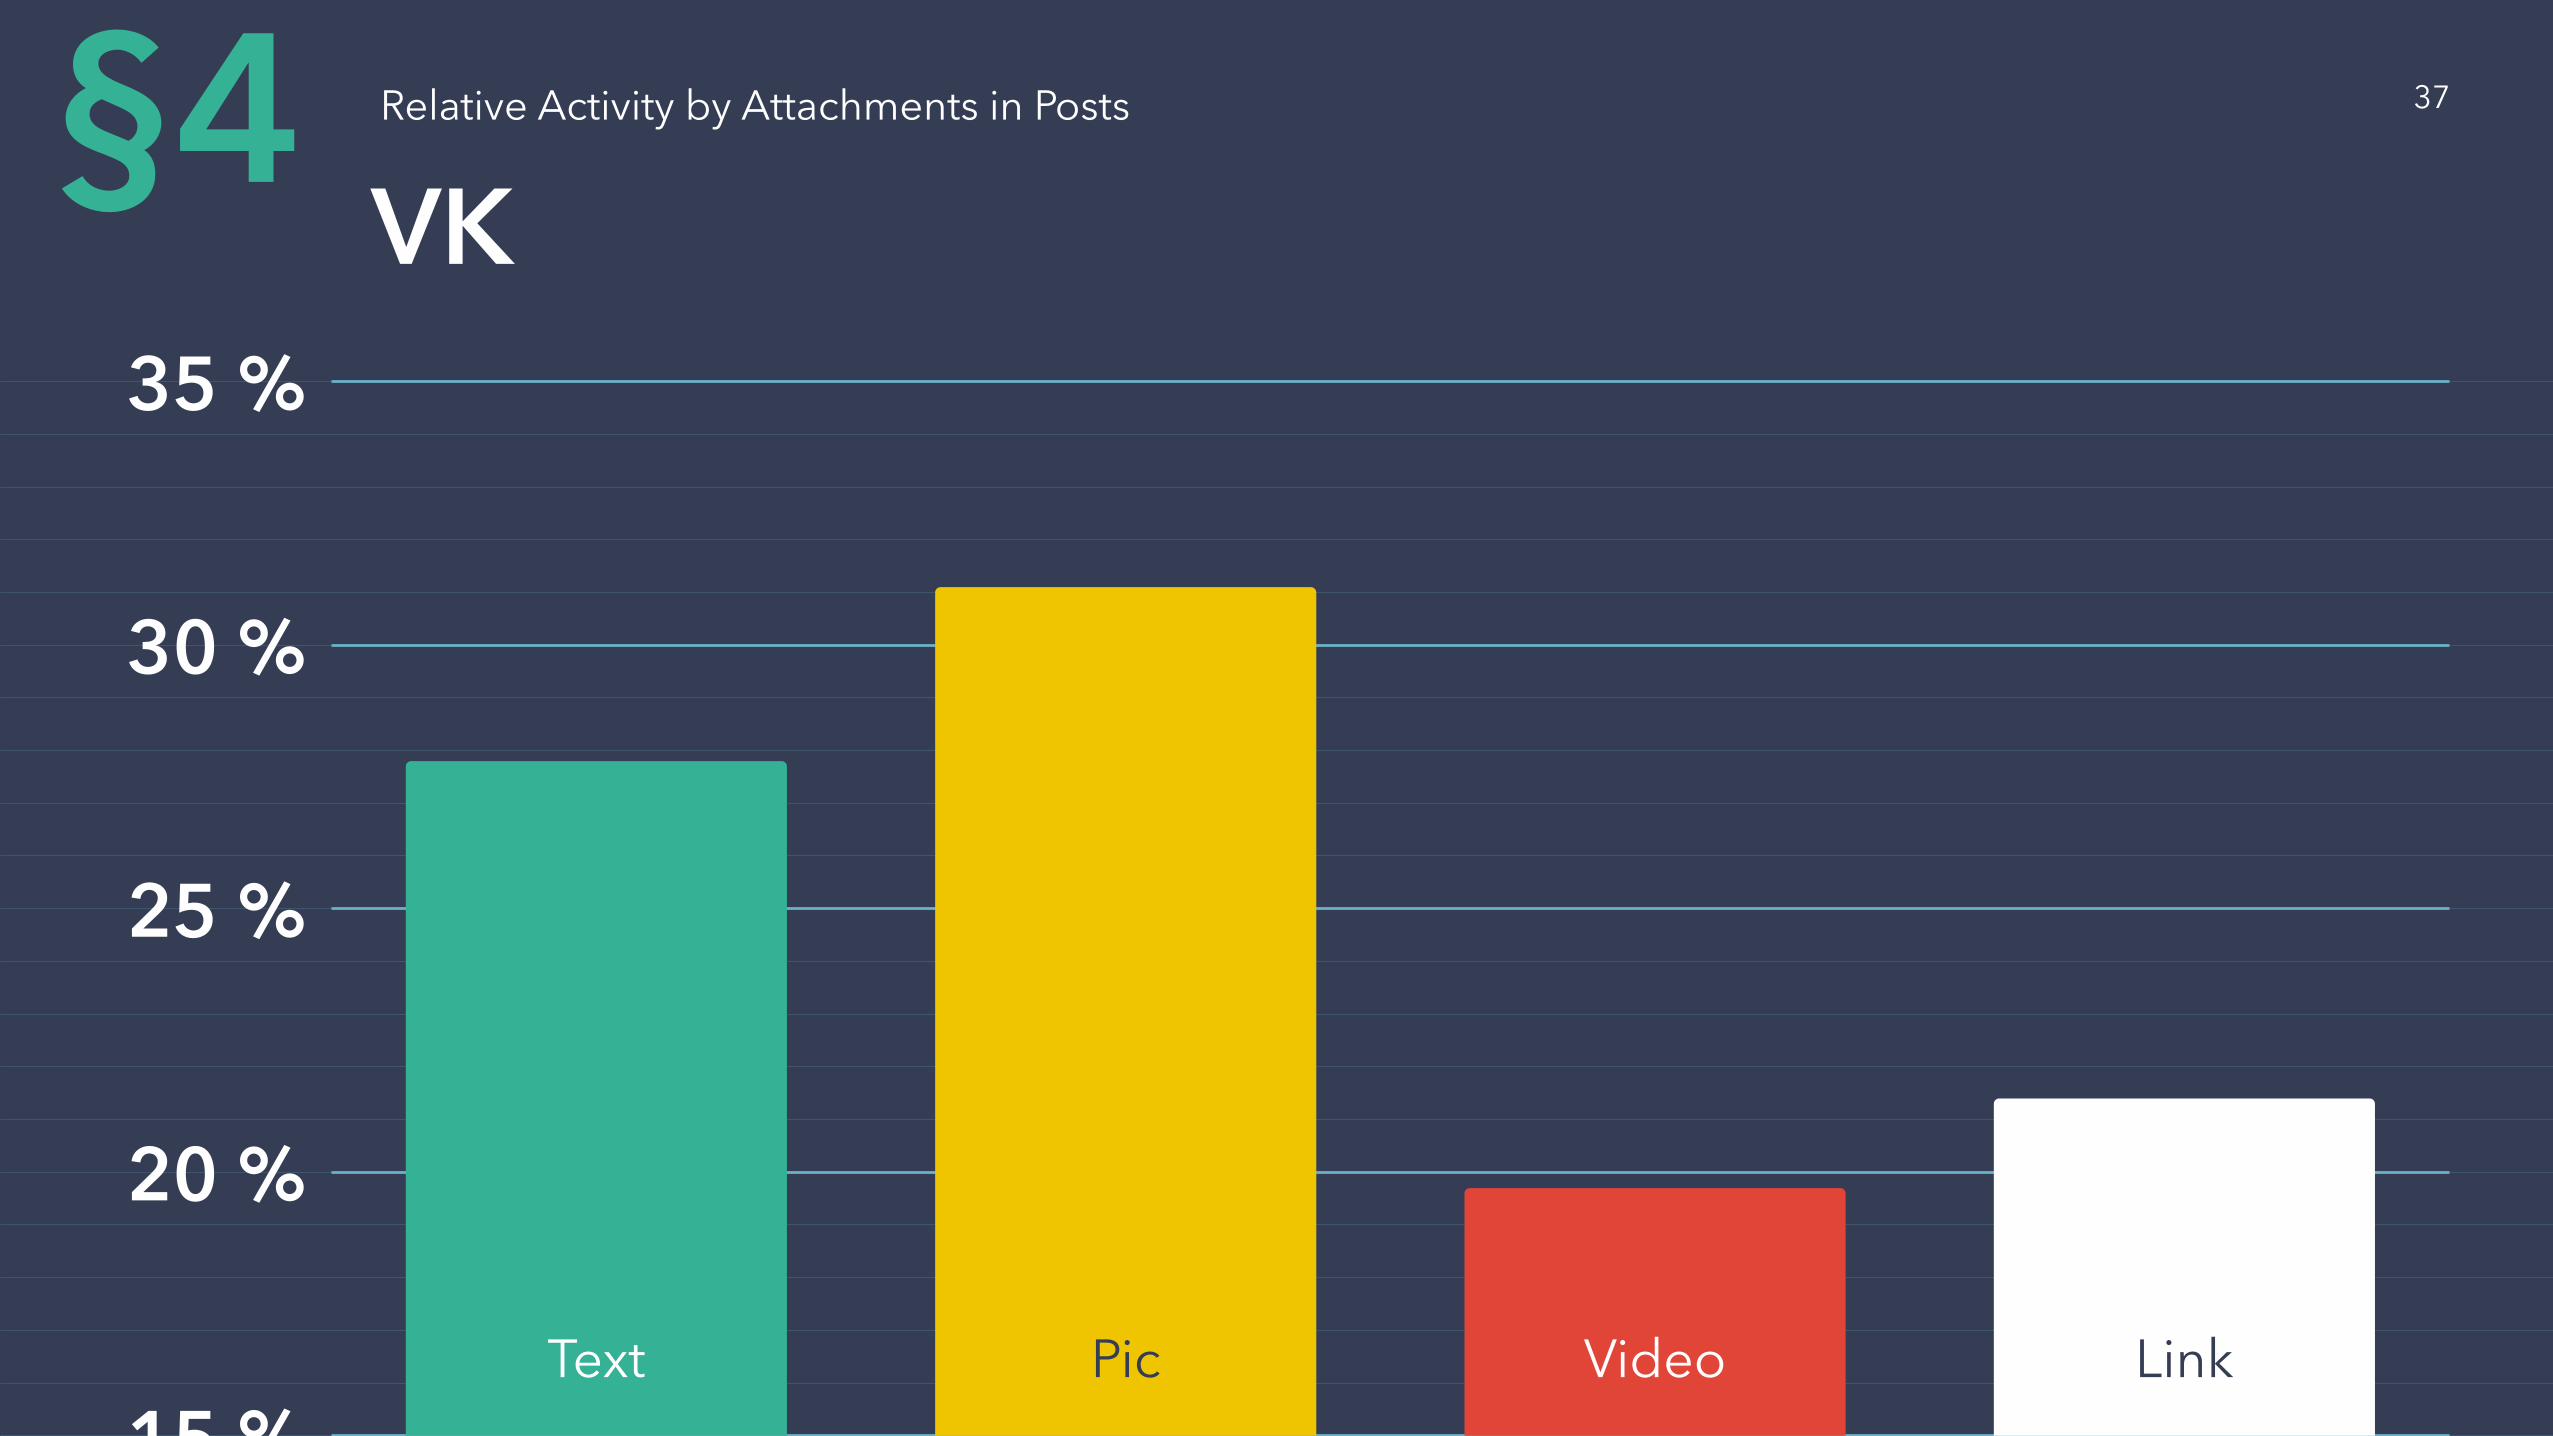
15 %
20 %
25 %
30 %
35 %
Relative Activity by Attachments in Posts
VK§4
Text Pic Video Link
37

15 %
20 %
25 %
30 %
35 %
Relative Activity by Attachments in Posts
Facebook§4
Text Pic Video Link
38
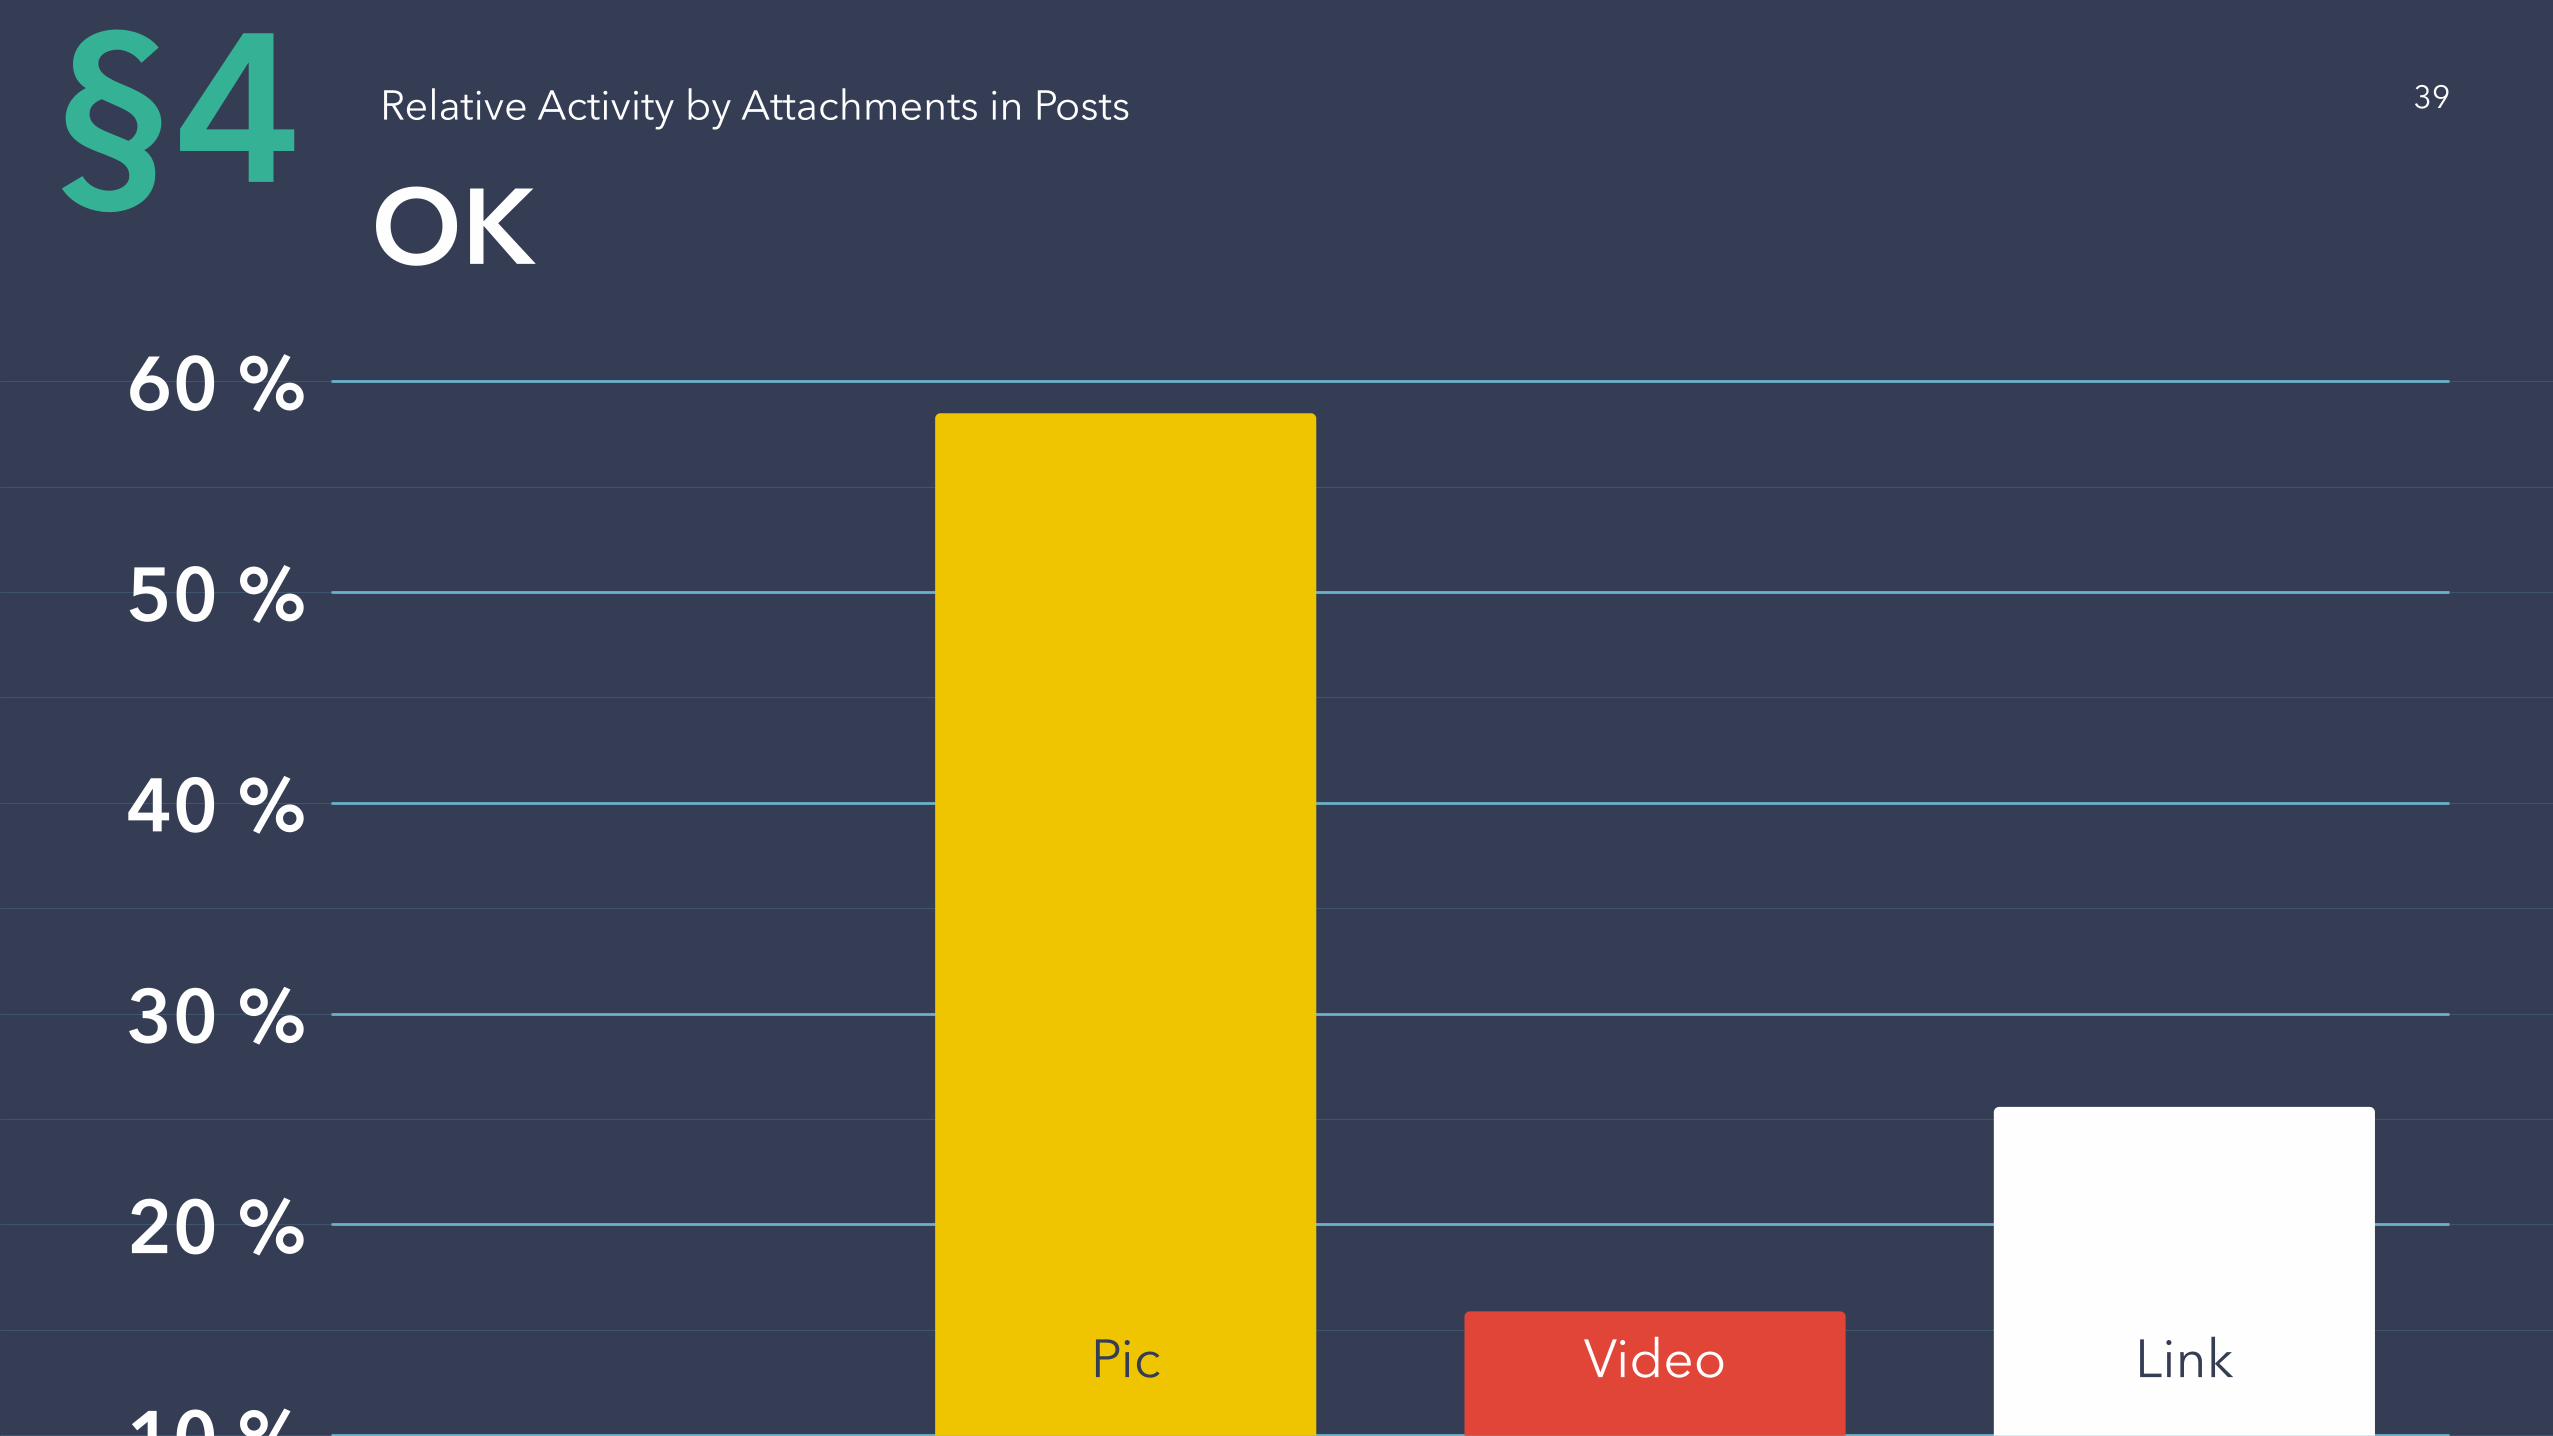
10 %
20 %
30 %
40 %
50 %
60 %
Relative Activity by Attachments in Posts
OK§4
Pic Video Link
39
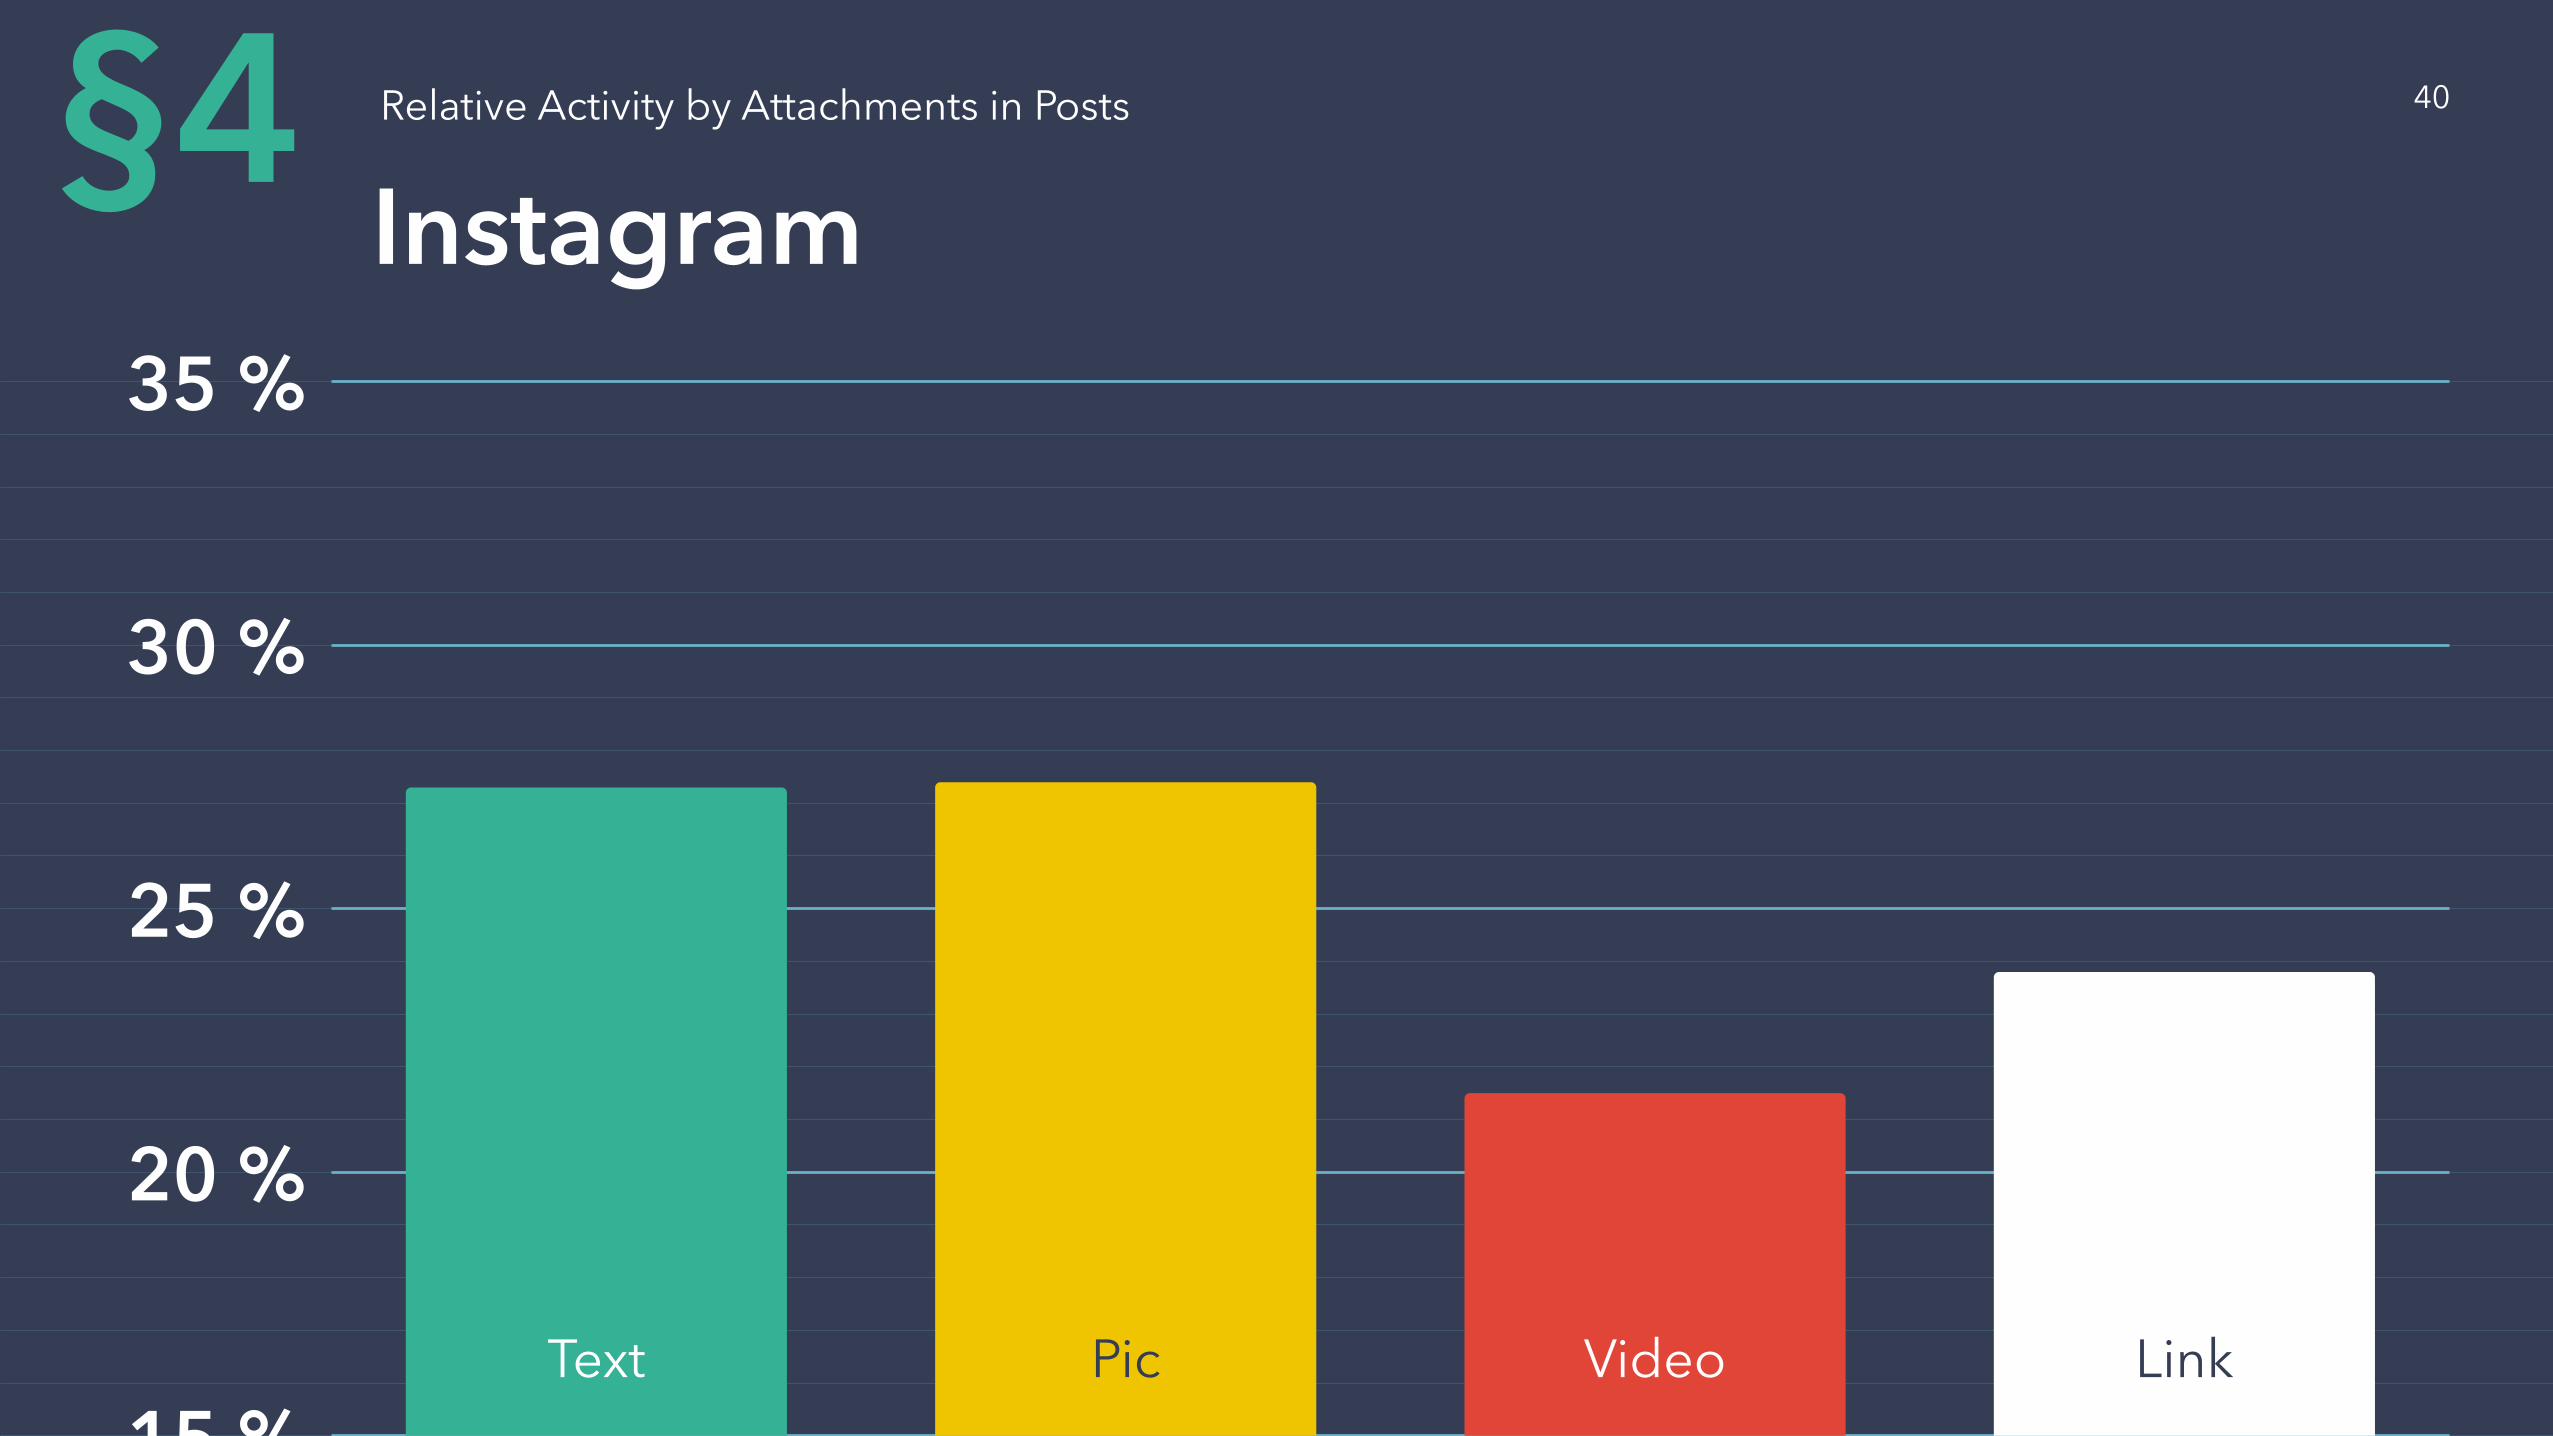
15 %
20 %
25 %
30 %
35 %
Relative Activity by Attachments in Posts
Instagram§4
Text Pic Video Link
40
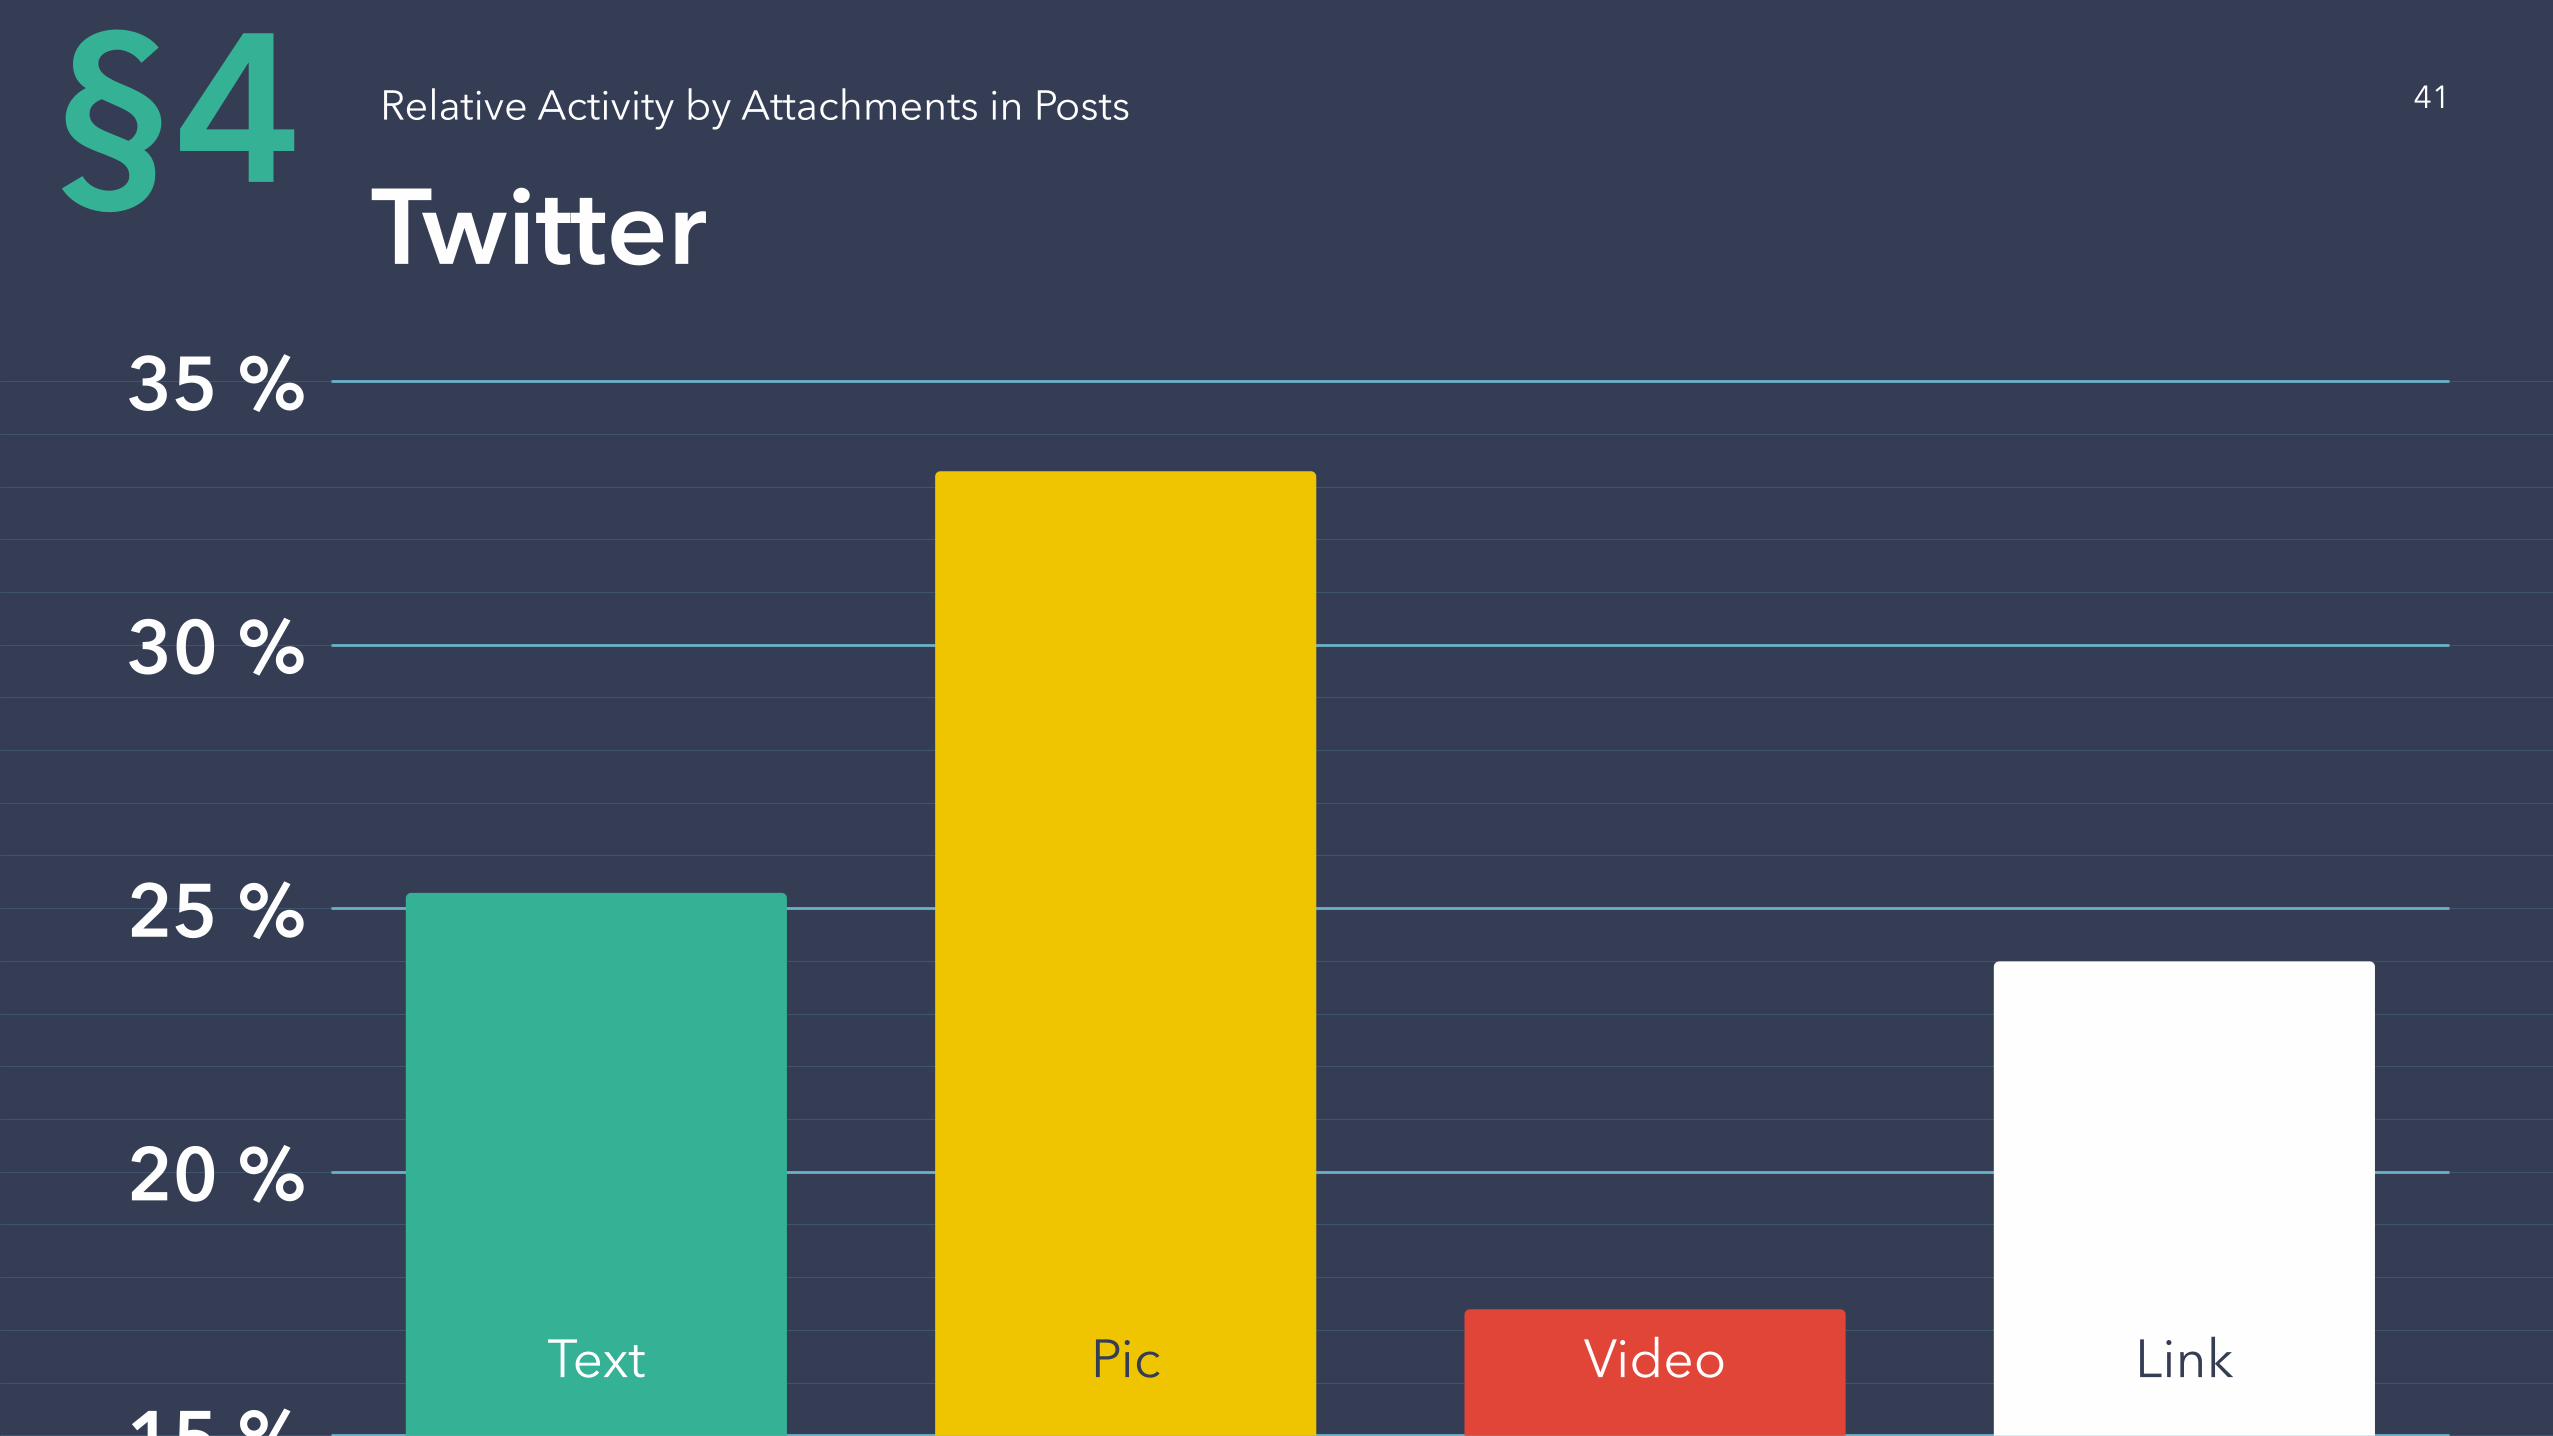
15 %
20 %
25 %
30 %
35 %
Relative Activity by Attachments in Posts
Twitter§4
Text Pic Video Link
41
15 %
20 %
25 %
30 %
35 %
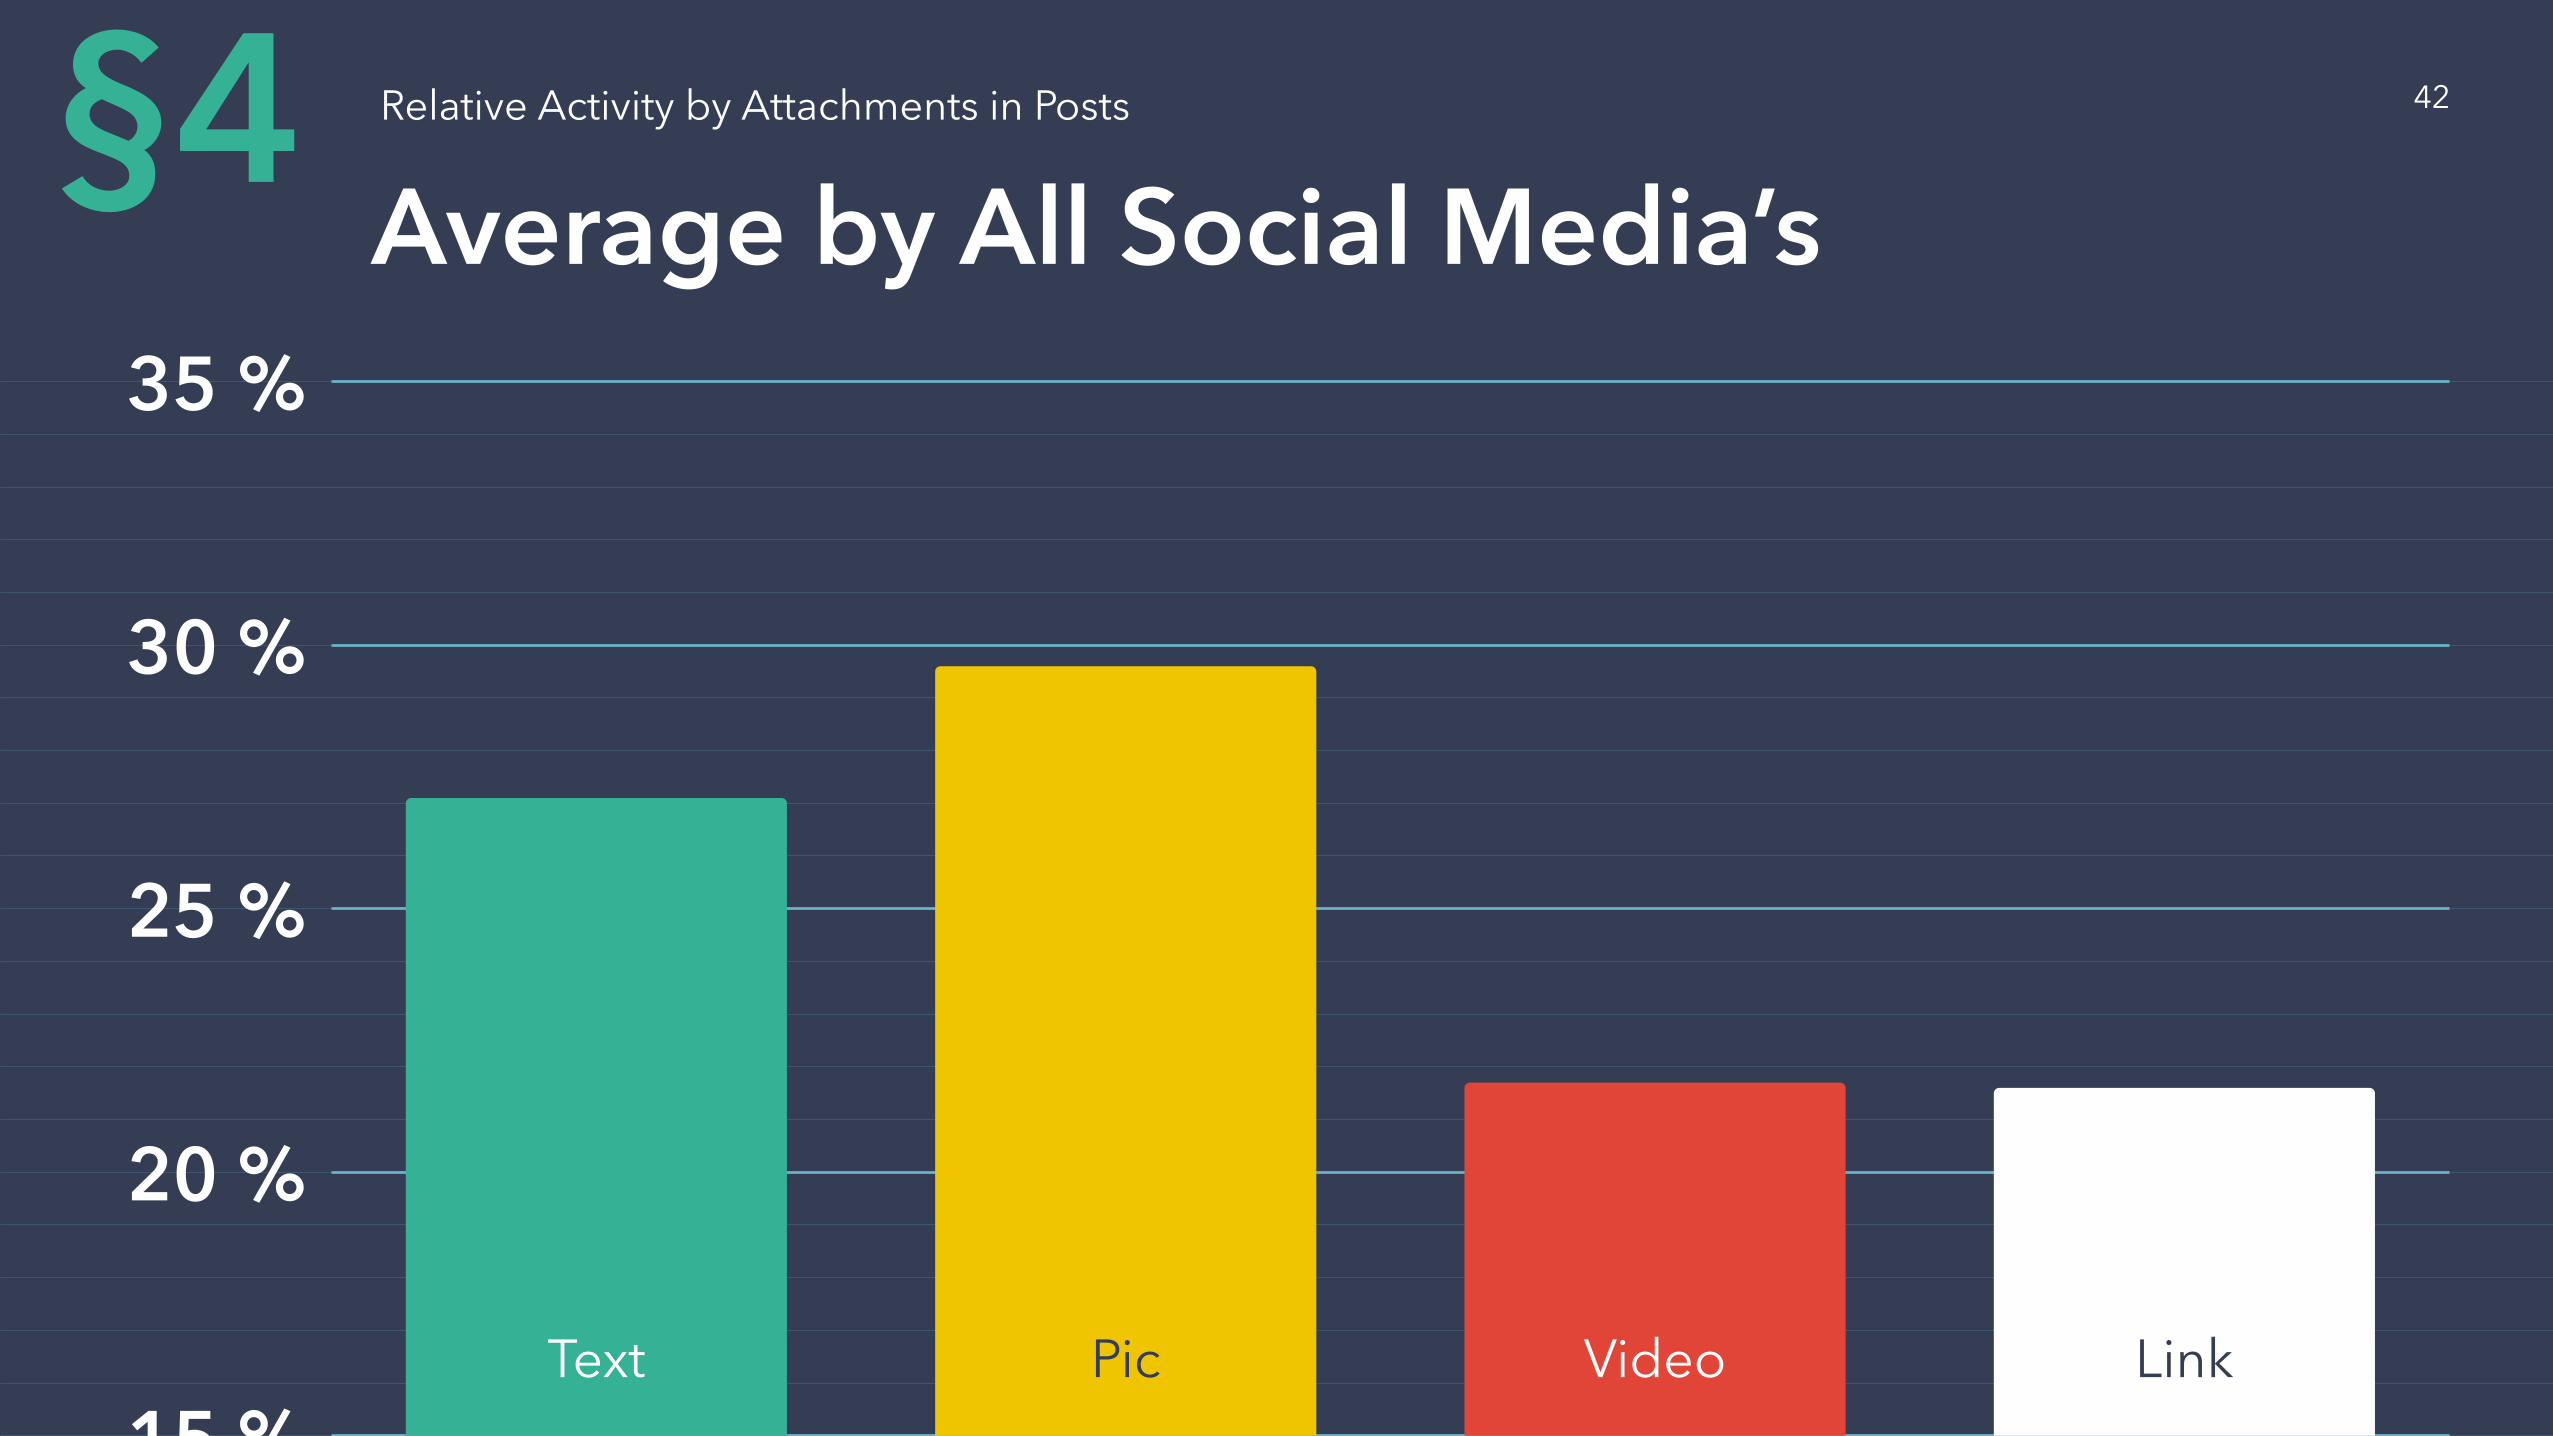
Relative Activity by Attachments in Posts
Average by All Social Media’s
Text Pic Video Link
§4 42

§5Average Engagement Rateof Pages by Count of Followers
Methodology IAverage Engagement Rate of Pages by Count of Followers§5
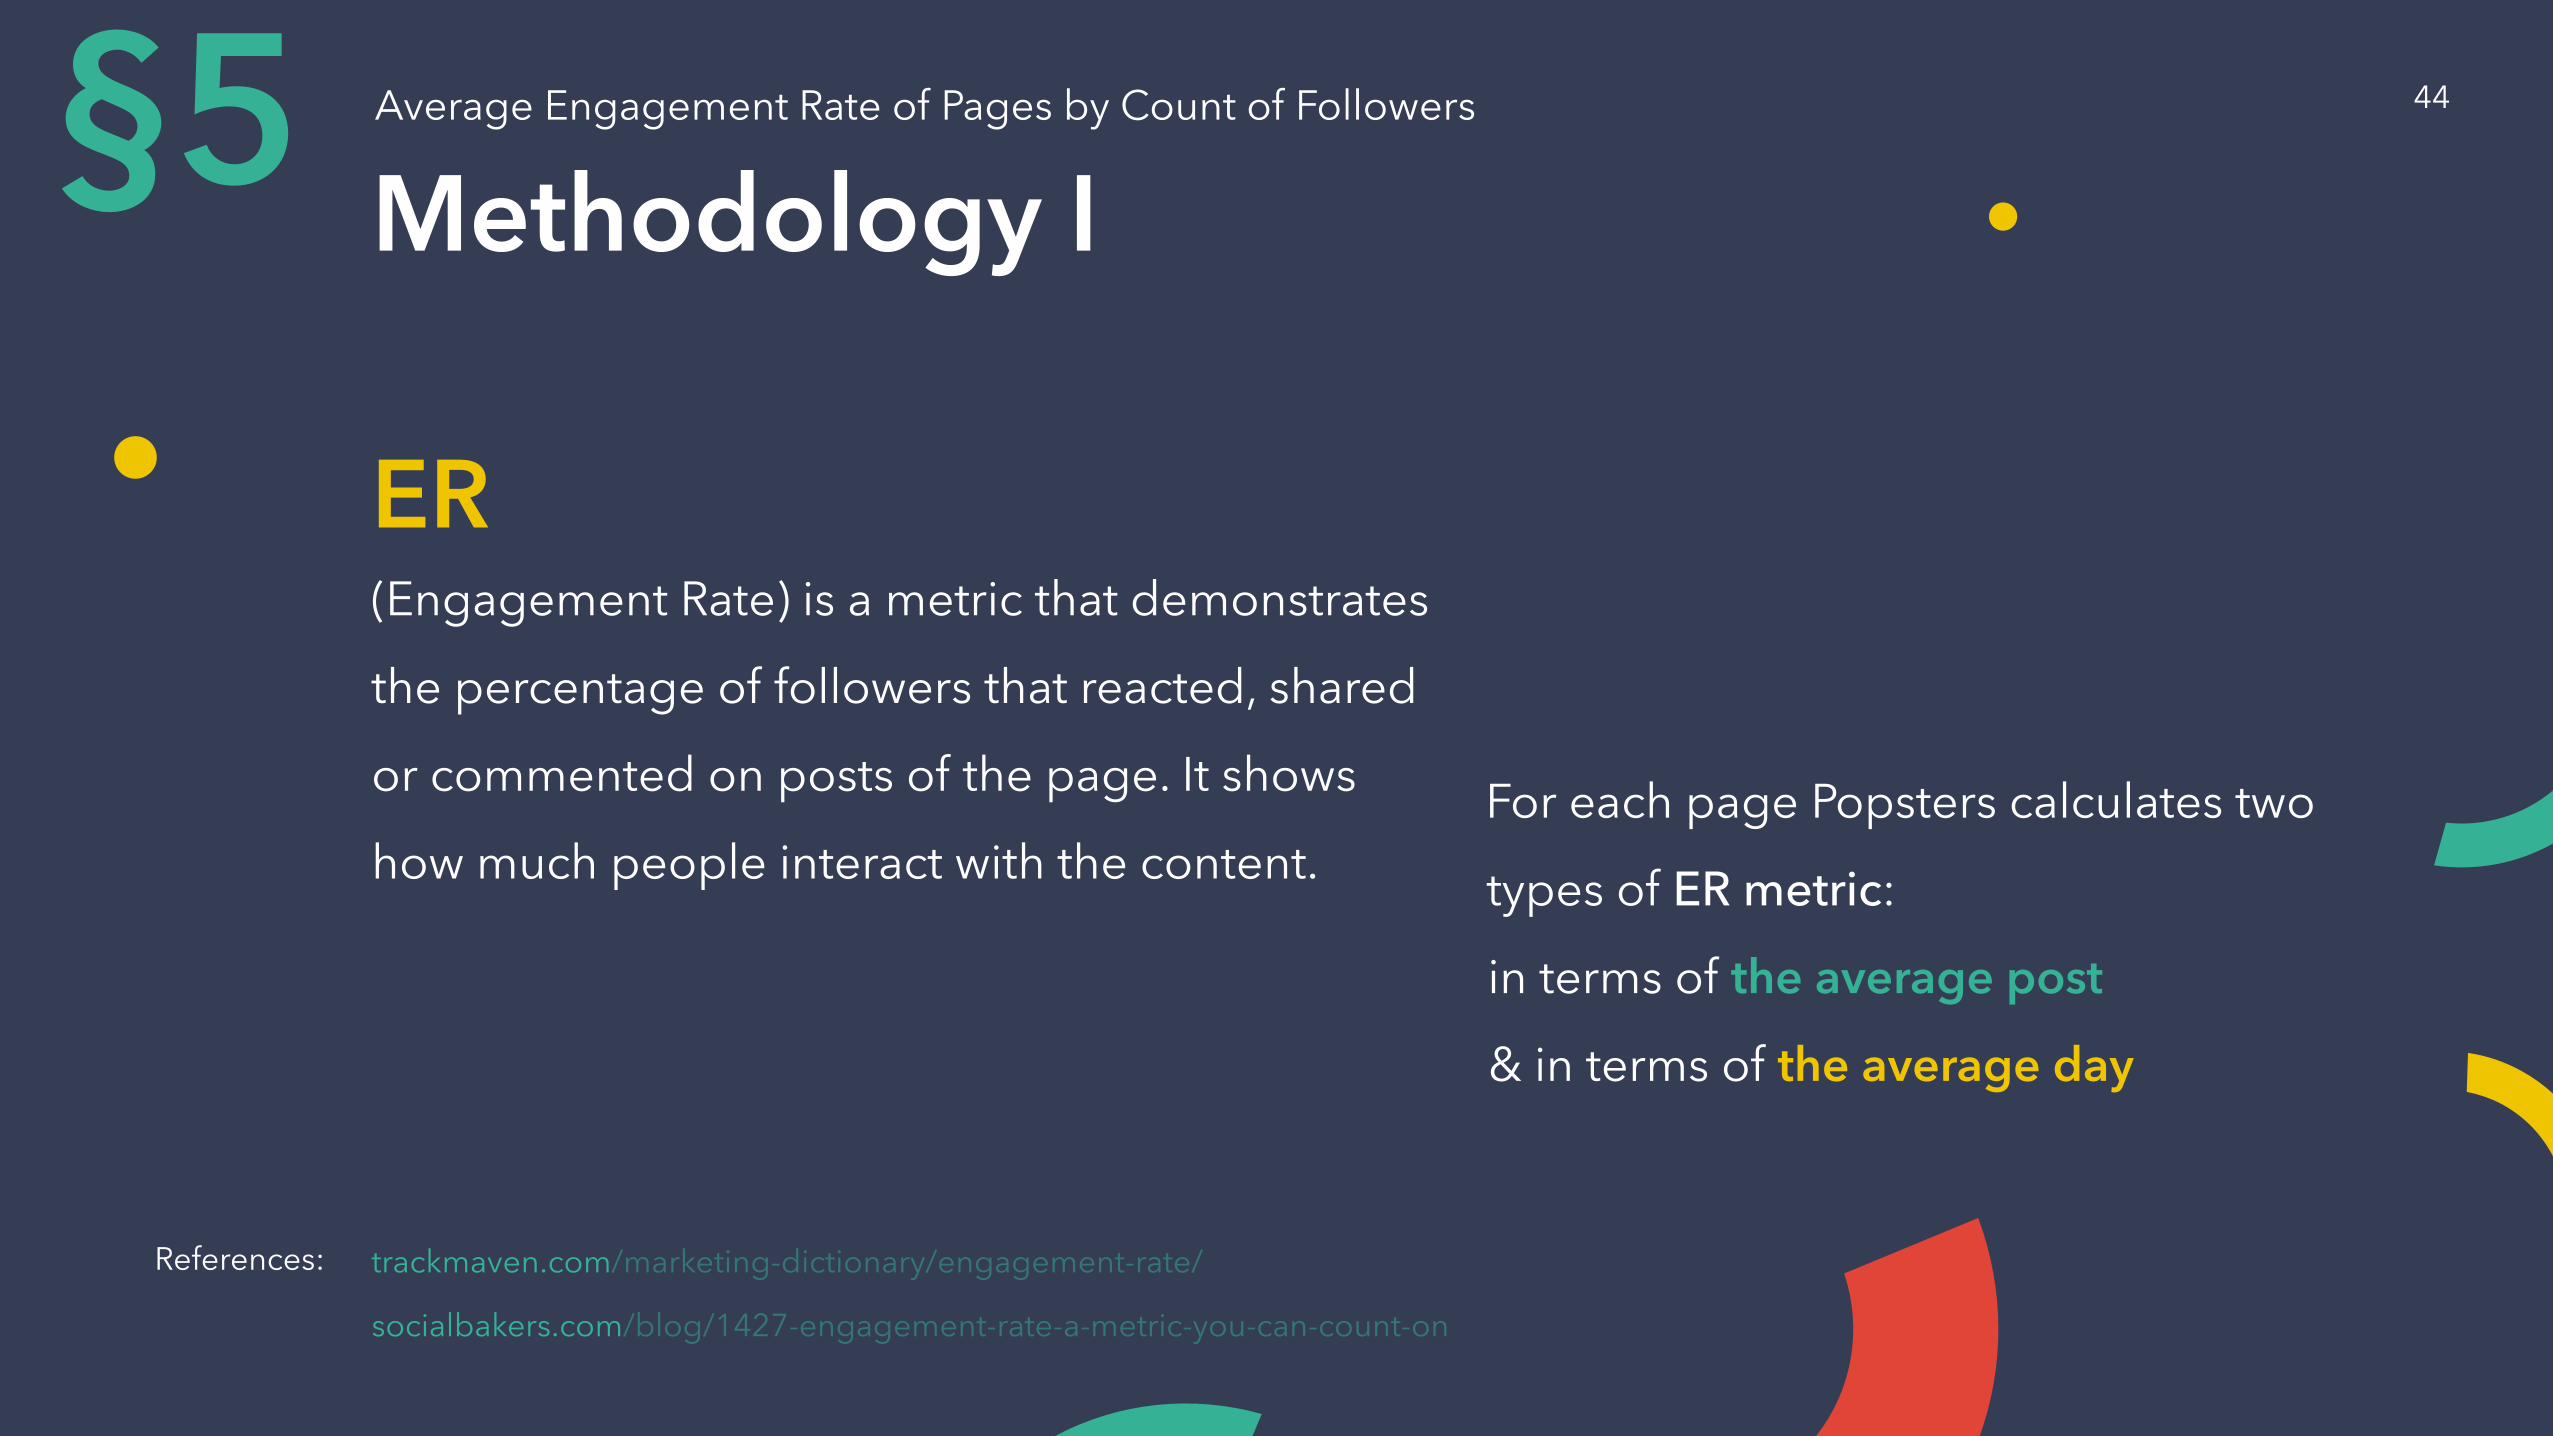
ER(Engagement Rate) is a metric that demonstrates
the percentage of followers that reacted, shared
or commented on posts of the page. It shows
how much people interact with the content.
For each page Popsters calculates two
types of ER metric:
in terms of the average post
& in terms of the average day
trackmaven.com/marketing-dictionary/engagement-rate/
socialbakers.com/blog/1427-engagement-rate-a-metric-you-can-count-on
References:
44
Methodology IIAverage Engagement Rate of Pages by Count of Followers§5
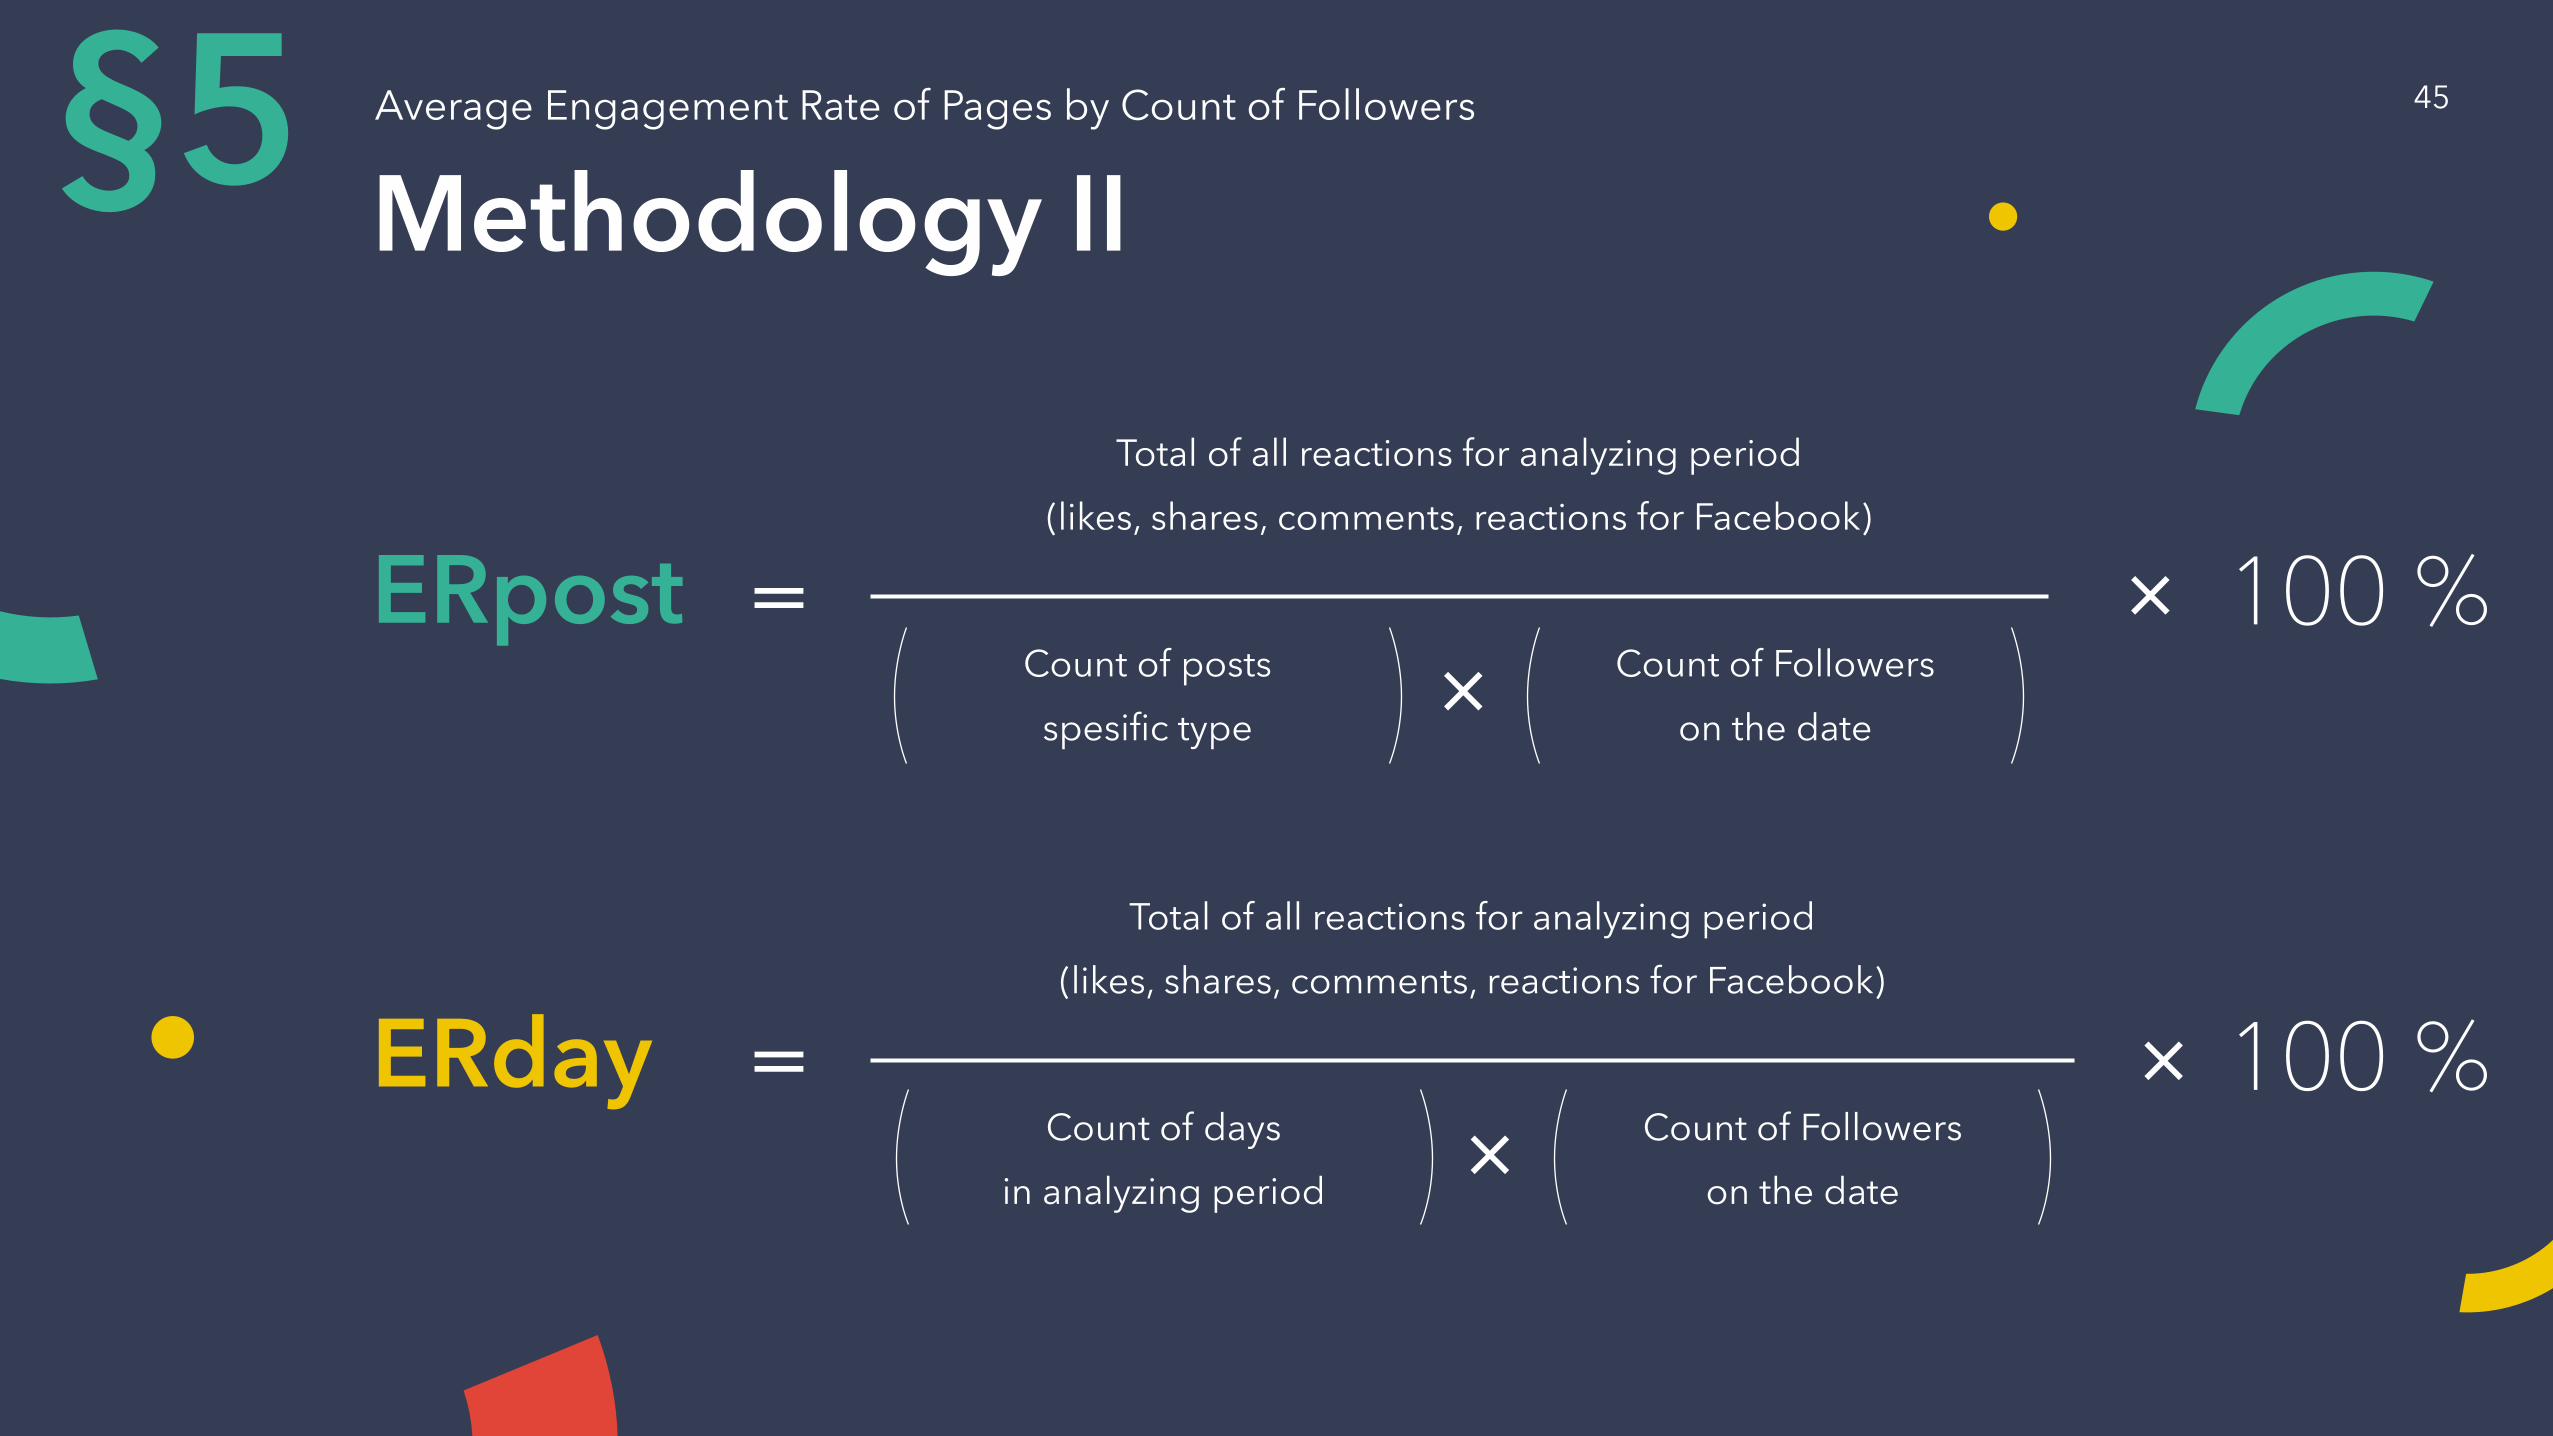
ERpost
Total of all reactions for analyzing period
(likes, shares, comments, reactions for Facebook)
Count of posts
spesific type
Count of Followers
on the date
=×
× 100 %
ERday
Total of all reactions for analyzing period
(likes, shares, comments, reactions for Facebook)
Count of days
in analyzing period
Count of Followers
on the date
=×
× 100 %
45
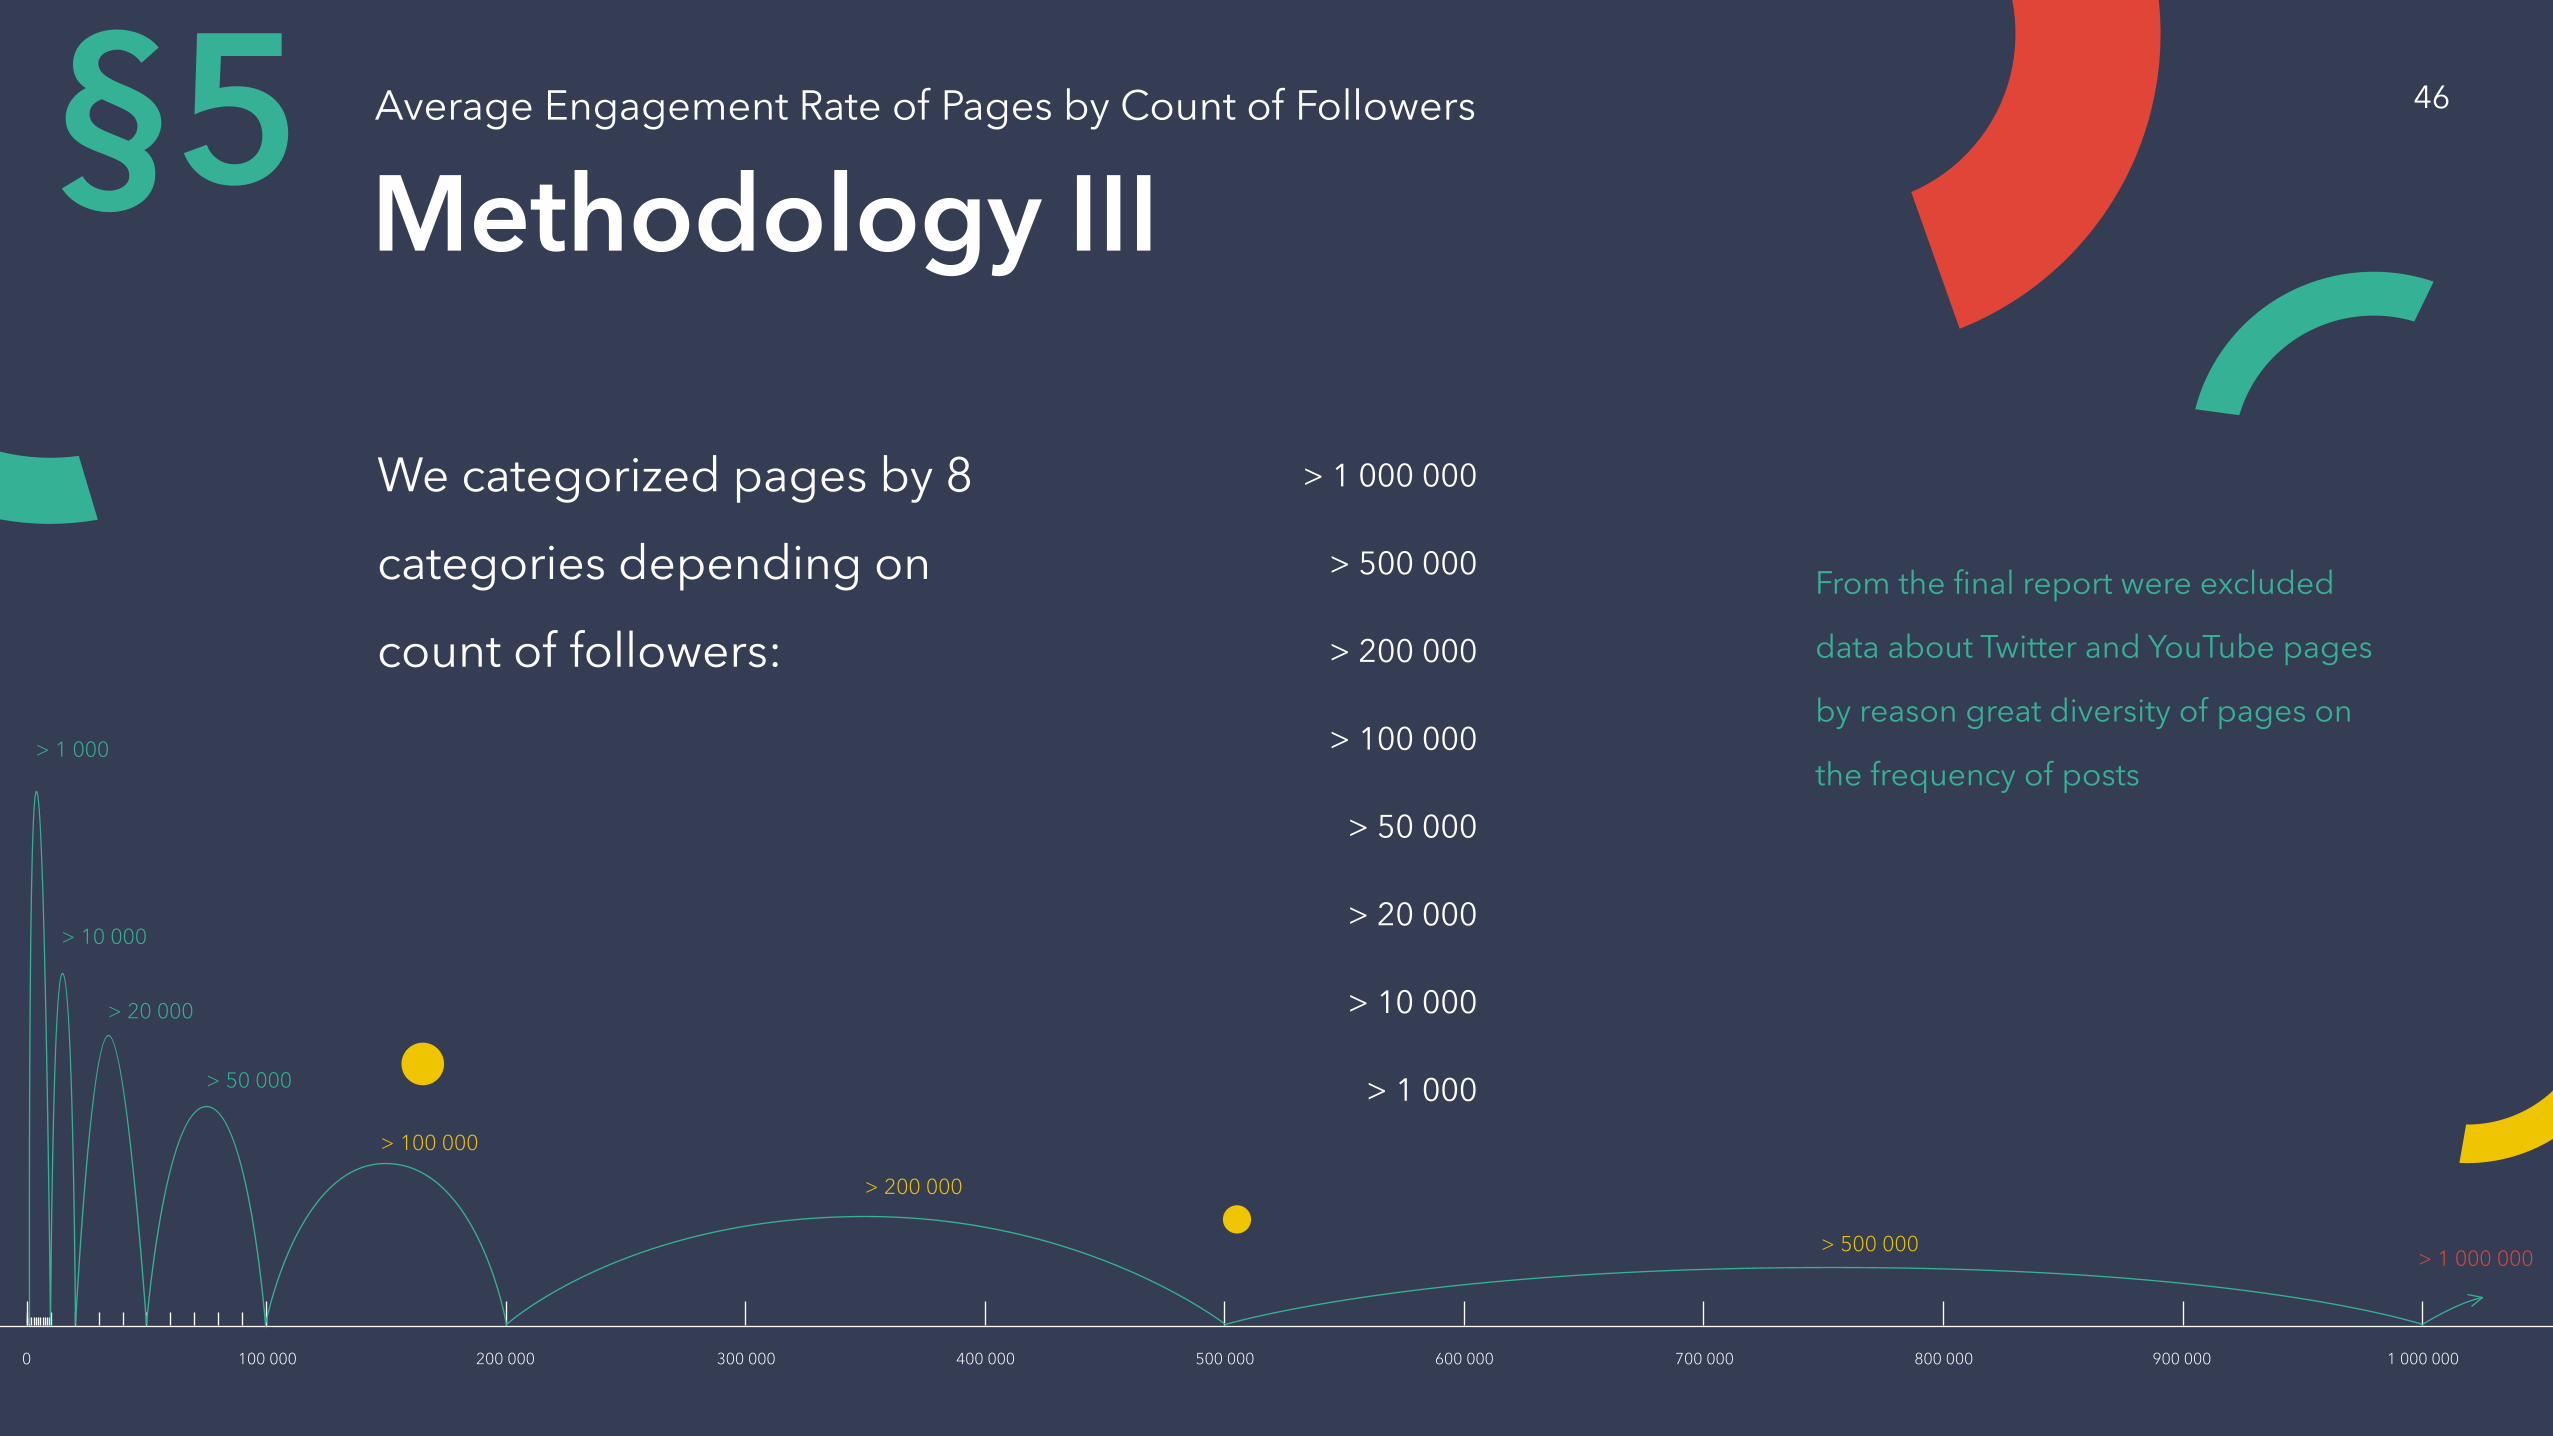
Methodology IIIAverage Engagement Rate of Pages by Count of Followers§5We categorized pages by 8
categories depending on
count of followers:
> 1 000 000
> 500 000
> 200 000
> 100 000
> 50 000
> 20 000
> 10 000
> 1 000
From the final report were excluded
data about Twitter and YouTube pages
by reason great diversity of pages on
the frequency of posts> 1 000
> 10 000
> 20 000
> 50 000
> 100 000
> 200 000
> 500 000> 1 000 000
0 100 000 200 000 300 000 400 000 500 000 600 000 700 000 800 000 900 000 1 000 000
46
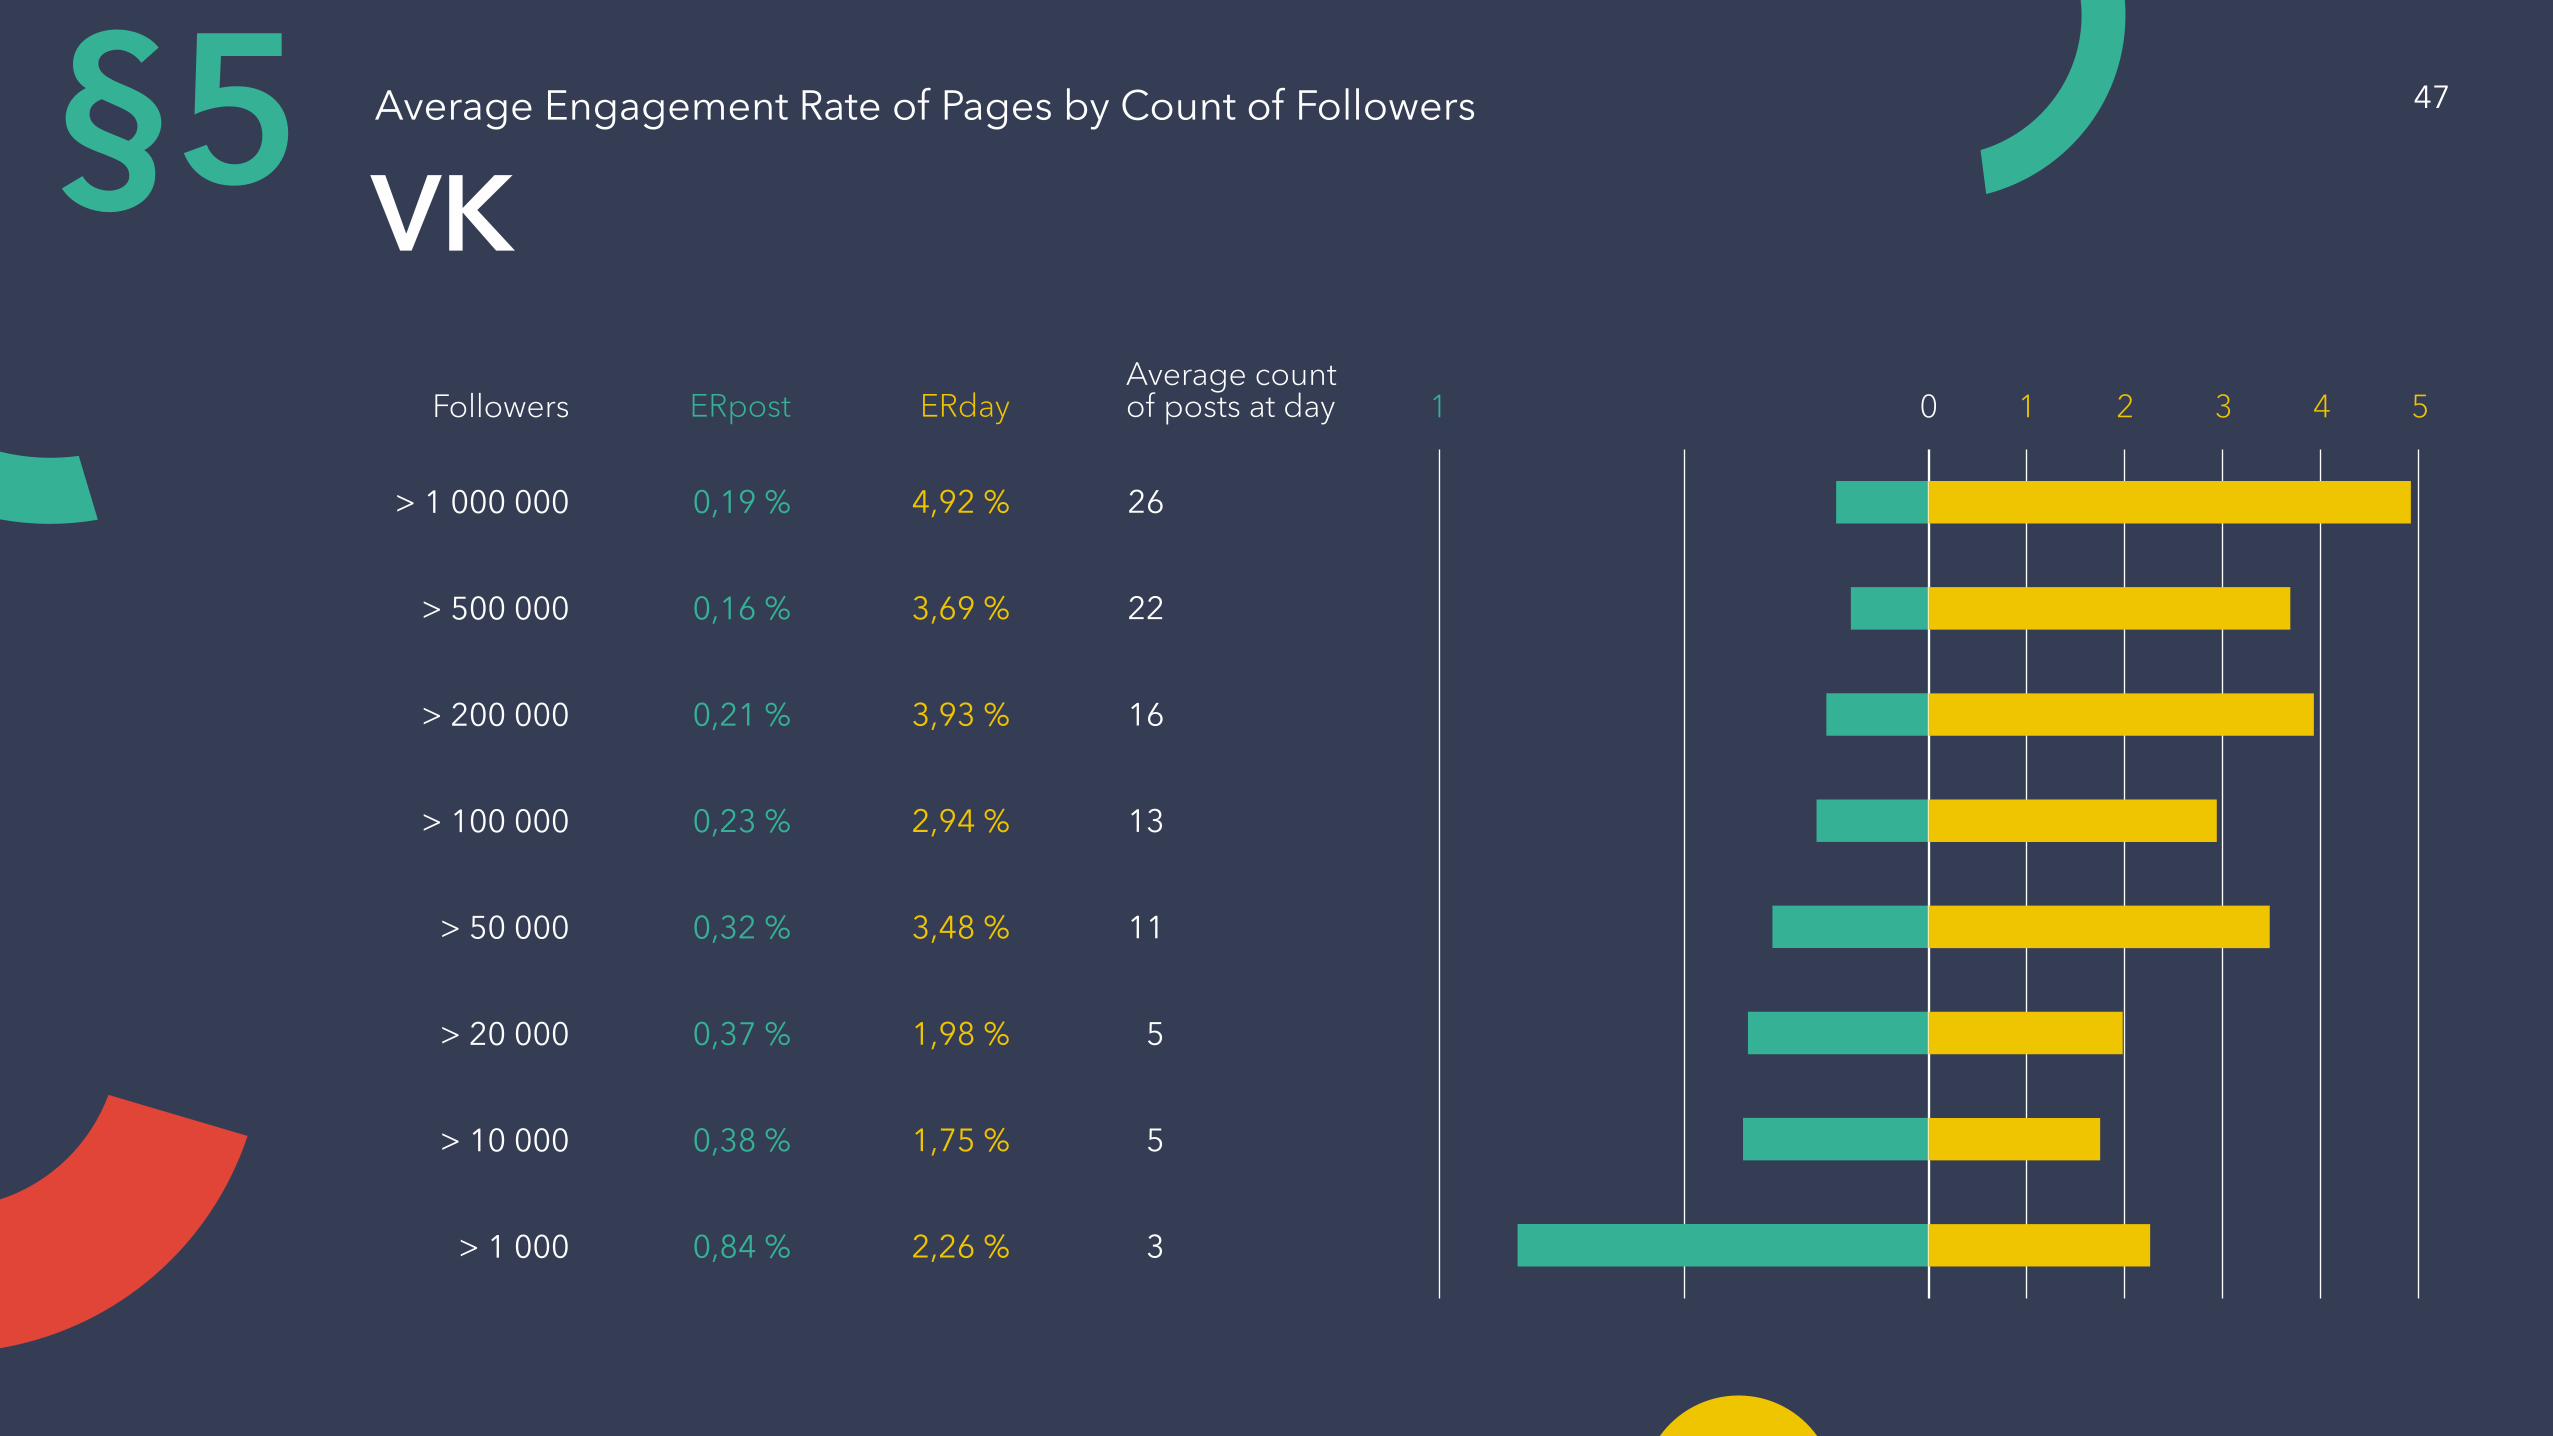
VKAverage Engagement Rate of Pages by Count of Followers§5
> 1 000 000
> 500 000
> 200 000
> 100 000
> 50 000
> 20 000
> 10 000
> 1 000
0,19 %
0,16 %
0,21 %
0,23 %
0,32 %
0,37 %
0,38 %
0,84 %
4,92 %
3,69 %
3,93 %
2,94 %
3,48 %
1,98 %
1,75 %
2,26 %
26
22
16
13
11
5
5
3
ERpost ERdayAverage countof posts at dayFollowers 01 1 2 3 4 5
47
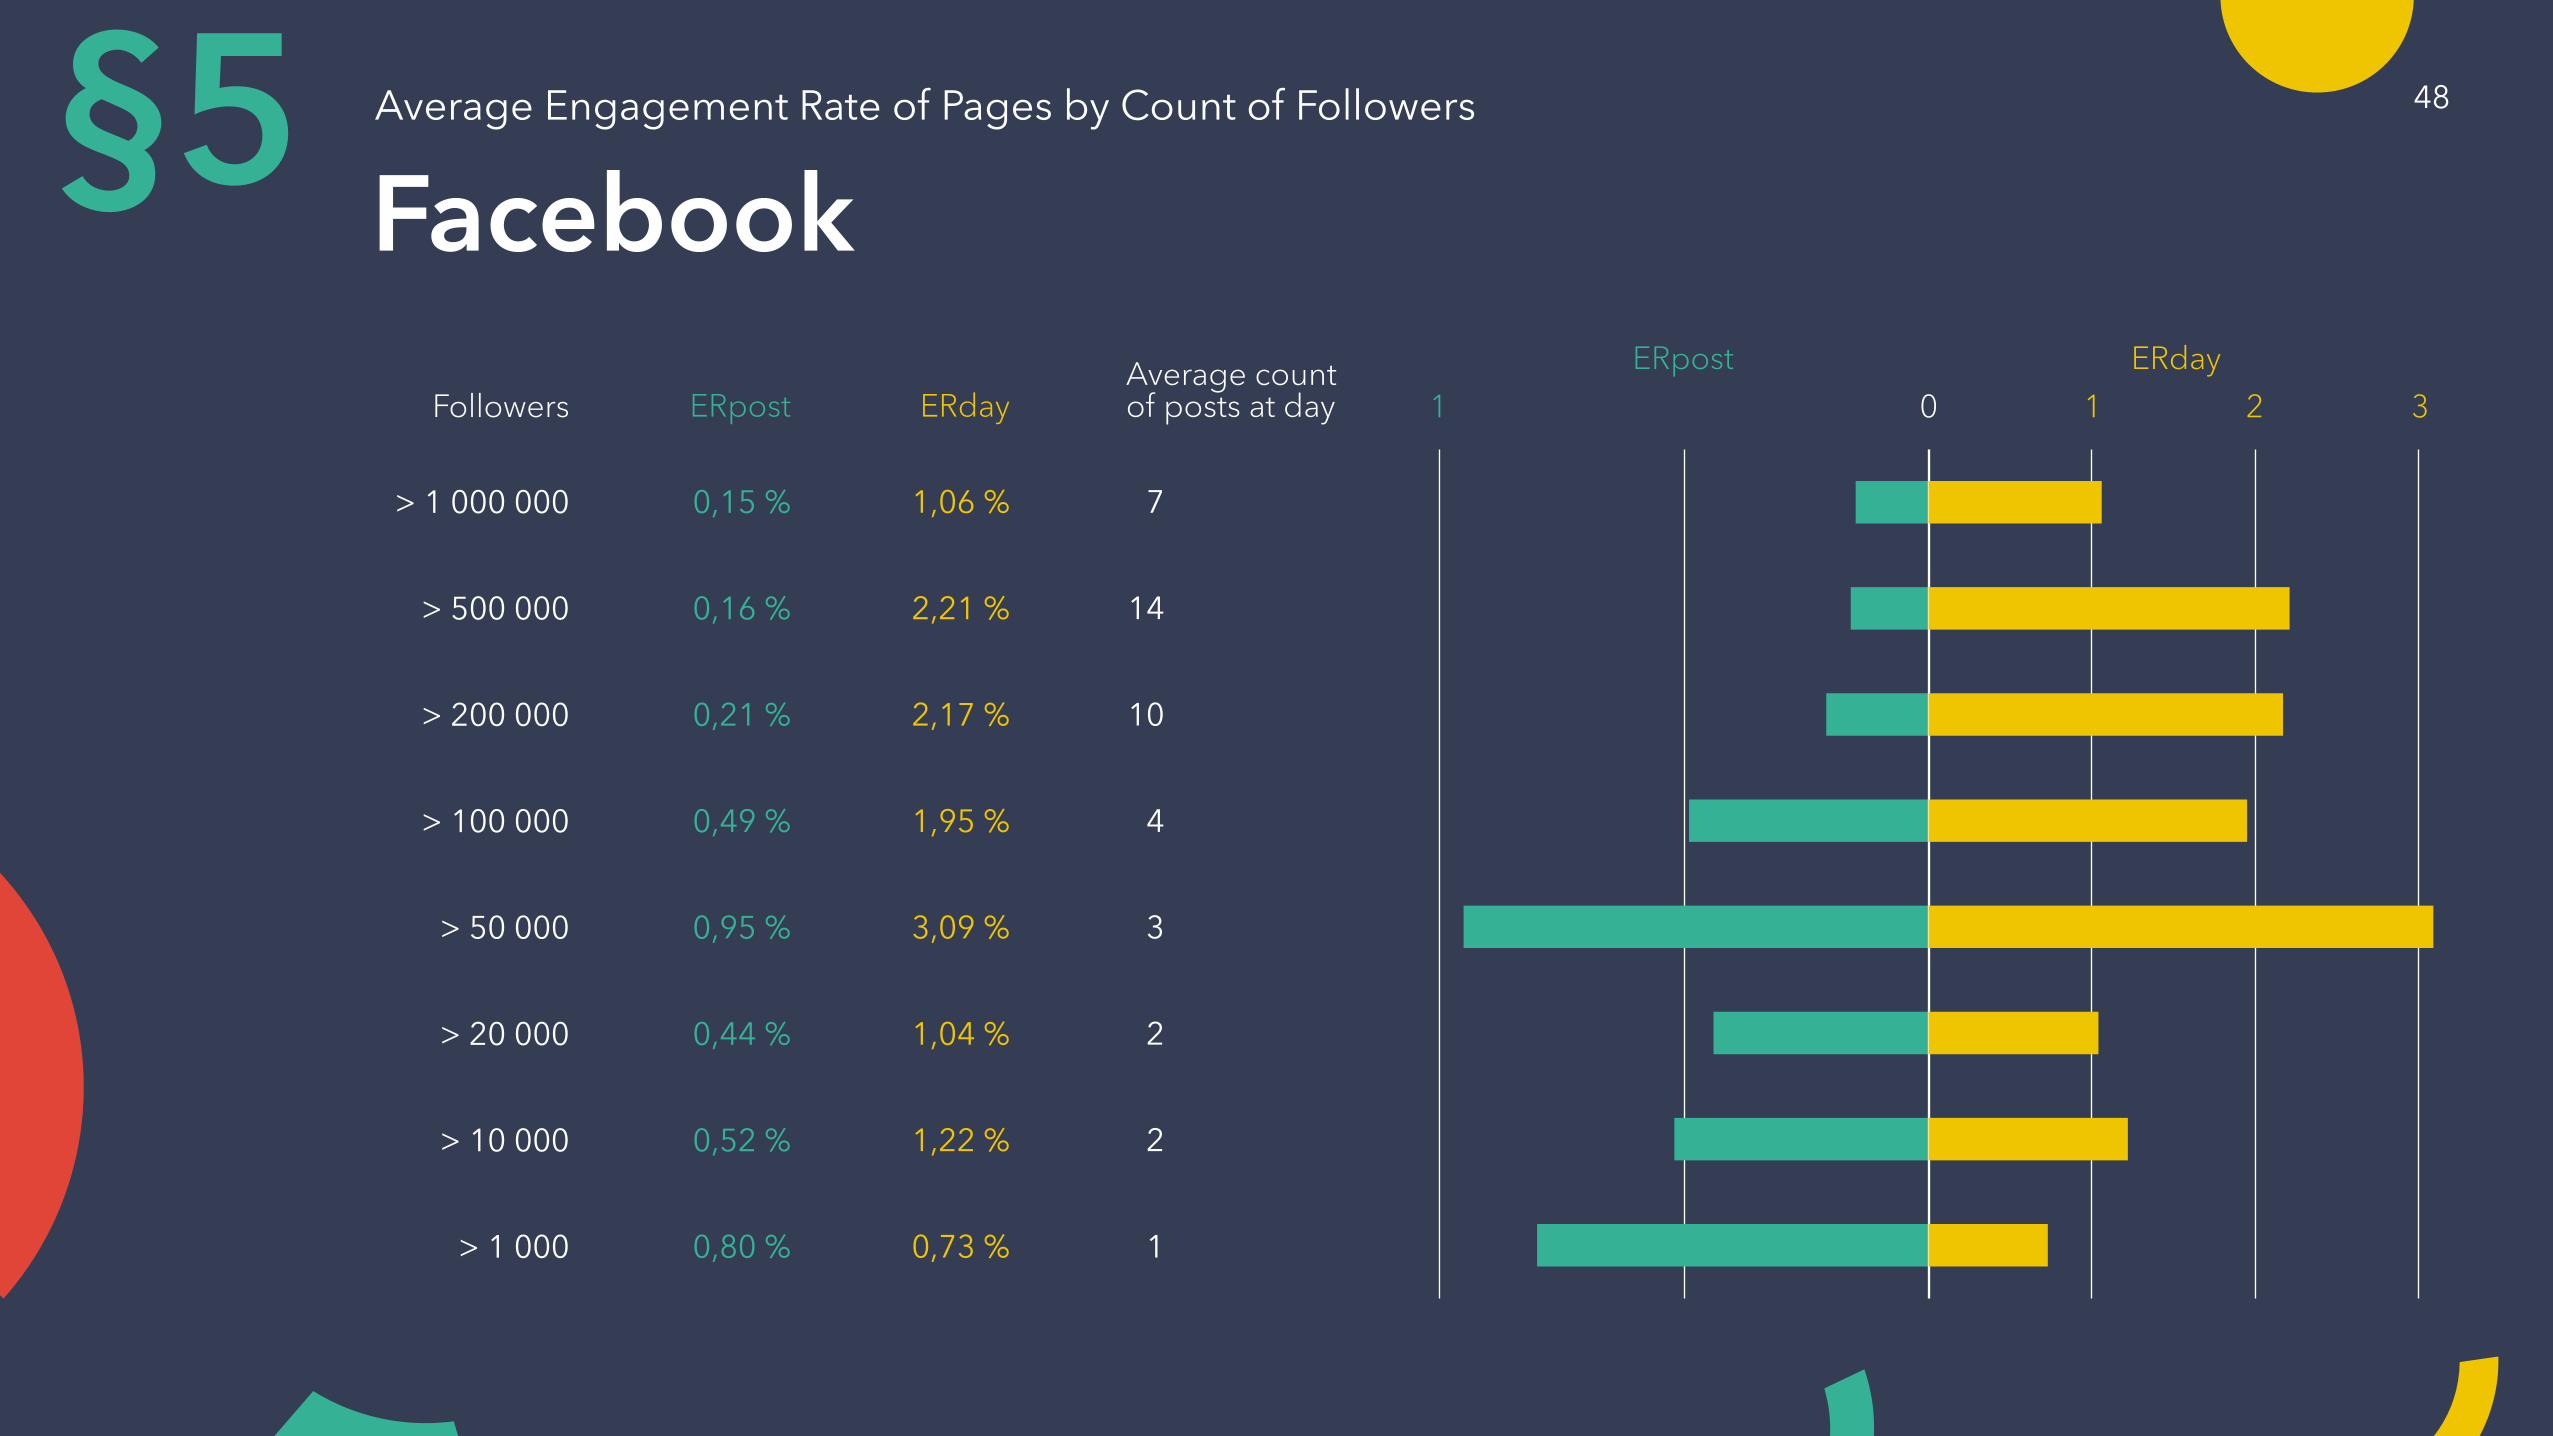
FacebookAverage Engagement Rate of Pages by Count of Followers§5
> 1 000 000
> 500 000
> 200 000
> 100 000
> 50 000
> 20 000
> 10 000
> 1 000
0,15 %
0,16 %
0,21 %
0,49 %
0,95 %
0,44 %
0,52 %
0,80 %
1,06 %
2,21 %
2,17 %
1,95 %
3,09 %
1,04 %
1,22 %
0,73 %
7
14
10
4
3
2
2
1
ERpost ERdayAverage countof posts at dayFollowers
ERpost ERday
01 1 2 3
48
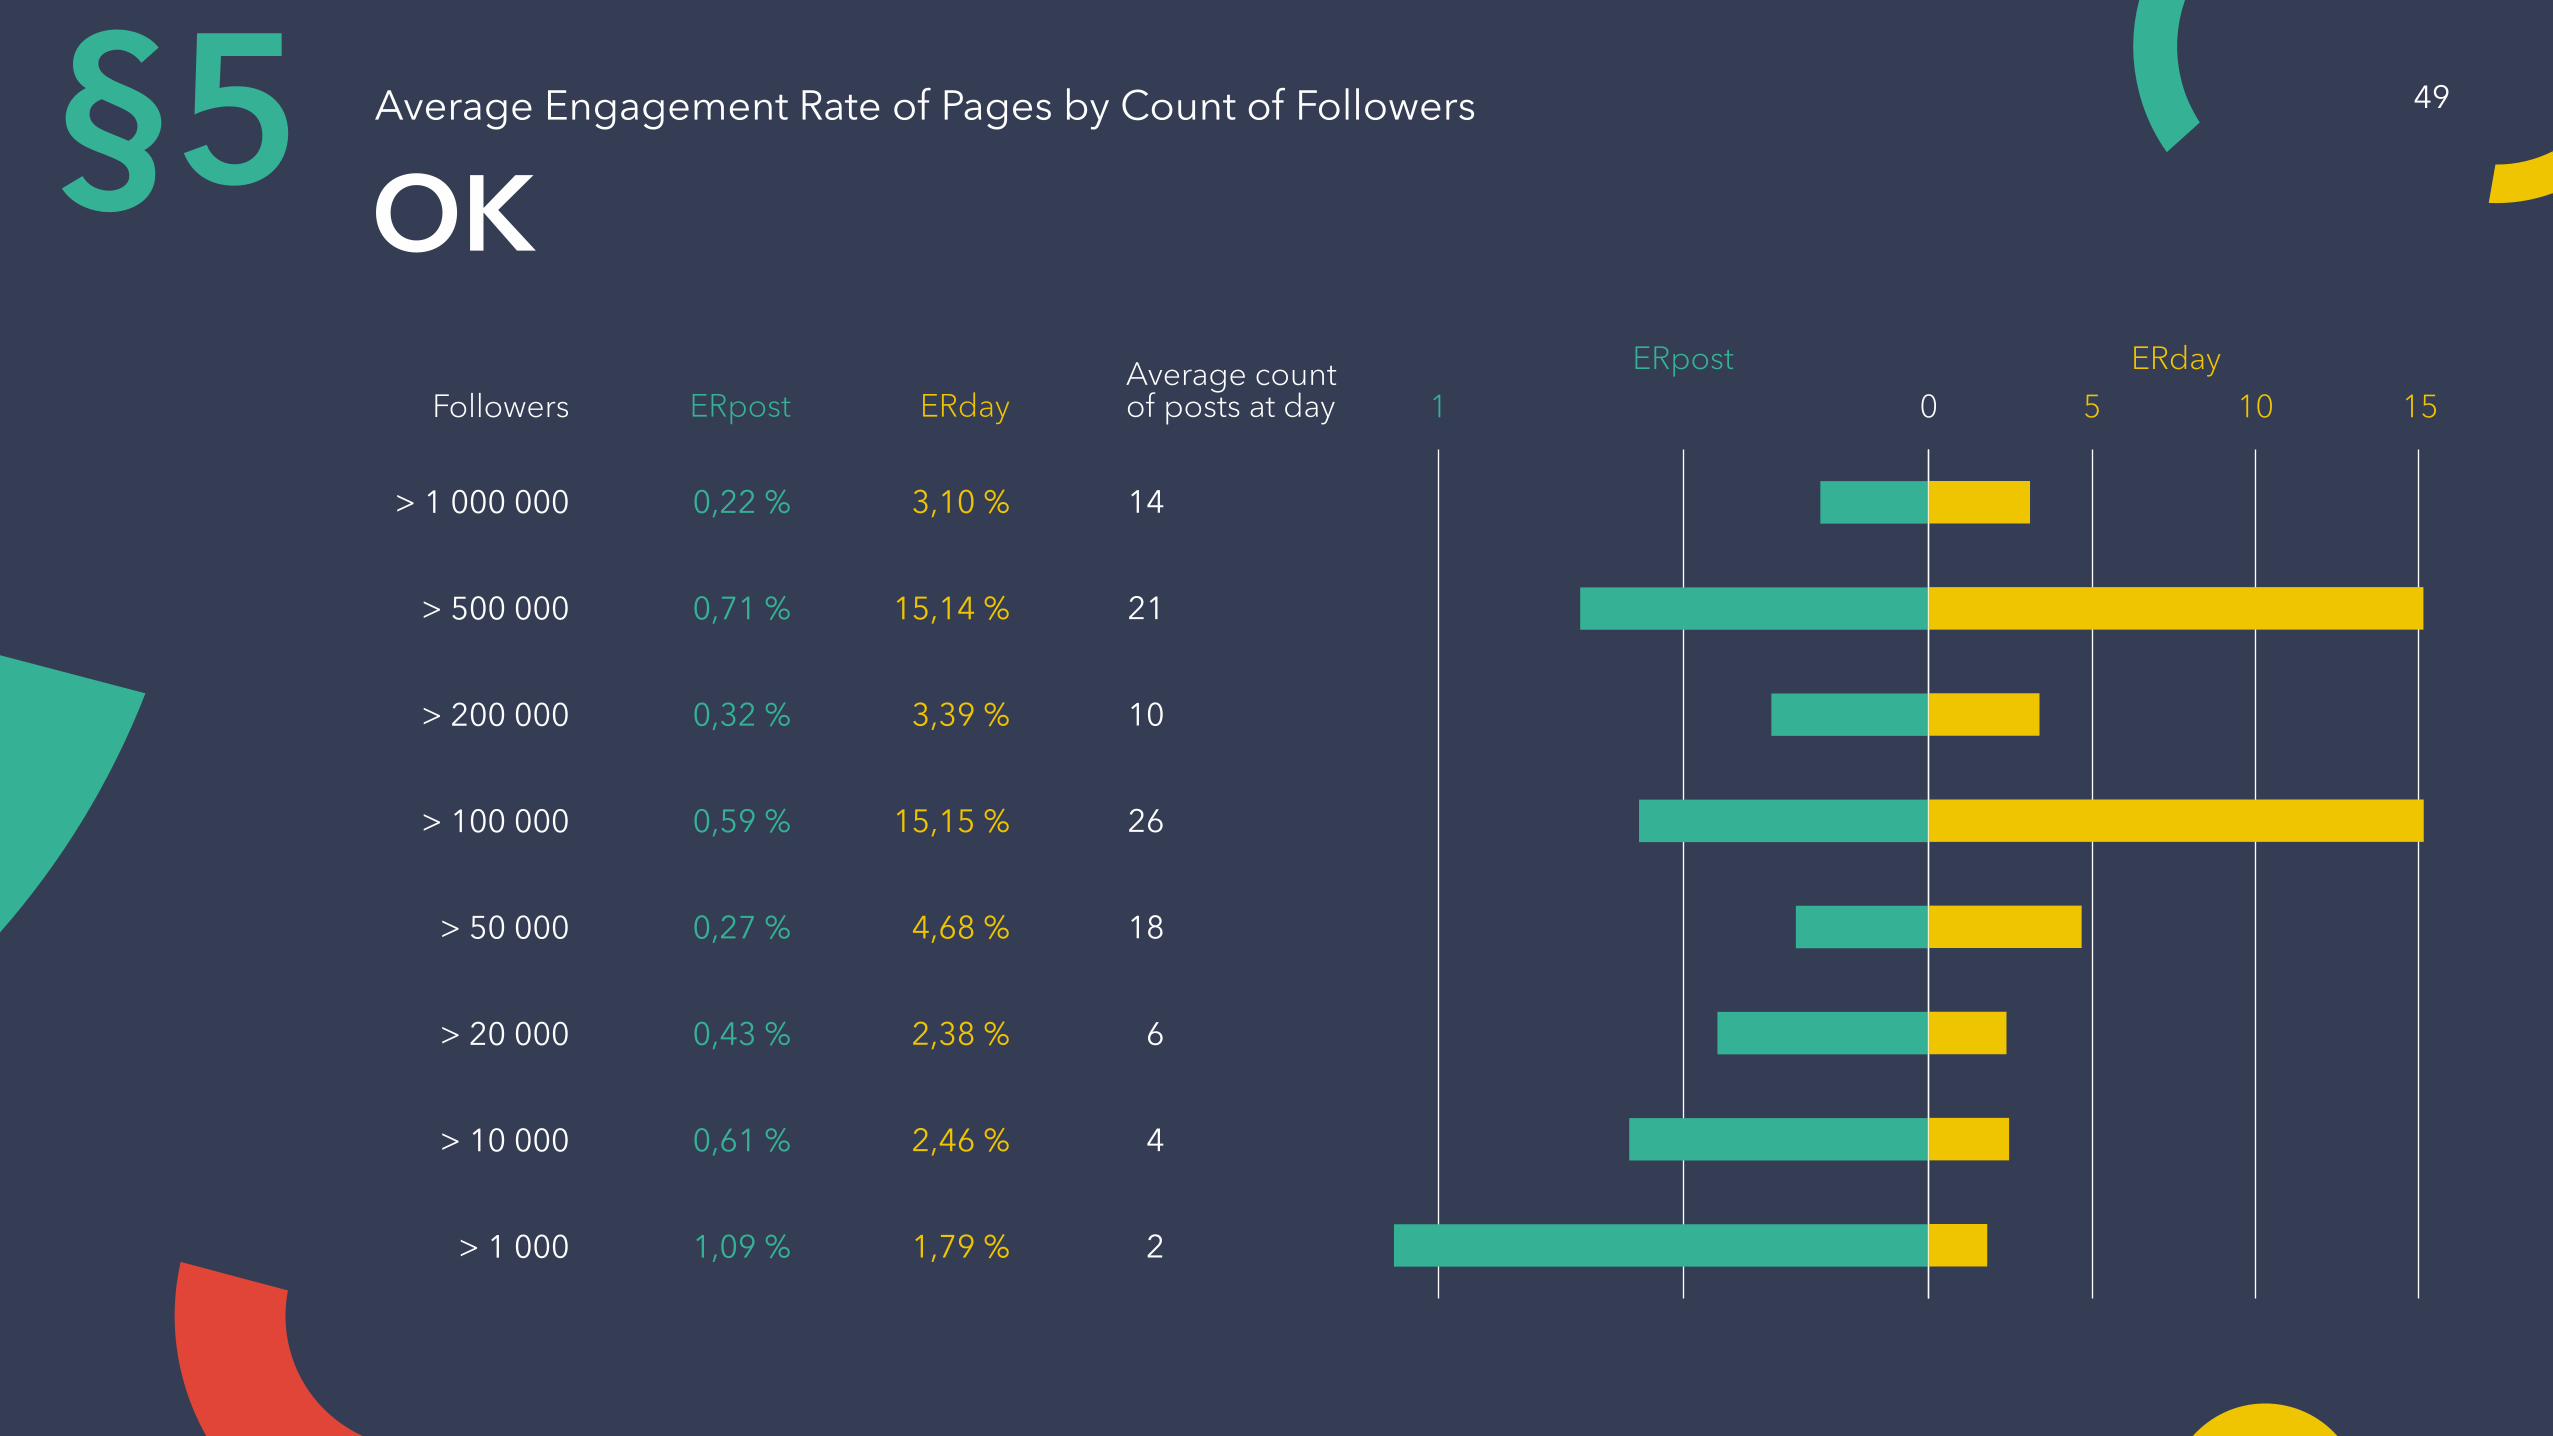
OKAverage Engagement Rate of Pages by Count of Followers§5
> 1 000 000
> 500 000
> 200 000
> 100 000
> 50 000
> 20 000
> 10 000
> 1 000
0,22 %
0,71 %
0,32 %
0,59 %
0,27 %
0,43 %
0,61 %
1,09 %
3,10 %
15,14 %
3,39 %
15,15 %
4,68 %
2,38 %
2,46 %
1,79 %
14
21
10
26
18
6
4
2
ERpost ERdayAverage countof posts at dayFollowers 01 5 10 15
ERpost ERday
49
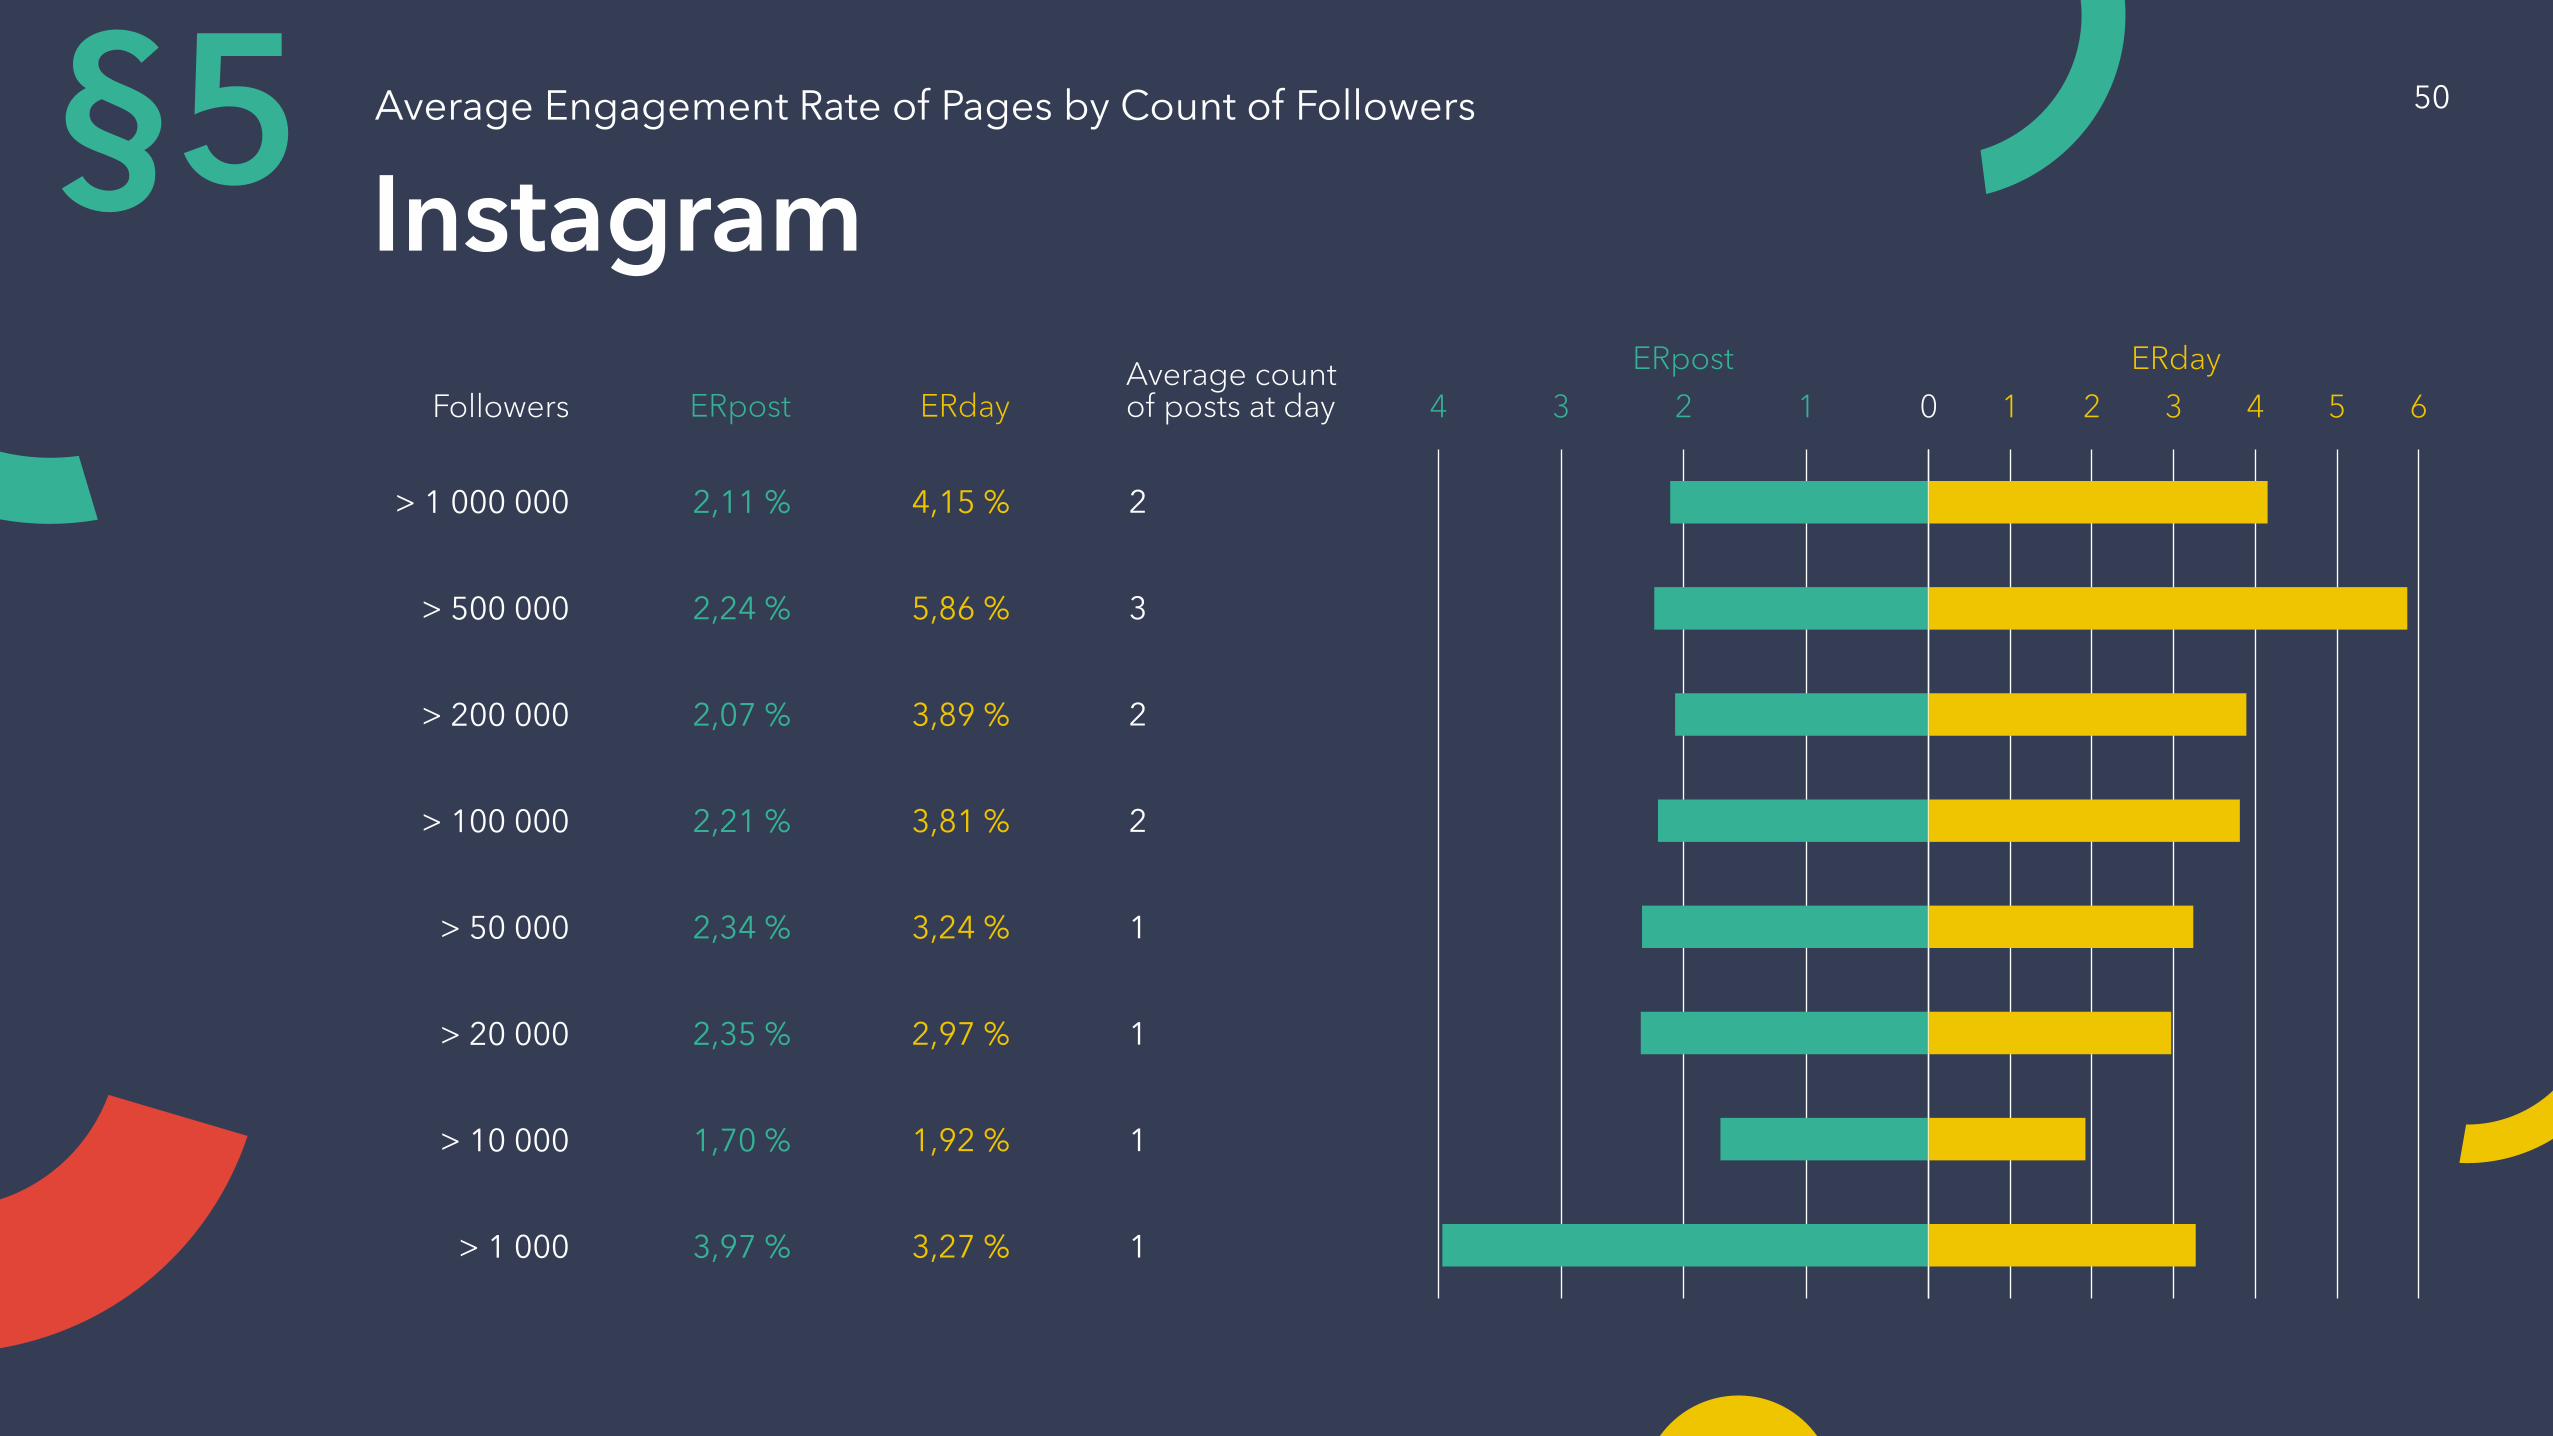
InstagramAverage Engagement Rate of Pages by Count of Followers§5
> 1 000 000
> 500 000
> 200 000
> 100 000
> 50 000
> 20 000
> 10 000
> 1 000
2,11 %
2,24 %
2,07 %
2,21 %
2,34 %
2,35 %
1,70 %
3,97 %
4,15 %
5,86 %
3,89 %
3,81 %
3,24 %
2,97 %
1,92 %
3,27 %
2
3
2
2
1
1
1
1
ERpost ERdayAverage countof posts at dayFollowers 04 3 2 1 1 2 3 4 5 6
ERpost ERday
50

https://popsters.us
Related Documents