Index Insights Characteristics Russell Growth and Value Indexes: the enduring utility of style ftserussell.com 1 1 Data as of December 31, 2019 as reported on April 1, 2020 by eVestment for institutional assets, Morningstar for retail mutual funds, insurance products, and ETFs, and additional passive assets directly collected by FTSE Russell. AUM data includes blended benchmarks and excludes futures and options. AUM data will not include active and passive assets not reported to a 3rd party source or FTSE Russell. Passive assets directly collected by FTSE Russell have been removed from third party sources to prevent double counting. No assurances are given by FTSE Russell as to the accuracy of the data. Introduction In this white paper—the third in a series examining the long history and performance of the Russell US indexes—we focus on the Russell Growth and Value indexes. The Russell Growth and Value indexes were developed by the Frank Russell Company in 1987 to help Russell’s manager research team analyze the investing styles and performance of active asset managers. Since then, the Russell Growth and Value indexes have proven to be useful tools both as benchmarks and as the basis for investment products. As of December 31, 2019, there were $5.7 trillion of active strategies using Russell US Style indexes as performance benchmarks, and $466 billion of passive investment products using Russell US Style indexes as their underlying portfolio, a total of $6.2 trillion in assets benchmarked or tracking the Russell Style suite of indexes. 1 The wide adoption of the Russell US Style indexes led to the launch of the Russell Pure Style indexes in 2015, and in 2019, Russell’s style methodology was applied to the flagship FTSE Global Equity Index Series (FTSE GEIS), extending coverage beyond the US equity market to the large-, mid- and small-cap segments of 49 equity markets globally. The history of their development provides insights into how these indexes have been used, and how they can be used going forward. January 2021 AUTHOR Mark Barnes Head of Investment Research (Americas) +1 212 314 1199 [email protected]

Welcome message from author
This document is posted to help you gain knowledge. Please leave a comment to let me know what you think about it! Share it to your friends and learn new things together.
Transcript
Index Insights
Characteristics
Russell Growth and Value Indexes: the enduring utility of style
ftserussell.com 1
1 Data as of December 31, 2019 as reported on April 1, 2020 by eVestment for institutional assets, Morningstar for retail mutual funds, insurance
products, and ETFs, and additional passive assets directly collected by FTSE Russell. AUM data includes blended benchmarks and excludes futures and options. AUM data will not include active and passive assets not reported to a 3rd party source or FTSE Russell. Passive assets directly collected by FTSE Russell have been removed from third party sources to prevent double counting. No assurances are given by FTSE Russell as to the accuracy of the data.
Introduction In this white paper—the third in a series examining the long history and
performance of the Russell US indexes—we focus on the Russell Growth and
Value indexes.
The Russell Growth and Value indexes were developed by the Frank Russell
Company in 1987 to help Russell’s manager research team analyze the investing
styles and performance of active asset managers. Since then, the Russell Growth
and Value indexes have proven to be useful tools both as benchmarks and as the
basis for investment products.
As of December 31, 2019, there were $5.7 trillion of active strategies using
Russell US Style indexes as performance benchmarks, and $466 billion of
passive investment products using Russell US Style indexes as their underlying
portfolio, a total of $6.2 trillion in assets benchmarked or tracking the Russell Style
suite of indexes.1 The wide adoption of the Russell US Style indexes led to the
launch of the Russell Pure Style indexes in 2015, and in 2019, Russell’s style
methodology was applied to the flagship FTSE Global Equity Index Series (FTSE
GEIS), extending coverage beyond the US equity market to the large-, mid- and
small-cap segments of 49 equity markets globally.
The history of their development provides insights into how these indexes have
been used, and how they can be used going forward.
January 2021
AUTHOR
Mark Barnes
Head of Investment Research
(Americas)
+1 212 314 1199
ftserussell.com 2
Contents Executive summary 3
Style as a benchmark 4
Style as the basis for investment 5
Methodology evolution 5
Measures of growth and value 5
Division methodology refined over time: growth, value or both? 6
Style index performance and characteristics 7
Strategic tilting to styles 7
Performance—Russell 1000 Growth and Value 7
Performance—Russell 2000 Growth and Value 9
Transparency of strategic tilting 12
Tactical tilting to styles 12
Cyclicality 12
Sector composition 15
Transparency of tactical tilting 19
Style vs. Factor Exposures 20
Value style and Value factor 21
The factor exposures of styles 21
Value style index 21
Growth style index 22
Do factors replace styles? 26
Conclusions 27
References 28
ftserussell.com 3
Executive summary When the Russell Style Indexes were developed by the Frank Russell Company in 1987, their
primary objective was to provide appropriate benchmarks for active asset managers. While the
index construction methodology has evolved over time, the usefulness of splitting the market into
growth and value buckets has only increased.
As of December 31, 2019, there were $5.7 trillion of active strategies using Russell US Style
Indexes as performance benchmarks, and $466 billion using them as bases for passive
investment, for a total of $6.2 trillion in benchmarked assets.2
This review of the history and evolution of the Russell US Style indexes highlights some key
findings:
• The first Russell US Style indexes, the Russell 1000 Growth and Value Indexes, were
originally developed to provide appropriate benchmarks for active managers that specialized
in growth or value investing.
• Soon, the indexes became used as basis for passive investment; by splitting the market in
two, investors could fill holes in style allocations when they could not find active managers to
meet their requirements.
• Differences in composition and performance of the indexes led investors to use the style
indexes to implement strategic or tactical tilts away from the market. Because the two sides
always sum up to the overall market, style allocation tilts are fully transparent.
• The more recent focus on factors has not diminished the utility of style indexes as both
benchmarks and transparent style-allocation tools.
2 Data as of December 31, 2019 as reported on April 1, 2020 by eVestment for institutional assets, Morningstar for retail mutual funds, insurance
products, and ETFs, and additional passive assets directly collected by FTSE Russell. AUM data includes blended benchmarks and excludes futures and options. AUM data will not include active and passive assets not reported to a 3rd party source or FTSE Russell. Passive assets directly collected by FTSE Russell have been removed from third party sources to prevent double counting. No assurances are given by FTSE Russell as to the accuracy of the data.
ftserussell.com 4
Style as a benchmark In the mid-1980s, investment management was dominated by active managers, with very little of
the passive investment that has grown to be prevalent today. As a consultant, a major part of
Russell Investments’ mandate was to help clients identify successful active managers. The
concept of using a market capitalization-weighted index as a benchmark against which to
compare the performance of active managers was well accepted.
However, it became increasingly apparent that not all active managers pursued their craft in
similar ways. Some managers were good at pinpointing outperformers among the largest
capitalization stocks for which there was considerable public information, while other managers
were more skilled at sleuthing out obscure opportunities among smaller stocks. Moreover, each
group tended to outperform at different times. Using the same benchmark to compare all
managers was a disservice to both types of managers and was not efficient. To rectify these
issues, Russell launched the Russell 1000 and Russell 2000 indexes in 1984 to more
appropriately segment the broad market into large- and small-cap camps.
However, the differences in manager investment styles did not stop there. Important distinctions
arose even within the large- and small-cap space. Some managers used their analysis and skill to
identify growth stocks, or companies they believed would grow rapidly, and thus generate above-
average returns. Other managers focused on finding value stocks, or companies that appeared
undervalued relative to their longer-term fundamental prospects.
These divisions likely emerged from growing interest in growth and value investing strategies,
supported by investor demand for both styles, as well as from differences in manager skill sets. In
any event, using a common benchmark for these two types of managers resulted in inappropriate
benchmarking, highlighting the need for distinct growth and value indexes.
In the case of small versus large capitalization benchmarks, the index methodology was straight-
forward: a simple process involving ranking companies by size and applying a breakpoint at the
1,000th largest stock was used to divide the market into large- and small-cap size segments, thus
creating the Russell 1000 and Russell 2000 Indexes. Growth and value, however, were different
asset management styles and the breakpoint was not as obvious. One well-known distinction
between the two styles was valuation: growth stocks tended to have a market value that was
expensive relative to their underlying fundamentals, while value stocks tended to be relatively
cheap on that basis. As a result, the first version of the value and growth indexes used the book-
to-price ratio as the dividing metric.3 While this methodology went through several iterations, the
critical concept was that the market was divided into two equal sections.
The introduction of the style benchmarks provided an invaluable tool for consultants who needed
to distinguish between portfolio managers of different types, as well as for investors who needed
to understand how their portfolios are allocated to these basic styles. The introduction of
appropriate benchmarks also enabled active portfolios managers to differentiate skill from the
vagaries of style performance.
3 Cariño (2011).
ftserussell.com 5
Style as the basis for investment One aspect of segmenting the broad market into both the size and style components was its
“completeness.” When investors combined the two together, they regained the original entire
benchmark. This naturally led to using the style indexes as a basis for investment products.
Consider investors who had the total index (e.g., Russell 1000) as a policy benchmark, and a
stable of active managers to implement their investments. As discussed, it was more efficient for
investors to benchmark their value managers to the value index and their growth managers to the
growth index. However, suppose the two investments were unbalanced. For example, suppose
that it was easy to find capacity among good value managers but not among growth managers.
To overcome this imbalance, investors could invest in a portfolio passively tracking the growth
index as a completion sleeve to fill the hole in their portfolio created by the lack of capacity of their
growth managers. Thus, there was demand for style index-tracking investments to retain
exposure to the total benchmark.
This leads to the important observation: the style indexes cannot be used to diversify the portfolio.
Because of the completeness property of the indexes, investing passively with equal allocations
to value and growth creates the same portfolio as investing in the underlying cap-weighted index.
There may be some diversification benefit from dividing active management into the two styles if,
for example, the value-added streams of the two styles are expected to be uncorrelated.
However, while equal allocation to passive style investments is equivalent to investing in the
underlying index, it can serve as the baseline for investors to overweight value or growth to
implement their own strategic or tactical views, as discussed below.
Despite this lack of a diversification benefit, several rationales for investing in style indexes
revolve around the differences between the styles. One obvious motivation would be if an
investor has a long-term or strategic preference for one style or the other. Indeed, it was during
the early 1990s that the first of a series of articles by Fama and French (1992) emphasized the
expected long-term outperformance of value stocks. Another, more tactical, rationale is if an
investor has a view that one style will outperform over a certain period. This timing rationale has
led to considerable research around when and why one style has tended to outperform the other
at different points in the market cycle. In the next sections, we examine the performance
characteristics of the growth and value indexes to gain insight into why investors might use these
investments tactically.
Methodology evolution
Measures of growth and value
Russell conducted extensive research to determine the best characteristic for delineating growth
from value stocks. The goal was to propose a simple and transparent methodology that
objectively distinguished between these two types of managers. The goal of the indexes was not
to represent a specific growth or value strategy, but rather to provide an objective representation
of the universe from which active growth and value managers make their portfolio selections. In
order to fulfill this goal, the indexes were tested to determine whether they reflected fundamental
characteristics and performance patterns of managers classified as growth or value.
ftserussell.com 6
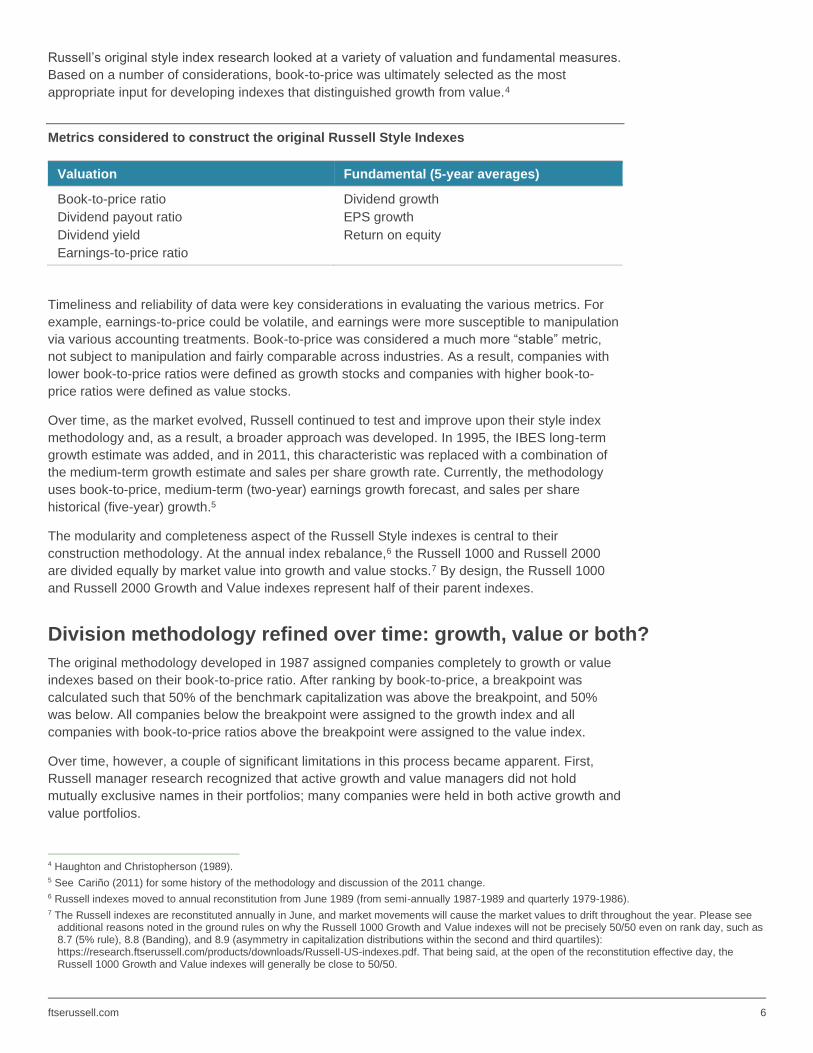
Russell’s original style index research looked at a variety of valuation and fundamental measures.
Based on a number of considerations, book-to-price was ultimately selected as the most
appropriate input for developing indexes that distinguished growth from value.4
Metrics considered to construct the original Russell Style Indexes
Valuation Fundamental (5-year averages)
Book-to-price ratio
Dividend payout ratio
Dividend yield
Earnings-to-price ratio
Dividend growth
EPS growth
Return on equity
Timeliness and reliability of data were key considerations in evaluating the various metrics. For
example, earnings-to-price could be volatile, and earnings were more susceptible to manipulation
via various accounting treatments. Book-to-price was considered a much more “stable” metric,
not subject to manipulation and fairly comparable across industries. As a result, companies with
lower book-to-price ratios were defined as growth stocks and companies with higher book-to-
price ratios were defined as value stocks.
Over time, as the market evolved, Russell continued to test and improve upon their style index
methodology and, as a result, a broader approach was developed. In 1995, the IBES long-term
growth estimate was added, and in 2011, this characteristic was replaced with a combination of
the medium-term growth estimate and sales per share growth rate. Currently, the methodology
uses book-to-price, medium-term (two-year) earnings growth forecast, and sales per share
historical (five-year) growth.5
The modularity and completeness aspect of the Russell Style indexes is central to their
construction methodology. At the annual index rebalance,6 the Russell 1000 and Russell 2000
are divided equally by market value into growth and value stocks.7 By design, the Russell 1000
and Russell 2000 Growth and Value indexes represent half of their parent indexes.
Division methodology refined over time: growth, value or both?
The original methodology developed in 1987 assigned companies completely to growth or value
indexes based on their book-to-price ratio. After ranking by book-to-price, a breakpoint was
calculated such that 50% of the benchmark capitalization was above the breakpoint, and 50%
was below. All companies below the breakpoint were assigned to the growth index and all
companies with book-to-price ratios above the breakpoint were assigned to the value index.
Over time, however, a couple of significant limitations in this process became apparent. First,
Russell manager research recognized that active growth and value managers did not hold
mutually exclusive names in their portfolios; many companies were held in both active growth and
value portfolios.
4 Haughton and Christopherson (1989). 5 See Cariño (2011) for some history of the methodology and discussion of the 2011 change. 6 Russell indexes moved to annual reconstitution from June 1989 (from semi-annually 1987-1989 and quarterly 1979-1986). 7 The Russell indexes are reconstituted annually in June, and market movements will cause the market values to drift throughout the year. Please see
additional reasons noted in the ground rules on why the Russell 1000 Growth and Value indexes will not be precisely 50/50 even on rank day, such as 8.7 (5% rule), 8.8 (Banding), and 8.9 (asymmetry in capitalization distributions within the second and third quartiles): https://research.ftserussell.com/products/downloads/Russell-US-indexes.pdf. That being said, at the open of the reconstitution effective day, the Russell 1000 Growth and Value indexes will generally be close to 50/50.
ftserussell.com 7
Second, for investors managing portfolios passively against the indexes, this model could cause
substantial turnover at rebalancing, particularly if a large company shifted from one index to the
other. In that case, the entire market value of the stock would be removed from one style index
and added to the other to preserve the balance in market value, even if that stock’s valuation
measures had not changed.
In 1993, Russell modified the methodology to include companies on a pro rata basis in both the
growth and value indexes. This meant that from June 1995, Russell 1000 companies were
assigned a growth and value weight and could be in both indexes (versus single designation of
growth or value); the Russell 2000 Growth and Value indexes adopted this approach historically
back to their inception date of December 31, 1978, from their launch in 1993.
After that change, a stock with a valuation score at the breakpoint would be assigned 50% to the
growth index and 50% to the value index. Around the breakpoint there was an overlap region in
which stocks were assigned to both growth and value categories, with their market value divided
based upon their relative style score (e.g., 75% growth/25% value). Above some threshold,
stocks with high valuations would be assigned 100% to the growth index and would have no
weight in the value index, and vice versa for low-valuation stocks. On average, roughly 30% of
companies in the Russell 1000 are in the overlap region and, therefore, are in both the growth
and value indexes, while the remaining 70% are assigned to be either all growth or all value. This
enhancement proved to be much more reflective of active manager behavior and dramatically
reduced the amount of turnover at rebalancing.
Additionally, banding between the growth and value indexes was introduced in June 2011 at the
annual reconstitution to reduce turnover,8 which is now +/-0.10 of the Composite Value Score if
the company remains in the same core index (Russell 1000 or Russell 2000).9 The banding
methodology has proved to reduce turnover caused by smaller, less meaningful movements while
continuing to allow the larger, more meaningful changes to occur, signaling a true change in the
company’s growth or value characteristics relative to the market.
Style index performance and characteristics While the original purpose of the Russell US Style indexes was to allow portfolio managers to be
characterized and benchmarked based on their active management style, a role soon developed
for using these indexes as the basis of passive investments. Initially, the two style indexes were
used as structural portfolio completion tools that allowed investors to maintain balanced
allocations to the market. However, as differences in performance emerged between the styles,
investors realized they could use these indexes to implement unbalanced allocations based on
their strategic or tactical views.
Strategic tilting to styles
Performance—Russell 1000 Growth and Value
An investor who prefers a certain style can adopt a strategic tilt toward that style. To get an idea
of the long-term differences between the performance of the style indexes, we reviewed the 41-
year performance history of the indexes from January 1979 through December 2019. Chart 1
shows the cumulative return of the Russell 1000 Value and Growth Indexes for the entire period,
using a log scale.
8 See Cariño (2011). 9 https://research.ftserussell.com/products/downloads/Russell-US-indexes.pdf
ftserussell.com 8
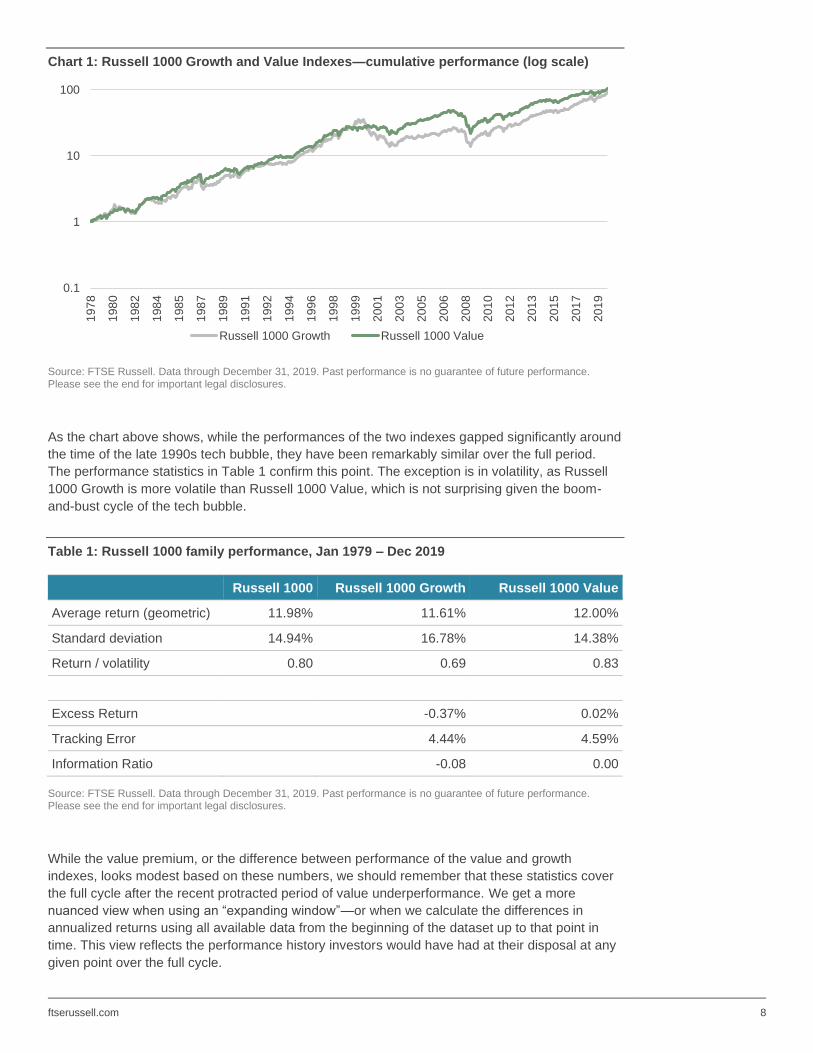
Chart 1: Russell 1000 Growth and Value Indexes—cumulative performance (log scale)
Source: FTSE Russell. Data through December 31, 2019. Past performance is no guarantee of future performance. Please see the end for important legal disclosures.
As the chart above shows, while the performances of the two indexes gapped significantly around
the time of the late 1990s tech bubble, they have been remarkably similar over the full period.
The performance statistics in Table 1 confirm this point. The exception is in volatility, as Russell
1000 Growth is more volatile than Russell 1000 Value, which is not surprising given the boom-
and-bust cycle of the tech bubble.
Table 1: Russell 1000 family performance, Jan 1979 – Dec 2019
Russell 1000 Russell 1000 Growth Russell 1000 Value
Average return (geometric) 11.98% 11.61% 12.00%
Standard deviation 14.94% 16.78% 14.38%
Return / volatility 0.80 0.69 0.83
Excess Return -0.37% 0.02%
Tracking Error 4.44% 4.59%
Information Ratio -0.08 0.00
Source: FTSE Russell. Data through December 31, 2019. Past performance is no guarantee of future performance. Please see the end for important legal disclosures.
While the value premium, or the difference between performance of the value and growth
indexes, looks modest based on these numbers, we should remember that these statistics cover
the full cycle after the recent protracted period of value underperformance. We get a more
nuanced view when using an “expanding window”—or when we calculate the differences in
annualized returns using all available data from the beginning of the dataset up to that point in
time. This view reflects the performance history investors would have had at their disposal at any
given point over the full cycle.
0.1
1
10
1001
97
8
198
0
198
2
198
4
198
5
198
7
198
9
199
1
199
2
199
4
199
6
199
8
199
9
200
1
200
3
200
5
200
6
200
8
201
0
201
2
201
3
201
5
201
7
201
9
Russell 1000 Growth Russell 1000 Value
ftserussell.com 9
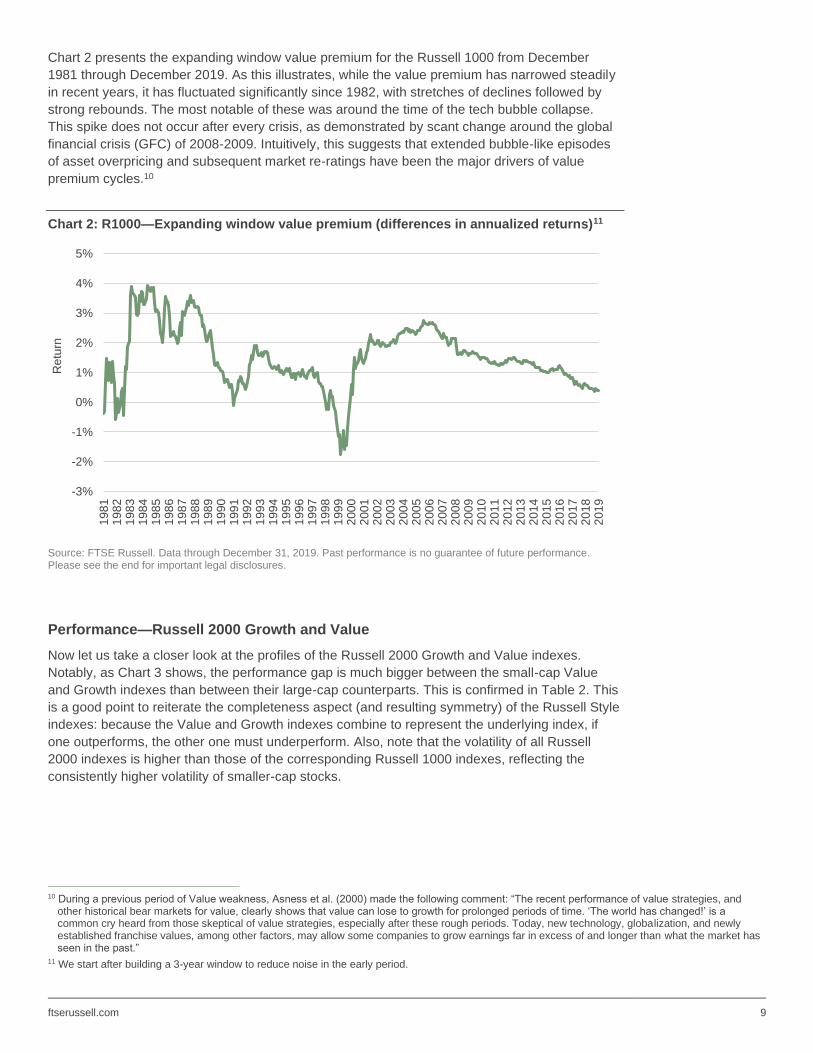
Chart 2 presents the expanding window value premium for the Russell 1000 from December
1981 through December 2019. As this illustrates, while the value premium has narrowed steadily
in recent years, it has fluctuated significantly since 1982, with stretches of declines followed by
strong rebounds. The most notable of these was around the time of the tech bubble collapse.
This spike does not occur after every crisis, as demonstrated by scant change around the global
financial crisis (GFC) of 2008-2009. Intuitively, this suggests that extended bubble-like episodes
of asset overpricing and subsequent market re-ratings have been the major drivers of value
premium cycles.10
Chart 2: R1000—Expanding window value premium (differences in annualized returns)11
Source: FTSE Russell. Data through December 31, 2019. Past performance is no guarantee of future performance. Please see the end for important legal disclosures.
Performance—Russell 2000 Growth and Value
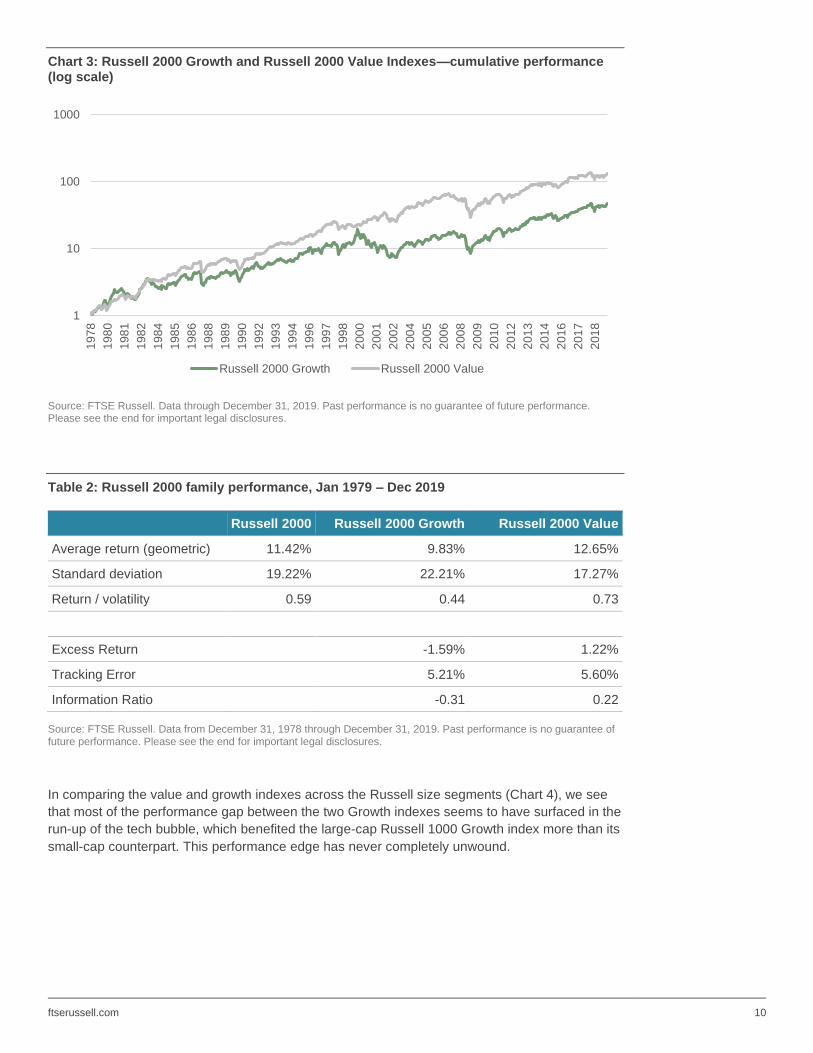
Now let us take a closer look at the profiles of the Russell 2000 Growth and Value indexes.
Notably, as Chart 3 shows, the performance gap is much bigger between the small-cap Value
and Growth indexes than between their large-cap counterparts. This is confirmed in Table 2. This
is a good point to reiterate the completeness aspect (and resulting symmetry) of the Russell Style
indexes: because the Value and Growth indexes combine to represent the underlying index, if
one outperforms, the other one must underperform. Also, note that the volatility of all Russell
2000 indexes is higher than those of the corresponding Russell 1000 indexes, reflecting the
consistently higher volatility of smaller-cap stocks.
10 During a previous period of Value weakness, Asness et al. (2000) made the following comment: “The recent performance of value strategies, and
other historical bear markets for value, clearly shows that value can lose to growth for prolonged periods of time. ‘The world has changed!’ is a common cry heard from those skeptical of value strategies, especially after these rough periods. Today, new technology, globalization, and newly established franchise values, among other factors, may allow some companies to grow earnings far in excess of and longer than what the market has seen in the past.”
11 We start after building a 3-year window to reduce noise in the early period.
-3%
-2%
-1%
0%
1%
2%
3%
4%
5%
198
11
98
21
98
31
98
41
98
51
98
61
98
71
98
81
98
91
99
01
99
11
99
21
99
31
99
41
99
51
99
61
99
71
99
81
99
92
00
02
00
12
00
22
00
32
00
42
00
52
00
62
00
72
00
82
00
92
01
02
01
12
01
22
01
32
01
42
01
52
01
62
01
72
01
82
01
9
Re
turn
ftserussell.com 10
Chart 3: Russell 2000 Growth and Russell 2000 Value Indexes—cumulative performance (log scale)
Source: FTSE Russell. Data through December 31, 2019. Past performance is no guarantee of future performance. Please see the end for important legal disclosures.
Table 2: Russell 2000 family performance, Jan 1979 – Dec 2019
Russell 2000 Russell 2000 Growth Russell 2000 Value
Average return (geometric) 11.42% 9.83% 12.65%
Standard deviation 19.22% 22.21% 17.27%
Return / volatility 0.59 0.44 0.73
Excess Return -1.59% 1.22%
Tracking Error 5.21% 5.60%
Information Ratio -0.31 0.22
Source: FTSE Russell. Data from December 31, 1978 through December 31, 2019. Past performance is no guarantee of future performance. Please see the end for important legal disclosures.
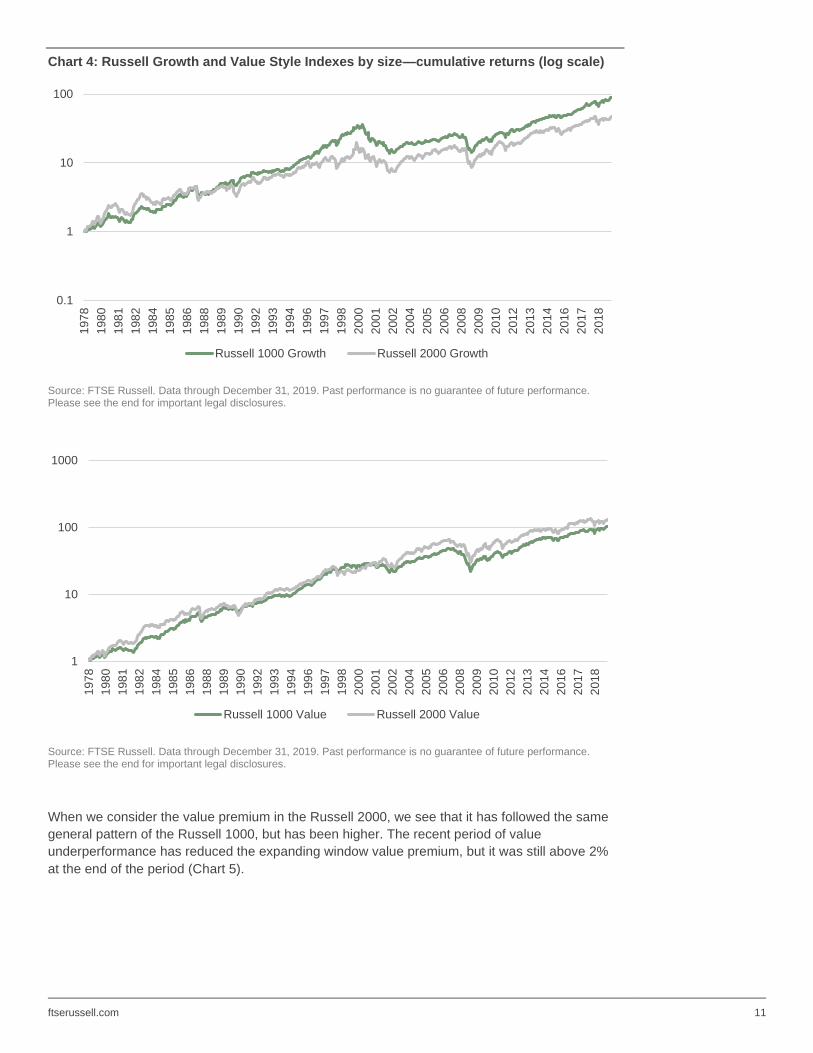
In comparing the value and growth indexes across the Russell size segments (Chart 4), we see
that most of the performance gap between the two Growth indexes seems to have surfaced in the
run-up of the tech bubble, which benefited the large-cap Russell 1000 Growth index more than its
small-cap counterpart. This performance edge has never completely unwound.
1
10
100
1000
197
8
198
0
198
1
198
2
198
4
198
5
198
6
198
8
198
9
199
0
199
2
199
3
199
4
199
6
199
7
199
8
200
0
200
1
200
2
200
4
200
5
200
6
200
8
200
9
201
0
201
2
201
3
201
4
201
6
201
7
201
8
Russell 2000 Growth Russell 2000 Value
ftserussell.com 11
Chart 4: Russell Growth and Value Style Indexes by size—cumulative returns (log scale)
Source: FTSE Russell. Data through December 31, 2019. Past performance is no guarantee of future performance. Please see the end for important legal disclosures.
Source: FTSE Russell. Data through December 31, 2019. Past performance is no guarantee of future performance. Please see the end for important legal disclosures.
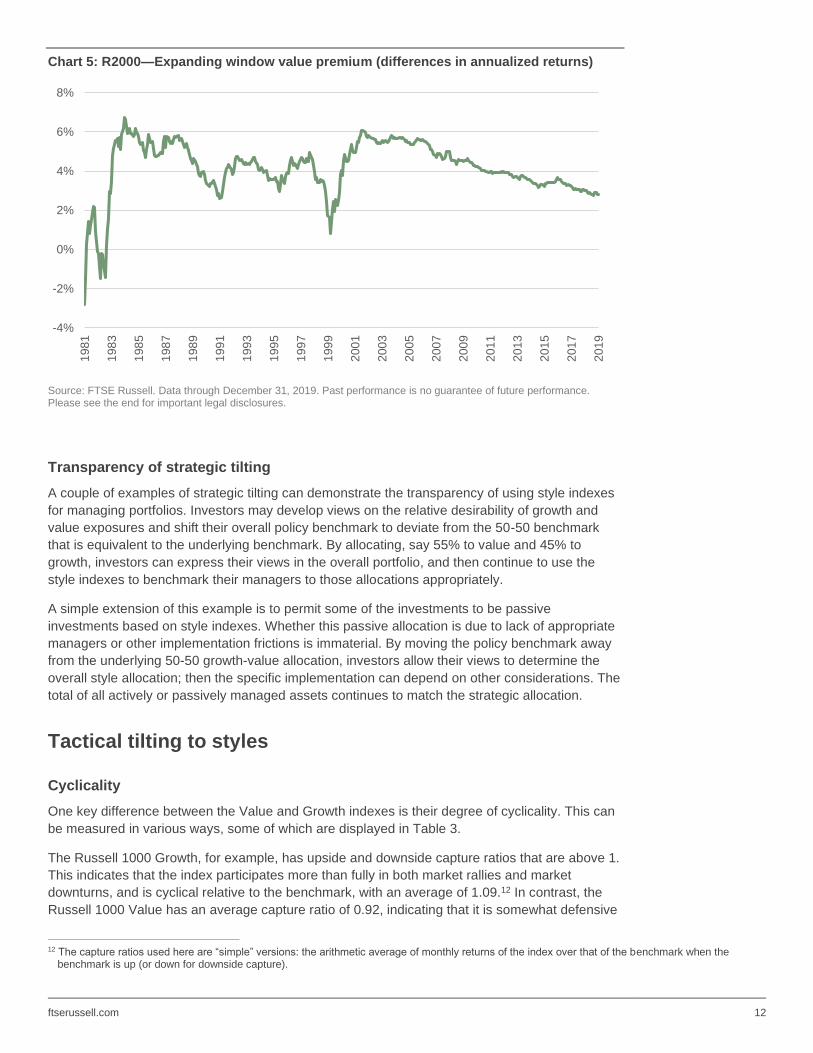
When we consider the value premium in the Russell 2000, we see that it has followed the same
general pattern of the Russell 1000, but has been higher. The recent period of value
underperformance has reduced the expanding window value premium, but it was still above 2%
at the end of the period (Chart 5).
0.1
1
10
1001
97
8
198
0
198
1
198
2
198
4
198
5
198
6
198
8
198
9
199
0
199
2
199
3
199
4
199
6
199
7
199
8
200
0
200
1
200
2
200
4
200
5
200
6
200
8
200
9
201
0
201
2
201
3
201
4
201
6
201
7
201
8
Russell 1000 Growth Russell 2000 Growth
1
10
100
1000
197
8
198
0
198
1
198
2
198
4
198
5
198
6
198
8
198
9
199
0
199
2
199
3
199
4
199
6
199
7
199
8
200
0
200
1
200
2
200
4
200
5
200
6
200
8
200
9
201
0
201
2
201
3
201
4
201
6
201
7
201
8
Russell 1000 Value Russell 2000 Value
ftserussell.com 12
Chart 5: R2000—Expanding window value premium (differences in annualized returns)
Source: FTSE Russell. Data through December 31, 2019. Past performance is no guarantee of future performance. Please see the end for important legal disclosures.
Transparency of strategic tilting
A couple of examples of strategic tilting can demonstrate the transparency of using style indexes
for managing portfolios. Investors may develop views on the relative desirability of growth and
value exposures and shift their overall policy benchmark to deviate from the 50-50 benchmark
that is equivalent to the underlying benchmark. By allocating, say 55% to value and 45% to
growth, investors can express their views in the overall portfolio, and then continue to use the
style indexes to benchmark their managers to those allocations appropriately.
A simple extension of this example is to permit some of the investments to be passive
investments based on style indexes. Whether this passive allocation is due to lack of appropriate
managers or other implementation frictions is immaterial. By moving the policy benchmark away
from the underlying 50-50 growth-value allocation, investors allow their views to determine the
overall style allocation; then the specific implementation can depend on other considerations. The
total of all actively or passively managed assets continues to match the strategic allocation.
Tactical tilting to styles
Cyclicality
One key difference between the Value and Growth indexes is their degree of cyclicality. This can
be measured in various ways, some of which are displayed in Table 3.
The Russell 1000 Growth, for example, has upside and downside capture ratios that are above 1.
This indicates that the index participates more than fully in both market rallies and market
downturns, and is cyclical relative to the benchmark, with an average of 1.09.12 In contrast, the
Russell 1000 Value has an average capture ratio of 0.92, indicating that it is somewhat defensive
12 The capture ratios used here are “simple” versions: the arithmetic average of monthly returns of the index over that of the benchmark when the
benchmark is up (or down for downside capture).
-4%
-2%
0%
2%
4%
6%
8%1
98
1
198
3
198
5
198
7
198
9
199
1
199
3
199
5
199
7
199
9
200
1
200
3
200
5
200
7
200
9
201
1
201
3
201
5
201
7
201
9
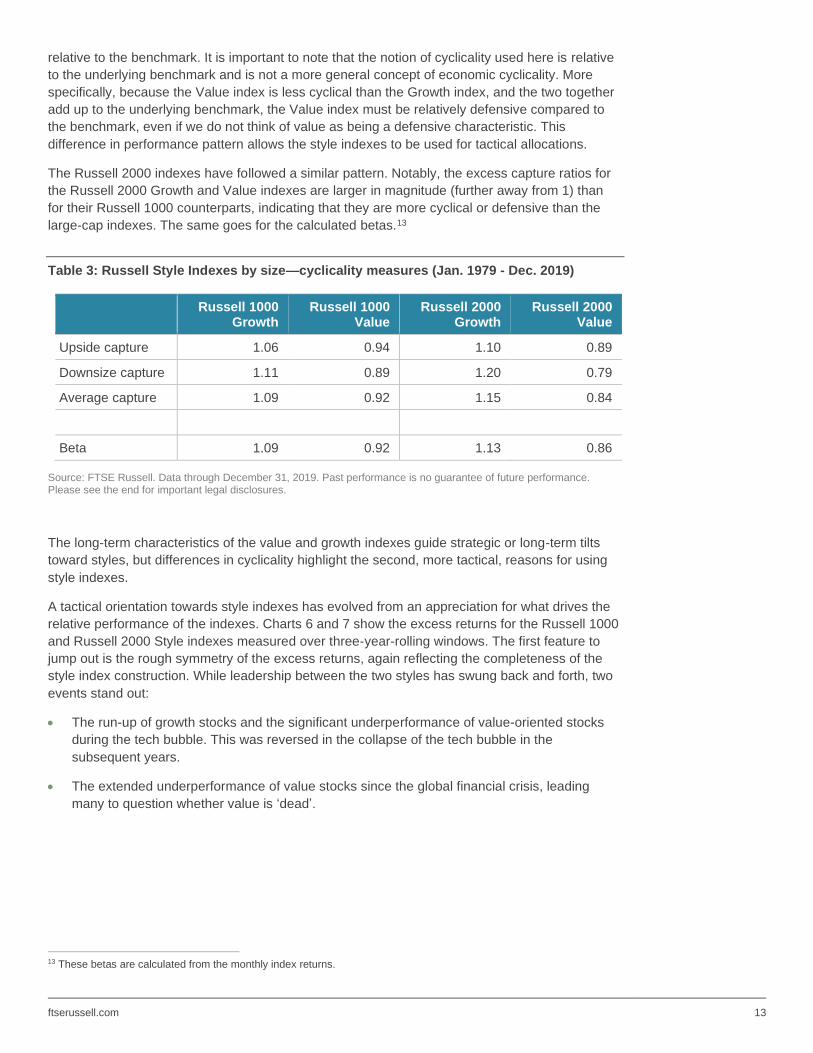
ftserussell.com 13
relative to the benchmark. It is important to note that the notion of cyclicality used here is relative
to the underlying benchmark and is not a more general concept of economic cyclicality. More
specifically, because the Value index is less cyclical than the Growth index, and the two together
add up to the underlying benchmark, the Value index must be relatively defensive compared to
the benchmark, even if we do not think of value as being a defensive characteristic. This
difference in performance pattern allows the style indexes to be used for tactical allocations.
The Russell 2000 indexes have followed a similar pattern. Notably, the excess capture ratios for
the Russell 2000 Growth and Value indexes are larger in magnitude (further away from 1) than
for their Russell 1000 counterparts, indicating that they are more cyclical or defensive than the
large-cap indexes. The same goes for the calculated betas.13
Table 3: Russell Style Indexes by size—cyclicality measures (Jan. 1979 - Dec. 2019)
Russell 1000
Growth Russell 1000
Value Russell 2000
Growth Russell 2000
Value
Upside capture 1.06 0.94 1.10 0.89
Downsize capture 1.11 0.89 1.20 0.79
Average capture 1.09 0.92 1.15 0.84
Beta 1.09 0.92 1.13 0.86
Source: FTSE Russell. Data through December 31, 2019. Past performance is no guarantee of future performance. Please see the end for important legal disclosures.
The long-term characteristics of the value and growth indexes guide strategic or long-term tilts
toward styles, but differences in cyclicality highlight the second, more tactical, reasons for using
style indexes.
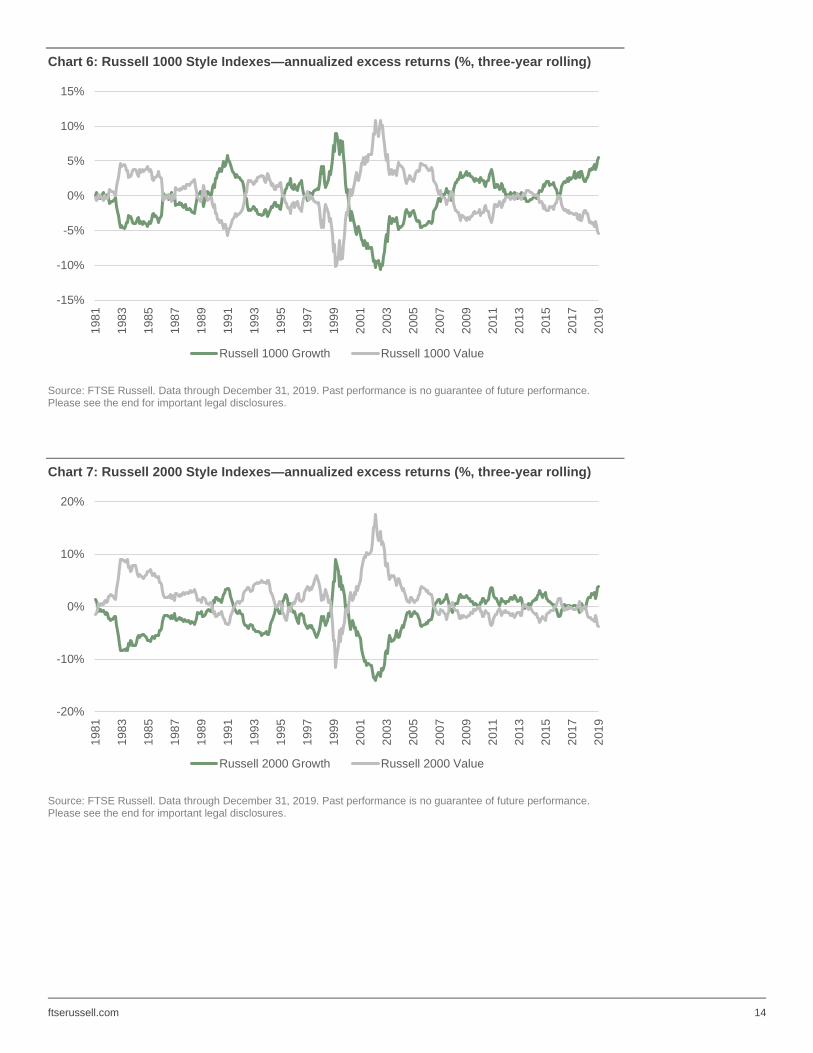
A tactical orientation towards style indexes has evolved from an appreciation for what drives the
relative performance of the indexes. Charts 6 and 7 show the excess returns for the Russell 1000
and Russell 2000 Style indexes measured over three-year-rolling windows. The first feature to
jump out is the rough symmetry of the excess returns, again reflecting the completeness of the
style index construction. While leadership between the two styles has swung back and forth, two
events stand out:
• The run-up of growth stocks and the significant underperformance of value-oriented stocks
during the tech bubble. This was reversed in the collapse of the tech bubble in the
subsequent years.
• The extended underperformance of value stocks since the global financial crisis, leading
many to question whether value is ‘dead’.
13 These betas are calculated from the monthly index returns.
ftserussell.com 14
Chart 6: Russell 1000 Style Indexes—annualized excess returns (%, three-year rolling)
Source: FTSE Russell. Data through December 31, 2019. Past performance is no guarantee of future performance. Please see the end for important legal disclosures.
Chart 7: Russell 2000 Style Indexes—annualized excess returns (%, three-year rolling)
Source: FTSE Russell. Data through December 31, 2019. Past performance is no guarantee of future performance. Please see the end for important legal disclosures.
-15%
-10%
-5%
0%
5%
10%
15%1
98
1
198
3
198
5
198
7
198
9
199
1
199
3
199
5
199
7
199
9
200
1
200
3
200
5
200
7
200
9
201
1
201
3
201
5
201
7
201
9
Russell 1000 Growth Russell 1000 Value
-20%
-10%
0%
10%
20%
198
1
198
3
198
5
198
7
198
9
199
1
199
3
199
5
199
7
199
9
200
1
200
3
200
5
200
7
200
9
201
1
201
3
201
5
201
7
201
9
Russell 2000 Growth Russell 2000 Value
ftserussell.com 15
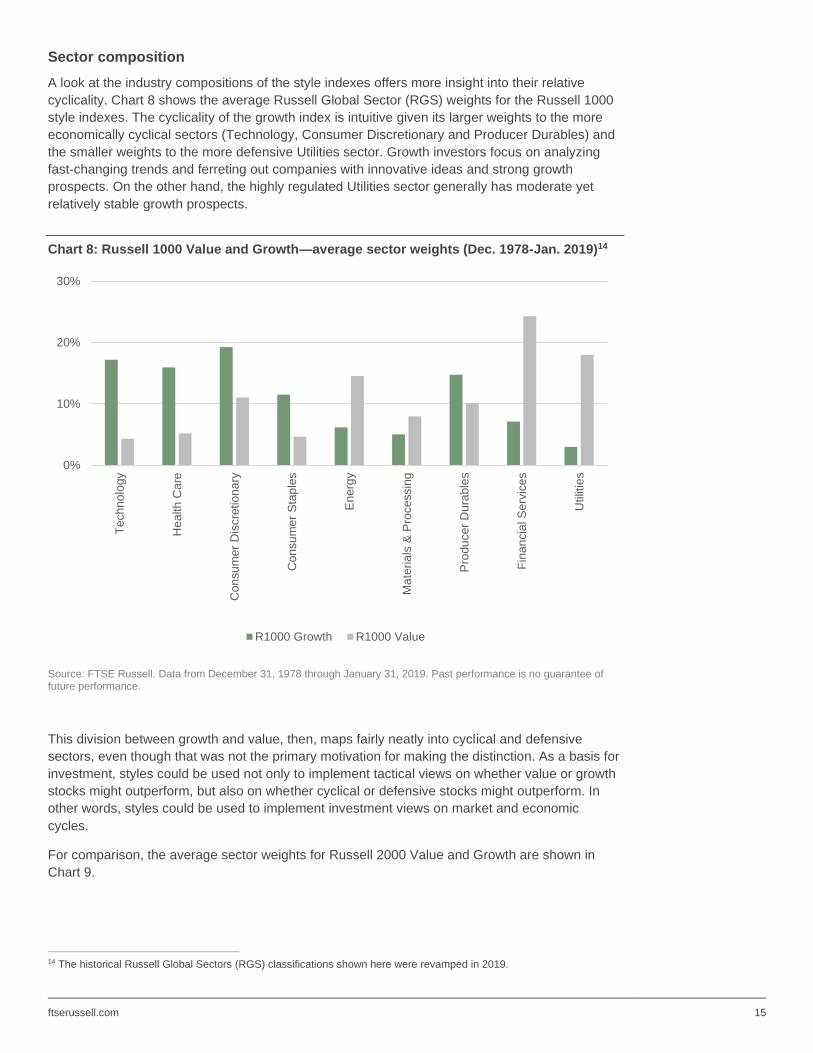
Sector composition
A look at the industry compositions of the style indexes offers more insight into their relative
cyclicality. Chart 8 shows the average Russell Global Sector (RGS) weights for the Russell 1000
style indexes. The cyclicality of the growth index is intuitive given its larger weights to the more
economically cyclical sectors (Technology, Consumer Discretionary and Producer Durables) and
the smaller weights to the more defensive Utilities sector. Growth investors focus on analyzing
fast-changing trends and ferreting out companies with innovative ideas and strong growth
prospects. On the other hand, the highly regulated Utilities sector generally has moderate yet
relatively stable growth prospects.
Chart 8: Russell 1000 Value and Growth—average sector weights (Dec. 1978-Jan. 2019)14
Source: FTSE Russell. Data from December 31, 1978 through January 31, 2019. Past performance is no guarantee of future performance.
This division between growth and value, then, maps fairly neatly into cyclical and defensive
sectors, even though that was not the primary motivation for making the distinction. As a basis for
investment, styles could be used not only to implement tactical views on whether value or growth
stocks might outperform, but also on whether cyclical or defensive stocks might outperform. In
other words, styles could be used to implement investment views on market and economic
cycles.
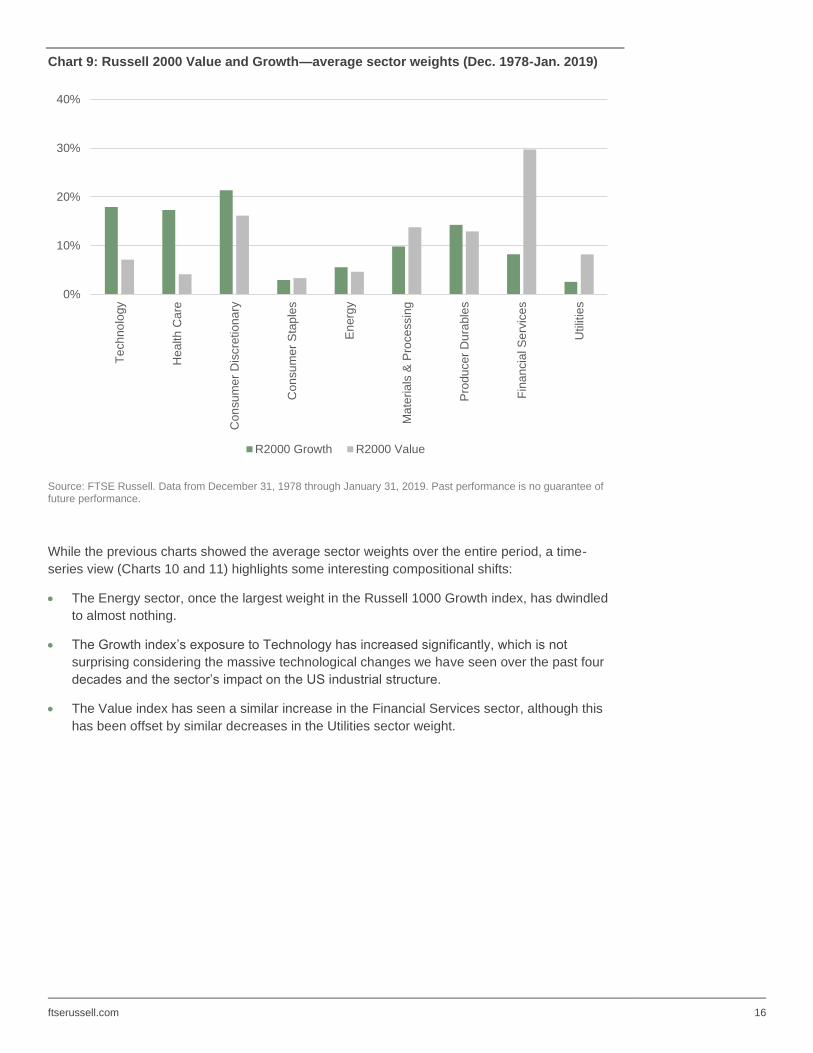
For comparison, the average sector weights for Russell 2000 Value and Growth are shown in
Chart 9.
14 The historical Russell Global Sectors (RGS) classifications shown here were revamped in 2019.
0%
10%
20%
30%
Te
ch
no
logy
Hea
lth
Ca
re
Co
nsu
me
r D
iscre
tion
ary
Con
su
me
r S
tap
les
En
erg
y
Ma
teria
ls &
Pro
ce
ssin
g
Pro
du
cer
Du
rable
s
Fin
an
cia
l S
erv
ice
s
Utilit
ies
R1000 Growth R1000 Value
ftserussell.com 16
Chart 9: Russell 2000 Value and Growth—average sector weights (Dec. 1978-Jan. 2019)
Source: FTSE Russell. Data from December 31, 1978 through January 31, 2019. Past performance is no guarantee of future performance.
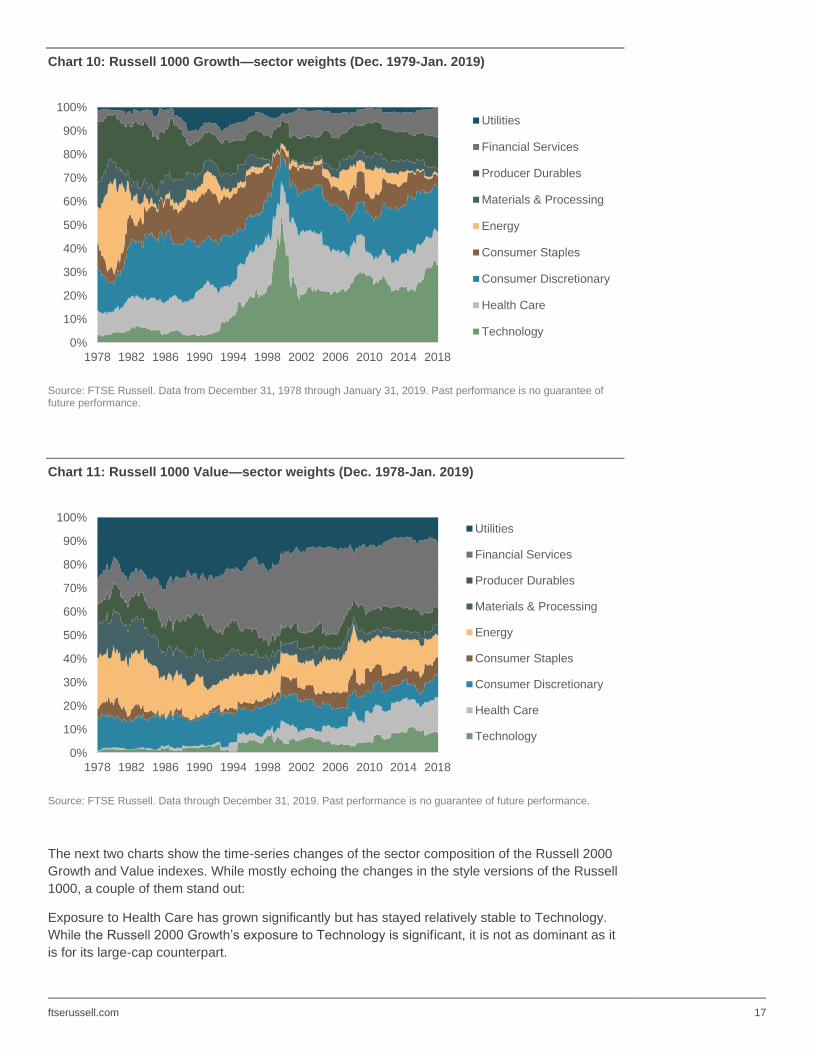
While the previous charts showed the average sector weights over the entire period, a time-
series view (Charts 10 and 11) highlights some interesting compositional shifts:
• The Energy sector, once the largest weight in the Russell 1000 Growth index, has dwindled
to almost nothing.
• The Growth index’s exposure to Technology has increased significantly, which is not
surprising considering the massive technological changes we have seen over the past four
decades and the sector’s impact on the US industrial structure.
• The Value index has seen a similar increase in the Financial Services sector, although this
has been offset by similar decreases in the Utilities sector weight.
0%
10%
20%
30%
40%
Te
ch
no
logy
He
alth
Ca
re
Co
nsu
me
r D
iscre
tion
ary
Con
su
me
r S
tap
les
En
erg
y
Ma
teria
ls &
Pro
ce
ssin
g
Pro
du
cer
Du
rable
s
Fin
an
cia
l S
erv
ice
s
Utilit
ies
R2000 Growth R2000 Value
ftserussell.com 17
Chart 10: Russell 1000 Growth—sector weights (Dec. 1979-Jan. 2019)
Source: FTSE Russell. Data from December 31, 1978 through January 31, 2019. Past performance is no guarantee of future performance.
Chart 11: Russell 1000 Value—sector weights (Dec. 1978-Jan. 2019)
Source: FTSE Russell. Data through December 31, 2019. Past performance is no guarantee of future performance.
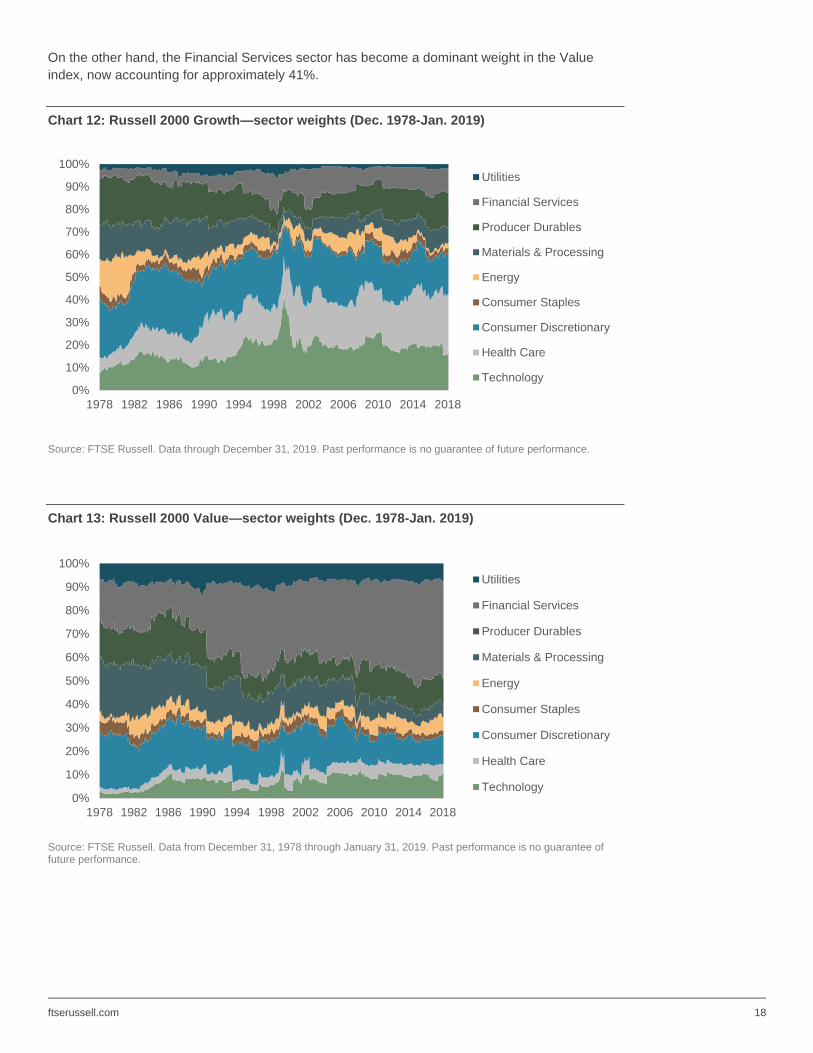
The next two charts show the time-series changes of the sector composition of the Russell 2000
Growth and Value indexes. While mostly echoing the changes in the style versions of the Russell
1000, a couple of them stand out:
Exposure to Health Care has grown significantly but has stayed relatively stable to Technology.
While the Russell 2000 Growth’s exposure to Technology is significant, it is not as dominant as it
is for its large-cap counterpart.
0%
10%
20%
30%
40%
50%
60%
70%
80%
90%
100%
1978 1982 1986 1990 1994 1998 2002 2006 2010 2014 2018
Utilities
Financial Services
Producer Durables
Materials & Processing
Energy
Consumer Staples
Consumer Discretionary
Health Care
Technology
0%
10%
20%
30%
40%
50%
60%
70%
80%
90%
100%
1978 1982 1986 1990 1994 1998 2002 2006 2010 2014 2018
Utilities
Financial Services
Producer Durables
Materials & Processing
Energy
Consumer Staples
Consumer Discretionary
Health Care
Technology
ftserussell.com 18
On the other hand, the Financial Services sector has become a dominant weight in the Value
index, now accounting for approximately 41%.
Chart 12: Russell 2000 Growth—sector weights (Dec. 1978-Jan. 2019)
Source: FTSE Russell. Data through December 31, 2019. Past performance is no guarantee of future performance.
Chart 13: Russell 2000 Value—sector weights (Dec. 1978-Jan. 2019)
Source: FTSE Russell. Data from December 31, 1978 through January 31, 2019. Past performance is no guarantee of future performance.
0%
10%
20%
30%
40%
50%
60%
70%
80%
90%
100%
1978 1982 1986 1990 1994 1998 2002 2006 2010 2014 2018
Utilities
Financial Services
Producer Durables
Materials & Processing
Energy
Consumer Staples
Consumer Discretionary
Health Care
Technology
0%
10%
20%
30%
40%
50%
60%
70%
80%
90%
100%
1978 1982 1986 1990 1994 1998 2002 2006 2010 2014 2018
Utilities
Financial Services
Producer Durables
Materials & Processing
Energy
Consumer Staples
Consumer Discretionary
Health Care
Technology
ftserussell.com 19
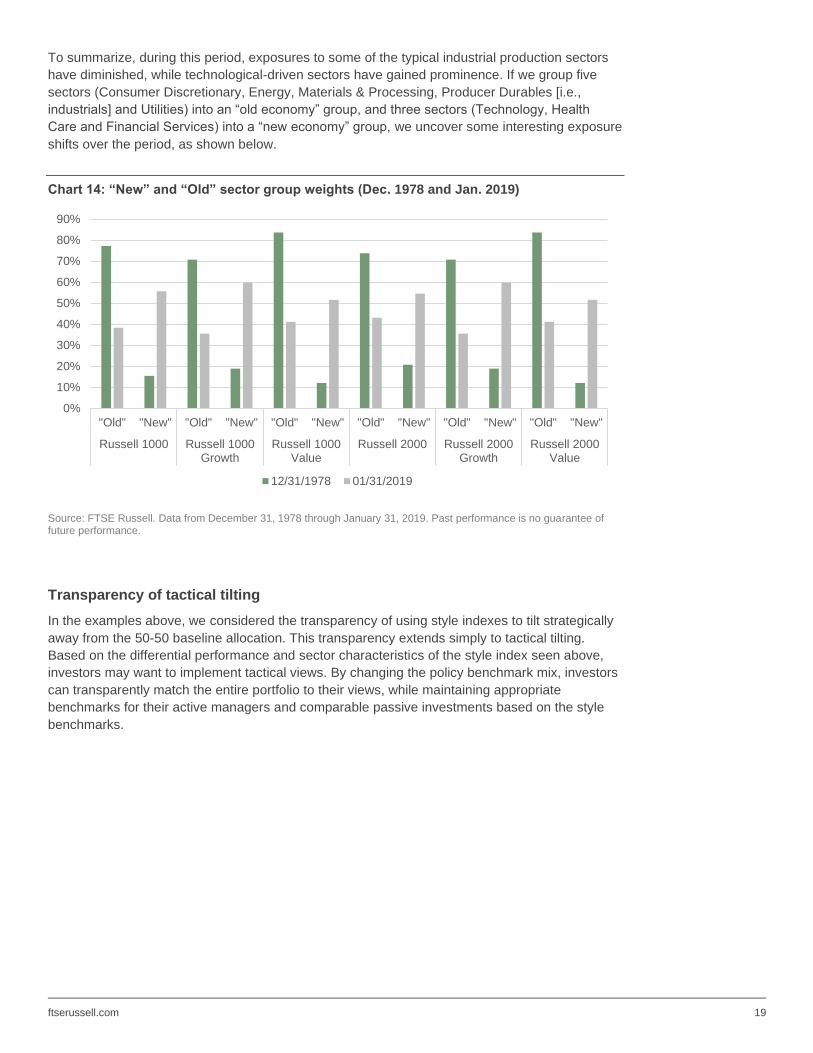
To summarize, during this period, exposures to some of the typical industrial production sectors
have diminished, while technological-driven sectors have gained prominence. If we group five
sectors (Consumer Discretionary, Energy, Materials & Processing, Producer Durables [i.e.,
industrials] and Utilities) into an “old economy” group, and three sectors (Technology, Health
Care and Financial Services) into a “new economy” group, we uncover some interesting exposure
shifts over the period, as shown below.
Chart 14: “New” and “Old” sector group weights (Dec. 1978 and Jan. 2019)
Source: FTSE Russell. Data from December 31, 1978 through January 31, 2019. Past performance is no guarantee of future performance.
Transparency of tactical tilting
In the examples above, we considered the transparency of using style indexes to tilt strategically
away from the 50-50 baseline allocation. This transparency extends simply to tactical tilting.
Based on the differential performance and sector characteristics of the style index seen above,
investors may want to implement tactical views. By changing the policy benchmark mix, investors
can transparently match the entire portfolio to their views, while maintaining appropriate
benchmarks for their active managers and comparable passive investments based on the style
benchmarks.
0%
10%
20%
30%
40%
50%
60%
70%
80%
90%
"Old" "New" "Old" "New" "Old" "New" "Old" "New" "Old" "New" "Old" "New"
Russell 1000 Russell 1000Growth
Russell 1000Value
Russell 2000 Russell 2000Growth
Russell 2000Value
12/31/1978 01/31/2019
ftserussell.com 20
Style vs. Factor Exposures One of the most significant developments in the investment landscape in recent years has been
the emergence of factor investing. Factors, generally speaking, are stock characteristics that
drive performance. Stock characteristics, such as value, had been used for decades as criteria for
selecting stocks in a portfolio (see Graham and Dodd [1934]). Factor investing, however, took a
different approach: because stocks with certain characteristics were shown to outperform over
the long-term, investors could build diversified portfolios of stocks with those characteristics,
without regard to the specific stocks in the portfolio.
Factor investing grew out of research in the 1960s (see Sharpe [1964] and Lintner [1965]) that led
to the Capital Asset Pricing Model (CAPM), which showed that the cross-section of expected
returns was related to “beta” as measured by the co-movement of stocks with the market. Thus,
beta was the first factor, and research soon followed on other factors, including (low) Volatility
(Black [1972], and Haugen and Heins [1972]), Value (Basu [1977]), and (small) Size (Banz
[1981]).
In 1992, Fama and French published a ground-breaking paper that proposed a framework for
studying factors that became the basis for much of the academic research that followed. Two
other influential papers in the 1990s focused on two new factors: Momentum (Jagadeesh and
Titman [1993]), and Accruals (Sloan [1996]). In 2015, Fama and French published a paper that
extended their three-factor model by adding two new ones: Profitability and Investment. The new
factors were intuitive extensions providing a more dynamic characterization of a firm’s intrinsic
value.
Since then, consensus has developed around the understanding that there are five main factors
that potentially offer a positive expected premium, meaning that they are expected to outperform
over the long term. They are: Value, Momentum, (small) Size, Quality and (low) Volatility. While
there is less consensus around the definition of Quality, it generally encompasses the robustness
of a firm’s earnings and its resilience to external shocks, and so includes measures of profitability,
low accruals and low leverage.
Factor investing remained of interest primarily for academic researchers and the growing
category of quantitative investors (quants) until it gained much more traction with large
institutional investors after the global financial crisis. An influential analysis of the Norwegian
Government Pension Fund performance during the crisis found that “a significant component of
performance is explained by exposure to systematic factors” (Ang et al., p. 9, [2009]).
Subsequent academic and practitioner research has sparked keen interest in developing
investment strategies that seek the return potential from persistent exposure to these common
factors.
When considering growth and value styles within this context, it is important to keep several
details in mind:
• The value style is not the same as the Value factor, despite the confusion of having the same
label. As discussed, the value style is an index construction concept used to split the entire
market into two segments, one in which value managers act, and the other in which growth
managers act. The Value factor is an empirical/theoretical construct that helps investors
understand the behavior of the equity market.
• Given that the five compensated factors are expected to drive equity behavior, it is useful to
look at the exposure of any portfolio to these five factors to better understand how that
portfolio may perform. Since the style indexes can be thought of as hypothetical portfolios, we
can also look at the factor exposures of the style indexes.
ftserussell.com 21
• Factors do not have the completeness property discussed above. Because of completeness,
overweighting the growth style necessarily implies underweighting the value style. However,
while there are natural correlations between factors—which make it more likely that
overweighting one factor results in being underweight another factor—it is possible to control
these unintentional factor exposures to be overweight all factors. In the style context,
because of completeness, there are no unintentional exposures. In the factor context, all
factor exposures should be expressed intentionally, even though this is not necessarily done
in practice.15
Value style and Value factor
Above, we describe the value style as a sub-category of the overall market. While an early
definition of the value style relied only on book-to-price to demarcate the value side of the market
from the growth side, subsequent versions used a combination of book-to-price and growth
metrics, because they wanted to take into account aspects of both. This division was driven by
the desire to draw a distinction between value and growth investment spheres and had little to do
with their inherent investment properties.
The Value factor, on the other hand, was analyzed specifically for its investment properties. In the
1970s and 1980s, academics began reporting the performance benefits of investing in stocks that
had low market values (or prices) relative to some fundamental or intrinsic measure of Value.
Early papers looked at earnings-to-price (Basu [1977]) and book-to-price (Fama and French
[1992]). While these metrics had been used by investors for decades, they had primarily been
employed by stock pickers to identify specific stocks to buy. The factor approach was different:
stock selection became less important than getting diversified factor exposure.16
The factor exposures of styles
One way to disentangle the relationship between styles and factors is to look at the factor
exposures of the style indexes. Chart 15 shows the average active factor exposures for the
Russell 1000 Style indexes from June 2005 through December 2019.17 We will make a few
observations on each index.
Value style index
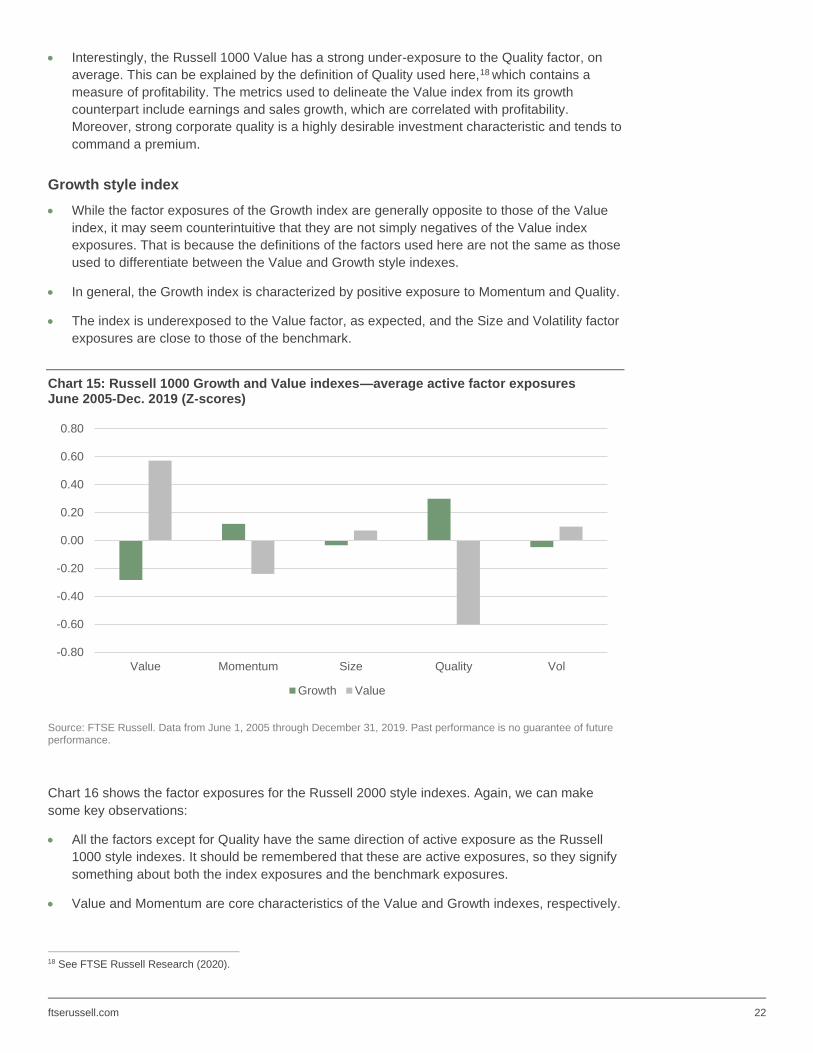
• The primary exposure is to the Value factor, as would be expected. On average, this has a
portfolio-weighted Value Z-score that is approximately 0.57 higher than that of the
benchmark. Since these are standard Z-scores, we can interpret this as the Value index
having a Value factor exposure of approximately 0.57 standard deviations above that of the
benchmark, where the standard deviations are calculated cross-sectionally every period.
• The Momentum active exposure is negative, which is not a surprise given the natural
negative correlation between Value and Momentum.
• Size and Volatility are both modestly positive, indicating that the Value index is close to the
benchmark exposure for these two factors, on average.
15 See FTSE Russell Research (April 2020) for a discussion of intentional factor exposures. 16 We measure factor exposure as the portfolio-weighted average of the valuation metric, and the active exposure as the difference between the
portfolio-weighted average and that of the benchmark. Other methods of calculating exposure often involve running regressions to measure each stock’s sensitivity to factors.
17 Our factor data starts later.
ftserussell.com 22
• Interestingly, the Russell 1000 Value has a strong under-exposure to the Quality factor, on
average. This can be explained by the definition of Quality used here,18 which contains a
measure of profitability. The metrics used to delineate the Value index from its growth
counterpart include earnings and sales growth, which are correlated with profitability.
Moreover, strong corporate quality is a highly desirable investment characteristic and tends to
command a premium.
Growth style index
• While the factor exposures of the Growth index are generally opposite to those of the Value
index, it may seem counterintuitive that they are not simply negatives of the Value index
exposures. That is because the definitions of the factors used here are not the same as those
used to differentiate between the Value and Growth style indexes.
• In general, the Growth index is characterized by positive exposure to Momentum and Quality.
• The index is underexposed to the Value factor, as expected, and the Size and Volatility factor
exposures are close to those of the benchmark.
Chart 15: Russell 1000 Growth and Value indexes—average active factor exposures June 2005-Dec. 2019 (Z-scores)
Source: FTSE Russell. Data from June 1, 2005 through December 31, 2019. Past performance is no guarantee of future performance.
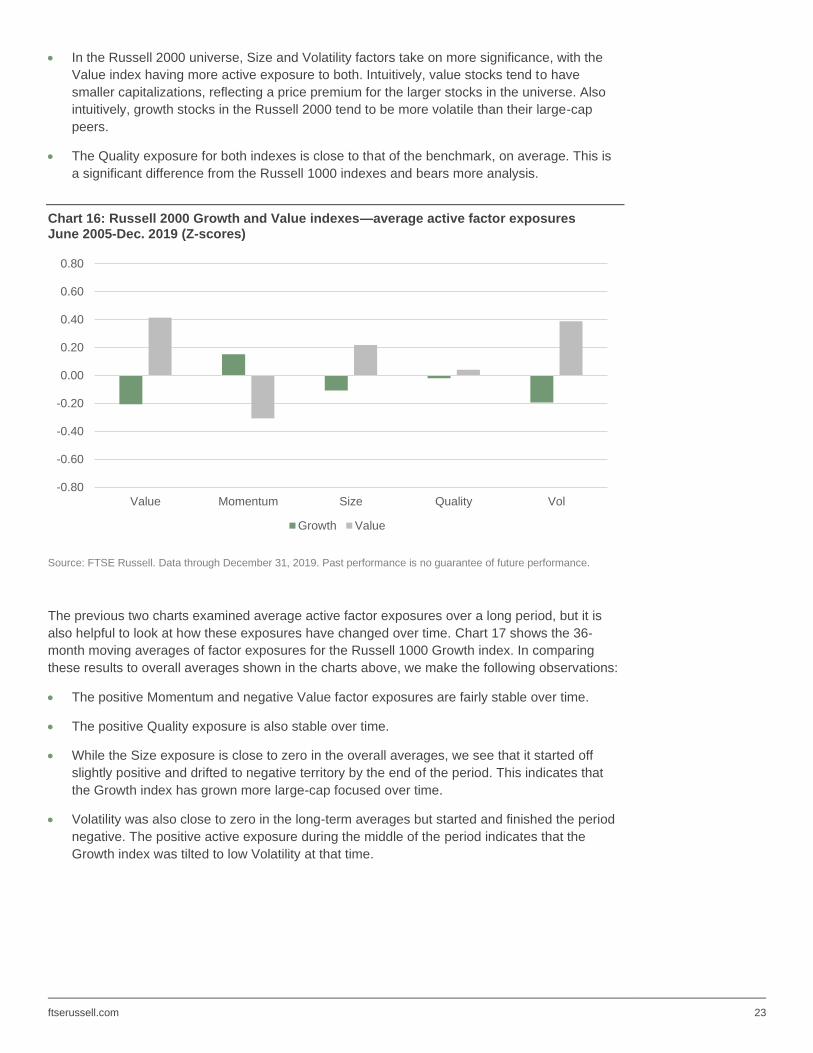
Chart 16 shows the factor exposures for the Russell 2000 style indexes. Again, we can make
some key observations:
• All the factors except for Quality have the same direction of active exposure as the Russell
1000 style indexes. It should be remembered that these are active exposures, so they signify
something about both the index exposures and the benchmark exposures.
• Value and Momentum are core characteristics of the Value and Growth indexes, respectively.
18 See FTSE Russell Research (2020).
-0.80
-0.60
-0.40
-0.20
0.00
0.20
0.40
0.60
0.80
Value Momentum Size Quality Vol
Growth Value
ftserussell.com 23
• In the Russell 2000 universe, Size and Volatility factors take on more significance, with the
Value index having more active exposure to both. Intuitively, value stocks tend to have
smaller capitalizations, reflecting a price premium for the larger stocks in the universe. Also
intuitively, growth stocks in the Russell 2000 tend to be more volatile than their large-cap
peers.
• The Quality exposure for both indexes is close to that of the benchmark, on average. This is
a significant difference from the Russell 1000 indexes and bears more analysis.
Chart 16: Russell 2000 Growth and Value indexes—average active factor exposures June 2005-Dec. 2019 (Z-scores)
Source: FTSE Russell. Data through December 31, 2019. Past performance is no guarantee of future performance.
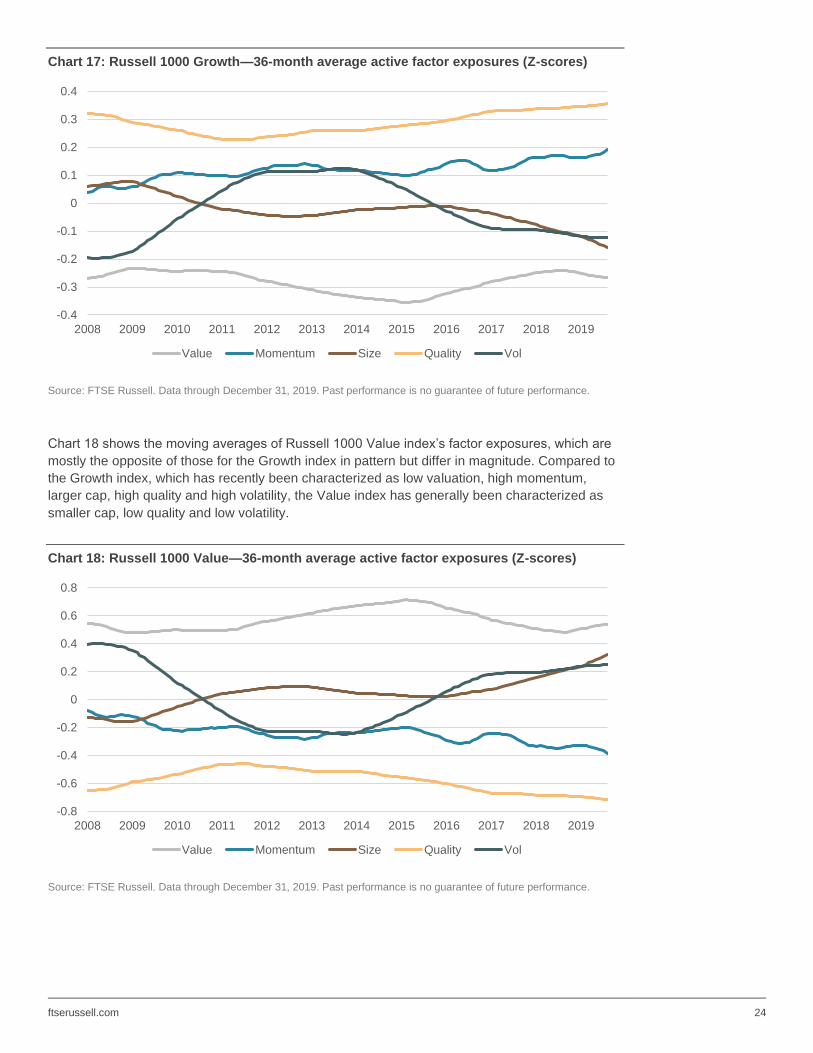
The previous two charts examined average active factor exposures over a long period, but it is
also helpful to look at how these exposures have changed over time. Chart 17 shows the 36-
month moving averages of factor exposures for the Russell 1000 Growth index. In comparing
these results to overall averages shown in the charts above, we make the following observations:
• The positive Momentum and negative Value factor exposures are fairly stable over time.
• The positive Quality exposure is also stable over time.
• While the Size exposure is close to zero in the overall averages, we see that it started off
slightly positive and drifted to negative territory by the end of the period. This indicates that
the Growth index has grown more large-cap focused over time.
• Volatility was also close to zero in the long-term averages but started and finished the period
negative. The positive active exposure during the middle of the period indicates that the
Growth index was tilted to low Volatility at that time.
-0.80
-0.60
-0.40
-0.20
0.00
0.20
0.40
0.60
0.80
Value Momentum Size Quality Vol
Growth Value
ftserussell.com 24
Chart 17: Russell 1000 Growth—36-month average active factor exposures (Z-scores)
Source: FTSE Russell. Data through December 31, 2019. Past performance is no guarantee of future performance.
Chart 18 shows the moving averages of Russell 1000 Value index’s factor exposures, which are
mostly the opposite of those for the Growth index in pattern but differ in magnitude. Compared to
the Growth index, which has recently been characterized as low valuation, high momentum,
larger cap, high quality and high volatility, the Value index has generally been characterized as
smaller cap, low quality and low volatility.
Chart 18: Russell 1000 Value—36-month average active factor exposures (Z-scores)
Source: FTSE Russell. Data through December 31, 2019. Past performance is no guarantee of future performance.
-0.4
-0.3
-0.2
-0.1
0
0.1
0.2
0.3
0.4
2008 2009 2010 2011 2012 2013 2014 2015 2016 2017 2018 2019
Value Momentum Size Quality Vol
-0.8
-0.6
-0.4
-0.2
0
0.2
0.4
0.6
0.8
2008 2009 2010 2011 2012 2013 2014 2015 2016 2017 2018 2019
Value Momentum Size Quality Vol
ftserussell.com 25
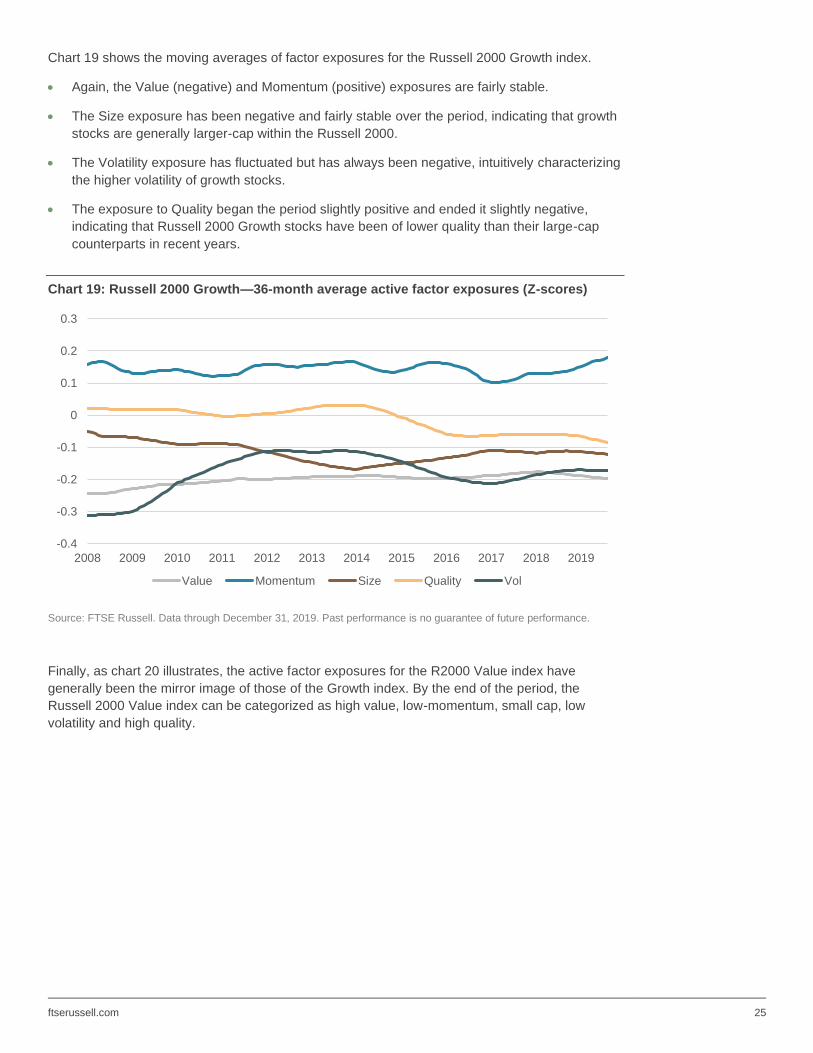
Chart 19 shows the moving averages of factor exposures for the Russell 2000 Growth index.
• Again, the Value (negative) and Momentum (positive) exposures are fairly stable.
• The Size exposure has been negative and fairly stable over the period, indicating that growth
stocks are generally larger-cap within the Russell 2000.
• The Volatility exposure has fluctuated but has always been negative, intuitively characterizing
the higher volatility of growth stocks.
• The exposure to Quality began the period slightly positive and ended it slightly negative,
indicating that Russell 2000 Growth stocks have been of lower quality than their large-cap
counterparts in recent years.
Chart 19: Russell 2000 Growth—36-month average active factor exposures (Z-scores)
Source: FTSE Russell. Data through December 31, 2019. Past performance is no guarantee of future performance.
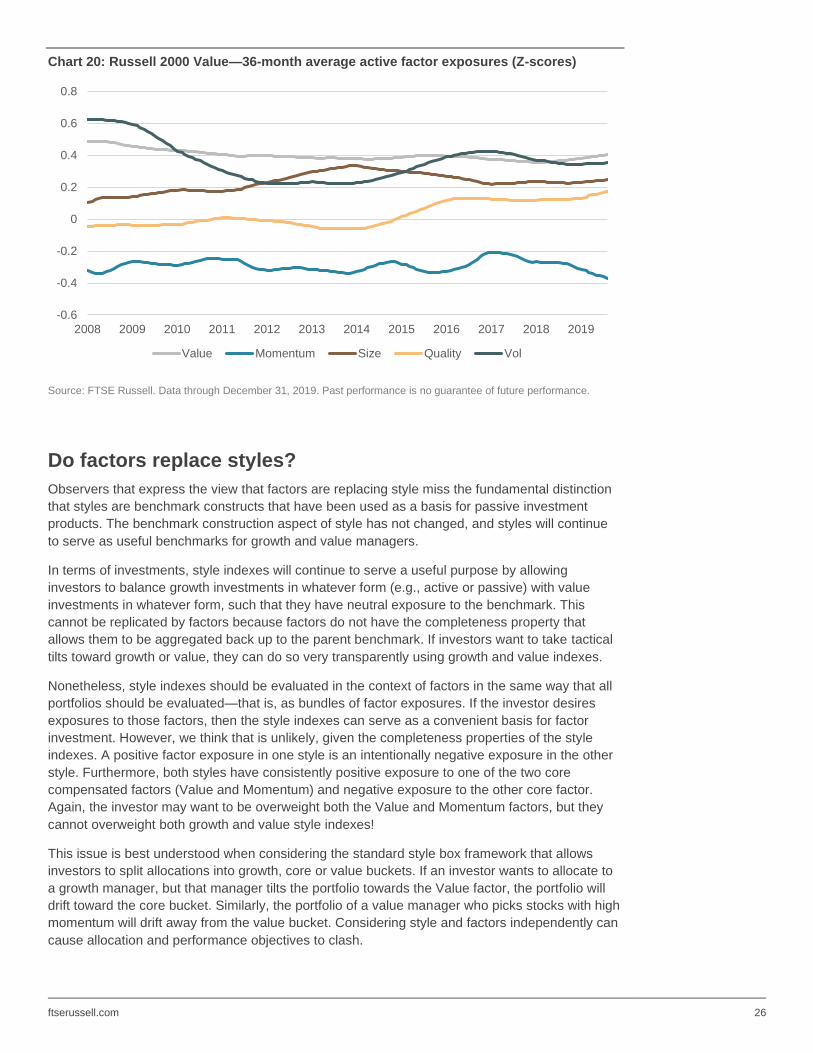
Finally, as chart 20 illustrates, the active factor exposures for the R2000 Value index have
generally been the mirror image of those of the Growth index. By the end of the period, the
Russell 2000 Value index can be categorized as high value, low-momentum, small cap, low
volatility and high quality.
-0.4
-0.3
-0.2
-0.1
0
0.1
0.2
0.3
2008 2009 2010 2011 2012 2013 2014 2015 2016 2017 2018 2019
Value Momentum Size Quality Vol
ftserussell.com 26
Chart 20: Russell 2000 Value—36-month average active factor exposures (Z-scores)
Source: FTSE Russell. Data through December 31, 2019. Past performance is no guarantee of future performance.
Do factors replace styles?
Observers that express the view that factors are replacing style miss the fundamental distinction
that styles are benchmark constructs that have been used as a basis for passive investment
products. The benchmark construction aspect of style has not changed, and styles will continue
to serve as useful benchmarks for growth and value managers.
In terms of investments, style indexes will continue to serve a useful purpose by allowing
investors to balance growth investments in whatever form (e.g., active or passive) with value
investments in whatever form, such that they have neutral exposure to the benchmark. This
cannot be replicated by factors because factors do not have the completeness property that
allows them to be aggregated back up to the parent benchmark. If investors want to take tactical
tilts toward growth or value, they can do so very transparently using growth and value indexes.
Nonetheless, style indexes should be evaluated in the context of factors in the same way that all
portfolios should be evaluated—that is, as bundles of factor exposures. If the investor desires
exposures to those factors, then the style indexes can serve as a convenient basis for factor
investment. However, we think that is unlikely, given the completeness properties of the style
indexes. A positive factor exposure in one style is an intentionally negative exposure in the other
style. Furthermore, both styles have consistently positive exposure to one of the two core
compensated factors (Value and Momentum) and negative exposure to the other core factor.
Again, the investor may want to be overweight both the Value and Momentum factors, but they
cannot overweight both growth and value style indexes!
This issue is best understood when considering the standard style box framework that allows
investors to split allocations into growth, core or value buckets. If an investor wants to allocate to
a growth manager, but that manager tilts the portfolio towards the Value factor, the portfolio will
drift toward the core bucket. Similarly, the portfolio of a value manager who picks stocks with high
momentum will drift away from the value bucket. Considering style and factors independently can
cause allocation and performance objectives to clash.
-0.6
-0.4
-0.2
0
0.2
0.4
0.6
0.8
2008 2009 2010 2011 2012 2013 2014 2015 2016 2017 2018 2019
Value Momentum Size Quality Vol
ftserussell.com 27
Combining styles and factors is a more promising approach. For example, the FTSE Russell tilt
methodology of building factor indexes allows a factor index to tilt away from any benchmark to
gain active factor exposure or, more importantly, to neutralize undesired factor exposure. In many
ways, this can be like a systematic active manager who starts with a benchmark but buys stocks
with desirable characteristics and avoids stocks with undesirable characteristics. Adding this
factor overlay can give investors exposure to long-term factor outperformance potential while
maintaining allocations to the respective style indexes. This transparency in allocation allows
investors to balance, for example, skilled active managers in one style with factor index
exposures in the other style, which would avoid the requirement of giving up performance simply
to balance style allocations.
A different approach would be to start with the underlying style index constituents and build
portfolios of stocks that have the desired factor exposures using an optimizer. Like the tilt method,
active factor exposures could be controlled by imposing appropriate constraints on the factor
exposures. Factor exposures expected to reduce long-term portfolio performance could be
controlled by these constraints. FTSE Russell has also introduced indexes using this
methodology with the Russell US Factors Style Index Series. (See FTSE Russell, “Ground Rules:
Russell US Factors Style Index Series”, v1.4, December 2020.)
Both tilting and optimization address the problem of style drift that is a direct result of combining
the style definitions with factor definitions. Because growth indexes intentionally contain a
negative Value factor exposure—and value indexes unintentionally include a negative Momentum
exposure—removing these exposures will cause the portfolios to “drift” away from the style
bucket. This points out that the two-dimensional style boxes may not be useful when thinking
about styles and factors in isolation. However, depending on investor preferences, careful control
of all active factor exposures can result in an exposure profile that is better aligned with expected
factor risk premia while also maintaining exposures that are acceptably close to the underlying
style indexes.
Conclusions The Russell Style indexes have a long history of providing investors with useful investment tools.
Examining the history of the indexes reminds us that they were originally constructed as
benchmarks that split the manager universe into equal value and growth manager sub-universes
based on market capitalization. This completeness characteristic allowed the style indexes to be
used as the basis for completion investments when style investments were unbalanced.
The indexes as the basis for investments in their own right developed over time as investors
understood the characteristics of the different style indexes well enough to use them to express
strategic and tactical views. Relative to the overall market, growth indexes are more cyclical,
while value indexes are more defensive. Investors could use these characteristics to position their
portfolios to reflect their views on the market cycle or risk appetite, while maintaining a clear view
on their positioning relative to the market. This will continue to be the case.
The increased focus of investors on factors does not negate these uses for the style indexes. The
understanding that factors drive market performance and that compensated factors are expected
to have a long term pay-off adds more tools to the investor’s toolbox. The next step is to combine
the performance aspects of factor investing with the well-established allocation advantages of
style indexes. Careful control of factor exposures can result in portfolios that maintain a specific
value or growth style profile and yet can take advantage of the expected factor premia.
ftserussell.com 28
References Ang, A., W. Goetzmann, and S. Schaefer. “Evaluation of Active Management of the Norwegian
Government Pension Fund – Global.” 2009.
https://www0.gsb.columbia.edu/faculty/aang/papers/report%20Norway.pdf
Banz, R.W. “The Relationship Between Return and Market Value of Common Stocks.” Journal of
Financial Economics, Vol. 9, No. 1 (1981).
Basu, S. “Investment Performance of Common Stocks in Relation to their Price-Earnings Ratios: A
Test of the Efficient Market Hypothesis.” Journal of Finance, Vol. 32, No. 3 (1977), pp. 663-682.
Black, F. “Capital Market Equilibrium with Restricted Borrowing.” Journal of Business, Vol. 45, No. 3
(1972), pp. 444-455.
Cariño, David. “Russell Style Index Methodology Update.” Russell Investments, April 2011.
Fama, E., and K. French. “The Cross-Section of Expected Stock Returns.” Journal of Finance, Vol. 37,
No. 2 (1992), pp. 427-465,
Fama, E., and K. French. “A five-factor asset pricing model.” Journal of Financial Economics, Vol. 116
(2015), pp. 1-22.
Graham, B. and Dodd, D. “Security Analysis”, 1934.
FTSE Russell, “Construction and Methodology: Russell U.S. Equity Indexes”, v4.6, June 2020.
https://research.ftserussell.com/products/downloads/Russell-US-indexes.pdf
FTSE Russell, “Ground Rules: FTSE Global Factor Index Series”, v5.2, April 2020.
https://research.ftserussell.com/products/downloads/FTSE_Global_Factor_Index_Series_Ground_Rul
es.pdf
FTSE Russell, “Ground Rules: Russell US Factors Style Index Series”, v1.4, December 2020.]
https://research.ftserussell.com/products/downloads/Russell_US_Factors_Style_Index_Series_Groun
d_Rules.pdf
FTSE Russell, “Target Factor Exposure: Investment applications and solutions”, April 2020b.
https://www.ftserussell.com/research/target-factor-exposure-investment-applications-and-solutions.pdf
FTSE Russell Research, “Russell US Indexes – 40 years of insights”, FTSE Russell, 2019.
https://www.ftserussell.com/research/russell-us-indexes-40-years-insights
FTSE Russell Research, “Russell 2000 – 40+ years of insights”, FTSE Russell, 2020.
https://www.ftserussell.com/research/russell-2000-forty-years-insights
Haugen, R., and J. Heins. “On the Evidence Supporting the Existence of Risk Premiums in the Capital
Market”. Wisconsin Working Paper, 1972.
Haughton, Kelly and Jon Christopherson. “Equity Style Indexes: Tools for Better Portfolio Evaluation
and Plan Management.” Russell Research Commentary, September 1989.
Jegadeesh, N., and S. Titman. “Returns to Buying Winners and Selling Losers: Implications for Stock
Market Efficiency.” Journal of Finance, Vol, 48, No. 1 (1993), pp. 65-91.
Lintner, J. “The Valuation of Risk Assets and the Selection of Risky Investments in Stocks Portfolios
and Capital Budgets.” Review of Economics and Statistics, Vol. 47, No. 1 (1965) pp. 13-37.
https://research.ftserussell.com/products/downloads/FTSE_Global_Factor_Index_Series_Ground_Rules.pdf

ftserussell.com 29
Sharpe, W. “Capital Asset Prices: A Theory of Market Equilibrium under Conditions of Risk.” Journal of
Finance, Vol. 19, No. 3 (1964), pp. 425-442.
Sloan, R. “Do Stock Prices Fully Reflect Information in Accruals and Cash Flows about Future
Earnings?” Accounting Review, Vol. 71, No. 3 (1996), pp. 289-315.
ftserussell.com 30
About FTSE Russell
FTSE Russell is a leading global provider of benchmarks, analytics and data solutions with multi-asset capabilities,
offering a precise view of the markets relevant to any investment process. For over 30 years, leading asset owners,
asset managers, ETF providers and investment banks have chosen FTSE Russell indexes to benchmark their
investment performance and create investment funds, ETFs, structured products and index-based derivatives. FTSE
Russell indexes also provide clients with tools for performance benchmarking, asset allocation, investment strategy
analysis and risk management.
To learn more, visit ftserussell.com; email [email protected]; or call your regional Client Service Team office
EMEA
+44 (0) 20 7866 1810
North America
+1 877 503 6437
Asia-Pacific
Hong Kong +852 2164 3333
Tokyo +81 3 4563 6346
Sydney +61 (0) 2 8823 3521
© 2020 London Stock Exchange Group plc and its applicable group undertakings (the “LSE Group”). The LSE Group includes (1) FTSE International Limited (“FTSE”), (2) Frank Russell Company (“Russell”), (3) FTSE Global Debt Capital Markets Inc. and FTSE Global Debt Capital Markets Limited (together, “FTSE Canada”), (4) MTSNext Limited (“MTSNext”), (5) Mergent, Inc. (“Mergent”), (6) FTSE Fixed Income LLC (“FTSE FI”), (7) The Yield Book Inc (“YB”) and (8) Beyond Ratings S.A.S. (“BR”). All rights reserved.
FTSE Russell® is a trading name of FTSE, Russell, FTSE Canada, MTSNext, Mergent, FTSE FI, YB and BR. “FTSE®”, “Russell®”, “FTSE Russell®”, “MTS®”, “FTSE4Good®”, “ICB®”, “Mergent®”, “The Yield Book®”, “Beyond Ratings®“ and all other trademarks and service marks used herein (whether registered or unregistered) are trademarks and/or service marks owned or licensed by the applicable member of the LSE Group or their respective licensors and are owned, or used under licence, by FTSE, Russell, MTSNext, FTSE Canada, Mergent, FTSE FI, YB or BR. FTSE International Limited is authorised and regulated by the Financial Conduct Authority as a benchmark administrator.
All information is provided for information purposes only. All information and data contained in this publication is obtained by the LSE Group, from sources believed by it to be accurate and reliable. Because of the possibility of human and mechanical error as well as other factors, however, such information and data is provided “as is” without warranty of any kind. No member of the LSE Group nor their respective directors, officers, employees, partners or licensors make any claim, prediction, warranty or representation whatsoever, expressly or impliedly, either as to the accuracy, timeliness, completeness, merchantability of any information or of results to be obtained from the use of the FTSE Russell products, including but not limited to indexes, data and analytics or the fitness or suitability of the FTSE Russell products for any particular purpose to which they might be put. Any representation of historical data accessible through FTSE Russell products is provided for information purposes only and is not a reliable indicator of future performance.
No responsibility or liability can be accepted by any member of the LSE Group nor their respective directors, officers, employees, partners or licensors for (a) any loss or damage in whole or in part caused by, resulting from, or relating to any error (negligent or otherwise) or other circumstance involved in procuring, collecting, compiling, interpreting, analysing, editing, transcribing, transmitting, communicating or delivering any such information or data or from use of this document or links to this document or (b) any direct, indirect, special, consequential or incidental damages whatsoever, even if any member of the LSE Group is advised in advance of the possibility of such damages, resulting from the use of, or inability to use, such information.
No member of the LSE Group nor their respective directors, officers, employees, partners or licensors provide investment advice and nothing contained herein or accessible through FTSE Russell products, including statistical data and industry reports, should be taken as constituting financial or investment advice or a financial promotion.
Past performance is no guarantee of future results. Charts and graphs are provided for illustrative purposes only. Index returns shown may not represent the results of the actual trading of investable assets. Certain returns shown may reflect back-tested performance. All performance presented prior to the index inception date is back-tested performance. Back-tested performance is not actual performance, but is hypothetical. The back-test calculations are based on the same methodology that was in effect when the index was officially launched. However, back- tested data may reflect the application of the index methodology with the benefit of hindsight, and the historic calculations of an index may change from month to month based on revisions to the underlying economic data used in the calculation of the index.
This document may contain forward-looking assessments. These are based upon a number of assumptions concerning future conditions that ultimately may prove to be inaccurate. Such forward-looking assessments are subject to risks and uncertainties and may be affected by various factors that may cause actual results to differ materially. No member of the LSE Group nor their licensors assume any duty to and do not undertake to update forward-looking assessments.
No part of this information may be reproduced, stored in a retrieval system or transmitted in any form or by any means, electronic, mechanical, photocopying, recording or otherwise, without prior written permission of the applicable member of the LSE Group. Use and distribution of the LSE Group data requires a licence from FTSE, Russell, FTSE Canada, MTSNext, Mergent, FTSE FI, YB, BR and/or their respective licensors.
Related Documents