Working Paper No. 100 John Hine Good Policies and Practices on Rural Transport in Africa Planning Infrastructure & Services Public Disclosure Authorized Public Disclosure Authorized Public Disclosure Authorized Public Disclosure Authorized Public Disclosure Authorized Public Disclosure Authorized Public Disclosure Authorized Public Disclosure Authorized

Welcome message from author
This document is posted to help you gain knowledge. Please leave a comment to let me know what you think about it! Share it to your friends and learn new things together.
Transcript

Working Paper No. 100
John Hine
Good Policies and Practices on Rural Transport in Africa
Planning Infrastructure & Services
Good Policies and Ptractices on Rural Transport in A
frica | Planning Infrastructure & Services
Working Paper N
o. 100
Pub
lic D
iscl
osur
e A
utho
rized
Pub
lic D
iscl
osur
e A
utho
rized
Pub
lic D
iscl
osur
e A
utho
rized
Pub
lic D
iscl
osur
e A
utho
rized
Pub
lic D
iscl
osur
e A
utho
rized
Pub
lic D
iscl
osur
e A
utho
rized
Pub
lic D
iscl
osur
e A
utho
rized
Pub
lic D
iscl
osur
e A
utho
rized
WB406484
Typewritten Text
93779
WB406484
Typewritten Text


Good Policies and Practices
on Rural Transport in Africa
Planning Infrastructure & Services


Good Policies and Practices
on Rural Transport in Africa
Planning Infrastructure & Services
John Hine
September 2014

The SSATP is an international partnership to facilitate policy development and related
capacity building in the transport sector in Africa.
Sound policies lead to safe, reliable, and cost-effective transport, freeing people to lift them-
selves out of poverty and helping countries to compete internationally.
* * * * * * *
The SSATP is a partnership of
40 African countries
8 Regional Economic Communities
2 African institutions: UNECA, AU/NEPAD
Financing partners for the Second Development Plan: European Commission (main do-
nor), Austria, France, Norway, Sweden, United Kingdom, Islamic Development Bank, Afri-
can Development Bank, and World Bank (host)
Many public and private national and regional organizations
* * * * * * *
The SSATP gratefully acknowledges the contributions and support of member countries
and its partners.
* * * * * * *
This paper is a product of the SSATP, written by an external author. The findings, interpretations, and
conclusions expressed herein do not necessarily reflect the views of the SSATP or the World Bank. The
SSATP does not guarantee the accuracy of the data included in this work. The boundaries, colors, de-
nominations, and other information shown on any map in this work do not imply any judgment on
the part of the SSATP or the World Bank concerning the legal status of any territory or the endorse-
ment or acceptance of such boundaries.
© September 2014 The World Bank Group
1818 H Street, NW Washington DC 20433 USA.
The text of this publication may be reproduced in whole or in part and in any form for educational or
nonprofit issues, without special permission provided acknowledgement of the source is made. Re-
quests for permission to reproduce portions for resale or commercial purposes should be sent to the
SSATP Program Manager at the address above. The SSATP encourages dissemination of its work and
normally gives permission promptly. The Program Manager would appreciate receiving a copy of the
document that uses this publication for its source sent in care of the address above.

v
Table of Contents
Acknowledgements ________________________________________________ ix
Acronyms and abbreviations _________________________________________ xi
Executive Summary _______________________________________________ xiii
1. Introduction __________________________________________________ 1 1.1 Objectives ________________________________________________ 1 1.2 The Role and Importance of Planning and Prioritization ___________ 2
2. The Rural Transport System in Africa: Setting the Context for Planning__ 5 2.1 The Role of Transport Policy _________________________________ 6 2.2 Connections between Rural Transport and Poverty Reduction ______ 7 2.3 The Benefits of Rural Road Investment and Evidence of Impact ____ 10 2.4 The Institutional Structure of Rural Transport __________________ 13 2.5 The Range of Transport Choices _____________________________ 15 2.6 User Perspectives __________________________________________ 17 2.7 Transport Costs and Prices __________________________________ 21 2.8 Rural Transport and Agriculture _____________________________ 25 2.9 Rural Transport Safety and Security ___________________________ 27
3. Transport Surveys and Consultation ______________________________ 29 3.1 Common Types of Surveys and Consultation ___________________ 29
4. Rural Infrastructure Planning ___________________________________ 39 4.1 The Planning Context ______________________________________ 39 4.2 Key Challenges and Solutions for Better Rural Road Planning ______ 40 4.3 General Goals and Objectives ________________________________ 42 4.4 Planning Rural Roads to Meet Agricultural and Other Objectives ___ 43 4.5 Planning Rural Road Density and Connectivity __________________ 43 4.6 Key Engineering and Planning Decisions _______________________ 44 4.7 The Planning Cycle ________________________________________ 45 4.8 Engineering Design Choices and Standards _____________________ 46 4.9 Road Maintenance and Road Deterioration _____________________ 49

Rural Transport in Africa – Planning Infrastructure & Services
vi
4.10 Taking into Account Social and Environment Issues ______________ 52 4.11 Income Distribution Issues __________________________________ 52 4.12 Identifying the Best Projects _________________________________ 53 4.13 Transport Cost-Benefit Analysis ______________________________ 53 4.14 Agricultural Response & Producers’ Surplus Approach____________ 61 4.15 Social and Economic Case for Basic Vehicle Access _______________ 63 4.16 Road Appraisal in a Context of an Integrated Development Project __ 66 4.17 Ranking Procedures, Cost Effectiveness & Multi-Criteria Analysis ___ 66 4.18 Working with Road Planning Models _________________________ 69 4.19 Planning Village-Based Infrastructure using the iRAP Tool ________ 72
5. Introducing and Planning Transport Services ______________________ 77 5.1 Introducing Intermediate Means of Transport __________________ 77 5.2 Improving the Policy and Legal Framework of Services ___________ 79 5.3 Possible Transport Service Solutions __________________________ 81 5.4 A Framework for Prioritizing Service Interventions ______________ 84
6. Methods for Planning and Prioritization of Infrastructure & Services __ 97 6.1 The State of Rural Transport in Sub-Saharan Africa in a Nutshell ___ 97 6.2 A Framework for Planning and Prioritization ___________________ 98 6.3 The Need for Further Research ______________________________ 100
References ______________________________________________________ 103
Appendices _____________________________________________________ 113 Appendix 1. Examples of Road Planning Procedures _________________ 115 Appendix 2. Examples of District Planning Procedures _______________ 133
Figures
Figure 1. The Rural Transport System and the Poverty Connections _________________ 9
Figure 2. Comparative GDP (US$) / sq km for different countries (2012 data) _________ 10
Figure 3. The Transport Burden for Men and Women in Makete, Tanzania ___________ 18
Figure 4. The Rural Access Index Estimated for 2007 ____________________________ 19
Figure 5. Comparison of Long Distance Transport Tariffs ($ cents per ton-km) 2007 ___ 24
Figure 6. An example of rural roads in poor condition ___________________________ 48
Figure 7. An example of rural roads in poor condition ___________________________ 48
Figure 8. An overdesigned road _____________________________________________ 48
Figure 9. Marginal Productivity of Maintenance Expenditure on Low Traffic Roads ____ 50
Figure 10. A Normal and Generated Traffic Benefits Using the Consumers’ Surplus ____ 57

Table of Contents
vii
Figure 11. Producers’ Surplus Benefits Resulting from Lower Transport Costs Giving
Higher Farm Gate Prices and Lower Input Costs. _______________________ 62
Figure 12. Benefits of Providing Basic Access __________________________________ 64
Figure 13. A Community Footbridge in Kenya _________________________________ 73
Figure 14. Rural Road Section Procedure for RT3 in Vietnam ____________________ 129


ix
Acknowledgements
This publication forms part of the work of SSATP on identifying and promoting
good policies and practices in rural transport in Africa. This work was intended to
fill knowledge gaps on the planning and prioritization of rural transport infra-
structure & services, a key element to rational and efficient allocation of resources
for comprehensive rural development and poverty reduction in Africa.
The paper draws on a wide range of rural transport background and planning ma-
terials, published and grey literature, as well as the author’s wealth of experience
on the subject. The author is indebted to all those who have contributed to devel-
oping the topic over many years.
The transport services component benefitted considerably from the author’s re-
cent participation in preparing and delivering a course on transport services with
the Transport Research Laboratory (United Kingdom) for the African Community
Access Program (AFCAP) under the British Department for International Devel-
opment (DfID).
The paper was prepared with the help and guidance of Camilla Lema, the SSATP
task team leader for the rural transport activities. I will also acknowledge the con-
tribution of Jean-Noel Guillossou, the SSATP Program Manager, for his helpful
suggestions to improve the content and structure of the document. The author
would also like to thank Stefan Achia of the African Development Bank (AfDB) for
the initial discussions and contribution in planning the work. The author is grate-
ful for valuable contributions made by Julie Babinard and Gaël Raballand from the
World Bank, and Jeff Turner from the Africa College, University of Leeds, United
Kingdom, as peer reviewers, with extensive written comments.
Finally, I would like to thank Monique Desthuis-Francis, the SSATP publication
officer, for providing valuable editorial advice and publishing the paper.


xi
Acronyms and abbreviations
AADT Average Annual Daily Traffic
AFCAP Africa Community Access Programme
AICD Africa Infrastructure Country Diagnostic
CBA Cost-benefit analysis
DfID Department for International Development (UK)
DRRP District Rural Roads Plan (India)
EIA Environmental Impact Assessment
EIRR Economic Internal Rate of Return
ERTTP Ethiopian Rural Travel and Transport Programme
FYRR First Year Rate of Return
GPRTU Ghana Private Road Transport Union
GPS Global Positioning System
GIS Geographical Information Systems
HDM-4 Highway Development and Management Model
IDA International Development Association
IFPRI International Food Policy Research Institute
IFRTD International Forum for Rural Transport Development
ILO International Labor Organisation
IMT Intermediate Means of Transport
IRAP Integrated Rural Accessibility Planning
IRI International Roughness Index
IRR Internal Rate of Return
LSMS Living Standards Measurement Survey
LVSR Low Volume Sealed Road
MCA Multi-Criteria Analysis
MIRR Modified Internal Rate of Return
MIRTP Makete Integrated Rural Transport Project
MDG Millennium Development Goal
NGO Non-Governmental Organization
NMT Non-Motorized Transport
NPV Net Present Value
NPV/C Net Present Value over Cost ratio
NRRDA National Rural Road Development Agency (India)
Rural Transport in Africa – Planning Infrastructure & Services
xii
OMMS Online Management & Monitoring System (India)
PA Participatory Appraisal
PAM Performance Assessment Marco
PCI Pavement Condition Index
PIARC World Road Association
PIRTP Pilot Integrated Rural Transport Project (Malawi)
PIU Programme Implementation Unit
PLA Participatory Learning in Action
PMORALG Prime Minister's Office Regional Administration and
Local Government (Tanzania)
PPP Public-Private Partnership
PRA Participatory Rural Appraisal
PMGSY Pradhan Mantri Gram Sadak Yojana (India)
PRSP Poverty Reduction Strategy Paper
RAI Rural Access Index
RAMPA Rural Accessibility and Mobility Pilot Activity (Malawi)
RED Roads Economic Decision Model
RONET Road Network Evaluation Tools
RP Revealed Preference
RRA Rapid Rural Appraisal
RTTP Rural Travel & Transport Program (formerly a com
ponent of SSATP)
RTIM Road Transport Investment Model
SSATP Africa Transport Policy Program
STA State Technical Agency (India)
SUMATRA Surface and Marine Transport Regulatory Authority
(Tanzania)
TRL Transport Research Laboratory (UK)
TRRL Transport and Road Research Laboratory (UK)
VOC Vehicle operating cost
VTTP Village Travel and Transport Programme (Tanzania)
WHO World Health Organisation
WIDP Woreda Integrated Development Plans (for Ethiopia)

xiii
Executive Summary
Background
Sub-Saharan Africa is at a major disadvantage compared with other continents on
the availability of rural transport infrastructure, intermediate means of transport
and transport services, the efficiency of agricultural transport and marketing, and
on costs of transport. There is clearly scope for major improvements. Better rural
transport is crucial to reducing poverty and isolation and in promoting economic
growth. An inefficient and unsafe transport system has key adverse knock-on ef-
fects on livelihoods, the delivery of health and education, social interaction and the
development of agriculture and the service sector.
The problems of rural transport are largely the manifestation of a wider vicious
circle of rural poverty. Low incomes, a weak tax base and a deficient institutional
structure lead to a poor quality of infrastructure, a lack of investment and mainte-
nance. Despite its importance, outside of donor-driven programs, rural road plan-
ning is poorly carried out, with little analysis of alternatives, and based on very
limited data. Low density of transport demand coupled with poor infrastructure
lead to low transport productivity with infrequent and high cost transport services.
This in turn leads to low mobility rates and poor interaction with markets and
services as well as low goods movement and development of resources. These fac-
tors, in turn, lead to poor health and education outcomes and poverty—and so the
circle is completed. The challenge is how to break the vicious circle of low demand
and incomes, poor infrastructure and weak institutions.
This paper provides an overall framework for identifying, planning and prioritiz-
ing rural transport infrastructure and services interventions. A key element is to
encourage a holistic understanding of rural transport. Although services and infra-
structure can be planned in isolation of each other, the best long-term results are
likely to be achieved if they are improved in conjunction with each other.
Rural Transport in Africa – Planning Infrastructure & Services
xiv
Planning and Prioritization
Within the context of managing rural transport infrastructure and services, inter-
ventions planning is a process that involves a number of steps or components:
objectives are identified
relevant data is collected and analyzed
resources and constraints are identified
alternative scenarios, (or investment choices or plans) are prepared
different scenarios are compared to see how objectives can be best achieved
with available resources, taking into account constraints
once a final choice made, the plan is put in place with committed resources
monitoring of outputs, outcomes and final impacts is then undertaken
Alternatives may be compared using an economic cost-benefit analysis, whereby
the objective is usually to maximize the Net Present Value (NPV) of a project or
program of interventions.
Prioritization is the process by which different scenarios, options or plans are
compared and ranked. This may be carried out within the framework of an eco-
nomic cost-benefit analysis or via some form of cost effectiveness or ranking pro-
cess, or a procedure such as Integrated Rural Accessibility Planning (iRAP). The
prioritization process may involve multiple stages and include the participation of
local stakeholders.
As part of the planning process, road feasibility studies, network plans, and master
plans are prepared to indicate the viability and priority of investments. These plans
cannot be implemented at once. As a result, a programming process needs to be
undertaken whereby the different investments are phased in year by year.
A range of planning and prioritization procedures are outlined here, but keeping
in mind there is no magic formula. What will work well in one country, or con-
text, may be inappropriate in another. A traffic-based transport cost savings ap-
proach to road planning will be easy to apply in a densely populated country
where all year round access is in place and traffic levels are moderate to high, but
Executive Summary
xv
much more difficult to apply in sparsely populated rural areas where basic vehicle
access is the main problem.
It is only by undertaking a comparative analysis of plausible alternative solutions
that we can be sure that financial resources are not going to be wasted. Limited
funding for implementation is often a major constraint. Too often, no compara-
tive analysis is undertaken and unnecessarily expensive solutions are chosen for
rural road investment, which means that there may be far fewer beneficiaries, for
the available funds, than may be achieved by using more appropriate alternatives.
Fundamental to all rural transport planning is a need for adequate data and
properly trained staff. However, they are both too often lacking, particularly at the
district level. In this case, extra resources are needed to collect traffic and other
data as well as to provide training for planning and engineering staff in the tech-
niques of transport planning. It is essential that they must be able to identify realis-
tic alternatives and subject them to analysis to determine the best options. It is
only when this has been achieved that proper planning processes can be undertak-
en for both locally funded and donor funded programs.
This paper outlines a range of measures and procedures to plan and improve rural
transport infrastructure and services (Cost Effectiveness and Ranking Criteria,
iRAP, HDM-4, and the Roads Economic Decision model (RED). A new planning
procedure, the Rural Transport Prioritization Framework is introduced, primarily
to assist with planning transport service initiatives. All approaches have strengths
and weaknesses, and no solution will be ideal in all circumstances.
For rural road planning, the most important first objective is to achieve basic vehi-
cle access. This has important economic and social benefits. A spot improvement
approach, whereby the main objective is to achieve all season access is likely to
provide the best value for money where traffic volumes are low. However, a
transport cost-benefit analysis approach is unlikely to work well due to the diffi-
culties of assessing the social and long-term developmental benefits of establishing
basic vehicle access. So where communities are completely cut off, or all season
access is not provided, then road investments may be prioritized by a form of a
cost-effectiveness criterion that takes into account both adjacent population and
traffic. It is important that the initial local screening, within a district, involves
strong community participation. The Taylor and Airey (1999) approach or the
Ghana Feeder Road Prioritization approach are useful examples.

Rural Transport in Africa – Planning Infrastructure & Services
xvi
Once all year round access has been achieved then road investment priorities for
improving earth and gravel roads with low traffic volumes (under 200 AADT) can
be accessed via a transport cost savings approach. The RED model is well suited
for this purpose. If a detailed assessment of road maintenance policies is required,
if higher traffic volumes are to be examined, or paved road solutions are to be in-
vestigated then the HDM-4 model is better suited because of its capacity to exam-
ine road deterioration, alternative structural designs and a wide road works effects.
For both approaches, an initial screening may be undertaken that identifies traffic
volumes and current road condition. Once the RED or HDM-4 analysis has been
undertaken, the final choice of links to improve with available funds should rely
on the NPV/C1 ranking. If there are very significant environmental, social or other
issues that differentially affect the identified choices (particularly when these issues
have not been taken into account through mitigation measures) then additional
multi-criteria analysis may be used to assess the final choice.
If a program is designed to meet a specific wider objective, such as reducing pov-
erty, promote an agricultural target or deal with the consequences of natural disas-
ters or conflicts, then it is best to initially choose regions or districts for investiga-
tion that best meet these criteria. Once the selection made, then more convention-
al transport planning criteria can be taken into account.
Village-based infrastructure, such as pedestrian footpaths, trails, bridges, as well as
non-transport infrastructure (schools, well clinics etc.) should be planned using
the iRAP tool. Here the key measure of access benefits is likely to be the expected
personal travel time savings. Similar projects may be ranked and selected by the
expected time savings divided by costs. The iRAP approach has a number of draw-
backs and it is essential that significant community participation be involved in
establishing priorities.
For transport service solutions, the Framework for Prioritizing Rural Transport
Service Interventions presented in this paper could be used, accompanied, where
appropriate, with a financial analysis of the costs and revenues to users. Govern-
ment sponsored transport service initiatives are likely to involve a very high degree
of uncertainty, that are not easily amenable to conventional analysis. Hence it is
1 Net Present Value over Cost ratio
Executive Summary
xvii
suggested that a range of experts and local stakeholders are involved, using Delphi
techniques, to assess the key benefits and viability of proposed measures.
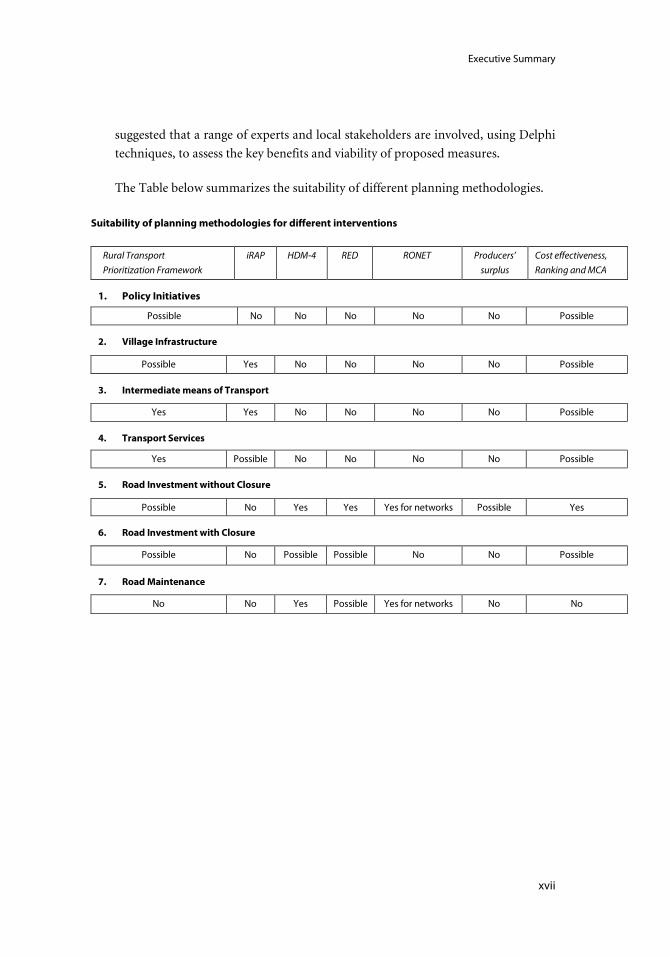
The Table below summarizes the suitability of different planning methodologies.
Suitability of planning methodologies for different interventions
Rural Transport Prioritization Framework
iRAP HDM-4 RED RONET Producers’ surplus
Cost effectiveness, Ranking and MCA
1. Policy Initiatives
Possible No No No No No Possible
2. Village Infrastructure
Possible Yes No No No No Possible
3. Intermediate means of Transport
Yes Yes No No No No Possible
4. Transport Services
Yes Possible No No No No Possible
5. Road Investment without Closure
Possible No Yes Yes Yes for networks Possible Yes
6. Road Investment with Closure
Possible No Possible Possible No No Possible
7. Road Maintenance
No No Yes Possible Yes for networks No No


1
1. Introduction
1.1 Objectives
The purpose of this paper is to provide detailed advice and an overall framework,
for identifying, planning and prioritizing rural transport infrastructure and ser-
vices. The intended audience is officials, planners, economists and engineers who
are concerned with improving the livelihoods of the rural population in Africa.
This work is designed to complement another SSATP publication on rural
transport and its important role for agriculture development in Africa2. That paper
provides a strategic overview of rural transport to help guide government policy at
the highest level, including the interaction of transport with agriculture and other
sectors. In contrast, this paper is more ‘micro’ in scope. It focuses more on how
rural transport interacts with people’s lives and how different types of interven-
tions may be identified, planned and prioritized.
A key element of the paper is to encourage a holistic understanding of rural
transport. There are no precise boundaries as to what constitutes ‘rural transport’
as opposed to ‘national transport’, ‘urban transport’ or ‘inter-urban transport’. In
this paper, the term covers both transport at the village and farm level as well as
the transport services and infrastructure involved with the movement of people
and goods within the village area and between villages, rural markets and urban
areas. Although services and infrastructure can be planned in isolation of each
other, the best long-term results are likely to be achieved if they are improved in
conjunction with each other.
2 SSATP Working Paper No. 93. Rural Transport – Improving its Contribution to Growth
and Poverty Reduction in Sub-Saharan Africa, Banjo et al, 2012.
Rural Transport in Africa – Planning Infrastructure & Services
2
Chapter 1 provides a background to planning rural transport. Chapter 2 looks at
the policy context, the connections between poverty and transport together with a
range of issues affecting transport users. Chapter 3 considers how planning data
can be collected through surveys and consultation. Chapter 4 considers and de-
scribes the planning and cost-benefit tools and procedures for rural road invest-
ment. Chapter 5 identifies transport service interventions and provides a frame-
work for their prioritization. Chapter 6 provides conclusions, recommendations
and the need for further research.
1.2 The Role and Importance of Planning and Prioritization
Clearly, the purpose of a systematic planning and prioritization process is to
achieve the best outcome with the resources available. If the process is based on
reliable data, is easy to understand and transparent, then there is less likelihood for
unwarranted political interference. Better transport planning is one of the key
components in getting the most from resources, to provide year round access,
lower transport costs and lift the rural population out of poverty.
Within the context of planning rural transport infrastructure and service interven-
tions, network plans and master plans are prepared to indicate the viability and
priority of different investment strategies. These plans gradually become out-of-
date but usually have a useful lifetime of five to seven years. Planning is a process
that involves a number of steps, or components:
objectives are identified
relevant data is collected and analyzed
resources and constraints are identified
alternative scenarios (or investment choices or plans) are prepared
various scenarios are compared to see how the objectives can be achieved
with the available resources, taking into account identified constraints
once a final choice made, the plan is put into action and resources are
committed
monitoring of outputs, outcomes and final impacts is then undertaken
Because of funding, capacity and management constraints, plans cannot be im-
plemented at once. As a result, a programming process needs to be undertaken

Introduction
3
whereby the different investments are phased in year by year. Prioritization is the
process by which investments are compared and ranked to define a program. This
may be carried out within the framework of an economic cost-benefit analysis or via
some form of cost effectiveness or ranking process, or a procedure such as inte-
grated Rural Accessibility Planning (iRAP). The prioritization process may involve
multiple stages and may also include the participation of local stakeholders. Com-
prehensively improved rural transport requires the successful interaction of a wide
range of institutions, actors and procedures. There is no magic formula. What will
work well in one country, or context, may be inappropriate in another. For exam-
ple, an ambitious physical target-based approach, such as that adopted in India,
may work well where there is very ample funding for rural roads but be unsuitable
in countries where funding is very scarce. Similarly, a traffic-based transport cost
savings approach to road planning will be easy to apply in a densely populated
country where all year round access is in place and traffic levels are moderate to
high, but much more difficult to apply in sparsely populated rural areas where
basic vehicle access is the main problem.
A range of planning and prioritization procedures had therefore to be outlined.
To get the best results, comprehensive data collection and systematic planning is
required. Where there is ample funding for planning, a wide range of data may be
collected and analyzed, and detailed cost-benefit analysis may be possible. Howev-
er, where funding is limited and planning resources remain scarce it may be neces-
sary to rely more on secondary data, and guestimates, and a more limited analysis
may have to be carried out. In both cases, the overall objective should still be the
same, to get the best results from limited resources that are available. Undertaking
a comparative analysis of plausible alternative solutions is the mean to ensure that
resources are not going to be wasted. Unfortunately, too often, no comparative
analysis is undertaken, and too often (for rural road investment) unnecessarily
expensive solutions are chosen with may be far fewer beneficiaries, for the availa-
ble funds, than may be achieved by using more appropriate alternatives.


5
2. The Rural Transport System in Africa: Setting the Context
for Planning
Inadequate rural transport is a major factor contributing to the poverty of the ru-
ral population of most developing countries. It is estimated that over 900 million
people worldwide do not have access to a all-season road and about 300 million do
not have motorized access at all. For large parts of rural Africa walking and head-
loading are by far the most important means of transport, most of this effort being
undertaken by women. There is often very limited choice in both motorized and
non-motorized transport such as bicycles, carts, camels and donkeys and where
motorized transport services are provided these tend to be infrequent, expensive,
unreliable, crowded and unsafe.
The main components of rural transport considered here are:
Movement of goods and people, in and around the village
Village-based infrastructure
Location of local facilities
Intermediate means of transport – including non-motorized transport
Commercial transport services to markets and towns
Emergency and health transport services
Rural roads
The overwhelming majority of external funding that goes into rural transport ini-
tiatives is for rural roads. For example, over 98 percent of World Bank lending in
rural transport is for road building and maintenance (Tsumagari, 2007). However
it has been argued by many (e.g. “Roads are not Enough”, Dawson & Barwell,
1993) that much greater attention needs to be given to the other components of
rural transport systems. Substantial coverage will be given here to the planning
and prioritization of both roads and the other components.

Rural Transport in Africa – Planning Infrastructure & Services
6
2.1 The Role of Transport Policy
It is relatively rare for a government to prepare a separate rural transport policy or
strategy document. The topic is usually covered within national transport policy
and strategy documents. A good example is the Rural Transport Strategy prepared
for South Africa (Republic of South Africa, Department of Transport, 2007) and
rural transport policy and strategy statements have also been recently prepared for
Nigeria (Federal Ministry of Agriculture and Rural Development, 2013), Uganda
(Republic of Uganda, Ministry of Works and Transport, 2013) and Tanzania (See
below). Advice on the preparation of a rural transport policy is given by Banjo and
Robinson (1999). Important government policy statements may also be found in
other documents, particularly in Poverty Reduction Strategy Papers (PRSP).
An Example of National Transport Policy Statements
The Vision:
“To have an efficient and cost effective domestic and international transport services to all segments of the population and sectors of the national econ-omy with maximum safety and minimum environmental degradations.”
The Mission:
“To develop safe, reliable, effective, efficient and fully integrated transport in-frastructure and operations which will best meet the needs of travel and transport at improving levels of service at lower costs in a manner, which supports government strategies for socio-economic development, whilst be-ing economically sustainable”.
Source: Ministry of Transport and communications, United Republic of Tanzania, National
Transport Policy 2002.
Within many government papers, the terms ‘transport policy’ and ‘transport strat-
egy’ are often used interchangeably to cover the same material. When distinction is
made, the term policy covers goals and objectives as well as overall guiding princi-
ples while the term strategy provides details on specific measures, can also cover an
action timetable and may outline which institutions and departments are respon-
sible for implementation. General advice on the preparation of a National
Transport Strategy is given by Lee and Hine (2008).
Although it may be possible to plan very common interventions (like rural roads)
without a policy or strategy, this is extremely difficult for other types of interven-
The Rural Transport System in Africa
7
tions. It is important to understand the detailed objectives of the government, as
well as the institutional structure and the legal framework. Many interventions
(e.g. those relating to commercial transport services) may require changes in legis-
lation to implement.
Over the last thirty years, common major changes in transport policy in the road
sector have been along the following lines: Delegation of day-to-day management
away from central ministries to legally constituted authorities and agencies/bodies
like Road Funds and Road Agencies, while ministries retain policy and oversight
responsibility; commercialization of the road sector; decentralization; and provi-
sions covering public-private partnerships. These changes have been met with var-
ying degrees of success. Where a strong institution has been set up with a strong
revenue stream (e.g. road funds and some road authorities) there has been a rec-
ord of success. However, where the revenue stream or the administration has
proved weak, as for example for some local authorities, then the changes have not
been so successful. In fact, very often there has been very considerable delays in
implementing some aspects of policy, such as with decentralization (e.g. Feeder
Roads in Ghana).
2.2 Connections between Rural Transport and Poverty Reduction
Before further developing an approach to planning, it is necessary to understand
the nature of the problem. A systematic problem diagnosis can help with designing
the most appropriate package of interventions that can address the key constraints.
Effective rural transport planning, particularly when addressing service issues but
also the wider aspects of infrastructure planning, requires a great deal of back-
ground data and information to assess priorities but also to provide a measure of
the scale of interventions required. To help with the planning process, this section
explores the connections between rural transport and poverty reduction, and pro-
vides and discusses a range of data and issues relating to the rural population and
their use of and interaction with different forms of transport.
Isolation is a strong contributor to poverty (Stifel and Minton, 2008). Good access
to markets and basic services is essential for its eradication. Because of the high
proportion of the poorest sections of the population living in rural areas, Poverty
Reduction Strategy Papers often articulate the need to increase rural livelihoods
through a range of measures including improving rural accessibility. They also
usually stress the need to meet the Millennium Development Goals (MDGs).

Rural Transport in Africa – Planning Infrastructure & Services
8
However, none of the MDGs directly mention transport, even if in most instances
it would be impossible to achieve the goals without an extensive and relatively effi-
cient rural transport system.
Breaking the Vicious Circle of Rural Transport and Poverty
It is useful to think of rural transport as a system in equilibrium with many inter-
acting components. Key outputs are mobility rates, the distance people have to
walk to roads and access services, goods traffic levels, transport fares & tariffs and
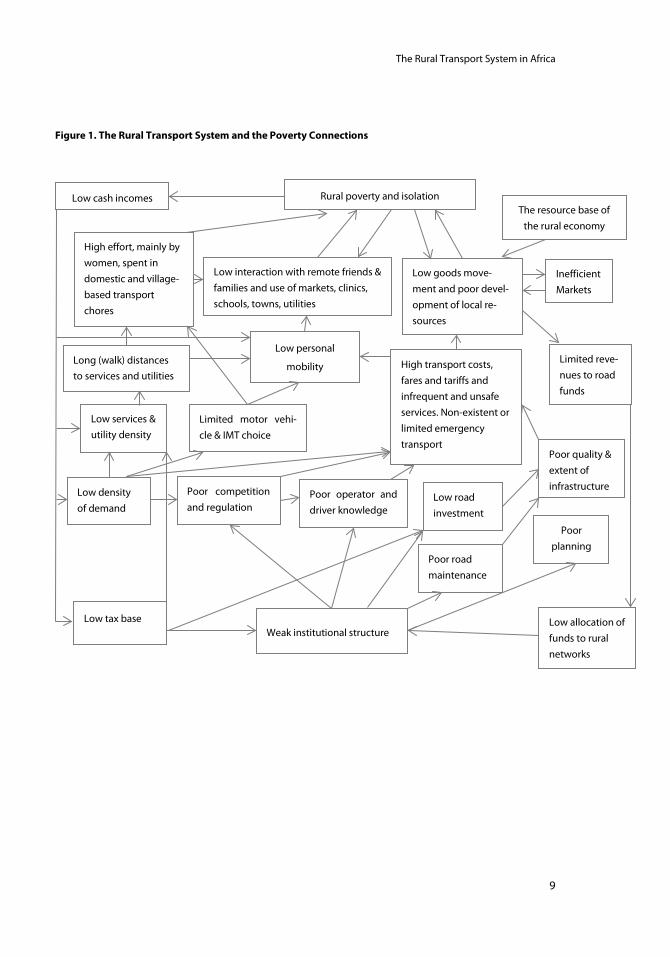
the availability of different modes. The diagram below (Figure 1) is a representa-
tion of the complexity of such a system.
Infrequent and high cost transport services lead to low mobility rates and poor
interaction with markets and services as well as low goods movement and devel-
opment of resources. Because of the lack of affordable alternatives a huge personal
effort is spent on transport, mostly by women. These factors, in turn, lead to poor
health and education outcomes and to poverty; and so the circle is completed.
Individual interventions, such as a rural road investment program, can help to
adjust the system of relationships and lead to a new equilibrium with perhaps low-
er transport costs & tariffs, and lower levels of poverty. However, without long-
term secure funding for maintenance the quality of the network will decline and
revert to previous levels. If there is poor competition and regulation of transport
services then the benefits of improved infrastructure may be limited and not
passed on to the rural population.
To a large extent, the problems of rural transport are manifestations of a wider
vicious circle of rural poverty. Low incomes, a low tax base and a poor institution-
al structure lead to a poor quality of infrastructure, low investment, and poor
maintenance. A low density of demand coupled with poor infrastructure lead to
low transport productivity and infrequent and high cost transport services.
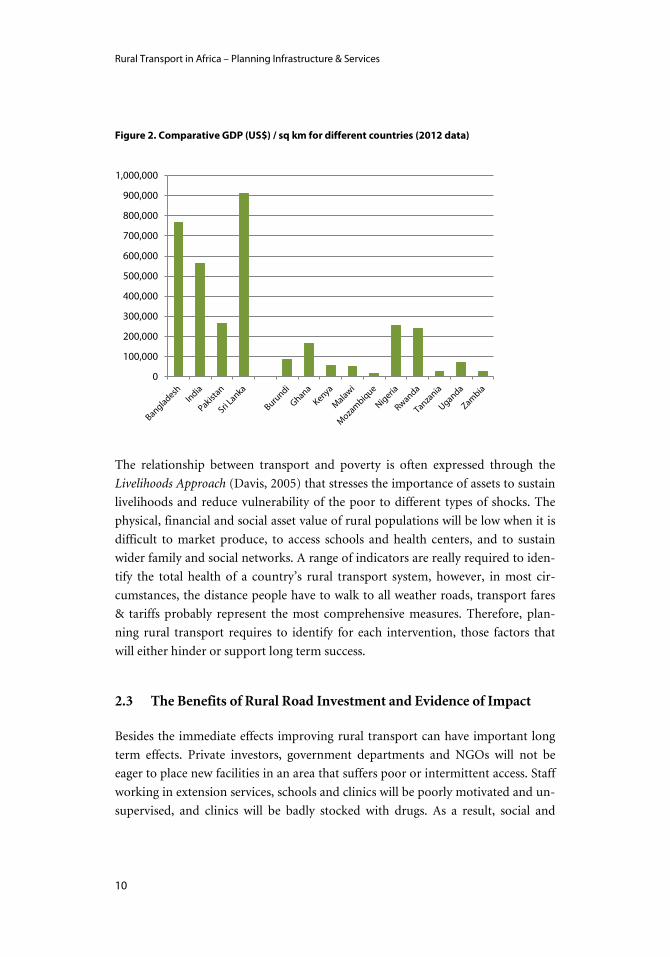
Africa needs strong rural transport to support efforts to reach levels of economic
productivity required to alleviate poverty. Figure 2 shows GDP per square km for
selected countries in Asia and Africa. The very low density of economic activity for
many African countries, compared with those in Asia is apparent.
The Rural Transport System in Africa
9
Figure 1. The Rural Transport System and the Poverty Connections
Low personal
mobility High transport costs, fares and tariffs and infrequent and unsafe services. Non-existent or limited emergency transport
Poor quality & extent of infrastructure
Poor road maintenance
Low road investment
Poor competition and regulation
Poor planning
Poor operator and driver knowledge
Low goods move-ment and poor devel-opment of local re-sources
Low interaction with remote friends & families and use of markets, clinics, schools, towns, utilities
Limited motor vehi-cle & IMT choice
Inefficient Markets
The resource base of the rural economy
Limited reve-nues to road funds
Low allocation of funds to rural networks
Low cash incomes Rural poverty and isolation
High effort, mainly by women, spent in domestic and village-based transport chores
Long (walk) distances to services and utilities
Low density of demand
Low tax base Weak institutional structure
Low services & utility density
Rural Transport in Africa – Planning Infrastructure & Services
10
Figure 2. Comparative GDP (US$) / sq km for different countries (2012 data)
The relationship between transport and poverty is often expressed through the
Livelihoods Approach (Davis, 2005) that stresses the importance of assets to sustain
livelihoods and reduce vulnerability of the poor to different types of shocks. The
physical, financial and social asset value of rural populations will be low when it is
difficult to market produce, to access schools and health centers, and to sustain
wider family and social networks. A range of indicators are really required to iden-
tify the total health of a country’s rural transport system, however, in most cir-
cumstances, the distance people have to walk to all weather roads, transport fares
& tariffs probably represent the most comprehensive measures. Therefore, plan-
ning rural transport requires to identify for each intervention, those factors that
will either hinder or support long term success.
2.3 The Benefits of Rural Road Investment and Evidence of Impact
Besides the immediate effects improving rural transport can have important long
term effects. Private investors, government departments and NGOs will not be
eager to place new facilities in an area that suffers poor or intermittent access. Staff
working in extension services, schools and clinics will be poorly motivated and un-
supervised, and clinics will be badly stocked with drugs. As a result, social and
0
100,000
200,000
300,000
400,000
500,000
600,000
700,000
800,000
900,000
1,000,000

The Rural Transport System in Africa
11
economic development will be constrained. Improving accessibility, and transport
services can break this ‘log-jam’.
Economic theory indicates that road investment is most likely to stimulate rural
development if it induces a relatively large change in transport costs, and if there
are unused resources of land and labor to exploit, and dynamic urban markets to
absorb new production. However, despite a consensus on the importance of rural
roads for development, there is surprisingly little hard evidence to validate the
theory on the size and nature of their benefits and distributional impacts. Among
many studies of the impact of rural road investment, there have been relatively few
that have been carried out with proper controls and subject to rigorous analysis
and statistical testing (de Walle, 2008). Perhaps the most widely quoted research
into the impact of rural roads has been work carried out by the International Food
Policy Research Institute (IFPRI) under the leadership of Shenggen Fan3. The ap-
proach adopted has been through an analysis of disaggregated national data on
household incomes with forms of public expenditure (agricultural research, roads,
electricity supply, irrigation, health) which has shown a close relationship between
the development of rural roads, and income growth and poverty reduction.
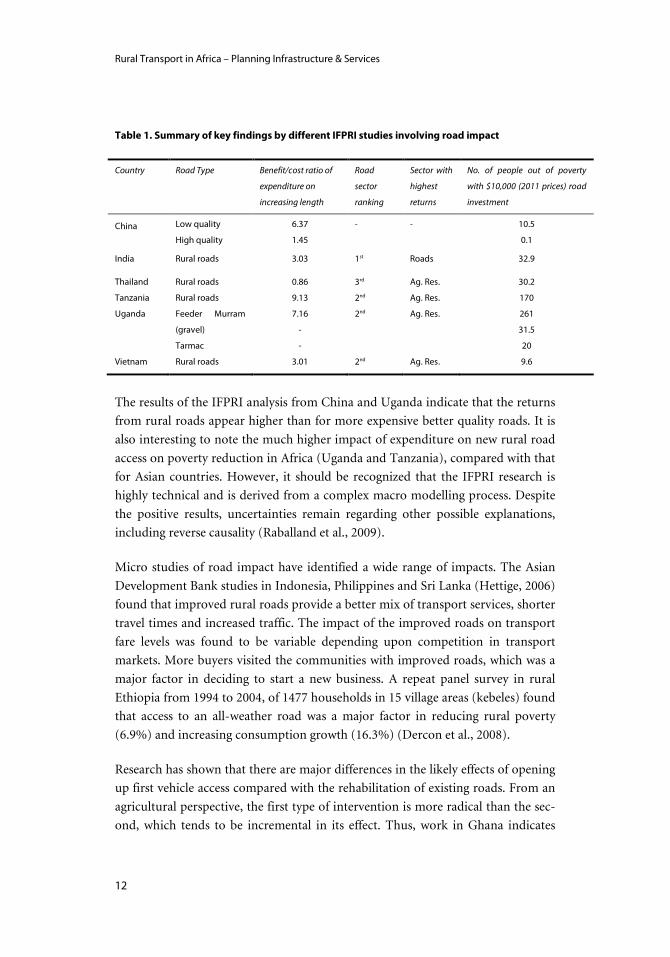
A key result of several IFPRI studies is that rural roads are second to agricultural
research in terms of benefit-cost ratio of expenditures (Table 1). Table 1 also
shows the capacity of rural road improvements to lift rural people out of poverty.
The Benefit Cost ratios should be interpreted in terms of returns to expenditure on
providing new access rather than total expenditure on roads, because the original
analysis was based on differences that increased road length has on measures of
regional, or district, household income. Further, it should not be assumed that
benefits are exclusively rural in character. There is a good chance that a significant
proportion of the benefits will stem from an improvement in urban incomes.
3 Significant studies have been carried out in China (Fan and Chan-Kang, 2004) Vietnam
(Fan, Huong and Long), India (Fan, Hazell and Thorat, 1999), Uganda (Fan, Zhang, and
Rao, 2004), Tanzania (Fan, Nyange and Rao, 2005), Thailand (Fan, Jitsuchon and
Methakunnavut, 2004).
Rural Transport in Africa – Planning Infrastructure & Services
12
Table 1. Summary of key findings by different IFPRI studies involving road impact
Country Road Type Benefit/cost ratio of
expenditure on
increasing length
Road
sector
ranking
Sector with
highest
returns
No. of people out of poverty
with $10,000 (2011 prices) road
investment
China Low quality
High quality
6.37
1.45
- - 10.5
0.1
India Rural roads 3.03 1st Roads 32.9
Thailand Rural roads 0.86 3rd Ag. Res. 30.2
Tanzania Rural roads 9.13 2nd Ag. Res. 170
Uganda Feeder Murram
(gravel)
Tarmac
7.16
-
-
2nd Ag. Res. 261
31.5
20
Vietnam Rural roads 3.01 2nd Ag. Res. 9.6
The results of the IFPRI analysis from China and Uganda indicate that the returns
from rural roads appear higher than for more expensive better quality roads. It is
also interesting to note the much higher impact of expenditure on new rural road
access on poverty reduction in Africa (Uganda and Tanzania), compared with that
for Asian countries. However, it should be recognized that the IFPRI research is
highly technical and is derived from a complex macro modelling process. Despite
the positive results, uncertainties remain regarding other possible explanations,
including reverse causality (Raballand et al., 2009).
Micro studies of road impact have identified a wide range of impacts. The Asian
Development Bank studies in Indonesia, Philippines and Sri Lanka (Hettige, 2006)
found that improved rural roads provide a better mix of transport services, shorter
travel times and increased traffic. The impact of the improved roads on transport
fare levels was found to be variable depending upon competition in transport
markets. More buyers visited the communities with improved roads, which was a
major factor in deciding to start a new business. A repeat panel survey in rural
Ethiopia from 1994 to 2004, of 1477 households in 15 village areas (kebeles) found
that access to an all-weather road was a major factor in reducing rural poverty
(6.9%) and increasing consumption growth (16.3%) (Dercon et al., 2008).
Research has shown that there are major differences in the likely effects of opening
up first vehicle access compared with the rehabilitation of existing roads. From an
agricultural perspective, the first type of intervention is more radical than the sec-
ond, which tends to be incremental in its effect. Thus, work in Ghana indicates
The Rural Transport System in Africa
13
that the improvement or rehabilitation of an existing rural road has a negligible
impact on agricultural prices but the upgrading of a footpath to a road providing
vehicle access has a potential beneficial effect that is in the order of a hundred
times that of improving the same length of an existing road. This is measured in
terms of the change in farm gate prices as farmers and traders shift from head
loading to motorized vehicles to buy and sell their crops (Hine, Riverson and
Kwakye, 1983).
A study in Peru has found substantial synergies when roads and other infrastruc-
ture are provided together (World Bank, 2006). Clearly, there is a case for road
investment to be planned and supplied with other forms of infrastructure such as
water, sanitation, electricity and telecommunications. However, with limited
budgets there are likely to be equity issues if all public investment is restricted to
certain favored localities.
The benefits of road investment are not confined to economics. Levy (2004) found
that in Morocco improved roads led directly to an improvement in the quality of
education. It was easier to recruit and retain teachers and absenteeism of both
teachers and students dropped. Similarly, the rural population doubled their use
of health care services, the supply of medicine improved and it became easier to
implement immunization programs. Women and girls benefited from the provi-
sion of all-weather access roads. Girls’ enrolment in primary education trebled,
very largely because, with the improved roads, butane gas became affordable and
the daily collection of firewood for cooking and heating was no longer necessary.
An analysis of data in Pakistan also suggests that the presence of an all-weather
road in a village is associated with higher school enrolment rates. The enrolment
rate for girls living in villages with all-weather road access was 41 percent com-
pared with 27 percent for those living in villages without. Higher immunization
and more births assisted by a skilled attendant were also found to be associated
with the presence of all-weather roads (Essakali, 2005).
2.4 The Institutional Structure of Rural Transport
Stakeholders
The main stakeholders involved with rural transport include rural communities,
transport operators, farmers, entrepreneurs, health workers, schoolteachers, exten-
sion workers, NGOs, road and river transport authorities, road fund organization,
police, local and regional and central government administrations, etc. However,

Rural Transport in Africa – Planning Infrastructure & Services
14
local transport that takes place within vicinity of the village and farm is very largely
the sole responsibility of the rural community. Local authorities can have an im-
pact through for example, the assistance to help improve footpaths and pedestrian
bridges. However, for out-of-village transport a much wider range of stakeholders
and institutions become involved.
Infrastructure
There is a wide range of organizational structures used to cover essential functions
for the effective management of the rural road network. The core network ‘owner-
ship’ is usually vested in a central government department, regional or local gov-
ernment, or a roads authority. For lower level village roads, tracks, paths and trails
effective control, if not formal legal ‘ownership’, is most often in the hands of the
local community. The importance of local sense of ownership in the management
of the local network is stressed by Malmberg Calvo (1998).
In some countries (e.g. Ethiopia), one body may be legally responsible for defining
the whole road network even though responsibility for management may be split
between a range of different bodies. Road finance usually comes from the central
government, from local government taxes, donor program, or from a road fund
administration. Most planning, work programming, setting standards and central
administration is undertaken by publicly employed staff but there are examples
(e.g. for local authorities in the UK) where these functions are being fulfilled under
management contracts.
The decentralization of the management of the rural road network has been a ma-
jor trend over the last few years. The identified advantages are that priority setting
and planning will be more responsive to the needs of the rural population. The
observed difficulties have been that proper authority is often not transferred to
lower levels of government, making it difficult to legally administer contracts. Al-
so, local authorities will rarely have sufficient technically qualified staff—
particularly with experience of transport planning, and suitable funding arrange-
ments are often not in place.
IMT and Transport Services
Most rural transport services in Africa are supplied by small scale ‘informal’ com-
mercial transport operators often using small minibuses and trucks. The pattern of
public transport operations tends to be very different from urban and interurban
operations where large-scale companies often predominate. The revenues of rural

The Rural Transport System in Africa
15
public transport operators are almost entirely derived directly from their custom-
ers. This is in contrast to rural public transport operations in developed countries
that are invariably subsidized through various contractual arrangements with local
governments. Although entry into the market is usually fairly cheap (the cost of an
old second-hand vehicle) often local associations restrict operational supply
through the control of lorry and bus fleets.
The regulation of drivers, transport vehicles and services, is undertaken in most
countries either by a national road traffic licensing office or by an office of local
government. These authorities will register vehicles, issue driving licenses, road
worthiness certificates and collect annual vehicle taxes. Authority to offer com-
mercial services will often be provided by licensing office or regulator. In many
countries IMT, particularly bicycles, may be registered and taxed alongside motor-
ized vehicles. The more rural and remote an area is so, the less likely that regula-
tions will be monitored or enforced by the police.
2.5 The Range of Transport Choices
Although the position is changing quickly, it has often been observed that much of
rural Africa has traditionally had far fewer different types of transport vehicle, both
motorized and non-motorized, than rural Asia. For example in 1985, it was re-
ported that Sub-Saharan Africa had 35 bicycles per 1000 inhabitants, compared to
400 per 1000 in South Asia (Starkey, 2001). At the most extreme, in the forest re-
gion of Ghana for example, one used to find little else other than a mummy wagon
(typically a three-ton truck) with a wooden body converted for both passenger and
freight cargo, and pedestrian transport, where goods, if not transported by mum-
my wagon, were head loaded.
A number of factors influence the availability of transport. Where there is a stable,
high density of demand, as in much of Asia, it is possible for many different forms
of transport to coexist—each finding its own niche in the market. Likewise, where
population density is lower, it is much more difficult to keep pathways open and
level for the easy use of transport aids and IMT. Cultural factors can also play a
part. In Southern Ghana, bicycles are often viewed as symbols of ‘low status”,
while in Northern part, they have been more popular (Turner et al. 1995).

Rural Transport in Africa – Planning Infrastructure & Services
16
Women and the Use of Intermediate Means of Transport
A number of studies have looked at how women might benefit from a better use of
transport technology (see, for example, Fernando and Porter, 2002). Overwhelm-
ingly, it appears that men (and boys) are able to adopt and make more intensive
use of transport technology than women. The reasons for these gender differences
relate to a number of interrelated factors, e.g. women spend a great deal of time
multi-tasking, which gives them less time during the day to make full commercial
use of the technology. Hence, for women that are constrained in this way, the fi-
nancial returns from using transport technology, are likely to be lower, than for a
man. Furthermore, women tend to have far less access to credit and funds for in-
vestment than men, and there may be cultural reasons that prevent women using
technology, e.g. riding bicycles or motorcycles (Fernando and Porter, 2002).
The Current Position and the Recent Growth of Motorcycle Transport
Undoubtedly, the biggest change in rural transport taking place in Africa is the
growth of motorcycles. In December 2005, there were 31,006 motorcycles regis-
tered in Tanzania and by December 2010, this number raised to 323,192 (Ministry
of Infrastructure Development, 2010). This is equivalent to an annual growth rate
of 60 percent per year. Although they are not formally licensed for hire, many mo-
torcycles are used in East Africa in boda-boda4 taxi use operations. In rural areas,
they are mostly used to carry passengers and freight, on journeys between a bus
stop and more remote locations away from conventional bus routes. In a study in
Tanzania (Starkey et al., 2013) rural motorcycle passenger fares were found to be
between 17 US cents and 34 US cents, per km, in comparison rural bus fares were
between 3.5 US cents and 4.7 US cents, per km.
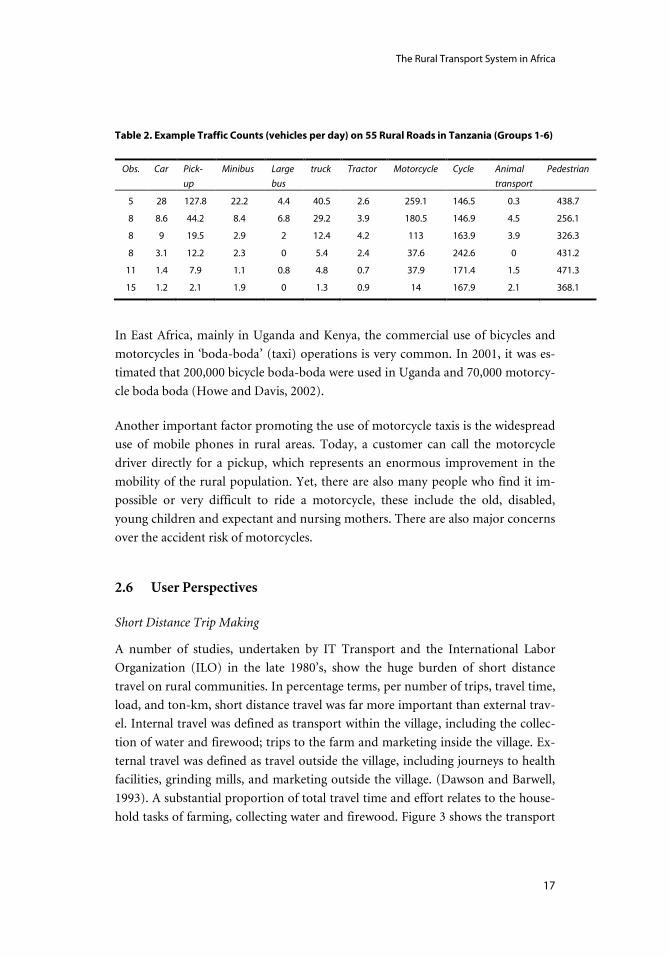
Recent surveys of 55 district and regional roads in Tanzania (IT Transport, 2013)
illustrate the growing importance of motorcycles and bicycles in rural transport.
An example of traffic composition is shown below, motorcycles exceeding bicycles
on 20 percent of the roads. The data is grouped in descending order of motorized
traffic with Group 1 having the most motorized traffic and Group 6 the least.
4 From English border-border.
The Rural Transport System in Africa
17
Table 2. Example Traffic Counts (vehicles per day) on 55 Rural Roads in Tanzania (Groups 1-6)
Obs. Car Pick-up
Minibus Large bus
truck Tractor Motorcycle Cycle Animal transport
Pedestrian
5 28 127.8 22.2 4.4 40.5 2.6 259.1 146.5 0.3 438.7
8 8.6 44.2 8.4 6.8 29.2 3.9 180.5 146.9 4.5 256.1
8 9 19.5 2.9 2 12.4 4.2 113 163.9 3.9 326.3
8 3.1 12.2 2.3 0 5.4 2.4 37.6 242.6 0 431.2
11 1.4 7.9 1.1 0.8 4.8 0.7 37.9 171.4 1.5 471.3
15 1.2 2.1 1.9 0 1.3 0.9 14 167.9 2.1 368.1
In East Africa, mainly in Uganda and Kenya, the commercial use of bicycles and
motorcycles in ‘boda-boda’ (taxi) operations is very common. In 2001, it was es-
timated that 200,000 bicycle boda-boda were used in Uganda and 70,000 motorcy-
cle boda boda (Howe and Davis, 2002).
Another important factor promoting the use of motorcycle taxis is the widespread
use of mobile phones in rural areas. Today, a customer can call the motorcycle
driver directly for a pickup, which represents an enormous improvement in the
mobility of the rural population. Yet, there are also many people who find it im-
possible or very difficult to ride a motorcycle, these include the old, disabled,
young children and expectant and nursing mothers. There are also major concerns
over the accident risk of motorcycles.
2.6 User Perspectives
Short Distance Trip Making
A number of studies, undertaken by IT Transport and the International Labor
Organization (ILO) in the late 1980’s, show the huge burden of short distance
travel on rural communities. In percentage terms, per number of trips, travel time,
load, and ton-km, short distance travel was far more important than external trav-
el. Internal travel was defined as transport within the village, including the collec-
tion of water and firewood; trips to the farm and marketing inside the village. Ex-
ternal travel was defined as travel outside the village, including journeys to health
facilities, grinding mills, and marketing outside the village. (Dawson and Barwell,
1993). A substantial proportion of total travel time and effort relates to the house-
hold tasks of farming, collecting water and firewood. Figure 3 shows the transport

Rural Transport in Africa – Planning Infrastructure & Services
18
burden in terms of tone-km, whereas women share a disproportionate large share
amounting to 85 percent of the burden.
Figure 3. The Transport Burden for Men and Women in Makete, Tanzania
The huge amount of time spent on transport tasks particularly by women, repre-
sents one of the biggest opportunities to improve rural transport in Africa. Even a
small reduction in this burden could significantly affect time available for agricul-
ture and other activities. The SSATP Resource Guide on mainstreaming gender in
transport provides further advice on the subject of gender and transport5.
Isolation from Transport Services and the Road Network
In 2005, a ‘Rural Access Index’ (RAI) was developed to monitor progress in
achieving the different MDG targets. The RAI measures the proportion of the rural
population who live within 2 km (equivalent to 20 minutes’ walk) of an “all-
season” road motorable all year round by the prevailing means of rural transport.
As shown in Figure 4, Sub-Saharan Africa is believed to have the worst accessibility
of any populated region of the world.
The RAI is important, as it is the only transport indicator required in the IDA
/World Bank reporting process. It can be measured by household surveys or via
mapping and engineering surveys. The definition of ‘all season’ remains subject to
interpretation. It is sometimes accepted to be a paved road, while other surveys
may accept good quality gravel roads. It appears that the RAI, as currently inter-
5 www.ssatp.org/sites/ssatp/files/publications/HTML/Gender-RG/index.html

The Rural Transport System in Africa
19
preted, will not cover an ungraveled “basic access” road that may in fact provide
“all-season” passability, because of the higher roughness values and poorer quality.
Figure 4. The Rural Access Index Estimated for 2007
The RAI was primarily developed as a measure of social access. However, based on
research in Burkina Faso, Cameroon and Uganda, Raballand et al (2010) have cau-
tioned that the RAI may not be used as a major economic tool for planning. It is
argued that the 2 km index is not a real economic threshold and may result in
overinvestment and waste of funds, and maybe should be increased to 5 km.
A further point to bear in mind is that even if a village is located on a reasonable
quality road, this is no guarantee that the residents will have easy access to motor-
ized transport services. Surveys in Ghana and Malawi found that 30-40 percent of
the rural population have to walk more than 4 km and sometimes up to 20 km to a
vehicle pick up point, often located at a road junction, to be guaranteed a reasona-
ble chance of getting onto a bus or truck (Hine and Rutter, 2000).
Transport Services for Health
The greatest concerns of rural women are how to get to a health center or hospital
in an emergency, particularly relating to childbirth. This was particularly apparent
in consultative work carried out for the development of the Ghana Feeder Road
Prioritization Procedure (Hine et al, 2002). Emergency transport has ramifications
for road planning, particularly in the case of seasonal impassability, as well as for
transport services.
Rural Transport in Africa – Planning Infrastructure & Services
20
Improving maternal health is one of a key MDG targets. Sub-Saharan Africa has a
lifetime maternal death rate of 1:39 compared with 1:4,700 in industrialized coun-
tries. In 2010, in Sub-Saharan Africa there were 500 maternal deaths per 100,000
live births, a total of 162,000 deaths (World Health Organisation, 2012). A major
problem is the delay in getting to hospital and receiving proper medical attention.
It is estimated that 75 percent of maternal deaths could be prevented through
timely access to childbirth-related care, facilitated by transport (World Bank,
2008). Another health-related issue of concern (particularly for women and girls)
that needs further research is the effect of carrying heavy loads on long-term
health and physical development (Porter, 2013).
A number of initiatives and schemes have been set up to deal with health and
transport issues. In Malawi and Zambia, TRANSAID for instance has been work-
ing with local communities to provide bicycle and motorcycle ambulances. Riders
for Health which works in seven African countries provides specialized training in
the maintenance of vehicles for health staff. Likewise, the Partnership for Reviving
Routine Immunization in Northern Nigeria, Maternal, Newborn and Child Health
Initiative in association with TRANSAID, has been working with the National Un-
ion of Road Transport workers to train (elementary) drivers for emergency trans-
portation of women in labor to the closest hospital. Compensation is paid to the
driver for the cost of fuel only. Between January 2010 and May 2012, 5,515 emer-
gency transfers were recorded. (Adamu et al., 2012).
Transport Services for Education
For primary schools in remote rural areas, school enrolment and attendance will
be affected by travel distance. There is evidence to suggest that travel distance to
school is an important factor on attendance (Porter et al., 2011). Long journey
distances are likely to have a differential impact on girls’ education. Once girls
reach puberty they may be considered at greater risk when traveling to school
(Porter, 2013).
Data from South Africa found 76 percent of ‘learners’ walked to their destination
and that 3 million out of 16 million spent more than an hour per day walking to
and from school. A multi-sectoral approach may be required to improve the situa-
tion with measures to enhance transport for children and sensitize teaching staff to
this issue (Porter, 2013).

The Rural Transport System in Africa
21
Transport for People with Disabilities and the Elderly
The burden of lack of access to mobility aids and rehabilitation services is com-
pounded for disabled people and the elderly. Disability and poverty are closely
linked in many developing countries. Typically, the incidence of disability is more
than twice as high among the lowest income groups than among the others. Disa-
bility leads to exclusion from education and employment opportunities, causing
further hardship. Social and cultural attitudes can also exclude people with disabil-
ities from mainstream society. In India, it was estimated that only 5 percent of the
estimated 10 million people who have difficulty moving about receive wheelchairs
or other devices and the additional services they require (TRL Ltd, 2004a).
Both disabled people and the elderly face particular severe challenges when trying
to access rural transport services. Both groups will face difficulties in getting to
transport stops and into vehicles (Porter, 2013). Overall, there is very little data on
the travelling patterns of the elderly and people with disabilities in rural Africa.
2.7 Transport Costs and Prices
Key definitions are important for transport costs and prices.
Vehicle Operating Costs (VOCs): These include the various variable and
fixed costs paid by a transport operator to operate a vehicle.
Transport Costs: These are the costs a transport operator incurs when
transporting a cargo, including VOCs and other costs such as value of
time for passengers and freight or payments at checkpoints.
Transport Prices / Fares & Tariffs: These are the rates charged by a
transport /freight company to the final customer. They include transport
costs, operator’s overheads and profit margin. They will exclude subsidies
paid to the company.
A number of parameters affect transport costs and prices, namely:
Load and Distance: The greater the load and the longer the distance, the
lower the possible average costs measured on a ton/km basis.
Mode of Transport: Small modes of transport (head loading, IMT) have a
comparative advantage, and lower costs for small loads and short distance
Rural Transport in Africa – Planning Infrastructure & Services
22
transport. Large buses and big trucks have the advantage for heavy loads
and long distance transport and provide the lowest costs per ton/km.
Road Characteristics: The alignment, type and quality of the road surface
will affect transport costs, through the effects on speed, fuel consumption
and vehicle maintenance costs.
Geographical Dimension: A number of studies have shown, for the same
type of transport, that African freight transport costs are many times
higher than in Asia.
Clearly, transport tariffs will be dependent on road characteristics, consignment
size and the overall density of demand, including the probability of return loads.
Transport tariffs on main roads are likely to be lower than on minor roads, be-
cause the density of traffic will mean less waiting time to find a load. It is also
common to find passenger fares increasing in the wet season for poor quality
roads. For example, a study in Tanzania found fares increasing by between 40 per-
cent and 67 percent (Ellis and Hine, 1997).
Modelling VOCs of Rural Vehicles
To compare different types of rural transport vehicles, Crossley and Ellis (1996)
developed a model to estimate vehicle operating costs. Results show that a bicycle
has the lowest operating costs (for short distances) only where demand is 10 tons,
per year, and below. For a 10 km trip, the ox cart has an advantage between 10 and
250 tons, while the farm vehicle (the Itaen built in Thailand) has the lowest costs
between 250 and 1,500 tons, per year. Trucks have an advantage at higher levels of
demand and longer trip distances.
Road Appraisal Models such as HDM-4 and RED calculate vehicle operating costs
as a function of road alignment, road width, traffic volume and road roughness.
For low volume rural roads, road roughness is the most important factor govern-
ing the variation in VOC. However, not all road characteristics are modelled, so
the probability of getting stuck in mud, or the probability of road closure because
of flooding are not covered.
Perceived Values of Time and the Costs of Head Loading
Despite its importance, there is remarkably little research or documented evidence
on the personal value of time (for walking, riding in a vehicle, or load carrying) in
Africa. An exception is work carried out by IT Transport in 2005 that undertook a

The Rural Transport System in Africa
23
detailed study of rural values of time in Yendi District (a relatively poor district) in
Ghana and the Moshi District (a relatively prosperous one) in Tanzania. The re-
sults of stated preference surveys show the average in vehicle values of time were
equivalent to 64 percent of the wage rate in Ghana and 49 percent in Tanzania.
Although there is little documentary evidence on the cost of head loading in Afri-
ca, it could be 10 to 30 times the cost of transport by truck. From studies carried
out in Ghana and elsewhere it was estimated that it takes two person-days to move
one ton-km; using a minimum wage rate this amounted to some $2 to $2.5 per
ton-km. In comparison, it was estimated that on rural roads trucking would cost
$0.2 per ton-km (1991 prices) (Lebo and Schelling 2001). Thus moving goods by
head loading was estimated to cost 10 to 12 times as much per ton-km than by
truck. An earlier analysis found that head loading charges of moving a bag of
maize in rural Ghana were about 30 times more expensive, per ton-km than typi-
cal distance movement by a full, medium truck. (Hine, Riverson and Kwakye,
(1983b). Starkey et. al. (2002) indicate a cost of $1.5 per ton-km for head loading.
Differences between Africa and Asia
Studies confirm that freight transport tariffs, for comparable journeys, are up to
six times higher in Africa than in Asia. Over the past 25 years, there have been at
least five such comparative studies of freight transport costs between Africa and
Asia. Earlier studies emphasized a range of reasons for the differences (Rizet and
Hine, 1993) while the latest study (Teravaninthorn and Raballand, 2009) empha-
sized very high profits for transporters in Africa. No comparable study has been
undertaken for passenger transport; however, it seems likely that the same differ-
ences exist. For example, it was reported that in 2008-2009, passenger fares for
State Road Transport Services in India averaged 48.37 paise per km, equivalent to
$ 0.01 per km (Economic Times of India, April 22nd 2011). In contrast, an analysis
of long distance passenger fares in Tanzania for 2009, averaged 31.92 T Shillings
per km or US$ 0.025 per km (Ministry of Infrastructure Development, 2010).
In 1994, a study that collected transport costs and utilization data relating to rural
transport and agricultural vehicles in Asia and Africa. (Ellis, 1996, Ellis and Hine,
1998) confirmed a similar difference. For example, a pickup truck in Africa had
operating costs 4.5 times that of Thailand, while a medium truck had costs that
were nearly 10 times that of Pakistan. A range of factors had been identified for
differences in costs including the prices of fuel, tyres, vehicles and differences in
utilization. Lower levels of utilization are shown for African vehicles. The pattern

Rural Transport in Africa – Planning Infrastructure & Services
24
follows earlier studies, which showed much higher utilization in Asia. For exam-
ple, tractor units and semi-trailers were found to average 123,000 km in Pakistan
compared with 50,000 km in Francophone Africa. Data on transport tariffs from
the latest major comparative study is presented in Figure 5. In this study, the same
pattern of high transport charges for Africa compared with other parts of the
world remains.
Figure 5. Comparison of Long Distance Transport Tariffs ($ cents per ton-km) 2007
The Role of Transport Operator Associations in Africa
Major factors in keeping transport prices high in Africa relate to transport associa-
tions (such as the Ghana Private Road transport Union or GPRTU). These organi-
zations very common, particularly in West Africa, help determine transport fares
and the organization of the commercial transport industry. Competition is re-
stricted in various ways, but particularly by the queuing system that operates at the
truck and bus terminals. Guards may be employed to restrict non-members from
taking loads (Lyon, 2006). As a result, a driver can be waiting in a queue for a week
or more to find a load. Prices are thus kept high, and fleet utilization remains low
through this system that favors an over-supply of vehicles. This is also an encour-
agement to keep very old vehicles working well beyond their normal economic life.
Operators of newer vehicles need to by-pass the queuing system to recover their
capital costs and remain in business.
The Ngoundere District in Northern Cameroon provides an example where a local
mayor decided to address the issue of poor transport services and high fares. In
Cameroon, transport syndicates determine fares and routes; they negotiate with

The Rural Transport System in Africa
25
the authorities for access, fees, and for the use of terminals. In Ngoundere, the
mayor licensed various transport agencies to operate from different terminals in
competition with one another. Within two years, passenger fares dropped by 50
percent with a reported greater frequency of service using cleaner and better main-
tained vehicles. Fares in the South were found to be 53 percent higher, (for 10 km)
and 370 percent (for 200 km) than in Ngoundere (Lisinge, 2001).
Besides the rather negative effects on society of restricting transport supply and
keeping transport prices high, transport associations have nevertheless some bene-
fits (Lyon, 2006). They play an important social support role for members, and
they often try to maintain standards of honesty and behavior. For example, taxi
associations in Nigeria have been very cooperative in the initiative to support the
emergency transfer of women in labor to hospital (Adamu, et al., 2012).
2.8 Rural Transport and Agriculture
Agriculture is the major source of livelihood and the most important economic
activity that takes place in rural areas of Africa. To properly understand the role of
transport in supporting agriculture, it needs to be considered as an integral part of
the whole distribution system. The overall efficiency of agriculture is affected by:
The nature of the marketing chain
Poor quality roads that are rough and seasonally impassable
Access to farm inputs, extension advice and credit
Monopolistic practices in both marketing and transport
Economies of scale
Availability and choice of the means of transport
The development of modern supply chain management
Transport over the First Mile and the Effects of Impassability and Rough Roads
The first stage of crop movement, from field to roadside, house, village, or to the
local market is the most expensive per kilometer, and can represent a major con-
straint to the development of agriculture. Terrain can be difficult, load sizes are
small and there may not be a motorable road. Head loading is in Africa the main
form of transport for crop movement. Yet, this type of transport is per ton-mile
very expensive – 10 to 30 times more expensive than by truck. If difficult pathways
can be improved or converted to a track or road then IMT such as bicycles, mo-

Rural Transport in Africa – Planning Infrastructure & Services
26
torcycles, animal carts or tractors and other forms of less costly motorized
transport can be used.
The Benefits of Road Investment to Agriculture
Improved roads facilitate access to extension services and credit. Remotely located
farmers are at a disadvantage in accessing such services. This was particularly not-
ed in a study of Ashanti Region of Ghana. The reason for this problem was the
need for multiple trips between a village and the extension services (Hine, River-
son and Kwakye, 1983a).
During the wet season many unpaved roads be-
come impassable or very hard going, so
transport costs rise, and this can have a negative
impact on agriculture. Availability of farm inputs
can be seriously affected by wet season accessibil-
ity as they are needed for the next growing sea-
son. Crops and products such as vegetables or
milk can deteriorate easily once collected, and
can entail serious losses if they are delayed in
getting to the market or processing factory. Oth-
er crops such as tomatoes, mangos, bananas and soft fruit can bruise easily and
hence be damaged by travelling on rough roads. Thus, road investment is clearly
an important tool in promoting agricultural development.
The Efficiency of Transport and Marketing System
The rural transport system is often closely integrated into the agricultural market-
ing system. The availability of agricultural storage can provide flexibility to supply
markets when roads become impassable in wet weather. However, this symbiosis
can be detrimental in terms of restricting competition in both transport and agri-
cultural marketing. This will tend to keep farm-gate prices low and retail prices
high to the urban consumers thus preventing the effective development of agricul-
ture and rural welfare.
The transport and marketing systems in much of rural Africa are expensive, ineffi-
cient and unresponsive. This can be explained by the low density of economic ac-
tivity where economies of scale cannot be achieved, competition is weak and in-
formation flows poor—although this latter factor is undoubtedly changing with
the rise of mobile phone in rural areas. It has been shown that agricultural market-
Gra
ce W
ahom
e

The Rural Transport System in Africa
27
ing associations can keep agricultural prices high by both enforcing retail price
control and restricting the supply of particular commodities into certain markets
(Gore, 1978). Further, traders in Africa often travel together to a village and are
able to prevent competition through allocating farmers to different wholesalers,
and credit relationship. Farmers can improve the prices they get by selling directly
in the urban markets. However, they often pay a very high price for the transport
of their small volume of produce. Marketing is most efficient where there are large
concentrations of population and concentrated flow of goods, unlike much of ru-
ral Africa. There is also evidence to suggest that, as a proportion of the final price,
transport and marketing margins are much higher in Africa compared with Asia.
For example, it was found that for food grains 45 percent of the final price was
received by producers in Kenya and Malawi, as against 80 percent in Bangladesh
and India (Ahmed and Rustagi, 1987).
2.9 Rural Transport Safety and Security
Although there is a shortage of reliable data for all aspects of rural transport, this is
particularly acute for safety and security. It is well known that underreporting is a
major issue for road safety in Africa. However, there are good grounds to believe
that better data exist and consequently much more is known on the incidence and
causes of road crashes in urban areas and along interurban routes than for rural
areas. Similarly, there are very few specific studies of rural transport safety and
security in Africa.
In 2007, it was estimated that 235,000 people died from road traffic injuries in
Africa, (an incidence rate of 32.2 per hundred thousand inhabitants) with most
deaths occurring for people between the ages of 5 and 44 years old. The risks are
particularly high for African pedestrians, those travelling in two and three wheeled
vehicles, or in public transport (WHO, 2010). Most rural roads have no separate
provision for pedestrians who tend to use the road along with the mix of vehicle
types. Unsafe vehicles, poor traffic awareness and safety knowledge will also be
issues alongside a lack of enforcement. However, an enforcement regime that in-
terprets the regulations too strictly would involve a significant decrease in services
or an increase in prices. A balanced approach is therefore recommended. Starkey
(2007) identified the following safety issues in rural areas: inadequate infrastruc-
ture, including potholes, lack of safety barriers and signs; unsafe vehicles; unsafe
loads and mixed passengers and freight; and unsafe behavior of drivers.


29
3. Transport Surveys and Consultation
A wide range of consultation and survey techniques are available for rural
transport planning. The decision on the survey to undertake will naturally depend
on its purpose, the quality and extent of existing sources of information, and the
resources available. The approaches described here are qualitative and quantita-
tive. For a large scale specialized survey, it is beneficial to try out, test, modify and
refine the questionnaire with several rounds of interviews. To get the most reliable
information, it is important to ‘triangulate’ approaches whereby different tech-
niques are applied with different groups to see whether information is confirmed.
Tables 3 and 4 list a range of different types of surveys that can be used. They are
derived from the Rural Transport Knowledge Base (Fouracre, 2001). Table 3 co-
vers the supply-side of road transport while Table 4 covers the demand-side. More
specific information of these tools can be found in the SSATP document – A user
guide to road management tools6.
3.1 Common Types of Surveys and Consultation
Road Inventory
Increasingly road inventory information is now collected using Geographical In-
formation Systems (GIS) and for some countries, the data is available on the web.
GIS enables mapping to be much more accurate and helps road professionals to
know exactly where key facilities and infrastructure are located. An instrumented
vehicle may collect GIS data as well as a range of road condition data.
While main and secondary road networks are usually mapped using GIS, the
mapping of rural road networks has been much more partial. GIS planning proce-
6 http://www.ssatp.org/en/node/290

Rural Transport in Africa – Planning Infrastructure & Services
30
dures are currently being used in India and Bangladesh for rural roads; Vajjhala
and Walker (2009) provides an example for Lesotho. An instrumented vehicle that
can also provide road condition data together with GIS information could be very
useful for planning. With GIS data, it is possible to match up at a finer level, where
people live in relation to the road network and the characteristic of the population,
for example relating to poverty from the Living Standards Measurement Survey.
However, using GIS data in this way is still relatively rare, particularly in Africa,
but it obviously has considerable potential.
Table 3. Road and Road User Surveys
ROADS
Survey Purpose
Inventory To confirm agency network data. Includes surface types, width,
structures, road furniture, etc.
Traffic Counts To establish daily traffic volumes, seasonal and weekly patterns,
as well traffic composition.
Traffic Speeds To establish average speeds along different routes
Road condition & maintenance To determine road roughness, gravel thickness, pavement de-
fects, state of drains, structures, etc. and need for maintenance.
Axle Load To determine vehicle overloading and damage to road pave-
ments, these surveys are common on main roads but rare for
low traffic rural roads.
Safety Surveys To determine location and nature of safety hazards, as well as
accident reporting procedures and trends.
ROADS USERS
Survey Purpose
Passenger Loading To determine load factors, vehicle productivity can also be
used to find journeys, distances, journey time and vehicle
speeds.
Passenger Waiting Time To determine level of service and passenger waiting times
Passenger Interview To determine journeys distances, journey times, fares paid and
passenger satisfaction.
Shipper Surveys To determine freight journey distances, times, tariffs, customer
satisfaction.

Transport Surveys and Consultation
31
Table 4. Demand-Side and Background Surveys
Surveys Purpose
Origin-Destination surveys To identify current travel patterns of population, including non-motorized
trips. Particularly useful when new road links are planned.
Cordon/screen line survey Similar to OD surveys (Origin-Destination) but carried out on smaller scale
across an imaginary line or cordon around an area of enquiry.
Stated and Revealed Prefer-
ence surveys
To try to establish how respondents might respond to proposed transport
changes (for example a new service or different fares). Also used to deter-
mine traveler ‘values of time.’
Household Surveys & Travel
Diaries
To establish travel patterns and relationship with household characteris-
tics (including income and assets) to help model future transport demand.
May also include surveys of farming and economic activity for road impact
studies.
Market surveys Surveys of markets and market prices are often undertaken as part of road
impact studies and help with demand modelling.
Surveys of economic & social
facilities and establishments
Markets, hospitals, clinics, schools, churches, factories, warehouses, shops,
government offices, water sources, etc. are key journey destinations. Their
location and future development are important in demand modelling.
Semi-structured interviews
and discussions
Semi-structured interviews and discussions with village leaders are im-
portant to help understand the background to an area and introduce the
researchers to the village. These interviews will take place before more
detailed surveys are undertaken.
Participatory Appraisal There are many forms of Participatory Appraisal, however in all participa-
tory surveys, the aim is to understand the context and problems as per-
ceived by local people (i.e. stakeholders) and it can help in getting them
involved in developing solutions.
Traffic Counts
The main objective of a traffic count is usually to obtain an accurate estimate of
the Average Annual Daily Traffic (AADT), which can then be used, for example,
for an economic road appraisal. In general, the lower the traffic volume the greater
the daily variability. Hence, because of the low traffic volumes in rural areas, it is
important that the traffic count be conducted over sufficient time to smooth out
factors such as market days, peak harvest time, public holidays, religious festivals
and weekends. It is often recommended that a seven day count be carried out, cov-
ering market and non-market days for the 12 daylight hours, with two days cover-
ing 24 hours to help estimate night time movements. Motorized traffic usually falls
in the wet season and so, if possible, the counts should be taken twice per year to

Rural Transport in Africa – Planning Infrastructure & Services
32
cover wet and dry seasons. Ellis and Hine (1997) found that for rural roads in
Iringa and Kilimanjaro regions of Tanzania traffic volumes in the wet season for
cars, 4-wheel drive vehicles, trucks, and large buses fell, on average, to around 60
to 70 percent of the dry season totals, with non-motorized traffic increasing to
over 100 percent of the dry season totals.
Road Condition Surveys
Overall road condition data is often supplied by regional and district engineers on
a regular basis using simple classifications of “very good, good, fair, poor, very
poor” categories. However, it is well recognized that these subjective evaluations
are very inconsistent, and may be influenced by the road agency’s need to meet
internationally set targets.
Road roughness is the key driver of vehicle operating costs and, overall it is critical
for the assessment of overall road condition. Roughness data is useful for assessing
the quality of different components of the rural network, for indicating when
maintenance or investment should take place and to assist with road impact evalu-
ations. However, roughness can change very quickly on unpaved roads with traffic,
rainfall, and maintenance treatment. Nevertheless, it is recommended that objec-
tive roughness measurements be taken of the unpaved road network. It is very
useful to know the frequency of grading and regravelling.
As with all surveys, there is an inevitable trade-off between costs, quantity and
quality of the data collected. The costs of vehicle instrumentation to record and
log roughness data together with GPS position will be in the range of $8,000 to
$12,000. However, a separate roughness calibration device will also be required.
One of the cheapest methods of calibrating is to construct a MERLIN7 using a
metal frame and bicycle wheel (Cundill, 1996), alternatively commercially made
profiler will cost around $8,000.
Travelling Time and Level of Service Surveys
SSATP developed the SOURCE methodology8 for standardized measurement of
speed of light vehicles and actual level of services provided by roads. The measure
7 Machine for evaluating roughness using low-cost instrumentation. 8 Standard Overall Ultra-lite Road Care Estimate (SOURCE). www.ssatp.org/en/node/290

Transport Surveys and Consultation
33
of the speed can be used to calibrate planning models such as HDM-4. It also pro-
vides the estimate of traveling time on roads used in conjunction with the value of
time in the economic analysis of road projects. Lastly, data collected for an entire
network can be used as a proxy of road conditions in the planning process.
Operator and Driver Surveys
Surveys of operators and drivers can provide a great deal of information on the
operation and utilization of vehicles, transport fares and tariffs, vehicle operating
costs, etc. These surveys can be carried out at truck and bus terminals or by the
roadside (origin-destination surveys). Often the surveys will be carried out in the
market towns in the areas of interest. For major surveys, particularly involving
long distance movement, it is possible to collect data on larger vehicle fleets from
the offices of owners and companies in the larger cities.
Household Interview Surveys
Information collected in household interviews may cover household composition,
sources of income, levels of expenditure, consumption patterns, education, health,
employment, household assets, travel patterns, as well as information on farming.
Because household surveys are much more likely to cover the whole population
(e.g. The Living Standard Measurement Study, LSMS9) they will provide a less
biased result than micro surveys such as passenger surveys when investigating
travel patterns. Baker and Denning (2005) provide advice on developing a country
specific transport module to be included in nationwide ‘multi-topic’ household
surveys. Babinard and Scott (2009) review transport data (with a focus on gender)
collected by a range of national household surveys carried out in developing coun-
tries. Household surveys may be repeated to establish long-term trends as with a
panel survey. Airey and Cundill (1998) provide an example of a rural panel survey.
The costs of household surveys vary considerably. An (unspecified) OECD inter-
net source suggests that in South Asia the survey costs could be $25 per household
while in Africa (and Latin America) it might be as much as $100 per household.
The overall costs of a national road impact study could well be in the region of
9 The Living Standards Measurement Study (LSMS) was established by the World Bank to
improve the type and quality of data collected by Government statistics offices. Currently a
wide range of advice on household surveys is available from the LSMS website at the World
Bank. (http://go.worldbank.org/ZAWINK6M10).

Rural Transport in Africa – Planning Infrastructure & Services
34
$500,000 to $1,200,000 depending on the extent and frequency of surveys and the
quality of the consultants and enumerators. Ideally three rounds of surveys should
be undertaken, a before survey, and two after surveys. Grootaert (2002) quotes a
range from $ 238,000 (Trinidad) to $878,000 (Bolivia) for previous national (non-
road) impact evaluations.
Semi-Structured Interviews
Semi-structured interviews are carried out in a variety of ways. Key questions are
formulated beforehand but the interviewer is free to explore different avenues as
they come up. The interviewer will tend to write answers down in a notebook ra-
ther than on a preformatted questionnaire. The approach is often very useful when
talking to key informants (village leaders, local administrators, etc.) to understand
the background to an area and so is often one of the first types of information
gathering administered in an area.
Participatory Appraisal
Participatory Appraisal (PA) is a powerful technique often used to consult a local
community over transport issues. The methods are described as “…a growing fam-
ily of approaches and methods, to enable local people to share, enhance and analyze
their knowledge of life and conditions, to plan and to act.” (Chambers, 1994). The
term Participatory Appraisal is often used interchangeably with Participatory
Learning in Action (PLA), Participatory Rural Appraisal (PRA), and Rapid Rural
Appraisal (RRA). A prerequisite of a participatory appraisal is that data collection
and analysis are undertaken by local people, with outsiders facilitating rather than
controlling. Outcomes of the participatory process are referred back to the com-
munity in a process of learning and reflection. Advice on the forms PA for rural
transport is provided in the TRL Overseas Road Note 22 (2004b).
A PA is most likely to be employed when dealing with transport issues at the vil-
lage level. The approach often involves drawing different types of diagram such as
Venn diagrams to depict key institutions, individuals and their interaction with
the community, and social and resource mapping to identify the location and im-
portance of different resources within the area. Vajjhala and Walker (2009) pro-
vide a useful example of how Participatory Mapping combined with GIS was un-
dertaken in Lesotho.

Transport Surveys and Consultation
35
Delphi Technique
This is a structured communication technique, traditionally used by experts, that
was developed for forecasting10. Questions are answered in several rounds, and
after each round a facilitator provides anonymous feedback. After the feedback,
the experts are encouraged to revise their previous answers. Over time, it is ex-
pected that the group will converge towards one answer. Chapter 5 below proposes
to use the approach for prioritizing transport service interventions, whereby the
maximum desirable benefits of different interventions are made together with es-
timates of probability support and likely success.
Other Forms of Stakeholder Consultation
There are a very wide range of methods that can be used to consult stakeholders
including public meetings, workshops and seminars, focus groups, user panels and
representative groups. As an example a range of consultation approaches were
adopted in Ghana Feeder Road Prioritization Procedure (See Annex 1). These in-
cluded press advertisements, preparation of handouts, in-depth interviews with
officials, workshops for nomination of candidate roads and for prioritization, and
finally a public hearing.
In order to assess the adequacy of rural transport services, Starkey (2007) devel-
oped a rapid appraisal procedure based on the hub and spoke system in which
participative interviews are held with transport regulators, operators, users and
support services. The procedure is stratified to ensure coverage of women (at least
40%), people in remote areas (15%) and people disadvantaged in various ways.
Traffic counts are undertaken on selected representative spokes, chosen by hub
type and remoteness. Data is collected on passenger and freight tariffs and the op-
erating cost of motor vehicles and IMT.
Road Impact Studies
Road impact studies are a major source of information for rural transport plan-
ning. Impact is usually identified through one of the following methods:
a cross-sectional analysis (i.e. comparing different locations with different
degrees of accessibility at the same time, sometimes referred to as a “with
and without” study)
10 http://en.wikipedia.org/wiki/Delphi_method

Rural Transport in Africa – Planning Infrastructure & Services
36
by some form of historical analysis (through a "before and after" study)
by combination of both approaches (often referred to as the “double-
difference” or “difference-in-difference” approach)
Impact studies can be undertaken either through an analysis of specific local sur-
vey data or through a macro analysis using existing regional or national data. In
order to determine the impact of the road investment in ‘before and after studies’,
observed differences need to be compared to controls which are very similar in all
key aspects and where no change in road investment has taken place. In this way,
general changes in national or regional market price trends or the effects of local
weather can be screened out. For many road impact studies control locations are
identified at the start of the project. However it is in fact very difficult to ensure
some years ahead that the planned investment will take place on the proposed
road within the specified time period and that for the control location road ‘no
investment’ will occur. As a result, many studies have found that a control road
was improved and that sometimes the project road investment was postponed.
There are clear advantages in the ‘double-difference’ approach as it can help deal
with the weaknesses of the other two approaches, even though biases can still be
present. One approach to help reduce the element of bias is to adopt ‘propensity
score matching’ whereby elements (e.g. households, areas or roads) are selected to
match observations ‘with the investment’ as closely as possible to observations
‘without the investment’ to ensure that the presence or absence of the road in-
vestment is the key factor influencing the difference in impact. The double-
difference approach, that combines historical ‘before and after’ analysis with a
cross-sectional ‘with and without’ analysis, involving control areas (or roads) will
obviously provide the most convincing results. Very simply, with the double-
difference approach impact is equal to the improvement in welfare and income of
households on the roads that are improved, less the improvement in condition
that occurs in the designated control households where no road improvement has
taken place. Examples of undertaking the double-difference approach to evaluate
rural road programs include The Poverty Impact of Rural Roads: Evidence from
Bangladesh by Khandker, Bakht, Koolwal, (2006), and Rural Roads and Poor Area
Development in Vietnam, Mu and De Walle, (2007).
Advice on rural road impact evaluation methodology is provided by De Walle
(2008) while Grootaert (2002) provides practical advice on procedures and ques-
tionnaires. Baker (2000) provides general advice on impact surveys, and Bamberg-

Transport Surveys and Consultation
37
er (2006) discusses the risks and implications of adopting less-than-perfect survey
procedures and possible ways of reducing survey costs. Roberts, Khattri and Wes-
sel (2011) provide advice on how to write Terms of Reference for an Evaluation.
More information on impact evaluation is also available in the SSATP Working
Paper Good Policies and Practices on Rural Transport in Africa – Monitoring and
Evaluation, (Airey, 2014).


39
4. Rural Infrastructure Planning
This chapter covers both rural road planning and the planning of village-based infra-
structure. Most of the chapter is devoted to rural road planning, whereas section 4.20
considers village infrastructure and the use of the integrated Rural Accessibility Plan-
ning (iRAP) tool.
4.1 The Planning Context
Rural roads are managed and financed by a variety of institutions. Management may
be by central ministry departments, road authorities, and by local government bodies,
while finance may be from central and local government funding, road fund admin-
istrations or donors. The nature of the planning that is undertaken with regard to an
intervention will depend on its scale, funding source and institutions involved. Rural
road planning covers a wide range of interventions from new investments to mainte-
nance and spot improvements on rural access tracks that may be managed by a district
council or village committee. Clearly the larger the investment involved the greater the
need for formal planning. Cost-benefit analysis and cost-effectiveness criteria are fre-
quently used to plan and prioritize both major road investments and major mainte-
nance interventions; however, they are less used to plan routine maintenance.
A range of policy documents will influence rural road investment and maintenance
planning. These include mainly Transport Policy and Strategy, Poverty Reduction and
Growth Strategy, Agricultural Policy, Regional and District Plans, National Transport
Investment Plans. At the national level, the documents will outline the direction of
government policy and guiding principles for the development of the transport sector,
the responsibilities of national and local government for the sector, the desired regula-
tory framework, sources of funding, and general principles for prioritizing invest-
ment. National Transport Investment Plans and Regional and District Plans will iden-
tify key road investments that it is felt will contribute to national, regional and district
development. Ideally, these plans will be backed up by formal planning or prioritiza-
tion procedures.

Rural Transport in Africa – Planning Infrastructure & Services
40
In recent years, there has been a trend to separate key functions of the organization
and management of the network. Typically, a ministry takes the role of ‘owner’ and is
responsible for policy development, defining the network, setting standards, and high-
er level planning. For main roads, a roads authority takes the role of administrator
and commissions maintenance and development works to contractors. For rural
roads, a local government body or the regional or local office of the road ministry
takes on the role of administrator and either undertakes physical works in house or
contracts out the work.
Although examples of efficient in-house works by force account, do exist in Africa,
(Zimbabwe is an example, see Gongera and Petts, 2003) most published evidence
points to substantial savings if road maintenance and construction are undertaken by
competitive contract.
4.2 Key Challenges and Solutions for Better Rural Road Planning
For most countries in Africa, the rural road network is very extensive and largely un-
derfunded. Because the condition of gravel and earth roads can change very quickly, it
is difficult for engineers and planners to keep up-to-date with monitoring the net-
work. The move towards decentralization (involving local government), and to a less-
er extent deconcentration (of central ministries), has been seen, by many, as a way of
increasing the involvement of the local population in decision-making and improving
transparency. However, the formal planning process for government funded pro-
grams in most of Africa, remains very weak and decisions are largely taken on an ad-
hoc basis, by local engineering staff in consultation with the District works committee.
For rural roads, formal cost-benefit or cost effectiveness analysis tends to be confined
to donor programs. Very little accurate traffic data is collected for the rural road net-
work on a systematic basis. For the most part traffic volumes are assigned to roads
based on very broad categories.
While in recent years, there appears to be an improvement in the numbers of profes-
sionally qualified engineers and technicians working at the district level, for the most
part the focus of their work, and their training, has been on achieving physical work
progress and procuring contracts rather than on better planning to get the best results
for limited resources. District planning officers can, and do, assist with providing
planning information about the district however, their responsibilities cover all sectors
and they often have little time to devote to assisting with the intensive collection of

Rural Infrastructure Planning
41
traffic data or other data. They too will usually have little or no training in transport
planning matters.
Political interference in road planning is most likely to happen if there is little relevant
data and weak planning procedures. However, a formal planning process for rural
road investments can be established and sustained by centrally organized bodies that
have oversight of the rural road network such as the ministry of local government,
department of feeder roads or the road funds. These bodies can demand evidence of
some formal planning process when deciding on funds allocation to the districts.
However, they will not usually have the capacity to check traffic or other data. Occa-
sionally, local and donor funded consultants are appointed to prepare rural road in-
vestment programs using transport planning procedures.
In order to improve planning, there clearly needs to be a recognition that extra re-
sources need to be found for:
1. Collecting key planning data (traffic, adjacent population) as well as road
condition data, including the degree of seasonal vehicle passability.
2. Training of district engineering and planning staff, as well as central staff in
ministries and road funds on the need and techniques of planning.
3. Additional planning staff and consultants to assist with the transport plan-
ning process.
There is no reason why district staff should not be familiar with and capable of using
road-planning models such as the Roads Economic Decision Model (RED)11 or simple
cost effectiveness models. Because of the cost and intensive training required, the ca-
pacity to use models such as HDM-4 and the Road Network Evaluation Tool
(RONET)6 is likely to remain the preserve of central government staff, the Road Fund
and consultants.
Central government bodies and the road fund have a key role to organize and offer
training, ensure that planning is carried out according to agreed procedures, monitor
performance, assist with providing technical advice on planning and maintenance
management procedures and to allocate and distribute funds. They can also coordi-
nate between districts, regions, the central government, donors and consultants. If
11 http://www.ssatp.org/en/node/290

Rural Transport in Africa – Planning Infrastructure & Services
42
local governments do not have the funds for the extra resources identified above, these
will have to come from the central government and the road fund.
4.3 General Goals and Objectives
Rural infrastructure is designed, built and maintained to fulfil a wide range of possible
goals and objectives:
Maximize welfare
Promote economic growth and regional balance
Increase agricultural output
Reduce crop losses and improve food marketing and distribution
Provide access to basic facilities, taking into account the needs of the poor, iso-
lated and marginalized groups
Minimize the time, costs and effort of the community in accessing facilities
Improve health and educational outcomes
Promote mobility and social interaction
Increase employment and develop local skills
Minimize environment damage
Improve security and promote national integration
Promote maximum value for money from limited budgets
Many of the objectives listed can be partially taken into account by a Transport Cost-
benefit analysis during planning. For example, crop losses incurred during travel can
be taken into account by adjusting the value of freight when calculating transport
costs. The benefits of increased employment can be accounted for by using the oppor-
tunity cost of labor rather than market wage rates. Environmental issues may be par-
tially dealt with by ensuring that the main costs of mitigation measures are included in
the analysis. A range of tools and procedures used to evaluate rural road projects are
discussed below.

Rural Infrastructure Planning
43
4.4 Planning Rural Roads to Meet Agricultural and Other Objectives
A large proportion of rural road programs in Africa are initiated by donors specifically
to support agriculture or to support community development objectives. These pro-
grams may be part of larger schemes where other investments (e.g. technical advice,
irrigation, farm mechanization, community resettlement, community funding, etc.)
are also provided. In the first instance, these programs will tend to define in broad
terms, where the rural road investments will be located. In general, specific districts
will be identified that meet certain agricultural, poverty or geographic characteristics.
Once the area choice has been made, it will then be necessary to determine the selec-
tion of specific roads and tracks to be improved and their standards of construction.
The standards of construction are best determined by conventional engineering and
economic criteria. Major weaknesses of rural development programs that include ru-
ral roads are the lack of consideration about sustainability when rural road mainte-
nance is not funded, the lack of local ownership if local populations are not involved
in the planning process, the lack of attention to setting up the proper institutional
framework by focusing on the physical part of the investment and the lack of con-
sistency with transport sector policies.
4.5 Planning Rural Road Density and Connectivity
Before considering the economics of road investment, it would be advisable to consid-
er targets of road density and connectivity, which translate into measurable indicators.
The Rural Access Index (RAI) is currently used as a measure of how effective the road
network is for serving the rural population (See Chapter 2).
Road access and density targets have been particularly important in India. Since the
Nagpur Plan (1943-1961), India has put forward long-term targets for the rural road
connectivity. These targets have taken different forms based on desirable road densi-
ties or maximum distance to a road with variations based on the development of agri-
culture and the size of village populations. For example, the 1981 target envisaged a
road density of 0.7 miles per sq. mile with the maximum distance from a metaled road
of 4 miles, for developed agricultural areas. For undeveloped areas, a target density of
0.19 miles per sq. mile was set with a maximum distance of 12 miles to a metaled road.
The current Indian government plan, the Pradhan Mantri Gram Sadak Yojana
(PMGSY), envisaged all settlements with population above 1,000 (500 in case of hill,
NE States, deserts and tribal areas) to be connected by 2009-2010. The thresholds are
progressively reduced so that settlements above 500 (250 in case of hill, NE states, de-

Rural Transport in Africa – Planning Infrastructure & Services
44
serts and tribal areas) will be connected by 2014-1015 and all settlements above 250
will be connected by 2021-2022. The PMGSY target approach is very ambitious and
only feasible with a very well-funded budget. In 2010, it was estimated that a further
$40 billion was required to complete the program, in addition to the $14.6 billion al-
ready spent (World Bank, 2010). Although the approach does not use cost-benefit
analysis to select roads for improvement, the cost-benefit analysis together with im-
pact studies have been used to validate the program. Details of the planning approach
of the PMGSY are given in Appendix 1.
Howe (1971) suggests that road density in different areas of a country tends to be a
function of the population density. Clearly, population is not the only factor to influ-
ence road building. Alternative models based on employment density or agricultural
output value density may also need to be tested to identify areas most in need of road
building, and how much is required to meet the given norm.
4.6 Key Engineering and Planning Decisions
In order to meet the wider policy objectives, planners and engineers need to take deci-
sions relating to specific investments:
Is the investment worthwhile? Are the benefits greater than the costs?
If there is a range of alternative investments, which option gives the best re-
turn?
Is the proposed project timing optimal?
Should components of the project be phased in over a period of time?
Would it be better to combine the project with other investments?
How should risk affect the choice of projects?
If funds are limited, and there are many worthwhile investments, which
should be built first?
One of the strengths of an economic analysis is that it can address these issues. Differ-
ent economic decision criteria such as NPV12, EIRR13, FYRR14, NPV/C15, etc. can help
provide answers to all these questions.
12 Net Present Value 13 Economic Internal Rate of Return

Rural Infrastructure Planning
45
4.7 The Planning Cycle
In broad terms, the objectives of the planning cycle are that:
the highest priority links are identified for improvement and construction
the engineering design chosen is the most appropriate
the specific investment is economically viable
all environmental, social, gender and safety criteria are met
there is a minimum risk of major errors
there is a feedback mechanism in place
For main and secondary roads, the sequence of activities may be as follows:
Network Analysis or Master Plan Study to establish priorities
Definition of a program based on priorities and available budget
Prefeasibility study
Feasibility study/ preliminary engineering design
Final decision
Final engineering design
Procurement
Construction
Operation and maintenance
Monitoring and Evaluation
The process should help ensure that the best road projects are chosen, that there is
minimum risk of major errors and the other criteria are met. The monitoring and
evaluation will provide feedback. At each of the first three stages, various aspects of
road projects will be considered including transport demand, environmental, social,
and safety. A ‘broad brush’ approach will be taken at the first stage, and more detailed
analyses undertaken at the second and third stages.
14 First Year rate of return 15 Net Present Value over cost ratio

Rural Transport in Africa – Planning Infrastructure & Services
46
Local rural road investment can vary enormously in cost and, particularly for the
cheaper interventions; it will not be practical to adhere to the same detail of evaluation
given for planning main roads. Nevertheless, many of the same principles will apply.
Planning interventions at the district level will usually involve, and take account of,
some kind of ‘funds allocation’ process whereby road investment and maintenance
budgets are set according to a specified formula (based on population, area, existing
road length, etc.). At a minimum there needs to be an initial screening of possible
road interventions, after this the best candidate roads need to be assessed from a cost
benefit or cost effectiveness point of view. Conceivably, this might be done as part of
one study that may also cover social and environmental issues. An example of a
screening procedure for rural roads is given for Sri Lanka in Appendix 1.
Lebo and Schelling (2001), suggest:
a) Initial screening to target disadvantaged areas, or communities, based on
poverty indices and to eliminate low priority links.
b) Ranking the remaining investment choices based on cost-benefit analysis,
cost-effectiveness analysis or multi-criteria analysis.
However, because of the common lack of transparency relating to multi-criteria
analysis, it is suggested this is ‘kept simple, transparent, and participatory’. Consulta-
tion with local communities and representatives of local government is essential at
many stages during the planning process of rural roads (see Chapter 3).
4.8 Engineering Design Choices and Standards
Engineering interventions need to be appropriate to the budget available and the traf-
fic type and volume that will use the road. There should be a realistic expectation that
the intervention can be properly used soon after its completion. It does not make eco-
nomic sense, that for example, roads are built without associated structures, or struc-
tures without connecting roads, or roads are built “leading nowhere”, in the vain hope
that sometime in the distant future further funds will be found to complete the job.
From a planning perspective, it is extremely important to try to ensure that vehicle
access is spread as widely as possible, the quality of road access (i.e. road roughness) is
a secondary consideration. Hence, assuming funds are limited, it makes sense to en-
sure that most communities, with the same broad levels of demand, have basic vehicle
access before funds are allocated to upgrading a selection of roads to a higher gravel or

Rural Infrastructure Planning
47
paved standard. Planning for Basic Access is discussed in more detail by Lebo and
Schelling (2001). The main investment options are:
Access, improvements (or spot improvements) on an existing earth road or
track for passage of motorized and non-motorized vehicles, particularly in
wet seasons
Construction and improvement of paths, trails and bridges for pedestrians,
animal transport and other forms of intermediate transport
Construction of an earth road. Here the road will be built from in situ mate-
rials, or from materials that are outside engineering standard
Construction or rehabilitation of a gravel road, where imported materials of
a specific engineering standard are used
Construction or rehabilitation of a paved road
Resurfacing of a gravel or paved road
Construction of major structures, such as a bridge or culvert
Typically, a track will have less than 5 vehicles per day; an earth road, 5 to 50 vehicles; a
gravel road 50 to 250 vehicles per day; and a paved road above 150 vehicles per day.
The economics of the optimum choice will depend upon construction costs, mainte-
nance operations, traffic volumes, vehicle operating costs, terrain, and climate. Exam-
ples of unpaved access roads are shown in Figures 6 and 7.
Partly in response to growing dissatisfaction with the increasing scarcity and cost of
good quality gravel for resurfacing, engineers have taken a growing interest in either
trying to improve the performance of earth roads, (through the basic access approach
and the use of low cost maintenance methods, for example using the towed grader) or
in reducing the cost of paving roads, (the Low Volume Sealed Roads (LVSR) ap-
proach)16. These have tended to reduce the effective “window for gravel” between
earth and paved roads.
16 Guidelines for low volume sealed roads. SADC. www.ssatp.org/en/node/292

Rural Transport in Africa – Planning Infrastructure & Services
48
Figure 6. An example of rural roads in poor condition
Road Design Standards
Most countries have specified road standards for geometric and pavement design.
These standards are based on traffic volumes, vehicle axle loads, terrain and road
function. In Ethiopia for instance, the 2011 Design Manual specifies nine geometric
standards, four standards for the high volume traffic, ranging from 300 to over 10,000
AADT and five geometric standards for lower traf-
fic volumes, i.e. DC4 for 150-300 AADT, DC3 for
75-150 AADT, DC2 for 25-75 AADT, DC1 for
below 25 AADT. There is also a standard for a
‘track’. In general most modern design standards
are based on a combination of economic viability
and road safety. With the development of road
engineering/economic models (HDM-4) there has
been an important movement away from basing
design on what was often administrative function.
If there is insufficient traffic the latter approach can
lead to ‘over design’ and a very significant waste of
resources. An example of overdesign is given in Figure 8. In driving on this very wide
road for well over an hour, only three other vehicles were encountered.
Figure 8. An overdesigned road
Figure 7. An example of rural roads in poor condition

Rural Infrastructure Planning
49
Labor-Based and Tractor-Based Technology
Rural road construction and maintenance are particularly suited to the use of labor-
based and tractor-based technology where more labor and simple equipment (trac-
tors, trailers and towed graders) are used. Labor and small-scale equipment is much
more flexible and therefore often ideally suited to the construction of basic access.
The big advantage of using labor-based solutions is that far more people, including
women, can be employed and trained to work, so there are much greater benefits to
the community. In the 1980s and 1990s, ILO helped in setting up labor-based pro-
jects, in a number of countries in Africa. This also involved the training of district
engineers, technicians and contractors, in the use of labor-based roadwork.
Tractor-based technology, using tractors, trailers and towed graders has successfully
operated in Zimbabwe for many years (Gongera and Petts, 2003). This approach has
also spread to a number of other African countries, often in association with labor-
based work. The Roads 2000 approach, adopted in Kenya, used the same technology.
The general consensus is that labor and tractor based technology can carry out road
work to the same standards as capital intensive work, in the most part for similar or
less cost. The relative advantage of labor or machine based work will depend on the
cost of labor.
4.9 Road Maintenance and Road Deterioration
Road maintenance is critical to the long-term performance and design of roads. In
maintaining a given quality of riding surface there is a trade-off between construction
standards and maintenance. An expensive concrete pavement surface can last a long
time with little, or no maintenance. Conversely, with low traffic, reasonable standards
can be achieved on an earth road with intensive maintenance.
Maintenance Priorities
There is general broad agreement over which maintenance activities should take pri-
ority. The Transport Research Laboratory’s Overseas Road Note 1 (TRL Ltd, 2003)
presents priorities based on a combination of treatment type and traffic volume. The
heaviest trafficked roads have priority over lower trafficked roads. In terms of treat-
ment, the highest priority task is emergency work, designed to keep the road open to
traffic. Following this is routine drainage work, routine pavement work and the peri-
odic work such as regravelling and surface dressing.

Rural Transport in Africa – Planning Infrastructure & Services
50
It is interesting to note under this approach that recurrent pavement work has a high-
er priority than periodic work. This reinforces the results of an analysis using the
road-planning model HDM-4. In general, the results suggest that unpaved road grad-
ing is extremely cost effective with high economic returns. In contrast regravelling,
because of its high expense generally provides much lower economic returns and is
often uneconomic for lower traffic volumes, if the alternative is to maintain a high
grading frequency of an “earth” surface because the gravel is lost.
The importance of keeping roads open for traffic on very low traffic roads is graph-
ically shown in Figure 9. The curved line, showing the Marginal Productivity of
Maintenance Expenditure, for earth or gravel roads initially in very bad condition,
demonstrates that starting with very little expenditure the value of each dollar spent
on maintenance rises quickly as access is established for around 95 percent of the year.
It then falls as further access is established and flattens out as further maintenance is
spent to achieve roughness reduction. The graph is useful in helping road organiza-
tions determine priorities if maintenance funding is limited.
Figure 9. Marginal Productivity of Maintenance Expenditure on Low Traffic Roads
Road Roughness and Optimal Maintenance Policy
From the point of view of the user, passability and road roughness are the most im-
portant characteristics of a road. Road roughness is important because it is a key fac-
tor influencing vehicle operating costs (VOCs) and hence transport fares and tariffs.
The International Roughness Index (IRI) measures road roughness on a scale from 0
IRI typically rising up to say 30 IRI where the road is so rough that it is barely driva-
ble. A new asphalt concrete road can have roughness value of 1 to 2 IRI. A newly con-
Rural Infrastructure Planning
51
structed gravel road of good materials can have a roughness value of under 5 IRI. Over
time, an increase in roughness can be expected resulting from the effects of weather
and traffic.
For paved roads, routine road maintenance will have the effect of delaying the rate of
road deterioration and the eventual rise in roughness levels but there will usually be
no immediate effect on reducing road roughness. Resealing will only have a marginal
effect on reducing road roughness, but again it will help to delay the rate of road dete-
rioration. Reconstruction, rehabilitation or an overlay can substantially reduce road
roughness below previous levels.
For earth and gravel road surface routine maintenance can have a substantial immedi-
ate effect in reducing road roughness, although the beneficial results may only last a
few weeks or months. Regravelling will also reduce the rate of earth and gravel road
deterioration. In order to achieve the target of having a substantial proportion of the
gravel road network in good condition (i.e. below 10 IRI) there needs to be at least 3
or 4 gradings per year.
Allocation of Maintenance Funds Between Different Road Networks
Governments and Road Fund organisations tend to have a formula for allocating
maintenance funding between different road networks. So regional and rural roads
may be allocated, say, 30 percent of the total. Funds allocation procedures are also
used to allocate funds for road rehabilitation and maintenance to different regions
and districts. The allocation may be based on previous performance and subject to
bidding and negotiation between national and local authorities. They may also be
based on a formula including factors such as population, road length, area and
income per head in each district.
Although a rational funds allocation procedure is essential to an effective road
maintenance policy, the area has not been researched, or widely discussed in any de-
tail. In part because of funding shortfalls and delays in releasing funds, the process
may not be a straightforward as indicated in published budgets: "Allocating the funds
among various levels of the network is a murky business." (Malmberg Calvo, 1998).
There is obviously a strong economic case for keeping a high level of maintenance
funding for roads carrying the highest traffic volumes. It is argued that if funds are
limited it is difficult to justify taking funding away from roads carrying 1000 vehicles
per day to reduce roughness on roads carrying 20 vehicles per day. This argument is

Rural Transport in Africa – Planning Infrastructure & Services
52
true, up to a point. However, as is argued elsewhere in this report, the social and
economic consequences of road closure are very high, even for relatively low traffic
roads. So a balance clearly needs to be struck, in allocating funds, to ensure that both
the high traffic roads are kept in reasonable condition and, at the same time, low
traffic rural roads are also open to traffic.
4.10 Taking into Account Social and Environment Issues
Social and environmental issues are taken into account at many stages in the project
cycle. At the screening stage (which might be a network analysis study or a master
plan study), an assessment will be made to see whether a full EIA is required or not. If
not, some form of environmental analysis will be necessary, proportional to the scale
of the project and its likely environmental impact. An initial environmental scoping
study should identify the most important environmental issues associated with the
project. For rural roads, these may be resettlement issues, ecological issues affecting
flora and fauna, impact on water courses, etc. Assessing the social and environmental
impact is critical to compare and decide on options of design and alignments. After
consultation, a workplan for the proposed EIA should be prepared. The EIA will then
be undertaken and baseline data will be collected. This will then be followed by an
Impact Prediction & Assessment. The significance of any impact should be evaluated
and mitigation measures identified. An Environmental Management Plan should be
prepared for when the project is to be physically implemented. Finally, a monitoring
and evaluation procedure is implemented.
Detailed advice on environmental issues can be found in Tsunokawa and Hoban,
(1997). Advice on social issues, in Social Analysis in Transport Projects: Guidelines for
Incoporating Social Dimensions into Bank Supported Projects, The World Bank,
(2006b), and the World Bank’s Transport and Social Responsibility Website.
4.11 Income Distribution Issues
Although procedures exist, income distribution weighting is not commonly applied to
the cost-benefit analysis (CBA) of road projects. An economic analysis considers the
project from a national point of view. In a CBA, the total costs and total benefits aris-
ing from a project are identified and measured, irrespective of who incurs the costs or
who benefits from the project. Within the conventional CBA, it is usual to treat each
monetary unit of benefits as being of equal value to each individual in society, irre-
Rural Infrastructure Planning
53
spective of his or her income level. It is more usual to take account of poverty issues,
in the prior screening of projects, either before the CBA is undertaken, or as part of a
final multi-criteria analysis, before the final decision is made. Examples from Vietnam
and Sri Lanka are given in Appendix 1.
More advice on incorporating the benefits within road appraisal can be found in
World Bank Transport Note TRN-26 (2005) and in Gajewski et al. (2004).
4.12 Identifying the Best Projects
Before substantial resources are committed to carry out a detailed feasibility study, it
is first essential to ensure that the most promising projects are selected for analysis. In
Section 4.7 on the planning cycle, it is suggested that some form of screening study is
carried out to identify a wide range of links for initial analysis. The screening may in-
volve identifying projects meeting a poverty criteria and an economic efficiency meas-
ure such as ranking projects by a ratio of demand (expressed as traffic or population
served) divided by an estimate of construction cost per kilometer. For low traffic rural
roads and tracks roads community participation can also be invaluable in this process.
4.13 Transport Cost-Benefit Analysis
Conventional Cost-Benefit Analysis (CBA) is the most widely used procedure for
planning road investment. The approach is adopted in the road planning models
HDM-4 and RED. The main focus is to maximize economic welfare and perhaps its
biggest strength is that it can discriminate between different projects and engineering
designs on a rational basis. The main economic components of a Cost-Benefit Analy-
sis (also common to other forms of CBA) are as follows:
First round effects and secondary benefits
Project and alternative case
Planning time horizon, discounting and residual values
Use of economic prices and inflation
Road investment and maintenance costs
Estimating traffic benefits (normal, diverted and generated traffic)
Forecasting traffic
Estimating generated traffic

Rural Transport in Africa – Planning Infrastructure & Services
54
Vehicle Operating Costs
Value of passenger time
Accident rates and costs
Economic decision criteria
Strengths and weaknesses of transport – Cost-benefit analysis
First Round Effects and Secondary Benefits
Any procedure to analyze benefits should be designed to provide maximum coverage
of the costs and benefits without double-counting. Transport Cost-benefit analysis fo-
cuses on the direct ‘first round’ effects of road investment on traffic and transport
costs. The assumption is that these will broadly capture the costs and benefits of road
investment without double counting. Because the approach measures benefits to the
consumers of transport, it is sometimes referred to as the Consumers Surplus ap-
proach. In contrast, road impact studies also include the wider ‘secondary benefits’ of
road investment on the total economy. These are much more difficult to estimate,
particularly ‘ex ante’, in advance of the investment. It would clearly be double-
counting to crudely add the primary traffic based benefits to an estimate of the overall
secondary benefits. As an example, one approach of measuring secondary benefits is
to estimate the rise in land values, or land rents, following a road investment. Because
these arise as direct result of reduced transport costs, it would be double-counting to
add transport cost savings to the rise in land values.
The Project and Alternative Case
To carry out an economic evaluation it is necessary to identify a “base” or “without
investment” case in order to make a comparison with different “project” or “with in-
vestment” cases. Different forecasts are prepared of both traffic volumes and transport
costs and road maintenance costs to estimate net benefits.
In order for the economic analysis to be as realistic as possible the base case should
include a level of road maintenance that is appropriate to the expected traffic volumes.
It is sometimes easy to artificially inflate the value of a project case by assuming an
unrealistically poor base case with little or no maintenance. Such practices should of
course be avoided. Whatever base case is used it is important to include a “minimum
do something” case, in other words, a case where the minimum of new investment or
other measures are assumed, such as increased maintenance, to address the problem.

Rural Infrastructure Planning
55
The Planning Time Horizon, Discounting and Residual Values
The Planning Time Horizon is the period over which the economic analysis is to be
carried out. The choice of time horizon should reflect the economic lifetime of major
assets in the investment. In general, main roads are evaluated over a 20 to 30 year pe-
riod, while rural roads are more commonly evaluated over a 10 to 20-year period.
Because of the nature of the way that costs and benefits are valued in the future (using
an economic discount rate) those that occur in the distant future are valued less than
those that occur in the near future. Using a 12 percent discount rate a dollar’s worth
of benefits occurring in the 25th year will only be valued at 0.066 percent, although for
traffic benefits, this will be substantially mitigated by a high traffic growth rate.
Traditionally, the economic discount rate has been viewed as the opportunity cost of
capital, which vary from country to country. The World Bank has used a 12 percent
discount rate for most of its work, primarily to ration its funds. A lower rate can be
used for projects particularly focused on the poorest sections of society.
Residual values of major investments are sometimes used in an economic analysis.
These should reflect the remaining economic life of an investment. In most instances
because of discounting these values will usually have little impact on the outcome of
the analysis.
The Use of Economic Prices and Inflation
To carry out an economic evaluation all costs and benefits need to be expressed in
economic price terms (shadow prices). Prices should reflect the value that society
places on the use of the resource excluding distortions resulting from taxation, subsi-
dies, license fees, and legislation and other market imperfections.
Taxation and license fees do not represent a demand on real resources but transfer of
spending power to the Government and hence in determining the economic price the
taxation component should be subtracted from the market price. In contrast, an item
that is subsidized is under-valued and hence the subsidy element should be added
back in.
Depending on economic conditions, it is sometimes appropriate to make other ad-
justments to determine economic prices. When there is very substantial unemploy-
ment in the economy it is argued that the market price for unskilled labor does not
properly reflect the true economic cost and hence the value should be adjusted down-
wards. Other distortions can arise if the exchange rate between local and foreign cur-
Rural Transport in Africa – Planning Infrastructure & Services
56
rency is kept at an artificial level; hence, there may be a need to adjust the relative
prices of imports and exports. Sometimes in feasibility studies, a very detailed shadow
pricing analysis is carried out in which a range of adjustment factors are calculated
and applied.
For most feasibility studies appropriate economic prices can be determined from ad-
justing market prices for taxation and subsidies. For many countries, Standard Con-
version Factors are published to convert market prices to economic prices.
In an economic analysis, all prices used throughout the analysis should be in constant
price terms and refer to a given date. Hence, there is no reason to adjust future costs
and benefits for forecast price inflation.
Road Investment and Maintenance Costs
Investment and maintenance costs should be incorporated into the economic analysis
using economic rather than market prices. The Standard Conversion Factors are par-
ticularly useful for converting construction and maintenance costs to market prices in
road appraisals. This will avoid a separate detailed study to achieve the same result.
The new investment and maintenance costs that are to be incurred in a project should
be phased into the economic analysis at the time of their main economic consequenc-
es. The environmental appraisal will often identify measures that should be taken to
minimize the effects of environmental disruption (e.g. sound barriers or tree plant-
ing). These costs should also be included within the investment costs of the project.
Estimating Traffic Benefits
In order to evaluate traffic benefits, it is useful to separate traffic into the following
categories:
a) Normal traffic. The traffic volume that is forecast to travel on the same route in
both the base and project cases.
b) Diverted traffic. Traffic, travelling between the same origin and destination that
is forecast to switch routes as a result of the investment.
c) Generated traffic. An increase in traffic volume that is forecast to arise, because
of lower operating costs, directly as a result of the road investment.
Normal (and diverted) traffic benefits are valued in terms of the forecast traffic vol-
ume multiplied by the forecast change in transport costs. In Figure 10, as transport
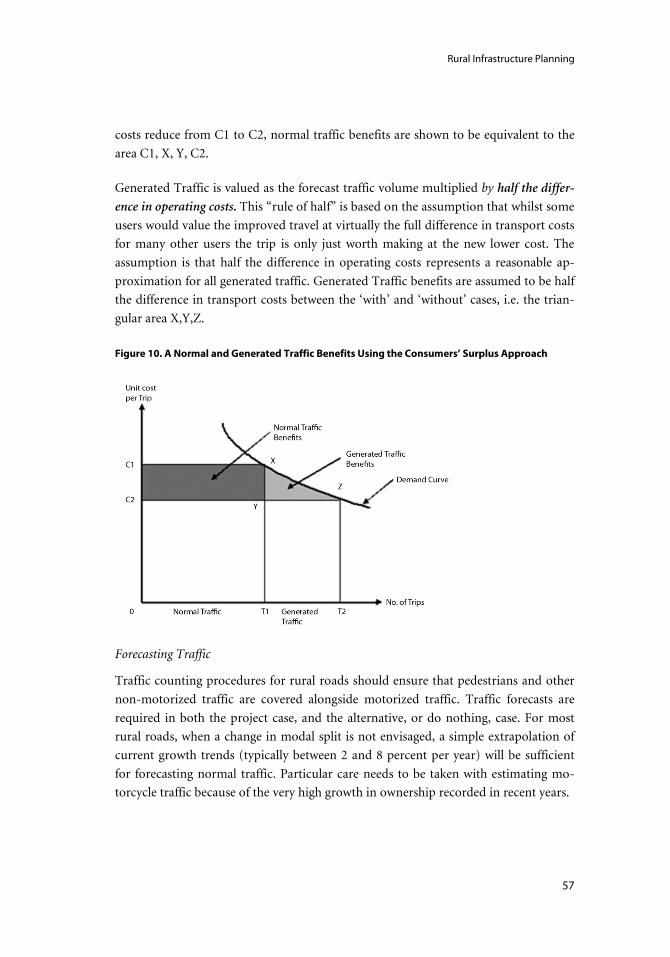
Rural Infrastructure Planning
57
costs reduce from C1 to C2, normal traffic benefits are shown to be equivalent to the
area C1, X, Y, C2.
Generated Traffic is valued as the forecast traffic volume multiplied by half the differ-
ence in operating costs. This “rule of half” is based on the assumption that whilst some
users would value the improved travel at virtually the full difference in transport costs
for many other users the trip is only just worth making at the new lower cost. The
assumption is that half the difference in operating costs represents a reasonable ap-
proximation for all generated traffic. Generated Traffic benefits are assumed to be half
the difference in transport costs between the ‘with’ and ‘without’ cases, i.e. the trian-
gular area X,Y,Z.
Figure 10. A Normal and Generated Traffic Benefits Using the Consumers’ Surplus Approach
Forecasting Traffic
Traffic counting procedures for rural roads should ensure that pedestrians and other
non-motorized traffic are covered alongside motorized traffic. Traffic forecasts are
required in both the project case, and the alternative, or do nothing, case. For most
rural roads, when a change in modal split is not envisaged, a simple extrapolation of
current growth trends (typically between 2 and 8 percent per year) will be sufficient
for forecasting normal traffic. Particular care needs to be taken with estimating mo-
torcycle traffic because of the very high growth in ownership recorded in recent years.

Rural Transport in Africa – Planning Infrastructure & Services
58
Estimating Generated Traffic
An analysis of 25 main road sections in Ethiopia with significant road improvements,
in comparison with 97 sections without improvement, during the period 2000-2003,
found that on average traffic was 13.1 percent higher on the ‘with improvement’ sec-
tions, than what would have been forecast from the ‘without improvement’ sections.
Overall, the average generated traffic for different vehicles, for typical road improve-
ments were calculated to be cars: 8 percent, buses: 15 percent, rigid trucks: 10 percent,
articulated trucks: 2 percent (Ethiopian Roads Authority, 2005).
In principle, generated traffic can be forecast from an estimate of the transport de-
mand elasticity. The elasticity is the ratio of the percentage change in demand to the
percentage change in transport costs faced by the users. It is important to realize that
the elasticity relates to the change in costs for the total journey, and not just for the
change in costs for the link in question. A typical journey may be many times the
length of the improved link. There have been many studies of transport elasticities,
(mostly related to developed economies, and few, if any, relating to rural Africa) giv-
ing varying results. Based on the midpoint values of a survey of transport, elasticities
bus traffic would increase 0.6 percent and freight traffic by 0.9 percent for a 1 percent
decline in costs (Oum et al., 1990) as the result of elasticities equal respectively to mi-
nus 0.6 and minus 0.9 (the minus signs reflects the fact that traffic increases when
costs decrease and vice versa).
Vehicle Operating Costs
Changes in vehicle operating costs represent a major component of benefits from road
investment. Savings arise from road investment through a reduction in trip distance,
trip time, road roughness, and a change in road alignment and in modal split.
The main components of vehicle operating costs are:
Capital costs including depreciation and interest
Fuel consumption
Tyre consumption
Maintenance costs including parts and labor charges
Driver and conductors labor costs
Passenger and freight values of time
Oil and lubricants
Overhead costs including garaging and insurance
Rural Infrastructure Planning
59
Value of Passenger Time
Savings in passenger time can represent an important component of the economic
benefits of road investment. For urban road projects, they often represent the largest
proportion of benefits. Passenger time values are usually divided into the following
categories:
Working time
Non-working time
It is commonly accepted that the value of working time is the total cost of employ-
ment of an individual expressed per working hour, i.e. it includes salary, bonuses, and
any contribution made by an employer to pensions, social security and national insur-
ance. Using a Stated Preference Analysis, IT Transport (2005) undertook a detailed
study of the value of time in Ghana and Tanzania, which found that the average values
of passenger time were 64 percent and 49 percent of the wage rates in each country
respectively.
Accident Rates and Costs
Despite high accident rates and costs to the economy, it is relatively rare to include an
accident cost analysis when planning rural roads in Africa. Because accidents are
caused by a large range of interacting factors, and are relatively rare along specific road
sections, predicting accident rates is difficult at the best of times. Furthermore, it is
believed that there is massive under reporting of accidents, particularly in rural areas
of Africa. In addition, there has been relatively little research in rural Africa to address
these issues.
One exception is work carried out for the use of accident analysis for HDM-4, by
Fletcher et al. (2006). The study of Tanzania was carried out over a three-year period
on 264 km of roads, and 3,754 accidents were recorded, with most of the data on busy
main roads near Dar es Salaam.
Detailed advice on accident costing is provided by Jacobs (1995) and Ross Silcock and
TRL (1995). General advice on designing roads to improve road safety is provided by
the Transport and Road Research Laboratory (1991). The iRAP method17 provides a
simple and objective measure of the level of road safety on a road network. The results
17 www.irap.net

Rural Transport in Africa – Planning Infrastructure & Services
60
associated to estimated costs to reduce the risk can be included in the planning pro-
cess to take road safety into account in a harmonized manner.
Economic Decision Criteria
A range of decision criteria (such as Net Present Value, NPV and Internal Rate of Re-
turn, IRR) are used to help identify the best investment solution. Each has its particu-
lar strengths and weaknesses. With a cost-benefit analysis, a number of decision crite-
ria can be established. Assuming an appropriate discount rate and all underlying as-
sumptions are correct, a project will be economically worthwhile if the NPV is greater
than zero. The higher the NPV, the greater the net benefits of the project. If there are
no budgetary constraints and there is confidence in all underlying assumptions, then
the choice between two alternative projects should be based on the NPV.
Because discounted cost and benefit streams can be easily added or subtracted, the
NPV approach is suitable for assessing projects built from separate components, such
as when different minor projects are combined together, or when a road project is
combined with another form of investment such an agricultural development scheme.
Internal Rate of Return (IRR) and Uncertainty
The Internal Rate of Return (sometimes referred to as the Economic Internal Rate of
Return (EIRR) in an economic context) is the discount rate at which the base year
value of costs and benefits are equal (i.e. NPV = 0).
The IRR gives no indication of the size of the costs or benefits of a project; it acts as a
guide to the ‘profitability’ of the investment - the higher the better. The IRR is often
used to see how robust a project will be to future uncertainty and possible changes in
assumptions. For this reason, it is frequently used for initial project screening. The
IRR cannot discriminate between mutually exclusive projects, hence the NPV is re-
quired to compare alternative solutions of the same project.
Net Present Value over Cost Ratio (NPV/C) and Budget Constraints
The Net Present Value over Cost ratio is simply:
NPV/C = Net Present Value / Construction Cost
The NPV/C criterion serves to rank projects where there is a budget constraint. This
happens when many more worthwhile projects can be accommodated within the
available budget—the higher the ratio the more worthwhile the project.

Rural Infrastructure Planning
61
First Year Rate of Return (FYRR) and Optimal Timing
FYRR = Total Net Benefit in First Full Year after Opening/ Construction Costs
For road projects with a smoothly increasing forecast traffic growth, the First Year
Rate of Return (FYRR) gives a rough guide to optimal project timing. If the FYRR is
greater than the discount rate, then the project should go ahead. Otherwise, it should
be delayed until it satisfies the criterion.
Strengths and Weaknesses of Transport – Cost-benefit analysis
The biggest strength of a Transport Cost-benefit analysis is that it can discriminate
between different transport projects and different engineering designs on a rational
basis. However, there are still major problems with valuing many of the components,
including vehicle operating cost savings. Its main weaknesses, based on transport
costs, are that it is not so good at dealing with:
poverty and income inequality issues
externalities (environment, national security and integration)
social and economic issues relating to major changes in accessibility (e.g. deal-
ing with new vehicle access or seasonally impassable roads)
procedure, where there are major uncertainties with forecasting outcomes
4.14 Agricultural Response & Producers’ Surplus Approach
An alternative approach to the (transport cost benefit) consumers’ surplus approach
to estimating the benefits of road investment is the Producers’ Surplus approach. This
approach was advocated by Carnemark, et al. (1976). The approach was relatively
popular in the 1960’s and 1970’s, and although it is still used, it fell out of favor with
the development of transport cost savings models such as RTIM18, HDM and RED.
The basic model is diagrammatically described in Figure 11. This shows the benefits
from a road investment in terms of the increased profits to farmers who farm in the
area of influence of the road. In the without road case agricultural output is Q1 and
the farm gate price is P1. Q1 is determined by the marginal cost curve MC1 meeting
the price level P1. According to his location each farmer will face a different farm gate
18 Road Transport Investment Model

Rural Transport in Africa – Planning Infrastructure & Services
62
price and each will have a different marginal cost curve. The supply curve of an area
will be the sum of the individual marginal cost curves.
Figure 11. Producers’ Surplus Benefits Resulting from Lower Transport Costs Giving Higher Farm Gate Prices and Lower Input Costs.
With the road investment two separate effects will occur which will affect agricultural
production. Assuming the market price remains fixed, the farm gate price will rise
from P1 to P2 as it is now cheaper to transport farm produce to market, and the farm-
ing cost curve will fall (from MC1 to MC2) because it costs less to transport farming
inputs (labor, fertilizers, tools, etc.) to the farm. This joint effect leads to production
increasing to Q2 given by the point of intersection of marginal cost curve MC2 with
farm gate price P2. Areas A and C represent benefits from farm gate price rise alone.
Areas B and D represent benefits from the lower cost curve alone. Area E is a benefit
of the joint effect. Total benefits are given by the shaded area ABCDE.
It is recognized that in practice the exact shape of the marginal cost curve will not be
known and so it is suggested that average variable costs are used to determine the in-
cremental producer’s surplus. The total producer’s surplus benefits arising from the
road investment are then:
= (new farm gate price P2–new average variable cost at Q2) x new output level Q2
- (original farm gate price P1 – original average variable cost at Q1) x original out-
put level Q1

Rural Infrastructure Planning
63
This will give equivalent producer benefits to those shown in Figure 11. However,
estimating average variable costs are far from straightforward. Although, in Figure 11
marginal cost curve MC2 lies below MC1, it intersects at a higher point (P2 rather
than P1) hence the average of MC2 can be higher than the average of MC1.
The main advantage of the producers’ surplus approach is that it focusses directly on
the effects of lower transport costs on the main productive activity of rural areas. It
may be felt that the alternative transport cost savings approach may miss important
benefits because of distortions within rural economies. However, its biggest weakness
is in predicting new levels of agricultural production following road investment. Agri-
cultural supply elasticities may provide a way of predicting response to farm gate price
changes. Biswanger (1989) and Peterson (1979) quote a wide range of elasticities rang-
ing from 0.07 up to 1.66. However, an examination of many road appraisals using the
approach found that increased agricultural production was, in most instances, arbi-
trarily guessed at, with no supporting evidence (Hine, 1982).
If the producers’ surplus approach is used, then it is likely to be in addition to the
conventional transport cost savings approach, to ensure that non-agricultural traffic
benefits are covered. Care needs to be taken to avoid double counting.
4.15 Social and Economic Case for Basic Vehicle Access
It is sometimes argued that it can be difficult to justify road investment to remote ru-
ral communities using conventional Transport Cost-benefit analysis, where traffic
volumes are low and seasonal. Although this may be the case in many situations, if a
road investment can substantially change vehicle accessibility then there may be a
good case on both economic and social grounds for the investment.
Economic Benefits of Basic Access
On economic grounds if there is currently no vehicle access, or vehicle movements are
prevented for many months during the wet season and therefore the alternative is
walking or head loading then, there may be a substantial decline in transport costs
with the road investment. Because transport costs by vehicle are so much lower than
by alternative methods such as head loading the economic case for basic vehicle access
can be very strong, provided there is sufficient demand to substantially fill a vehicle at
a given time. Moving goods by head load can be as much as 10 to 30 times more ex-
pensive than moving by vehicle. In contrast improving basic access to an improved
gravel standard may only reduce transport costs by around 20 to 50 percent.

Rural Transport in Africa – Planning Infrastructure & Services
64
A representation of the benefits of upgrading a footpath to a basic access earth road
and upgrading an earth road to an improved gravel road are presented in Figure 12,
using the consumers’ surplus diagram. In the first case, transport costs are reduced
from C1 to C2 and traffic rises from T1 to T2 while the associated benefits are repre-
sented by the area in blue. In the second case transport costs fall from C2 to C3 and
traffic rises from T2 to T3 while the associated benefits are represented by the area in
red. Because of the very large change in transport costs (from footpath to earth road)
there is in the first case an associated large increase in traffic and associated generated
traffic benefits. In the second case of the change from earth to gravel road, the
transport cost savings are much smaller and hence the generated traffic response and
associated generated traffic benefits response will be very much smaller. In this exam-
ple, a key factor is the shape of the demand curve, which represents the underlying
economic opportunities.
Clearly, the economic case will depend on the costs of construction, current non-
motorized traffic levels, the duration of the season when the road is impassable, the
volume of traffic and the proportion of journeys that will switch modes, or divert, and
the likely traffic response to the investment. If vehicles carry passengers as well as
freight then basic access will be much easier to justify.
Figure 12. Benefits of Providing Basic Access
Social Benefits of Basic Access
Social benefits can be thought of as a function of size of the population to benefit from
a road investment multiplied by the decline in transport costs. If there is no decline or
no population to benefit, then no social benefits are expected.
Rural Infrastructure Planning
65
On social grounds, basic vehicle access can be extremely important to the community
and the conventional transport cost-benefit analysis is unlikely to capture these bene-
fits. For most situations, where there is good vehicle access, and incomes are sufficient,
then people will be willing to make a trip (to hospital, market or visits to friends) irre-
spective of normal fare levels. In this case, the conventional transport cost savings ap-
proach represents a reasonable approximation of the benefits of the road investment
and there is little pressure to include additional “social” benefits to the analysis.
However, problems arise where income levels are low and communities are inaccessi-
ble or roads are cut off for much of the year. In the extreme case where a new road is
being introduced to a remote poor community, where in the “without” case people
have to walk twenty kilometers and carry sick relatives to hospital but in the “with”
case they can travel (perhaps intermittently) by motor vehicle trip purpose does begin
to matter. It can be a matter of “life or death” and the conventional valuation of
transport cost savings either for normal traffic or for generated traffic, looks complete-
ly unrealistic.
The case for a different approach is then strongest where a remotely located large
population makes relatively few trips and the only access is via a poor access footpath,
road or track that is cut for several months of the year and vehicle movement is pre-
vented. From the point of view of personal security and the need for vehicle access in a
medical emergency, there is an important psychological benefit of all year round vehi-
cle access even if emergency trips are rarely made. Similarly, if a road is cut then it is
likely that normal marketing activities in the area will either cease or be severely cur-
tailed. Longer, more circuitous walking trips can be expected. Likewise, whilst gov-
ernment services and external agencies remain crucial to the development of an area
there are strong arguments for reasonable all year round vehicle access to major cen-
ters within each local district. Any external institution planning to locate staff and
facilities in a remote location will think twice if vehicle access is very poor and cannot
be guaranteed throughout the year.
It is impossible to capture the long-term impact of improving accessibility (through
the conventional measurement of traffic benefits) when this has a direct impact on the
location of important facilities. Perhaps correctly, new road investment in rural areas
of developing countries is seen as the precursor of many other interventions including
schools, clinics, water supply, government offices, NGO activity and commercial in-
vestment. A way of incorporating social benefits into project appraisal is via a multi-
criteria analysis in which social, economic and environmental costs and benefits are

Rural Transport in Africa – Planning Infrastructure & Services
66
combined together in a single analytical framework and an overall ranking of different
alternatives achieved. A way of doing this is provided by Odoki et al. (2008).
4.16 Road Appraisal in a Context of an Integrated Development Project
Roads often form a significant component of integrated agricultural development
schemes. If major agricultural inputs and other investments are planned then perhaps
the simplest approach would be to plan the scale and quality of the road infrastructure
to meet the forecast traffic levels at minimum discounted cost (effectively ignoring any
‘generated traffic’ benefits). As output and traffic are forecast to grow then the quality
of the infrastructure could be upgraded to meet the future increase in demand. In
these situations, it may be necessary to provide an economic appraisal of the overall
viability of the combined project including the roads. Attention should be paid to as-
sign benefits and costs respectively to each component of the project and not allocate
the same benefits several times to each component or allocate all benefits to one single
component without considering the costs of the other components.
However as the Peru Case study (World Bank, 2006a) demonstrates there may be sig-
nificant positive synergies between the provision of different types of infrastructure
(such as electricity, water, telecommunication and roads), for same rural communi-
ties. Then, care needs to be taken to ensure that the resulting increase in traffic levels
and economic activity is properly taken into account. Unfortunately, apart from the
Peru study, there is little published guidance on the scale of likely interactions. It
would be therefore important to closely monitor the effects and find out what hap-
pened with similar interventions elsewhere within the country and wider region.
4.17 Ranking Procedures, Cost Effectiveness & Multi-Criteria Analysis
Cost Effectiveness and Ranking
Whilst conventional economic cost-benefit analysis is commonly used to prioritize
main, secondary and urban roads, other methods are often employed to prioritize low
volume rural or feeder road investments. These procedures are often referred to as
"ranking" or "screening" procedures. Although there are many formulations, the dif-
ferent procedures are not deliberately designed to fit within a conventional economic
framework. The procedures often include indicators or measures of social as well as
economic demand, need or benefit. Compared with a conventional economic ap-
praisal less attention is given to the precision of coverage of benefits. Sometimes the

Rural Infrastructure Planning
67
procedure will include a method of incorporating consultation in the selection and
prioritization of road investments.
The main advantages of ranking procedures are:
Speed, simplicity and transparency
Ability to incorporate a measure of social benefits
Ability to directly incorporate community choice
The main disadvantages are:
The procedures may involve summing and weighting totally different charac-
teristics (i.e. adding up "apples and pears")
The weightings adopted are unlikely to be stable in the long run
It is difficult for the procedure to assist with the range of ancillary planning
choices that may be covered by a conventional economic appraisal such as
project timing, alternative project designs, combinations with other invest-
ment and maintenance options, etc.
The solution may be very far from optimal, leading to economically wasteful
investment in the sense that the same objectives may be achieved, by an al-
ternative approach, with less resources
Population is used as a key factor together with the costs of upgrading in the following
cost-effectiveness criterion identified by Lebo and Schelling (2001):
𝐶𝑜𝑠𝑡 𝐸𝑓𝑓𝑒𝑐𝑡𝑖𝑣𝑒𝑛𝑒𝑠𝑠 𝐼𝑛𝑑𝑖𝑐𝑎𝑡𝑜𝑟 𝑜𝑓 𝑙𝑖𝑛𝑘(𝑗)
=𝐶𝑜𝑠𝑡 𝑜𝑓 𝑈𝑝𝑔𝑟𝑎𝑑𝑖𝑛𝑔 𝑙𝑖𝑛𝑘(𝑗) 𝑡𝑜 𝑏𝑎𝑠𝑖𝑐 𝑎𝑐𝑐𝑒𝑠𝑠 𝑠𝑡𝑎𝑛𝑑𝑎𝑟𝑑
𝑃𝑜𝑝𝑢𝑙𝑎𝑡𝑖𝑜𝑛 𝑠𝑒𝑟𝑣𝑒𝑑 𝑏𝑦 𝑙𝑖𝑛𝑘(𝑗)
With this method, improvement of links that have the lowest ratio is given the highest
priority. The two key drawbacks of this approach is that there is no measure of bene-
fits resulting from the change in road condition and secondly no importance is at-
tached to traffic which is assumed to be represented by the population when it reflects
both the population and the specific socio-economic situation of the rural area ser-
viced by the road. This method assumes that the socio-economic situation in rural
areas is the same across the country.
An approach overcoming these difficulties has been suggested by Airey and Taylor
(1999) where two indices are derived one for impassable roads, the other for passable

Rural Transport in Africa – Planning Infrastructure & Services
68
ones. The approach is designed for roads that are less than 25 km in length and have
less than 25 vehicles per day. A simplification of the approach is presented below.
For impassable roads (for example where a bridge or culvert is broken) ranking is
based upon the minimum cost per head (person), of the population in the catchment
area of the road, for establishing access.
Cost/head = Estimated cost of minimum improvement works
Population served by or living in the zone of influence of the improvement
The lowest cost per head of establishing access would then have the highest priority.
For passable roads the prioritization is based on predicted traffic multiplied by an ac-
cess change and divided by the cost of the proposed improvement. Simplifying
Prioritization Index = Traffic x Access Change
Improvement Cost
In this case, the highest value has the highest priority. The access change is calculated
from an estimate of the change in road condition. Road condition is based on a scale
of 0 to 5, where a rating of "0" is for very poor and of "5" is good. The access change is
then rating for the “after” condition minus the rating of the “before” condition.
In their original paper19, the authors put forward an approach to estimate ‘post im-
provement traffic’ assuming that the road condition was not a constraint on traffic
levels based on different rural economic activities (for example based on marketed
agricultural output and traffic generated by other activities). Although this refinement
may help, the index should work well, to rank alternative projects, based purely on
estimates of dry season traffic volumes.
Another cost effectiveness approach was adopted in the Ghana Feeder Road Prioriti-
zation procedure where two measures of benefits are used based on both traffic (for
both motor vehicles and other users) as well as on the adjacent population. Seasonal
accessibility was also identified as a major problem and to address these issues a com-
bined index was developed (see Appendix 1).
19 The full paper may be obtained from Cardno IT Transport, The Old Power Station, Arding-
ton, Wantage, Oxfordshire, OX12 8QJ, UK, email: [email protected].

Rural Infrastructure Planning
69
Multi-Criteria Analysis (MCA)
In the form of multi-criteria analysis, ranking procedures may be used to combine
economic, social, environmental and other considerations in the final choice of alter-
natives for major road investment. The procedure has been widely used in this way in
Indonesia and other countries. For each characteristic, the different projects are as-
sessed and put into rank order (e.g. 1st, 2nd, 3rd, etc.). This process is then repeated for
the other characteristics. Weights are then assigned to each characteristic and an over-
all score is obtained. The process is demonstrated below in Table 5. In this table, to
achieve the desired result, the ranking is presented in reverse order, i.e. the highest
number rank refers to the best.
Table 5. Example of Multi-Criteria Analysis
Alternative 1 Alternative 2 Alternative 3
Rank Weight Score Rank Weight score Rank weight score
Economic evaluation 3 50 150 1 50 50 2 50 100
Environmental evaluation 2 30 60 3 30 90 3 30 90
Development 3 10 30 2 10 20 1 10 10
Public transport 3 5 15 2 5 10 2 5 10
Accessibility/ Severance 1 5 5 2 5 10 3 5 15
Overall score - - 260 - - 180 - - 225
4.18 Working with Road Planning Models
This section discusses key issues when working with the road planning models, HDM-
4, RED and RONET. The main purpose is to highlight how the models may be used
for rural road planning, and identify particular strengths and possible weaknesses.
Specific guidance on the operation of the model is provided on the websites where the
models can be downloaded.

Rural Transport in Africa – Planning Infrastructure & Services
70
Highway Development and Management, HDM-4
The HDM-4 (World Bank, 2000) is the principal road-planning model used to evalu-
ated major interurban road investments in most developing countries. The World
Road Association (PIARC) is now responsible for the model20.
The HDM-4 contains a wide range of modelled relationships relating to paved and
unpaved road deterioration, the effects of a wide range of maintenance and road work
activities, and vehicle operating costs for different vehicle types. According to the data
input the model will predict, year-by-year, the state of a road surface, vehicle speeds,
vehicle operating costs, vehicle pollution, and accident rates. It will also predict when
different types of road works be triggered. The model undertakes an economic analy-
sis based on the consumers surplus approach and standard decision criteria such as
NPV and IRR. A wide range of alternative maintenance and investment treatments
can be specified at the same time for a road project to find the best option.
HDM-4 is extremely versatile and can help design appropriate road surfaces, appraise
individual projects, act as a maintenance or pavement management tool to analyze
networks, predict network condition, identify future network budgets, and guide stra-
tegic planning. A wide range of reports are prepared covering traffic, road deteriora-
tion, works effects, road user effects (including VOC and accidents), environmental
effects, cost streams and economic evaluation, together with results of the multi-
criteria analysis. A similar process is undertaken under “Programmes” and “Strate-
gies”. In these cases, budget optimization can also be specified.
HDM-4 contains as a main strength, a very wide range of technical choices that can be
analyzed, and ranked according to rational economic criteria. Perhaps its most im-
portant drawback is that it is not freely available to potential users, it is expensive in
both monetary cost terms and in time and effort to learn how it can be used. Another
drawback is the considerable amount of data required to use the model. However,
because the model comes with various examples, and a lot of default values, it is pos-
sible to explore various design options, and prioritize different investments and
maintenance strategies, even if a full set of input data is not immediately available.
There remain a number of technical weaknesses to be addressed. Perhaps the most
important one relates to the uncertainty associated with the key roughness and vehicle
20 www.piarc.org/en/knowledge-base/road-assets-management/HDM-4-Software/
Rural Infrastructure Planning
71
maintenance relationships. There is also an unresolved problem for HDM-4, particu-
larly acute in Africa, relating to treatment of second-hand vehicles. HDM-4 relation-
ships are based on conventional lifetime use of new vehicles, and new vehicle prices
are required to be input into the model. However, most vehicles used in Africa are
imported second-hand, which will tend to have lower capital depreciation and higher
maintenance costs, higher fuel consumption, lower service availability, greater fre-
quency and cost of breaking down on the road, than newer vehicles. To help over-
come some of the uncertainty in the economic and engineering relationships, users
are recommended to calibrate relationships as appropriate with locally collected data.
With regard to engineering relationships, HDM-4 is best for gravel roads. HDM-4
relationships do not work well when the surface is composed of unspecified material,
which is by definition the case for earth roads, which do not have standard specifica-
tions for their materials. Likewise, HDM-4 principally models the effect of road sur-
face on vehicle speed through changes in road roughness. Similarly, it is not easy to
calculate the effects of traffic diversions that occur during the wet season, thus nor
modal shift from head loading to motorized transport that may happen with invest-
ment, the tool is not particularly useful for dealing with the provision of ‘basic access’
on earth roads.
Roads Economic Decision Model (RED)
The Roads Economic Decision Model was developed by SSATP to assist with the ap-
praisal of the investment and maintenance of low-volume roads (World Bank 2006c).
The model is Excel-based and is designed to be relatively easy to use with fewer data
input requirements compared with HDM-4. The model is freely available and can be
downloaded from the SSATP website under ‘Tools and Toolkits’.
Like HDM-4, RED is based on the consumer’s surplus approach to calculate benefits.
The model uses the VOC relationships of HDM-4 and can predict user benefits from
specified changes in road roughness. It is particularly useful for low volume roads
where seasonal passability issues are present. The user is able to specify different
roughness values, road lengths, for wet and dry seasons, together with the length of
the wet season, so it is easily able to cater for situations when vehicles need to season-
ally divert to other routes. RED is also able to deal with uncertainty (a major issue for
many rural road interventions) through a range of tools including risk analysis, sensi-
tivity testing and automatically calculated switching values.

Rural Transport in Africa – Planning Infrastructure & Services
72
Perhaps the most challenging aspect of using RED is that, unlike HDM-4, it does not
predict changes in road roughness, or other measures of road condition, from road
deterioration relationships. For unpaved roads, roughness is critically dependent upon
maintenance treatment; increased grading frequency can dramatically alter roughness
levels. Where uncertainty is very high, as for example dealing with provision of basic
access then there may be no option but to guess a suitable roughness level.
Road Network Evaluation Tools (RONET)
RONET was developed by the SSATP to help assess the performance of a country’s
road maintenance and rehabilitation policies. It assesses the current network condi-
tion and traffic, computes the asset value of the network and road network monitor-
ing indicators. It can be used to assess the performance over time of the network un-
der different road works standards and different budgets. The model can also be used
to determine appropriate road user charges to support the maintenance of the net-
work. RONET is freely available and can be downloaded from the SSATP website.
To undertake its analysis, RONET uses simplified road user cost relationships and
road deterioration/road works effects relationships from HDM-4. However, the mod-
el is relatively user-friendly being Excel-based and requires a far lower volume of data
input than HDM-4. RONET was used to provide an overall assessment of Sub-Sahara
Africa’s road maintenance, investment and funding requirements under the Africa
Infrastructure Country Diagnostic (AICD) (Gwilliam et al, 2008).
Overall, RONET provides an extremely useful tool for managing network and allocat-
ing funds. A possible weakness of the approach may relate to the broad traffic catego-
ries used in the analysis. The default versions of the AADT run for example, from 30-
100, 100-300, 300-1000, 1000-3000, 3,000-10,000. While it is unlikely that there would
be a gross error in overall budgets, traffic volumes, fuel consumption, etc. it is possible
though that a significant error might occur for these data within the individual road
surface and traffic categories. Only a detailed investigation would show this up.
Hence, it is recommended that the user checks the general reliability of classification
used against actual traffic data, and if necessary amends the class intervals.
4.19 Planning Village-Based Infrastructure using the iRAP Tool
There are three main ways of improving accessibility to village-based facilities:
Improving and increasing the availability of transport infrastructure

Rural Infrastructure Planning
73
Siting facilities more closely (proximity) to the household
Introducing and improving transport services and the means of transport
Village-based transport infrastructure includes community roads and tracks, foot-
paths and walkways, small scale bridges (see Figure 13) and river jetties. Village based
facilities might include water sources, woodlots, clinics / health centers, schools, mar-
kets, grinding mills, shops, post office, places of worship, sports ground, and commu-
nity hall.
Figure 13. A Community Footbridge in Kenya
iRAP has been an important tool for
planning and prioritizing rural infra-
structure and siting facilities. It is
also used to identify requirements
for improving the means of
transport. iRAP has been used at the
village, district and regional level.
However, in this section only its use
at the village/district level is dis-
cussed. iRAP is designed to be a
simple and user-friendly tool that can be used by local planners and communities.
iRAP procedure involves secondary and primary data collection, processing and anal-
ysis; preparation of accessibility profiles, indicators and maps; prioritization; data val-
idation and defining targets and objectives, project identification; implementation and
monitoring and evaluation (Donnges, 2003). Data is collected on: the general village
characteristics; sources of livelihoods, agriculture and marketing; the existing
transport system; location and availability and quality of services; travel times, fre-
quencies, costs and modes; perceived problems and priorities. A variety of accessibility
indicators will be used within iRAP. For example, for longer distance travel, transport
fares may then be the most appropriate accessibility indicator. However, personal
travel time from household to different facilities may be regarded as the core indicator
for planning village-level infrastructure.
In the iRAP procedure weightings may be used (for example carrying a heavy load
would be weighted differently from a journey not carrying a load) and a system of
thresholds may be employed, to help ensure for instance that every household was
Paul
Sta
rkey

Rural Transport in Africa – Planning Infrastructure & Services
74
within a certain maximum travel time to a facility. Community consultations will be
involved to decide on weightings and thresholds. From this, composite indicators can
be built up and locations mapped to show which communities are in need of what
facilities. Projects can then be identified to address the identified need.
In simple terms, the estimated reduction in total personal travel time may be regarded
as key benefit of a proposed investment. Priorities may then be assessed in value-for-
money terms, by comparing the forecast resulting change in travel time, say over a
year, with the investment cost. So similar projects could be ranked by ratios of the
change in travel time divided by the investment cost; and to efficiently use an available
budget projects with the highest ratios would be chosen first in rank order until the
budget is exhausted. Because different sectors will have different budget constraints,
the marginal cut-off ratios will vary from sector to sector.
The use of travel time savings as a key indicator of benefit, works best when the in-
vestments being compared have similar characteristics, life cycles and maintenance
and operating costs. When operating and maintenance costs become more important,
for example for non-transport infrastructure such as schools or clinics then a way has
to be found of bringing investment costs, maintenance and running costs to a com-
mon basis. Annualizing the investment costs is one solution, whereby priorities may
be determined by the annual total travel time savings divided by the difference in an-
nual investment and running costs. However, with larger and more complicated in-
vestments, a full cost-benefit analysis may be required. In this case, the appropriate
values of travel time will need to be used.
Quality issues, particularly for non-transport interventions, will also need to be con-
sidered, when planning infrastructure. For example, water quality will vary from
source to source. Similarly, education may be better provided in a larger school, where
supervision is easier to arrange. A larger clinic may be staffed with higher quality pro-
fessionals and will be more likely to have a consistent supply of drugs. Larger markets
will attract more traders and are likely to provide a wider range of goods and better
prices. There is also a case for developing the synergies between different sectors by
centrally locating key facilities so that they may in turn be supplied more cheaply by
electricity, piped water, roads and commercial transport services.
There is clearly a trade-off between quality and travel time (or quality and travel
costs)—difficult to quantify and incorporate all issues into a simple numerical priori-
tization framework. Nevertheless, it should be possible to sensitize communities to the
issues and help them adopt minimum size thresholds which will partially deal with the

Rural Infrastructure Planning
75
problem. These issues will of course be brought up by the different sector representa-
tives and sector ministries.
It has been estimated that survey costs for an iRAP village are around $30-$75 per
village (Donnges, 2003). In Malawi, iRAP field surveys were carried out in Ntchisi
District covering 254 Village Development Committees (VDCs) including 1,659 vil-
lages. The overall costs of the Ntchisi study was $700,000 including consultants, iRAP
and GIS surveys. The estimated roll-out costs to the remaining 25 other districts of
Malawi is estimated to be $250,000 per district, assuming a five year life would be
$50,000 per year, per district. (IT Transport Ltd in association with CCE Ltd, 2005).
A number of significant initiatives covering district and village level transport, using
iRAP and other approaches, have been set up in different countries with initial sup-
port of donor organizations including the SSATP under its rural component. Exam-
ples from Malawi and Ethiopia are outlined in Appendix 2.

77
5. Introducing and Planning Transport Services
Transport Services have been called the “forgotten problem”. There is a persistent
widespread assumption that investment in roads will spontaneously lead to the
provision of transport services by the private sector (Porter, 2013). Yet as is shown
in Chapter 2 for much of the rural population, road services are unavailable, infre-
quent, dangerous and expensive. Transport services in rural areas are overwhelm-
ingly provided by the private sector, while the institutional capacity of the gov-
ernment to monitor, evaluate and intervene in the provision of rural transport
services is very weak. What capacity there is tends to be directed towards urban
and to a lesser extent interurban services.
5.1 Introducing Intermediate Means of Transport
The use of intermediate means of transport (IMT) in Africa has been growing,
both in volume and in diversity over the past thirty years. The growth in motorcy-
cles, in Tanzania from 2005 to 2010, which was at a compound rate of 60 percent
per year, is such an example. Starkey (2001) lists other examples:
Kenya imported fewer than 2,000 bicycles in 1985, but as many as
100,000 in 1989.
In Mauritania, the number of donkey carts increased from zero to 75,000
in 30 years.
Transport donkeys in Sahelian countries increased from one million in
1950 to 2.5 million in 1999.
In Senegal, more than 150,000 animal drawn carts have been sold from
one factory.
The growth of IMT has been overwhelmingly supplied by the private sector, with
relatively little direct government involvement, although changes in taxation and
import duties may also have played a part. Donor and government sponsored pro-

Rural Transport in Africa – Planning Infrastructure & Services
78
grams to introduce IMT have also been tried out, on small scale, in many African
countries. However, most of these initiatives have not been successful in the longer
term. A number of review papers relating to their adoption and IMT initiatives
were carried out from 2001 to 2006 (Starkey, 2001; Porter, 2002; IT Transport Ltd,
2003; IT Transport Ltd, 2006). Their general findings suggested the following:
Acceptance and growth in their use is not entirely predictable.
Growth in their use tends to occur around existing established clusters of
users. Hence, for a new initiative a minimum number of IMT concentrat-
ed in an area may be a better strategy for establishing long-term use, by
providing a market for spare parts and repair facilities and gaining wider
acceptability in their use.
Cultural factors can be extremely important in determining the uptake of
an IMT. In many countries, negative attitudes against women owning
and using an IMT have prevented their use. Likewise, some are perceived
to be low status, as for example bicycles in southern Ghana.
Access to spare parts or repair and maintenance are very important for
more complex ones such as power-tillers.
Ability of an IMT to generate time and effort savings in carrying out
household chores may not be enough to secure long-term viability. Being
able to directly earn cash income from the IMT (for transport services,
marketing or hiring it out) may be very important for long-term viability
and to ensure that funds are available for maintenance when required.
Ability to make good use of an IMT all year round, for passenger
transport for instance, may be important in the long-term adoption of an
IMT, rather than just being able to use it for moving goods during the
harvest period.
Availability of loans to secure IMT is also a key element. However, care
must be taken to ensure that users have wide options as to which IMT
may be purchased. Unsatisfactory results can arise if the loans are tied to
particular IMT types.
Men may be reluctant to lend out their IMT to their wife or children if
they believe they will not be repaid should a repair be necessary.
There is evidence that within rural areas of specific countries the richer
sections of the population will adopt IMT at a faster rate than the poor

Introducing and Planning Transport Services
79
sections of the population. Larger farmers can use the IMT more inten-
sively for marketing. Hence, care needs to be taken if IMT programmes
are directed specifically towards the poorest groups.
Quality of IMT being provided is important. Many IMT manufactured by
local artisans have been of poor quality and have failed to take off because
they have not given good service.
Environmental and cultural factors are very important with the introduc-
tion of animal transport. Humid climates do not suit donkeys and cam-
els. People must have basic understanding of animal health care.
Despite the difficulties, programs to introduce animal traction (such as
donkey carts), with suitable training have been amongst the most success-
ful initiatives.
Government regulations on use of IMT (such as bicycle, motorcycle, taxi
or for hire operations) may limit its earning capacity and restrict its use.
Roads, tracks or pathways must be suitable for IMT use. For example, bi-
cycles are not suitable for sandy soils of Senegal.
Clearly, a wide range of issues need to be addressed when considering an IMT in-
troduction program. Although there are no guarantees of success, the program is
more than likely to fail if just one of the above issues is not satisfactory. The issues
need to be researched and the program well-funded. Methods of possible promo-
tion include setting up demonstration projects with training in use and animal
care; repair facilities; ensuring that taxation levels on the import of key IMT (bicy-
cles, motorcycles) are not a disincentive; and allowing new forms of IMT based
services to be licensed for commercial hire.
5.2 Improving the Policy and Legal Framework of Services
Although there have been a few studies that have looked at the way rural transport
services operate, very little has been published on the oversight, management and
legal framework of transport services in Africa. In much of Africa, rural transport
services are run from bus and lorry or trucks where vehicles queue, and customers
are obliged to go to the first vehicle in the queue. By sharing out demand in this
way, the operators have formed a cartel that tends to keep prices high, restricts
utilization and keeps older vehicles in operation. The role of transport unions and
associations that run the trucking terminals is discussed in Section 2.7.

Rural Transport in Africa – Planning Infrastructure & Services
80
In Ghana, the Ghana Private Road Transport Union (GPRTU), runs truck and bus
terminals, and helps enforce transport tariffs and fares. In Tanzania, the Surface
and Marine Transport Regulatory Authority (SUMATRA) regulates the frequency
and fares of the larger buses operating in rural areas; however, there is much less
control over the operations of smaller vehicles. Police enforcement of safety and
licensing regulations, together with axle load control, is very common on major
routes, but less common on lightly trafficked rural roads in Africa.
Wide differences in the pattern of motorcycle and bicycle taxis have been ob-
served. In some countries such as Ghana for instance, motorcycle and bicycle taxi
services are rare, while in other countries (Nigeria, Kenya, Uganda or Tanzania)
they are very common. However, it appears that in Tanzania, the services are not
legally allowed although there is no enforcement to prevent the operations.
In contrast with urban transport policies, rural transport policies in Africa appear
to be relatively silent on services and tend to focus on the provision of infrastruc-
ture, planning the location of facilities close to the population, and the provision
of IMT. However, concern over poor services and the operation of cartels (in this
case for urban transport, but the same issues are also likely to apply to rural
transport) is evident from the Kenya Transport White Paper (Republic of Kenya,
Ministry of Transport and Communications, 2004).
There are no easy solutions to directly improving existing transport services. Pow-
erful vested interests will resent changes they perceive as threatening. Working in
rural areas is doubly difficult given the difficulty of monitoring operators away
from the main towns and off main corridors. In order to address key issues, it is
first necessary to undertake surveys to collect information on the nature of services
that are currently provided. This will provide direct evidence of the case for inter-
vention and which areas of the country are most in need. Furthermore, major new
initiatives in rural transport services are likely to require changes in the legal and
regulatory framework backed up and guided by a new articulation of (Rural)
Transport Policy (see Section 2.1). This in turn will also require studies, discus-
sions with stakeholders, possible pilot interventions and a great deal of consensus
building. A possible scenario for moving forward might be as follows:
Government and donors are requested to support a new approach and pro-
vide initial funding for studies, meetings and pilot interventions.
Terms of reference are prepared and consultants recruited to collect local
background information, undertake brief rural surveys, interview stake-

Introducing and Planning Transport Services
81
holders, identify possible pilot interventions, and map out a framework for
moving forward.
A senior public official is identified to act as a ‘Champion’ to see reforms
through.
A stakeholder workshop will then be held to review and refine the frame-
work and make recommendations.
Pilot interventions are carried out and monitored by consultants.
Results of the pilot studies are reviewed at a stakeholder workshop, followed
by a public meeting to review the findings of the workshop.
A policy paper is prepared that can be presented to Cabinet and adopted as
Government Policy.
Changes in legislation are drafted, and presented to Cabinet and Parlia-
ment. Any associated changes in public budgets are implemented together
with institutional changes in regulatory and service organizations.
New policy is then adopted, implemented and monitored.
Before any new transport policy reform measure is considered, it would be useful
to review how it might be implemented. A useful checklist is provided in the
World Bank Transport Note, ‘Economic Appraisal of Regulatory Reform – Check-
list of Issues’ TRN 24, 2005.
5.3 Possible Transport Service Solutions
A number of possible transport service solutions are outlined below. Some solu-
tions may be covered by existing legislation while for others new legislation may be
required. In each case, it will be necessary to decide how the changes will be im-
plemented and which bodies will be responsible for monitoring and enforcement.
Maybe a new regulatory authority will be the best option (as for example SUMA-
TRA in Tanzania). Obviously, where new resources are required it will be neces-
sary to identify sources of funding.
Operator, Vehicle and Driver Licensing
In most countries, vehicles and drivers are tested and licensed so that they are safe
to operate commercial services. Increasingly, commercial operator licensing has
Rural Transport in Africa – Planning Infrastructure & Services
82
been introduced to ensure that vehicles are properly managed in a safe way; a
technically qualified manager is specified as being responsible. However, for many
countries it may be too expensive and not practical to insist that a properly quali-
fied manager looks after small buses and trucks on short distance rural operations.
The approach should be adopted for high capacity long distance buses and trucks
where the dangers of speeding and accidents are considerable.
Controlling Routes and Fares
Route licensing. This helps restrict the number of operators on a route. It is used
for bus operations, with a requirement that a certain service frequency is achieved.
Fare control. This helps prevent operators from overcharging fares.
Encouraging Competition through Rival Associations
The example from Northern Cameroon (see Section 2.7) shows how the local
mayor tackled the transport associations directly and got them to provide a higher
quality service at a lower price. In this case, rival associations were set up so that an
element of competition was involved. A key issue is controlling the number of
vehicles as this is often a major force promoting high fares if there is oversupply of
vehicles for a limited demand. Competition by rival associations may be set up
through competition by different forms of operator i.e. large buses, minibuses,
motorcycle taxis, pickup trucks, trucks, power tiller transport, etc. Each type of
vehicle might be assigned its own terminal in the urban center and be operated by
a different association.
A Public-Private Partnership (PPP) Bidding for the Market
In most high-income countries, rural passenger transport is subsidized to ensure
that minimum service frequencies are achieved and fares set at a reasonable level.
This is mostly achieved through a PPP setting with operators ‘bidding for the mar-
ket’ whereby different operators put in a competitive bid to be subsidized by a
certain amount, assuming a given service frequency and fare levels. The operator
that demands the least amount of subsidy is given the exclusive right to operate on
the route. The arrangements can vary, sometimes the operator collects and keeps
the fares, in other arrangements fare revenues go back to the government agency.
To estimate the amount of subsidy required to sustain a transport service, Rabal-
land et al. (2011) undertook surveys of both bus operators and passengers in rural
Malawi to determine how much the local population were willing to pay.
Introducing and Planning Transport Services
83
State-Owned Services
Although national bus companies still operate in many countries, the approach
diminished with the worldwide move to commercialization in the 1980s and
1990s. It was felt that States could not operate efficient services and private opera-
tors would do better. Although there have been many benefits from commerciali-
zation, it has had some serious adverse effects on some rural routes, in Zambia for
example, where services were permanently discontinued without private operators
filling the gap. At the last resort, it is an option where nothing else will work, alt-
hough there may be subsidy involved, which will have to be looked at carefully.
Village-Owned Vehicle
One solution would be a cooperatively run and operated vehicle by, prominent
members of a village, the village council, or a local religious group. The approach
has been adopted from time to time (Millennium Village Initiative) but very little
information is available. There is anecdotal evidence of failure (i.e. people in the
village run it for their own personal gain or disappear with the assets) and some
evidence of success (the Sri Lanka Community Bus Project set up with the help of
the local IFRTD in 1997). Some initial external finance was available but the bus
generated an income, which kept it going and a replacement bus was purchased,
by the funds generated, in 2008. An evaluation of the project was carried out by
the Centre for Poverty Analysis, (2009).
Monitoring Prices of New Vehicles and Spare Parts
Major differences have been found between countries in the prices of new vehicles
and spare parts. Prices in Africa tend to be extremely high (often in the range of
two to three times) compared with those found in Europe and Asia, for virtually
identical new vehicles and parts. Because of the high prices for new vehicles, sec-
ond-hand vehicles tend to be imported which can be very unreliable. It is suggest-
ed that governments maintain a database of prices and components to monitor
what is happening in the sector. The information may be used to challenge dealers,
identify restrictive practices and set taxation policy.
Promotion of Transport Services for Maternal Health and Emergencies
A number of initiatives have been developed to help expectant mothers get to hos-
pital, and more widely assist with medical emergencies. These include provision of
specialized motor vehicles and IMT to act as ambulances. There have also been
training and vehicle maintenance programs for medical staff. In Northern Nigeria

Rural Transport in Africa – Planning Infrastructure & Services
84
a program working with the National Union of Road Transport workers has also
had a great deal of success in helping to get women in labor to hospital using taxis.
(Adamu, et al., 2012).
A study undertaken in Uganda showed a 62 percent improvement in health service
access with the bicycle ambulance ("Appropriate Mobility for Improved Access to
Health Care Services in Rural Communities. A Case Study of the Bicycle Ambu-
lance Project" Kayemba, Patrick G. and the FABIO Team.) The study shows that
women were the greatest users of this concept although Uganda is a male domi-
nated society and women’s opinions did not count for as much. Officials did not
either put the word out about the availability of this service. The usage rate could
have been even higher if there had been a public education program in place to let
people know about the bicycle ambulance program. Public education is a critical
component that must be part of any program for people to get the maximum ben-
efit from it. Still, the bicycle ambulance program in Uganda has been successful in
saving many lives and has provided a faster means of transport to move those who
cannot walk and who can't afford motorized transport.
5.4 A Framework for Prioritizing Service Interventions
There is currently very little advice available to help prioritize service interven-
tions. This is clearly a problematic area, as there are no ready-made solutions.
The main focus of the framework proposed in the following section is to assist
with planning transport service interventions, although the approach can also con-
ceivably be used to plan transport investments or prioritize between types of
measures. The outlined approach is based on a simplified version of cost-benefit
analysis whereby the user tries to quantify the likely benefits in monetary terms,
compared then with the estimated intervention costs. Although monetary values
are used to assess the benefits and costs, the approach should not be thought of as
a robust economic analysis—it is more an aid to decision-making to help identify
the strengths and weaknesses of interventions and compare them.
The Framework Components
With the framework procedure, a wide range of information needs to be collected.
Much of it may be very uncertain and best ‘guestimates’ are likely to be required. A
range of data is to be collected, particularly involving costs and estimates of mone-
tary values of benefits along with estimates of the strength of support of different
Introducing and Planning Transport Services
85
measures and the likelihood of their success. It is suggested that Delphi method be
employed to obtain some of the data (See Chapter 3).
The proposed information to collect is as follows:
Name and type of intervention
Geographic area covered
Target beneficiary population
Current incidence of use of service or facility
Expected growth in use per year
Expected increase in use as a direct result of proposed intervention
Maximum realistic monetary benefit, or cost reduction, per event or trip
Strength of political support to initiate intervention
Strength of administrative budgetary and funding support
Strength of support by target beneficiary population
Strength of support by current service providers
Strength of support by regulators
Likelihood of strong adverse reaction by key players
Probability of implementing intervention within five years
Evidence of success of similar interventions elsewhere
Expected percentage realization of estimated maximum benefits
Initial cost of implementing intervention
Annual running costs of intervention
Anticipated lifetime of intervention for planning purposes
Name and type of intervention: This is obviously required for future reference and
to distinguish between interventions.
Geographic area covered: Interventions can differ enormously in scale depending
on the targeted geographic area covered. They may be for a village, a road, a local
district, a region or for a whole country.

Rural Transport in Africa – Planning Infrastructure & Services
86
Target beneficiary population: To estimate total benefits of service interventions it
is required to identify the direct population that will benefit from the intervention.
It may be appropriate to record total population in the area or just the specific
users of the service.
Current incidence of use of service or facility: This is calculated in relation to the
chosen beneficiary population. It may be calculated per event or per trip, by indi-
vidual members of target population per year. For a service or facility that is to be
improved then the incidence relates to the existing use of that service or facility. If
a new service or facility is to be introduced then incidence of use of the nearest
alternative should be recorded.
Expected (normal) growth per year: This relates to the expected growth in use for
an existing unimproved service or facility. Annual population growth or annual
traffic growth might be appropriate metrics.
Expected increase in use as direct result of the intervention: An increase in use as
a result of the proposed intervention is in addition to the expected normal growth
given above. It is the same as ‘generated traffic’ in road project appraisal.
Maximum realistic monetary benefit, or cost reduction, per event or per trip: This
estimate of benefit directly relates to the measure of incidence of use given above.
There are different ways of estimating the monetary benefit. One approach is via a
calculated change in transport fares and costs to the user as a result of the inter-
vention. This is, of course, similar to the transport cost savings benefits that is used
in road appraisal. However forecasting cost changes will not work, as estimate of
benefit, for many transport service interventions. For example major components
of the benefits may be social or from controlled fares, via some form of new com-
petition or regulatory control. In these cases, it may be better to estimate the bene-
fit by Delphi techniques using a focus group. The estimate of benefits is specified
as a realistic maximum, further information will be used to estimate what propor-
tion of the maximum benefit will actually be achieved.
There are a variety of methods for directly estimating transport cost savings. The
approach adopted will depend on the nature of the intervention and the infor-
mation available. For interventions at the village-level, the iRAP approach that
focuses on personal time savings, multiplied by the value of time may be the best
to use. If IMT interventions are planned then it will be necessary to compare the
value of current travel time, not using the IMT, with the cost of using the IMT,

Introducing and Planning Transport Services
87
together with the operators’ time. In this case, either current hire costs of the IMT
might be employed or its costs may be calculated from the purchase price together
with an assumed utilization rate, interest charges, vehicle lifetime and mainte-
nance and running costs. If new patterns of vehicle operation are planned then
evidence may be collected from elsewhere to estimate the extent to which fares
may be reduced. Obviously, evidence of transport price changes from similar in-
terventions in similar circumstances will carry the most weight. In any event, it
will be essential to collect existing fares and freight tariffs. It will also be useful to
carry out a full financial analysis of operating costs, including hire charges (or de-
preciation and interest costs), running and maintenance costs, together with real-
istic utilization rates to see whether the predicted fare levels are plausible.
If the nature of the intervention is more social in character then a Delphi tech-
nique should be employed, whereby a panel is asked to provide an estimate of the
monetary value of the benefit resulting from the intervention. For this, it will be
essential to prepare a package of information for the panel that they can refer to.
This should include information on the current travel patterns and fares, and lev-
els of income and expenditure, as well as information on the proposed interven-
tion and past records of successes and failures. It might be best if the panel is com-
posed of both technical experts as well as representatives of the local community.
Strength of support (or adverse reaction) by different stakeholders: In order to
estimate the likelihood of success for different interventions, it is important to
gauge what support there is among different stakeholders. Measures of support
may be best expressed as a percentage, with 100 percent being maximum support
and 0 percent representing no support. The likelihood of adverse reaction would
be the reverse with 100 percent representing very strongly against the proposal. It
is not usually necessary to consider the support for most rural transport infra-
structure because it usually has very substantial support from virtually all stake-
holders. However, the situation may be more complicated with transport services.
New institutional arrangements and new legislation may be required, which may
be problematical with a challenge from vested interests. Clearly, the support for
interventions will vary according to what initial groundwork is carried out before-
hand to elicit support and to allay fears.
The following stakeholder support and reactions are identified:
Strength of political support to initiate intervention
Strength of administrative budgetary and funding support for intervention

Rural Transport in Africa – Planning Infrastructure & Services
88
Strength of support by target beneficiary population
Strength of support by current service providers
Strength of support by regulators
Likelihood of strong adverse reaction by key players
This list is not fixed and other stakeholders (police, local government, road au-
thorities) may be identified. If it is not practical to interview or survey different
stakeholders then Delphi techniques may be employed to gauge likely support.
Probability of implementing intervention within five years: From an assessment
of the stakeholder and budgetary support, an estimate may be made of the likeli-
hood of being able to make the intervention within a reasonable timeframe.
Evidence of success of similar interventions elsewhere: Available evidence of suc-
cess and failure for different interventions should be supplemented by further in-
formation searches.
Expected percentage realization of estimated maximum benefits: From a judg-
ment based on an assessment of evidence of similar interventions elsewhere to-
gether with evidence of stakeholder support, an estimate of the expected percent-
age realization of estimated maximum benefits may be made. Again, Delphi tech-
niques may be employed to review the evidence and make the assessment.
Initial costs of implementing intervention: The costs of implementing an inter-
vention are essential for planning and getting value for money. The costs of
providing road infrastructure are well known; however, the costs of implementing
new services are less understood. Section 5.1 outlines a number of steps that might
be required to implement new transport service interventions. This may include
considerable consultation, and legislative changes. However, from an opportunity
cost point of view only future costs should be included in an analysis. The costs of
earlier work can be regarded as ‘sunk costs’ and may be ignored. Therefore, when a
key decision has to be made for moving forward, which may be a choice between
different interventions, then the total future costs of the different scenarios need to
be calculated. These costs should include future administrative staff time, the costs
of preparing legislation, the costs of consultation together with the costs of further
surveys, and the costs of any additional pilot studies.

Introducing and Planning Transport Services
89
Annual running costs of intervention: The running and maintenance costs of any
intervention need to be factored into decision-making. For the purposes of any
analysis what is wanted is the net difference in running and maintenance costs
between the current situation (the non-intervention case) and the intervention
case. So for some interventions where running and maintenance costs are very
similar between the intervention and non-intervention cases these costs may ig-
nored. Similarly if the estimate of net benefits already takes into account reduced
running costs, as for example in an estimate of the benefits of IMT or new
transport services, then it will be unnecessary to factor them in again. However,
where a major change in the regulation of services are planned then the additional
costs of ongoing regulation should be included.
Growth in running costs: It may be necessary to accommodate the growth in run-
ning costs over the lifetime of a project.
Anticipated lifetime of intervention for planning purposes: In any comparison of
costs and benefits, it is necessary to consider the lifetime of the intervention. The
average lifetime of motorized vehicles, in normal use, is around ten to fifteen
years, although modern vehicles may now last much longer. Of course, individual
vehicles can last much longer. The effects of policy changes can last many genera-
tions although they can also become dated as the nature of institutions and eco-
nomic activity changes. So a maximum lifespan of say 20 years is recommended. A
cost-benefit analysis usually involves discounting hence increasing planning time
horizons beyond 20 years may have little impact on the analysis. It is recommend-
ed that discounting is applied for this framework analysis.
Framework Analysis
In order to estimate how worthwhile any intervention will be or to compare differ-
ent interventions it is suggested that forecast year-by-year stream of costs and ben-
efits are incorporated into a spreadsheet format and the Net Present Value, IRR
and NPV/C calculated.
The overall estimated benefits per year will need to be calculated in a number of
steps. It is first necessary to calculate the maximum benefits per year for the target
population. This is split between normal traffic and generated traffic, as in a con-
ventional road project appraisal.
Rural Transport in Africa – Planning Infrastructure & Services
90
Maximum normal benefits per year, in any given year, for target population is
equal to:
(Target beneficiary population) x (Incidence of use per year) x (Maximum realistic benefit per incidence of
use) x (traffic growth factor for year in question)
Maximum generated traffic benefits per year, in any given year, for target popula-
tion is equal to:
(Target beneficiary population) x (Incidence of use per year) x (Maximum realistic benefit per incidence of
use) x (Traffic growth factor for year in question) x (Expected percentage increase in use as a result of the intervention) x 0.5
The 0.5 factor is as for the standard treatment of generated traffic in a normal road
appraisal.
The total maximum benefits per year (for any given year) is then the sum of:
(Maximum normal benefits) + (Maximum generated traffic benefits)
To estimate the Total expected benefits per year this is calculated by:
(Total maximum benefits per year) x (Expected percentage realization of maximum benefits)
There is no precise formula for the Expected percentage realization of benefits. It is
necessary to make a judgment looking at the strength of support, the evidence of
success elsewhere and the probability of implementing the intervention. Again,
Delphi techniques may be employed.
To calculate a Net Present Value or Internal Rate of Return from each intervention
the Total expected benefits per year should be entered into a spreadsheet, for the
planning time horizon of the project, along with the estimated Initial costs and
Annual running costs of the intervention. For the NPV the costs and benefits may
be discounted at the country’s planning discount rate. Section 7.6 outlines the
procedures for calculating different decision criteria such as NPVs, IRRs, NPV/C
and how they may be interpreted.
Of course it is important to remember that the analysis may only represent a gen-
eral guide to how worthwhile the different interventions are. The emphasis of the
analysis is to see the project’s benefits from a social/ economic perspective. A sepa-
rate financial analysis may also be required, to see whether the service will be self-
sustaining or whether subsidies will be necessary. Obviously, the data used have to

Introducing and Planning Transport Services
91
be expressed in economic price terms to ensure that the analysis represents a con-
ventional economic analysis.
Examples of the use of the Prioritization Framework. Three hypothetical exam-
ples showing the use of the framework are outlined below. These relate to setting
up an IMT initiative, encouraging competition between transport service opera-
tions, and providing emergency ambulances.
An IMT Initiative
In this example, it is proposed to provide 1,000 IMT to 1,000 families. The IMT
are estimated to cost $150 each giving a total of $150,000. The costs of initial ad-
ministration and setting up repair facilities are estimated to cost another $50,000.
Overall running costs of the IMT, together with repairs and ongoing administra-
tion is estimated to be $15,000 per year. This is anticipated to grow at 5 percent
per year. It is anticipated that each IMT will be used 200 times per year and that
the estimated maximum benefit for an average trip (assuming all goes to plan),
calculated on the basis of savings in time in effort, is $0.6 per trip. The expected
growth rate in use is 3 percent per year and expected overall increase in activity
(i.e. generated traffic) is 20 percent. The anticipated lifetime of the project is 10
years. The project is planned to be set up in one year with full benefits occurring in
the next year. The support from different stakeholders is identified in Table 6. Im-
plementation probability is set at 70 percent, and evidence of previous success was
estimated to be 60 percent. An overall judgment is made that realization of maxi-
mum benefits will be 40 percent giving overall realistic net benefits of $37,800 in
the first year. (i.e. normal maximum benefits of $120,000, and generated max ben-
efits, $12,000; both multiplied by 40 percent less running costs of $ 15,000).
Table 6 provides key project information together with the calculated NPV, IRR
and NPC/C results. In this example no information on financing of the IMT are
included. If loans are provided to pay for the IMT then a separate financial analysis
would be required.

Rural Transport in Africa – Planning Infrastructure & Services
92
Table 6. IMT Project Example Data
Population to Benefit Use (of IMT) per year per family Annual growth in use per year Induced increase in activity by IMT Maximum benefit per trip Political support Administrative support Population support Regulatory support Adverse reaction Implementation probability Evidence of past success Realization of maximum benefits Initial costs Initial running cost Growth in running costs Anticipated project lifetime
1000 families 200 times per year 3% growth 20% $0.6 90% 50% 80% 50% 10% 70% 60% 40% $200,000 $15,000 5% per year 10 years
NPV @ 12% IRR NPV/C
$39,542 16.7% 0.2
Encouraging Competition between Transport Service Organizations
In this example, it is planned to encourage competition between transport services,
and help reduce fares, through getting existing operators to operate from rival
transport service organizations. The earlier reported example of Ngoundere Dis-
trict in Northern Cameroon may be used as a model. It is proposed that a region
of a million people will benefit from the change, which will involve the setting up
of 20 transport terminals. The operators will continue to use their own vehicles;
however, some compensation will be paid to those operators who wish to leave the
business. This will reduce the oversupply of vehicles and help reduce monopolistic
practices. The remaining operators should achieve greater utilization of their vehi-
cles and hence lower costs.

Introducing and Planning Transport Services
93
Table 7.Competition in Transport Services Project
Population to Benefit Service use per person, per year Annual growth in use per year Induced increase service use Maximum benefit per trip Political support Administrative support Population support Service provider support Regulatory support Adverse reaction Implementation probability Evidence of past success Realization of maximum benefits Initial costs Initial running cost Anticipated project lifetime
1,000,000 people 10 times per year 4% growth 10% $0.5 80% 50% 90% 10% 60% 40% 50% 40% 25% $2,500,000 $250,000 15 years
NPV @ 12% IRR NPV/C
$6,076,301 47% 2.43
The expected incidence of use will be 10 trips per person per year. Expected annual
growth is 4 percent per year, the expected induced increase in demand for services
will be 10 percent as a result, of the changes. The maximum benefit per trip is es-
timated to be $ 0.5, based on the anticipated reduction in fares. The support of
different stakeholders is identified in Table 7. The implementation probability is
set at 50 percent and evidence of past success is set at 40 percent. Based on judg-
ment the overall estimate of realization of maximum benefits is set at 25 percent.
The initial costs of the project are $ 2,500,000 to cover the costs of consultation,
additional transport terminals and pay compensation. The annual running costs
are estimated to be $250,000 to pay for increased regulation. The anticipated life-
time of the project is 15 years.
In this example, the first full year of net benefits is calculated to be $1,062,500.
Setting up Emergency Transport
In this example, an emergency transport service is to be set up for one million
people. The service costs $ 250,000 to set up for some 50 motorcycle ambulances.

Rural Transport in Africa – Planning Infrastructure & Services
94
The running cost is $50,000 per year, but estimated to grow at 5 percent per year.
The estimated use is 0.005, i.e. a half of one percent per year per person. Annual
growth in use will be 3 percent per year. The maximum average benefit per trip is
set at $100 per trip. This value is decided by a focus group considering the availa-
bility and quality of service of alternative methods. It is high, because of the poten-
tial of saving lives. The implementation probability is set at 80 percent and evi-
dence of success is estimated to be 80 percent. The support for the service is indi-
cated in Table 8. The overall judgment of realizing the maximum benefits is set at
80 percent. The anticipated lifetime of the project is 10 years.
Note: With national and district data it may be possible to calculate, for an area,
the expected number of maternal, and other, emergencies that are likely to arise
per year, and further estimate the proportion of deaths that could be reduced by
improved transport.
In this example, the first year of net benefits is $350,000.
Table 8. Setting Up an Emergency Transport Service
Population to Benefit Use per person, per year Annual growth in use per year Induced increase service use Maximum benefit per trip Political support Administrative support Population support Service provider support Regulatory support Adverse reaction Implementation probability Evidence of past success Realization of maximum benefits Initial costs Initial running cost Growth in running costs Anticipated project lifetime
1,000,000 people 0.005 times per year 3% growth 0 $100 95% 70% 95% 80% 70% 0% 80% 80% 80% $250,000 $50,000 5% per year 10 years
NPV @ 12% IRR NPV/C
$1,841,754 143% 7.37

Introducing and Planning Transport Services
95
Observations on the three examples
Clearly, the emergency transport has the highest IRR and NPV/C ratio. This is
because of the very high valuation per trip ($100) and the high realization of bene-
fits (80%) because of the very substantial support for the operation.
The transport services project also has a relatively high IRR and NPC/C ratio de-
spite the low valuation of realization of maximum benefits (25%). This is because
the overall investment per trip is relatively low, at around one quarter of that of
the IMT project, for the first year.


97
6. Methods for Planning and Prioritization of
Infrastructure & Services
6.1 The State of Rural Transport in Sub-Saharan Africa in a Nutshell
Rural transport comprises a range of interrelated activities from the collection of
water and firewood, travel to farms, agricultural transport and marketing, travel to
school, health centers and hospitals, markets, shops and work, trips to friends and
relations as well as the provision of means of transport and the provision of infra-
structure. Although the data are far from being comprehensive, it is clear that Afri-
ca is at a major disadvantage compared with Asia in terms of availability of IMT
and transport services, efficiency of agricultural transport and marketing, and
transport costs. There is clearly scope for major improvements.
Rural road investment has so far dominated government and donor supported
rural transport interventions. Despite its importance, rural road planning is poorly
carried out, with little analysis of choice or alternatives, based on very limited data.
It is also worth noting that road investment may promote growth and raise in-
comes of the better off. However, until village-level transport and rural transport
services are dramatically improved, rural transport in Sub-Saharan Africa will re-
main a drag on the rest of the rural economy and prevent much of the rural popu-
lations from achieving their full potential.
Rural transport in Africa is not static. Over the last twenty years, there has been
major increase in the availability of improved domestic water supply which has
obviously reduced the daily household drudgery of collecting water. Secondly,
there has been a gradual improvement in availability of bicycles and some other
types of IMT. Over the last ten years, there has also been an almost explosive
growth in the availability of motorcycles, although their numbers per head of pop-
ulation are still very low. With the recent spread of mobile phone, new forms of
door-to-door transport services have become available to the better off sections of
the population. Likewise, with the advent of road funds, there have been real im-
Rural Transport in Africa – Planning Infrastructure & Services
98
provements in the maintenance of parts of the rural road network. Yet, perhaps
the majority of rural roads and tracks receive no systematic maintenance and,
many isolated areas do not have access to any forms of transport service.
6.2 A Framework for Planning and Prioritization
Fundamental to all rural transport planning is the need for adequate data and
properly trained staff. However, too often both of these are lacking, particularly at
the district level. In this case, extra resources need to be found to collect traffic and
other data as well as provide training for planning and engineering staff in the
techniques of transport planning. It is essential that they be able to identify realis-
tic alternatives and subject them to analysis to determine the best options. It is
only when this has been achieved that proper planning processes can be undertak-
en for both locally funded and donor funded programs.
This paper has outlined a range of measures and procedures to help plan and pri-
oritize rural transport infrastructure and services. These include Cost Effectiveness
and Ranking Criteria, Integrated Rural Accessibility Planning (IRAP), HDM-4,
and the Road Economic Decision model (RED). A new planning procedure, the
Rural Transport Services Prioritization Framework, is introduced primarily to assist
with planning Transport Service Initiatives. It has been pointed out that there are
strengths and weaknesses in all approaches, and that there is no one solution or
approach that will be ideal in all circumstances.
For rural road planning, the most important objective is to achieve basic vehicle
access. This has important economic and social benefits. A spot improvement ap-
proach, whereby the main objective is to achieve all season access is likely to pro-
vide the best value for money where traffic volumes are low. However, a transport
cost-benefit analysis approach is unlikely to work well due to the difficulties of
assessing the social and long-term developmental benefits of establishing basic
vehicle access. So where communities are completely cut off, or all season access is
not provided, then road investments may be prioritized by a form of a cost-
effectiveness criterion that takes into account adjacent population and traffic. It is
important that the initial local screening, within a district, involves strong com-
munity participation. The Airey and Taylor (1999) approach or the Ghana Feeder
Road Prioritization approach are useful examples of prioritization methods.

Conclusions
99
Once all year round access has been achieved then, road investment priorities for
improving earth and gravel roads with low traffic volumes (under 200 AADT) can
be envisaged via a transport cost savings approach. The RED road appraisal model
is well suited for this purpose. If a detailed assessment of road maintenance poli-
cies is required, higher traffic volumes are to be examined, or paved road solutions
are to be investigated then, the HDM-4 model is better suited because of its ca-
pacity to examine road deterioration, alternative structural designs and wide road
works effects. For both approaches, an initial screening may be undertaken that
identifies traffic volumes and current road condition. Once the RED or HDM-4
analysis has been undertaken the final choice of links to be improved, for the funds
available, should be based on the NPV/C ranking. If there are very significant envi-
ronmental, social or other issues that differentially affect the identified choices
(particularly when these issues have not been taken into account through mitiga-
tion measures) then a multi-criteria analysis may be used to assess the final choice.
If a program is designed to meet a specific wider objective, such as reducing pov-
erty, promote an agricultural target or deal with the consequences of natural disas-
ters or conflicts, then it is best to initially choose regions or districts for investiga-
tion that best meet these criteria. Once the selection has been made, then more
conventional transport planning criteria can be taken into account.
Village based infrastructure, such as pedestrian footpaths, trails, bridges, as well as
non- transport infrastructure (schools, well clinics etc.) should be planned using
the Integrated Rural Accessibility Planning (iRAP) approach. Here the key meas-
ure of access benefits is likely to be the expected personal travel time saving. Simi-
lar projects may be ranked and selected by the expected time savings divided by
costs. The iRAP approach has a number of drawbacks and it is essential that signif-
icant community participation is involved in establishing priorities.
For transport service solutions, it is suggested that the Framework for Prioritizing
Rural Transport Service Interventions, as outlined in Section 5.4, is used. This
should be accompanied, where appropriate, with a financial analysis of costs and
revenues to users. State sponsored transport service initiatives are likely to involve
a very high degree of uncertainty, not easily amenable to conventional analysis.
Hence, it is suggested that a range of experts and local stakeholders are involved,
using Delphi techniques, to assess the key benefits and viability of proposed
measures. Table 9 summarizes the suitability of different planning processes.

Rural Transport in Africa – Planning Infrastructure & Services
100
Table 9. Suitability of Different Planning Processes for Different Interventions
Rural Transport Prioritization Framework
iRAP HDM-4 RED RONET Producers’ surplus
Cost effectiveness, Ranking and MCA
1. Policy Initiatives
Possible No No No No No Possible
2. Village Infrastructure
Possible Yes No No No No Possible
3. Intermediate means of Transport
Yes Yes No No No No Possible
4. Transport Services
Yes Possible No No No No Possible
5. Road Investment without Closure
Possible No Yes Yes Yes for networks Possible Yes
6. Road Investment with Closure
Possible No Possible Possible No No Possible
7. Road Maintenance
No No Yes Possible Yes for networks No No
6.3 The Need for Further Research
There is a clear need for new research to provide an up-to-date picture of
transport conditions in countries to help inform policy. There is also an important
need for further background research on the relationship between rural transport
and social access and mobility, health, education, agriculture and marketing.
Much more needs to be known about the operation of rural transport services.
While road planning is a relatively mature activity, there are many weaknesses and
some opportunities that need to be addressed including:
Planning the provision of basic access for very low traffic roads, including
the prediction of modal split following interventions
Planning the incorporation of social benefits

Conclusions
101
The prediction of vehicle maintenance costs, and vehicle service availabil-
ity (particularly for second-hand vehicles) following interventions
Identifying the overall impact of rural road investment including estimat-
ing benefits that go beyond transport cost savings (i.e. ‘wider benefits’)
and dealing with the issue of ‘reverse causality’
The advent GIS mapping provides a unique opportunity to plan road in-
terventions much more precisely and that are aligned to the needs of the
rural population and coordinated with other interventions.
In contrast, the planning of rural transport services, and to a lesser extent village
level infrastructure, is very much at its infancy. These activities have been left, by
default, to the local community and the market to deal with. There is a need to
find effective ways of working with and strengthening local communities and local
institutions and markets, to improve performance. Pilot projects are urgently
needed to help identify how best to implement new transport service interven-
tions. Previous initiatives have generated a great deal of knowledge about the fac-
tors that are likely help or hinder the introduction of new IMT. Further work can
be built on this research.

103
References
Adamu, F. and National Union of Road Transport Workers, (2012). Increasing
Rural Women’s Access to Maternal Care through Emergency Transport Scheme in
Northern Nigeria. 2nd AFCAP Practitioners Conference 2012, Maputo.
Ahmed, R. and Rustagi, N. (1987). “Marketing and Price Incentives in African and
Asian Countries: A Comparison.” in Agricultural Marketing Strategy and Pricing
Policy, edited by D. Eltz. World Bank, Washington, D.C.
Airey, A. (2014). Good Policies and Practices on Rural Transport in Africa: Moni-
toring & Evaluation. SSATP Working Paper 99. Washington D.C.
Airey, A. and Cundill, M A. (1998). A study of household travel in the Meru Dis-
trict of Kenya. TRL Report 353. Transport Research Laboratory Crowthorne.
Airey A. and Taylor G. (1999). "Prioritization Procedure for Improvement of Very
Low Volume Roads, Seventh International Conference on Low-Volume Roads,
May 23-26, 1999, Baton Rouge, Transportation Research Record 1652, pp 175-
180.
Babinard, J. and Scott, K. (2009) What Do Existing Household Surveys Tell Us
About Gender and Transportation in Developing Countries? Women’s Issues in
Transportation, 4th International Conference. Irvine Oct 27-30, 2009. In Confer-
ence Proceedings 46, 2011, Transportation Research Board, Washington D.C.
Baker, J. and Denning, W. (2005) Development of a Transport Module for Multi-
topic Household Surveys. Transport Paper TP-5, World Bank, Washington D.C
Banjo, G., Gordon, H. and Riverson, J. (2012) Rural Transport – Improving its
Contribution to Growth and Poverty Reduction in Sub-Saharan Africa. SSATP
Working Paper No. 93. The World Bank, Washington DC.
Banjo, G. and Robinson, R. (1999), Rural Transport Policy in Action, Draft Re-
port, World Bank, Washington D.C.
Rural Transport in Africa – Planning Infrastructure & Services
104
Biswanger, H. (1989) The Policy Response of Agriculture, Proceedings of the
World Bank Annual Conference on Development Economics, World Bank, Wash-
ington DC.
Carnemark, C., Biderman, J. and Bovet, D. (1976). The Economic Analysis of Ru-
ral Road Projects. World Bank Staff Working Paper No. 241. Washington D.C.
Centre for Poverty Analysis, (2009). Economic, Social, and Environmental Evalua-
tion of Community Bus Services, Kosgala Village, Ratnapura, Sri Lanka, Columbo.
Chambers, R. (1994). The Origins and Practice of Participatory Rural Appraisal.
World Development, Vol. 22, No. 7, pp. 953-969.
Crossley, P. and Ellis, S. 1996. A Handbook of Rural Transport Vehicles in Develop-
ing Countries. Silsoe College, Cranfield, United Kingdom, and Transport Research
Laboratory, Crowthorne, U.K.
Cundill, M. 1996, The MERLIN Road Roughness User Guide, TRL Report 229,
Transport Research Laboratory, Crowthorne.
Cundill, M., Hine. J. and Greening, P. A. (1997), The Costs of Maintaining and
Repairing Vehicles in Developing Countries, TRL Report 256, Transport Research
Laboratory, Crowthorne.
Davis, A. (2005). Relationships between transport, mobility, sustainable liveli-
hoods and social capital for poverty reduction, PhD Thesis. Centre for Interna-
tional Development and Training, University of Wolverhampton.
Dawson, J. and Barwell, I. (1993). Roads Are Not Enough: New Perspectives on
Rural Transport Planning in Developing Countries. Intermediate Technology
Publications, London.
De Walle, D. (2008). Impact Evaluation of Road Investment Projects. World Bank,
Washington D.C.
Delaquis, M. (1993). “Vehicle Efficiency and Agricultural Transport in Ghana.”
MSc thesis. University of Manitoba, Department of Engineering, Canada.
Dercon, S., Gilligan. D., Hoddinott. J and Woldehan, T. (2008). ‘The Impact of
Agricultural Extension and Roads on Poverty and Consumption Growth in Fifteen
Ethiopian Villages’, IFPRI Discussion Paper 00840, International Food Policy Re-
search Institute, Washington D.C.

References
105
Donnges, C. (2003). Improving Access in Rural Areas: Guidelines for Rural Acces-
sibility Planning, ILO.
Ellis, S. (1996). The Economics of the Provision of Rural Transport Services. PhD
Thesis, Cranfield University.
Ellis, S. and Hine, J. (1998). The Provision of Rural Transport Services. Sub Saharan
African Transport Policy Program. SSATP Working Paper No. 37, World Bank,
Washington D.C.
Ellis, S. and Hine, J. (1997). ‘Rapid Appraisal Techniques for Identifying Mainte-
nance on Low Volume Roads’ Project Report PR/OSC/122/97 Transport Research
Laboratory, Crowthorne.
Essakali, M. D. (2005). Rural Access and Mobility in Pakistan: A Policy Note.
Transport Note No. TRN-28, World Bank, Washington, D.C.
Ethiopian Roads Authority, (2005). Traffic Forecasting In Ethiopia: A Discussion
Note, Addis Ababa.
Fan, S. and Chan-Kang, C. (2004). Road Development, Economic Growth, and
Poverty Reduction in China, DSGD Discussion Paper no.12, International Food
Policy Research Institute, Washington, D.C.
Fan, S., Nyange, D. and Rao, N. (2005). Public Investment and poverty Reduction
in Tanzania: Evidence from Household Survey Data. DSDG Discussion Paper No.
18. International Food Policy Research Institute, Washington, D.C.
Fan, S., Hazell, P. and Thorat, S. (1999). Linkages between Government Spending,
Growth, and Poverty in Rural India. Research Report 110, International Food Pol-
icy Research Institute, Washington D.C.
Fan, S., Huong, P. and Long, T. (2004). Government Spending and Poverty Re-
duction in Vietnam. Project Report. International Food Policy Research Institute,
Washington DC, and Central Institute for Economic Management, Hanoi.
Fan, S., Jitsuchon, S. and Methakunnavut, N. (2004). The importance of public
investment for reducing rural poverty in middle-income countries: the case of
Thailand. DSDG Discussion Paper No. 7. International Food Policy Research In-
stitute, Washington, D.C.

Rural Transport in Africa – Planning Infrastructure & Services
106
Fan, S. Zhang, X. and Rao, N. (2004). Public Expenditure, Growth, and Poverty
Reduction in Rural Uganda. DSDG Discussion Paper No. 4. International Food
Policy Research Institute, Washington, D.C.
Fernando P., and Porter, G. (2002). Balancing the Load, Women Gender and
Transport, International Forum for Rural Transport and Development, London.
Fouracre, P. (2001). Rural Transport Knowledge Base, Transport Research Labora-
tory, Crowthorne.
Fletcher J., Baguley, C., Sexton B. and Done S. (2006). Road Accident Modelling
for Highway Development and Management in Developing Countries: Main Re-
port: Trials in India and Tanzania, DfID Project Report No. PPR095, Transport
Research Laboratory, Crowthorne.
Gajewski, G., Luppino, M., Ihara, M. and Luppino, L. (2004). Estimating the Pov-
erty-Reduction Potential of Roads Projects in Regions Experiencing Institutional
Instability due to Conflict and Post-Conflict Conditions. Presented at the Europe-
an Association for Evolutionary Political Economy, 2004 Conference, Crete, Oct.
28 - 31.
Gongera, K. and Petts, R. (2003). A tractor and labor based routine maintenance
system for rural roads. Low Cost Road Surfacing: Project Working Paper No. 5,
DDF & Intech Associates, Harare.
Gore, C. (1978). Food Marketing and Rural Under Development: A Study of an
Urban Supply System in Ghana. PhD Thesis, Pennsylvania State University, De-
partment of Geography.
Grootaert, C. (2002). Socioeconomic Impact Assessment of Rural Roads: Method-
ology and Questionnaires. Draft Report, World Bank, Washington D.C.
Gwilliam, K., Foster, V., Archondo-Callao, R., Briceño-Garmendia, C., Nogales, A.
and Sethi, K. (2008). Africa Infrastructure Country Diagnostic, Roads in Sub-
Saharan Africa. Background Paper 14. World Bank, Washington D.C.
Hettige, H. (2006). When do Rural Roads Benefit the Poor and How? An In-depth
Analysis Based on Case Studies. Asian Development Bank, Manila.
Hine, J. (1982). Road Planning for Rural Development in Developing Countries: A
Review of Current Practice, Transport and Road Research Laboratory, LR 1046,
Crowthrone.

References
107
Hine, J., Riverson, J. and Kwakye, E. (1983a). Accessibility and agricultural devel-
opment in the Ashanti Region of Ghana. TRRL Report SR 791, Transport and Road
Research Laboratory, Crowthorne.
Hine, J., Riverson, J. and Kwakye, E. (1983b). Accessibility, transport costs and food
marketing in the Ashanti Region of Ghana. TRRL Report SR 809, Transport and
Road Research Laboratory, Crowthorne.
Hine, J. and Rutter, J. (2000). “Roads, Personal Mobility and Poverty: The Chal-
lenge.” Paper presented at a workshop on transport and poverty alleviation, 13
June, World Bank, Washington, D.C.
Hine, J., Ellis, S., Done, S. and Korboe, D. (2002). Ghana Feeder Road Prioritisa-
tion. ILO Conference, Maputo.
Howe, J. (1971). Rural road distribution in Kenya. RRL Report LR 414 Road Re-
search Laboratory, Crowthorne.
Howe, J. and Davis A. (2002). ‘Boda boda – Uganda’s rural and urban low-
capacity transport services’. Paper presented at Codatu X, Lomé, Togo, 12-15.
International Forum for Rural Transport and Development (IFRTD), (2007).
Time to broaden the transport Safety Debate, Study on Various Elements of Rural
Transport Safety. A Synthesis of pilot case studies from Sri Lanka, India, Madagas-
car, Cameroon and Peru.
IT Transport Ltd, (2005). The Value of Time in Least Developed Countries: The
Africa Studies (R8307). Unpublised Project Report for DFID. Ardington
IT Transport Ltd in association with CCE Ltd, (2005). Road Maintenance and
Rehabilitation Project, Management Services for Rural Accessibility and Mobility
Pilot Activity, Ardington.
IT Transport Ltd, (2006). An Audit of Intermediate Means of Transport Promo-
tion Projects in Africa, Synthesis Report, Ardington.
IT Transport Ltd, (2008). Ethiopian Rural Travel and Transport Programme
(ERTTP): Assessment of the Pilot Project, DfID/Ethiopian Roads Authority, Ar-
dington.
IT Transport Ltd (2013). Consultancy Services for Development of Local Gov-
ernment Transport Plan to Full Implementation 2013, Tanzania, Ardington.

Rural Transport in Africa – Planning Infrastructure & Services
108
Jacobs, G. (1995). Costing Road Accidents in Developing Countries, Overseas
Road Note 10, Transport Research Laboratory, Crowthorne.
Lee, J. and Hine, J. (2008). Preparing a National Transport Strategy: Suggestions
for Government Agencies in Developing Countries. Transport Paper TP-19,
World Bank, Washington D.C.
Lebo, J. and Schelling, D. (2001). Design and Appraisal of Rural Infrastructure,
World Bank Technical Paper No. 496, World Bank, Washington D.C.
Lema, C. (2007). Makete Integrated Rural Transport Project: A Case Study of
MIRTP and its Impacts on Rural Transport Policy in Tanzania. Dar es Salaam.
Levy, H. (2004). Rural Roads and Poverty Alleviation in Morocco. Scaling Up
Poverty Reduction: A Global Learning Process and Conference, Shanghai May 25-
27, 2004.
Lisinge, R. T. (2001). Transport, Sustainable Livelihoods and Travel Patterns in
Rural Cameroon. TRL Limited, Unpublished Report. Crowthorne, U.K.
Lwoga, R. and Mhalila, H. (2005). in “Village Travel and Transport Programme:
Operational Guidelines and Way Forward” PMORALG, Tanzania.
Lyon, F. (2006). Managing Co-operation: Trust and Power in Ghanaian Associa-
tions. Organizational Studies, 2006, 26:31.
Kemtsop, G. and Starkey, P. (2013). Rural Transport Services Indicators: Report of
the Pitoa–Djallou Road, Northern Region, Cameroon, IFRTD Report for African
community Access Programme (AFCAP), Crown Agents, Sutton.
Khandker, S., Bakht, Z. and Koolwal, G. (2006). The Poverty Impact of Rural
Roads: Evidence from Bangladesh. World Bank Policy Research Working Paper
3875. World Bank. Washington D.C.
Malmberg Calvo, C. (1998). Options for managing and financing rural transport
infrastructure. World Bank Technical Paper 411, Washington. D.C.
Ministry of Transport and Communications, United Republic of Tanzania, (2002)
National Transport Policy, Dar es Salaam.
Ministry of Infrastructure Development, United Republic of Tanzania, (2010)
Transport, Construction and Meteorology Sector Statistics, Dar es Salaam.

References
109
Ministry of Rural Development, Government of India Pradhan Mantri Gram Sa-
dak Yojana (PMGSY) - Programme Guidelines April 2012.
Mu, R. and Van De Walle, D. (2007). Rural Roads and Poor Area Development in
Vietnam. Policy Research Working Paper 4340. World Bank, Washington, D.C.
Nigeria, Federal Ministry of Agriculture and Rural Development, (2013). Final
Draft National Strategy on Rural Travel & Transport, Abuja.
Odoki, J., Ahmed, F., Taylor, G. and Okello, S. (2008). Towards the Mainstream-
ing of an Approach to Include Social Benefits within Road Appraisal, A Case Study
from Uganda. Transport Paper No. TP-17, World Bank, Washington D.C.
Oum, T., Waters, W. and Say Yong, J. (1990). A survey of Recent Estimates of
Price Elasticities of Demand for Transport, WPS 359, The World Bank, Washing-
ton D.C.
Peterson, W.L. (1979). International Farm Prices and the Social Cost of Cheap
Food Policies. American Journal of Agricultural Economics 61 (1): 12-21.
Porter, G. (2002). Intermediate Means of Transport: A Review Paper with Special
Reference to Ghana, Report to the Department for International Development,
Crop Harvest Programme Project R. 7575, Department of Anthropology, Univer-
sity of Durham.
Porter, G., Hampshire, K., Abane, A., Tanle, A., Esia-Donkoh, K., Amoako-Sakyi,
R., Agblorti, S. and Owusu, S. (2011). Mobility, Education and Livelihood Trajec-
tories for Young People in Rural Ghana: a Gender Perspective. Children’s Geogra-
phies, Vol 9, Nos. 3-4, 2011, 395-410.
Porter, G. (2013). Transport Services and their Impact on Poverty and Growth in
Rural Sub-Saharan Africa. Africa Community Access Programme, University of
Durham.
Raballand, G., Macchi, P., Merotto, D. and Petracco, C. (2009). Revising the Roads
Investment Strategy in Rural Areas, An Application for Uganda. Policy Research
Working Paper 5036. World Bank. Washington D.C.
Raballand, G., Macchi, D. and Petracco, C. (2010). Rural Road Investment Effi-
ciency: Lessons from Burkina Faso, Cameroon, and Uganda. World Bank, Wash-
ington, D.C.

Rural Transport in Africa – Planning Infrastructure & Services
110
Raballand, G., Thornton, R., Yang, D., Goldberg, J., Keleher, N. and Müller, A.
(2011). Are Rural Road Investments Alone Sufficient to Generate Transport
Flows? Lessons from a Randomised Experiment in Rural Malawi and Policy Impli-
cations. Policy Research Working Paper 5535. The World Bank, Washington D.C.
Republic of Kenya, Ministry of Transport and Communications, (2004). Recom-
mendations on Integrated National Transport Policy: Moving A Working Nation,
Sub-Sector Policy Papers And Implementation Matrices, Volume II, Nairobi.
Republic of South Africa, Department of Transport (2007). Rural Transport Strat-
egy for South Africa.
Republic of Uganda, Ministry of Works and Transport (2013). Rural Transport
Policy and Strategy. Linking people to economic opportunities and services in rural
areas. Entebbe.
Rizet, C. and Hine, J. (1993). “A Comparison of the Costs and Productivity of
Road Freight Transport in Africa and Pakistan.” Transport Reviews 13 (2): 151-65.
Road Fund Board, United Republic of Tanzania (2010). Report on Baseline Data
for Assessing Impact of Road Maintenance In Tanzania Mainland, Draft Report,
Dar es Salaam.
Roberts, D., N. Khattri and A. Wessel (2011) Writing Terms of Reference for an
Evaluation: A How-To Guide. Independent Evaluation Group, The World Bank,
Washington, DC.
Romanik, C. (2007). An Urban-Rural Focus on Food Markets in Africa, The Ur-
ban Institute. Washington D.C.
Ross, Silcock and TRL (2003) Guidelines for Estimating the Cost of Road Crashes
in Developing Countries, Department for International Development (DfID) Pro-
ject 7780, TRL Ltd and Babtie Ross Silcock, Crowthorne.
Starkey, P. (2001). Local Transport Solutions, People, Paradoxes and Progress,
SSATP Working Paper No. 56, World Bank, Washington D.C.
Starkey, P., Ellis, S., Hine, J. and Ternell, A. (2002). Improving rural mobility: Op-
tions for developing motorized and nonmotorized transport in rural areas. World
Bank Technical Paper No 525. World Bank, Washington D.C.
Starkey, P. (2007). A Methodology for Rapid Assessment of Rural Transport Ser-
vices, SSATP Working Paper No. 87-A, World Bank, Washington D.C.

References
111
Starkey, P., Njenga, P., Kemptsop, G., Willilo, S., Opiyo, R. and Hine, J. (2013).
Rural Transport Services Indicators: Final Report. International Forum for Rural
Transport and Development (IFRTD), for African Community Access Pro-
gramme, Crown Agents, Sutton.
Stifel, D. and Minten, B. (2008). Isolation and agricultural productivity. Agricul-
tural Economics, 39: 1.
Teravaninthorn, S. and Raballand, G. (2009). Transport Prices and Costs in Africa:
A Review of the international Corridors. The World Bank, Washington D.C.
Transport and Road Research Laboratory (1991). Towards Safer Roads in Devel-
oping Countries: A Guide for Planners and Engineers, Transport Research Labora-
tory, Crowthorne.
TRL Ltd, (2003) Overseas Road Note 1: Road Maintenance Management for Dis-
trict Engineers, prepared for UK Department for International Development
(DFID), TRL Ltd, Crowthorne.
TRL, Ltd (2004a). Overseas Road Note 21: Enhancing the Mobility of Disabled
People: Guidelines for Practitioners, prepared for UK Department for Internation-
al Development (DFID), TRL Ltd, Crowthorne.
TRL Ltd. (2004b). Overseas Road Note 22: A Guide to Pro-Poor Transport Ap-
praisal: The Inclusion of Social Benefits in Road Investment Appraisal, prepared
for UK Department for International Development (DfID), TRL Ltd, Wokingham.
Tsumagari, M. (2007). Rural Transport: A Review of Fifteen Years of Bank Lend-
ing from Fiscal 1992 to 2006. Unpublished Report, 2007. Transport Unit, ETWTR,
World Bank, Washington D.C.
Tsunokawa, K. and Hoban, C. (1997). Roads and the Environment, A Handbook.
World Bank Technical Paper No.376. World Bank, Washington D.C.
Turner, J., Grieco, M. and Kwakye, E. A. (1995). Subverting sustainability? - infra-
structural and cultural barriers to cycle use in Accra. Seventh World Conference
on Transport Research, Sydney, 16-21 July 1995.
Vajjhala, S. and Walker, W. (2009). Roads to Participatory Planning - Integrating
Cognitive Mapping and GIS for Transport Prioritization in Rural Lesotho. Re-
sources for the Future. August 2009, RFF DP 09-26, Washington D.C.
Rural Transport in Africa – Planning Infrastructure & Services
112
World Bank (2000). Highway Development and Management Model (HDM-4),
jointly published by World Bank, Washington, D.C, and the World Roads Asso-
ciation (PIARC), Paris.
World Bank (2005). ‘Economic Appraisal of Regulatory Reform – Checklist of
Issues’ Transport Note, TRN 24, World Bank, Washington, D.C.
World Bank (2005). ‘Distribution of Benefits and Impacts on Poor People’
Transport Note, TRN-26, World Bank, Washington, D.C.
World Bank (2006a). Rural Infrastructure in Peru: Effectively Underpinning Local
Development and Fostering Complementarities. Report No. 34598-PE, Washing-
ton, D.C.
World Bank (2006b). Social Analysis in Transport Projects: Guidelines for
Incoporating Social Dimensions into Bank Supported Projects, World Bank,
Washington, D.C.
World Bank (2006c). Roads Economic Decision Model (RED), Sub-Saharan Afri-
can Transport Policy Program, World Bank, Washington D.C.
World Bank (2010). India - Pradhan Mantri Gram Sadak Yojana (PMGSY) Sec-
ond Rural Roads Project, Project Information Document, World Bank, Washing-
ton, D.C.
World Health Organisation (2010). Status report on road safety in the countries of
the WHO Africa Region, 2009, Brazzaville.
World Health Organisation (2012). Trends in Maternal Mortality: 1990-2010, Ge-
neva.

Appendices


115
Appendix 1. Examples of Road Planning Procedures
The following examples have been selected to show, in broad terms, how road
planning procedures in different countries have attempted to meet economic and
social objectives through various methods.
Planning Rural Roads in India, the PMGSY21 Approach
The Pradhan Mantri Gram Sadak Yojana (PMGSY) is a nationwide plan to pro-
vide all weather access to the rural population of India. The plan is centrally fund-
ed and was established in 2000. The 2005 version envisaged all habitations with
population above 1,000 (500 in case of hill, NE States, deserts and tribal areas) to
be connected by 2009-2010. The thresholds are progressive reduced so that habita-
tions above 500 (250 in case of hill, NE states, deserts and tribal areas) will be con-
nected by 2014-15 and all habitations above 250 will be connected by 2021-22.
The PMGSY planning approach is very much based on achieving physical targets
rather than on meeting specified economic, cost-effectiveness or other criteria.
The first priority is to achieve connection to the road network, improving its
quality is a secondary consideration. The Ministry of Rural Development has set
up the National Rural Roads Development Agency (NRRDA) to provide opera-
tional and management support, including design specification and cost norms,
scrutiny of project proposals, quality monitoring, online monitoring of progress,
R&D etc. In order for a District to have road investment included in the PMGSY a
number of different steps need to be taken. Broadly, they are as follows:
1. Every State in India identifies an Executing Agency for execution of the
Program. The Executing Agency then sets up a Program Implementation
Unit (PIU) in each District, headed by a Superintending or Executive Engi-
neer of the Public Works Department or Rural Engineering Service. The
preparation of plans is the responsibility of the PIU who must ensure that
21 Pradhan Mantri Gram Sadak Yojana

Rural Transport in Africa – Planning Infrastructure & Services
116
approval is given by the District council (District Panchayat) and that the
views of members of Parliament are also taken into account.
2. A District Rural Roads Plan (DRRP or District Master Plan) is prepared.
The DRRP is prepared first at sub-district (or Block) level and then inte-
grated into the District Plan. Sub-District plans are prepared by:
Constituting a team to carry out the work.
Preparing a database by collecting maps, road inventory, condition &
census data. Pavement condition data is entered into an online man-
agement & monitoring system (OMMS) involving GIS coordinates.
Preparing detailed maps showing the road network, habitation cen-
ters and key facilities. All settlements of at least 100 people, which are
more than 500 meters from each other are identified on the map.
However, only settlements with more than 250 or 500 people are eli-
gible for connection under the PMGSY.
Preparing two lists of settlements that are either unconnected or just
connected by a fair weather road. From this, road links are selected
that connect the unconnected settlements with all-weather roads.
The most efficient and economic link should be chosen that connects
up to key facilities such as markets, health, education and adminis-
trative centers.
Consultation, scrutiny and approval of the plans by sub-district and
district authorities. The sub-district plans are then incorporated into
the DRRP.
3. Having established a DRRP a core network is identified that provides a single
all weather roads connecting to each eligible settlement. The purpose is to
avoid unnecessary duplicate links. If a settlement is less than 500 meters
from a road, it is deemed to be already connected and not eligible under the
PMGSY. Each road link is identified by a code.
4. To be part of the PMGSY, a priority must be established for each link. First
of all, a comprehensive new connectivity priority list must be established. The
methodology adopted for prioritization must be uniform throughout the
State. Priorities are based on the population size being connected. Annual
proposals are made and agreed by the District Panchayats. If no new road

Appendix 1. Examples of road planning procedures
117
connectivities remain to be taken up then the selection of roads for im-
provement may be submitted. The priority list will be based on:
Priority 1. Through-routes that are water bound macadam roads.
Priority 2. Fair weather through-routes that are gravel, or through-
routes with missing links or lacking cross drainage.
Priority 3. Other through-routes that are at the end of their design
life where the pavement condition is poor or very poor (Pavement
Condition Index (PCI) is 2 or less). Pavement Condition Surveys will
provide PCI on a scale of 1 to 5.
Within each priority class qualifying roads will be listed in terms of
population served as an indication of traffic. However, States are ex-
pected to conduct traffic surveys to determine Average Daily Traffic.
5. The priority lists will need to be approved by the District Panchayats. The
lists must also be sent to the Members of Parliament for their views and
suggestions.
6. The Program implementation unit (PIU) will finally enter the core network
priorities into the online management & monitoring system (OMMS).
7. The PIU will hold consultations with the local community to determine the
most suitable alignment, sort out issues of land availability and deal with
any adverse social and environmental impact. A ‘transect walk’ will be ar-
ranged for this purpose and digital photographs taken and attached to the
submission.
8. The choice of design surface will be determined by factors such as traffic,
soil type, rainfall, following specifications laid down in the Rural Roads
Manual. Where populations are below 1,000 and traffic very low (less than
15 commercial vehicles per day), then in the interests of economy the road
will generally be designed for a gravel or other unsealed surface, subject to
rainfall. Likewise, with populations below 500, the carriageway width may
be restricted to 3.0 meter. Where the road passes a built up area, it may be
cement of with paved stones and appropriate side drains and cross drainage
will be provided so that rain does not damage road or the adjacent dwell-
ings. Minor bridges, of single lane only, may be included in the project.
Bridges over 25 meters are the responsibility of the State Government.
Based on the design, the PIUs will cost each proposal. Allowances for five
years of maintenance will also be estimated.

Rural Transport in Africa – Planning Infrastructure & Services
118
9. The State Government will allocate money under PMGSY to each district
with the aim of providing at least 80 percent of the road length to provide
connectivity to unconnected habitations and up to 20 percent of the length
requiring improvement (upgrading). Special allocations will be provided to
districts bordering other countries and for tribal and backward districts.
10. After approval by the District Panchayats State Technical Agencies (STA)
will vet the core network plans and the annual proposals. Within each dis-
trict, annual funding of the PMGSY is allocated to each project based on the
priority lists for new connectivity and improvement (upgrading). After the
agencies have cleared the proposals the State Executing Agency will invite
tenders, through competitive bidding. At the district level the program will
be implemented through the PIUs.
Reference: Ministry of Rural Development, Government of India (2012) Pradhan Mantri
Gram Sadak Yojana – Programme Guidelines April 2012
Planning Feeder Roads in Ghana
Before the year 2000, the main criterion used for planning the improvement of
feeder roads in Ghana was based on a combination of transport cost savings and
the producer's surplus approach involving predicting changes in agricultural out-
put. The approach was felt to be unsatisfactory as it is extremely difficult to predict
agricultural response and secondly when feeder roads are in very poor condition
or the road is cut it becomes difficult to estimate transport cost savings based on
existing motorized traffic flows.
The UK Department for International Development was interested in assisting the
Department of Feeder Roads to establish a feeder road program to rehabilitate
existing roads and tracks in nine districts in the North of Ghana that had been
relatively neglected in the past, in part, because the area was subject to inter-tribal
conflict. In connection with this project a new feeder road prioritization procedure
was developed. The general objectives was to of the procedure were as follows:
Ensure economic rationality
Be sensitive to social and poverty objectives
Include community participation
Cover the issues of road impassability and traffickability (i.e. when mo-
torized traffic is impeded by the road but not absolutely prevented)
Address issues of non-motorized traffic and gender

Appendix 1. Examples of road planning procedures
119
Be relative simple and transparent
To be capable of being operated from Districts and Regions without high-
level external support.
The development of the procedure was undertaken by engineers and economists at
TRL together with the assistance of an externally recruited social development
adviser. The procedure took 18 months to develop. It includes both community
consultation to nominate roads that are then assessed using a prioritization index.
The index was based on developing a benefit cost ratio in which the benefit com-
ponent comprised transport cost savings of both motorized and non-motorized
traffic together with social benefits expressed in money terms. The cost compo-
nent was the cost of road construction. The highest-ranking roads were nominated
for improvement in the program until the allocated budget was spent.
The approach has for main strengths in order to meet the main objectives, to
combine economic and social benefits together with community participation. In
directly addressing the problems of road passability and traffickability, the main
feeder road accessibility constraints are addressed. Value for money is directly in-
corporated into the procedure, which can help with addressing appropriate engi-
neering design. An innovation in the approach, compared with other feeder road
ranking procedures, is that both social and economic benefits are calculated to be
directly dependent upon the change in road condition and transport costs. If there
is little or no change in transport costs, there will be little or no social benefits.
The main weakness of the approach was that the cost of repeated community con-
sultation (in part designed to create a sense of community involvement and hence
reduce inter-tribal conflict) which made the process relatively expensive. Addi-
tionally are the common problems of all ranking criteria. The social weighting
factors, although subject to community consultation and professional debate, are
essentially arbitrary. Likewise, some of the cost weighting factors used to estimate
the benefits are, at present, not well researched, although, in principle, further re-
search data could be used to improve their validity.
The procedure was successfully trialed in Nanumba District. At the public hearing,
the clear advantage of maintaining basic access standards, rather than the more
expensive full rehabilitation approach was demonstrated. Initially, district repre-
sentatives (at a workshop) had given priority to roads involving relatively expen-
sive interventions. It was pointed out that with the planned budget the District
Workshop ranking would provide for three roads to be constructed with 55.4 km

Rural Transport in Africa – Planning Infrastructure & Services
120
of improvements, benefiting approximate 8,400 people and giving annual benefits
of $423,000. If the same budget was spent using the Prioritization Index then five
roads would be built, giving 95 km of roads and benefiting approximately 17,650
people with annual index benefits of $649,000. Although these arguments were
accepted at the public hearing, there was still concern that a particular road section
might not be built involving people wading and waist deep, through about half a
kilometer of water (this issue was not given a high priority at the earlier District
Workshop). It was agreed that it would be dealt with separately and addressed by
saving money through reducing road widths.
The general approach was as follows:
Local consultants were trained and recruited to engage the local communities
in the district to identify roads they wanted improving.
Identified roads were presented to subcommittee of the area councils to nom-
inate two roads for each area (approximately ten (10) areas in each district).
The nominated roads from each area were then investigated by an engineer to
identify the current state of the road or track, the measures needed firstly to
provide basic access (i.e. all year road accessibility by vehicle) and secondly to
bring the road up to a full gravel road standard.
For the nominated existing road and the improved alternatives, the engineer
estimated road roughness and the period in the year the road suffers from ab-
solute impassability and the period it suffers traffickability problems.
Traffic surveys were undertaken on each road to measure both motor vehicle
traffic and pedestrian and other non-motorized traffic movement.
The adjacent population for each road was estimated from census returns and
maps.
A prioritization index benefit cost ratio was developed which had a benefit
component (including both transport economic benefits and social benefits),
modified engineering costs represented the cost component of the index.
It was proposed for the DfID funds to the nine districts that half the money be
initially allocated evenly to each district and that those roads with the highest
benefit cost ratios be selected for inclusion in the program until the available
funds are "spent". In a second round, the prioritization index data is pooled
together with all remaining funds and those remaining roads with the highest

Appendix 1. Examples of road planning procedures
121
scores are selected until all the remaining funds are spent. The process ensures
that each district gets some road investment.
In order to make the selection process as open as possible a district workshop
is held for district representatives to make their own prioritization list. This is
then discussed together with the results of the technical analysis at an open
public forum to agree the final program.
For each road, an index is built from traffic, population and engineering cost data.
Costs and benefits are estimated for both full upgrading and spot improvements.
To achieve the greatest value for money, it is essential that unnecessarily high
standards are avoided and that road widths (formation, carriageway and struc-
tures) are kept to a sensible minimum in relation to traffic volumes.
In order to address the issue of appropriate road standards (in this case between
basic all year round access and full gravel standard road), it is necessary to com-
pare the incremental benefit cost ratio (difference in benefits divided by the differ-
ences in costs) with the established cut off benefit cost ratio of the whole program.
If the incremental benefit cost ratio is greater than the program cut off ratio the
higher cost intervention (i.e. full rehabilitation) should be undertaken; if it is less
than the cut off ratio then the lower cost project (i.e. basic access improvements)
should be undertaken.
The selection process is budget limited. However, in order to ensure that com-
pletely uneconomic roads are not selected for the program, a sensitivity analysis
was carried out in order to define a minimum cut off ratio. This was also rein-
forced by a community participation exercise to address the same issue, i.e. cir-
cumstances in which road improvement were felt to be worthwhile.
The benefits components of the index include:
Motorized traffic benefits
Non-motorized traffic benefits
Social benefits
Total transport benefits are calculated for a calendar year. In order to ensure that
longer lasting improvements were valued more highly in the analysis in construct-
ing the benefit cost ratio the costs of structures were divided by a factor of two.
The benefits were calculated as follows.
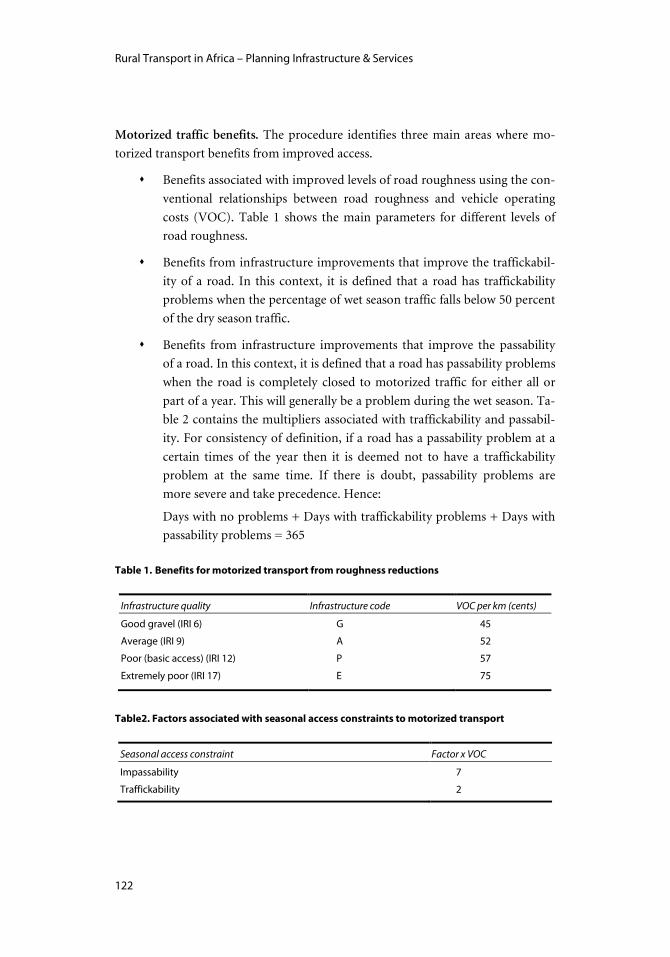
Rural Transport in Africa – Planning Infrastructure & Services
122
Motorized traffic benefits. The procedure identifies three main areas where mo-
torized transport benefits from improved access.
Benefits associated with improved levels of road roughness using the con-
ventional relationships between road roughness and vehicle operating
costs (VOC). Table 1 shows the main parameters for different levels of
road roughness.
Benefits from infrastructure improvements that improve the traffickabil-
ity of a road. In this context, it is defined that a road has traffickability
problems when the percentage of wet season traffic falls below 50 percent
of the dry season traffic.
Benefits from infrastructure improvements that improve the passability
of a road. In this context, it is defined that a road has passability problems
when the road is completely closed to motorized traffic for either all or
part of a year. This will generally be a problem during the wet season. Ta-
ble 2 contains the multipliers associated with traffickability and passabil-
ity. For consistency of definition, if a road has a passability problem at a
certain times of the year then it is deemed not to have a traffickability
problem at the same time. If there is doubt, passability problems are
more severe and take precedence. Hence:
Days with no problems + Days with traffickability problems + Days with
passability problems = 365
Table 1. Benefits for motorized transport from roughness reductions
Infrastructure quality Infrastructure code VOC per km (cents)
Good gravel (IRI 6) G 45
Average (IRI 9) A 52
Poor (basic access) (IRI 12) P 57
Extremely poor (IRI 17) E 75
Table2. Factors associated with seasonal access constraints to motorized transport
Seasonal access constraint Factor x VOC
Impassability 7
Traffickability 2

Appendix 1. Examples of road planning procedures
123
Non-motorized transport benefits. Many prioritization techniques ignore benefits
to non-motorized transport but research has shown that a considerable propor-
tion of the transport burden is carried by NMT and that they benefit from im-
proved infrastructure. The parameters shown in Tables 3 to 5 show that there are
substantial benefits to NMT where there are no existing transport services reduc-
ing to very small benefits where basic access is already established.
The largest benefits are associated with extremely poor quality access where there
are no transport services. Infrastructure improvements are then most likely to lead
to a change of transport mode (from bicycle to truck). This type of modal change
has the potential to deliver large transport cost savings.
The inclusion of NMT, particularly head loading, allows gender inequalities in the
transport burden to be addressed. In many parts of Ghana, women carry an over-
whelming proportion of head loads. This procedure recognizes this situation and
gives benefits to the increased probability of modal shift or to the time savings
associated with walking on improved infrastructure.
Table 3. Benefits for NMT where infrastructure is impassable or there is extremely poor ac-
cess and no useable transport services
Benefits in cents per km
Headload (>10kg) Walk Cycle (load) Cycle (no load)
Good Gravel 11.4 2 5.4 0.5
Average Condition 11.3 1.9 5.3 0.4
Basic access 11.2 1.8 5.2 0.3
Table 4. Benefits for NMT for extremely poor access and weak existing services
Benefits in cents per km
Headload (>10kg) Walk Cycle (load) Cycle (no load)
Good Gravel & Average Condition 2.2 0.5 1.1 0.1
Basic access 2.1 0.4 1 0.1

Rural Transport in Africa – Planning Infrastructure & Services
124
Table 5. Benefits for NMT where infrastructure is improved from basic access
Benefits in cents per km
Headload (>10kg) Walk Cycle (load) Cycle (no load)
Average condition 1.0 0.2 0.5 0
Good Gravel 1.1 0.2 0.5 0
Social Benefits. Many low volume roads are impossible to justify on the grounds
of transport cost savings to existing traffic. However, many of the roads will pro-
vide an essential social and economic service in enabling communities to reach
health facilities, markets, education and to visit friends and relatives. Problems
with access to services are very often greatest with the poorest communities and
where physical access is extremely poor. To build these factors into the prioritiza-
tion procedure four parameters have been included as shown in Table 6.
A social access benefit component has been included which gives a greater
weighting to roads in high population areas. In order to allow for a minimum de-
gree of social movement, it is suggested that a population factor is added to the
other benefit components. The factor provides a way of improving the index score
of populated areas even if there is little or no motorized traffic. Therefore, if access
is poor and trip constrained, a weighting can help redress the balance compared
with areas that might have higher traffic volumes but lower population.
Recent research carried out in rural Ghana by TRL has shown that vehicle trips per
year range from about three (found in Yendi) to 35 (found in Kwabre) trips per
person per year. It is suggested that five return trips per year represents an ac-
ceptable minimum estimate of social trip making which may be added to existing
traffic levels to ensure the prioritization index can account for a minimum level of
trip making for all communities.
For direct estimates of accessibility improvement and full rehabilitation benefits
adjacent road population should be multiplied by a factor of "1.0" to estimate ve-
hicle trips per year. This figure is based on five return trips per year, 10 passengers
per average vehicle 5 * 2 (single trips)/10 = 1 vehicle trip per person per year.

Appendix 1. Examples of road planning procedures
125
The social access benefit is calculated by multiplying the social access bene-
fit factor (taken as “1”) by the population that depend on the road by the
average distance traveled along its length and by the change in transport
costs for motorized transport (per km). It is recognized that both the ad-
jacent population to the road section and the population adjacent to oth-
er road sections (that also depend on the road) need to be included.
A poverty benefit component has been included which gives a greater
weight to roads running through the poorest one third of districts (as
listed by Ghana’s common fund allocation procedure). The poverty bene-
fit component is calculated through the use of a poverty weighting factor
that is multiplied by the social access benefit component.
A benefit component for isolation from health facilities has been included.
As with social access and poverty, this benefit component is population
dependent. The benefit component is calculated through the use of isola-
tion from health facility weighting factor that is multiplied by the social
access benefit component. Communities which have identified isolation
from markets as a key factor and where the mean road distance is further
than 10 km from a hospital would qualify.
An index for isolation from markets has been included. Isolation from
markets was highlighted through consultation with the communities as
being of highest concern. Communities which have identified isolation
from markets as a key factor and the mean road distance to an urban
market is more than 10 km would qualify. In this case the isolation from
markets index will be multiplied by the sum of motorized, and non-
motorized transport benefits.
Table 6. Social benefit factors
Social benefit component Social benefit factors
Social Access ( Population) 1
District Poverty ( Yes/No) 0.5
Isolation from health facilities (Yes/No) 0.5
Isolation from markets (Yes/No) 0.1

Rural Transport in Africa – Planning Infrastructure & Services
126
Engineering Data used in the Analysis
Engineering surveys were carried out on the roads nominated for improvement. It
was estimated that approximately 50 km could be surveyed and costed in one day.
The roads were initially classified into sections: Road Access Condition A (road
access is impassable for some period during the year), Road Access Condition B
(road access is possible throughout the year but unreliable), and Road Access
Condition C (road access is possible and reliable throughout the year). Interven-
tions were then identified to firstly provide basic access throughout the year, and
secondly to bring the road up to a good standard of roughness, mostly involving
full rehabilitation. For each existing and future condition of the road, roughness
was estimated together with an estimate of the period of the year when passability
and traffickability problems would occur. For each intervention, the costs of con-
struction would be identified, together with a separate estimate of the cost of
structures involved.
Reference: Hine J, S Ellis, S Done, and D Korboe Ghana Feeder Road Prioritisation. (2002),
ILO Conference, Maputo22.
Vietnam Rural Transport III (RT3) Rural Roads Planning Procedure
The following outlines the planning and prioritization adopted for the Vietnam
Rural Transport III (RT3) program supported by a World Bank credit in 2005.
RT3 supported the provision of both basic (all weather) access roads and road
improvements to gravel and sealed road standard. Following RT2 only a small
number of communes lacked basic access, however this was the first priority for
RT3. Basic access roads were justified purely on social grounds, while road im-
provements were initially justified on economic grounds. However, due to limited
annual budgets, for both types of road, indices based on the number of poor peo-
ple served by the road divided by the cost of the road were used to finally prioritize
when, and if, the intervention would be included in the program.
22 Full details of the procedure, covering consultation, engineering design and costing and
prioritization, together with associated Excel spreadsheet, are available from the author at

Appendix 1. Examples of road planning procedures
127
The indices were therefore:
Basic Access Index = (no. poor people) + 0.2 x (no. non-poor people
Cost of road
Improvement Index = no. poor people
Cost of road
Given the difficulty and cost of carrying out detailed engineering and economic
feasibility studies on a large number of short and widely dispersed roads, a simpli-
fied procedure was used to determine pavement type, approximate costs and the
economic viability of road improvements. This was based on establishing traffic
thresholds for improvements based on calculated economic NPV and IRR for dif-
ferent terrains and pavement types using the HDM-4 model. Road Class which
determines the geometric standards to which the road should be built, was identi-
fied from Ministry of Transport’ Standards, depending on road function and traf-
fic volumes. Assumptions on traffic counts were taken from counts carried out
from different studies.
A regression analysis was undertaken to obtain relationships between traffic vol-
umes, population and land use variables. Where traffic volume data was not readi-
ly available, these relationships were used to compute traffic volumes.
Each province provided a “long list” of candidate roads for inclusion in the RT3
program, developed in accordance with the provinces general planning proce-
dures. Prioritization was carried out separately for each province. Basic access
roads were included in the first year of the program in accordance with the rank-
ing index until either all roads had been included or the budget limit reached. The
balance of the budget was then made available for road improvements.
Based on traffic volume, road function and the economic HDM-4 threshold analy-
sis, the road class, and pavement type were determined for road improvements.
Road construction costs were estimated from surface type and terrain. The roads
were then prioritized according to the index given above and included in the pro-
gram until the provincial budget had been used up.
The civil works budget allocations, for the program, to provinces are based on 50
percent evenly distributed between them and 50 percent allocated on the basis of

Rural Transport in Africa – Planning Infrastructure & Services
128
rural population weighted by rural poverty incidence and lack of access. Mainte-
nance funds are allocated based on length of district roads.
Figure 14 provides a diagram of the road selection procedure and Table 7 provides
traffic thresholds for different interventions according to road class and terrain.
Table 7. Threshold Traffic Volumes for Road Improvements
Road Class Flat Rolling Mountainous
vpd (MT) Pcu vpd (MT) Pcu vpd (MT) Pcu
Gravel Roads Compared to Earth Tracks
V 50 35 55 40 60 45 VI 35 25 40 30 60 45 A 35 25 40 30 40 30 B 30 20 35 25 35 25
Sealed Roads Compared to Gravel
V 400 300 350 – 400 250 – 300 250 – 300 175 – 225 VI 350 – 400 250 - 300 350 250 250 – 300 175 -225 A 300 – 350 225 - 250 250 -300 175 – 225 250 – 300 175 – 225 B 250 – 300 175 - 225 250 175 200 – 250 150 -175
Notes: vpd – Vehicles per day, pcu –passenger car equivalent units.
Reference: Roughton International, (2005) Third Rural Transport Project (RT3), Consultancy Services for
Technical Assistance for Project Preparation. Ministry of Transport, Vietnam.

Appendix 1. Examples of road planning procedures
129
Figure 14. Rural Road Section Procedure for RT3 in Vietnam
Sri Lanka – Provincial Roads Project
This project to improve the provincial road network was initially supported by the
Asian Development Bank, in 2004, and later by the World Bank. This network,
estimated at about 15,700 km, constitutes about 14 percent of the total road net-
work. It provides the key connection between the rural and the national networks.
Due to the long-running communal conflict and a lack of consistent funding for
provincial roads over the past 20 years, little maintenance or rehabilitation has
taken place. The roads in the provincial network were mostly in an advanced state
of deterioration, with extensive pot holing, breakup of bitumen surfacing, broken
and inadequate culverts and pavement failure.
The Feasibility Study outlines a road prioritization procedure involving a number
of different stages. Simplifying, the procedure is as follows:
a) initial nomination of roads by provincial governments
b) allocation of road length to be considered for each province
SOCIO-ECONOMIC DATA
Commune level
PROVINCIAL MASTER PLANS & PRIORITIES
No
Yes
Yes No
No Yes
Basic Access ?
ROAD DATA INVENTORY & CONDITION
TRAFFIC COUNTS
LONG LIST OF ROADS Counts
available ? ESTIMATE TRAFFIC
(from socio-economic data)
PLANNING DATA FOR LONG LIST OF ROADS
PRELIMINARY DESIGN
Minimum cost
PRELIMINARY DESIGN Class Cross-section Costs
SELECT TOP RANKED BAR UP
TO BUDGET LIMIT
REMAINING BAR TO NEXT
YEAR PROGRAM
ECONOMIC SCREENING
All Budget
SELECT TOP RANKED ROADS UP TO BUDGET
LIMIT
Choose from
Threshold analysis SS model (RT2) HDM-4
Suggested Index
Poor population served by road / total cost of road
Suggested Index (RT2)
(poor population + 0.2 *
total population) / cost of
road RANK VIABLE ROADS ON
SOCIO-ECONOMIC CRITERIA
RANK BA ROADS on SOCIO-
ECONOMIC CRITERIA
Based On
Road function Terrain Traffic Standard designs
Based On
Terrain

Rural Transport in Africa – Planning Infrastructure & Services
130
c) short listing selection procedure (based on factors such as connectivity,
traffic, road condition etc.) for roads in each province
d) economic analysis of short listed roads
e) application of 10 percent EIRR cut off
f) final ranking (multi-criteria analysis) based on combination of economic
analysis and social criteria
After the initial nomination of roads by the provincial governments, an allocation
procedure was developed to determine the length of road to be built in the differ-
ent provinces. The criteria used for this provincial allocation (and the weight as-
signed to each) were as follows:
Land area (20%)
Population (20%)
Poverty headcount index (35%)
Total provincial road length (30%)
Registered vehicles per km of provincial road (10%)
Length of provincial road already improved under previous projects
(15%)
For each province and criterion, a normalized index was computed:
NIP,C = DVP,C ÷ DVM,C
Where NIP,C is the normalized index for province P and criterion C;
DVP,C is the data value for province P and criterion C; and
DVM,C is the median province-wise data value for criterion C.
A cap was imposed on the number of kilometers that could be shortlisted in the
Northern Province, because of uncertainty about the practicality of carrying out
feasibility and design work during on-going hostilities. This produced a surplus
allocation, which was redistributed to the four border provinces roughly in pro-
portion to the damage they suffered as a result of the conflict in the north and east.
In total 2,400 km of road was allocated between the nine provinces.
To provide a short list of roads in each province, totaling the allocation to the
province, a screening was carried out on the initial long list of roads provided by

Appendix 1. Examples of road planning procedures
131
each province. The criteria chosen, and weightings used, varied slightly from prov-
ince to province. The criteria and weightings for Uva province, are as follows:
Connectivity to major roads (25%)
Access to communities and economic and social assets (20%)
Traffic volume (15%)
Road condition (5%)
Surface type (5%)
Maintenance costs (5%)
Potential contribution to poverty reduction (15%)
Likely impact of project (high, moderate, low) (10%)
Following the derivation of the short list, an economic analysis was carried out on
each short listed road. This comprised a conventional transport cost analysis (in-
cluding road safety benefits) together with calculated economic benefits associated
with reduced impassability (in this case educational benefits from increased school
attendance) and benefits associated with reduced crop losses. The results of the
calculated IRRs from the economic analysis were scaled whereby an IRR of 50 per-
cent has a rank of 10 and an IRR of 10 percent has a rank of 0.
Two social assessments were made of each shortlisted road. One, from public
sources to identify the total population, housing and commercial units benefiting
from each road. The other, from field surveys looking at 25 meter belt of land each
side of the road to identify the population and facilities to benefit from each road.
In each case, a score was obtained by dividing by road length and then by normal-
izing on a scale of 0 to 10.
Finally, a multi-criteria analysis was undertaken to provide the final ranking
whereby the economic analysis was given a weighting of 70 percent and the first
social assessment based on published data a weighting of 10 percent and the sec-
ond social assessment based on field survey was weighted at 20 percent.
Originally, it was planned to include an environmental assessment within the mul-
ti-criteria analysis. However, this was dropped because it was felt that the envi-
ronmental mitigation measures included in the engineering costing used in the
economic analysis covered this.
Reference: CARDNO, (2008) Draft Report. Consulting Services for Feasibility Study and
Detailed Engineering Design of Provincial Roads. ADB Sri Lanka Road Project Preparatory
Facility, Columbo.

133
Appendix 2. Examples of District Planning Procedures
Malawi District Development Planning using the IRAP Tool
Following an initial work carried out in the Makete project in Tanzania, it was
decided, with support of ILO, to develop an Integrated Rural Accessibility Plan-
ning (iRAP) tool to improve accessibility to services. As a result, major initiatives
in the development of iRAP were carried out in the Philippines, Malawi and else-
where. Under the Pilot Integrated Rural Transport Project in Malawi, iRAP was
introduced, in the late 1990’s to Mwanza District, Lobi, Dezda District, and Em-
bangweni, Mzimbi District).
It had been observed that previous District Development Plans (DDP) were like
‘shopping lists’ based on limited secondary data, prepared by different sector rep-
resentatives, with little buy-in from the local communities, and as a result priori-
ties could be easily changed. It was felt that a more rational approach needed de-
velopment, with much greater community involvement using iRAP. In 2004, un-
der the Rural Accessibility Mobility Pilot Activity (RAMPA) the iRAP data collec-
tion exercise was implemented for Ntchisi District, involving 254 Village Devel-
opment Committees with 1,659 villages. From this information, a revised high
quality DDP was produced. Furthermore, with the new planning tool a much
more rational approach could be used to planning the location of roads and new
facilities, and possibly to effectively resist irrational pressures by various sections of
the population. Although developing the database involved a considerable initial
effort, the fact that the information was largely supplied by the local population
established its credibility and acceptance. The RAMPA project also covered signifi-
cant IMT initiatives.
Reference: IT Transport Ltd in association with CCE Ltd, (2005) Road Maintenance and
Rehabilitation Project, Management Services for Rural Accessibility and Mobility Pilot Ac-
tivity, Ardington.

Rural Transport in Africa – Planning Infrastructure & Services
134
Ethiopian Rural Travel and Transport Programme (ERTTP)
From the outset, the ERTTP was perceived to be a way of preparing comprehen-
sive district (Woreda) development plans using accessibility as a key tool to inte-
grate the various components. The objective went beyond increasing access to ser-
vices to include increasing employment and income generation. The program was
administered by the Ethiopian Roads Authority but with representation of other
ministries. Although most of the proposed investments were beyond the village,
including rural roads and major investments, the approach was also designed to
tackle some of the within village and local transport issues including provision of
IMT and village level infrastructure. A series of manuals were prepared outlining
how the Woreda Integrated Development Plans should be prepared. These cov-
ered:
Manual for Formulation and Implementation Framework
Manual for Planning, Monitoring and Evaluation
Manual for Rural Transport Infrastructure Development
Manual for Means of Transport and Service Development
Manual for Non-Transport Interventions and Income Generating Schemes
Manual for Resource Mobilization and Management
In 2001, consultants were recruited to prepare eight pilot Woreda Integrated De-
velopment Plans using a variety of consultation and planning techniques. It was
recognized that, in view of the diversity of Woreda characteristics a ‘one-size-fits-
all’ approach would not be appropriate. By 2008, 130 such plans had been pre-
pared or were under preparation. The plans produced were very comprehensive
covering significant investments in agriculture, health, education, etc. Implemen-
tation of each plan was the responsibility of the Woreda officials, with the roads
desk responsible for overall coordination. A wide range of planning procedures
were adopted by the ERTTP including, iRAP, transport cost-benefit analysis and
conventional financial accounting approaches.
An assessment of the implementation of the eight pilot plans, in relation to the
transport related components, was carried out in 2008. The assessment found sig-
nificant improvements in both accessibility and socio-economic conditions result-
ing from road investments (of varying standards), provision of IMT, and increased

Appendix 2. Examples of District Planning Procedures
135
provision of facilities such as health posts and schools. The ERTTP approach has
been scale-up nationally under the ongoing Universal Rural Access Program.
Reference: IT Transport Ltd, (2008) Ethiopian Rural Travel and Transport Programme
(ERTTP): Assessment of the Pilot Project, DfID/Ethiopian Roads Authority, Ardington.
Related Documents