Rural Prosperity Bond LAB INSTRUMENT ANALYSIS September 2020 DESCRIPTION & GOAL — The Rural Prosperity Bond is a unique debt instrument employed by the Land Accelerator to help scale-up land restoration efforts. The combination of the instrument with the accelerator, provides credit and tailored capacity building to land restoration enterprises that are too small for commercial banks and too large for microfinance. SECTOR — Sustainable Agriculture FINANCE TARGET — Concessional public funding, development finance institutions and foundations. Private impact investors and corporates. GEOGRAPHY — For pilot phase: Kenya, Ethiopia, Rwanda In the future: Africa, South Asia and Latin America

Welcome message from author
This document is posted to help you gain knowledge. Please leave a comment to let me know what you think about it! Share it to your friends and learn new things together.
Transcript
Rural Prosperity Bond
LAB INSTRUMENT ANALYSIS September 2020
DESCRIPTION & GOAL — The Rural Prosperity Bond is a unique debt instrument employed by the Land Accelerator to help scale-up land restoration efforts. The combination of the instrument with the accelerator, provides credit and tailored capacity building to land restoration enterprises that are too small for commercial banks and too large for microfinance. SECTOR — Sustainable Agriculture
FINANCE TARGET — Concessional public funding, development finance institutions and foundations. Private impact investors and corporates.
GEOGRAPHY — For pilot phase: Kenya, Ethiopia, Rwanda In the future: Africa, South Asia and Latin America
2
The Lab identifies, develops, and launches sustainable finance instruments that can drive billions to a low-carbon economy.
The 2020 Global Lab cycle targets four specific sectors across mitigation and adaptation: nature-based solutions; sustainable
agriculture for smallholders in sub-Saharan Africa; sustainable energy access; and sustainable cities, as well as three regions:
India, Brazil and Southern Africa.
AUTHORS AND ACKNOWLEDGEMENTS The authors of this brief are Daniela Chiriac and Paul Rosane. The authors would like to acknowledge the following professionals for their cooperation and valued contributions including the proponents Sofia Faruqi, Sean DeWitt and Vanessa Haggans (WRI) and the working group members: Ines Angulo (CIF), Alice Caravani (UK BEIS), Julie Cheng (IFAD), David Ekabouma (African Guarantee Fund), Anne-Katrin Gruenewald (DWS), Daniel Kandy (US Department of State), Moses Kimani (Lentera Ltd.), Thomas Legrand (independent), Norah Magero (Expressions Global), Kiyoshi Okumura (IFC), Mike Reddaway (DFID), Sebastien Subsol (IFAD), Chiara Trabacchi (CIF). The authors would like to acknowledge the contribution of the experts and professionals: Saif Ahmed (Independent), Iain Church (Moringa Miracles), Patrick Flynn (Kiva), Tanja Havemann (Clarmondial), Luke Seidl (Kiva), Noor Ullah (ADB), Theophile Hakizimana (Asili Natural Oils). The authors would also like to thank Barbara Buchner, Vikram Widge, Angela Falconer, Leigh Madeira, Ricardo Narvaez, Ben Broche, Elysha Davila, Rob Kahn, and Júlio Lubianco for their continuous advice, support, comments, design, and internal review.
The Lab’s 2019/2020 programs have been funded by the Australian, Dutch, German, and UK governments, as well as Bloomberg Philanthropies, GIZ, the International Fund for Agricultural Development (IFAD), the Rockefeller Foundation, and the Shakti Sustainable Energy Foundation. Climate Policy Initiative (CPI) serves as Secretariat and analytical provider.
3
SUMMARY Land degradation has become a major threat to populations, economies, and ecosystems that are already vulnerable to the effects of climate change and who are under additional strain due to the current COVID-19 pandemic. Small and medium enterprises (SMEs) working on land degradation are essential for rural economies as they play a major role in assuring food security and in providing rural jobs. However, they struggle to access the financial resources necessary to grow their businesses.
The Rural Prosperity Bond (RPB) will provide loans to small and medium size enterprises working in land restoration in Africa, South Asia and Latin America.
The support provided to the proponents by the Lab analytical team together with the Working Group, was centered around four main criteria. Our analysis demonstrated that the instrument addresses them all successfully.
Innovative: The instrument will target SMEs too big for microfinance, and yet too small for commercial banks and provide them with small ticket size loans adapted to their needs. Moreover, through discounted interest rates, it will stimulate these businesses to facilitate market access for farmers. The RPB will be used by the Land Accelerator, an entrepreneurship program, which ensures the provision of capacity building and acts as a de-risking mechanism by screening the potential borrowing businesses.
Actionability: The RPB will benefit from an existing investment pipeline in Africa, build through the Land Accelerator and already counting 26 businesses. Led by the World Resources Institute, the Accelerator is extending and will include new enterprises from South Asia and South America.
Catalytic: The replication to other regions based on the same model will permit the instrument to reach hundreds of SMEs and thousands of smallholders within six years. The instrument can help to increase incomes and carbon sequestration, can improve ecosystem services and gender balance, thus generating economic, environmental, and social returns and contributing to a green recovery in areas that are hard-hit by the pandemic.
Financial Sustainability: The Rural Prosperity Bond will start with a one-year pilot phase funded by grants and targeting enterprises based in three East-African countries. In the scale-up stage, the instrument will decrease the grant funding and add first-loss capital and commercial debt. The commercial structure will include a majority of commercial capital with a decreased first-loss tranche.
The Rural Prosperity Bond is an innovative financial instrument, immediately actionable, with capacity to replicate and produce positive impact in rural economies in emerging markets. We therefore recommend it for Lab’s endorsement.
In the next months, World Resources Institute will proceed to determine the most appropriate legal and financial structure for the Rural Prosperity Bond and to select a special purpose vehicle (SPV) manager. They are also initiating fundraising efforts with an immediate focus on the grant funds needed for the pilot phase.
4
TABLE OF CONTENTS
SUMMARY ............................................................................................................................................... 3
CONTEXT ................................................................................................................................................. 4
CONCEPT ................................................................................................................................................ 5
1. Instrument Mechanics ................................................................................................................... 5
2. Innovation ....................................................................................................................................... 8
3. Implementation Pathway and Replication .............................................................................. 11
4. Financial Impact and Sustainability ........................................................................................... 13
5. Environmental and Socio-economic Impact .......................................................................... 15
NEXT STEPS ............................................................................................................................................. 17
REFERENCES .......................................................................................................................................... 18
6. ANNEXES ........................................................................................................................................ 20
Annex 1 – Land accelerator Selection criteria ..................................................................... 20
Annex 2 - Land restoration: working definition ...................... Erro! Indicador não definido.
Annex 3 - Full list of comparable instruments........................................................................ 21
ANNEX 4 - Quantitative modeling assumptions ................................................................... 23
Annex 5 - Impact assessment methodology ........................................................................ 25
CONTEXT
Land degradation reduces the carbon sequestration potential of soil, causes massive economic costs as well as productivity losses, threatening food security in countries
that are highly vulnerable to climate change.
In Africa alone, 65% of land is affected by degradation (WRI, 2015) which causes reduction in soil productivity (Gibbs et al., 2015) and loss of various ecosystem services including water retention, carbon sequestration, and biodiversity. Climate change, through extreme weather events and changes in rainfall patterns, is directly contributing to land degradation. Every year, an additional 6 million hectares of land are estimated to become degraded in Africa (WRI, 2020), an area the size of Croatia. If no action is taken, the continent’s progressive loss of ecosystem services could cost PPP USD 4.6 trillion1 over the 15 years to 2030, due to annual yields losses of 278 million tons of cereals (ELD initiative, 2015).
An estimated 69 million African people already experienced malnutrition and food shortages in 2019 (FSIN, 2020). The current COVID-19 crisis has brought further challenges to food security and employment in Africa. As household income decreased, so has local food
1 4.6 trillion Purchasing Power Parity (PPP) USD are equivalent 1.9 trillion constant 2011 USD.
5
demand. Agricultural labor availability is also deeply hit due to sanitary and logistic restrictions, leading to lower employment rates and altered food production and distribution (ISF et al., 2020a). Export-bound value chains also suffered from high demand volatility and disruptions. As a result, the farmers growing these crops are facing even greater food insecurity (ISF et al., 2020b).
Rehabilitation of degraded land improves food production on existing cropland, therefore limiting further agriculture-driven deforestation (Gibbs et al., 2015). In addition, restoring soils and ecosystems enhance climate resilience (Griscom et al., 2017) and the return of biodiversity (Benayas et al., 2009). In this context, restoration represents a great financial opportunity: restoring African croplands can generate 2.8 trillion USD worth of cereals over the next 15 years (ELD initiative, 2015).
Rural small and medium enterprises working on sustainable agriculture and forestry are crucial to land restoration, as they account for 80% of local food supply chains and providing 25 % of rural employment (ISF et al., 2019). However, they struggle to access the financial resources necessary to grow their businesses. In Sub-Saharan Africa alone, there is an estimated annual lending gap of USD 100 billion for agricultural SME (ISF and all, 2019). The Rural Prosperity Bond, proposed by the World Resources Institute (WRI), is a debt instrument that aims to provide access to credit for these enterprises in Africa, with future expansion plans to South Asia and Latin America.
CONCEPT
1. INSTRUMENT MECHANICS
The Rural Prosperity Bond provides credit to businesses active in sustainable agriculture and forestry, thus enabling them to grow and serve more smallholders
The Rural Prosperity Bond is a debt instrument that will be used by the Land Accelerator, a WRI initiative that provides training to selected small and medium enterprises that restore degraded forests and farmland. The instrument aims to provide access to credit for the enterprises graduating from the Land Accelerator, thus helping them to scale up their business and restoration work. This segment of the market is particularly underserved by financial markets: agri-enterprises tend to be too large for micro-finance institutions and too small for most commercial banks, representing what is typically referred to as “the missing middle”. The scarcity of capital prevents these businesses from growing faster and expanding their smallholder customer base.
TECHNICAL ASSISTANCE: LAND ACCELERATOR
Financed by grants from private foundations and institutional donors (Figure 1), the Land Accelerator was launched in 2018 by WRI and was held twice in Africa producing 26 graduate enterprises. The Accelerator provides a four-month training program to selected small and medium enterprises active in sustainable agriculture and forestry, which contribute to soil quality restoration. The supporting curriculum is designed to build entrepreneurs’ technical and business capacity, as well as improving the management of their farmer
6
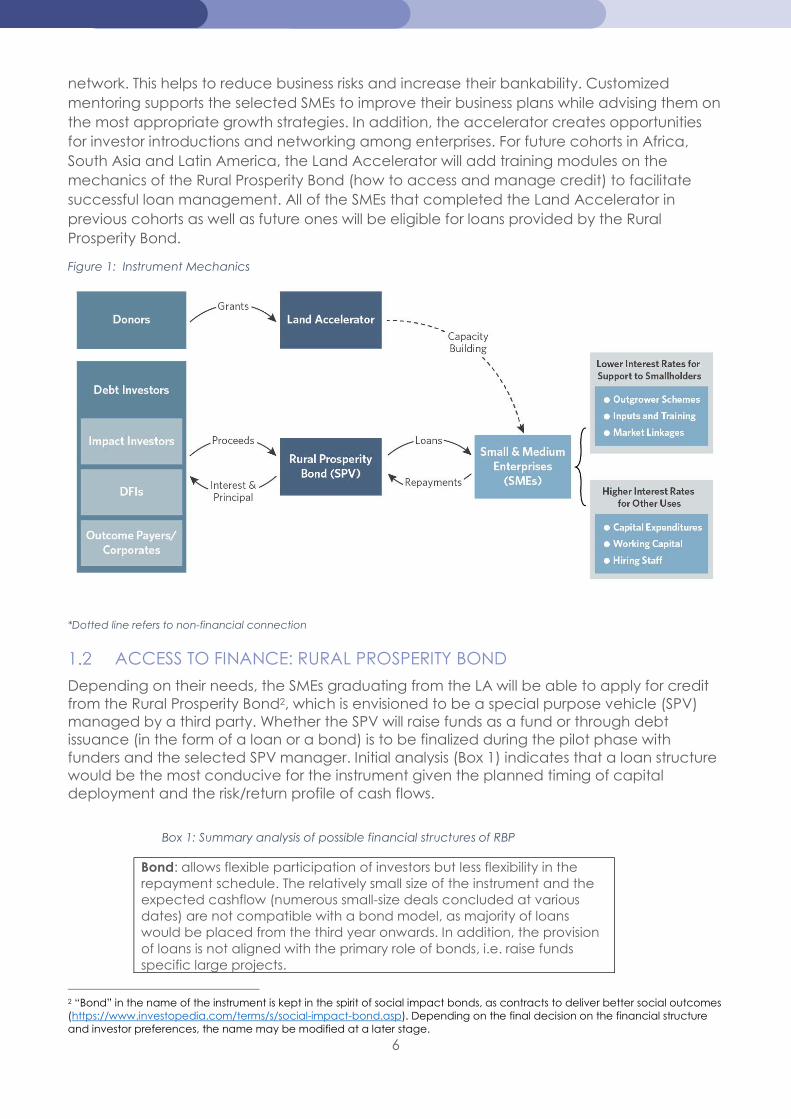
network. This helps to reduce business risks and increase their bankability. Customized mentoring supports the selected SMEs to improve their business plans while advising them on the most appropriate growth strategies. In addition, the accelerator creates opportunities for investor introductions and networking among enterprises. For future cohorts in Africa, South Asia and Latin America, the Land Accelerator will add training modules on the mechanics of the Rural Prosperity Bond (how to access and manage credit) to facilitate successful loan management. All of the SMEs that completed the Land Accelerator in previous cohorts as well as future ones will be eligible for loans provided by the Rural Prosperity Bond.
Figure 1: Instrument Mechanics
*Dotted line refers to non-financial connection
ACCESS TO FINANCE: RURAL PROSPERITY BOND
Depending on their needs, the SMEs graduating from the LA will be able to apply for credit from the Rural Prosperity Bond2, which is envisioned to be a special purpose vehicle (SPV) managed by a third party. Whether the SPV will raise funds as a fund or through debt issuance (in the form of a loan or a bond) is to be finalized during the pilot phase with funders and the selected SPV manager. Initial analysis (Box 1) indicates that a loan structure would be the most conducive for the instrument given the planned timing of capital deployment and the risk/return profile of cash flows.
Box 1: Summary analysis of possible financial structures of RBP
Bond: allows flexible participation of investors but less flexibility in the repayment schedule. The relatively small size of the instrument and the expected cashflow (numerous small-size deals concluded at various dates) are not compatible with a bond model, as majority of loans would be placed from the third year onwards. In addition, the provision of loans is not aligned with the primary role of bonds, i.e. raise funds specific large projects.
2 “Bond” in the name of the instrument is kept in the spirit of social impact bonds, as contracts to deliver better social outcomes (https://www.investopedia.com/terms/s/social-impact-bond.asp). Depending on the final decision on the financial structure and investor preferences, the name may be modified at a later stage.
7
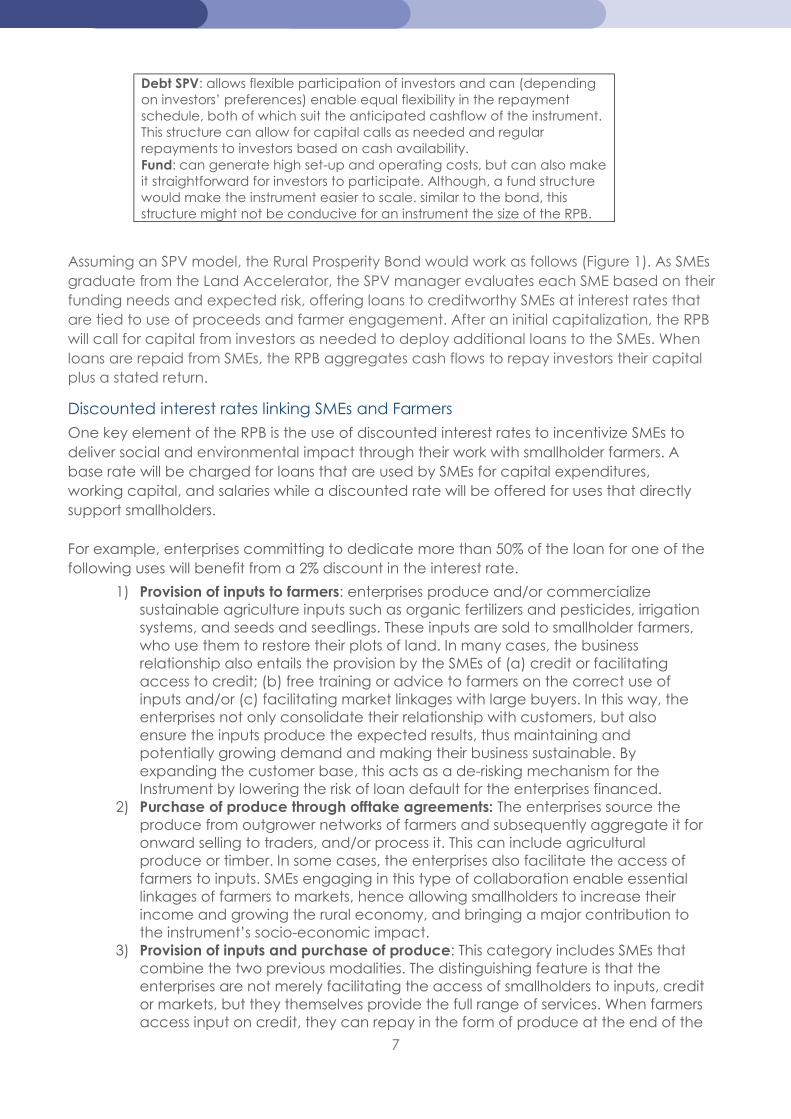
Debt SPV: allows flexible participation of investors and can (depending on investors’ preferences) enable equal flexibility in the repayment schedule, both of which suit the anticipated cashflow of the instrument. This structure can allow for capital calls as needed and regular repayments to investors based on cash availability. Fund: can generate high set-up and operating costs, but can also make it straightforward for investors to participate. Although, a fund structure would make the instrument easier to scale. similar to the bond, this structure might not be conducive for an instrument the size of the RPB.
Assuming an SPV model, the Rural Prosperity Bond would work as follows (Figure 1). As SMEs graduate from the Land Accelerator, the SPV manager evaluates each SME based on their funding needs and expected risk, offering loans to creditworthy SMEs at interest rates that are tied to use of proceeds and farmer engagement. After an initial capitalization, the RPB will call for capital from investors as needed to deploy additional loans to the SMEs. When loans are repaid from SMEs, the RPB aggregates cash flows to repay investors their capital plus a stated return.
Discounted interest rates linking SMEs and Farmers One key element of the RPB is the use of discounted interest rates to incentivize SMEs to deliver social and environmental impact through their work with smallholder farmers. A base rate will be charged for loans that are used by SMEs for capital expenditures, working capital, and salaries while a discounted rate will be offered for uses that directly support smallholders.
For example, enterprises committing to dedicate more than 50% of the loan for one of the following uses will benefit from a 2% discount in the interest rate.
1) Provision of inputs to farmers: enterprises produce and/or commercialize sustainable agriculture inputs such as organic fertilizers and pesticides, irrigation systems, and seeds and seedlings. These inputs are sold to smallholder farmers, who use them to restore their plots of land. In many cases, the business relationship also entails the provision by the SMEs of (a) credit or facilitating access to credit; (b) free training or advice to farmers on the correct use of inputs and/or (c) facilitating market linkages with large buyers. In this way, the enterprises not only consolidate their relationship with customers, but also ensure the inputs produce the expected results, thus maintaining and potentially growing demand and making their business sustainable. By expanding the customer base, this acts as a de-risking mechanism for the Instrument by lowering the risk of loan default for the enterprises financed.
2) Purchase of produce through offtake agreements: The enterprises source the produce from outgrower networks of farmers and subsequently aggregate it for onward selling to traders, and/or process it. This can include agricultural produce or timber. In some cases, the enterprises also facilitate the access of farmers to inputs. SMEs engaging in this type of collaboration enable essential linkages of farmers to markets, hence allowing smallholders to increase their income and growing the rural economy, and bringing a major contribution to the instrument’s socio-economic impact.
3) Provision of inputs and purchase of produce: This category includes SMEs that combine the two previous modalities. The distinguishing feature is that the enterprises are not merely facilitating the access of smallholders to inputs, credit or markets, but they themselves provide the full range of services. When farmers access input on credit, they can repay in the form of produce at the end of the
8
season. At the level of the RPB, this full-circle model acts as a de-risking mechanism and directly contributes to its socio-economic impacts.
The use of funds will be assessed at the application stage when SMEs will be required to submit a brief plan for how the funds will be used. There will also be periodic surveys to track spending. In addition, the instrument may limit the proportion of SMEs that qualify for the lower interest rate to 50% of the portfolio. This will incentivize borrowers to prioritize benefits for smallholders and will also result in more viable cash flows for the Rural Prosperity Bond.
Investors
At commercial stage, the Rural Prosperity Bond is capitalized from proceeds from debt investors blending two categories of capital:
Senior debt (80%) features lower risk since it has higher priority in terms of capital repayments and interest payment. This tranche aims to attract private impact investors and development finance institutions, among others.
First loss tranche (20%) bears higher risk since initial losses will be absorbed by this tranche. Only after this tranche is exhausted will losses float to the senior level. Thus, it serves as a risk buffer for the senior class of capital. This tranche is designed to catalyze private capital participation, and it will be capitalized from public sources and possibly foundations and corporates interested in supporting rural prosperity.
Land restoration
As it relies on the Land Accelerator for a pipeline of eligible SMEs, the RPB will use the same working definition of land restoration. To access a loan, the enterprises’ business focus should be in one of the activities listed below. Consequently, the farmers they serve will be involved in the same type of activities.
Agroforestry and low carbon, sustainable/climate-smart agricultural practices that add trees to farms
Production of organic fertilizer, pesticides and nature-based soil amendments Sustainable silvopastoral practices that add trees to grazing land Natural and assisted regeneration that grows trees for private or public clients Sustainable forestry and non-timber forest product harvesting Native grassland restoration (no trees added to the landscape) Interventions that avoid deforestation, e.g., by reducing the demand for
unsustainably sourced fuelwood Technologies that inform/support/facilitate the above
2. INNOVATION
The Rural Prosperity Bond supports land restoration enterprises that graduate from the Land Accelerator through a unique combination of tailored capacity building with a
debt facility that includes with de-risking mechanisms
BARRIERS ADDRESSED: MARKET, BUSINESS AND FINANCIAL SUPPLY CHALLENGES ENCOUNTERED BY RESTORATION ENTERPRISES
The Rural Prosperity Bond is designed to address several of the barriers limiting investments in land restoration SMEs in Africa.
9
External barriers – market and geopolitical Enterprises operating in agriculture and forestry in Africa are inherently vulnerable to a range of exogenous risks and restoration of degraded land requires long time horizons. (WRI, 2017). However, long-term investments in the sector are deterred by climate related risks (African countries are some of the most vulnerable to climate change3) that are coupled with market, regulatory, and political volatility as well as insecure land tenure (WRI, 2018; CSAF, 2019). Solution: The Rural Prosperity Bond addresses these exogenous barriers by incorporating in its structure grant funding and first-loss capital. These de-risking mechanisms are meant to absorb potential losses and thus attract private investments. Additionally, the loan interest rate structure offered by the RPB aims to incentivize SMEs to support their smallholder networks and facilitate market linkages. These help farmers to sell their produce, thus mitigating some of the risks related to agricultural market volatility. Also, land restoration boosts climate resilience, which lessens the risk of losses caused by natural disasters and extreme weather events. Internal barriers - Business risks Restoration enterprises in Africa and Asia often lack formal technical and business training (WRI), as well as management capacity and adequate financial and accounting skills (ISF and all, 2019). The capacity gap is further exacerbated by the remote, often rural location of most agricultural enterprises, without connection to skilled human resources, investor and start-up networks, typically concentrated in urban centers. Solution: WRI’s Land Accelerator program for SMEs working on land restoration combines business and technical training with investor introductions and networking. Mentoring by experts supports the participants to improve their business plans and develop their financial acumen, while improving the management of their farmer network. This helps to reduce business risks and increase commercial viability. The Land Accelerator program therefore generates a pipeline of curated and high-quality SMEs that are eligible for loans from the Rural Prosperity Bond. Mismatch between capital supply and demand While commercial banks provide credit to larger agri-businesses and microfinance institutions cater to the needs of very small SMEs, capital markets offer few options for debt financing between $50,000-250,000, and the alternatives available bear high interest rates (Dalberg, 2018). Typical forestry and agriculture businesses require capital in this range, often labeled as the “missing middle”. Lack of credit history and collateral makes it difficult for local lenders to assess the creditworthiness of rural SMEs and limits the appetite of financiers to go beyond established value chains such as coffee and cocoa (Dalberg 2018). The small investment sums and the challenges in performing due diligence result in high transaction costs which deter investors. Solution: The instrument provides small-size loans with averages between $100,000 and 200,000, thus directly addressing the missing middle. The loans also give freedom of use to the SMEs, with an incentive for the funds to be used toward smallholder farmers. The interest rates will be adapted based on the interest rates prevalent4 in each SME’s country of operations, thus making it more accessible to the enterprises. To be able to offer these services, the Rural Prosperity Bond will work to systematically reduce transaction costs, possibly by using virtual due diligence among others.
3 https://gain.nd.edu/our-work/country-index/ 4 For similar size loans to SMEs operating in the same sector
10
INNOVATION: SMALL LOANS COMBINED WITH TAILORED CAPACITY BUILDING FOR RESTORATION ENTERPRISES
The extensive screening of existing financial instruments (full list in Annex 3) focusing on land restoration revealed that the Rural Prosperity Bond features a unique combination of three essential components.
Focus on land restoration SMEs. Among other facilities focusing on restoration, few use small and medium enterprises as the entry point as the RPB does.
Small ticket size ($100,000-$200,000 on average). Among the few financial instruments providing small size loans (as low as 100,000 USD), none focuses on restoration.
Capacity building. The association of the RPB with the Land Accelerator ensures the provision of tailored capacity building to the rural enterprises eligible for loans and acts as a pre-screening mechanism for the instrument.
Table 2- Shortlist of comparable instruments.
Similar Instruments
Description Differences
Responsible Commodities Facility – Brazil
Provides finance to farmers that commit to deforestation-free soy cultivation in the Cerrado, in compliance with the Brazilian Forest Code.
- Country, biome and crop-specific with focus on farmers.
- Requires a specific regulatory framework and is applicable to internationally traded crops
IFC Forests Bond – Kenya
Kasigau Corridor REDD+ project: forest conservation and sustainable forestry
- No specific focus on agri-SMEs: designed around a specific wildlife sanctuary and the surrounding communities;
- Is strongly linked to officially protected areas and does not involve supply chain actors.
Acumen Resilient Agriculture Fund (ARAF)
Finance SMEs that promote climate-resilient agriculture. Help them scale up to qualify for other types of capital investments. The regional scope was narrowed down to three countries to limit travel and operational costs.
After screening investors’ appetite, loan ticket sizes were set to higher levels (starting $1m). As a result, the fund targets larger SMEs with USD inflows (SMEs that export their products). Moreover, the ARAF provides equity capital.
CHALLENGES TO INSTRUMENT SUCCESS
Several potential challenges may hinder the operationalization of the Rural Prosperity Bond concept and its financial sustainability. Thus, the design of the instrument incorporates a number of mitigation strategies.
Table 2: Challenges to instrument success and mitigation strategies
Potential Challenge Management Strategy
Portfolio Risks
Impacts of COVID-19 pandemic may include, higher cash flow volatility, lower customer spending, and tighter export-import restrictions
Based on consultation with SMEs, incorporate training in the Land Accelerator curriculum to support businesses to adapt to the “new normal”
SME loan default risk due to unreliable agricultural supply
(i) Pipeline of SMEs vetted by the Land Accelerator and trained on how to manage their network of farmers
11
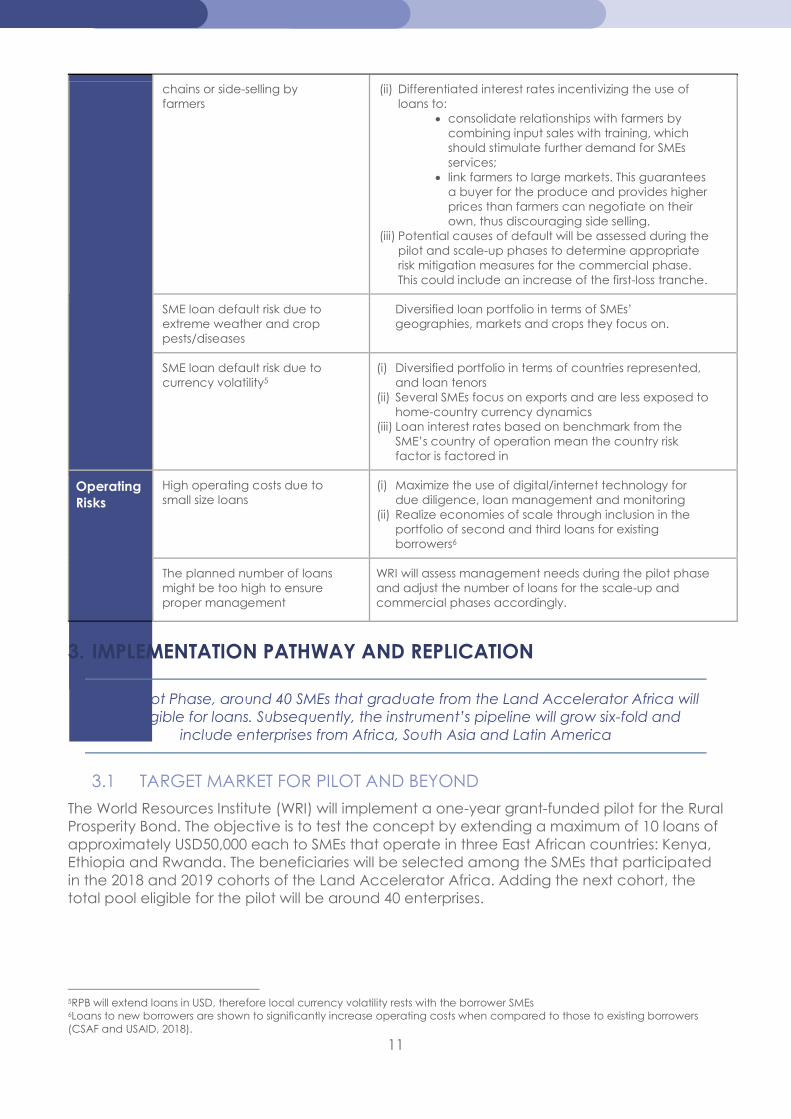
chains or side-selling by farmers
(ii) Differentiated interest rates incentivizing the use of loans to:
consolidate relationships with farmers by combining input sales with training, which should stimulate further demand for SMEs services;
link farmers to large markets. This guarantees a buyer for the produce and provides higher prices than farmers can negotiate on their own, thus discouraging side selling.
(iii) Potential causes of default will be assessed during the pilot and scale-up phases to determine appropriate risk mitigation measures for the commercial phase. This could include an increase of the first-loss tranche.
SME loan default risk due to extreme weather and crop pests/diseases
Diversified loan portfolio in terms of SMEs’ geographies, markets and crops they focus on.
SME loan default risk due to currency volatility5
(i) Diversified portfolio in terms of countries represented, and loan tenors
(ii) Several SMEs focus on exports and are less exposed to home-country currency dynamics
(iii) Loan interest rates based on benchmark from the SME’s country of operation mean the country risk factor is factored in
Operating Risks
High operating costs due to small size loans
(i) Maximize the use of digital/internet technology for due diligence, loan management and monitoring
(ii) Realize economies of scale through inclusion in the portfolio of second and third loans for existing borrowers6
The planned number of loans might be too high to ensure proper management
WRI will assess management needs during the pilot phase and adjust the number of loans for the scale-up and commercial phases accordingly.
3. IMPLEMENTATION PATHWAY AND REPLICATION
In the Pilot Phase, around 40 SMEs that graduate from the Land Accelerator Africa will be eligible for loans. Subsequently, the instrument’s pipeline will grow six-fold and
include enterprises from Africa, South Asia and Latin America
3.1 TARGET MARKET FOR PILOT AND BEYOND
The World Resources Institute (WRI) will implement a one-year grant-funded pilot for the Rural Prosperity Bond. The objective is to test the concept by extending a maximum of 10 loans of approximately USD50,000 each to SMEs that operate in three East African countries: Kenya, Ethiopia and Rwanda. The beneficiaries will be selected among the SMEs that participated in the 2018 and 2019 cohorts of the Land Accelerator Africa. Adding the next cohort, the total pool eligible for the pilot will be around 40 enterprises.
5RPB will extend loans in USD, therefore local currency volatility rests with the borrower SMEs 6Loans to new borrowers are shown to significantly increase operating costs when compared to those to existing borrowers (CSAF and USAID, 2018).
12
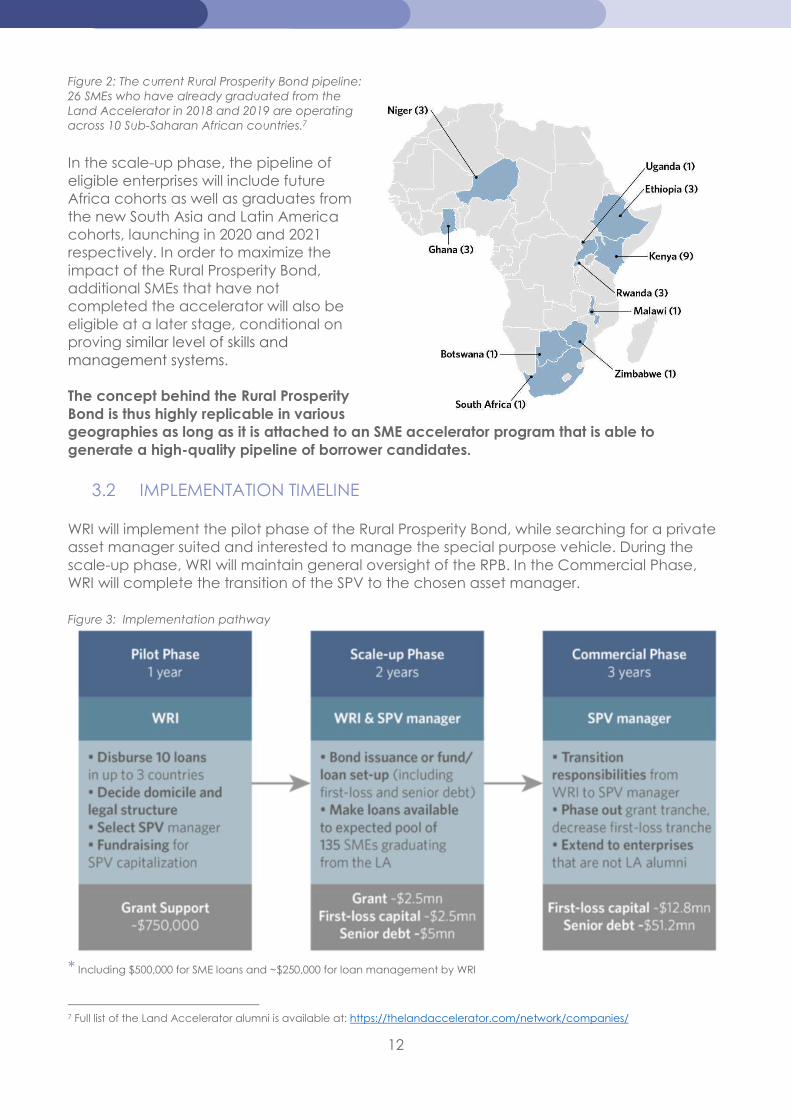
Figure 2: The current Rural Prosperity Bond pipeline: 26 SMEs who have already graduated from the Land Accelerator in 2018 and 2019 are operating across 10 Sub-Saharan African countries.7
In the scale-up phase, the pipeline of eligible enterprises will include future Africa cohorts as well as graduates from the new South Asia and Latin America cohorts, launching in 2020 and 2021 respectively. In order to maximize the impact of the Rural Prosperity Bond, additional SMEs that have not completed the accelerator will also be eligible at a later stage, conditional on proving similar level of skills and management systems. The concept behind the Rural Prosperity Bond is thus highly replicable in various geographies as long as it is attached to an SME accelerator program that is able to generate a high-quality pipeline of borrower candidates.
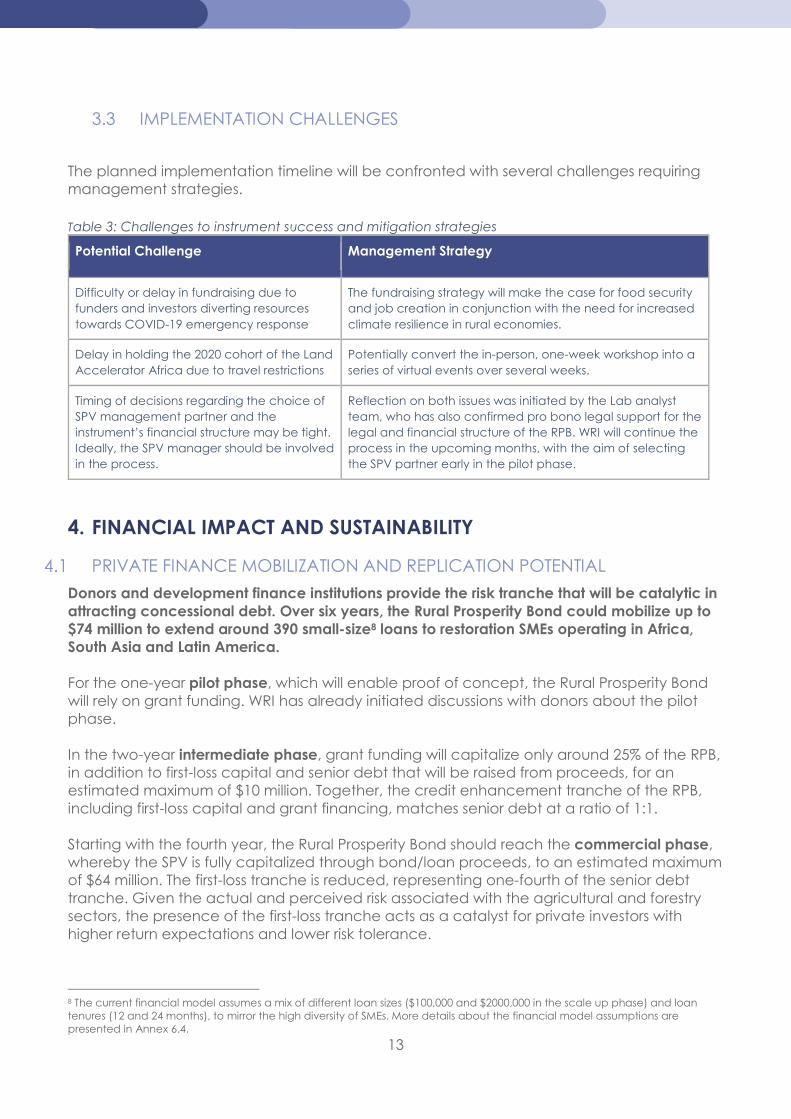
3.2 IMPLEMENTATION TIMELINE WRI will implement the pilot phase of the Rural Prosperity Bond, while searching for a private asset manager suited and interested to manage the special purpose vehicle. During the scale-up phase, WRI will maintain general oversight of the RPB. In the Commercial Phase, WRI will complete the transition of the SPV to the chosen asset manager. Figure 3: Implementation pathway
* Including $500,000 for SME loans and ~$250,000 for loan management by WRI
7 Full list of the Land Accelerator alumni is available at: https://thelandaccelerator.com/network/companies/
13
3.3 IMPLEMENTATION CHALLENGES
The planned implementation timeline will be confronted with several challenges requiring management strategies. Table 3: Challenges to instrument success and mitigation strategies
Potential Challenge Management Strategy
Difficulty or delay in fundraising due to funders and investors diverting resources towards COVID-19 emergency response
The fundraising strategy will make the case for food security and job creation in conjunction with the need for increased climate resilience in rural economies.
Delay in holding the 2020 cohort of the Land Accelerator Africa due to travel restrictions
Potentially convert the in-person, one-week workshop into a series of virtual events over several weeks.
Timing of decisions regarding the choice of SPV management partner and the instrument’s financial structure may be tight. Ideally, the SPV manager should be involved in the process.
Reflection on both issues was initiated by the Lab analyst team, who has also confirmed pro bono legal support for the legal and financial structure of the RPB. WRI will continue the process in the upcoming months, with the aim of selecting the SPV partner early in the pilot phase.
4. FINANCIAL IMPACT AND SUSTAINABILITY
PRIVATE FINANCE MOBILIZATION AND REPLICATION POTENTIAL
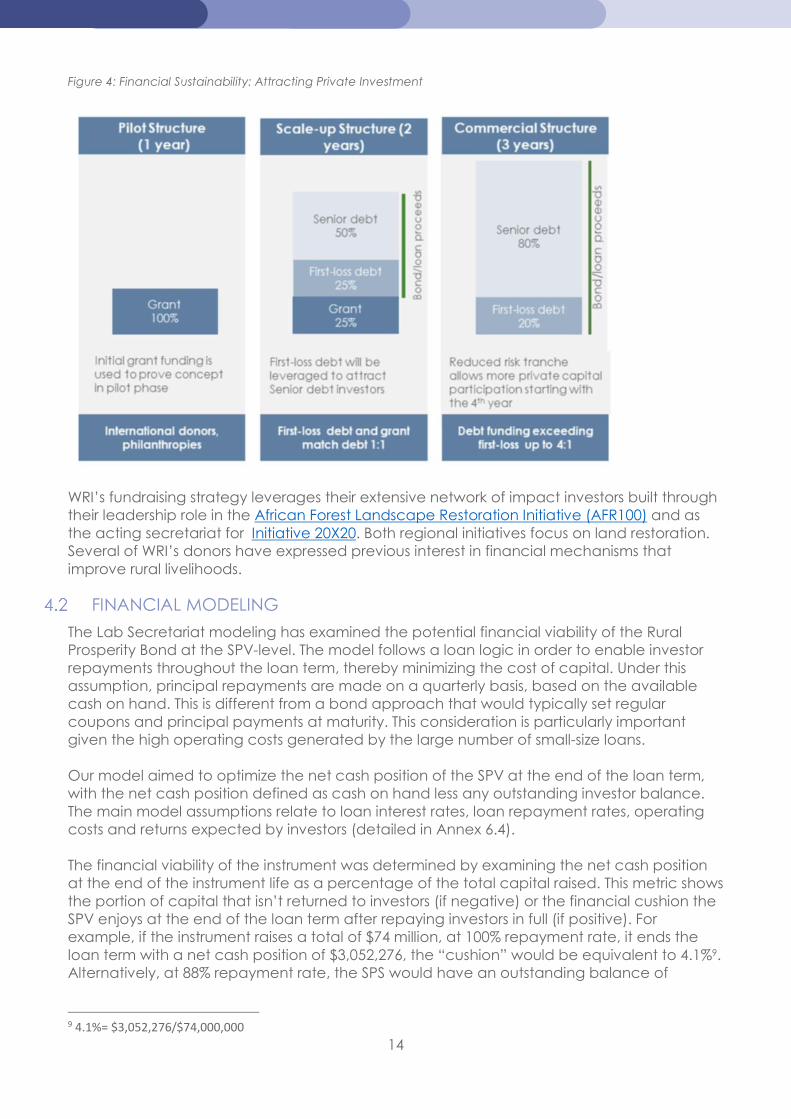
Donors and development finance institutions provide the risk tranche that will be catalytic in attracting concessional debt. Over six years, the Rural Prosperity Bond could mobilize up to $74 million to extend around 390 small-size8 loans to restoration SMEs operating in Africa, South Asia and Latin America. For the one-year pilot phase, which will enable proof of concept, the Rural Prosperity Bond will rely on grant funding. WRI has already initiated discussions with donors about the pilot phase. In the two-year intermediate phase, grant funding will capitalize only around 25% of the RPB, in addition to first-loss capital and senior debt that will be raised from proceeds, for an estimated maximum of $10 million. Together, the credit enhancement tranche of the RPB, including first-loss capital and grant financing, matches senior debt at a ratio of 1:1. Starting with the fourth year, the Rural Prosperity Bond should reach the commercial phase, whereby the SPV is fully capitalized through bond/loan proceeds, to an estimated maximum of $64 million. The first-loss tranche is reduced, representing one-fourth of the senior debt tranche. Given the actual and perceived risk associated with the agricultural and forestry sectors, the presence of the first-loss tranche acts as a catalyst for private investors with higher return expectations and lower risk tolerance.
8 The current financial model assumes a mix of different loan sizes ($100,000 and $2000,000 in the scale up phase) and loan tenures (12 and 24 months), to mirror the high diversity of SMEs. More details about the financial model assumptions are presented in Annex 6.4.
14
Figure 4: Financial Sustainability: Attracting Private Investment
WRI’s fundraising strategy leverages their extensive network of impact investors built through their leadership role in the African Forest Landscape Restoration Initiative (AFR100) and as the acting secretariat for Initiative 20X20. Both regional initiatives focus on land restoration. Several of WRI’s donors have expressed previous interest in financial mechanisms that improve rural livelihoods.
FINANCIAL MODELING
The Lab Secretariat modeling has examined the potential financial viability of the Rural Prosperity Bond at the SPV-level. The model follows a loan logic in order to enable investor repayments throughout the loan term, thereby minimizing the cost of capital. Under this assumption, principal repayments are made on a quarterly basis, based on the available cash on hand. This is different from a bond approach that would typically set regular coupons and principal payments at maturity. This consideration is particularly important given the high operating costs generated by the large number of small-size loans. Our model aimed to optimize the net cash position of the SPV at the end of the loan term, with the net cash position defined as cash on hand less any outstanding investor balance. The main model assumptions relate to loan interest rates, loan repayment rates, operating costs and returns expected by investors (detailed in Annex 6.4). The financial viability of the instrument was determined by examining the net cash position at the end of the instrument life as a percentage of the total capital raised. This metric shows the portion of capital that isn’t returned to investors (if negative) or the financial cushion the SPV enjoys at the end of the loan term after repaying investors in full (if positive). For example, if the instrument raises a total of $74 million, at 100% repayment rate, it ends the loan term with a net cash position of $3,052,276, the “cushion” would be equivalent to 4.1%9. Alternatively, at 88% repayment rate, the SPS would have an outstanding balance of
9 4.1%= $3,052,276/$74,000,000
15
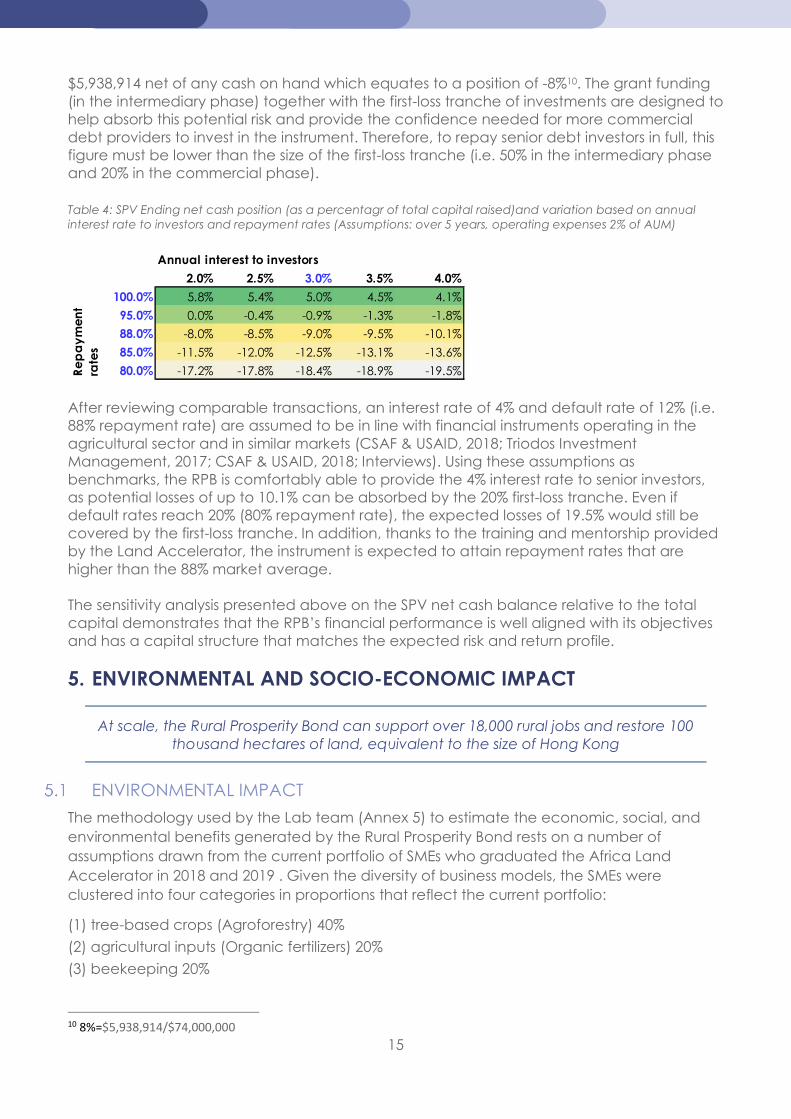
$5,938,914 net of any cash on hand which equates to a position of -8%10. The grant funding (in the intermediary phase) together with the first-loss tranche of investments are designed to help absorb this potential risk and provide the confidence needed for more commercial debt providers to invest in the instrument. Therefore, to repay senior debt investors in full, this figure must be lower than the size of the first-loss tranche (i.e. 50% in the intermediary phase and 20% in the commercial phase). Table 4: SPV Ending net cash position (as a percentagr of total capital raised)and variation based on annual interest rate to investors and repayment rates (Assumptions: over 5 years, operating expenses 2% of AUM)
After reviewing comparable transactions, an interest rate of 4% and default rate of 12% (i.e. 88% repayment rate) are assumed to be in line with financial instruments operating in the agricultural sector and in similar markets (CSAF & USAID, 2018; Triodos Investment Management, 2017; CSAF & USAID, 2018; Interviews). Using these assumptions as benchmarks, the RPB is comfortably able to provide the 4% interest rate to senior investors, as potential losses of up to 10.1% can be absorbed by the 20% first-loss tranche. Even if default rates reach 20% (80% repayment rate), the expected losses of 19.5% would still be covered by the first-loss tranche. In addition, thanks to the training and mentorship provided by the Land Accelerator, the instrument is expected to attain repayment rates that are higher than the 88% market average. The sensitivity analysis presented above on the SPV net cash balance relative to the total capital demonstrates that the RPB’s financial performance is well aligned with its objectives and has a capital structure that matches the expected risk and return profile.
5. ENVIRONMENTAL AND SOCIO-ECONOMIC IMPACT
At scale, the Rural Prosperity Bond can support over 18,000 rural jobs and restore 100 thousand hectares of land, equivalent to the size of Hong Kong
ENVIRONMENTAL IMPACT
The methodology used by the Lab team (Annex 5) to estimate the economic, social, and environmental benefits generated by the Rural Prosperity Bond rests on a number of assumptions drawn from the current portfolio of SMEs who graduated the Africa Land Accelerator in 2018 and 2019 . Given the diversity of business models, the SMEs were clustered into four categories in proportions that reflect the current portfolio:
(1) tree-based crops (Agroforestry) 40%
(2) agricultural inputs (Organic fertilizers) 20%
(3) beekeeping 20%
10 8%=$5,938,914/$74,000,000
Annual interest to investors
2.0% 2.5% 3.0% 3.5% 4.0%
100.0% 5.8% 5.4% 5.0% 4.5% 4.1%
95.0% 0.0% -0.4% -0.9% -1.3% -1.8%
88.0% -8.0% -8.5% -9.0% -9.5% -10.1%
85.0% -11.5% -12.0% -12.5% -13.1% -13.6%
80.0% -17.2% -17.8% -18.4% -18.9% -19.5%Re
pa
ym
en
t ra
tes
16
(4) timber products (Eucalyptus and Bamboo) 20%
Future SMEs will be recruited with identical selection rules as those in the current portfolio, however the final composition of the future portfolio will depend on applicant SMEs and therefore cannot be anticipated. The impact of the instrument can vary substantially depending on the actual distribution among these four categories and the variety of activities conducted.
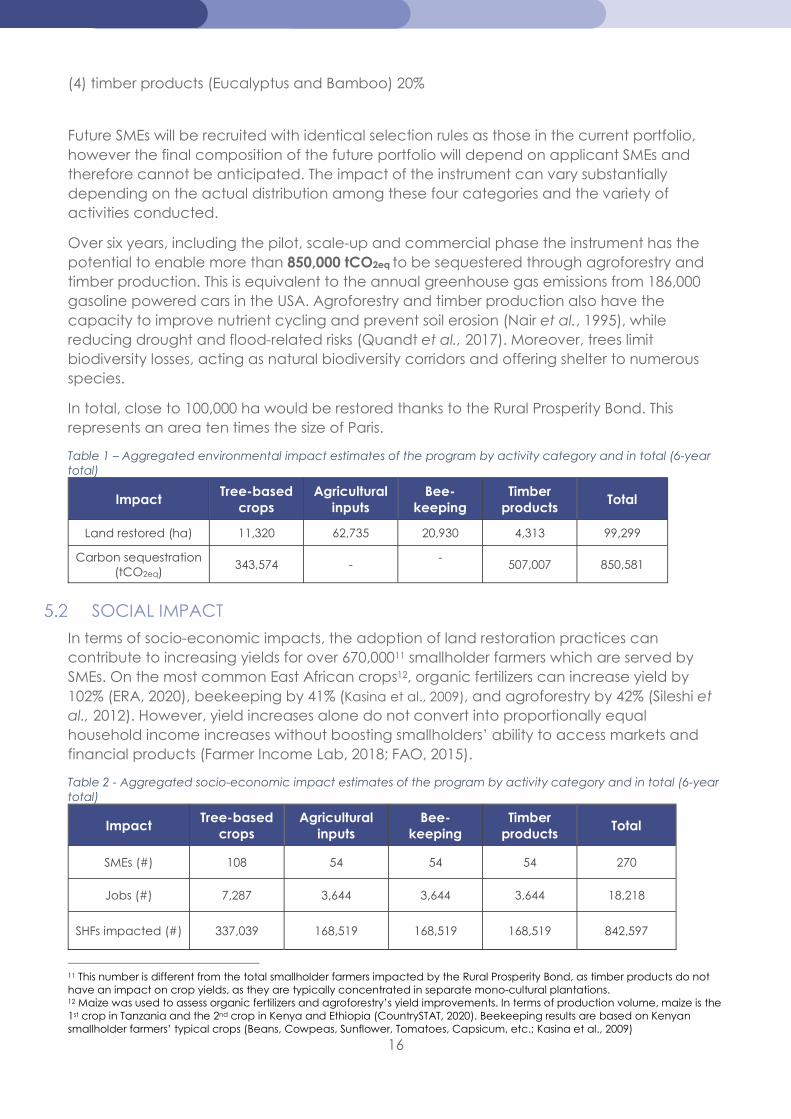
Over six years, including the pilot, scale-up and commercial phase the instrument has the potential to enable more than 850,000 tCO2eq to be sequestered through agroforestry and timber production. This is equivalent to the annual greenhouse gas emissions from 186,000 gasoline powered cars in the USA. Agroforestry and timber production also have the capacity to improve nutrient cycling and prevent soil erosion (Nair et al., 1995), while reducing drought and flood-related risks (Quandt et al., 2017). Moreover, trees limit biodiversity losses, acting as natural biodiversity corridors and offering shelter to numerous species.
In total, close to 100,000 ha would be restored thanks to the Rural Prosperity Bond. This represents an area ten times the size of Paris.
Table 1 – Aggregated environmental impact estimates of the program by activity category and in total (6-year total)
Impact Tree-based
crops Agricultural
inputs Bee-
keeping Timber
products Total
Land restored (ha) 11,320 62,735 20,930 4,313 99,299
Carbon sequestration (tCO2eq)
343,574 - -
507,007 850,581
SOCIAL IMPACT
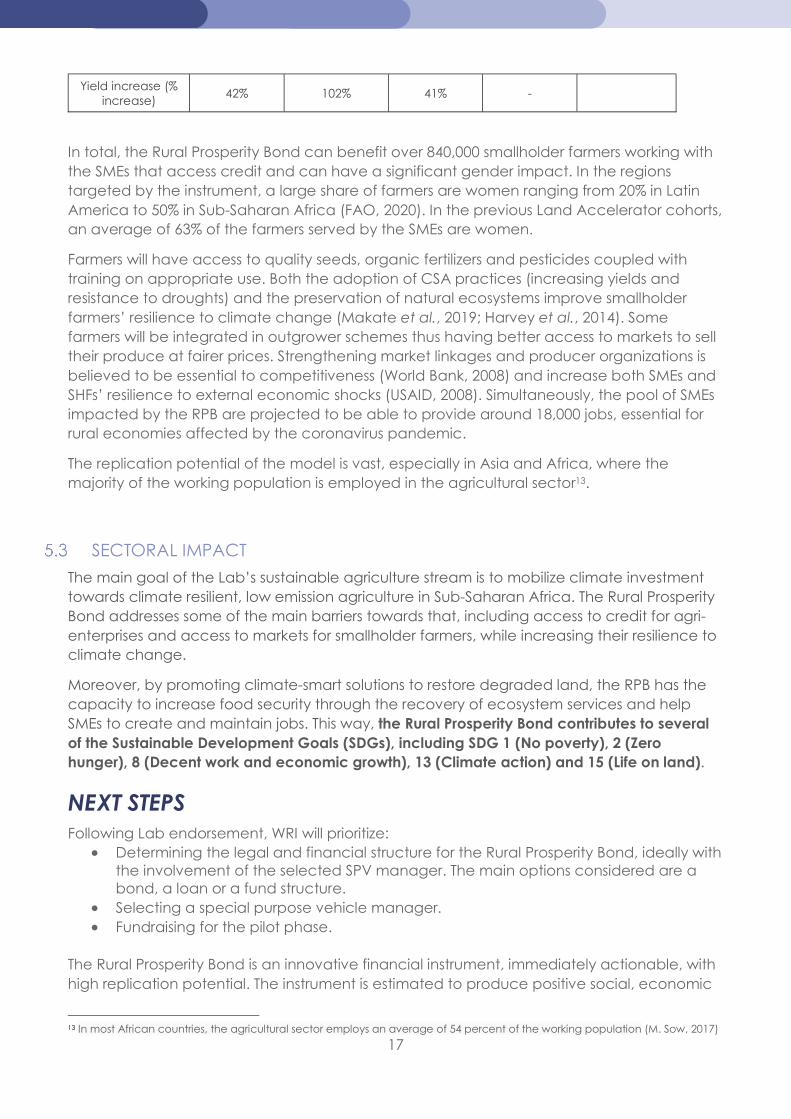
In terms of socio-economic impacts, the adoption of land restoration practices can contribute to increasing yields for over 670,00011 smallholder farmers which are served by SMEs. On the most common East African crops12, organic fertilizers can increase yield by 102% (ERA, 2020), beekeeping by 41% (Kasina et al., 2009), and agroforestry by 42% (Sileshi et al., 2012). However, yield increases alone do not convert into proportionally equal household income increases without boosting smallholders’ ability to access markets and financial products (Farmer Income Lab, 2018; FAO, 2015).
Table 2 - Aggregated socio-economic impact estimates of the program by activity category and in total (6-year total)
Impact Tree-based
crops Agricultural
inputs Bee-
keeping Timber
products Total
SMEs (#) 108 54 54 54 270
Jobs (#) 7,287 3,644 3,644 3,644 18,218
SHFs impacted (#) 337,039 168,519 168,519 168,519 842,597
11 This number is different from the total smallholder farmers impacted by the Rural Prosperity Bond, as timber products do not have an impact on crop yields, as they are typically concentrated in separate mono-cultural plantations. 12 Maize was used to assess organic fertilizers and agroforestry’s yield improvements. In terms of production volume, maize is the 1st crop in Tanzania and the 2nd crop in Kenya and Ethiopia (CountrySTAT, 2020). Beekeeping results are based on Kenyan smallholder farmers’ typical crops (Beans, Cowpeas, Sunflower, Tomatoes, Capsicum, etc.; Kasina et al., 2009)
17
Yield increase (% increase)
42% 102% 41% -
In total, the Rural Prosperity Bond can benefit over 840,000 smallholder farmers working with the SMEs that access credit and can have a significant gender impact. In the regions targeted by the instrument, a large share of farmers are women ranging from 20% in Latin America to 50% in Sub-Saharan Africa (FAO, 2020). In the previous Land Accelerator cohorts, an average of 63% of the farmers served by the SMEs are women.
Farmers will have access to quality seeds, organic fertilizers and pesticides coupled with training on appropriate use. Both the adoption of CSA practices (increasing yields and resistance to droughts) and the preservation of natural ecosystems improve smallholder farmers’ resilience to climate change (Makate et al., 2019; Harvey et al., 2014). Some farmers will be integrated in outgrower schemes thus having better access to markets to sell their produce at fairer prices. Strengthening market linkages and producer organizations is believed to be essential to competitiveness (World Bank, 2008) and increase both SMEs and SHFs’ resilience to external economic shocks (USAID, 2008). Simultaneously, the pool of SMEs impacted by the RPB are projected to be able to provide around 18,000 jobs, essential for rural economies affected by the coronavirus pandemic.
The replication potential of the model is vast, especially in Asia and Africa, where the majority of the working population is employed in the agricultural sector13.
SECTORAL IMPACT
The main goal of the Lab’s sustainable agriculture stream is to mobilize climate investment towards climate resilient, low emission agriculture in Sub-Saharan Africa. The Rural Prosperity Bond addresses some of the main barriers towards that, including access to credit for agri-enterprises and access to markets for smallholder farmers, while increasing their resilience to climate change.
Moreover, by promoting climate-smart solutions to restore degraded land, the RPB has the capacity to increase food security through the recovery of ecosystem services and help SMEs to create and maintain jobs. This way, the Rural Prosperity Bond contributes to several of the Sustainable Development Goals (SDGs), including SDG 1 (No poverty), 2 (Zero hunger), 8 (Decent work and economic growth), 13 (Climate action) and 15 (Life on land).
NEXT STEPS Following Lab endorsement, WRI will prioritize:
Determining the legal and financial structure for the Rural Prosperity Bond, ideally with the involvement of the selected SPV manager. The main options considered are a bond, a loan or a fund structure.
Selecting a special purpose vehicle manager. Fundraising for the pilot phase.
The Rural Prosperity Bond is an innovative financial instrument, immediately actionable, with high replication potential. The instrument is estimated to produce positive social, economic
13 In most African countries, the agricultural sector employs an average of 54 percent of the working population (M. Sow, 2017)
18
and environmental impacts in rural economies in emerging markets thus helping to sustainably rebuild their economies affected by the pandemic. We therefore warmly recommend the Rural Prosperity Bond for Lab’s endorsement.
REFERENCES AfDB, 2010. Smallholder Agriculture in East Africa: Trends, Constraints and Opportunities. Working Paper Series 105. Available at: https://docs.igihe.com/IMG/pdf/working_105_pdf_d.pdf Bala, S., Biswas, S., & Mazumdar, A. (2006). Potential of carbon benefits from eucalyptus hybrid in dry-deciduous coppice forest of Jharkhand. Journal of Engineering and Applied Sciences, 7, 1614-1622. Available at: https://www.researchgate.net/publication/261145412 Bradbear, N., 2009. Bees and their role in forest livelihoods: a guide to the services provided by bees and the sustainable harvesting, processing and marketing of their products. Non-wood Forest Products, (19). Available at: http://www.fao.org/3/i0842e/i0842e00.htm Benayas, J. M. R., Newton, A. C., Diaz, A., & Bullock, J. M., 2009. Enhancement of biodiversity and ecosystem services by ecological restoration: a meta-analysis. science, 325(5944), 1121-1124. Doi: https://doi.org/10.1126/science.1172460 Council on Smallholder Agricultural Finance (CSAF). (2019). State of the Sector. Available at: https://csaf.org/wp-content/uploads/2019/07/CSAF_State_of_Sector_2019_Full_Final.pdf Council on Smallholder Agricultural Finance (CSAF) and USAID. (2018). CSAF financial benchmarking. Final learning report. Available at: https://www.agrilinks.org/sites/default/files/usaid_-_csaf_financial_benchmarking_final_learning_report.pdf CountrySTAT, 2020. FAO. Available at: http://www.fao.org/in-action/countrystat/en/ Dalberg (2018). The Economics od Agri-SME Lending in East Africa. Available at: https://www.agrilinks.org/sites/default/files/resources/the_economics_of_agri_sme_lending_in_east_africa_final_report.pdf ELD initiative, 2015. The Economics of Land Degradation in Africa. Available at: https://www.eld-initiative.org/fileadmin/pdf/ELD-unep-report_07_spec_72dpi.pdf FAO, 2015. The economic lives of smallholder farmers: An analysis based on household data from nine countries Rome. 48 pages. Available at: http://www.fao.org/3/a-i5251e.pdf FAO, 2018. Koronivia Joint Work on Agriculture: Analysis of Submissions. Environment and Natural Resources Management Series, Working Paper 71, Rome. 52 pages. Available at: http://www.fao.org/3/CA2586EN/ca2586en.pdf FAO, 2020. The female face of Farming. FAO. Available at: http://www.fao.org/gender/resources/infographics/the-female-face-of-farming/en/ FAOSTAT, 2019. Food and Agriculture Organization of the United Nations (FAO). Rome, Italy. Available at: http://faostat3.fao.org/home/E Farmer Income Lab, 2018. What works to increase smallholder farmers’ income? A Landscape review. Working draft for discussion. Available at:
19
https://www.farmerincomelab.com/sites/g/files/jydpyr621/files/2019-09/What%20Works_FINAL_9.19.pdf FSIN, 2020. Global Report On Food Crises: Joint Analysis For Better Decisions. Available at: http://www.fao.org/3/ca8786en/CA8786EN.pdf Garrity, D.P., et al. (2010). Evergreen Agriculture: a robust approach to sustainable food security in Africa. Food Security, 2(3), 197-214. doi: https://doi.org/10.1007/s12571-010-0070-7
Gibbs et al., 2015. Mapping the world's degraded lands. Applied geography, 57, 12-21. Available at: https://doi.org/10.1016/j.apgeog.2014.11.024 Griscom, B. W., Adams, J., Ellis, P. W., Houghton, R. A., Lomax, G., Miteva, D. A., ... & Woodbury, P., 2017. Natural climate solutions. Proceedings of the National Academy of Sciences, 114(44), 11645-11650. Doi: https://doi.org/10.1073/pnas.1710465114
Harvey, C. A., Rakotobe, Z. L., Rao, N. S., Dave, R., Razafimahatratra, H., Rabarijohn, R. H., ... & MacKinnon, J. L., 2014. Extreme vulnerability of smallholder farmers to agricultural risks and climate change in Madagascar. Philosophical Transactions of the Royal Society B: Biological Sciences, 369(1639), 20130089. doi: http://dx.doi.org/10.1098/rstb.2013.0089
ISF Advisors, Mastercard Foundation Rural and Agricultural Finance Learning Lab. (2019). Pathways to Prosperity. Rural and Agricultural Finance State of the Sector Report. Available at: https://pathways.raflearning.org/ ISF Advisors, Rural and Agricultural Finance Learning Lab (RAFLL), Feed the future initiative, 2020a. Agri-SMEs operating in uncertain financial, operational, and supply chain conditions. available at: https://www.raflearning.org/sites/default/files/covid19_pathway4_brief3.pdf?token=qphZbIML
ISF Advisors, Rural and Agricultural Finance Learning Lab (RAFLL), Feed the future initiative, 2020b. High-risk households dependent on, and critical for, food supply chains. Available at: https://www.raflearning.org/sites/default/files/covid19_pathway2_brief2.pdf?token=LXA728h5
Kasina, J. M., Mburu, J., Kraemer, M., & Holm-Mueller, K., 2009. Economic benefit of crop pollination by bees: a case of Kakamega small-holder farming in western Kenya. Journal of economic entomology, 102(2), 467-473. doi: https://doi.org/10.1603/029.102.0201
King, L. E., Douglas-Hamilton, I., & Vollrath, F., 2007. African elephants run from the sound of disturbed bees. Current Biology, 17(19), R832-R833. Doi: https://doi.org/10.1016/j.cub.2007.07.038 Luedeling, E. and Henry Neufeldt. (2012). Carbon sequestration potential of parkland agroforestry in the Sahel. Climate Change 115, 443-461. doi: https://doi.org/10.1007/s10584-012-0438-0
Makate, C., Makate, M., Mango, N., & Siziba, S., 2019. Increasing resilience of smallholder farmers to climate change through multiple adoption of proven climate-smart agriculture innovations. Lessons from Southern Africa. Journal of environmental management, 231, 858-868. doi: https://doi.org/10.1016/j.jenvman.2018.10.069
Mbow, C., et al. (2014). Achieving mitigation and adaptation to climate change through sustainable agroforestry practices in Africa. Current Opinion in Environmental Sustainability, 6, 8-14. doi: https://doi.org/10.1016/j.cosust.2013.09.002
Nair, P. K. R., Kang, B. T., & Kass, D. C. L.,1995. Nutrient Cycling and Soil‐Erosion Control in Agroforestry Systems. Agriculture and the environment: bridging food production and environmental protection in developing countries, 60, 117-138. doi: https://doi.org/10.2134/asaspecpub60.c7
20
Nath, A. J., Lal, R., & Das, A. K., 2015. Managing woody bamboos for carbon farming and carbon trading. Global Ecology and Conservation, 3, 654-663. doi: https://doi.org/10.1016/j.gecco.2015.03.002
Quandt, A., Neufeldt, H., & McCabe, J. T. (2017). The role of agroforestry in building livelihood resilience to floods and drought in semiarid Kenya. Ecology and Society, 22(3). Available at: https://www.jstor.org/stable/26270151
Sileshi, G. W., Debusho, L. K., & Akinnifesi, F. K., 2012. Can integration of legume trees increase yield stability in rainfed maize cropping systems in Southern Africa?. Agronomy Journal, 104(5), 1392-1398. doi: https://doi.org/10.2134/agronj2012.0063
M. Sow, 2017. Figures of the week: Sub-Saharan Africa’s labor market in 2017. Brookings. Available at: https://www.brookings.edu/blog/africa-in-focus/2017/01/11/figures-of-the-week-sub-saharan-africas-labor-market-in-2017/ Triodos Investment Management. (2017). Triodos Sustainable Trade Fund. Annual Report 2017. Available at: https://www.triodos-im.com/binaries/content/assets/tim/annual-reports/tstf/tstf-annual-report-2017.pdf. USAID, 2018. CSAF financial benchmarking. Final learning report. Available at: https://www.dropbox.com/preview/CF-Program/1.Workstreams/Innovation/the%20lab%20-%20the%20files/11%20Sixth%20cycle/Ag_LA%20Bond/5_Library/2018_csaf_financial_benchmarking_final_learning_report.pdf?role=work
World Bank, 2008. World Development Report 2008 : Agriculture for Development. Available at: https://openknowledge.worldbank.org/handle/10986/5990
World Resources Institute (WRI) and The Nature Conservancy. (2018). The Business of Planting Trees. A Growing Investment Opportunity. Available at: https://files.wri.org/s3fs-public/business-planting-trees_0.pdf World Resources Institute (WRI). (2017). Roots of Prosperity: The Economics and Finance of Restoring Land. Available at: https://files.wri.org/s3fs-public/roots-of-prosperity_0.pdf World Resources Institute (WRI), 2020. Available at: https://www.wri.org
World Resources Institute (WRI), 2015. AFR100: Africa Restoring 100 Million Hectares of Deforested and Degraded Land by 2030. Available at: https://www.wri.org/resources/data-visualizations/afr100-africa-restoring-100-million-hectares-deforested-and-degraded
6. ANNEXES
ANNEX 1 – LAND ACCELERATOR SELECTION CRITERIA
The Land Accelerator generates a pipeline of curated SMEs that are eligible for loans from the Rural Prosperity Bond. After the Rural Prosperity Bond proof of concept is established through the initial loan cycles, the eligibility criteria will be extended to include SMEs that are not Land Accelerator graduates but have similar potential.
The Accelerator’s selection criteria are:
Commercial viability (Profitability) – expectations for revenues and profit Scalability or growth potential Replicability
21
Environmental Impact (carbon sequestration, biodiversity, soil quality) Social impact (job creation, women employed, benefits to local community)
Additional company due diligence will be performed by the SPV prior to loan approval. This may include
Audited financial statements Operating history of at least two years; References (from investors, customers and suppliers); Recent photos or video calls showing assets and operations;
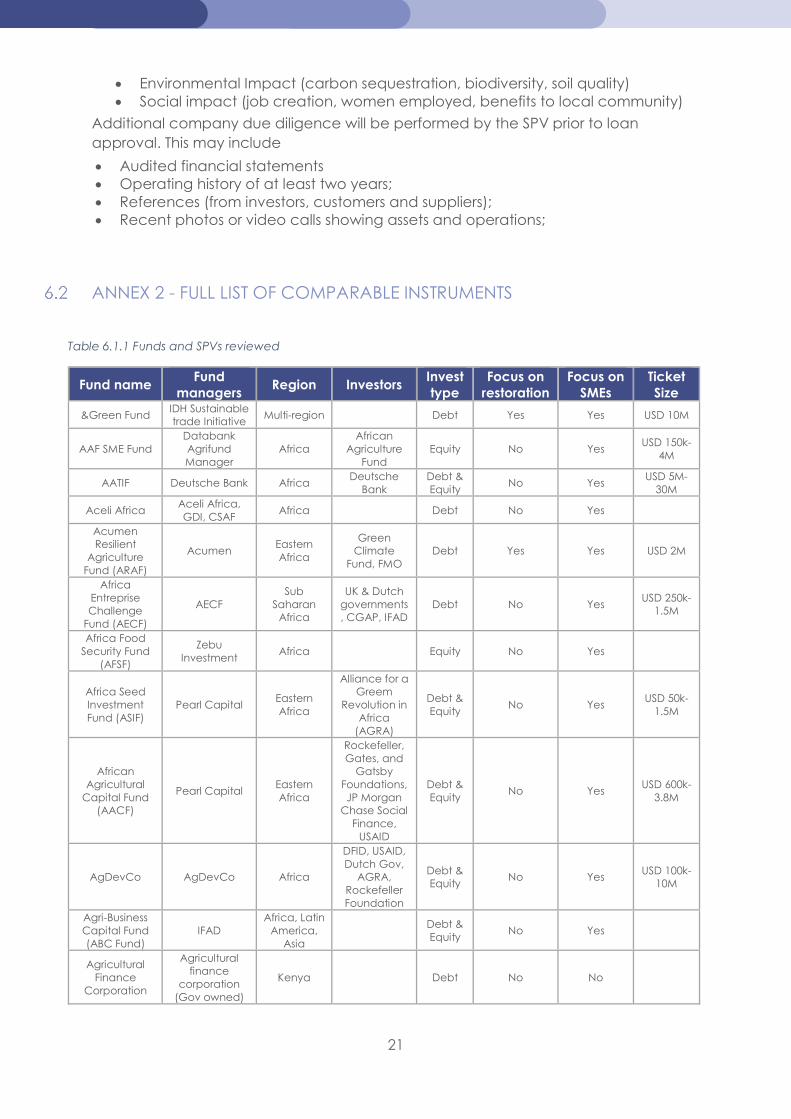
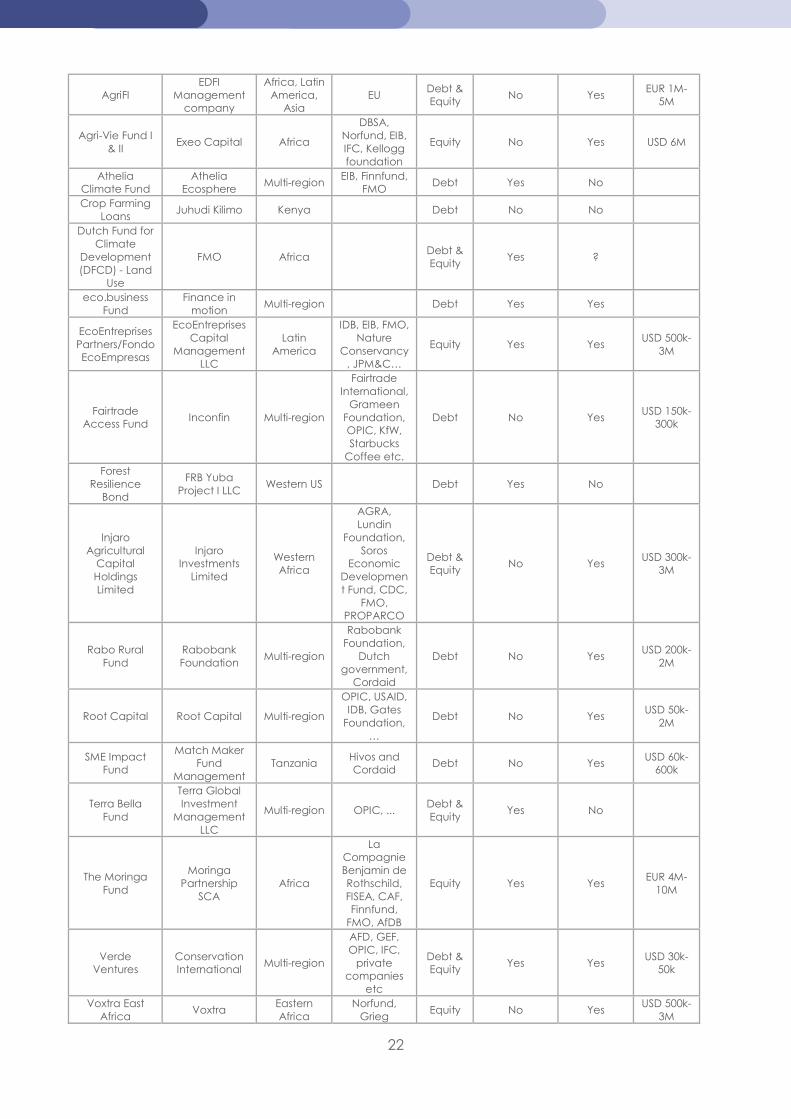
ANNEX 2 - FULL LIST OF COMPARABLE INSTRUMENTS
Table 6.1.1 Funds and SPVs reviewed
Fund name Fund
managers Region Investors
Invest type
Focus on restoration
Focus on SMEs
Ticket Size
&Green Fund IDH Sustainable trade Initiative
Multi-region Debt Yes Yes USD 10M
AAF SME Fund Databank Agrifund Manager
Africa African
Agriculture Fund
Equity No Yes USD 150k-
4M
AATIF Deutsche Bank Africa Deutsche
Bank Debt & Equity
No Yes USD 5M-
30M
Aceli Africa Aceli Africa, GDI, CSAF
Africa Debt No Yes
Acumen Resilient
Agriculture Fund (ARAF)
Acumen Eastern Africa
Green Climate
Fund, FMO Debt Yes Yes USD 2M
Africa Entreprise Challenge
Fund (AECF)
AECF Sub
Saharan Africa
UK & Dutch governments, CGAP, IFAD
Debt No Yes USD 250k-
1.5M
Africa Food Security Fund
(AFSF)
Zebu Investment
Africa Equity No Yes
Africa Seed Investment Fund (ASIF)
Pearl Capital Eastern Africa
Alliance for a Greem
Revolution in Africa
(AGRA)
Debt & Equity
No Yes USD 50k-
1.5M
African Agricultural
Capital Fund (AACF)
Pearl Capital Eastern Africa
Rockefeller, Gates, and
Gatsby Foundations, JP Morgan
Chase Social Finance,
USAID
Debt & Equity
No Yes USD 600k-
3.8M
AgDevCo AgDevCo Africa
DFID, USAID, Dutch Gov,
AGRA, Rockefeller Foundation
Debt & Equity
No Yes USD 100k-
10M
Agri-Business Capital Fund (ABC Fund)
IFAD Africa, Latin
America, Asia
Debt & Equity
No Yes
Agricultural Finance
Corporation
Agricultural finance
corporation (Gov owned)
Kenya Debt No No
22
AgriFI EDFI
Management company
Africa, Latin America,
Asia EU
Debt & Equity
No Yes EUR 1M-
5M
Agri-Vie Fund I & II
Exeo Capital Africa
DBSA, Norfund, EIB, IFC, Kellogg foundation
Equity No Yes USD 6M
Athelia Climate Fund
Athelia Ecosphere
Multi-region EIB, Finnfund,
FMO Debt Yes No
Crop Farming Loans
Juhudi Kilimo Kenya Debt No No
Dutch Fund for Climate
Development (DFCD) - Land
Use
FMO Africa Debt & Equity
Yes ?
eco.business Fund
Finance in motion
Multi-region Debt Yes Yes
EcoEntreprises Partners/Fondo EcoEmpresas
EcoEntreprises Capital
Management LLC
Latin America
IDB, EIB, FMO, Nature
Conservancy, JPM&C…
Equity Yes Yes USD 500k-
3M
Fairtrade Access Fund
Inconfin Multi-region
Fairtrade International,
Grameen Foundation, OPIC, KfW, Starbucks
Coffee etc.
Debt No Yes USD 150k-
300k
Forest Resilience
Bond
FRB Yuba Project I LLC
Western US Debt Yes No
Injaro Agricultural
Capital Holdings Limited
Injaro Investments
Limited
Western Africa
AGRA, Lundin
Foundation, Soros
Economic Development Fund, CDC,
FMO, PROPARCO
Debt & Equity
No Yes USD 300k-
3M
Rabo Rural Fund
Rabobank Foundation
Multi-region
Rabobank Foundation,
Dutch government,
Cordaid
Debt No Yes USD 200k-
2M
Root Capital Root Capital Multi-region
OPIC, USAID, IDB, Gates
Foundation, …
Debt No Yes USD 50k-
2M
SME Impact Fund
Match Maker Fund
Management Tanzania
Hivos and Cordaid
Debt No Yes USD 60k-
600k
Terra Bella Fund
Terra Global Investment
Management LLC
Multi-region OPIC, ... Debt & Equity
Yes No
The Moringa Fund
Moringa Partnership
SCA Africa
La Compagnie Benjamin de Rothschild, FISEA, CAF, Finnfund,
FMO, AfDB
Equity Yes Yes EUR 4M-
10M
Verde Ventures
Conservation International
Multi-region
AFD, GEF, OPIC, IFC,
private companies
etc
Debt & Equity
Yes Yes USD 30k-
50k
Voxtra East Africa
Voxtra Eastern Africa
Norfund, Grieg
Equity No Yes USD 500k-
3M
23
Agribusiness Fund
International, Kavlifondet
Yield Uganda Investment Fund (Yield)
Pearl Capital Uganda
IFAD, National
Security Fund Unganda
(NSSF)
Debt & Equity
No Yes USD 250k-
2M
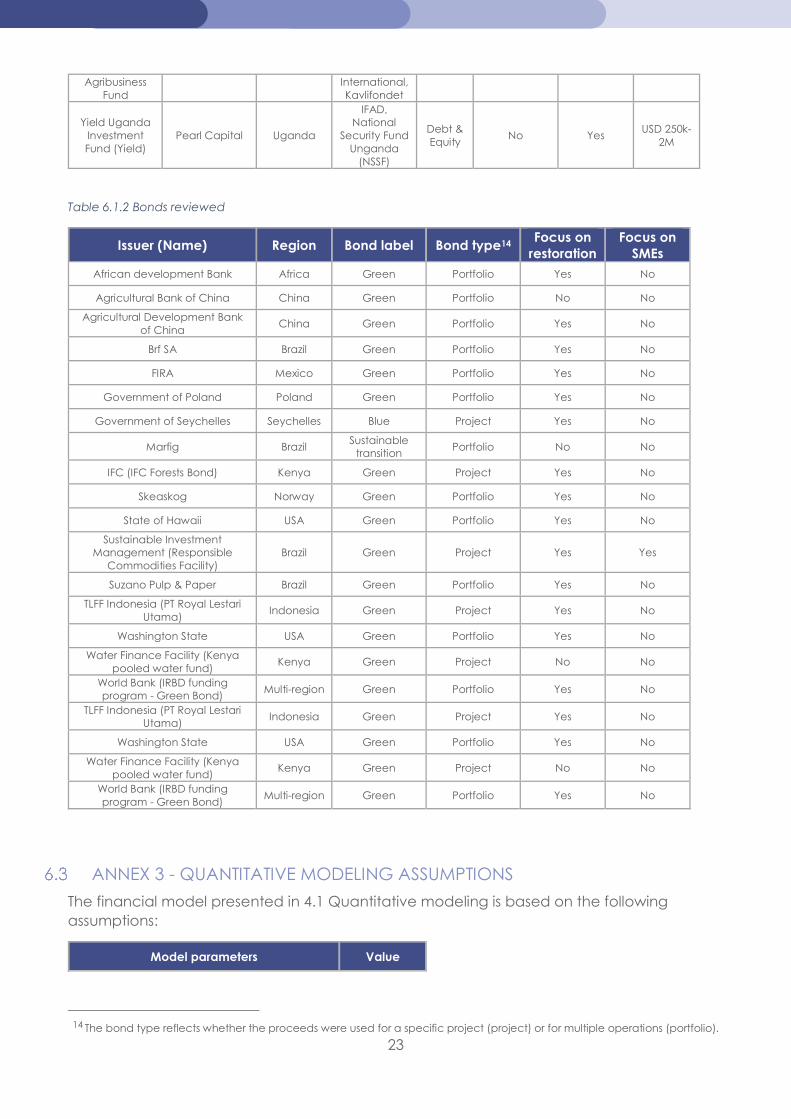
Table 6.1.2 Bonds reviewed
Issuer (Name) Region Bond label Bond type14 Focus on
restoration Focus on
SMEs African development Bank Africa Green Portfolio Yes No
Agricultural Bank of China China Green Portfolio No No
Agricultural Development Bank of China
China Green Portfolio Yes No
Brf SA Brazil Green Portfolio Yes No
FIRA Mexico Green Portfolio Yes No
Government of Poland Poland Green Portfolio Yes No
Government of Seychelles Seychelles Blue Project Yes No
Marfig Brazil Sustainable
transition Portfolio No No
IFC (IFC Forests Bond) Kenya Green Project Yes No
Skeaskog Norway Green Portfolio Yes No
State of Hawaii USA Green Portfolio Yes No
Sustainable Investment Management (Responsible
Commodities Facility) Brazil Green Project Yes Yes
Suzano Pulp & Paper Brazil Green Portfolio Yes No
TLFF Indonesia (PT Royal Lestari Utama)
Indonesia Green Project Yes No
Washington State USA Green Portfolio Yes No
Water Finance Facility (Kenya pooled water fund)
Kenya Green Project No No
World Bank (IRBD funding program - Green Bond)
Multi-region Green Portfolio Yes No
TLFF Indonesia (PT Royal Lestari Utama)
Indonesia Green Project Yes No
Washington State USA Green Portfolio Yes No
Water Finance Facility (Kenya pooled water fund)
Kenya Green Project No No
World Bank (IRBD funding program - Green Bond)
Multi-region Green Portfolio Yes No
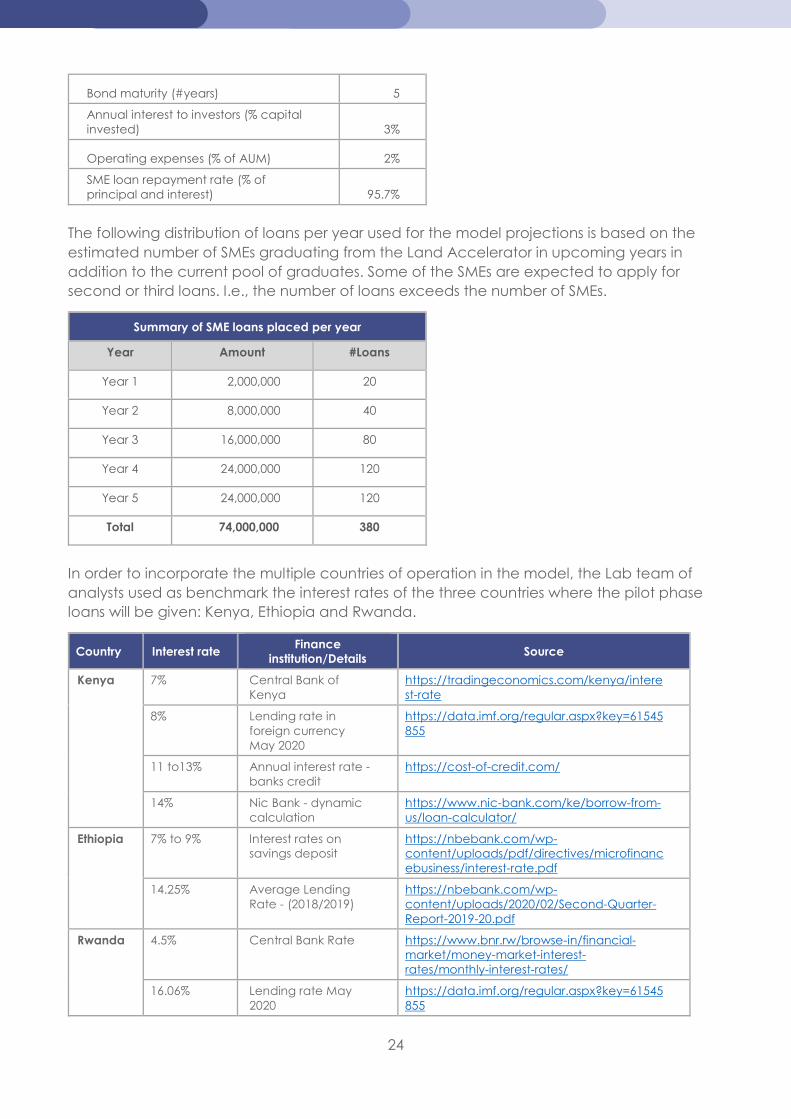
ANNEX 3 - QUANTITATIVE MODELING ASSUMPTIONS
The financial model presented in 4.1 Quantitative modeling is based on the following assumptions:
Model parameters Value
14 The bond type reflects whether the proceeds were used for a specific project (project) or for multiple operations (portfolio).
24
Bond maturity (#years) 5
Annual interest to investors (% capital invested) 3%
Operating expenses (% of AUM) 2%
SME loan repayment rate (% of principal and interest) 95.7%
The following distribution of loans per year used for the model projections is based on the estimated number of SMEs graduating from the Land Accelerator in upcoming years in addition to the current pool of graduates. Some of the SMEs are expected to apply for second or third loans. I.e., the number of loans exceeds the number of SMEs.
Summary of SME loans placed per year
Year Amount #Loans
Year 1 2,000,000 20
Year 2 8,000,000 40
Year 3 16,000,000 80
Year 4 24,000,000 120
Year 5 24,000,000 120
Total 74,000,000 380
In order to incorporate the multiple countries of operation in the model, the Lab team of analysts used as benchmark the interest rates of the three countries where the pilot phase loans will be given: Kenya, Ethiopia and Rwanda.
Country Interest rate Finance
institution/Details Source
Kenya 7% Central Bank of Kenya
https://tradingeconomics.com/kenya/interest-rate
8% Lending rate in foreign currency May 2020
https://data.imf.org/regular.aspx?key=61545855
11 to13% Annual interest rate - banks credit
https://cost-of-credit.com/
14% Nic Bank - dynamic calculation
https://www.nic-bank.com/ke/borrow-from-us/loan-calculator/
Ethiopia 7% to 9% Interest rates on savings deposit
https://nbebank.com/wp-content/uploads/pdf/directives/microfinancebusiness/interest-rate.pdf
14.25% Average Lending Rate - (2018/2019)
https://nbebank.com/wp-content/uploads/2020/02/Second-Quarter-Report-2019-20.pdf
Rwanda 4.5% Central Bank Rate https://www.bnr.rw/browse-in/financial-market/money-market-interest-rates/monthly-interest-rates/
16.06% Lending rate May 2020
https://data.imf.org/regular.aspx?key=61545855
25
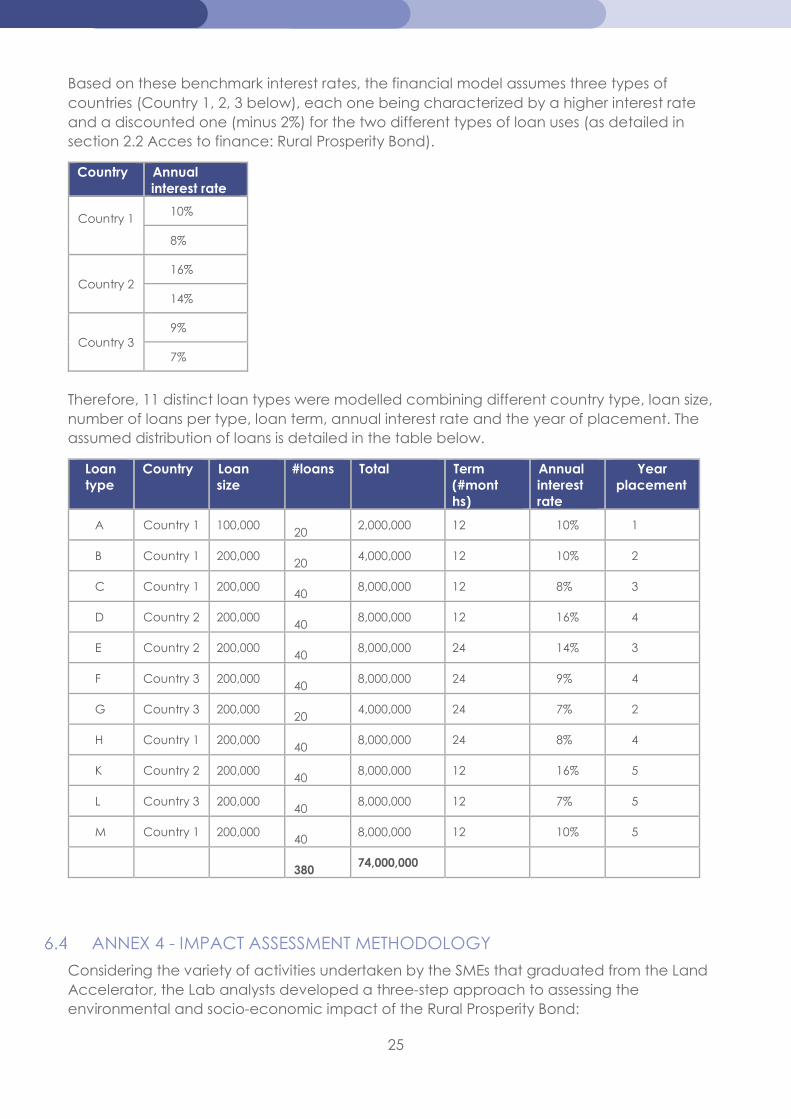
Based on these benchmark interest rates, the financial model assumes three types of countries (Country 1, 2, 3 below), each one being characterized by a higher interest rate and a discounted one (minus 2%) for the two different types of loan uses (as detailed in section 2.2 Acces to finance: Rural Prosperity Bond).
Country Annual interest rate
Country 1
10%
8%
Country 2 16%
14%
Country 3 9%
7%
Therefore, 11 distinct loan types were modelled combining different country type, loan size, number of loans per type, loan term, annual interest rate and the year of placement. The assumed distribution of loans is detailed in the table below.
Loan type
Country Loan size
#loans Total Term (#months)
Annual interest rate
Year placement
A Country 1 100,000 20
2,000,000 12 10% 1
B Country 1 200,000 20
4,000,000 12 10% 2
C Country 1 200,000 40
8,000,000 12 8% 3
D Country 2 200,000 40
8,000,000 12 16% 4
E Country 2 200,000 40
8,000,000 24 14% 3
F Country 3 200,000 40
8,000,000 24 9% 4
G Country 3 200,000 20
4,000,000 24 7% 2
H Country 1 200,000 40
8,000,000 24 8% 4
K Country 2 200,000 40
8,000,000 12 16% 5
L Country 3 200,000 40
8,000,000 12 7% 5
M Country 1 200,000 40
8,000,000 12 10% 5
380
74,000,000
ANNEX 4 - IMPACT ASSESSMENT METHODOLOGY
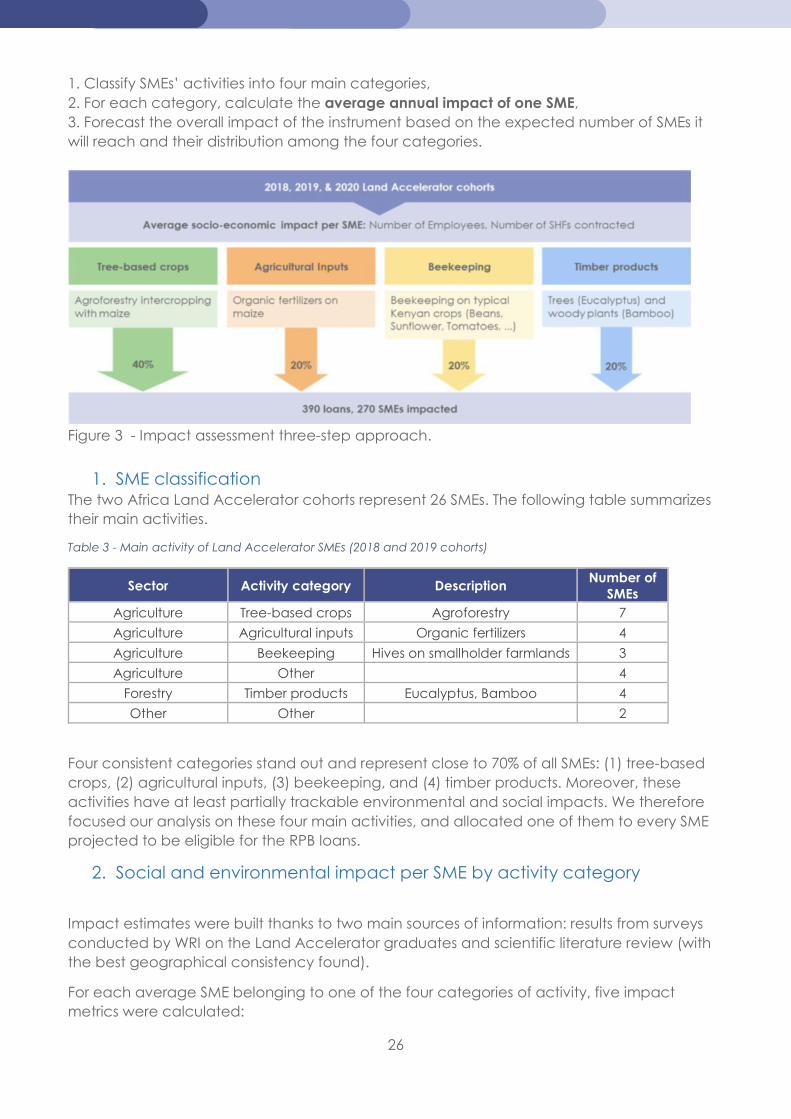
Considering the variety of activities undertaken by the SMEs that graduated from the Land Accelerator, the Lab analysts developed a three-step approach to assessing the environmental and socio-economic impact of the Rural Prosperity Bond:
26
1. Classify SMEs’ activities into four main categories, 2. For each category, calculate the average annual impact of one SME, 3. Forecast the overall impact of the instrument based on the expected number of SMEs it will reach and their distribution among the four categories.
Figure 3 - Impact assessment three-step approach.
1. SME classification The two Africa Land Accelerator cohorts represent 26 SMEs. The following table summarizes their main activities.
Table 3 - Main activity of Land Accelerator SMEs (2018 and 2019 cohorts)
Sector Activity category Description Number of
SMEs Agriculture Tree-based crops Agroforestry 7
Agriculture Agricultural inputs Organic fertilizers 4
Agriculture Beekeeping Hives on smallholder farmlands 3
Agriculture Other 4
Forestry Timber products Eucalyptus, Bamboo 4
Other Other 2
Four consistent categories stand out and represent close to 70% of all SMEs: (1) tree-based crops, (2) agricultural inputs, (3) beekeeping, and (4) timber products. Moreover, these activities have at least partially trackable environmental and social impacts. We therefore focused our analysis on these four main activities, and allocated one of them to every SME projected to be eligible for the RPB loans.
2. Social and environmental impact per SME by activity category
Impact estimates were built thanks to two main sources of information: results from surveys conducted by WRI on the Land Accelerator graduates and scientific literature review (with the best geographical consistency found).
For each average SME belonging to one of the four categories of activity, five impact metrics were calculated:
27
- Number of employees (Cohort surveys) - Number of smallholder farmers impacted (Cohort surveys) - Number of hectares restored per year (Cohort surveys) - Carbon dioxide sequestrated per year - Yield increase
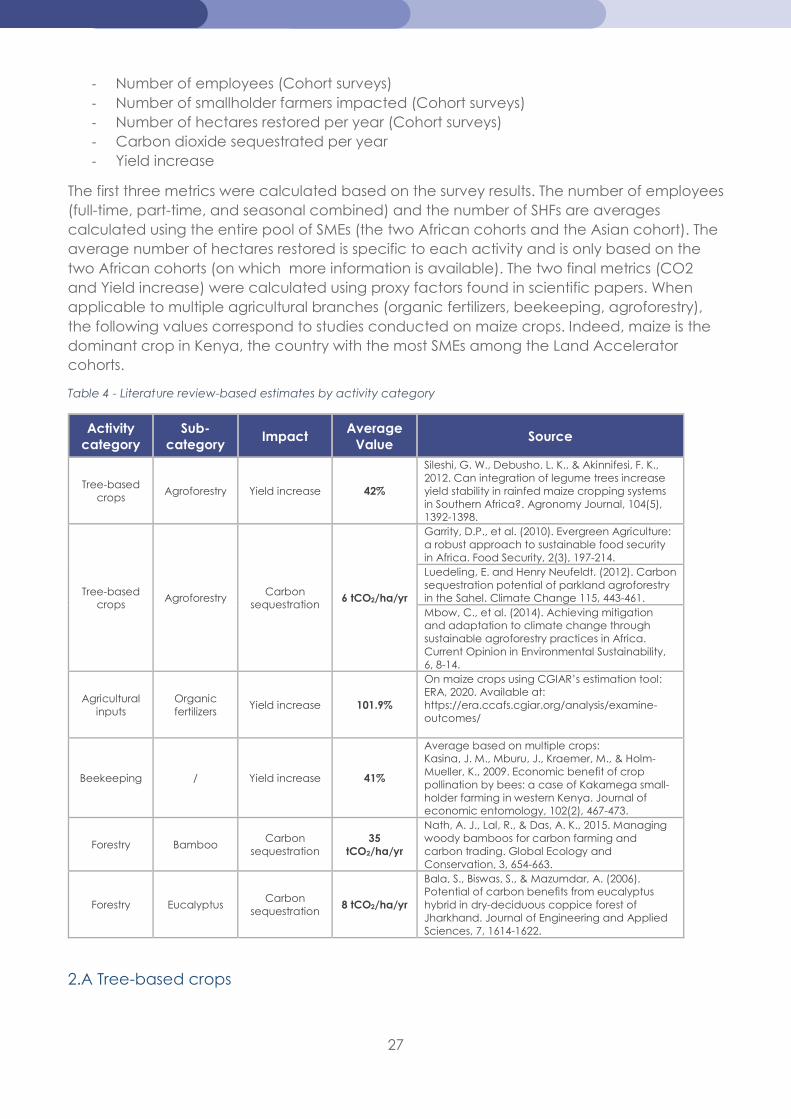
The first three metrics were calculated based on the survey results. The number of employees (full-time, part-time, and seasonal combined) and the number of SHFs are averages calculated using the entire pool of SMEs (the two African cohorts and the Asian cohort). The average number of hectares restored is specific to each activity and is only based on the two African cohorts (on which more information is available). The two final metrics (CO2 and Yield increase) were calculated using proxy factors found in scientific papers. When applicable to multiple agricultural branches (organic fertilizers, beekeeping, agroforestry), the following values correspond to studies conducted on maize crops. Indeed, maize is the dominant crop in Kenya, the country with the most SMEs among the Land Accelerator cohorts.
Table 4 - Literature review-based estimates by activity category
Activity category
Sub-category
Impact Average
Value Source
Tree-based crops
Agroforestry Yield increase 42%
Sileshi, G. W., Debusho, L. K., & Akinnifesi, F. K., 2012. Can integration of legume trees increase yield stability in rainfed maize cropping systems in Southern Africa?. Agronomy Journal, 104(5), 1392-1398.
Tree-based crops
Agroforestry Carbon
sequestration 6 tCO2/ha/yr
Garrity, D.P., et al. (2010). Evergreen Agriculture: a robust approach to sustainable food security in Africa. Food Security, 2(3), 197-214. Luedeling, E. and Henry Neufeldt. (2012). Carbon sequestration potential of parkland agroforestry in the Sahel. Climate Change 115, 443-461. Mbow, C., et al. (2014). Achieving mitigation and adaptation to climate change through sustainable agroforestry practices in Africa. Current Opinion in Environmental Sustainability, 6, 8-14.
Agricultural inputs
Organic fertilizers
Yield increase 101.9%
On maize crops using CGIAR’s estimation tool: ERA, 2020. Available at: https://era.ccafs.cgiar.org/analysis/examine-outcomes/
Beekeeping / Yield increase 41%
Average based on multiple crops: Kasina, J. M., Mburu, J., Kraemer, M., & Holm-Mueller, K., 2009. Economic benefit of crop pollination by bees: a case of Kakamega small-holder farming in western Kenya. Journal of economic entomology, 102(2), 467-473.
Forestry Bamboo Carbon
sequestration 35
tCO2/ha/yr
Nath, A. J., Lal, R., & Das, A. K., 2015. Managing woody bamboos for carbon farming and carbon trading. Global Ecology and Conservation, 3, 654-663.
Forestry Eucalyptus Carbon
sequestration 8 tCO2/ha/yr
Bala, S., Biswas, S., & Mazumdar, A. (2006). Potential of carbon benefits from eucalyptus hybrid in dry-deciduous coppice forest of Jharkhand. Journal of Engineering and Applied Sciences, 7, 1614-1622.
2.A Tree-based crops
28
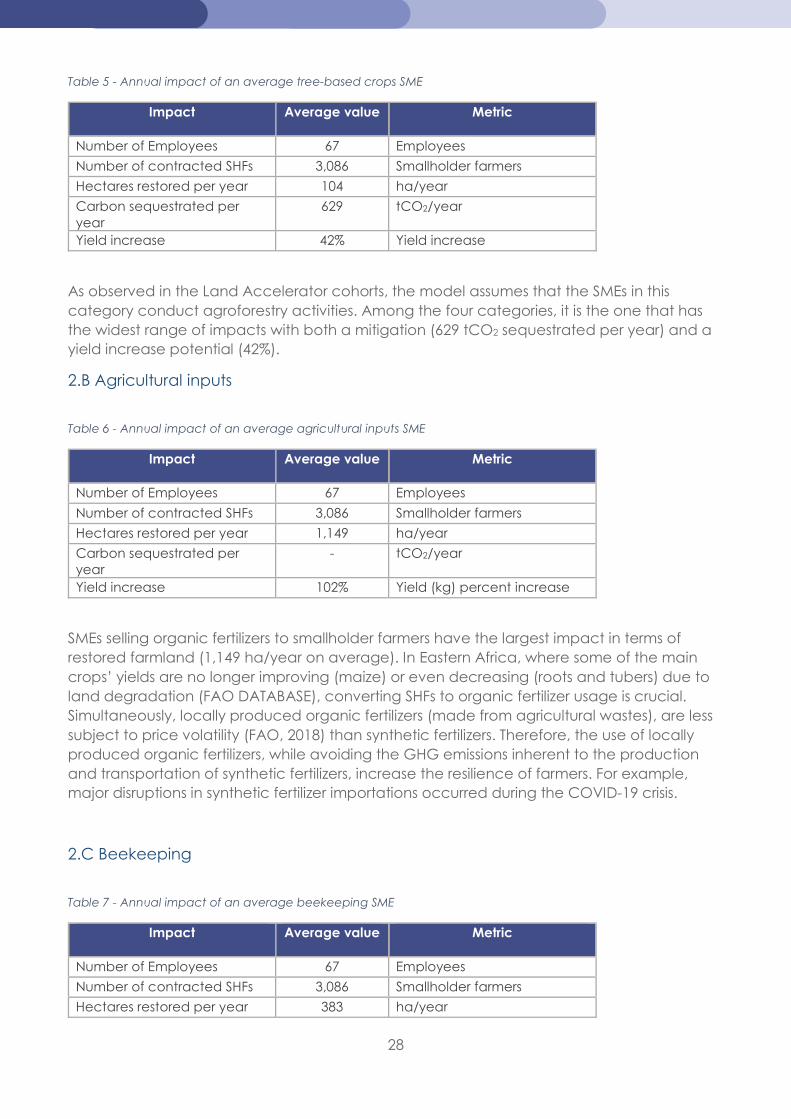
Table 5 - Annual impact of an average tree-based crops SME
Impact Average value Metric
Number of Employees 67 Employees
Number of contracted SHFs 3,086 Smallholder farmers
Hectares restored per year 104 ha/year
Carbon sequestrated per year
629 tCO2/year
Yield increase 42% Yield increase
As observed in the Land Accelerator cohorts, the model assumes that the SMEs in this category conduct agroforestry activities. Among the four categories, it is the one that has the widest range of impacts with both a mitigation (629 tCO2 sequestrated per year) and a yield increase potential (42%).
2.B Agricultural inputs
Table 6 - Annual impact of an average agricultural inputs SME
Impact Average value Metric
Number of Employees 67 Employees
Number of contracted SHFs 3,086 Smallholder farmers
Hectares restored per year 1,149 ha/year
Carbon sequestrated per year
- tCO2/year
Yield increase 102% Yield (kg) percent increase
SMEs selling organic fertilizers to smallholder farmers have the largest impact in terms of restored farmland (1,149 ha/year on average). In Eastern Africa, where some of the main crops’ yields are no longer improving (maize) or even decreasing (roots and tubers) due to land degradation (FAO DATABASE), converting SHFs to organic fertilizer usage is crucial. Simultaneously, locally produced organic fertilizers (made from agricultural wastes), are less subject to price volatility (FAO, 2018) than synthetic fertilizers. Therefore, the use of locally produced organic fertilizers, while avoiding the GHG emissions inherent to the production and transportation of synthetic fertilizers, increase the resilience of farmers. For example, major disruptions in synthetic fertilizer importations occurred during the COVID-19 crisis.
2.C Beekeeping
Table 7 - Annual impact of an average beekeeping SME
Impact Average value Metric
Number of Employees 67 Employees
Number of contracted SHFs 3,086 Smallholder farmers
Hectares restored per year 383 ha/year
29
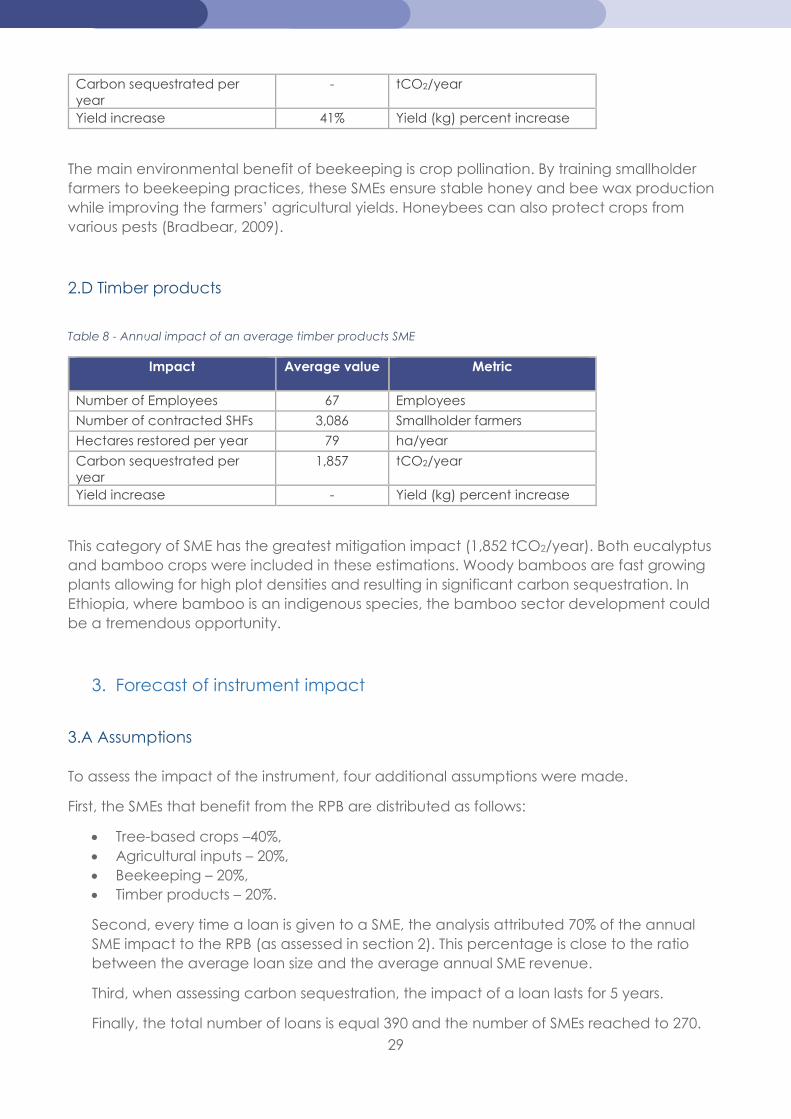
Carbon sequestrated per year
- tCO2/year
Yield increase 41% Yield (kg) percent increase
The main environmental benefit of beekeeping is crop pollination. By training smallholder farmers to beekeeping practices, these SMEs ensure stable honey and bee wax production while improving the farmers’ agricultural yields. Honeybees can also protect crops from various pests (Bradbear, 2009).
2.D Timber products
Table 8 - Annual impact of an average timber products SME
Impact Average value Metric
Number of Employees 67 Employees
Number of contracted SHFs 3,086 Smallholder farmers
Hectares restored per year 79 ha/year
Carbon sequestrated per year
1,857 tCO2/year
Yield increase - Yield (kg) percent increase
This category of SME has the greatest mitigation impact (1,852 tCO2/year). Both eucalyptus and bamboo crops were included in these estimations. Woody bamboos are fast growing plants allowing for high plot densities and resulting in significant carbon sequestration. In Ethiopia, where bamboo is an indigenous species, the bamboo sector development could be a tremendous opportunity.
3. Forecast of instrument impact
3.A Assumptions To assess the impact of the instrument, four additional assumptions were made.
First, the SMEs that benefit from the RPB are distributed as follows:
Tree-based crops –40%, Agricultural inputs – 20%, Beekeeping – 20%, Timber products – 20%.
Second, every time a loan is given to a SME, the analysis attributed 70% of the annual SME impact to the RPB (as assessed in section 2). This percentage is close to the ratio between the average loan size and the average annual SME revenue.
Third, when assessing carbon sequestration, the impact of a loan lasts for 5 years.
Finally, the total number of loans is equal 390 and the number of SMEs reached to 270.
30
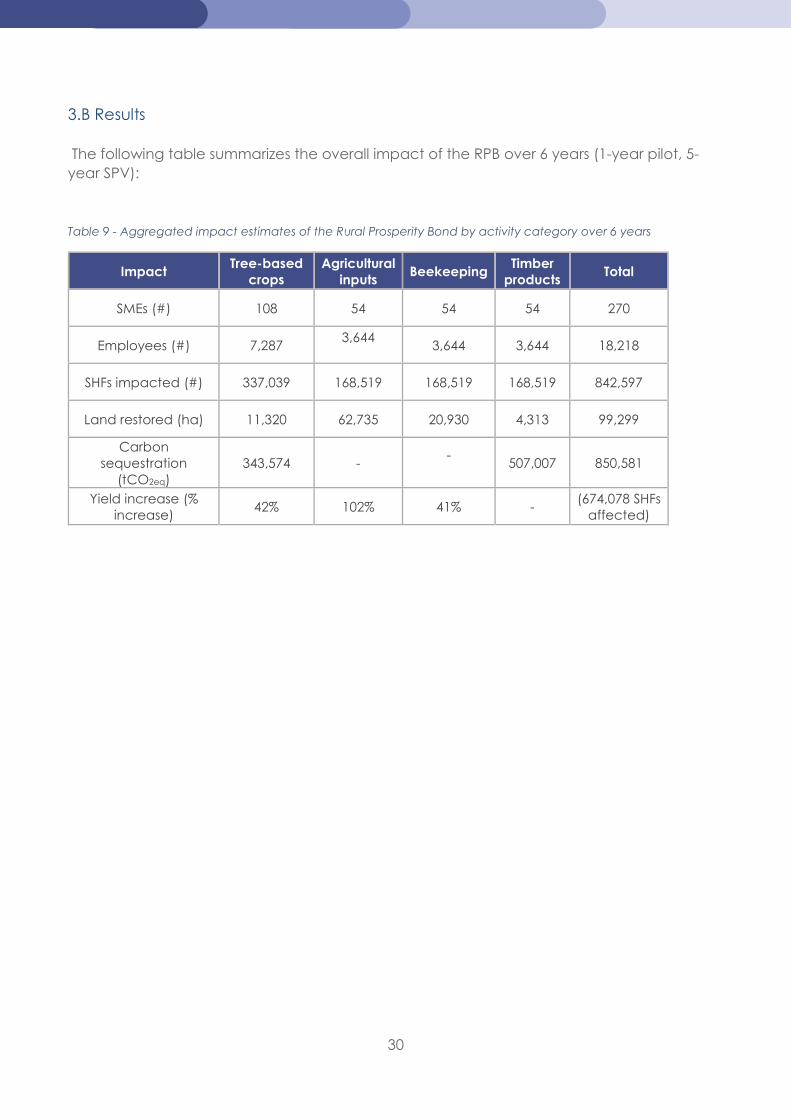
3.B Results The following table summarizes the overall impact of the RPB over 6 years (1-year pilot, 5-year SPV):
Table 9 - Aggregated impact estimates of the Rural Prosperity Bond by activity category over 6 years
Impact Tree-based
crops Agricultural
inputs Beekeeping
Timber products
Total
SMEs (#) 108 54 54 54 270
Employees (#) 7,287 3,644
3,644 3,644 18,218
SHFs impacted (#) 337,039 168,519 168,519 168,519 842,597
Land restored (ha) 11,320 62,735 20,930 4,313 99,299
Carbon sequestration
(tCO2eq) 343,574 -
-
507,007 850,581
Yield increase (% increase)
42% 102% 41% - (674,078 SHFs
affected)
Related Documents