1 Rural Oregon Analyzing Demographic and Economic Trends Across Rural Oregon and a Look Ahead September 2015 Oregon Office of Economic Analysis

Welcome message from author
This document is posted to help you gain knowledge. Please leave a comment to let me know what you think about it! Share it to your friends and learn new things together.
Transcript

1
Rural OregonAnalyzing Demographic and Economic Trends
Across Rural Oregon and a Look Ahead
September 2015
Oregon Office of Economic Analysis

2Oregon Office of Economic Analysis
Oregon’s Nonmetropolitan Areas
U.S. Bureau of Labor Statistics’ Regions
Oregon Office of Economic Analysis’ Regions
Prior to 2011, Eastern Oregon Nonmetropolitan Area consisted of Eastern and North Central

3Oregon Office of Economic Analysis
Rural America is Recovering Slower than Metros

4Oregon Office of Economic Analysis
Rural Oregon is No Exception
-10%
-8%
-6%
-4%
-2%
0%
2%
07 09 11 13 15
Oregon and the Great RecessionEmployment Change From Peak
Urban Oregon
Rural Oregon
Data: Seasonally-Adjusted, 3 Month Average, Latest data point: June 2015Source: Oregon Employment Department, Oregon Office of Economic Analysis

5Oregon Office of Economic Analysis
Partly Due to Less Diverse Economies
Bigger cities have more diverse economies (advertising firms, ballet dancers, etc).
Less industrial diversification not necessarily bad. In good times for your region’s specialty, economy really grows. In bad times, your local economy really suffers however.
E.g. Rural Oregon with timber in 1960s and 1970s. North Dakota with oil and gas in 2000s.

6Oregon Office of Economic Analysis
Exposure to Housing and Government Extremely High
Rural Oregon economies had 37% of payroll tied directly to housing and government prior to the Great Recession.
The two biggest drags following the Great Recession where housing and government.
As migration flows return, so too is the housing industry.
Public sector is stabilized and adding jobs in select locations. Not Curry or Josephine however.
9.8%
15.5%
10.3%
16.5%
12.7%
24.6%
0%
5%
10%
15%
20%
25%
30%
Housing Government
Housing and Government in OregonShare of Local Payroll, 2007
Urban Oregon Rural
Housing = Construction, Wood Product Manufacturing, Furniture Stores, Building Material and Garden Supply Store,Real Estate | Data: 2007 QCEW | Source: Oregon Employment Department, Oregon Office of Economic Analysis

7Oregon Office of Economic Analysis
Good News: Job Growth Has Returned, but…

8Oregon Office of Economic Analysis
…Only the Gorge is Fully Recovered, and…

9Oregon Office of Economic Analysis
...Individual Counties Differ Considerably
10Oregon Office of Economic Analysis
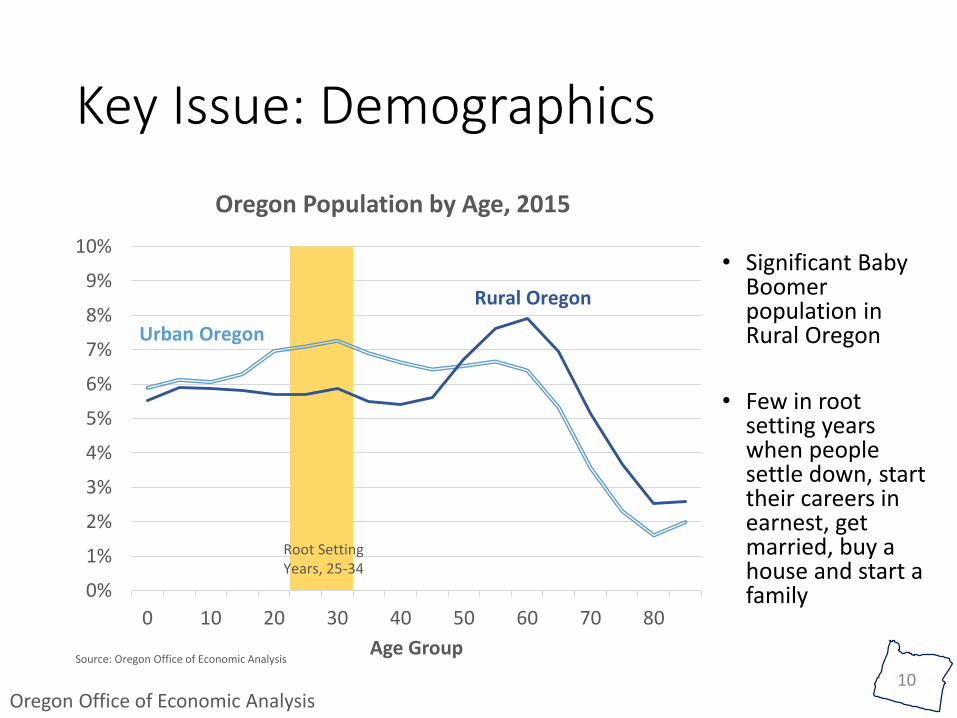
Key Issue: Demographics
• Significant Baby Boomer population in Rural Oregon
• Few in root setting years when people settle down, start their careers in earnest, get married, buy a house and start a family0%
1%
2%
3%
4%
5%
6%
7%
8%
9%
10%
0 10 20 30 40 50 60 70 80
Age Group
Oregon Population by Age, 2015
Source: Oregon Office of Economic Analysis
Rural Oregon
Urban Oregon
Root SettingYears, 25-34

11Oregon Office of Economic Analysis
Participation Drops with Age
• Rural counties tend to be older, have lower participation rates
• Impacts productive capacity of regional economy
Clatsop
Coos
Crook
Curry
Douglas
Gilliam
Grant
Harney
Hood River
JeffersonKlamath
Lake
Lincoln
Malheur
Morrow
Sherman
Tillamook
Umatilla
UnionWallowa
Wasco
Wheeler
Benton
Clackamas
Columbia
Deschutes
Jackson
Josephine
LaneLinn
Multnomah
Polk
Washington
YamhillU.S.
OR
45%
50%
55%
60%
65%
70%
75%
10% 15% 20% 25% 30% 35% 40%
Lab
or
Forc
e Pa
rtic
ipat
ion
Rat
e
Share of Population 65 Years and Older
Rural Oregon
Urban Oregon
Data: 2013 ACS, 5 Year Estimates | Source: Census, Oregon Office of Economic Analysis

12Oregon Office of Economic Analysis
Potential Growth Likely Shrinking
-10%
-8%
-6%
-4%
-2%
0%
2%
4%
6%
U.S. Oregon U.S. Oregon Gorge NE SE S.Coast
N.Coast
Metros Rural Rural Oregon
Rural Labor Force ShrinkingChange from 2007 to 2014
Source: BLS, Oregon Employment Department, Oregon Office of Economci Analysis
13Oregon Office of Economic Analysis
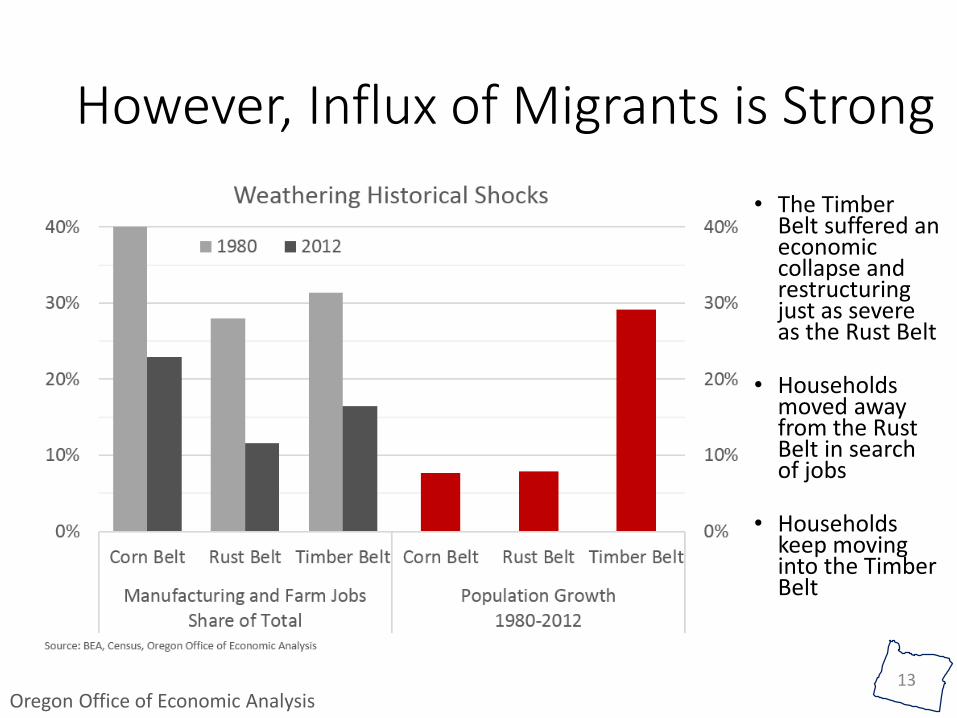
However, Influx of Migrants is Strong
• The Timber Belt suffered an economic collapse and restructuring just as severe as the Rust Belt
• Households moved away from the Rust Belt in search of jobs
• Households keep moving into the Timber Belt

14Oregon Office of Economic Analysis
…To Nearly All Oregon Counties…
Baker
Benton Clackamas
Clatsop
Columbia
Coos
Crook
Curry
Deschutes
Douglas
Gilliam
Grant
Harney
Hood River
Jackson
Jefferson
Josephine
Klamath
Lake
Lane
Lincoln
Linn
Malheur
Marion Morrow
Multnomah
Polk Sherman Tillamook
Umatilla
Union
Wallowa Wasco
Washington Wheeler
Yamhill
-15
-10
-5
0
5
10
15
20
25
-15 -10 -5 0 5 10 15 20 25
Net
Mig
rati
on
fro
m O
ther
Sta
tes
Net Migration from Other Areas in Oregon
Net Migration of Tax Filers:Number per 1,000 Tax Returns, 1995-2011
Losses to otherstates and other Oregon counties
Losses to Oregon counties outstrip gains from otherstates
Gains from other states outstrip losses to Oregon counties
Gains from Oregon counties outstrip losses to other states
Gains from other states and other Oregon counties
Losses to other states outstrip gainsfrom Oregon counties

15Oregon Office of Economic Analysis
…But Different Type of MigrantGaining experienced and some wealthy households, losing working age families on net
0%
2%
4%
6%
8%
10%
12%
14%
16%
Health Care CashContributions
Shar
e o
f To
tal E
xpen
dit
ure
s
Older Households Spend More On Health and Cash Contributions
55-6465-7475+
Source: BLS, Consumer Expenditure Survey
$0
$50,000
$100,000
$150,000
$200,000
$250,000
$300,000
$350,000
$400,000
$450,000
$500,000
Expenditures Wealth
Household Finances for Top Half of the Income Distribution
50-64
65-74
75-84
85+
Source: Employee Benefit Research Institute

16Oregon Office of Economic Analysis
Important Forward Looking Indicator Looks OK for Rural Oregon
33.1% 32.5%
18.7% 18.6%
24.7%21.8%
18.3% 17.6% 17.5%
0%
10%
20%
30%
40%
Oregon U.S. Oregon U.S. Gorge NorthCoast
South-east
North-east
SouthCoast
Metro Rural Rural Oregon
Educational Attainment25-64 Years Old, Share with Bachelor's Degree or Higher
Data: 2013 ACS, 5 Year Estimates | Source: Census, USDA, Oregon Office of Economic Analysis
• Gorge and N. Coast rank among best rural areas in entire country
• Rest of Rural Oregon right around the average yet above the typical area (above the median)

17Oregon Office of Economic Analysis
Quality of Jobs in Rural Oregon
Rural job growth slower than metros
Middle-wage jobs lacking everywhere
High-wage jobs stronger in rural Oregon than rural America over past decade
18Oregon Office of Economic Analysis
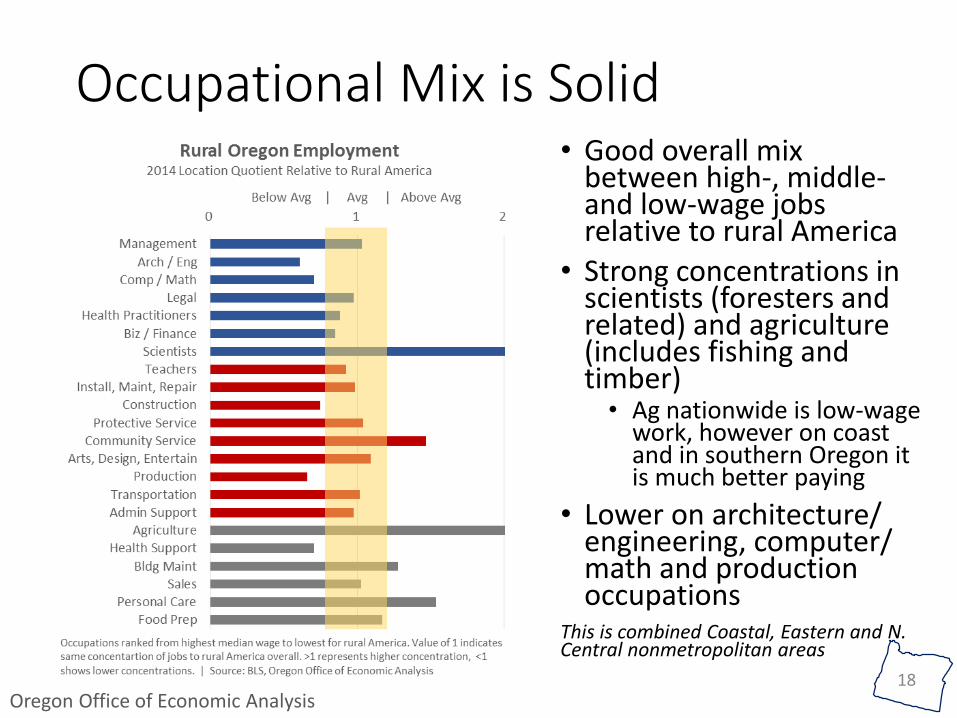
Occupational Mix is Solid• Good overall mix
between high-, middle-and low-wage jobs relative to rural America
• Strong concentrations in scientists (foresters and related) and agriculture (includes fishing and timber)• Ag nationwide is low-wage
work, however on coast and in southern Oregon it is much better paying
• Lower on architecture/ engineering, computer/ math and production occupations
This is combined Coastal, Eastern and N. Central nonmetropolitan areas

19Oregon Office of Economic Analysis
Rural Oregon is Good Place to Grow Up
• Eastern Oregon areas among top third of all U.S. for economic mobility• 700+ areas
• La Grande and Ontario are typical
• Southern Oregon below average, most likely due to timing of research which follows children born in early 80s• Worst possible time to
start the clock on southern Oregon due to timber industry

20Oregon Office of Economic Analysis
Pockets of StrengthWhile Broad Prosperity is Lacking, Not All Hope is Lost
• On the coast, dairy, fishing and tourism are strong
• In the gorge, beer, drones and fruit are doing well
• Out east, manufacturing expanding, wheat harvests have been good and Morrow is booming
• Down south, timber industry is adding some jobs and migration flows are returning

21
Regional OverviewsFacts and Figures by Rural Oregon Region
22Oregon Office of Economic Analysis
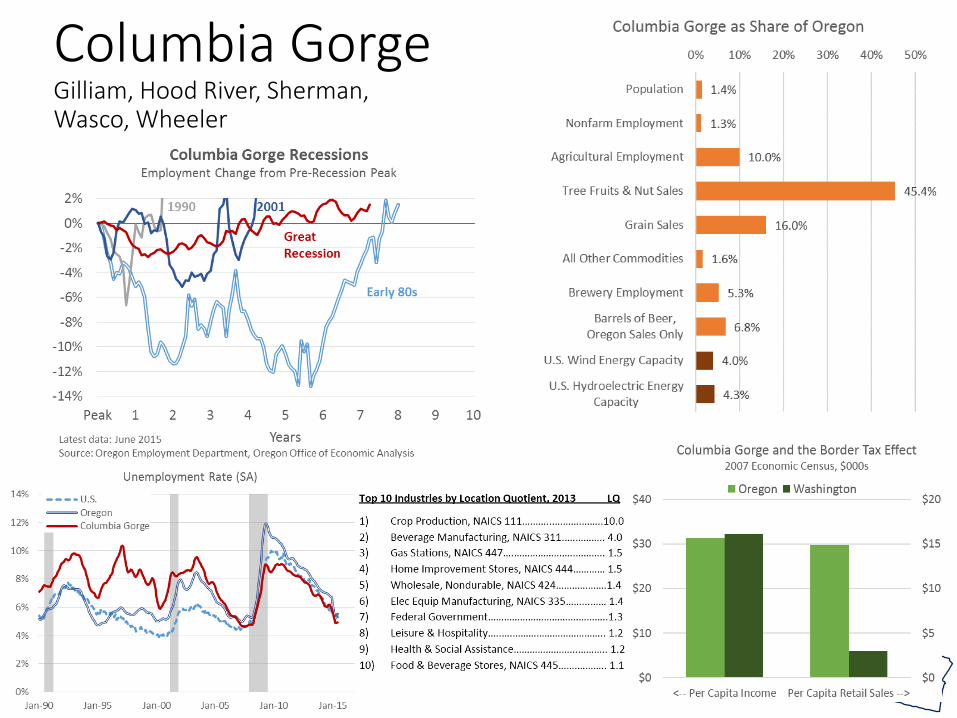
Columbia GorgeGilliam, Hood River, Sherman, Wasco, Wheeler
23Oregon Office of Economic Analysis
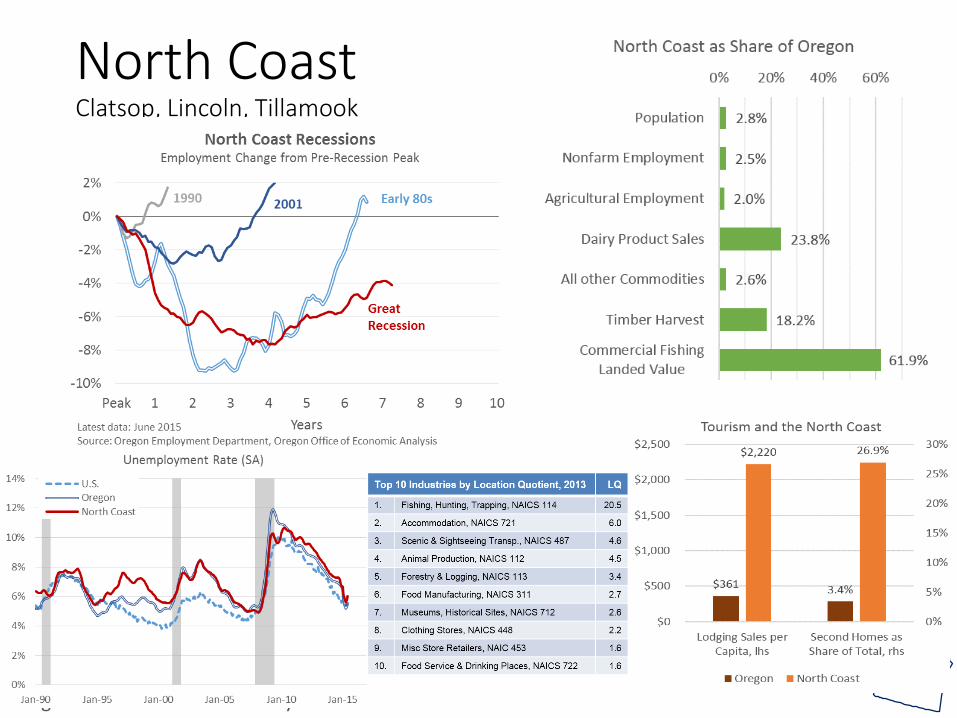
North CoastClatsop, Lincoln, Tillamook

24Oregon Office of Economic Analysis
South CoastCoos, Curry

25Oregon Office of Economic Analysis
Northeast OregonBaker, Grant, Morrow, Umatilla, Union, Wallowa

26Oregon Office of Economic Analysis
Southeast OregonHarney, Klamath, Lake, Malheur

27Oregon Office of Economic Analysis
Contact
www.OregonEconomicAnalysis.com
@OR_EconAnalysis
(503) 378-4052
Related Documents