RURAL LABOUR ENQUIRY (61 st 2004–05 Round of N.S.S.) REPORT ON WAGES & EARNINGS OF RURAL LABOUR HOUSEHOLDS * * * * * GOVERNMENT OF INDIA MINISTRY OF LABOUR AND EMPLOYMENT LABOUR BUREAU SHIMLA/CHANDIGARH 2010

Welcome message from author
This document is posted to help you gain knowledge. Please leave a comment to let me know what you think about it! Share it to your friends and learn new things together.
Transcript
RURAL LABOUR ENQUIRY (61st
2004–05 Round of N.S.S.)
REPORT ON
WAGES & EARNINGS OF
RURAL LABOUR HOUSEHOLDS * * * * *
GOVERNMENT OF INDIA MINISTRY OF LABOUR AND EMPLOYMENT
LABOUR BUREAU SHIMLA/CHANDIGARH
2010
RURAL LABOUR ENQUIRY (61st
2004–05 Round of N.S.S.)
REPORT ON
WAGES & EARNINGS OF
RURAL LABOUR HOUSEHOLDS * * * * *
GOVERNMENT OF INDIA MINISTRY OF LABOUR AND EMPLOYMENT
LABOUR BUREAU SHIMLA/CHANDIGARH
2010

P R E F A C E The availability of up-to date information on the socio-economic conditions of
agricultural/rural labourers assumes great importance in planning and policy formulation.
The Labour Bureau has, therefore, been conducting all India enquiries on agricultural/rural
labourers through NSSO since 1950-51. The first and second round of agricultural labour
enquiry were conducted in 1950-51 and 1956-57 respectively. In order to collect data
and information on various socio-economic aspects of rural labour households, it was
decided to extend the scope and coverage of Agricultural Labour Enquiry to cover all
Rural Labour Households, including agricultural labour households. Accordingly, eight
Rural Labour Enquiries in 1963-65, 1974-75, 1977-78, 1983, 1987-88, 1993-94, 1999-
2000 and 2004-2005 have so far been conducted by NSSO on rural/agricultural labour.
The data collected during the course of these enquiries are processed by the Labour
Bureau and separate reports on the following aspects are published for each round of the
NSSO.
i) Employment and Unemployment of the Rural Labour Households;
ii) Wages and Earnings of the Rural Labour Households;
iii) Indebtedness among the Rural Labour Households;
iv) General Characteristics of the Rural Labour Households; and
v) Consumption Expenditure of the Rural Labour Households.
The present report brings out the results in respect of ‘Wages and Earnings of
Rural Labour Households in 2004-2005’ on the basis of Eighth Rural Labour Enquiry
conducted by NSSO during 61st
I take this opportunity to express my thanks to the NSSO, particularly the Field
Operations Division and Survey Design & Research Division for conducting field work,
preparation of special tabulation plan and segregation of Rural Labour Enquiry data as
per our requirement. I am also thankful to the officers/officials of the RLE Division
(Annexure-II) for their efforts in preparation of this report.
Round (2004-05) as a part of survey on Employment &
Unemployment. For sake of comparison, statistics pertaining to previous round of Rural
Labour Enquiry conducted during 1999-2000 have also been incorporated in this report
Suggestions for improvement in the contents and presentation of the report are
welcome.
Shimla Dated: 9th
( DR. K.S.R.V.S.CHALAM ) February,2010
DIRECTOR GENERAL
CONTENTS
Page No.
Summary of the Report viii – x
CHAPTER - I Scope and Method of Enquiry
1. Introduction 1
2. Objectives 2
3. Scope 2
4. Geographical Coverage 2
5. Concepts and definitions 2
6. Period of Survey 7
7. Sampling Design and Sample Size 7
8. Estimation Procedure 11
9. Present Report
12
CHAPTER - II Earning Strength of the Labour Households
1. Average Size and Average Earning Strength per Rural and Agricultural Labour Household
14
(i) Rural Labour Households 14
a. All Classes 14
b Scheduled Castes 15
c Scheduled Tribes 15
d Other Backward Classes 16
(ii) Agricultural Labour Households
17

2 Wage Earners per Labour Household 17
(i) Rural Labour Households 17
a. All Classes 17
b Scheduled Castes 18
c Scheduled Tribes 18
d Other Backward Classes 18
(ii) Agricultural Labour Households
19
CHAPTER - III Wages and Earnings
1. Earnings of workers of Rural Labour Households vis-à-vis Agricultural Labour Households
20
2. Average Earnings of Rural Labour Household workers in Agricultural Operations
21
3. Average Earnings of Rural Labour Household workers in Non-agricultural Operations
25
CHAPTER - IV Earnings in Different Agricultural Operations
1. Earnings of Male Workers of Rural Labour Households 29
2. Earnings of Women Workers of Rural Labour Households 33
3. Earnings of Child Workers of Rural Labour Households 36
4. Earnings of Workers of Rural Labour Households and Agricultural Labour Households in Agricultural Operations
39
5. Level of Real Earnings 40
6. Minimum Wages in Agriculture 41
7. Wages in Agriculture vis-à-vis Wages in Factories, Coal Mines & Plantations
41

LIST OF STATEMENTS
Statement No. Description
Page No.
2.1 (a)(i) Average Earning Strength of all Rural Labour Households by sex
42
2.1 (a)(ii) Average Earning Strength of Scheduled Castes Rural Labour Households by sex
43
2.1 (a)(iii) Average Earning Strength of Scheduled Tribes Rural Labour Households by sex
44
2.1 (a)(iv) Average Earning Strength of Other Backward Classes Rural Labour Households by sex
45
2.1 (b)(i) Average Earning Strength of the All Agricultural Labour Households by sex
46
2.1 (b)(ii) Average Earning Strength of Scheduled Castes Agricultural Labour Households by sex
47
2.1 (b)(iii) Average Earning Strength of Scheduled Tribes Agricultural Labour Households by sex
48
2.1 (b)(iv) Average Earning Strength of Other Backward Classes Agricultural Labour Households by sex
49
2.2 (a)(i) Average Number of Wage Earners in Rural Labour Households by sex
50
2.2 (a)(ii) Average Number of Wage Earners in Scheduled Castes Rural Labour Households by sex
51
2.2 (a)(iii) Average Number of Wage Earners in Scheduled Tribes Rural Labour Households by sex
52
2.2 (a)(iv) Average Number of Wage Earners in Other Backward Classes Rtural Labour Households by sex
53

2.2 (b)(i) Average Number of Wage Earners in All Agricultural Labour Households by sex
54
2.2 (b)(ii) Average Number of Wage Earners in Scheduled Castes Agricultural Households by sex
55
2.2 (b)(iii) Average Number of Wage Earners in Scheduled Tribes Agricultural Labour Households by sex
56
2.2 (b)(iv) Average Number of Wage Earners Other Backward Classes Agricultural Labour Households by sex
57
3.1 (a)(i) Average Daily Earnings of Men, Women and Children belonging to All Rural Labour Households in Agricultural Occupations
58
3.1 (a)(ii) Average Daily Earnings of Men, Women and Children belonging to Scheduled Castes Rural Labour Households in Agricultural Occupations
59
3.1 (a)(iii) Average Daily Earnings of Men, Women and Children belonging to Scheduled Tribes Rural Labour Households in Agricultural Occupations
60
3.1 (a)(iv) Average Daily Earnings of Men, Women and Children belonging to Other Backward Classes Rural Labour Households in Agricultural Occupations
61
3.1 (b)(i) Average Daily Earnings of Men, Women and Children belonging to All Agricultural Labour Households in Agricultural Occupations
62
3.1 (b)(ii) Average Daily Earnings of Men, Women and Children belonging to Scheduled Castes Agricultural Labour Households in Agricultural Occupations
63
3.1 (b)(iii) Average Daily Earnings of Men, Women and Children belonging to Scheduled Tribes Agricultural Labour Households in Agricultural Occupations
64
3.1 (b)(iv) Average Daily Earnings of Men, Women and Children belonging to Other Backward Classes Agricultural Labour Households in Agricultural Occupations
65
3.2 (a)(i) Average Daily Earnings of Men, Women and Children belonging to All Rural Labour Households in Non-Agricultural Occupations
66
3.2 (a)(ii) Average Daily Earnings of Men, Women and Children belonging to Scheduled Castes Rural Labour Households in Non-Agricultural Occupations
67
3.2 (a)(iii) Average Daily Earnings of Men, Women and Children belonging to Scheduled Tribes Rural Labour Households in non-agricultural Occupations
68
3.2 (a)(iv) Average Daily Earnings of Men, Women and Children belonging to Other Backward Classes Rural Labour Households in Non-Agricultural Occupations
69
3.2 (b)(i) Average Daily Earnings of Men, Women and Children belonging to All Agricultural Labour Households in Non-Agricultural Occupations
70
3.2 (b)(ii) Average Daily Earnings of Men, Women and Children belonging to Scheduled Castes Agricultural Labour Households in Non-Agricultural Occupations
71
3.2 (b)(iii) Average Daily Earnings of (Men, Women and Children belonging to Scheduled Tribes Agricultural Labour Households in Non-Agricultural Occupations
72
3.2 (b)(iv) Average Daily Earnings of (Men, Women and Children belonging to Other Backward Classes Agricultural Labour Households in Non-Agricultural Occupations
73
4.1 (a)(i)M Average Daily Earnings of Men belonging to All Rural Labour Households in different All Agricultural Occupations
74 – 78
4.1 (a)(ii)M Average Daily Earnings of Men belonging to Scheduled Castes Rural Labour Households in different Agricultural Occupations
79 – 83
4.1 (a)(iii)M Average Daily Earnings of Men belonging to Scheduled Tribes Rural Labour Households in different Agricultural Occupations
84 – 88

4.1 (a)(iv)M Average Daily Earnings of Men belonging to Other Backward Classes Rural Labour Households in different Agricultural Occupations
89 – 93
4.1 (a)(i)W Average Daily Earnings of Women belonging to All Rural Labour Households in different All Agricultural Occupations
94 – 98
4.1 (a)(ii)W Average Daily Earnings of Women belonging to Scheduled Castes Rural Labour Households in different Agricultural Occupations
99 – 103
4.1 (a)(iii)W Average Daily Earnings of Women belonging to Scheduled Tribes Rural Labour Households in different Agricultural Occupations
104 – 108
4.1 (a)(iv)W Average Daily Earnings of Women belonging to Other Backward Classes Rural Labour Households in different Agricultural Occupations
109 – 113
4.1 (a)(i)C Average Daily Earnings of Children belonging to All Rural Labour Households in different Agricultural Occupations
114 – 118
4.1 (a)(ii)C Average Daily Earnings of Children belonging to Scheduled Castes Rural Labour Households in different Agricultural Occupations
119 – 123
4.1 (a)(iii)C Average Daily Earnings of Children belonging to Scheduled Tribes Rural Labour Households in different Agricultural Occupations
124 – 128
4.1 (a)(iv)C Average Daily Earnings of Children belonging to Other Backward Classes Rural Labour Households in different Agricultural Occupations
129 – 133
4.1 (b)(i)M Average Daily Earnings of Men belonging to All Agricultural Labour Households in different agricultural Occupations
134 – 138
4.1 (b)(ii)M Average Daily Earnings of Men belonging to Scheduled Castes Agricultural Labour Households in different Agricultural Occupations
139 – 143
4.1 (b)(iii)M Average Daily Earnings of Men belonging to Scheduled Tribes Agricultural Labour Households in different Agricultural Occupations
144 – 148
4.1 (b)(iv)M Average Daily Earnings of Men belonging to Other Backward Classes Agricultural Labour Households in different Agricultural Occupations
149 – 153
4.1 (b)(i)W Average Daily Earnings of Women belonging to All Agricultural Labour Households in different Agricultural Occupations
154 – 158
4.1 (b)(ii)W Average Daily Earnings of Women belonging to Scheduled Castes Agricultural Labour Households in different Agricultural Occupations
159 – 163
4.1 (b)(iii)W Average Daily Earnings of Women belonging to Scheduled Tribes Agricultural Labour Households in different Agricultural Occupations
164 – 168
4.1 (b)(iv)W Average Daily Earnings of Women belonging to Other Backward Classes Agricultural Labour Households in different Agricultural Occupations
169 – 173
4.1 (b)(i)C Average Daily Earnings of Children belonging to All Rural Labour Households in different Agricultural Occupations
174 – 178
4.1 (b)(ii)C Average Daily Earnings of Children belonging to Scheduled Castes Agricultural Labour Households in different Agricultural Occupations
179 – 183
4.1 (b)(iii)C Average Daily Earnings of Children belonging to Scheduled Tribes Agricultural Labour Households in different Agricultural Occupations
184 – 188
4.1 (b)(iv)C Average Daily Earnings of Children belonging to Other Backward Classes Agricultural Labour Households in different Agricultural Occupations
189 – 193
4.2 Average Daily Real Earnings of Men belonging to Agricultural Labour Households in Agricultural Operations
194
4.3 Average Daily Real Earnings of Men in Agricultural Operations vis-a-vis the Minimum wages in Agriculture fixed under the Minimum wages Act, 1948
195
4.4 Average Daily Earnings in Agricultural Occupations vis-a-vis those in other sectors of economy
196
Annexure - I Main findings of various Rural Labour Enquiries 197 – 201 Annexure - II
List of Officers/Officials associated with the Report
202


RURAL LABOUR ENQUIRY REPORT ON WAGES AND EARNINGS OF RURAL LABOUR HOUSEHOLDS
(2004-05)
1. INTRODUCTION SUMMARY
1.1 Rural Labour Enquiries conducted at regular interval on a quinquennial basis alongwith general ‘Employment & Unemployment’ surveys of the NSSO provide necessary data inputs required for planning. The main objective of the Rural Labour Enquiry is to provide upto date serial data for building up of reliable estimates of important socio-economic characteristics of rural labour households. However provision has been made in the tabulation plan to get separate estimates for agricultural labour households. 1.2 The data collected under these enquiries pertain to demographic structure, extent of employment and unemployment, wages and earnings, households consumption expenditure, indebtedness, etc. Data relating to consumption expenditure for derivation of weighting diagrams for updating the series of CPI Nos. separately for rural and agricultural labourers is generated. The results of the eighth Rural Labour Enquiry for which data was collected by NSSO in its 61st
round during the period July,2004 to June, 2005 are being published in five separate reports covering:
i) Employment and Unemployment of Rural Labour Households; ii) Wages and Earnings of Rural Labour Households; iii) Indebtedness of Rural Labour Households; iv) General Characteristics of Rural Labour Households; and v) Consumption Expenditure of Rural Labour Households.
2. SCOPE AND METHOD OF ENQUIRY 2.1 The enquiry relates to all rural labour households. However, provision had been made to get separate estimates for agricultural labour households. The survey covered whole of Indian Union, except Leh & Kargil Districts of state of Jammu & Kashmir, interior villages of Nagaland and inaccessible villages of Andaman & Nicobar Islands. 2.2 A stratified multi stage design had been adopted. The first stage selection was done from census villages and the second stage selection was done from the rural households. A total of 8128 villages in 28 states and 7 union territories were selected out of which only 7999 villages could be surveyed by covering 79306 households and 3,98,025 persons.

2.3 Period of survey was July, 2004 to June, 2005, spread over 4 sub rounds of three months duration each. 2.4 The entire data has been tabulated by 4 social groups i.e. scheduled castes, scheduled tribes, other backward classes and all classes. These have also been further subdivided by age and sex. 3 WAGES & EARNINGS OF RURAL LABOUR HOUSEHOLDS 3.1 The present report on ‘Wages and Earnings of Rural Labour Households (2004-05) is the second among all the five reports to be published by Labour Bureau. The gist of the findings of this report are summarised below. 3.2 The 2004-05 survey revealed a decline in the average household size of all classes of Rural Labour Households over the previous survey by 2.36 percent (4.56 from 4.67) at All-India level. The earning strength also declined from 1.98 to 1.96 during the period. In case of Scheduled Castes Labour Households a decrease in household size was registered 0.43 percent (4.66 to 4.64) and in earning strength by 1.52 percent (1.98 to 1.95). The household size of Other Backward Classes households showed a decrease of 2.39 percent (4.61 to 4.50) and in earning strength by 0.51 percent (1.97 to 1.96). However, the highest fall in household size by 4.65 percent 4.73 to 4.51) among all the section of the social setup was noticed among Scheduled Tribes Households.
(Statements 2.1(a)(i) – 2.1(a)(iv).
3.3 The similar details in respect of agricultural labour households, which is the main segment of rural labour households, revealed 3.23 percent fall in household size (4.65 to 4.50) with the corresponding decrease by 0.49 percent in earning strength (2.04 to 2.03) of all classes of households. Scheduled Tribes households registered the highest decrease of 5.16 percent (4.65 to 4.41) with 2.60 percent fall in earning strength. The scheduled castes households reported the downward movement in household size by 1.51 percent (4.64 to 4.57) while the earning strength remained constant. The household size of Other Backward Classes decreased by 3.47 percent (4.61 to 4.45) alongwith 0.98 percent (2.05 to 2.03) decrease in earning strength was also observed.
(Statements 2.1(b)(i) – 2.1(b)(iv).
3.4 The average number of wage earners per rural labour household during 2004-05 was 1.73 persons of all classes of Rural Labour Households at All-India level. This has decreased by 0.57 percent over 1999-2000 survey. In case of Scheduled Castes Households the wage earners decreased over the previous survey by 1.67 percent (i.e. 1.80 to 1.77). Among all the four sections of the society the highest decrease of wage
earners per rural labour households was 3.98 percent in Scheduled Tribe Households over 1999-2000 (i.e.2.01 to 1.43), whereas it decreased by 1.16 percent in respect of Other Backward Classes households(1.73 to 1.71).
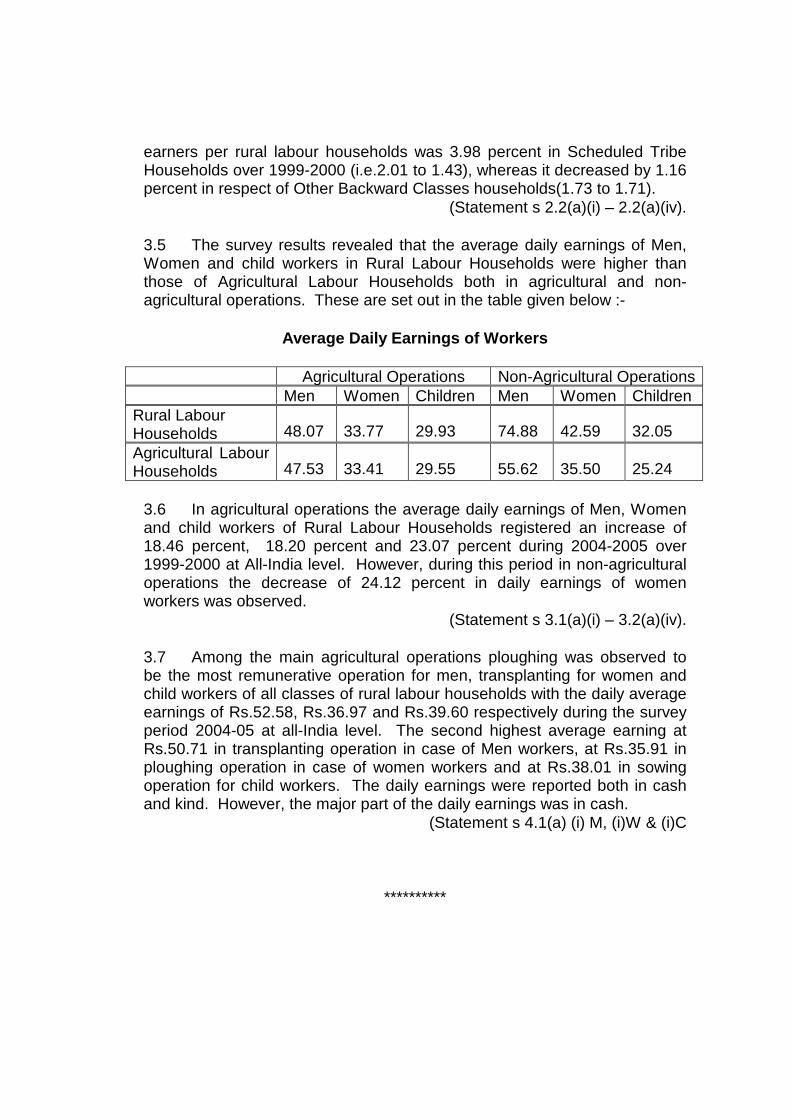
(Statement s 2.2(a)(i) – 2.2(a)(iv). 3.5 The survey results revealed that the average daily earnings of Men, Women and child workers in Rural Labour Households were higher than those of Agricultural Labour Households both in agricultural and non-agricultural operations. These are set out in the table given below :-
Average Daily Earnings of Workers
Agricultural Operations Non-Agricultural Operations Men Women Children Men Women Children Rural Labour Households 48.07 33.77 29.93 74.88 42.59 32.05 Agricultural Labour Households 47.53 33.41 29.55 55.62 35.50 25.24
3.6 In agricultural operations the average daily earnings of Men, Women and child workers of Rural Labour Households registered an increase of 18.46 percent, 18.20 percent and 23.07 percent during 2004-2005 over 1999-2000 at All-India level. However, during this period in non-agricultural operations the decrease of 24.12 percent in daily earnings of women workers was observed.
(Statement s 3.1(a)(i) – 3.2(a)(iv). 3.7 Among the main agricultural operations ploughing was observed to be the most remunerative operation for men, transplanting for women and child workers of all classes of rural labour households with the daily average earnings of Rs.52.58, Rs.36.97 and Rs.39.60 respectively during the survey period 2004-05 at all-India level. The second highest average earning at Rs.50.71 in transplanting operation in case of Men workers, at Rs.35.91 in ploughing operation in case of women workers and at Rs.38.01 in sowing operation for child workers. The daily earnings were reported both in cash and kind. However, the major part of the daily earnings was in cash.
(Statement s 4.1(a) (i) M, (i)W & (i)C
**********

1
CHAPTER - I
SCOPE AND METHOD OF ENQUIRY
1. INTRODUCTION
1.1 India is a land of villages as around two-third of the total labour force in the country lives in rural areas. Wage paid employment is the main source of their livelihood. It has been the endeavour of the Government of India to alleviate poverty, particularly in the rural areas, by formulating and implementing various target oriented anti-poverty rural development programmes. For formulating appropriate policies and programmes, sound data base is of utmost importance. Government of India had recognised the need for sound data base during early years of independence itself and conducted first Agricultural Labour Enquiry (ALE) in 1950-51, followed by the second Enquiry in 1956-57. Thereafter, the scope of the subsequent enquiries was enlarged to cover all rural labour households, instead of agricultural labour households alone covered in the first two enquiries. Hence, the third enquiry in the series known as the ‘first Rural Labour Enquiry (RLE)’ was conducted in 1963-65 followed by the second in 1974-75, the third in 1977-78, the fourth in 1983, the fifth in 1987-88, the sixth in 1993-94, the seventh in 1999-2000 and the eighth in 2004–05. With a view to narrowing down the gap between the successive rounds of the Enquiries, the RLE was integrated with the General Employment & Unemployment Survey of the NSSO in 1977-78 and all subsequent enquiries are now being conducted quinquennially to provide continuous data in the form of time series.
1.2 During the course of the Rural Labour Enquiries, data on various socio-economic aspects viz, Employment & Unemployment; Consumption Expenditure; Wages & Earnings; and Indebtedness of rural and agricultural labourers are collected by Field Operation Division (FOD) of National Sample Survey Organisation(NSSO) through its network of Zonal, regional and sub-regional offices located all over the Country. Under these enquiries, the data are collected and analysed for rural labour as a whole. However, in order to enable comparison with the previous rounds of enquiries and also to understand problems of this segment, which constitutes bulk of the rural labour, the analysis are presented for agricultural labour separately. The Labour Bureau is responsible for processing and disseminating data, collected under RLE, on General Characteristics, Indebtedness, Wages and Earnings, Consumer Expenditure and Employment & Unemployment of the Rural Labour Households. The results of the latest Rural Labour Enquiry, the eighth in the series, for which the field work was undertaken by the NSSO (FOD) during its 61st Round Survey (July, 2004 to June, 2005), are being published in the following five reports :-
i) Employment and Unemployment of Rural Labour Households;
ii) Wages and Earnings of Rural Labour Households;
iii) Indebtedness among Rural Labour Households;
iv) General Characteristics of Rural Labour Households; and
v) Consumption Expenditure of Rural Labour Households.
2
1.3 The usefulness of the data thrown up by the Rural Labour Enquiries has been acknowledged by various Committees and Commissions from time to time. The National Commission on Labour (1969) and the National Commission on Rural Labour (1991) have recommended that the periodic surveys undertaken by the Government to understand the rural situation should be continued and intensified. The second National Commission on Labour (1999) has recommended that the Rural Labour Enquiries should be conducted more frequently. 2. OBJECTIVES
2.1 The main objectives of the enquiry are :
i) To provide up-to-date serial data on demographic structure, extent of employment & unemployment, wages and earnings, household consumption expenditure, indebtedness, etc. for building up of reliable estimates of important socio-economic characteristics of rural labour in general and agricultural labour in particular.
ii) To provide data relating to consumption expenditure for derivation of weighting diagrams for updating the series of CPI numbers for agricultural and rural labourers.
3. SCOPE:
The Rural Labour Enquiry relates to all rural labour households. However, provision has been made in the tabulation plan to get separate estimates for agricultural labour households and rural labour households.
4. GEOGRAPHICAL COVERAGE
The survey covered the whole of the Indian Union, except (i) Leh (Ladakh) and Kargil districts of Jammu & Kashmir, (ii) interior villages of Nagaland situated beyond 5 Kms. of the bus route, and (iii) villages in Andaman & Nicobar Islands which are inaccessible throughout the year.
5. CONCEPTS AND DEFINITIONS The important concepts and definitions adopted for the survey are as follows :-
(i) HOUSEHOLD
A household is a group of persons normally living together and taking food from a common kitchen. A boarding and lodging house, a hotel or a hostel is treated as a cluster of households where each individual boarder(with his dependants or guests) forms a separate household. Households maintained and fed directly by institutional bodies such as those in prisons, police quarters, cantonments, hospitals, asylums, relief camps are, however, excluded from the scope of the survey.
(ii) HOUSEHOLD MEMBERS
Any person who is a normal resident of the sample household is considered to be a member of the household. The members of a household may or may not be related by

3
blood to one another. Accordingly, any person who usually lives and takes the principal meals with the household is also considered a member of the household.
(iii) HOUSEHOLD SIZE
The number of normally resident members of a household formed the size of the household. It included temporary stay-aways but excluded temporary visitors and guests.
(iv) RURAL LABOUR HOUSEHOLD
A household was classified as a rural labour household if its major source of income during the last 365 days preceding the survey was more from wage paid manual labour (agricultural and/or non-agricultural) than either from paid non-manual employment or from self-employment. Rural labour households include agricultural labour households also.
(v) AGRICULTURAL LABOUR HOUSEHOLD
Of the households which are initially classified as `Rural Labour Households’, those deriving 50 percent or more of their total income from wage paid manual labour in agricultural activities are treated as agricultural labour households.
(vi) RURAL LABOUR HOUSEHOLDS WITH CULTIVATED LAND
A household with cultivated land, either owned or taken on lease, was treated as household with land. Cultivated land was taken to mean the net area sown during the last calendar year (i.e. July to June) preceding the year of enquiry and included orchards and current fallows.
(vii) LAND POSSESSED
Land possessed means land ‘owned’ (including land under ‘owned-like possession’) and includes land ‘leased in’ but excludes land ‘leased out’ and any land held by the household which is neither owned nor leased in (e.g. encroached land etc.).
(viii) MANUAL WORK
A job essentially involving physical labour is considered as manual work. However, jobs essentially involving physical labour but also requiring a certain level of general, professional, scientific or technical education are not to be termed as manual work. On the other hand, jobs not involving much of physical labour and at the same time not requiring much educational background, are to be treated as manual work. Thus, engineers, doctors, dentists, midwives, etc. are not considered as manual workers even though their jobs involve some amount of physical labour. But, peons, chowkidars, watchmen, etc., are considered as manual workers even though their work may not involve much physical labour.
(ix) WAGE PAID MANUAL LABOUR
A person who does manual work in return for wages in cash or kind or partly in cash and partly in kind (excluding exchange labour) is a wage paid manual labour. Salaries are also to be counted as wages. A person who is self-employed in manual work is not treated as a wage paid manual labour.
4
(x) RURAL LABOUR
A Rural Labourer is defined as ‘one who does manual work in rural areas in agricultural and/or non-agricultural occupation in return for wages in cash or kind, or partly in cash and partly in kind.’ The term ‘wages’ included salary also. Any person who was self employed, though in manual work, was not treated as a wage paid manual rural labourer. Exchange labour was also excluded.
(xi) AGRICULTURAL LABOUR
A person was treated as an agricultural labourer if he/she followed one or more of the following agricultural occupations in the capacity of a labourer on hire, whether paid wholly in cash or kind or partly in cash and partly in kind;
(a) farming including cultivation, tillage, etc.
(b) dairy farming;
(c) production, cultivation, growing and harvesting of any horticultural commodity;
(d) raising of livestock, bee-keeping or poultry farming;
(e) any practice performed on a farm as incidental to or in conjunction with farm operations (including any forestry or timbering) and the preparation for market and delivery to storage or to market or to carriage for transportation to market of farm products.
It might be noted that manual work in fisheries was excluded from the purview of
the category of agricultural labour. Further, carriage for transportation coming under the category (e) above, referred only to the first stage of transportation from farm to the first stage of disposal. (xii) WAGE AND SALARY EARNINGS
Information on wage and salary earnings was collected separately for each of the wage/salaried work recorded for a person in a day. Here, earnings refer to the wage/salary income (and not total earnings taking into consideration of all other activities done) received/receivable for the wage/salaried work done during the reference week by a wage/salaried employee and casual labourer. The wage/salary received or receivable may be in cash or kind or partly in cash and partly in kind. While recording the earnings following conventions were followed.
a) The wages in kind were evaluated at the current retail price.
b) Bonus and perquisites such as free accommodation, reimbursement of expenditure for medical treatment, free telephones, etc. evaluated at the cost of the employer or at retail prices and duly apportioned for the reference week were also included in earnings.
c) Amount receivable as ‘over-time’ for the additional work done beyond normal working time was excluded.
It may be noted that in the survey, at most two activities could be recorded for a
person in a day. Therefore, it is possible that a person might have carried out two or more

5
wage/salaried activities in a day, but only one activity or two activities at the most, depending upon the time spent on those activities, was recorded. In that case, the wage/salary income only from that activity(s) was collected and recorded separately, and not the total income of the person from all the activities done for the entire day.
(xiii) ECONOMIC ACTIVITY
The entire spectrum of human activity falls into two categories – economic
activities and non-economic activities. Any activity resulting in production of goods and services that adds value to national product was considered as an economic activity for the employment and unemployment survey of NSS 61st round. Such activities included production of all goods and services for market (i.e. for pay or profit) including those of government services, and, the production of primary commodities for own consumption and own account production of fixed assets. (xiv) USUAL OCCUPATION
The usual occupation of a person was the economic activity which he may be pursuing during the major part of the 365 days preceding the date of survey. (xv) ACTIVITY STATUS
It is the activity situation in which a person was found during the reference period with regard to the person’s participation in economic and non-economic activities. According to this, a person could be in one or a combination of the following three broad activity statuses during a reference period:
a) working or being engaged in economic activity (work) as defined above,
b) being not engaged in economic activity ( work) but either making tangible efforts to seek ’work’ or being available for ‘work’ if the ‘work’ is available, and
c) being not engaged in any economic activity (work) and also not available for ‘work’.
Broad activity statuses mentioned in (I) and (ii) above are associated with ‘being in
labour force’ and the last with ’not being in the labour force’. Within the labour force, broad activity status (I) & (ii) were associated with ‘employment‘ and ‘unemployment’ respectively.
(xvi) WORKERS (OR EMPLOYED) Persons who were engaged in any economic activity or who, despite their attachment to economic activity, abstained from work for reason of illness, injury or other physical disability, bad weather, festivals, social or religious functions or other contingencies necessitating temporary absence from work constituted ‘workers’. Unpaid helpers who assisted in the operation of an economic activity in the household farm or non-farm activities were also considered as workers. (xvii) SEEKING OR AVAILABLE FOR WORK (OR UNEMPLOYED) Persons, who owing to lack of work, had not worked but either sought work through employment exchanges, intermediaries, friends or relatives or by making applications to prospective employers or expressed their willingness or availability for

6
work under the prevailing condition or work and remunerations, were considered as those who were ‘seeking or available for work’ (or unemployed). (xviii) LABOUR FORCE Persons who were either ‘working’ (or employed) or ‘seeking or available for work’ (or unemployed) during the reference period together constitute the ‘labour force’. Persons who were neither ‘working’ and at the same time nor ‘seeking or available for work’ for various reasons during the reference period were considered to be ‘out of labour force’. The persons under this category are students, those engaged in domestic duties, rentiers, pensioners, recipients of remittances, those living on alms, infirm or disabled persons, too young or too old persons, prostitutes, etc. and casual labourers not working due to sickness. (xix) SELF-EMPLOYED
Persons who operated their own farm or non-farm enterprises or were engaged
independently in a profession or trade on own-account or with one or a few partners were deemed to be self-employed in household enterprises. The essential feature of the self-employed is that they have autonomy (i.e., how, where and when to produce) and economic independence (i.e., market, scale of operation and money) for carrying out their operation. The remuneration received by them comprised two parts – share of their labour and profit of the enterprise. In other words, their remuneration was determined wholly or mainly by sales or profits of the goods or services which were produced. Self-employed persons were categorised as follows:
a) Own-account workers: those self-employed persons who operated their
enterprises on their own account or with one or a few partners and who, during the reference period, by and large, ran their enterprise without hiring any labour. They could, however, have had unpaid helpers to assist them in the activity of the enterprise;
b) Employers: those self-employed persons who worked on their own account or
with one or a few partners and, who, by and large, ran their enterprise by hiring labour; and
c) Helpers in household enterprise: those self-employed persons (mostly family
members) who were engaged in their household enterprises, working full or part time and did not receive any regular salary or wages in return for the work performed. They did not run the household enterprise on their own but assisted the related person living in the same household in running the household enterprise.
(xx) REGULAR SALARIED/WAGE EMPLOYEES
Persons working in other’s farm or non-farm enterprises, both household and non-household and getting in return salary or wages on a regular basis (and not on the basis of daily or periodic renewal of work contract) are the ’regular salaried/wage employees’. This category not only includes persons getting time wage but also persons receiving piece rate wage salary and paid apprentices, both full time and part-time.
(xxi) CASUAL LABOUR A person casually engaged in other’s farm or non-farm enterprises (both
household and non household) and getting in return wage according to the terms of the

7
daily or periodic work contract is a ‘casual labour’. Depending on whether they are so employed in ‘public works’ sponsored by government agencies or local bodies or in other types of work, the casual workers are classified into two groups viz. casual labour in public works and casual workers in other types of work. (xxii) CHILDREN
Persons below 15 years of age have been treated as children.
6. PERIOD OF SURVEY The enquiry was integrated with the 61st Round of the N.S.S. during the period 1st July, 2004 to 30th June, 2005, which was divided into 4 sub-rounds each of three months duration. 7. SAMPLING DESIGN AND SAMPLE SIZE 7.1 Outline of sampling design: A stratified multi-stage sampling design has been adopted for the 61st round survey. The first stage units (FSU) are the 2001 census villages in the rural sector and Urban Frame Survey (UFS) blocks in the urban sector. The ultimate stage units (USU) are households in both the sectors. In the case of large villages/blocks requiring hamlet-group (hg)/sub-block (sb) formation, one intermediate stage is the selection of two hgs/sbs from each FSU. 7.2 Sampling Frame for First Stage Units: For the rural sector, the list of 2001 census villages (panchayat wards for Kerala) constitutes the sampling frame. For the urban sector, the list of latest available Urban Frame Survey (UFS) blocks has been considered as the sampling frame. 7.3 Stratification: Within each district of a State/UT, two basic strata have been formed: i) rural stratum comprising of all rural areas of the district and (ii) urban stratum comprising of all the urban areas of the district. However, if there are one or more towns with population 10 lakhs or more as per population census 2001 in a district, each of them will also form a separate basic stratum and the remaining urban areas of the district will be considered as another basic stratum. There are 27 towns with population 10 lakhs or more at all-India level as per census 2001. 7.4 Sub-stratification 7.4.1 Rural sector: If ‘r’ be the sample size allocated for a rural stratum, the number of sub-strata formed is ‘r/2’. The villages within a district as per frame have been first arranged in ascending order of population. Then sub-strata 1 to ‘r/2’ have been demarcated in such a way that each sub-stratum comprises a group of villages of the arranged frame and has more or less equal population. 7.5 Total sample size (FSUs): 12784 FSUs have been allocated at all-India level on the basis of Investigator strength in different States/UTs for central sample and 14992 for state sample. 7.6 Allocation of total sample to States and UTs: The total number of sample FSUs is allocated to the States and UTs in proportion to population as per census 2001 subject to the availability of Investigators ensuring more or less uniform work-load.

8
7.7 Allocation of State/UT level sample to rural and urban sectors: State/UT level sample size is allocated between two sectors in proportion to population as per census 2001 with 1.5 weightage to urban sector subject to the restriction that urban sample size for bigger states like Maharashtra, Tamil Nadu etc. should not exceed the rural sample size. A minimum of 8 FSUs has been allocated to each state/UT separately for rural and urban areas. 7.8 Allocation to strata: Within each sector of a State/UT, the respective sample size is allocated to the different strata in proportion to the stratum population as per census 2001. Allocations at stratum level have been adjusted to a multiple of 4 with a minimum sample size of 4. 7.9 Selection of FSUs: Two FSUs have been selected from each sub-stratum of a district of rural sector with Probability Proportional to Size With Replacement (PPSWR), size being the population as per Population Census 2001. For urban sector, two FSUs have been selected from each sub-stratum by using Simple Random Sampling Without Replacement (SRSWOR). Within each sub-stratum, samples have been drawn in the form of two independent sub-samples in both the rural and urban sectors.
7.10 Selection of hamlet-groups/sub-blocks/households 7.10.1 Criterion for hamlet-group/sub-block formation: Large villages/blocks having approximate present population of 1200 or more will be divided into a suitable number (say, D) of ‘hamlet-groups’ in the rural sector and ‘sub-blocks’ in the urban sector as stated below.
approximate present population of the sample village/block
no. of hgs/sbs to be formed (D)
less than 1200 (no. hamlet-groups/sub-blocks) 1
1200 to 1799 3
1800 to 2399 4
2400 to 2999 5
3000 to 3599 6
..…….…………..and so on
For rural areas of Himachal Pradesh, Sikkim and Poonch, Rajouri, Udhampur, Doda districts of Jammu and Kashmir and Idukki district of Kerala, the number of hamlet-groups formed is as follows.
approximate present population of the sample village
no. of hgs to be formed
less than 600 (no hamlet-groups) 1
600 to 899 3
900 to 1199 4
1200 to 1499 5
.………..and so on

9
Two hamlet-groups/sub-blocks are selected from a large village/UFS block wherever
hamlet-groups/sub-blocks have been formed, by SRSWOR. Listing and selection of the households are done independently in the two selected hamlet-groups/sub-blocks. In case hamlet-groups/sub-blocks are to be formed in the sample FSU, the same would be done by more or less equalizing population.
7.11 Formation of Second Stage Strata and allocation of households
For both Schedule 1.0 and Schedule 10, households listed in the selected village/block/ hamlet-groups/sub-blocks are stratified into three second stage strata (SSS) as given below.
The three second-stage-strata (SSS) in the rural sector are formed in the following order:-
SSS 1: relatively affluent households
SSS 2: from the remaining households, households having principal earning from non-agricultural activity
SSS 3: other households The number of households to be surveyed in each FSU is 10 for each of the schedules 1.0 and 10. Composition of SSS with number of households to be surveyed for both schedule 1.0 and schedule 10 are as follows:
SSS composition of SSS no. of hhs to be surveyed
without hg/sb formation
with hg/sb formation (for each hg/sb)
SSS 1: relatively affluent households 2 1
SSS 2: of the rest, households having principal earning from non- agricultural activity
4 2
SSS 3: other households 4 2
7.12. Selection of households for Schedules 1.0 and 10: From each SSS the sample households for both the schedules are selected by SRSWOR. If a household is selected both for schedule 1.0 and schedule 10, only schedule 1.0 would be canvassed in that household and the sample household for schedule 10 would be replaced by next household in the frame for schedule 10. 7.13 SAMPLE SIZE A total of 3,98,025 persons belonging to 79,306 households spread over 7,999 villages were surveyed. The number of sample villages, households and persons surveyed in different States/Union Territories and all-India for rural sector are set out in the following table :-

10
TABLE
NUMBER OF VILLAGES, ALLOTTED AND SURVEYED AND RURAL HOUSEHOLDS /PERSONS SURVEYED IN DIFFERENT STATES/UTs
Sl.No. State/U.T. No. of villages allottted
No. of villages surveyed
No.of House-holds surveyed
No.of persons
1 2. 3. 4. 5. 6. 1 Andhra Pradesh 556 556 5550 22591 2 Arunachal Pradesh 156 156 1502 7409 3 Assam 340 335 3349 17182 4 Bihar 436 436 4354 23591 5 Chhattisgarh 200 200 1999 10643 6 Delhi 8 8 57 246 7 Goa 16 16 160 677 8 Gujarat 232 232 2318 11552 9 Haryana 168 168 1679 9250
10 Himachal Pradesh 216 216 2145 10263 11 Jammu & Kashmir 288 190 1887 10772 12 Jharkhand 240 239 2378 12454 13 Karnataka 288 288 2880 13665 14 Kerala 368 368 3298 14319 15 Madhya Pradesh 384 384 3838 21120 16 Maharashtra 504 504 5023 24276 17 Manipur 220 220 2177 10969 18 Meghalaya 116 116 1159 5664 19 Mizoram 80 80 800 4001 20 Nagaland 96 96 960 4847 21 Orissa 384 384 3835 18755 22 Punjab 244 244 2433 13184 23 Rajasthan 356 356 3543 19887 24 Sikkim 92 92 920 4036 25 Tamil Nadu 416 416 4160 16028 26 Tripura 176 176 1760 8078 27 Uttaranchal 148 148 1464 7334 28 Uttar Pradesh 792 792 7872 47330 29 West Bengal 500 500 4988 24282 30 A & N Islands 52 28 269 1174 31 Chandigarh 8 8 80 394 32 D & N Haveli 16 16 160 720 33 Daman & Diu 8 8 80 342 34 Lakshadweep 8 7 69 351 35 Pondicherry 16 16 160 639
All-India 8,128 7,999 79306 3,98,025

11
8. ESTIMATION PROCEDURE 8.1 Notations: The following notations were used in the estimation procedure of 61st Round: s = subscript for s-th stratum t = subscript for t-th sub-stratum m = subscript for sub-sample (m =1, 2) i = subscript for i-th FSU [village (panchayat ward) / block] d = subscript for a hamlet-group/sub-block (d = 1, 2) j = subscript for j-th second stage stratum in an FSU/ hg/sb ( j = 1, 2 or 3)
k = subscript for k-th sample household under a particular second stage stratum within an FSU/ hg/sb
D = total number of hg’s/sb’s formed in the sample village (panchayat ward) / block
D* = 1 if D = 1 = D / 2 for FSUs with D > 1 N = total number of FSUs in any urban sub-stratum Z = total size of a rural sub-stratum (= sum of sizes for all the FSUs of a rural sub-stratum) z = size of sample village used for selection. n = number of sample village / block surveyed including zero cases but excluding casualty
for a particular sub-sample and sub-stratum. H = total number of households listed in a second-stage stratum of a village/block/hamlet-
group/sub-block of sample FSU h = number of households surveyed in a second-stage stratum of a village/block/hamlet-
group/sub-block of sample FSU x, y = observed value of characteristics x, y under estimation
X , Y = estimate of population total X, Y for the characteristics x, y
Under the above symbols,
ystmidjk = observed value of the characteristic y for the k-th household in the j-th second stage stratum of the d-th hg/sb (d = 1, 2) of the i-th FSU belonging to the m-th sub-sample for the t-th sub-stratum of s-th stratum;
However, for ease of understanding, a few symbols have been suppressed in following paragraphs where they are obvious.
8.2 Formulae for Estimation of Aggregates for a particular sub-sample and
stratum in Rural sector:
12
Schedules 1.0 and 10:
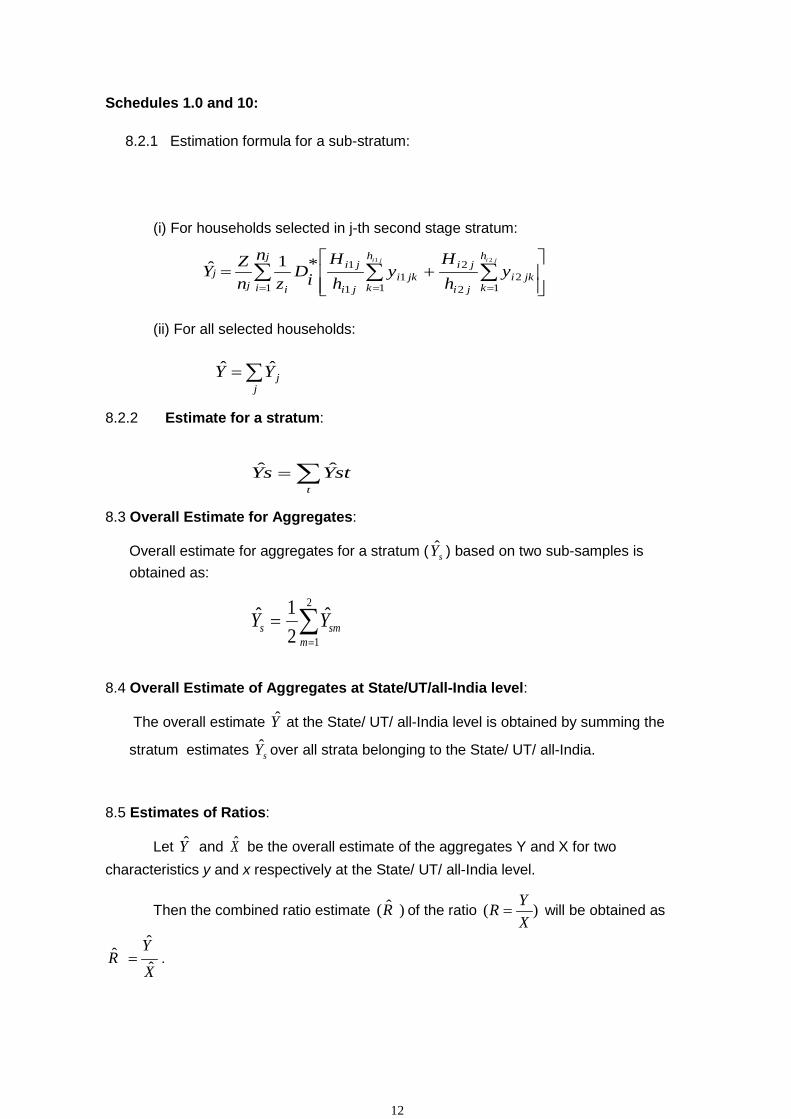
8.2.1 Estimation formula for a sub-stratum:
(i) For households selected in j-th second stage stratum:
∑ ∑∑= ==
+=
j
i
h
kjki
ji
jih
kjki
ji
ji
ijj
ny
hH
yhH
iDzn
ZYjiji
1 12
2
2
11
1
1 21*1ˆ
(ii) For all selected households:
∑=j
jYY ˆˆ
8.2.2 Estimate for a stratum:
∑=t
stYsY ˆˆ
8.3 Overall Estimate for Aggregates:
Overall estimate for aggregates for a stratum ( sY ) based on two sub-samples is obtained as:
∑=
=2
1
ˆ21ˆ
msms YY
8.4 Overall Estimate of Aggregates at State/UT/all-India level:
The overall estimate Y at the State/ UT/ all-India level is obtained by summing the
stratum estimates sY over all strata belonging to the State/ UT/ all-India.
8.5 Estimates of Ratios:
Let Y and X be the overall estimate of the aggregates Y and X for two characteristics y and x respectively at the State/ UT/ all-India level.
Then the combined ratio estimate )ˆ(R of the ratio )(XYR = will be obtained as
X
YR ˆ
ˆˆ = .

13
9. PRESENT REPORT This is the second report in the series of five reports to be brought out on the basis of eighth RLE covering different aspects of rural labour households. It presents analysis of data on the wages and earnings of rural labour households. It contains the basic results on wages and earnings of workers of Rural Labour Households at state and all-India level. It gives (a) earning strength and the number of wage earners in the average size of Rural Labour Households; (b) data on wages and earnings of agricultural labour households workers in agricultural and non-agricultural operations; (c) earnings of workers (men, women and children) of agricultural labour households and rural labour households in different agricultural operations; (d) level of real earnings in agricultural operations during 2004-2005; and (e) comparison of wages of agricultural labour household workers with Minimum Wages fixed by the State Governments for agricultural operations as well as with wages paid to workers in organised sector (viz factories, mines & plantations). A comparative picture of the main findings of the various Rural Labour Enquiries conducted so far is given in Annexure. - I
*****************
14
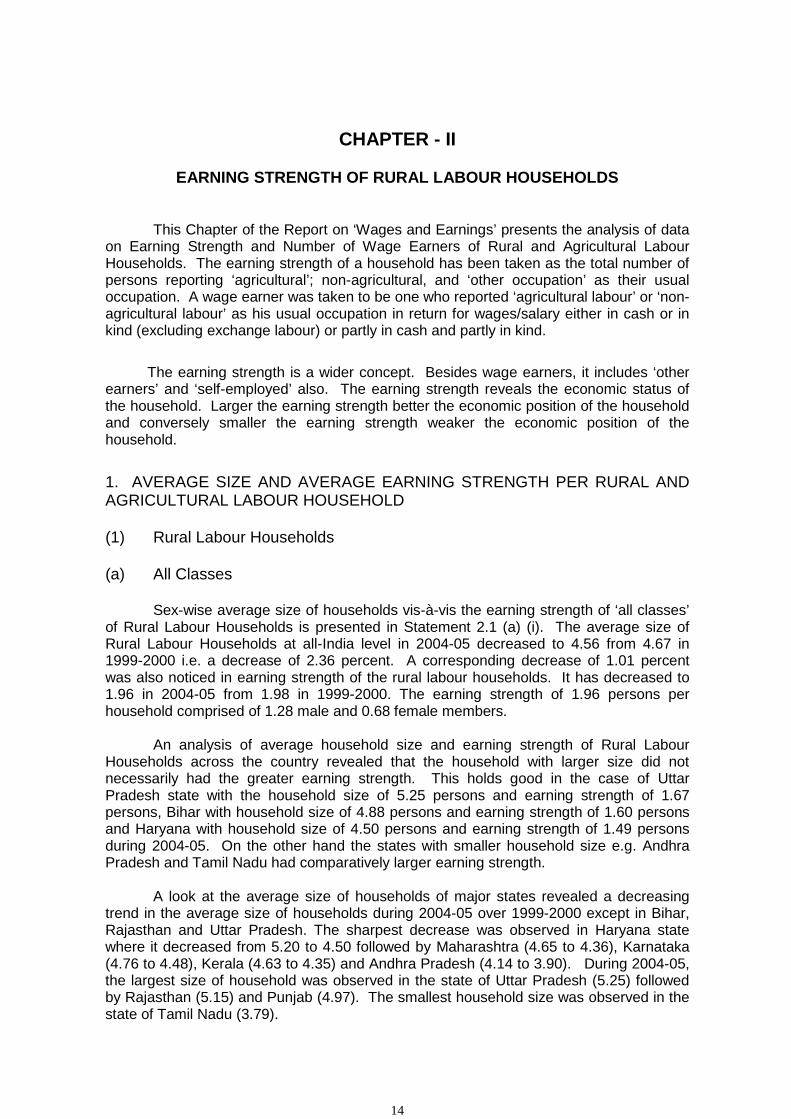
CHAPTER - II
EARNING STRENGTH OF RURAL LABOUR HOUSEHOLDS This Chapter of the Report on ‘Wages and Earnings’ presents the analysis of data on Earning Strength and Number of Wage Earners of Rural and Agricultural Labour Households. The earning strength of a household has been taken as the total number of persons reporting ‘agricultural’; non-agricultural, and ‘other occupation’ as their usual occupation. A wage earner was taken to be one who reported ‘agricultural labour’ or ‘non-agricultural labour’ as his usual occupation in return for wages/salary either in cash or in kind (excluding exchange labour) or partly in cash and partly in kind.
The earning strength is a wider concept. Besides wage earners, it includes ‘other
earners’ and ‘self-employed’ also. The earning strength reveals the economic status of the household. Larger the earning strength better the economic position of the household and conversely smaller the earning strength weaker the economic position of the household.
1. AVERAGE SIZE AND AVERAGE EARNING STRENGTH PER RURAL AND AGRICULTURAL LABOUR HOUSEHOLD (1) Rural Labour Households
(a) All Classes
Sex-wise average size of households vis-à-vis the earning strength of ‘all classes’ of Rural Labour Households is presented in Statement 2.1 (a) (i). The average size of Rural Labour Households at all-India level in 2004-05 decreased to 4.56 from 4.67 in 1999-2000 i.e. a decrease of 2.36 percent. A corresponding decrease of 1.01 percent was also noticed in earning strength of the rural labour households. It has decreased to 1.96 in 2004-05 from 1.98 in 1999-2000. The earning strength of 1.96 persons per household comprised of 1.28 male and 0.68 female members.
An analysis of average household size and earning strength of Rural Labour
Households across the country revealed that the household with larger size did not necessarily had the greater earning strength. This holds good in the case of Uttar Pradesh state with the household size of 5.25 persons and earning strength of 1.67 persons, Bihar with household size of 4.88 persons and earning strength of 1.60 persons and Haryana with household size of 4.50 persons and earning strength of 1.49 persons during 2004-05. On the other hand the states with smaller household size e.g. Andhra Pradesh and Tamil Nadu had comparatively larger earning strength.
A look at the average size of households of major states revealed a decreasing
trend in the average size of households during 2004-05 over 1999-2000 except in Bihar, Rajasthan and Uttar Pradesh. The sharpest decrease was observed in Haryana state where it decreased from 5.20 to 4.50 followed by Maharashtra (4.65 to 4.36), Karnataka (4.76 to 4.48), Kerala (4.63 to 4.35) and Andhra Pradesh (4.14 to 3.90). During 2004-05, the largest size of household was observed in the state of Uttar Pradesh (5.25) followed by Rajasthan (5.15) and Punjab (4.97). The smallest household size was observed in the state of Tamil Nadu (3.79).

15
Average size of the household and average earning strength may not be directly
correlated. In states of Bihar, Rajasthan and Uttar Pradesh with the slight increase in average household size the earning strength declined in 2004-05 as compared to 1999-2000. In Bihar it decreased from 1.72 persons to 1.60 persons. The number of both male and female workers reported the decline. In case of Bihar the decrease of 0.12 person i.e. from 1.72 to 1.60, was more significant as the average household size had increased by 0.04 persons (4.88 from 4.84) during 2004-05 over 1999-2000. During 2004-05, the highest earning strength was reported from Karnataka (2.41) followed by Gujarat (2.29) and Madhya Pradesh (2.26). Andhra Pradesh reported a very high proportion of female earning strength (45.41%), followed by Maharashtra (45%) and Karnataka (43.57%).
The results of other States/UT’s showed a mixed trend. The highest fall in the average household size from 5.05 to 3.89 was noticed in the case of Nagaland during 2004-05 over the previous survey. As regards earnings strength it also showed downward trend from 1.80 to 1.70 persons. In case of Lakshadweep, the household size increased from 3.81 to 5.30 persons and the earning strength increased from 1.52 to 2.82 persons. In Chhattisgarh state, the proportion of females in earning strength was as high as 44.86%. Many small states/UTs e.g. Arunachal Pradesh (4.19 to 3.98), Chhattisgarh (4.96 to 4.92), Goa (4.82 to 4.40) Jharkhand (4.76 to 4.67), Mizoram (4.22 to 3.90), Sikkim (4.57 to 3.58), Tripura (4.30 to 4.29), Uttaranchal (4.99 to 4.97), A & N Islands (4.20 to 4.11), Chandigarh (2.83 to 1.90), D & N Haveli (4.48 to 3.88), Delhi (4.14 to 3.58) and Pondicherry (4.02 to 3.65) reported a decline in average household size over the previous survey. (b) Scheduled Castes
The details of average household size and earning strength of Scheduled Castes Rural Labour Households is presented in Statement 2.1 (a) (ii). At the national level the average size of Scheduled Castes Rural Labour Households showed an decrease of 0.43 percent during 2004-05 over 1999-2000 survey results whereas the earning strength decreased by 1.52 percent.
The largest size of household was observed in Uttar Paradesh (5.25) followed by the Rajasthan (5.19) and Punjab (5.09) during 2004-05. The average household size of all states except Assam (4.86 to 5.01); Bihar (4.68 to 4.70), Gujarat (4.77 to 5.04), Maharashtra (4.53 to 4.55), Orissa (4.41 to 4.71) and Uttar Pradesh (5.13 to 5.25) reported decrease in 2004-05 as compared to 1999-2000. The earning strength also decreased in many states viz; Andhra Pradesh (2.36 to 2.33); Assam (1.87 to 1.77); Bihar (1.83 to 1.68); Haryana (1.58 to 1.48); Karnataka (2.55 to 2.50); Kerala (2.06 to 1.73);Madhya Pradesh (2.15 to 2.10); Tamil Nadu (2.08 to 2.01) and Uttar Pradesh (1.78 to 1.77). During 2004-05, Karnataka had the highest earning strength of 2.50 followed by Gujarat (2.37) and Andhra Pradesh (2.33). In case of other states/UTs. highest increase in earning strength was in respect of Uttranchal (1.44 to 2.09) followed by Goa (1.51 to 1.99). In the case of Jammu & Kashmir the average Household size increased from 3.94 to 5.09 persons while earning strength decreased from 1.50 to 1.45 persons and in respect of Goa the average household size decreased from 5.08 to 3.97 persons while earning strength increased from 1.51 to 1.99 persons. (c) Scheduled Tribes
The average household size and earning strength of Scheduled Tribes Rural Labour Households are given in Statement 2.1(a) (iii). The average household size and earning strength at national level has registered a decrease of 4.65 percent and 1.75

16
percent respectively during 2004-05 over 1999-2000. The decrease in earning strength (2.28 to 2.24) was mainly due to decrease in the number of female earners from 0.97 to 0.94.
The analysis of average household size and earning strength revealed a decrease in the household sizes of a large number of states in 2004-05 over 1999-2000. The average household size of all states except Kerala (3.84 to 4.09), Rajasthan (5.24 to 5.29) and Tamil Nadu (3.64 to 4.05) reported decrease in 2004-05 as compared to 1999-2000. The decline of 1.18 persons in household size was the highest in Uttar Pradesh state from 5.11 to 3.93 persons. Rajasthan reported maximum household size of 5.29 persons followed by Madhya Pradesh (5.02) and Gujarat (4.91) in 2004-05. The lowest size of household was reported from Bihar (3.25). The states which showed a decline in the number of earning strength were Andhra Pradesh (2.41 to 2.12), Assam (1.61 to 1.56), Bihar (2.13 to 1.23), Kerala (2.08 to 1.68), Orissa (2.05 to 1.97), Uttar Pradesh (1.69 to 1.38) and West Bengal (2.14 to 1.79). In case of Kerala although the household size increased by 0.25 persons yet earning strength registered a steep fall of 0.40 persons. During 2004-05, the highest earning strength was observed in Gujarat (2.61) and the lowest in the Bihar (1.23).
Among the other states/UT’s, Lakshadweep registered the highest increase in
household size by 2.07 persons (4.38 to 6.45) with corresponding increase in earning strength of 1.40 persons (1.62 to 3.02). Nagaland showed a decrease in household size from 5.22 to 3.89 and earning strength from 1.87 to 1.70. Sikkim also revealed the decline in household size by 1.00 persons (4.87 to 3.87) but registered an increase in earning strength by 0.28 persons (1.54 to 1.82) during 2004-05 over 1999-2000.
(d) Other Backward Classes
Statement 2.1(a)(iv) depicts the Household size and Earning Strength of ‘Other Backward Classes’ of the Rural Labour Households. At national level the average size of Other Backward Classes Rural Labour Households showed a decrease of 2.39 percent during 2004-05 over 1999-2000 survey results whereas the earning strength also declined by 0.51 percent..
The largest size of household was observed in Uttar Pradesh (5.23) followed by
the Bihar (5.06) and Rajasthan (5.02) during 2004-05. The analysis of average household size and earning strength revealed a decrease in the household sizes of a large number of states in 2004-05 over 1999-2000 except Bihar (4.99 to 5.06), Punjab (4.66 to 4.76) and Uttar Pradesh (5.05 to 5.23). The decline of 1.02 persons in household size was the highest in Haryana State. The lowest size of households was reported from Tamil Nadu (3.72). the states which showed an increase in the number of earning strength were Assam (1.96 to 2.14), Haryana (1.34 to1.55), Karnataka (2.29 to 2.33), Madhya Pradesh (2.12 to 2.16), Orissa (1.64 to 1.81), Punjab (1.43 to 1.54) and Tamil Nadu (1.98 to 1.99).
The results of other states/UT’s showed a mixed trend. The highest fall in the
average household size from 4.25 to 1.00 was noticed in the case of Arunachal Pradesh during 2004-05 over the previous survey. However, as regard earning strength it showed upward trend from 0.78 to 1.00 persons. In case of Lakshadweep, the household size and the earning strength both increased from 1.00 to 2.52 persons. In Chhattisgarh state the proportion of female in earning strength was as high as 46.34%. Many small states/UTs e.g. Sikkim (4.76 to 3.70), Uttranchal (5.94 to 4.98), D & N Haveli (3.48 to 2.27), Daman & Diu (4.29 to 4.05), Delhi (4.02 to 2.25) and Pondicherry (3.98 to 3.59) reported a decline in average household size over the previous survey.
17
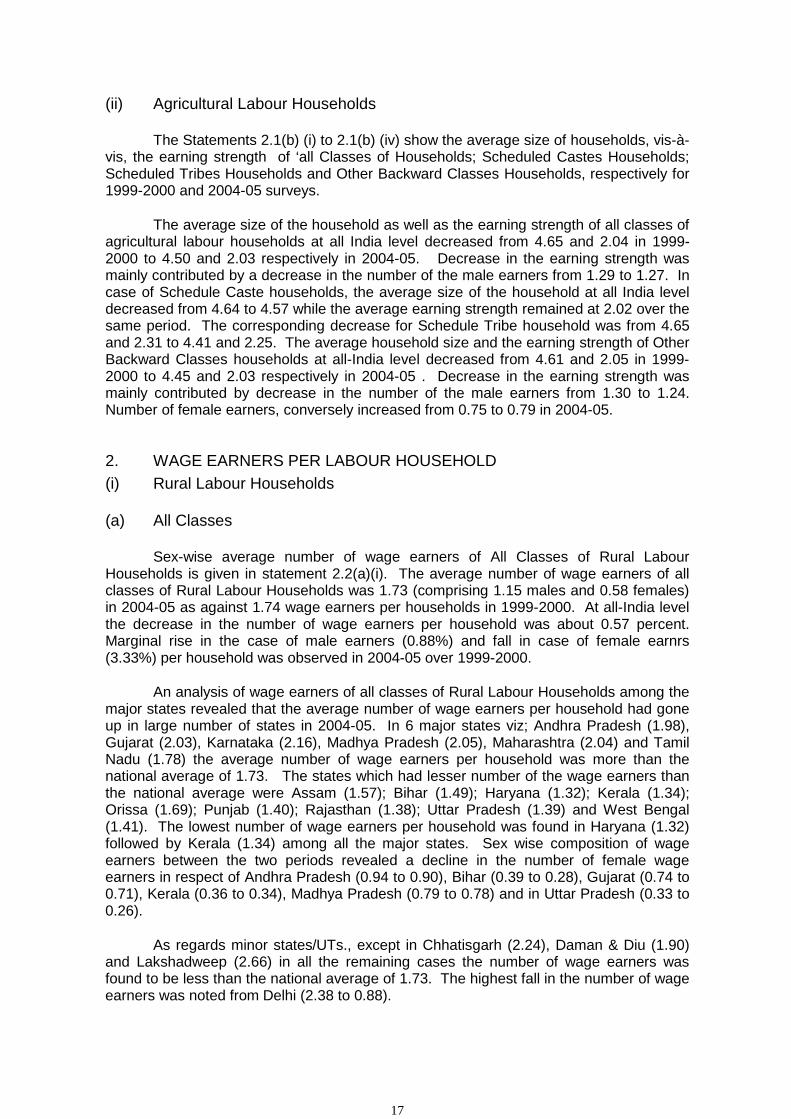
(ii) Agricultural Labour Households
The Statements 2.1(b) (i) to 2.1(b) (iv) show the average size of households, vis-à-vis, the earning strength of ‘all Classes of Households; Scheduled Castes Households; Scheduled Tribes Households and Other Backward Classes Households, respectively for 1999-2000 and 2004-05 surveys.
The average size of the household as well as the earning strength of all classes of
agricultural labour households at all India level decreased from 4.65 and 2.04 in 1999-2000 to 4.50 and 2.03 respectively in 2004-05. Decrease in the earning strength was mainly contributed by a decrease in the number of the male earners from 1.29 to 1.27. In case of Schedule Caste households, the average size of the household at all India level decreased from 4.64 to 4.57 while the average earning strength remained at 2.02 over the same period. The corresponding decrease for Schedule Tribe household was from 4.65 and 2.31 to 4.41 and 2.25. The average household size and the earning strength of Other Backward Classes households at all-India level decreased from 4.61 and 2.05 in 1999-2000 to 4.45 and 2.03 respectively in 2004-05 . Decrease in the earning strength was mainly contributed by decrease in the number of the male earners from 1.30 to 1.24. Number of female earners, conversely increased from 0.75 to 0.79 in 2004-05.
2. WAGE EARNERS PER LABOUR HOUSEHOLD (i) Rural Labour Households
(a) All Classes
Sex-wise average number of wage earners of All Classes of Rural Labour Households is given in statement 2.2(a)(i). The average number of wage earners of all classes of Rural Labour Households was 1.73 (comprising 1.15 males and 0.58 females) in 2004-05 as against 1.74 wage earners per households in 1999-2000. At all-India level the decrease in the number of wage earners per household was about 0.57 percent. Marginal rise in the case of male earners (0.88%) and fall in case of female earnrs (3.33%) per household was observed in 2004-05 over 1999-2000.
An analysis of wage earners of all classes of Rural Labour Households among the
major states revealed that the average number of wage earners per household had gone up in large number of states in 2004-05. In 6 major states viz; Andhra Pradesh (1.98), Gujarat (2.03), Karnataka (2.16), Madhya Pradesh (2.05), Maharashtra (2.04) and Tamil Nadu (1.78) the average number of wage earners per household was more than the national average of 1.73. The states which had lesser number of the wage earners than the national average were Assam (1.57); Bihar (1.49); Haryana (1.32); Kerala (1.34); Orissa (1.69); Punjab (1.40); Rajasthan (1.38); Uttar Pradesh (1.39) and West Bengal (1.41). The lowest number of wage earners per household was found in Haryana (1.32) followed by Kerala (1.34) among all the major states. Sex wise composition of wage earners between the two periods revealed a decline in the number of female wage earners in respect of Andhra Pradesh (0.94 to 0.90), Bihar (0.39 to 0.28), Gujarat (0.74 to 0.71), Kerala (0.36 to 0.34), Madhya Pradesh (0.79 to 0.78) and in Uttar Pradesh (0.33 to 0.26).
As regards minor states/UTs., except in Chhatisgarh (2.24), Daman & Diu (1.90)
and Lakshadweep (2.66) in all the remaining cases the number of wage earners was found to be less than the national average of 1.73. The highest fall in the number of wage earners was noted from Delhi (2.38 to 0.88).

18
(b) Scheduled Castes
Sex-wise average number of wage earners of Scheduled Castes Rural Labour Households is given in Statement 2.2(a).(ii). At the national level, during 2004-05 the average number of wage earners worked out to 1.77 persons consisting of 1.20 males and 0.57 female as against 1.80; 1.18, and 0.62 respectively in 1999-2000 survey. In percentage terms the decrease during 2004-05 over the previous survey was 1.67.
A look at the major states revealed that the highest number of wage earners was
in Karnataka (2.30) followed by Gujarat (2.25), Andhra Pradesh (2.18) and Maharashtra (2.09). The states of Assam (1.53 to 1.51), Bihar (1.76 to 1.61), Haryana (1.44 to 1.38), Karnataka, (2.35 to 2.30), Kerala (1.88 to 1.55), Tamil Nadu (1.93 to 1.86) and Uttar Pradesh (1.57 to 1.53) showed downward trend during 2004-05 in the number of wage earners as compared to the previous survey. The states of Andhra Pradesh (1.03 to 1.00), Bihar (0.49 to 0.37), Kerala (0.64 to 0.53) and Uttar Pradesh (0.43 to 0.33) reported decrease in number of female wage earners during 2004-05 as compared to 1999-2000. The over all decrease in number of wage earners in these states was due to decrease in the number of the female wage earners.
(c) Scheduled Tribes
Average number of the wage earners belonging to Scheduled Tribes Rural Labour Households is presented in Statement 2.2 (a) (iii). During 2004-05 the average number of wage earners of Scheduled Tribes Rural Labour Households at all-India level stood at 1.93 persons which was largest among all social groups viz; all classes of household (1.73); scheduled castes (1.77), and other backward classes households (1.71). The highest number of wage earners was in Tamil Nadu (2.37) followed by Karnataka (2.32); Gujarat (2.30); Maharashtra (2.28), and Madhya Pradesh (2.23). In all other major states the average number of wage earners was less than the all-India level. The highest decline in average number of wage earners was observed in Bihar (43.15%). Study of sex wise composition of wage earners amongst the major states revealed that male earners per household were more in all the states except in Tamil Nadu.
Among the minor states/UTs. Chhattisgarh, Daman & Diu (2.20) and
Lakshadweep (3.02) were the only states where the number of wage earners turned out to be more than the all-India average of 1.93. All other States/UTs. showed lesser number of wage earners than the national average. In Himachal Pradesh and Lakshadweep the number of wage earners per household increased by 85.45% and 88.75% respectively over the previous survey. An interesting feature observed in States of Mizoram and Nagaland was that there was no case of female wage earners in the households of these states.
(d) Other Backward Classes
Statement 2.2 (a) (iv) depicts the average number of wage-earners per household in other backward classes of Rural Labour Households by sex. The average number of Other Backward Classes Rural Labour Households, at all India level, during 2004-05 was 1.71 constituting 1.11 males and 0.60 females as against 1.73 of 1999-2000 comprising 1.13 males and 0.60 females. The number of wage earners per household has gone down by 1.16% in 2004-05 over 1999-2000. The average number of Other Backward Classes Rural Labour Households wage earners (1.71) in 2004-05 was lower than the average of Rural Labour Households for all classes (1.73), scheduled castes (1.77) and scheduled tribes (1.93) during 2004-05.

19
An analysis of data for 2004-05 revealed that the highest number of wage earners per household was reported from Maharasthra (2.07), followed by Karnataka (2.06) and Andhra Pradesh (2.01). The states which had lesser number of the wage earners than the national average were Bihar (1.41), Haryana (1.24), Kerala (1.32), Orissa (1.56), Punjab (1.45), Rajasthan (1.27), Uttar Pradesh (1.27) and West Bengal (1.32). The lowest number of wage earners per household was found in Haryana (1.24) followed by Rajasthan (1.27) and Uttar Pradesh (1.27) among all the major state. Sex wise composition of wage earners between the two periods revealed a decline in the number of female wage earners in respect of Bihar (0.32 to 0.22), Kerala (0.30 to 0.27), Maharashtra (1.01 to 0.96), Rajasthan (0.29 to 0.22), Uttar Pradesh (0.22 to 0.19) and West Bengal (0.25 to 0.23).
As regards minor states/UTs., except in Chhattisgarh (2.29) and Lakshadweep
(1.83) in all the remaining cases the number of wage earners was found to be less than the national average of 1.71. No female wage earner was found in the households of Arunachal Pradesh, Himachal Pradesh, Jammu & Kashmir, D & N Haveli, Delhi and Lakshadweep. The highest fall in the number of wage earners was noted from Delhi (2.60 to 0.71).
(ii) Agricultural Labour Households
The data on the average number of wage earners per household of Agricultural Labour Households in respect of all the four groups of households viz; all-classes; scheduled castes; scheduled tribes, and other backward classes households is presented in Statements 2.2 (b)(i) to 2.2 (b)(iv). The Agricultural Labour Households constituted around 80 percent of the Rural Labour Households.
All-India level results in respect of all the four sections showed that during 2004-05
the largest number of wage earners was found in scheduled tribes households (2.03) followed by scheduled castes (1.87), all-classes (1.84) and other backward classes households (1.83). These results were in consonance with those of Rural Labour Households.
During 2004-05 the number of wage earners of all classes of households of major
states had declined in case of Andhra Pradesh (2.10 to 2.05), Assam (1.75 to 1.73), Bihar (1.64 to 1.52), Kerala (1.52 to 1.45), Madhya Pradesh (2.10 to 2.08), Rajasthan (1.59 to 1.45), Tamil nadu (1.91 to 1.90 ) and Uttar Pradesh (1.49 to 1.38). The decline in the number of wage earners was also noticed in the scheduled castes households of Assam (2.03 to 1.66), Bihar (1.78 to 1.63), Karnataka (2.40 to 2.32), Kerala (1.91 to 1.59), Madhya Pradesh (2.02 to 2.00), Tamil Nadu (2.01 to 1.93) and Uttar Pradesh (1.59 to 1.52). A similar decline was also observed in the number of the wage earners of Scheduled Tribes Households in Andhra Pradesh (2.22 to 1.89), Assam (1.59 to 1.27), Bihar (2.03 to 1.24), Kerala (1.92 to 1.57), Madhya Pradesh (2.26 to 2.25), Orissa ( 1.86 to 1.77), Punjab (1.33 to 1.00), Rajasthan (2.07 to 1.40), Uttar Pradesh (1.56 to 1.40) and West Bengal (2.14 to 1.60) and decline in the number of wage earners was also noticed in Other Backward Classes households in Andhra Pradesh (2.10 to 2.07), Bihar (1.55 to 1.46), Gujarat (1.99 to 1.91), Madhya Pradesh (1.98 to 1.94), Maharashtra (2.20 to 2.19), Rajasthan (1.44 to 1.36), Uttar Pradesh (1.38 to 1.30) and West Bengal (1.27 to 1.20).
.
20
CHAPTER -III
WAGES AND EARNINGS
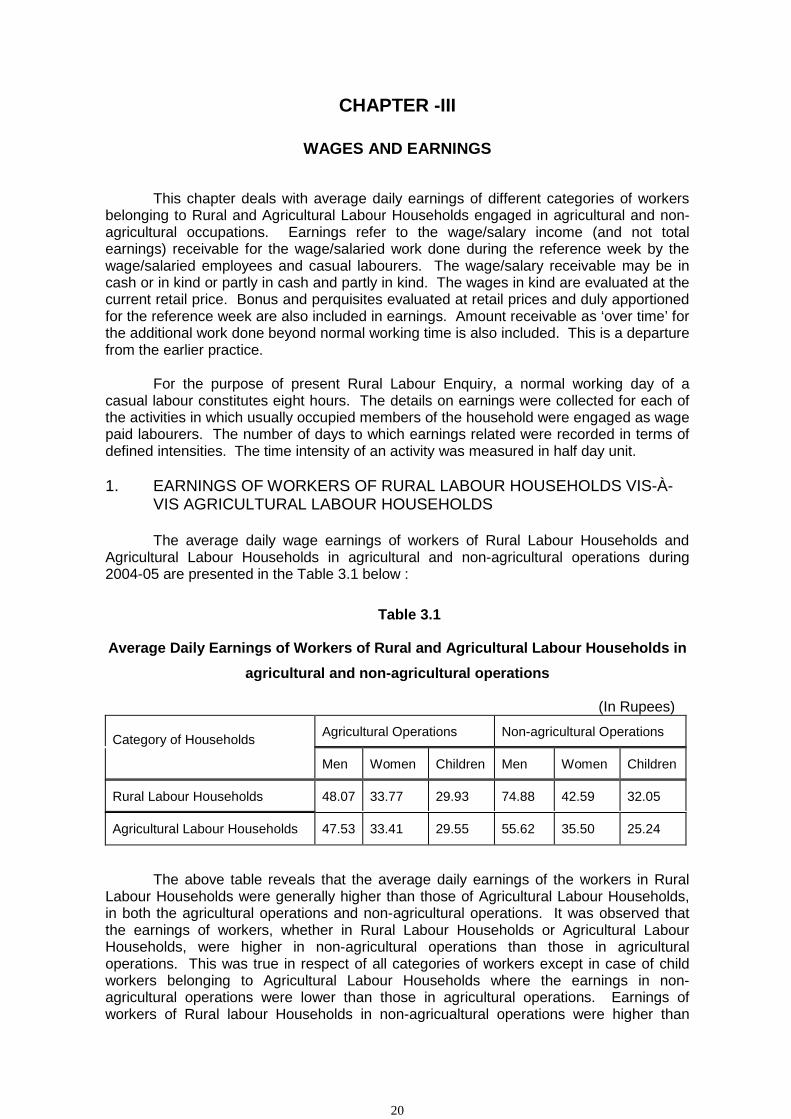
This chapter deals with average daily earnings of different categories of workers belonging to Rural and Agricultural Labour Households engaged in agricultural and non-agricultural occupations. Earnings refer to the wage/salary income (and not total earnings) receivable for the wage/salaried work done during the reference week by the wage/salaried employees and casual labourers. The wage/salary receivable may be in cash or in kind or partly in cash and partly in kind. The wages in kind are evaluated at the current retail price. Bonus and perquisites evaluated at retail prices and duly apportioned for the reference week are also included in earnings. Amount receivable as ‘over time’ for the additional work done beyond normal working time is also included. This is a departure from the earlier practice. For the purpose of present Rural Labour Enquiry, a normal working day of a casual labour constitutes eight hours. The details on earnings were collected for each of the activities in which usually occupied members of the household were engaged as wage paid labourers. The number of days to which earnings related were recorded in terms of defined intensities. The time intensity of an activity was measured in half day unit. 1. EARNINGS OF WORKERS OF RURAL LABOUR HOUSEHOLDS VIS-À-
VIS AGRICULTURAL LABOUR HOUSEHOLDS The average daily wage earnings of workers of Rural Labour Households and Agricultural Labour Households in agricultural and non-agricultural operations during 2004-05 are presented in the Table 3.1 below :
Table 3.1
Average Daily Earnings of Workers of Rural and Agricultural Labour Households in agricultural and non-agricultural operations
(In Rupees)
Category of Households Agricultural Operations Non-agricultural Operations
Men Women Children Men Women Children
Rural Labour Households 48.07 33.77 29.93 74.88 42.59 32.05
Agricultural Labour Households 47.53 33.41 29.55 55.62 35.50 25.24
The above table reveals that the average daily earnings of the workers in Rural Labour Households were generally higher than those of Agricultural Labour Households, in both the agricultural operations and non-agricultural operations. It was observed that the earnings of workers, whether in Rural Labour Households or Agricultural Labour Households, were higher in non-agricultural operations than those in agricultural operations. This was true in respect of all categories of workers except in case of child workers belonging to Agricultural Labour Households where the earnings in non-agricultural operations were lower than those in agricultural operations. Earnings of workers of Rural labour Households in non-agricualtural operations were higher than
21
those in agricultural operations by 55.77% for men, 26.12% for women and 7.08% for children. The respective figures for men and women belonging to Agricultural Labour Households were 17.02% and 6.26% respectively. The highest earnings were observed in case of men workers followed by women and children both in Rural Labour Households and Agricultural Labour Households.
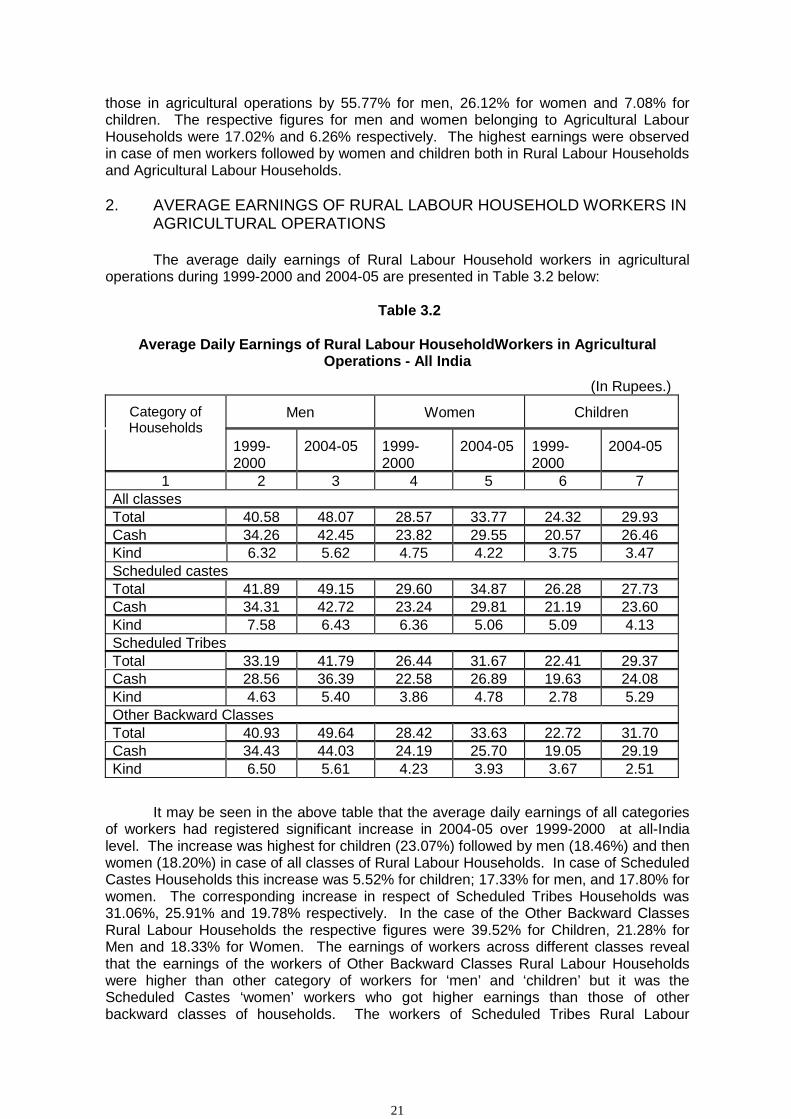
2. AVERAGE EARNINGS OF RURAL LABOUR HOUSEHOLD WORKERS IN
AGRICULTURAL OPERATIONS The average daily earnings of Rural Labour Household workers in agricultural operations during 1999-2000 and 2004-05 are presented in Table 3.2 below:
Table 3.2
Average Daily Earnings of Rural Labour HouseholdWorkers in Agricultural Operations - All India
(In Rupees.)
Category of Households
Men Women Children
1999-2000
2004-05 1999-2000
2004-05 1999-2000
2004-05
1 2 3 4 5 6 7 All classes Total 40.58 48.07 28.57 33.77 24.32 29.93 Cash 34.26 42.45 23.82 29.55 20.57 26.46 Kind 6.32 5.62 4.75 4.22 3.75 3.47 Scheduled castes Total 41.89 49.15 29.60 34.87 26.28 27.73 Cash 34.31 42.72 23.24 29.81 21.19 23.60 Kind 7.58 6.43 6.36 5.06 5.09 4.13 Scheduled Tribes Total 33.19 41.79 26.44 31.67 22.41 29.37 Cash 28.56 36.39 22.58 26.89 19.63 24.08 Kind 4.63 5.40 3.86 4.78 2.78 5.29 Other Backward Classes Total 40.93 49.64 28.42 33.63 22.72 31.70 Cash 34.43 44.03 24.19 25.70 19.05 29.19 Kind 6.50 5.61 4.23 3.93 3.67 2.51
It may be seen in the above table that the average daily earnings of all categories of workers had registered significant increase in 2004-05 over 1999-2000 at all-India level. The increase was highest for children (23.07%) followed by men (18.46%) and then women (18.20%) in case of all classes of Rural Labour Households. In case of Scheduled Castes Households this increase was 5.52% for children; 17.33% for men, and 17.80% for women. The corresponding increase in respect of Scheduled Tribes Households was 31.06%, 25.91% and 19.78% respectively. In the case of the Other Backward Classes Rural Labour Households the respective figures were 39.52% for Children, 21.28% for Men and 18.33% for Women. The earnings of workers across different classes reveal that the earnings of the workers of Other Backward Classes Rural Labour Households were higher than other category of workers for ‘men’ and ‘children’ but it was the Scheduled Castes ‘women’ workers who got higher earnings than those of other backward classes of households. The workers of Scheduled Tribes Rural Labour
22
Households had however, the lowest average daily earning among the four classes of households. The analysis of mode of payment of earnings revealed that the proportion of payments in kind decreased in case of male, female and child workers of all classes of Rural Labour Households when compared to previous enquiry. Similar trend was observed in case of workers of Scheduled Castes and Other Backward Classes Households. However, the proportion of kind payment had increased for all the three categories of workers of Scheduled Tribe Households. Among different categories of workers, the sharpest decline in the proportion of payment in kind was observed from 15.42% to 11.59% for all classes, from 19.37% to 14.89% for Scheduled Castes and 16.15% to 7.92% for Other Backward Classes in case of children belonging to all the three classes of households during 2004-05. However the earnings of the children belonging to Scheduled Tribes Rural Labour Households increased from 12.40% to 18.01% during 2004-05.
(a) All Classes
The average daily earnings of `men’, `women’ and child workers belonging to All classes of Rural Labour Households engaged in agricultural operations by states for 2004-05 and 1999-2000 have been presented in Statement 3.1(a) (i). Among the major states the highest daily earnings of male workers during 2004-05 were observed in Kerala (Rs.121.81) followed by Haryana (Rs.72.18) and Punjab (Rs.71.46). The lowest earnings were observed in Madhya Pradesh (Rs.34.64). In Andhra Pradesh (Rs.45.94), Bihar (Rs.43.42), Gujarat (Rs.45.90), Karnataka (Rs.43.79), Madhya Pradesh (Rs.34.64), Maharashtra (Rs.44.56), Orissa (Rs.39.63) and West Bengal (Rs.45.57) the average daily earnings of male workers were less than the All India average (Rs.48.07). Female workers of Kerala engaged in agricultural operations in Rural Labour Households reported the highest daily earnings of Rs.73.53 followed by Haryana Rs.61.27 and Punjab Rs.53.71. The lowest average daily earnings for female workers were reported in Maharashtra (Rs.27.41). The states of Andhra Pradesh (Rs.29.98), Karnataka (Rs.30.62), Madhya Pradesh (Rs.28.59), Maharashtra (Rs.27.41) and Orissa (Rs.28.05) reported daily earnings below the national average of Rs.33.77. Assam reported the highest average daily earnings of child workers in agricultural operations (Rs.60.28) followed by Haryana (Rs.48.71) and Punjab (Rs.44.27). Madhya Pradesh experienced lowest daily earnings of child workers of Rs.27.26 as also observed in the case of men workers. In Andhra Pradesh (Rs.27.83), Karnataka (Rs.28.01), Madhya Pradesh (Rs.27.26) and Maharashtra (Rs.28.39), the average daily earning of child workers were less than the national average of Rs.29.93. A look at the percentage change of average daily earnings of male, female and child workers of Rural Labour Households in agricultural operations in 2004-05 over 1999-2000 reflected that the earnings of all categories of workers had increased in all the states except the states of Punjab, Arunachal Pradesh and Uttranchal in case of women workers and in the states of Punjab, West Bengal and Jharkhand in the case of child workers where some decline in the earnings were recorded. For male workers of Rural Labour Households the rise in average daily earnings was the highest in Orissa (38.13%) followed by Assam (33.27%), Kerala (28.87%), Uttar Pradesh (26.51%) and Bihar (23.70%) in the case of major states. For minor states/UTs for male workers the increase was as high as 110.55% in Arunachal Pradesh followed by 76.44% in Sikkim, 66.97% in Andman & Nicobar Islands and 40.01% in Dadar & Nagar Haveli which may be the result of thin sample size in these states/UTs. The percentage increase in average daily earnings in case of female workers of major states was the highest in Assam (38.08%) followed by Rajasthan (32.87%), Uttar Pradesh (30.77%), Orissa (25.72%), and Bihar (20.99%). In case of minor states/UTs, the increase was as high as (99.02%) in Andman & Nicobar Islands followed by Dadar & Nagar Haveli (79.62%) and Sikkim (79.22%). Similarly in major states the child workers witnessed a maximum increase in average earnings in Rajasthan (84.21%) followed by
23
Assam (83.56%), Orissa (63.82%), Karnataka (40.12%), Bihar (35.74%), Uttar Pradesh (35.24%) and Maharashtra (34.11%). The earnings received by male, female and child workers in all the states were both in cash and in kind but major part of it was in cash.
The daily earnings of male workers of all classes revealed that 48.80% of the total
earnings in Bihar; 27.26% in Haryana; 25.92% in Madhya Pradesh; 34.41% in Chhatisgarh; 24.23% in Himachal Pradesh; 18.53% in Jammu & Kashmir; 27.90% in Daman & Diu, and 37.50% in Delhi were paid in kind. The daily earnings of male workers of all classes revealed that in the states of Manipur, Mizoram, Nagaland and Chandigarh they received their entire daily earnings in cash. The proportion of the payment in kind in the total earnings of woman workers was as high as 65.17% in Bihar, 74.66% in Haryana, 40.24% in Uttar Pradesh, 35.80% in Chhattisgarh, 37.51% in Daman & Diu, 24.17% in Dadar & Nagar Haveli, 20.40% in Himachal Pradesh, 28.99% in Pondicherry, 20.91% in Punjab and 22.91% in Rajasthan while Goa, Manipur, and A & N Islands they received their entire daily earnings in cash.
(b) Scheduled Castes
The average daily earnings of the Scheduled Castes Rural Labour Households engaged in agricultural occupations have been presented in Statement 3.1(a)(ii). The average daily earnings of men, women and children belonging to the Scheduled Castes Rural Labour Households engaged in agricultural operations increased in almost all the States/Union Territories, in 2004-05 over 1999-2000 except in Gujarat for male workers, in Punjab & Uttranchal for female workers and Andhra Pradesh, Gujarat, Orissa, Punjab and Jharkhand for child workers where a marginal decrease in the earnings was reported. Amongst major states of the country the earnings of male workers during 2004-05 were the highest in the State of Kerala (Rs.116.02) followed by Haryana (Rs.72.30). In Andhra Pradesh (Rs.45.36), Bihar (Rs.43.40), Gujarat (Rs.44.59), Karnataka (Rs.44.73), Madhya Pradesh (Rs.37.09), Maharashtra (Rs.44.25), Orissa (Rs.41.37), Uttar Pradesh (Rs.47.68), and West Bengal (Rs.45.60) the daily earnings of male workers were lower than the all-India average of Rs.49.15. In the case of minor states/Union Territories the states of Chhattisgarh (Rs.29.98), Jharkhand (Rs.42.22) and Manipur (Rs.42.86) showed less average daily earnings than the National average. The highest average daily earnings for men workers in case of minor states/union territories were reported from Jammu & Kashmir (Rs.119.78) followed by Goa (Rs.110.07). Similarly, in case of major states in the country female workers in Kerala reported the highest average daily earnings (Rs.79.58) and Maharashtra (Rs.26.16) the lowest. In the case of minor states/union territories, Sikkim reported the highest daily earnings (Rs.84.24) and Meghalya (Rs.21.43) the minimum. Amongst major states, the average daily earnings of female workers in Andhra Pradesh (Rs.30.68), Karnataka (Rs.31.11), Madhya Pradesh (Rs.30.67), Maharashtra (Rs.26.16) and Orissa (Rs.30.83) were less than the national average earnings of Rs.34.87 during 2004-05. In case of children, the highest daily earnings were in Tamil Nadu (Rs.50.00) followed by Haryana (Rs.48.71) and the lowest in Orissa (Rs.14.26). Besides Orissa, the average daily earnings of child workers were less than the national average earnings (Rs.27.73) in the states of Andhra Pradesh (Rs.24.17), Bihar (Rs.25.71), Gujarat (Rs.20.00), Karnataka (Rs.25.54), Orissa (Rs.14.26) and Maharashtra (Rs.26.10). As in the case of all classes of households men, women and children of the Scheduled Castes Rural Labour Households engaged in agricultural occupations also received their daily earnings both in cash and in kind in all the major states. However, the proportion of earnings in kind was as high as 67.67% in Chhattisgarh for male workers followed by Bihar (49.50%). In the case of women during 20047-05, earnings in kind were more than fifty percent in the States of Bihar (77.21%), Haryana (83.90%) and Chhattisgarh (54.51%) and for children it was the highest in Tamil Nadu (104.42%) followed by Orissa (67.37%) and Bihar (64.39%).
24
(c) Scheduled Tribes
Average daily earnings of male, female and child workers of the Scheduled Tribes Rural Labour Households engaged in agricultural operations for the years 1999-2000 & 2004-05 is presented in Statement 3.1(a)(iii). The average daily earnings of men of the Scheduled Tribes Rural Labour Households was the highest in Kerala (Rs.110.77) and the lowest in Madhya Pradesh (Rs.32.97). The female workers got the highest average daily earnings in the Kerala (Rs.73.81) and the lowest in Orissa (Rs.25.07). In the case of child workers the highest daily earning was reported from West Bengal (Rs.44.99) and the lowest (Rs.24.61) from Madhya Pradesh state. Average daily earnings of men, however, were below the national average of Rs.41.79 in the states of Karnataka (Rs.40.48), Madhya Pradesh (Rs.32.97), Orissa (Rs.36.28) and Uttar Pradesh (Rs.39.44). Likewise, daily earnings of women were less than the national average of Rs.31.67 in the states of Andhra Pradesh (Rs.29.87), Karnataka (Rs.27.59), Madhya Pradesh (Rs.27.68), Maharashtra (28.72), Orissa (Rs.25.07) and Uttar Pradesh (Rs.28.01).
(d) Other Backward Classes
Data on average daily earnings of men, women and children of the Other Backward Classes in Rural Labour Hosueholds engaged in agricultural operations for the year 1999-2000 and 2004-05 is presented in Statement 3.1(a) (iv). It has been observed that among the major states, the average daily earnings of men were the highest in Kerala (Rs. 132.33) and the lowest in Madhya Pradesh (Rs.34.50). The average daily earnings of women were the highest in Haryana (Rs.70.88) and the lowest in Maharashtra (Rs.27.00). In the case of child workers, the highest earnings were reported from Assam (Rs.60.02) and the lowest in the state of Tamil Nadu (Rs.24.83). The pattern of average daily earnings in other minor states and union territories was similar to those of the all classes households, the scheduled castes and the scheduled tribes households. The state of Kerala had the highest daily earnings of men in all the four categories of households viz; All classes, Scheduled Castes, Scheduled Ttribes and Other Backward Classes of Rural Labour Households. Amongst major states, in Andhra Pradesh (Rs. 45.50), Bihar (Rs. 43.32), Gujarat (Rs. 47.36), Karnataka (Rs. 46.58), Madhya Pradesh (Rs. 34.50), Maharashtra (Rs. 45.78), Orissa (Rs. 39.27) and Uttar Pradesh (Rs. 48.30) the average daily earnings of men were found to be below the national average of Rs.49.64. In Andhra Pradesh (Rs. 29.70), Karnataka (Rs. 32.05), Madhya Pradesh (Rs. 27.77), Maharashtra (Rs. 27.00) and Orissa (Rs. 27.58) the daily earnings of female workers were found to be below the all-India average of Rs.33.63. The states of Andhra Pradesh (Rs. 28.57), Karnataka (Rs. 27.99) Madhya Pradesh (Rs.25.61), and Tamil Nadu (Rs. 24.83) reported average daily earnings of child workers less than the national average of Rs.31.70.
2.1 AVERAGE EARNING OF AGRICULTURAL LABOUR HOUSEHOLD WORKERS IN AGRICULTURAL OPERATIONS
The average daily earnings of Agricultural Labour Household workers in agricultural operations in respect of Men, Women and Child workers belonging to all classes, scheduled castes, scheduled tribes and other backward classes are presented in Statements 3.1(b)(i) to 3.1(b)(iv). As agricultural Labour Households constituted majority of the rural labour households, the earnings were similar to the one observed in case of rural labour households. Hence detailed analysis has not been done for agricultural labour households.
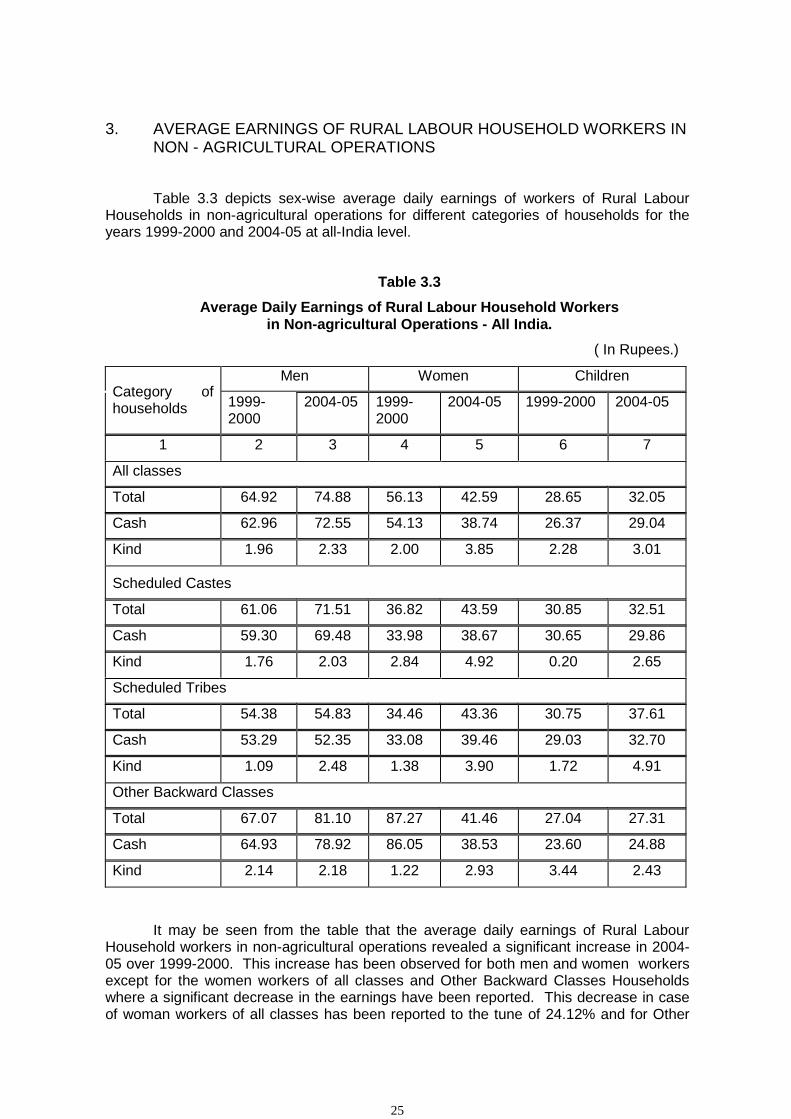
25
3. AVERAGE EARNINGS OF RURAL LABOUR HOUSEHOLD WORKERS IN NON - AGRICULTURAL OPERATIONS
Table 3.3 depicts sex-wise average daily earnings of workers of Rural Labour Households in non-agricultural operations for different categories of households for the years 1999-2000 and 2004-05 at all-India level.
Table 3.3 Average Daily Earnings of Rural Labour Household Workers
in Non-agricultural Operations - All India. ( In Rupees.)
Category of households
Men Women Children
1999-2000
2004-05 1999-2000
2004-05 1999-2000 2004-05
1 2 3 4 5 6 7
All classes
Total 64.92 74.88 56.13 42.59 28.65 32.05
Cash 62.96 72.55 54.13 38.74 26.37 29.04
Kind 1.96 2.33 2.00 3.85 2.28 3.01
Scheduled Castes
Total 61.06 71.51 36.82 43.59 30.85 32.51
Cash 59.30 69.48 33.98 38.67 30.65 29.86
Kind 1.76 2.03 2.84 4.92 0.20 2.65
Scheduled Tribes
Total 54.38 54.83 34.46 43.36 30.75 37.61
Cash 53.29 52.35 33.08 39.46 29.03 32.70
Kind 1.09 2.48 1.38 3.90 1.72 4.91
Other Backward Classes
Total 67.07 81.10 87.27 41.46 27.04 27.31
Cash 64.93 78.92 86.05 38.53 23.60 24.88
Kind 2.14 2.18 1.22 2.93 3.44 2.43
It may be seen from the table that the average daily earnings of Rural Labour Household workers in non-agricultural operations revealed a significant increase in 2004-05 over 1999-2000. This increase has been observed for both men and women workers except for the women workers of all classes and Other Backward Classes Households where a significant decrease in the earnings have been reported. This decrease in case of woman workers of all classes has been reported to the tune of 24.12% and for Other
26
Backward Classes women workers it was to the tune of 52.49%. The male and child workers of All-Classes of Households reported increase of 15.34% and 10.61% respectively. A similar trend was observed in case of the Scheduled Castes workers with 17.11% increase for men followed by 18.39% for women and 5.38% for child workers. In case of Scheduled Tribes Rural Labour Households, increase in daily earnings was highest for female workers (25.83%) followed by child worker (22.31%) and for men workers only (0.83%). The average daily earnings of men during 2004-05 were higher than those of women and child workers. The average daily earnings of men (Rs.81.10) of Other Backward Classes (O.B.Cs.) and women (Rs.43.59) of Scheduled Caste Rural Labour Households were the highest among all the four categories of households during 2004-05. However, the child workers of the OBCs had the lowest (Rs.27.31) daily earnings among all these classes of households. The proportion of the payment in kind in total earnings has increased in comparison to previous enquiry in respect of all category of households except for child workers of Other Backward Classes, where a minor decrease was noticed. The child workers of Scheduled Tribes Rural Labour Households received 13.06% of their total daily earnings in kind during the 2004-05 survey which was the highest among all the four classes of households.
(a) All Classes
State-wise data on the average daily earnings of men, women and children of All Classes of Rural Labour Households engaged in non-agricultural operations are presented in Statement 3.2(a)(i). The average daily earnings of all categories of workers i.e. men, women and children of Rural Labour Households in non - agricultural operations in 2004-05 have increased when compared to 1999-2000 in majority of the States/Union Territories. The highest average daily earnings for men among the major states was reported from Kerala (Rs.139.81) followed by Haryana (Rs.85.51), Tamil Nadu (Rs.85.42), Gujarat (Rs.75.38), and the Punjab (Rs.84.47). Among the minor states and Union Territories, highest daily earnings for men was reported from A & N Islands (Rs.145.12) followed by Lakshdweep (Rs.132.70), Goa (Rs.119.00), Daman & Diu (Rs.112.23) and Sikkim (Rs.100.05). During 2004-05 the average daily earnings of men were less than the national average of Rs.74.88 in the states of Andhra Pradesh (Rs.62.87), Assam (Rs.73.96), Bihar (Rs.68.09), Karnataka (Rs.74.45), Madhya Pradesh (Rs.47.21), Maharashtra (Rs.73.93), Orissa (Rs.56.35), Rajasthan (Rs.68.29), Uttar Pradesh (Rs.58.49), West Bengal (Rs.64.06), Arunachal Pradesh (Rs.41.76), Chhattisgarh (Rs.52.05), Jharkhand (Rs.53.84), Meghalaya (Rs.72.18), Tripura (Rs.66.41), Delhi (Rs.67.86) and Pondicherry (Rs.72.89). Men engaged in non-agricultural operations, however, had higher earnings than their counterparts engaged in agricultural occupations in all the states except some minor states/union territories of Arunachal Pradesh, Mizoram, A & N Island and Delhi. Daily earnings were paid both in cash and in kind. Major share of total earnings however, was received in cash in all the states. In Arunachal Pradesh, Manipur, Mizoram, Nagaland, Delhi and Lakshdweep, men received their entire daily earnings in cash. Amongst major states, the highest daily earnings for women was reported from Haryana (Rs.58.97) followed by Assam (Rs.58.00), Kerala (Rs.54.34) and Uttar Pradesh (Rs.52.66) during 2004-05. The women received their earnings totally in cash in Arunachal Pradesh, Jammu & Kashmir, Manipur, Sikkim and Daman & Diu. In other states, earnings were received both in cash and in kind. The share of payment in kind of the daily earnings of women was the highest in Rajasthan (25.41%) followed by West Bengal (15.57%) and the lowest in Dadar & Nagar Haveli (0.14). In Bihar, Haryana, Kerala, Madhya Pradesh, Punjab, West Bengal, Goa, Meghalaya, Tripura and A & N Island women of Rural Labour Households engaged in non-agricultural operations, received less average daily earnings than those engaged in agricultural operations. The highest daily earnings for child workers were observed in the state of Kerala (Rs.65.05) and the lowest in Uttar Pradesh (Rs.21.18) among major states of the country. In case of

27
minor states and union territories the highest earnings of child workers was in Goa (Rs.78.46) and the lowest in Tripura (Rs.21.43). Average daily earnings of child workers in Andhra Pradesh, Maharashtra, Orissa, Tamil Nadu, Uttar Pradesh, West Bengal, Chhatisgarh and Tripura were less than the national average of Rs.32.05. Children received their earnings both in cash and in kind except in the states of Assam, Gujarat, Tamil Nadu, Goa, Jharkhand, Manipur, Tripura and Uttranchal where the daily earnings were wholly received in cash. The share of payment in kind of daily earnings of child workers was the highest in Maharashtra (29.12%) and the lowest in Orissa (1.55%)
(b) Scheduled Castes
Statement 3.2 (a) (ii) presents information on average daily earnings of men,
women and children belonging to the Scheduled Castes Rural Labour Households engaged in non-agricultural occupations. Except Madhya Pradesh and Pondicherry in case of men workers, Madhya Pradesh, West Bengal, Himachal Pradesh and Pondicherry in case of women workers and Andhra Pradesh, Tamil Nadu, Uttar Pradesh and West Bengal of child workers, all the remaining states and union territories experienced an increase in the average daily earnings of men, women and child workers in 2004-05 over 1999-2000. Amongst major states, the highest average daily earnings for men were reported from Kerala (Rs.139.68) and the lowest from Madhya Pradesh (Rs.38.20). In the states of Andhra Pradesh (Rs.64.14), Bihar (Rs.54.24), Gujarat (Rs.66.43), Madhya Pradesh (Rs.38.20), Orissa (Rs.63.59), Uttar Pradesh (Rs.58.63), West Bengal (Rs.71.48), Chhatisgarh (Rs.53.40), Jharkhand (Rs.52.02) and Pondicherry (Rs.56.63) average daily earnings were less than the national average of Rs.71.51. In case of major states in the country the women received the highest average daily earnings in Maharashtra (Rs. 63.43), and the lowest in Madhya Pradesh (Rs. 20.67). In case of minor states/union territories the highest daily earnings for women were in Uttranchal (Rs. 100.00) and the lowest in Pondicherry (Rs. 17.86). Female workers in all the states received their earnings both in cash & in kind except the state of Goa, Jharkhand, Sikkim, Uttranchal and Pondicherry where the earnings were wholly paid in cash. Only 11 states reported daily earnings for child workers in non-agricultural operations. The states which showed the daily earnings of child workers below the all-India average of (Rs.32.51) were Andhra Pradesh, Orissa, Tamil Nadu, Uttar Pradesh and West Bengal. The highest average daily earnings of children were reported from Kerala (Rs.73.33) and the lowest from Andhra Pradesh (Rs. 13.93).
(c) Scheduled Tribes The average daily earnings of men, women and children belonging to the
Scheduled Tribes Rural Labour Households engaged in non-agricultural operations are presented in Statement 3.2(a) (iii). The major states where men received lower daily earnings than the national average of Rs.54.83 were Karnataka (Rs. 52.31) Madhya Pradesh (Rs. 49.78), Orissa (Rs. 43.46), Uttar Pradesh (Rs. 33.50) and West Bengal (Rs. 47.11). Female workers received the highest daily earnings in Tamil Nadu (Rs. 76.00) and the lowest in the state of Karnataka (Rs.26.47). In all the major states except Karnataka women were paid both in cash & in kind. Average daily earnings for children were reported only from the states of Andhra Pradesh, Gujarat, Karnataka, Madhya Pradesh, Orissa, Rajasthan, West Bengal and Tripura. The Highest average daily earnings for Children was in Andhra Pradesh (Rs.40.71) and the lowest in West Bengal (Rs.15.00). Amongst these states, the mode of payment in Gujarat, West Bengal and Tripura was cash only where as in rest of the states it was both in cash and in kind.

28
(d) Other Backward Classes The information on average daily earnings of men, women and children belonging
to Other Backward Classes of Rural Labour Households engaged in non-agricultural occupations is given in Statement 3.2 (a) (iv). It reveals that amongst the major states, average daily earnings of men was the highest in Kerala (Rs. 140.43) followed by Haryana (Rs.90.11) and the lowest in Madhya Pradesh (Rs.51.09). Among the fifteen major states, only seven states of Assam (Rs.88.62), Bihar (Rs.82.10), Gujarat (Rs.88.00), Haryana (Rs.90.11), Kerala (Rs.140.43), Punjab (Rs.82.62) and Tamil Nadu (Rs.86.48) reported the average daily earnings of male workers higher than the national average of Rs. 81.10. The average daily earnings among other minor states and union territories were the highest in Himachal Pradesh (Rs.105.45) and the lowest in Goa (Rs.50.00). The average daily earnings of women were the highest in Haryana (Rs.77.19) and the lowest in Madhya Pradesh (Rs. 17.67). The major share of the earnings of women were received in cash in all the states except West Bengal and Bihar where 44.33% and 40.23% of the earnings were received in kind. The earnings in the states of Haryana, Goa, Manipur and Sikkim were however, paid wholly in cash. In rest of the states, the earnings were received partly in cash and partly in kind. The daily earnings for child workers were reported from 15 states only. The average daily earnings of the child workers were reported to be the highest in Rajasthan (70.00) followed by Gujarat (Rs.50.00) and the lowest in Orissa (Rs.15.00). Children received their daily earnings in kind in four states viz; Kerala (36.36%), Maharashtra (35.20%), Uttar Pradesh (12.31%) and Andhra Pradesh (2.03%) where as in the remaining states their earning were fully in cash.
3.1 AVERAGE EARNINGS OF AGRICULTURAL LABOUR HOUSEHOLD WORKERS IN NON - AGRICULTURAL OPERATIONS
The average daily earnings of Agricultural Labour Household workers in non-agricultural operations in respect of Men, Women and Child workers belonging to all classes, scheduled castes, scheduled tribes and other backward classes are presented in Statements 3.2(b) (i) to 3.2(b) (iv). As agricultural Labour Households constituted majority of the rural labour households, the earnings were similar to the one observed in case of rural labour households. Hence detailed analysis has not been done for agricultural labour households.

29
CHAPTER - IV
EARNINGS IN DIFFERENT AGRICULTURAL OPERATIONS
In the following paragraphs an attempt has been made to present the average daily earnings of rural workers, i.e., men, women and children, belonging to all the four categories of Rural Labour Households viz; All Classes; Scheduled Castes; Scheduled Tribes and Other Backward Classes engaged in different agricultural operations. The daily earnings of the rural workers are influenced by several forces e.g. the local traditions/customs; prosperity of the region/state; awareness of beneficial provisions contained in the Minimum Wages Act, 1948; skill in particular agricultural operation; mobility of labour and many other such factors.
1. EARNINGS OF MALE WORKERS OF RURAL LABOUR HOUSEHOLDS
The average daily earnings of male workers belonging to all the four categories (at all India level) of Rural Labour Households engaged in different agricultural operations during 2004-05, are depicted in Table 4.1.
Table 4.1
Average daily earnings of men of Rural Labour Households in different Agricultural Operations – All India.
(In Rupees) Category of Households
Operations All Classes Scheduled Castes
1999-
2000
2004-05 1999-
2000
2004-05
Total Total Cash Kind Total Total Cash Kind
1 2 3 4 5 6 7 8 9
1.Ploughing 42.40 52.58 47.98 4.60 43.14 54.34 49.12 5.22
2.Sowing 39.30 45.20 40.52 4.68 41.85 45.06 40.56 4.50
3.Transplanting 39.68 50.71 46.89 3.82 40.81 54.19 50.99 3.20
4.Weeding 34.99 41.70 36.73 4.97 37.29 44.41 38.19 6.22
5.Harvesting 38.69 46.73 36.43 10.30 39.75 48.81 37.39 11.42
6.Cultivation 39.50 47.20 42.77 4.43 41.46 48.66 43.49 5.17
7.Forestry 50.41 52.12 50.89 1.23 45.33 47.67 46.66 1.01
8.Plantation 55.93 66.15 61.11 5.04 66.90 70.16 66.37 3.79
9.Animal Husbandry 32.84 36.70 31.22 5.48 39.39 36.56 28.98 7.58
10.Fisheries 60.93 92.33 85.57 6.76 56.82 64.22 57.22 7.00
11.Other (Agricultural
operations)
44.63 48.21 45.24 2.97 45.33 49.35 45.58 3.77

30
Table 4.1 Concld.. Category of Households
Operations Scheduled Tribes Other Backward Classes
1999-
2000
2004-05 1999-
2000
2004-05
Total Total Cash Kind Total Total Cash Kind
1 10 11 12 13 14 15 16 17
1.Ploughing 35.91 45.91 40.03 5.88 41.62 55.53 51.31 4.22
2.Sowing 28.79 41.97 34.13 7.84 38.63 45.79 40.08 5.71
3.Transplanting 33.97 47.19 39.38 7.81 41.02 48.93 45.69 3.24
4.Weeding 29.32 36.03 30.55 5.48 34.20 41.15 37.19 3.96
5.Harvesting 32.94 40.31 31.26 9.05 38.55 47.06 36.43 10.63
6.Cultivation 31.41 41.06 37.10 3.96 39.80 48.16 43.84 4.32
7.Forestry 40.23 40.08 37.38 2.70 61.50 58.67 57.60 1.07
8.Plantation 44.77 53.67 49.59 43.08 61.24 72.09 65.83 6.26
9.Animal Husbandry 23.13 24.21 19.95 4.26 29.06 34.29 28.64 5.65
10.Fisheries 34.76 73.46 60.52 12.94 67.97 148.57 141.95 6.62
11.Other (Agricultural
operations)
36.79 38.68 37.02 1.66 45.28 51.02 47.79 3.23
It is evident from the above Table that the daily earnings of men belonging to All
the four categories of all Classes Households, Scheduled Castes, Scheduled Tribes and the Other Backward Classes Households at all-India level have increased in all the specified agricultural occupations during 2004-05 over the year 1999-2000 except in case of the Scheduled Castes households for animal husbandry occupation and Scheduled Tribes & Other Backward Classes Households, for forestry occupation where the earnings of workers have slightly decreased. Amongst the six main agricultural operations, viz., ploughing; sowing; transplanting; weeding; harvesting, and cultivation, ploughing was observed to be the most remunerative operation for men belonging to the three categories of households viz; Rs. 52.58 for All Classes Households, Rs. 54.34 for Schedules Castes Households and Rs. 55.53 for Other Backward Classes of Households whereas transplanting was on the top in case of scheduled tribe households during 2004-05. The earning of Rs. 47.19 was the highest for transplanting operation among the six main agricultural occupation in the case of men workers of the Scheduled Tribes Households. The men engaged in weeding secured the lowest daily earnings of Rs. 41.70 for All Classes Households, Rs.44.41 for the Scheduled Castes Households Rs.36.03 for the Scheduled Tribe Households and Rs.41.15 for Other Backward Classes Rural Labour Households among the six main occupations.
Among the other agricultural operations, fishing was observed to be the highest
paid operation for All Classes Households, Scheduled Tribe Households and Other Backward Classes of households whereas the plantation operation was the most remunerative operation for the Scheduled Castes households. The average daily earnings for men in Animal Husbandry was the lowest in all the four categories of Rural Labour Households. It was also revealed that male workers of the Scheduled Tribes

31
households earned less daily earnings in all the specified agricultural operations when compared with other categories of households except in fisheries of Scheduled Castes Households which was slightly higher. On the other hand, the Other Backward Classes men, except in transplanting, weeding and animal husbandry operations, secured higher daily earnings than their counterparts of the Scheduled Tribes Households as well as All Classes of households whereas the Scheduled Castes Households men got higher earnings in the transplanting, weeding, harvesting and cultivation operations then the Other Backward Classes households.
(a) All Classes
The average daily earnings of men belonging to all Rural Labour Households in various agricultural operations is presented in Statement 4.1(a)(i) M for all States/Union Territories of the country for the years 1999-2000 and 2004-05. Though the increase in daily earnings have been observed in almost all the agricultural operations in all the states/union territories but it varied tremendously from state to state and operation to operation. Among the major states highest increase in daily earnings was observed for all the operations in Kerala except for Animal Husbandry operation where it was the highest in Rajasthan. The lowest daily earnings were reported from Madhya Pradesh for Ploughing, Transplanting, Harvesting, Cultivation, Forestry & Animal Husbandry; Andhra Pradesh for Sowing; Karnataka for Weeding; Maharashtra for Plantation; Tamil Nadu for Fisheries and Orissa for other agricultural occupation. Average daily earnings varied from Rs.182.14 (Transplanting) to Rs.87.81 (Animal Husbandry) in respect of Kerala and Rs.29.30 (Transplanting) to Rs.23.04 (Animal Husbandry) in Madhya Pradesh. In the succeeding lines the analysis is made excluding these two states. In Ploughing operation, men in Punjab received the highest daily earnings of Rs.74.49 followed by Haryana & Tamil Nadu (Rs.74.32 each). In sowing operation, Rajasthan reported the highest daily earnings of Rs.67.31 followed again by Haryana (Rs.65.71) and the lowest of Rs. 28.95 were reported from Andhra Pradesh. Transplanting operation secured the highest daily earnings of Rs. 90.00 in Rajasthan followed by Haryana (Rs.87.27) and the lowest in Madhya Pradesh (Rs.29.30). Earnings in weeding operation in Punjab were most remunerative (Rs.69.92) but least lucrative in Karnataka (Rs.32.53). In Harvesting and cultivation operation also Punjab was leading with earnings of (Rs.70.02) and (Rs70.51) whereas it was lowest in Madhya Pradesh (Rs.32.22) and (Rs.36.54) respectively.
Among all other agricultural operations viz; Forestry, Plantation, Animal
Husbandry, Fisheries and Other agricultural Operations, earnings of men in fisheries were highest in Kerala (Rs.191.13) and the lowest in Tamil Nadu (Rs. 50.00). In Forestry operations Kerala got the highest earnings (Rs.174.00) and the lowest in Madhya Pradesh (Rs.30.11). In Plantation operation also Kerala ranked first with Rs. 114.25 as daily earnings. Lowest earnings in this operation were reported from Maharashtra (Rs.40.81). In Animal Husbandry operation, daily earnings were Rs.101.94 in Rajasthan and as low as Rs.23.04 in Madhya Pradesh. Orissa and West Bengal were the only States where the daily earnings for forestry had declined by 35 percent and 33 percent respectively followed by Gujarat and Andhra Pradesh in sowing operation where decline was noticed by 26 & 22 percent respectively. No such major decrease for any state for any operation except Plantation in Rajasthan (59 percent decline) has been noticed. The payment were made both in cash and in kind in almost in all the states.
Daily earnings of men in minor states/union territories also showed an increasing
trend in earnings over the previous survey. Since the percentage of wage earners covered under these state/union territories is negligible, therefore, an elaborate analysis has not been attempted here.
32
(b) Scheduled Castes
State-wise details of average daily earnings of men, belonging to the Scheduled Castes Rural Labour Households in various agricultural operations are given in Statement 4.1(a) (ii) M. Amongst all the major States, male workers in Kerala State stood first in 8 occupation out of all the agricultural operations with daily earnings ranging between Rs.182.14 (transplanting) and Rs.101.16 (harvesting). The lowest daily earnings in animal husbandry operation was reported from Madhya Pradesh (Rs.15.61), in Sowing (Rs. 18.62) from Gujarat and forestry (Rs.26.67) from Orissa. In weeding operation, lowest daily earnings of Rs. 34.86 was noticed in Madhya Pradesh. In harvesting and cultivation operations lowest daily earnings of Rs.38.73 and Rs.39.28 respectively were also reported from Madhya Pradesh as against Rs.101.16 and Rs. 130.73 from Kerala. In ploughing operation, the increase in daily earnings was as high as 215% over the previous survey in respect of Gujarat State and in transplanting it was 181% followed by 112% in forestry from Kerala state. In forestry the highest daily earnings of Rs.171.43 were reported from Kerala and the lowest from Orissa (Rs.26.67). In plantation operation, daily earnings of Rs.44.07 were reported from West Bengal as against Rs. 106.70 from Kerala. Animal Husbandry did not appear to be very popular occupation among the Scheduled Castes male workers. (c) Scheduled Tribes
State-wise data on average daily earnings of men belonging to the Scheduled Tribes Rural Labour Households is given in Statement 4.1(a) (iii) M. As compared to the previous survey 1999-2000, during 2004-05 there has been an increase in the daily earnings of men engaged in all the specified agricultural operations in most of the States and Union Territories. The highest increase among all the major agricultural operations was observed in case of harvesting in Uttar Pradesh (124.6%) followed by Tamil Nadu (99.6%). In weeding operation increase in daily earnings (Rs.28.85 to Rs.60.00) in respect of Karnataka was as much as 108% in 2004-05 followed by Rajasthan where increase was to the tune of 86.20% over the previous survey. In ploughing operation Kerala reported the highest daily earnings of Rs. 108.16 and the lowest (Rs.35.97) in Madhya Pradesh. Sowing operation fetched the highest earnings of Rs.70.00 in Rajasthan and the lowest (Rs.30.00) in Uttar Pradesh. Harvesting and Cultivation operations continued to be popular occupations amongst male workers of the Scheduled Tribes households though the earnings were not very high. In harvesting the earnings ranged from Rs.80.00 in Punjab and Tamil Nadu to Rs.28.45 in Madhya Pradesh and in cultivation from Rs.97.28 (Kerala) to Rs.35.77 (Madhya Pradesh). Among other agricultural operations, plantation secured the highest earnings (Rs.124.22) in Kerala and the lowest (Rs.22.86) in animal husbandry occupation in Madhya Pradesh among the major states. (d) Other Backward Classes
The data on daily earnings of male workers of Other Backward Classes of Rural Labour Households in various agricultural operation is presented in Statement 4.1 (a) (iv) -M. The operation- wise details in respect of major states revealed that in ploughing operation highest earnings were in Kerala (Rs.120.56), followed by Punjab (Rs.106.79) and Assam (Rs.60.92). The lowest daily earnings in this operation were reported from Madhya Pradesh (Rs.43.14). However, in sowing operation, Assam topped by reporting Rs.70.00 as daily earnings. Haryana, in second position, earned Rs.66.33. Lowest average daily earnings (Rs.28.95) were reported from Andhra Pradesh. In transplanting operation, Haryana reported the highest earnings of Rs.82.86 and Madhya pradesh the

33
lowest (Rs.30.00). In weeding operation highest (Rs.70.00) daily earnings were found in Kerala followed by Haryana (Rs 65.02). Daily earnings in harvesting operation ranged between Rs.98.99 (Kerala) and Rs.30.82 (Madhya Pradesh). In cultivation operation, earnings varied from Rs.35.81 (Madhya Pradesh) to Rs. 132.77 (Kerala). Workers engaged in forestry and plantation operations reported daily earnings of Rs.210.44 and Rs.120.70 respectively from Kerala State as against Rs.30.00 in forestry from Madhya Pradesh and Rs.50.00 in plantation from Maharashtra. Animal husbandry operation was reported remunerative from Rajasthan with daily earnings of Rs.148.57. However, Madhya Pradesh reported the lowest daily earnings (Rs.19.59) in animal husbandry but highest in fisheries was (Rs.197.13) from Kerala.
2. EARNINGS OF WOMEN WORKERS OF RURAL LABOUR HOUSEHOLDS
The average daily earnings of female workers of various Rural Labour Households in different agricultural operations at all-India level is presented in Table 4.2
Table 4.2
Average daily earnings of Women of Rural Labour Households in different Agricultural Operations – All India
(In Rupees)
Category of Households
Operations All Classes Scheduled Castes
1999-2000
2004-05 1999-2000
2004-05
Total Total Cash Kind Total Total Cash Kind
1 2 3 4 5 6 7 8 9
1.Ploughing 32.16 35.91 32.35 3.56 28.36 38.09 33.64 4.45
2.Sowing 28.40 31.94 27.88 4.06 30.23 33.43 29.38 4.05
3.Transplanting 28.83 36.97 32.94 4.03 29.97 38.34 35.15 3.19
4.Weeding 25.55 30.13 27.63 2.50 26.35 30.96 27.58 3.38
5.Harvesting 29.33 33.99 26.04 7.95 30.73 36.53 27.40 9.13
6.Cultivation 27.81 33.09 30.13 2.96 29.10 33.81 30.18 3.63
7.Forestry 32.99 32.22 30.27 1.95 32.24 31.81 30.44 1.37
8.Plantation 43.09 52.38 48.62 3.76 48.95 57.10 56.00 1.10
9.Animal Husbandry 24.25 31.65 20.87 10.78 24.02 35.71 23.01 12.70
10.Fisheries 60.95 43.57 37.92 5.65 25.71 25.00 25.00 -
11.Other (Agricultural, operations)
28.58 35.00 31.92 3.08 29.61 38.18 32.92 5.26
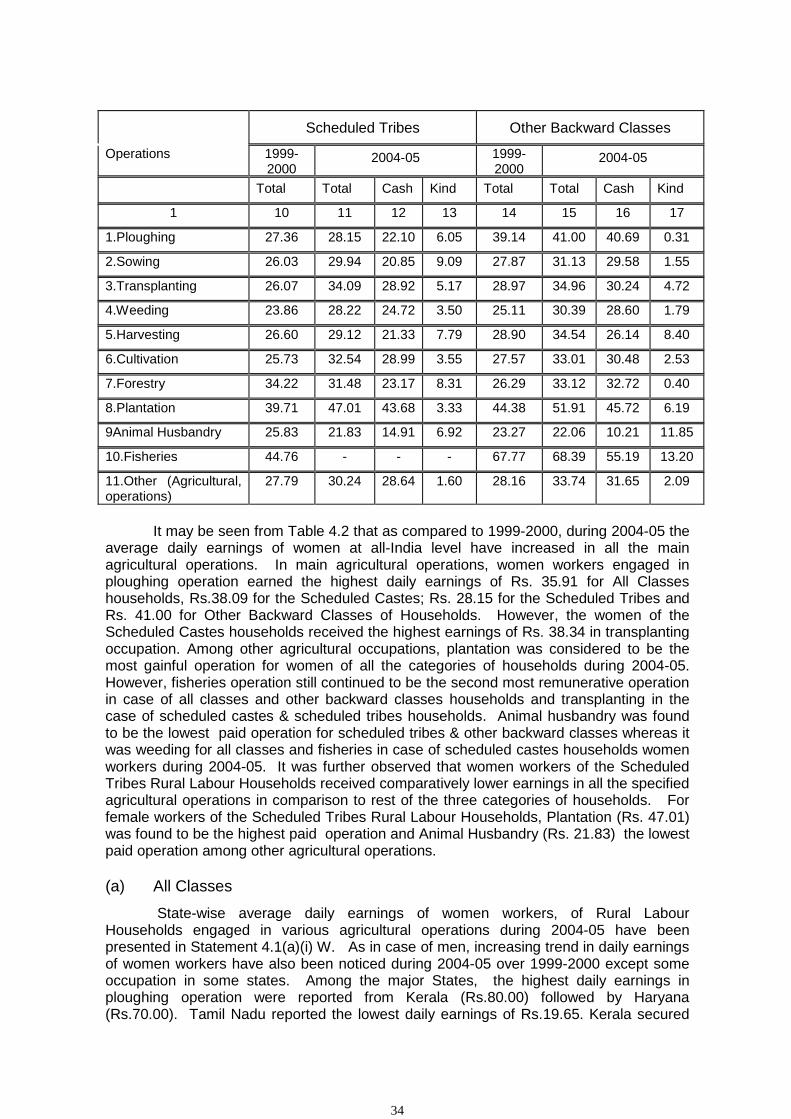
34
Scheduled Tribes Other Backward Classes
Operations 1999-2000
2004-05 1999-2000
2004-05
Total Total Cash Kind Total Total Cash Kind
1 10 11 12 13 14 15 16 17
1.Ploughing 27.36 28.15 22.10 6.05 39.14 41.00 40.69 0.31
2.Sowing 26.03 29.94 20.85 9.09 27.87 31.13 29.58 1.55
3.Transplanting 26.07 34.09 28.92 5.17 28.97 34.96 30.24 4.72
4.Weeding 23.86 28.22 24.72 3.50 25.11 30.39 28.60 1.79
5.Harvesting 26.60 29.12 21.33 7.79 28.90 34.54 26.14 8.40
6.Cultivation 25.73 32.54 28.99 3.55 27.57 33.01 30.48 2.53
7.Forestry 34.22 31.48 23.17 8.31 26.29 33.12 32.72 0.40
8.Plantation 39.71 47.01 43.68 3.33 44.38 51.91 45.72 6.19
9Animal Husbandry 25.83 21.83 14.91 6.92 23.27 22.06 10.21 11.85
10.Fisheries 44.76 - - - 67.77 68.39 55.19 13.20
11.Other (Agricultural, operations)
27.79 30.24 28.64 1.60 28.16 33.74 31.65 2.09
It may be seen from Table 4.2 that as compared to 1999-2000, during 2004-05 the
average daily earnings of women at all-India level have increased in all the main agricultural operations. In main agricultural operations, women workers engaged in ploughing operation earned the highest daily earnings of Rs. 35.91 for All Classes households, Rs.38.09 for the Scheduled Castes; Rs. 28.15 for the Scheduled Tribes and Rs. 41.00 for Other Backward Classes of Households. However, the women of the Scheduled Castes households received the highest earnings of Rs. 38.34 in transplanting occupation. Among other agricultural occupations, plantation was considered to be the most gainful operation for women of all the categories of households during 2004-05. However, fisheries operation still continued to be the second most remunerative operation in case of all classes and other backward classes households and transplanting in the case of scheduled castes & scheduled tribes households. Animal husbandry was found to be the lowest paid operation for scheduled tribes & other backward classes whereas it was weeding for all classes and fisheries in case of scheduled castes households women workers during 2004-05. It was further observed that women workers of the Scheduled Tribes Rural Labour Households received comparatively lower earnings in all the specified agricultural operations in comparison to rest of the three categories of households. For female workers of the Scheduled Tribes Rural Labour Households, Plantation (Rs. 47.01) was found to be the highest paid operation and Animal Husbandry (Rs. 21.83) the lowest paid operation among other agricultural operations.
(a) All Classes
State-wise average daily earnings of women workers, of Rural Labour Households engaged in various agricultural operations during 2004-05 have been presented in Statement 4.1(a)(i) W. As in case of men, increasing trend in daily earnings of women workers have also been noticed during 2004-05 over 1999-2000 except some occupation in some states. Among the major States, the highest daily earnings in ploughing operation were reported from Kerala (Rs.80.00) followed by Haryana (Rs.70.00). Tamil Nadu reported the lowest daily earnings of Rs.19.65. Kerala secured
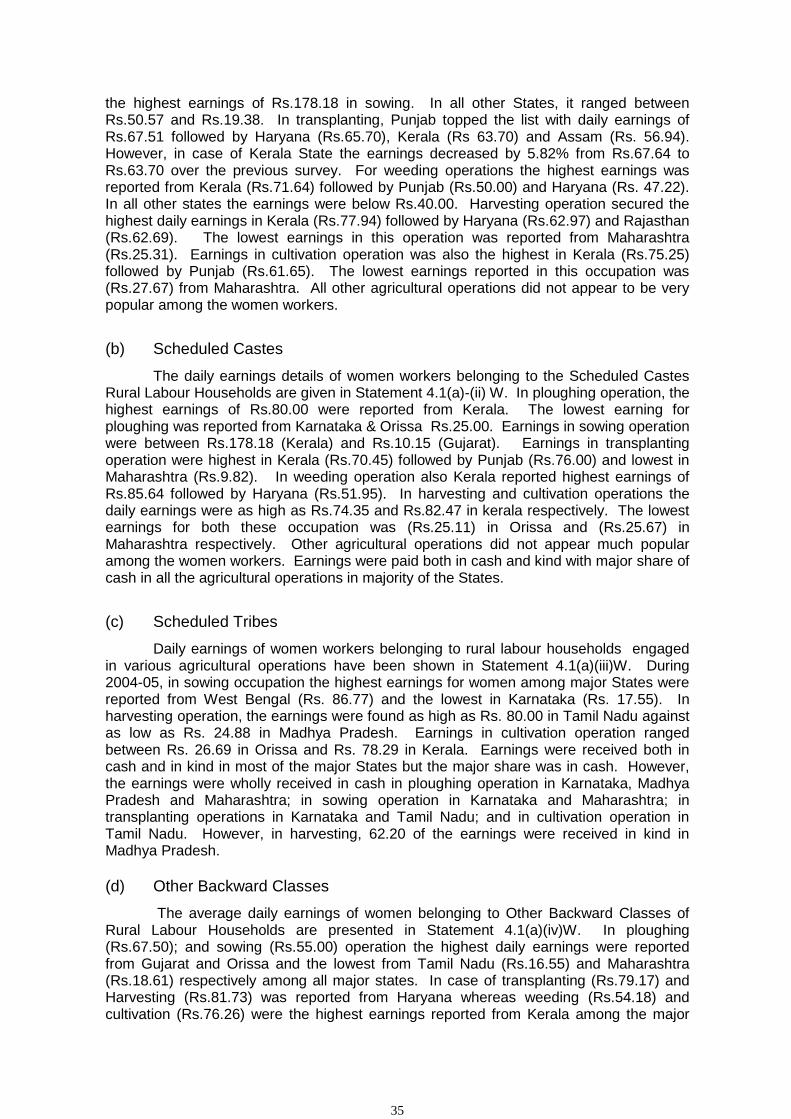
35
the highest earnings of Rs.178.18 in sowing. In all other States, it ranged between Rs.50.57 and Rs.19.38. In transplanting, Punjab topped the list with daily earnings of Rs.67.51 followed by Haryana (Rs.65.70), Kerala (Rs 63.70) and Assam (Rs. 56.94). However, in case of Kerala State the earnings decreased by 5.82% from Rs.67.64 to Rs.63.70 over the previous survey. For weeding operations the highest earnings was reported from Kerala (Rs.71.64) followed by Punjab (Rs.50.00) and Haryana (Rs. 47.22). In all other states the earnings were below Rs.40.00. Harvesting operation secured the highest daily earnings in Kerala (Rs.77.94) followed by Haryana (Rs.62.97) and Rajasthan (Rs.62.69). The lowest earnings in this operation was reported from Maharashtra (Rs.25.31). Earnings in cultivation operation was also the highest in Kerala (Rs.75.25) followed by Punjab (Rs.61.65). The lowest earnings reported in this occupation was (Rs.27.67) from Maharashtra. All other agricultural operations did not appear to be very popular among the women workers.
(b) Scheduled Castes
The daily earnings details of women workers belonging to the Scheduled Castes Rural Labour Households are given in Statement 4.1(a)-(ii) W. In ploughing operation, the highest earnings of Rs.80.00 were reported from Kerala. The lowest earning for ploughing was reported from Karnataka & Orissa Rs.25.00. Earnings in sowing operation were between Rs.178.18 (Kerala) and Rs.10.15 (Gujarat). Earnings in transplanting operation were highest in Kerala (Rs.70.45) followed by Punjab (Rs.76.00) and lowest in Maharashtra (Rs.9.82). In weeding operation also Kerala reported highest earnings of Rs.85.64 followed by Haryana (Rs.51.95). In harvesting and cultivation operations the daily earnings were as high as Rs.74.35 and Rs.82.47 in kerala respectively. The lowest earnings for both these occupation was (Rs.25.11) in Orissa and (Rs.25.67) in Maharashtra respectively. Other agricultural operations did not appear much popular among the women workers. Earnings were paid both in cash and kind with major share of cash in all the agricultural operations in majority of the States.
(c) Scheduled Tribes
Daily earnings of women workers belonging to rural labour households engaged in various agricultural operations have been shown in Statement 4.1(a)(iii)W. During 2004-05, in sowing occupation the highest earnings for women among major States were reported from West Bengal (Rs. 86.77) and the lowest in Karnataka (Rs. 17.55). In harvesting operation, the earnings were found as high as Rs. 80.00 in Tamil Nadu against as low as Rs. 24.88 in Madhya Pradesh. Earnings in cultivation operation ranged between Rs. 26.69 in Orissa and Rs. 78.29 in Kerala. Earnings were received both in cash and in kind in most of the major States but the major share was in cash. However, the earnings were wholly received in cash in ploughing operation in Karnataka, Madhya Pradesh and Maharashtra; in sowing operation in Karnataka and Maharashtra; in transplanting operations in Karnataka and Tamil Nadu; and in cultivation operation in Tamil Nadu. However, in harvesting, 62.20 of the earnings were received in kind in Madhya Pradesh.
(d) Other Backward Classes
The average daily earnings of women belonging to Other Backward Classes of Rural Labour Households are presented in Statement 4.1(a)(iv)W. In ploughing (Rs.67.50); and sowing (Rs.55.00) operation the highest daily earnings were reported from Gujarat and Orissa and the lowest from Tamil Nadu (Rs.16.55) and Maharashtra (Rs.18.61) respectively among all major states. In case of transplanting (Rs.79.17) and Harvesting (Rs.81.73) was reported from Haryana whereas weeding (Rs.54.18) and cultivation (Rs.76.26) were the highest earnings reported from Kerala among the major

36
states. The lowest earnings reported for transplanting and weeding occupation were (Rs28.24) and (Rs.25.40) from Orissa. In case of harvesting (Rs.24.36) and (Rs.25.28) were the lowest earnings reported from Maharashtra and Madhya Pradesh respectively. In ploughing occupation all the major states paid the earnings in cash whereas in sowing the earnings were paid fully in kind in West Bengal.
3. EARNINGS OF CHILD WORKERS OF RURAL LABOUR HOUSEHOLDS
The average daily earnings of child workers belonging to the Rural Labour Households in different agricultural operations at all-India level is given in Table 4.3.
Table 4.3
Average daily earnings of Children of Rural Labour Households in different Agricultural Operations – All India
(In Rupees)
Category of Households
Operations All Classes Scheduled Castes
1999-2000
2004-05 1999-2000
2004-05
Total Total Cash Kind Total Total Cash Kind
1 2 3 4 5 6 7 8 9
1.Ploughing 27.37 36.58 35.11 1.47 31.22 57.14 42.86 14.28
2.Sowing 25.09 38.01 33.12 4.89 55.54 28.73 23.54 5.19
3.Transplanting 24.87 39.60 35.00 4.60 32.18 10.00 10.00 -
4.Weeding 23.18 27.61 24.53 3.08 24.44 27.80 23.10 4.70
5.Harvesting 27.19 29.04 23.10 5.94 28.40 31.14 22.13 9.01
6.Cultivation 24.92 31.49 29.07 2.42 26.70 26.05 24.63 1.42
7.Forestry 40.95 32.26 32.26 - 30.00 30.00 30.00 -
8.Plantation 19.03 46.73 41.88 4.85 35.00 40.00 40.00 -
9.Animal Husbandry 19.72 20.76 16.70 4.06 22.42 21.17 16.75 4.42
10.Fisheries 41.55 25.00 25.00 - 27.27 - - -
11.Other (Agricultural, operations)
21.86 27.33 27.30 0.03 21.28 34.29 34.29 -
37
Scheduled Tribes Other Backward Classes
Operations 1999-2000
2004-05 1999-2000
2004-05
Total Total Cash Kind Total Total Cash Kind
1 10 11 12 13 14 15 16 17
1.Ploughing 24.39 30.00 30.00 - 25.00 35.30 35.30 - 2.Sowing 20.00 - - - 21.34 43.20 38.42 4.78
3.Transplanting 30.26 40.95 37.21 3.74 15.66 42.76 40.96 1.80
4.Weeding 24.55 28.16 21.72 6.44 19.95 26.13 24.32 1.81
5.Harvesting 25.25 28.43 21.78 6.65 27.68 29.52 26.06 3.46
6.Cultivation 21.53 30.75 24.84 5.91 24.21 36.03 34.64 1.39
7.Forestry 40.00 20.00 20.00 - 42.50 54.26 54.26 -
8.Plantation 18.06 - - - - 60.02 39.79 20.23
9.Animal Husbandry 15.08 25.20 23.39 1.81 20.38 19.48 12.58 6.90
10.Fisheries - - - - 50.00 - - -
11.Other (Agricultural operations)
19.70 20.00 20.00 - 20.40 25.80 25.80 -
The average daily earnings of child workers recorded a mix trend in all the four
categories of households during 2004-05 over 1999-2000. Among main agricultural operations in transplanting average daily earnings of child workers were as high as Rs. 39.60 for All Classes Households. Taking all the operations as well as all the Rural labour Households into consideration, it was found that the highest daily earnings of Rs. 57.14 were received by the child workers of the Scheduled Castes Households engaged in ploughing operations and the lowest (Rs.10.00) by the child workers of the same Classes of Households engaged in transplanting operations showing a decrease of 68.9% over the previous survey.
(a) All Classes
The average daily earnings of child workers belonging to Rural Labour Households in various agricultural operations is presented, state-wise, in Statement 4.1(a)(i)C. The analysis has been confined to major states as only a few of the minor states/union territories reported daily earnings for child workers engaged in agricultural operations. The highest daily earnings were reported in Ploughing (Rs.71.43) in Punjab, Sowing (Rs.60.00) in Bihar, Transplanting (Rs.70.00) from Maharashtra, Weeding (Rs.39.60) from Gujarat, Harvesting (Rs.48.71) from Haryana and in Cultivation (Rs.50.00) were reported from the Rajasthan state. In all other states, the earnings were quite low as compared to the major states. The payments were made both in cash and in kind. Earnings in forestry were reported only from Madhya Pradesh (Rs.25.00), Rajasthan (Rs.50.00) and Uttar Pradesh (Rs.60.00). Similarly, the earnings in plantation were reported only from Andhra Pradesh (Rs.60.02) and Karnataka (Rs.42.54). In animal husbandry, the highest earnings of Rs.95.00 was reported from Punjab followed by West Bengal (Rs.30.35). In Maharashtra, the daily earnings in this operation during 2004-05 were reported at Rs. 14.17 which was much lower than that of the previous survey (Rs. 20.67).
38
(b) Scheduled Castes
The average daily earnings of child workers belonging to the Scheduled Castes Rural Labour Households are given in Statement 4.1(a) (ii)C. The earnings for ploughing operation were reported only from Punjab at Rs.57.14. In Sowing, earnings were reported only from Karnataka (Rs.25.71), Punjab (Rs.19.13) and West Bengal (Rs. 45.00). In Transplanting, the earnings of child workers was only reported from West Bengal at (Rs.10.00). Similarly, the earnings in weeding operation ranged between Rs. 22.55 in Andhra Pradesh and Rs. 42.50 in West Bengal. In harvesting, the earnings varied from Rs. 10.67 in Karnataka to Rs. 50.00 in Tamil Nadu. Though harvesting appeared to be a popular operation, yet the earnings in this operation were observed to be almost equivalent to those reported for other major agricultural operations. The daily earnings in cultivation operation ranged between Rs. 50.00 in Tamil Nadu and Rs. 14.26 in Orissa. In forestry and plantation operations the earnings for child worker were reported only from Madhya Pradesh (Rs.30.00) and Karnataka (Rs.40.00) respectively. Animal Husbandry secured highest in West Begal (Rs.30.35) and the lowest in Karnataka (Rs. 10.00).
(c) Scheduled Tribes
The average daily earnings of child workers belonging to the Scheduled Tribes Rural Labour Households engaged in various agricultural operations are presented in Statement 4.1(a) (iii)C. The earnings in ploughing operation was reported only from one state of Karnataka at (Rs.30.00). Sowing, Forestry, Plantation, Animal Husbandry and Fisheries did not appear to be popular occupations among the Scheduled Tribes child workers as daily earnings were not at all available and if available it was for very few states. The daily earnings in transplanting ranged between Rs. 70.00 in Maharashtra and Rs. 30.00 each in Karnataka and Madhya Pradesh. In weeding operation the highest earnings were reported from Gujarat (Rs.38.33) and the lowest (Rs.20.00) in Andhra Pradesh. In harvesting and cultivation operation highest earnings were reported from West Bengal (Rs.44.99) and Maharashtra (Rs.40.74) whereas the lowest earnings were (Rs.21.78) from Maharashtra and Rs.25.00 from Madhya Pradesh respectively. Taking all the States/UTs in to consideration the lowest earnings (Rs.18.41) in harvesting operation was found in the state of Chhattisgarh.
(d) Other Backward Classes
Average daily earnings of child workers of Other Backward Classes households is given in statement 4.1 (a) (iv)C. In Ploughing operation, amongst the major states daily earnings were reported only from three states viz; Gujarat (Rs.30.00), Karnataka (Rs.25.00) and Punjab (Rs.70.00). Sowing recorded earnings only in Andhra Pradesh (Rs.27.09), Bihar (Rs.60.00) and Tamil nadu (Rs.30.00). In transplanting, highest earnings were in Andhra Pradesh (Rs.58.98) followed by Bihar (Rs.44.44) and the lowest in Uttar Pradesh (Rs. 34.29). Weeding operation secured the highest earnings of Rs.40.00 in Uttar Pradesh and lowest of Rs.11.16 in Bihar. Harvesting and Cultivation operations appeared most popular among the child workers. Daily earnings in harvesting varied widely from Rs. 46.97 in Gujarat to Rs. 18.62 in Maharashtra. Earnings in cultivation ranged between Rs.57.39 (Maharashtra) and Rs.20.00 (Tamil Nadu). In Animal husbandry, the earnings ranged from Rs.21.43 (Tamil Nadu) to Rs.95.00 (Punjab).
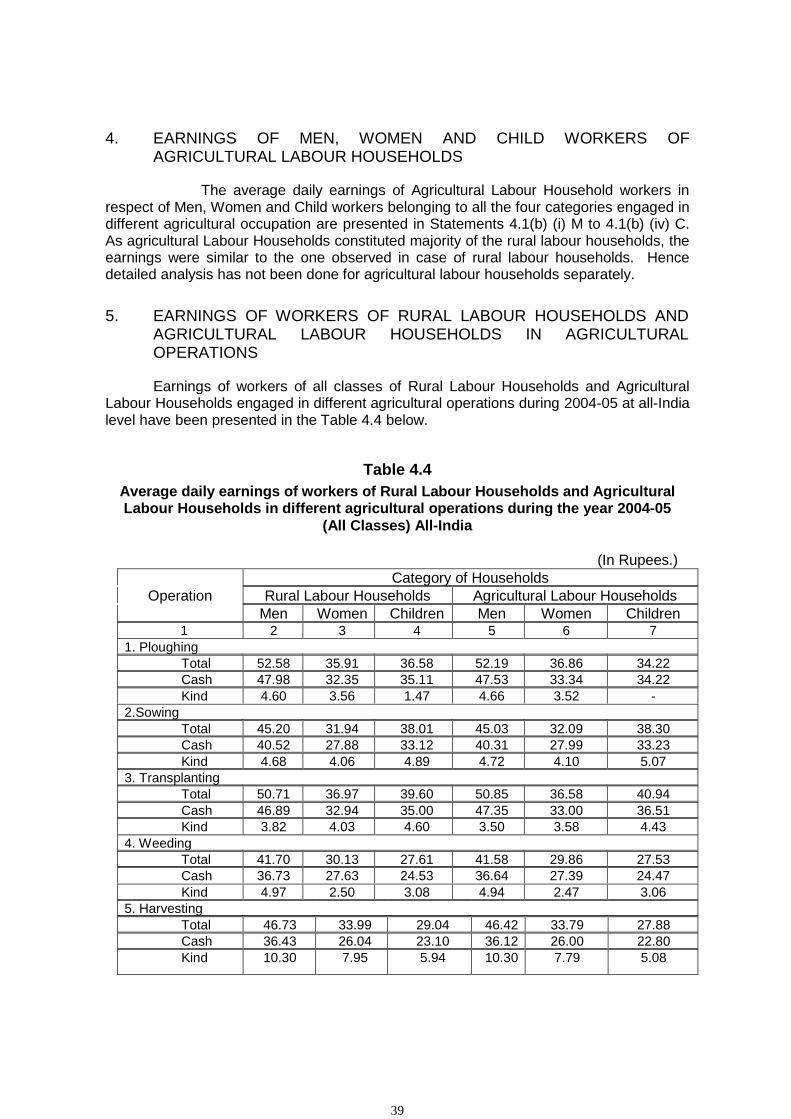
39
4. EARNINGS OF MEN, WOMEN AND CHILD WORKERS OF
AGRICULTURAL LABOUR HOUSEHOLDS
The average daily earnings of Agricultural Labour Household workers in respect of Men, Women and Child workers belonging to all the four categories engaged in different agricultural occupation are presented in Statements 4.1(b) (i) M to 4.1(b) (iv) C. As agricultural Labour Households constituted majority of the rural labour households, the earnings were similar to the one observed in case of rural labour households. Hence detailed analysis has not been done for agricultural labour households separately. 5. EARNINGS OF WORKERS OF RURAL LABOUR HOUSEHOLDS AND
AGRICULTURAL LABOUR HOUSEHOLDS IN AGRICULTURAL OPERATIONS
Earnings of workers of all classes of Rural Labour Households and Agricultural
Labour Households engaged in different agricultural operations during 2004-05 at all-India level have been presented in the Table 4.4 below.
Table 4.4 Average daily earnings of workers of Rural Labour Households and Agricultural Labour Households in different agricultural operations during the year 2004-05
(All Classes) All-India
(In Rupees.) Category of Households
Operation Rural Labour Households Agricultural Labour Households Men Women Children Men Women Children 1 2 3 4 5 6 7
1. Ploughing Total 52.58 35.91 36.58 52.19 36.86 34.22 Cash 47.98 32.35 35.11 47.53 33.34 34.22 Kind 4.60 3.56 1.47 4.66 3.52 -
2.Sowing Total 45.20 31.94 38.01 45.03 32.09 38.30 Cash 40.52 27.88 33.12 40.31 27.99 33.23 Kind 4.68 4.06 4.89 4.72 4.10 5.07
3. Transplanting Total 50.71 36.97 39.60 50.85 36.58 40.94 Cash 46.89 32.94 35.00 47.35 33.00 36.51 Kind 3.82 4.03 4.60 3.50 3.58 4.43
4. Weeding Total 41.70 30.13 27.61 41.58 29.86 27.53 Cash 36.73 27.63 24.53 36.64 27.39 24.47 Kind 4.97 2.50 3.08 4.94 2.47 3.06
5. Harvesting Total 46.73 33.99 29.04 46.42 33.79 27.88 Cash 36.43 26.04 23.10 36.12 26.00 22.80 Kind 10.30 7.95 5.94 10.30 7.79 5.08

40
Table 4.4 Concld… 1 2 3 4 5 6 7
6. Cultivation Total 47.20 33.09 31.49 47.10 32.86 31.37 Cash 42.77 30.13 29.07 42.65 29.90 28.91 Kind 4.43 2.96 2.42 4.45 2.96 2.46
7. Forestry Total 52.12 32.22 32.26 46.38 31.76 25.00 Cash 50.89 30.27 32.26 45.12 29.84 25.00 Kind 1.23 1.95 - 1.26 1.92 -
8. Plantation Total 66.15 52.38 46.73 67.72 53.63 56.89 Cash 61.11 48.62 41.88 62.03 49.57 44.91 Kind 5.04 3.76 4.85 5.69 4.06 11.98
9. Animal Husbandry Total 36.70 31.65 20.76 36.34 30.29 20.83 Cash 31.22 20.87 16.70 31.51 20.54 16.69 Kind 5.48 10.78 4.06 4.83 9.75 4.14
10. Fisheries Total 92.33 43.57 25.00 63.54 25.00 - Cash 85.57 37.92 25.00 57.90 25.00 - Kind 6.76 5.65 5.64 - -
11. Other (Agriculture) Total 48.21 35.00 27.33 47.71 34.77 27.33 Cash 45.24 31.92 27.30 44.76 31.83 27.30 Kind 2.97 3.08 0.03 2.95 2.94 0.03
It may be seen from the above Table that the average daily earnings of the Rural Labour Households are marginally higher than those of the Agricultural Labour Households in most of the operations. Only in plantation operation, the daily earnings of male workers of Agricultural Labour Households were slightly higher than those of the Rural Labour Households. Similarly, except in ploughing, Sowing and plantation operations, women in Rural Labour Households earned better than those in the Agricultural Labour Households. In case of child workers, not much variation was found in the daily average earnings of both the households except in plantation where an increase of 21.7% was noticed for child workers of agricultural labour households. The narrow difference in average daily earnings in agricultural operations was mainly due to the fact that Agricultural Labour Households were a sub-set of Rural Labour Households which constitute about 80% of the Rural Labour Households.
6. Level of Real Earnings
Information on money earnings of men of Agricultural Labour Households engaged in agricultural occupations along with the daily real earnings for the period 1999-2000 and 2004-05 in respect of 20 States which the new series on base 1986-87=100 of the Consumer Price Index Numbers for Agricultural Labourers is given in Statement 4.2. The real earnings have been derived by deflating the money earnings with the index numbers for agricultural labourers on base 1986-87=100. The real earnings during 2004-05 have increased in all states over the previous survey period except in the state of Jammu & Kashmir. The highest increase 39.24% was observed in Himachal Pradesh followed by Orissa 37.83% in terms of money earnings. This increase was, however, lowest in the State of West Bengal to the tune of 4.06% only.

41
7. Minimum Wages in Agriculture
The Minimum Wages Act, 1948 is the only statutory legislation which ensures minimum wages to workers in agriculture, thus, protecting against exploitation by the employers. The State-wise average daily earnings of Agricultural Labour Households and Rural Labour Households during 2004-05 in agricultural operations alongwith the prevailing minimum wages under the Minimum Wages Act, 1948 as fixed by the respective State Governments are given in Statement 4.3. The difference between the daily earnings of the Agricultural Labour Households and those of the Rural Labour Households was not very large as agricultural labour households constituted about 80 percent of the rural labour households. It has been observed that in many major States such as Bihar, Gujarat, Haryana, Karnataka, Madhya Pradesh, Orissa, Punjab Rajasthan, Uttar Pradesh and West Bengal, the average daily earnings of men were even less than the minimum wages fixed by the respective State Governments. The position in respect of some minor states/union territories was much better. In all such states/union territories the average daily earnings were more than the minimum wages fixed under the Act, 1948 except Chhattisgarh, Jharkhand, Manipur, Meghalaya, Sikkim, Uttranchal, Chandigarh and Delhi.
8. Wages in Agriculture vis-a-vis Wages in Factories, Coal Mines and Plantations
The average daily earnings of men engaged in agricultural operations and those
who are employed in factories, mines & plantations are given in Statement 4.4 Though these are not strictly comparable with each other for various reasons but a rough estimate can be made out of these details. It has been observed that the daily earnings in agriculture were generally comparable with those in plantations and factories but are much lower than those prevailing in coal mines.

STATEMENT 2.1 (a) (i)
AVERAGE EARNING STRENGTH OF RURAL LABOUR HOUSEHOLDS BY SEX - ALL CLASSES HOUSEHOLDS
(No. of persons)
AVERAGE SIZE OF EARNING STRENGTH SL. STATES/ HOUSEHOLDS 1999-2000 2004-05NO. UNION TERRITORIES 1999-2000 2004-05 MALE FEMALE TOTAL MALE FEMALE TOTAL1 2 3 4 5 6 7 8 9 10
Major States1 Andhra Pradesh 4.14 3.90 1.24 1.02 2.26 1.19 0.99 2.182 Assam 5.01 4.91 1.35 0.44 1.79 1.29 0.49 1.783 Bihar 4.84 4.88 1.30 0.42 1.72 1.29 0.31 1.604 Gujarat 4.93 4.85 1.44 0.90 2.34 1.47 0.82 2.295 Haryana 5.20 4.50 1.34 0.13 1.47 1.27 0.22 1.496 Karnataka 4.76 4.48 1.36 1.01 2.37 1.36 1.05 2.417 Kerala 4.63 4.35 1.27 0.46 1.73 1.19 0.45 1.648 Madhya Pradesh 5.08 4.91 1.38 0.87 2.25 1.37 0.89 2.269 Maharashtra 4.65 4.36 1.25 0.99 2.24 1.24 1.01 2.25
10 Orissa 4.42 4.39 1.22 0.56 1.78 1.30 0.62 1.9211 Punjab 5.05 4.97 1.44 0.10 1.54 1.44 0.13 1.5712 Rajasthan 5.14 5.15 1.38 0.68 2.06 1.34 0.69 2.0313 TamilNadu 3.90 3.79 1.16 0.85 2.01 1.10 0.89 1.9914 Uttar Pradesh 5.14 5.25 1.28 0.40 1.68 1.31 0.36 1.6715 West Bengal 4.74 4.58 1.28 0.40 1.68 1.28 0.32 1.60
Other States/UTs16 Arunachal Pradesh 4.19 3.98 0.67 0.36 1.03 1.17 0.51 1.6817 Chhattisgarh 4.96 4.92 1.31 1.11 2.42 1.34 1.09 2.4318 Goa 4.82 4.40 1.38 0.33 1.71 1.08 0.36 1.4419 Himachal Pradesh 4.75 4.82 1.30 0.58 1.88 1.33 0.84 2.1720 Jammu & Kashmir 4.67 5.40 1.45 0.02 1.47 1.48 0.02 1.5021 Jharkhand 4.76 4.67 1.35 0.46 1.81 1.27 0.58 1.8522 Manipur 4.58 4.71 1.23 0.37 1.60 1.18 0.32 1.5023 Meghalaya 4.00 4.22 0.98 0.88 1.86 1.19 0.86 2.0524 Mizoram 4.22 3.90 1.16 0.38 1.54 1.36 1.04 2.4025 Nagaland 5.05 3.89 1.34 0.46 1.80 1.17 0.53 1.7026 Sikkim 4.57 3.58 1.13 0.44 1.57 1.14 0.34 1.4827 Tripura 4.30 4.29 1.17 0.15 1.32 1.21 0.20 1.4128 Uttranchal 4.99 4.97 1.17 0.35 1.52 1.36 0.54 1.9029 A & N Islands 4.20 4.11 1.16 0.20 1.36 1.25 0.17 1.4230 Chandigarh 2.83 1.90 1.21 0.07 1.28 1.02 - 1.0231 D & N Haveli 4.48 3.88 1.28 0.85 2.13 1.23 0.54 1.7732 Daman & Diu 4.17 4.62 1.81 0.47 2.28 1.36 0.68 2.0433 Delhi 4.14 3.58 2.54 0.03 2.57 1.00 - 1.0034 Lakshadweep 3.81 5.30 1.41 0.11 1.52 2.82 - 2.8235 Pondicherry 4.02 3.65 1.20 0.60 1.80 0.96 0.70 1.66
ALL-INDIA 4.67 4.56 1.29 0.69 1.98 1.28 0.68 1.96
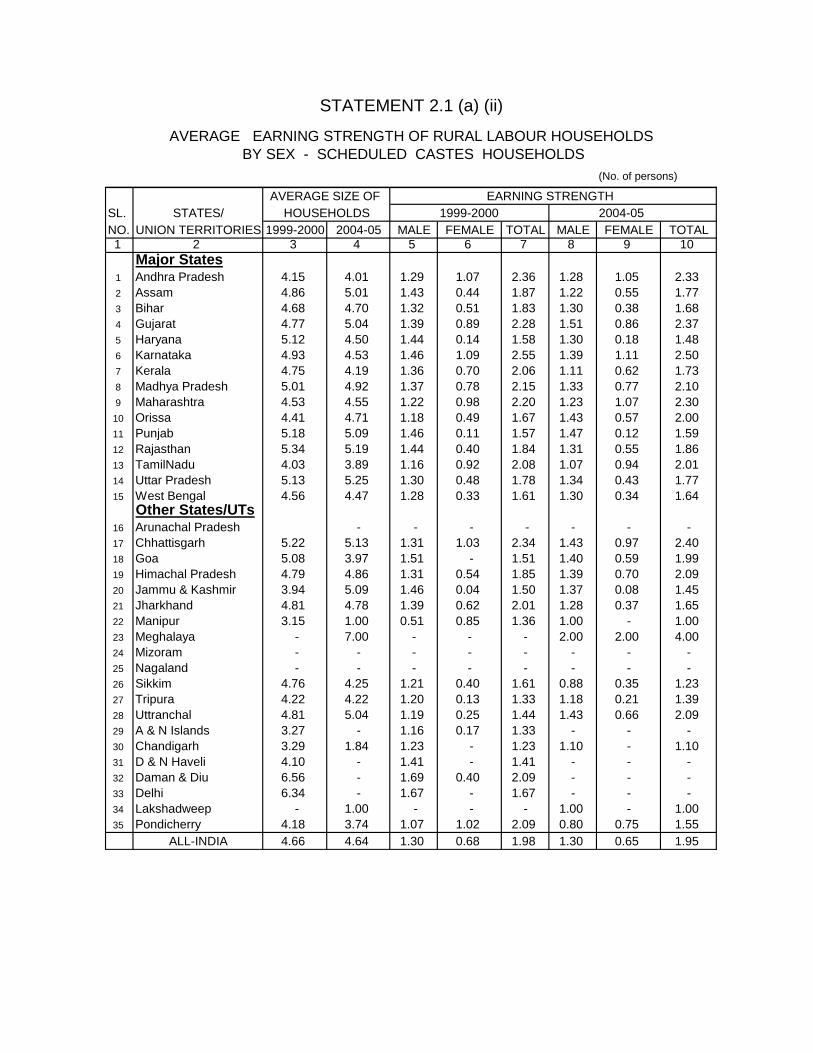
STATEMENT 2.1 (a) (ii)
AVERAGE EARNING STRENGTH OF RURAL LABOUR HOUSEHOLDS BY SEX - SCHEDULED CASTES HOUSEHOLDS
(No. of persons)
AVERAGE SIZE OF EARNING STRENGTH SL. STATES/ HOUSEHOLDS 1999-2000 2004-05NO. UNION TERRITORIES 1999-2000 2004-05 MALE FEMALE TOTAL MALE FEMALE TOTAL1 2 3 4 5 6 7 8 9 10
Major States1 Andhra Pradesh 4.15 4.01 1.29 1.07 2.36 1.28 1.05 2.332 Assam 4.86 5.01 1.43 0.44 1.87 1.22 0.55 1.773 Bihar 4.68 4.70 1.32 0.51 1.83 1.30 0.38 1.684 Gujarat 4.77 5.04 1.39 0.89 2.28 1.51 0.86 2.375 Haryana 5.12 4.50 1.44 0.14 1.58 1.30 0.18 1.486 Karnataka 4.93 4.53 1.46 1.09 2.55 1.39 1.11 2.507 Kerala 4.75 4.19 1.36 0.70 2.06 1.11 0.62 1.738 Madhya Pradesh 5.01 4.92 1.37 0.78 2.15 1.33 0.77 2.109 Maharashtra 4.53 4.55 1.22 0.98 2.20 1.23 1.07 2.30
10 Orissa 4.41 4.71 1.18 0.49 1.67 1.43 0.57 2.0011 Punjab 5.18 5.09 1.46 0.11 1.57 1.47 0.12 1.5912 Rajasthan 5.34 5.19 1.44 0.40 1.84 1.31 0.55 1.8613 TamilNadu 4.03 3.89 1.16 0.92 2.08 1.07 0.94 2.0114 Uttar Pradesh 5.13 5.25 1.30 0.48 1.78 1.34 0.43 1.7715 West Bengal 4.56 4.47 1.28 0.33 1.61 1.30 0.34 1.64
Other States/UTs16 Arunachal Pradesh - - - - - - -17 Chhattisgarh 5.22 5.13 1.31 1.03 2.34 1.43 0.97 2.4018 Goa 5.08 3.97 1.51 - 1.51 1.40 0.59 1.9919 Himachal Pradesh 4.79 4.86 1.31 0.54 1.85 1.39 0.70 2.0920 Jammu & Kashmir 3.94 5.09 1.46 0.04 1.50 1.37 0.08 1.4521 Jharkhand 4.81 4.78 1.39 0.62 2.01 1.28 0.37 1.6522 Manipur 3.15 1.00 0.51 0.85 1.36 1.00 - 1.0023 Meghalaya - 7.00 - - - 2.00 2.00 4.0024 Mizoram - - - - - - - -25 Nagaland - - - - - - - -26 Sikkim 4.76 4.25 1.21 0.40 1.61 0.88 0.35 1.2327 Tripura 4.22 4.22 1.20 0.13 1.33 1.18 0.21 1.3928 Uttranchal 4.81 5.04 1.19 0.25 1.44 1.43 0.66 2.0929 A & N Islands 3.27 - 1.16 0.17 1.33 - - -30 Chandigarh 3.29 1.84 1.23 - 1.23 1.10 - 1.1031 D & N Haveli 4.10 - 1.41 - 1.41 - - -32 Daman & Diu 6.56 - 1.69 0.40 2.09 - - -33 Delhi 6.34 - 1.67 - 1.67 - - -34 Lakshadweep - 1.00 - - - 1.00 - 1.0035 Pondicherry 4.18 3.74 1.07 1.02 2.09 0.80 0.75 1.55
ALL-INDIA 4.66 4.64 1.30 0.68 1.98 1.30 0.65 1.95
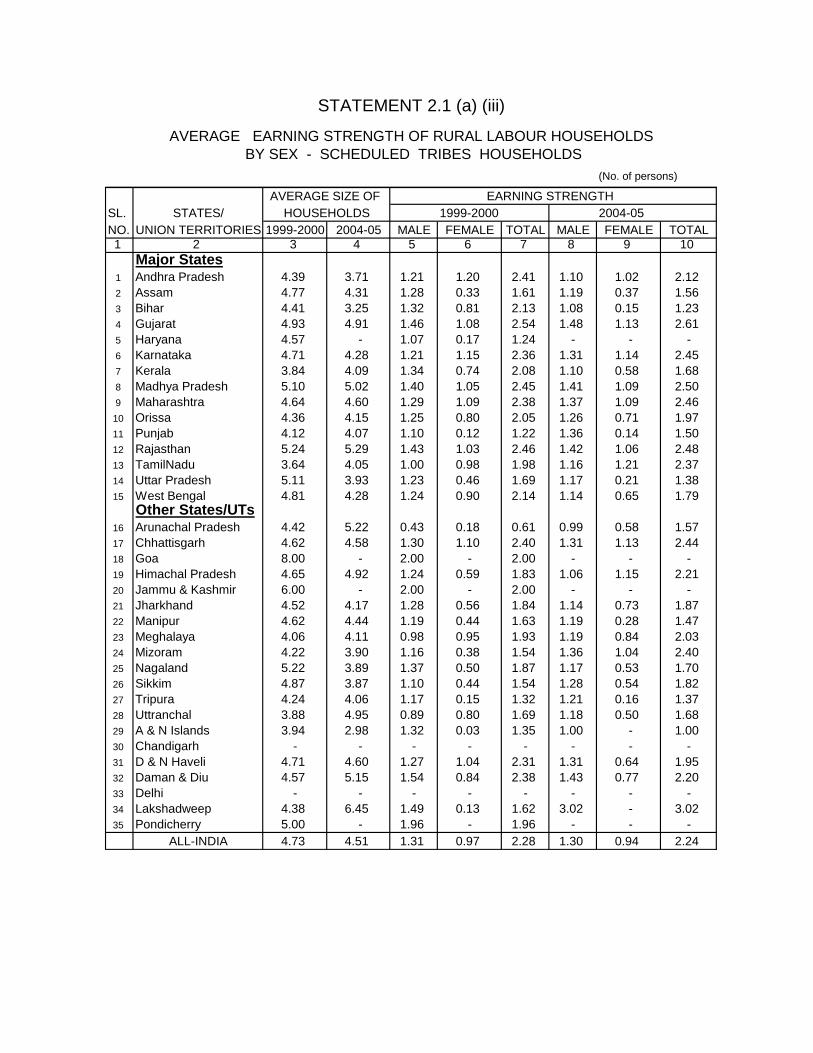
STATEMENT 2.1 (a) (iii)
AVERAGE EARNING STRENGTH OF RURAL LABOUR HOUSEHOLDS BY SEX - SCHEDULED TRIBES HOUSEHOLDS
(No. of persons)
AVERAGE SIZE OF EARNING STRENGTH SL. STATES/ HOUSEHOLDS 1999-2000 2004-05NO. UNION TERRITORIES 1999-2000 2004-05 MALE FEMALE TOTAL MALE FEMALE TOTAL1 2 3 4 5 6 7 8 9 10
Major States1 Andhra Pradesh 4.39 3.71 1.21 1.20 2.41 1.10 1.02 2.122 Assam 4.77 4.31 1.28 0.33 1.61 1.19 0.37 1.563 Bihar 4.41 3.25 1.32 0.81 2.13 1.08 0.15 1.234 Gujarat 4.93 4.91 1.46 1.08 2.54 1.48 1.13 2.615 Haryana 4.57 - 1.07 0.17 1.24 - - -6 Karnataka 4.71 4.28 1.21 1.15 2.36 1.31 1.14 2.457 Kerala 3.84 4.09 1.34 0.74 2.08 1.10 0.58 1.688 Madhya Pradesh 5.10 5.02 1.40 1.05 2.45 1.41 1.09 2.509 Maharashtra 4.64 4.60 1.29 1.09 2.38 1.37 1.09 2.46
10 Orissa 4.36 4.15 1.25 0.80 2.05 1.26 0.71 1.9711 Punjab 4.12 4.07 1.10 0.12 1.22 1.36 0.14 1.5012 Rajasthan 5.24 5.29 1.43 1.03 2.46 1.42 1.06 2.4813 TamilNadu 3.64 4.05 1.00 0.98 1.98 1.16 1.21 2.3714 Uttar Pradesh 5.11 3.93 1.23 0.46 1.69 1.17 0.21 1.3815 West Bengal 4.81 4.28 1.24 0.90 2.14 1.14 0.65 1.79
Other States/UTs16 Arunachal Pradesh 4.42 5.22 0.43 0.18 0.61 0.99 0.58 1.5717 Chhattisgarh 4.62 4.58 1.30 1.10 2.40 1.31 1.13 2.4418 Goa 8.00 - 2.00 - 2.00 - - -19 Himachal Pradesh 4.65 4.92 1.24 0.59 1.83 1.06 1.15 2.2120 Jammu & Kashmir 6.00 - 2.00 - 2.00 - - -21 Jharkhand 4.52 4.17 1.28 0.56 1.84 1.14 0.73 1.8722 Manipur 4.62 4.44 1.19 0.44 1.63 1.19 0.28 1.4723 Meghalaya 4.06 4.11 0.98 0.95 1.93 1.19 0.84 2.0324 Mizoram 4.22 3.90 1.16 0.38 1.54 1.36 1.04 2.4025 Nagaland 5.22 3.89 1.37 0.50 1.87 1.17 0.53 1.7026 Sikkim 4.87 3.87 1.10 0.44 1.54 1.28 0.54 1.8227 Tripura 4.24 4.06 1.17 0.15 1.32 1.21 0.16 1.3728 Uttranchal 3.88 4.95 0.89 0.80 1.69 1.18 0.50 1.6829 A & N Islands 3.94 2.98 1.32 0.03 1.35 1.00 - 1.0030 Chandigarh - - - - - - - -31 D & N Haveli 4.71 4.60 1.27 1.04 2.31 1.31 0.64 1.9532 Daman & Diu 4.57 5.15 1.54 0.84 2.38 1.43 0.77 2.2033 Delhi - - - - - - - -34 Lakshadweep 4.38 6.45 1.49 0.13 1.62 3.02 - 3.0235 Pondicherry 5.00 - 1.96 - 1.96 - - -
ALL-INDIA 4.73 4.51 1.31 0.97 2.28 1.30 0.94 2.24

STATEMENT 2.1 (a) (iv)
AVERAGE EARNING STRENGTH OF RURAL LABOUR HOUSEHOLDS BY SEX - OTHER BACKWARD CLASSES HOUSEHOLDS
(No. of persons)
AVERAGE SIZE OF EARNING STRENGTH SL. STATES/ HOUSEHOLDS 1999-2000 2004-05NO. UNION TERRITORIES 1999-2000 2004-05 MALE FEMALE TOTAL MALE FEMALE TOTAL1 2 3 4 5 6 7 8 9 10
Major States1 Andhra Pradesh 4.12 3.95 1.23 1.03 2.26 1.16 1.05 2.212 Assam 5.03 4.96 1.33 0.63 1.96 1.32 0.82 2.143 Bihar 4.99 5.06 1.31 0.36 1.67 1.28 0.27 1.554 Gujarat 5.01 4.68 1.48 0.73 2.21 1.41 0.67 2.085 Haryana 5.47 4.45 1.22 0.12 1.34 1.22 0.33 1.556 Karnataka 4.71 4.40 1.36 0.93 2.29 1.32 1.01 2.337 Kerala 4.82 4.60 1.26 0.40 1.66 1.26 0.39 1.658 Madhya Pradesh 5.08 4.80 1.37 0.75 2.12 1.35 0.81 2.169 Maharashtra 4.78 4.30 1.25 1.09 2.34 1.23 1.04 2.27
10 Orissa 4.35 4.32 1.21 0.43 1.64 1.21 0.60 1.8111 Punjab 4.66 4.76 1.37 0.06 1.43 1.36 0.18 1.5412 Rajasthan 5.09 5.02 1.33 0.60 1.93 1.29 0.52 1.8113 TamilNadu 3.82 3.72 1.17 0.81 1.98 1.13 0.86 1.9914 Uttar Pradesh 5.05 5.23 1.29 0.30 1.59 1.29 0.29 1.5815 West Bengal 4.37 4.32 1.27 0.34 1.61 1.17 0.26 1.43
Other States/UTs16 Arunachal Pradesh 4.25 1.00 0.78 - 0.78 1.00 - 1.0017 Chhattisgarh 4.06 5.04 1.33 1.15 2.48 1.32 1.14 2.4618 Goa 4.02 4.95 0.82 0.81 1.63 1.09 0.17 1.2619 Himachal Pradesh 4.56 4.90 1.43 0.81 2.24 1.36 1.03 2.3920 Jammu & Kashmir 5.27 5.40 1.68 0.01 1.69 1.39 - 1.3921 Jharkhand 4.79 4.93 1.38 0.34 1.72 1.33 0.61 1.9422 Manipur 4.62 4.79 1.10 0.58 1.68 1.19 0.33 1.5223 Meghalaya 5.00 - 1.00 - 1.00 - - -24 Mizoram - - - - - - - -25 Nagaland 3.00 - 1.00 - 1.00 - - -26 Sikkim 4.76 3.70 1.17 0.43 1.60 1.09 0.21 1.3027 Tripura 4.17 4.25 1.08 0.21 1.29 1.26 0.18 1.4428 Uttranchal 5.94 4.98 1.48 0.25 1.73 1.37 0.26 1.6329 A & N Islands 4.23 - 1.00 0.36 1.36 - - -30 Chandigarh 3.40 - 1.17 - 1.17 - - -31 D & N Haveli 3.48 2.27 1.00 - 1.00 1.00 - 1.0032 Daman & Diu 4.29 4.05 2.46 - 2.46 1.23 0.44 1.6733 Delhi 4.02 2.25 2.66 0.03 2.69 1.00 - 1.0034 Lakshadweep 1.00 2.52 1.00 - 1.00 2.52 - 2.5235 Pondicherry 3.98 3.59 1.25 0.42 1.67 1.13 0.66 1.79
ALL-INDIA 4.61 4.50 1.28 0.69 1.97 1.25 0.71 1.96
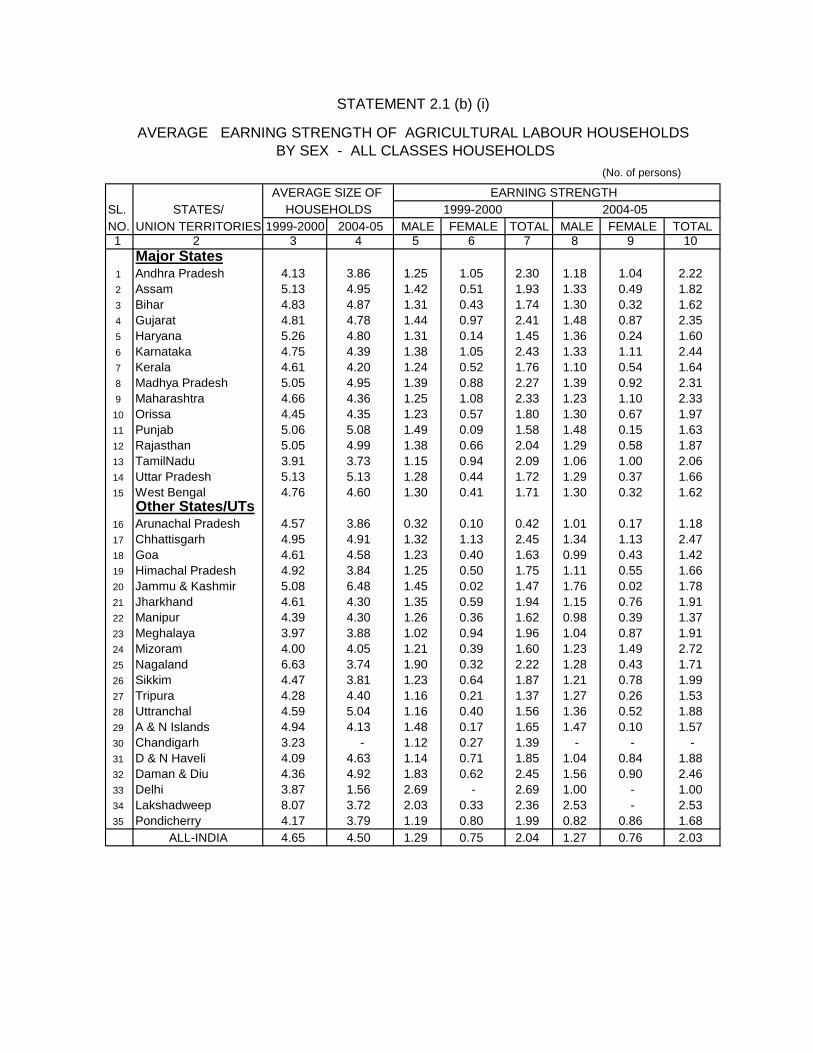
STATEMENT 2.1 (b) (i)
AVERAGE EARNING STRENGTH OF AGRICULTURAL LABOUR HOUSEHOLDS BY SEX - ALL CLASSES HOUSEHOLDS
(No. of persons)
AVERAGE SIZE OF EARNING STRENGTH SL. STATES/ HOUSEHOLDS 1999-2000 2004-05NO. UNION TERRITORIES 1999-2000 2004-05 MALE FEMALE TOTAL MALE FEMALE TOTAL1 2 3 4 5 6 7 8 9 10
Major States1 Andhra Pradesh 4.13 3.86 1.25 1.05 2.30 1.18 1.04 2.222 Assam 5.13 4.95 1.42 0.51 1.93 1.33 0.49 1.823 Bihar 4.83 4.87 1.31 0.43 1.74 1.30 0.32 1.624 Gujarat 4.81 4.78 1.44 0.97 2.41 1.48 0.87 2.355 Haryana 5.26 4.80 1.31 0.14 1.45 1.36 0.24 1.606 Karnataka 4.75 4.39 1.38 1.05 2.43 1.33 1.11 2.447 Kerala 4.61 4.20 1.24 0.52 1.76 1.10 0.54 1.648 Madhya Pradesh 5.05 4.95 1.39 0.88 2.27 1.39 0.92 2.319 Maharashtra 4.66 4.36 1.25 1.08 2.33 1.23 1.10 2.33
10 Orissa 4.45 4.35 1.23 0.57 1.80 1.30 0.67 1.9711 Punjab 5.06 5.08 1.49 0.09 1.58 1.48 0.15 1.6312 Rajasthan 5.05 4.99 1.38 0.66 2.04 1.29 0.58 1.8713 TamilNadu 3.91 3.73 1.15 0.94 2.09 1.06 1.00 2.0614 Uttar Pradesh 5.13 5.13 1.28 0.44 1.72 1.29 0.37 1.6615 West Bengal 4.76 4.60 1.30 0.41 1.71 1.30 0.32 1.62
Other States/UTs16 Arunachal Pradesh 4.57 3.86 0.32 0.10 0.42 1.01 0.17 1.1817 Chhattisgarh 4.95 4.91 1.32 1.13 2.45 1.34 1.13 2.4718 Goa 4.61 4.58 1.23 0.40 1.63 0.99 0.43 1.4219 Himachal Pradesh 4.92 3.84 1.25 0.50 1.75 1.11 0.55 1.6620 Jammu & Kashmir 5.08 6.48 1.45 0.02 1.47 1.76 0.02 1.7821 Jharkhand 4.61 4.30 1.35 0.59 1.94 1.15 0.76 1.9122 Manipur 4.39 4.30 1.26 0.36 1.62 0.98 0.39 1.3723 Meghalaya 3.97 3.88 1.02 0.94 1.96 1.04 0.87 1.9124 Mizoram 4.00 4.05 1.21 0.39 1.60 1.23 1.49 2.7225 Nagaland 6.63 3.74 1.90 0.32 2.22 1.28 0.43 1.7126 Sikkim 4.47 3.81 1.23 0.64 1.87 1.21 0.78 1.9927 Tripura 4.28 4.40 1.16 0.21 1.37 1.27 0.26 1.5328 Uttranchal 4.59 5.04 1.16 0.40 1.56 1.36 0.52 1.8829 A & N Islands 4.94 4.13 1.48 0.17 1.65 1.47 0.10 1.5730 Chandigarh 3.23 - 1.12 0.27 1.39 - - -31 D & N Haveli 4.09 4.63 1.14 0.71 1.85 1.04 0.84 1.8832 Daman & Diu 4.36 4.92 1.83 0.62 2.45 1.56 0.90 2.4633 Delhi 3.87 1.56 2.69 - 2.69 1.00 - 1.0034 Lakshadweep 8.07 3.72 2.03 0.33 2.36 2.53 - 2.5335 Pondicherry 4.17 3.79 1.19 0.80 1.99 0.82 0.86 1.68
ALL-INDIA 4.65 4.50 1.29 0.75 2.04 1.27 0.76 2.03

STATEMENT 2.1 (b) (ii)
AVERAGE EARNING STRENGTH OF AGRICULTURAL LABOUR HOUSEHOLDS BY SEX - SCHEDULED CASTES HOUSEHOLDS
(No. of persons)
AVERAGE SIZE OF EARNING STRENGTH SL. STATES/ HOUSEHOLDS 1999-2000 2004-05NO. UNION TERRITORIES 1999-2000 2004-05 MALE FEMALE TOTAL MALE FEMALE TOTAL1 2 3 4 5 6 7 8 9 10
Major States1 Andhra Pradesh 4.13 3.97 1.29 1.10 2.39 1.27 1.09 2.362 Assam 5.39 5.02 1.57 0.67 2.24 1.29 0.58 1.873 Bihar 4.67 4.70 1.33 0.52 1.85 1.30 0.39 1.694 Gujarat 4.67 5.15 1.38 0.94 2.32 1.59 0.99 2.585 Haryana 5.28 4.79 1.43 0.16 1.59 1.45 0.21 1.666 Karnataka 4.94 4.52 1.46 1.11 2.57 1.37 1.14 2.517 Kerala 4.74 3.82 1.35 0.73 2.08 1.04 0.64 1.688 Madhya Pradesh 5.02 5.10 1.38 0.82 2.20 1.35 0.83 2.189 Maharashtra 4.54 4.45 1.23 1.05 2.28 1.21 1.12 2.33
10 Orissa 4.44 4.79 1.19 0.49 1.68 1.49 0.59 2.0811 Punjab 5.21 5.02 1.51 0.10 1.61 1.50 0.13 1.6312 Rajasthan 5.33 5.16 1.37 0.33 1.70 1.30 0.60 1.9013 TamilNadu 3.98 3.85 1.14 0.99 2.13 1.03 1.01 2.0414 Uttar Pradesh 5.13 5.04 1.29 0.52 1.81 1.28 0.47 1.7515 West Bengal 4.60 4.53 1.29 0.34 1.63 1.34 0.35 1.69
Other States/UTs16 Arunachal Pradesh - - - - - - -17 Chhattisgarh 5.23 5.14 1.33 1.04 2.37 1.45 0.97 2.4218 Goa 5.00 6.00 2.00 - 2.00 3.00 1.00 4.0019 Himachal Pradesh 4.33 4.19 1.33 0.62 1.95 1.21 0.45 1.6620 Jammu & Kashmir 4.97 5.57 1.51 - 1.51 1.00 - 1.0021 Jharkhand 4.63 4.75 1.39 0.77 2.16 1.32 0.52 1.8422 Manipur 3.15 1.00 0.51 0.85 1.36 1.00 - 1.0023 Meghalaya - 7.00 - - - 2.00 2.00 4.0024 Mizoram - - - - - - - -25 Nagaland - - - - - - - -26 Sikkim 4.74 4.61 1.37 0.66 2.03 0.81 1.00 1.8127 Tripura 4.20 4.47 1.30 0.26 1.56 1.28 0.33 1.6128 Uttranchal 4.08 5.28 0.94 0.39 1.33 1.46 0.65 2.1129 A & N Islands 3.52 - 1.48 - 1.48 - - -30 Chandigarh 3.02 - 1.11 - 1.11 - - -31 D & N Haveli 5.00 - 2.00 - 2.00 - - -32 Daman & Diu 5.08 - 2.38 - 2.38 - - -33 Delhi 3.00 - 1.00 - 1.00 - - -34 Lakshadweep - - - - - - - -35 Pondicherry 4.09 3.78 1.06 1.10 2.16 0.69 0.88 1.57
ALL-INDIA 4.64 4.57 1.30 0.72 2.02 1.30 0.72 2.02

STATEMENT 2.1 (b) (iii)
AVERAGE EARNING STRENGTH OF AGRICULTURAL LABOUR HOUSEHOLDS BY SEX - SCHEDULED TRIBES HOUSEHOLDS
(No. of persons)
AVERAGE SIZE OF EARNING STRENGTH SL. STATES/ HOUSEHOLDS 1999-2000 2004-05NO. UNION TERRITORIES 1999-2000 2004-05 MALE FEMALE TOTAL MALE FEMALE TOTAL1 2 3 4 5 6 7 8 9 10
Major States1 Andhra Pradesh 4.36 3.74 1.20 1.23 2.43 1.09 1.06 2.152 Assam 5.01 3.96 1.33 0.43 1.76 0.98 0.29 1.273 Bihar 4.36 3.23 1.34 0.83 2.17 1.12 0.12 1.244 Gujarat 4.78 4.79 1.45 1.12 2.57 1.45 1.14 2.595 Haryana 4.68 - 0.86 0.24 1.10 - - -6 Karnataka 4.71 4.11 1.20 1.17 2.37 1.24 1.15 2.397 Kerala 3.77 4.06 1.09 0.98 2.07 1.08 0.67 1.758 Madhya Pradesh 4.96 5.02 1.37 1.01 2.38 1.45 1.10 2.559 Maharashtra 4.62 4.61 1.31 1.14 2.45 1.35 1.12 2.47
10 Orissa 4.37 4.11 1.27 0.78 2.05 1.25 0.77 2.0211 Punjab 3.97 4.00 1.16 0.17 1.33 1.00 - 1.0012 Rajasthan 5.55 5.17 1.54 1.48 3.02 1.39 0.93 2.3213 TamilNadu 3.83 3.76 1.04 1.13 2.17 1.19 1.30 2.4914 Uttar Pradesh 5.04 3.91 1.39 0.42 1.81 1.09 0.31 1.4015 West Bengal 4.87 4.24 1.27 0.93 2.20 1.14 0.65 1.79
Other States/UTs16 Arunachal Pradesh 4.09 4.83 0.21 0.07 0.28 0.76 0.08 0.8417 Chhattisgarh 4.61 4.54 1.29 1.10 2.39 1.30 1.18 2.4818 Goa 8.00 - 2.00 - 2.00 - - -19 Himachal Pradesh 4.48 3.00 1.16 0.35 1.51 1.00 1.00 2.0020 Jammu & Kashmir - - - - - - - -21 Jharkhand 4.50 3.76 1.28 0.64 1.92 1.01 0.87 1.8822 Manipur 4.23 5.00 1.11 0.62 1.73 1.50 1.00 2.5023 Meghalaya 4.06 3.70 1.03 0.95 1.98 1.02 0.84 1.8624 Mizoram 4.00 4.05 1.21 0.39 1.60 1.23 1.49 2.7225 Nagaland 6.63 3.74 1.90 0.32 2.22 1.28 0.43 1.7126 Sikkim 4.23 3.78 1.48 0.56 2.04 1.29 0.83 2.1227 Tripura 4.43 4.06 1.20 0.14 1.34 1.25 0.17 1.4228 Uttranchal 3.24 7.28 0.61 0.72 1.33 1.55 - 1.5529 A & N Islands 4.20 2.98 1.00 0.07 1.07 1.00 - 1.0030 Chandigarh - - - - - - - -31 D & N Haveli 4.01 4.63 1.08 0.78 1.86 1.04 0.84 1.8832 Daman & Diu 4.91 4.89 1.46 1.04 2.50 1.80 1.00 2.8033 Delhi - - - - - - - -34 Lakshadweep 8.34 3.72 2.07 0.34 2.41 2.53 - 2.5335 Pondicherry 5.00 - 3.00 - 3.00 - - -
ALL-INDIA 4.65 4.41 1.30 1.01 2.31 1.28 0.97 2.25

STATEMENT 2.1 (b) (iv)
AVERAGE EARNING STRENGTH OF AGRICULTURAL LABOUR HOUSEHOLDS BY SEX - OTHER BACKWARD CLASSES HOUSEHOLDS
(No. of persons)
AVERAGE SIZE OF EARNING STRENGTH SL. STATES/ HOUSEHOLDS 1999-2000 2004-05NO. UNION TERRITORIES 1999-2000 2004-05 MALE FEMALE TOTAL MALE FEMALE TOTAL1 2 3 4 5 6 7 8 9 10
Major States1 Andhra Pradesh 4.14 3.91 1.26 1.08 2.34 1.14 1.10 2.242 Assam 4.94 4.99 1.34 0.71 2.05 1.39 0.78 2.173 Bihar 4.97 5.05 1.31 0.37 1.68 1.30 0.29 1.594 Gujarat 4.93 4.58 1.49 0.80 2.29 1.40 0.66 2.065 Haryana 5.38 4.71 1.11 0.13 1.24 1.14 0.23 1.376 Karnataka 4.74 4.30 1.39 0.97 2.36 1.28 1.10 2.387 Kerala 4.71 4.62 1.19 0.46 1.65 1.18 0.45 1.638 Madhya Pradesh 5.14 4.77 1.40 0.81 2.21 1.32 0.84 2.169 Maharashtra 4.79 4.31 1.27 1.14 2.41 1.23 1.14 2.37
10 Orissa 4.40 4.33 1.21 0.45 1.66 1.20 0.67 1.8711 Punjab 4.57 5.20 1.36 0.01 1.37 1.43 0.23 1.6612 Rajasthan 4.56 4.97 1.32 0.52 1.84 1.27 0.41 1.6813 TamilNadu 3.85 3.64 1.18 0.89 2.07 1.09 0.99 2.0814 Uttar Pradesh 5.08 5.16 1.30 0.35 1.65 1.28 0.29 1.5715 West Bengal 4.21 4.07 1.24 0.26 1.50 1.12 0.18 1.30
Other States/UTs16 Arunachal Pradesh 7.38 1.00 0.56 - 0.56 1.00 - 1.0017 Chhattisgarh 5.05 5.04 1.33 1.21 2.54 1.33 1.19 2.5218 Goa 5.00 4.95 1.00 1.00 2.00 1.00 0.13 1.1319 Himachal Pradesh 5.39 - 1.21 1.20 2.41 - - -20 Jammu & Kashmir 5.84 6.75 1.83 0.04 1.87 1.25 - 1.2521 Jharkhand 4.52 4.37 1.35 0.47 1.82 1.12 0.86 1.9822 Manipur 4.17 4.42 1.26 0.47 1.73 0.96 0.39 1.3523 Meghalaya - - - - - - - -24 Mizoram - - - - - - - -25 Nagaland - - - - - - - -26 Sikkim 4.39 3.35 1.23 0.63 1.86 1.00 0.32 1.3227 Tripura 4.26 4.25 0.98 0.29 1.27 1.24 0.14 1.3828 Uttranchal 5.85 4.72 1.69 0.43 2.12 1.25 0.32 1.5729 A & N Islands - - - - - - - -30 Chandigarh 4.78 - 1.66 - 1.66 - - -31 D & N Haveli 5.00 - 1.00 - 1.00 - - -32 Daman & Diu - 3.43 - - - 1.00 0.05 1.0533 Delhi 3.96 1.56 2.76 - 2.76 1.00 - 1.0034 Lakshadweep 1.00 - 1.00 - 1.00 - - -35 Pondicherry 4.24 3.80 1.27 0.56 1.83 1.04 0.82 1.86
ALL-INDIA 4.61 4.45 1.30 0.75 2.05 1.24 0.79 2.03

STATEMENT 2.2 (a) (i)
AVERAGE NUMBER OF WAGE EARNERS IN RURAL LABOUR HOUSEHOLDS BY SEX - ALL CLASSES OF HOUSEHOLDS
(No. of persons)
SL. STATES/ 1999-2000 2004-05NO. UNION TERRITORIES MALE FEMALE TOTAL MALE FEMALE TOTAL
1 2 6 7 8 6 7 8Major States
1 Andhra Pradesh 1.09 0.94 2.03 1.08 0.90 1.982 Assam 1.11 0.42 1.53 1.13 0.44 1.573 Bihar 1.22 0.39 1.61 1.21 0.28 1.494 Gujarat 1.27 0.74 2.01 1.32 0.71 2.035 Haryana 1.20 0.09 1.29 1.19 0.13 1.326 Karnataka 1.21 0.91 2.12 1.23 0.93 2.167 Kerala 1.07 0.36 1.43 1.00 0.34 1.348 Madhya Pradesh 1.25 0.79 2.04 1.27 0.78 2.059 Maharashtra 1.09 0.92 2.01 1.11 0.93 2.04
10 Orissa 1.13 0.51 1.64 1.16 0.53 1.6911 Punjab 1.28 0.07 1.35 1.30 0.10 1.4012 Rajasthan 1.14 0.26 1.40 1.10 0.28 1.3813 TamilNadu 1.03 0.76 1.79 1.02 0.76 1.7814 Uttar Pradesh 1.11 0.33 1.44 1.13 0.26 1.3915 West Bengal 1.13 0.24 1.37 1.17 0.24 1.41
Other States/UTs16 Arunachal Pradesh 0.29 0.11 0.40 0.91 0.31 1.2217 Chhattisgarh 1.22 1.04 2.26 1.23 1.01 2.2418 Goa 1.17 0.25 1.42 0.92 0.27 1.1919 Himachal Pradesh 0.95 0.06 1.01 1.08 0.09 1.1720 Jammu & Kashmir 1.18 0.01 1.19 1.16 0.02 1.1821 Jharkhand 1.23 0.39 1.62 1.13 0.43 1.5622 Manipur 0.78 0.15 0.93 1.03 0.25 1.2823 Meghalaya 0.85 0.67 1.52 1.09 0.60 1.6924 Mizoram 0.39 0.03 0.42 0.53 - 0.5325 Nagaland 0.61 - 0.61 0.32 - 0.3226 Sikkim 0.79 0.20 0.99 0.85 0.14 0.9927 Tripura 1.06 0.13 1.19 1.10 0.17 1.2728 Uttranchal 0.92 0.21 1.13 1.19 0.30 1.4929 A & N Islands 0.84 0.09 0.93 0.92 0.09 1.0130 Chandigarh 0.82 - 0.82 0.99 - 0.9931 D & N Haveli 1.05 0.44 1.49 1.08 0.47 1.5532 Daman & Diu 1.62 0.39 2.01 1.32 0.58 1.9033 Delhi 2.38 - 2.38 0.88 - 0.8834 Lakshadweep 1.39 0.11 1.50 2.66 - 2.6635 Pondicherry 1.02 0.52 1.54 0.86 0.54 1.40
ALL-INDIA 1.14 0.60 1.74 1.15 0.58 1.73

STATEMENT 2.2 (a) (ii)
AVERAGE NUMBER OF WAGE EARNERS IN RURAL LABOUR HOUSEHOLDS BY SEX - SCHEDULED CASTES HOUSEHOLDS
(No. of persons)
SL. STATES/ 1999-2000 2004-05NO. UNION TERRITORIES MALE FEMALE TOTAL MALE FEMALE TOTAL
1 2 3 4 5 6 7 8Major States
1 Andhra Pradesh 1.14 1.03 2.17 1.18 1.00 2.182 Assam 1.11 0.42 1.53 1.08 0.43 1.513 Bihar 1.27 0.49 1.76 1.24 0.37 1.614 Gujarat 1.25 0.81 2.06 1.44 0.81 2.255 Haryana 1.32 0.12 1.44 1.27 0.11 1.386 Karnataka 1.33 1.02 2.35 1.28 1.02 2.307 Kerala 1.24 0.64 1.88 1.02 0.53 1.558 Madhya Pradesh 1.24 0.70 1.94 1.26 0.70 1.969 Maharashtra 1.11 0.94 2.05 1.11 0.98 2.09
10 Orissa 1.09 0.45 1.54 1.32 0.51 1.8311 Punjab 1.31 0.08 1.39 1.33 0.09 1.4212 Rajasthan 1.16 0.23 1.39 1.16 0.33 1.4913 TamilNadu 1.06 0.87 1.93 0.99 0.87 1.8614 Uttar Pradesh 1.14 0.43 1.57 1.20 0.33 1.5315 West Bengal 1.16 0.26 1.42 1.20 0.29 1.49
Other States/UTs16 Arunachal Pradesh - - - - - -17 Chhattisgarh 1.25 0.98 2.23 1.33 0.90 2.2318 Goa 1.03 - 1.03 1.40 0.34 1.7419 Himachal Pradesh 1.00 0.06 1.06 1.15 0.11 1.2620 Jammu & Kashmir 1.34 0.03 1.37 1.21 0.06 1.2721 Jharkhand 1.29 0.59 1.88 1.20 0.26 1.4622 Manipur 0.35 0.85 1.20 - - -23 Meghalaya - - - 1.50 1.00 2.5024 Mizoram - - - - - -25 Nagaland - - - - - -26 Sikkim 0.95 0.22 1.17 0.80 0.24 1.0427 Tripura 1.09 0.10 1.19 1.08 0.17 1.2528 Uttranchal 0.84 0.15 0.99 1.34 0.38 1.7229 A & N Islands 1.00 0.17 1.17 - - -30 Chandigarh 0.83 - 0.83 0.97 - 0.9731 D & N Haveli 1.41 - 1.41 - - -32 Daman & Diu 1.57 0.19 1.76 - - -33 Delhi 0.33 - 0.33 - - -34 Lakshadweep - - - 1.00 - 1.0035 Pondicherry 0.86 0.96 1.82 0.76 0.66 1.42
ALL-INDIA 1.18 0.62 1.80 1.20 0.57 1.77

STATEMENT 2.2 (a) (iii)
AVERAGE NUMBER OF WAGE EARNERS IN RURAL LABOUR HOUSEHOLDS BY SEX - SCHEDULED TRIBES HOUSEHOLDS
(No. of persons)
SL. STATES/ 1999-2000 2004-05NO. UNION TERRITORIES MALE FEMALE TOTAL MALE FEMALE TOTAL
1 2 3 4 5 6 7 8Major States
1 Andhra Pradesh 1.07 1.11 2.18 0.96 0.89 1.852 Assam 1.02 0.28 1.30 0.99 0.29 1.283 Bihar 1.21 0.76 1.97 1.02 0.10 1.124 Gujarat 1.30 0.91 2.21 1.33 0.97 2.305 Haryana 0.90 - 0.90 - - -6 Karnataka 1.11 1.04 2.15 1.23 1.09 2.327 Kerala 1.24 0.60 1.84 0.94 0.56 1.508 Madhya Pradesh 1.31 0.96 2.27 1.27 0.96 2.239 Maharashtra 1.14 0.99 2.13 1.26 1.02 2.28
10 Orissa 1.16 0.71 1.87 1.12 0.60 1.7211 Punjab 1.10 0.12 1.22 1.36 0.14 1.5012 Rajasthan 1.19 0.30 1.49 1.09 0.30 1.3913 TamilNadu 0.96 0.96 1.92 1.16 1.21 2.3714 Uttar Pradesh 1.06 0.29 1.35 1.17 0.21 1.3815 West Bengal 1.19 0.86 2.05 1.00 0.59 1.59
Other States/UTs16 Arunachal Pradesh 0.25 0.08 0.33 0.40 0.11 0.5117 Chhattisgarh 1.19 1.00 2.19 1.17 1.03 2.2018 Goa 2.00 - 2.00 - - -19 Himachal Pradesh 0.55 - 0.55 0.70 0.32 1.0220 Jammu & Kashmir 2.00 - 2.00 - - -21 Jharkhand 1.09 0.46 1.55 1.04 0.51 1.5522 Manipur 0.50 0.08 0.58 0.47 0.27 0.7423 Meghalaya 0.85 0.71 1.56 1.10 0.62 1.7224 Mizoram 0.39 0.03 0.42 0.53 - 0.5325 Nagaland 0.58 - 0.58 0.32 - 0.3226 Sikkim 0.68 0.12 0.80 0.95 0.20 1.1527 Tripura 1.16 0.14 1.30 1.14 0.14 1.2828 Uttranchal 0.69 0.80 1.49 0.91 0.23 1.1429 A & N Islands 1.02 - 1.02 - - -30 Chandigarh - - - - - -31 D & N Haveli 1.07 0.54 1.61 1.11 0.55 1.6632 Daman & Diu 1.44 0.73 2.17 1.43 0.77 2.2033 Delhi - - - - - -34 Lakshadweep 1.47 0.13 1.60 3.02 - 3.0235 Pondicherry 1.96 - 1.96 - - -
ALL-INDIA 1.18 0.83 2.01 1.15 0.78 1.93

STATEMENT 2.2 (a) (iv)
AVERAGE NUMBER OF WAGE EARNERS IN RURAL LABOUR HOUSEHOLDS BY SEX - OTHER BACKWARD CLASSES HOUSEHOLDS
(No. of persons)
SL. STATES/ 1999-2000 2004-05NO. UNION TERRITORIES MALE FEMALE TOTAL MALE FEMALE TOTAL
1 2 3 4 5 6 7 8Major States
1 Andhra Pradesh 1.07 0.94 2.01 1.06 0.95 2.012 Assam 1.11 0.60 1.71 1.18 0.78 1.963 Bihar 1.21 0.32 1.53 1.19 0.22 1.414 Gujarat 1.33 0.56 1.89 1.26 0.57 1.835 Haryana 1.08 0.07 1.15 1.10 0.14 1.246 Karnataka 1.19 0.81 2.00 1.17 0.89 2.067 Kerala 1.04 0.30 1.34 1.05 0.27 1.328 Madhya Pradesh 1.20 0.67 1.87 1.25 0.68 1.939 Maharashtra 1.11 1.01 2.12 1.11 0.96 2.07
10 Orissa 1.13 0.40 1.53 1.05 0.51 1.5611 Punjab 1.15 0.02 1.17 1.28 0.17 1.4512 Rajasthan 1.10 0.29 1.39 1.05 0.22 1.2713 TamilNadu 1.01 0.68 1.69 1.03 0.69 1.7214 Uttar Pradesh 1.10 0.22 1.32 1.08 0.19 1.2715 West Bengal 1.06 0.25 1.31 1.09 0.23 1.32
Other States/UTs16 Arunachal Pradesh 0.29 - 0.29 1.00 - 1.0017 Chhattisgarh 1.24 1.10 2.34 1.22 1.07 2.2918 Goa 0.63 0.61 1.24 1.00 0.12 1.1219 Himachal Pradesh 1.18 0.14 1.32 1.16 - 1.1620 Jammu & Kashmir 1.28 - 1.28 1.21 - 1.2121 Jharkhand 1.30 0.28 1.58 1.14 0.48 1.6222 Manipur 0.87 0.24 1.11 1.09 0.26 1.3523 Meghalaya 1.00 - 1.00 - - -24 Mizoram - - - - - -25 Nagaland 1.00 - 1.00 - - -26 Sikkim 0.92 0.22 1.14 0.72 0.09 0.8127 Tripura 1.01 0.18 1.19 1.12 0.15 1.2728 Uttranchal 1.15 0.20 1.35 1.13 0.20 1.3329 A & N Islands 0.64 - 0.64 - - -30 Chandigarh 0.63 - 0.63 - - -31 D & N Haveli 0.85 - 0.85 1.00 - 1.0032 Daman & Diu 2.27 - 2.27 1.05 0.06 1.1133 Delhi 2.60 - 2.60 0.71 - 0.7134 Lakshadweep 1.00 - 1.00 1.83 - 1.8335 Pondicherry 1.08 0.32 1.40 0.96 0.43 1.39
ALL-INDIA 1.13 0.60 1.73 1.11 0.60 1.71

STATEMENT 2.2 (b) (i)
AVERAGE NUMBER OF WAGE EARNERS IN AGRICULTURAL LABOUR HOUSEHOLDS BY SEX - ALL CLASSES OF HOUSEHOLDS
(No. of persons)
SL. STATES/ 1999-2000 2004-05NO. UNION TERRITORIES MALE FEMALE TOTAL MALE FEMALE TOTAL
1 2 3 4 5 6 7 8Major States
1 Andhra Pradesh 1.11 0.99 2.10 1.08 0.97 2.052 Assam 1.26 0.49 1.75 1.25 0.48 1.733 Bihar 1.23 0.41 1.64 1.23 0.29 1.524 Gujarat 1.30 0.82 2.12 1.38 0.79 2.175 Haryana 1.17 0.10 1.27 1.32 0.15 1.476 Karnataka 1.23 0.97 2.20 1.22 1.01 2.237 Kerala 1.09 0.43 1.52 0.99 0.46 1.458 Madhya Pradesh 1.27 0.83 2.10 1.27 0.81 2.089 Maharashtra 1.11 1.01 2.12 1.12 1.03 2.1510 Orissa 1.14 0.52 1.66 1.18 0.58 1.7611 Punjab 1.33 0.07 1.40 1.36 0.12 1.4812 Rajasthan 1.18 0.41 1.59 1.04 0.41 1.4513 TamilNadu 1.06 0.85 1.91 1.00 0.90 1.9014 Uttar Pradesh 1.12 0.37 1.49 1.10 0.28 1.3815 West Bengal 1.16 0.24 1.40 1.21 0.25 1.46
Other States/UTs16 Arunachal Pradesh 0.20 0.10 0.30 0.60 0.06 0.6617 Chhattisgarh 1.23 1.07 2.30 1.24 1.07 2.3118 Goa 1.15 0.28 1.43 0.99 0.31 1.3019 Himachal Pradesh 0.84 0.08 0.92 0.85 0.28 1.1320 Jammu & Kashmir 0.96 - 0.96 1.13 0.01 1.1421 Jharkhand 1.22 0.51 1.73 1.07 0.59 1.6622 Manipur 0.83 0.15 0.98 0.89 0.28 1.1723 Meghalaya 0.89 0.73 1.62 0.97 0.67 1.6424 Mizoram 0.36 0.03 0.39 0.31 - 0.3125 Nagaland 0.75 - 0.75 - - -26 Sikkim 1.11 0.36 1.47 1.21 0.38 1.5927 Tripura 1.07 0.18 1.25 1.11 0.20 1.3128 Uttranchal 0.85 0.38 1.23 1.21 0.41 1.6229 A & N Islands 1.02 0.05 1.07 0.98 0.06 1.0430 Chandigarh 0.53 - 0.53 - - -31 D & N Haveli 1.08 0.53 1.61 1.04 0.84 1.8832 Daman & Diu 1.61 0.58 2.19 1.56 0.90 2.4633 Delhi 2.69 - 2.69 0.44 - 0.4434 Lakshadweep 1.98 0.33 2.31 2.53 - 2.5335 Pondicherry 1.02 0.73 1.75 0.78 0.74 1.52
ALL-INDIA 1.17 0.67 1.84 1.17 0.67 1.84

STATEMENT 2.2 (b) (ii)
AVERAGE NUMBER OF WAGE EARNERS IN AGRICULTURAL LABOUR HOUSEHOLDS BY SEX - SCHEDULED CASTES HOUSEHOLDS
(No. of persons)
SL. STATES/ 1999-2000 2004-05NO. UNION TERRITORIES MALE FEMALE TOTAL MALE FEMALE TOTAL
1 2 3 4 5 6 7 8Major States
1 Andhra Pradesh 1.15 1.06 2.21 1.18 1.06 2.242 Assam 1.38 0.65 2.03 1.09 0.57 1.663 Bihar 1.28 0.50 1.78 1.25 0.38 1.634 Gujarat 1.24 0.86 2.10 1.54 0.93 2.475 Haryana 1.33 0.14 1.47 1.43 0.13 1.566 Karnataka 1.34 1.06 2.40 1.27 1.05 2.327 Kerala 1.24 0.67 1.91 0.98 0.61 1.598 Madhya Pradesh 1.27 0.75 2.02 1.25 0.75 2.009 Maharashtra 1.12 1.02 2.14 1.12 1.04 2.16
10 Orissa 1.10 0.45 1.55 1.41 0.53 1.9411 Punjab 1.35 0.08 1.43 1.39 0.09 1.4812 Rajasthan 1.21 0.27 1.48 1.11 0.48 1.5913 TamilNadu 1.07 0.94 2.01 0.99 0.94 1.9314 Uttar Pradesh 1.13 0.46 1.59 1.14 0.38 1.5215 West Bengal 1.19 0.27 1.46 1.26 0.30 1.56
Other States/UTs16 Arunachal Pradesh - - - - - -17 Chhattisgarh 1.27 0.99 2.26 1.38 0.94 2.3218 Goa 2.00 - 2.00 3.00 1.00 4.0019 Himachal Pradesh 0.85 0.12 0.97 1.00 0.29 1.2920 Jammu & Kashmir 1.30 - 1.30 1.00 - 1.0021 Jharkhand 1.27 0.72 1.99 1.29 0.40 1.6922 Manipur 0.35 0.85 1.20 - - -23 Meghalaya - - - 1.50 1.00 2.5024 Mizoram - - - - - -25 Nagaland - - - - - -26 Sikkim 1.24 0.47 1.71 0.81 1.00 1.8127 Tripura 1.25 0.18 1.43 1.12 0.27 1.3928 Uttranchal 0.62 0.33 0.95 1.37 0.54 1.9129 A & N Islands 1.00 - 1.00 - - -30 Chandigarh 0.76 - 0.76 - - -31 D & N Haveli 2.00 - 2.00 - - -32 Daman & Diu 1.84 - 1.84 - - -33 Delhi 1.00 - 1.00 - - -34 Lakshadweep - - - - - -35 Pondicherry 0.85 1.03 1.88 0.69 0.85 1.54
ALL-INDIA 1.19 0.68 1.87 1.21 0.66 1.87
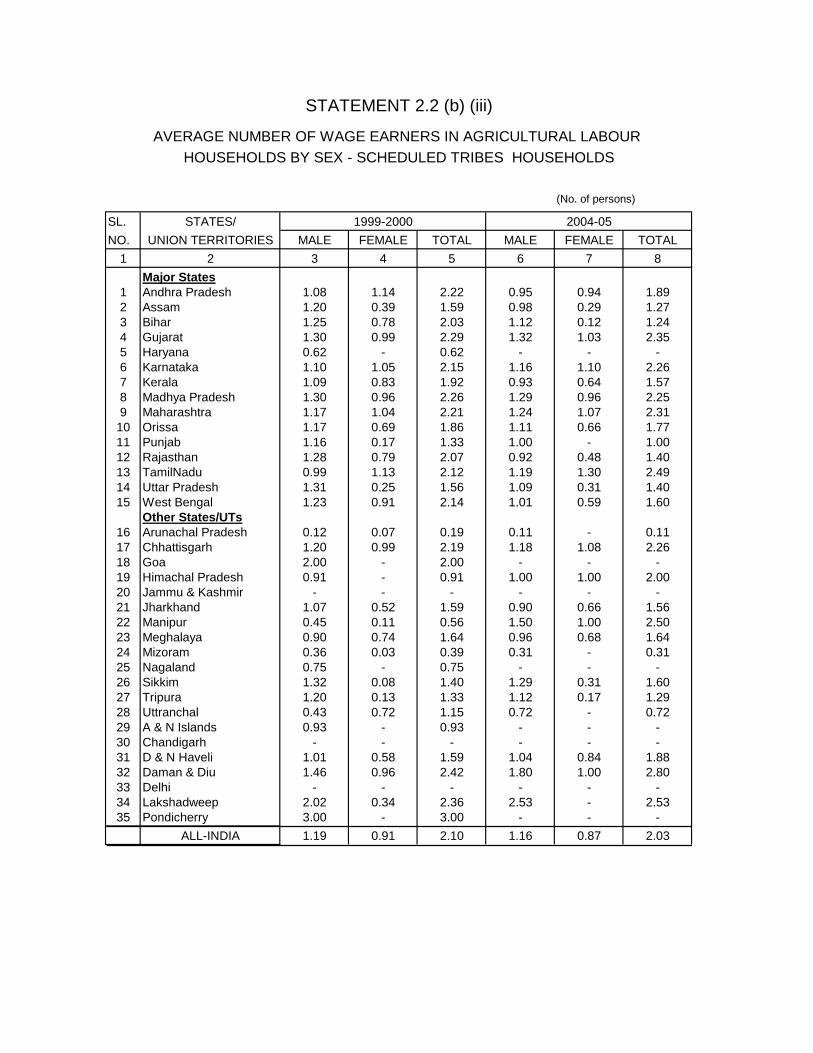
STATEMENT 2.2 (b) (iii)
AVERAGE NUMBER OF WAGE EARNERS IN AGRICULTURAL LABOUR HOUSEHOLDS BY SEX - SCHEDULED TRIBES HOUSEHOLDS
(No. of persons)
SL. STATES/ 1999-2000 2004-05NO. UNION TERRITORIES MALE FEMALE TOTAL MALE FEMALE TOTAL
1 2 3 4 5 6 7 8Major States
1 Andhra Pradesh 1.08 1.14 2.22 0.95 0.94 1.892 Assam 1.20 0.39 1.59 0.98 0.29 1.273 Bihar 1.25 0.78 2.03 1.12 0.12 1.244 Gujarat 1.30 0.99 2.29 1.32 1.03 2.355 Haryana 0.62 - 0.62 - - -6 Karnataka 1.10 1.05 2.15 1.16 1.10 2.267 Kerala 1.09 0.83 1.92 0.93 0.64 1.578 Madhya Pradesh 1.30 0.96 2.26 1.29 0.96 2.259 Maharashtra 1.17 1.04 2.21 1.24 1.07 2.31
10 Orissa 1.17 0.69 1.86 1.11 0.66 1.7711 Punjab 1.16 0.17 1.33 1.00 - 1.0012 Rajasthan 1.28 0.79 2.07 0.92 0.48 1.4013 TamilNadu 0.99 1.13 2.12 1.19 1.30 2.4914 Uttar Pradesh 1.31 0.25 1.56 1.09 0.31 1.4015 West Bengal 1.23 0.91 2.14 1.01 0.59 1.60
Other States/UTs16 Arunachal Pradesh 0.12 0.07 0.19 0.11 - 0.1117 Chhattisgarh 1.20 0.99 2.19 1.18 1.08 2.2618 Goa 2.00 - 2.00 - - -19 Himachal Pradesh 0.91 - 0.91 1.00 1.00 2.0020 Jammu & Kashmir - - - - - -21 Jharkhand 1.07 0.52 1.59 0.90 0.66 1.5622 Manipur 0.45 0.11 0.56 1.50 1.00 2.5023 Meghalaya 0.90 0.74 1.64 0.96 0.68 1.6424 Mizoram 0.36 0.03 0.39 0.31 - 0.3125 Nagaland 0.75 - 0.75 - - -26 Sikkim 1.32 0.08 1.40 1.29 0.31 1.6027 Tripura 1.20 0.13 1.33 1.12 0.17 1.2928 Uttranchal 0.43 0.72 1.15 0.72 - 0.7229 A & N Islands 0.93 - 0.93 - - -30 Chandigarh - - - - - -31 D & N Haveli 1.01 0.58 1.59 1.04 0.84 1.8832 Daman & Diu 1.46 0.96 2.42 1.80 1.00 2.8033 Delhi - - - - - -34 Lakshadweep 2.02 0.34 2.36 2.53 - 2.5335 Pondicherry 3.00 - 3.00 - - -
ALL-INDIA 1.19 0.91 2.10 1.16 0.87 2.03

STATEMENT 2.2 (b) (iv)
AVERAGE NUMBER OF WAGE EARNERS IN AGRICULTURAL LABOUR HOUSEHOLDS BY SEX - OTHER BACKWARD CLASSES HOUSEHOLDS
(No. of persons)
SL. STATES/ NO. UNION TERRITORIES 1999-2000 2004-05
1 2 3 4 5 6 7 8Major States
1 Andhra Pradesh 1.10 1.00 2.10 1.04 1.03 2.072 Assam 1.21 0.68 1.89 1.34 0.76 2.103 Bihar 1.22 0.33 1.55 1.22 0.24 1.464 Gujarat 1.35 0.64 1.99 1.31 0.60 1.915 Haryana 0.99 0.07 1.06 1.02 0.14 1.166 Karnataka 1.22 0.86 2.08 1.16 0.99 2.157 Kerala 1.03 0.36 1.39 1.06 0.33 1.398 Madhya Pradesh 1.24 0.74 1.98 1.23 0.71 1.949 Maharashtra 1.14 1.06 2.20 1.13 1.06 2.19
10 Orissa 1.14 0.42 1.56 1.06 0.58 1.6411 Punjab 1.16 0.01 1.17 1.36 0.23 1.5912 Rajasthan 1.04 0.40 1.44 1.06 0.30 1.3613 TamilNadu 1.05 0.78 1.83 1.01 0.86 1.8714 Uttar Pradesh 1.11 0.27 1.38 1.09 0.21 1.3015 West Bengal 1.06 0.21 1.27 1.08 0.12 1.20
Other States/UTs16 Arunachal Pradesh 0.48 - 0.48 1.00 - 1.0017 Chhattisgarh 1.25 1.15 2.40 1.22 1.13 2.3518 Goa 0.50 0.50 1.00 1.00 0.13 1.1319 Himachal Pradesh 1.07 0.24 1.31 - - -20 Jammu & Kashmir 0.97 - 0.97 1.10 - 1.1021 Jharkhand 1.30 0.41 1.71 1.02 0.74 1.7622 Manipur 1.11 0.20 1.31 0.91 0.26 1.1723 Meghalaya - - - - - -24 Mizoram - - - - - -25 Nagaland - - - - - -26 Sikkim 1.07 0.34 1.41 1.00 0.32 1.3227 Tripura 0.97 0.26 1.23 1.15 0.12 1.2728 Uttranchal 1.32 0.43 1.75 1.02 0.27 1.2929 A & N Islands - - - - - -30 Chandigarh 0.31 - 0.31 - - -31 D & N Haveli 1.00 - 1.00 - - -32 Daman & Diu - - - 1.00 0.05 1.0533 Delhi 2.76 - 2.76 0.44 - 0.4434 Lakshadweep 1.00 - 1.00 - - -35 Pondicherry 1.12 0.49 1.61 0.93 0.54 1.47
ALL-INDIA 1.16 0.67 1.83 1.12 0.71 1.83
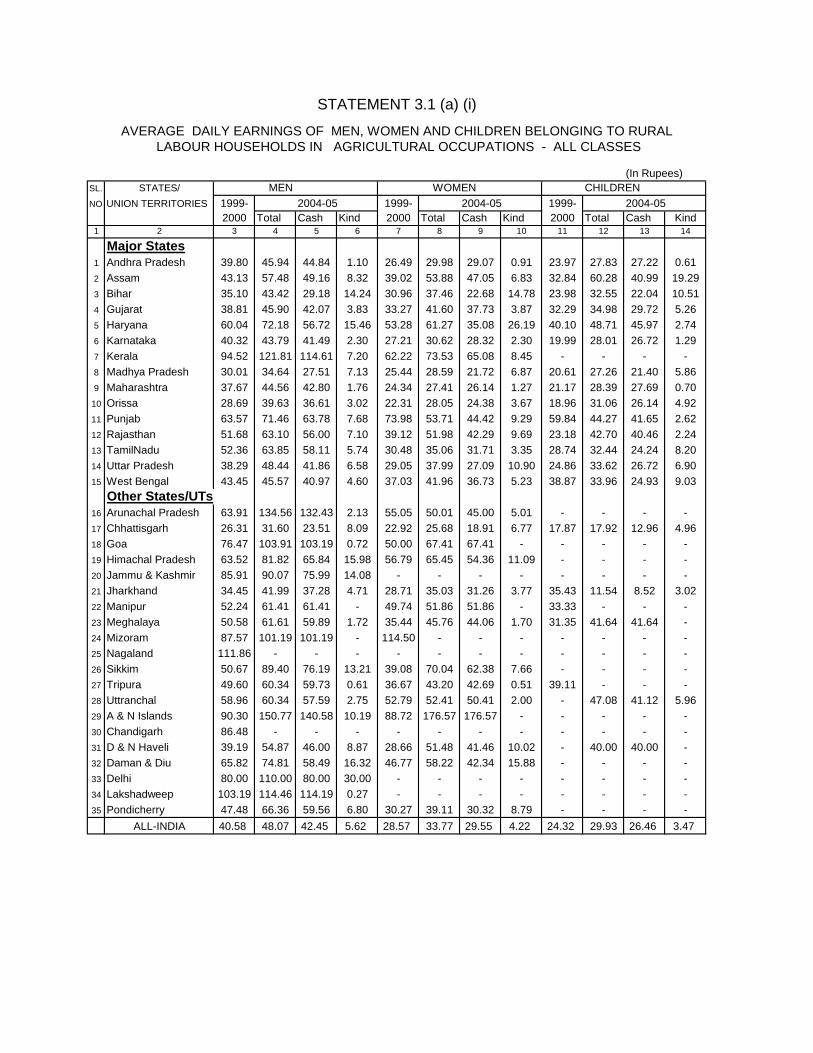
STATEMENT 3.1 (a) (i)
AVERAGE DAILY EARNINGS OF MEN, WOMEN AND CHILDREN BELONGING TO RURAL LABOUR HOUSEHOLDS IN AGRICULTURAL OCCUPATIONS - ALL CLASSES
(In Rupees)SL. STATES/ MEN WOMEN CHILDRENNO. UNION TERRITORIES 1999- 2004-05 1999- 2004-05 1999- 2004-05
2000 Total Cash Kind 2000 Total Cash Kind 2000 Total Cash Kind1 2 3 4 5 6 7 8 9 10 11 12 13 14
Major States1 Andhra Pradesh 39.80 45.94 44.84 1.10 26.49 29.98 29.07 0.91 23.97 27.83 27.22 0.612 Assam 43.13 57.48 49.16 8.32 39.02 53.88 47.05 6.83 32.84 60.28 40.99 19.293 Bihar 35.10 43.42 29.18 14.24 30.96 37.46 22.68 14.78 23.98 32.55 22.04 10.514 Gujarat 38.81 45.90 42.07 3.83 33.27 41.60 37.73 3.87 32.29 34.98 29.72 5.265 Haryana 60.04 72.18 56.72 15.46 53.28 61.27 35.08 26.19 40.10 48.71 45.97 2.746 Karnataka 40.32 43.79 41.49 2.30 27.21 30.62 28.32 2.30 19.99 28.01 26.72 1.297 Kerala 94.52 121.81 114.61 7.20 62.22 73.53 65.08 8.45 - - - -8 Madhya Pradesh 30.01 34.64 27.51 7.13 25.44 28.59 21.72 6.87 20.61 27.26 21.40 5.869 Maharashtra 37.67 44.56 42.80 1.76 24.34 27.41 26.14 1.27 21.17 28.39 27.69 0.70
10 Orissa 28.69 39.63 36.61 3.02 22.31 28.05 24.38 3.67 18.96 31.06 26.14 4.9211 Punjab 63.57 71.46 63.78 7.68 73.98 53.71 44.42 9.29 59.84 44.27 41.65 2.6212 Rajasthan 51.68 63.10 56.00 7.10 39.12 51.98 42.29 9.69 23.18 42.70 40.46 2.2413 TamilNadu 52.36 63.85 58.11 5.74 30.48 35.06 31.71 3.35 28.74 32.44 24.24 8.2014 Uttar Pradesh 38.29 48.44 41.86 6.58 29.05 37.99 27.09 10.90 24.86 33.62 26.72 6.9015 West Bengal 43.45 45.57 40.97 4.60 37.03 41.96 36.73 5.23 38.87 33.96 24.93 9.03
Other States/UTs16 Arunachal Pradesh 63.91 134.56 132.43 2.13 55.05 50.01 45.00 5.01 - - - -17 Chhattisgarh 26.31 31.60 23.51 8.09 22.92 25.68 18.91 6.77 17.87 17.92 12.96 4.9618 Goa 76.47 103.91 103.19 0.72 50.00 67.41 67.41 - - - - -19 Himachal Pradesh 63.52 81.82 65.84 15.98 56.79 65.45 54.36 11.09 - - - -20 Jammu & Kashmir 85.91 90.07 75.99 14.08 - - - - - - - -21 Jharkhand 34.45 41.99 37.28 4.71 28.71 35.03 31.26 3.77 35.43 11.54 8.52 3.0222 Manipur 52.24 61.41 61.41 - 49.74 51.86 51.86 - 33.33 - - -23 Meghalaya 50.58 61.61 59.89 1.72 35.44 45.76 44.06 1.70 31.35 41.64 41.64 -24 Mizoram 87.57 101.19 101.19 - 114.50 - - - - - - -25 Nagaland 111.86 - - - - - - - - - - -26 Sikkim 50.67 89.40 76.19 13.21 39.08 70.04 62.38 7.66 - - - -27 Tripura 49.60 60.34 59.73 0.61 36.67 43.20 42.69 0.51 39.11 - - -28 Uttranchal 58.96 60.34 57.59 2.75 52.79 52.41 50.41 2.00 - 47.08 41.12 5.9629 A & N Islands 90.30 150.77 140.58 10.19 88.72 176.57 176.57 - - - - -30 Chandigarh 86.48 - - - - - - - - - - -31 D & N Haveli 39.19 54.87 46.00 8.87 28.66 51.48 41.46 10.02 - 40.00 40.00 -32 Daman & Diu 65.82 74.81 58.49 16.32 46.77 58.22 42.34 15.88 - - - -33 Delhi 80.00 110.00 80.00 30.00 - - - - - - - -34 Lakshadweep 103.19 114.46 114.19 0.27 - - - - - - - -35 Pondicherry 47.48 66.36 59.56 6.80 30.27 39.11 30.32 8.79 - - - -
ALL-INDIA 40.58 48.07 42.45 5.62 28.57 33.77 29.55 4.22 24.32 29.93 26.46 3.47
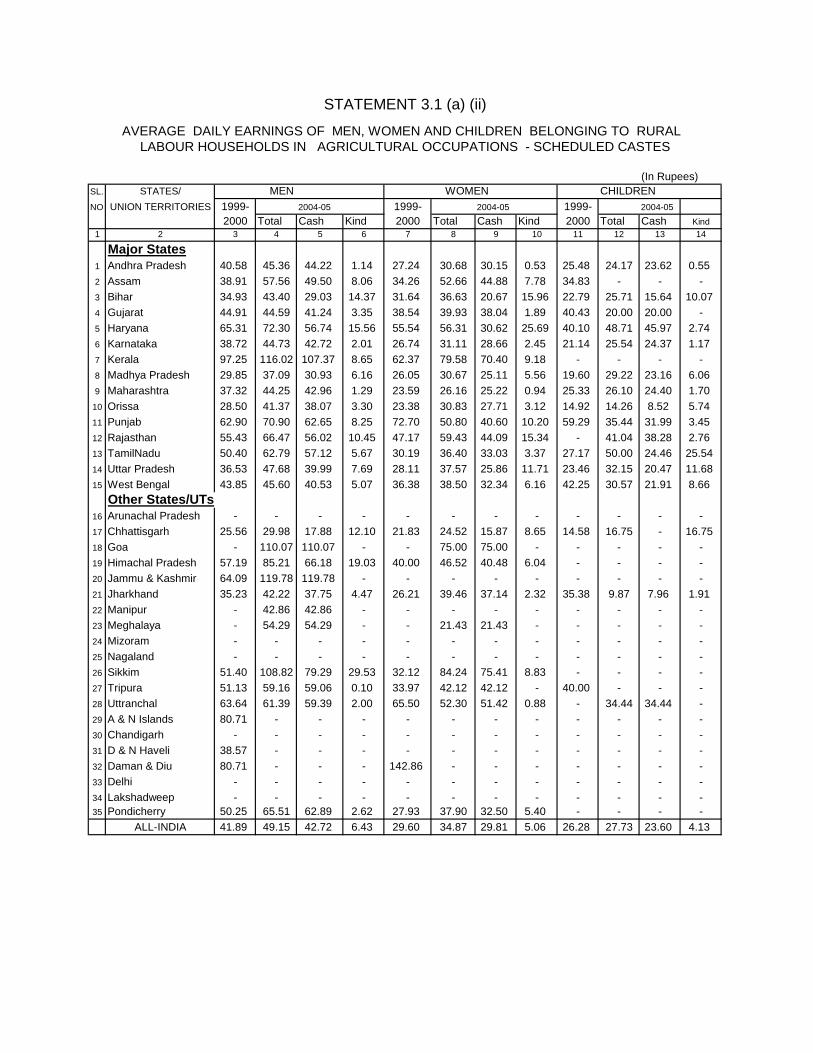
STATEMENT 3.1 (a) (ii)
AVERAGE DAILY EARNINGS OF MEN, WOMEN AND CHILDREN BELONGING TO RURAL LABOUR HOUSEHOLDS IN AGRICULTURAL OCCUPATIONS - SCHEDULED CASTES
(In Rupees)SL. STATES/ MEN WOMEN CHILDRENNO. UNION TERRITORIES 1999- 2004-05 1999- 2004-05 1999- 2004-05
2000 Total Cash Kind 2000 Total Cash Kind 2000 Total Cash Kind1 2 3 4 5 6 7 8 9 10 11 12 13 14
Major States1 Andhra Pradesh 40.58 45.36 44.22 1.14 27.24 30.68 30.15 0.53 25.48 24.17 23.62 0.552 Assam 38.91 57.56 49.50 8.06 34.26 52.66 44.88 7.78 34.83 - - -3 Bihar 34.93 43.40 29.03 14.37 31.64 36.63 20.67 15.96 22.79 25.71 15.64 10.074 Gujarat 44.91 44.59 41.24 3.35 38.54 39.93 38.04 1.89 40.43 20.00 20.00 -5 Haryana 65.31 72.30 56.74 15.56 55.54 56.31 30.62 25.69 40.10 48.71 45.97 2.746 Karnataka 38.72 44.73 42.72 2.01 26.74 31.11 28.66 2.45 21.14 25.54 24.37 1.177 Kerala 97.25 116.02 107.37 8.65 62.37 79.58 70.40 9.18 - - - -8 Madhya Pradesh 29.85 37.09 30.93 6.16 26.05 30.67 25.11 5.56 19.60 29.22 23.16 6.069 Maharashtra 37.32 44.25 42.96 1.29 23.59 26.16 25.22 0.94 25.33 26.10 24.40 1.70
10 Orissa 28.50 41.37 38.07 3.30 23.38 30.83 27.71 3.12 14.92 14.26 8.52 5.7411 Punjab 62.90 70.90 62.65 8.25 72.70 50.80 40.60 10.20 59.29 35.44 31.99 3.4512 Rajasthan 55.43 66.47 56.02 10.45 47.17 59.43 44.09 15.34 - 41.04 38.28 2.7613 TamilNadu 50.40 62.79 57.12 5.67 30.19 36.40 33.03 3.37 27.17 50.00 24.46 25.5414 Uttar Pradesh 36.53 47.68 39.99 7.69 28.11 37.57 25.86 11.71 23.46 32.15 20.47 11.6815 West Bengal 43.85 45.60 40.53 5.07 36.38 38.50 32.34 6.16 42.25 30.57 21.91 8.66
Other States/UTs16 Arunachal Pradesh - - - - - - - - - - - -17 Chhattisgarh 25.56 29.98 17.88 12.10 21.83 24.52 15.87 8.65 14.58 16.75 - 16.7518 Goa - 110.07 110.07 - - 75.00 75.00 - - - - -19 Himachal Pradesh 57.19 85.21 66.18 19.03 40.00 46.52 40.48 6.04 - - - -20 Jammu & Kashmir 64.09 119.78 119.78 - - - - - - - - -21 Jharkhand 35.23 42.22 37.75 4.47 26.21 39.46 37.14 2.32 35.38 9.87 7.96 1.9122 Manipur - 42.86 42.86 - - - - - - - - -23 Meghalaya - 54.29 54.29 - - 21.43 21.43 - - - - -24 Mizoram - - - - - - - - - - - -25 Nagaland - - - - - - - - - - - -26 Sikkim 51.40 108.82 79.29 29.53 32.12 84.24 75.41 8.83 - - - -27 Tripura 51.13 59.16 59.06 0.10 33.97 42.12 42.12 - 40.00 - - -28 Uttranchal 63.64 61.39 59.39 2.00 65.50 52.30 51.42 0.88 - 34.44 34.44 -29 A & N Islands 80.71 - - - - - - - - - - -30 Chandigarh - - - - - - - - - - - -31 D & N Haveli 38.57 - - - - - - - - - - -32 Daman & Diu 80.71 - - - 142.86 - - - - - - -33 Delhi - - - - - - - - - - - -34 Lakshadweep - - - - - - - - - - - -35 Pondicherry 50.25 65.51 62.89 2.62 27.93 37.90 32.50 5.40 - - - -
ALL-INDIA 41.89 49.15 42.72 6.43 29.60 34.87 29.81 5.06 26.28 27.73 23.60 4.13

STATEMENT 3.1 (a) (iii)
AVERAGE DAILY EARNINGS OF MEN, WOMEN AND CHILDREN BELONGING TO RURAL LABOUR HOUSEHOLDS IN AGRICULTURAL OCCUPATIONS - SCHEDULED TRIBES
(In Rupees)SL. STATES/ MEN WOMEN CHILDRENNO. UNION TERRITORIES 1999- 2004-05 1999- 2004-05 1999- 2004-05
2000 Total Cash Kind 2000 Total Cash Kind 2000 Total Cash Kind1 2 3 4 5 6 7 8 9 10 11 12 13 14
Major States1 Andhra Pradesh 39.14 47.48 44.92 2.56 29.77 29.87 27.07 2.80 28.89 26.31 24.53 1.782 Assam 45.49 59.20 51.78 7.42 35.68 53.98 46.17 7.81 29.00 - - -3 Bihar 33.32 50.25 12.71 37.54 31.61 44.00 32.00 12.00 30.00 - - -4 Gujarat 31.24 44.48 38.94 5.54 27.58 35.22 30.54 4.68 18.48 32.04 24.56 7.485 Haryana 62.87 - - - - - - - - - - -6 Karnataka 36.21 40.48 39.57 0.91 25.22 27.59 26.71 0.88 18.30 29.63 27.37 2.267 Kerala 76.28 110.77 99.32 11.45 56.34 73.81 64.23 9.58 - - - -8 Madhya Pradesh 29.24 32.97 24.73 8.24 25.26 27.68 18.92 8.76 21.04 24.61 15.18 9.439 Maharashtra 35.84 42.25 39.30 2.95 24.87 28.72 26.19 2.53 19.82 26.76 24.99 1.77
10 Orissa 26.37 36.28 32.19 4.09 22.72 25.07 20.20 4.87 18.72 35.43 30.72 4.7111 Punjab 48.88 80.00 80.00 - 124.00 - - - - - - -12 Rajasthan 39.68 49.80 45.35 4.45 30.45 38.38 35.86 2.52 19.58 - - -13 TamilNadu 53.67 53.45 52.98 0.47 24.83 40.85 36.98 3.87 - - - -14 Uttar Pradesh 25.74 39.44 32.89 6.55 17.92 28.01 17.32 10.69 - - - -15 West Bengal 40.97 45.48 40.11 5.37 36.93 45.84 40.07 5.77 36.18 44.99 20.99 24.00
Other States/UTs16 Arunachal Pradesh 73.94 263.52 263.52 - 60.00 - - - - - - -17 Chhattisgarh 27.16 34.87 29.62 5.25 23.21 28.58 23.57 5.01 25.15 17.55 15.49 2.0618 Goa - - - - - - - - - - - -19 Himachal Pradesh 81.02 26.71 26.71 - 62.56 70.73 53.63 17.10 - - - -20 Jammu & Kashmir - - - - - - - - - - - -21 Jharkhand 32.73 38.47 33.54 4.93 30.01 32.82 28.71 4.11 36.25 - - -22 Manipur 58.82 59.45 59.45 - 50.00 41.43 41.43 - - - - -23 Meghalaya 50.16 62.02 60.17 1.85 35.48 47.20 45.46 1.74 31.72 41.64 41.64 -24 Mizoram 87.57 101.19 101.19 - 114.50 - - - - - - -25 Nagaland 135.91 - - - - - - - - - - -26 Sikkim 52.09 89.19 75.47 13.72 30.00 55.69 47.72 7.97 - - - -27 Tripura 37.77 68.85 67.62 1.23 38.97 54.36 54.36 - - - - -28 Uttranchal 64.29 39.28 39.28 - - 60.00 60.00 - - - - -29 A & N Islands 84.83 - - - - - - - - - - -30 Chandigarh - - - - - - - - - - - -31 D & N Haveli 39.35 54.87 46.00 8.87 28.66 51.48 41.46 10.02 - 40.00 40.00 -32 Daman & Diu 65.87 71.15 53.79 17.36 39.79 54.64 39.91 14.73 - - - -33 Delhi - - - - - - - - - - - -34 Lakshadweep 101.01 114.46 114.19 0.27 - - - - - - - -35 Pondicherry 40.60 - - - - - - - - - - -
ALL-INDIA 33.19 41.79 36.39 5.40 26.44 31.67 26.89 4.78 22.41 29.37 24.08 5.29

ANNEXURE-IV
AVERAGE DAILY EARNINGS OF MEN, WOMEN AND CHILDREN BELONGING TO RURAL LABOUR HOUSEHOLDS IN AGRICULTURAL OCCUPATIONS - OTHER BACKWARD
CLASSES(In Rupees)
SL. STATES/ MEN WOMEN CHILDRENNO. UNION TERRITORIES 1999- 2004-05 1999- 2004-05 1999- 2004-05
2000 Total Cash Kind 2000 Total Cash Kind 2000 Total Cash Kind1 2 3 4 5 6 7 8 9 10 11 12 13 14
Major States1 Andhra Pradesh 38.24 45.50 44.53 0.97 25.08 29.70 28.73 0.97 21.02 28.57 28.00 0.572 Assam 41.04 56.02 45.53 10.49 44.75 54.14 45.41 8.73 17.14 60.02 39.79 20.233 Bihar 35.47 43.32 31.04 12.28 30.29 39.35 25.42 13.93 24.91 35.67 26.80 8.874 Gujarat 41.35 47.36 44.74 2.62 34.53 48.47 44.05 4.42 38.76 38.65 34.80 3.855 Haryana 48.89 70.65 56.03 14.62 47.02 70.88 36.04 34.84 - - - -6 Karnataka 44.85 46.58 42.37 4.21 30.13 32.05 28.72 3.33 19.57 27.99 26.64 1.357 Kerala 97.46 132.33 125.45 6.88 60.48 65.32 53.15 12.17 - - - -8 Madhya Pradesh 30.29 34.50 27.27 7.23 25.97 27.77 23.05 4.72 20.34 25.61 25.61 -9 Maharashtra 37.08 45.78 43.75 2.03 23.23 27.00 26.02 0.98 20.76 33.62 33.62 -
10 Orissa 29.45 39.27 37.51 1.76 20.04 27.58 24.74 2.84 21.20 - - -11 Punjab 67.56 71.20 64.78 6.42 90.00 60.65 53.76 6.89 48.66 55.25 53.68 1.5712 Rajasthan 53.21 63.45 59.90 3.55 48.92 48.68 43.39 5.29 22.61 50.00 50.00 -13 TamilNadu 54.21 64.81 58.90 5.91 31.01 33.92 30.61 3.31 30.50 24.83 24.15 0.6814 Uttar Pradesh 39.40 48.30 43.32 4.98 30.83 38.23 28.61 9.62 25.69 32.92 27.70 5.2215 West Bengal 42.41 53.44 48.25 5.19 35.13 43.73 40.69 3.04 35.00 40.00 40.00 -
Other States/UTs16 Arunachal Pradesh 88.11 - - - - - - - - - - -17 Chhattisgarh 25.94 30.47 22.84 7.63 23.31 24.93 18.56 6.37 14.87 18.41 12.87 5.5418 Goa - 75.76 70.18 5.58 - 53.57 53.57 - - - - -19 Himachal Pradesh 68.54 56.98 56.98 - 67.38 - - - - - - -20 Jammu & Kashmir 117.24 97.92 81.78 16.14 - - - - - - - -21 Jharkhand 34.61 41.48 35.97 5.51 30.82 34.77 30.87 3.90 34.40 11.57 7.08 4.4922 Manipur 51.57 62.34 62.34 - 49.23 53.08 53.08 - - - - -23 Meghalaya - - - - - - - - - - - -24 Mizoram - - - - - - - - - - - -25 Nagaland 42.86 - - - - - - - - - - -26 Sikkim 51.59 84.38 77.67 6.71 42.78 69.22 64.54 4.68 - - - -27 Tripura 62.62 58.41 58.07 0.34 51.99 43.13 40.46 2.67 35.00 - - -28 Uttranchal 55.46 61.47 58.26 3.21 40.00 52.05 47.92 4.13 - 50.00 42.66 7.3429 A & N Islands - - - - - - - - - - - -30 Chandigarh 122.37 - - - - - - - - - - -31 D & N Haveli 37.14 - - - - - - - - - - -32 Daman & Diu - 87.79 76.80 10.99 - 150.00 120.00 30.00 - - - -33 Delhi 80.00 110.00 80.00 30.00 - - - - - - - -34 Lakshadweep 205.71 - - - - - - - - - - -35 Pondicherry 46.36 67.35 55.71 11.64 34.24 41.68 25.72 15.96 - - - -
ALL-INDIA 40.93 49.64 44.03 5.61 28.42 33.63 29.70 3.93 22.72 31.70 29.19 2.51

STATEMENT 3.1 (b) (i)
AVERAGE DAILY EARNINGS OF MEN, WOMEN AND CHILDREN BELONGING TO AGRICULTURAL LABOUR HOUSEHOLDS IN AGRICULTURAL OCCUPATIONS - ALL CLASSES
(In Rupees)SL. STATES/ MEN WOMEN CHILDRENNO. UNION TERRITORIES 1999- 2004-05 1999- 2004-05 1999- 2004-05
2000 Total Cash Kind 2000 Total Cash Kind 2000 Total Cash Kind1 2 3 4 5 6 7 8 9 10 11 12 13 14
Major States1 Andhra Pradesh 39.76 45.95 44.88 1.07 26.53 30.11 29.32 0.79 23.93 27.87 27.28 0.592 Assam 45.51 60.13 50.62 9.51 39.07 55.94 47.33 8.61 29.98 63.23 41.60 21.633 Bihar 35.04 43.43 29.21 14.22 30.98 37.34 22.64 14.70 23.98 32.55 22.04 10.514 Gujarat 38.98 45.95 42.19 3.76 33.30 41.20 37.48 3.72 31.56 35.00 30.03 4.975 Haryana 60.57 73.29 58.25 15.04 56.06 64.34 34.98 29.36 40.10 48.71 45.97 2.746 Karnataka 39.75 43.31 40.97 2.34 26.77 30.46 28.12 2.34 19.98 27.58 26.24 1.347 Kerala 95.34 115.08 107.77 7.31 62.22 73.24 67.55 5.69 - - - -8 Madhya Pradesh 29.80 34.63 27.40 7.23 25.36 28.32 21.30 7.02 20.25 27.26 21.40 5.869 Maharashtra 37.47 43.98 42.48 1.50 24.24 27.18 26.05 1.13 21.14 28.26 27.71 0.5510 Orissa 28.63 39.46 36.41 3.05 22.13 27.36 23.47 3.89 18.96 31.38 26.32 5.0611 Punjab 63.44 71.75 63.94 7.81 78.70 54.69 46.62 8.07 59.84 42.89 41.37 1.5212 Rajasthan 50.45 64.13 56.46 7.67 39.51 51.71 40.39 11.32 23.36 40.04 36.98 3.0613 TamilNadu 51.78 64.08 58.17 5.91 30.43 35.10 31.72 3.38 28.78 32.57 24.29 8.2814 Uttar Pradesh 37.85 48.46 41.98 6.48 29.07 38.81 27.84 10.97 24.19 33.28 26.29 6.9915 West Bengal 43.32 45.08 40.57 4.51 37.22 41.70 36.80 4.90 39.22 32.39 25.18 7.21
Other States/UTs16 Arunachal Pradesh 75.15 135.26 133.11 2.15 60.00 50.01 45.00 5.01 - - - -17 Chhattisgarh 26.32 31.39 23.26 8.13 22.92 25.60 18.96 6.64 18.90 17.91 12.93 4.9818 Goa 50.47 99.87 99.02 0.85 50.00 67.41 67.41 - - - - -19 Himachal Pradesh 64.14 89.31 64.87 24.44 56.79 61.65 58.00 3.65 - - - -20 Jammu & Kashmir 86.44 90.90 76.40 14.50 - - - - - - - -21 Jharkhand 34.33 40.12 36.29 3.83 28.84 34.92 30.76 4.16 35.68 11.78 8.40 3.3822 Manipur 52.24 57.72 57.72 - 49.73 49.14 49.14 - 33.33 - - -23 Meghalaya 47.95 61.72 60.07 1.65 34.93 45.27 43.19 2.08 31.35 41.64 41.64 -24 Mizoram 95.83 120.20 120.20 - 137.15 - - - - - - -25 Nagaland 135.00 - - - - - - - - - - -26 Sikkim 50.99 83.73 67.36 16.37 39.52 64.20 54.38 9.82 - - - -27 Tripura 49.24 59.93 59.41 0.52 36.37 41.76 41.76 - 39.11 - - -28 Uttranchal 57.35 58.97 56.00 2.97 51.95 52.14 49.87 2.27 - 46.27 38.66 7.6129 A & N Islands 77.80 152.36 146.09 6.27 125.00 176.57 176.57 - - - - -30 Chandigarh 122.37 - - - - - - - - - - -31 D & N Haveli 39.08 54.87 46.01 8.86 28.69 54.42 42.85 11.57 - 40.00 40.00 -32 Daman & Diu 67.86 84.13 64.03 20.10 52.18 66.42 47.61 18.81 - - - -33 Delhi 80.00 110.00 80.00 30.00 - - - - - - - -34 Lakshadweep 103.19 129.60 129.17 0.43 - - - - - - - -35 Pondicherry 48.16 66.86 59.48 7.38 30.28 39.13 29.71 9.42 - - - -
ALL-INDIA 40.15 47.53 41.90 5.63 28.38 33.41 29.28 4.13 24.23 29.55 26.23 3.32
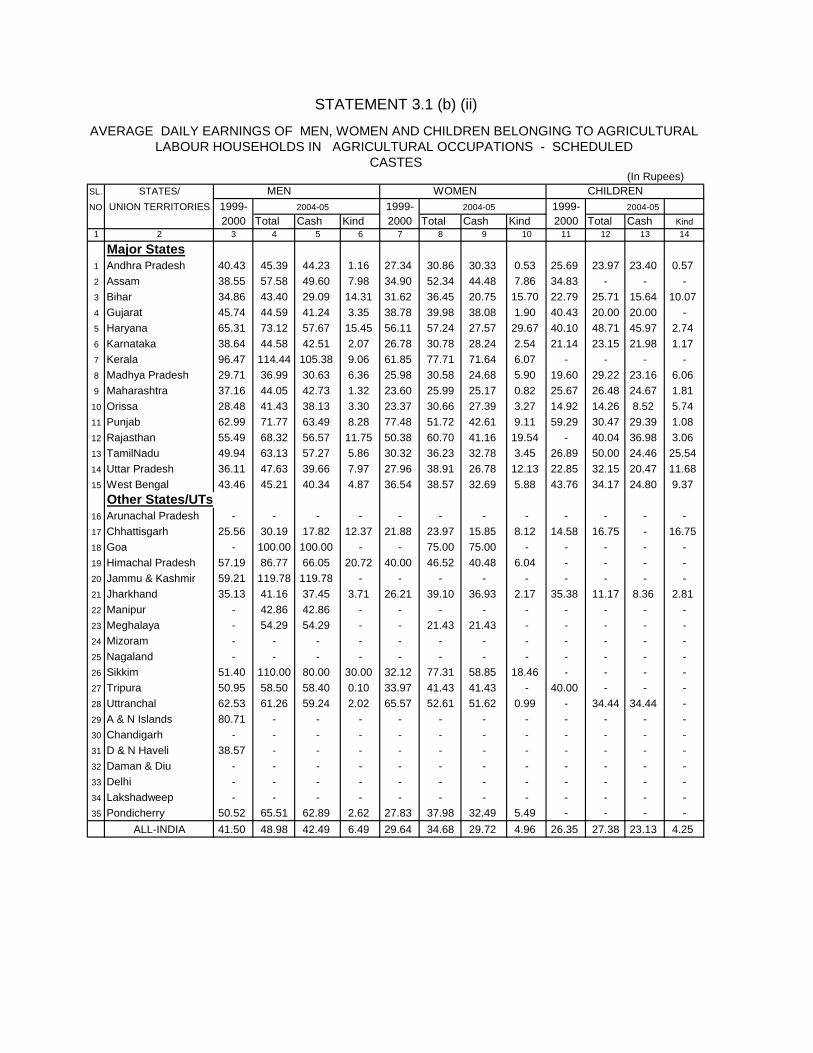
STATEMENT 3.1 (b) (ii)
AVERAGE DAILY EARNINGS OF MEN, WOMEN AND CHILDREN BELONGING TO AGRICULTURAL LABOUR HOUSEHOLDS IN AGRICULTURAL OCCUPATIONS - SCHEDULED
CASTES(In Rupees)
SL. STATES/ MEN WOMEN CHILDRENNO. UNION TERRITORIES 1999- 2004-05 1999- 2004-05 1999- 2004-05
2000 Total Cash Kind 2000 Total Cash Kind 2000 Total Cash Kind1 2 3 4 5 6 7 8 9 10 11 12 13 14
Major States1 Andhra Pradesh 40.43 45.39 44.23 1.16 27.34 30.86 30.33 0.53 25.69 23.97 23.40 0.572 Assam 38.55 57.58 49.60 7.98 34.90 52.34 44.48 7.86 34.83 - - -3 Bihar 34.86 43.40 29.09 14.31 31.62 36.45 20.75 15.70 22.79 25.71 15.64 10.074 Gujarat 45.74 44.59 41.24 3.35 38.78 39.98 38.08 1.90 40.43 20.00 20.00 -5 Haryana 65.31 73.12 57.67 15.45 56.11 57.24 27.57 29.67 40.10 48.71 45.97 2.746 Karnataka 38.64 44.58 42.51 2.07 26.78 30.78 28.24 2.54 21.14 23.15 21.98 1.177 Kerala 96.47 114.44 105.38 9.06 61.85 77.71 71.64 6.07 - - - -8 Madhya Pradesh 29.71 36.99 30.63 6.36 25.98 30.58 24.68 5.90 19.60 29.22 23.16 6.069 Maharashtra 37.16 44.05 42.73 1.32 23.60 25.99 25.17 0.82 25.67 26.48 24.67 1.81
10 Orissa 28.48 41.43 38.13 3.30 23.37 30.66 27.39 3.27 14.92 14.26 8.52 5.7411 Punjab 62.99 71.77 63.49 8.28 77.48 51.72 42.61 9.11 59.29 30.47 29.39 1.0812 Rajasthan 55.49 68.32 56.57 11.75 50.38 60.70 41.16 19.54 - 40.04 36.98 3.0613 TamilNadu 49.94 63.13 57.27 5.86 30.32 36.23 32.78 3.45 26.89 50.00 24.46 25.5414 Uttar Pradesh 36.11 47.63 39.66 7.97 27.96 38.91 26.78 12.13 22.85 32.15 20.47 11.6815 West Bengal 43.46 45.21 40.34 4.87 36.54 38.57 32.69 5.88 43.76 34.17 24.80 9.37
Other States/UTs16 Arunachal Pradesh - - - - - - - - - - - -17 Chhattisgarh 25.56 30.19 17.82 12.37 21.88 23.97 15.85 8.12 14.58 16.75 - 16.7518 Goa - 100.00 100.00 - - 75.00 75.00 - - - - -19 Himachal Pradesh 57.19 86.77 66.05 20.72 40.00 46.52 40.48 6.04 - - - -20 Jammu & Kashmir 59.21 119.78 119.78 - - - - - - - - -21 Jharkhand 35.13 41.16 37.45 3.71 26.21 39.10 36.93 2.17 35.38 11.17 8.36 2.8122 Manipur - 42.86 42.86 - - - - - - - - -23 Meghalaya - 54.29 54.29 - - 21.43 21.43 - - - - -24 Mizoram - - - - - - - - - - - -25 Nagaland - - - - - - - - - - - -26 Sikkim 51.40 110.00 80.00 30.00 32.12 77.31 58.85 18.46 - - - -27 Tripura 50.95 58.50 58.40 0.10 33.97 41.43 41.43 - 40.00 - - -28 Uttranchal 62.53 61.26 59.24 2.02 65.57 52.61 51.62 0.99 - 34.44 34.44 -29 A & N Islands 80.71 - - - - - - - - - - -30 Chandigarh - - - - - - - - - - - -31 D & N Haveli 38.57 - - - - - - - - - - -32 Daman & Diu - - - - - - - - - - - -33 Delhi - - - - - - - - - - - -34 Lakshadweep - - - - - - - - - - - -35 Pondicherry 50.52 65.51 62.89 2.62 27.83 37.98 32.49 5.49 - - - -
ALL-INDIA 41.50 48.98 42.49 6.49 29.64 34.68 29.72 4.96 26.35 27.38 23.13 4.25

STATEMENT 3.1 (b) (iii)
AVERAGE DAILY EARNINGS OF MEN, WOMEN AND CHILDREN BELONGING TO AGRICULTURAL LABOUR HOUSEHOLDS IN AGRICULTURAL OCCUPATIONS -
SCHEDULED TRIBES(In Rupees)
SL. STATES/ MEN WOMEN CHILDRENNO. UNION TERRITORIES 1999- 2004-05 1999- 2004-05 1999- 2004-05
2000 Total Cash Kind 2000 Total Cash Kind 2000 Total Cash Kind1 2 3 4 5 6 7 8 9 10 11 12 13 14
Major States1 Andhra Pradesh 39.03 47.44 44.92 2.52 29.56 29.93 27.21 2.72 28.51 26.35 24.92 1.432 Assam 45.61 59.61 52.18 7.43 36.51 52.72 45.46 7.26 29.00 - - -3 Bihar 33.32 50.25 12.71 37.54 31.61 44.00 32.00 12.00 30.00 - - -4 Gujarat 31.47 44.38 39.03 5.35 27.49 34.91 30.44 4.47 18.48 31.82 25.00 6.825 Haryana 62.87 - - - - - - - - - - -6 Karnataka 36.21 39.92 39.05 0.87 24.40 27.54 26.67 0.87 18.30 30.33 27.95 2.387 Kerala 78.06 109.04 96.71 12.33 54.13 73.77 64.66 9.11 - - - -8 Madhya Pradesh 28.90 33.03 24.76 8.27 25.15 27.27 18.32 8.95 20.46 24.61 15.18 9.439 Maharashtra 35.62 40.47 38.15 2.32 24.62 28.38 26.18 2.20 19.82 25.20 24.05 1.15
10 Orissa 26.24 36.28 32.16 4.12 22.37 24.89 19.80 5.09 18.72 35.98 31.10 4.8811 Punjab 48.88 80.00 80.00 - 124.00 - - - - - - -12 Rajasthan 33.98 50.22 45.50 4.72 28.98 38.38 35.86 2.52 19.58 - - -13 TamilNadu 53.76 53.45 52.98 0.47 21.62 40.85 36.98 3.87 - - - -14 Uttar Pradesh 20.63 40.43 33.19 7.24 17.92 23.83 23.83 - - - - -15 West Bengal 41.11 44.98 40.04 4.94 37.36 45.28 40.40 4.88 36.18 30.00 - 30.00
Other States/UTs16 Arunachal Pradesh 73.65 270.82 270.82 - 60.00 - - - - - - -17 Chhattisgarh 27.13 34.83 29.54 5.29 23.10 28.76 23.45 5.31 25.15 17.53 15.46 2.0718 Goa - - - - - - - - - - - -19 Himachal Pradesh 81.02 - - - 62.56 75.00 75.00 - - - - -20 Jammu & Kashmir - - - - - - - - - - - -21 Jharkhand 32.48 37.41 33.69 3.72 30.81 32.76 28.53 4.23 36.89 - - -22 Manipur 58.82 41.90 41.90 - 50.00 41.43 41.43 - - - - -23 Meghalaya 47.66 62.20 60.41 1.79 34.94 47.02 44.84 2.18 31.72 41.64 41.64 -24 Mizoram 95.83 120.20 120.20 - 137.15 - - - - - - -25 Nagaland 135.00 - - - - - - - - - - -26 Sikkim 52.09 81.49 65.71 15.78 30.00 50.00 43.05 6.95 - - - -27 Tripura 37.77 69.43 68.06 1.37 38.97 55.19 55.19 - - - - -28 Uttranchal - 31.43 31.43 - - - - - - - - -29 A & N Islands 78.44 - - - - - - - - - - -30 Chandigarh - - - - - - - - - - - -31 D & N Haveli 39.24 54.87 46.01 8.86 28.69 54.42 42.85 11.57 - 40.00 40.00 -32 Daman & Diu 69.35 82.64 62.64 20.00 52.18 68.43 50.00 18.43 - - - -33 Delhi - - - - - - - - - - - -34 Lakshadweep 101.01 129.60 129.17 0.43 - - - - - - - -35 Pondicherry 47.14 - - - - - - - - - - -
ALL-INDIA 32.79 41.31 36.04 5.27 26.18 31.29 26.68 4.61 22.01 28.14 23.87 4.27
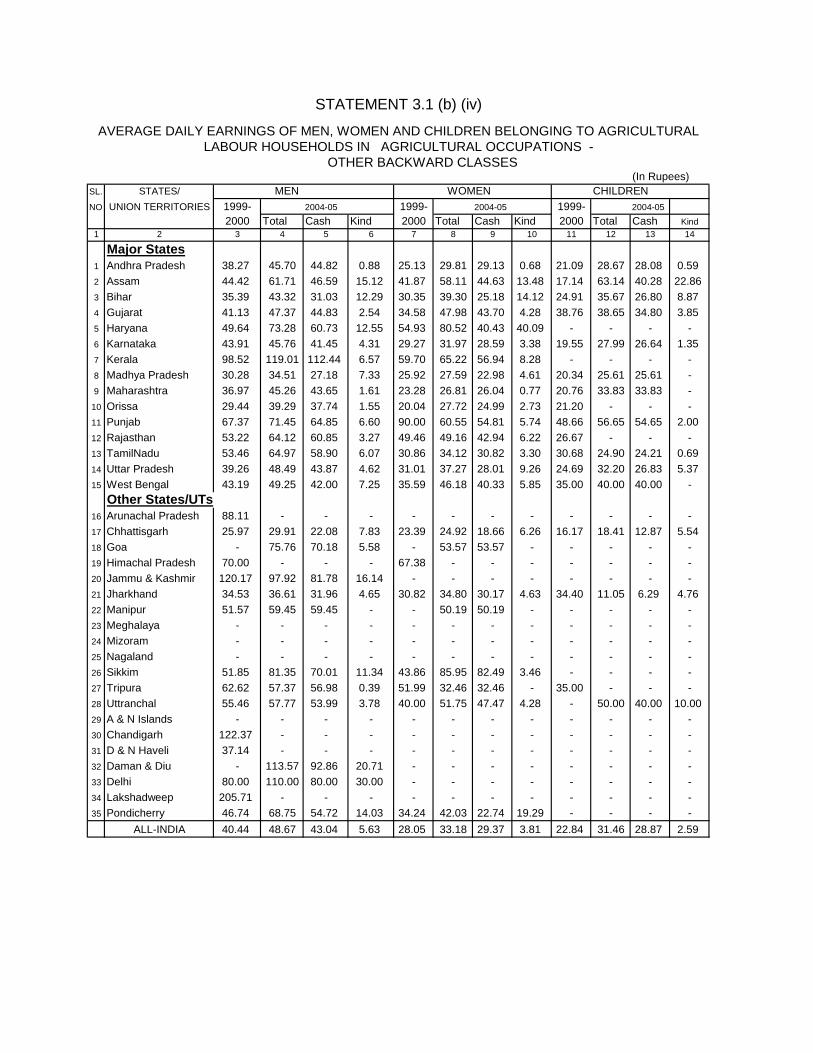
STATEMENT 3.1 (b) (iv)
AVERAGE DAILY EARNINGS OF MEN, WOMEN AND CHILDREN BELONGING TO AGRICULTURAL LABOUR HOUSEHOLDS IN AGRICULTURAL OCCUPATIONS -
OTHER BACKWARD CLASSES(In Rupees)
SL. STATES/ MEN WOMEN CHILDRENNO. UNION TERRITORIES 1999- 2004-05 1999- 2004-05 1999- 2004-05
2000 Total Cash Kind 2000 Total Cash Kind 2000 Total Cash Kind1 2 3 4 5 6 7 8 9 10 11 12 13 14
Major States1 Andhra Pradesh 38.27 45.70 44.82 0.88 25.13 29.81 29.13 0.68 21.09 28.67 28.08 0.592 Assam 44.42 61.71 46.59 15.12 41.87 58.11 44.63 13.48 17.14 63.14 40.28 22.863 Bihar 35.39 43.32 31.03 12.29 30.35 39.30 25.18 14.12 24.91 35.67 26.80 8.874 Gujarat 41.13 47.37 44.83 2.54 34.58 47.98 43.70 4.28 38.76 38.65 34.80 3.855 Haryana 49.64 73.28 60.73 12.55 54.93 80.52 40.43 40.09 - - - -6 Karnataka 43.91 45.76 41.45 4.31 29.27 31.97 28.59 3.38 19.55 27.99 26.64 1.357 Kerala 98.52 119.01 112.44 6.57 59.70 65.22 56.94 8.28 - - - -8 Madhya Pradesh 30.28 34.51 27.18 7.33 25.92 27.59 22.98 4.61 20.34 25.61 25.61 -9 Maharashtra 36.97 45.26 43.65 1.61 23.28 26.81 26.04 0.77 20.76 33.83 33.83 -
10 Orissa 29.44 39.29 37.74 1.55 20.04 27.72 24.99 2.73 21.20 - - -11 Punjab 67.37 71.45 64.85 6.60 90.00 60.55 54.81 5.74 48.66 56.65 54.65 2.0012 Rajasthan 53.22 64.12 60.85 3.27 49.46 49.16 42.94 6.22 26.67 - - -13 TamilNadu 53.46 64.97 58.90 6.07 30.86 34.12 30.82 3.30 30.68 24.90 24.21 0.6914 Uttar Pradesh 39.26 48.49 43.87 4.62 31.01 37.27 28.01 9.26 24.69 32.20 26.83 5.3715 West Bengal 43.19 49.25 42.00 7.25 35.59 46.18 40.33 5.85 35.00 40.00 40.00 -
Other States/UTs16 Arunachal Pradesh 88.11 - - - - - - - - - - -17 Chhattisgarh 25.97 29.91 22.08 7.83 23.39 24.92 18.66 6.26 16.17 18.41 12.87 5.5418 Goa - 75.76 70.18 5.58 - 53.57 53.57 - - - - -19 Himachal Pradesh 70.00 - - - 67.38 - - - - - - -20 Jammu & Kashmir 120.17 97.92 81.78 16.14 - - - - - - - -21 Jharkhand 34.53 36.61 31.96 4.65 30.82 34.80 30.17 4.63 34.40 11.05 6.29 4.7622 Manipur 51.57 59.45 59.45 - - 50.19 50.19 - - - - -23 Meghalaya - - - - - - - - - - - -24 Mizoram - - - - - - - - - - - -25 Nagaland - - - - - - - - - - - -26 Sikkim 51.85 81.35 70.01 11.34 43.86 85.95 82.49 3.46 - - - -27 Tripura 62.62 57.37 56.98 0.39 51.99 32.46 32.46 - 35.00 - - -28 Uttranchal 55.46 57.77 53.99 3.78 40.00 51.75 47.47 4.28 - 50.00 40.00 10.0029 A & N Islands - - - - - - - - - - - -30 Chandigarh 122.37 - - - - - - - - - - -31 D & N Haveli 37.14 - - - - - - - - - - -32 Daman & Diu - 113.57 92.86 20.71 - - - - - - - -33 Delhi 80.00 110.00 80.00 30.00 - - - - - - - -34 Lakshadweep 205.71 - - - - - - - - - - -35 Pondicherry 46.74 68.75 54.72 14.03 34.24 42.03 22.74 19.29 - - - -
ALL-INDIA 40.44 48.67 43.04 5.63 28.05 33.18 29.37 3.81 22.84 31.46 28.87 2.59

STATEMENT 3.2 (a) (i)
AVERAGE DAILY EARNINGS OF MEN, WOMEN AND CHILDREN BELONGING TO RURAL LABOUR HOUSEHOLDS IN NON-AGRICULTURAL OCCUPATIONS - ALL CLASSES
(In Rupees)SL. STATES/ MEN WOMEN CHILDRENNO. UNION TERRITORIES 1999- 2004-05 1999- 2004-05 1999- 2004-05
2000 Total Cash Kind 2000 Total Cash Kind 2000 Total Cash Kind1 2 3 4 5 6 7 8 9 10 11 12 13 14
Major States1 Andhra Pradesh 52.50 62.87 61.21 1.66 31.70 39.46 37.72 1.74 28.53 24.62 23.96 0.662 Assam 53.62 73.96 70.42 3.54 32.95 58.00 55.03 2.97 53.37 44.72 44.72 -3 Bihar 46.25 68.09 65.52 2.57 29.05 35.18 30.20 4.98 27.35 - - -4 Gujarat 46.71 75.38 74.50 0.88 36.44 52.14 48.48 3.66 29.41 45.60 45.60 -5 Haryana 80.00 85.51 83.13 2.38 25.75 58.97 55.17 3.80 60.00 42.48 33.05 9.436 Karnataka 61.45 74.45 72.57 1.88 42.87 30.92 28.93 1.99 38.69 33.27 32.60 0.677 Kerala 107.74 139.81 135.85 3.96 50.21 54.34 49.60 4.74 73.04 65.05 48.70 16.358 Madhya Pradesh 50.23 47.21 45.08 2.13 27.37 28.09 25.99 2.10 23.32 40.37 37.28 3.099 Maharashtra 74.29 73.93 72.00 1.93 45.22 39.70 37.78 1.92 20.46 25.00 17.72 7.2810 Orissa 38.54 56.35 54.94 1.41 26.66 36.41 35.43 0.98 30.58 27.63 27.20 0.4311 Punjab 72.63 84.47 81.04 3.43 40.88 46.30 39.60 6.70 40.00 38.03 32.91 5.1212 Rajasthan 62.27 69.29 65.48 3.81 40.44 52.45 39.12 13.33 30.03 43.12 36.30 6.8213 TamilNadu 75.15 85.42 83.11 2.31 - 41.85 39.48 2.37 25.74 26.47 26.47 -14 Uttar Pradesh 51.53 58.49 57.16 1.33 39.94 52.66 44.94 7.72 34.12 21.18 19.64 1.5415 West Bengal 56.42 64.06 60.43 3.63 32.00 33.33 28.14 5.19 24.06 29.05 25.47 3.58
Other States/UTs16 Arunachal Pradesh 60.50 41.76 41.76 - 39.69 54.33 54.33 - - - - -17 Chhattisgarh 40.43 52.05 51.07 0.98 32.14 41.59 37.13 4.46 22.12 27.92 27.92 -18 Goa 82.48 119.00 117.82 1.18 49.97 64.59 62.09 2.50 - 78.46 78.46 -19 Himachal Pradesh 76.62 99.44 94.05 5.39 43.55 68.15 66.54 1.61 - - - -20 Jammu & Kashmir 73.37 92.43 86.66 5.77 58.65 14.29 14.29 - - - - -21 Jharkhand 45.72 53.84 52.82 1.02 33.25 41.96 41.57 0.39 29.67 44.28 44.28 -22 Manipur 142.60 75.70 75.70 - 36.37 77.06 77.06 - - 45.06 45.06 -23 Meghalaya 81.66 72.18 72.09 0.09 35.71 30.41 28.36 2.05 - - - -24 Mizoram 91.70 100.00 100.00 - - - - - - - - -25 Nagaland 106.25 94.30 94.30 - - - - - - - - -26 Sikkim 117.61 100.05 98.94 1.11 49.10 79.46 79.46 - - - - -27 Tripura 52.02 66.41 66.35 0.06 40.15 41.50 40.11 1.39 - 21.43 21.43 -28 Uttranchal 56.40 75.69 74.94 0.75 57.22 67.51 65.96 1.55 - 41.12 41.12 -29 A & N Islands 123.81 145.12 143.62 1.50 103.36 67.78 66.75 1.03 - - - -30 Chandigarh 81.67 86.93 69.04 17.89 - - - - - - - -31 D & N Haveli 65.59 81.78 77.48 4.30 48.91 58.04 57.96 0.08 25.00 - - -32 Daman & Diu 89.67 112.23 110.36 1.87 67.41 60.00 60.00 - 85.71 - - -33 Delhi 74.44 67.86 67.86 - - - - - - - - -34 Lakshadweep 147.74 132.70 132.70 - - - - - - - - -35 Pondicherry 88.14 72.89 69.38 3.51 40.05 54.31 51.75 2.56 - - - -
ALL-INDIA 64.92 74.88 72.55 2.33 56.13 42.59 38.74 3.85 28.65 32.05 29.04 3.01

STATEMENT 3.2 (a) (ii)
AVERAGE DAILY EARNINGS OF MEN, WOMEN AND CHILDREN BELONGING TO RURAL LABOUR HOUSEHOLDS IN NON-AGRICULTURAL OCCUPATIONS -
SCHEDULED CASTES(In Rupees)
SL. STATES/ MEN WOMEN CHILDRENNO. UNION TERRITORIES 1999- 2004-05 1999- 2004-05 1999- 2004-05
2000 Total Cash Kind 2000 Total Cash Kind 2000 Total Cash Kind1 2 3 4 5 6 7 8 9 10 11 12 13 14
Major States1 Andhra Pradesh 44.52 64.14 63.79 0.35 34.77 41.62 39.77 1.85 35.84 13.93 12.52 1.412 Assam 51.29 83.57 81.60 1.97 27.73 - - - 60.00 - - -3 Bihar 47.85 54.24 52.22 2.02 29.81 37.24 35.81 1.43 20.00 - - -4 Gujarat 62.41 66.43 64.97 1.46 41.39 42.07 36.09 5.98 50.00 - - -5 Haryana 69.21 80.24 78.63 1.61 29.03 51.17 45.64 5.53 - 42.48 33.05 9.436 Karnataka 63.97 72.49 71.34 1.15 36.05 37.86 37.58 0.28 20.00 - - -7 Kerala 108.38 139.68 135.83 3.85 55.07 55.93 49.37 6.56 40.00 73.33 60.00 13.338 Madhya Pradesh 48.34 38.20 37.69 0.51 25.89 20.67 20.60 0.07 20.52 - - -9 Maharashtra 71.40 75.65 71.90 3.75 48.50 63.43 60.86 2.57 10.57 - - -
10 Orissa 36.55 63.59 62.77 0.82 27.51 35.98 34.77 1.21 - 30.00 30.00 -11 Punjab 70.92 84.35 80.19 4.16 43.42 41.86 34.06 7.80 40.00 53.13 50.00 3.1312 Rajasthan 71.11 71.83 67.48 4.35 25.53 52.46 35.83 16.63 30.00 53.85 53.85 -13 TamilNadu 73.94 82.02 80.84 1.18 33.88 43.24 39.98 3.26 26.72 21.89 21.89 -14 Uttar Pradesh 52.21 58.63 57.19 1.44 42.97 61.00 52.15 8.85 29.24 20.00 20.00 -15 West Bengal 49.45 71.48 69.67 1.81 30.84 29.61 25.23 4.38 37.72 31.80 28.71 3.09
Other States/UTs16 Arunachal Pradesh - - - - - - - - - - - -17 Chhattisgarh 39.75 53.40 53.23 0.17 43.60 48.15 42.00 6.15 - - - -18 Goa 65.77 143.11 143.11 - - 80.00 80.00 - - - - -19 Himachal Pradesh 69.15 94.84 87.44 7.40 67.10 49.32 47.87 1.45 - - - -20 Jammu & Kashmir 57.50 83.13 80.68 2.45 58.65 - - - - - -21 Jharkhand 46.97 52.02 51.44 0.58 19.19 48.76 48.76 - 30.00 50.00 50.00 -22 Manipur - - - - - - - - - - - -23 Meghalaya - - - - - - - - - - - -24 Mizoram - - - - - - - - - - - -25 Nagaland - - - - - - - - - - - -26 Sikkim 96.64 107.94 107.72 0.22 42.05 89.32 89.32 - - - - -27 Tripura 53.79 72.06 71.98 0.08 33.85 42.43 40.99 1.44 - - - -28 Uttranchal 61.84 74.54 74.09 0.45 21.42 100.00 100.00 - - 50.00 50.00 -29 A & N Islands 81.51 - - - - - - - - - - -30 Chandigarh 88.03 100.00 100.00 - - - - - - - - -31 D & N Haveli 75.29 - - - - - - - - - - -32 Daman & Diu 105.42 - - - - - - - - - - -33 Delhi 50.00 - - - - - - - - - - -34 Lakshadweep - 100.00 100.00 - - - - - - - - -35 Pondicherry 79.75 56.63 55.25 1.38 32.54 17.86 17.86 - - - - -
ALL-INDIA 61.06 71.51 69.48 2.03 36.82 43.59 38.67 4.92 30.85 32.51 29.86 2.65
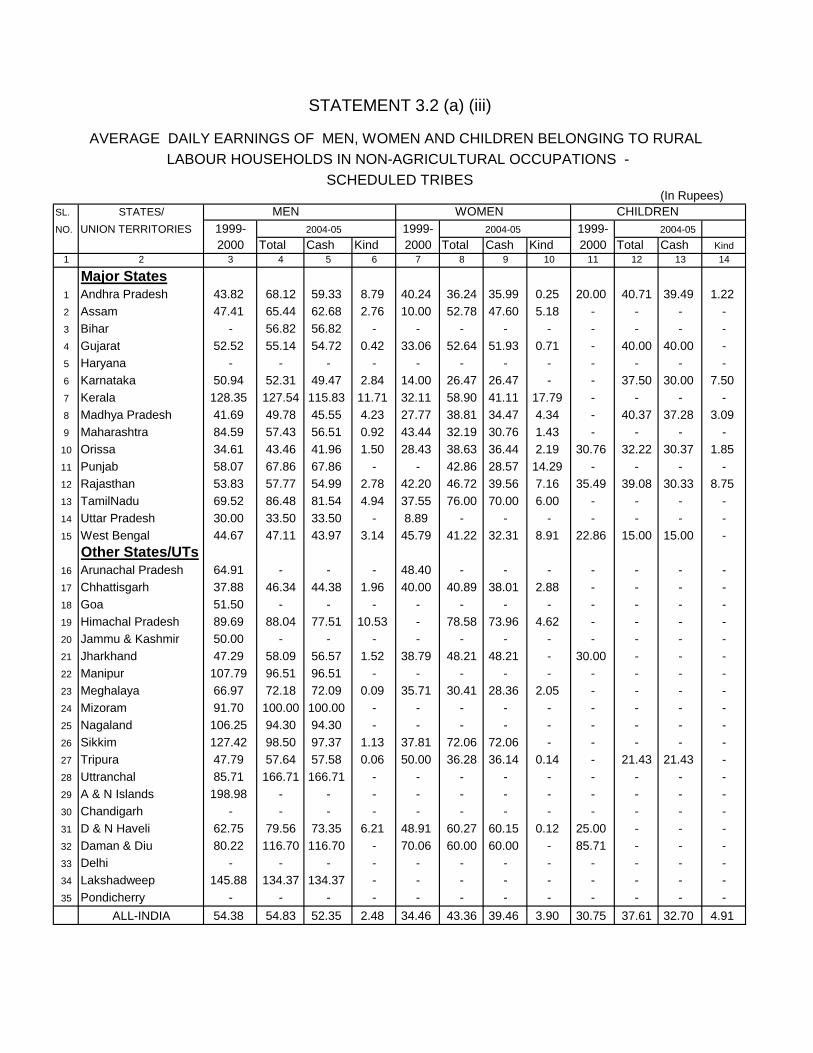
STATEMENT 3.2 (a) (iii)
AVERAGE DAILY EARNINGS OF MEN, WOMEN AND CHILDREN BELONGING TO RURAL LABOUR HOUSEHOLDS IN NON-AGRICULTURAL OCCUPATIONS -
SCHEDULED TRIBES(In Rupees)
SL. STATES/ MEN WOMEN CHILDRENNO. UNION TERRITORIES 1999- 2004-05 1999- 2004-05 1999- 2004-05
2000 Total Cash Kind 2000 Total Cash Kind 2000 Total Cash Kind1 2 3 4 5 6 7 8 9 10 11 12 13 14
Major States1 Andhra Pradesh 43.82 68.12 59.33 8.79 40.24 36.24 35.99 0.25 20.00 40.71 39.49 1.222 Assam 47.41 65.44 62.68 2.76 10.00 52.78 47.60 5.18 - - - -3 Bihar - 56.82 56.82 - - - - - - - - -4 Gujarat 52.52 55.14 54.72 0.42 33.06 52.64 51.93 0.71 - 40.00 40.00 -5 Haryana - - - - - - - - - - - -6 Karnataka 50.94 52.31 49.47 2.84 14.00 26.47 26.47 - - 37.50 30.00 7.507 Kerala 128.35 127.54 115.83 11.71 32.11 58.90 41.11 17.79 - - - -8 Madhya Pradesh 41.69 49.78 45.55 4.23 27.77 38.81 34.47 4.34 - 40.37 37.28 3.099 Maharashtra 84.59 57.43 56.51 0.92 43.44 32.19 30.76 1.43 - - - -
10 Orissa 34.61 43.46 41.96 1.50 28.43 38.63 36.44 2.19 30.76 32.22 30.37 1.8511 Punjab 58.07 67.86 67.86 - - 42.86 28.57 14.29 - - - -12 Rajasthan 53.83 57.77 54.99 2.78 42.20 46.72 39.56 7.16 35.49 39.08 30.33 8.7513 TamilNadu 69.52 86.48 81.54 4.94 37.55 76.00 70.00 6.00 - - - -14 Uttar Pradesh 30.00 33.50 33.50 - 8.89 - - - - - - -15 West Bengal 44.67 47.11 43.97 3.14 45.79 41.22 32.31 8.91 22.86 15.00 15.00 -
Other States/UTs16 Arunachal Pradesh 64.91 - - - 48.40 - - - - - - -17 Chhattisgarh 37.88 46.34 44.38 1.96 40.00 40.89 38.01 2.88 - - - -18 Goa 51.50 - - - - - - - - - - -19 Himachal Pradesh 89.69 88.04 77.51 10.53 - 78.58 73.96 4.62 - - - -20 Jammu & Kashmir 50.00 - - - - - - - - - - -21 Jharkhand 47.29 58.09 56.57 1.52 38.79 48.21 48.21 - 30.00 - - -22 Manipur 107.79 96.51 96.51 - - - - - - - - -23 Meghalaya 66.97 72.18 72.09 0.09 35.71 30.41 28.36 2.05 - - - -24 Mizoram 91.70 100.00 100.00 - - - - - - - - -25 Nagaland 106.25 94.30 94.30 - - - - - - - - -26 Sikkim 127.42 98.50 97.37 1.13 37.81 72.06 72.06 - - - - -27 Tripura 47.79 57.64 57.58 0.06 50.00 36.28 36.14 0.14 - 21.43 21.43 -28 Uttranchal 85.71 166.71 166.71 - - - - - - - - -29 A & N Islands 198.98 - - - - - - - - - - -30 Chandigarh - - - - - - - - - - - -31 D & N Haveli 62.75 79.56 73.35 6.21 48.91 60.27 60.15 0.12 25.00 - - -32 Daman & Diu 80.22 116.70 116.70 - 70.06 60.00 60.00 - 85.71 - - -33 Delhi - - - - - - - - - - - -34 Lakshadweep 145.88 134.37 134.37 - - - - - - - - -35 Pondicherry - - - - - - - - - - - -
ALL-INDIA 54.38 54.83 52.35 2.48 34.46 43.36 39.46 3.90 30.75 37.61 32.70 4.91
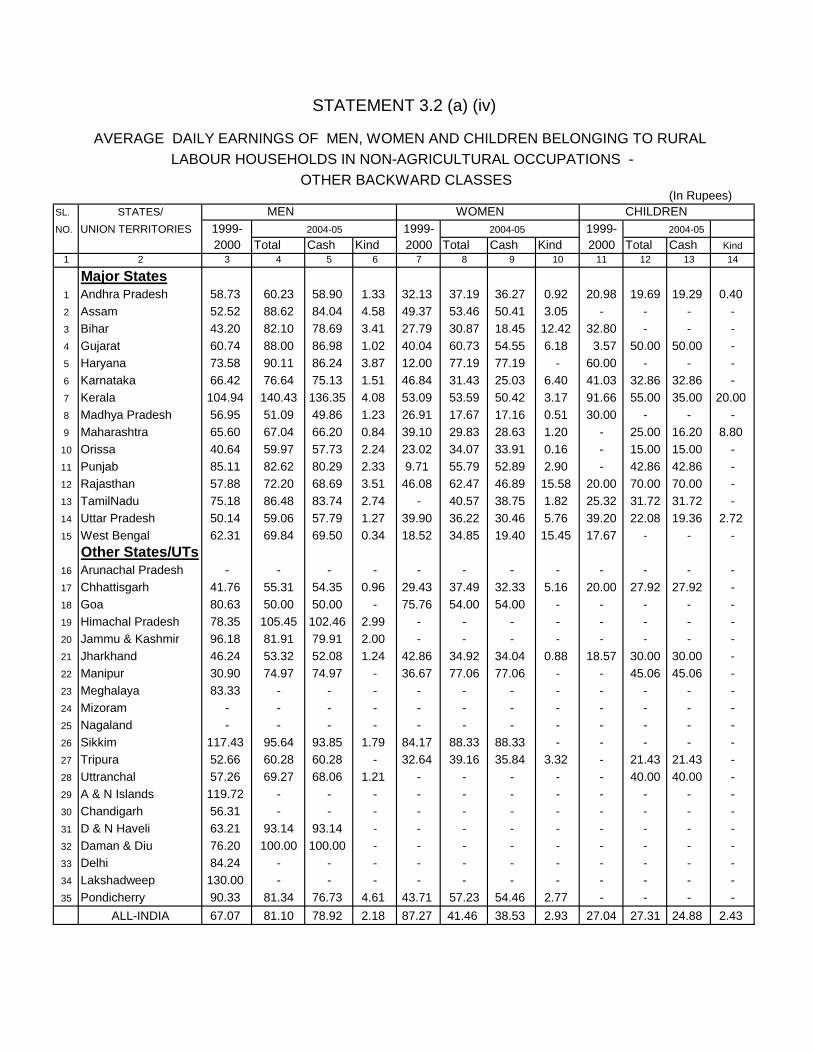
STATEMENT 3.2 (a) (iv)
AVERAGE DAILY EARNINGS OF MEN, WOMEN AND CHILDREN BELONGING TO RURAL LABOUR HOUSEHOLDS IN NON-AGRICULTURAL OCCUPATIONS -
OTHER BACKWARD CLASSES(In Rupees)
SL. STATES/ MEN WOMEN CHILDRENNO. UNION TERRITORIES 1999- 2004-05 1999- 2004-05 1999- 2004-05
2000 Total Cash Kind 2000 Total Cash Kind 2000 Total Cash Kind1 2 3 4 5 6 7 8 9 10 11 12 13 14
Major States1 Andhra Pradesh 58.73 60.23 58.90 1.33 32.13 37.19 36.27 0.92 20.98 19.69 19.29 0.402 Assam 52.52 88.62 84.04 4.58 49.37 53.46 50.41 3.05 - - - -3 Bihar 43.20 82.10 78.69 3.41 27.79 30.87 18.45 12.42 32.80 - - -4 Gujarat 60.74 88.00 86.98 1.02 40.04 60.73 54.55 6.18 3.57 50.00 50.00 -5 Haryana 73.58 90.11 86.24 3.87 12.00 77.19 77.19 - 60.00 - - -6 Karnataka 66.42 76.64 75.13 1.51 46.84 31.43 25.03 6.40 41.03 32.86 32.86 -7 Kerala 104.94 140.43 136.35 4.08 53.09 53.59 50.42 3.17 91.66 55.00 35.00 20.008 Madhya Pradesh 56.95 51.09 49.86 1.23 26.91 17.67 17.16 0.51 30.00 - - -9 Maharashtra 65.60 67.04 66.20 0.84 39.10 29.83 28.63 1.20 - 25.00 16.20 8.80
10 Orissa 40.64 59.97 57.73 2.24 23.02 34.07 33.91 0.16 - 15.00 15.00 -11 Punjab 85.11 82.62 80.29 2.33 9.71 55.79 52.89 2.90 - 42.86 42.86 -12 Rajasthan 57.88 72.20 68.69 3.51 46.08 62.47 46.89 15.58 20.00 70.00 70.00 -13 TamilNadu 75.18 86.48 83.74 2.74 - 40.57 38.75 1.82 25.32 31.72 31.72 -14 Uttar Pradesh 50.14 59.06 57.79 1.27 39.90 36.22 30.46 5.76 39.20 22.08 19.36 2.7215 West Bengal 62.31 69.84 69.50 0.34 18.52 34.85 19.40 15.45 17.67 - - -
Other States/UTs16 Arunachal Pradesh - - - - - - - - - - - -17 Chhattisgarh 41.76 55.31 54.35 0.96 29.43 37.49 32.33 5.16 20.00 27.92 27.92 -18 Goa 80.63 50.00 50.00 - 75.76 54.00 54.00 - - - - -19 Himachal Pradesh 78.35 105.45 102.46 2.99 - - - - - - - -20 Jammu & Kashmir 96.18 81.91 79.91 2.00 - - - - - - - -21 Jharkhand 46.24 53.32 52.08 1.24 42.86 34.92 34.04 0.88 18.57 30.00 30.00 -22 Manipur 30.90 74.97 74.97 - 36.67 77.06 77.06 - - 45.06 45.06 -23 Meghalaya 83.33 - - - - - - - - - - -24 Mizoram - - - - - - - - - - - -25 Nagaland - - - - - - - - - - - -26 Sikkim 117.43 95.64 93.85 1.79 84.17 88.33 88.33 - - - - -27 Tripura 52.66 60.28 60.28 - 32.64 39.16 35.84 3.32 - 21.43 21.43 -28 Uttranchal 57.26 69.27 68.06 1.21 - - - - - 40.00 40.00 -29 A & N Islands 119.72 - - - - - - - - - - -30 Chandigarh 56.31 - - - - - - - - - - -31 D & N Haveli 63.21 93.14 93.14 - - - - - - - - -32 Daman & Diu 76.20 100.00 100.00 - - - - - - - - -33 Delhi 84.24 - - - - - - - - - - -34 Lakshadweep 130.00 - - - - - - - - - - -35 Pondicherry 90.33 81.34 76.73 4.61 43.71 57.23 54.46 2.77 - - - -
ALL-INDIA 67.07 81.10 78.92 2.18 87.27 41.46 38.53 2.93 27.04 27.31 24.88 2.43
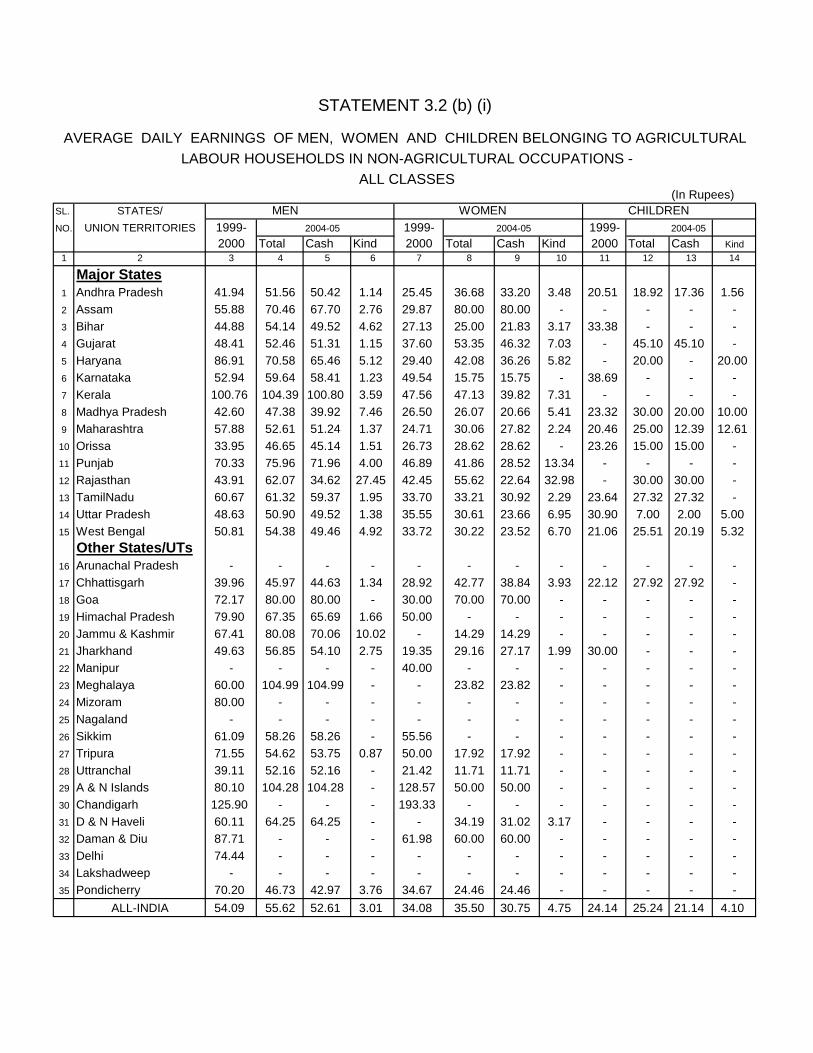
STATEMENT 3.2 (b) (i)
AVERAGE DAILY EARNINGS OF MEN, WOMEN AND CHILDREN BELONGING TO AGRICULTURAL LABOUR HOUSEHOLDS IN NON-AGRICULTURAL OCCUPATIONS -
ALL CLASSES(In Rupees)
SL. STATES/ MEN WOMEN CHILDRENNO. UNION TERRITORIES 1999- 2004-05 1999- 2004-05 1999- 2004-05
2000 Total Cash Kind 2000 Total Cash Kind 2000 Total Cash Kind1 2 3 4 5 6 7 8 9 10 11 12 13 14
Major States1 Andhra Pradesh 41.94 51.56 50.42 1.14 25.45 36.68 33.20 3.48 20.51 18.92 17.36 1.562 Assam 55.88 70.46 67.70 2.76 29.87 80.00 80.00 - - - - -3 Bihar 44.88 54.14 49.52 4.62 27.13 25.00 21.83 3.17 33.38 - - -4 Gujarat 48.41 52.46 51.31 1.15 37.60 53.35 46.32 7.03 - 45.10 45.10 -5 Haryana 86.91 70.58 65.46 5.12 29.40 42.08 36.26 5.82 - 20.00 - 20.006 Karnataka 52.94 59.64 58.41 1.23 49.54 15.75 15.75 - 38.69 - - -7 Kerala 100.76 104.39 100.80 3.59 47.56 47.13 39.82 7.31 - - - -8 Madhya Pradesh 42.60 47.38 39.92 7.46 26.50 26.07 20.66 5.41 23.32 30.00 20.00 10.009 Maharashtra 57.88 52.61 51.24 1.37 24.71 30.06 27.82 2.24 20.46 25.00 12.39 12.6110 Orissa 33.95 46.65 45.14 1.51 26.73 28.62 28.62 - 23.26 15.00 15.00 -11 Punjab 70.33 75.96 71.96 4.00 46.89 41.86 28.52 13.34 - - - -12 Rajasthan 43.91 62.07 34.62 27.45 42.45 55.62 22.64 32.98 - 30.00 30.00 -13 TamilNadu 60.67 61.32 59.37 1.95 33.70 33.21 30.92 2.29 23.64 27.32 27.32 -14 Uttar Pradesh 48.63 50.90 49.52 1.38 35.55 30.61 23.66 6.95 30.90 7.00 2.00 5.0015 West Bengal 50.81 54.38 49.46 4.92 33.72 30.22 23.52 6.70 21.06 25.51 20.19 5.32
Other States/UTs16 Arunachal Pradesh - - - - - - - - - - - -17 Chhattisgarh 39.96 45.97 44.63 1.34 28.92 42.77 38.84 3.93 22.12 27.92 27.92 -18 Goa 72.17 80.00 80.00 - 30.00 70.00 70.00 - - - - -19 Himachal Pradesh 79.90 67.35 65.69 1.66 50.00 - - - - - - -20 Jammu & Kashmir 67.41 80.08 70.06 10.02 - 14.29 14.29 - - - - -21 Jharkhand 49.63 56.85 54.10 2.75 19.35 29.16 27.17 1.99 30.00 - - -22 Manipur - - - - 40.00 - - - - - - -23 Meghalaya 60.00 104.99 104.99 - - 23.82 23.82 - - - - -24 Mizoram 80.00 - - - - - - - - - - -25 Nagaland - - - - - - - - - - - -26 Sikkim 61.09 58.26 58.26 - 55.56 - - - - - - -27 Tripura 71.55 54.62 53.75 0.87 50.00 17.92 17.92 - - - - -28 Uttranchal 39.11 52.16 52.16 - 21.42 11.71 11.71 - - - - -29 A & N Islands 80.10 104.28 104.28 - 128.57 50.00 50.00 - - - - -30 Chandigarh 125.90 - - - 193.33 - - - - - - -31 D & N Haveli 60.11 64.25 64.25 - - 34.19 31.02 3.17 - - - -32 Daman & Diu 87.71 - - - 61.98 60.00 60.00 - - - - -33 Delhi 74.44 - - - - - - - - - - -34 Lakshadweep - - - - - - - - - - - -35 Pondicherry 70.20 46.73 42.97 3.76 34.67 24.46 24.46 - - - - -
ALL-INDIA 54.09 55.62 52.61 3.01 34.08 35.50 30.75 4.75 24.14 25.24 21.14 4.10

STATEMENT 3.2 (b) (ii)
AVERAGE DAILY EARNINGS OF MEN, WOMEN AND CHILDREN BELONGING TO AGRI-CULTURAL LABOUR HOUSEHOLDS IN NON-AGRICULTURAL OCCUPATIONS -
SCHEDULED CASTES(In Rupees)
SL. STATES/ MEN WOMEN CHILDRENNO. UNION TERRITORIES 1999- 2004-05 1999- 2004-05 1999- 2004-05
2000 Total Cash Kind 2000 Total Cash Kind 2000 Total Cash Kind1 2 3 4 5 6 7 8 9 10 11 12 13 14
Major States1 Andhra Pradesh 35.29 52.62 52.02 0.60 17.18 34.43 34.15 0.28 7.99 13.93 12.52 1.412 Assam 53.41 41.17 35.83 5.34 28.57 - - - - - - -3 Bihar 42.66 51.11 49.98 1.13 27.43 25.00 21.83 3.17 - - - -4 Gujarat 53.28 46.32 41.32 5.00 47.20 50.00 17.26 32.74 - - - -5 Haryana 55.80 68.38 62.73 5.65 29.40 30.42 21.85 8.57 - 20.00 - 20.006 Karnataka 51.48 69.78 67.09 2.69 32.55 25.00 25.00 - 20.00 - - -7 Kerala 91.36 109.30 105.30 4.00 47.52 48.33 40.96 7.37 - - - -8 Madhya Pradesh 46.16 44.08 41.30 2.78 27.88 17.42 17.42 - 20.52 - - -9 Maharashtra 57.47 65.38 63.26 2.12 20.00 35.00 35.00 - 10.57 - - -
10 Orissa 33.91 46.94 46.79 0.15 30.15 37.13 37.13 - - - - -11 Punjab 66.00 75.63 70.06 5.57 46.89 41.86 28.52 13.34 - - - -12 Rajasthan 55.05 61.38 33.89 27.49 29.88 54.37 23.34 31.03 - 30.00 30.00 -13 TamilNadu 61.90 60.64 58.14 2.50 35.82 36.72 32.70 4.02 25.34 17.14 17.14 -14 Uttar Pradesh 50.85 56.19 54.13 2.06 40.12 40.00 40.00 - 19.44 - - -15 West Bengal 50.04 58.87 56.88 1.99 29.19 28.31 22.83 5.48 35.00 19.90 16.05 3.85
Other States/UTs16 Arunachal Pradesh - - - - - - - - - - - -17 Chhattisgarh 38.12 49.78 49.55 0.23 22.19 49.41 48.59 0.82 - - - -18 Goa 50.00 - - - - - - - - - - -19 Himachal Pradesh 65.23 65.00 65.00 - 50.00 - - - - - - -20 Jammu & Kashmir 60.00 - - - - - - - - - - -21 Jharkhand 47.09 56.84 56.84 - 6.28 30.00 30.00 - 30.00 - - -22 Manipur - - - - - - - - - - - -23 Meghalaya - - - - - - - - - - - -24 Mizoram - - - - - - - - - - - -25 Nagaland - - - - - - - - - - - -26 Sikkim - - - - - - - - - - - -27 Tripura 80.65 62.56 59.66 2.90 - 13.34 13.34 - - - - -28 Uttranchal - - - - 21.42 - - - - - - -29 A & N Islands 40.00 - - - - - - - - - - -30 Chandigarh 138.67 - - - - - - - - - - -31 D & N Haveli 55.00 - - - - - - - - - - -32 Daman & Diu 85.43 - - - - - - - - - - -33 Delhi 50.00 - - - - - - - - - - -34 Lakshadweep - - - - - - - - - - - -35 Pondicherry 72.20 33.26 28.61 4.65 32.54 17.86 17.86 - - - - -
ALL-INDIA 52.26 58.77 56.02 2.75 33.42 36.51 30.53 5.98 21.46 18.48 14.84 3.64
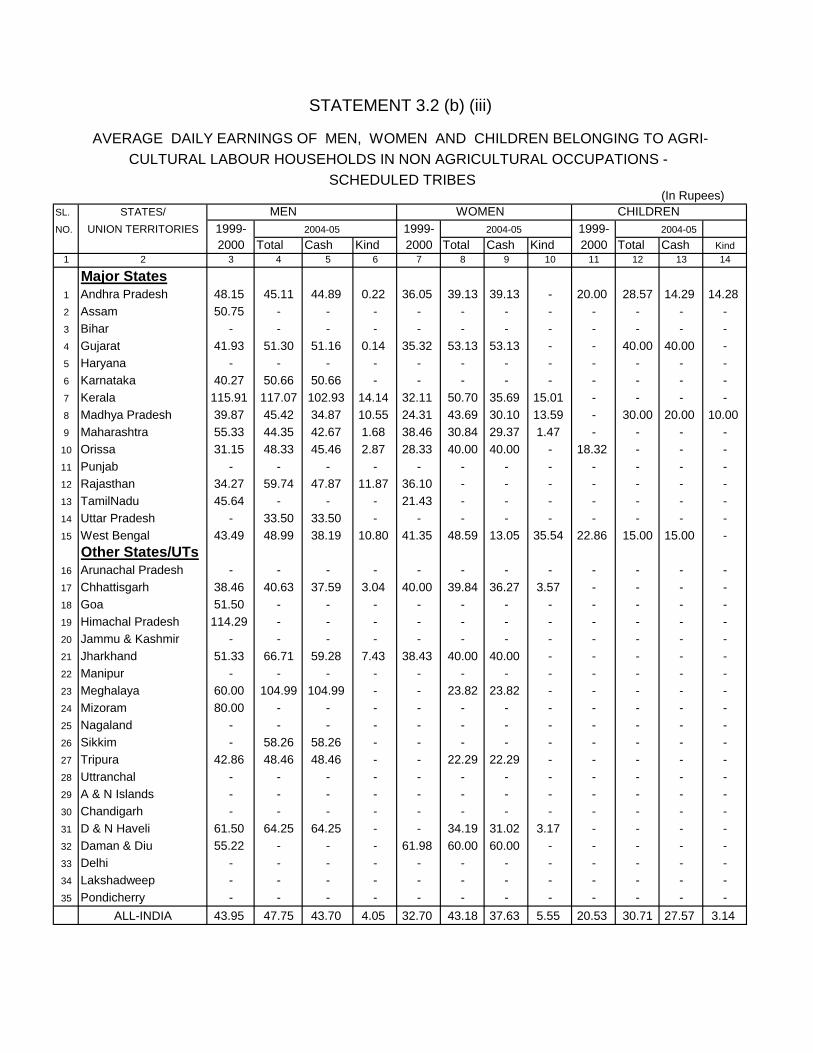
STATEMENT 3.2 (b) (iii)
AVERAGE DAILY EARNINGS OF MEN, WOMEN AND CHILDREN BELONGING TO AGRI-CULTURAL LABOUR HOUSEHOLDS IN NON AGRICULTURAL OCCUPATIONS -
SCHEDULED TRIBES(In Rupees)
SL. STATES/ MEN WOMEN CHILDRENNO. UNION TERRITORIES 1999- 2004-05 1999- 2004-05 1999- 2004-05
2000 Total Cash Kind 2000 Total Cash Kind 2000 Total Cash Kind1 2 3 4 5 6 7 8 9 10 11 12 13 14
Major States1 Andhra Pradesh 48.15 45.11 44.89 0.22 36.05 39.13 39.13 - 20.00 28.57 14.29 14.282 Assam 50.75 - - - - - - - - - - -3 Bihar - - - - - - - - - - - -4 Gujarat 41.93 51.30 51.16 0.14 35.32 53.13 53.13 - - 40.00 40.00 -5 Haryana - - - - - - - - - - - -6 Karnataka 40.27 50.66 50.66 - - - - - - - - -7 Kerala 115.91 117.07 102.93 14.14 32.11 50.70 35.69 15.01 - - - -8 Madhya Pradesh 39.87 45.42 34.87 10.55 24.31 43.69 30.10 13.59 - 30.00 20.00 10.009 Maharashtra 55.33 44.35 42.67 1.68 38.46 30.84 29.37 1.47 - - - -
10 Orissa 31.15 48.33 45.46 2.87 28.33 40.00 40.00 - 18.32 - - -11 Punjab - - - - - - - - - - - -12 Rajasthan 34.27 59.74 47.87 11.87 36.10 - - - - - - -13 TamilNadu 45.64 - - - 21.43 - - - - - - -14 Uttar Pradesh - 33.50 33.50 - - - - - - - - -15 West Bengal 43.49 48.99 38.19 10.80 41.35 48.59 13.05 35.54 22.86 15.00 15.00 -
Other States/UTs16 Arunachal Pradesh - - - - - - - - - - - -17 Chhattisgarh 38.46 40.63 37.59 3.04 40.00 39.84 36.27 3.57 - - - -18 Goa 51.50 - - - - - - - - - - -19 Himachal Pradesh 114.29 - - - - - - - - - - -20 Jammu & Kashmir - - - - - - - - - - - -21 Jharkhand 51.33 66.71 59.28 7.43 38.43 40.00 40.00 - - - - -22 Manipur - - - - - - - - - - - -23 Meghalaya 60.00 104.99 104.99 - - 23.82 23.82 - - - - -24 Mizoram 80.00 - - - - - - - - - - -25 Nagaland - - - - - - - - - - - -26 Sikkim - 58.26 58.26 - - - - - - - - -27 Tripura 42.86 48.46 48.46 - - 22.29 22.29 - - - - -28 Uttranchal - - - - - - - - - - - -29 A & N Islands - - - - - - - - - - - -30 Chandigarh - - - - - - - - - - - -31 D & N Haveli 61.50 64.25 64.25 - - 34.19 31.02 3.17 - - - -32 Daman & Diu 55.22 - - - 61.98 60.00 60.00 - - - - -33 Delhi - - - - - - - - - - - -34 Lakshadweep - - - - - - - - - - - -35 Pondicherry - - - - - - - - - - - -
ALL-INDIA 43.95 47.75 43.70 4.05 32.70 43.18 37.63 5.55 20.53 30.71 27.57 3.14
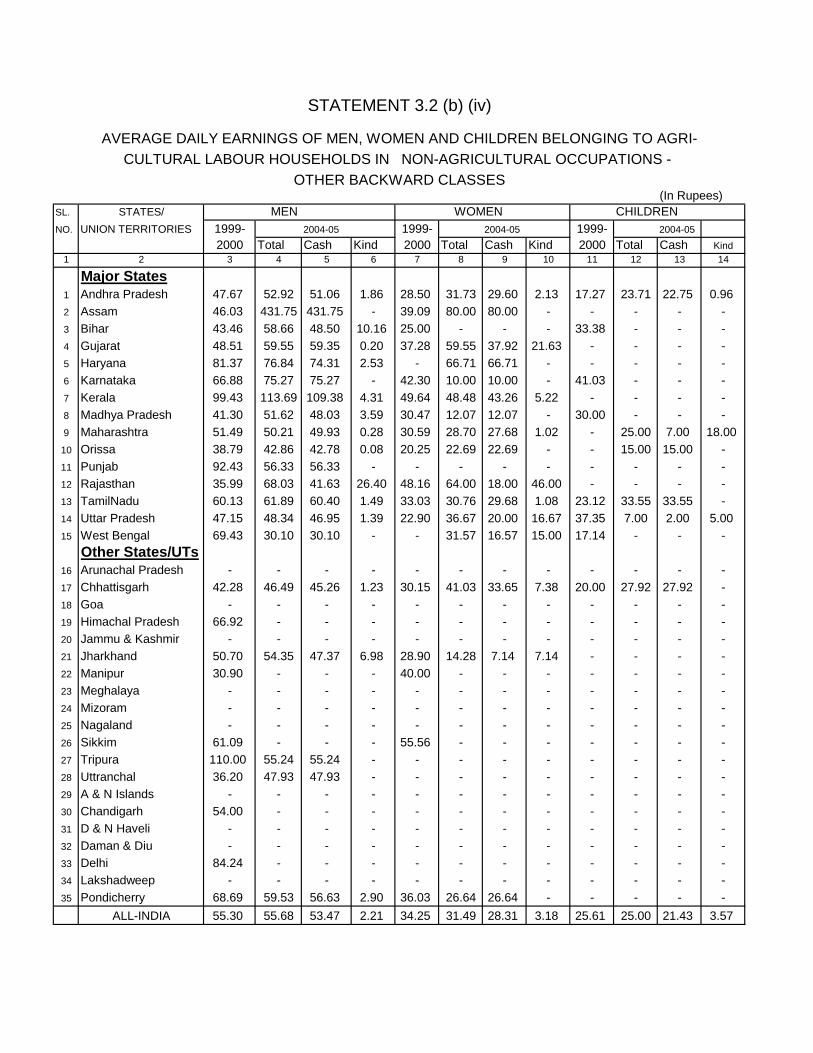
STATEMENT 3.2 (b) (iv)
AVERAGE DAILY EARNINGS OF MEN, WOMEN AND CHILDREN BELONGING TO AGRI-CULTURAL LABOUR HOUSEHOLDS IN NON-AGRICULTURAL OCCUPATIONS -
OTHER BACKWARD CLASSES(In Rupees)
SL. STATES/ MEN WOMEN CHILDRENNO. UNION TERRITORIES 1999- 2004-05 1999- 2004-05 1999- 2004-05
2000 Total Cash Kind 2000 Total Cash Kind 2000 Total Cash Kind1 2 3 4 5 6 7 8 9 10 11 12 13 14
Major States1 Andhra Pradesh 47.67 52.92 51.06 1.86 28.50 31.73 29.60 2.13 17.27 23.71 22.75 0.962 Assam 46.03 431.75 431.75 - 39.09 80.00 80.00 - - - - -3 Bihar 43.46 58.66 48.50 10.16 25.00 - - - 33.38 - - -4 Gujarat 48.51 59.55 59.35 0.20 37.28 59.55 37.92 21.63 - - - -5 Haryana 81.37 76.84 74.31 2.53 - 66.71 66.71 - - - - -6 Karnataka 66.88 75.27 75.27 - 42.30 10.00 10.00 - 41.03 - - -7 Kerala 99.43 113.69 109.38 4.31 49.64 48.48 43.26 5.22 - - - -8 Madhya Pradesh 41.30 51.62 48.03 3.59 30.47 12.07 12.07 - 30.00 - - -9 Maharashtra 51.49 50.21 49.93 0.28 30.59 28.70 27.68 1.02 - 25.00 7.00 18.00
10 Orissa 38.79 42.86 42.78 0.08 20.25 22.69 22.69 - - 15.00 15.00 -11 Punjab 92.43 56.33 56.33 - - - - - - - - -12 Rajasthan 35.99 68.03 41.63 26.40 48.16 64.00 18.00 46.00 - - - -13 TamilNadu 60.13 61.89 60.40 1.49 33.03 30.76 29.68 1.08 23.12 33.55 33.55 -14 Uttar Pradesh 47.15 48.34 46.95 1.39 22.90 36.67 20.00 16.67 37.35 7.00 2.00 5.0015 West Bengal 69.43 30.10 30.10 - - 31.57 16.57 15.00 17.14 - - -
Other States/UTs16 Arunachal Pradesh - - - - - - - - - - - -17 Chhattisgarh 42.28 46.49 45.26 1.23 30.15 41.03 33.65 7.38 20.00 27.92 27.92 -18 Goa - - - - - - - - - - - -19 Himachal Pradesh 66.92 - - - - - - - - - - -20 Jammu & Kashmir - - - - - - - - - - - -21 Jharkhand 50.70 54.35 47.37 6.98 28.90 14.28 7.14 7.14 - - - -22 Manipur 30.90 - - - 40.00 - - - - - - -23 Meghalaya - - - - - - - - - - - -24 Mizoram - - - - - - - - - - - -25 Nagaland - - - - - - - - - - - -26 Sikkim 61.09 - - - 55.56 - - - - - - -27 Tripura 110.00 55.24 55.24 - - - - - - - - -28 Uttranchal 36.20 47.93 47.93 - - - - - - - - -29 A & N Islands - - - - - - - - - - - -30 Chandigarh 54.00 - - - - - - - - - - -31 D & N Haveli - - - - - - - - - - - -32 Daman & Diu - - - - - - - - - - - -33 Delhi 84.24 - - - - - - - - - - -34 Lakshadweep - - - - - - - - - - - -35 Pondicherry 68.69 59.53 56.63 2.90 36.03 26.64 26.64 - - - - -
ALL-INDIA 55.30 55.68 53.47 2.21 34.25 31.49 28.31 3.18 25.61 25.00 21.43 3.57

STATEMENT 4.1 (a) (i)-M
AVERAGE DAILY EARNINGS OF MEN BELONGING TO ALL RURAL LABOUR HOUSEHOLDS IN DIFFERENT AGRICULTURAL OCCUPATIONS
(In Rupees)
SL. STATES/ PLOUGHING SOWINGNO. UNION TERRITORIES 1999- 2004-05 1999- 2004-05
2000 Total Cash Kind 2000 Total Cash Kind1 2 3 4 5 6 7 8 9 10
Major States1 Andhra Pradesh 36.60 49.52 46.88 2.64 37.13 28.95 26.17 2.782 Assam 76.90 65.35 59.33 6.02 51.32 61.66 46.91 14.753 Bihar 41.42 47.98 39.74 8.24 32.97 40.17 30.54 9.634 Gujarat 36.04 71.28 60.63 10.65 41.87 31.08 27.54 3.545 Haryana 59.08 74.32 74.32 - 55.02 65.71 62.62 3.096 Karnataka 42.52 47.52 45.64 1.88 38.68 37.07 34.00 3.077 Kerala 103.75 123.50 114.53 8.97 117.86 150.00 150.00 -8 Madhya Pradesh 31.56 37.67 30.00 7.67 26.93 37.81 31.37 6.449 Maharashtra 40.65 48.46 47.59 0.87 38.96 44.85 43.31 1.54
10 Orissa 30.06 41.18 38.37 2.81 28.11 50.56 50.56 -11 Punjab 69.84 74.49 61.85 12.64 62.34 63.21 58.13 5.0812 Rajasthan 35.46 65.80 59.73 6.07 78.60 67.31 65.19 2.1213 TamilNadu 51.99 74.32 71.91 2.41 49.39 64.34 63.99 0.3514 Uttar Pradesh 33.89 52.40 51.59 0.81 35.77 50.53 49.61 0.9215 West Bengal 47.72 51.15 45.05 6.10 47.65 47.84 42.90 4.94
Other States/UTs16 Arunachal Pradesh - 216.84 213.51 3.33 - - - -17 Chhattisgarh 35.12 38.74 28.88 9.86 35.00 25.00 25.00 -18 Goa 51.43 - - - - - - -19 Himachal Pradesh 68.17 90.00 50.00 40.00 61.90 - - -20 Jammu & Kashmir 65.79 - - - - - - -21 Jharkhand 32.59 42.76 41.28 1.48 33.56 36.88 32.07 4.8122 Manipur 63.07 - - - - 100.00 100.00 -23 Meghalaya 50.55 72.67 70.00 2.67 59.67 65.11 65.11 -24 Mizoram - - - - 120.00 - - -25 Nagaland - - - - - - - -26 Sikkim 55.47 83.04 69.92 13.12 44.84 50.00 40.00 10.0027 Tripura 45.33 73.19 73.19 - 62.60 72.75 72.47 0.2828 Uttranchal 50.21 56.18 56.18 - 70.00 50.38 45.06 5.3229 A & N Islands 60.00 100.00 100.00 - 70.00 - - -30 Chandigarh - - - - - - - -31 D & N Haveli - - - - - - - -32 Daman & Diu 70.00 - - - - - - -33 Delhi - 110.00 80.00 30.00 - - - -34 Lakshadweep - - - - - - - -35 Pondicherry 65.00 54.78 54.78 - - 40.00 40.00 -
ALL-INDIA 42.40 52.58 47.98 4.60 39.30 45.20 40.52 4.68

STATEMENT 4.1 (a) (i)-M contd..
(In Rupees)
SL. STATES/ TRANSPLANTING WEEDINGNO. UNION TERRITORIES 1999- 2004-05 1999- 2004-05
2000 Total Cash Kind 2000 Total Cash Kind1 2 11 12 13 14 15 16 17 18
Major States1 Andhra Pradesh 44.87 55.51 55.19 0.32 33.82 42.39 42.17 0.222 Assam 42.81 54.26 44.83 9.43 45.29 62.02 52.10 9.923 Bihar 36.85 42.01 36.19 5.82 33.32 36.98 26.61 10.374 Gujarat 40.34 41.23 37.50 3.73 37.37 42.45 36.57 5.885 Haryana 58.27 87.27 79.45 7.82 64.71 61.21 42.39 18.826 Karnataka 43.26 45.66 44.79 0.87 34.11 32.53 31.42 1.117 Kerala 99.64 182.14 157.14 25.00 100.00 118.60 118.60 -8 Madhya Pradesh 26.00 29.30 27.89 1.41 29.09 33.31 28.86 4.459 Maharashtra 32.45 45.74 37.45 8.29 36.24 39.05 37.99 1.06
10 Orissa 29.91 38.61 37.04 1.57 28.77 38.66 33.12 5.5411 Punjab 62.61 73.52 69.86 3.66 64.89 69.92 63.84 6.0812 Rajasthan - 90.00 60.00 30.00 59.96 56.96 46.74 10.2213 TamilNadu 53.56 62.31 61.48 0.83 41.41 55.12 54.22 0.9014 Uttar Pradesh 38.96 40.04 31.88 8.16 32.16 46.39 41.18 5.2115 West Bengal 42.85 54.49 48.18 6.31 41.66 44.50 40.97 3.53
Other States/UTs16 Arunachal Pradesh - - - - - - - -17 Chhattisgarh 24.68 31.67 29.40 2.27 21.56 24.38 13.32 11.0618 Goa 62.50 - - - - - - -19 Himachal Pradesh - - - - 30.86 106.78 78.16 28.6220 Jammu & Kashmir 113.92 - - - - - - -21 Jharkhand 39.87 44.82 38.63 6.19 38.36 38.50 36.51 1.9922 Manipur - 42.86 42.86 - 46.67 50.00 50.00 -23 Meghalaya - 46.31 43.74 2.57 - 61.15 60.39 0.7624 Mizoram - - - - 69.09 - - -25 Nagaland - - - - - - - -26 Sikkim 44.60 90.00 70.00 20.00 60.35 79.85 62.12 17.7327 Tripura 70.48 65.53 64.42 1.11 56.17 71.49 69.04 2.4528 Uttranchal - 50.00 50.00 - 67.73 57.20 56.39 0.8129 A & N Islands - - - - 101.82 250.06 237.62 12.4430 Chandigarh - - - - - - - -31 D & N Haveli 40.00 58.73 46.23 12.50 - - - -32 Daman & Diu 45.86 - - - 40.00 - - -33 Delhi - - - - - - - -34 Lakshadweep - - - - - - - -35 Pondicherry 50.53 105.00 100.00 5.00 34.78 - - -
ALL-INDIA 39.68 50.71 46.89 3.82 34.99 41.70 36.73 4.97
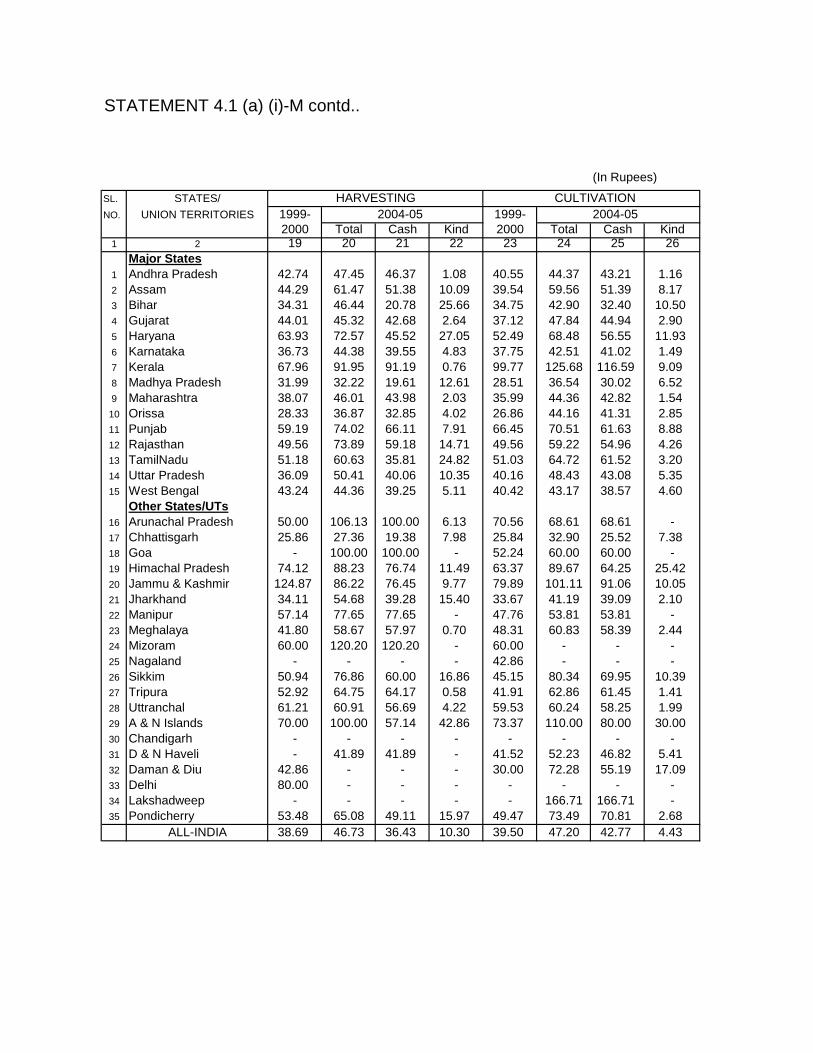
STATEMENT 4.1 (a) (i)-M contd..
(In Rupees)
SL. STATES/ HARVESTING CULTIVATIONNO. UNION TERRITORIES 1999- 2004-05 1999- 2004-05
2000 Total Cash Kind 2000 Total Cash Kind1 2 19 20 21 22 23 24 25 26
Major States1 Andhra Pradesh 42.74 47.45 46.37 1.08 40.55 44.37 43.21 1.162 Assam 44.29 61.47 51.38 10.09 39.54 59.56 51.39 8.173 Bihar 34.31 46.44 20.78 25.66 34.75 42.90 32.40 10.504 Gujarat 44.01 45.32 42.68 2.64 37.12 47.84 44.94 2.905 Haryana 63.93 72.57 45.52 27.05 52.49 68.48 56.55 11.936 Karnataka 36.73 44.38 39.55 4.83 37.75 42.51 41.02 1.497 Kerala 67.96 91.95 91.19 0.76 99.77 125.68 116.59 9.098 Madhya Pradesh 31.99 32.22 19.61 12.61 28.51 36.54 30.02 6.529 Maharashtra 38.07 46.01 43.98 2.03 35.99 44.36 42.82 1.54
10 Orissa 28.33 36.87 32.85 4.02 26.86 44.16 41.31 2.8511 Punjab 59.19 74.02 66.11 7.91 66.45 70.51 61.63 8.8812 Rajasthan 49.56 73.89 59.18 14.71 49.56 59.22 54.96 4.2613 TamilNadu 51.18 60.63 35.81 24.82 51.03 64.72 61.52 3.2014 Uttar Pradesh 36.09 50.41 40.06 10.35 40.16 48.43 43.08 5.3515 West Bengal 43.24 44.36 39.25 5.11 40.42 43.17 38.57 4.60
Other States/UTs16 Arunachal Pradesh 50.00 106.13 100.00 6.13 70.56 68.61 68.61 -17 Chhattisgarh 25.86 27.36 19.38 7.98 25.84 32.90 25.52 7.3818 Goa - 100.00 100.00 - 52.24 60.00 60.00 -19 Himachal Pradesh 74.12 88.23 76.74 11.49 63.37 89.67 64.25 25.4220 Jammu & Kashmir 124.87 86.22 76.45 9.77 79.89 101.11 91.06 10.0521 Jharkhand 34.11 54.68 39.28 15.40 33.67 41.19 39.09 2.1022 Manipur 57.14 77.65 77.65 - 47.76 53.81 53.81 -23 Meghalaya 41.80 58.67 57.97 0.70 48.31 60.83 58.39 2.4424 Mizoram 60.00 120.20 120.20 - 60.00 - - -25 Nagaland - - - - 42.86 - - -26 Sikkim 50.94 76.86 60.00 16.86 45.15 80.34 69.95 10.3927 Tripura 52.92 64.75 64.17 0.58 41.91 62.86 61.45 1.4128 Uttranchal 61.21 60.91 56.69 4.22 59.53 60.24 58.25 1.9929 A & N Islands 70.00 100.00 57.14 42.86 73.37 110.00 80.00 30.0030 Chandigarh - - - - - - - -31 D & N Haveli - 41.89 41.89 - 41.52 52.23 46.82 5.4132 Daman & Diu 42.86 - - - 30.00 72.28 55.19 17.0933 Delhi 80.00 - - - - - - -34 Lakshadweep - - - - - 166.71 166.71 -35 Pondicherry 53.48 65.08 49.11 15.97 49.47 73.49 70.81 2.68
ALL-INDIA 38.69 46.73 36.43 10.30 39.50 47.20 42.77 4.43

STATEMENT 4.1 (a) (i)-M Contd..
(In Rupees)
SL. STATES/ FORESTRY PLANTATIONNO. UNION TERRITORIES 1999- 2004-05 1999- 2004-05
2000 Total Cash Kind 2000 Total Cash Kind1 2 27 28 29 30 31 32 33 34
Major States1 Andhra Pradesh 40.16 69.83 67.10 2.73 41.02 48.48 48.48 -2 Assam - 81.11 71.89 9.22 37.13 52.41 44.15 8.263 Bihar 39.09 - - - 17.37 - - -4 Gujarat 57.57 - - - 25.00 - - -5 Haryana 70.00 89.10 85.34 3.76 - - - -6 Karnataka 58.26 45.48 42.99 2.49 57.14 60.26 57.07 3.197 Kerala 148.18 174.40 172.90 1.50 90.57 114.25 107.32 6.938 Madhya Pradesh 36.35 30.11 28.75 1.36 46.15 - - -9 Maharashtra 36.71 47.88 47.54 0.34 25.05 40.81 40.81 -
10 Orissa 46.51 30.20 30.20 - 38.34 - - -11 Punjab - 91.22 83.13 8.09 80.00 82.86 82.86 -12 Rajasthan 140.00 100.00 100.00 - 132.86 54.06 41.40 12.6613 TamilNadu 47.45 63.27 62.61 0.66 73.35 60.38 60.38 -14 Uttar Pradesh 39.39 57.25 52.72 4.53 45.56 - - -15 West Bengal 50.59 33.68 32.44 1.24 43.29 47.66 44.43 3.23
Other States/UTs16 Arunachal Pradesh - 71.43 71.43 - 35.00 - - -17 Chhattisgarh 43.74 49.55 49.55 - 20.00 55.52 50.52 5.0018 Goa 165.86 - - - - 70.00 70.00 -19 Himachal Pradesh 50.77 55.57 55.57 - - 76.37 26.92 49.4520 Jammu & Kashmir - 75.00 75.00 - - - - -21 Jharkhand 38.06 - - - - - - -22 Manipur - 53.89 53.89 - - - - -23 Meghalaya 17.86 - - - 98.85 57.17 57.17 -24 Mizoram 37.50 84.00 84.00 - - - - -25 Nagaland - - - - 135.00 - - -26 Sikkim 35.00 163.45 163.45 - - 83.21 60.00 23.2127 Tripura - - - - 36.15 38.44 38.44 -28 Uttranchal - 100.00 100.00 - 50.00 - - -29 A & N Islands 92.41 209.23 209.23 - 77.27 121.82 121.82 -30 Chandigarh - - - - - - - -31 D & N Haveli 37.14 - - - - - - -32 Daman & Diu - - - - - - - -33 Delhi - - - - - - - -34 Lakshadweep - - - - - 129.11 127.61 1.5035 Pondicherry - - - - 24.04 - - -
ALL-INDIA 50.41 52.12 50.89 1.23 55.93 66.15 61.11 5.04

STATEMENT 4.1 (a) (i)-M Concld..
(In Rupees)
SL. STATES/ ANIMAL HUSBANDRY FISHERIES OTHERS (AGRICULTURAL)NO. UNION TERRITORIES 1999- 2004-05 1999- 2004-05 1993-94 1999-2000
2000 Total Cash Kind 2000 Total Cash Kind Total Cash Kind1 2 35 36 37 38 39 40 41 42 43 44 45 46
Major States1 Andhra Pradesh 23.53 28.50 22.74 5.76 55.44 68.96 68.38 0.58 37.80 47.21 46.93 0.282 Assam - 70.00 70.00 - - - - - 41.60 63.63 53.45 10.183 Bihar 31.07 41.05 31.89 9.16 54.47 - - - 33.36 45.15 36.39 8.764 Gujarat 30.14 59.40 57.96 1.44 - - - - 40.35 47.30 43.85 3.455 Haryana 32.18 68.30 53.98 14.32 - - - - 68.18 96.06 93.66 2.406 Karnataka 17.13 25.18 25.18 - 101.89 84.02 84.02 - 39.70 41.00 38.57 2.437 Kerala 104.80 87.81 79.00 8.81 62.55 191.13 ###### 10.37 99.18 114.53 ###### 6.758 Madhya Pradesh 22.45 23.04 21.37 1.67 21.43 - - - 32.46 35.25 34.39 0.869 Maharashtra 28.67 26.23 20.39 5.84 31.69 91.30 57.90 33.40 42.23 49.07 48.28 0.7910 Orissa 24.94 31.21 30.43 0.78 45.13 52.79 38.40 14.39 29.23 32.65 32.25 0.4011 Punjab 57.29 59.75 51.74 8.01 73.22 - - - 60.44 77.77 66.57 11.2012 Rajasthan 36.50 101.94 ###### - - - - - 52.58 54.74 52.66 2.0813 TamilNadu 29.39 52.59 52.55 0.04 70.61 50.00 50.00 - 58.60 60.20 59.65 0.5514 Uttar Pradesh 32.33 41.16 37.43 3.73 61.43 - - - 44.54 45.86 37.28 8.5815 West Bengal 10.00 55.20 49.32 5.88 63.44 50.91 46.43 4.48 45.36 43.35 41.29 2.06
Other States/UTs16 Arunachal Pradesh - - - - - - - - 96.54 - - -17 Chhattisgarh 21.86 18.37 5.34 13.03 - - - - 29.07 33.79 26.86 6.9318 Goa - - - - 50.00 125.00 ###### - 84.10 122.97 ###### 2.5919 Himachal Pradesh 75.00 - - - - 90.71 71.43 19.28 65.57 84.92 79.26 5.6620 Jammu & Kashmir - 65.75 65.75 - - - - - 81.00 85.72 68.11 17.6121 Jharkhand - 34.44 26.48 7.96 21.11 - - - 31.88 32.52 25.41 7.1122 Manipur - - - - 60.00 - - - 53.89 94.26 94.26 -23 Meghalaya 60.00 - - - - - - - 49.81 39.31 38.72 0.5924 Mizoram - - - - - - - - 73.00 - - -25 Nagaland - - - - - - - - 200.00 - - -26 Sikkim - 105.32 82.10 23.22 - - - - 48.32 86.15 86.15 -27 Tripura - 75.00 75.00 - - - - - 49.75 55.63 54.63 1.0028 Uttranchal - 32.00 32.00 - - - - - 50.01 - - -29 A & N Islands - - - - - - - - 111.25 139.86 ###### 3.4730 Chandigarh - - - - - - - - 86.48 - - -31 D & N Haveli - - - - - - - - 37.89 48.97 46.91 2.0632 Daman & Diu - - - - 76.27 77.86 62.46 15.40 - - - -33 Delhi - - - - - - - - - - - -34 Lakshadweep - - - - - 89.29 89.29 - - 125.00 ###### -35 Pondicherry 44.62 32.00 20.00 12.00 42.14 - - - 51.74 90.00 84.00 6.00
ALL-INDIA 32.84 36.70 31.22 5.48 60.93 92.33 85.57 6.76 44.63 48.21 45.24 2.97
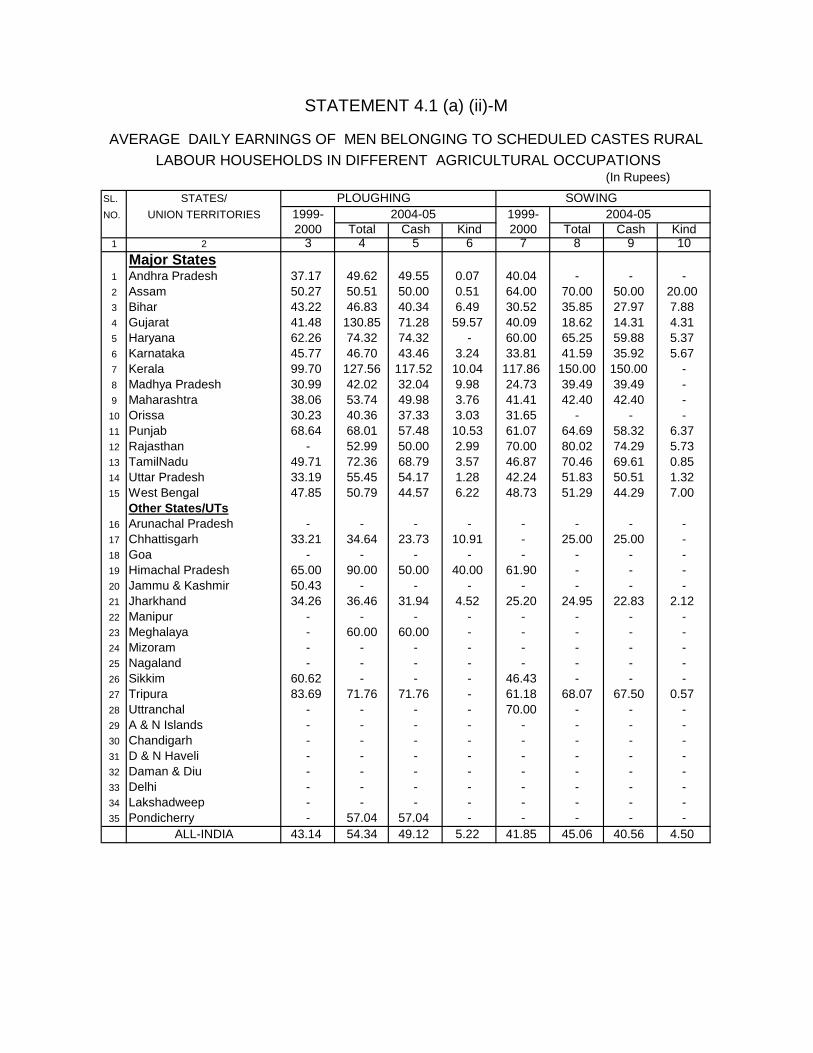
STATEMENT 4.1 (a) (ii)-M
AVERAGE DAILY EARNINGS OF MEN BELONGING TO SCHEDULED CASTES RURAL LABOUR HOUSEHOLDS IN DIFFERENT AGRICULTURAL OCCUPATIONS
(In Rupees)
SL. STATES/ PLOUGHING SOWINGNO. UNION TERRITORIES 1999- 2004-05 1999- 2004-05
2000 Total Cash Kind 2000 Total Cash Kind1 2 3 4 5 6 7 8 9 10
Major States1 Andhra Pradesh 37.17 49.62 49.55 0.07 40.04 - - -2 Assam 50.27 50.51 50.00 0.51 64.00 70.00 50.00 20.003 Bihar 43.22 46.83 40.34 6.49 30.52 35.85 27.97 7.884 Gujarat 41.48 130.85 71.28 59.57 40.09 18.62 14.31 4.315 Haryana 62.26 74.32 74.32 - 60.00 65.25 59.88 5.376 Karnataka 45.77 46.70 43.46 3.24 33.81 41.59 35.92 5.677 Kerala 99.70 127.56 117.52 10.04 117.86 150.00 150.00 -8 Madhya Pradesh 30.99 42.02 32.04 9.98 24.73 39.49 39.49 -9 Maharashtra 38.06 53.74 49.98 3.76 41.41 42.40 42.40 -
10 Orissa 30.23 40.36 37.33 3.03 31.65 - - -11 Punjab 68.64 68.01 57.48 10.53 61.07 64.69 58.32 6.3712 Rajasthan - 52.99 50.00 2.99 70.00 80.02 74.29 5.7313 TamilNadu 49.71 72.36 68.79 3.57 46.87 70.46 69.61 0.8514 Uttar Pradesh 33.19 55.45 54.17 1.28 42.24 51.83 50.51 1.3215 West Bengal 47.85 50.79 44.57 6.22 48.73 51.29 44.29 7.00
Other States/UTs16 Arunachal Pradesh - - - - - - - -17 Chhattisgarh 33.21 34.64 23.73 10.91 - 25.00 25.00 -18 Goa - - - - - - - -19 Himachal Pradesh 65.00 90.00 50.00 40.00 61.90 - - -20 Jammu & Kashmir 50.43 - - - - - - -21 Jharkhand 34.26 36.46 31.94 4.52 25.20 24.95 22.83 2.1222 Manipur - - - - - - - -23 Meghalaya - 60.00 60.00 - - - - -24 Mizoram - - - - - - - -25 Nagaland - - - - - - - -26 Sikkim 60.62 - - - 46.43 - - -27 Tripura 83.69 71.76 71.76 - 61.18 68.07 67.50 0.5728 Uttranchal - - - - 70.00 - - -29 A & N Islands - - - - - - - -30 Chandigarh - - - - - - - -31 D & N Haveli - - - - - - - -32 Daman & Diu - - - - - - - -33 Delhi - - - - - - - -34 Lakshadweep - - - - - - - -35 Pondicherry - 57.04 57.04 - - - - -
ALL-INDIA 43.14 54.34 49.12 5.22 41.85 45.06 40.56 4.50
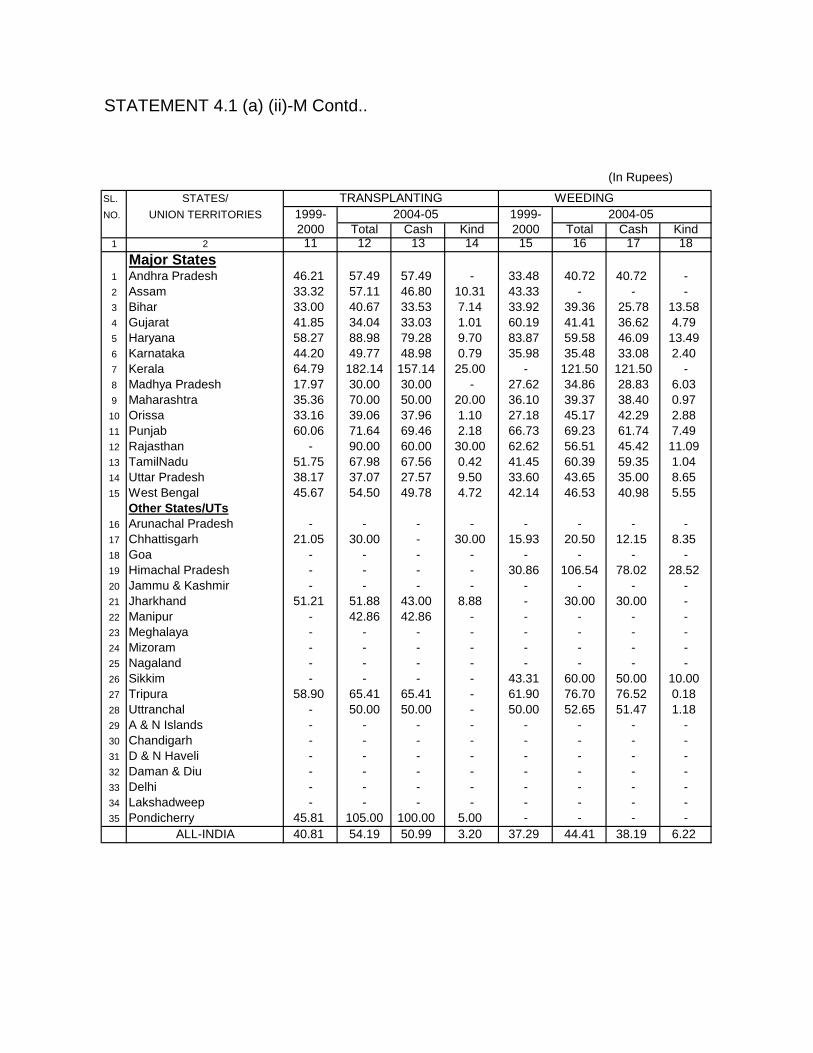
STATEMENT 4.1 (a) (ii)-M Contd..
(In Rupees)
SL. STATES/ TRANSPLANTING WEEDINGNO. UNION TERRITORIES 1999- 2004-05 1999- 2004-05
2000 Total Cash Kind 2000 Total Cash Kind1 2 11 12 13 14 15 16 17 18
Major States1 Andhra Pradesh 46.21 57.49 57.49 - 33.48 40.72 40.72 -2 Assam 33.32 57.11 46.80 10.31 43.33 - - -3 Bihar 33.00 40.67 33.53 7.14 33.92 39.36 25.78 13.584 Gujarat 41.85 34.04 33.03 1.01 60.19 41.41 36.62 4.795 Haryana 58.27 88.98 79.28 9.70 83.87 59.58 46.09 13.496 Karnataka 44.20 49.77 48.98 0.79 35.98 35.48 33.08 2.407 Kerala 64.79 182.14 157.14 25.00 - 121.50 121.50 -8 Madhya Pradesh 17.97 30.00 30.00 - 27.62 34.86 28.83 6.039 Maharashtra 35.36 70.00 50.00 20.00 36.10 39.37 38.40 0.97
10 Orissa 33.16 39.06 37.96 1.10 27.18 45.17 42.29 2.8811 Punjab 60.06 71.64 69.46 2.18 66.73 69.23 61.74 7.4912 Rajasthan - 90.00 60.00 30.00 62.62 56.51 45.42 11.0913 TamilNadu 51.75 67.98 67.56 0.42 41.45 60.39 59.35 1.0414 Uttar Pradesh 38.17 37.07 27.57 9.50 33.60 43.65 35.00 8.6515 West Bengal 45.67 54.50 49.78 4.72 42.14 46.53 40.98 5.55
Other States/UTs16 Arunachal Pradesh - - - - - - - -17 Chhattisgarh 21.05 30.00 - 30.00 15.93 20.50 12.15 8.3518 Goa - - - - - - - -19 Himachal Pradesh - - - - 30.86 106.54 78.02 28.5220 Jammu & Kashmir - - - - - - - -21 Jharkhand 51.21 51.88 43.00 8.88 - 30.00 30.00 -22 Manipur - 42.86 42.86 - - - - -23 Meghalaya - - - - - - - -24 Mizoram - - - - - - - -25 Nagaland - - - - - - - -26 Sikkim - - - - 43.31 60.00 50.00 10.0027 Tripura 58.90 65.41 65.41 - 61.90 76.70 76.52 0.1828 Uttranchal - 50.00 50.00 - 50.00 52.65 51.47 1.1829 A & N Islands - - - - - - - -30 Chandigarh - - - - - - - -31 D & N Haveli - - - - - - - -32 Daman & Diu - - - - - - - -33 Delhi - - - - - - - -34 Lakshadweep - - - - - - - -35 Pondicherry 45.81 105.00 100.00 5.00 - - - -
ALL-INDIA 40.81 54.19 50.99 3.20 37.29 44.41 38.19 6.22
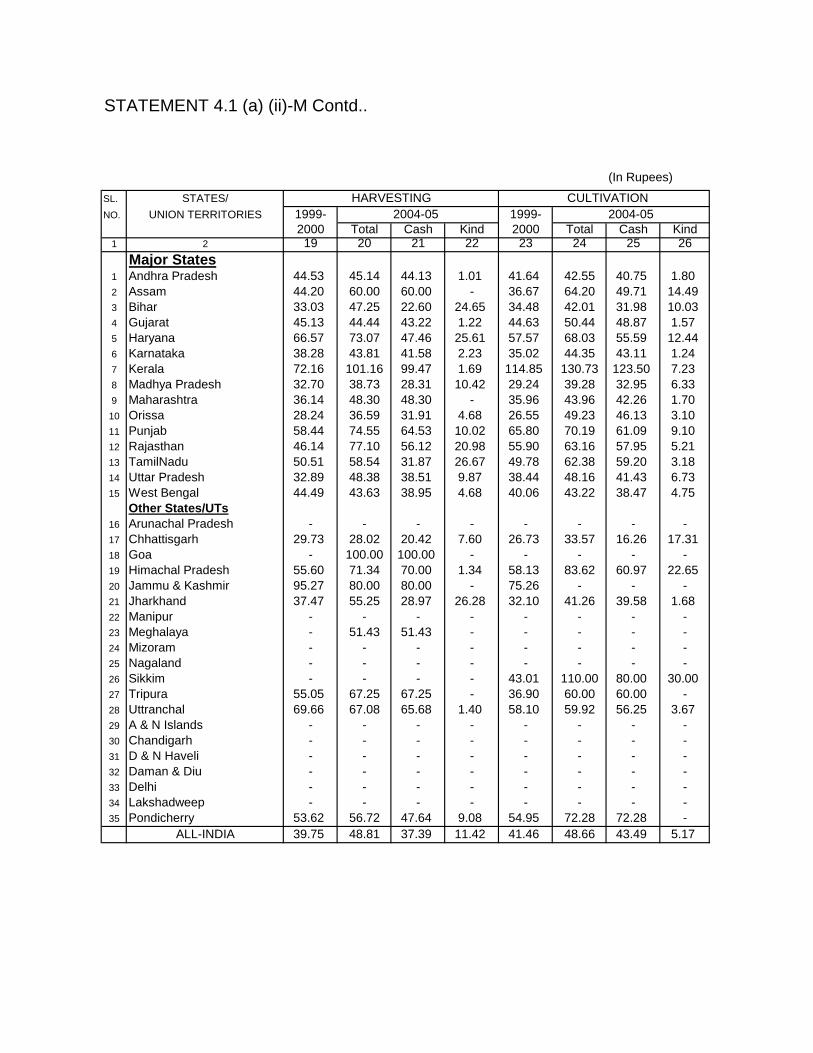
STATEMENT 4.1 (a) (ii)-M Contd..
(In Rupees)
SL. STATES/ HARVESTING CULTIVATIONNO. UNION TERRITORIES 1999- 2004-05 1999- 2004-05
2000 Total Cash Kind 2000 Total Cash Kind1 2 19 20 21 22 23 24 25 26
Major States1 Andhra Pradesh 44.53 45.14 44.13 1.01 41.64 42.55 40.75 1.802 Assam 44.20 60.00 60.00 - 36.67 64.20 49.71 14.493 Bihar 33.03 47.25 22.60 24.65 34.48 42.01 31.98 10.034 Gujarat 45.13 44.44 43.22 1.22 44.63 50.44 48.87 1.575 Haryana 66.57 73.07 47.46 25.61 57.57 68.03 55.59 12.446 Karnataka 38.28 43.81 41.58 2.23 35.02 44.35 43.11 1.247 Kerala 72.16 101.16 99.47 1.69 114.85 130.73 123.50 7.238 Madhya Pradesh 32.70 38.73 28.31 10.42 29.24 39.28 32.95 6.339 Maharashtra 36.14 48.30 48.30 - 35.96 43.96 42.26 1.70
10 Orissa 28.24 36.59 31.91 4.68 26.55 49.23 46.13 3.1011 Punjab 58.44 74.55 64.53 10.02 65.80 70.19 61.09 9.1012 Rajasthan 46.14 77.10 56.12 20.98 55.90 63.16 57.95 5.2113 TamilNadu 50.51 58.54 31.87 26.67 49.78 62.38 59.20 3.1814 Uttar Pradesh 32.89 48.38 38.51 9.87 38.44 48.16 41.43 6.7315 West Bengal 44.49 43.63 38.95 4.68 40.06 43.22 38.47 4.75
Other States/UTs16 Arunachal Pradesh - - - - - - - -17 Chhattisgarh 29.73 28.02 20.42 7.60 26.73 33.57 16.26 17.3118 Goa - 100.00 100.00 - - - - -19 Himachal Pradesh 55.60 71.34 70.00 1.34 58.13 83.62 60.97 22.6520 Jammu & Kashmir 95.27 80.00 80.00 - 75.26 - - -21 Jharkhand 37.47 55.25 28.97 26.28 32.10 41.26 39.58 1.6822 Manipur - - - - - - - -23 Meghalaya - 51.43 51.43 - - - - -24 Mizoram - - - - - - - -25 Nagaland - - - - - - - -26 Sikkim - - - - 43.01 110.00 80.00 30.0027 Tripura 55.05 67.25 67.25 - 36.90 60.00 60.00 -28 Uttranchal 69.66 67.08 65.68 1.40 58.10 59.92 56.25 3.6729 A & N Islands - - - - - - - -30 Chandigarh - - - - - - - -31 D & N Haveli - - - - - - - -32 Daman & Diu - - - - - - - -33 Delhi - - - - - - - -34 Lakshadweep - - - - - - - -35 Pondicherry 53.62 56.72 47.64 9.08 54.95 72.28 72.28 -
ALL-INDIA 39.75 48.81 37.39 11.42 41.46 48.66 43.49 5.17

STATEMENT 4.1 (a) (ii)-M Contd..
(In Rupees)
SL. STATES/ FORESTRY PLANTATIONNO. UNION TERRITORIES 1999- 2004-05 1999- 2004-05
2000 Total Cash Kind 2000 Total Cash Kind1 2 27 28 29 30 31 32 33 34
Major States1 Andhra Pradesh 50.00 74.86 71.43 3.43 41.35 51.59 51.59 -2 Assam - - - - 37.49 44.59 44.23 0.363 Bihar 40.05 - - - 20.00 - - -4 Gujarat - - - - - - - -5 Haryana - 89.10 85.34 3.76 - - - -6 Karnataka - - - - 55.48 58.51 55.76 2.757 Kerala 81.00 171.43 171.43 - 85.68 106.70 97.21 9.498 Madhya Pradesh - 30.32 30.32 - - - - -9 Maharashtra 36.29 53.56 53.56 - - 60.00 60.00 -
10 Orissa 40.00 26.67 26.67 - 37.27 - - -11 Punjab - 91.46 83.75 7.71 - - - -12 Rajasthan 140.00 100.00 100.00 - - 70.00 60.00 10.0013 TamilNadu 38.98 78.37 78.14 0.23 70.05 66.13 66.13 -14 Uttar Pradesh 34.19 43.73 31.06 12.67 45.56 - - -15 West Bengal - 31.76 30.00 1.76 45.70 44.07 42.25 1.82
Other States/UTs16 Arunachal Pradesh - - - - - - - -17 Chhattisgarh 30.00 50.00 50.00 - 20.00 - - -18 Goa - - - - - - - -19 Himachal Pradesh - 70.00 70.00 - - - - -20 Jammu & Kashmir - - - - - - - -21 Jharkhand - - - - - - - -22 Manipur - - - - - - - -23 Meghalaya - - - - - - - -24 Mizoram - - - - - - - -25 Nagaland - - - - - - - -26 Sikkim - - - - - - - -27 Tripura - - - - 42.68 41.19 41.19 -28 Uttranchal - - - - 50.00 - - -29 A & N Islands 80.71 - - - - - - -30 Chandigarh - - - - - - - -31 D & N Haveli - - - - - - - -32 Daman & Diu - - - - - - - -33 Delhi - - - - - - - -34 Lakshadweep - - - - - - - -35 Pondicherry - - - - 24.04 - - -
ALL-INDIA 45.33 47.67 46.66 1.01 66.90 70.16 66.37 3.79
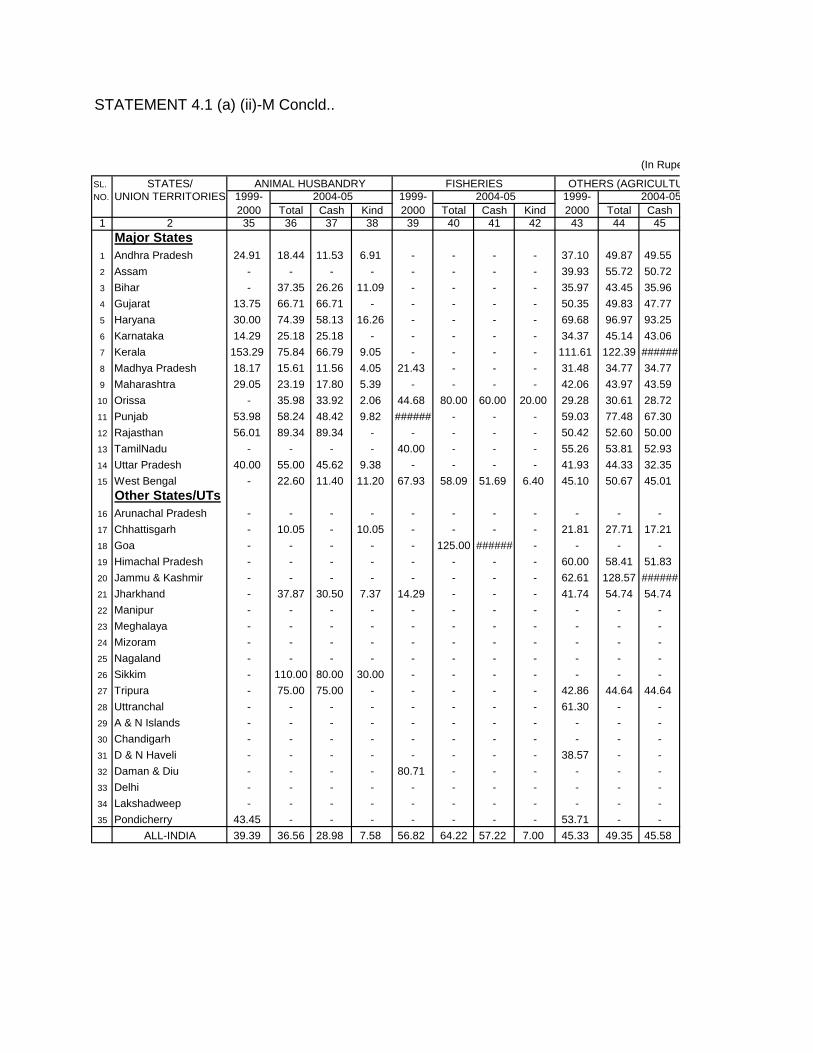
STATEMENT 4.1 (a) (ii)-M Concld..
(In Rupe
SL. STATES/ ANIMAL HUSBANDRY FISHERIES OTHERS (AGRICULTUNO. UNION TERRITORIES 1999- 2004-05 1999- 2004-05 1999- 2004-05
2000 Total Cash Kind 2000 Total Cash Kind 2000 Total Cash1 2 35 36 37 38 39 40 41 42 43 44 45
Major States1 Andhra Pradesh 24.91 18.44 11.53 6.91 - - - - 37.10 49.87 49.552 Assam - - - - - - - - 39.93 55.72 50.723 Bihar - 37.35 26.26 11.09 - - - - 35.97 43.45 35.964 Gujarat 13.75 66.71 66.71 - - - - - 50.35 49.83 47.775 Haryana 30.00 74.39 58.13 16.26 - - - - 69.68 96.97 93.256 Karnataka 14.29 25.18 25.18 - - - - - 34.37 45.14 43.067 Kerala 153.29 75.84 66.79 9.05 - - - - 111.61 122.39 ######8 Madhya Pradesh 18.17 15.61 11.56 4.05 21.43 - - - 31.48 34.77 34.779 Maharashtra 29.05 23.19 17.80 5.39 - - - - 42.06 43.97 43.5910 Orissa - 35.98 33.92 2.06 44.68 80.00 60.00 20.00 29.28 30.61 28.7211 Punjab 53.98 58.24 48.42 9.82 ###### - - - 59.03 77.48 67.3012 Rajasthan 56.01 89.34 89.34 - - - - - 50.42 52.60 50.0013 TamilNadu - - - - 40.00 - - - 55.26 53.81 52.9314 Uttar Pradesh 40.00 55.00 45.62 9.38 - - - - 41.93 44.33 32.3515 West Bengal - 22.60 11.40 11.20 67.93 58.09 51.69 6.40 45.10 50.67 45.01
Other States/UTs16 Arunachal Pradesh - - - - - - - - - - -17 Chhattisgarh - 10.05 - 10.05 - - - - 21.81 27.71 17.2118 Goa - - - - - 125.00 ###### - - - -19 Himachal Pradesh - - - - - - - - 60.00 58.41 51.8320 Jammu & Kashmir - - - - - - - - 62.61 128.57 ######21 Jharkhand - 37.87 30.50 7.37 14.29 - - - 41.74 54.74 54.7422 Manipur - - - - - - - - - - -23 Meghalaya - - - - - - - - - - -24 Mizoram - - - - - - - - - - -25 Nagaland - - - - - - - - - - -26 Sikkim - 110.00 80.00 30.00 - - - - - - -27 Tripura - 75.00 75.00 - - - - - 42.86 44.64 44.6428 Uttranchal - - - - - - - - 61.30 - -29 A & N Islands - - - - - - - - - - -30 Chandigarh - - - - - - - - - - -31 D & N Haveli - - - - - - - - 38.57 - -32 Daman & Diu - - - - 80.71 - - - - - -33 Delhi - - - - - - - - - - -34 Lakshadweep - - - - - - - - - - -35 Pondicherry 43.45 - - - - - - - 53.71 - -
ALL-INDIA 39.39 36.56 28.98 7.58 56.82 64.22 57.22 7.00 45.33 49.35 45.58

ees)
URAL)5
Kind46
0.325.007.492.063.722.08
13.98-
0.381.89
10.182.600.88
11.985.66
-10.50
-6.58
----------------
3.77
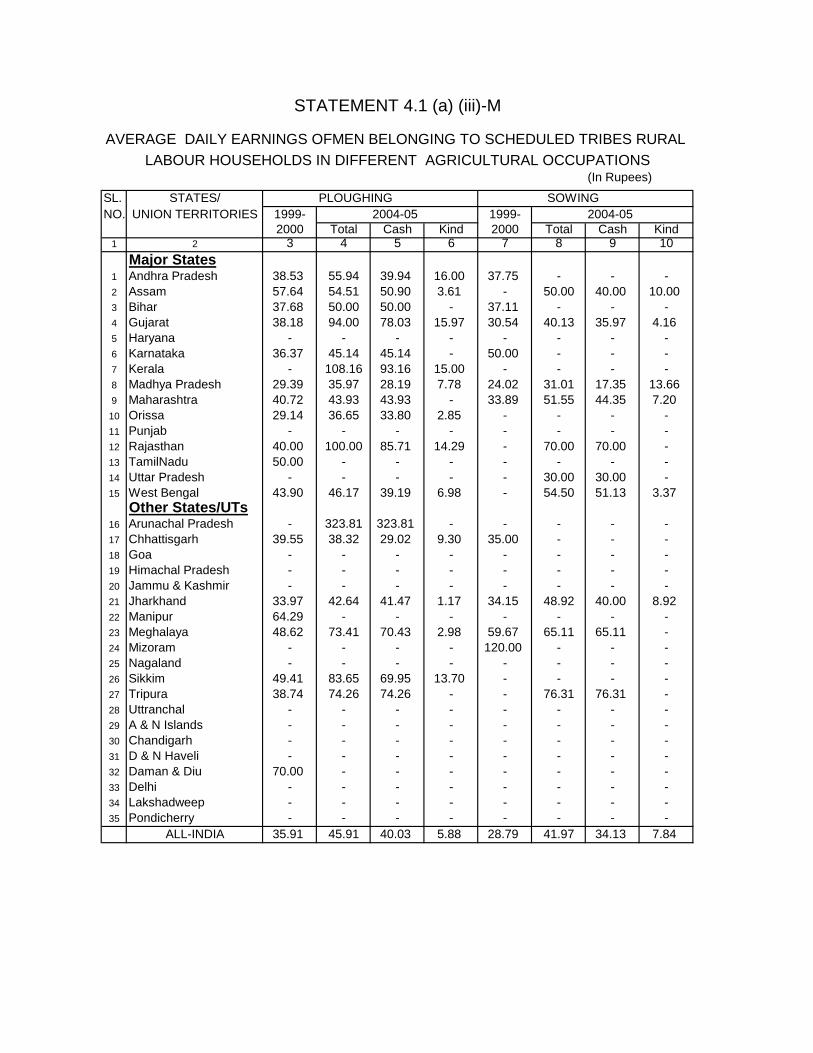
STATEMENT 4.1 (a) (iii)-M
AVERAGE DAILY EARNINGS OFMEN BELONGING TO SCHEDULED TRIBES RURAL LABOUR HOUSEHOLDS IN DIFFERENT AGRICULTURAL OCCUPATIONS
(In Rupees)
SL. STATES/ PLOUGHING SOWINGNO. UNION TERRITORIES 1999- 2004-05 1999- 2004-05
2000 Total Cash Kind 2000 Total Cash Kind1 2 3 4 5 6 7 8 9 10
Major States1 Andhra Pradesh 38.53 55.94 39.94 16.00 37.75 - - -2 Assam 57.64 54.51 50.90 3.61 - 50.00 40.00 10.003 Bihar 37.68 50.00 50.00 - 37.11 - - -4 Gujarat 38.18 94.00 78.03 15.97 30.54 40.13 35.97 4.165 Haryana - - - - - - - -6 Karnataka 36.37 45.14 45.14 - 50.00 - - -7 Kerala - 108.16 93.16 15.00 - - - -8 Madhya Pradesh 29.39 35.97 28.19 7.78 24.02 31.01 17.35 13.669 Maharashtra 40.72 43.93 43.93 - 33.89 51.55 44.35 7.20
10 Orissa 29.14 36.65 33.80 2.85 - - - -11 Punjab - - - - - - - -12 Rajasthan 40.00 100.00 85.71 14.29 - 70.00 70.00 -13 TamilNadu 50.00 - - - - - - -14 Uttar Pradesh - - - - - 30.00 30.00 -15 West Bengal 43.90 46.17 39.19 6.98 - 54.50 51.13 3.37
Other States/UTs16 Arunachal Pradesh - 323.81 323.81 - - - - -17 Chhattisgarh 39.55 38.32 29.02 9.30 35.00 - - -18 Goa - - - - - - - -19 Himachal Pradesh - - - - - - - -20 Jammu & Kashmir - - - - - - - -21 Jharkhand 33.97 42.64 41.47 1.17 34.15 48.92 40.00 8.9222 Manipur 64.29 - - - - - - -23 Meghalaya 48.62 73.41 70.43 2.98 59.67 65.11 65.11 -24 Mizoram - - - - 120.00 - - -25 Nagaland - - - - - - - -26 Sikkim 49.41 83.65 69.95 13.70 - - - -27 Tripura 38.74 74.26 74.26 - - 76.31 76.31 -28 Uttranchal - - - - - - - -29 A & N Islands - - - - - - - -30 Chandigarh - - - - - - - -31 D & N Haveli - - - - - - - -32 Daman & Diu 70.00 - - - - - - -33 Delhi - - - - - - - -34 Lakshadweep - - - - - - - -35 Pondicherry - - - - - - - -
ALL-INDIA 35.91 45.91 40.03 5.88 28.79 41.97 34.13 7.84

STATEMENT 4.1 (a) (iii)-M Contd..
(In Rupees)
SL. STATES/ TRANSPLANTING WEEDINGNO. UNION TERRITORIES 1999- 2004-05 1999- 2004-05
2000 Total Cash Kind 2000 Total Cash Kind1 2 11 12 13 14 15 16 17 18
Major States1 Andhra Pradesh 47.11 43.64 43.64 - 30.80 44.71 44.71 -2 Assam 37.33 56.61 43.23 13.38 - 70.00 60.00 10.003 Bihar 34.13 - - - 46.58 - - -4 Gujarat 36.28 51.66 45.26 6.40 28.53 36.96 30.73 6.235 Haryana - - - - - - - -6 Karnataka 48.05 50.00 50.00 - 28.85 60.00 50.00 10.007 Kerala - - - - - - - -8 Madhya Pradesh 30.08 26.06 11.05 15.01 30.47 31.88 27.37 4.519 Maharashtra 33.42 49.17 33.53 15.64 34.83 33.17 32.77 0.40
10 Orissa 24.27 30.01 28.92 1.09 24.73 23.66 7.58 16.0811 Punjab - - - - - - - -12 Rajasthan - - - - 34.93 65.03 55.42 9.6113 TamilNadu - - - - - 55.00 50.00 5.0014 Uttar Pradesh - - - - - - - -15 West Bengal 37.18 54.27 44.02 10.25 39.99 41.11 39.97 1.14
Other States/UTs16 Arunachal Pradesh - - - - - - - -17 Chhattisgarh 30.00 25.00 25.00 - 21.73 28.45 5.34 23.1118 Goa - - - - - - - -19 Himachal Pradesh - - - - - - - -20 Jammu & Kashmir - - - - - - - -21 Jharkhand 33.20 53.88 48.83 5.05 30.74 - - -22 Manipur - - - - - - - -23 Meghalaya - 46.31 43.74 2.57 - 61.15 60.39 0.7624 Mizoram - - - - 69.09 - - -25 Nagaland - - - - - - - -26 Sikkim - 90.00 70.00 20.00 - 71.67 55.61 16.0627 Tripura - 68.52 64.32 4.20 30.00 69.96 65.70 4.2628 Uttranchal - 50.00 50.00 - - - - -29 A & N Islands - - - - - - - -30 Chandigarh - - - - - - - -31 D & N Haveli 40.00 58.73 46.23 12.50 - - - -32 Daman & Diu 45.86 - - - 40.00 - - -33 Delhi - - - - - - - -34 Lakshadweep - - - - - - - -35 Pondicherry - - - - - - - -
ALL-INDIA 33.97 47.19 39.38 7.81 29.32 36.03 30.55 5.48

STATEMENT 4.1 (a) (iii)-M Contd..
(In Rupees)
SL. STATES/ HARVESTING CULTIVATIONNO. UNION TERRITORIES 1999- 2004-05 1999- 2004-05
2000 Total Cash Kind 2000 Total Cash Kind1 2 19 20 21 22 23 24 25 26
Major States1 Andhra Pradesh 47.65 61.10 53.86 7.24 40.05 44.70 44.23 0.472 Assam 38.55 66.49 56.49 10.00 46.28 60.32 52.73 7.593 Bihar 30.01 47.63 - 47.63 35.98 52.26 11.08 41.184 Gujarat 33.44 47.38 42.69 4.69 29.46 43.04 37.48 5.565 Haryana - - - - 64.28 - - -6 Karnataka 31.78 41.83 41.43 0.40 33.88 41.52 39.73 1.797 Kerala - 50.00 50.00 - 74.04 97.28 89.98 7.308 Madhya Pradesh 32.58 28.45 13.55 14.90 26.87 35.77 30.34 5.439 Maharashtra 33.98 44.36 39.04 5.32 33.98 39.61 38.59 1.02
10 Orissa 30.00 34.23 27.86 6.37 23.20 40.72 37.04 3.6811 Punjab 62.00 80.00 80.00 - 52.80 - - -12 Rajasthan 48.81 53.01 49.14 3.87 36.33 40.13 36.54 3.5913 TamilNadu 40.09 80.00 80.00 - 57.88 44.24 44.24 -14 Uttar Pradesh 20.25 45.49 30.42 15.07 - 40.59 39.83 0.7615 West Bengal 40.64 47.20 37.08 10.12 40.48 44.52 38.75 5.77
Other States/UTs16 Arunachal Pradesh - - - - 70.00 78.72 78.72 -17 Chhattisgarh 26.13 29.44 26.13 3.31 24.65 35.80 34.74 1.0618 Goa - - - - - - - -19 Himachal Pradesh 81.15 - - - 80.00 - - -20 Jammu & Kashmir - - - - - - - -21 Jharkhand 31.31 48.79 32.82 15.97 32.49 36.76 33.60 3.1622 Manipur - - - - - 41.90 41.90 -23 Meghalaya 41.92 60.36 59.50 0.86 47.70 61.36 58.72 2.6424 Mizoram 60.00 120.20 120.20 - 60.00 - - -25 Nagaland - - - - - - - -26 Sikkim - 76.71 60.00 16.71 56.35 70.00 58.40 11.6027 Tripura 43.04 63.95 63.95 - 32.61 60.00 60.00 -28 Uttranchal - - - - 64.29 31.43 31.43 -29 A & N Islands - - - - 60.00 - - -30 Chandigarh - - - - - - - -31 D & N Haveli - 41.89 41.89 - 41.52 52.23 46.82 5.4132 Daman & Diu - - - - 30.00 72.28 55.19 17.0933 Delhi - - - - - - - -34 Lakshadweep - - - - 40.00 166.71 166.71 -35 Pondicherry - - - - 47.14 - - -
ALL-INDIA 32.94 40.31 31.26 9.05 31.41 41.06 37.10 3.96
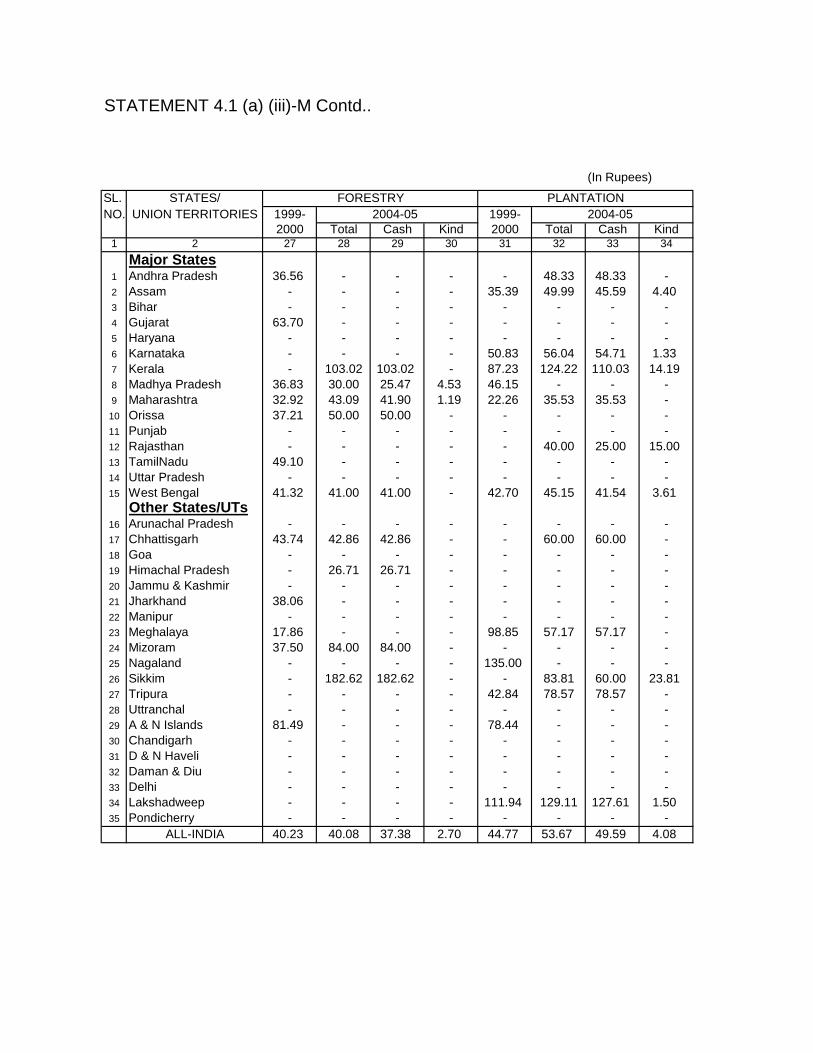
STATEMENT 4.1 (a) (iii)-M Contd..
(In Rupees)
SL. STATES/ FORESTRY PLANTATIONNO. UNION TERRITORIES 1999- 2004-05 1999- 2004-05
2000 Total Cash Kind 2000 Total Cash Kind1 2 27 28 29 30 31 32 33 34
Major States1 Andhra Pradesh 36.56 - - - - 48.33 48.33 -2 Assam - - - - 35.39 49.99 45.59 4.403 Bihar - - - - - - - -4 Gujarat 63.70 - - - - - - -5 Haryana - - - - - - - -6 Karnataka - - - - 50.83 56.04 54.71 1.337 Kerala - 103.02 103.02 - 87.23 124.22 110.03 14.198 Madhya Pradesh 36.83 30.00 25.47 4.53 46.15 - - -9 Maharashtra 32.92 43.09 41.90 1.19 22.26 35.53 35.53 -
10 Orissa 37.21 50.00 50.00 - - - - -11 Punjab - - - - - - - -12 Rajasthan - - - - - 40.00 25.00 15.0013 TamilNadu 49.10 - - - - - - -14 Uttar Pradesh - - - - - - - -15 West Bengal 41.32 41.00 41.00 - 42.70 45.15 41.54 3.61
Other States/UTs16 Arunachal Pradesh - - - - - - - -17 Chhattisgarh 43.74 42.86 42.86 - - 60.00 60.00 -18 Goa - - - - - - - -19 Himachal Pradesh - 26.71 26.71 - - - - -20 Jammu & Kashmir - - - - - - - -21 Jharkhand 38.06 - - - - - - -22 Manipur - - - - - - - -23 Meghalaya 17.86 - - - 98.85 57.17 57.17 -24 Mizoram 37.50 84.00 84.00 - - - - -25 Nagaland - - - - 135.00 - - -26 Sikkim - 182.62 182.62 - - 83.81 60.00 23.8127 Tripura - - - - 42.84 78.57 78.57 -28 Uttranchal - - - - - - - -29 A & N Islands 81.49 - - - 78.44 - - -30 Chandigarh - - - - - - - -31 D & N Haveli - - - - - - - -32 Daman & Diu - - - - - - - -33 Delhi - - - - - - - -34 Lakshadweep - - - - 111.94 129.11 127.61 1.5035 Pondicherry - - - - - - - -
ALL-INDIA 40.23 40.08 37.38 2.70 44.77 53.67 49.59 4.08

STATEMENT 4.1 (a) (iii)-M Concld..
(In Rupees)
SL. STATES/ ANIMAL HUSBANDRY FISHERIES OTHERS (AGRICULTURAL)NO.UNION TERRITORIES 1999- 2004-05 1999- 2004-05 1993-94 1999-2000
2000 Total Cash Kind 2000 Total Cash Kind Total Cash Kind1 2 35 36 37 38 39 40 41 42 43 44 45 46
Major States1 Andhra Pradesh 19.90 24.43 11.52 12.91 10.00 80.04 80.04 - 33.56 41.65 41.65 -2 Assam - - - - - - - - 38.41 62.92 55.84 7.083 Bihar - - - - - - - - 20.00 - - -4 Gujarat 13.74 - - - - - - - 30.10 35.73 34.41 1.325 Haryana - - - - - - - - 60.00 - - -6 Karnataka - - - - - - - - 43.52 32.64 32.42 0.227 Kerala - - - - 38.00 - - - 67.75 104.39 86.75 17.648 Madhya Pradesh 22.40 22.86 22.86 - - - - - 31.24 30.78 29.53 1.259 Maharashtra 25.00 24.25 24.25 - 30.00 101.24 57.23 44.01 41.48 59.15 56.73 2.4210 Orissa 19.19 25.00 25.00 - - - - - 24.73 26.72 26.66 0.0611 Punjab - - - - 35.71 - - - 35.71 - - -12 Rajasthan 23.48 - - - - - - - 47.67 50.29 48.13 2.1613 TamilNadu - - - - - - - - 50.00 54.29 54.29 -14 Uttar Pradesh - 26.71 26.71 - - - - - 31.19 40.82 35.41 5.4115 West Bengal - - - - 52.22 26.71 26.71 - 42.04 48.99 48.99 -
Other States/UTs16 Arunachal Pradesh - - - - - - - - 80.67 - - -17 Chhattisgarh 34.12 21.14 21.14 - - - - - 30.86 37.32 33.81 3.5118 Goa - - - - - - - - - - - -19 Himachal Pradesh - - - - - - - - - - - -20 Jammu & Kashmir - - - - - - - - - - - -21 Jharkhand - - - - - - - - 33.79 23.53 16.15 7.3822 Manipur - - - - - - - - 58.41 120.00 ###### -23 Meghalaya 60.00 - - - - - - - 49.81 39.31 38.72 0.5924 Mizoram - - - - - - - - 73.00 - - -25 Nagaland - - - - - - - - 200.00 - - -26 Sikkim - - - - - - - - 48.85 82.14 82.14 -27 Tripura - - - - - - - - 39.22 58.77 57.02 1.7528 Uttranchal - - - - - - - - - - - -29 A & N Islands - - - - - - - - 128.57 - - -30 Chandigarh - - - - - - - - - - - -31 D & N Haveli - - - - - - - - 37.74 48.97 46.91 2.0632 Daman & Diu - - - - 75.80 60.00 40.00 20.00 - - - -33 Delhi - - - - - - - - - - - -34 Lakshadweep - - - - - 89.29 89.29 - 46.00 125.00 ###### -35 Pondicherry - - - - 30.00 - - - - - - -
ALL-INDIA 23.13 24.21 19.95 4.26 34.76 73.46 60.52 12.94 36.79 38.68 37.02 1.66

STATEMENT 4.1 (a) (iv)-M
AVERAGE DAILY EARNINGS OF MEN BELONGING TO OTHER BACKWARD CLASSESRURAL LABOUR HOUSEHOLDS IN DIFFERENT AGRICULTURAL OCCUPATIONS
(In Rupees)
SL. STATES/ PLOUGHING SOWINGNO. UNION TERRITORIES 1999- 2004-05 1999- 2004-05
2000 Total Cash Kind 2000 Total Cash Kind1 2 3 4 5 6 7 8 9 10
Major States1 Andhra Pradesh 35.05 48.00 46.77 1.23 34.94 28.95 26.17 2.782 Assam 60.75 60.92 52.80 8.12 27.32 70.00 50.00 20.003 Bihar 41.34 48.37 38.57 9.80 34.99 43.06 31.54 11.524 Gujarat 31.33 51.21 51.21 - 57.78 40.65 40.65 -5 Haryana - - - - 52.09 66.33 66.33 -6 Karnataka 42.78 59.46 56.00 3.46 42.36 31.01 30.59 0.427 Kerala 99.32 120.56 113.59 6.97 - - - -8 Madhya Pradesh 36.46 43.14 38.17 4.97 31.75 40.21 33.03 7.189 Maharashtra 39.26 50.69 49.69 1.00 39.15 45.91 45.91 -
10 Orissa 29.23 47.95 45.12 2.83 35.00 50.00 50.00 -11 Punjab 70.83 106.79 84.75 22.04 67.31 59.40 57.63 1.7712 Rajasthan 30.00 - - - 85.00 56.45 56.45 -13 TamilNadu 55.14 75.22 73.35 1.87 52.45 60.04 60.04 -14 Uttar Pradesh 35.99 49.00 48.71 0.29 30.63 46.88 46.88 -15 West Bengal 46.79 57.57 52.37 5.20 37.27 51.72 39.82 11.90
Other States/UTs16 Arunachal Pradesh - - - - - - - -17 Chhattisgarh 33.84 39.91 29.42 10.49 - - - -18 Goa - - - - - - - -19 Himachal Pradesh - - - - - - - -20 Jammu & Kashmir 74.19 - - - - - - -21 Jharkhand 36.16 37.16 35.77 1.39 40.00 40.00 40.00 -22 Manipur 55.58 - - - - 100.00 100.00 -23 Meghalaya - - - - - - - -24 Mizoram - - - - - - - -25 Nagaland - - - - - - - -26 Sikkim 53.81 79.30 69.75 9.55 44.94 50.00 40.00 10.0027 Tripura 44.99 75.26 75.26 - 62.42 78.57 78.57 -28 Uttranchal - 56.18 56.18 - - 50.00 50.00 -29 A & N Islands - - - - - - - -30 Chandigarh - - - - - - - -31 D & N Haveli - - - - - - - -32 Daman & Diu - - - - - - - -33 Delhi - 110.00 80.00 30.00 - - - -34 Lakshadweep - - - - - - - -35 Pondicherry 65.00 50.00 50.00 - - 40.00 40.00 -
ALL-INDIA 41.62 55.53 51.31 4.22 38.63 45.79 40.08 5.71
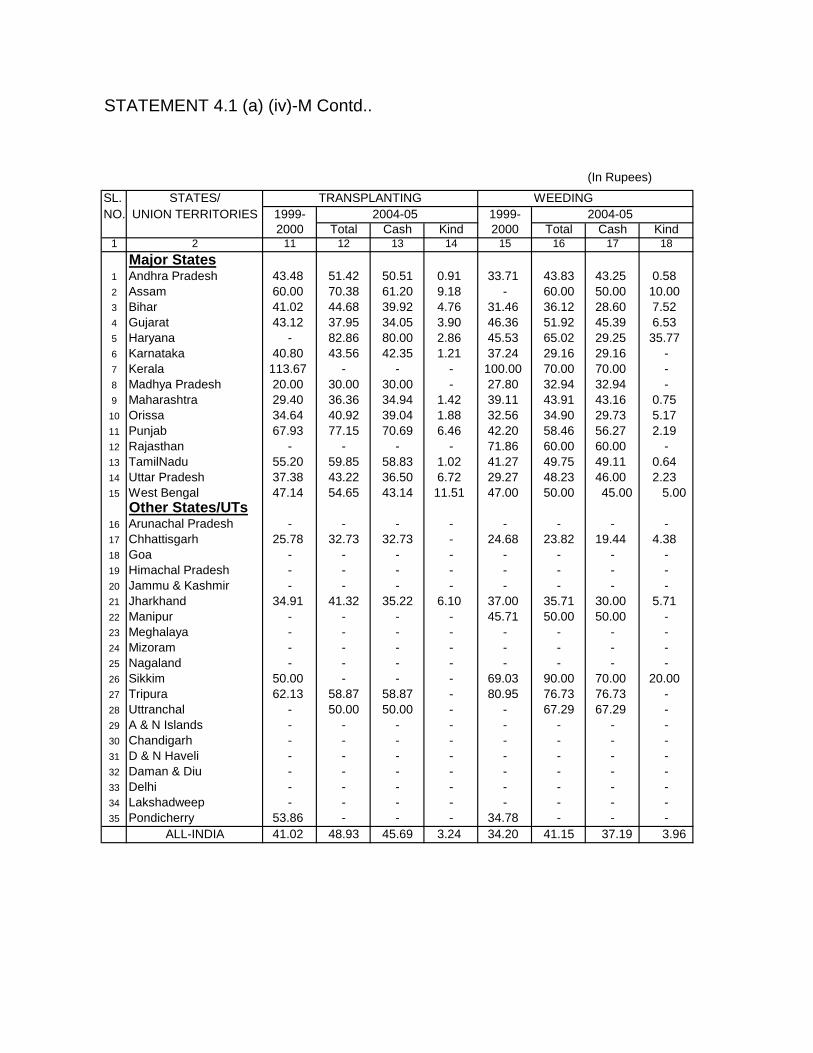
STATEMENT 4.1 (a) (iv)-M Contd..
(In Rupees)
SL. STATES/ TRANSPLANTING WEEDINGNO. UNION TERRITORIES 1999- 2004-05 1999- 2004-05
2000 Total Cash Kind 2000 Total Cash Kind1 2 11 12 13 14 15 16 17 18
Major States1 Andhra Pradesh 43.48 51.42 50.51 0.91 33.71 43.83 43.25 0.582 Assam 60.00 70.38 61.20 9.18 - 60.00 50.00 10.003 Bihar 41.02 44.68 39.92 4.76 31.46 36.12 28.60 7.524 Gujarat 43.12 37.95 34.05 3.90 46.36 51.92 45.39 6.535 Haryana - 82.86 80.00 2.86 45.53 65.02 29.25 35.776 Karnataka 40.80 43.56 42.35 1.21 37.24 29.16 29.16 -7 Kerala 113.67 - - - 100.00 70.00 70.00 -8 Madhya Pradesh 20.00 30.00 30.00 - 27.80 32.94 32.94 -9 Maharashtra 29.40 36.36 34.94 1.42 39.11 43.91 43.16 0.75
10 Orissa 34.64 40.92 39.04 1.88 32.56 34.90 29.73 5.1711 Punjab 67.93 77.15 70.69 6.46 42.20 58.46 56.27 2.1912 Rajasthan - - - - 71.86 60.00 60.00 -13 TamilNadu 55.20 59.85 58.83 1.02 41.27 49.75 49.11 0.6414 Uttar Pradesh 37.38 43.22 36.50 6.72 29.27 48.23 46.00 2.2315 West Bengal 47.14 54.65 43.14 11.51 47.00 50.00 45.00 5.00
Other States/UTs16 Arunachal Pradesh - - - - - - - -17 Chhattisgarh 25.78 32.73 32.73 - 24.68 23.82 19.44 4.3818 Goa - - - - - - - -19 Himachal Pradesh - - - - - - - -20 Jammu & Kashmir - - - - - - - -21 Jharkhand 34.91 41.32 35.22 6.10 37.00 35.71 30.00 5.7122 Manipur - - - - 45.71 50.00 50.00 -23 Meghalaya - - - - - - - -24 Mizoram - - - - - - - -25 Nagaland - - - - - - - -26 Sikkim 50.00 - - - 69.03 90.00 70.00 20.0027 Tripura 62.13 58.87 58.87 - 80.95 76.73 76.73 -28 Uttranchal - 50.00 50.00 - - 67.29 67.29 -29 A & N Islands - - - - - - - -30 Chandigarh - - - - - - - -31 D & N Haveli - - - - - - - -32 Daman & Diu - - - - - - - -33 Delhi - - - - - - - -34 Lakshadweep - - - - - - - -35 Pondicherry 53.86 - - - 34.78 - - -
ALL-INDIA 41.02 48.93 45.69 3.24 34.20 41.15 37.19 3.96
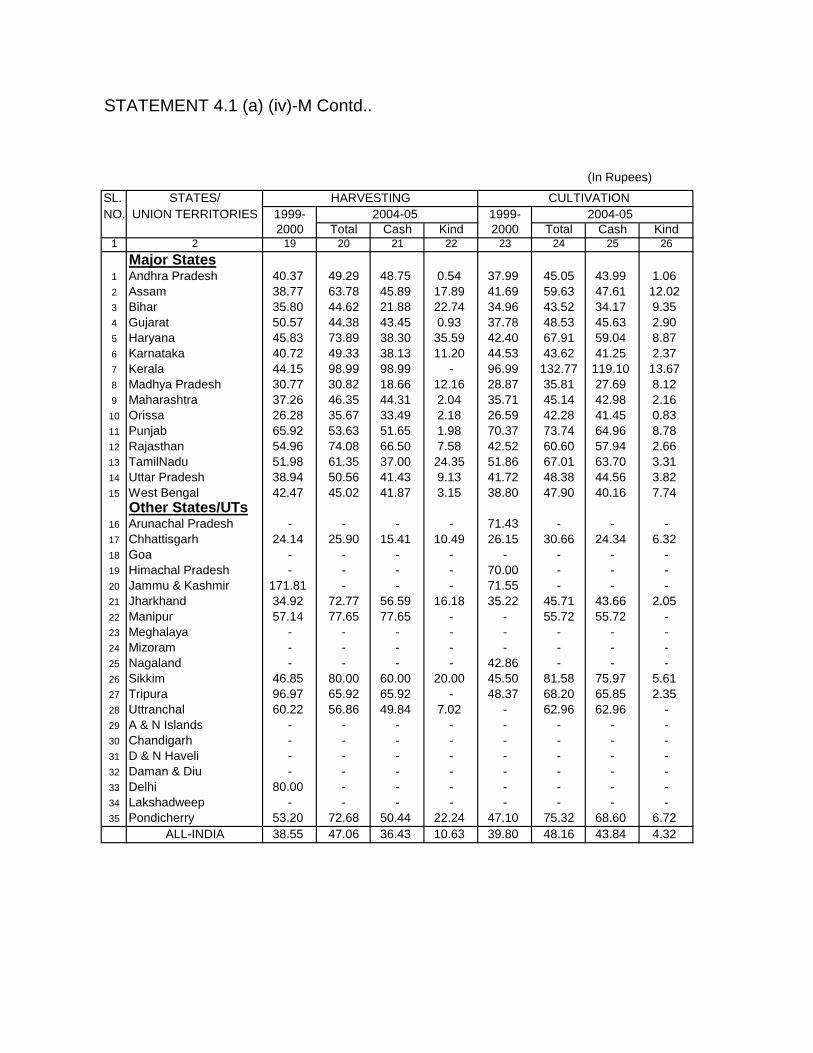
STATEMENT 4.1 (a) (iv)-M Contd..
(In Rupees)
SL. STATES/ HARVESTING CULTIVATIONNO. UNION TERRITORIES 1999- 2004-05 1999- 2004-05
2000 Total Cash Kind 2000 Total Cash Kind1 2 19 20 21 22 23 24 25 26
Major States1 Andhra Pradesh 40.37 49.29 48.75 0.54 37.99 45.05 43.99 1.062 Assam 38.77 63.78 45.89 17.89 41.69 59.63 47.61 12.023 Bihar 35.80 44.62 21.88 22.74 34.96 43.52 34.17 9.354 Gujarat 50.57 44.38 43.45 0.93 37.78 48.53 45.63 2.905 Haryana 45.83 73.89 38.30 35.59 42.40 67.91 59.04 8.876 Karnataka 40.72 49.33 38.13 11.20 44.53 43.62 41.25 2.377 Kerala 44.15 98.99 98.99 - 96.99 132.77 119.10 13.678 Madhya Pradesh 30.77 30.82 18.66 12.16 28.87 35.81 27.69 8.129 Maharashtra 37.26 46.35 44.31 2.04 35.71 45.14 42.98 2.16
10 Orissa 26.28 35.67 33.49 2.18 26.59 42.28 41.45 0.8311 Punjab 65.92 53.63 51.65 1.98 70.37 73.74 64.96 8.7812 Rajasthan 54.96 74.08 66.50 7.58 42.52 60.60 57.94 2.6613 TamilNadu 51.98 61.35 37.00 24.35 51.86 67.01 63.70 3.3114 Uttar Pradesh 38.94 50.56 41.43 9.13 41.72 48.38 44.56 3.8215 West Bengal 42.47 45.02 41.87 3.15 38.80 47.90 40.16 7.74
Other States/UTs16 Arunachal Pradesh - - - - 71.43 - - -17 Chhattisgarh 24.14 25.90 15.41 10.49 26.15 30.66 24.34 6.3218 Goa - - - - - - - -19 Himachal Pradesh - - - - 70.00 - - -20 Jammu & Kashmir 171.81 - - - 71.55 - - -21 Jharkhand 34.92 72.77 56.59 16.18 35.22 45.71 43.66 2.0522 Manipur 57.14 77.65 77.65 - - 55.72 55.72 -23 Meghalaya - - - - - - - -24 Mizoram - - - - - - - -25 Nagaland - - - - 42.86 - - -26 Sikkim 46.85 80.00 60.00 20.00 45.50 81.58 75.97 5.6127 Tripura 96.97 65.92 65.92 - 48.37 68.20 65.85 2.3528 Uttranchal 60.22 56.86 49.84 7.02 - 62.96 62.96 -29 A & N Islands - - - - - - - -30 Chandigarh - - - - - - - -31 D & N Haveli - - - - - - - -32 Daman & Diu - - - - - - - -33 Delhi 80.00 - - - - - - -34 Lakshadweep - - - - - - - -35 Pondicherry 53.20 72.68 50.44 22.24 47.10 75.32 68.60 6.72
ALL-INDIA 38.55 47.06 36.43 10.63 39.80 48.16 43.84 4.32

STATEMENT 4.1 (a) (iv)-M Contd..
(In Rupees)
SL. STATES/ FORESTRY PLANTATIONNO. UNION TERRITORIES 1999- 2004-05 1999- 2004-05
2000 Total Cash Kind 2000 Total Cash Kind1 2 27 28 29 30 31 32 33 34
Major States1 Andhra Pradesh - 50.00 50.00 - 38.52 50.46 50.46 -2 Assam - 85.14 42.29 42.85 38.27 53.35 43.78 9.573 Bihar 32.00 - - - 16.85 - - -4 Gujarat 40.00 - - - 25.00 - - -5 Haryana 70.00 - - - - - - -6 Karnataka 46.38 45.48 42.99 2.49 58.49 64.08 59.49 4.597 Kerala 159.97 210.44 207.79 2.65 98.31 120.70 114.96 5.748 Madhya Pradesh 26.41 30.00 30.00 - - - - -9 Maharashtra - 46.90 46.86 0.04 - 50.00 50.00 -
10 Orissa 87.01 50.00 50.00 - - - - -11 Punjab - 90.00 80.00 10.00 80.00 82.86 82.86 -12 Rajasthan - - - - - - - -13 TamilNadu 55.94 60.04 59.16 0.88 82.03 53.30 53.30 -14 Uttar Pradesh 47.08 64.76 64.76 - - - - -15 West Bengal - - - - 31.67 61.27 60.76 0.51
Other States/UTs16 Arunachal Pradesh - - - - - - - -17 Chhattisgarh 50.00 50.00 50.00 - - 38.88 15.25 23.6318 Goa - - - - - 70.00 70.00 -19 Himachal Pradesh 50.00 56.98 56.98 - - - - -20 Jammu & Kashmir - - - - - - - -21 Jharkhand - - - - - - - -22 Manipur - 53.89 53.89 - - - - -23 Meghalaya - - - - - - - -24 Mizoram - - - - - - - -25 Nagaland - - - - - - - -26 Sikkim 35.00 90.64 90.64 - - - - -27 Tripura - - - - 22.67 28.07 28.07 -28 Uttranchal - 100.00 100.00 - - - - -29 A & N Islands - - - - - - - -30 Chandigarh - - - - - - - -31 D & N Haveli 37.14 - - - - - - -32 Daman & Diu - - - - - - - -33 Delhi - - - - - - - -34 Lakshadweep - - - - 240.00 - - -35 Pondicherry - - - - - - - -
ALL-INDIA 61.50 58.67 57.60 1.07 61.24 72.09 65.83 6.26

STATEMENT 4.1 (a) (iv)-M Concld..
(In Rupees)
SL. STATES/ ANIMAL HUSBANDRY FISHERIES OTHERS (AGRICULTURAL)NO.UNION TERRITORIES 1999- 2004-05 1999- 2004-05 1999- 2004-05
2000 Total Cash Kind 2000 Total Cash Kind 2000 Total Cash Kind1 2 35 36 37 38 39 40 41 42 43 44 45 46
Major States1 Andhra Pradesh 18.70 24.44 19.96 4.48 59.40 34.00 29.71 4.29 37.88 45.24 44.81 0.432 Assam - 70.00 70.00 - - - - - 43.70 67.26 52.46 14.803 Bihar 31.07 58.67 58.67 - 54.47 - - - 32.16 46.97 36.85 10.124 Gujarat 45.34 55.75 55.75 - - - - - 42.86 57.37 47.42 9.955 Haryana 32.86 52.29 43.08 9.21 - - - - 73.61 92.59 91.77 0.826 Karnataka 17.56 - - - 101.89 105.28 ###### - 38.50 45.07 40.35 4.727 Kerala 105.43 97.79 89.20 8.59 69.16 197.13 ###### 10.48 102.40 120.82 ###### 2.658 Madhya Pradesh 26.11 19.59 19.59 - - - - - 29.67 39.10 37.24 1.869 Maharashtra 26.20 32.39 22.55 9.84 34.29 60.00 60.00 - 39.02 50.86 50.00 0.8610 Orissa 30.43 28.57 28.57 - 45.85 - - - 32.90 38.51 38.51 -11 Punjab 71.77 81.29 69.39 11.90 60.00 - - - 69.60 - - -12 Rajasthan - 148.57 ###### - - - - - 61.78 57.52 55.61 1.9113 TamilNadu 23.47 52.59 52.55 0.04 89.30 50.00 50.00 - 61.04 64.61 64.23 0.3814 Uttar Pradesh 25.00 35.46 32.86 2.60 - - - - 47.34 44.96 40.69 4.2715 West Bengal - - - - - 60.00 60.00 - 47.80 - - -
Other States/UTs16 Arunachal Pradesh - - - - - - - - 115.04 - - -17 Chhattisgarh 18.54 20.06 4.35 15.71 - - - - 29.04 30.90 23.69 7.2118 Goa - - - - - - - - - 91.73 70.68 21.0519 Himachal Pradesh - - - - - - - - 70.00 - - -20 Jammu & Kashmir - 71.43 71.43 - - - - - 100.00 110.74 86.79 23.9521 Jharkhand - 29.14 20.29 8.85 30.00 - - - 29.78 15.58 4.70 10.8822 Manipur - - - - 60.00 - - - 70.00 70.00 70.00 -23 Meghalaya - - - - - - - - - - - -24 Mizoram - - - - - - - - - - - -25 Nagaland - - - - - - - - - - - -26 Sikkim - 89.29 89.29 - - - - - 53.33 89.29 89.29 -27 Tripura - - - - - - - - 64.29 - - -28 Uttranchal - 32.00 32.00 - - - - - 18.14 - - -29 A & N Islands - - - - - - - - - - - -30 Chandigarh - - - - - - - - 122.37 - - -31 D & N Haveli - - - - - - - - - - - -32 Daman & Diu - - - - - 87.79 76.80 10.99 - - - -33 Delhi - - - - - - - - - - - -34 Lakshadweep - - - - - - - - 120.00 - - -35 Pondicherry 50.00 32.00 20.00 12.00 44.17 - - - 50.84 90.00 84.00 6.00
ALL-INDIA 29.06 34.29 28.64 5.65 67.97 148.57 ###### 6.62 45.28 51.02 47.79 3.23

STATEMENT 4.1 (a) (i)-W
AVERAGE DAILY EARNINGS OF WOMEN BELONGING TO ALL RURAL LABOURHOUSEHOLDS IN DIFFERENT AGRICULTURAL OCCUPATIONS
(In Rupees)
SL. STATES/ PLOUGHING SOWINGNO. UNION TERRITORIES 1999- 2004-05 1999- 2004-05
2000 Total Cash Kind 2000 Total Cash Kind1 2 3 4 5 6 7 8 9 10
Major States1 Andhra Pradesh 37.96 36.07 32.79 3.28 24.51 28.00 23.71 4.292 Assam - 50.00 50.00 - 37.73 50.59 45.65 4.943 Bihar 35.62 34.19 21.51 12.68 33.03 45.16 40.66 4.504 Gujarat 28.02 67.50 67.50 - 40.09 19.38 19.03 0.355 Haryana - 70.00 50.00 20.00 40.00 - - -6 Karnataka 28.34 27.83 27.83 - 30.74 27.62 25.08 2.547 Kerala 84.16 80.00 80.00 - 60.00 178.18 156.37 21.818 Madhya Pradesh 24.80 44.02 44.02 - 27.10 28.75 17.94 10.819 Maharashtra 29.74 34.61 34.61 - 24.29 28.61 28.61 -
10 Orissa 25.64 22.32 11.56 10.76 25.00 50.40 46.67 3.7311 Punjab 97.14 - - - - - - -12 Rajasthan - - - - - 48.68 44.70 3.9813 TamilNadu 28.50 19.65 19.65 - 28.67 35.74 35.23 0.5114 Uttar Pradesh 32.77 50.00 50.00 - 26.08 39.43 37.27 2.1615 West Bengal 40.70 30.68 28.09 2.59 42.31 50.57 33.86 16.71
Other States/UTs16 Arunachal Pradesh - - - - - 23.57 23.57 -17 Chhattisgarh 42.86 - - - 40.00 26.67 20.00 6.6718 Goa - - - - - - - -19 Himachal Pradesh - - - - - - - -20 Jammu & Kashmir - - - - - - - -21 Jharkhand 32.22 39.04 37.00 2.04 27.24 31.20 28.37 2.8322 Manipur 50.00 - - - - - - -23 Meghalaya 40.00 42.86 42.86 - 30.00 34.29 34.29 -24 Mizoram - - - - - - - -25 Nagaland - - - - - - - -26 Sikkim 38.27 95.00 80.00 15.00 52.91 75.00 60.00 15.0027 Tripura 41.66 80.00 80.00 - 30.00 56.02 56.02 -28 Uttranchal - - - - - 53.33 53.33 -29 A & N Islands - - - - - - - -30 Chandigarh - - - - - - - -31 D & N Haveli - - - - - - - -32 Daman & Diu - - - - - - - -33 Delhi - - - - - - - -34 Lakshadweep - - - - - - - -35 Pondicherry - - - - - - - -
ALL-INDIA 32.16 35.91 32.35 3.56 28.40 31.94 27.88 4.06

STATEMENT 4.1 (a) (i)-W Contd..
(In Rupees)
SL. STATES/ TRANSPLANTING WEEDINGNO. UNION TERRITORIES 1999- 2004-05 1999- 2004-05
2000 Total Cash Kind 2000 Total Cash Kind1 2 11 12 13 14 15 16 17 18
Major States1 Andhra Pradesh 27.97 36.71 35.76 0.95 24.36 27.27 26.89 0.382 Assam 30.83 56.94 55.53 1.41 38.34 - - -3 Bihar 29.72 38.08 26.59 11.49 31.95 31.02 20.53 10.494 Gujarat 36.63 37.67 34.24 3.43 33.42 39.08 33.42 5.665 Haryana 60.52 65.70 56.51 9.19 50.00 47.22 24.22 23.006 Karnataka 28.14 33.80 31.99 1.81 24.43 27.13 25.76 1.377 Kerala 67.64 63.70 59.59 4.11 69.20 71.64 67.78 3.868 Madhya Pradesh 23.87 28.53 19.45 9.08 25.23 28.08 24.51 3.579 Maharashtra 25.85 31.23 28.42 2.81 24.27 27.70 27.50 0.20
10 Orissa 22.82 26.35 22.84 3.51 21.57 29.71 22.91 6.8011 Punjab 40.00 67.51 59.45 8.06 59.37 50.00 50.00 -12 Rajasthan - - - - 36.75 36.43 29.35 7.0813 TamilNadu 29.69 35.04 33.34 1.70 26.30 31.80 30.81 0.9914 Uttar Pradesh 29.69 43.32 26.02 17.30 23.07 37.83 27.24 10.5915 West Bengal 39.46 50.88 40.41 10.47 40.11 35.73 33.12 2.61
Other States/UTs16 Arunachal Pradesh - - - - - - - -17 Chhattisgarh 24.49 27.04 19.40 7.64 20.89 23.58 15.25 8.3318 Goa - 60.00 60.00 - - - - -19 Himachal Pradesh - - - - - 70.00 50.00 20.0020 Jammu & Kashmir - - - - - - - -21 Jharkhand 28.49 38.21 34.42 3.79 19.94 41.48 39.73 1.7522 Manipur - 60.00 60.00 - 50.00 50.00 50.00 -23 Meghalaya - 42.66 42.66 - 44.97 37.06 36.59 0.4724 Mizoram - - - - 60.00 - - -25 Nagaland - - - - - - - -26 Sikkim - - - - 48.98 50.00 40.00 10.0027 Tripura - 54.13 54.13 - 43.42 56.86 56.86 -28 Uttranchal - 50.00 50.00 - 50.00 45.40 42.47 2.9329 A & N Islands - - - - 125.00 - - -30 Chandigarh - - - - - - - -31 D & N Haveli 26.36 55.37 43.03 12.34 30.00 - - -32 Daman & Diu 41.81 - - - 30.00 - - -33 Delhi - - - - - - - -34 Lakshadweep - - - - - - - -35 Pondicherry 26.82 - - - 23.64 33.89 33.89 -
ALL-INDIA 28.83 36.97 32.94 4.03 25.55 30.13 27.63 2.50

STATEMENT 4.1 (a) (i)-W Contd..
(In Rupees)
SL. STATES/ HARVESTING CULTIVATIONNO. UNION TERRITORIES 1999- 2004-05 1999- 2004-05
2000 Total Cash Kind 2000 Total Cash Kind1 2 19 20 21 22 23 24 25 26
Major States1 Andhra Pradesh 27.78 30.49 29.79 0.70 26.67 29.39 28.34 1.052 Assam 43.20 57.72 41.90 15.82 33.72 54.21 46.25 7.963 Bihar 32.72 42.62 16.77 25.85 28.69 35.93 27.65 8.284 Gujarat 36.08 39.98 37.35 2.63 32.16 47.47 43.78 3.695 Haryana 54.67 62.97 29.91 33.06 52.76 47.59 36.34 11.256 Karnataka 25.69 33.17 27.22 5.95 26.78 30.93 29.50 1.437 Kerala 53.09 77.94 21.83 56.11 61.25 75.25 65.12 10.138 Madhya Pradesh 26.88 26.56 15.86 10.70 23.63 29.78 23.50 6.289 Maharashtra 23.75 25.31 22.54 2.77 23.87 27.67 26.46 1.21
10 Orissa 22.61 27.31 22.52 4.79 20.32 30.42 28.65 1.7711 Punjab 61.43 47.53 41.45 6.08 - 61.65 57.80 3.8512 Rajasthan 43.10 62.69 48.76 13.93 38.90 46.12 44.25 1.8713 TamilNadu 32.54 39.80 27.71 12.09 32.84 36.14 34.60 1.5414 Uttar Pradesh 29.54 35.47 22.10 13.37 28.90 41.78 32.71 9.0715 West Bengal 39.09 41.50 34.17 7.33 34.24 37.89 33.11 4.78
Other States/UTs16 Arunachal Pradesh - - - - 60.00 57.14 57.14 -17 Chhattisgarh 22.94 22.27 16.07 6.20 22.45 28.45 22.48 5.9718 Goa 50.00 75.00 75.00 - - 75.27 75.27 -19 Himachal Pradesh 61.41 90.00 90.00 - 70.00 62.45 58.27 4.1820 Jammu & Kashmir - - - - - - - -21 Jharkhand 28.77 21.33 16.41 4.92 27.20 35.92 32.40 3.5222 Manipur - 60.00 60.00 - - 48.68 48.68 -23 Meghalaya 47.85 49.33 46.83 2.50 33.74 51.55 48.78 2.7724 Mizoram 50.00 - - - - - - -25 Nagaland - - - - - - - -26 Sikkim 30.00 53.02 50.00 3.02 35.60 78.80 61.91 16.8927 Tripura 51.91 - - - 33.53 53.22 49.59 3.6328 Uttranchal 51.99 54.24 51.48 2.76 - 52.55 52.02 0.5329 A & N Islands - - - - - - - -30 Chandigarh - - - - - - - -31 D & N Haveli - 31.33 31.33 - 29.45 45.00 42.00 3.0032 Daman & Diu 142.86 - - - 30.00 53.86 38.35 15.5133 Delhi - - - - - - - -34 Lakshadweep - - - - - - - -35 Pondicherry 34.67 47.61 11.37 36.24 32.81 41.40 34.16 7.24
ALL-INDIA 29.33 33.99 26.04 7.95 27.81 33.09 30.13 2.96
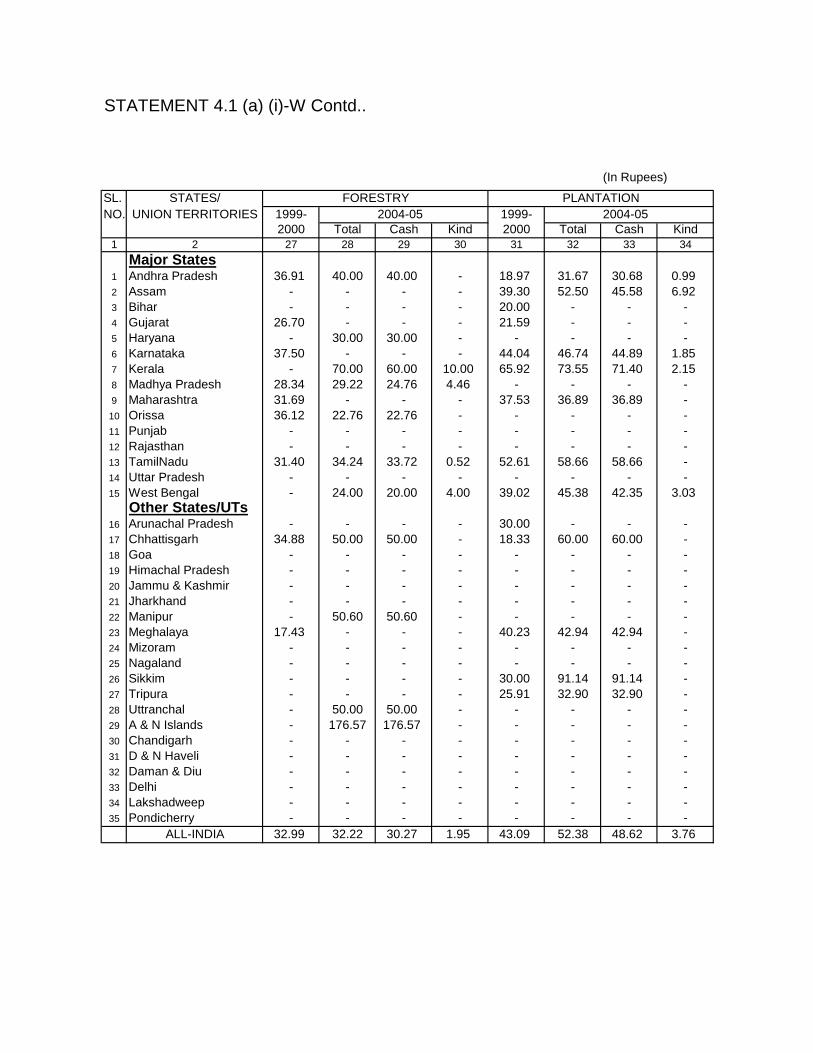
STATEMENT 4.1 (a) (i)-W Contd..
(In Rupees)
SL. STATES/ FORESTRY PLANTATIONNO. UNION TERRITORIES 1999- 2004-05 1999- 2004-05
2000 Total Cash Kind 2000 Total Cash Kind1 2 27 28 29 30 31 32 33 34
Major States1 Andhra Pradesh 36.91 40.00 40.00 - 18.97 31.67 30.68 0.992 Assam - - - - 39.30 52.50 45.58 6.923 Bihar - - - - 20.00 - - -4 Gujarat 26.70 - - - 21.59 - - -5 Haryana - 30.00 30.00 - - - - -6 Karnataka 37.50 - - - 44.04 46.74 44.89 1.857 Kerala - 70.00 60.00 10.00 65.92 73.55 71.40 2.158 Madhya Pradesh 28.34 29.22 24.76 4.46 - - - -9 Maharashtra 31.69 - - - 37.53 36.89 36.89 -
10 Orissa 36.12 22.76 22.76 - - - - -11 Punjab - - - - - - - -12 Rajasthan - - - - - - - -13 TamilNadu 31.40 34.24 33.72 0.52 52.61 58.66 58.66 -14 Uttar Pradesh - - - - - - - -15 West Bengal - 24.00 20.00 4.00 39.02 45.38 42.35 3.03
Other States/UTs16 Arunachal Pradesh - - - - 30.00 - - -17 Chhattisgarh 34.88 50.00 50.00 - 18.33 60.00 60.00 -18 Goa - - - - - - - -19 Himachal Pradesh - - - - - - - -20 Jammu & Kashmir - - - - - - - -21 Jharkhand - - - - - - - -22 Manipur - 50.60 50.60 - - - - -23 Meghalaya 17.43 - - - 40.23 42.94 42.94 -24 Mizoram - - - - - - - -25 Nagaland - - - - - - - -26 Sikkim - - - - 30.00 91.14 91.14 -27 Tripura - - - - 25.91 32.90 32.90 -28 Uttranchal - 50.00 50.00 - - - - -29 A & N Islands - 176.57 176.57 - - - - -30 Chandigarh - - - - - - - -31 D & N Haveli - - - - - - - -32 Daman & Diu - - - - - - - -33 Delhi - - - - - - - -34 Lakshadweep - - - - - - - -35 Pondicherry - - - - - - - -
ALL-INDIA 32.99 32.22 30.27 1.95 43.09 52.38 48.62 3.76

STATEMENT 4.1 (a) (i)-W Concld..
(In Rupees)
SL. STATES/ ANIMAL HUSBANDRY FISHERIES OTHERS (AGRICULTURAL)NO. UNION TERRITORIES 1999- 2004-05 1999- 2004-05 1993-94 1999-2000
2000 Total Cash Kind 2000 Total Cash Kind Total Cash Kind1 2 35 36 37 38 39 40 41 42 43 44 45 46
Major States1 Andhra Pradesh 13.91 30.00 30.00 - 40.00 - - - 25.63 35.78 34.83 0.952 Assam - 40.00 30.00 10.00 - - - - 47.12 67.64 57.90 9.743 Bihar 17.86 36.16 36.16 - - - - - 25.32 42.77 33.20 9.574 Gujarat 25.09 33.00 20.03 12.97 - - - - 35.33 46.15 40.98 5.175 Haryana - - - - - - - - 53.41 98.47 98.47 -6 Karnataka - 23.52 23.52 - 78.93 - - - 20.90 30.06 28.21 1.857 Kerala - 33.00 33.00 - - 65.00 52.50 12.50 57.04 70.63 54.81 15.828 Madhya Pradesh 31.28 50.00 50.00 - - - - - 28.64 29.90 28.83 1.079 Maharashtra - 20.00 20.00 - - - - - 25.27 29.03 28.21 0.82
10 Orissa 20.00 28.16 22.00 6.16 - - - - 21.27 25.99 25.99 -11 Punjab 38.09 45.01 23.69 21.32 - - - - 39.59 44.35 29.90 14.4512 Rajasthan 15.58 59.44 22.90 36.54 - - - - 35.63 50.20 45.80 4.4013 TamilNadu 26.86 29.81 24.91 4.90 25.71 - - - 31.79 31.64 31.47 0.1714 Uttar Pradesh 20.00 15.00 15.00 - - - - - 38.33 35.07 25.70 9.3715 West Bengal - - - - - 25.00 25.00 - 34.74 37.37 37.14 0.23
Other States/UTs16 Arunachal Pradesh - - - - - - - - - - - -17 Chhattisgarh 25.00 15.05 5.79 9.26 20.00 - - - 24.35 32.18 25.55 6.6318 Goa - - - - - - - - 50.00 53.57 53.57 -19 Himachal Pradesh - - - - - - - - 40.00 44.00 38.57 5.4320 Jammu & Kashmir - - - - - - - - - - - -21 Jharkhand - 28.25 28.25 - - - - - 36.68 35.31 28.27 7.0422 Manipur - - - - - - - - 49.53 - - -23 Meghalaya - - - - - - - - 37.26 - - -24 Mizoram - - - - - - - - 145.58 - - -25 Nagaland - - - - - - - - - - - -26 Sikkim - 71.57 57.19 14.38 - - - - 32.00 89.29 89.29 -27 Tripura - 34.29 34.29 - - - - - - 55.19 55.19 -28 Uttranchal - - - - - - - - 65.00 - - -29 A & N Islands - - - - - - - - 70.00 - - -30 Chandigarh - - - - - - - - - - - -31 D & N Haveli - - - - - - - - 28.65 40.00 37.32 2.6832 Daman & Diu - - - - 44.76 150.00 ##### 30.00 - 65.00 50.00 15.0033 Delhi - - - - - - - - - - - -34 Lakshadweep - - - - - - - - - - - -35 Pondicherry 30.00 - - - - - - - 39.23 39.00 36.00 3.00
ALL-INDIA 24.25 31.65 20.87 10.78 60.95 43.57 37.92 5.65 28.58 35.00 31.92 3.08

STATEMENT 4.1(a) (ii)-W
AVERAGE DAILY EARNINGS OF WOMEN BELONGING TO SCHEDULED CASTES RURAL LABOUR HOUSEHOLDS IN DIFFERENT
AGRICULTURAL OCCUPATIONS(In Rupees)
SL. STATES/ PLOUGHING SOWINGNO. UNION TERRITORIES 1999- 2004-05 1999- 2004-05
2000 Total Cash Kind 2000 Total Cash Kind1 2 3 4 5 6 7 8 9 10
Major States1 Andhra Pradesh 30.53 50.00 50.00 - 25.69 27.29 26.84 0.452 Assam - 50.00 50.00 - 54.00 47.56 42.56 5.003 Bihar 37.75 34.19 21.51 12.68 36.75 37.06 35.59 1.474 Gujarat 35.00 - - - 40.00 10.15 10.08 0.075 Haryana - 70.00 50.00 20.00 40.00 - - -6 Karnataka 28.22 25.00 25.00 - 31.95 37.12 29.42 7.707 Kerala 40.00 80.00 80.00 - - 178.18 156.37 21.818 Madhya Pradesh 25.00 40.00 40.00 - 26.39 31.75 24.83 6.929 Maharashtra 21.54 - - - 23.19 30.03 30.03 -
10 Orissa 22.14 25.00 25.00 - - 36.88 36.88 -11 Punjab 97.14 - - - - - - -12 Rajasthan - - - - - 50.00 50.00 -13 TamilNadu 20.73 37.50 37.50 - 28.80 41.24 39.56 1.6814 Uttar Pradesh 27.01 50.00 50.00 - 29.97 47.89 43.78 4.1115 West Bengal - 30.68 28.09 2.59 42.35 46.08 29.96 16.12
Other States/UTs16 Arunachal Pradesh - - - - - - - -17 Chhattisgarh 38.25 - - - - - - -18 Goa - - - - - - - -19 Himachal Pradesh - - - - - - - -20 Jammu & Kashmir - - - - - - - -21 Jharkhand 28.57 30.00 30.00 - - 60.00 60.00 -22 Manipur - - - - - - - -23 Meghalaya - - - - - - - -24 Mizoram - - - - - - - -25 Nagaland - - - - - - - -26 Sikkim 32.50 - - - - 75.00 60.00 15.0027 Tripura - 80.00 80.00 - - 56.02 56.02 -28 Uttranchal - - - - - 60.00 60.00 -29 A & N Islands - - - - - - - -30 Chandigarh - - - - - - - -31 D & N Haveli - - - - - - - -32 Daman & Diu - - - - - - - -33 Delhi - - - - - - - -34 Lakshadweep - - - - - - - -35 Pondicherry - - - - - - - -
ALL-INDIA 28.36 38.09 33.64 4.45 30.23 33.43 29.38 4.05
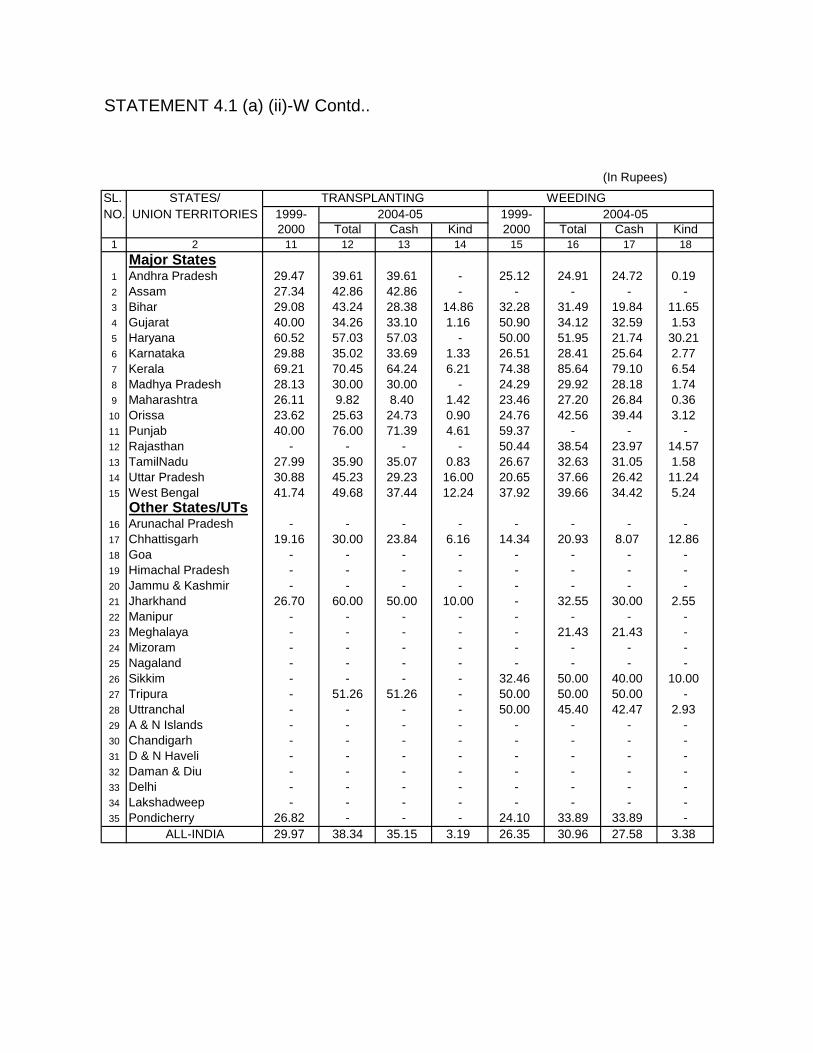
STATEMENT 4.1 (a) (ii)-W Contd..
(In Rupees)
SL. STATES/ TRANSPLANTING WEEDINGNO. UNION TERRITORIES 1999- 2004-05 1999- 2004-05
2000 Total Cash Kind 2000 Total Cash Kind1 2 11 12 13 14 15 16 17 18
Major States1 Andhra Pradesh 29.47 39.61 39.61 - 25.12 24.91 24.72 0.192 Assam 27.34 42.86 42.86 - - - - -3 Bihar 29.08 43.24 28.38 14.86 32.28 31.49 19.84 11.654 Gujarat 40.00 34.26 33.10 1.16 50.90 34.12 32.59 1.535 Haryana 60.52 57.03 57.03 - 50.00 51.95 21.74 30.216 Karnataka 29.88 35.02 33.69 1.33 26.51 28.41 25.64 2.777 Kerala 69.21 70.45 64.24 6.21 74.38 85.64 79.10 6.548 Madhya Pradesh 28.13 30.00 30.00 - 24.29 29.92 28.18 1.749 Maharashtra 26.11 9.82 8.40 1.42 23.46 27.20 26.84 0.36
10 Orissa 23.62 25.63 24.73 0.90 24.76 42.56 39.44 3.1211 Punjab 40.00 76.00 71.39 4.61 59.37 - - -12 Rajasthan - - - - 50.44 38.54 23.97 14.5713 TamilNadu 27.99 35.90 35.07 0.83 26.67 32.63 31.05 1.5814 Uttar Pradesh 30.88 45.23 29.23 16.00 20.65 37.66 26.42 11.2415 West Bengal 41.74 49.68 37.44 12.24 37.92 39.66 34.42 5.24
Other States/UTs16 Arunachal Pradesh - - - - - - - -17 Chhattisgarh 19.16 30.00 23.84 6.16 14.34 20.93 8.07 12.8618 Goa - - - - - - - -19 Himachal Pradesh - - - - - - - -20 Jammu & Kashmir - - - - - - - -21 Jharkhand 26.70 60.00 50.00 10.00 - 32.55 30.00 2.5522 Manipur - - - - - - - -23 Meghalaya - - - - - 21.43 21.43 -24 Mizoram - - - - - - - -25 Nagaland - - - - - - - -26 Sikkim - - - - 32.46 50.00 40.00 10.0027 Tripura - 51.26 51.26 - 50.00 50.00 50.00 -28 Uttranchal - - - - 50.00 45.40 42.47 2.9329 A & N Islands - - - - - - - -30 Chandigarh - - - - - - - -31 D & N Haveli - - - - - - - -32 Daman & Diu - - - - - - - -33 Delhi - - - - - - - -34 Lakshadweep - - - - - - - -35 Pondicherry 26.82 - - - 24.10 33.89 33.89 -
ALL-INDIA 29.97 38.34 35.15 3.19 26.35 30.96 27.58 3.38

STATEMENT 4.1 (a) (ii)-W Contd..
(In Rupees)
SL. STATES/ HARVESTING CULTIVATIONNO. UNION TERRITORIES 1999- 2004-05 1999- 2004-05
2000 Total Cash Kind 2000 Total Cash Kind1 2 19 20 21 22 23 24 25 26
Major States1 Andhra Pradesh 26.91 29.49 29.32 0.17 28.36 30.99 29.89 1.102 Assam 32.00 56.18 39.62 16.56 34.83 56.41 46.57 9.843 Bihar 32.84 42.23 14.65 27.58 29.48 33.99 24.55 9.444 Gujarat 38.85 42.65 41.45 1.20 36.98 50.79 48.58 2.215 Haryana 58.23 55.28 25.76 29.52 50.96 46.89 32.41 14.486 Karnataka 25.51 30.83 28.46 2.37 24.64 30.94 29.41 1.537 Kerala 56.10 74.35 13.78 60.57 59.53 82.47 67.17 15.308 Madhya Pradesh 26.96 28.25 21.76 6.49 25.82 33.91 23.49 10.429 Maharashtra 22.99 26.21 24.53 1.68 23.52 25.67 24.45 1.22
10 Orissa 21.81 25.11 18.76 6.35 22.95 37.10 35.02 2.0811 Punjab 57.33 47.61 40.66 6.95 - 58.77 56.40 2.3712 Rajasthan 52.14 71.08 52.70 18.38 45.52 49.17 49.17 -13 TamilNadu 34.78 39.83 30.47 9.36 30.43 36.04 33.90 2.1414 Uttar Pradesh 28.03 35.75 22.29 13.46 28.03 39.41 29.53 9.8815 West Bengal 38.66 38.08 31.96 6.12 33.45 36.35 32.16 4.19
Other States/UTs16 Arunachal Pradesh - - - - - - - -17 Chhattisgarh 21.09 22.89 16.90 5.99 25.62 27.66 18.78 8.8818 Goa - 75.00 75.00 - - - - -19 Himachal Pradesh - - - - - 52.50 45.00 7.5020 Jammu & Kashmir - - - - - - - -21 Jharkhand 26.33 - - - 25.78 36.99 35.21 1.7822 Manipur - - - - - - - -23 Meghalaya - - - - - - - -24 Mizoram - - - - - - - -25 Nagaland - - - - - - - -26 Sikkim - - - - 31.68 74.74 57.37 17.3727 Tripura 70.00 25.00 25.00 - 22.86 - - -28 Uttranchal 66.48 56.69 56.69 - - 49.27 48.22 1.0529 A & N Islands - - - - - - - -30 Chandigarh - - - - - - - -31 D & N Haveli - - - - - - - -32 Daman & Diu 142.86 - - - - - - -33 Delhi - - - - - - - -34 Lakshadweep - - - - - - - -35 Pondicherry 35.86 43.70 14.96 28.74 26.16 45.43 45.43 -
ALL-INDIA 30.73 36.53 27.40 9.13 29.10 33.81 30.18 3.63

STATEMENT 4.1 (a) (ii)-W Contd..
(In Rupees)
SL. STATES/ FORESTRY PLANTATIONNO. UNION TERRITORIES 1999- 2004-05 1999- 2004-05
2000 Total Cash Kind 2000 Total Cash Kind1 2 27 28 29 30 31 32 33 34
Major States1 Andhra Pradesh 20.00 - - - 25.00 23.99 23.99 -2 Assam - - - - 36.56 49.74 46.84 2.903 Bihar - - - - - - - -4 Gujarat - - - - - - - -5 Haryana - - - - - - - -6 Karnataka 37.50 - - - 41.47 39.09 38.00 1.097 Kerala - 70.00 60.00 10.00 64.98 76.60 75.90 0.708 Madhya Pradesh - 37.10 37.10 - - - - -9 Maharashtra - - - - - - - -
10 Orissa 40.00 22.12 22.12 - - - - -11 Punjab - - - - - - - -12 Rajasthan - - - - - - - -13 TamilNadu 34.50 - - - 50.56 61.34 61.34 -14 Uttar Pradesh - - - - - - - -15 West Bengal - 24.00 20.00 4.00 39.43 43.51 38.92 4.59
Other States/UTs16 Arunachal Pradesh - - - - - - - -17 Chhattisgarh 25.00 - - - 18.33 - - -18 Goa - - - - - - - -19 Himachal Pradesh - - - - - - - -20 Jammu & Kashmir - - - - - - - -21 Jharkhand - - - - - - - -22 Manipur - - - - - - - -23 Meghalaya - - - - - - - -24 Mizoram - - - - - - - -25 Nagaland - - - - - - - -26 Sikkim - - - - - 91.14 91.14 -27 Tripura - - - - 19.04 32.23 32.23 -28 Uttranchal - 50.00 50.00 - - - - -29 A & N Islands - - - - - - - -30 Chandigarh - - - - - - - -31 D & N Haveli - - - - - - - -32 Daman & Diu - - - - - - - -33 Delhi - - - - - - - -34 Lakshadweep - - - - - - - -35 Pondicherry - - - - - - - -
ALL-INDIA 32.24 31.81 30.44 1.37 48.95 57.10 56.00 1.10

STATEMENT 4.1 (a) (ii)-W Concld..
(In Rupees)
SL. STATES/ ANIMAL HUSBANDRY FISHERIES OTHERS (AGRICULTURAL)NO.UNION TERRITORIES 1999- 2004-05 1999- 2004-05 1999- 2004-05
2000 Total Cash Kind 2000 Total Cash Kind 2000 Total Cash Kind1 2 35 36 37 38 39 40 41 42 43 44 45 46
Major States1 Andhra Pradesh 10.89 30.00 30.00 - - - - - 26.36 45.35 45.14 0.212 Assam - - - - - - - - - - - -3 Bihar 17.86 - - - - - - - 26.96 45.00 35.00 10.004 Gujarat 40.00 30.00 30.00 - - - - - 46.96 63.45 50.00 13.455 Haryana - - - - - - - - 40.00 97.29 97.29 -6 Karnataka - 22.88 22.88 - - - - - 23.80 41.16 32.93 8.237 Kerala - 33.00 33.00 - - - - - 47.08 85.06 66.77 18.298 Madhya Pradesh - - - - - - - - 29.82 28.34 27.75 0.599 Maharashtra - 20.00 20.00 - - - - - 25.24 27.51 26.98 0.5310 Orissa - 30.00 30.00 - - - - - 24.27 26.56 26.56 -11 Punjab 38.09 44.55 24.42 20.13 - - - - 34.21 44.35 29.90 14.4512 Rajasthan 12.18 59.44 22.90 36.54 - - - - - - - -13 TamilNadu 28.61 24.57 18.40 6.17 25.71 - - - 32.73 40.33 39.55 0.7814 Uttar Pradesh 20.00 - - - - - - - 42.32 33.14 21.66 11.4815 West Bengal - - - - - 25.00 25.00 - 30.19 34.03 33.48 0.55
Other States/UTs16 Arunachal Pradesh - - - - - - - - - - - -17 Chhattisgarh - 5.00 - 5.00 - - - - 28.54 24.75 10.51 14.2418 Goa - - - - - - - - - - - -19 Himachal Pradesh - - - - - - - - 40.00 44.00 38.57 5.4320 Jammu & Kashmir - - - - - - - - - - - -21 Jharkhand - 50.00 50.00 - - - - - 30.00 40.00 40.00 -22 Manipur - - - - - - - - - - - -23 Meghalaya - - - - - - - - - - - -24 Mizoram - - - - - - - - - - - -25 Nagaland - - - - - - - - - - - -26 Sikkim - 80.00 60.00 20.00 - - - - - - - -27 Tripura - 34.29 34.29 - - - - - - 55.19 55.19 -28 Uttranchal - - - - - - - - 65.00 - - -29 A & N Islands - - - - - - - - - - - -30 Chandigarh - - - - - - - - - - - -31 D & N Haveli - - - - - - - - - - - -32 Daman & Diu - - - - - - - - - - - -33 Delhi - - - - - - - - - - - -34 Lakshadweep - - - - - - - - - - - -35 Pondicherry 30.00 - - - - - - - 44.77 - - -
ALL-INDIA 24.02 35.71 23.01 12.70 25.71 25.00 25.00 - 29.61 38.18 32.92 5.26
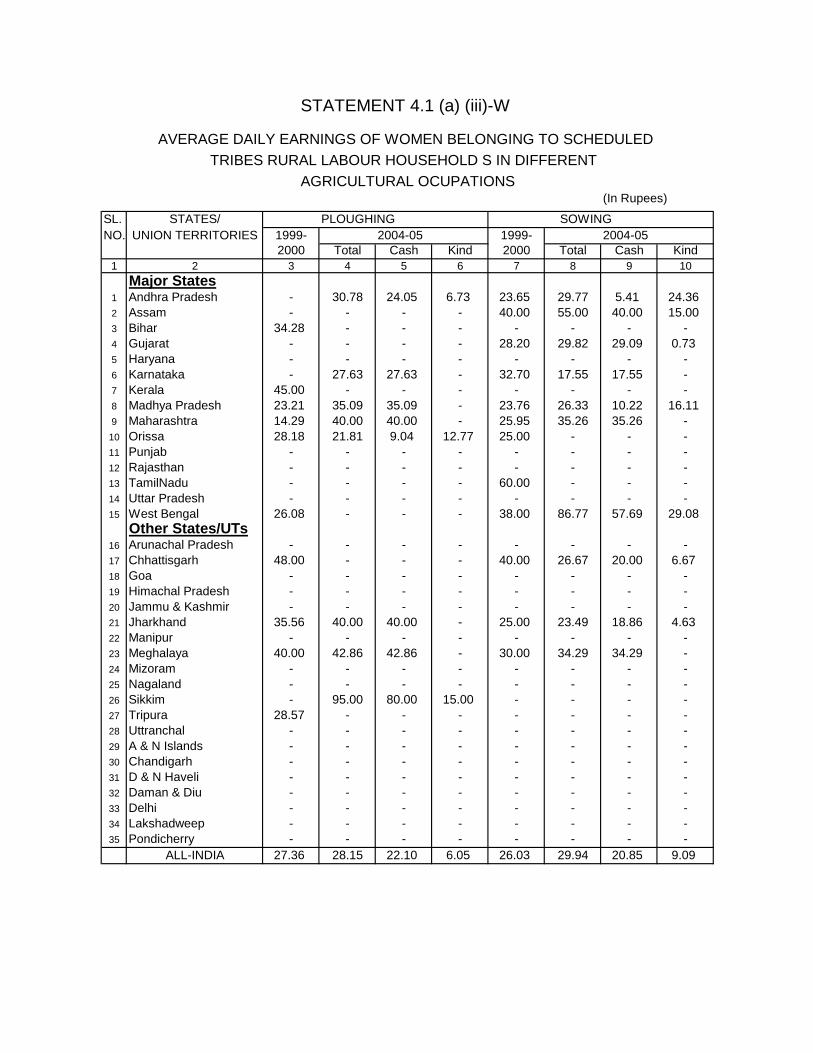
STATEMENT 4.1 (a) (iii)-W
AVERAGE DAILY EARNINGS OF WOMEN BELONGING TO SCHEDULED TRIBES RURAL LABOUR HOUSEHOLD S IN DIFFERENT
AGRICULTURAL OCUPATIONS(In Rupees)
SL. STATES/ PLOUGHING SOWINGNO. UNION TERRITORIES 1999- 2004-05 1999- 2004-05
2000 Total Cash Kind 2000 Total Cash Kind1 2 3 4 5 6 7 8 9 10
Major States1 Andhra Pradesh - 30.78 24.05 6.73 23.65 29.77 5.41 24.362 Assam - - - - 40.00 55.00 40.00 15.003 Bihar 34.28 - - - - - - -4 Gujarat - - - - 28.20 29.82 29.09 0.735 Haryana - - - - - - - -6 Karnataka - 27.63 27.63 - 32.70 17.55 17.55 -7 Kerala 45.00 - - - - - - -8 Madhya Pradesh 23.21 35.09 35.09 - 23.76 26.33 10.22 16.119 Maharashtra 14.29 40.00 40.00 - 25.95 35.26 35.26 -
10 Orissa 28.18 21.81 9.04 12.77 25.00 - - -11 Punjab - - - - - - - -12 Rajasthan - - - - - - - -13 TamilNadu - - - - 60.00 - - -14 Uttar Pradesh - - - - - - - -15 West Bengal 26.08 - - - 38.00 86.77 57.69 29.08
Other States/UTs16 Arunachal Pradesh - - - - - - - -17 Chhattisgarh 48.00 - - - 40.00 26.67 20.00 6.6718 Goa - - - - - - - -19 Himachal Pradesh - - - - - - - -20 Jammu & Kashmir - - - - - - - -21 Jharkhand 35.56 40.00 40.00 - 25.00 23.49 18.86 4.6322 Manipur - - - - - - - -23 Meghalaya 40.00 42.86 42.86 - 30.00 34.29 34.29 -24 Mizoram - - - - - - - -25 Nagaland - - - - - - - -26 Sikkim - 95.00 80.00 15.00 - - - -27 Tripura 28.57 - - - - - - -28 Uttranchal - - - - - - - -29 A & N Islands - - - - - - - -30 Chandigarh - - - - - - - -31 D & N Haveli - - - - - - - -32 Daman & Diu - - - - - - - -33 Delhi - - - - - - - -34 Lakshadweep - - - - - - - -35 Pondicherry - - - - - - - -
ALL-INDIA 27.36 28.15 22.10 6.05 26.03 29.94 20.85 9.09
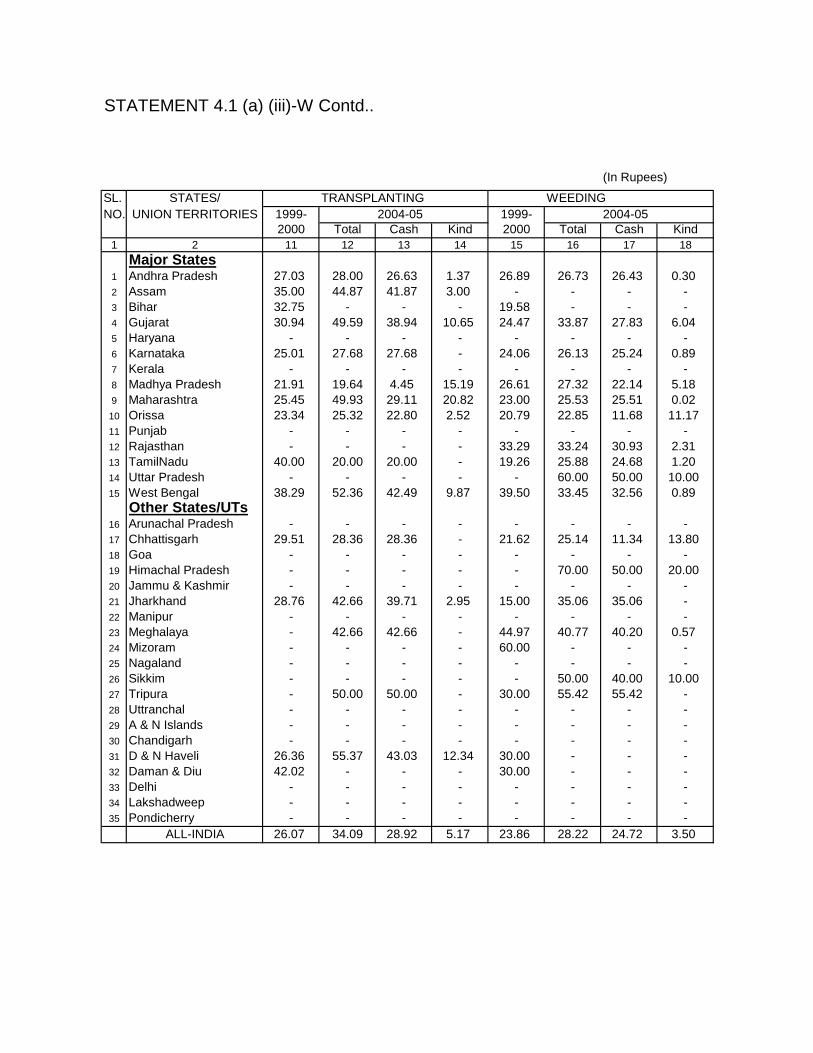
STATEMENT 4.1 (a) (iii)-W Contd..
(In Rupees)
SL. STATES/ TRANSPLANTING WEEDINGNO. UNION TERRITORIES 1999- 2004-05 1999- 2004-05
2000 Total Cash Kind 2000 Total Cash Kind1 2 11 12 13 14 15 16 17 18
Major States1 Andhra Pradesh 27.03 28.00 26.63 1.37 26.89 26.73 26.43 0.302 Assam 35.00 44.87 41.87 3.00 - - - -3 Bihar 32.75 - - - 19.58 - - -4 Gujarat 30.94 49.59 38.94 10.65 24.47 33.87 27.83 6.045 Haryana - - - - - - - -6 Karnataka 25.01 27.68 27.68 - 24.06 26.13 25.24 0.897 Kerala - - - - - - - -8 Madhya Pradesh 21.91 19.64 4.45 15.19 26.61 27.32 22.14 5.189 Maharashtra 25.45 49.93 29.11 20.82 23.00 25.53 25.51 0.02
10 Orissa 23.34 25.32 22.80 2.52 20.79 22.85 11.68 11.1711 Punjab - - - - - - - -12 Rajasthan - - - - 33.29 33.24 30.93 2.3113 TamilNadu 40.00 20.00 20.00 - 19.26 25.88 24.68 1.2014 Uttar Pradesh - - - - - 60.00 50.00 10.0015 West Bengal 38.29 52.36 42.49 9.87 39.50 33.45 32.56 0.89
Other States/UTs16 Arunachal Pradesh - - - - - - - -17 Chhattisgarh 29.51 28.36 28.36 - 21.62 25.14 11.34 13.8018 Goa - - - - - - - -19 Himachal Pradesh - - - - - 70.00 50.00 20.0020 Jammu & Kashmir - - - - - - - -21 Jharkhand 28.76 42.66 39.71 2.95 15.00 35.06 35.06 -22 Manipur - - - - - - - -23 Meghalaya - 42.66 42.66 - 44.97 40.77 40.20 0.5724 Mizoram - - - - 60.00 - - -25 Nagaland - - - - - - - -26 Sikkim - - - - - 50.00 40.00 10.0027 Tripura - 50.00 50.00 - 30.00 55.42 55.42 -28 Uttranchal - - - - - - - -29 A & N Islands - - - - - - - -30 Chandigarh - - - - - - - -31 D & N Haveli 26.36 55.37 43.03 12.34 30.00 - - -32 Daman & Diu 42.02 - - - 30.00 - - -33 Delhi - - - - - - - -34 Lakshadweep - - - - - - - -35 Pondicherry - - - - - - - -
ALL-INDIA 26.07 34.09 28.92 5.17 23.86 28.22 24.72 3.50
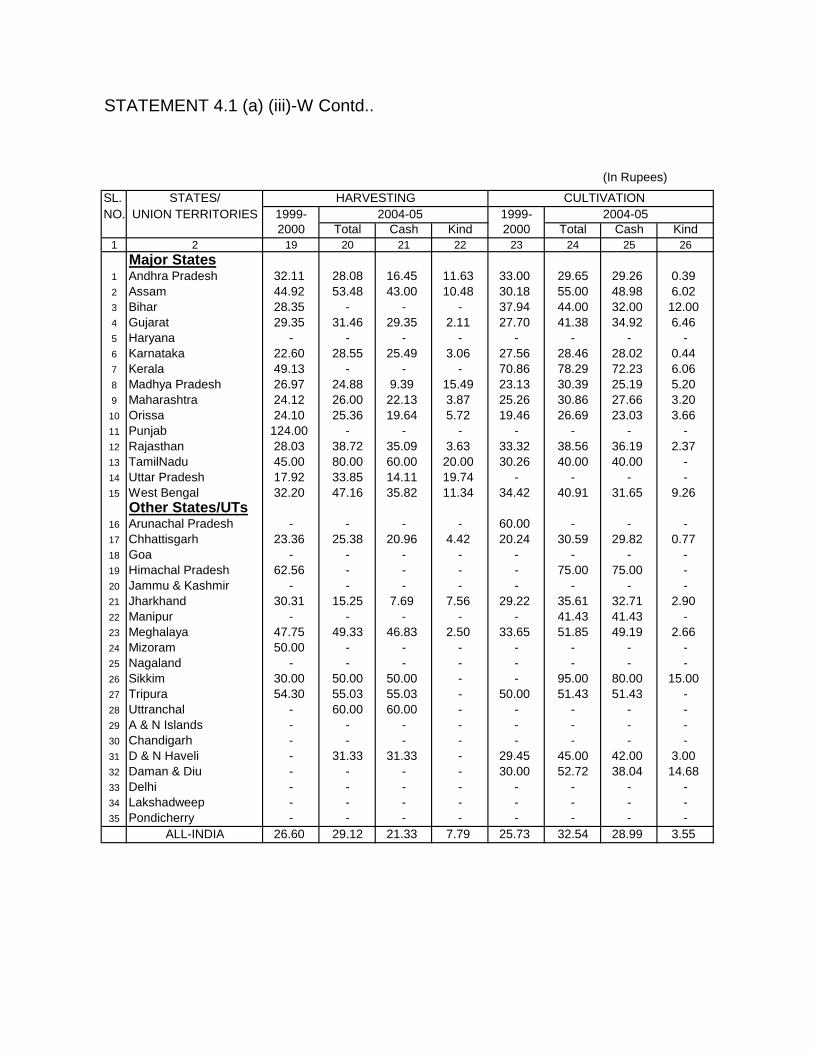
STATEMENT 4.1 (a) (iii)-W Contd..
(In Rupees)
SL. STATES/ HARVESTING CULTIVATIONNO. UNION TERRITORIES 1999- 2004-05 1999- 2004-05
2000 Total Cash Kind 2000 Total Cash Kind1 2 19 20 21 22 23 24 25 26
Major States1 Andhra Pradesh 32.11 28.08 16.45 11.63 33.00 29.65 29.26 0.392 Assam 44.92 53.48 43.00 10.48 30.18 55.00 48.98 6.023 Bihar 28.35 - - - 37.94 44.00 32.00 12.004 Gujarat 29.35 31.46 29.35 2.11 27.70 41.38 34.92 6.465 Haryana - - - - - - - -6 Karnataka 22.60 28.55 25.49 3.06 27.56 28.46 28.02 0.447 Kerala 49.13 - - - 70.86 78.29 72.23 6.068 Madhya Pradesh 26.97 24.88 9.39 15.49 23.13 30.39 25.19 5.209 Maharashtra 24.12 26.00 22.13 3.87 25.26 30.86 27.66 3.20
10 Orissa 24.10 25.36 19.64 5.72 19.46 26.69 23.03 3.6611 Punjab 124.00 - - - - - - -12 Rajasthan 28.03 38.72 35.09 3.63 33.32 38.56 36.19 2.3713 TamilNadu 45.00 80.00 60.00 20.00 30.26 40.00 40.00 -14 Uttar Pradesh 17.92 33.85 14.11 19.74 - - - -15 West Bengal 32.20 47.16 35.82 11.34 34.42 40.91 31.65 9.26
Other States/UTs16 Arunachal Pradesh - - - - 60.00 - - -17 Chhattisgarh 23.36 25.38 20.96 4.42 20.24 30.59 29.82 0.7718 Goa - - - - - - - -19 Himachal Pradesh 62.56 - - - - 75.00 75.00 -20 Jammu & Kashmir - - - - - - - -21 Jharkhand 30.31 15.25 7.69 7.56 29.22 35.61 32.71 2.9022 Manipur - - - - - 41.43 41.43 -23 Meghalaya 47.75 49.33 46.83 2.50 33.65 51.85 49.19 2.6624 Mizoram 50.00 - - - - - - -25 Nagaland - - - - - - - -26 Sikkim 30.00 50.00 50.00 - - 95.00 80.00 15.0027 Tripura 54.30 55.03 55.03 - 50.00 51.43 51.43 -28 Uttranchal - 60.00 60.00 - - - - -29 A & N Islands - - - - - - - -30 Chandigarh - - - - - - - -31 D & N Haveli - 31.33 31.33 - 29.45 45.00 42.00 3.0032 Daman & Diu - - - - 30.00 52.72 38.04 14.6833 Delhi - - - - - - - -34 Lakshadweep - - - - - - - -35 Pondicherry - - - - - - - -
ALL-INDIA 26.60 29.12 21.33 7.79 25.73 32.54 28.99 3.55

STATEMENT 4.1 (a) (iii)-W Contd..
(In Rupees)
SL. STATES/ FORESTRY PLANTATIONNO. UNION TERRITORIES 1999- 2004-05 1999- 2004-05
2000 Total Cash Kind 2000 Total Cash Kind1 2 27 28 29 30 31 32 33 34
Major States1 Andhra Pradesh 40.00 - - - - 50.00 50.00 -2 Assam - - - - 36.25 55.24 47.33 7.913 Bihar - - - - - - - -4 Gujarat 40.00 - - - 21.59 - - -5 Haryana - - - - - - - -6 Karnataka - - - - 45.38 51.52 50.00 1.527 Kerala - - - - 60.00 70.64 58.57 12.078 Madhya Pradesh 28.48 23.48 11.57 11.91 - - - -9 Maharashtra 27.78 - - - 37.65 37.67 37.67 -
10 Orissa 36.98 - - - - - - -11 Punjab - - - - - - - -12 Rajasthan - - - - - - - -13 TamilNadu 25.00 - - - - - - -14 Uttar Pradesh - - - - - - - -15 West Bengal - - - - 40.71 45.61 42.44 3.17
Other States/UTs16 Arunachal Pradesh - - - - - - - -17 Chhattisgarh 35.74 50.00 50.00 - - 60.00 60.00 -18 Goa - - - - - - - -19 Himachal Pradesh - - - - - - - -20 Jammu & Kashmir - - - - - - - -21 Jharkhand - - - - - - - -22 Manipur - - - - - - - -23 Meghalaya 16.67 - - - 40.23 42.94 42.94 -24 Mizoram - - - - - - - -25 Nagaland - - - - - - - -26 Sikkim - - - - - - - -27 Tripura - - - - 38.67 - - -28 Uttranchal - - - - - - - -29 A & N Islands - - - - - - - -30 Chandigarh - - - - - - - -31 D & N Haveli - - - - - - - -32 Daman & Diu - - - - - - - -33 Delhi - - - - - - - -34 Lakshadweep - - - - - - - -35 Pondicherry - - - - - - - -
ALL-INDIA 34.22 31.48 23.17 8.31 39.71 47.01 43.68 3.33

STATEMENT4.1(a) (iii)-W Concld..
(In Rupees)
SL. STATES/ ANIMAL HUSBANDRY FISHERIES OTHERS (AGRICULTURAL)NO. UNION TERRITORIES 1999- 2004-05 1999- 2004-05 1993-94 1999-2000
2000 Total Cash Kind 2000 Total Cash Kind Total Cash Kind1 2 35 36 37 38 39 40 41 42 43 44 45 46
Major States1 Andhra Pradesh 21.43 - - - - - - - 29.24 35.69 35.69 -2 Assam - - - - - - - - 37.67 61.57 55.00 6.573 Bihar - - - - - - - - 18.43 - - -4 Gujarat 23.47 24.86 4.86 20.00 - - - - 29.63 34.22 33.07 1.155 Haryana - - - - - - - - - - - -6 Karnataka - 25.71 25.71 - - - - - 20.18 23.06 22.78 0.287 Kerala - - - - - - - - - - - -8 Madhya Pradesh 68.57 - - - - - - - 29.06 27.04 23.90 3.149 Maharashtra - - - - - - - - 27.50 30.00 30.00 -10 Orissa - 30.00 20.00 10.00 - - - - 19.79 21.40 21.40 -11 Punjab - - - - - - - - - - - -12 Rajasthan 17.14 - - - - - - - 30.58 45.39 45.39 -13 TamilNadu - - - - - - - - 14.00 - - -14 Uttar Pradesh - 15.00 15.00 - - - - - - - - -15 West Bengal - - - - - - - - 34.74 - - -
Other States/UTs16 Arunachal Pradesh - - - - - - - - - - - -17 Chhattisgarh - - - - - - - - 24.40 30.25 24.43 5.8218 Goa - - - - - - - - - - - -19 Himachal Pradesh - - - - - - - - - - - -20 Jammu & Kashmir - - - - - - - - - - - -21 Jharkhand - 22.86 22.86 - - - - - 37.65 37.97 30.82 7.1522 Manipur - - - - - - - - 50.00 - - -23 Meghalaya - - - - - - - - 37.26 - - -24 Mizoram - - - - - - - - 145.58 - - -25 Nagaland - - - - - - - - - - - -26 Sikkim - - - - - - - - - - - -27 Tripura - - - - - - - - - - - -28 Uttranchal - - - - - - - - - - - -29 A & N Islands - - - - - - - - - - - -30 Chandigarh - - - - - - - - - - - -31 D & N Haveli - - - - - - - - 28.65 40.00 37.32 2.6832 Daman & Diu - - - - 44.76 - - - - 65.00 50.00 15.0033 Delhi - - - - - - - - - - - -34 Lakshadweep - - - - - - - - - - - -35 Pondicherry - - - - - - - - - - - -
ALL-INDIA 25.83 21.83 14.91 6.92 44.76 - - - 27.79 30.24 28.64 1.60
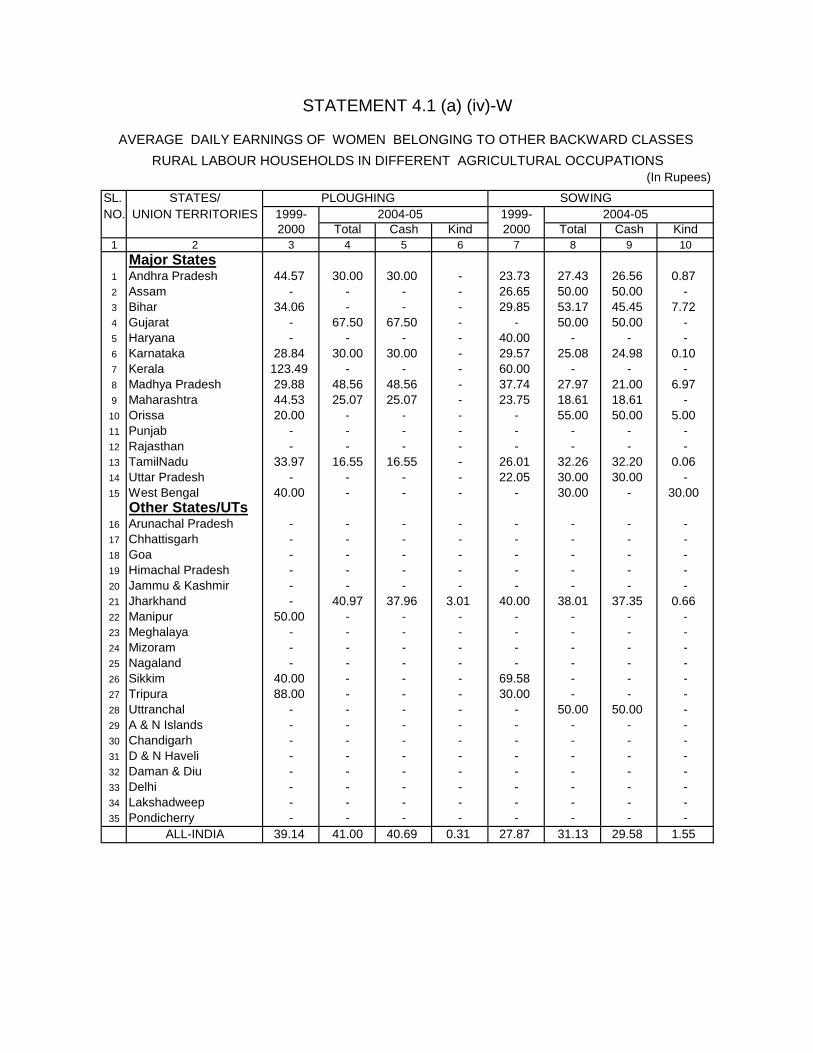
STATEMENT 4.1 (a) (iv)-W
AVERAGE DAILY EARNINGS OF WOMEN BELONGING TO OTHER BACKWARD CLASSES RURAL LABOUR HOUSEHOLDS IN DIFFERENT AGRICULTURAL OCCUPATIONS
(In Rupees)
SL. STATES/ PLOUGHING SOWINGNO. UNION TERRITORIES 1999- 2004-05 1999- 2004-05
2000 Total Cash Kind 2000 Total Cash Kind1 2 3 4 5 6 7 8 9 10
Major States1 Andhra Pradesh 44.57 30.00 30.00 - 23.73 27.43 26.56 0.872 Assam - - - - 26.65 50.00 50.00 -3 Bihar 34.06 - - - 29.85 53.17 45.45 7.724 Gujarat - 67.50 67.50 - - 50.00 50.00 -5 Haryana - - - - 40.00 - - -6 Karnataka 28.84 30.00 30.00 - 29.57 25.08 24.98 0.107 Kerala 123.49 - - - 60.00 - - -8 Madhya Pradesh 29.88 48.56 48.56 - 37.74 27.97 21.00 6.979 Maharashtra 44.53 25.07 25.07 - 23.75 18.61 18.61 -
10 Orissa 20.00 - - - - 55.00 50.00 5.0011 Punjab - - - - - - - -12 Rajasthan - - - - - - - -13 TamilNadu 33.97 16.55 16.55 - 26.01 32.26 32.20 0.0614 Uttar Pradesh - - - - 22.05 30.00 30.00 -15 West Bengal 40.00 - - - - 30.00 - 30.00
Other States/UTs16 Arunachal Pradesh - - - - - - - -17 Chhattisgarh - - - - - - - -18 Goa - - - - - - - -19 Himachal Pradesh - - - - - - - -20 Jammu & Kashmir - - - - - - - -21 Jharkhand - 40.97 37.96 3.01 40.00 38.01 37.35 0.6622 Manipur 50.00 - - - - - - -23 Meghalaya - - - - - - - -24 Mizoram - - - - - - - -25 Nagaland - - - - - - - -26 Sikkim 40.00 - - - 69.58 - - -27 Tripura 88.00 - - - 30.00 - - -28 Uttranchal - - - - - 50.00 50.00 -29 A & N Islands - - - - - - - -30 Chandigarh - - - - - - - -31 D & N Haveli - - - - - - - -32 Daman & Diu - - - - - - - -33 Delhi - - - - - - - -34 Lakshadweep - - - - - - - -35 Pondicherry - - - - - - - -
ALL-INDIA 39.14 41.00 40.69 0.31 27.87 31.13 29.58 1.55

STATEMENT 4.1 (a) (iv)-W Contd..
(In Rupees)
SL. STATES/ TRANSPLANTING WEEDINGNO. UNION TERRITORIES 1999- 2004-05 1999- 2004-05
2000 Total Cash Kind 2000 Total Cash Kind1 2 11 12 13 14 15 16 17 18
Major States1 Andhra Pradesh 25.01 36.58 34.69 1.89 23.32 28.29 27.89 0.402 Assam 32.87 49.02 49.02 - 38.34 - - -3 Bihar 30.26 37.86 26.71 11.15 31.80 30.95 20.39 10.564 Gujarat 40.00 36.48 33.49 2.99 45.33 49.43 41.05 8.385 Haryana - 79.17 58.33 20.84 - 31.17 8.32 22.856 Karnataka 31.81 35.78 34.41 1.37 23.87 26.39 25.72 0.677 Kerala 69.33 55.08 53.88 1.20 - 54.18 52.74 1.448 Madhya Pradesh 26.58 30.90 18.64 12.26 23.91 27.77 26.70 1.079 Maharashtra 27.26 29.68 29.68 - 24.37 28.81 28.62 0.19
10 Orissa 18.93 28.24 22.24 6.00 20.92 25.40 18.38 7.0211 Punjab - 62.98 53.06 9.92 - 50.00 50.00 -12 Rajasthan - - - - 45.84 34.11 33.52 0.5913 TamilNadu 32.29 34.27 31.33 2.94 26.61 31.33 30.75 0.5814 Uttar Pradesh 29.50 40.53 21.34 19.19 24.02 37.75 31.36 6.3915 West Bengal - 55.00 40.00 15.00 47.00 - - -
Other States/UTs16 Arunachal Pradesh - - - - - - - -17 Chhattisgarh 25.85 26.16 16.36 9.80 23.14 23.64 21.43 2.2118 Goa - - - - - - - -19 Himachal Pradesh - - - - - - - -20 Jammu & Kashmir - - - - - - - -21 Jharkhand 29.48 35.26 31.59 3.67 25.46 44.91 41.28 3.6322 Manipur - 60.00 60.00 - 50.00 50.00 50.00 -23 Meghalaya - - - - - - - -24 Mizoram - - - - - - - -25 Nagaland - - - - - - - -26 Sikkim - - - - 55.93 50.00 40.00 10.0027 Tripura - - - - 44.15 - - -28 Uttranchal - 50.00 50.00 - - - - -29 A & N Islands - - - - - - - -30 Chandigarh - - - - - - - -31 D & N Haveli - - - - - - - -32 Daman & Diu - - - - - - - -33 Delhi - - - - - - - -34 Lakshadweep - - - - - - - -35 Pondicherry - - - - 22.83 - - -
ALL-INDIA 28.97 34.96 30.24 4.72 25.11 30.39 28.60 1.79

STATEMENT 4.1 (a) (iv)-W Contd..
(In Rupees)
SL. STATES/ HARVESTING CULTIVATIONNO. UNION TERRITORIES 1999- 2004-05 1999- 2004-05
2000 Total Cash Kind 2000 Total Cash Kind1 2 19 20 21 22 23 24 25 26
Major States1 Andhra Pradesh 27.50 31.79 31.20 0.59 24.45 28.22 26.90 1.322 Assam - 74.27 42.00 32.27 - 53.14 45.65 7.493 Bihar 33.68 43.16 19.64 23.52 27.01 40.80 35.72 5.084 Gujarat 40.61 44.40 41.69 2.71 30.33 50.84 47.51 3.335 Haryana 41.34 81.73 36.31 45.42 55.18 50.00 50.00 -6 Karnataka 28.81 37.82 26.33 11.49 32.42 32.50 30.27 2.237 Kerala 52.76 80.98 25.35 55.63 55.45 76.26 65.37 10.898 Madhya Pradesh 26.97 27.71 21.50 6.21 23.79 25.28 19.66 5.629 Maharashtra 21.65 24.36 21.39 2.97 22.64 27.19 26.91 0.28
10 Orissa 20.98 25.43 23.60 1.83 18.66 28.03 28.03 -11 Punjab 90.00 45.48 45.48 - - 64.78 59.33 5.4512 Rajasthan 53.76 55.60 46.71 8.89 45.11 50.95 47.05 3.9013 TamilNadu 30.40 39.66 24.57 15.09 35.12 35.98 34.74 1.2414 Uttar Pradesh 33.64 34.90 22.37 12.53 30.25 42.06 33.35 8.7115 West Bengal - - - - 34.61 40.00 30.00 10.00
Other States/UTs16 Arunachal Pradesh - - - - - - - -17 Chhattisgarh 23.45 20.47 13.31 7.16 22.56 27.98 21.34 6.6418 Goa - - - - - - - -19 Himachal Pradesh 60.00 - - - 70.00 - - -20 Jammu & Kashmir - - - - - - - -21 Jharkhand 29.26 36.82 33.68 3.14 30.27 32.06 27.48 4.5822 Manipur - 60.00 60.00 - - 51.55 51.55 -23 Meghalaya - - - - - - - -24 Mizoram - - - - - - - -25 Nagaland - - - - - - - -26 Sikkim - 70.00 50.00 20.00 36.64 - - -27 Tripura - 60.00 60.00 - - 53.54 49.26 4.2828 Uttranchal 40.00 51.73 44.94 6.79 - 54.55 54.55 -29 A & N Islands - - - - - - - -30 Chandigarh - - - - - - - -31 D & N Haveli - - - - - - - -32 Daman & Diu - - - - - - - -33 Delhi - - - - - - - -34 Lakshadweep - - - - - - - -35 Pondicherry 31.72 60.00 - 60.00 38.43 39.06 27.64 11.42
ALL-INDIA 28.90 34.54 26.14 8.40 27.57 33.01 30.48 2.53

STATEMENT 4.1 (a) (iv)-W Contd..
(In Rupees)
SL. STATES/ FORESTRY PLANTATIONNO. UNION TERRITORIES 1999- 2004-05 1999- 2004-05
2000 Total Cash Kind 2000 Total Cash Kind1 2 27 28 29 30 31 32 33 34
Major States1 Andhra Pradesh - 40.00 40.00 - 15.60 31.05 29.39 1.662 Assam - - - - 43.40 53.58 44.89 8.693 Bihar - - - - 20.00 - - -4 Gujarat 25.00 - - - - - - -5 Haryana - 30.00 30.00 - - - - -6 Karnataka - - - - 45.60 54.24 51.03 3.217 Kerala - - - - 59.96 65.03 60.10 4.938 Madhya Pradesh 28.09 24.86 24.86 - - - - -9 Maharashtra - - - - - 35.00 35.00 -
10 Orissa 25.00 - - - - - - -11 Punjab - - - - - - - -12 Rajasthan - - - - - - - -13 TamilNadu 30.00 34.24 33.72 0.52 55.84 44.86 44.86 -14 Uttar Pradesh - - - - - - - -15 West Bengal - - - - 20.00 43.85 43.02 0.83
Other States/UTs16 Arunachal Pradesh - - - - - - -17 Chhattisgarh - - - - - - - -18 Goa - - - - - - - -19 Himachal Pradesh - - - - - - - -20 Jammu & Kashmir - - - - - - - -21 Jharkhand - - - - - - - -22 Manipur - 50.60 50.60 - - - - -23 Meghalaya - - - - - - - -24 Mizoram - - - - - - - -25 Nagaland - - - - - - - -26 Sikkim - - - - 30.00 - - -27 Tripura - - - - - 23.09 23.09 -28 Uttranchal - - - - - - - -29 A & N Islands - - - - - - - -30 Chandigarh - - - - - - - -31 D & N Haveli - - - - - - - -32 Daman & Diu - - - - - - - -33 Delhi - - - - - - - -34 Lakshadweep - - - - - - - -35 Pondicherry - - - - - - - -
ALL-INDIA 26.29 33.12 32.72 0.40 44.38 51.91 45.72 6.19

STATEMENT 4.1 (a) (iv)-W Concld..
(In Rupees)
SL. STATES/ ANIMAL HUSBANDRY FISHERIES OTHERS (AGRICULTURAL)NO. UNION TERRITORIES 1999- 2004-05 1999- 2004-05 1999- 2004-05
2000 Total Cash Kind 2000 Total Cash Kind 2000 Total Cash Kind1 2 35 36 37 38 39 40 41 42 43 44 45 46
Major States1 Andhra Pradesh - - - - 40.00 - - - 24.23 29.79 28.00 1.792 Assam - 40.00 30.00 10.00 - - - - 54.83 74.35 61.87 12.483 Bihar - 36.16 36.16 - - - - - 24.07 41.98 32.57 9.414 Gujarat - - - - - - - - 39.25 55.83 48.40 7.435 Haryana - - - - - - - - 57.14 - - -6 Karnataka - - - - 78.93 - - - 19.43 30.50 29.80 0.707 Kerala - - - - - 65.00 52.50 12.50 58.17 56.23 50.03 6.208 Madhya Pradesh 14.29 - - - - - - - 27.34 37.25 37.25 -9 Maharashtra - - - - - - - - 22.02 29.04 28.33 0.7110 Orissa - 20.00 - 20.00 - - - - 17.00 29.68 29.68 -11 Punjab - 60.00 - 60.00 - - - - - - - -12 Rajasthan - - - - - - - - 50.00 54.05 46.12 7.9313 TamilNadu 25.68 50.00 50.00 - - - - - 31.05 29.87 29.83 0.0414 Uttar Pradesh - - - - - - - - 36.96 38.13 33.15 4.9815 West Bengal - - - - - - - - 41.26 - - -
Other States/UTs16 Arunachal Pradesh - - - - - - - - - - - -17 Chhattisgarh 25.00 17.72 7.85 9.87 20.00 - - - 23.93 44.12 44.12 -18 Goa - - - - - - - - - 53.57 53.57 -19 Himachal Pradesh - - - - - - - - - - - -20 Jammu & Kashmir - - - - - - - - - - - -21 Jharkhand - - - - - - - - 37.42 12.86 - 12.8622 Manipur - - - - - - - - 42.86 - - -23 Meghalaya - - - - - - - - - - - -24 Mizoram - - - - - - - - - - - -25 Nagaland - - - - - - - - - - - -26 Sikkim - 50.00 50.00 - - - - - 32.00 89.29 89.29 -27 Tripura - - - - - - - - - - - -28 Uttranchal - - - - - - - - - - - -29 A & N Islands - - - - - - - - - - - -30 Chandigarh - - - - - - - - - - - -31 D & N Haveli - - - - - - - - - - - -32 Daman & Diu - - - - - 150.00 120.00 30.00 - - - -33 Delhi - - - - - - - - - - - -34 Lakshadweep - - - - - - - - - - - -35 Pondicherry - - - - - - - - 34.68 39.00 36.00 3.00
ALL-INDIA 23.27 22.06 10.21 11.85 67.77 68.39 55.19 13.20 28.16 33.74 31.65 2.09
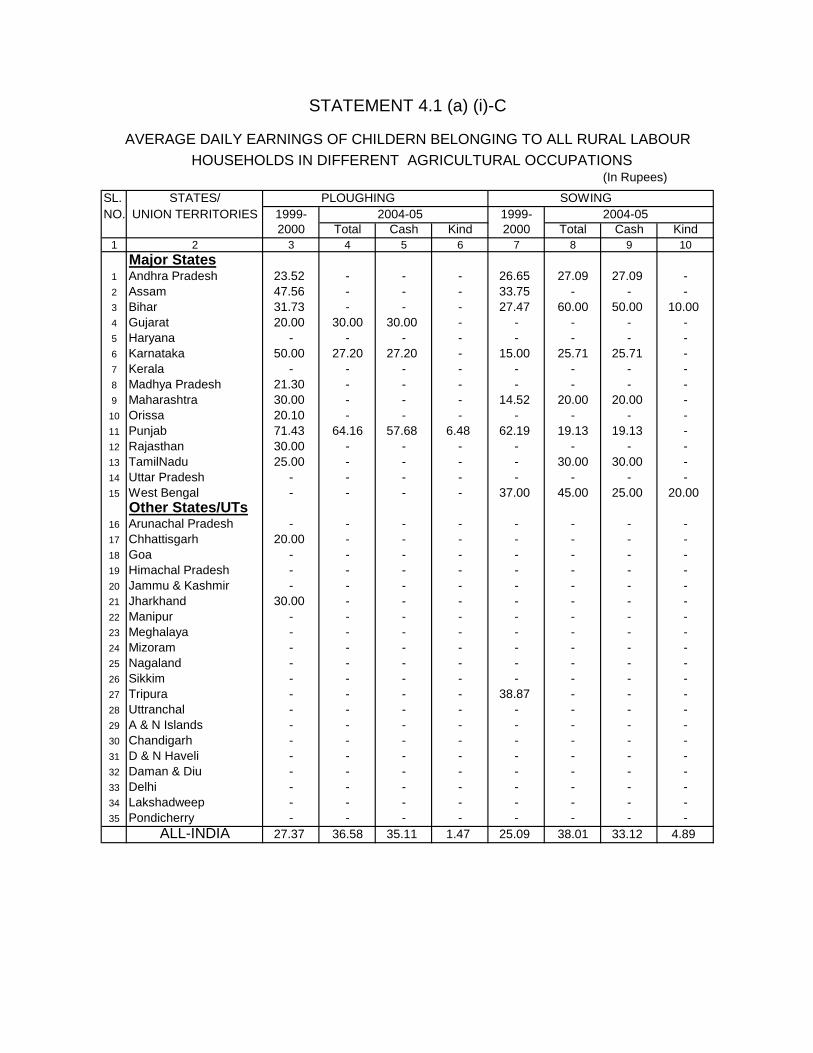
STATEMENT 4.1 (a) (i)-C
AVERAGE DAILY EARNINGS OF CHILDERN BELONGING TO ALL RURAL LABOUR HOUSEHOLDS IN DIFFERENT AGRICULTURAL OCCUPATIONS
(In Rupees)
SL. STATES/ PLOUGHING SOWINGNO. UNION TERRITORIES 1999- 2004-05 1999- 2004-05
2000 Total Cash Kind 2000 Total Cash Kind1 2 3 4 5 6 7 8 9 10
Major States1 Andhra Pradesh 23.52 - - - 26.65 27.09 27.09 -2 Assam 47.56 - - - 33.75 - - -3 Bihar 31.73 - - - 27.47 60.00 50.00 10.004 Gujarat 20.00 30.00 30.00 - - - - -5 Haryana - - - - - - - -6 Karnataka 50.00 27.20 27.20 - 15.00 25.71 25.71 -7 Kerala - - - - - - - -8 Madhya Pradesh 21.30 - - - - - - -9 Maharashtra 30.00 - - - 14.52 20.00 20.00 -
10 Orissa 20.10 - - - - - - -11 Punjab 71.43 64.16 57.68 6.48 62.19 19.13 19.13 -12 Rajasthan 30.00 - - - - - - -13 TamilNadu 25.00 - - - - 30.00 30.00 -14 Uttar Pradesh - - - - - - - -15 West Bengal - - - - 37.00 45.00 25.00 20.00
Other States/UTs16 Arunachal Pradesh - - - - - - - -17 Chhattisgarh 20.00 - - - - - - -18 Goa - - - - - - - -19 Himachal Pradesh - - - - - - - -20 Jammu & Kashmir - - - - - - - -21 Jharkhand 30.00 - - - - - - -22 Manipur - - - - - - - -23 Meghalaya - - - - - - - -24 Mizoram - - - - - - - -25 Nagaland - - - - - - - -26 Sikkim - - - - - - - -27 Tripura - - - - 38.87 - - -28 Uttranchal - - - - - - - -29 A & N Islands - - - - - - - -30 Chandigarh - - - - - - - -31 D & N Haveli - - - - - - - -32 Daman & Diu - - - - - - - -33 Delhi - - - - - - - -34 Lakshadweep - - - - - - - -35 Pondicherry - - - - - - - -
ALL-INDIA 27.37 36.58 35.11 1.47 25.09 38.01 33.12 4.89
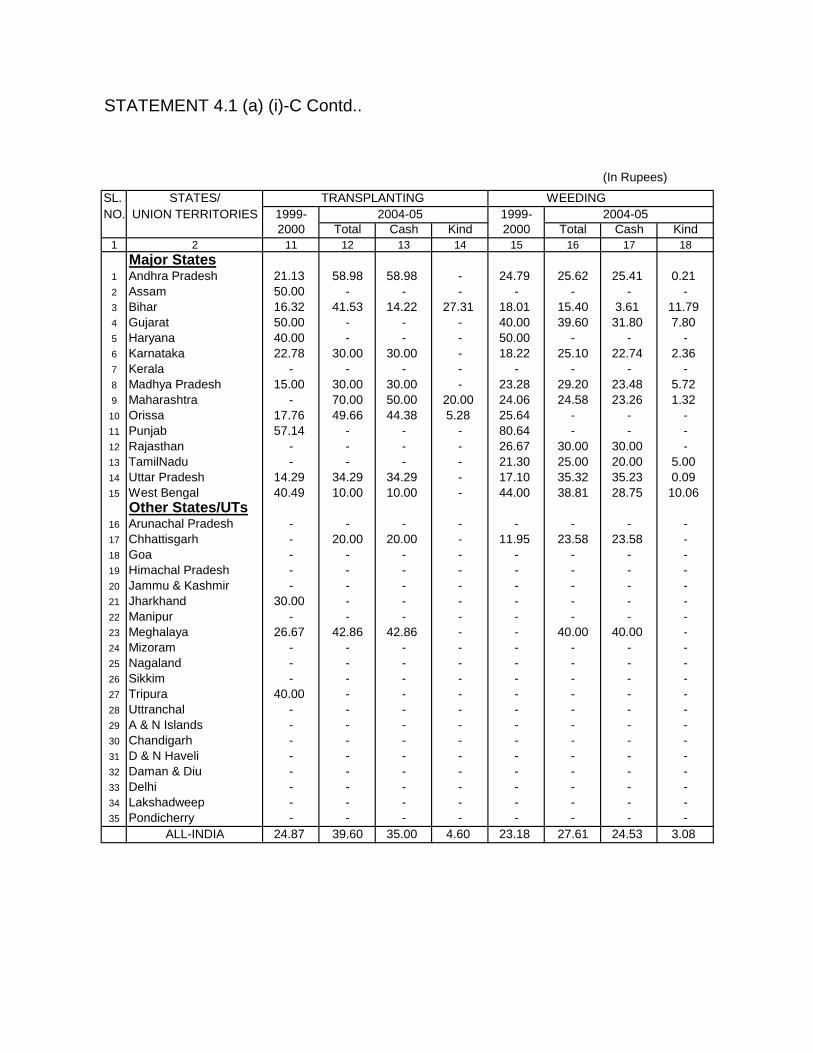
STATEMENT 4.1 (a) (i)-C Contd..
(In Rupees)
SL. STATES/ TRANSPLANTING WEEDINGNO. UNION TERRITORIES 1999- 2004-05 1999- 2004-05
2000 Total Cash Kind 2000 Total Cash Kind1 2 11 12 13 14 15 16 17 18
Major States1 Andhra Pradesh 21.13 58.98 58.98 - 24.79 25.62 25.41 0.212 Assam 50.00 - - - - - - -3 Bihar 16.32 41.53 14.22 27.31 18.01 15.40 3.61 11.794 Gujarat 50.00 - - - 40.00 39.60 31.80 7.805 Haryana 40.00 - - - 50.00 - - -6 Karnataka 22.78 30.00 30.00 - 18.22 25.10 22.74 2.367 Kerala - - - - - - - -8 Madhya Pradesh 15.00 30.00 30.00 - 23.28 29.20 23.48 5.729 Maharashtra - 70.00 50.00 20.00 24.06 24.58 23.26 1.32
10 Orissa 17.76 49.66 44.38 5.28 25.64 - - -11 Punjab 57.14 - - - 80.64 - - -12 Rajasthan - - - - 26.67 30.00 30.00 -13 TamilNadu - - - - 21.30 25.00 20.00 5.0014 Uttar Pradesh 14.29 34.29 34.29 - 17.10 35.32 35.23 0.0915 West Bengal 40.49 10.00 10.00 - 44.00 38.81 28.75 10.06
Other States/UTs16 Arunachal Pradesh - - - - - - - -17 Chhattisgarh - 20.00 20.00 - 11.95 23.58 23.58 -18 Goa - - - - - - - -19 Himachal Pradesh - - - - - - - -20 Jammu & Kashmir - - - - - - - -21 Jharkhand 30.00 - - - - - - -22 Manipur - - - - - - - -23 Meghalaya 26.67 42.86 42.86 - - 40.00 40.00 -24 Mizoram - - - - - - - -25 Nagaland - - - - - - - -26 Sikkim - - - - - - - -27 Tripura 40.00 - - - - - - -28 Uttranchal - - - - - - - -29 A & N Islands - - - - - - - -30 Chandigarh - - - - - - - -31 D & N Haveli - - - - - - - -32 Daman & Diu - - - - - - - -33 Delhi - - - - - - - -34 Lakshadweep - - - - - - - -35 Pondicherry - - - - - - - -
ALL-INDIA 24.87 39.60 35.00 4.60 23.18 27.61 24.53 3.08
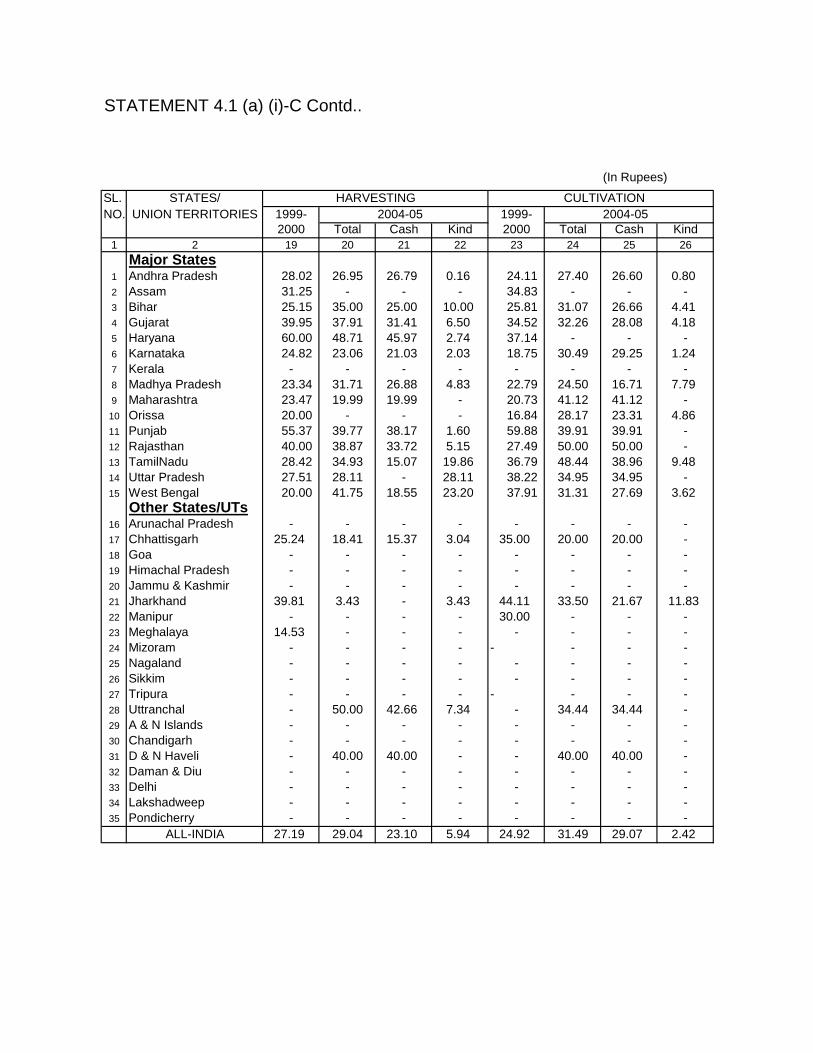
STATEMENT 4.1 (a) (i)-C Contd..
(In Rupees)
SL. STATES/ HARVESTING CULTIVATIONNO. UNION TERRITORIES 1999- 2004-05 1999- 2004-05
2000 Total Cash Kind 2000 Total Cash Kind1 2 19 20 21 22 23 24 25 26
Major States1 Andhra Pradesh 28.02 26.95 26.79 0.16 24.11 27.40 26.60 0.802 Assam 31.25 - - - 34.83 - - -3 Bihar 25.15 35.00 25.00 10.00 25.81 31.07 26.66 4.414 Gujarat 39.95 37.91 31.41 6.50 34.52 32.26 28.08 4.185 Haryana 60.00 48.71 45.97 2.74 37.14 - - -6 Karnataka 24.82 23.06 21.03 2.03 18.75 30.49 29.25 1.247 Kerala - - - - - - - -8 Madhya Pradesh 23.34 31.71 26.88 4.83 22.79 24.50 16.71 7.799 Maharashtra 23.47 19.99 19.99 - 20.73 41.12 41.12 -
10 Orissa 20.00 - - - 16.84 28.17 23.31 4.8611 Punjab 55.37 39.77 38.17 1.60 59.88 39.91 39.91 -12 Rajasthan 40.00 38.87 33.72 5.15 27.49 50.00 50.00 -13 TamilNadu 28.42 34.93 15.07 19.86 36.79 48.44 38.96 9.4814 Uttar Pradesh 27.51 28.11 - 28.11 38.22 34.95 34.95 -15 West Bengal 20.00 41.75 18.55 23.20 37.91 31.31 27.69 3.62
Other States/UTs16 Arunachal Pradesh - - - - - - - -17 Chhattisgarh 25.24 18.41 15.37 3.04 35.00 20.00 20.00 -18 Goa - - - - - - - -19 Himachal Pradesh - - - - - - - -20 Jammu & Kashmir - - - - - - - -21 Jharkhand 39.81 3.43 - 3.43 44.11 33.50 21.67 11.8322 Manipur - - - - 30.00 - - -23 Meghalaya 14.53 - - - - - - -24 Mizoram - - - - - - - -25 Nagaland - - - - - - - -26 Sikkim - - - - - - - -27 Tripura - - - - - - - -28 Uttranchal - 50.00 42.66 7.34 - 34.44 34.44 -29 A & N Islands - - - - - - - -30 Chandigarh - - - - - - - -31 D & N Haveli - 40.00 40.00 - - 40.00 40.00 -32 Daman & Diu - - - - - - - -33 Delhi - - - - - - - -34 Lakshadweep - - - - - - - -35 Pondicherry - - - - - - - -
ALL-INDIA 27.19 29.04 23.10 5.94 24.92 31.49 29.07 2.42
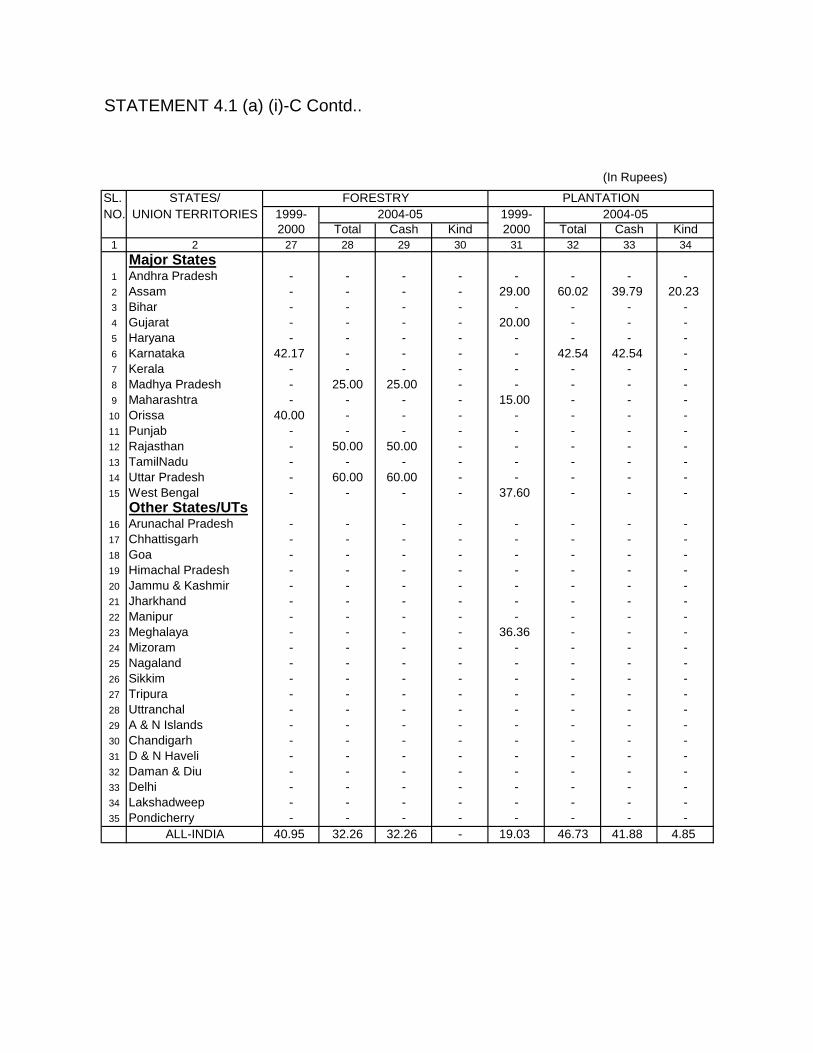
STATEMENT 4.1 (a) (i)-C Contd..
(In Rupees)
SL. STATES/ FORESTRY PLANTATIONNO. UNION TERRITORIES 1999- 2004-05 1999- 2004-05
2000 Total Cash Kind 2000 Total Cash Kind1 2 27 28 29 30 31 32 33 34
Major States1 Andhra Pradesh - - - - - - - -2 Assam - - - - 29.00 60.02 39.79 20.233 Bihar - - - - - - - -4 Gujarat - - - - 20.00 - - -5 Haryana - - - - - - - -6 Karnataka 42.17 - - - - 42.54 42.54 -7 Kerala - - - - - - - -8 Madhya Pradesh - 25.00 25.00 - - - - -9 Maharashtra - - - - 15.00 - - -
10 Orissa 40.00 - - - - - - -11 Punjab - - - - - - - -12 Rajasthan - 50.00 50.00 - - - - -13 TamilNadu - - - - - - - -14 Uttar Pradesh - 60.00 60.00 - - - - -15 West Bengal - - - - 37.60 - - -
Other States/UTs16 Arunachal Pradesh - - - - - - - -17 Chhattisgarh - - - - - - - -18 Goa - - - - - - - -19 Himachal Pradesh - - - - - - - -20 Jammu & Kashmir - - - - - - - -21 Jharkhand - - - - - - - -22 Manipur - - - - - - - -23 Meghalaya - - - - 36.36 - - -24 Mizoram - - - - - - - -25 Nagaland - - - - - - - -26 Sikkim - - - - - - - -27 Tripura - - - - - - - -28 Uttranchal - - - - - - - -29 A & N Islands - - - - - - - -30 Chandigarh - - - - - - - -31 D & N Haveli - - - - - - - -32 Daman & Diu - - - - - - - -33 Delhi - - - - - - - -34 Lakshadweep - - - - - - - -35 Pondicherry - - - - - - - -
ALL-INDIA 40.95 32.26 32.26 - 19.03 46.73 41.88 4.85

STATEMENT 4.1 (a) (i)-C Concld..
(In Rupees)
SL. STATES/ ANIMAL HUSBANDRY FISHERIES OTHERS (AGRICULTURAL)NO. UNION TERRITORIES 1999- 2004-05 1999- 2004-05 1999- 2004-05
2000 Total Cash Kind 2000 Total Cash Kind 2000 Total Cash Kind1 2 35 36 37 38 39 40 41 42 43 44 45 46
Major States1 Andhra Pradesh 22.06 27.30 23.39 3.91 41.55 - - - 19.54 25.00 25.00 -2 Assam - - - - - - - - 7.14 64.44 60.00 4.443 Bihar 27.01 20.00 10.00 10.00 - - - - 30.17 - - -4 Gujarat 15.60 - - - - - - - 20.00 20.00 20.00 -5 Haryana 21.43 - - - - - - - - - - -6 Karnataka 21.69 26.62 26.62 - - 25.00 25.00 - 17.16 - - -7 Kerala - - - - - - - - - - - -8 Madhya Pradesh 14.48 - - - - - - - 15.34 30.00 30.00 -9 Maharashtra 20.67 14.17 12.08 2.09 - - - - 19.31 26.61 26.61 -
10 Orissa 12.94 - - - - - - - - - - -11 Punjab 35.63 95.00 80.00 15.00 - - - - 45.88 - - -12 Rajasthan 14.05 - - - - - - - - 60.00 60.00 -13 TamilNadu - 21.43 21.43 - - - - - 28.72 - - -14 Uttar Pradesh 16.16 - - - - - - - 17.35 - - -15 West Bengal - 30.35 24.66 5.69 - - - - 39.16 - - -
Other States/UTs16 Arunachal Pradesh - - - - - - - - - - - -17 Chhattisgarh 17.64 15.19 4.50 10.69 - - - - 5.00 - - -18 Goa - - - - - - - - - - - -19 Himachal Pradesh - - - - - - - - - - - -20 Jammu & Kashmir - - - - - - - - - - - -21 Jharkhand 11.43 8.41 8.41 - - - - - 28.09 - - -22 Manipur - - - - - - - - 40.00 - - -23 Meghalaya - - - - - - - - - - - -24 Mizoram - - - - - - - - - - - -25 Nagaland - - - - - - - - - - - -26 Sikkim - - - - - - - - - - - -27 Tripura - - - - - - - - - - - -28 Uttranchal - - - - - - - - - - - -29 A & N Islands - - - - - - - - - - - -30 Chandigarh - - - - - - - - - - - -31 D & N Haveli - - - - - - - - - - - -32 Daman & Diu - - - - - - - - - - - -33 Delhi - - - - - - - - - - - -34 Lakshadweep - - - - - - - - - - - -35 Pondicherry - - - - - - - - - - - -
ALL-INDIA 19.72 20.76 16.70 4.06 41.55 25.00 25.00 - 21.86 27.33 27.30 0.03

STATEMENT 4.1 (a) (ii)-C
AVERAGE DAILY EARNINGS OF CHILDERN BELONGING TO SCHEDULED CASTES RURAL LABOUR HOUSEHOLDS IN DIFFERENT
AGRICULTURAL OCCUPATIONS(In Rupees)
SL. STATES/ PLOUGHING SOWINGNO. UNION TERRITORIES 1999- 2004-05 1999- 2004-05
2000 Total Cash Kind 2000 Total Cash Kind1 2 3 4 5 6 7 8 9 10
Major States1 Andhra Pradesh 20.00 - - - 55.00 - - -2 Assam - - - - - - - -3 Bihar 32.00 - - - - - - -4 Gujarat - - - - - - - -5 Haryana - - - - - - - -6 Karnataka - - - - - 25.71 25.71 -7 Kerala - - - - - - - -8 Madhya Pradesh - - - - - - - -9 Maharashtra - - - - - - - -
10 Orissa - - - - - - - -11 Punjab 71.43 57.14 42.86 14.28 62.19 19.13 19.13 -12 Rajasthan - - - - - - - -13 TamilNadu - - - - - - - -14 Uttar Pradesh - - - - - - - -15 West Bengal - - - - - 45.00 25.00 20.00
Other States/UTs16 Arunachal Pradesh - - - - - - - -17 Chhattisgarh - - - - - - - -18 Goa - - - - - - - -19 Himachal Pradesh - - - - - - - -20 Jammu & Kashmir - - - - - - - -21 Jharkhand - - - - - - - -22 Manipur - - - - - - - -23 Meghalaya - - - - - - - -24 Mizoram - - - - - - - -25 Nagaland - - - - - - - -26 Sikkim - - - - - - - -27 Tripura - - - - 40.00 - - -28 Uttranchal - - - - - - - -29 A & N Islands - - - - - - - -30 Chandigarh - - - - - - - -31 D & N Haveli - - - - - - - -32 Daman & Diu - - - - - - - -33 Delhi - - - - - - - -34 Lakshadweep - - - - - - - -35 Pondicherry - - - - - - - -
ALL-INDIA 31.22 57.14 42.86 14.28 55.54 28.73 23.54 5.19

STATEMENT 4.1 (a) (ii)-C Contd..
(In Rupees)
SL. STATES/ TRANSPLANTING WEEDINGNO. UNION TERRITORIES 1999- 2004-05 1999- 2004-05
2000 Total Cash Kind 2000 Total Cash Kind1 2 11 12 13 14 15 16 17 18
Major States1 Andhra Pradesh 24.83 - - - 24.42 22.55 22.55 -2 Assam - - - - - - - -3 Bihar - - - - 18.65 30.00 - 30.004 Gujarat 50.00 - - - - - - -5 Haryana 40.00 - - - 50.00 - - -6 Karnataka 25.00 - - - 19.67 22.98 21.42 1.567 Kerala - - - - - - - -8 Madhya Pradesh - - - - - 30.00 23.19 6.819 Maharashtra - - - - 22.12 28.74 21.26 7.48
10 Orissa 16.47 - - - - - - -11 Punjab - - - - 80.64 - - -12 Rajasthan - - - - - 30.00 30.00 -13 TamilNadu - - - - 23.59 - - -14 Uttar Pradesh - - - - 17.10 33.71 33.71 -15 West Bengal 48.06 10.00 10.00 - 44.00 42.50 25.00 17.50
Other States/UTs16 Arunachal Pradesh - - - - - - - -17 Chhattisgarh - - - - 10.29 - - -18 Goa - - - - - - - -19 Himachal Pradesh - - - - - - - -20 Jammu & Kashmir - - - - - - - -21 Jharkhand 30.00 - - - - - - -22 Manipur - - - - - - - -23 Meghalaya - - - - - - - -24 Mizoram - - - - - - - -25 Nagaland - - - - - - - -26 Sikkim - - - - - - - -27 Tripura 40.00 - - - - - - -28 Uttranchal - - - - - - - -29 A & N Islands - - - - - - - -30 Chandigarh - - - - - - - -31 D & N Haveli - - - - - - - -32 Daman & Diu - - - - - - - -33 Delhi - - - - - - - -34 Lakshadweep - - - - - - - -35 Pondicherry - - - - - - - -
ALL-INDIA 32.18 10.00 10.00 - 24.44 27.80 23.10 4.70

STATEMENT 4.1 (a) (ii)-C Contd..
(In Rupees)
SL. STATES/ HARVESTING CULTIVATIONNO. UNION TERRITORIES 1999- 2004-05 1999- 2004-05
2000 Total Cash Kind 2000 Total Cash Kind1 2 19 20 21 22 23 24 25 26
Major States1 Andhra Pradesh 27.40 20.02 20.02 - 26.51 24.14 23.61 0.532 Assam - - - - 34.83 - - -3 Bihar 22.06 35.00 25.00 10.00 25.63 25.00 25.00 -4 Gujarat 36.49 - - - 20.00 20.00 20.00 -5 Haryana 60.00 48.71 45.97 2.74 37.14 - - -6 Karnataka 26.78 10.67 - 10.67 18.25 28.43 26.83 1.607 Kerala - - - - - - - -8 Madhya Pradesh 25.38 30.00 20.00 10.00 25.00 20.00 20.00 -9 Maharashtra 35.81 20.07 20.07 - 26.05 28.38 28.38 -
10 Orissa - - - - 10.00 14.26 8.52 5.7411 Punjab 28.57 45.00 40.00 5.00 51.30 34.76 34.76 -12 Rajasthan - 38.87 33.72 5.15 - - - -13 TamilNadu 28.42 50.00 - 50.00 30.18 50.00 40.00 10.0014 Uttar Pradesh 26.97 29.73 - 29.73 25.00 - - -15 West Bengal - 20.00 - 20.00 41.66 27.40 25.00 2.40
Other States/UTs16 Arunachal Pradesh - - - - - - - -17 Chhattisgarh - - - - 35.00 - - -18 Goa - - - - - - - -19 Himachal Pradesh - - - - - - - -20 Jammu & Kashmir - - - - - - - -21 Jharkhand 55.43 - - - - 17.14 - 17.1422 Manipur - - - - - - - -23 Meghalaya - - - - - - - -24 Mizoram - - - - - - - -25 Nagaland - - - - - - - -26 Sikkim - - - - - - - -27 Tripura - - - - - - - -28 Uttranchal - - - - - 34.44 34.44 -29 A & N Islands - - - - - - - -30 Chandigarh - - - - - - - -31 D & N Haveli - - - - - - - -32 Daman & Diu - - - - - - - -33 Delhi - - - - - - - -34 Lakshadweep - - - - - - - -35 Pondicherry - - - - - - - -
ALL-INDIA 28.40 31.14 22.13 9.01 26.70 26.05 24.63 1.42

STATEMENT 4.1 (a) (ii)-C Contd..
(In Rupees)
SL. STATES/ FORESTRY PLANTATIONNO. UNION TERRITORIES 1999- 2004-05 1999- 2004-05
2000 Total Cash Kind 2000 Total Cash Kind1 2 27 28 29 30 31 32 33 34
Major States1 Andhra Pradesh - - - - - - - -2 Assam - - - - - - - -3 Bihar - - - - - - - -4 Gujarat - - - - - - - -5 Haryana - - - - - - - -6 Karnataka 30.00 - - - - 40.00 40.00 -7 Kerala - - - - - - - -8 Madhya Pradesh - 30.00 30.00 - - - - -9 Maharashtra - - - - - - - -
10 Orissa - - - - - - - -11 Punjab - - - - - - - -12 Rajasthan - - - - - - - -13 TamilNadu - - - - - - - -14 Uttar Pradesh - - - - - - - -15 West Bengal - - - - 35.00 - - -
Other States/UTs16 Arunachal Pradesh - - - - - - - -17 Chhattisgarh - - - - - - - -18 Goa - - - - - - - -19 Himachal Pradesh - - - - - - - -20 Jammu & Kashmir - - - - - - - -21 Jharkhand - - - - - - - -22 Manipur - - - - - - - -23 Meghalaya - - - - - - - -24 Mizoram - - - - - - - -25 Nagaland - - - - - - - -26 Sikkim - - - - - - - -27 Tripura - - - - - - - -28 Uttranchal - - - - - - - -29 A & N Islands - - - - - - - -30 Chandigarh - - - - - - - -31 D & N Haveli - - - - - - - -32 Daman & Diu - - - - - - - -33 Delhi - - - - - - - -34 Lakshadweep - - - - - - - -35 Pondicherry - - - - - - - -
ALL-INDIA 30.00 30.00 30.00 - 35.00 40.00 40.00 -
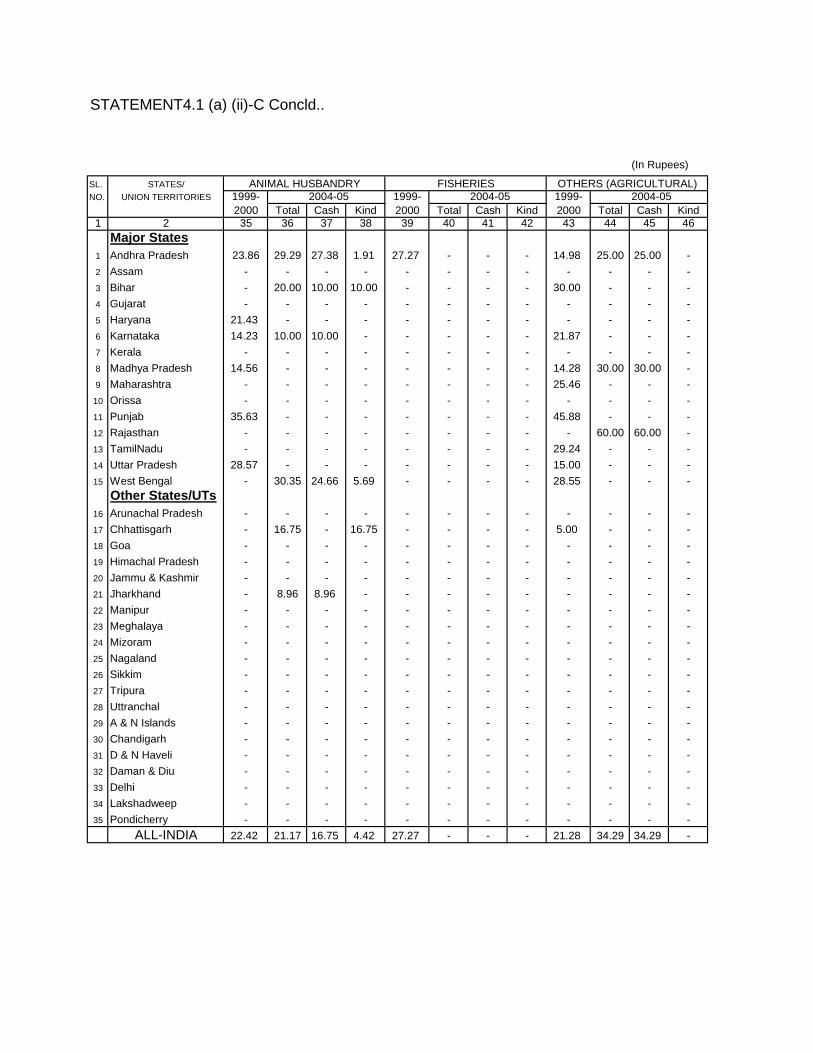
STATEMENT4.1 (a) (ii)-C Concld..
(In Rupees)
SL. STATES/ ANIMAL HUSBANDRY FISHERIES OTHERS (AGRICULTURAL)NO. UNION TERRITORIES 1999- 2004-05 1999- 2004-05 1999- 2004-05
2000 Total Cash Kind 2000 Total Cash Kind 2000 Total Cash Kind1 2 35 36 37 38 39 40 41 42 43 44 45 46
Major States1 Andhra Pradesh 23.86 29.29 27.38 1.91 27.27 - - - 14.98 25.00 25.00 -2 Assam - - - - - - - - - - - -3 Bihar - 20.00 10.00 10.00 - - - - 30.00 - - -4 Gujarat - - - - - - - - - - - -5 Haryana 21.43 - - - - - - - - - - -6 Karnataka 14.23 10.00 10.00 - - - - - 21.87 - - -7 Kerala - - - - - - - - - - - -8 Madhya Pradesh 14.56 - - - - - - - 14.28 30.00 30.00 -9 Maharashtra - - - - - - - - 25.46 - - -10 Orissa - - - - - - - - - - - -11 Punjab 35.63 - - - - - - - 45.88 - - -12 Rajasthan - - - - - - - - - 60.00 60.00 -13 TamilNadu - - - - - - - - 29.24 - - -14 Uttar Pradesh 28.57 - - - - - - - 15.00 - - -15 West Bengal - 30.35 24.66 5.69 - - - - 28.55 - - -
Other States/UTs16 Arunachal Pradesh - - - - - - - - - - - -17 Chhattisgarh - 16.75 - 16.75 - - - - 5.00 - - -18 Goa - - - - - - - - - - - -19 Himachal Pradesh - - - - - - - - - - - -20 Jammu & Kashmir - - - - - - - - - - - -21 Jharkhand - 8.96 8.96 - - - - - - - - -22 Manipur - - - - - - - - - - - -23 Meghalaya - - - - - - - - - - - -24 Mizoram - - - - - - - - - - - -25 Nagaland - - - - - - - - - - - -26 Sikkim - - - - - - - - - - - -27 Tripura - - - - - - - - - - - -28 Uttranchal - - - - - - - - - - - -29 A & N Islands - - - - - - - - - - - -30 Chandigarh - - - - - - - - - - - -31 D & N Haveli - - - - - - - - - - - -32 Daman & Diu - - - - - - - - - - - -33 Delhi - - - - - - - - - - - -34 Lakshadweep - - - - - - - - - - - -35 Pondicherry - - - - - - - - - - - -
ALL-INDIA 22.42 21.17 16.75 4.42 27.27 - - - 21.28 34.29 34.29 -
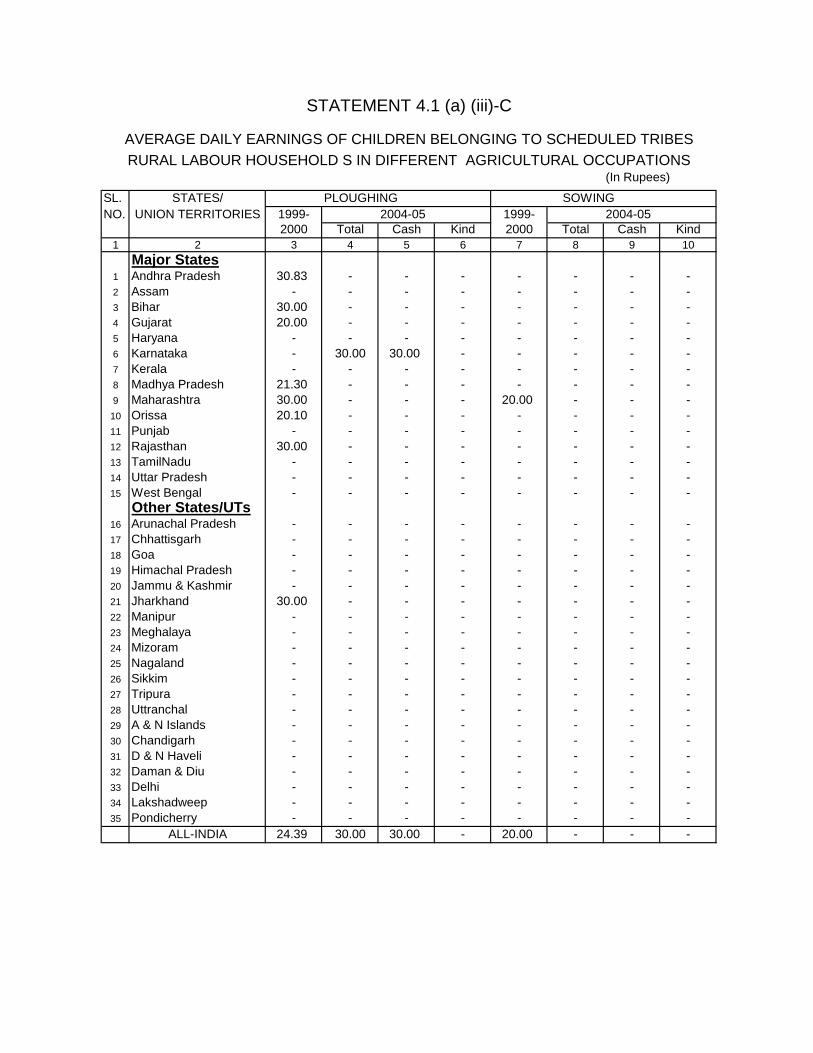
STATEMENT 4.1 (a) (iii)-C
AVERAGE DAILY EARNINGS OF CHILDREN BELONGING TO SCHEDULED TRIBESRURAL LABOUR HOUSEHOLD S IN DIFFERENT AGRICULTURAL OCCUPATIONS
(In Rupees)
SL. STATES/ PLOUGHING SOWINGNO. UNION TERRITORIES 1999- 2004-05 1999- 2004-05
2000 Total Cash Kind 2000 Total Cash Kind1 2 3 4 5 6 7 8 9 10
Major States1 Andhra Pradesh 30.83 - - - - - - -2 Assam - - - - - - - -3 Bihar 30.00 - - - - - - -4 Gujarat 20.00 - - - - - - -5 Haryana - - - - - - - -6 Karnataka - 30.00 30.00 - - - - -7 Kerala - - - - - - - -8 Madhya Pradesh 21.30 - - - - - - -9 Maharashtra 30.00 - - - 20.00 - - -
10 Orissa 20.10 - - - - - - -11 Punjab - - - - - - - -12 Rajasthan 30.00 - - - - - - -13 TamilNadu - - - - - - - -14 Uttar Pradesh - - - - - - - -15 West Bengal - - - - - - - -
Other States/UTs16 Arunachal Pradesh - - - - - - - -17 Chhattisgarh - - - - - - - -18 Goa - - - - - - - -19 Himachal Pradesh - - - - - - - -20 Jammu & Kashmir - - - - - - - -21 Jharkhand 30.00 - - - - - - -22 Manipur - - - - - - - -23 Meghalaya - - - - - - - -24 Mizoram - - - - - - - -25 Nagaland - - - - - - - -26 Sikkim - - - - - - - -27 Tripura - - - - - - - -28 Uttranchal - - - - - - - -29 A & N Islands - - - - - - - -30 Chandigarh - - - - - - - -31 D & N Haveli - - - - - - - -32 Daman & Diu - - - - - - - -33 Delhi - - - - - - - -34 Lakshadweep - - - - - - - -35 Pondicherry - - - - - - - -
ALL-INDIA 24.39 30.00 30.00 - 20.00 - - -

STATEMENT 4.1 (a) (iii)-C Contd..
(In Rupees)
SL. STATES/ TRANSPLANTING WEEDINGNO. UNION TERRITORIES 1999- 2004-05 1999- 2004-05
2000 Total Cash Kind 2000 Total Cash Kind1 2 11 12 13 14 15 16 17 18
Major States1 Andhra Pradesh 39.49 - - - 29.30 20.00 20.00 -2 Assam - - - - - - - -3 Bihar - - - - - - - -4 Gujarat - - - - - 38.33 23.08 15.255 Haryana - - - - - - - -6 Karnataka - 30.00 30.00 - 18.30 26.42 16.27 10.157 Kerala - - - - - - - -8 Madhya Pradesh 15.00 30.00 30.00 - 25.00 25.00 25.00 -9 Maharashtra - 70.00 50.00 20.00 28.90 24.28 24.28 -
10 Orissa 16.19 49.66 44.38 5.28 25.64 - - -11 Punjab - - - - - - - -12 Rajasthan - - - - - - - -13 TamilNadu - - - - - - - -14 Uttar Pradesh - - - - - - - -15 West Bengal 34.36 - - - - - - -
Other States/UTs16 Arunachal Pradesh - - - - - - - -17 Chhattisgarh - - - - 12.00 20.00 20.00 -18 Goa - - - - - - - -19 Himachal Pradesh - - - - - - - -20 Jammu & Kashmir - - - - - - - -21 Jharkhand - - - - - - - -22 Manipur - - - - - - - -23 Meghalaya 26.67 42.86 42.86 - - 40.00 40.00 -24 Mizoram - - - - - - - -25 Nagaland - - - - - - - -26 Sikkim - - - - - - - -27 Tripura - - - - - - - -28 Uttranchal - - - - - - - -29 A & N Islands - - - - - - - -30 Chandigarh - - - - - - - -31 D & N Haveli - - - - - - - -32 Daman & Diu - - - - - - - -33 Delhi - - - - - - - -34 Lakshadweep - - - - - - - -35 Pondicherry - - - - - - - -
ALL-INDIA 30.26 40.95 37.21 3.74 24.55 28.16 21.72 6.44

STATEMENT 4.1 (a) (iii)-C Contd..
(In Rupees)
SL. STATES/ HARVESTING CULTIVATIONNO. UNION TERRITORIES 1999- 2004-05 1999- 2004-05
2000 Total Cash Kind 2000 Total Cash Kind1 2 19 20 21 22 23 24 25 26
Major States1 Andhra Pradesh - - - - 20.79 27.99 25.74 2.252 Assam - - - - - - - -3 Bihar - - - - - - - -4 Gujarat 20.00 30.00 30.00 - - 40.00 25.00 15.005 Haryana - - - - - - - -6 Karnataka 25.00 24.72 23.00 1.72 24.48 - - -7 Kerala - - - - - - - -8 Madhya Pradesh 23.32 - - - 22.05 25.00 13.21 11.799 Maharashtra 23.40 21.78 21.78 - 20.00 40.74 40.74 -
10 Orissa - - - - 13.25 32.53 27.94 4.5911 Punjab - - - - - - - -12 Rajasthan 40.00 - - - - - - -13 TamilNadu - - - - - - - -14 Uttar Pradesh - - - - - - - -15 West Bengal 20.00 44.99 20.99 24.00 - - - -
Other States/UTs16 Arunachal Pradesh - - - - - - - -17 Chhattisgarh 25.24 18.41 15.37 3.04 35.00 20.00 20.00 -18 Goa - - - - - - - -19 Himachal Pradesh - - - - - - - -20 Jammu & Kashmir - - - - - - - -21 Jharkhand 38.96 - - - 50.00 - - -22 Manipur - - - - - - - -23 Meghalaya 12.50 - - - - - - -24 Mizoram - - - - - - - -25 Nagaland - - - - - - - -26 Sikkim - - - - - - - -27 Tripura - - - - - - - -28 Uttranchal - - - - - - - -29 A & N Islands - - - - - - - -30 Chandigarh - - - - - - - -31 D & N Haveli - 40.00 40.00 - - 40.00 40.00 -32 Daman & Diu - - - - - - - -33 Delhi - - - - - - - -34 Lakshadweep - - - - - - - -35 Pondicherry - - - - - - - -
ALL-INDIA 25.25 28.43 21.78 6.65 21.53 30.75 24.84 5.91

STATEMENT 4.1 (a) (iii)-C Contd..
(In Rupees)
SL. STATES/ FORESTRY PLANTATIONNO. UNION TERRITORIES 1999- 2004-05 1999- 2004-05
2000 Total Cash Kind 2000 Total Cash Kind1 2 27 28 29 30 31 32 33 34
Major States1 Andhra Pradesh - - - - - - - -2 Assam - - - - 29.00 - - -3 Bihar - - - - - - - -4 Gujarat - - - - 20.00 - - -5 Haryana - - - - - - - -6 Karnataka - - - - - - - -7 Kerala - - - - - - - -8 Madhya Pradesh - 20.00 20.00 - - - - -9 Maharashtra - - - - 15.00 - - -
10 Orissa 40.00 - - - - - - -11 Punjab - - - - - - - -12 Rajasthan - - - - - - - -13 TamilNadu - - - - - - - -14 Uttar Pradesh - - - - - - - -15 West Bengal - - - - 42.33 - - -
Other States/UTs16 Arunachal Pradesh - - - - - - - -17 Chhattisgarh - - - - - - - -18 Goa - - - - - - - -19 Himachal Pradesh - - - - - - - -20 Jammu & Kashmir - - - - - - - -21 Jharkhand - - - - - - - -22 Manipur - - - - - - - -23 Meghalaya - - - - 36.36 - - -24 Mizoram - - - - - - - -25 Nagaland - - - - - - - -26 Sikkim - - - - - - - -27 Tripura - - - - - - - -28 Uttranchal - - - - - - - -29 A & N Islands - - - - - - - -30 Chandigarh - - - - - - - -31 D & N Haveli - - - - - - - -32 Daman & Diu - - - - - - - -33 Delhi - - - - - - - -34 Lakshadweep - - - - - - - -35 Pondicherry - - - - - - - -
ALL-INDIA 40.00 20.00 20.00 - 18.06 - - -

STATEMENT 4.1 (a) (iii)-C Concld..
(In Rupees)
SL. STATES/ ANIMAL HUSBANDRY FISHERIES OTHERS (AGRICULTURAL)NO.UNION TERRITORIES 1999- 2004-05 1999- 2004-05 1993-94 1999-2000
2000 Total Cash Kind 2000 Total Cash Kind Total Cash Kind1 2 35 36 37 38 39 40 41 42 43 44 45 46
Major States1 Andhra Pradesh - - - - - - - - 26.97 - - -2 Assam - - - - - - - - - - - -3 Bihar - - - - - - - - - - - -4 Gujarat 12.86 - - - - - - - 20.00 20.00 20.00 -5 Haryana - - - - - - - - - - - -6 Karnataka - 40.00 40.00 - - - - - 9.81 - - -7 Kerala - - - - - - - - - - - -8 Madhya Pradesh 20.00 - - - - - - - 15.93 - - -9 Maharashtra 16.17 15.00 10.00 5.00 - - - - 16.34 - - -10 Orissa 11.43 - - - - - - - - - - -11 Punjab - - - - - - - - - - - -12 Rajasthan 14.05 - - - - - - - - - - -13 TamilNadu - - - - - - - - - - - -14 Uttar Pradesh - - - - - - - - - - - -15 West Bengal - - - - - - - - 43.80 - - -
Other States/UTs16 Arunachal Pradesh - - - - - - - - - - - -17 Chhattisgarh - 15.00 15.00 - - - - - - - - -18 Goa - - - - - - - - - - - -19 Himachal Pradesh - - - - - - - - - - - -20 Jammu & Kashmir - - - - - - - - - - - -21 Jharkhand 11.43 - - - - - - - - - - -22 Manipur - - - - - - - - - - - -23 Meghalaya - - - - - - - - - - - -24 Mizoram - - - - - - - - - - - -25 Nagaland - - - - - - - - - - - -26 Sikkim - - - - - - - - - - - -27 Tripura - - - - - - - - - - - -28 Uttranchal - - - - - - - - - - - -29 A & N Islands - - - - - - - - - - - -30 Chandigarh - - - - - - - - - - - -31 D & N Haveli - - - - - - - - - - - -32 Daman & Diu - - - - - - - - - - - -33 Delhi - - - - - - - - - - - -34 Lakshadweep - - - - - - - - - - - -35 Pondicherry - - - - - - - - - - - -
ALL-INDIA 15.08 25.20 23.39 1.81 - - - - 19.70 20.00 20.00 -

STATEMENT 4.1 (a) (iv)-C
AVERAGE DAILY EARNINGS OF CHILDREN BELONGING TO OTHER BACKWARD CLASSES RURAL LABOUR HOUSEHOLDS IN DIFFERENT AGRICULTURAL OCCUPATIONS
(In Rupees)
SL. STATES/ PLOUGHING SOWINGNO. UNION TERRITORIES 1999- 2004-05 1999- 2004-05
2000 Total Cash Kind 2000 Total Cash Kind1 2 3 4 5 6 7 8 9 10
Major States1 Andhra Pradesh - - - - 15.00 27.09 27.09 -2 Assam - - - - 17.14 - - -3 Bihar - - - - 27.47 60.00 50.00 10.004 Gujarat - 30.00 30.00 - - - - -5 Haryana - - - - - - - -6 Karnataka 50.00 25.00 25.00 - - - - -7 Kerala - - - - - - - -8 Madhya Pradesh - - - - - - - -9 Maharashtra - - - - 10.00 - - -
10 Orissa - - - - - - - -11 Punjab - 70.00 70.00 - - - - -12 Rajasthan - - - - - - - -13 TamilNadu 25.00 - - - - 30.00 30.00 -14 Uttar Pradesh - - - - - - - -15 West Bengal - - - - - - - -
Other States/UTs16 Arunachal Pradesh - - - - - - - -17 Chhattisgarh 20.00 - - - - - - -18 Goa - - - - - - - -19 Himachal Pradesh - - - - - - - -20 Jammu & Kashmir - - - - - - - -21 Jharkhand - - - - - - - -22 Manipur - - - - - - - -23 Meghalaya - - - - - - - -24 Mizoram - - - - - - - -25 Nagaland - - - - - - - -26 Sikkim - - - - - - - -27 Tripura - - - - 35.00 - - -28 Uttranchal - - - - - - - -29 A & N Islands - - - - - - - -30 Chandigarh - - - - - - - -31 D & N Haveli - - - - - - - -32 Daman & Diu - - - - - - - -33 Delhi - - - - - - - -34 Lakshadweep - - - - - - - -35 Pondicherry - - - - - - - -
ALL-INDIA 25.00 35.30 35.30 - 21.34 43.20 38.42 4.78

STATEMENT 4.1 (a) (iv)-C Contd..
(In Rupees)
SL. STATES/ TRANSPLANTING WEEDINGNO. UNION TERRITORIES 1999- 2004-05 1999- 2004-05
2000 Total Cash Kind 2000 Total Cash Kind1 2 11 12 13 14 15 16 17 18
Major States1 Andhra Pradesh 15.36 58.98 58.98 - 15.36 24.68 24.23 0.452 Assam - - - - - - - -3 Bihar 16.32 44.44 22.22 22.22 16.32 11.16 4.65 6.514 Gujarat - - - - - 37.45 34.48 2.975 Haryana - - - - - - - -6 Karnataka 19.08 - - - 19.08 27.11 25.92 1.197 Kerala - - - - - - - -8 Madhya Pradesh - - - - - - - -9 Maharashtra - - - - - 22.03 22.03 -
10 Orissa - - - - - - - -11 Punjab - - - - - - - -12 Rajasthan - - - - - - - -13 TamilNadu - - - - - 25.00 20.00 5.0014 Uttar Pradesh 14.29 34.29 34.29 - 14.29 40.00 39.67 0.3315 West Bengal - - - - - - - -
Other States/UTs16 Arunachal Pradesh - - - - - - - -17 Chhattisgarh - 20.00 20.00 - - 25.00 25.00 -18 Goa - - - - - - - -19 Himachal Pradesh - - - - - - - -20 Jammu & Kashmir - - - - - - - -21 Jharkhand - - - - - - - -22 Manipur - - - - - - - -23 Meghalaya - - - - - - - -24 Mizoram - - - - - - - -25 Nagaland - - - - - - - -26 Sikkim - - - - - - - -27 Tripura - - - - - - - -28 Uttranchal - - - - - - - -29 A & N Islands - - - - - - - -30 Chandigarh - - - - - - - -31 D & N Haveli - - - - - - - -32 Daman & Diu - - - - - - - -33 Delhi - - - - - - - -34 Lakshadweep - - - - - - - -35 Pondicherry - - - - - - - -
ALL-INDIA 15.66 42.76 40.96 1.80 19.95 26.13 24.32 1.81
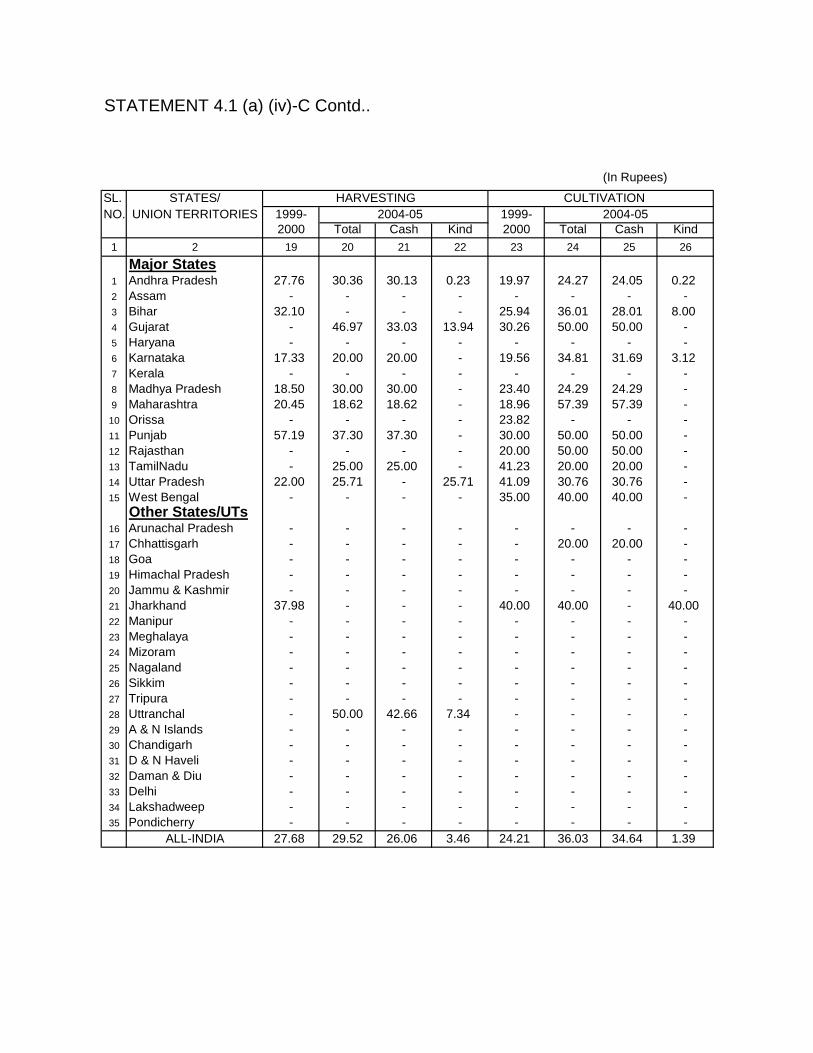
STATEMENT 4.1 (a) (iv)-C Contd..
(In Rupees)
SL. STATES/ HARVESTING CULTIVATIONNO. UNION TERRITORIES 1999- 2004-05 1999- 2004-05
2000 Total Cash Kind 2000 Total Cash Kind1 2 19 20 21 22 23 24 25 26
Major States1 Andhra Pradesh 27.76 30.36 30.13 0.23 19.97 24.27 24.05 0.222 Assam - - - - - - - -3 Bihar 32.10 - - - 25.94 36.01 28.01 8.004 Gujarat - 46.97 33.03 13.94 30.26 50.00 50.00 -5 Haryana - - - - - - - -6 Karnataka 17.33 20.00 20.00 - 19.56 34.81 31.69 3.127 Kerala - - - - - - - -8 Madhya Pradesh 18.50 30.00 30.00 - 23.40 24.29 24.29 -9 Maharashtra 20.45 18.62 18.62 - 18.96 57.39 57.39 -
10 Orissa - - - - 23.82 - - -11 Punjab 57.19 37.30 37.30 - 30.00 50.00 50.00 -12 Rajasthan - - - - 20.00 50.00 50.00 -13 TamilNadu - 25.00 25.00 - 41.23 20.00 20.00 -14 Uttar Pradesh 22.00 25.71 - 25.71 41.09 30.76 30.76 -15 West Bengal - - - - 35.00 40.00 40.00 -
Other States/UTs16 Arunachal Pradesh - - - - - - - -17 Chhattisgarh - - - - - 20.00 20.00 -18 Goa - - - - - - - -19 Himachal Pradesh - - - - - - - -20 Jammu & Kashmir - - - - - - - -21 Jharkhand 37.98 - - - 40.00 40.00 - 40.0022 Manipur - - - - - - - -23 Meghalaya - - - - - - - -24 Mizoram - - - - - - - -25 Nagaland - - - - - - - -26 Sikkim - - - - - - - -27 Tripura - - - - - - - -28 Uttranchal - 50.00 42.66 7.34 - - - -29 A & N Islands - - - - - - - -30 Chandigarh - - - - - - - -31 D & N Haveli - - - - - - - -32 Daman & Diu - - - - - - - -33 Delhi - - - - - - - -34 Lakshadweep - - - - - - - -35 Pondicherry - - - - - - - -
ALL-INDIA 27.68 29.52 26.06 3.46 24.21 36.03 34.64 1.39

STATEMENT 4.1 (a) (iv)-C Contd..
(In Rupees)
SL. STATES/ FORESTRY PLANTATIONNO. UNION TERRITORIES 1999- 2004-05 1999- 2004-05
2000 Total Cash Kind 2000 Total Cash Kind1 2 27 28 29 30 31 32 33 34
Major States1 Andhra Pradesh - - - - - - - -2 Assam - - - - - 60.02 39.79 20.233 Bihar - - - - - - - -4 Gujarat - - - - - - - -5 Haryana - - - - - - - -6 Karnataka 42.50 - - - - - - -7 Kerala - - - - - - - -8 Madhya Pradesh - - - - - - - -9 Maharashtra - - - - - - - -
10 Orissa - - - - - - - -11 Punjab - - - - - - - -12 Rajasthan - 50.00 50.00 - - - - -13 TamilNadu - - - - - - - -14 Uttar Pradesh - 60.00 60.00 - - - - -15 West Bengal - - - - - - - -
Other States/UTs16 Arunachal Pradesh - - - - - - - -17 Chhattisgarh - - - - - - - -18 Goa - - - - - - - -19 Himachal Pradesh - - - - - - - -20 Jammu & Kashmir - - - - - - - -21 Jharkhand - - - - - - - -22 Manipur - - - - - - - -23 Meghalaya - - - - - - - -24 Mizoram - - - - - - - -25 Nagaland - - - - - - - -26 Sikkim - - - - - - - -27 Tripura - - - - - - - -28 Uttranchal - - - - - - - -29 A & N Islands - - - - - - - -30 Chandigarh - - - - - - - -31 D & N Haveli - - - - - - - -32 Daman & Diu - - - - - - - -33 Delhi - - - - - - - -34 Lakshadweep - - - - - - - -35 Pondicherry - - - - - - - -
ALL-INDIA 42.50 54.26 54.26 - - 60.02 39.79 20.23
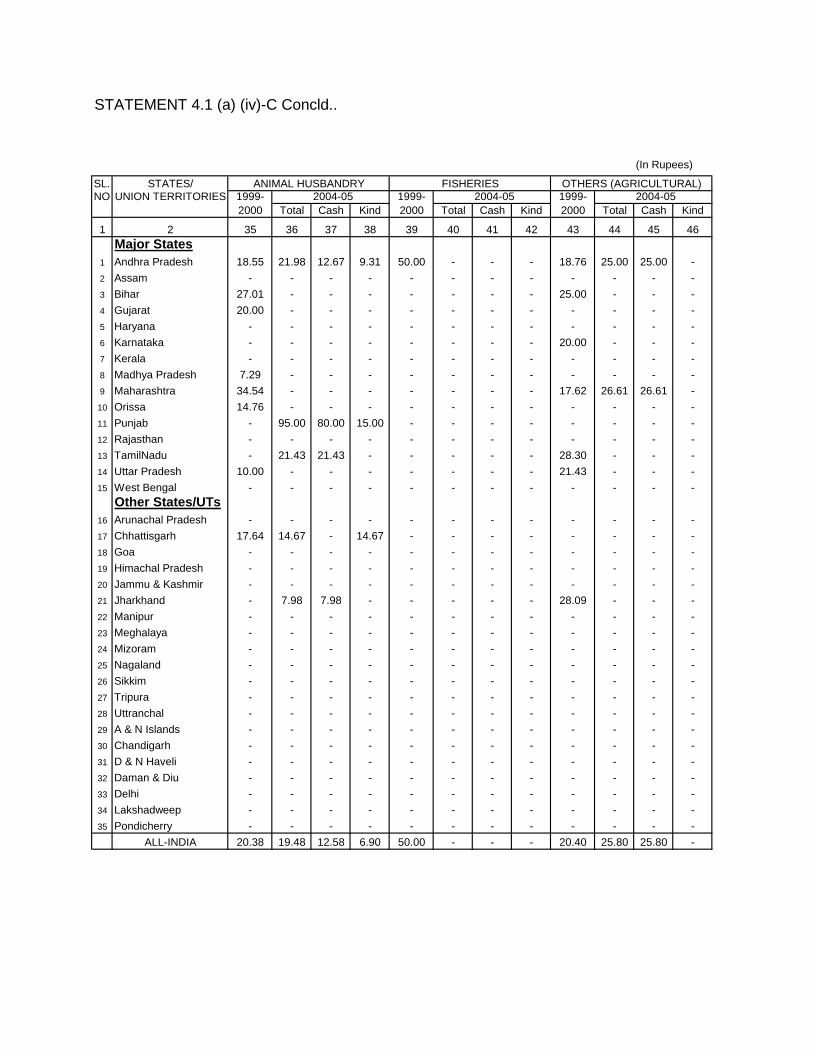
STATEMENT 4.1 (a) (iv)-C Concld..
(In Rupees)
SL. STATES/ ANIMAL HUSBANDRY FISHERIES OTHERS (AGRICULTURAL)NO. UNION TERRITORIES 1999- 2004-05 1999- 2004-05 1999- 2004-05
2000 Total Cash Kind 2000 Total Cash Kind 2000 Total Cash Kind
1 2 35 36 37 38 39 40 41 42 43 44 45 46Major States
1 Andhra Pradesh 18.55 21.98 12.67 9.31 50.00 - - - 18.76 25.00 25.00 -2 Assam - - - - - - - - - - - -3 Bihar 27.01 - - - - - - - 25.00 - - -4 Gujarat 20.00 - - - - - - - - - - -5 Haryana - - - - - - - - - - - -6 Karnataka - - - - - - - - 20.00 - - -7 Kerala - - - - - - - - - - - -8 Madhya Pradesh 7.29 - - - - - - - - - - -9 Maharashtra 34.54 - - - - - - - 17.62 26.61 26.61 -10 Orissa 14.76 - - - - - - - - - - -11 Punjab - 95.00 80.00 15.00 - - - - - - - -12 Rajasthan - - - - - - - - - - - -13 TamilNadu - 21.43 21.43 - - - - - 28.30 - - -14 Uttar Pradesh 10.00 - - - - - - - 21.43 - - -15 West Bengal - - - - - - - - - - - -
Other States/UTs16 Arunachal Pradesh - - - - - - - - - - - -17 Chhattisgarh 17.64 14.67 - 14.67 - - - - - - - -18 Goa - - - - - - - - - - - -19 Himachal Pradesh - - - - - - - - - - - -20 Jammu & Kashmir - - - - - - - - - - - -21 Jharkhand - 7.98 7.98 - - - - - 28.09 - - -22 Manipur - - - - - - - - - - - -23 Meghalaya - - - - - - - - - - - -24 Mizoram - - - - - - - - - - - -25 Nagaland - - - - - - - - - - - -26 Sikkim - - - - - - - - - - - -27 Tripura - - - - - - - - - - - -28 Uttranchal - - - - - - - - - - - -29 A & N Islands - - - - - - - - - - - -30 Chandigarh - - - - - - - - - - - -31 D & N Haveli - - - - - - - - - - - -32 Daman & Diu - - - - - - - - - - - -33 Delhi - - - - - - - - - - - -34 Lakshadweep - - - - - - - - - - - -35 Pondicherry - - - - - - - - - - - -
ALL-INDIA 20.38 19.48 12.58 6.90 50.00 - - - 20.40 25.80 25.80 -

STATEMENT 4.1 (b) (i)-M
AVERAGE DAILY EARNINGS OF MEN BELONGING TO ALL AGRICULTURAL LABOUR HOUSEHOLDS IN DIFFERENT AGRICULTURAL OCCUPATIONS
(In Rupees)
SL. STATES/ PLOUGHING SOWINGNO. UNION TERRITORIES 1999- 2004-05 1999- 2004-05
2000 Total Cash Kind 2000 Total Cash Kind1 2 3 4 5 6 7 8 9 10
Major States1 Andhra Pradesh 36.60 49.49 46.90 2.59 37.03 29.10 26.22 2.882 Assam 80.72 65.35 59.33 6.02 45.37 60.93 46.64 14.293 Bihar 41.44 48.02 39.81 8.21 32.97 40.16 30.53 9.634 Gujarat 36.04 71.61 60.94 10.67 42.05 30.62 27.42 3.205 Haryana 62.26 74.32 74.32 - 54.35 65.71 62.61 3.106 Karnataka 42.52 47.52 45.63 1.89 38.68 37.08 34.01 3.077 Kerala 102.99 120.24 109.65 10.59 117.86 150.00 150.00 -8 Madhya Pradesh 31.89 37.83 30.00 7.83 26.93 38.22 31.89 6.339 Maharashtra 40.71 47.14 46.21 0.93 38.96 44.19 42.32 1.87
10 Orissa 30.15 40.75 37.89 2.86 28.11 50.56 50.56 -11 Punjab 70.18 73.92 61.92 12.00 61.28 64.94 59.31 5.6312 Rajasthan 35.46 73.77 64.64 9.13 78.60 71.90 69.21 2.6913 TamilNadu 52.14 74.38 71.96 2.42 49.39 64.36 64.01 0.3514 Uttar Pradesh 33.80 51.30 50.45 0.85 34.57 50.57 49.58 0.9915 West Bengal 47.95 50.81 45.09 5.72 47.65 47.49 42.61 4.88
Other States/UTs16 Arunachal Pradesh - 216.84 213.51 3.33 - - - -17 Chhattisgarh 35.29 37.08 26.55 10.53 35.00 25.00 25.00 -18 Goa 51.43 - - - - - - -19 Himachal Pradesh 68.17 90.00 50.00 40.00 61.90 - - -20 Jammu & Kashmir 65.84 - - - - - - -21 Jharkhand 32.35 42.28 40.79 1.49 33.56 36.88 32.07 4.8122 Manipur 63.07 - - - - - - -23 Meghalaya 50.55 72.65 69.97 2.68 59.67 65.11 65.11 -24 Mizoram - - - - 120.00 - - -25 Nagaland - - - - - - - -26 Sikkim 55.50 82.91 69.41 13.50 44.84 - - -27 Tripura 44.91 73.41 73.41 - 62.60 72.75 72.47 0.2828 Uttranchal 50.21 50.00 50.00 - 70.00 50.38 45.06 5.3229 A & N Islands 60.00 100.00 100.00 - 70.00 - - -30 Chandigarh - - - - - - - -31 D & N Haveli - - - - - - - -32 Daman & Diu - - - - - - - -33 Delhi - 110.00 80.00 30.00 - - - -34 Lakshadweep - - - - - - - -35 Pondicherry 65.00 54.78 54.78 - - - - -
ALL-INDIA 42.36 52.19 47.53 4.66 38.75 45.03 40.31 4.72

STATEMENT 4.1 (b) (i)-M contd..
(In Rupees)
SL. STATES/ TRANSPLANTING WEEDINGNO. UNION TERRITORIES 1999- 2004-05 1999- 2004-05
2000 Total Cash Kind 2000 Total Cash Kind1 2 11 12 13 14 15 16 17 18
Major States1 Andhra Pradesh 44.59 55.54 55.20 0.34 33.65 42.26 42.03 0.232 Assam 38.37 54.21 44.82 9.39 44.74 62.02 52.10 9.923 Bihar 36.85 42.01 36.19 5.82 33.32 36.95 26.50 10.454 Gujarat 41.43 41.06 37.43 3.63 38.04 42.63 36.88 5.755 Haryana 58.27 87.27 79.45 7.82 64.71 65.69 48.78 16.916 Karnataka 43.26 45.72 44.85 0.87 34.11 32.53 31.42 1.117 Kerala 99.64 182.14 157.14 25.00 100.00 118.60 118.60 -8 Madhya Pradesh 26.00 29.27 27.82 1.45 29.14 33.33 28.86 4.479 Maharashtra 32.34 40.80 39.80 1.00 36.53 39.08 38.01 1.07
10 Orissa 29.94 39.03 37.57 1.46 28.77 38.58 32.98 5.6011 Punjab 62.61 74.21 70.61 3.60 64.96 70.36 63.45 6.9112 Rajasthan - 90.00 60.00 30.00 59.96 57.44 46.43 11.0113 TamilNadu 53.56 62.24 61.42 0.82 41.15 55.12 54.22 0.9014 Uttar Pradesh 38.12 38.02 30.32 7.70 31.10 46.15 40.72 5.4315 West Bengal 42.95 55.12 48.94 6.18 41.57 44.47 40.92 3.55
Other States/UTs16 Arunachal Pradesh - - - - - - - -17 Chhattisgarh 24.68 31.79 31.48 0.31 21.47 24.29 13.55 10.7418 Goa - - - - - - - -19 Himachal Pradesh - - - - 30.86 106.78 78.16 28.6220 Jammu & Kashmir 113.92 - - - - - - -21 Jharkhand 39.73 45.89 37.43 8.46 38.36 38.50 36.51 1.9922 Manipur - 42.86 42.86 - 46.67 50.00 50.00 -23 Meghalaya - 48.14 48.14 - - 49.23 47.66 1.5724 Mizoram - - - - 70.00 - - -25 Nagaland - - - - - - - -26 Sikkim 44.60 90.00 70.00 20.00 60.35 80.39 62.46 17.9327 Tripura 70.48 65.53 64.42 1.11 56.17 72.92 69.89 3.0328 Uttranchal - 50.00 50.00 - 67.73 57.20 56.39 0.8129 A & N Islands - - - - 101.82 250.06 237.62 12.4430 Chandigarh - - - - - - - -31 D & N Haveli - 58.73 46.24 12.49 - - - -32 Daman & Diu 50.00 - - - - - - -33 Delhi - - - - - - - -34 Lakshadweep - - - - - - - -35 Pondicherry 50.53 105.00 100.00 5.00 34.78 - - -
ALL-INDIA 39.53 50.85 47.35 3.50 34.99 41.58 36.64 4.94

STATEMENT 4.1 (b) (i)-M Contd..
(In Rupees)
SL. STATES/ HARVESTING CULTIVATIONNO. UNION TERRITORIES 1999- 2004-05 1999- 2004-05
2000 Total Cash Kind 2000 Total Cash Kind1 2 19 20 21 22 23 24 25 26
Major States1 Andhra Pradesh 42.73 47.38 46.30 1.08 40.44 44.46 43.29 1.172 Assam 44.37 62.57 52.48 10.09 39.46 59.59 51.42 8.173 Bihar 34.28 46.41 20.83 25.58 34.65 42.92 32.44 10.484 Gujarat 43.61 45.31 42.67 2.64 37.28 47.86 44.98 2.885 Haryana 65.92 73.39 47.08 26.31 52.49 68.37 56.32 12.056 Karnataka 36.71 44.30 39.46 4.84 37.61 42.45 40.96 1.497 Kerala 59.84 90.38 89.48 0.90 100.60 123.37 114.75 8.628 Madhya Pradesh 31.59 31.94 19.05 12.89 28.44 36.63 30.03 6.609 Maharashtra 37.72 45.77 43.93 1.84 36.05 44.14 42.56 1.58
10 Orissa 28.25 36.25 32.11 4.14 26.80 44.23 41.38 2.8511 Punjab 59.34 74.15 65.86 8.29 66.28 70.50 61.62 8.8812 Rajasthan 46.44 72.20 57.46 14.74 50.35 60.47 56.20 4.2713 TamilNadu 51.25 60.70 35.76 24.94 51.17 64.99 61.71 3.2814 Uttar Pradesh 35.86 50.39 40.32 10.07 39.95 48.40 43.31 5.0915 West Bengal 43.18 43.83 39.17 4.66 40.49 43.15 38.55 4.60
Other States/UTs16 Arunachal Pradesh 50.00 106.13 100.00 6.13 70.56 68.51 68.51 -17 Chhattisgarh 25.79 27.37 19.38 7.99 25.85 33.08 25.49 7.5918 Goa - 100.00 100.00 - 52.24 60.00 60.00 -19 Himachal Pradesh 74.12 88.23 76.74 11.49 63.37 89.67 64.25 25.4220 Jammu & Kashmir 150.54 86.22 76.45 9.77 79.23 103.93 93.11 10.8221 Jharkhand 34.11 51.33 44.96 6.37 33.53 38.95 36.93 2.0222 Manipur 57.14 77.65 77.65 - 47.76 53.81 53.81 -23 Meghalaya 41.51 58.67 57.97 0.70 48.23 62.43 59.77 2.6624 Mizoram 60.00 120.20 120.20 - - - - -25 Nagaland - - - - - - - -26 Sikkim 50.94 76.86 60.00 16.86 45.15 76.33 61.30 15.0327 Tripura 53.02 63.54 63.54 - 41.91 65.93 62.19 3.7428 Uttranchal 61.32 60.91 56.69 4.22 50.00 58.41 56.20 2.2129 A & N Islands 70.00 - - - 78.02 110.00 80.00 30.0030 Chandigarh - - - - - - - -31 D & N Haveli - 41.89 41.89 - 41.52 52.23 46.82 5.4132 Daman & Diu 42.86 - - - 30.00 85.45 65.45 20.0033 Delhi 80.00 - - - - - - -34 Lakshadweep - - - - 40.00 116.71 116.71 -35 Pondicherry 53.48 64.64 47.25 17.39 49.60 74.99 72.01 2.98
ALL-INDIA 38.44 46.42 36.12 10.30 39.31 47.10 42.65 4.45

STATEMENT 4.1 (b) (i)-M Contd..
(In Rupees)
SL. STATES/ FORESTRY PLANTATIONNO. UNION TERRITORIES 1999- 2004-05 1999- 2004-05
2000 Total Cash Kind 2000 Total Cash Kind1 2 27 28 29 30 31 32 33 34
Major States1 Andhra Pradesh 40.16 69.83 67.10 2.73 41.02 48.45 48.45 -2 Assam - 81.11 71.89 9.22 40.71 56.71 43.81 12.903 Bihar 39.09 - - - 17.37 - - -4 Gujarat 57.57 - - - 25.00 - - -5 Haryana 70.00 105.31 100.00 5.31 - - - -6 Karnataka 50.59 30.00 30.00 - 57.10 62.37 58.21 4.167 Kerala 147.56 141.93 138.87 3.06 90.71 111.93 104.60 7.338 Madhya Pradesh 25.44 30.10 28.73 1.37 46.15 - - -9 Maharashtra 37.84 45.35 45.01 0.34 25.05 40.81 40.81 -
10 Orissa 49.40 29.40 29.40 - 38.34 - - -11 Punjab - 91.22 83.13 8.09 80.00 82.86 82.86 -12 Rajasthan - 100.00 100.00 - - 40.00 25.00 15.0013 TamilNadu 45.38 58.95 58.60 0.35 73.35 60.99 60.99 -14 Uttar Pradesh 39.39 43.73 31.06 12.67 50.00 - - -15 West Bengal 40.88 33.87 32.57 1.30 43.56 45.29 41.37 3.92
Other States/UTs16 Arunachal Pradesh - 71.43 71.43 - - - - -17 Chhattisgarh 43.74 50.00 50.00 - 20.00 57.47 52.19 5.2818 Goa - - - - - 70.00 70.00 -19 Himachal Pradesh - - - - - 76.37 26.91 49.4620 Jammu & Kashmir - - - - - - - -21 Jharkhand 38.06 - - - - - - -22 Manipur - 46.43 46.43 - - - - -23 Meghalaya 17.86 - - - 17.50 57.17 57.17 -24 Mizoram 37.50 - - - - - - -25 Nagaland - - - - 135.00 - - -26 Sikkim - - - - - 83.21 60.00 23.2127 Tripura - - - - 36.15 36.74 36.74 -28 Uttranchal - - - - 50.00 - - -29 A & N Islands 85.19 209.23 209.23 - 77.27 121.82 121.82 -30 Chandigarh - - - - - - - -31 D & N Haveli 37.17 - - - - - - -32 Daman & Diu - - - - - - - -33 Delhi - - - - - - - -34 Lakshadweep - - - - 114.20 129.10 127.60 1.5035 Pondicherry - - - - 15.00 - - -
ALL-INDIA 46.03 46.38 45.12 1.26 58.27 67.72 62.03 5.69

STATEMENT 4.1 (b) (i)-M Concld..
(In Rupees)
SL. STATES/ ANIMAL HUSBANDRY FISHERIES OTHERS (AGRICULTURAL)NO. UNION TERRITORIES 1999- 2004-05 1999- 2004-05 1999- 2004-05
2000 Total Cash Kind 2000 Total Cash Kind 2000 Total Cash Kind1 2 35 36 37 38 39 40 41 42 43 44 45 46
Major States1 Andhra Pradesh 23.53 25.74 20.39 5.35 54.20 68.96 68.38 0.58 38.17 46.74 46.46 0.282 Assam - - - - - - - - 42.00 63.20 54.09 9.113 Bihar 31.07 41.05 31.89 9.16 54.47 - - - 32.98 45.13 36.38 8.754 Gujarat 30.14 60.87 59.20 1.67 - - - - 41.10 47.32 43.92 3.405 Haryana 32.18 72.07 56.44 15.63 - - - - 68.18 98.56 96.09 2.476 Karnataka 17.13 30.00 30.00 - 70.00 43.39 43.39 - 38.89 41.03 38.60 2.437 Kerala 108.90 87.81 79.00 8.81 71.70 148.51 143.12 5.39 99.49 118.22 111.56 6.668 Madhya Pradesh 22.79 23.07 21.41 1.66 21.43 - - - 32.44 35.39 35.13 0.269 Maharashtra 30.40 24.47 23.18 1.29 32.69 96.03 63.23 32.80 40.91 46.56 46.03 0.5310 Orissa 24.94 29.37 29.37 - 48.16 52.79 38.40 14.39 29.26 32.06 31.65 0.4111 Punjab 57.24 59.86 51.58 8.28 73.22 - - - 59.54 77.52 66.11 11.4112 Rajasthan 37.05 50.00 50.00 - - - - - 51.05 59.06 56.43 2.6313 TamilNadu 24.61 52.59 52.55 0.04 70.61 - - - 55.41 63.77 63.66 0.1114 Uttar Pradesh 32.33 51.79 47.17 4.62 - - - - 43.77 46.17 35.89 10.2815 West Bengal 10.00 57.99 51.44 6.55 53.52 44.89 44.71 0.18 45.10 42.79 40.58 2.21
Other States/UTs16 Arunachal Pradesh - - - - - - - - 104.43 - - -17 Chhattisgarh 21.86 19.76 5.68 14.08 - - - - 29.07 33.21 27.04 6.1718 Goa - - - - 50.00 - - - 45.00 122.97 120.38 2.5919 Himachal Pradesh 75.00 - - - - - - - 65.57 63.95 55.80 8.1520 Jammu & Kashmir - 65.75 65.75 - - - - - 94.01 85.72 67.97 17.7521 Jharkhand - 34.44 26.48 7.96 21.11 - - - 31.23 29.51 21.63 7.8822 Manipur - - - - 60.00 - - - 53.89 70.00 70.00 -23 Meghalaya - - - - - - - - 49.79 39.31 38.72 0.5924 Mizoram - - - - - - - - 73.00 - - -25 Nagaland - - - - - - - - - - - -26 Sikkim - 110.00 80.00 30.00 - - - - 50.47 89.29 89.29 -27 Tripura - - - - - - - - 41.40 57.22 56.09 1.1328 Uttranchal - - - - - - - - 35.91 - - -29 A & N Islands - - - - - - - - - 122.82 118.98 3.8430 Chandigarh - - - - - - - - 122.37 - - -31 D & N Haveli - - - - - - - - 37.89 48.97 46.91 2.0632 Daman & Diu - - - - 74.27 82.33 62.10 20.23 - - - -33 Delhi - - - - - - - - - - - -34 Lakshadweep - - - - - - - - 51.70 125.00 125.00 -35 Pondicherry 44.62 32.00 20.00 12.00 - - - - 50.90 90.00 84.00 6.00
ALL-INDIA 32.25 36.34 31.51 4.83 54.11 63.54 57.90 5.64 43.30 47.71 44.76 2.95
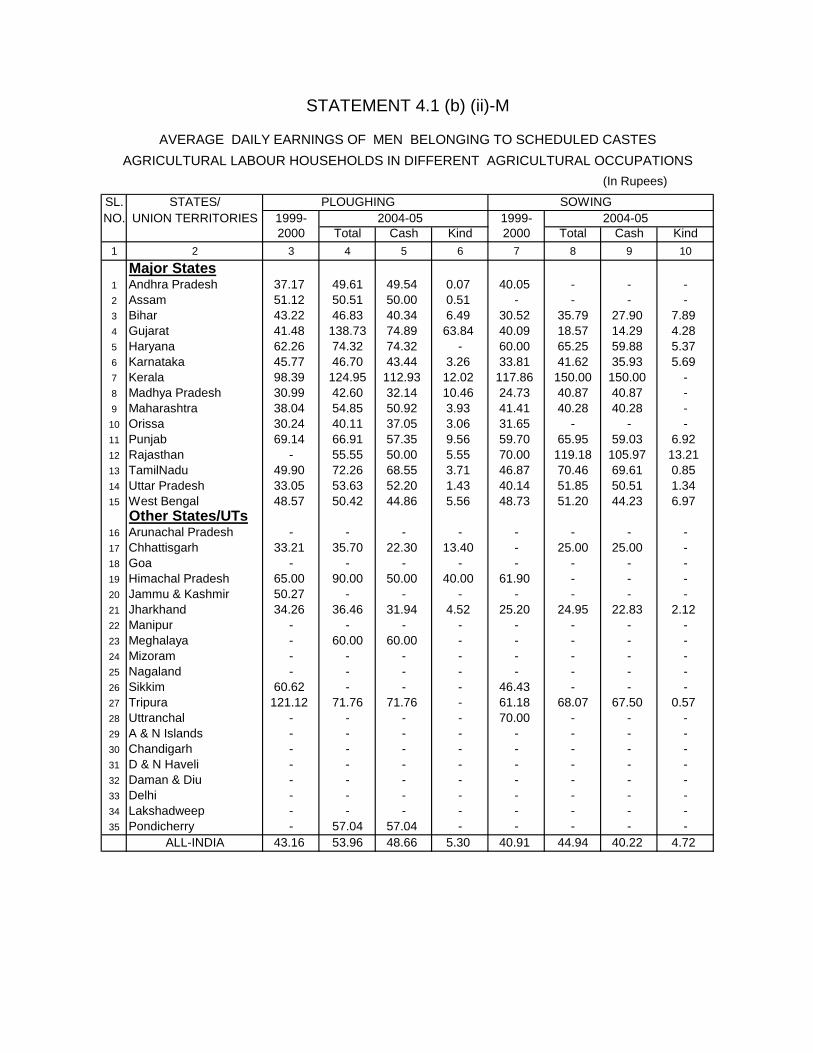
STATEMENT 4.1 (b) (ii)-M
AVERAGE DAILY EARNINGS OF MEN BELONGING TO SCHEDULED CASTESAGRICULTURAL LABOUR HOUSEHOLDS IN DIFFERENT AGRICULTURAL OCCUPATIONS
(In Rupees)
SL. STATES/ PLOUGHING SOWINGNO. UNION TERRITORIES 1999- 2004-05 1999- 2004-05
2000 Total Cash Kind 2000 Total Cash Kind1 2 3 4 5 6 7 8 9 10
Major States1 Andhra Pradesh 37.17 49.61 49.54 0.07 40.05 - - -2 Assam 51.12 50.51 50.00 0.51 - - - -3 Bihar 43.22 46.83 40.34 6.49 30.52 35.79 27.90 7.894 Gujarat 41.48 138.73 74.89 63.84 40.09 18.57 14.29 4.285 Haryana 62.26 74.32 74.32 - 60.00 65.25 59.88 5.376 Karnataka 45.77 46.70 43.44 3.26 33.81 41.62 35.93 5.697 Kerala 98.39 124.95 112.93 12.02 117.86 150.00 150.00 -8 Madhya Pradesh 30.99 42.60 32.14 10.46 24.73 40.87 40.87 -9 Maharashtra 38.04 54.85 50.92 3.93 41.41 40.28 40.28 -
10 Orissa 30.24 40.11 37.05 3.06 31.65 - - -11 Punjab 69.14 66.91 57.35 9.56 59.70 65.95 59.03 6.9212 Rajasthan - 55.55 50.00 5.55 70.00 119.18 105.97 13.2113 TamilNadu 49.90 72.26 68.55 3.71 46.87 70.46 69.61 0.8514 Uttar Pradesh 33.05 53.63 52.20 1.43 40.14 51.85 50.51 1.3415 West Bengal 48.57 50.42 44.86 5.56 48.73 51.20 44.23 6.97
Other States/UTs16 Arunachal Pradesh - - - - - - - -17 Chhattisgarh 33.21 35.70 22.30 13.40 - 25.00 25.00 -18 Goa - - - - - - - -19 Himachal Pradesh 65.00 90.00 50.00 40.00 61.90 - - -20 Jammu & Kashmir 50.27 - - - - - - -21 Jharkhand 34.26 36.46 31.94 4.52 25.20 24.95 22.83 2.1222 Manipur - - - - - - - -23 Meghalaya - 60.00 60.00 - - - - -24 Mizoram - - - - - - - -25 Nagaland - - - - - - - -26 Sikkim 60.62 - - - 46.43 - - -27 Tripura 121.12 71.76 71.76 - 61.18 68.07 67.50 0.5728 Uttranchal - - - - 70.00 - - -29 A & N Islands - - - - - - - -30 Chandigarh - - - - - - - -31 D & N Haveli - - - - - - - -32 Daman & Diu - - - - - - - -33 Delhi - - - - - - - -34 Lakshadweep - - - - - - - -35 Pondicherry - 57.04 57.04 - - - - -
ALL-INDIA 43.16 53.96 48.66 5.30 40.91 44.94 40.22 4.72
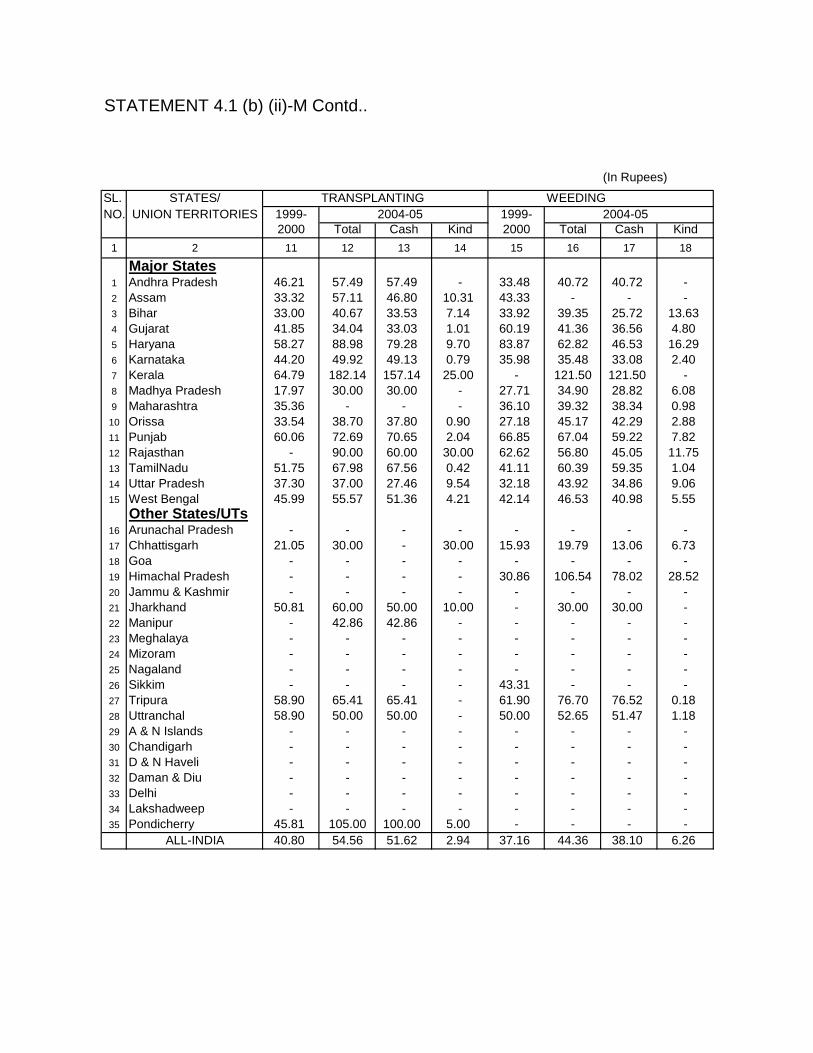
STATEMENT 4.1 (b) (ii)-M Contd..
(In Rupees)
SL. STATES/ TRANSPLANTING WEEDINGNO. UNION TERRITORIES 1999- 2004-05 1999- 2004-05
2000 Total Cash Kind 2000 Total Cash Kind1 2 11 12 13 14 15 16 17 18
Major States1 Andhra Pradesh 46.21 57.49 57.49 - 33.48 40.72 40.72 -2 Assam 33.32 57.11 46.80 10.31 43.33 - - -3 Bihar 33.00 40.67 33.53 7.14 33.92 39.35 25.72 13.634 Gujarat 41.85 34.04 33.03 1.01 60.19 41.36 36.56 4.805 Haryana 58.27 88.98 79.28 9.70 83.87 62.82 46.53 16.296 Karnataka 44.20 49.92 49.13 0.79 35.98 35.48 33.08 2.407 Kerala 64.79 182.14 157.14 25.00 - 121.50 121.50 -8 Madhya Pradesh 17.97 30.00 30.00 - 27.71 34.90 28.82 6.089 Maharashtra 35.36 - - - 36.10 39.32 38.34 0.98
10 Orissa 33.54 38.70 37.80 0.90 27.18 45.17 42.29 2.8811 Punjab 60.06 72.69 70.65 2.04 66.85 67.04 59.22 7.8212 Rajasthan - 90.00 60.00 30.00 62.62 56.80 45.05 11.7513 TamilNadu 51.75 67.98 67.56 0.42 41.11 60.39 59.35 1.0414 Uttar Pradesh 37.30 37.00 27.46 9.54 32.18 43.92 34.86 9.0615 West Bengal 45.99 55.57 51.36 4.21 42.14 46.53 40.98 5.55
Other States/UTs16 Arunachal Pradesh - - - - - - - -17 Chhattisgarh 21.05 30.00 - 30.00 15.93 19.79 13.06 6.7318 Goa - - - - - - - -19 Himachal Pradesh - - - - 30.86 106.54 78.02 28.5220 Jammu & Kashmir - - - - - - - -21 Jharkhand 50.81 60.00 50.00 10.00 - 30.00 30.00 -22 Manipur - 42.86 42.86 - - - - -23 Meghalaya - - - - - - - -24 Mizoram - - - - - - - -25 Nagaland - - - - - - - -26 Sikkim - - - - 43.31 - - -27 Tripura 58.90 65.41 65.41 - 61.90 76.70 76.52 0.1828 Uttranchal 58.90 50.00 50.00 - 50.00 52.65 51.47 1.1829 A & N Islands - - - - - - - -30 Chandigarh - - - - - - - -31 D & N Haveli - - - - - - - -32 Daman & Diu - - - - - - - -33 Delhi - - - - - - - -34 Lakshadweep - - - - - - - -35 Pondicherry 45.81 105.00 100.00 5.00 - - - -
ALL-INDIA 40.80 54.56 51.62 2.94 37.16 44.36 38.10 6.26
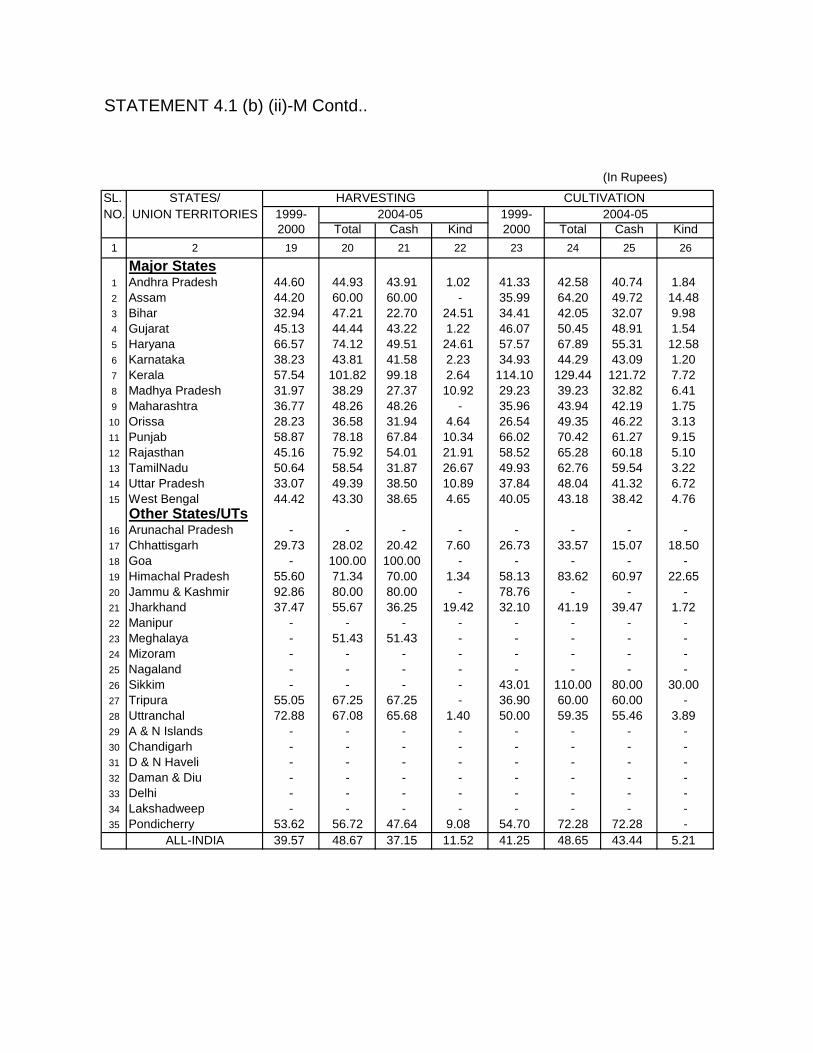
STATEMENT 4.1 (b) (ii)-M Contd..
(In Rupees)
SL. STATES/ HARVESTING CULTIVATIONNO. UNION TERRITORIES 1999- 2004-05 1999- 2004-05
2000 Total Cash Kind 2000 Total Cash Kind1 2 19 20 21 22 23 24 25 26
Major States1 Andhra Pradesh 44.60 44.93 43.91 1.02 41.33 42.58 40.74 1.842 Assam 44.20 60.00 60.00 - 35.99 64.20 49.72 14.483 Bihar 32.94 47.21 22.70 24.51 34.41 42.05 32.07 9.984 Gujarat 45.13 44.44 43.22 1.22 46.07 50.45 48.91 1.545 Haryana 66.57 74.12 49.51 24.61 57.57 67.89 55.31 12.586 Karnataka 38.23 43.81 41.58 2.23 34.93 44.29 43.09 1.207 Kerala 57.54 101.82 99.18 2.64 114.10 129.44 121.72 7.728 Madhya Pradesh 31.97 38.29 27.37 10.92 29.23 39.23 32.82 6.419 Maharashtra 36.77 48.26 48.26 - 35.96 43.94 42.19 1.75
10 Orissa 28.23 36.58 31.94 4.64 26.54 49.35 46.22 3.1311 Punjab 58.87 78.18 67.84 10.34 66.02 70.42 61.27 9.1512 Rajasthan 45.16 75.92 54.01 21.91 58.52 65.28 60.18 5.1013 TamilNadu 50.64 58.54 31.87 26.67 49.93 62.76 59.54 3.2214 Uttar Pradesh 33.07 49.39 38.50 10.89 37.84 48.04 41.32 6.7215 West Bengal 44.42 43.30 38.65 4.65 40.05 43.18 38.42 4.76
Other States/UTs16 Arunachal Pradesh - - - - - - - -17 Chhattisgarh 29.73 28.02 20.42 7.60 26.73 33.57 15.07 18.5018 Goa - 100.00 100.00 - - - - -19 Himachal Pradesh 55.60 71.34 70.00 1.34 58.13 83.62 60.97 22.6520 Jammu & Kashmir 92.86 80.00 80.00 - 78.76 - - -21 Jharkhand 37.47 55.67 36.25 19.42 32.10 41.19 39.47 1.7222 Manipur - - - - - - - -23 Meghalaya - 51.43 51.43 - - - - -24 Mizoram - - - - - - - -25 Nagaland - - - - - - - -26 Sikkim - - - - 43.01 110.00 80.00 30.0027 Tripura 55.05 67.25 67.25 - 36.90 60.00 60.00 -28 Uttranchal 72.88 67.08 65.68 1.40 50.00 59.35 55.46 3.8929 A & N Islands - - - - - - - -30 Chandigarh - - - - - - - -31 D & N Haveli - - - - - - - -32 Daman & Diu - - - - - - - -33 Delhi - - - - - - - -34 Lakshadweep - - - - - - - -35 Pondicherry 53.62 56.72 47.64 9.08 54.70 72.28 72.28 -
ALL-INDIA 39.57 48.67 37.15 11.52 41.25 48.65 43.44 5.21

STATEMENT 4.1 (b) (ii)-M Contd..
(In Rupees)
SL. STATES/ FORESTRY PLANTATIONNO. UNION TERRITORIES 1999- 2004-05 1999- 2004-05
2000 Total Cash Kind 2000 Total Cash Kind1 2 27 28 29 30 31 32 33 34
Major States1 Andhra Pradesh 50.00 74.86 71.43 3.43 41.35 51.59 51.59 -2 Assam - - - - 37.49 44.76 44.37 0.393 Bihar 40.05 - - - 20.00 - - -4 Gujarat - - - - - - - -5 Haryana - 105.31 100.00 5.31 - - - -6 Karnataka - - - - 55.48 64.48 59.17 5.317 Kerala - - - - 84.12 103.82 94.60 9.228 Madhya Pradesh 30.30 30.30 - - - - -9 Maharashtra 36.29 48.51 48.51 - - 60.00 60.00 -
10 Orissa 40.00 26.67 26.67 - 37.27 - - -11 Punjab - 91.46 83.75 7.71 - - - -12 Rajasthan - 100.00 100.00 - - - - -13 TamilNadu 38.98 64.51 64.04 0.47 70.05 67.51 67.51 -14 Uttar Pradesh 34.19 43.73 31.06 12.67 50.00 - - -15 West Bengal - 31.76 30.00 1.76 48.23 44.07 42.25 1.82
Other States/UTs16 Arunachal Pradesh - - - - - - - -17 Chhattisgarh 30.00 50.00 50.00 - 20.00 - - -18 Goa - - - - - - - -19 Himachal Pradesh - - - - - - - -20 Jammu & Kashmir - - - - - - - -21 Jharkhand - - - - - - - -22 Manipur - - - - - - - -23 Meghalaya - - - - - - - -24 Mizoram - - - - - - - -25 Nagaland - - - - - - - -26 Sikkim - - - - - - - -27 Tripura - - - - 42.68 41.03 41.03 -28 Uttranchal - - - - 50.00 - - -29 A & N Islands 80.71 - - - - - - -30 Chandigarh - - - - - - - -31 D & N Haveli - - - - - - - -32 Daman & Diu - - - - - - - -33 Delhi - - - - - - - -34 Lakshadweep - - - - - - - -35 Pondicherry - - - - - - - -
ALL-INDIA 38.93 43.40 42.29 1.11 66.49 70.86 66.80 4.06

STATEMENT 4.1 (b) (ii)-M Concld..
(In Rupees)
SL. STATES/ ANIMAL HUSBANDRY FISHERIES OTHERS (AGRICULTURAL)NO. UNION TERRITORIES 1999- 2004-05 1999- 2004-05 1993-94 1999-2000
2000 Total Cash Kind 2000 Total Cash Kind Total Cash Kind1 2 35 36 37 38 39 40 41 42 43 44 45 46
Major States1 Andhra Pradesh 24.91 18.14 9.95 8.19 - - - - 37.10 49.73 49.41 0.322 Assam - - - - - - - - 37.57 55.72 50.72 5.003 Bihar - 37.35 26.26 11.09 - - - - 35.58 43.41 35.93 7.484 Gujarat 13.75 66.71 66.71 - - - - - 50.35 49.83 47.77 2.065 Haryana 30.00 71.85 55.11 16.74 - - - - 69.68 101.43 97.52 3.916 Karnataka 14.29 30.00 30.00 - - - - - 33.57 45.14 43.07 2.077 Kerala 153.29 75.84 66.79 9.05 - 120.00 110.00 10.00 114.86 122.39 108.41 13.988 Madhya Pradesh 18.66 15.64 11.61 4.03 21.43 - - - 31.48 34.77 34.77 -9 Maharashtra 29.05 23.19 17.80 5.39 - - - - 40.93 43.79 43.39 0.4010 Orissa - 30.00 30.00 - 50.00 80.00 60.00 20.00 29.40 30.77 28.39 2.3811 Punjab 52.95 60.35 50.46 9.89 121.43 - - - 58.19 77.21 66.84 10.3712 Rajasthan 56.01 50.00 50.00 - - - - - 46.79 58.86 55.22 3.6413 TamilNadu - - - - 40.00 - - - 51.94 60.14 60.14 -14 Uttar Pradesh 40.00 70.00 60.00 10.00 - - - - 41.60 42.54 29.86 12.6815 West Bengal - 21.77 10.05 11.72 70.00 51.39 51.39 - 43.42 50.67 45.01 5.66
Other States/UTs16 Arunachal Pradesh - - - - - - - - - - - -17 Chhattisgarh - 16.67 - 16.67 - - - - 21.81 27.71 17.22 10.4918 Goa - - - - - - - - - - - -19 Himachal Pradesh - - - - - - - - 60.00 54.52 47.42 7.1020 Jammu & Kashmir - - - - - - - - 80.00 128.57 128.57 -21 Jharkhand - 37.87 30.50 7.37 14.29 - - - 41.74 50.00 50.00 -22 Manipur - - - - - - - - - - - -23 Meghalaya - - - - - - - - - - - -24 Mizoram - - - - - - - - - - - -25 Nagaland - - - - - - - - - - - -26 Sikkim - 110.00 80.00 30.00 - - - - - - - -27 Tripura - - - - - - - - 42.86 44.64 44.64 -28 Uttranchal - - - - - - - - 46.11 - - -29 A & N Islands - - - - - - - - - - - -30 Chandigarh - - - - - - - - - - - -31 D & N Haveli - - - - - - - - 38.57 - - -32 Daman & Diu - - - - - - - - - - - -33 Delhi - - - - - - - - - - - -34 Lakshadweep - - - - - - - - - - - -35 Pondicherry 43.45 - - - - - - - 50.00 - - -
ALL-INDIA 39.29 35.41 27.46 7.95 47.76 56.84 54.48 2.36 44.04 49.48 45.59 3.89

STATEMENT 4.1 (b) (iii)-M
AVERAGE DAILY EARNINGS OF MEN BELONGING TO SCHEDULED TRIBES AGRICULTURAL LABOUR HOUSEHOLDS IN DIFFERENT
AGRICULTURAL OCCUPATIONS(In Rupees)
SL. STATES/ PLOUGHING SOWINGNO. UNION TERRITORIES 1999- 2004-05 1999- 2004-05
2000 Total Cash Kind 2000 Total Cash Kind1 2 3 4 5 6 7 8 9 10
Major States1 Andhra Pradesh 38.53 55.46 39.05 16.41 37.75 - - -2 Assam 58.16 54.51 50.90 3.61 - 50.00 40.00 10.003 Bihar 37.68 50.00 50.00 - 37.11 - - -4 Gujarat 38.18 94.42 78.41 16.01 30.58 39.82 36.68 3.145 Haryana - - - - - - - -6 Karnataka 36.37 45.14 45.14 - 50.00 - - -7 Kerala - 108.16 93.16 15.00 - - - -8 Madhya Pradesh 30.11 36.09 28.15 7.94 24.02 31.08 18.56 12.529 Maharashtra 40.72 43.97 43.97 - 33.89 52.94 44.78 8.16
10 Orissa 29.15 36.68 33.89 2.79 - - - -11 Punjab - - - - - - - -12 Rajasthan 40.00 100.00 85.71 14.29 - 70.00 70.00 -13 TamilNadu 50.00 - - - - - - -14 Uttar Pradesh - - - - - 30.00 30.00 -15 West Bengal 43.90 46.17 39.19 6.98 - 54.50 51.13 3.37
Other States/UTs16 Arunachal Pradesh - 323.81 323.81 - - - - -17 Chhattisgarh 39.55 38.32 29.02 9.30 35.00 - - -18 Goa - - - - - - - -19 Himachal Pradesh - - - - - - - -20 Jammu & Kashmir - - - - - - - -21 Jharkhand 33.23 42.64 41.47 1.17 34.15 48.92 40.00 8.9222 Manipur 64.29 - - - - - - -23 Meghalaya 48.62 73.38 70.40 2.98 59.67 65.11 65.11 -24 Mizoram - - - - 120.00 - - -25 Nagaland - - - - - - - -26 Sikkim 49.41 83.65 69.95 13.70 - - - -27 Tripura 38.74 74.63 74.63 - - 76.31 76.31 -28 Uttranchal - - - - - - - -29 A & N Islands - - - - - - - -30 Chandigarh - - - - - - - -31 D & N Haveli - - - - - - - -32 Daman & Diu - - - - - - - -33 Delhi - - - - - - - -34 Lakshadweep - - - - - - - -35 Pondicherry - - - - - - - -
ALL-INDIA 36.07 45.98 40.07 5.91 28.78 42.21 34.93 7.28
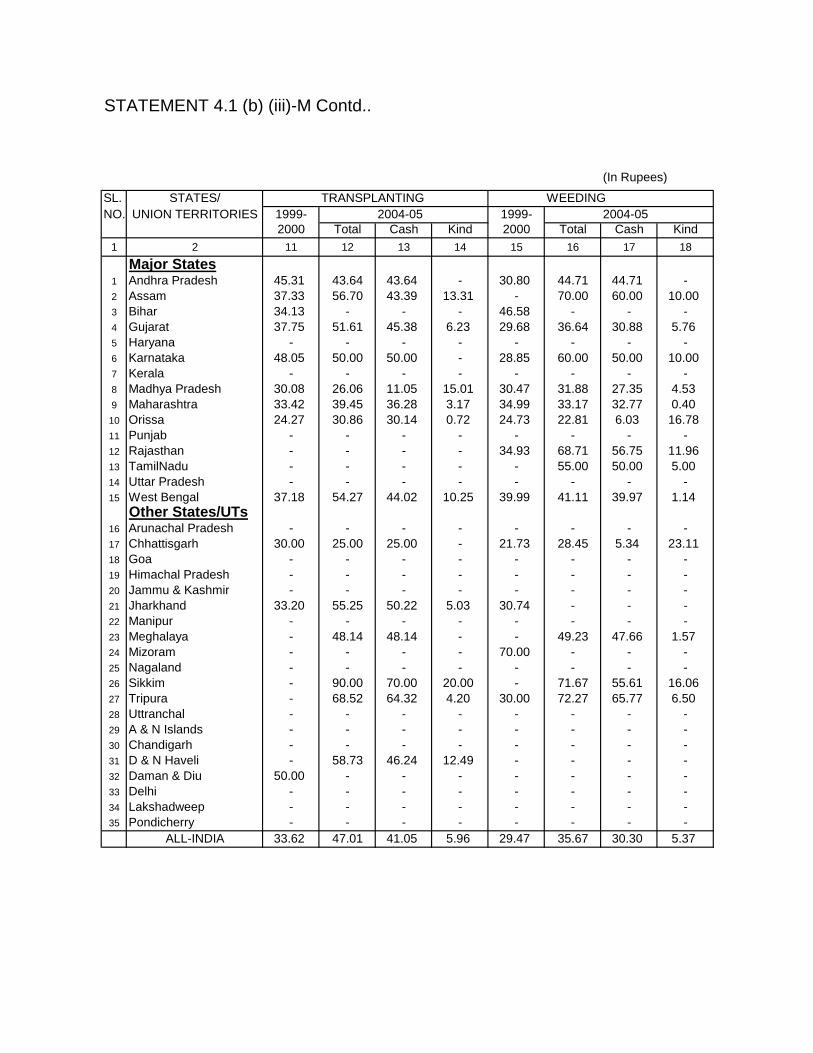
STATEMENT 4.1 (b) (iii)-M Contd..
(In Rupees)
SL. STATES/ TRANSPLANTING WEEDINGNO. UNION TERRITORIES 1999- 2004-05 1999- 2004-05
2000 Total Cash Kind 2000 Total Cash Kind1 2 11 12 13 14 15 16 17 18
Major States1 Andhra Pradesh 45.31 43.64 43.64 - 30.80 44.71 44.71 -2 Assam 37.33 56.70 43.39 13.31 - 70.00 60.00 10.003 Bihar 34.13 - - - 46.58 - - -4 Gujarat 37.75 51.61 45.38 6.23 29.68 36.64 30.88 5.765 Haryana - - - - - - - -6 Karnataka 48.05 50.00 50.00 - 28.85 60.00 50.00 10.007 Kerala - - - - - - - -8 Madhya Pradesh 30.08 26.06 11.05 15.01 30.47 31.88 27.35 4.539 Maharashtra 33.42 39.45 36.28 3.17 34.99 33.17 32.77 0.40
10 Orissa 24.27 30.86 30.14 0.72 24.73 22.81 6.03 16.7811 Punjab - - - - - - - -12 Rajasthan - - - - 34.93 68.71 56.75 11.9613 TamilNadu - - - - - 55.00 50.00 5.0014 Uttar Pradesh - - - - - - - -15 West Bengal 37.18 54.27 44.02 10.25 39.99 41.11 39.97 1.14
Other States/UTs16 Arunachal Pradesh - - - - - - - -17 Chhattisgarh 30.00 25.00 25.00 - 21.73 28.45 5.34 23.1118 Goa - - - - - - - -19 Himachal Pradesh - - - - - - - -20 Jammu & Kashmir - - - - - - - -21 Jharkhand 33.20 55.25 50.22 5.03 30.74 - - -22 Manipur - - - - - - - -23 Meghalaya - 48.14 48.14 - - 49.23 47.66 1.5724 Mizoram - - - - 70.00 - - -25 Nagaland - - - - - - - -26 Sikkim - 90.00 70.00 20.00 - 71.67 55.61 16.0627 Tripura - 68.52 64.32 4.20 30.00 72.27 65.77 6.5028 Uttranchal - - - - - - - -29 A & N Islands - - - - - - - -30 Chandigarh - - - - - - - -31 D & N Haveli - 58.73 46.24 12.49 - - - -32 Daman & Diu 50.00 - - - - - - -33 Delhi - - - - - - - -34 Lakshadweep - - - - - - - -35 Pondicherry - - - - - - - -
ALL-INDIA 33.62 47.01 41.05 5.96 29.47 35.67 30.30 5.37
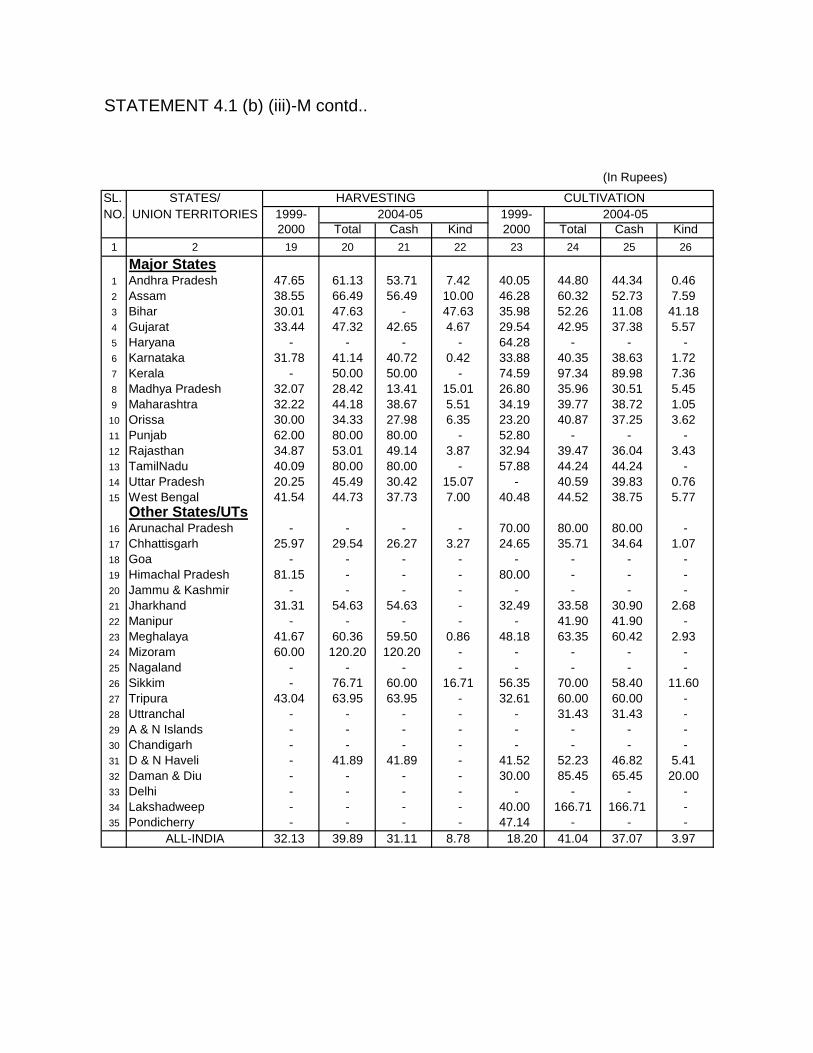
STATEMENT 4.1 (b) (iii)-M contd..
(In Rupees)
SL. STATES/ HARVESTING CULTIVATIONNO. UNION TERRITORIES 1999- 2004-05 1999- 2004-05
2000 Total Cash Kind 2000 Total Cash Kind1 2 19 20 21 22 23 24 25 26
Major States1 Andhra Pradesh 47.65 61.13 53.71 7.42 40.05 44.80 44.34 0.462 Assam 38.55 66.49 56.49 10.00 46.28 60.32 52.73 7.593 Bihar 30.01 47.63 - 47.63 35.98 52.26 11.08 41.184 Gujarat 33.44 47.32 42.65 4.67 29.54 42.95 37.38 5.575 Haryana - - - - 64.28 - - -6 Karnataka 31.78 41.14 40.72 0.42 33.88 40.35 38.63 1.727 Kerala - 50.00 50.00 - 74.59 97.34 89.98 7.368 Madhya Pradesh 32.07 28.42 13.41 15.01 26.80 35.96 30.51 5.459 Maharashtra 32.22 44.18 38.67 5.51 34.19 39.77 38.72 1.05
10 Orissa 30.00 34.33 27.98 6.35 23.20 40.87 37.25 3.6211 Punjab 62.00 80.00 80.00 - 52.80 - - -12 Rajasthan 34.87 53.01 49.14 3.87 32.94 39.47 36.04 3.4313 TamilNadu 40.09 80.00 80.00 - 57.88 44.24 44.24 -14 Uttar Pradesh 20.25 45.49 30.42 15.07 - 40.59 39.83 0.7615 West Bengal 41.54 44.73 37.73 7.00 40.48 44.52 38.75 5.77
Other States/UTs16 Arunachal Pradesh - - - - 70.00 80.00 80.00 -17 Chhattisgarh 25.97 29.54 26.27 3.27 24.65 35.71 34.64 1.0718 Goa - - - - - - - -19 Himachal Pradesh 81.15 - - - 80.00 - - -20 Jammu & Kashmir - - - - - - - -21 Jharkhand 31.31 54.63 54.63 - 32.49 33.58 30.90 2.6822 Manipur - - - - - 41.90 41.90 -23 Meghalaya 41.67 60.36 59.50 0.86 48.18 63.35 60.42 2.9324 Mizoram 60.00 120.20 120.20 - - - - -25 Nagaland - - - - - - - -26 Sikkim - 76.71 60.00 16.71 56.35 70.00 58.40 11.6027 Tripura 43.04 63.95 63.95 - 32.61 60.00 60.00 -28 Uttranchal - - - - - 31.43 31.43 -29 A & N Islands - - - - - - - -30 Chandigarh - - - - - - - -31 D & N Haveli - 41.89 41.89 - 41.52 52.23 46.82 5.4132 Daman & Diu - - - - 30.00 85.45 65.45 20.0033 Delhi - - - - - - - -34 Lakshadweep - - - - 40.00 166.71 166.71 -35 Pondicherry - - - - 47.14 - - -
ALL-INDIA 32.13 39.89 31.11 8.78 18.20 41.04 37.07 3.97
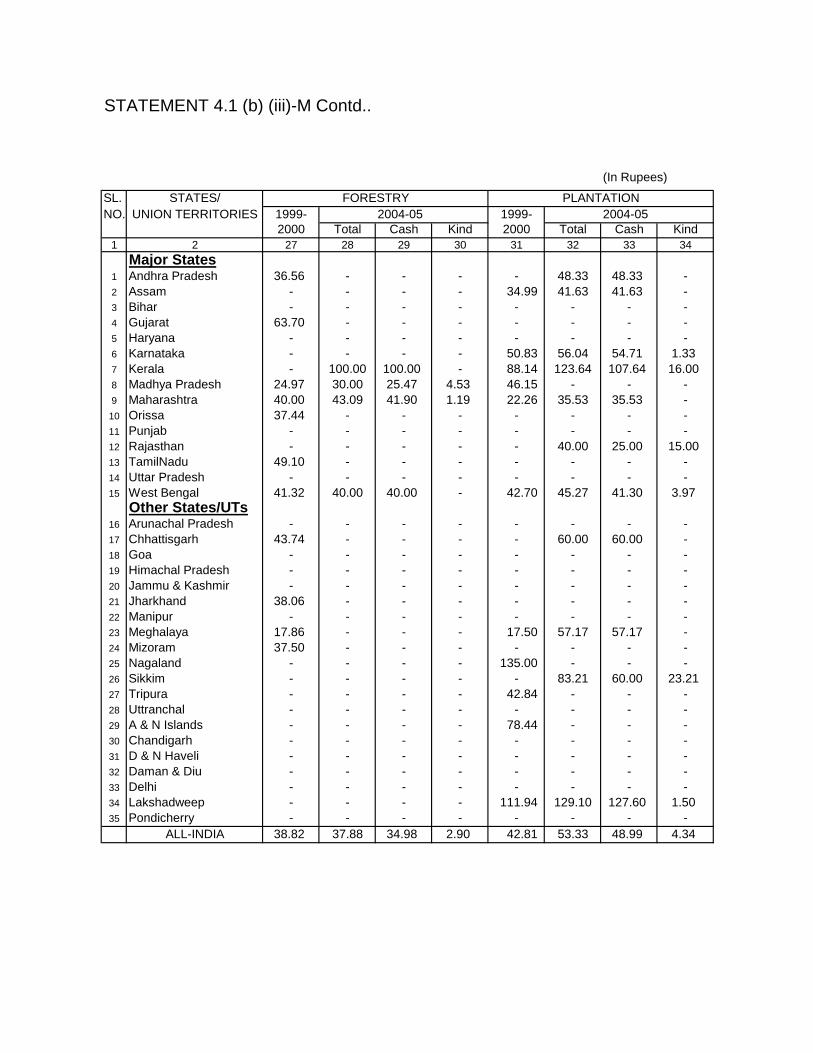
STATEMENT 4.1 (b) (iii)-M Contd..
(In Rupees)
SL. STATES/ FORESTRY PLANTATIONNO. UNION TERRITORIES 1999- 2004-05 1999- 2004-05
2000 Total Cash Kind 2000 Total Cash Kind1 2 27 28 29 30 31 32 33 34
Major States1 Andhra Pradesh 36.56 - - - - 48.33 48.33 -2 Assam - - - - 34.99 41.63 41.63 -3 Bihar - - - - - - - -4 Gujarat 63.70 - - - - - - -5 Haryana - - - - - - - -6 Karnataka - - - - 50.83 56.04 54.71 1.337 Kerala - 100.00 100.00 - 88.14 123.64 107.64 16.008 Madhya Pradesh 24.97 30.00 25.47 4.53 46.15 - - -9 Maharashtra 40.00 43.09 41.90 1.19 22.26 35.53 35.53 -
10 Orissa 37.44 - - - - - - -11 Punjab - - - - - - - -12 Rajasthan - - - - - 40.00 25.00 15.0013 TamilNadu 49.10 - - - - - - -14 Uttar Pradesh - - - - - - - -15 West Bengal 41.32 40.00 40.00 - 42.70 45.27 41.30 3.97
Other States/UTs16 Arunachal Pradesh - - - - - - - -17 Chhattisgarh 43.74 - - - - 60.00 60.00 -18 Goa - - - - - - - -19 Himachal Pradesh - - - - - - - -20 Jammu & Kashmir - - - - - - - -21 Jharkhand 38.06 - - - - - - -22 Manipur - - - - - - - -23 Meghalaya 17.86 - - - 17.50 57.17 57.17 -24 Mizoram 37.50 - - - - - - -25 Nagaland - - - - 135.00 - - -26 Sikkim - - - - - 83.21 60.00 23.2127 Tripura - - - - 42.84 - - -28 Uttranchal - - - - - - - -29 A & N Islands - - - - 78.44 - - -30 Chandigarh - - - - - - - -31 D & N Haveli - - - - - - - -32 Daman & Diu - - - - - - - -33 Delhi - - - - - - - -34 Lakshadweep - - - - 111.94 129.10 127.60 1.5035 Pondicherry - - - - - - - -
ALL-INDIA 38.82 37.88 34.98 2.90 42.81 53.33 48.99 4.34

STATEMENT 4.1 (b) (iii)-M Concld..
(In Rupees)
SL. STATES/ ANIMAL HUSBANDRY FISHERIES OTHERS (AGRICULTURAL)NO. UNION TERRITORIES 1999- 2004-05 1999- 2004-05 1999- 2004-05
2000 Total Cash Kind 2000 Total Cash Kind 2000 Total Cash Kind1 2 35 36 37 38 39 40 41 42 43 44 45 46
Major States1 Andhra Pradesh 19.90 24.43 11.52 12.91 10.00 80.04 80.04 - 32.58 41.65 41.65 -2 Assam - - - - - - - - 38.42 62.92 55.84 7.083 Bihar - - - - - - - - 20.00 - - -4 Gujarat 13.74 - - - - - - - 30.71 35.63 34.28 1.355 Haryana - - - - - - - - 60.00 - - -6 Karnataka - - - - - - - - 43.52 32.64 32.41 0.237 Kerala - - - - - - - - 67.75 104.39 86.75 17.648 Madhya Pradesh 22.40 22.86 22.86 - - - - - 31.11 30.78 29.53 1.259 Maharashtra 25.00 24.25 24.25 - 30.00 108.91 64.39 44.52 40.98 30.15 30.15 -10 Orissa 19.19 - - - - - - - 24.73 24.85 24.79 0.0611 Punjab - - - - 35.71 - - - 35.71 - - -12 Rajasthan 17.14 - - - - - - - 44.28 54.30 51.30 3.0013 TamilNadu - - - - - - - - - 54.29 54.29 -14 Uttar Pradesh - 26.71 26.71 - - - - - 21.43 50.00 40.00 10.0015 West Bengal - - - - 52.22 26.71 26.71 - 42.72 45.98 45.98 -
Other States/UTs16 Arunachal Pradesh - - - - - - - - 83.00 - - -17 Chhattisgarh 34.12 20.00 20.00 - - - - - 30.86 37.32 33.81 3.5118 Goa - - - - - - - - - - - -19 Himachal Pradesh - - - - - - - - - - - -20 Jammu & Kashmir - - - - - - - - - - - -21 Jharkhand - - - - - - - - 32.40 23.53 16.15 7.3822 Manipur - - - - - - - - 58.41 - - -23 Meghalaya - - - - - - - - 49.79 39.31 38.72 0.5924 Mizoram - - - - - - - - 73.00 - - -25 Nagaland - - - - - - - - - - - -26 Sikkim - - - - - - - - 48.85 - - -27 Tripura - - - - - - - - 39.22 62.59 60.42 2.1728 Uttranchal - - - - - - - - - - - -29 A & N Islands - - - - - - - - - - - -30 Chandigarh - - - - - - - - - - - -31 D & N Haveli - - - - - - - - 37.74 48.97 46.91 2.0632 Daman & Diu - - - - 74.27 60.00 40.00 20.00 - - - -33 Delhi - - - - - - - - - - - -34 Lakshadweep - - - - - - - - 46.00 125.00 125.00 -35 Pondicherry - - - - - - - - - - - -
ALL-INDIA 22.14 24.14 19.72 4.42 33.54 74.30 62.04 12.26 36.41 35.86 34.32 1.54

STATEMENT 4.1 (b) (iv)-M
AVERAGE DAILY EARNINGS OF MEN BELONGING TO OTHER BACKWARD CLASSESAGRICULTURAL LABOUR HOUSEHOLDS IN DIFFERENT AGRICULTURAL OCCUPATIONS
(In Rupees)
SL. STATES/ PLOUGHING SOWINGNO. UNION TERRITORIES 1999- 2004-05 1999- 2004-05
2000 Total Cash Kind 2000 Total Cash Kind1 2 3 4 5 6 7 8 9 10
Major States1 Andhra Pradesh 35.05 48.24 46.98 1.26 34.94 29.10 26.21 2.892 Assam 53.42 60.92 52.80 8.12 27.32 70.00 50.00 20.003 Bihar 41.37 48.46 38.71 9.75 34.99 43.06 31.54 11.524 Gujarat 31.33 51.21 51.21 - 57.78 40.65 40.65 -5 Haryana - - - - 48.41 66.33 66.33 -6 Karnataka 42.78 59.46 56.00 3.46 42.36 31.01 30.59 0.427 Kerala 99.32 115.47 106.88 8.59 - - - -8 Madhya Pradesh 36.25 43.14 38.17 4.97 31.75 40.21 33.03 7.189 Maharashtra 39.57 47.74 46.68 1.06 39.15 45.91 45.91 -
10 Orissa 29.57 46.54 43.39 3.15 35.00 50.00 50.00 -11 Punjab 70.83 106.79 84.75 22.04 66.06 62.13 60.08 2.0512 Rajasthan 30.00 - - - 85.00 56.45 56.45 -13 TamilNadu 55.31 75.35 73.51 1.84 52.45 60.04 60.04 -14 Uttar Pradesh 35.99 49.00 48.71 0.29 30.63 46.05 46.05 -15 West Bengal 46.79 57.57 52.37 5.20 37.27 51.72 39.82 11.90
Other States/UTs16 Arunachal Pradesh - - - - - - - -17 Chhattisgarh 34.38 36.95 25.66 11.29 - - - -18 Goa - - - - - - - -19 Himachal Pradesh - - - - - - - -20 Jammu & Kashmir 74.19 - - - - - - -21 Jharkhand 36.16 35.39 34.02 1.37 40.00 40.00 40.00 -22 Manipur 55.58 - - - - - - -23 Meghalaya - - - - - - - -24 Mizoram - - - - - - - -25 Nagaland - - - - - - - -26 Sikkim 53.78 70.00 60.00 10.00 44.94 - - -27 Tripura 44.99 75.26 75.26 - 62.42 78.57 78.57 -28 Uttranchal - 50.00 50.00 - - 50.00 50.00 -29 A & N Islands - - - - - - - -30 Chandigarh - - - - - - - -31 D & N Haveli - - - - - - - -32 Daman & Diu - - - - - - - -33 Delhi - 110.00 80.00 30.00 - - - -34 Lakshadweep - - - - - - - -35 Pondicherry 65.00 50.00 50.00 - - - - -
ALL-INDIA 41.45 54.86 50.57 4.29 38.36 45.74 39.84 5.90
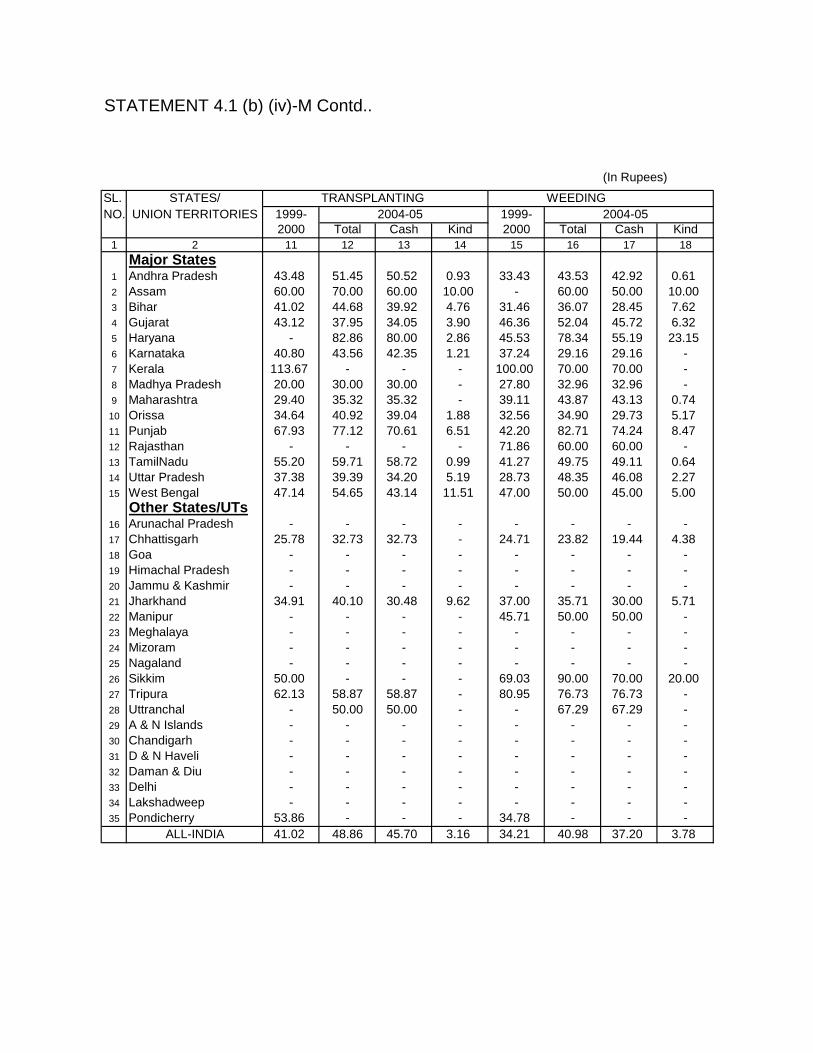
STATEMENT 4.1 (b) (iv)-M Contd..
(In Rupees)
SL. STATES/ TRANSPLANTING WEEDINGNO. UNION TERRITORIES 1999- 2004-05 1999- 2004-05
2000 Total Cash Kind 2000 Total Cash Kind1 2 11 12 13 14 15 16 17 18
Major States1 Andhra Pradesh 43.48 51.45 50.52 0.93 33.43 43.53 42.92 0.612 Assam 60.00 70.00 60.00 10.00 - 60.00 50.00 10.003 Bihar 41.02 44.68 39.92 4.76 31.46 36.07 28.45 7.624 Gujarat 43.12 37.95 34.05 3.90 46.36 52.04 45.72 6.325 Haryana - 82.86 80.00 2.86 45.53 78.34 55.19 23.156 Karnataka 40.80 43.56 42.35 1.21 37.24 29.16 29.16 -7 Kerala 113.67 - - - 100.00 70.00 70.00 -8 Madhya Pradesh 20.00 30.00 30.00 - 27.80 32.96 32.96 -9 Maharashtra 29.40 35.32 35.32 - 39.11 43.87 43.13 0.74
10 Orissa 34.64 40.92 39.04 1.88 32.56 34.90 29.73 5.1711 Punjab 67.93 77.12 70.61 6.51 42.20 82.71 74.24 8.4712 Rajasthan - - - - 71.86 60.00 60.00 -13 TamilNadu 55.20 59.71 58.72 0.99 41.27 49.75 49.11 0.6414 Uttar Pradesh 37.38 39.39 34.20 5.19 28.73 48.35 46.08 2.2715 West Bengal 47.14 54.65 43.14 11.51 47.00 50.00 45.00 5.00
Other States/UTs16 Arunachal Pradesh - - - - - - - -17 Chhattisgarh 25.78 32.73 32.73 - 24.71 23.82 19.44 4.3818 Goa - - - - - - - -19 Himachal Pradesh - - - - - - - -20 Jammu & Kashmir - - - - - - - -21 Jharkhand 34.91 40.10 30.48 9.62 37.00 35.71 30.00 5.7122 Manipur - - - - 45.71 50.00 50.00 -23 Meghalaya - - - - - - - -24 Mizoram - - - - - - - -25 Nagaland - - - - - - - -26 Sikkim 50.00 - - - 69.03 90.00 70.00 20.0027 Tripura 62.13 58.87 58.87 - 80.95 76.73 76.73 -28 Uttranchal - 50.00 50.00 - - 67.29 67.29 -29 A & N Islands - - - - - - - -30 Chandigarh - - - - - - - -31 D & N Haveli - - - - - - - -32 Daman & Diu - - - - - - - -33 Delhi - - - - - - - -34 Lakshadweep - - - - - - - -35 Pondicherry 53.86 - - - 34.78 - - -
ALL-INDIA 41.02 48.86 45.70 3.16 34.21 40.98 37.20 3.78

STATEMENT 4.1 (b) (iv)-M Contd..
(In Rupees)
SL. STATES/ HARVESTING CULTIVATIONNO. UNION TERRITORIES 1999- 2004-05 1999- 2004-05
2000 Total Cash Kind 2000 Total Cash Kind1 2 19 20 21 22 23 24 25 26
Major States1 Andhra Pradesh 40.31 49.29 48.75 0.54 38.05 45.18 44.13 1.052 Assam 38.77 63.78 45.89 17.89 42.31 59.71 47.62 12.093 Bihar 35.81 44.60 21.90 22.70 34.83 43.52 34.17 9.354 Gujarat 50.23 44.39 43.46 0.93 37.66 48.62 45.76 2.865 Haryana 57.64 73.89 38.30 35.59 42.40 67.91 59.04 8.876 Karnataka 40.72 49.33 38.13 11.20 44.41 43.75 41.36 2.397 Kerala 44.15 98.99 98.99 - 95.53 131.25 118.63 12.628 Madhya Pradesh 30.77 30.52 18.05 12.47 28.93 35.91 27.68 8.239 Maharashtra 37.37 45.92 44.45 1.47 35.67 44.79 42.59 2.20
10 Orissa 26.06 36.56 34.99 1.57 26.59 41.87 41.15 0.7211 Punjab 65.92 52.20 50.15 2.05 70.37 72.49 63.92 8.5712 Rajasthan 55.36 71.26 65.35 5.91 42.52 62.37 59.62 2.7513 TamilNadu 51.98 61.46 36.92 24.54 51.93 67.19 63.78 3.4114 Uttar Pradesh 38.74 49.50 41.06 8.44 41.92 48.37 45.28 3.0915 West Bengal 42.47 45.11 41.95 3.16 39.96 47.90 40.16 7.74
Other States/UTs16 Arunachal Pradesh - - - - 71.43 - - -17 Chhattisgarh 24.14 25.90 15.41 10.49 26.17 31.06 24.60 6.4618 Goa - - - - - - - -19 Himachal Pradesh - - - - 70.00 - - -20 Jammu & Kashmir 108.95 - - - 57.15 - - -21 Jharkhand 34.92 65.69 64.65 1.04 35.04 37.24 34.58 2.6622 Manipur 57.14 77.65 77.65 - - 55.72 55.72 -23 Meghalaya - - - - - - - -24 Mizoram - - - - - - - -25 Nagaland - - - - - - - -26 Sikkim 46.85 80.00 60.00 20.00 45.50 70.66 57.11 13.5527 Tripura 96.97 65.92 65.92 - 48.37 74.22 61.56 12.6628 Uttranchal 60.22 56.86 49.84 7.02 - 58.38 58.38 -29 A & N Islands - - - - - - - -30 Chandigarh - - - - - - - -31 D & N Haveli - - - - - - - -32 Daman & Diu - - - - - - - -33 Delhi 80.00 - - - - - - -34 Lakshadweep - - - - - - - -35 Pondicherry 53.20 73.17 46.83 26.34 47.34 80.43 71.47 8.96
ALL-INDIA 38.47 46.80 36.22 10.58 39.66 47.98 43.66 4.32
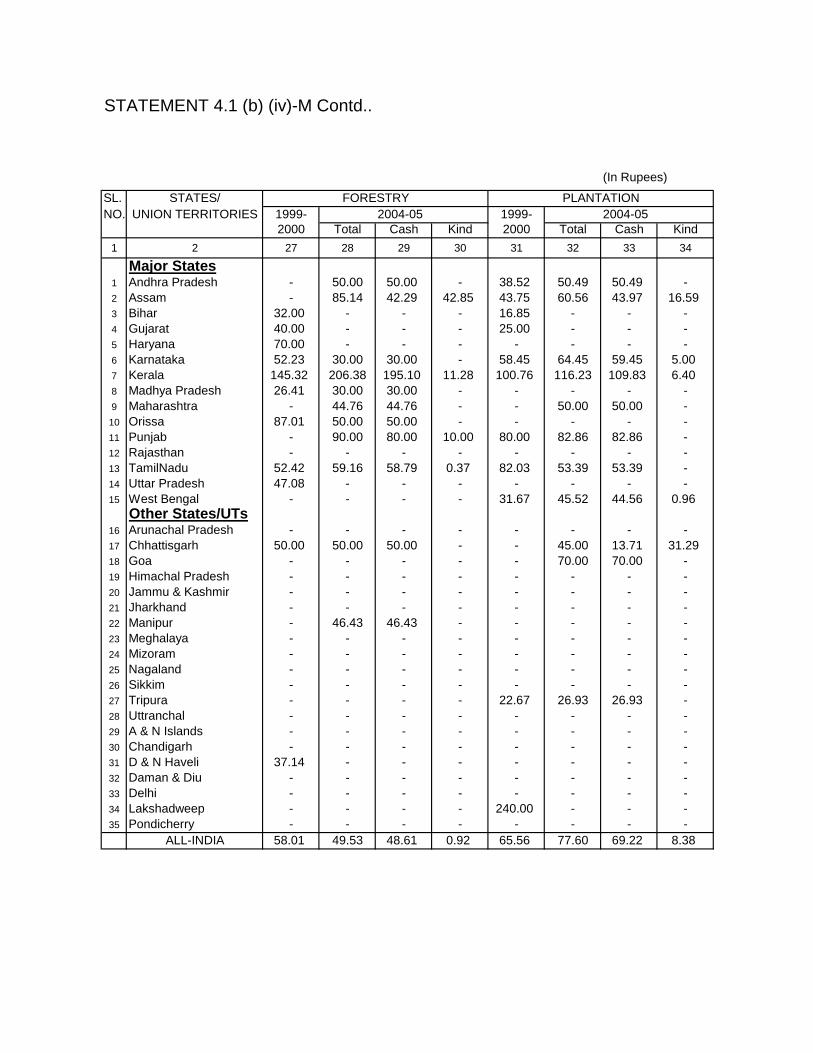
STATEMENT 4.1 (b) (iv)-M Contd..
(In Rupees)
SL. STATES/ FORESTRY PLANTATIONNO. UNION TERRITORIES 1999- 2004-05 1999- 2004-05
2000 Total Cash Kind 2000 Total Cash Kind1 2 27 28 29 30 31 32 33 34
Major States1 Andhra Pradesh - 50.00 50.00 - 38.52 50.49 50.49 -2 Assam - 85.14 42.29 42.85 43.75 60.56 43.97 16.593 Bihar 32.00 - - - 16.85 - - -4 Gujarat 40.00 - - - 25.00 - - -5 Haryana 70.00 - - - - - - -6 Karnataka 52.23 30.00 30.00 - 58.45 64.45 59.45 5.007 Kerala 145.32 206.38 195.10 11.28 100.76 116.23 109.83 6.408 Madhya Pradesh 26.41 30.00 30.00 - - - - -9 Maharashtra - 44.76 44.76 - - 50.00 50.00 -
10 Orissa 87.01 50.00 50.00 - - - - -11 Punjab - 90.00 80.00 10.00 80.00 82.86 82.86 -12 Rajasthan - - - - - - - -13 TamilNadu 52.42 59.16 58.79 0.37 82.03 53.39 53.39 -14 Uttar Pradesh 47.08 - - - - - - -15 West Bengal - - - - 31.67 45.52 44.56 0.96
Other States/UTs16 Arunachal Pradesh - - - - - - - -17 Chhattisgarh 50.00 50.00 50.00 - - 45.00 13.71 31.2918 Goa - - - - - 70.00 70.00 -19 Himachal Pradesh - - - - - - - -20 Jammu & Kashmir - - - - - - - -21 Jharkhand - - - - - - - -22 Manipur - 46.43 46.43 - - - - -23 Meghalaya - - - - - - - -24 Mizoram - - - - - - - -25 Nagaland - - - - - - - -26 Sikkim - - - - - - - -27 Tripura - - - - 22.67 26.93 26.93 -28 Uttranchal - - - - - - - -29 A & N Islands - - - - - - - -30 Chandigarh - - - - - - - -31 D & N Haveli 37.14 - - - - - - -32 Daman & Diu - - - - - - - -33 Delhi - - - - - - - -34 Lakshadweep - - - - 240.00 - - -35 Pondicherry - - - - - - - -
ALL-INDIA 58.01 49.53 48.61 0.92 65.56 77.60 69.22 8.38

STATEMENT 4.1 (b) (iv)-M Concld..
(In Rupees)
SL. STATES/ ANIMAL HUSBANDRY FISHERIES OTHERS (AGRICULTURAL)NO. UNION TERRITORIES 1999- 2004-05 1999- 2004-05 1993-94 1999-2000
2000 Total Cash Kind 2000 Total Cash Kind Total Cash Kind
1 2 35 36 37 38 39 40 41 42 43 44 45 46Major States
1 Andhra Pradesh 18.70 27.87 27.22 0.65 58.42 34.00 29.71 4.29 38.70 43.78 43.32 0.462 Assam - - - - - - - - 51.71 66.74 53.20 13.543 Bihar 31.07 58.67 58.67 - 54.47 - - - 31.78 46.97 36.85 10.124 Gujarat 45.34 55.75 55.75 - - - - - 44.02 57.76 47.98 9.785 Haryana 32.86 73.62 65.77 7.85 - - - - 73.61 92.59 91.77 0.826 Karnataka 17.56 - - - 70.00 - - - 38.33 45.11 40.38 4.737 Kerala 184.29 97.79 89.20 8.59 71.70 165.33 162.67 2.66 101.90 122.70 121.48 1.228 Madhya Pradesh 26.11 19.59 19.59 - - - - - 29.67 41.07 41.07 -9 Maharashtra 26.20 28.19 28.19 - 34.29 60.00 60.00 - 37.92 51.90 50.99 0.9110 Orissa 30.43 28.57 28.57 - 48.85 - - - 32.90 38.37 38.37 -11 Punjab 71.77 81.29 69.39 11.90 60.00 - - - 69.60 - - -12 Rajasthan - - - - - - - - 61.21 61.30 59.24 2.0613 TamilNadu 24.61 52.59 52.55 0.04 89.30 - - - 57.92 66.80 66.61 0.1914 Uttar Pradesh 25.00 57.26 50.00 7.26 - - - - 47.16 48.27 41.85 6.4215 West Bengal - - - - - - - - 47.80 - - -
Other States/UTs16 Arunachal Pradesh - - - - - - - - 115.04 - - -17 Chhattisgarh 18.54 20.06 4.35 15.71 - - - - 29.04 28.02 19.44 8.5818 Goa - - - - - - - - - 91.73 70.68 21.0519 Himachal Pradesh - - - - - - - - 70.00 - - -20 Jammu & Kashmir - 71.43 71.43 - - - - - 100.00 110.74 86.79 23.9521 Jharkhand - 29.14 20.29 8.85 30.00 - - - 29.78 15.58 4.70 10.8822 Manipur - - - - 60.00 - - - 70.00 70.00 70.00 -23 Meghalaya - - - - - - - - - - - -24 Mizoram - - - - - - - - - - - -25 Nagaland - - - - - - - - - - - -26 Sikkim - - - - - - - - 53.33 89.29 89.29 -27 Tripura - - - - - - - - 64.29 - - -28 Uttranchal - - - - - - - - - - - -29 A & N Islands - - - - - - - - - - - -30 Chandigarh - - - - - - - - 122.37 - - -31 D & N Haveli - - - - - - - - - - - -32 Daman & Diu - - - - - 113.57 92.86 20.71 - - - -33 Delhi - - - - - - - - - - - -34 Lakshadweep - - - - - - - - 120.00 - - -35 Pondicherry 50.00 32.00 20.00 12.00 - - - - 51.39 90.00 84.00 6.00
ALL-INDIA 27.87 35.28 32.09 3.19 59.32 70.39 66.32 4.07 43.63 51.13 47.89 3.24

STATEMENT 4.1 (b) (i)-W
AVERAGE DAILY EARNINGS OF WOMEN BELONGING TO ALL AGRICULTURAL LABOUR HOUSEHOLDS IN DIFFERENT AGRICULTURAL OCCUPATIONS
(In Rupees)
SL. STATES/ PLOUGHING SOWINGNO. UNION TERRITORIES 1999- 2004-05 1999- 2004-05
2000 Total Cash Kind 2000 Total Cash Kind1 2 3 4 5 6 7 8 9 10
Major States1 Andhra Pradesh 37.96 36.17 32.83 3.34 24.15 27.79 23.35 4.442 Assam - 50.00 50.00 - 33.75 50.59 45.65 4.943 Bihar 35.16 34.19 21.51 12.68 33.07 45.16 40.66 4.504 Gujarat 28.02 67.50 67.50 - 38.72 19.07 18.84 0.235 Haryana - 70.00 50.00 20.00 40.00 - - -6 Karnataka 28.34 27.83 27.83 - 30.74 27.63 25.08 2.557 Kerala 84.16 80.00 80.00 - 60.00 178.18 156.36 21.828 Madhya Pradesh 26.31 44.02 44.02 - 27.89 28.86 18.45 10.419 Maharashtra 32.11 34.61 34.61 - 24.42 28.19 28.19 -
10 Orissa 26.88 22.32 11.56 10.76 - 55.00 50.00 5.0011 Punjab 97.14 - - - - - - -12 Rajasthan - - - - - 47.50 40.00 7.5013 TamilNadu 28.50 19.65 19.65 - 28.15 37.73 37.17 0.5614 Uttar Pradesh 32.77 50.00 50.00 - 25.83 39.94 39.27 0.6715 West Bengal 45.22 43.08 43.08 - 42.31 50.93 34.47 16.46
Other States/UTs16 Arunachal Pradesh - - - - - 23.57 - 23.5717 Chhattisgarh 42.86 - - - 40.00 26.67 20.00 6.6718 Goa - - - - - - - -19 Himachal Pradesh - - - - - - - -20 Jammu & Kashmir - - - - - - - -21 Jharkhand 32.22 40.97 37.96 3.01 27.24 31.76 29.13 2.6322 Manipur - - - - - - - -23 Meghalaya 40.00 42.86 42.86 - 30.00 - - -24 Mizoram - - - - - - - -25 Nagaland - - - - - - - -26 Sikkim 38.27 - - - 52.91 75.00 60.00 15.0027 Tripura 41.66 80.00 80.00 - 30.00 60.00 60.00 -28 Uttranchal - - - - - 53.33 53.33 -29 A & N Islands - - - - - - - -30 Chandigarh - - - - - - - -31 D & N Haveli - - - - - - - -32 Daman & Diu - - - - - - - -33 Delhi - - - - - - - -34 Lakshadweep - - - - - - - -35 Pondicherry - - - - - - - -
ALL-INDIA 33.21 36.86 33.34 3.52 28.30 32.09 27.99 4.10

STATEMENT 4.1 (b) (i)-W Contd..
(In Rupees)
SL. STATES/ TRANSPLANTING WEEDINGNO. UNION TERRITORIES 1999- 2004-05 1999- 2004-05
2000 Total Cash Kind 2000 Total Cash Kind1 2 11 12 13 14 15 16 17 18
Major States1 Andhra Pradesh 27.88 37.06 36.07 0.99 24.42 27.45 27.04 0.412 Assam 30.83 56.90 55.55 1.35 38.34 - - -3 Bihar 29.72 38.08 26.59 11.49 31.95 30.86 20.29 10.574 Gujarat 38.59 37.49 34.12 3.37 33.84 38.55 33.32 5.235 Haryana 60.52 62.18 50.73 11.45 50.00 52.70 27.07 25.636 Karnataka 28.30 33.74 31.92 1.82 24.30 26.92 25.62 1.307 Kerala 70.61 59.43 55.94 3.49 70.87 65.77 61.12 4.658 Madhya Pradesh 24.25 29.90 19.73 10.17 25.23 28.07 24.48 3.599 Maharashtra 25.25 28.50 28.05 0.45 24.12 27.72 27.50 0.22
10 Orissa 22.79 25.87 22.06 3.81 21.57 30.88 22.76 8.1211 Punjab 40.00 68.11 60.19 7.92 59.37 50.00 50.00 -12 Rajasthan - - - - 34.69 36.27 28.87 7.4013 TamilNadu 29.96 34.57 32.85 1.72 25.75 31.64 30.64 1.0014 Uttar Pradesh 27.91 46.99 34.33 12.66 22.84 38.63 25.00 13.6315 West Bengal 39.46 50.75 41.08 9.67 41.11 35.15 32.48 2.67
Other States/UTs16 Arunachal Pradesh - - - - - - - -17 Chhattisgarh 24.49 26.97 19.88 7.09 20.98 23.39 15.08 8.3118 Goa - 60.00 60.00 - - - - -19 Himachal Pradesh - - - - - - - -20 Jammu & Kashmir - - - - - - - -21 Jharkhand 28.49 37.40 32.82 4.58 19.94 42.55 40.50 2.0522 Manipur - 60.00 60.00 - 50.00 50.00 50.00 -23 Meghalaya - 43.24 43.24 - 44.97 37.06 36.59 0.4724 Mizoram - - - - - - - -25 Nagaland - - - - - - - -26 Sikkim - - - - 48.98 50.00 40.00 10.0027 Tripura - 66.29 66.29 - 43.42 59.45 59.45 -28 Uttranchal - 50.00 50.00 - 50.00 44.48 40.97 3.5129 A & N Islands - - - - 125.00 - - -30 Chandigarh - - - - - - - -31 D & N Haveli 20.00 56.08 43.17 12.91 - - - -32 Daman & Diu 63.00 - - - - - - -33 Delhi - - - - - - - -34 Lakshadweep - - - - - - - -35 Pondicherry 26.69 - - - 22.84 33.90 33.90 -
ALL-INDIA 28.59 36.58 33.00 3.58 25.41 29.86 27.39 2.47
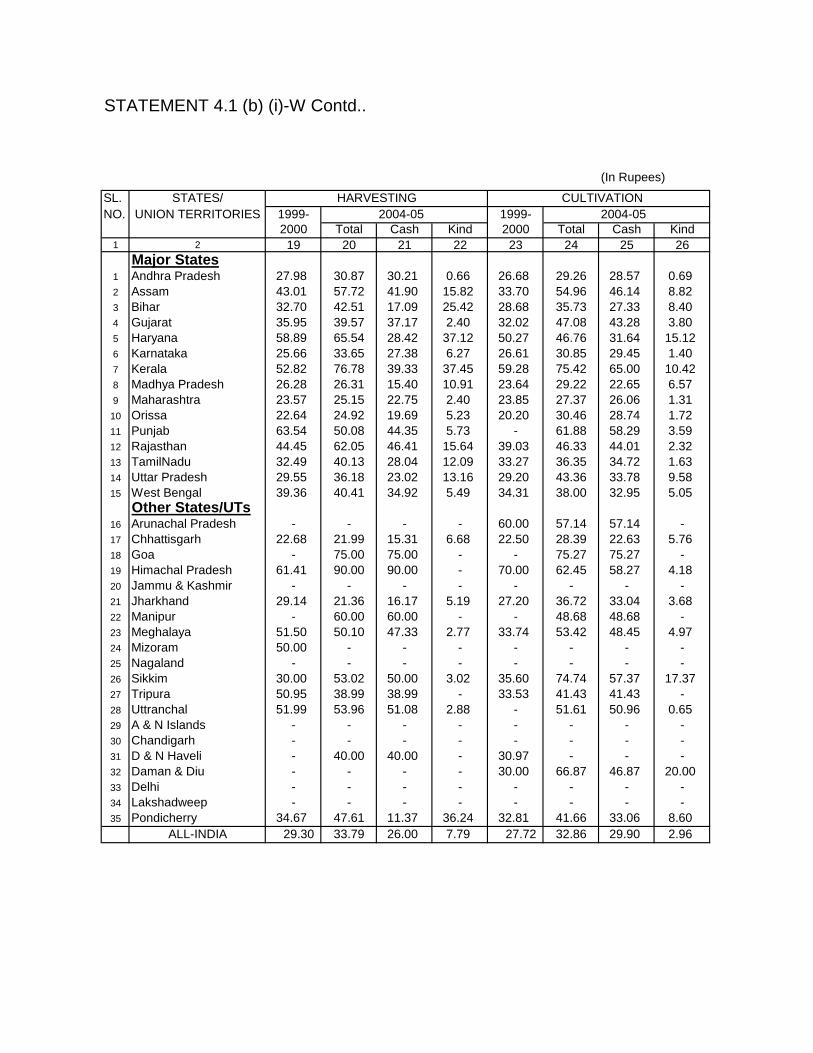
STATEMENT 4.1 (b) (i)-W Contd..
(In Rupees)
SL. STATES/ HARVESTING CULTIVATIONNO. UNION TERRITORIES 1999- 2004-05 1999- 2004-05
2000 Total Cash Kind 2000 Total Cash Kind1 2 19 20 21 22 23 24 25 26
Major States1 Andhra Pradesh 27.98 30.87 30.21 0.66 26.68 29.26 28.57 0.692 Assam 43.01 57.72 41.90 15.82 33.70 54.96 46.14 8.823 Bihar 32.70 42.51 17.09 25.42 28.68 35.73 27.33 8.404 Gujarat 35.95 39.57 37.17 2.40 32.02 47.08 43.28 3.805 Haryana 58.89 65.54 28.42 37.12 50.27 46.76 31.64 15.126 Karnataka 25.66 33.65 27.38 6.27 26.61 30.85 29.45 1.407 Kerala 52.82 76.78 39.33 37.45 59.28 75.42 65.00 10.428 Madhya Pradesh 26.28 26.31 15.40 10.91 23.64 29.22 22.65 6.579 Maharashtra 23.57 25.15 22.75 2.40 23.85 27.37 26.06 1.31
10 Orissa 22.64 24.92 19.69 5.23 20.20 30.46 28.74 1.7211 Punjab 63.54 50.08 44.35 5.73 - 61.88 58.29 3.5912 Rajasthan 44.45 62.05 46.41 15.64 39.03 46.33 44.01 2.3213 TamilNadu 32.49 40.13 28.04 12.09 33.27 36.35 34.72 1.6314 Uttar Pradesh 29.55 36.18 23.02 13.16 29.20 43.36 33.78 9.5815 West Bengal 39.36 40.41 34.92 5.49 34.31 38.00 32.95 5.05
Other States/UTs16 Arunachal Pradesh - - - - 60.00 57.14 57.14 -17 Chhattisgarh 22.68 21.99 15.31 6.68 22.50 28.39 22.63 5.7618 Goa - 75.00 75.00 - - 75.27 75.27 -19 Himachal Pradesh 61.41 90.00 90.00 - 70.00 62.45 58.27 4.1820 Jammu & Kashmir - - - - - - - -21 Jharkhand 29.14 21.36 16.17 5.19 27.20 36.72 33.04 3.6822 Manipur - 60.00 60.00 - - 48.68 48.68 -23 Meghalaya 51.50 50.10 47.33 2.77 33.74 53.42 48.45 4.9724 Mizoram 50.00 - - - - - - -25 Nagaland - - - - - - - -26 Sikkim 30.00 53.02 50.00 3.02 35.60 74.74 57.37 17.3727 Tripura 50.95 38.99 38.99 - 33.53 41.43 41.43 -28 Uttranchal 51.99 53.96 51.08 2.88 - 51.61 50.96 0.6529 A & N Islands - - - - - - - -30 Chandigarh - - - - - - - -31 D & N Haveli - 40.00 40.00 - 30.97 - - -32 Daman & Diu - - - - 30.00 66.87 46.87 20.0033 Delhi - - - - - - - -34 Lakshadweep - - - - - - - -35 Pondicherry 34.67 47.61 11.37 36.24 32.81 41.66 33.06 8.60
ALL-INDIA 29.30 33.79 26.00 7.79 27.72 32.86 29.90 2.96

STATEMENT 4.1 (b) (i)-W Contd..
(In Rupees)
SL. STATES/ FORESTRY PLANTATIONNO. UNION TERRITORIES 1999- 2004-05 1999- 2004-05
2000 Total Cash Kind 2000 Total Cash Kind1 2 27 28 29 30 31 32 33 34
Major States1 Andhra Pradesh 36.91 40.00 40.00 - 18.97 31.11 30.05 1.062 Assam - - - - 40.88 54.92 44.58 10.343 Bihar - - - - 20.00 - - -4 Gujarat 40.00 - - - 21.59 - - -5 Haryana - 30.00 30.00 - - - - -6 Karnataka - - - - 44.04 49.38 46.55 2.837 Kerala - 70.00 60.00 10.00 66.06 73.57 71.77 1.808 Madhya Pradesh 27.36 29.22 24.73 4.49 - - - -9 Maharashtra 31.69 - - - 37.53 36.89 36.89 -
10 Orissa 36.82 22.76 22.76 - - - - -11 Punjab - - - - - - - -12 Rajasthan - - - - - - - -13 TamilNadu 31.40 33.93 33.65 0.28 51.97 59.19 59.19 -14 Uttar Pradesh - - - - - - - -15 West Bengal - 24.00 20.00 4.00 39.04 45.31 42.05 3.26
Other States/UTs16 Arunachal Pradesh - - - - - - - -17 Chhattisgarh 34.88 50.00 50.00 - 18.33 60.00 60.00 -18 Goa - - - - - - - -19 Himachal Pradesh - - - - - - - -20 Jammu & Kashmir - - - - - - - -21 Jharkhand - - - - - - - -22 Manipur - 40.91 40.91 - - - - -23 Meghalaya 17.43 - - - 14.86 42.64 42.64 -24 Mizoram - - - - - - - -25 Nagaland - - - - - - - -26 Sikkim - - - - - - - -27 Tripura - - - - 25.91 33.89 33.89 -28 Uttranchal - - - - - - - -29 A & N Islands - 176.57 176.57 - - - - -30 Chandigarh - - - - - - - -31 D & N Haveli - - - - - - - -32 Daman & Diu - - - - - - - -33 Delhi - - - - - - - -34 Lakshadweep - - - - - - - -35 Pondicherry - - - - - - - -
ALL-INDIA 33.41 31.76 29.84 1.92 43.99 53.63 49.57 4.06

STATEMENT 4.1 (b) (i)-W Concld..
(In Rupees)
SL. STATES/ ANIMAL HUSBANDRY FISHERIES OTHERS (AGRICULTURAL)NO. UNION TERRITORIES 1999- 2004-05 1999- 2004-05 1999- 2004-05
2000 Total Cash Kind 2000 Total Cash Kind 2000 Total Cash Kind1 2 35 36 37 38 39 40 41 42 43 44 45 46
Major States1 Andhra Pradesh 13.91 30.00 30.00 - 40.00 - - - 25.77 35.65 34.77 0.882 Assam - - - - - - - - 41.52 67.64 57.90 9.743 Bihar 17.86 36.16 36.16 - - - - - 25.40 42.77 33.20 9.574 Gujarat 25.09 33.00 20.03 12.97 - - - - 36.02 45.73 40.65 5.085 Haryana - - - - - - - - 53.41 107.97 107.97 -6 Karnataka - 23.52 23.52 - 50.00 - - - 20.23 30.00 28.21 1.797 Kerala - 33.00 33.00 - - - - - 56.96 82.73 60.30 22.438 Madhya Pradesh 31.28 50.00 50.00 - - - - - 28.52 29.26 28.35 0.919 Maharashtra - 20.00 20.00 - - - - - 25.01 29.28 28.40 0.88
10 Orissa - 28.16 22.00 6.16 - - - - 21.31 26.08 26.08 -11 Punjab 23.47 41.23 21.86 19.37 - - - - 39.59 44.35 29.90 14.4512 Rajasthan 15.29 59.44 22.90 36.54 - - - - 34.40 50.20 45.80 4.4013 TamilNadu 28.02 24.57 18.40 6.17 25.71 - - - 31.33 31.43 31.22 0.2114 Uttar Pradesh 20.00 15.00 15.00 - - - - - 38.46 34.38 24.44 9.9415 West Bengal - - - - - 25.00 25.00 - 34.74 37.78 37.54 0.24
Other States/UTs16 Arunachal Pradesh - - - - - - - - - - - -17 Chhattisgarh 25.00 16.55 6.66 9.89 20.00 - - - 24.35 31.68 28.31 3.3718 Goa - - - - - - - - 50.00 53.57 53.57 -19 Himachal Pradesh - - - - - - - - 40.00 44.00 38.57 5.4320 Jammu & Kashmir - - - - - - - - - - - -21 Jharkhand - - - - - - - - 36.92 35.31 28.27 7.0422 Manipur - - - - - - - - 49.53 - - -23 Meghalaya - - - - - - - - 37.26 - - -24 Mizoram - - - - - - - - 145.58 - - -25 Nagaland - - - - - - - - - - - -26 Sikkim - 80.00 60.00 20.00 - - - - 32.00 89.29 89.29 -27 Tripura - 34.29 34.29 - - - - - - 55.19 55.19 -28 Uttranchal - - - - - - - - - - - -29 A & N Islands - - - - - - - - - - - -30 Chandigarh - - - - - - - - - - - -31 D & N Haveli - - - - - - - - 28.65 40.00 40.00 -32 Daman & Diu - - - - 44.76 - - - - 65.00 50.00 15.0033 Delhi - - - - - - - - - - - -34 Lakshadweep - - - - - - - - - - - -35 Pondicherry 30.00 - - - - - - - 30.28 39.00 36.00 3.00
ALL-INDIA 22.68 30.29 20.54 9.75 34.33 25.00 25.00 - 27.97 34.77 31.83 2.94

STATEMENT 4.1 (b) (ii)-W
AVERAGE DAILY EARNINGS OF WOMEN BELONGING TO SCHEDULED CASTES AGRICULTURAL LABOUR HOUSEHOLDS IN DIFFERENT
AGRICULTURAL OCCUPATIONS(In Rupees)
SL. STATES/ PLOUGHING SOWINGNO. UNION TERRITORIES 1999- 2004-05 1999- 2004-05
2000 Total Cash Kind 2000 Total Cash Kind1 2 3 4 5 6 7 8 9 10
Major States1 Andhra Pradesh 30.53 50.00 50.00 - 24.99 27.27 26.81 0.462 Assam - 50.00 50.00 - - 47.56 42.56 5.003 Bihar 37.75 34.19 21.51 12.68 36.77 37.06 35.59 1.474 Gujarat 35.00 - - - 40.00 10.00 10.00 -5 Haryana - 70.00 50.00 20.00 40.00 - - -6 Karnataka 28.22 25.00 25.00 - 31.95 37.19 29.46 7.737 Kerala 40.00 80.00 80.00 - - 178.18 156.37 21.818 Madhya Pradesh 25.00 40.00 40.00 - 26.39 31.75 24.83 6.929 Maharashtra 22.51 - - - 23.19 28.76 28.76 -
10 Orissa 22.14 25.00 25.00 - - - - -11 Punjab 97.14 - - - - - - -12 Rajasthan - - - - - - - -13 TamilNadu 20.73 37.50 37.50 - 29.60 41.37 39.67 1.7014 Uttar Pradesh 27.01 50.00 50.00 - 29.50 49.81 48.48 1.3315 West Bengal - 43.08 43.08 - 42.35 46.08 29.96 16.12
Other States/UTs16 Arunachal Pradesh - - - - - - - -17 Chhattisgarh 38.25 - - - - - - -18 Goa - - - - - - - -19 Himachal Pradesh - - - - - - - -20 Jammu & Kashmir - - - - - - - -21 Jharkhand 28.57 - - - - 60.00 60.00 -22 Manipur - - - - - - - -23 Meghalaya - - - - - - - -24 Mizoram - - - - - - - -25 Nagaland - - - - - - - -26 Sikkim 32.50 - - - - 75.00 60.00 15.0027 Tripura - 80.00 80.00 - - 60.00 60.00 -28 Uttranchal - - - - - 60.00 60.00 -29 A & N Islands - - - - - - - -30 Chandigarh - - - - - - - -31 D & N Haveli - - - - - - - -32 Daman & Diu - - - - - - - -33 Delhi - - - - - - - -34 Lakshadweep - - - - - - - -35 Pondicherry - - - - - - - -
ALL-INDIA 28.84 41.31 36.94 4.37 30.25 33.29 29.10 4.19

STATEMENT 4.1 (b) (ii)-W Contd..
(In Rupees)
SL. STATES/ TRANSPLANTING WEEDINGNO. UNION TERRITORIES 1999- 2004-05 1999- 2004-05
2000 Total Cash Kind 2000 Total Cash Kind1 2 11 12 13 14 15 16 17 18
Major States1 Andhra Pradesh 29.56 39.73 39.73 - 25.29 24.99 24.78 0.212 Assam 27.34 42.86 42.86 - - - - -3 Bihar 29.08 43.24 28.38 14.86 32.30 31.27 19.58 11.694 Gujarat 40.00 34.20 33.03 1.17 50.90 34.07 32.52 1.555 Haryana 60.52 35.00 35.00 - 50.00 53.43 16.05 37.386 Karnataka 31.11 34.84 33.50 1.34 26.64 28.13 25.40 2.737 Kerala 68.45 60.09 55.32 4.77 74.38 74.38 65.78 8.608 Madhya Pradesh 28.13 30.00 30.00 - 24.29 29.88 28.13 1.759 Maharashtra 26.11 9.82 8.41 1.41 23.46 27.23 26.86 0.37
10 Orissa 23.62 23.22 23.22 - 24.76 42.56 39.44 3.1211 Punjab 40.00 76.00 71.39 4.61 59.37 - - -12 Rajasthan - - - - 50.44 38.54 23.97 14.5713 TamilNadu 28.75 34.89 34.10 0.79 26.32 32.33 30.69 1.6414 Uttar Pradesh 28.84 52.53 44.50 8.03 20.65 38.56 24.15 14.4115 West Bengal 41.74 49.01 37.27 11.74 42.54 38.62 32.98 5.64
Other States/UTs16 Arunachal Pradesh - - - - - - - -17 Chhattisgarh 19.16 30.00 29.06 0.94 14.34 19.93 7.78 12.1518 Goa - - - - - - - -19 Himachal Pradesh - - - - - - - -20 Jammu & Kashmir - - - - - - - -21 Jharkhand 26.70 60.00 50.00 10.00 - 32.55 30.00 2.5522 Manipur - - - - - - - -23 Meghalaya - - - - - 21.43 21.43 -24 Mizoram - - - - - - - -25 Nagaland - - - - - - - -26 Sikkim - - - - 32.46 - - -27 Tripura - 80.00 80.00 - 50.00 - - -28 Uttranchal - - - - 50.00 44.48 40.97 3.5129 A & N Islands - - - - - - - -30 Chandigarh - - - - - - - -31 D & N Haveli - - - - - - - -32 Daman & Diu - - - - - - - -33 Delhi - - - - - - - -34 Lakshadweep - - - - - - - -35 Pondicherry 26.69 - - - 22.85 33.90 33.90 -
ALL-INDIA 29.84 37.40 35.14 2.26 26.33 30.49 27.06 3.43

STATEMENT 4.1 (b) (ii)-W Contd..
(In Rupees)
SL. STATES/ HARVESTING CULTIVATIONNO. UNION TERRITORIES 1999- 2004-05 1999- 2004-05
2000 Total Cash Kind 2000 Total Cash Kind1 2 19 20 21 22 23 24 25 26
Major States1 Andhra Pradesh 27.08 29.74 29.58 0.16 28.51 31.00 29.88 1.122 Assam 32.00 56.18 39.62 16.56 34.83 56.41 46.57 9.843 Bihar 32.81 42.06 15.12 26.94 29.41 33.87 24.39 9.484 Gujarat 38.85 42.75 41.56 1.19 37.29 50.83 48.60 2.235 Haryana 59.34 55.94 23.59 32.35 50.96 45.37 23.78 21.596 Karnataka 25.51 30.85 28.56 2.29 24.64 31.00 29.48 1.527 Kerala 53.09 68.71 28.12 40.59 59.47 83.10 67.52 15.588 Madhya Pradesh 26.96 28.40 21.23 7.17 25.56 33.77 22.84 10.939 Maharashtra 23.25 26.30 25.66 0.64 23.51 25.35 23.99 1.36
10 Orissa 21.78 24.19 17.37 6.82 22.87 37.20 35.09 2.1111 Punjab 59.12 50.96 44.31 6.65 - 57.97 56.90 1.0712 Rajasthan 57.01 72.84 49.68 23.16 47.09 55.57 55.57 -13 TamilNadu 34.64 39.81 30.47 9.34 30.62 36.13 33.90 2.2314 Uttar Pradesh 27.91 37.48 24.18 13.30 28.39 41.19 29.94 11.2515 West Bengal 38.66 37.72 32.24 5.48 33.45 36.35 32.16 4.19
Other States/UTs16 Arunachal Pradesh - - - - - - - -17 Chhattisgarh 21.09 22.30 15.12 7.18 25.83 26.63 17.89 8.7418 Goa - 75.00 75.00 - - - - -19 Himachal Pradesh - - - - - 52.50 45.00 7.5020 Jammu & Kashmir - - - - - - - -21 Jharkhand 26.33 - - - 25.78 36.99 35.21 1.7822 Manipur - - - - - - - -23 Meghalaya - - - - - - - -24 Mizoram - - - - - - - -25 Nagaland - - - - - - - -26 Sikkim - - - - 31.68 74.74 57.37 17.3727 Tripura 70.00 25.00 25.00 - 22.86 - - -28 Uttranchal 66.48 56.69 56.69 - - 49.18 48.01 1.1729 A & N Islands - - - - - - - -30 Chandigarh - - - - - - - -31 D & N Haveli - - - - - - - -32 Daman & Diu - - - - - - - -33 Delhi - - - - - - - -34 Lakshadweep - - - - - - - -35 Pondicherry 35.86 43.70 14.96 28.74 26.16 45.43 45.43 -
ALL-INDIA 30.78 36.46 27.62 8.84 29.16 33.84 30.04 3.80
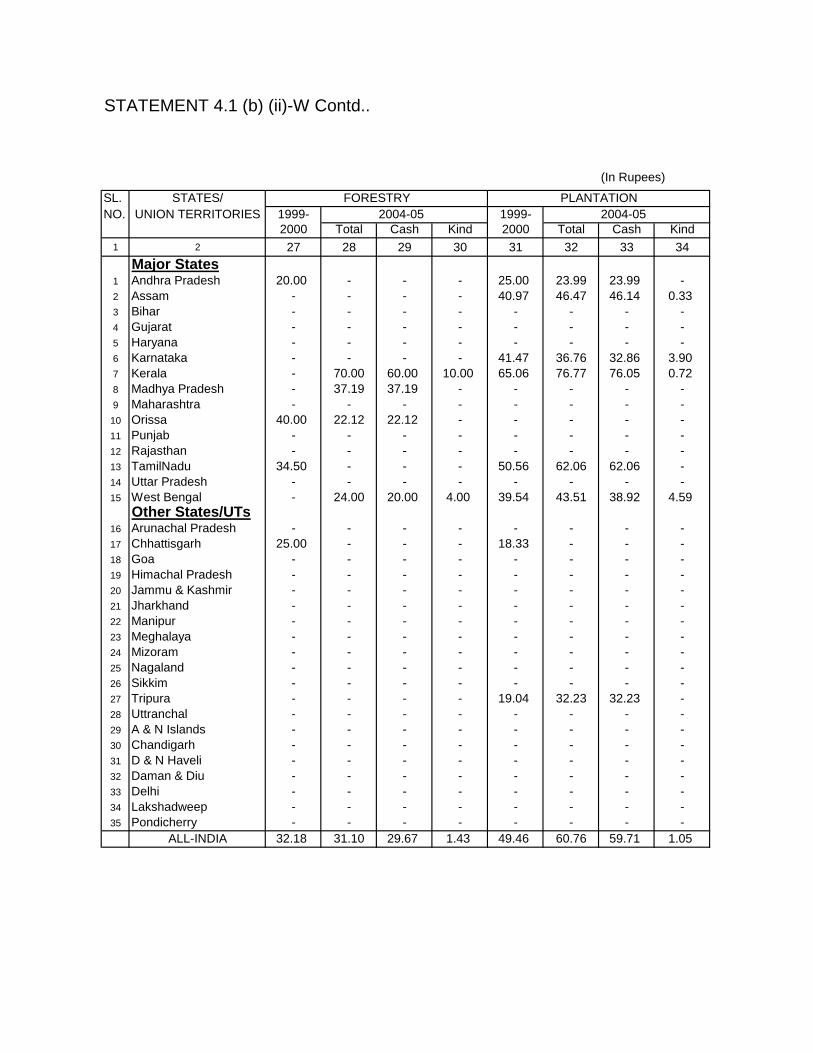
STATEMENT 4.1 (b) (ii)-W Contd..
(In Rupees)
SL. STATES/ FORESTRY PLANTATIONNO. UNION TERRITORIES 1999- 2004-05 1999- 2004-05
2000 Total Cash Kind 2000 Total Cash Kind1 2 27 28 29 30 31 32 33 34
Major States1 Andhra Pradesh 20.00 - - - 25.00 23.99 23.99 -2 Assam - - - - 40.97 46.47 46.14 0.333 Bihar - - - - - - - -4 Gujarat - - - - - - - -5 Haryana - - - - - - - -6 Karnataka - - - - 41.47 36.76 32.86 3.907 Kerala - 70.00 60.00 10.00 65.06 76.77 76.05 0.728 Madhya Pradesh - 37.19 37.19 - - - - -9 Maharashtra - - - - - - - -
10 Orissa 40.00 22.12 22.12 - - - - -11 Punjab - - - - - - - -12 Rajasthan - - - - - - - -13 TamilNadu 34.50 - - - 50.56 62.06 62.06 -14 Uttar Pradesh - - - - - - - -15 West Bengal - 24.00 20.00 4.00 39.54 43.51 38.92 4.59
Other States/UTs16 Arunachal Pradesh - - - - - - - -17 Chhattisgarh 25.00 - - - 18.33 - - -18 Goa - - - - - - - -19 Himachal Pradesh - - - - - - - -20 Jammu & Kashmir - - - - - - - -21 Jharkhand - - - - - - - -22 Manipur - - - - - - - -23 Meghalaya - - - - - - - -24 Mizoram - - - - - - - -25 Nagaland - - - - - - - -26 Sikkim - - - - - - - -27 Tripura - - - - 19.04 32.23 32.23 -28 Uttranchal - - - - - - - -29 A & N Islands - - - - - - - -30 Chandigarh - - - - - - - -31 D & N Haveli - - - - - - - -32 Daman & Diu - - - - - - - -33 Delhi - - - - - - - -34 Lakshadweep - - - - - - - -35 Pondicherry - - - - - - - -
ALL-INDIA 32.18 31.10 29.67 1.43 49.46 60.76 59.71 1.05

STATEMENT 4.1 (b) (ii)-W Concld..
(In Rupees)
SL. STATES/ ANIMAL HUSBANDRY FISHERIES OTHERS (AGRICULTURAL)NO. UNION TERRITORIES 1999- 2004-05 1999- 2004-05 1999- 2004-05
2000 Total Cash Kind 2000 Total Cash Kind 2000 Total Cash Kind1 2 35 36 37 38 39 40 41 42 43 44 45 46
Major States1 Andhra Pradesh 10.89 30.00 30.00 - - - - - 26.26 45.49 45.28 0.212 Assam - - - - - - - - - - - -3 Bihar 17.86 - - - - - - - 26.67 45.00 35.00 10.004 Gujarat 40.00 30.00 30.00 - - - - - 46.96 63.45 50.00 13.455 Haryana - - - - - - - - 40.00 115.23 115.23 -6 Karnataka - 22.88 22.88 - - - - - 23.80 41.97 33.39 8.587 Kerala - 33.00 33.00 - - - - - 45.94 85.46 71.37 14.098 Madhya Pradesh - - - - - - - - 29.82 26.32 26.32 -9 Maharashtra - 20.00 20.00 - - - - - 24.60 27.86 27.24 0.62
10 Orissa - 30.00 30.00 - - - - - 24.27 27.21 27.21 -11 Punjab 23.47 41.23 21.86 19.37 - - - - 34.21 44.35 29.90 14.4512 Rajasthan 10.28 59.44 22.91 36.53 - - - - - - - -13 TamilNadu 28.61 24.57 18.40 6.17 25.71 - - - 32.68 50.78 49.21 1.5714 Uttar Pradesh 20.00 - - - - - - - 42.66 32.09 19.93 12.1615 West Bengal - - - - - 25.00 25.00 - 30.40 34.77 34.17 0.60
Other States/UTs16 Arunachal Pradesh - - - - - - - - - - - -17 Chhattisgarh - - - - - - - - 28.54 20.00 20.00 -18 Goa - - - - - - - - - - - -19 Himachal Pradesh - - - - - - - - 40.00 44.00 38.57 5.4320 Jammu & Kashmir - - - - - - - - - - - -21 Jharkhand - - - - - - - - 30.00 40.00 40.00 -22 Manipur - - - - - - - - - - - -23 Meghalaya - - - - - - - - - - - -24 Mizoram - - - - - - - - - - - -25 Nagaland - - - - - - - - - - - -26 Sikkim - 80.00 60.00 20.00 - - - - - - - -27 Tripura - 34.29 34.29 - - - - - - 55.19 55.19 -28 Uttranchal - - - - - - - - - - - -29 A & N Islands - - - - - - - - - - - -30 Chandigarh - - - - - - - - - - - -31 D & N Haveli - - - - - - - - - - - -32 Daman & Diu - - - - - - - - - - - -33 Delhi - - - - - - - - - - - -34 Lakshadweep - - - - - - - - - - - -35 Pondicherry 30.00 - - - - - - - 44.77 - - -
ALL-INDIA 19.89 34.87 23.35 11.52 25.71 25.00 25.00 - 29.48 38.66 33.56 5.10

STATEMENT 4.1 (b) (iii)-W
AVERAGE DAILY EARNINGS OF WOMEN BELONGING TO SCHEDULED TRIBES AGRICULTURAL LABOUR HOUSEHOLDS IN DIFFERENT
AGRICULTURAL OCCUPATIONS(In Rupees)
SL. STATES/ PLOUGHING SOWINGNO. UNION TERRITORIES 1999- 2004-05 1999- 2004-05
2000 Total Cash Kind 2000 Total Cash Kind1 2 3 4 5 6 7 8 9 10
Major States1 Andhra Pradesh - 30.78 24.05 6.73 23.65 30.00 5.68 24.322 Assam - - - - 40.00 55.00 40.00 15.003 Bihar 34.28 - - - - - - -4 Gujarat - - - - 28.20 29.82 29.09 0.735 Haryana - - - - - - - -6 Karnataka - 27.63 27.63 - 32.70 17.55 17.55 -7 Kerala 45.00 - - - - - - -8 Madhya Pradesh 26.92 35.09 35.09 - 24.27 26.04 11.02 15.029 Maharashtra 14.29 40.00 40.00 - 25.95 37.59 37.59 -
10 Orissa 31.19 21.81 9.04 12.77 - - - -11 Punjab - - - - - - - -12 Rajasthan - - - - - - - -13 TamilNadu - - - - - - - -14 Uttar Pradesh - - - - - - - -15 West Bengal 23.20 - - - 38.00 86.77 57.69 29.08
Other States/UTs16 Arunachal Pradesh - - - - - - - -17 Chhattisgarh 48.00 - - - 40.00 26.67 20.00 6.6718 Goa - - - - - - - -19 Himachal Pradesh - - - - - - - -20 Jammu & Kashmir - - - - - - - -21 Jharkhand 35.56 - - - 25.00 23.49 18.86 4.6322 Manipur - - - - - - - -23 Meghalaya 40.00 42.86 42.86 - 30.00 - - -24 Mizoram - - - - - - - -25 Nagaland - - - - - - - -26 Sikkim - - - - - - - -27 Tripura 28.57 - - - - - - -28 Uttranchal - - - - - - - -29 A & N Islands - - - - - - - -30 Chandigarh - - - - - - - -31 D & N Haveli - - - - - - - -32 Daman & Diu - - - - - - - -33 Delhi - - - - - - - -34 Lakshadweep - - - - - - - -35 Pondicherry - - - - - - - -
ALL-INDIA 30.50 27.86 21.68 6.18 25.94 30.13 21.23 8.90
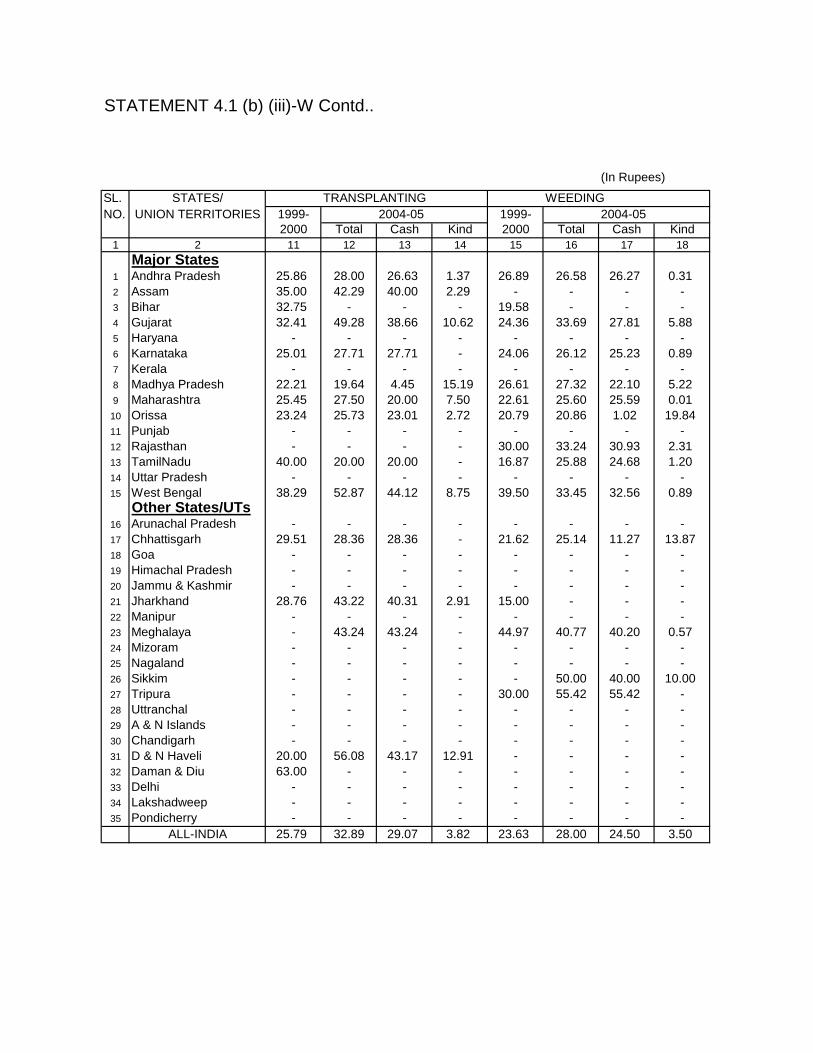
STATEMENT 4.1 (b) (iii)-W Contd..
(In Rupees)
SL. STATES/ TRANSPLANTING WEEDINGNO. UNION TERRITORIES 1999- 2004-05 1999- 2004-05
2000 Total Cash Kind 2000 Total Cash Kind1 2 11 12 13 14 15 16 17 18
Major States1 Andhra Pradesh 25.86 28.00 26.63 1.37 26.89 26.58 26.27 0.312 Assam 35.00 42.29 40.00 2.29 - - - -3 Bihar 32.75 - - - 19.58 - - -4 Gujarat 32.41 49.28 38.66 10.62 24.36 33.69 27.81 5.885 Haryana - - - - - - - -6 Karnataka 25.01 27.71 27.71 - 24.06 26.12 25.23 0.897 Kerala - - - - - - - -8 Madhya Pradesh 22.21 19.64 4.45 15.19 26.61 27.32 22.10 5.229 Maharashtra 25.45 27.50 20.00 7.50 22.61 25.60 25.59 0.01
10 Orissa 23.24 25.73 23.01 2.72 20.79 20.86 1.02 19.8411 Punjab - - - - - - - -12 Rajasthan - - - - 30.00 33.24 30.93 2.3113 TamilNadu 40.00 20.00 20.00 - 16.87 25.88 24.68 1.2014 Uttar Pradesh - - - - - - - -15 West Bengal 38.29 52.87 44.12 8.75 39.50 33.45 32.56 0.89
Other States/UTs16 Arunachal Pradesh - - - - - - - -17 Chhattisgarh 29.51 28.36 28.36 - 21.62 25.14 11.27 13.8718 Goa - - - - - - - -19 Himachal Pradesh - - - - - - - -20 Jammu & Kashmir - - - - - - - -21 Jharkhand 28.76 43.22 40.31 2.91 15.00 - - -22 Manipur - - - - - - - -23 Meghalaya - 43.24 43.24 - 44.97 40.77 40.20 0.5724 Mizoram - - - - - - - -25 Nagaland - - - - - - - -26 Sikkim - - - - - 50.00 40.00 10.0027 Tripura - - - - 30.00 55.42 55.42 -28 Uttranchal - - - - - - - -29 A & N Islands - - - - - - - -30 Chandigarh - - - - - - - -31 D & N Haveli 20.00 56.08 43.17 12.91 - - - -32 Daman & Diu 63.00 - - - - - - -33 Delhi - - - - - - - -34 Lakshadweep - - - - - - - -35 Pondicherry - - - - - - - -
ALL-INDIA 25.79 32.89 29.07 3.82 23.63 28.00 24.50 3.50
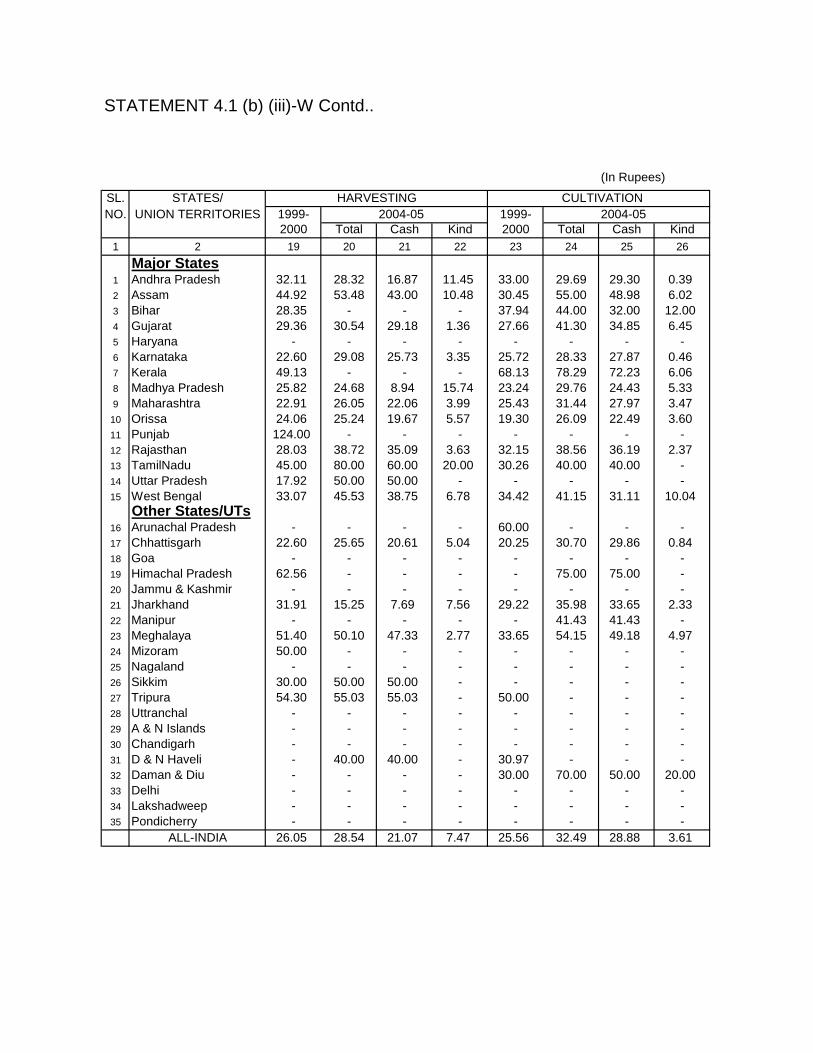
STATEMENT 4.1 (b) (iii)-W Contd..
(In Rupees)
SL. STATES/ HARVESTING CULTIVATIONNO. UNION TERRITORIES 1999- 2004-05 1999- 2004-05
2000 Total Cash Kind 2000 Total Cash Kind1 2 19 20 21 22 23 24 25 26
Major States1 Andhra Pradesh 32.11 28.32 16.87 11.45 33.00 29.69 29.30 0.392 Assam 44.92 53.48 43.00 10.48 30.45 55.00 48.98 6.023 Bihar 28.35 - - - 37.94 44.00 32.00 12.004 Gujarat 29.36 30.54 29.18 1.36 27.66 41.30 34.85 6.455 Haryana - - - - - - - -6 Karnataka 22.60 29.08 25.73 3.35 25.72 28.33 27.87 0.467 Kerala 49.13 - - - 68.13 78.29 72.23 6.068 Madhya Pradesh 25.82 24.68 8.94 15.74 23.24 29.76 24.43 5.339 Maharashtra 22.91 26.05 22.06 3.99 25.43 31.44 27.97 3.47
10 Orissa 24.06 25.24 19.67 5.57 19.30 26.09 22.49 3.6011 Punjab 124.00 - - - - - - -12 Rajasthan 28.03 38.72 35.09 3.63 32.15 38.56 36.19 2.3713 TamilNadu 45.00 80.00 60.00 20.00 30.26 40.00 40.00 -14 Uttar Pradesh 17.92 50.00 50.00 - - - - -15 West Bengal 33.07 45.53 38.75 6.78 34.42 41.15 31.11 10.04
Other States/UTs16 Arunachal Pradesh - - - - 60.00 - - -17 Chhattisgarh 22.60 25.65 20.61 5.04 20.25 30.70 29.86 0.8418 Goa - - - - - - - -19 Himachal Pradesh 62.56 - - - - 75.00 75.00 -20 Jammu & Kashmir - - - - - - - -21 Jharkhand 31.91 15.25 7.69 7.56 29.22 35.98 33.65 2.3322 Manipur - - - - - 41.43 41.43 -23 Meghalaya 51.40 50.10 47.33 2.77 33.65 54.15 49.18 4.9724 Mizoram 50.00 - - - - - - -25 Nagaland - - - - - - - -26 Sikkim 30.00 50.00 50.00 - - - - -27 Tripura 54.30 55.03 55.03 - 50.00 - - -28 Uttranchal - - - - - - - -29 A & N Islands - - - - - - - -30 Chandigarh - - - - - - - -31 D & N Haveli - 40.00 40.00 - 30.97 - - -32 Daman & Diu - - - - 30.00 70.00 50.00 20.0033 Delhi - - - - - - - -34 Lakshadweep - - - - - - - -35 Pondicherry - - - - - - - -
ALL-INDIA 26.05 28.54 21.07 7.47 25.56 32.49 28.88 3.61

STATEMENT 4.1 (b) (iii)-W Contd..
(In Rupees)
SL. STATES/ FORESTRY PLANTATIONNO. UNION TERRITORIES 1999- 2004-05 1999- 2004-05
2000 Total Cash Kind 2000 Total Cash Kind1 2 27 28 29 30 31 32 33 34
Major States1 Andhra Pradesh 40.00 - - - - 50.00 50.00 -2 Assam - - - - 37.57 44.50 44.50 -3 Bihar - - - - - - - -4 Gujarat 40.00 - - - 21.59 - - -5 Haryana - - - - - - - -6 Karnataka - - - - 45.38 51.52 50.00 1.527 Kerala - - - - 60.00 70.41 59.03 11.388 Madhya Pradesh 26.90 23.48 11.57 11.91 - - - -9 Maharashtra 27.78 - - - 37.65 37.67 37.67 -
10 Orissa 38.74 - - - - - - -11 Punjab - - - - - - - -12 Rajasthan - - - - - - - -13 TamilNadu 25.00 - - - - - - -14 Uttar Pradesh - - - - - - - -15 West Bengal - - - - 40.71 45.17 42.03 3.14
Other States/UTs16 Arunachal Pradesh - - - - - - - -17 Chhattisgarh 35.74 50.00 50.00 - - 60.00 60.00 -18 Goa - - - - - - - -19 Himachal Pradesh - - - - - - - -20 Jammu & Kashmir - - - - - - - -21 Jharkhand - - - - - - - -22 Manipur - - - - - - - -23 Meghalaya 16.67 - - - 14.86 42.64 42.64 -24 Mizoram - - - - - - - -25 Nagaland - - - - - - - -26 Sikkim - - - - - - - -27 Tripura - - - - 38.67 - - -28 Uttranchal - - - - - - - -29 A & N Islands - - - - - - - -30 Chandigarh - - - - - - - -31 D & N Haveli - - - - - - - -32 Daman & Diu - - - - - - - -33 Delhi - - - - - - - -34 Lakshadweep - - - - - - - -35 Pondicherry - - - - - - - -
ALL-INDIA 33.78 31.48 23.17 8.31 39.71 46.41 43.31 3.10

STATEMENT 4.1 (b) (iii)-W Concld..
(In Rupees)
SL. STATES/ ANIMAL HUSBANDRY FISHERIES OTHERS (AGRICULTURAL)NO. UNION TERRITORIES 1999- 2004-05 1999- 2004-05 1999- 2004-05
2000 Total Cash Kind 2000 Total Cash Kind 2000 Total Cash Kind1 2 35 36 37 38 39 40 41 42 43 44 45 46
Major States1 Andhra Pradesh 21.43 - - - - - - - 29.24 35.69 35.69 -2 Assam - - - - - - - - - 61.57 55.00 6.573 Bihar - - - - - - - - 18.43 - - -4 Gujarat 23.47 24.86 4.86 20.00 - - - - 29.56 34.00 32.81 1.195 Haryana - - - - - - - - - - - -6 Karnataka - 25.71 25.71 - - - - - 18.47 22.34 22.34 -7 Kerala - - - - - - - - - - - -8 Madhya Pradesh 68.57 - - - - - - - 28.89 27.04 23.90 3.149 Maharashtra - - - - - - - - 27.50 30.00 30.00 -
10 Orissa - 30.00 20.00 10.00 - - - - 19.78 21.40 21.40 -11 Punjab - - - - - - - - - - - -12 Rajasthan 17.14 - - - - - - - 22.50 45.39 45.39 -13 TamilNadu - - - - - - - - 14.00 - - -14 Uttar Pradesh - 15.00 15.00 - - - - - - - - -15 West Bengal - - - - - - - - 35.37 - - -
Other States/UTs16 Arunachal Pradesh - - - - - - - - - - - -17 Chhattisgarh - - - - - - - - 24.40 30.25 24.43 5.8218 Goa - - - - - - - - - - - -19 Himachal Pradesh - - - - - - - - - - - -20 Jammu & Kashmir - - - - - - - - - - - -21 Jharkhand - - - - - - - - 40.36 37.97 30.82 7.1522 Manipur - - - - - - - - - - - -23 Meghalaya - - - - - - - - - - - -24 Mizoram - - - - - - - - 145.58 - - -25 Nagaland - - - - - - - - - - - -26 Sikkim - - - - - - - - - - - -27 Tripura - - - - - - - - - - - -28 Uttranchal - - - - - - - - - - - -29 A & N Islands - - - - - - - - - - - -30 Chandigarh - - - - - - - - - - - -31 D & N Haveli - - - - - - - - 28.65 40.00 40.00 -32 Daman & Diu - - - - 44.76 - - - - 65.00 50.00 15.0033 Delhi - - - - - - - - - - - -34 Lakshadweep - - - - - - - - - - - -35 Pondicherry - - - - - - - - - - - -
ALL-INDIA 25.83 21.79 14.65 7.14 44.76 - - - 27.43 30.07 28.52 1.55

STATEMENT 4.1 (b) (iv)-W
AVERAGE DAILY EARNINGS OF WOMEN BELONGING TO OTHER BACKWARD CLASSESAGRICULTURAL LABOUR HOUSEHOLDS IN DIFFERENT AGRICULTURAL OCCUPATIONS
(In Rupees)
SL. STATES/ PLOUGHING SOWINGNO. UNION TERRITORIES 1999- 2004-05 1999- 2004-05
2000 Total Cash Kind 2000 Total Cash Kind1 2 3 4 5 6 7 8 9 10
Major States1 Andhra Pradesh 44.57 30.00 30.00 - 23.73 27.44 26.60 0.842 Assam - - - - 25.71 50.00 50.00 -3 Bihar 32.73 - - - 29.86 53.17 45.45 7.724 Gujarat - 67.50 67.50 - - 50.00 50.00 -5 Haryana - - - - - - - -6 Karnataka 28.84 30.00 30.00 - 29.57 25.88 24.98 0.907 Kerala 123.49 - - - 60.00 - - -8 Madhya Pradesh 29.88 48.56 48.56 - 37.74 28.74 20.94 7.809 Maharashtra 45.74 25.07 25.07 - 24.51 18.52 18.52 -
10 Orissa 20.00 - - - - 55.00 50.00 5.0011 Punjab - - - - - - - -12 Rajasthan - - - - - - - -13 TamilNadu 33.97 16.55 16.55 - 25.32 34.86 34.86 -14 Uttar Pradesh - - - - 22.15 30.00 30.00 -15 West Bengal 40.00 - - - - - - -
Other States/UTs16 Arunachal Pradesh - - - - - - - -17 Chhattisgarh - - - - - - - -18 Goa - - - - - - - -19 Himachal Pradesh - - - - - - - -20 Jammu & Kashmir - - - - - - - -21 Jharkhand - 40.97 37.96 3.01 40.00 40.00 40.00 -22 Manipur - - - - - - - -23 Meghalaya - - - - - - - -24 Mizoram - - - - - - - -25 Nagaland - - - - - - - -26 Sikkim 40.00 - - - 69.58 - - -27 Tripura 88.00 - - - 30.00 - - -28 Uttranchal - - - - - 50.00 50.00 -29 A & N Islands - - - - - - - -30 Chandigarh - - - - - - - -31 D & N Haveli - - - - - - - -32 Daman & Diu - - - - - - - -33 Delhi - - - - - - - -34 Lakshadweep - - - - - - - -35 Pondicherry - - - - - - - -
ALL-INDIA 39.21 41.00 40.69 0.31 27.82 31.82 30.27 1.55

STATEMENT 4.1 (b) (iv)-W Contd..
(In Rupees)
SL. STATES/ TRANSPLANTING WEEDINGNO. UNION TERRITORIES 1999- 2004-05 1999- 2004-05
2000 Total Cash Kind 2000 Total Cash Kind1 2 11 12 13 14 15 16 17 18
Major States1 Andhra Pradesh 25.01 36.95 34.99 1.96 23.34 28.57 28.13 0.442 Assam 32.87 49.02 49.02 - 38.34 - - -3 Bihar 30.26 37.86 26.71 11.15 31.80 30.83 20.09 10.744 Gujarat 40.00 36.48 33.49 2.99 45.40 48.72 41.34 7.385 Haryana - 79.17 58.33 20.84 - 51.00 45.00 6.006 Karnataka 31.81 35.76 34.39 1.37 23.87 26.07 25.53 0.547 Kerala 72.15 56.01 54.59 1.42 - 55.87 54.01 1.868 Madhya Pradesh 26.58 34.60 19.05 15.55 23.91 27.77 26.70 1.079 Maharashtra 27.26 29.72 29.72 - 24.43 28.76 28.55 0.21
10 Orissa 18.78 27.00 20.36 6.64 20.92 26.04 17.89 8.1511 Punjab - 63.12 53.12 10.00 - 50.00 50.00 -12 Rajasthan - - - - 45.84 33.31 32.65 0.6613 TamilNadu 31.67 34.58 31.58 3.00 25.94 31.26 30.70 0.5614 Uttar Pradesh 29.38 40.61 22.60 18.01 21.94 39.93 39.93 -15 West Bengal - 55.00 40.00 15.00 47.00 - - -
Other States/UTs16 Arunachal Pradesh - - - - - - - -17 Chhattisgarh 25.85 26.16 16.37 9.79 23.55 23.53 21.30 2.2318 Goa - - - - - - - -19 Himachal Pradesh - - - - - - - -20 Jammu & Kashmir - - - - - - - -21 Jharkhand 29.48 33.15 28.12 5.03 25.46 44.91 41.28 3.6322 Manipur - 60.00 60.00 - 50.00 50.00 50.00 -23 Meghalaya - - - - - - - -24 Mizoram - - - - - - - -25 Nagaland - - - - - - - -26 Sikkim - - - - 55.93 - - -27 Tripura - - - - 44.15 - - -28 Uttranchal - 50.00 50.00 - - - - -29 A & N Islands - - - - - - - -30 Chandigarh - - - - - - - -31 D & N Haveli - - - - - - - -32 Daman & Diu - - - - - - - -33 Delhi - - - - - - - -34 Lakshadweep - - - - - - - -35 Pondicherry - - - - 22.83 - - -
ALL-INDIA 28.83 34.87 30.04 4.83 24.99 30.17 28.53 1.64
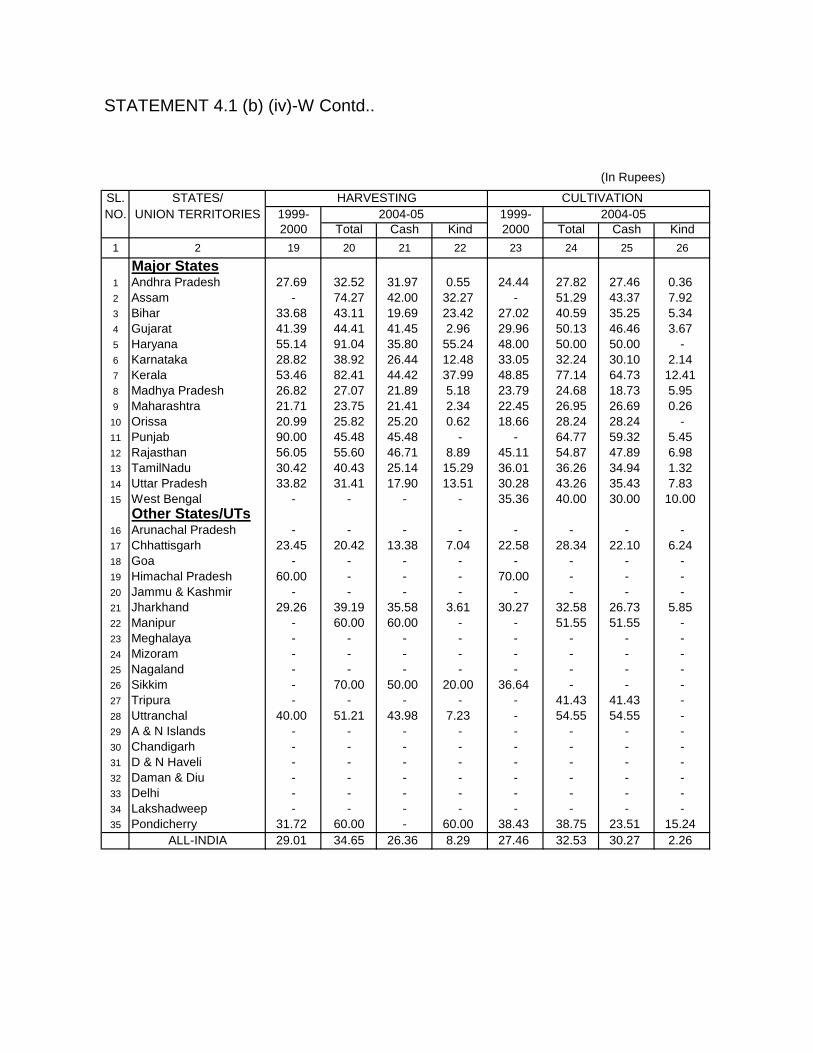
STATEMENT 4.1 (b) (iv)-W Contd..
(In Rupees)
SL. STATES/ HARVESTING CULTIVATIONNO. UNION TERRITORIES 1999- 2004-05 1999- 2004-05
2000 Total Cash Kind 2000 Total Cash Kind1 2 19 20 21 22 23 24 25 26
Major States1 Andhra Pradesh 27.69 32.52 31.97 0.55 24.44 27.82 27.46 0.362 Assam - 74.27 42.00 32.27 - 51.29 43.37 7.923 Bihar 33.68 43.11 19.69 23.42 27.02 40.59 35.25 5.344 Gujarat 41.39 44.41 41.45 2.96 29.96 50.13 46.46 3.675 Haryana 55.14 91.04 35.80 55.24 48.00 50.00 50.00 -6 Karnataka 28.82 38.92 26.44 12.48 33.05 32.24 30.10 2.147 Kerala 53.46 82.41 44.42 37.99 48.85 77.14 64.73 12.418 Madhya Pradesh 26.82 27.07 21.89 5.18 23.79 24.68 18.73 5.959 Maharashtra 21.71 23.75 21.41 2.34 22.45 26.95 26.69 0.26
10 Orissa 20.99 25.82 25.20 0.62 18.66 28.24 28.24 -11 Punjab 90.00 45.48 45.48 - - 64.77 59.32 5.4512 Rajasthan 56.05 55.60 46.71 8.89 45.11 54.87 47.89 6.9813 TamilNadu 30.42 40.43 25.14 15.29 36.01 36.26 34.94 1.3214 Uttar Pradesh 33.82 31.41 17.90 13.51 30.28 43.26 35.43 7.8315 West Bengal - - - - 35.36 40.00 30.00 10.00
Other States/UTs16 Arunachal Pradesh - - - - - - - -17 Chhattisgarh 23.45 20.42 13.38 7.04 22.58 28.34 22.10 6.2418 Goa - - - - - - - -19 Himachal Pradesh 60.00 - - - 70.00 - - -20 Jammu & Kashmir - - - - - - - -21 Jharkhand 29.26 39.19 35.58 3.61 30.27 32.58 26.73 5.8522 Manipur - 60.00 60.00 - - 51.55 51.55 -23 Meghalaya - - - - - - - -24 Mizoram - - - - - - - -25 Nagaland - - - - - - - -26 Sikkim - 70.00 50.00 20.00 36.64 - - -27 Tripura - - - - - 41.43 41.43 -28 Uttranchal 40.00 51.21 43.98 7.23 - 54.55 54.55 -29 A & N Islands - - - - - - - -30 Chandigarh - - - - - - - -31 D & N Haveli - - - - - - - -32 Daman & Diu - - - - - - - -33 Delhi - - - - - - - -34 Lakshadweep - - - - - - - -35 Pondicherry 31.72 60.00 - 60.00 38.43 38.75 23.51 15.24
ALL-INDIA 29.01 34.65 26.36 8.29 27.46 32.53 30.27 2.26

STATEMENT 4.1 (b) (iv)-W Contd..
(In Rupees)
SL. STATES/ FORESTRY PLANTATIONNO. UNION TERRITORIES 1999- 2004-05 1999- 2004-05
2000 Total Cash Kind 2000 Total Cash Kind1 2 27 28 29 30 31 32 33 34
Major States1 Andhra Pradesh - 40.00 40.00 - 15.60 30.00 28.15 1.852 Assam - - - - 42.35 58.07 43.51 14.563 Bihar - - - - 20.00 - - -4 Gujarat - - - - - - - -5 Haryana - 30.00 30.00 - - - - -6 Karnataka - - - - 45.60 55.07 51.23 3.847 Kerala - - - - 58.92 63.31 59.25 4.068 Madhya Pradesh 28.09 24.86 24.86 - - - - -9 Maharashtra - - - - - 35.00 35.00 -
10 Orissa 25.00 - - - - - - -11 Punjab - - - - - - - -12 Rajasthan - - - - - - - -13 TamilNadu 30.00 33.93 33.65 0.28 54.57 44.86 44.86 -14 Uttar Pradesh - - - - - - - -15 West Bengal - - - - 20.00 47.54 45.71 1.83
Other States/UTs16 Arunachal Pradesh - - - - - - - -17 Chhattisgarh - - - - - - - -18 Goa - - - - - - - -19 Himachal Pradesh - - - - - - - -20 Jammu & Kashmir - - - - - - - -21 Jharkhand - - - - - - - -22 Manipur - 40.91 40.91 - - - - -23 Meghalaya - - - - - - - -24 Mizoram - - - - - - - -25 Nagaland - - - - - - - -26 Sikkim - - - - - - - -27 Tripura - - - - - 22.29 22.29 -28 Uttranchal - - - - - - - -29 A & N Islands - - - - - - - -30 Chandigarh - - - - - - - -31 D & N Haveli - - - - - - - -32 Daman & Diu - - - - - - - -33 Delhi - - - - - - - -34 Lakshadweep - - - - - - - -35 Pondicherry - - - - - - - -
ALL-INDIA 27.45 32.68 32.48 0.20 43.59 54.09 45.36 8.73

STATEMENT 4.1 (b) (iv)-W Concld..
(In Rupees)
SL. STATES/ ANIMAL HUSBANDRY FISHERIES OTHERS (AGRICULTURAL)NO. UNION TERRITORIES 1999- 2004-05 1999- 2004-05 1999- 2004-05
2000 Total Cash Kind 2000 Total Cash Kind 2000 Total Cash Kind1 2 35 36 37 38 39 40 41 42 43 44 45 46
Major States1 Andhra Pradesh - - - - 40.00 - - - 24.60 28.54 26.78 1.762 Assam - - - - - - - - 42.08 74.35 61.87 12.483 Bihar - 36.16 36.16 - - - - - 24.48 41.98 32.57 9.414 Gujarat - - - - - - - - 40.31 55.07 48.11 6.965 Haryana - - - - - - - - 57.14 - - -6 Karnataka - - - - 50.00 - - - 18.84 30.50 29.80 0.707 Kerala - - - - - - - - 54.78 110.00 100.00 10.008 Madhya Pradesh 14.29 - - - 20.00 - - - 27.34 37.77 37.77 -9 Maharashtra - - - - - - - - 22.06 29.16 28.43 0.7310 Orissa - 20.00 - 20.00 - - - - 17.00 29.81 29.81 -11 Punjab - - - - - - - - - - - -12 Rajasthan - - - - - - - - 50.00 54.05 46.12 7.9313 TamilNadu 27.50 - - - - - - - 30.07 29.22 29.17 0.0514 Uttar Pradesh - - - - - - - - 36.96 37.88 32.25 5.6315 West Bengal - - - - - - - - 41.26 - - -
Other States/UTs16 Arunachal Pradesh - - - - - - - - - - - -17 Chhattisgarh 25.00 17.72 7.85 9.87 20.00 - - - 23.93 42.29 42.29 -18 Goa - - - - - - - - - 53.57 53.57 -19 Himachal Pradesh - - - - - - - - - - - -20 Jammu & Kashmir - - - - - - - - - - - -21 Jharkhand - - - - - - - - 37.42 12.86 - 12.8622 Manipur - - - - - - - - 42.86 - - -23 Meghalaya - - - - - - - - - - - -24 Mizoram - - - - - - - - - - - -25 Nagaland - - - - - - - - - - - -26 Sikkim - - - - - - - - 32.00 89.29 89.29 -27 Tripura - - - - - - - - - - - -28 Uttranchal - - - - - - - - - - - -29 A & N Islands - - - - - - - - - - - -30 Chandigarh - - - - - - - - - - - -31 D & N Haveli - - - - - - - - - - - -32 Daman & Diu - - - - - - - - - - - -33 Delhi - - - - - - - - - - - -34 Lakshadweep - - - - - - - - - - - -35 Pondicherry - - - - - - - - 34.68 39.00 36.00 3.00
ALL-INDIA 23.83 18.64 7.74 10.90 38.14 - - - 26.92 33.04 31.01 2.03
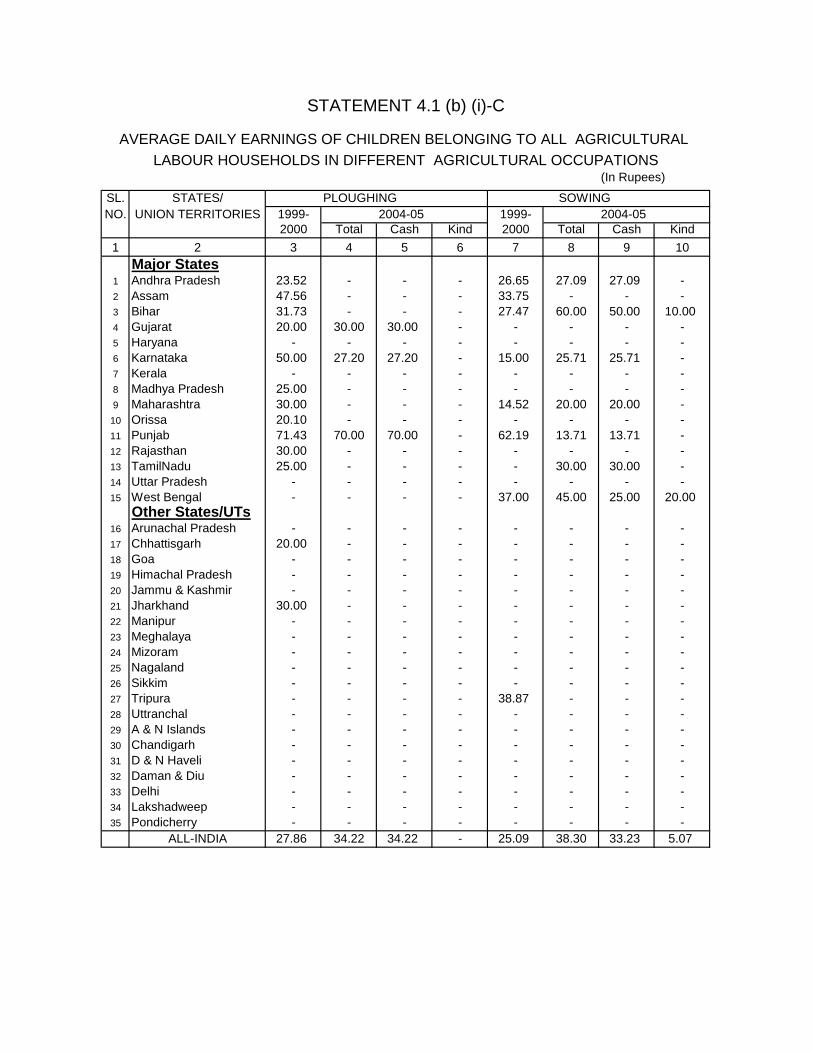
STATEMENT 4.1 (b) (i)-C
AVERAGE DAILY EARNINGS OF CHILDREN BELONGING TO ALL AGRICULTURAL LABOUR HOUSEHOLDS IN DIFFERENT AGRICULTURAL OCCUPATIONS
(In Rupees)
SL. STATES/ PLOUGHING SOWINGNO. UNION TERRITORIES 1999- 2004-05 1999- 2004-05
2000 Total Cash Kind 2000 Total Cash Kind1 2 3 4 5 6 7 8 9 10
Major States1 Andhra Pradesh 23.52 - - - 26.65 27.09 27.09 -2 Assam 47.56 - - - 33.75 - - -3 Bihar 31.73 - - - 27.47 60.00 50.00 10.004 Gujarat 20.00 30.00 30.00 - - - - -5 Haryana - - - - - - - -6 Karnataka 50.00 27.20 27.20 - 15.00 25.71 25.71 -7 Kerala - - - - - - - -8 Madhya Pradesh 25.00 - - - - - - -9 Maharashtra 30.00 - - - 14.52 20.00 20.00 -
10 Orissa 20.10 - - - - - - -11 Punjab 71.43 70.00 70.00 - 62.19 13.71 13.71 -12 Rajasthan 30.00 - - - - - - -13 TamilNadu 25.00 - - - - 30.00 30.00 -14 Uttar Pradesh - - - - - - - -15 West Bengal - - - - 37.00 45.00 25.00 20.00
Other States/UTs16 Arunachal Pradesh - - - - - - - -17 Chhattisgarh 20.00 - - - - - - -18 Goa - - - - - - - -19 Himachal Pradesh - - - - - - - -20 Jammu & Kashmir - - - - - - - -21 Jharkhand 30.00 - - - - - - -22 Manipur - - - - - - - -23 Meghalaya - - - - - - - -24 Mizoram - - - - - - - -25 Nagaland - - - - - - - -26 Sikkim - - - - - - - -27 Tripura - - - - 38.87 - - -28 Uttranchal - - - - - - - -29 A & N Islands - - - - - - - -30 Chandigarh - - - - - - - -31 D & N Haveli - - - - - - - -32 Daman & Diu - - - - - - - -33 Delhi - - - - - - - -34 Lakshadweep - - - - - - - -35 Pondicherry - - - - - - - -
ALL-INDIA 27.86 34.22 34.22 - 25.09 38.30 33.23 5.07

STATEMENT 4.1 (b) (i)-C Contd..
(In Rupees)
SL. STATES/ TRANSPLANTING WEEDINGNO. UNION TERRITORIES 1999- 2004-05 1999- 2004-05
2000 Total Cash Kind 2000 Total Cash Kind1 2 11 12 13 14 15 16 17 18
Major States1 Andhra Pradesh 21.13 58.98 58.98 - 23.17 25.48 25.26 0.222 Assam - - - - - - - -3 Bihar 16.32 41.53 14.22 27.31 18.01 15.40 3.60 11.804 Gujarat 50.00 - - - 40.00 40.05 32.79 7.265 Haryana 40.00 - - - 50.00 - - -6 Karnataka 22.78 30.00 30.00 - 18.14 25.40 22.97 2.437 Kerala - - - - - - - -8 Madhya Pradesh 15.00 30.00 30.00 - 23.28 29.20 23.48 5.729 Maharashtra - - - - 24.06 24.71 23.25 1.46
10 Orissa 17.76 49.66 44.38 5.28 25.64 - - -11 Punjab 57.14 - - - 80.64 - - -12 Rajasthan - - - - 26.67 30.00 30.00 -13 TamilNadu - - - - 21.30 25.00 20.00 5.0014 Uttar Pradesh 14.29 34.29 34.29 - 17.10 35.32 35.23 0.0915 West Bengal 40.49 - - - 44.00 38.24 25.75 12.49
Other States/UTs16 Arunachal Pradesh - - - - 11.92 - - -17 Chhattisgarh - 20.00 20.00 - - 23.58 23.58 -18 Goa - - - - - - - -19 Himachal Pradesh - - - - - - - -20 Jammu & Kashmir - - - - - - - -21 Jharkhand 30.00 - - - - - - -22 Manipur - - - - - - - -23 Meghalaya 26.67 42.86 42.86 - - 40.00 40.00 -24 Mizoram - - - - - - - -25 Nagaland - - - - - - - -26 Sikkim - - - - - - - -27 Tripura 40.00 - - - - - - -28 Uttranchal - - - - - - - -29 A & N Islands - - - - - - - -30 Chandigarh - - - - - - - -31 D & N Haveli - - - - - - - -32 Daman & Diu - - - - - - - -33 Delhi - - - - - - - -34 Lakshadweep - - - - - - - -35 Pondicherry - - - - - - - -
ALL-INDIA 24.56 40.94 36.51 4.43 22.88 27.53 24.47 3.06

STATEMENT 4.1 (b) (i)-C Contd..
(In Rupees)
SL. STATES/ HARVESTING CULTIVATIONNO. UNION TERRITORIES 1999- 2004-05 1999- 2004-05
2000 Total Cash Kind 2000 Total Cash Kind1 2 19 20 21 22 23 24 25 26
Major States1 Andhra Pradesh 28.80 26.95 26.79 0.16 24.10 27.57 26.85 0.722 Assam 27.75 - - - 34.83 - - -3 Bihar 25.15 35.00 25.00 10.00 25.81 31.07 26.66 4.414 Gujarat 39.95 37.91 31.41 6.50 33.15 32.26 28.08 4.185 Haryana 60.00 48.71 45.97 2.74 37.14 - - -6 Karnataka 24.82 24.01 22.55 1.46 18.75 30.49 29.25 1.247 Kerala - - - - - - - -8 Madhya Pradesh 22.22 31.71 26.88 4.83 22.79 24.50 16.71 7.799 Maharashtra 23.72 19.98 19.98 - 20.60 41.12 41.12 -
10 Orissa 20.00 - - - 16.84 28.44 23.42 5.0211 Punjab 55.37 39.77 38.17 1.60 59.88 34.76 34.76 -12 Rajasthan 40.00 36.33 30.00 6.33 28.57 - - -13 TamilNadu 28.42 34.93 15.07 19.86 36.79 50.00 40.00 10.0014 Uttar Pradesh 27.51 28.11 - 28.11 37.97 34.95 34.95 -15 West Bengal 20.00 26.86 - 26.86 37.91 31.31 27.69 3.62
Other States/UTs16 Arunachal Pradesh - - - - - - - -17 Chhattisgarh 25.24 18.41 15.37 3.04 35.00 20.00 20.00 -18 Goa - - - - - - - -19 Himachal Pradesh - - - - - - - -20 Jammu & Kashmir - - - - - - - -21 Jharkhand 39.81 3.43 - 3.43 44.11 33.50 21.67 11.8322 Manipur - - - - 30.00 - - -23 Meghalaya 14.53 - - - - - - -24 Mizoram - - - - - - - -25 Nagaland - - - - - - - -26 Sikkim - - - - - - - -27 Tripura - - - - - - - -28 Uttranchal - 50.00 40.00 10.00 - 34.44 34.44 -29 A & N Islands - - - - - - - -30 Chandigarh - - - - - - - -31 D & N Haveli - 40.00 40.00 - - - - -32 Daman & Diu - - - - - - - -33 Delhi - - - - - - - -34 Lakshadweep - - - - - - - -35 Pondicherry - - - - - - - -
ALL-INDIA 27.28 27.88 22.80 5.08 24.78 31.37 28.91 2.46

STATEMENT 4.1 (b) (i)-C Contd..
(In Rupees)
SL. STATES/ FORESTRY PLANTATIONNO. UNION TERRITORIES 1999- 2004-05 1999- 2004-05
2000 Total Cash Kind 2000 Total Cash Kind1 2 27 28 29 30 31 32 33 34
Major States1 Andhra Pradesh - - - - - - - -2 Assam - - - - 29.00 63.14 40.29 22.853 Bihar - - - - - - - -4 Gujarat - - - - 20.00 - - -5 Haryana - - - - - - - -6 Karnataka 42.50 - - - - 50.00 50.00 -7 Kerala - - - - - - - -8 Madhya Pradesh - 25.00 25.00 - - - - -9 Maharashtra - - - - 15.00 - - -
10 Orissa 40.00 - - - - - - -11 Punjab - - - - - - - -12 Rajasthan - - - - - - - -13 TamilNadu - - - - - - - -14 Uttar Pradesh - - - - - - - -15 West Bengal - - - - 42.33 - - -
Other States/UTs16 Arunachal Pradesh - - - - - - - -17 Chhattisgarh - - - - - - - -18 Goa - - - - - - - -19 Himachal Pradesh - - - - - - - -20 Jammu & Kashmir - - - - - - - -21 Jharkhand - - - - - - - -22 Manipur - - - - - - - -23 Meghalaya - - - - 36.36 - - -24 Mizoram - - - - - - - -25 Nagaland - - - - - - - -26 Sikkim - - - - - - - -27 Tripura - - - - - - - -28 Uttranchal - - - - - - - -29 A & N Islands - - - - - - - -30 Chandigarh - - - - - - - -31 D & N Haveli - - - - - - - -32 Daman & Diu - - - - - - - -33 Delhi - - - - - - - -34 Lakshadweep - - - - - - - -35 Pondicherry - - - - - - - -
ALL-INDIA 41.08 25.00 25.00 - 18.06 56.89 44.91 11.98
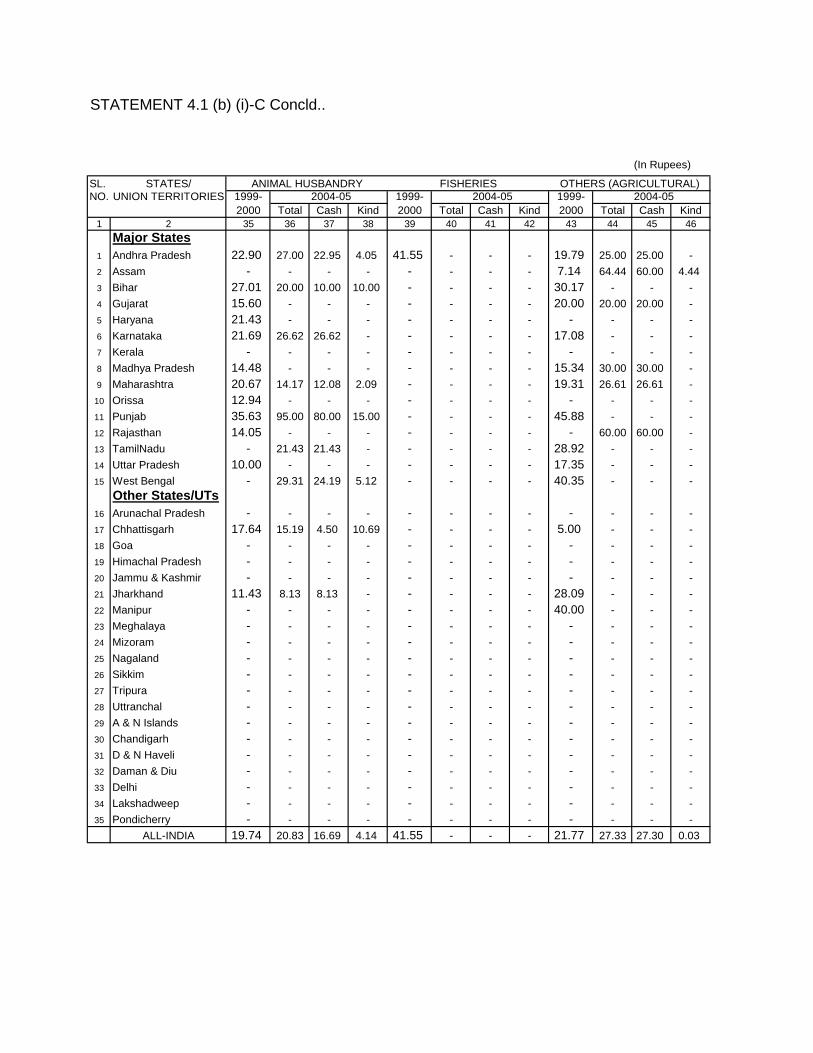
STATEMENT 4.1 (b) (i)-C Concld..
(In Rupees)
SL. STATES/ ANIMAL HUSBANDRY FISHERIES OTHERS (AGRICULTURAL)NO. UNION TERRITORIES 1999- 2004-05 1999- 2004-05 1999- 2004-05
2000 Total Cash Kind 2000 Total Cash Kind 2000 Total Cash Kind1 2 35 36 37 38 39 40 41 42 43 44 45 46
Major States1 Andhra Pradesh 22.90 27.00 22.95 4.05 41.55 - - - 19.79 25.00 25.00 -2 Assam - - - - - - - - 7.14 64.44 60.00 4.443 Bihar 27.01 20.00 10.00 10.00 - - - - 30.17 - - -4 Gujarat 15.60 - - - - - - - 20.00 20.00 20.00 -5 Haryana 21.43 - - - - - - - - - - -6 Karnataka 21.69 26.62 26.62 - - - - - 17.08 - - -7 Kerala - - - - - - - - - - - -8 Madhya Pradesh 14.48 - - - - - - - 15.34 30.00 30.00 -9 Maharashtra 20.67 14.17 12.08 2.09 - - - - 19.31 26.61 26.61 -
10 Orissa 12.94 - - - - - - - - - - -11 Punjab 35.63 95.00 80.00 15.00 - - - - 45.88 - - -12 Rajasthan 14.05 - - - - - - - - 60.00 60.00 -13 TamilNadu - 21.43 21.43 - - - - - 28.92 - - -14 Uttar Pradesh 10.00 - - - - - - - 17.35 - - -15 West Bengal - 29.31 24.19 5.12 - - - - 40.35 - - -
Other States/UTs16 Arunachal Pradesh - - - - - - - - - - - -17 Chhattisgarh 17.64 15.19 4.50 10.69 - - - - 5.00 - - -18 Goa - - - - - - - - - - - -19 Himachal Pradesh - - - - - - - - - - - -20 Jammu & Kashmir - - - - - - - - - - - -21 Jharkhand 11.43 8.13 8.13 - - - - - 28.09 - - -22 Manipur - - - - - - - - 40.00 - - -23 Meghalaya - - - - - - - - - - - -24 Mizoram - - - - - - - - - - - -25 Nagaland - - - - - - - - - - - -26 Sikkim - - - - - - - - - - - -27 Tripura - - - - - - - - - - - -28 Uttranchal - - - - - - - - - - - -29 A & N Islands - - - - - - - - - - - -30 Chandigarh - - - - - - - - - - - -31 D & N Haveli - - - - - - - - - - - -32 Daman & Diu - - - - - - - - - - - -33 Delhi - - - - - - - - - - - -34 Lakshadweep - - - - - - - - - - - -35 Pondicherry - - - - - - - - - - - -
ALL-INDIA 19.74 20.83 16.69 4.14 41.55 - - - 21.77 27.33 27.30 0.03
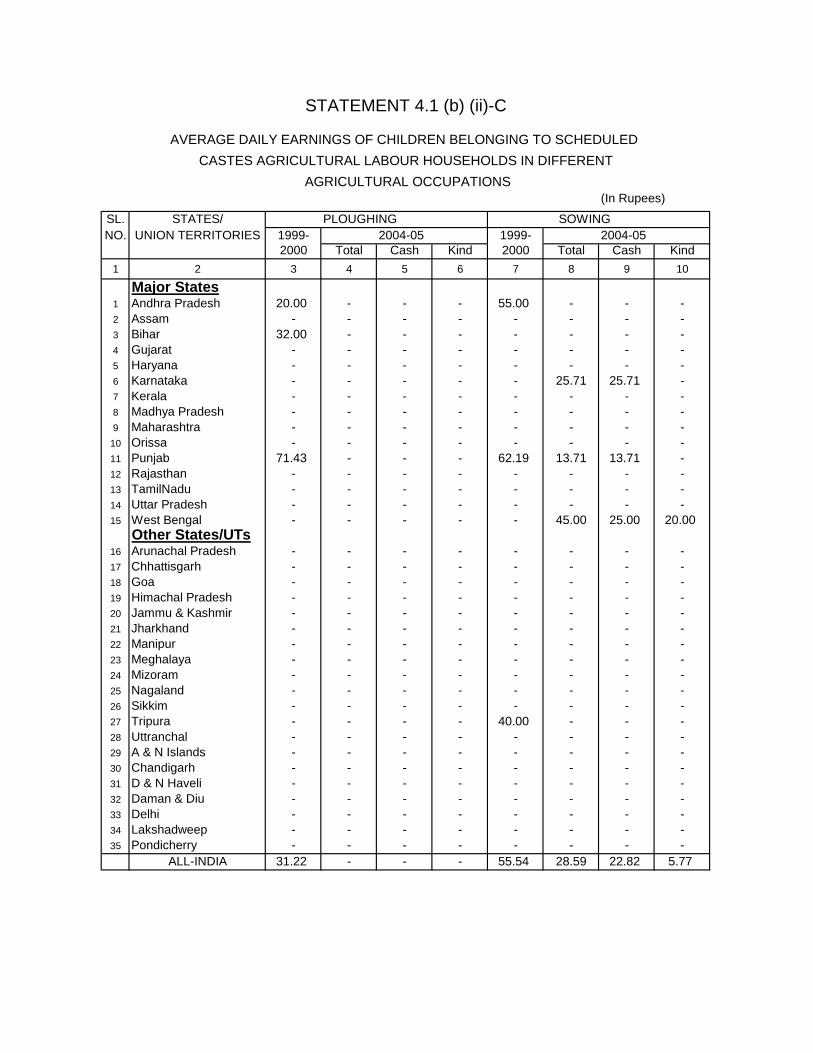
STATEMENT 4.1 (b) (ii)-C
AVERAGE DAILY EARNINGS OF CHILDREN BELONGING TO SCHEDULED CASTES AGRICULTURAL LABOUR HOUSEHOLDS IN DIFFERENT
AGRICULTURAL OCCUPATIONS(In Rupees)
SL. STATES/ PLOUGHING SOWINGNO. UNION TERRITORIES 1999- 2004-05 1999- 2004-05
2000 Total Cash Kind 2000 Total Cash Kind1 2 3 4 5 6 7 8 9 10
Major States1 Andhra Pradesh 20.00 - - - 55.00 - - -2 Assam - - - - - - - -3 Bihar 32.00 - - - - - - -4 Gujarat - - - - - - - -5 Haryana - - - - - - - -6 Karnataka - - - - - 25.71 25.71 -7 Kerala - - - - - - - -8 Madhya Pradesh - - - - - - - -9 Maharashtra - - - - - - - -
10 Orissa - - - - - - - -11 Punjab 71.43 - - - 62.19 13.71 13.71 -12 Rajasthan - - - - - - - -13 TamilNadu - - - - - - - -14 Uttar Pradesh - - - - - - - -15 West Bengal - - - - - 45.00 25.00 20.00
Other States/UTs16 Arunachal Pradesh - - - - - - - -17 Chhattisgarh - - - - - - - -18 Goa - - - - - - - -19 Himachal Pradesh - - - - - - - -20 Jammu & Kashmir - - - - - - - -21 Jharkhand - - - - - - - -22 Manipur - - - - - - - -23 Meghalaya - - - - - - - -24 Mizoram - - - - - - - -25 Nagaland - - - - - - - -26 Sikkim - - - - - - - -27 Tripura - - - - 40.00 - - -28 Uttranchal - - - - - - - -29 A & N Islands - - - - - - - -30 Chandigarh - - - - - - - -31 D & N Haveli - - - - - - - -32 Daman & Diu - - - - - - - -33 Delhi - - - - - - - -34 Lakshadweep - - - - - - - -35 Pondicherry - - - - - - - -
ALL-INDIA 31.22 - - - 55.54 28.59 22.82 5.77

STATEMENT 4.1 (b) (ii)-C Contd..
(In Rupees)
SL. STATES/ TRANSPLANTING WEEDINGNO. UNION TERRITORIES 1999- 2004-05 1999- 2004-05
2000 Total Cash Kind 2000 Total Cash Kind1 2 11 12 13 14 15 16 17 18
Major States1 Andhra Pradesh 24.83 - - - 22.34 22.59 22.59 -2 Assam - - - - - - - -3 Bihar - - - - 18.65 30.00 - 30.004 Gujarat 50.00 - - - - - - -5 Haryana 40.00 - - - 50.00 - - -6 Karnataka 25.00 - - - 19.67 22.98 21.42 1.567 Kerala - - - - - - - -8 Madhya Pradesh - - - - - 30.00 23.19 6.819 Maharashtra - - - - 22.12 28.74 21.26 7.48
10 Orissa 16.47 - - - - - - -11 Punjab - - - - 80.64 - - -12 Rajasthan - - - - - 30.00 30.00 -13 TamilNadu - - - - 23.59 - - -14 Uttar Pradesh - - - - 17.10 33.71 33.71 -15 West Bengal 48.06 - - - 44.00 42.50 25.00 17.50
Other States/UTs16 Arunachal Pradesh - - - - - - - -17 Chhattisgarh - - - - 10.29 - - -18 Goa - - - - - - - -19 Himachal Pradesh - - - - - - - -20 Jammu & Kashmir - - - - - - - -21 Jharkhand 30.00 - - - - - - -22 Manipur - - - - - - - -23 Meghalaya - - - - - - - -24 Mizoram - - - - - - - -25 Nagaland - - - - - - - -26 Sikkim - - - - - - - -27 Tripura 40.00 - - - - - - -28 Uttranchal - - - - - - - -29 A & N Islands - - - - - - - -30 Chandigarh - - - - - - - -31 D & N Haveli - - - - - - - -32 Daman & Diu - - - - - - - -33 Delhi - - - - - - - -34 Lakshadweep - - - - - - - -35 Pondicherry - - - - - - - -
ALL-INDIA 32.18 - - - 24.44 27.81 23.10 4.71

STATEMENT 4.1 (b) (ii)-C Contd..
(In Rupees)
SL. STATES/ HARVESTING CULTIVATIONNO. UNION TERRITORIES 1999- 2004-05 1999- 2004-05
2000 Total Cash Kind 2000 Total Cash Kind1 2 19 20 21 22 23 24 25 26
Major States1 Andhra Pradesh 28.73 20.02 20.02 - 26.51 23.85 23.30 0.552 Assam - - - - 34.83 - - -3 Bihar 22.06 35.00 25.00 10.00 25.63 25.00 25.00 -4 Gujarat 36.49 - - - 20.00 20.00 20.00 -5 Haryana 60.00 48.71 45.97 2.74 37.14 - - -6 Karnataka 26.78 - - - 18.25 28.43 26.83 1.607 Kerala - - - - - - - -8 Madhya Pradesh 25.38 30.00 20.00 10.00 25.00 20.00 20.00 -9 Maharashtra 44.95 20.00 20.00 - 26.05 28.38 28.38 -
10 Orissa - - - - 10.00 14.26 8.52 5.7411 Punjab 28.57 45.00 40.00 5.00 51.30 34.76 34.76 -12 Rajasthan - 36.33 30.00 6.33 - - - -13 TamilNadu 28.42 50.00 - 50.00 30.18 50.00 40.00 10.0014 Uttar Pradesh 26.97 29.73 - 29.73 25.00 - - -15 West Bengal - - - - 41.66 27.40 25.00 2.40
Other States/UTs16 Arunachal Pradesh - - - - - - - -17 Chhattisgarh - - - - 35.00 - - -18 Goa - - - - - - - -19 Himachal Pradesh - - - - - - - -20 Jammu & Kashmir - - - - - - - -21 Jharkhand 55.43 - - - - 17.14 - 17.1422 Manipur - - - - - - - -23 Meghalaya - - - - - - - -24 Mizoram - - - - - - - -25 Nagaland - - - - - - - -26 Sikkim - - - - - - - -27 Tripura - - - - - - - -28 Uttranchal - - - - - 34.44 34.44 -29 A & N Islands - - - - - - - -30 Chandigarh - - - - - - - -31 D & N Haveli - - - - - - - -32 Daman & Diu - - - - - - - -33 Delhi - - - - - - - -34 Lakshadweep - - - - - - - -35 Pondicherry - - - - - - - -
ALL-INDIA 28.40 31.70 22.45 9.25 26.70 25.99 24.55 1.44

STATEMENT 4.1 (b) (ii)-C Contd..
(In Rupees)
SL. STATES/ FORESTRY PLANTATIONNO. UNION TERRITORIES 1999- 2004-05 1999- 2004-05
2000 Total Cash Kind 2000 Total Cash Kind1 2 27 28 29 30 31 32 33 34
Major States1 Andhra Pradesh - - - - - - - -2 Assam - - - - - - - -3 Bihar - - - - - - - -4 Gujarat - - - - - - - -5 Haryana - - - - - - - -6 Karnataka - - - - - - - -7 Kerala - - - - - - - -8 Madhya Pradesh - 30.00 30.00 - - - - -9 Maharashtra - - - - - - - -
10 Orissa - - - - - - - -11 Punjab - - - - - - - -12 Rajasthan - - - - - - - -13 TamilNadu - - - - - - - -14 Uttar Pradesh - - - - - - - -15 West Bengal - - - - - - - -
Other States/UTs16 Arunachal Pradesh - - - - - - - -17 Chhattisgarh - - - - - - - -18 Goa - - - - - - - -19 Himachal Pradesh - - - - - - - -20 Jammu & Kashmir - - - - - - - -21 Jharkhand - - - - - - - -22 Manipur - - - - - - - -23 Meghalaya - - - - - - - -24 Mizoram - - - - - - - -25 Nagaland - - - - - - - -26 Sikkim - - - - - - - -27 - - - - - - - - -28 Uttranchal - - - - - - - -29 A & N Islands - - - - - - - -30 Chandigarh - - - - - - - -31 D & N Haveli - - - - - - - -32 Daman & Diu - - - - - - - -33 Delhi - - - - - - - -34 Lakshadweep - - - - - - - -35 Pondicherry - - - - - - - -
ALL-INDIA - 30.00 30.00 - - - - -

STATEMENT 4.1 (b) (ii)-C Concld..
(In Rupees)
SL. STATES/ ANIMAL HUSBANDRY FISHERIES OTHERS (AGRICULTURAL)NO. UNION TERRITORIES 1999- 2004-05 1999- 2004-05 1999- 2004-05
2000 Total Cash Kind 2000 Total Cash Kind 2000 Total Cash Kind1 2 35 36 37 38 39 40 41 42 43 44 45 46
Major States1 Andhra Pradesh 25.42 28.97 26.97 2.00 27.27 - - - 14.98 25.00 25.00 -2 Assam - - - - - - - - - - - -3 Bihar - 20.00 10.00 10.00 - - - - 30.00 - - -4 Gujarat - - - - - - - - - - - -5 Haryana 21.43 - - - - - - - - - - -6 Karnataka 14.23 10.00 10.00 - - - - - 21.99 - - -7 Kerala - - - - - - - - - - - -8 Madhya Pradesh 14.56 - - - - - - - 14.28 30.00 30.00 -9 Maharashtra - - - - - - - - 25.46 - - -10 Orissa - - - - - - - - - - - -11 Punjab 35.63 - - - - - - - 45.88 - - -12 Rajasthan - - - - - - - - - 60.00 60.00 -13 TamilNadu - - - - - - - - 29.20 - - -14 Uttar Pradesh - - - - - - - - 15.00 - - -15 West Bengal - 29.31 24.19 5.12 - - - - 23.58 - - -
Other States/UTs16 Arunachal Pradesh - - - - - - - - - - - -17 Chhattisgarh - 16.75 - 16.75 - - - - 5.00 - - -18 Goa - - - - - - - - - - - -19 Himachal Pradesh - - - - - - - - - - - -20 Jammu & Kashmir - - - - - - - - - - - -21 Jharkhand - 10.00 10.00 - - - - - - - - -22 Manipur - - - - - - - - - - - -23 Meghalaya - - - - - - - - - - - -24 Mizoram - - - - - - - - - - - -25 Nagaland - - - - - - - - - - - -26 Sikkim - - - - - - - - - - - -27 Tripura - - - - - - - - - - - -28 Uttranchal - - - - - - - - - - - -29 A & N Islands - - - - - - - - - - - -30 Chandigarh - - - - - - - - - - - -31 D & N Haveli - - - - - - - - - - - -32 Daman & Diu - - - - - - - - - - - -33 Delhi - - - - - - - - - - - -34 Lakshadweep - - - - - - - - - - - -35 Pondicherry - - - - - - - - - - - -
ALL-INDIA 22.42 21.35 16.73 4.62 27.27 - - - 21.28 34.29 34.29 -

STATEMENT 4.1 (b) (iii)-C
AVERAGE DAILY EARNINGS OF CHILDREN BELONGING TO SCHEDULED TRIBES AGRICULTURAL LABOUR HOUSEHOLDS IN DIFFERENT AGRICULTURAL OCCUPATIONS
(In Rupees)
SL. STATES/ PLOUGHING SOWINGNO. UNION TERRITORIES 1999- 2004-05 1999- 2004-05
2000 Total Cash Kind 2000 Total Cash Kind1 2 3 4 5 6 7 8 9 10
Major States1 Andhra Pradesh 30.83 - - - - - - -2 Assam - - - - - - - -3 Bihar 30.00 - - - - - - -4 Gujarat 20.00 - - - - - - -5 Haryana - - - - - - - -6 Karnataka - 30.00 30.00 - - - - -7 Kerala - - - - - - - -8 Madhya Pradesh 25.00 - - - - - - -9 Maharashtra 30.00 - - - 20.00 - - -
10 Orissa 20.10 - - - - - - -11 Punjab - - - - - - - -12 Rajasthan 30.00 - - - - - - -13 TamilNadu - - - - - - - -14 Uttar Pradesh - - - - - - - -15 West Bengal - - - - - - - -
Other States/UTs16 Arunachal Pradesh - - - - - - - -17 Chhattisgarh - - - - - - - -18 Goa - - - - - - - -19 Himachal Pradesh - - - - - - - -20 Jammu & Kashmir - - - - - - - -21 Jharkhand 30.00 - - - - - - -22 Manipur - - - - - - - -23 Meghalaya - - - - - - - -24 Mizoram - - - - - - - -25 Nagaland - - - - - - - -26 Sikkim - - - - - - - -27 Tripura - - - - - - - -28 Uttranchal - - - - - - - -29 A & N Islands - - - - - - - -30 Chandigarh - - - - - - - -31 D & N Haveli - - - - - - - -32 Daman & Diu - - - - - - - -33 Delhi - - - - - - - -34 Lakshadweep - - - - - - - -35 Pondicherry - - - - - - - -
ALL-INDIA 24.94 30.00 30.00 - 20.00 - - -

STATEMENT 4.1 (b) (iii)-C Contd..
(In Rupees)
SL. STATES/ TRANSPLANTING WEEDINGNO. UNION TERRITORIES 1999- 2004-05 1999- 2004-05
2000 Total Cash Kind 2000 Total Cash Kind1 2 11 12 13 14 15 16 17 18
Major States1 Andhra Pradesh 39.49 - - - 20.00 20.00 20.00 -2 Assam - - - - - - - -3 Bihar - - - - - - - -4 Gujarat - - - - - 39.90 24.27 15.635 Haryana - - - - - - - -6 Karnataka - 30.00 30.00 - 18.30 30.00 16.67 13.337 Kerala - - - - - - - -8 Madhya Pradesh 15.00 30.00 30.00 - 25.00 25.00 25.00 -9 Maharashtra - - - - 28.90 25.00 25.00 -
10 Orissa 16.19 49.66 44.38 5.28 25.64 - - -11 Punjab - - - - - - - -12 Rajasthan - - - - - - - -13 TamilNadu - - - - - - - -14 Uttar Pradesh - - - - - - - -15 West Bengal 34.36 - - - - - - -
Other States/UTs16 Arunachal Pradesh - - - - - - - -17 Chhattisgarh - - - - 12.00 20.00 20.00 -18 Goa - - - - - - - -19 Himachal Pradesh - - - - - - - -20 Jammu & Kashmir - - - - - - - -21 Jharkhand - - - - - - - -22 Manipur - - - - - - - -23 Meghalaya 26.67 42.86 42.86 - - 40.00 40.00 -24 Mizoram - - - - - - - -25 Nagaland - - - - - - - -26 Sikkim - - - - - - - -27 Tripura - - - - - - - -28 Uttranchal - - - - - - - -29 A & N Islands - - - - - - - -30 Chandigarh - - - - - - - -31 D & N Haveli - - - - - - - -32 Daman & Diu - - - - - - - -33 Delhi - - - - - - - -34 Lakshadweep - - - - - - - -35 Pondicherry - - - - - - - -
ALL-INDIA 30.26 37.59 35.73 1.86 22.85 29.04 22.10 6.94
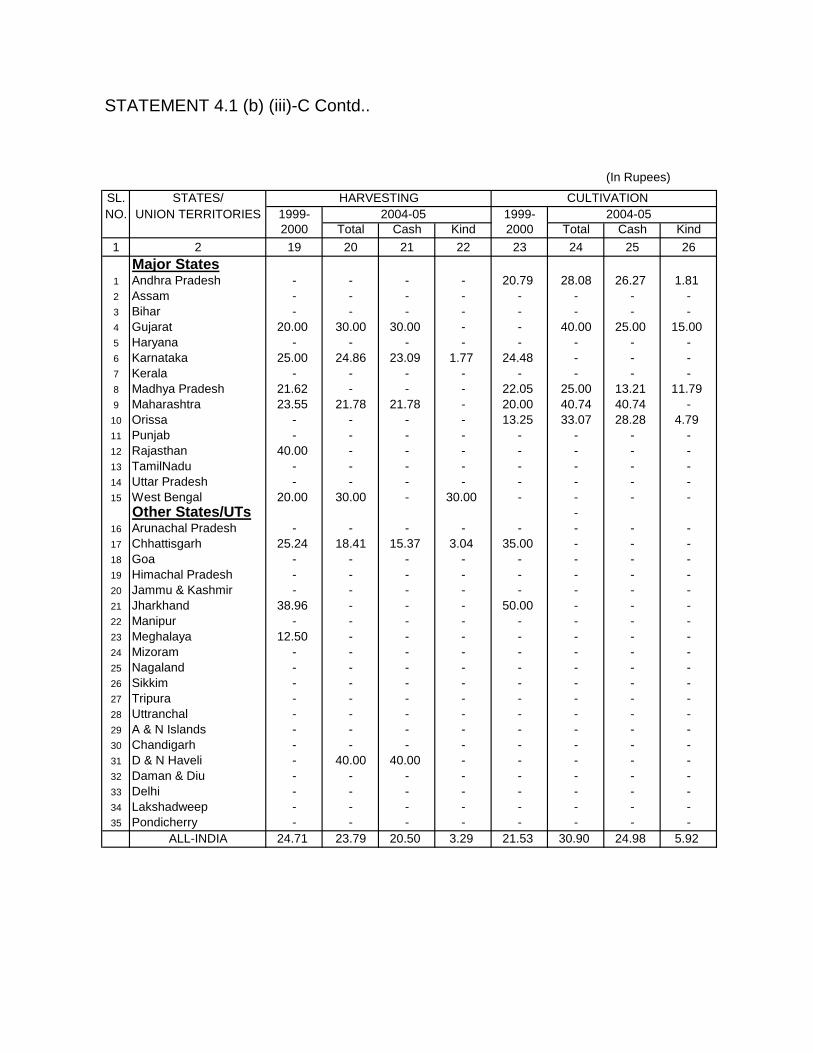
STATEMENT 4.1 (b) (iii)-C Contd..
(In Rupees)
SL. STATES/ HARVESTING CULTIVATIONNO. UNION TERRITORIES 1999- 2004-05 1999- 2004-05
2000 Total Cash Kind 2000 Total Cash Kind1 2 19 20 21 22 23 24 25 26
Major States1 Andhra Pradesh - - - - 20.79 28.08 26.27 1.812 Assam - - - - - - - -3 Bihar - - - - - - - -4 Gujarat 20.00 30.00 30.00 - - 40.00 25.00 15.005 Haryana - - - - - - - -6 Karnataka 25.00 24.86 23.09 1.77 24.48 - - -7 Kerala - - - - - - - -8 Madhya Pradesh 21.62 - - - 22.05 25.00 13.21 11.799 Maharashtra 23.55 21.78 21.78 - 20.00 40.74 40.74 -
10 Orissa - - - - 13.25 33.07 28.28 4.7911 Punjab - - - - - - - -12 Rajasthan 40.00 - - - - - - -13 TamilNadu - - - - - - - -14 Uttar Pradesh - - - - - - - -15 West Bengal 20.00 30.00 - 30.00 - - - -
Other States/UTs -16 Arunachal Pradesh - - - - - - - -17 Chhattisgarh 25.24 18.41 15.37 3.04 35.00 - - -18 Goa - - - - - - - -19 Himachal Pradesh - - - - - - - -20 Jammu & Kashmir - - - - - - - -21 Jharkhand 38.96 - - - 50.00 - - -22 Manipur - - - - - - - -23 Meghalaya 12.50 - - - - - - -24 Mizoram - - - - - - - -25 Nagaland - - - - - - - -26 Sikkim - - - - - - - -27 Tripura - - - - - - - -28 Uttranchal - - - - - - - -29 A & N Islands - - - - - - - -30 Chandigarh - - - - - - - -31 D & N Haveli - 40.00 40.00 - - - - -32 Daman & Diu - - - - - - - -33 Delhi - - - - - - - -34 Lakshadweep - - - - - - - -35 Pondicherry - - - - - - - -
ALL-INDIA 24.71 23.79 20.50 3.29 21.53 30.90 24.98 5.92

STATEMENT 4.1 (b) (iii)-C Contd..
(In Rupees)
SL. STATES/ FORESTRY PLANTATIONNO. UNION TERRITORIES 1999- 2004-05 1999- 2004-05
2000 Total Cash Kind 2000 Total Cash Kind1 2 27 28 29 30 31 32 33 34
Major States1 Andhra Pradesh - - - - - - - -2 Assam - - - - 29.00 - - -3 Bihar - - - - - - - -4 Gujarat - - - - 20.00 - - -5 Haryana - - - - - - - -6 Karnataka - - - - - - - -7 Kerala - - - - - - - -8 Madhya Pradesh - 20.00 20.00 - - - - -9 Maharashtra - - - - 15.00 - - -
10 Orissa 40.00 - - - - - - -11 Punjab - - - - - - - -12 Rajasthan - - - - - - - -13 TamilNadu - - - - - - - -14 Uttar Pradesh - - - - - - - -15 West Bengal - - - - 42.33 - - -
Other States/UTs16 Arunachal Pradesh - - - - - - - -17 Chhattisgarh - - - - - - - -18 Goa - - - - - - - -19 Himachal Pradesh - - - - - - - -20 Jammu & Kashmir - - - - - - - -21 Jharkhand - - - - - - - -22 Manipur - - - - - - - -23 Meghalaya - - - - 36.36 - - -24 Mizoram - - - - - - - -25 Nagaland - - - - - - - -26 Sikkim - - - - - - - -27 Tripura - - - - - - - -28 Uttranchal - - - - - - - -29 A & N Islands - - - - - - - -30 Chandigarh - - - - - - - -31 D & N Haveli - - - - - - - -32 Daman & Diu - - - - - - - -33 Delhi - - - - - - - -34 Lakshadweep - - - - - - - -35 Pondicherry - - - - - - - -
ALL-INDIA 40.00 20.00 20.00 - 18.06 - - -

STATEMENT 4.1 (b) (iii)-C Concld..
(In Rupees)
SL. STATES/ ANIMAL HUSBANDRY FISHERIES OTHERS (AGRICULTURAL)NO. UNION TERRITORIES 1999- 2004-05 1999- 2004-05 1999- 2004-05
2000 Total Cash Kind 2000 Total Cash Kind 2000 Total Cash Kind1 2 35 36 37 38 39 40 41 42 43 44 45 46
Major States1 Andhra Pradesh - - - - - - - - 26.97 - - -2 Assam - - - - - - - - - - - -3 Bihar - - - - - - - - - - - -4 Gujarat 12.86 - - - - - - - 20.00 20.00 20.00 -5 Haryana - - - - - - - - - - - -6 Karnataka - 40.00 40.00 - - - - - 9.81 - - -7 Kerala - - - - - - - - - - - -8 Madhya Pradesh 20.00 - - - - - - - 15.93 - - -9 Maharashtra 16.17 15.00 10.00 5.00 - - - - 16.34 - - -10 Orissa 11.43 - - - - - - - - - - -11 Punjab - - - - - - - - - - - -12 Rajasthan 14.05 - - - - - - - - - - -13 TamilNadu - - - - - - - - - - - -14 Uttar Pradesh - - - - - - - - - - - -15 West Bengal - - - - - - - - 43.80 - - -
Other States/UTs16 Arunachal Pradesh - - - - - - - - - - - -17 Chhattisgarh - 15.00 15.00 - - - - - - - - -18 Goa - - - - - - - - - - - -19 Himachal Pradesh - - - - - - - - - - - -20 Jammu & Kashmir - - - - - - - - - - - -21 Jharkhand 11.43 - - - - - - - - - - -22 Manipur - - - - - - - - - - - -23 Meghalaya - - - - - - - - - - - -24 Mizoram - - - - - - - - - - - -25 Nagaland - - - - - - - - - - - -26 Sikkim - - - - - - - - - - - -27 Tripura - - - - - - - - - - - -28 Uttranchal - - - - - - - - - - - -29 A & N Islands - - - - - - - - - - - -30 Chandigarh - - - - - - - - - - - -31 D & N Haveli - - - - - - - - - - - -32 Daman & Diu - - - - - - - - - - - -33 Delhi - - - - - - - - - - - -34 Lakshadweep - - - - - - - - - - - -35 Pondicherry - - - - - - - - - - - -
ALL-INDIA 15.08 25.20 23.39 1.81 - - - - 19.70 20.00 20.00 -
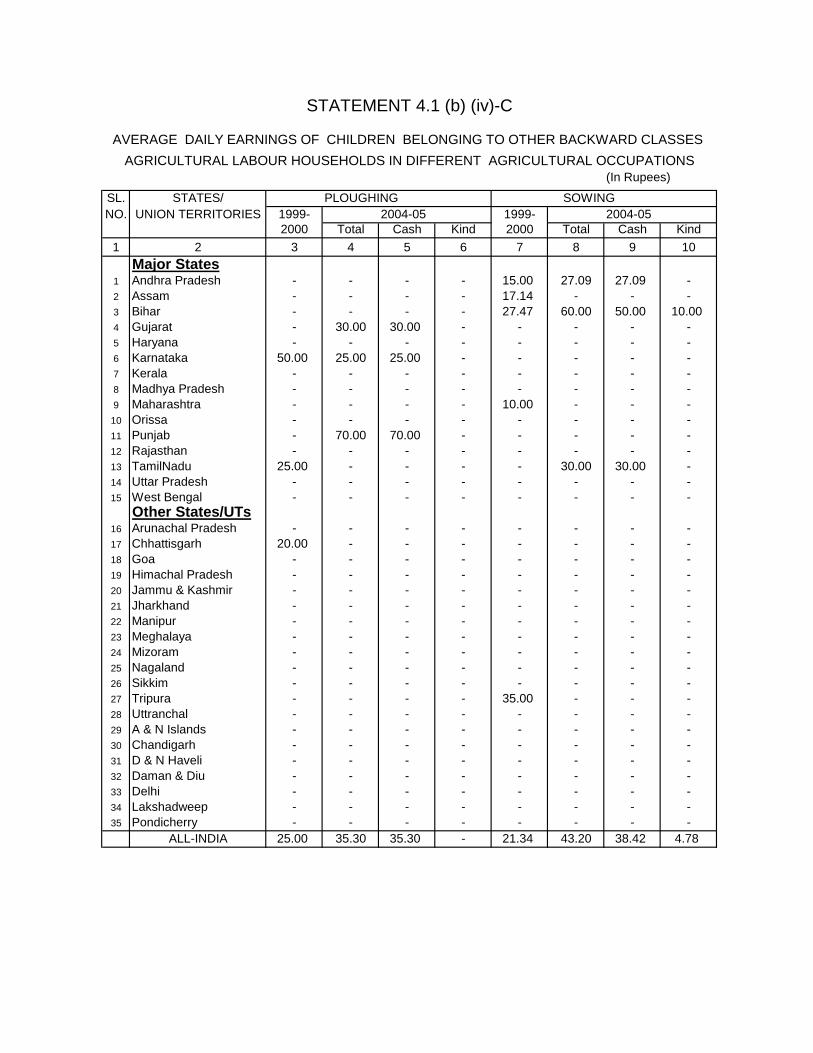
STATEMENT 4.1 (b) (iv)-C
AVERAGE DAILY EARNINGS OF CHILDREN BELONGING TO OTHER BACKWARD CLASSES AGRICULTURAL LABOUR HOUSEHOLDS IN DIFFERENT AGRICULTURAL OCCUPATIONS
(In Rupees)
SL. STATES/ PLOUGHING SOWINGNO. UNION TERRITORIES 1999- 2004-05 1999- 2004-05
2000 Total Cash Kind 2000 Total Cash Kind1 2 3 4 5 6 7 8 9 10
Major States1 Andhra Pradesh - - - - 15.00 27.09 27.09 -2 Assam - - - - 17.14 - - -3 Bihar - - - - 27.47 60.00 50.00 10.004 Gujarat - 30.00 30.00 - - - - -5 Haryana - - - - - - - -6 Karnataka 50.00 25.00 25.00 - - - - -7 Kerala - - - - - - - -8 Madhya Pradesh - - - - - - - -9 Maharashtra - - - - 10.00 - - -
10 Orissa - - - - - - - -11 Punjab - 70.00 70.00 - - - - -12 Rajasthan - - - - - - - -13 TamilNadu 25.00 - - - - 30.00 30.00 -14 Uttar Pradesh - - - - - - - -15 West Bengal - - - - - - - -
Other States/UTs16 Arunachal Pradesh - - - - - - - -17 Chhattisgarh 20.00 - - - - - - -18 Goa - - - - - - - -19 Himachal Pradesh - - - - - - - -20 Jammu & Kashmir - - - - - - - -21 Jharkhand - - - - - - - -22 Manipur - - - - - - - -23 Meghalaya - - - - - - - -24 Mizoram - - - - - - - -25 Nagaland - - - - - - - -26 Sikkim - - - - - - - -27 Tripura - - - - 35.00 - - -28 Uttranchal - - - - - - - -29 A & N Islands - - - - - - - -30 Chandigarh - - - - - - - -31 D & N Haveli - - - - - - - -32 Daman & Diu - - - - - - - -33 Delhi - - - - - - - -34 Lakshadweep - - - - - - - -35 Pondicherry - - - - - - - -
ALL-INDIA 25.00 35.30 35.30 - 21.34 43.20 38.42 4.78

STATEMENT 4.1 (b) (iv)-C Contd..
(In Rupees)
SL. STATES/ TRANSPLANTING WEEDINGNO. UNION TERRITORIES 1999- 2004-05 1999- 2004-05
2000 Total Cash Kind 2000 Total Cash Kind1 2 11 12 13 14 15 16 17 18
Major States1 Andhra Pradesh 15.36 58.98 58.98 - 23.14 24.23 23.75 0.482 Assam - - - - - - - -3 Bihar 16.32 44.44 22.22 22.22 16.00 11.16 4.65 6.514 Gujarat - - - - 40.00 37.45 34.48 2.975 Haryana - - - - - - - -6 Karnataka 19.08 - - - 14.76 27.11 25.93 1.187 Kerala - - - - - - - -8 Madhya Pradesh - - - - 22.80 - - -9 Maharashtra - - - - 20.00 22.03 22.03 -
10 Orissa - - - - - - - -11 Punjab - - - - - - - -12 Rajasthan - - - - 26.67 - - -13 TamilNadu - - - - 16.96 25.00 20.00 5.0014 Uttar Pradesh 14.29 34.29 34.29 - - 40.00 39.67 0.3315 West Bengal - - - - - - - -
Other States/UTs16 Arunachal Pradesh - - - - - - - -17 Chhattisgarh - 20.00 20.00 - - 25.00 25.00 -18 Goa - - - - 12.89 - - -19 Himachal Pradesh - - - - - - - -20 Jammu & Kashmir - - - - - - - -21 Jharkhand - - - - - - - -22 Manipur - - - - - - - -23 Meghalaya - - - - - - - -24 Mizoram - - - - - - - -25 Nagaland - - - - - - - -26 Sikkim - - - - - - - -27 Tripura - - - - - - - -28 Uttranchal - - - - - - - -29 A & N Islands - - - - - - - -30 Chandigarh - - - - - - - -31 D & N Haveli - - - - - - - -32 Daman & Diu - - - - - - - -33 Delhi - - - - - - - -34 Lakshadweep - - - - - - - -35 Pondicherry - - - - - - - -
ALL-INDIA 15.66 42.76 40.96 1.80 20.49 26.02 24.16 1.86

STATEMENT 4.1 (b) (iv)-C Contd..
(In Rupees)
SL. STATES/ HARVESTING CULTIVATIONNO. UNION TERRITORIES 1999- 2004-05 1999- 2004-05
2000 Total Cash Kind 2000 Total Cash Kind1 2 19 20 21 22 23 24 25 26
Major States1 Andhra Pradesh 27.76 30.36 30.13 0.23 19.97 24.70 24.46 0.242 Assam - - - - - - - -3 Bihar 32.10 - - - 25.94 36.01 28.01 8.004 Gujarat - 46.97 33.03 13.94 30.26 50.00 50.00 -5 Haryana - - - - - - - -6 Karnataka 17.33 20.00 20.00 - 19.56 34.81 31.69 3.127 Kerala - - - - - - - -8 Madhya Pradesh 18.50 30.00 30.00 - 23.40 24.29 24.29 -9 Maharashtra 20.45 18.55 18.55 - 18.96 57.39 57.39 -
10 Orissa - - - - 23.82 - - -11 Punjab 57.19 37.30 37.30 - 30.00 - - -12 Rajasthan - - - - - - - -13 TamilNadu - 25.00 25.00 - 41.23 - - -14 Uttar Pradesh 22.00 - - 25.71 41.28 30.76 30.76 -15 West Bengal - - - - 35.00 40.00 40.00 -
Other States/UTs16 Arunachal Pradesh - - - - - - - -17 Chhattisgarh - - - - - 20.00 20.00 -18 Goa - - - - - - - -19 Himachal Pradesh - - - - - - - -20 Jammu & Kashmir - - - - - - - -21 Jharkhand 37.98 - - - 40.00 40.00 - 40.0022 Manipur - - - - - - - -23 Meghalaya - - - - - - - -24 Mizoram - - - - - - - -25 Nagaland - - - - - - - -26 Sikkim - - - - - - - -27 Tripura - - - - - - - -28 Uttranchal - 50.00 40.00 10.00 - - - -29 A & N Islands - - - - - - - -30 Chandigarh - - - - - - - -31 D & N Haveli - - - - - - - -32 Daman & Diu - - - - - - - -33 Delhi - - - - - - - -34 Lakshadweep - - - - - - - -35 Pondicherry - - - - - - - -
ALL-INDIA 27.68 29.29 25.72 3.57 24.11 35.71 34.23 1.48

STATEMENT 4.1 (b) (iv)-C Contd..
(In Rupees)
SL. STATES/ FORESTRY PLANTATIONNO. UNION TERRITORIES 1999- 2004-05 1999- 2004-05
2000 Total Cash Kind 2000 Total Cash Kind1 2 27 28 29 30 31 32 33 34
Major States1 Andhra Pradesh - - - - - - - -2 Assam - - - - - 63.14 40.29 22.853 Bihar - - - - - - - -4 Gujarat - - - - - - - -5 Haryana - - - - - - - -6 Karnataka 42.50 - - - - - - -7 Kerala - - - - - - - -8 Madhya Pradesh - - - - - - - -9 Maharashtra - - - - - - - -
10 Orissa - - - - - - - -11 Punjab - - - - - - - -12 Rajasthan - - - - - - - -13 TamilNadu - - - - - - - -14 Uttar Pradesh - - - - - - - -15 West Bengal - - - - - - - -
Other States/UTs16 Arunachal Pradesh - - - - - - - -17 Chhattisgarh - - - - - - - -18 Goa - - - - - - - -19 Himachal Pradesh - - - - - - - -20 Jammu & Kashmir - - - - - - - -21 Jharkhand - - - - - - - -22 Manipur - - - - - - - -23 Meghalaya - - - - - - - -24 Mizoram - - - - - - - -25 Nagaland - - - - - - - -26 Sikkim - - - - - - - -27 Tripura - - - - - - - -28 Uttranchal - - - - - - - -29 A & N Islands - - - - - - - -30 Chandigarh - - - - - - - -31 D & N Haveli - - - - - - - -32 Daman & Diu - - - - - - - -33 Delhi - - - - - - - -34 Lakshadweep - - - - - - - -35 Pondicherry - - - - - - - -
ALL-INDIA 42.50 - - - - 63.14 40.29 22.85
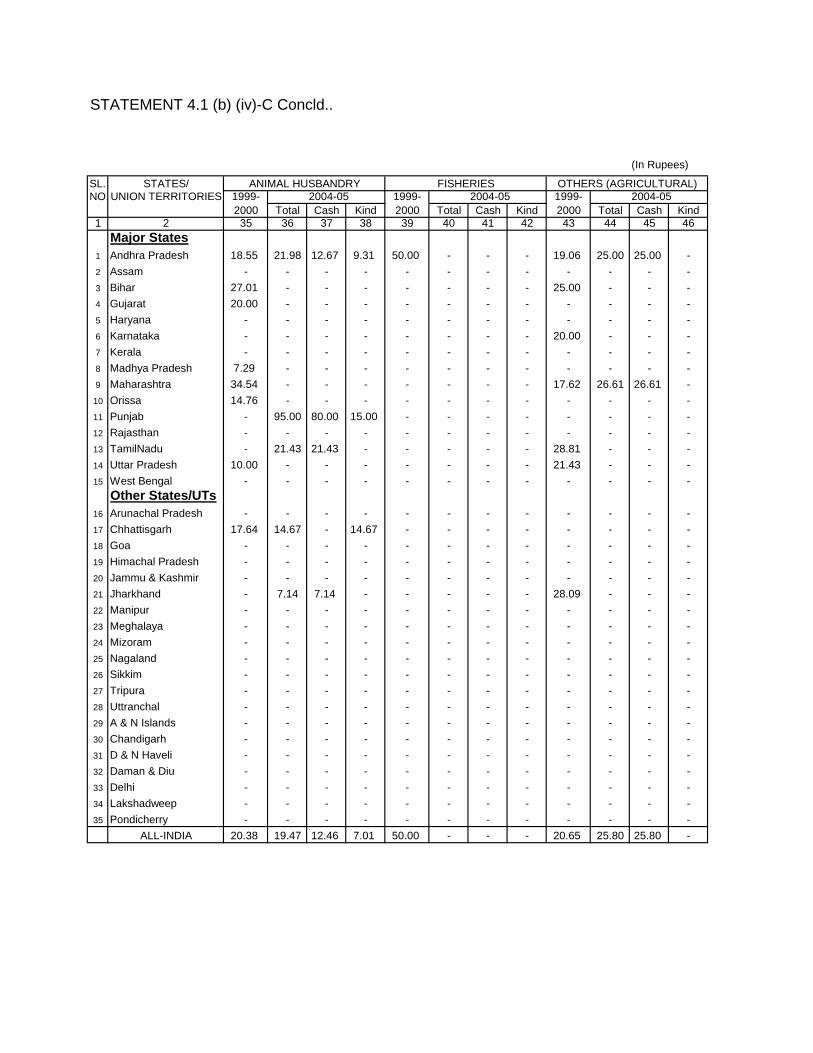
STATEMENT 4.1 (b) (iv)-C Concld..
(In Rupees)
SL. STATES/ ANIMAL HUSBANDRY FISHERIES OTHERS (AGRICULTURAL)NO. UNION TERRITORIES 1999- 2004-05 1999- 2004-05 1999- 2004-05
2000 Total Cash Kind 2000 Total Cash Kind 2000 Total Cash Kind1 2 35 36 37 38 39 40 41 42 43 44 45 46
Major States1 Andhra Pradesh 18.55 21.98 12.67 9.31 50.00 - - - 19.06 25.00 25.00 -2 Assam - - - - - - - - - - - -3 Bihar 27.01 - - - - - - - 25.00 - - -4 Gujarat 20.00 - - - - - - - - - - -5 Haryana - - - - - - - - - - - -6 Karnataka - - - - - - - - 20.00 - - -7 Kerala - - - - - - - - - - - -8 Madhya Pradesh 7.29 - - - - - - - - - - -9 Maharashtra 34.54 - - - - - - - 17.62 26.61 26.61 -10 Orissa 14.76 - - - - - - - - - - -11 Punjab - 95.00 80.00 15.00 - - - - - - - -12 Rajasthan - - - - - - - - - - - -13 TamilNadu - 21.43 21.43 - - - - - 28.81 - - -14 Uttar Pradesh 10.00 - - - - - - - 21.43 - - -15 West Bengal - - - - - - - - - - - -
Other States/UTs16 Arunachal Pradesh - - - - - - - - - - - -17 Chhattisgarh 17.64 14.67 - 14.67 - - - - - - - -18 Goa - - - - - - - - - - - -19 Himachal Pradesh - - - - - - - - - - - -20 Jammu & Kashmir - - - - - - - - - - - -21 Jharkhand - 7.14 7.14 - - - - - 28.09 - - -22 Manipur - - - - - - - - - - - -23 Meghalaya - - - - - - - - - - - -24 Mizoram - - - - - - - - - - - -25 Nagaland - - - - - - - - - - - -26 Sikkim - - - - - - - - - - - -27 Tripura - - - - - - - - - - - -28 Uttranchal - - - - - - - - - - - -29 A & N Islands - - - - - - - - - - - -30 Chandigarh - - - - - - - - - - - -31 D & N Haveli - - - - - - - - - - - -32 Daman & Diu - - - - - - - - - - - -33 Delhi - - - - - - - - - - - -34 Lakshadweep - - - - - - - - - - - -35 Pondicherry - - - - - - - - - - - -
ALL-INDIA 20.38 19.47 12.46 7.01 50.00 - - - 20.65 25.80 25.80 -

STATEMENT 4.2
AVERAGE DAILY REAL EARNINGS OF MEN BELONGING TO AGRICULTURAL LABOUR HOUSEHOLDS IN AGRICULTURAL OPERATIONS
Money Earnings Agrl. Consumer Real Earnings Index of RealSL. STATES/ Rural Labour Enquiry Index Numbers at 1999-2000 Prices Earnings forNO. UNION TERRITORIES ---------------- ---------------- for 2004 - 2005 ---------------- ---------------- 2004 - 2005
1999-2000 2004-05 after base shifted 1999-2000 2004-05 with base(Rs.) (Rs.) to 1999-2000=100 (Rs.) (Rs.) 1999-2000=100
1 2 3 4 5 6 7 8
1 Andhra Pradesh 39.76 45.95 112 39.76 41.03 103
2 Assam 45.51 60.13 107 45.51 56.20 123
3 Bihar 35.04 43.43 108 35.04 40.21 115
4 Gujarat 38.98 45.95 113 38.98 40.66 104
5 Hayana 60.57 73.29 115 60.57 63.73 105
6 Himachal Pradesh 64.14 89.31 111 64.14 80.46 125
7 Jammu & Kashmir 86.44 90.90 108 86.44 84.17 97
8 Karnataka 39.75 43.31 108 39.75 40.10 101
9 Kerala 95.34 115.08 112 95.34 102.75 108
10 Madhya Pradesh 29.80 34.63 105 29.80 32.98 111
11 Maharashtra 37.47 43.98 115 37.47 38.24 102
12 Manipur 54.24 57.72 99 54.24 58.30 107
13 Meghalaya 47.95 61.72 107 47.95 57.68 120
14 Orissa 28.63 39.46 101 28.63 39.07 136
15 Punjab 63.44 71.75 113 63.44 63.50 100
16 Rajasthan 50.45 64.13 112 50.45 57.26 113
17 TamilNadu 51.78 64.08 115 51.78 55.72 108
18 Tripura 49.24 59.93 102 49.24 58.75 119
19 Uttar Pradesh 37.85 48.46 112 37.85 43.27 114
20 West Bengal 43.32 45.08 110 43.32 40.98 95
ALL-INDIA 40.15 47.53 111 40.15 42.82 107
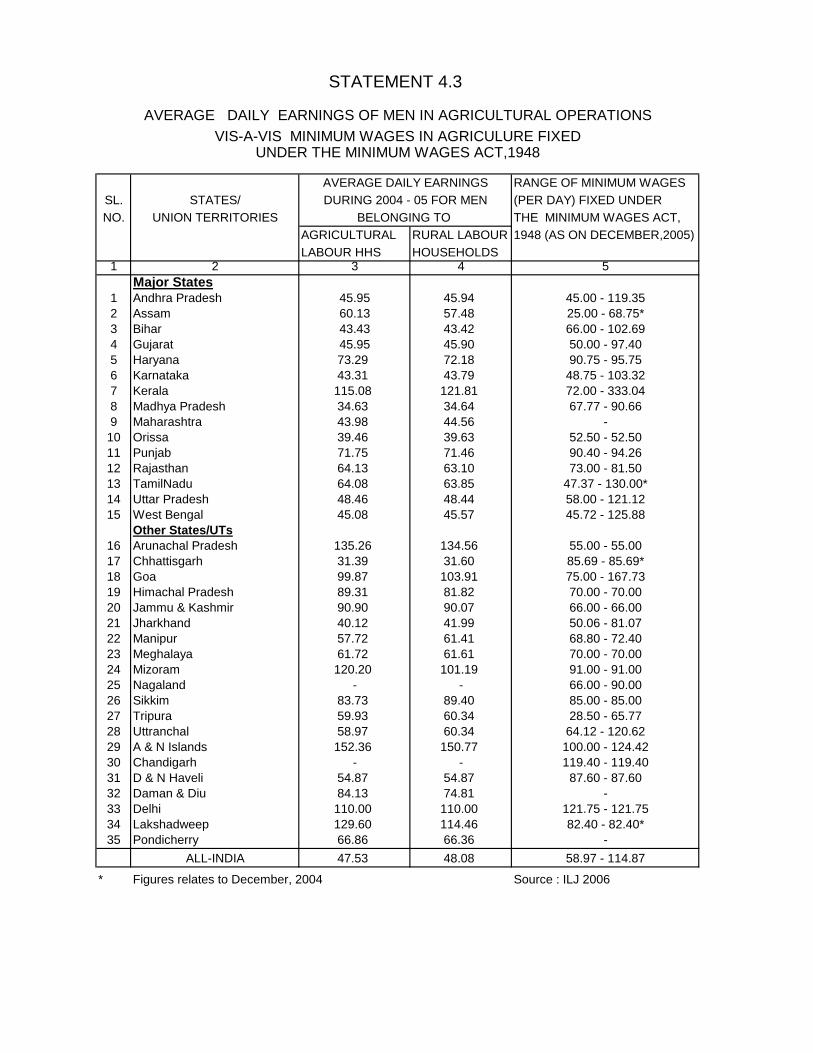
STATEMENT 4.3
AVERAGE DAILY EARNINGS OF MEN IN AGRICULTURAL OPERATIONS VIS-A-VIS MINIMUM WAGES IN AGRICULURE FIXED
UNDER THE MINIMUM WAGES ACT,1948
AVERAGE DAILY EARNINGS RANGE OF MINIMUM WAGESSL. STATES/ DURING 2004 - 05 FOR MEN (PER DAY) FIXED UNDERNO. UNION TERRITORIES BELONGING TO THE MINIMUM WAGES ACT,
AGRICULTURAL RURAL LABOUR 1948 (AS ON DECEMBER,2005)LABOUR HHS HOUSEHOLDS
1 2 3 4 5Major States
1 Andhra Pradesh 45.95 45.94 45.00 - 119.352 Assam 60.13 57.48 25.00 - 68.75*3 Bihar 43.43 43.42 66.00 - 102.694 Gujarat 45.95 45.90 50.00 - 97.405 Haryana 73.29 72.18 90.75 - 95.756 Karnataka 43.31 43.79 48.75 - 103.327 Kerala 115.08 121.81 72.00 - 333.048 Madhya Pradesh 34.63 34.64 67.77 - 90.669 Maharashtra 43.98 44.56 -
10 Orissa 39.46 39.63 52.50 - 52.5011 Punjab 71.75 71.46 90.40 - 94.2612 Rajasthan 64.13 63.10 73.00 - 81.5013 TamilNadu 64.08 63.85 47.37 - 130.00*14 Uttar Pradesh 48.46 48.44 58.00 - 121.1215 West Bengal 45.08 45.57 45.72 - 125.88
Other States/UTs16 Arunachal Pradesh 135.26 134.56 55.00 - 55.0017 Chhattisgarh 31.39 31.60 85.69 - 85.69*18 Goa 99.87 103.91 75.00 - 167.7319 Himachal Pradesh 89.31 81.82 70.00 - 70.0020 Jammu & Kashmir 90.90 90.07 66.00 - 66.0021 Jharkhand 40.12 41.99 50.06 - 81.0722 Manipur 57.72 61.41 68.80 - 72.4023 Meghalaya 61.72 61.61 70.00 - 70.0024 Mizoram 120.20 101.19 91.00 - 91.0025 Nagaland - - 66.00 - 90.0026 Sikkim 83.73 89.40 85.00 - 85.0027 Tripura 59.93 60.34 28.50 - 65.7728 Uttranchal 58.97 60.34 64.12 - 120.6229 A & N Islands 152.36 150.77 100.00 - 124.4230 Chandigarh - - 119.40 - 119.4031 D & N Haveli 54.87 54.87 87.60 - 87.6032 Daman & Diu 84.13 74.81 -33 Delhi 110.00 110.00 121.75 - 121.7534 Lakshadweep 129.60 114.46 82.40 - 82.40*35 Pondicherry 66.86 66.36 -
ALL-INDIA 47.53 48.08 58.97 - 114.87
* Figures relates to December, 2004 Source : ILJ 2006

STATEMENT 4.4
AVERAGE DAILY EARNINGS IN AGRICULTURAL OCCUPATIONS VIS-A-VIS THOSE IN OTHER SECTORS OF ECONOMY
AVERAGE DAILY EARNINGS AVERAGE DAILY EARNINGS RATIOS OF AVERAGE EARNINGS SL. STATES/ OF MEN BELONGING TO FACTO- COAL PLANT- IN AGRICULTURAL OPERATIONS NO. UNION TERRITORIES RURAL LABOUR HOUSEHOLDSRIES MINES ATIONS DURING 2004-05 IN RELATION TO
ENGAGED IN AGRICULTURAL DEC.,05 DEC.,05 2004-05 FACTORIES COAL, MINES PLANTATIONS OPERATIONS (RLE) COL.4/COL.5 COL.4/COL.6 COL.4/COL.7
1999-2000 2004-05
1 2 3 4 5 6 7 8 9 10Major States
1 Andhra Pradesh 39.80 45.94 54.56 476.57 56.84 0.84 0.10 0.812 Assam 43.13 57.48 45.26 348.86 76.48 1.27 0.16 0.753 Bihar 35.10 43.42 - - - - - -4 Gujarat 38.81 45.90 - 422.71 - - 0.11 -5 Haryana 60.04 72.18 - - - - - -6 Karnataka 40.32 43.79 - - - - - -7 Kerala 94.52 121.81 58.18 - - 2.09 - -8 Madhya Pradesh 30.01 34.64 - 471.71 - - 0.07 -9 Maharashtra 37.67 44.56 41.43 431.86 - 1.08 0.10 -
10 Orissa 28.69 39.63 56.87 367.86 - 0.70 0.11 -11 Punjab 63.57 71.46 - - - - - -12 Rajasthan 51.68 63.10 59.52 - - 1.06 - -13 TamilNadu 52.36 63.85 - 420.29 43.05 - 0.15 1.4814 Uttar Pradesh 38.29 48.44 - 388.86 - - 0.12 -15 West Bengal 43.45 45.57 - - - - - -
Other States/UTs16 Arunachal Pradesh 63.91 134.56 - - - - - -17 Chhattisgarh 26.31 31.60 - 405.29 - - 0.08 -18 Goa 76.47 103.91 89.07 - - 1.17 - -19 Himachal Pradesh 63.52 81.82 - - - - - -20 Jammu & Kashmir 85.91 90.07 - 210.29 - - 0.43 -21 Jharkhand 34.45 41.99 60.42 384.29 - 0.69 0.11 -22 Manipur 52.24 61.41 65.00 - - 0.94 - -23 Meghalaya 50.58 61.61 - - - - - -24 Mizoram 87.57 101.19 - - - - - -25 Nagaland 111.86 - - - - - - -26 Sikkim 50.67 89.40 - - 22.32 - - 4.0127 Tripura 49.60 60.34 43.57 - - 1.38 - -28 Uttranchal 58.96 60.34 - - - - - -29 A & N Islands 90.30 150.77 - - - - - -30 Chandigarh 86.48 - - - - - - -31 D & N Haveli 39.19 54.87 - - - - - -32 Daman & Diu 65.82 74.81 - - - - - -33 Delhi 80.00 110.00 - - - - - -34 Lakshadweep 103.19 114.46 - - - - - -35 Pondicherry 47.48 66.36 - - - - - -
ALL-INDIA 40.58 48.07 58.42 425.14 - 0.82 0.11 -
* Source : Indian Labour Year Book, 2007
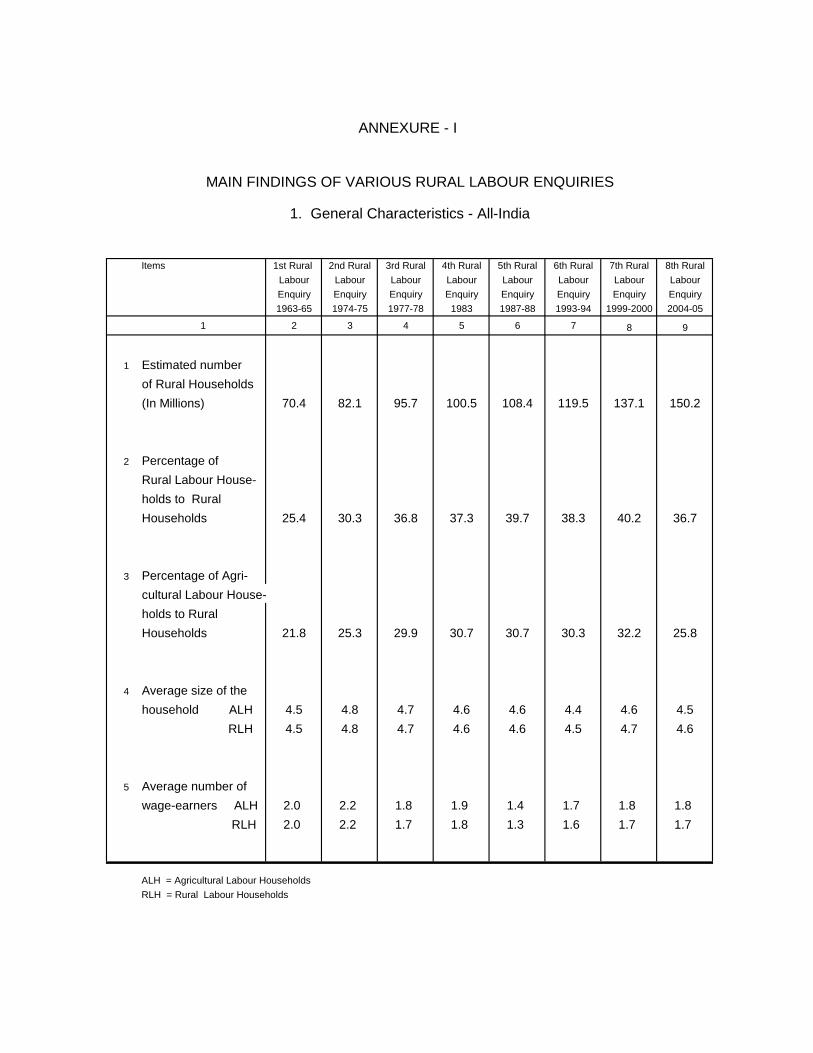
ANNEXURE - I
MAIN FINDINGS OF VARIOUS RURAL LABOUR ENQUIRIES
1. General Characteristics - All-India
Items 1st Rural 2nd Rural 3rd Rural 4th Rural 5th Rural 6th Rural 7th Rural 8th RuralLabour Labour Labour Labour Labour Labour Labour LabourEnquiry Enquiry Enquiry Enquiry Enquiry Enquiry Enquiry Enquiry1963-65 1974-75 1977-78 1983 1987-88 1993-94 1999-2000 2004-05
1 2 3 4 5 6 7 8 9
1 Estimated number of Rural Households(In Millions) 70.4 82.1 95.7 100.5 108.4 119.5 137.1 150.2
2 Percentage of Rural Labour House-holds to RuralHouseholds 25.4 30.3 36.8 37.3 39.7 38.3 40.2 36.7
3 Percentage of Agri-cultural Labour House-holds to RuralHouseholds 21.8 25.3 29.9 30.7 30.7 30.3 32.2 25.8
4 Average size of the household ALH 4.5 4.8 4.7 4.6 4.6 4.4 4.6 4.5
RLH 4.5 4.8 4.7 4.6 4.6 4.5 4.7 4.6
5 Average number ofwage-earners ALH 2.0 2.2 1.8 1.9 1.4 1.7 1.8 1.8
RLH 2.0 2.2 1.7 1.8 1.3 1.6 1.7 1.7
ALH = Agricultural Labour HouseholdsRLH = Rural Labour Households

ANNEXURE - I Contd..2 (a) All-India Indebtedness - Agricultural Labour Households
1st Rural 2nd Rural 3rd Rural 4th Rural 5th Rural 6th Rural 7th Rural 8th Rural
Items Labour Labour Labour Labour Labour Labour Labour LabourEnquiry Enquiry Enquiry Enquiry Enquiry Enquiry Enquiry Enquiry (P)1963-65 1974-75 1977-78 1983 1987-88 1993-94 1999-2000 2004-2005
1 2 3 4 5 6 7 8 9
A. Indebtedness :(i) Percentage of In-debted households 60.6 66.4 52.3 51.1 39.4 35.5 25.1 48.4(ii) Average Debt perHousehold(in Rs) 148 387 345 774 769 1031 1312 3946(iii) Average Debt perIndebted House-hold (in Rs) 244 584 660 1516 1952 2901 5230 8145
B. Percentage of debt by source :(i) Government - - - 2.9 3.6 8.2 4.1 3.7(ii) Co-operative 4.9 5.3 8.6 7.9 10.0 7.0 10.3 8.9 Societies(iii) Employers 19.7 10.1 7.0 13.9 13.0 12.2 7.9 7.3(iv) Money lenders 30.7 47.8 37.3 18.6 22.0 29.4 34.0 44.5(v) Shop-keepers 7.4 6.7 6.7 4.6 7.7 6.9 6.9 6.5(vi) Banks - 3.6 6.0 33.3 21.0 20.7 16.6 14.0(vii) Relatives &Friends - - - 10.8 13.7 12.9 16.1 12.9(viii) Others 37.3 26.5 34.4 8.0 9.0 2.8 4.0 2.2
C. Percentage of debt by purpose :(i) Household consumption 53.3 48.1 44.4 30.4 34.3 32.3 31.0 33.1
(ii) Marriage & otherceremonials 24.2 18.8 22.3 14.7 13.8 17.1 24.1 22.9
(iii)Productive purposes 11.9 12.7 20.9 41.4 29.1 28.3 21.5 20.8
(iv) Purchase of land & constr. of building - - - 6.3 8.5 10.0 14.6 15.0
(v) Repayment of debt - - - - 1.2 1.7 1.0 2.5
(vi) Others (More than 10.6 20.4 12.4 7.2 13.1 10.6 7.8 5.7one purpose)
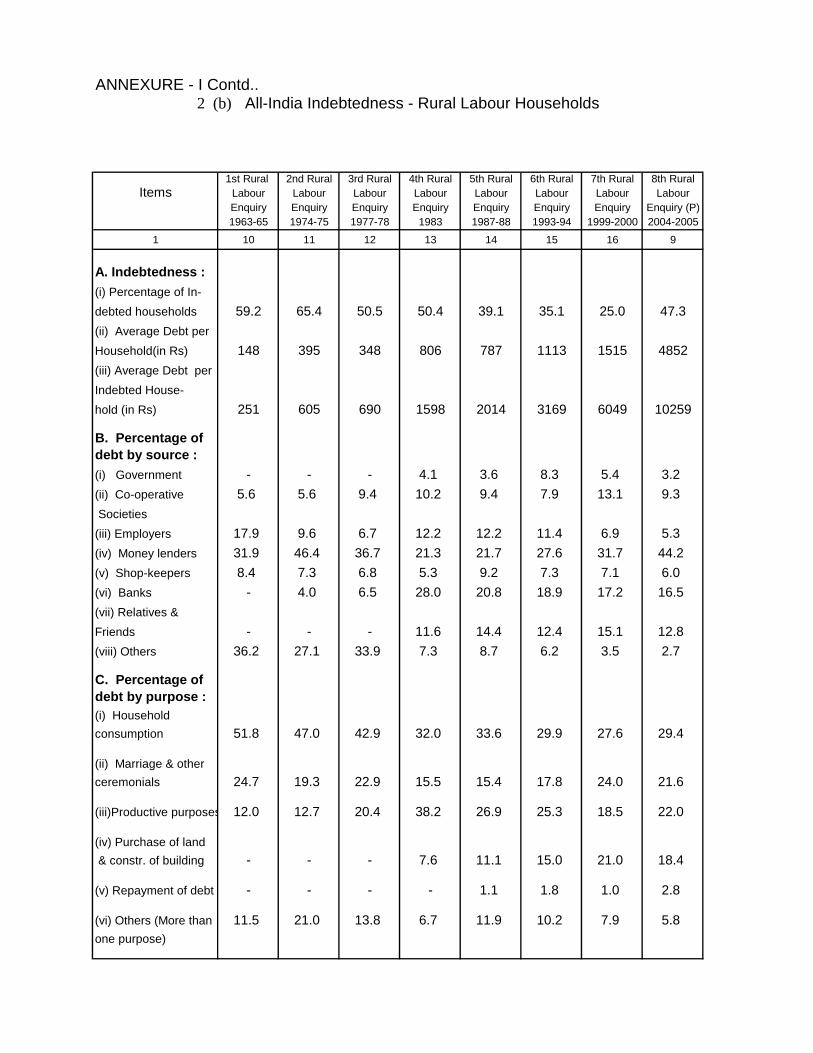
ANNEXURE - I Contd..2 (b) All-India Indebtedness - Rural Labour Households
1st Rural 2nd Rural 3rd Rural 4th Rural 5th Rural 6th Rural 7th Rural 8th Rural
Items Labour Labour Labour Labour Labour Labour Labour LabourEnquiry Enquiry Enquiry Enquiry Enquiry Enquiry Enquiry Enquiry (P)1963-65 1974-75 1977-78 1983 1987-88 1993-94 1999-2000 2004-2005
1 10 11 12 13 14 15 16 9
A. Indebtedness :(i) Percentage of In-debted households 59.2 65.4 50.5 50.4 39.1 35.1 25.0 47.3(ii) Average Debt perHousehold(in Rs) 148 395 348 806 787 1113 1515 4852(iii) Average Debt perIndebted House-hold (in Rs) 251 605 690 1598 2014 3169 6049 10259
B. Percentage of debt by source :(i) Government - - - 4.1 3.6 8.3 5.4 3.2(ii) Co-operative 5.6 5.6 9.4 10.2 9.4 7.9 13.1 9.3 Societies(iii) Employers 17.9 9.6 6.7 12.2 12.2 11.4 6.9 5.3(iv) Money lenders 31.9 46.4 36.7 21.3 21.7 27.6 31.7 44.2(v) Shop-keepers 8.4 7.3 6.8 5.3 9.2 7.3 7.1 6.0(vi) Banks - 4.0 6.5 28.0 20.8 18.9 17.2 16.5(vii) Relatives &Friends - - - 11.6 14.4 12.4 15.1 12.8(viii) Others 36.2 27.1 33.9 7.3 8.7 6.2 3.5 2.7
C. Percentage of debt by purpose :(i) Household consumption 51.8 47.0 42.9 32.0 33.6 29.9 27.6 29.4
(ii) Marriage & otherceremonials 24.7 19.3 22.9 15.5 15.4 17.8 24.0 21.6
(iii)Productive purposes 12.0 12.7 20.4 38.2 26.9 25.3 18.5 22.0
(iv) Purchase of land & constr. of building - - - 7.6 11.1 15.0 21.0 18.4
(v) Repayment of debt - - - - 1.1 1.8 1.0 2.8
(vi) Others (More than 11.5 21.0 13.8 6.7 11.9 10.2 7.9 5.8one purpose)

ANNEXURE - I Contd..
3 Wages and Earnings - All-India
Items 1st Rural 2nd Rural 3rd Rural 4th Rural 5th Rural 6th Rural 7th Rural 8th Rural
Labour Labour Labour Labour Labour Labour Labour Labour
Enquiry Enquiry Enquiry Enquiry Enquiry Enquiry Enquiry Enquiry (P)
1963-65 1974-75 1977-78 1983 1987-88 1993-94 1999-2000 2004-2005
1 2 3 4 5 6 7 8 9
Average earning strength(RLH) 2.1 2.3 2.1 2.0 2.0 2.0 2.0 2.0(ALH) 2.1 2.3 2.1 2.1 2.0 2.0 2.0 2.0
Average number of wage-earners(RLH) 2.0 2.2 1.7 1.8 1.3 1.6 1.7 1.7(ALH) 2.0 2.2 1.8 1.9 1.4 1.7 1.8 1.8
Average daily earnings of workers in agricultural operations (Rs.)Rural Labour Household
Men 1.41 3.26 3.79 4.63 9.46 21.53 40.58 48.07Women 0.89 2.28 2.67 3.46 7.05 15.33 28.57 33.77Children 0.76 1.82 2.17 2.20 6.01 12.32 24.32 29.93
Agricultural Labour HouseholdMen 1.43 3.24 3.74 4.72 9.42 21.35 40.14 47.53Women 0.95 2.22 2.62 3.56 7.00 15.18 28.38 33.41Children 0.72 1.82 2.16 2.32 6.01 12.45 24.23 29.55
Average daily earnings of workers in non-agricultural occupations (Rs.)Rural Labour Household
Men - - - 7.27 11.00 32.49 64.92 74.88Women - - - 3.78 7.99 17.45 56.13 42.59Children - - - 3.18 6.55 15.13 28.65 29.93
Agricultural Labour HouseholdMen - - - 5.12 10.23 26.95 54.09 55.62Women - - - 2.98 7.92 16.21 34.08 35.50Children - - - 2.83 6.30 15.00 24.14 25.24
ALH = Agricultural Labour Households
RLH = Rural Labour Households

ANNEXURE - I Concld.
4 Employment & Unemployment
Average Number of days worked/not worked by usually occupied workers belonging to Rural Labour Households (in estimated number of full days in a year)
1st Rural 2nd Rural 3rd Rural 4th Rural 5th Rural 6th Rural 7th Rural 8th RuralCategory of Employment Labour Labour Labour Labour Labour Labour Labour Labour
Enquiry Enquiry Enquiry Enquiry Enquiry Enquiry Enquiry Enquiry1963-65 1974-75 1977-78 1983 1987-88 1993-94 1999 - 2004-05
2000
1 2 3 4 5 6 7 7 8
A. Number of days worked on
1. Wage Employment
Men - 212 227 225 223 235 222 215
Women - 147 182 187 186 203 192 177
Children - 179 183 166 173 178 185 164
2. Self-employment
Men - 33 59 53 56 55 52 51
Women - 37 48 42 59 55 55 64
Children - 78 115 118 116 120 93 104
3. Salary Basis
Men - 5 7 8 17 15 24 25
Women - 1 2 4 9 7 9 9
Children - 5 6 3 13 8 12 18
B. Number of days not worked
1. Due to sickness etc
Men - 28 27 33 30 30 31 28
Women - 45 87 86 82 75 77 75
Children - 20 28 53 36 38 43 38
2. Due to want of work
Men - 71 45 46 39 30 36 46
Women - 115 46 46 29 25 32 40
Children - 72 33 24 27 21 32 41

ANNEXURE - II
List of Officers/Officials associated with the Report
S/Shri
R. K.Gupta Director
Syhama Kuthiala Investigator Grade – I
D.R. Verma Investigator Grade – I
Pravesh Kumar Investigator Grade – II
***

© GOVERNMENT OF INDIA CONTROLLER OF PUBLICATIONS
PDLB – 638
250-2010 (DSK-II)
Price : Rs. 105.00
2010
PRINTED BY THE PRINTING UNIT, LABOUR BUREAU, SHIMLA FOR THE CONTROLLER OF PUBLICATIONS, CIVIL LINES, DELHI – 110 054
Related Documents