Rural and Suburban Sprawl in the U.S. Midwest from 1940 to 2000 and Its Relation to Forest Fragmentation VOLKER C. RADELOFF, ∗ ROGER B. HAMMER,† AND SUSAN I. STEWART‡ ∗ Department of Forest Ecology and Management, University of Wisconsin–Madison, 1630 Linden Drive, Madison, WI 53706, U.S.A., email [email protected] †Department of Rural Sociology, University of Wisconsin–Madison, 1450 Linden Drive, Madison, WI 53706, U.S.A. ‡U.S. Department of Agriculture Forest Service, North Central Research Station, 1033 University Place, Suite 360, Evanston, IL 60201, U.S.A. Abstract: Housing growth and its environmental effects pose major conservation challenges. We sought to (1) quantify spatial and temporal patterns of housing growth across the U.S. Midwest from 1940–2000, (2) identify ecoregions strongly affected by housing growth, (3) assess the extent to which forests occur near housing, and (4) relate housing to forest fragmentation. We used data from the 2000 U.S. Census to derive fine-scale backcasts of decadal housing density. Housing data were integrated with a 30-m resolution U.S. Geological Survey land cover classification. The number of housing units in the Midwest grew by 146% between 1940 and 2000. Spatially, housing growth was particularly strong at the fringe of metropolitan areas (suburban sprawl) and in nonmetropolitan areas (rural sprawl) that are rich in natural amenities such as lakes and forests. The medium-density housing (4–32 housing units/km 2 ) category increased most in area. Temporally, suburban housing growth was especially high in the post-World War II decades. Rural sprawl was highest in the 1970s and 1990s. The majority of midwestern forests either contained or were near housing. Only 14.8% of the region’s forests were in partial block groups with no housing. Housing density was negatively correlated with the amount of interior forest. The widespread and pervasive nature of sprawl shown by our data is cause for conservation concern. Suburban sprawl has major environmental impacts on comparatively small areas because of the high number of housing units involved. In contrast, rural sprawl affects larger areas but with less intensity because associated housing densities are lower. The environmental effects per house, however, are likely higher in the case of rural sprawl because it occurs in less-altered areas. Conservation efforts will need to address both types of sprawl to be successful. Key Words: demography, development, forest fragmentation, housing growth, sprawl, U.S. census Expansi´ on Urbana y Suburbana en el Medio Oeste de E.U.A. de 1940 a 2000 y su Relaci´ on con la Fragmentaci´ on de Bosques Resumen: El crecimiento inmobiliario y sus efectos ambientales son retos mayores para la conservaci´ on. Tratamos de (1) cuantificar patrones espaciales y temporales del crecimiento inmobiliario en el medio oeste de E.U.A. de 1940–2000, (2) identificar ecoregiones fuertemente influenciadas por el crecimiento inmobiliario, (3) evaluar la extensi´ on en que los bosques ocurren cerca de viviendas, y (4) relacionar el crecimiento inmobiliario con la fragmentaci´ on de bosques. Utilizamos datos de los Censos de E.U.A. de 2000 para derivar retrospectivas a escala fina de la densidad inmobiliaria por d´ ecada. Los datos inmobiliarios fueron integrados en una clasificaci´ on de cobertura de suelos de la Prospecci´ on Geol´ ogica de E.U.A. con resoluci´ on de 30 m. El n´ umero de unidades de vivienda en el medio oeste creci´ o 146% entre 1940 y 2000. Espacialmente, el crecimiento inmobiliario fue particularmente fuerte en el borde ´ areas metropolitanas (expansi´ on suburbana) y en ´ areas Paper submitted September 2, 2003; revised manuscript accepted August 1, 2004. 793 Conservation Biology, Pages 793–805 Volume 19, No. 3, June 2005

Welcome message from author
This document is posted to help you gain knowledge. Please leave a comment to let me know what you think about it! Share it to your friends and learn new things together.
Transcript

Rural and Suburban Sprawl in the U.S. Midwestfrom 1940 to 2000 and Its Relation to ForestFragmentationVOLKER C. RADELOFF,∗ ROGER B. HAMMER,† AND SUSAN I. STEWART‡∗Department of Forest Ecology and Management, University of Wisconsin–Madison, 1630 Linden Drive,Madison, WI 53706, U.S.A., email [email protected]†Department of Rural Sociology, University of Wisconsin–Madison, 1450 Linden Drive, Madison, WI 53706, U.S.A.‡U.S. Department of Agriculture Forest Service, North Central Research Station, 1033 University Place, Suite 360,Evanston, IL 60201, U.S.A.
Abstract: Housing growth and its environmental effects pose major conservation challenges. We sought to(1) quantify spatial and temporal patterns of housing growth across the U.S. Midwest from 1940–2000, (2)identify ecoregions strongly affected by housing growth, (3) assess the extent to which forests occur near housing,and (4) relate housing to forest fragmentation. We used data from the 2000 U.S. Census to derive fine-scalebackcasts of decadal housing density. Housing data were integrated with a 30-m resolution U.S. GeologicalSurvey land cover classification. The number of housing units in the Midwest grew by 146% between 1940and 2000. Spatially, housing growth was particularly strong at the fringe of metropolitan areas (suburbansprawl) and in nonmetropolitan areas (rural sprawl) that are rich in natural amenities such as lakes andforests. The medium-density housing (4–32 housing units/km2) category increased most in area. Temporally,suburban housing growth was especially high in the post-World War II decades. Rural sprawl was highest inthe 1970s and 1990s. The majority of midwestern forests either contained or were near housing. Only 14.8%of the region’s forests were in partial block groups with no housing. Housing density was negatively correlatedwith the amount of interior forest. The widespread and pervasive nature of sprawl shown by our data is causefor conservation concern. Suburban sprawl has major environmental impacts on comparatively small areasbecause of the high number of housing units involved. In contrast, rural sprawl affects larger areas but withless intensity because associated housing densities are lower. The environmental effects per house, however, arelikely higher in the case of rural sprawl because it occurs in less-altered areas. Conservation efforts will needto address both types of sprawl to be successful.
Key Words: demography, development, forest fragmentation, housing growth, sprawl, U.S. census
Expansion Urbana y Suburbana en el Medio Oeste de E.U.A. de 1940 a 2000 y su Relacion con la Fragmentacionde Bosques
Resumen: El crecimiento inmobiliario y sus efectos ambientales son retos mayores para la conservacion.Tratamos de (1) cuantificar patrones espaciales y temporales del crecimiento inmobiliario en el medio oeste deE.U.A. de 1940–2000, (2) identificar ecoregiones fuertemente influenciadas por el crecimiento inmobiliario, (3)evaluar la extension en que los bosques ocurren cerca de viviendas, y (4) relacionar el crecimiento inmobiliariocon la fragmentacion de bosques. Utilizamos datos de los Censos de E.U.A. de 2000 para derivar retrospectivasa escala fina de la densidad inmobiliaria por decada. Los datos inmobiliarios fueron integrados en unaclasificacion de cobertura de suelos de la Prospeccion Geologica de E.U.A. con resolucion de 30 m. El numerode unidades de vivienda en el medio oeste crecio 146% entre 1940 y 2000. Espacialmente, el crecimientoinmobiliario fue particularmente fuerte en el borde areas metropolitanas (expansion suburbana) y en areas
Paper submitted September 2, 2003; revised manuscript accepted August 1, 2004.
793
Conservation Biology, Pages 793–805Volume 19, No. 3, June 2005

794 Sprawl and Forest Fragmentation Radeloff et al.
no metropolitanas (expansion rural) ricas en amenidades naturales, como lagos y bosques. Las viviendasde la categorıa de densidad media (4-32 unidades de vivienda/km2) incrementaron en casi toda el area.Temporalmente, el crecimiento inmobiliario fue especialmente elevado en las decadas posteriores a la SegundaGuerra Mundial. La expansion rural fue mayor en los 1970s y 1990s. La mayorıa de los bosques del mediooeste contenıan o estaban cerca de viviendas. Solo 14.8% de los bosques de la region estaban en gruposde bloques sin viviendas. La densidad de viviendas estuvo negativamente correlacionada con la cantidad debosque interior. La amplitud y la naturaleza penetrante de la expansion que muestran nuestros datos es motivode preocupacion para la conservacion. La expansion suburbana tiene impactos ambientales mayores sobreareas comparativamente pequenas por el gran numero de unidades de vivienda involucradas. En contraste,la expansion rural afecta a areas mas extensas con menor intensidad porque las densidades de viviendasson menores. Sin embargo, los efectos ambientales por vivienda probablemente son mayores en el caso dela expansion rural porque ocurre en areas menos alteradas. Los esfuerzos de conservacion deberan atenderambos tipos de expansion para ser exitosos.
Palabras Clave: censos E.U.A., crecimiento inmobiliario, demografıa, desarrollo, expansion, fragmentacion debosques
Introduction
Human domination of ecosystems across the globe israpidly increasing (Vitousek et al. 1997) and is the rootcause of current threats to biodiversity and species ex-tinctions. Housing development and urbanization are keyfactors in the increase of human domination and pose ma-jor threats to biodiversity (Hobbs & Mooney 1997; Liu etal. 2003). In the United States, urbanization is a primarycause of population declines in more than half of all fed-erally listed threatened and endangered species (Czech etal. 2000), and housing development plays a central rolein species endangerment.
Housing development removes habitat directly dur-ing construction and fragments the remaining habitat(Theobald et al. 1997; Swenson & Franklin 2000), whichin turn negatively affects biodiversity (Rochelle et al.1999). Housing development also fosters tertiary envi-ronmental problems (McKinney 2002) such as the in-troduction of exotic species (Suarez et al. 1998; McKin-ney 2001), including predatory domestic pets (Crooks &Soule 1999; Maestas et al. 2003). Finally, housing develop-ment increases other aspects of the human domination ofecosystems, such as road density (Forman & Alexander1998), land-use intensity (White et al. 1997), and recre-ation (Boyle & Samson 1985).
Empirical studies confirm that housing developmentlimits habitat use, population size, and species diversityof Neotropical migrant birds (Friesen et al. 1995), otherbird species (Marzluff et al. 2001), and mammals (Joly &Myers 2001). Results of most studies suggest that hous-ing negatively affects both animal and plant populations(Soule 1991; McKinney 2002; Liu et al. 2003). However,housing growth (especially at lower densities) may ben-efit some species such as human commensals and exoticinvasives ( Johnston 2001; Odell & Knight 2001; Maestaset al. 2003).
Hence, understanding housing growth patterns is es-sential for successful conservation efforts (Marzluff 2002;Miller & Hobbs 2002). During the 1990s, 13.6 million netnew housing units were built in the United States (13%growth). Housing growth has been pronounced both atthe fringe of urban areas (suburban sprawl) and in ru-ral areas with attractive natural amenities (rural sprawl;Knight et al. 1995; Theobald 2001). Although both typesof sprawl raise concerns about environmental impacts(Sierra Club 1998; Hansen et al. 2002), there are impor-tant differences between suburban and rural sprawl. Sub-urban sprawl tends to be denser, affecting a smaller areaper housing unit, but the number of housing units alsotends to be greater, thus causing more severe environ-mental impact. Rural sprawl, also referred to as exur-ban development (Daniels 1999; Theobald 2001) or ruralresidential development (Hansen et al. 2002), often oc-curs at lower densities. The problem with rural sprawlis that it affects much larger areas than suburban sprawl(Theobald 2001), amplifying its environmental impacts.Furthermore, rural sprawl typically occurs in areas withattractive recreational and aesthetic amenities ( Johnson& Beale 2002) that are less human dominated, such aslakeshores (Schnaiberg et al. 2002), coasts (Bartlett et al.2000), and forests (Radeloff et al. 2001). Housing growthis thus more pronounced in habitats particularly valuablefor conservation (Hansen et al. 2002). This makes a bet-ter understanding of the patterns of rural sprawl and itsdrivers important for conservation biology.
Nonmetropolitan areas throughout the United Statesexperienced particularly rapid growth in the 1970s,with population growth rates that exceeded those ofmetropolitan areas for the first time in U.S. history (Fu-guitt 1985). Growth trends reverted to their historicalpatterns during the 1980s (Beale & Fuguitt 1990), but inthe 1990s, nonmetropolitan housing growth was againstrong (Long & Nucci 1998; Johnson & Fuguitt 2000).
Conservation BiologyVolume 19, No. 3, June 2005

Radeloff et al. Sprawl and Forest Fragmentation 795
Rural sprawl is driven by Americans’ long-held prefer-ences for living in more rural settings (Fuguitt & Brown1990; Brown et al. 1997), which itself is rooted in the ru-ral/agrarian Jeffersonian ideal (Nelson & Dueker 1990).Changes in the economy, technology, and transporta-tion have made the realization of these preferences morewidely achievable in recent decades. The cost of living inrural areas tends to be lower, partially because of lowerland prices and property taxes relative to urban areas(Daniels 1999).
Amenity migration is a primary driver of growth in non-metropolitan counties ( Johnson & Beale 2002). Duringthe past several decades, mild climate, varied topogra-phy, and abundant water—all amenity resources—havesubstantially influenced population growth in the non-metropolitan United States (McGranahan 1999; Bartlettet al. 2000). Seasonal and retirement homes account fora significant portion of the growth in some rural areas(Stewart & Stynes 1994; Beale & Johnson 1998; Radeloffet al. 2001). In the future, amenity migration is likely toincrease as the baby-boomer generation approaches re-tirement age, a trend expected to accelerate rural sprawl(Stewart 2002).
In summary, recent human demographic trends and thewell-documented environmental effects of housing devel-opment suggest that both suburban and rural sprawl posemajor conservation challenges. Spatially detailed, long-term information on housing growth patterns is neededto assist scientists in understanding observed patterns ofbiodiversity declines and managers in mitigating threatsand planning future development. Our objectives wereto (1) quantify spatial and temporal patterns of both ruraland suburban sprawl across the U.S. Midwest from 1940–2000, (2) identify ecoregions that have been particularlyaffected by housing growth, (3) assess the extent to whichforests occur near housing, and (4) relate housing densityto forest fragmentation.
Methods
Study Area
Our study region encompassed the seven states of theU.S. Midwest (Fig. 1). Northern hardwood forests, domi-nated by sugar maple (Acer saccharum Marsh.), yellowbirch (Betula alleghaniensis Britton), hemlock (Tsugacanadensis [L.] Carriere), and early successional aspen(Populus tremuloides Michx.) and pine (Pinus spp.)forests are widespread in northern Minnesota, Wiscon-sin, and Michigan. Most of these forests were establishedafter logging occurred, either the initial harvest (1850–1910) or subsequent harvests. Forest cover is also ex-tensive in southern Missouri, Illinois, and Indiana, whereoak (Quercus spp.) forests are more common and theconifer component is lower. Agricultural land dominates
much of Iowa, southern Minnesota, Illinois, and northernIndiana.
The region also encompasses a number of major metro-politan areas (2000 population; national rank): Chicago-Gary-Kenosha (9,157,540; third); Detroit-Ann Arbor-Flint(5,456,428; eighth); Minneapolis/St. Paul (2,968,806; fif-teenth), St. Louis (2,603,607; eighteenth), Kansas City(1,776,062; twenty-sixth); Milwaukee-Racine (1,689,572;twenty-seventh); and Indianapolis (1,607,486; twenty-ninth) (U.S. Census Bureau 2001). The classification ofcounties as metropolitan or nonmetropolitan follows the2000 designation of the federal Office of Management andBudget. A metropolitan area consists of one or more coun-ties that contain one or more cities with at least 50,000 in-habitants and at least 100,000 inhabitants in each county,as well as adjacent counties that exhibit a high degreeof economic and social integration with that nucleus.A metropolitan county can contain rural areas with lowhousing density and nonmetropolitan counties can con-tain high-density urban areas (Fig. 2a). Traditionally relianton manufacturing, most of the metropolitan areas in theMidwest have become more diversified, service-orientedeconomies. In contrast, many nonmetropolitan areas inthe region are popular tourism and seasonal home des-tinations and are classified as recreation counties, retire-ment counties, or both (Beale & Johnson 1998). Thesecounties, which are concentrated in the northern GreatLakes, the Ozarks, and smaller water- and forest-rich pock-ets throughout the region, provide lower-density residen-tial settings.
Estimating Past Housing Growth with High Spatial Resolution
We used housing density instead of population as ourmeasure of human presence and disturbance. Housingdensity and housing growth (percent increase in hous-ing density) are better indicators of environmental im-pacts because they account for declining household size(Liu et al. 2003) and second-home ownership (Radeloffet al. 2001). We analyzed housing density as a continu-ous variable rather than classifying it into, for example,urban, suburban, and exurban density classes. We de-cided against housing-density classes because there are nogenerally accepted housing-density thresholds for theseclasses (Theobald 2004). Our analysis of past rural hous-ing growth was based on 2000 U.S. Census data (SummaryFile 3A) and the associated data from geographic informa-tion systems (GIS; TIGER/Line files).
Measurement of housing growth necessitated estima-tion of pre-2000 housing density. Changes in census blockand block group boundaries greatly complicate histor-ical analysis of housing growth (Hammer et al. 2004).We addressed this boundary-change problem by using in-formation from the “year housing unit built” question inthe 2000 census to backcast historic housing densitiesby decade from 1990 to 1940 and historic county-level
Conservation BiologyVolume 19, No. 3, June 2005

796 Sprawl and Forest Fragmentation Radeloff et al.
Figure 1. Housing density (a) in 1940 and (b) 2000, (c) housing growth 1940–2000 summarized for ecologicalsubsections, (d) 1992/1993 National Land Cover Data for the U.S. Midwest study area (Illinois, IL; Indiana, IN;Iowa, IA; Michigan, MI; Minnesota, MN; Missouri, MO; and Wisconsin, WI).
Conservation BiologyVolume 19, No. 3, June 2005

Radeloff et al. Sprawl and Forest Fragmentation 797
Figure 2. (a) Metropolitan and nonmetropolitan counties in the U.S. Midwest, (b) percent decadal housing growth,and (c) absolute decadal housing growth.
housing counts to adjust housing counts for historic unitsthat are missing in the 2000 Census (Radeloff et al. 2001;Theobald 2001; Hammer et al. 2004).
Mapping units were partial block groups (PBGs; Ham-mer et al. 2004), which have a finer spatial resolution thanthe more commonly used block groups but coarser res-olution than census blocks. We have demonstrated thatPBGs improve the spatial precision of housing-unit esti-mates considerably (Hammer et al. 2004). Census blockscould not be used because the age of housing units isnot reported at this level. The PBG boundaries are basedon block-group boundaries, congressional district, place,minor civil division (township), and urban/rural bound-aries. Census blocks with zero housing units and lakeswere retained in the PBG boundaries, further refiningspatial precision. In our study area, the mean PBG sizewas 3.4 km2 (SD = 38.8 km2). Our unit of measure washousing density, the number of housing units per squarekilometer. According to the U.S. Census, a housing unitmay be a house, an apartment, a mobile home, a room,or group of rooms, including those intended for seasonal,recreational, or occasional use, and units can be occupiedor vacant (U.S. Census Bureau 2002). We mapped hous-ing density at the PBG level and summarized it both asthe absolute number of homes added each decade and asthe percent growth for the decade. Summaries were cal-culated for both metropolitan and nonmetropolitan coun-
ties. We defined rural sprawl as housing growth occurringin nonmetropolitan counties.
Housing by Ecoregion
Housing density and housing growth are not spatially ho-mogeneous across the Midwest. We used subsections ofthe ecological units delineation for the eastern UnitedStates, as defined by the U.S. Department of Agricul-ture Forest Service (Fig. 1c; Keys et al. 1995), to identifyecoregions that have been particularly affected by hous-ing growth. Subsection boundaries are based on Bailey’secoregions (Bailey et al. 1994) but represent a lower hi-erarchical level in the ecoregion classification system at afiner spatial resolution (average size 3600 km2). Summaryvariables were decadal housing growth; total housinggrowth (1940–2000), percent area with low (≤4 housingunits/km2), medium (4–32), and high (>32) housing den-sity; and 1940–2000 areal growth (percentage) of thesethree density classes. These thresholds were chosen sothat low-density housing represents a distance betweenhousing units of 500 m, assuming a regular spatial pattern.At this density landscape patterns are connected as longas the disturbance zone has a radius of <250 m (Theobaldet al. 1997). High-density housing represents a distancebetween regularly spaced housing units of 175 m, which
Conservation BiologyVolume 19, No. 3, June 2005

798 Sprawl and Forest Fragmentation Radeloff et al.
Figure 3. The relative areaof low, medium, and highhousing density in eachecological subsection of theU.S. Midwest in 1940 and2000.
eliminates landscape connectivity at a disturbance-zoneradius of only 90 m.
Housing Growth and Forests
Sprawl in forested areas is of particular concern in ourstudy area because these areas often constitute impor-tant habitat. Among the major midwestern habitat types,forested areas resemble presettlement landscape condi-tions most closely, despite substantial changes in tree
species composition and forest structure. Prairies andsavannas, the other major natural habitat types presentin the presettlement landscape, exist today only as smallremnants, with most having been replaced by agricultureand urban areas. Forest-cover data was provided by theNational Land Cover Data (NLCD) land cover classifica-tion scheme of the U.S. Geological Survey (Vogelmann etal. 2001, Fig. 1d). The NLCD is based on 1992/1993 Land-sat Thematic Mapper imagery with 30-m pixel resolution.For our analysis, we defined forests as all areas classified in
Conservation BiologyVolume 19, No. 3, June 2005

Radeloff et al. Sprawl and Forest Fragmentation 799
the NLCD as deciduous, coniferous, or mixed forest. Nocomparable forest cover data exists for previous decades,precluding an analysis of forest cover change and housinggrowth.
We used the forest data to address two issues: the pro-portion of the forest that contains housing and the propor-tion of the forest that is remote (i.e., distant from settle-ments). We summarized the proportion of Midwest for-est in areas with housing by calculating the number offorested pixels across seven housing-density classes (0,0–2, 2–4, 4–8, 8–16, 16–32, >32 housing units/km2) andcomparing these with the total number of forested pixelsfor the study area and for each state.
Forests that do not contain houses may, nevertheless,be affected by proximate settlements. We quantified theproportion of forests that are remote with a buffer anal-ysis to assess the proportion of all forests located =1,2, 5, 25, or 100 km from PBGs with high (>128) ormedium-low (>8) housing density in 2000. We did notuse smaller buffer sizes, although edge effects may bestrongest within a few hundred meters of a house(Rochelle et al. 1999) because the census data are notsufficiently spatially detailed. It is not possible to deter-mine the particular location of housing units within agiven PBG.
Finally, we examined the relationship between hous-ing density and forest fragmentation. Riitters and his col-leagues (2002) conducted a detailed analysis of forest frag-mentation across the United States based on the NLCD.We related their forest fragmentation indices to hous-ing density. This raised the problem of differences inspatial scale and the disparate types of information con-tained in census and fragmentation data. Although PBGsrepresent census data with relatively high spatial resolu-tion, their grain is still about three orders of magnitudecoarser than the 30-m resolution fragmentation data. Fur-thermore, census data present aggregate housing countinformation for an entire PBG, making disaggregation ofPBGs unworkable. We thus aggregated forest and frag-mentation information at the PBG level and computedthe percent area in each PBG composed of forest coverand of interior forest (defined as a pixel that is entirelysurrounded by forested pixels based on an eight-neighborrule), with four different sizes of analysis windows (5 ×5, 9 × 9, 27 × 27, and 81 × 81 pixels). Larger windowsizes identify interior forests that are farther away fromforest edges. We excluded PBGs <1 ha from this analysisto ensure that percentage calculations were based on atleast 10 pixels of the land cover data.
Results
Housing Density Change
Housing in the U.S. Midwest grew by 14,314,969 units(146%) from 9,831,111 units in 1940 to 24,146,080 units
in 2000 (Figs. 1a & 1b). About one-third of this growth(31.6%, equivalent to 4,521,812 housing units) occurredin nonmetropolitan counties (Fig. 2a), contributing to ru-ral sprawl. Among states in the region, Michigan and In-diana experienced the highest overall growth, whereasIowa grew the least. Growth occurred both at the fringe ofurban areas (Fig. 1b) and in forested rural amenity areas in-cluding southern Missouri, the northern lower peninsulaof Michigan, northern Wisconsin, and parts of northernMinnesota. Growth in predominantly agricultural areaswas strong in the southern lower peninsula of Michiganand in central and northern Indiana.
Across the six decades, rural sprawl (i.e., housinggrowth in nonmetropolitan counties) in the U.S. Midwestwas particularly strong in the 1970s (Figs. 2b & 2c). Inabsolute terms rural housing growth was also strong inthe 1990s, but proportionally was less pronounced be-cause many areas had already reached substantial housingdensities. Metropolitan counties exhibited their highestgrowth—suburban sprawl—before 1970 (Figs. 2b & 2c).
Housing growth varied markedly by ecoregion (Fig.1c). The highest absolute growth between 1940 and 2000occurred in subsection 222Kg (1,124,981 housing units),which, before European settlement, was dominated byprairie of big bluestem Indian grass. This subsection isnow encompassed by the Chicago-Gary-Kenosha and theMilwaukee-Racine metropolitan areas. Other ecoregionswith more than 500,000 new housing units since 1940include 222If (originally swamp forests, now Detroit),222Hb and 222Ha (pine-oak flatwoods, Indianapolis andDetroit), and 222Ki (cordgrass wet prairie, Chicago). Sub-urban sprawl has substantially altered these subsections.
Rural sprawl also altered ecoregions in the Midwest.Relative growth from 1940 to 2000 showed different high-growth areas than absolute growth areas. The highestgrowth rate occurred in subsections 212Hq (673%, orig-inally jack pine barrens in Michigan) and 222Jj (596%,hemlock-sugar maple forests in Wisconsin). During the1990s, growth rates were also highest in the lowerpeninsula of Michigan (subsection 212Hn, 36.4% growth,hemlock-sugar maple forest). The subsections ranked sec-ond to fourth in relative growth, however, were all lo-cated in southern Missouri (222Ag, 222Ah, 222Ac, littlebluestem glades and oak woodlands). Rural sprawl shiftedto southern Missouri in the most recent decade, and hous-ing growth can be expected to continue there.
The spatial distribution of housing changed dramati-cally over the six decades of this study. In 1940, housingwas clustered; areas typically exhibited either low or highhousing density. Medium-density housing (4–32 housingunits/km2) was much less common in 1940 (Fig. 1a) thanin 2000 (Fig. 1b, Fig. 3). The area of medium-density hous-ing grew by >250% between 1940 and 2000 (Fig. 3). Incomparison, the area of high-density housing grew con-siderably less and the area of low-density housing declinedin many areas by more than 50%.
Conservation BiologyVolume 19, No. 3, June 2005

800 Sprawl and Forest Fragmentation Radeloff et al.
Figure 4. The percentage of forest that occurs inpartial block groups (PBGs) in each state and acrossthe U.S. Midwest.
Housing and Forests
The majority of the forests in the U.S. Midwest were lo-cated in areas with at least some housing (Fig. 4). Only14.8% of forests were in PBGs with no housing, and justover one-third (34.9%) were in PBGs with fewer than 4housing units/km2 (Fig. 4). Indiana forests contained thehighest housing density (67.1% of forests with >4 housingunits/km2) compared with other states in the region. Min-nesota had the largest proportion of forests in low- or no-housing density areas (79.7% with <4 housing units/km2,19.4% with 0 housing units/km2). Paradoxically, Michiganhad both the second highest percentage of forests in areaswith no housing (18.7% with 0 housing units/km2) andthe second highest percentage of forests with >8 hous-ing units/km2 (16.3%), a pattern attributable to the differ-ences between the sparsely populated Upper Peninsulaand the more developed Lower Peninsula. In general, theproportion of forests in low-density or no-housing areaswas affected by both the abundance of forest cover (stateswith low forest cover, such as Iowa, tended to exhibithigher housing density in the forests) and the proxim-ity of forests to metropolitan areas (forests in Michigan’sUpper Peninsula contain fewer houses than those in theLower Peninsula).
Forest cover was abundant in the U.S. Midwest, but al-most all forests were within close vicinity of settlements(Fig. 5). Only 13.4% of the forests were >25 km from aPBG with >128 housing units/km2. No forests were >100
km from areas with >128 housing units/km2. When set-tlements of >8 housing units/km2 were considered, only3.5% of all forests were >25 km from housing, and 54.2%were within 5 km of settlements. Only the northernmostforests in Minnesota and Wisconsin, the Upper Peninsulaof Michigan, and the central Ozarks of Missouri were >25km from settlements with >8 housing units/km2 (Fig. 5).There is substantial forest cover in the Lower Peninsulaof Michigan, southern Indiana, southern Wisconsin, andthroughout Missouri, but it is all within close vicinity ofhousing.
Among states with abundant forests, Minnesota con-tained the largest proportion of forests located >25 kmfrom settlements with >128 housing units/km2 (29.6%).In Michigan and Wisconsin, 17.6% of the forests werelocated >25 km from settlements with >128 housingunits/km2. Only 6.4% and 0.2% of forests in Michiganand Wisconsin, respectively, were more than 25 km fromPBGs with >8 housing units/km2.
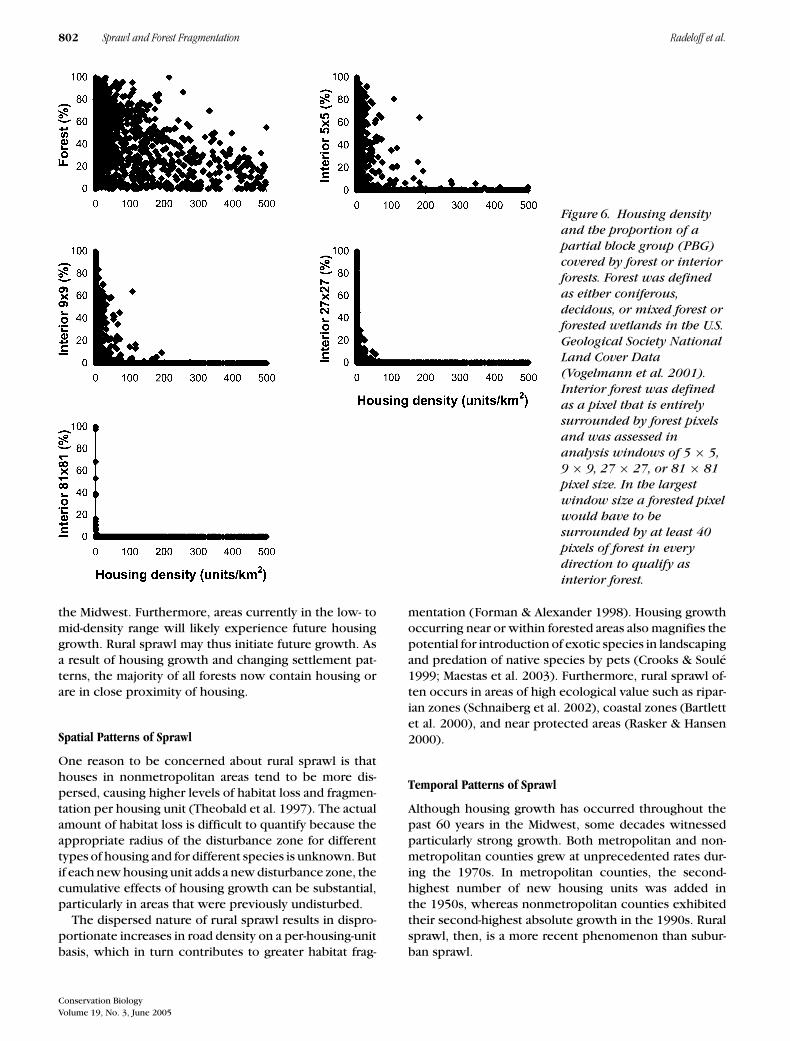
Scatterplots of housing density versus percent forestat the PBG level indicated a negative relationship, butone with high dispersion (Fig. 6). Some PBGs with hous-ing density up to 215 units/km2 still exhibited 100% for-est cover, and one PGB with housing density of 2384units/km2 exhibited 30% forest cover.
The relationship between housing density and for-est fragmentation was more pronounced. Scatterplots ofhousing density versus interior forest demonstrated thatalthough forests can be present even at high housingdensities, interior forests are lost at much lower hous-ing density thresholds. Based on the least rigorous 5 × 5pixel analysis window to identify interior forest, no PBGwith 193 housing units/km2 or more contained even 10%interior forest. As the window size increased, the hous-ing density at which interior forests were observed de-creased. With a 9 × 9 pixel window, interior forest wasalways below 10% at 117 housing units/km2. With a 27 ×27 pixel window, this threshold decreased to 46 housingunits/km2, and an 81 × 81 pixel window did not find 10%interior forest at housing density above zero.
Discussion
Our results highlight the magnitude and pervasiveness ofsprawl in the U.S. Midwest and its relation to forest re-sources. The region experienced strong housing growthbetween 1940 and 2000, both at the fringe of metropoli-tan areas (suburban sprawl) and in nonmetropolitancounties that are often forested (rural sprawl). Suburbansprawl has greater impacts on smaller areas because of thehigher number and density of housing units, whereas ru-ral sprawl affects larger areas with less intensity becauseassociated housing densities are usually lower. From aconservation perspective, however, the effects of ruralsprawl are arguably more significant because much larger
Conservation BiologyVolume 19, No. 3, June 2005

Radeloff et al. Sprawl and Forest Fragmentation 801
Figure 5. Remote forest areasin the U.S. Midwest (i.e.,forested pixels outside a 1-, 5-or 25-km buffer surroundingpartial block groups with ahousing density of >128 or>8 housing units/km2).
areas are affected and rural sprawl occurs in relatively less-altered landscapes. Even though the effect per unit areamay be less in the case of rural sprawl compared withurban sprawl, the total effect across the entire Midwest
is potentially greater because of the much higher totalarea affected by rural sprawl. Over the past six decades,the growth of medium-density housing areas greatlyexceeded the growth of higher-density settlements in
Conservation BiologyVolume 19, No. 3, June 2005
802 Sprawl and Forest Fragmentation Radeloff et al.
Figure 6. Housing densityand the proportion of apartial block group (PBG)covered by forest or interiorforests. Forest was definedas either coniferous,decidous, or mixed forest orforested wetlands in the U.S.Geological Society NationalLand Cover Data(Vogelmann et al. 2001).Interior forest was definedas a pixel that is entirelysurrounded by forest pixelsand was assessed inanalysis windows of 5 × 5,9 × 9, 27 × 27, or 81 × 81pixel size. In the largestwindow size a forested pixelwould have to besurrounded by at least 40pixels of forest in everydirection to qualify asinterior forest.
the Midwest. Furthermore, areas currently in the low- tomid-density range will likely experience future housinggrowth. Rural sprawl may thus initiate future growth. Asa result of housing growth and changing settlement pat-terns, the majority of all forests now contain housing orare in close proximity of housing.
Spatial Patterns of Sprawl
One reason to be concerned about rural sprawl is thathouses in nonmetropolitan areas tend to be more dis-persed, causing higher levels of habitat loss and fragmen-tation per housing unit (Theobald et al. 1997). The actualamount of habitat loss is difficult to quantify because theappropriate radius of the disturbance zone for differenttypes of housing and for different species is unknown. Butif each new housing unit adds a new disturbance zone, thecumulative effects of housing growth can be substantial,particularly in areas that were previously undisturbed.
The dispersed nature of rural sprawl results in dispro-portionate increases in road density on a per-housing-unitbasis, which in turn contributes to greater habitat frag-
mentation (Forman & Alexander 1998). Housing growthoccurring near or within forested areas also magnifies thepotential for introduction of exotic species in landscapingand predation of native species by pets (Crooks & Soule1999; Maestas et al. 2003). Furthermore, rural sprawl of-ten occurs in areas of high ecological value such as ripar-ian zones (Schnaiberg et al. 2002), coastal zones (Bartlettet al. 2000), and near protected areas (Rasker & Hansen2000).
Temporal Patterns of Sprawl
Although housing growth has occurred throughout thepast 60 years in the Midwest, some decades witnessedparticularly strong growth. Both metropolitan and non-metropolitan counties grew at unprecedented rates dur-ing the 1970s. In metropolitan counties, the second-highest number of new housing units was added inthe 1950s, whereas nonmetropolitan counties exhibitedtheir second-highest absolute growth in the 1990s. Ruralsprawl, then, is a more recent phenomenon than subur-ban sprawl.
Conservation BiologyVolume 19, No. 3, June 2005

Radeloff et al. Sprawl and Forest Fragmentation 803
The temporal patterns of growth raise the questionof time lags such as extinction debt (i.e., a delayed de-crease in species richness following habitat loss and frag-mentation; Tilman et al. 1994). Semistochastic processes,such as local extinctions following habitat fragmentation,may occur over decades. For example, amphibian bio-diversity loss resulting from road construction near wet-lands exhibits a temporal lag of several decades (Findlay &Bourdages 2000). Exotic plant species introductions andspread show a delayed response to the time of settlement(McKinney 2001). This suggests that the full ecologicalimpacts of recent sprawl have not yet materialized.
Conservation Implications
The U.S. Midwest is a region where housing developmentcan proceed without the limitations imposed by exten-sive public landownership, topography, or water avail-ability that constrain growth in other areas of the country.Road networks are dense and well established (Hawbaker& Radeloff 2004). In short, there is little to impede ruralsprawl. But the two major contiguous forested regions ofthe Midwest, the first in the northern lake states (Min-nesota, Wisconsin, and Michigan) and the second in theOzarks, are of crucial importance for conservation.
Rural sprawl in these areas is potentially disastrous. Forexample, nest success of breeding birds in the fragmentedforests of the central Midwest is too low to sustain viablepopulations (Robinson et al. 1995). The forests of theNorthwoods and the Ozarks thus likely function as pop-ulation sources that maintain sink populations elsewhere(Temple & Cary 1988), and declines in forest habitat qual-ity resulting from rural sprawl could affect avian popula-tions throughout the Midwest.
Similarly, the Northwoods of Wisconsin and Michiganhave been crucial to the range expansion and popula-tion growth of wolves in the Midwest. Habitat-use mod-els show, however, that wolves avoid areas with high roaddensity (Mladenoff et al. 1995). Rural sprawl in northernWisconsin, and the associated increase in road densityand human disturbance, is potentially detrimental to largecarnivore habitat availability and the dispersal of wolvesfrom Minnesota to Wisconsin and the Upper Peninsula ofMichigan.
Suburban sprawl was given much-deserved attentionin the 1990s as an emerging threat to conservation. Ru-ral sprawl is another manifestation of the same forces,but it has a different set of environmental consequencesthat have not been fully explored. The environmentaleffects per house are likely higher in the case of ruralsprawl when compared with suburban sprawl, becauserural sprawl occurs in more remote areas that have beenaltered less. When comparing rural and suburban sprawlon a per-unit area basis, environmental effects are mostlikely higher in the case of suburban sprawl because ofthe higher number of homes involved. Rural sprawl, how-
ever, occurs over much larger areas. We speculate thatthe total impact of rural sprawl is higher when taking theextent of the area over which it occurs into account. Rel-atively low land prices and weak land-use regulations innonmetropolitan counties (Nelson & Dueker 1990) canresult in disproportionate environmental impacts. Thiscombination leads to the “commodification of nature” inwhich developers and landowners use natural rural land-scapes as a marketable product in response to consumers’preferences for rural living (Esparza & Carruthers 2000).It is growth in rural, amenity-rich regions of the UnitedStates that most imperils forests—especially intact inte-rior forests—and the unique habitat they provide.
The trends in housing growth we report highlight theneed for ecological principles in land-use planning andgrowth management policies (Marzluff 2002; Broberg2003). Under the “smart-growth” rubric many states arestandardizing the comprehensive planning process acrossjurisdictions and requiring the coordination of plansamong adjacent municipalities and even counties (Burby& May 1997). These efforts ensure regulatory consis-tency, avoid conflict among municipalities, and discour-age spillover growth (Gale 1992). Rural areas are adopt-ing policies that directly affect the processes governingthe supply and demand for land, including property tax-ation, development fees, conservation areas, communityland trusts, and the transfer of development rights (Es-parza & Carruthers 2000). Agricultural communities haveachieved some success in preserving farmland by devel-oping methods for identifying the most valuable lands,such as the U.S. Department of Agriculture land evalu-ation and site assessment system (Lapping et al. 1989).Similar methods are needed for the identification of eco-logically important lands. But rural forested communitiesare newer than farm communities and individual house-holds are more isolated, which may make community col-laboration more difficult.
Ecoregions are increasingly used to set conservationpriorities (Myers et al. 2000), and demographic analysishas identified elevated population and household growthin ecoregions that are global biodiversity hotspots (Liu etal. 2003). Our results reveal marked differences in housinggrowth and housing density among Midwest ecoregionsat the subsection level (Fig. 1c). The data show that thehighest relative housing growth from 1940 to 2000 oc-curred predominantly in areas affected by rural sprawl,such as the forests of the lower peninsula of Michiganand northern Wisconsin. During the 1990s, the MissouriOzarks emerged as a rural sprawl hotspot, and high hous-ing growth is likely to continue. Such information canpotentially assist in setting conservation priorities withina region and at the local scale.
Effective wildlife management polices may be able tomitigate some of the negative effects associated withhousing growth (Linnell et al. 2001). Another suggestionemerging from studies in the western United States is to
Conservation BiologyVolume 19, No. 3, June 2005

804 Sprawl and Forest Fragmentation Radeloff et al.
cluster future development, affecting a smaller total areacompared with dispersed development (Theobald et al.1997; Odell et al. 2003). Clustered development, how-ever, affects smaller areas with greater intensity and couldresult in abrupt ecosystem change in an area, especially ifhousing growth and environmental response have a non-linear relationship. The prevalence of dispersed housingdevelopment in the Midwest suggests that ownership oflarge blocks without housing is crucial in areas wherelandscape-level management or restoration of presettle-ment landscape patterns and disturbance processes is de-sired (Radeloff et al. 2001). Large public land holdings andlarge-block ownership by timber companies are particu-larly valuable for conservation efforts, raising concernsabout the current trend of ownership fragmentation andthe sale of timber industry land for development pur-poses.
Conclusions
The net migration of people from metropolitan to non-metropolitan counties is the primary driver behind thewidespread rural sprawl that has taken place in the past 60years. The situation in many midwestern counties is ironicin that the forests attract the migration, which driveshome building, which degrades the forest resources. To-day’s rural sprawl may be tomorrow’s high-density hous-ing areas. Ecological research has traditionally focused on“natural” areas and more recently on urban ecosystems(Miller & Hobbs 2002). But large portions of the Midwestfall in neither category; instead, they exhibit low-densitydispersed housing. Long-term ecological implications ofsuch patterns are not well understood, but previous stud-ies suggest that they may be substantial. Interdisciplinaryresearch is needed to understand the effects of past andfuture housing growth on the environment across thefull range of housing densities. The analytical flexibilityprovided by GIS and spatially referenced data facilitateschanging the units of analysis to offer new insights intolinked processes, such as human demographic changeand ecological change. Ultimately, a larger debate on pop-ulation and housing growth will be essential for conser-vation efforts to succeed (Meffe et al. 1993).
Acknowledgments
We gratefully acknowledge financial support for this studyby the U.S. Department of Agriculture Forest ServiceNorth Central Research Station in Evanston, Illinois. Dis-cussions with J. Dwyer, D. Field, P. Gobster, P. Jakes, andP. Voss were valuable in designing this study. J. Dwyer, R.Haight, R. Knight, C. Lepczyk, J. Marzluff, D. Mladenoff,R. Stedman, and three anonymous reviewers providedvery helpful comments on the manuscript, improving itgreatly.
Literature Cited
Bailey, R. G., P. E. Avers, T. King, and W. H. McNab, editors. 1994. Ecore-gions and subregions of the United States (map 1:7,500,000). U.S.Department of Agriculture Forest Service, Washington, D.C.
Bartlett, J. G., D. M. Mageean, and R. J. O’Connor. 2000. Residentialexpansion as a continental threat to U.S. coastal ecosystems. Popu-lation and Environment 21:429–468.
Beale, C. L., and G. V. Fuguitt. 1990. Decade of pessimistic nonmetropopulation trends ends on optimistic note. Rural Development Per-spective 6:14–18.
Beale, C. L., and K. M. Johnson. 1998. The identification of recreationalcounties in nonmetropolitan areas of the USA. Population Researchand Policy Review 17:37–53.
Boyle, S. A., and F. B. Samson. 1985. Effects of nonconsumptive recre-ation on wildlife: a review. Wildlife Society Bulletin 13:110–116.
Broberg, L. 2003. Conserving ecosystems locally: a role for ecologistsin land-use planning. Bioscience 53:670–673.
Brown, D. L., G. V. Fuguitt, T. B. Heaton, and S. Waseem. 1997. Conti-nuities in size of place preferences in the United States, 1972–1992.Rural Sociology 62:408–428.
Burby, R., and P. May. 1997. Making government plan. The Johns Hop-kins University Press, Baltimore, Maryland.
Crooks, K. R. and M. E. Soule. 1999. Mesopredator release and avifaunalextinctions in a fragmented system. Nature 40:563–566.
Czech, B., P. R. Krausman, and P. K. Devers. 2000. Economic associa-tions among causes of species endangerment in the United States.BioScience 50:593–601.
Daniels, T. 1999. When city and country collide: managing growth inthe metropolitan fringe. Island Press, Washington, D.C.
Esparza, A. X., and J. I. Carruthers. 2000. Land use planning and exurban-ization in the rural mountain west: evidence from Arizona. Journalof Planning Education and Research 20:23–36.
Findlay, C. S., and J. Bourdages. 2000. Response time of wetland biodi-versity to road construction on adjacent lands. Conservation Biology14:86–94.
Forman, R. T. T., and L. E. Alexander. 1998. Roads and their majorecological effects. Annual Review of Ecology and Systematics 29:207–231.
Friesen, L. E., P. F. J. Eagles, and R. J. MacKay. 1995. Effects of residen-tial development on forest dwelling Neotropical migrant songbirds.Conservation Biology 9:1408–1414.
Fuguitt, G. V. 1985. The nonmetropolitan turnaround. Annual Reviewof Sociology 11:259–180.
Fuguitt, G. V., and D. L. Brown. 1990. Residential preferences and pop-ulation redistribution: 1972–1988. Demography 27:589–600.
Gale, D. 1992. Eight state-sponsored growth management programs: acomparative analysis. Journal of the American Planning Association58:425–439.
Hammer, R. B., S. I. Stewart, R. Winkler, V. C. Radeloff, and P. R. Voss.2004. Characterizing spatial and temporal residential density pat-terns across the U.S. Midwest, 1940–1990. Landscape and UrbanPlanning 69:183–199.
Hansen, A. J., et al. 2002. Ecological cause and consequence of demo-graphic change in the New West. BioScience 52:151–162.
Hawbaker, T. J., and V. C. Radeloff. 2004. Roads and landscape patternin northern Wisconsin: a comparison of four different road datasources. Conservation Biology 18:1233–1244.
Hobbs, R. J., and H. A. Mooney. 1997. Broadening the extinction de-bate: population deletions and additions in California and WesternAustralia. Conservation Biology 12:271–283.
Johnson, K. M., and C. L. Beale. 2002. Nonmetro recreation counties:their identification and rapid growth. Rural America 17:12–19.
Johnson, K. M., and G. V. Fuguitt. 2000. Continuity and change in ruralmigration patterns, 1950–1995. Rural Sociology 65:27–49.
Johnston, R. F. 2001. Synanthropic birds of North America. Pages 569–578 inJ. M. Marzluff, R. Bowman, and R. Donnelly, editors. Avian
Conservation BiologyVolume 19, No. 3, June 2005

Radeloff et al. Sprawl and Forest Fragmentation 805
ecology and conservation in an urbanizing world. Kluwer AcademicPublishers, Norwell, Massachusetts.
Joly, K., and W. L. Myers. 2001. Patterns of mammalian species richnessand habitat associations in Pennsylvania. Biological Conservation99:253–260.
Keys, J. E., Jr., C. A. Carpenter, S. L. Hooks, F. G. Koeneg, W. H. McNab,W. E. Russell, and M. L. Smith. 1995. Ecological units of the easternUnited States—first approximation. Technical publication R8-TP 21.U.S. Department of Agriculture Forest Service, Atlanta, Georgia.
Knight, R. L., G. N. Wallace, and W. E. Riebsame. 1995. Ranching theview: subdivisions versus agriculture. Conservation Biology 9:459–461.
Lapping, M., T. Daniels, and J. Keller. 1989. Rural planning and develop-ment in the United States. Guilford Press, New York.
Linnell, J. D. C., J. E. Swenson, and R. Andersen. 2001. Predators andpeople: conservation of large carnivores is possible at high humandensities if management policy is favourable. Animal Conservation4:345–349.
Liu, J., G. C. Daily, P. R. Ehrlich, and G. W. Luck. 2003. Effects of house-hold dynamics on resource consumption and biodiversity. Nature421:530–533.
Long, L., and A. Nucci. 1998. Accounting for two populationturnarounds in nonmetropolitan America. Research in Rural Soci-ology and Development 7:47–70.
Maestas, J. D., R. L. Knight, and W. C. Gilgert. 2003. Biodiversity acrossa rural land-use gradient. Conservation Biology 17:1425–1434.
Marzluff, J. M. 2002. Fringe conservation: a call to action. ConservationBiology 16:1175.
Marzluff, J. M, R. Bowman, and R. Donnelly, editors. 2001. Avian ecologyand conservation in an urbanizing world. Kluwer Academic Publish-ers, Norwell, Massachusetts.
McGranahan, D. A. 1999. Natural amenities drive population change.Agricultural economics report 781. U.S. Department of Agricul-ture Economic Research Service, Washington, D.C. Available fromwww.ers.usda.gov/Publications/AER781/(accessed August 2004).
McKinney, M. L. 2001. Effects of human population, area, and time onnon-native plant and fish diversity in the United States. BiologicalConservation 100:243–252.
McKinney, M. L. 2002. Urbanization, biodiversity and conservation. Bio-Science 52:883–890.
Meffe, G. K., A. H. Ehrlich, and D. Ehrenfeld. 1993. Human populationcontrol: the missing agenda. Conservation Biology 7:1–3.
Miller, J. R., and R. J. Hobbs. 2002. Conservation where people live andwork. Conservation Biology 16:330–337.
Mladenoff, D. J., T. A. Sickley, R. G. Haight, and A. P. Wydeven 1995. Aregional landscape analysis and prediction of favorable gray wolfhabitat in the northern great lakes region. Conservation Biology9:279–294.
Myers, N., R. A. Mittermeier, C. G. Mittermeier, G. A. B. da Fonseca,and J. Kent. 2000. Biodiversity hotspots for conservation planning.Nature 403:853–858.
Nelson, A., and K. Dueker. 1990. The exurbanization of America andits planning policy implications. Journal of Planning Education andResearch 9:91–100.
Odell, E. A., and R. L. Knight. 2001. Songbird and medium-sized mam-mal communities associated with exurban development in PitkinCounty, Colorado. Conservation Biology 15:1143–1150.
Odell, E. A., D. M. Theobald, and R. L. Knight. 2003. Incorporatingecology into land use planning—the songbirds’ case for clustereddevelopment. Journal of the American Planning Association 69:72–82.
Radeloff, V. C., R. G. Hammer, P. R. Voss, A. E. Hagen, D. R. Field, and D.J. Mladenoff. 2001. Human demographic trends and landscape levelforest management in the northwest Wisconsin Pine Barrens. ForestScience 47:229–241.
Rasker, R., and A. J. Hansen. 2000. Natural amenities and populationsgrowth in the Greater Yellowstone region. Human Ecology Review7:30–40.
Riitters, K. H., J. D. Wickham, R. V. O’Neill, K. B. Jones, E. R.Smith, J. W. Coulston, T. G. Wade, and J. H. Smith. 2002. Frag-mentation of continental United States forests. Ecosystems 5:815–822.
Robinson, S. K., F. R. Thompson, T. M. Donovan, D. R. Whitehead, andJ. Faaborg. 1995. Regional forest fragmentation and the nesting suc-cess of migratory birds. Science 267:1987–1990.
Rochelle, J. A., L. A. Lehman, and J. Wisniewski, editors. 1999. For-est fragmentation: wildlife and management implications. Brill Aca-demic Publishers, Leiden, The Netherlands.
Schnaiberg, J., J. Riera, M. G. Turner, and P. R. Voss. 2002. Explaining hu-man settlement patterns in a recreational lake district: Vilas County,Wisconsin, USA. Environmental Management 30:24–34.
Sierra Club. 1998. Sprawl: the dark side of the American dream. SierraClub, San Francisco. Available from www.sierraclub.org/sprawl/report98/(accessed June 2003).
Soule, M. E. 1991. Land-use planning and wildlife maintenance—guidelines for conserving wildlife in an urban landscape. Journalof the American Planning Association 57:313–323.
Stewart, S. I. 2002. Amenity Migration. Pages 369–378 in K. Luft andS. MacDonald, editors. Trends 2000: shaping the future. 5th Out-door Recreation & Tourism Trends Symposium. Department of Park,Recreation and Tourism Resources, Michigan State University, Lans-ing.
Stewart, S. I., and D. J. Stynes. 1994. Toward a dynamic model of complextourism choices: the seasonal home location decision. Journal ofTravel and Tourism Marketing 3:69–88.
Suarez, J. G., D. T. Bolger, and T. J. Case. 1998. Effects of fragmentationand invasion on native ant communities in coastal southern Califor-nia. Ecology 79:2041- -2056.
Swenson, J. J., and J. Franklin. 2000. The effects of future urban devel-opment on habitat fragmentation in the Santa Monica Mountains.Landscape Ecology 15:713–730.
Temple, S. A., and J. R. Cary. 1988. Modeling dynamics of habitat—interior bird populations in fragmented landscapes. ConservationBiology 2:340–347.
Theobald, D. M. 2001. Land use dynamics beyond the urban fringe. TheGeographical Review 91:544–564.
Theobald, D. M. 2004. Placing exurban land-use change in a humanmodification framework. Frontiers in Ecology and the Environment2:139–144.
Theobald, D. M., J. R. Miller, and N. T. Hobbs. 1997. Estimating thecumulative effects of development on wildlife habitat. Landscapeand Urban Planning 39:25–36.
Tilman, D., R. M. May, C. L. Lehman, and M. A. Nowak. 1994. Habitatdestruction and the extinction debt. Nature 371:65–66.
U.S. Census Bureau. 2001. Census 2000 summary file 1. U.S. CensusBureau, Washington, D.C.
U.S. Census Bureau. 2002. Census 2000 summary file 3A technical doc-umentation. U.S. Census Bureau, Washington, D.C.
Vitousek, P. M., H. A. Mooney, J. Luchenko, and J. M. Melillo.1997. Human domination of earth’s ecosystems. Science 277:494–499.
Vogelmann, J. E., S. M. Howard, L. Yang, C. R. Larson, B. K. Wylie, and N.van Driel. 2001. Completion of the 1990s National Land Cover DataSet for the conterminous United States from Landsat Thematic Map-per data and ancillary data sources. Photogrammetric Engineering& Remote Sensing 67:650–662.
White, D., P. G. Minotti, M. J. Barczak, J. C. Sifneos, K. E. Freemark,M. V. Santelmann, C. F. Steinitz, A. R. Kiester, and E. M. Preston.1997. Assessing risks to biodiversity from future landscape change.Conservation Biology 11:349–360.
Conservation BiologyVolume 19, No. 3, June 2005
Related Documents