DRAINAGE CRITERIA MANUAL (V. 1) RUNOFF RUNOFF CONTENTS Page Section RO- 1.0 OVERVIEW ......................................................................................................................................... 1 2.0 RATIONAL METHOD .......................................................................................................................... 3 2.1 Rational Formula ................................................................................................................ 3 2.2 Assumptions ....................................................................................................................... 4 2.3 Limitations ........................................................................................................................... 4 2.4 Time of Concentration ........................................................................................................ 5 2.4.1 Initial Flow Time ..................................................................................................... 5 2.4.2 Overland Travel Time ............................................................................................ 6 2.4.3 First Design Point Time of Concentration in Urban Catchments ........................... 6 2.4.4 Minimum Time of Concentration............................................................................ 7 2.4.5 Common Errors in Calculating Time of Concentration .......................................... 7 2.5 Intensity............................................................................................................................... 7 2.6 Watershed Imperviousness ................................................................................................ 7 2.7 Runoff Coefficient ............................................................................................................... 8 3.0 COLORADO URBAN HYDROGRAPH PROCEDURE ..................................................................... 19 3.1 Background....................................................................................................................... 19 3.2 Effective Rainfall for CUHP............................................................................................... 19 3.2.1 Pervious-Impervious Areas ................................................................................. 19 3.2.2 Depression Losses .............................................................................................. 20 3.2.3 Infiltration ............................................................................................................. 20 3.3 CUHP Parameter Selection .............................................................................................. 23 3.3.1 Rainfall ................................................................................................................. 23 3.3.2 Catchment Description ........................................................................................ 23 3.3.3 Catchment Delineation Criteria............................................................................ 25 3.3.3 Combining and Routing Sub-Catchment CUHP Hydrographs ............................ 26 4.0 EPA SWMM AND HYDROGRAPH ROUTING.................................................................................. 28 4.1 Software Description......................................................................................................... 28 4.1.1 Surface Flows and Flow Routing Features.......................................................... 28 4.1.2 Flow Routing Method of Choice .......................................................................... 29 4.2 Data Preparation for the SWMM Software ....................................................................... 29 4.2.1 Step 1—Method of Discretization ........................................................................ 29 4.2.2 Step 2—Estimate Coefficients and Functional/Tabular Characteristic of Storage and Outlets ......................................................................................... 29 4.2.3 Step 3—Preparation of Data for Computer Input ................................................ 30 5.0 OTHER HYDROLOGIC METHODS .................................................................................................. 31 5.1 Published Hydrologic Information ..................................................................................... 31 5.2 Statistical Methods............................................................................................................ 31 6.0 SPREADSHEETS AND OTHER SOFTWARE.................................................................................. 32 7.0 EXAMPLES ....................................................................................................................................... 33 7.1 Rational Method Example 1.............................................................................................. 33 7.2 Rational Method Example 2.............................................................................................. 34 7.3 Effective Rainfall Example ................................................................................................ 36 8.0 REFERENCES .................................................................................................................................. 38 APPENDIX A - DETAILS OF THE COLORADO URBAN HYDROGRAPH PROCEDURE (CUHP)......... 39 2007-01 RO-i Urban Drainage and Flood Control District

Welcome message from author
This document is posted to help you gain knowledge. Please leave a comment to let me know what you think about it! Share it to your friends and learn new things together.
Transcript

DRAINAGE CRITERIA MANUAL (V. 1) RUNOFF
RUNOFF CONTENTS
Page Section RO-
1.0 OVERVIEW ......................................................................................................................................... 1 2.0 RATIONAL METHOD .......................................................................................................................... 3
2.1 Rational Formula ................................................................................................................ 3 2.2 Assumptions ....................................................................................................................... 4 2.3 Limitations........................................................................................................................... 4 2.4 Time of Concentration ........................................................................................................ 5
2.4.1 Initial Flow Time..................................................................................................... 5 2.4.2 Overland Travel Time ............................................................................................ 6 2.4.3 First Design Point Time of Concentration in Urban Catchments........................... 6 2.4.4 Minimum Time of Concentration............................................................................ 7 2.4.5 Common Errors in Calculating Time of Concentration .......................................... 7
2.5 Intensity............................................................................................................................... 7 2.6 Watershed Imperviousness ................................................................................................ 7 2.7 Runoff Coefficient ............................................................................................................... 8
3.0 COLORADO URBAN HYDROGRAPH PROCEDURE ..................................................................... 19 3.1 Background....................................................................................................................... 19 3.2 Effective Rainfall for CUHP............................................................................................... 19
3.2.1 Pervious-Impervious Areas ................................................................................. 19 3.2.2 Depression Losses .............................................................................................. 20 3.2.3 Infiltration ............................................................................................................. 20
3.3 CUHP Parameter Selection.............................................................................................. 23 3.3.1 Rainfall ................................................................................................................. 23 3.3.2 Catchment Description ........................................................................................ 23 3.3.3 Catchment Delineation Criteria............................................................................ 25 3.3.3 Combining and Routing Sub-Catchment CUHP Hydrographs ............................ 26
4.0 EPA SWMM AND HYDROGRAPH ROUTING.................................................................................. 28 4.1 Software Description......................................................................................................... 28
4.1.1 Surface Flows and Flow Routing Features.......................................................... 28 4.1.2 Flow Routing Method of Choice .......................................................................... 29
4.2 Data Preparation for the SWMM Software ....................................................................... 29 4.2.1 Step 1—Method of Discretization ........................................................................ 29 4.2.2 Step 2—Estimate Coefficients and Functional/Tabular Characteristic
of Storage and Outlets......................................................................................... 29 4.2.3 Step 3—Preparation of Data for Computer Input ................................................ 30
5.0 OTHER HYDROLOGIC METHODS.................................................................................................. 31 5.1 Published Hydrologic Information..................................................................................... 31 5.2 Statistical Methods............................................................................................................ 31
6.0 SPREADSHEETS AND OTHER SOFTWARE.................................................................................. 32 7.0 EXAMPLES ....................................................................................................................................... 33
7.1 Rational Method Example 1.............................................................................................. 33 7.2 Rational Method Example 2.............................................................................................. 34 7.3 Effective Rainfall Example................................................................................................ 36
8.0 REFERENCES .................................................................................................................................. 38 APPENDIX A - DETAILS OF THE COLORADO URBAN HYDROGRAPH PROCEDURE (CUHP)......... 39
2007-01 RO-i Urban Drainage and Flood Control District
RUNOFF DRAINAGE CRITERIA MANUAL (V. 1)
Tables
Table RO-1—Applicability of Hydrologic Methods ........................................................................................2 Table RO-2—Conveyance Coefficient, Cv ....................................................................................................6 Table RO-3—Recommended Percentage Imperviousness Values..............................................................9 Table RO-4—Correction Factors KA and KCD for Use with Equations RO-6 and RO-7 ..............................10 Table RO-5— Runoff Coefficients, C ..........................................................................................................11 Table RO-6—Typical Depression Losses for Various Land Covers ...........................................................20 Table RO-7—Recommended Horton’s Equation Parameters ....................................................................22 Table RO-8—Incremental Infiltration Depths in Inches* .............................................................................22 Table RO-9—Effective Rainfall Calculations...............................................................................................37 Table RO-A1—Example for Determination a Storm Hydrograph................................................................53
Figures
Figure RO-1—Estimate of Average Overland Flow Velocity for Use With the Rational Formula ...............13 Figure RO-2—Diagram of First Design Point ..............................................................................................14 Figure RO-3— Watershed Imperviousness, Single-Family Residential Ranch Style Houses....................15 Figure RO-4—Watershed Imperviousness, Single-Family Residential Split-Level Houses .......................16 Figure RO-5—Watershed Imperviousness, Single-Family Residential Two-Story Houses........................17 Figure RO-6—Runoff Coefficient, C, vs. Watershed Percentage Imperviousness
NRCS Hydrologic Soil Group A.........................................................................................17 Figure RO-7—Runoff Coefficient, C, vs. Watershed Percentage Imperviousness
NRCS Hydrologic Soil Group B.........................................................................................18 Figure RO-8—Runoff Coefficient, C, vs. Watershed Percentage Imperviousness
NRCS Hydrologic Soil Groups C and D ............................................................................18 Figure RO-9—Representation of Horton’s Equation...................................................................................26 Figure RO-10—Slope Correction for Natural and Grass-Lined Channels ..................................................27 Figure RO-A1—Example of Unit Hydrograph Shaping ...............................................................................40 Figure RO-A2—Relationship Between Ct and Imperviousness ..................................................................44 Figure RO-A3—Relationship Between Peaking Parameter and Imperviousness ......................................45 Figure RO-A4—Unit Hydrograph Widths ....................................................................................................46 Figure RO-A5—Unit Hydrograph ................................................................................................................47 Figure RO-A6—Runoff Flow Diagram for the CUHPF/PC Model ...............................................................49 Figure RO-A7—Rainfall and Runoff Schematic for CUHPF/PC .................................................................50 Figure RO-A8—Default Values for Directly Connected Impervious Fraction (D) .......................................51 Figure RO-A9—Default Values for Receiving Pervious Area Fraction (R) .................................................51 Figure RO-A11—Comparison of Measured Peak Flow Rated Against Peak Flow Rates
Calculated Using the Post 1982 Colorado Urban Hydrograph Procedure........................55
RO-ii 2007-01 Urban Drainage and Flood Control District

DRAINAGE CRITERIA MANUAL (V. 1) RUNOFF
1.0 OVERVIEW
The importance of accurate runoff quantification cannot be overstated. Estimates of peak rate of runoff,
runoff volume, and the time distribution of flow provide the basis for all planning, design, and construction
of drainage facilities. Erroneous hydrology results in works being planned and built that are either
undersized, oversized, or out of hydraulic balance. On the other hand, it must be kept in mind that the
result of the runoff analysis is an approximation. Thus, the intent of this chapter of the Manual is to
provide a reasonably dependable and consistent method of approximating the characteristics of urban
runoff for areas of Colorado and the United States having similar meteorology and hydrology to what is
found within the Denver region.
Photograph RO-1—Devastating flooding from the South Platte River in 1965 emphasizes the importance of accurate flood flow projections.
Five methods of hydrologic analysis are described in this Manual: (1) the Rational Method; (2) the
Colorado Urban Hydrograph Procedure (CUHP) for generating hydrographs from watersheds, (3) the
EPA’s Storm Water Management Model (SWMM), mostly for combining and routing the hydrographs
generated using CUHP; (4) use of published runoff information; and (5) statistical analyses. CUHP has
been calibrated for the Denver area using data that were collected for a variety of watershed conditions
and has been used extensively since 1969. The vast majority of major drainage facilities within the
District have been designed based upon the hydrology calculated using the CUHP and a previously used
routing model used by the District, namely the Urban Drainage Stormwater Model (UDSWM). In 2005 the
District has began using the EPA’s SWMM and has also upgraded the CUHP software to be compatible
with the EPA model.
There have been hydrologic studies carried out for a majority of the major drainageways within the
2007-01 RO-1 Urban Drainage and Flood Control District

RUNOFF DRAINAGE CRITERIA MANUAL (V. 1)
District. Often the use of published flow data (available from the District) may make the need for
additional hydrologic analysis along major drainageways for a particular study unnecessary.
Statistical analyses may be used in certain situations. The use of this approach requires the availability of
acceptable, appropriate, and adequate data.
Calculations for the Rational Method can be carried out by hand or using the UD-Rational Spreadsheet
that may be downloaded from the District’s Web site (www.udfcd.org). CUHP-SWMM calculations are
extensive and are best carried out using the computer models provided by the District as an attachment
to the CD version of this Manual or downloaded from the District’s Web site.
Most of this chapter focuses on the Rational Method and on the CUHP method in combination with
SWMM routing. The Rational Method is generally used for smaller catchments when only the peak flow
rate or the total volume of runoff is needed (e.g., storm sewer sizing or simple detention basin sizing).
CUHP-SWMM is used for larger catchments and when a hydrograph of the storm event is needed (e.g.,
sizing large detention facilities). A summary of applicability of both the methods is provided in Table RO-
1.
Table RO-1—Applicability of Hydrologic Methods
Watershed Size (acres) Is the Rational Method Applicable? Is CUHP Applicable? 0 to 5 Yes Yes (1) 5 to 90 Yes Yes (1)
90 to 160 Yes Yes 160 to 3,000 No Yes (2)
Greater than 3,000 No Yes (if subdivided into smaller catchments) (2)
(1) If one-minute unit hydrograph is used. (2) Subdividing into smaller sub-catchments and routing the resultant hydrographs using SWMM may be needed to accurately model a catchment with areas of different soil types or percentages of imperviousness.
RO-2 2007-01 Urban Drainage and Flood Control District

DRAINAGE CRITERIA MANUAL (V. 1) RUNOFF
2.0 RATIONAL METHOD
For urban catchments that are not complex and are generally 160 acres or less in size, it is acceptable
that the design storm runoff be analyzed by the Rational Method. This method was introduced in 1889
and is still being used in most engineering offices in the United States. Even though this method has
frequently come under academic criticism for its simplicity, no other practical drainage design method has
evolved to such a level of general acceptance by the practicing engineer. The Rational Method properly
understood and applied can produce satisfactory results for urban storm sewer and small on-site
detention design.
2.1 Rational Formula
The Rational Method is based on the Rational Formula:
CIAQ = (RO-1)
in which:
Q = the maximum rate of runoff (cfs)
C = a runoff coefficient that is the ratio between the runoff volume from an area and the average
rate of rainfall depth over a given duration for that area
I = average intensity of rainfall in inches per hour for a duration equal to the time of concentration,
tc
A = area (acres)
Actually, Q has units of inches per hour per acre (in/hr/ac); however, since this rate of in/hr/ac differs from
cubic feet per second (cfs) by less than one percent, the more common units of cfs are used. The time of
concentration is typically defined as the time required for water to flow from the most remote point of the
area to the point being investigated. The time of concentration should be based upon a flow length and
path that results in a time of concentration for only a portion of the area if that portion of the catchment
produces a higher rate of runoff.
The general procedure for Rational Method calculations for a single catchment is as follows:
1. Delineate the catchment boundary. Measure its area.
2. Define the flow path from the upper-most portion of the catchment to the design point. This flow
path should be divided into reaches of similar flow type (e.g., overland flow, shallow swale flow,
gutter flow, etc.). The length and slope of each reach should be measured.
3. Determine the time of concentration, tc, for the catchment.
2007-01 RO-3 Urban Drainage and Flood Control District

RUNOFF DRAINAGE CRITERIA MANUAL (V. 1)
4. Find the rainfall intensity, I, for the design storm using the calculated tc and the rainfall intensity-
duration-frequency curve. (See Section 4.0 of the RAINFALL chapter.)
5. Determine the runoff coefficient, C.
6. Calculate the peak flow rate from the watershed using Equation RO-1.
2.2 Assumptions
The basic assumptions that are often made when the Rational Method is applied are:
1. The computed maximum rate of runoff to the design point is a function of the average rainfall rate
during the time of concentration to that point.
2. The depth of rainfall used is one that occurs from the start of the storm to the time of
concentration, and the design rainfall depth during that time period is converted to the average
rainfall intensity for that period.
3. The maximum runoff rate occurs when the entire area is contributing flow. However, this
assumption has to be modified when a more intensely developed portion of the catchment with a
shorter time of concentration produces a higher rate of maximum runoff than the entire catchment
with a longer time of concentration.
2.3 Limitations
The Rational Method is an adequate method for approximating the peak rate and total volume of runoff
from a design rainstorm in a given catchment. The greatest drawback to the Rational Method is that it
normally provides only one point on the runoff hydrograph. When the areas become complex and where
sub-catchments come together, the Rational Method will tend to overestimate the actual flow, which
results in oversizing of drainage facilities. The Rational Method provides no direct information needed to
route hydrographs through the drainage facilities. One reason the Rational Method is limited to small
areas is that good design practice requires the routing of hydrographs for larger catchments to achieve an
economic design.
Another disadvantage of the Rational Method is that with typical design procedures one normally
assumes that all of the design flow is collected at the design point and that there is no water running
overland to the next design point. However, this is not the fault of the Rational Method but of the design
procedure. The Rational Method must be modified, or another type of analysis must be used, when
analyzing an existing system that is under-designed or when analyzing the effects of a major storm on a
system designed for the minor storm.
RO-4 2007-01 Urban Drainage and Flood Control District
DRAINAGE CRITERIA MANUAL (V. 1) RUNOFF
2.4 Time of Concentration
One of the basic assumptions underlying the Rational Method is that runoff is a function of the average
rainfall rate during the time required for water to flow from the most remote part of the drainage area
under consideration to the design point. However, in practice, the time of concentration can be an
empirical value that results in reasonable and acceptable peak flow calculations. The time of
concentration relationships recommended in this Manual are based in part on the rainfall-runoff data
collected in the Denver metropolitan area and are designed to work with the runoff coefficients also
recommended in this Manual. As a result, these recommendations need to be used with a great deal of
caution whenever working in areas that may differ significantly from the climate or topography found in
the Denver region.
For urban areas, the time of concentration, tc, consists of an initial time or overland flow time, ti, plus the
travel time, tt, in the storm sewer, paved gutter, roadside drainage ditch, or drainage channel. For non-
urban areas, the time of concentration consists of an overland flow time, ti, plus the time of travel in a
defined form, such as a swale, channel, or drainageway. The travel portion, tt, of the time of
concentration can be estimated from the hydraulic properties of the storm sewer, gutter, swale, ditch, or
drainageway. Initial time, on the other hand, will vary with surface slope, depression storage, surface
cover, antecedent rainfall, and infiltration capacity of the soil, as well as distance of surface flow. The
time of concentration is represented by Equation RO-2 for both urban and non-urban areas:
tic ttt += (RO-2)
in which:
tc = time of concentration (minutes)
ti = initial or overland flow time (minutes)
tt = travel time in the ditch, channel, gutter, storm sewer, etc. (minutes)
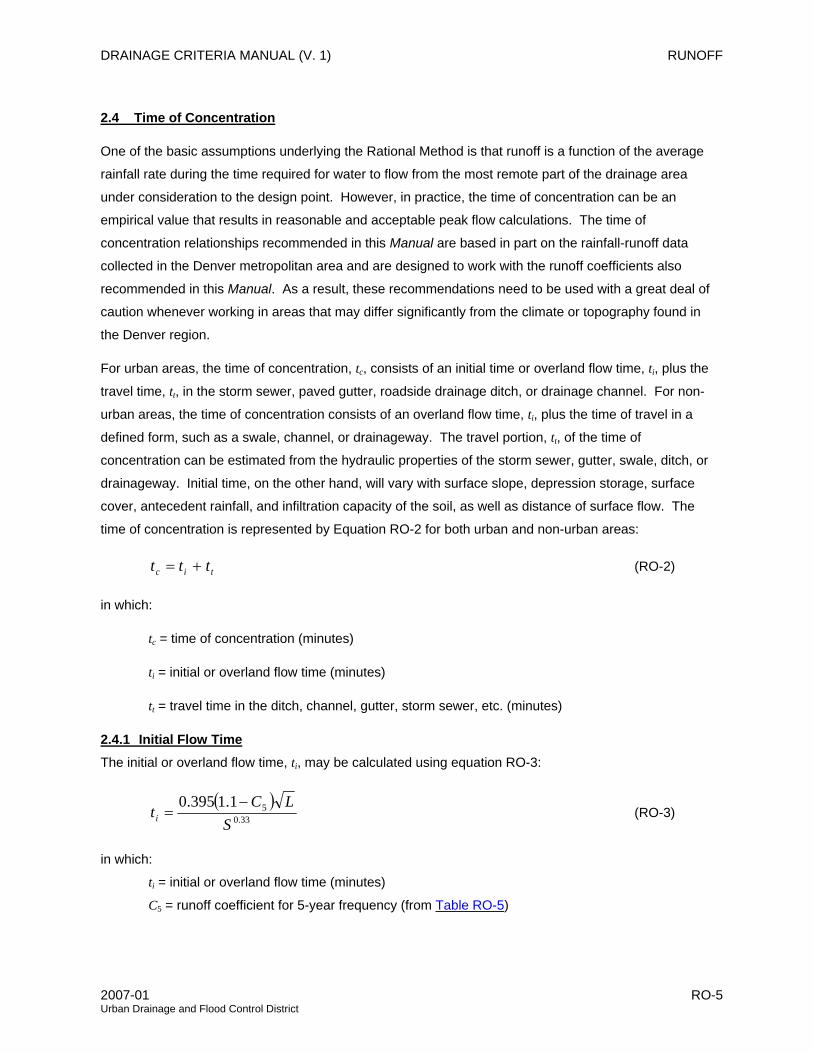
2.4.1 Initial Flow Time The initial or overland flow time, ti, may be calculated using equation RO-3:
( )33.0
51.1395.0S
LCti
−= (RO-3)
in which:
ti = initial or overland flow time (minutes)
C5 = runoff coefficient for 5-year frequency (from Table RO-5)
2007-01 RO-5 Urban Drainage and Flood Control District
RUNOFF DRAINAGE CRITERIA MANUAL (V. 1)
L = length of overland flow (500 ft maximum for non-urban land uses, 300 ft maximum for urban
land uses)
S = average basin slope (ft/ft)
Equation RO-3 is adequate for distances up to 500 feet. Note that, in some urban watersheds, the
overland flow time may be very small because flows quickly channelize.
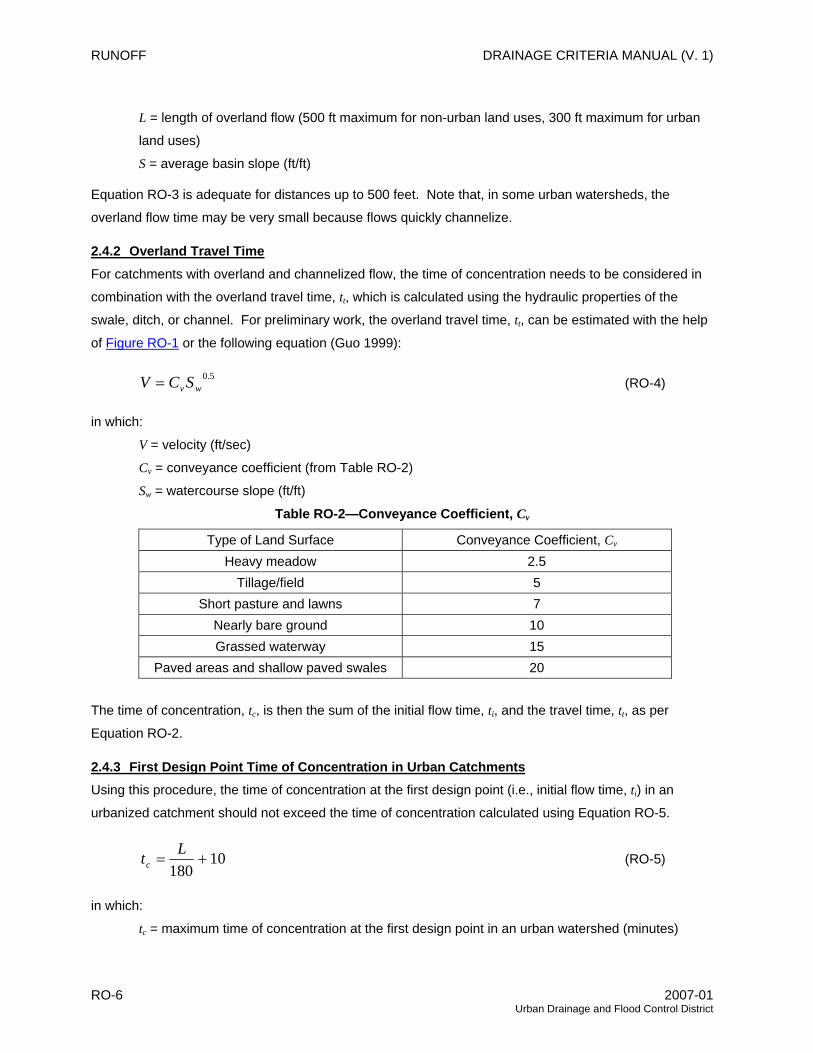
2.4.2 Overland Travel Time For catchments with overland and channelized flow, the time of concentration needs to be considered in
combination with the overland travel time, tt, which is calculated using the hydraulic properties of the
swale, ditch, or channel. For preliminary work, the overland travel time, tt, can be estimated with the help
of Figure RO-1 or the following equation (Guo 1999):
5.0wv SCV = (RO-4)
in which:
V = velocity (ft/sec)
Cv = conveyance coefficient (from Table RO-2)
Sw = watercourse slope (ft/ft)
Table RO-2—Conveyance Coefficient, Cv
Type of Land Surface Conveyance Coefficient, Cv Heavy meadow 2.5
Tillage/field 5 Short pasture and lawns 7
Nearly bare ground 10 Grassed waterway 15
Paved areas and shallow paved swales 20
The time of concentration, tc, is then the sum of the initial flow time, ti, and the travel time, tt, as per
Equation RO-2.
2.4.3 First Design Point Time of Concentration in Urban Catchments Using this procedure, the time of concentration at the first design point (i.e., initial flow time, ti) in an
urbanized catchment should not exceed the time of concentration calculated using Equation RO-5.
10180
+=Ltc (RO-5)
in which:
tc = maximum time of concentration at the first design point in an urban watershed (minutes)
RO-6 2007-01 Urban Drainage and Flood Control District
DRAINAGE CRITERIA MANUAL (V. 1) RUNOFF
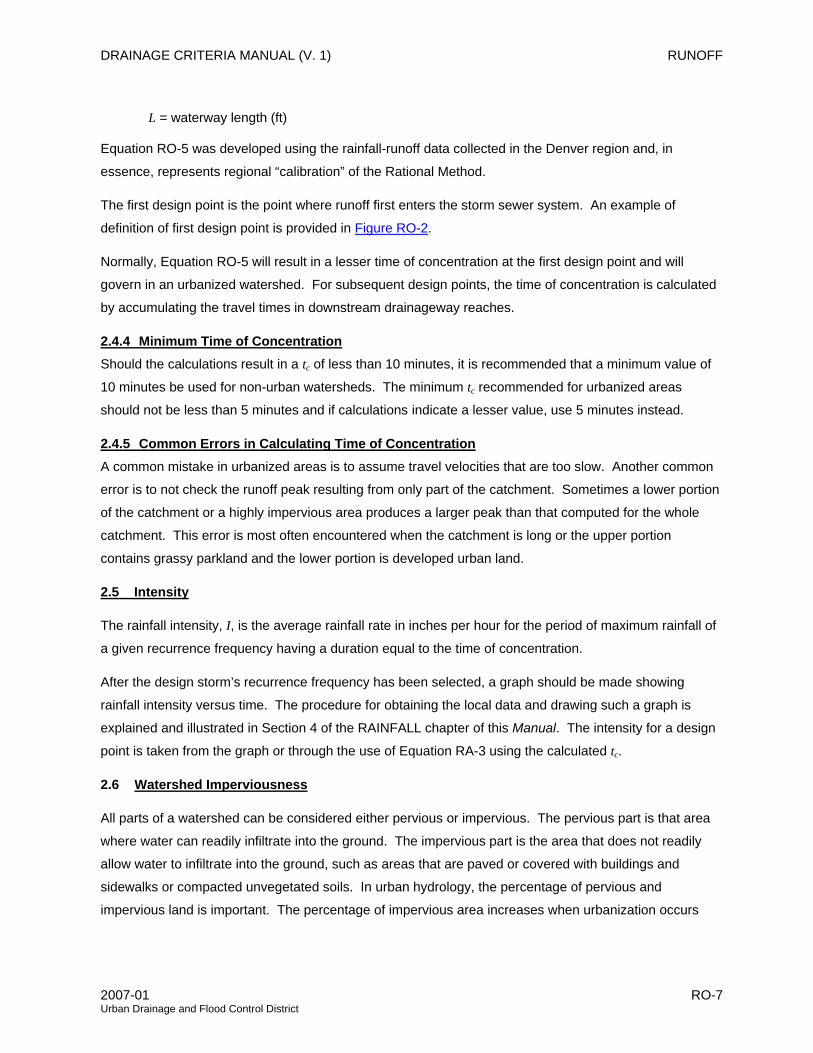
L = waterway length (ft)
Equation RO-5 was developed using the rainfall-runoff data collected in the Denver region and, in
essence, represents regional “calibration” of the Rational Method.
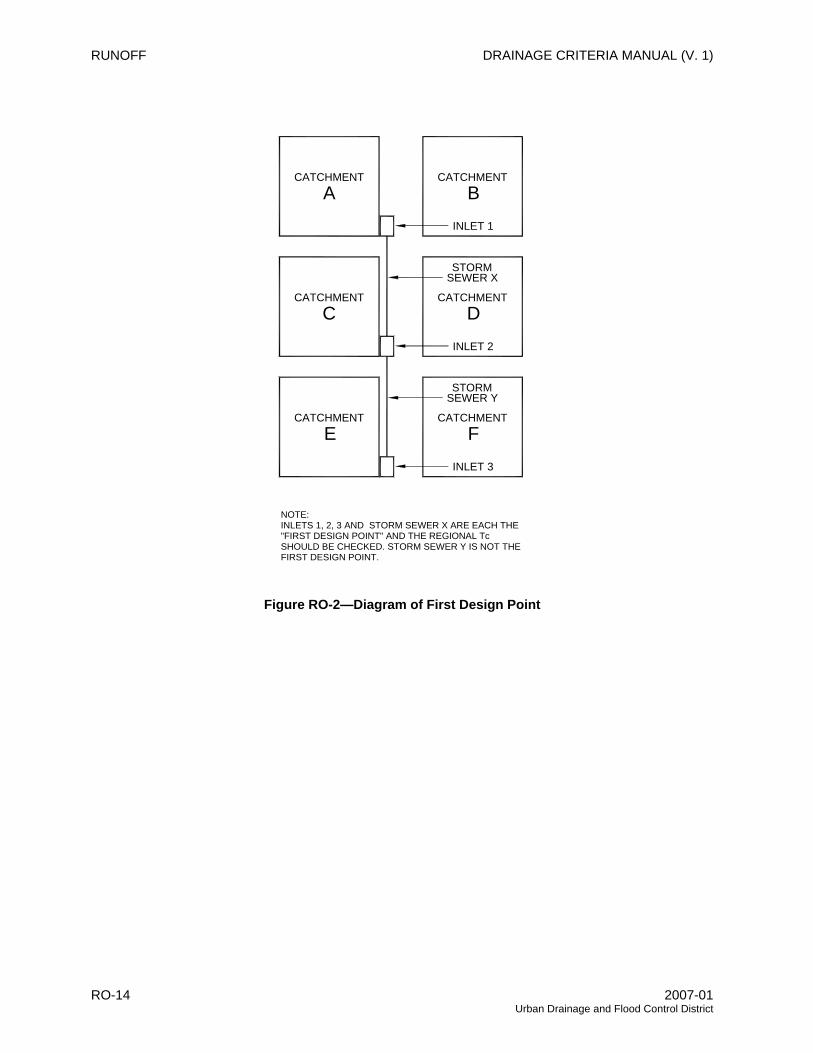
The first design point is the point where runoff first enters the storm sewer system. An example of
definition of first design point is provided in Figure RO-2.
Normally, Equation RO-5 will result in a lesser time of concentration at the first design point and will
govern in an urbanized watershed. For subsequent design points, the time of concentration is calculated
by accumulating the travel times in downstream drainageway reaches.
2.4.4 Minimum Time of Concentration Should the calculations result in a tc of less than 10 minutes, it is recommended that a minimum value of
10 minutes be used for non-urban watersheds. The minimum tc recommended for urbanized areas
should not be less than 5 minutes and if calculations indicate a lesser value, use 5 minutes instead.
2.4.5 Common Errors in Calculating Time of Concentration A common mistake in urbanized areas is to assume travel velocities that are too slow. Another common
error is to not check the runoff peak resulting from only part of the catchment. Sometimes a lower portion
of the catchment or a highly impervious area produces a larger peak than that computed for the whole
catchment. This error is most often encountered when the catchment is long or the upper portion
contains grassy parkland and the lower portion is developed urban land.
2.5 Intensity
The rainfall intensity, I, is the average rainfall rate in inches per hour for the period of maximum rainfall of
a given recurrence frequency having a duration equal to the time of concentration.
After the design storm’s recurrence frequency has been selected, a graph should be made showing
rainfall intensity versus time. The procedure for obtaining the local data and drawing such a graph is
explained and illustrated in Section 4 of the RAINFALL chapter of this Manual. The intensity for a design
point is taken from the graph or through the use of Equation RA-3 using the calculated tc.
2.6 Watershed Imperviousness
All parts of a watershed can be considered either pervious or impervious. The pervious part is that area
where water can readily infiltrate into the ground. The impervious part is the area that does not readily
allow water to infiltrate into the ground, such as areas that are paved or covered with buildings and
sidewalks or compacted unvegetated soils. In urban hydrology, the percentage of pervious and
impervious land is important. The percentage of impervious area increases when urbanization occurs
2007-01 RO-7 Urban Drainage and Flood Control District
RUNOFF DRAINAGE CRITERIA MANUAL (V. 1)
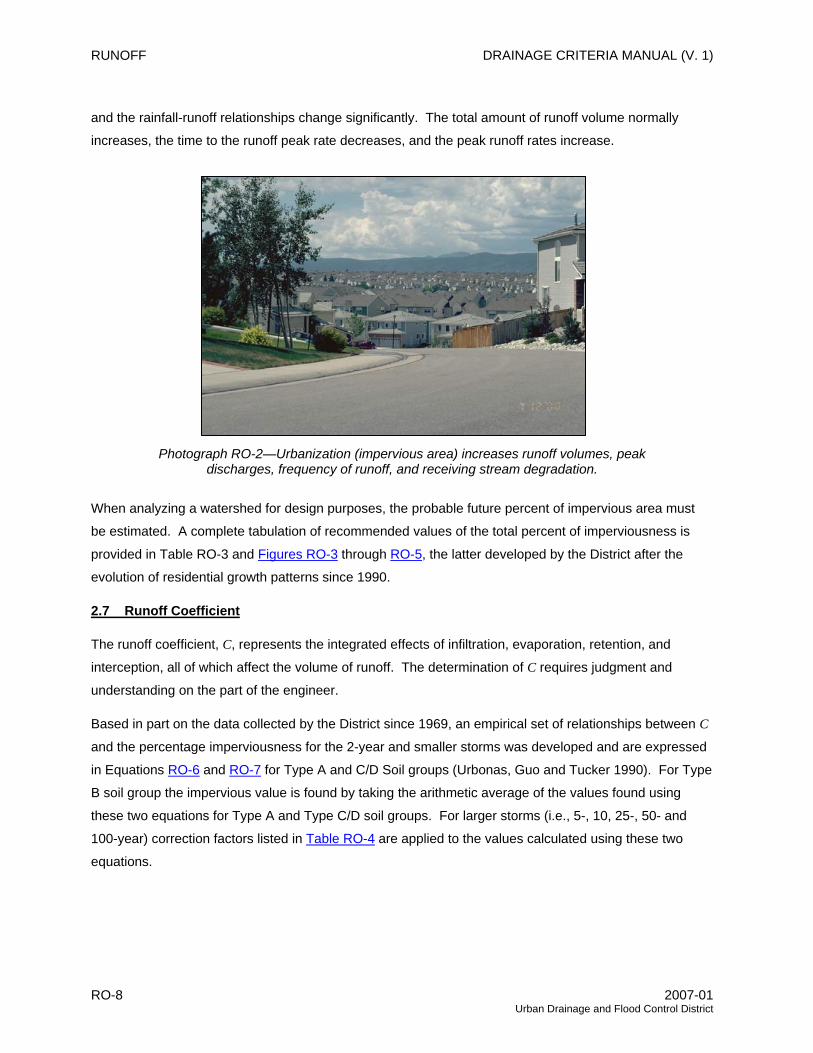
and the rainfall-runoff relationships change significantly. The total amount of runoff volume normally
increases, the time to the runoff peak rate decreases, and the peak runoff rates increase.
Photograph RO-2—Urbanization (impervious area) increases runoff volumes, peak discharges, frequency of runoff, and receiving stream degradation.
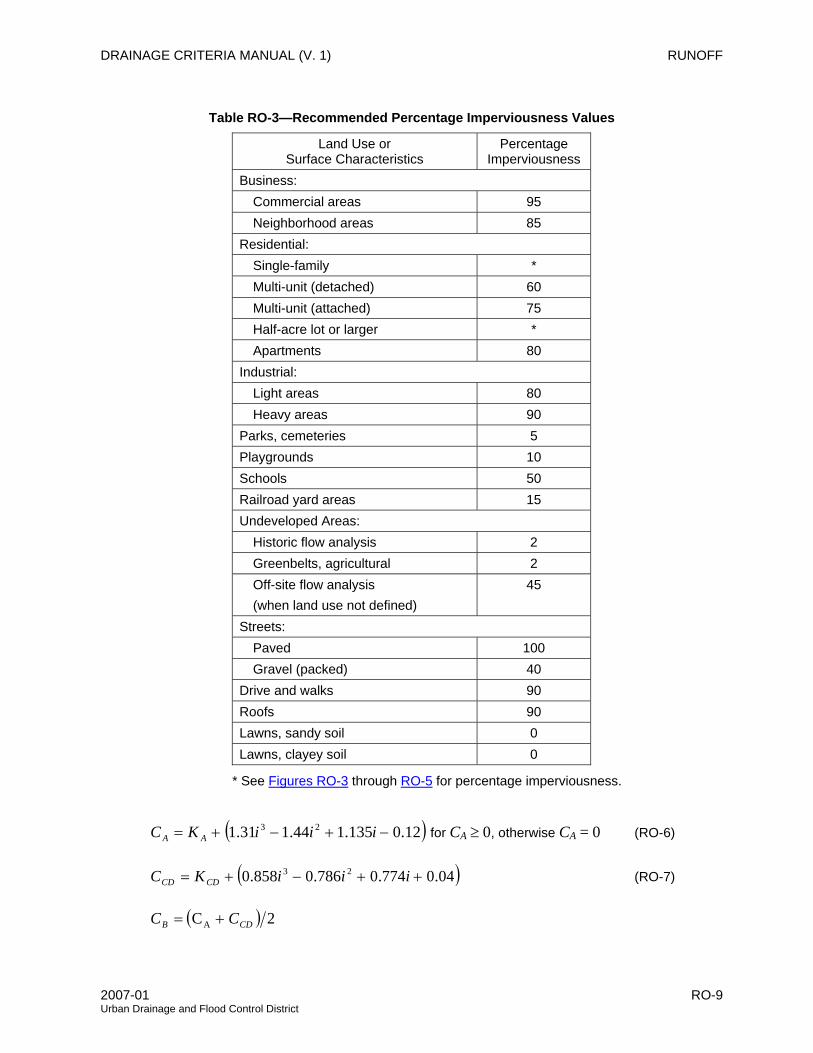
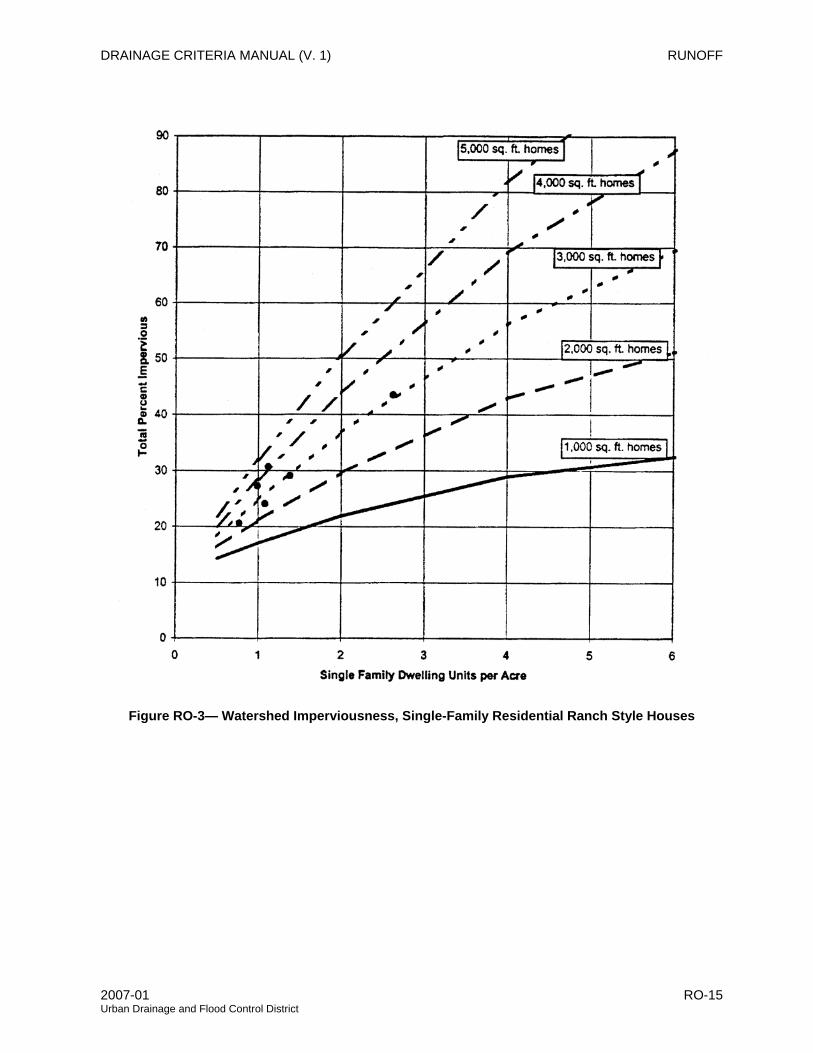
When analyzing a watershed for design purposes, the probable future percent of impervious area must
be estimated. A complete tabulation of recommended values of the total percent of imperviousness is
provided in Table RO-3 and Figures RO-3 through RO-5, the latter developed by the District after the
evolution of residential growth patterns since 1990.
2.7 Runoff Coefficient
The runoff coefficient, C, represents the integrated effects of infiltration, evaporation, retention, and
interception, all of which affect the volume of runoff. The determination of C requires judgment and
understanding on the part of the engineer.
Based in part on the data collected by the District since 1969, an empirical set of relationships between C
and the percentage imperviousness for the 2-year and smaller storms was developed and are expressed
in Equations RO-6 and RO-7 for Type A and C/D Soil groups (Urbonas, Guo and Tucker 1990). For Type
B soil group the impervious value is found by taking the arithmetic average of the values found using
these two equations for Type A and Type C/D soil groups. For larger storms (i.e., 5-, 10, 25-, 50- and
100-year) correction factors listed in Table RO-4 are applied to the values calculated using these two
equations.
RO-8 2007-01 Urban Drainage and Flood Control District
DRAINAGE CRITERIA MANUAL (V. 1) RUNOFF
Table RO-3—Recommended Percentage Imperviousness Values
Land Use or Surface Characteristics
Percentage Imperviousness
Business: Commercial areas 95 Neighborhood areas 85 Residential: Single-family * Multi-unit (detached) 60 Multi-unit (attached) 75 Half-acre lot or larger * Apartments 80 Industrial: Light areas 80 Heavy areas 90 Parks, cemeteries 5 Playgrounds 10 Schools 50 Railroad yard areas 15 Undeveloped Areas: Historic flow analysis 2 Greenbelts, agricultural 2 Off-site flow analysis (when land use not defined)
45
Streets: Paved 100 Gravel (packed) 40 Drive and walks 90 Roofs 90 Lawns, sandy soil 0 Lawns, clayey soil 0
* See Figures RO-3 through RO-5 for percentage imperviousness.
( )12.0135.144.131.1 23 −+−+= iiiKC AA for CA ≥ 0, otherwise CA = 0 (RO-6)
( )04.0774.0786.0858.0 23 ++−+= iiiKC CDCD (RO-7)
( ) 2CA CDB CC +=
2007-01 RO-9 Urban Drainage and Flood Control District

RUNOFF DRAINAGE CRITERIA MANUAL (V. 1)
in which:
i = % imperviousness/100 expressed as a decimal (see Table RO-3)
CA = Runoff coefficient for Natural Resources Conservation Service (NRCS) Type A soils
CB = Runoff coefficient for NRCS Type B soils
CCD = Runoff coefficient for NRCS Type C and D soils
KA = Correction factor for Type A soils defined in Table RO-4
KCD = Correction factor for Type C and D soils defined in Table RO-4
Table RO-4—Correction Factors KA and KCD for Use with Equations RO-6 and RO-7
Storm Return Period NRCS Soil Type 2-Year 5-Year 10-Year 25-Year 50-Year 100-Year
C and D 0 -0.10i + 0.11 -0.18i + 0.21 -0.28i + 0.33 -0.33i + 0.40 -0.39i + 0.46A 0 -0.08i + 0.09 -0.14i + 0.17 -0.19i + 0.24 -0.22i + 0.28 -0.25i + 0.32
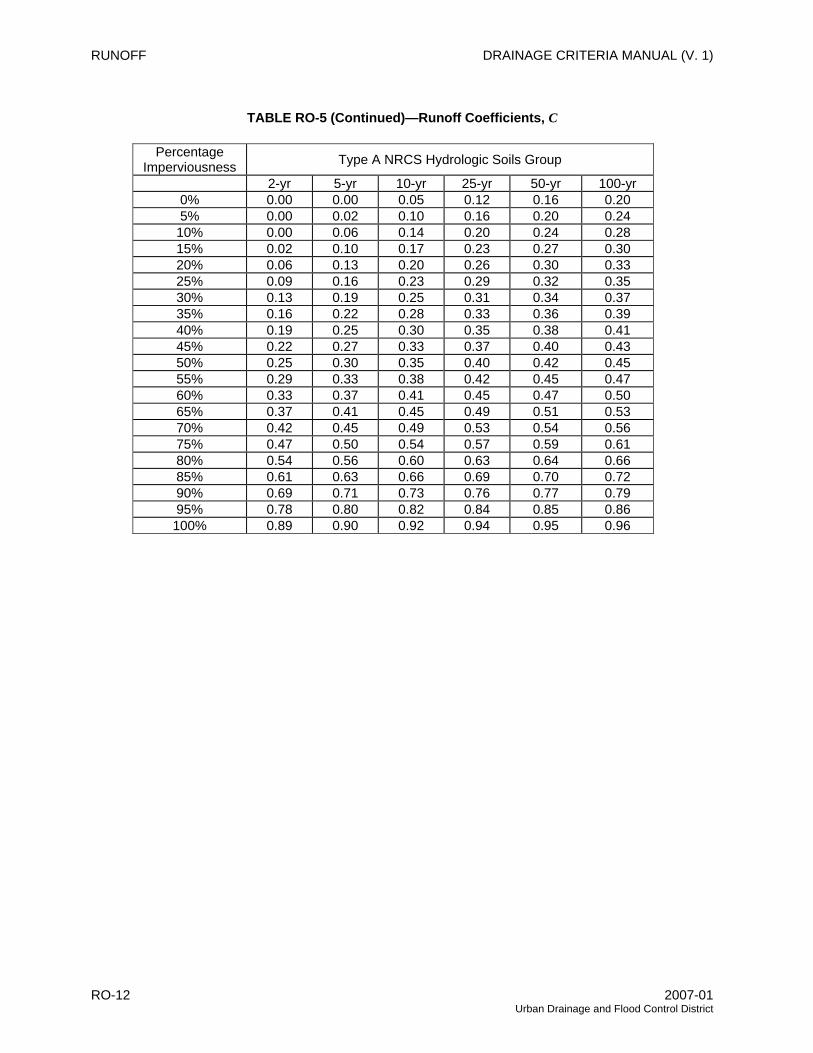
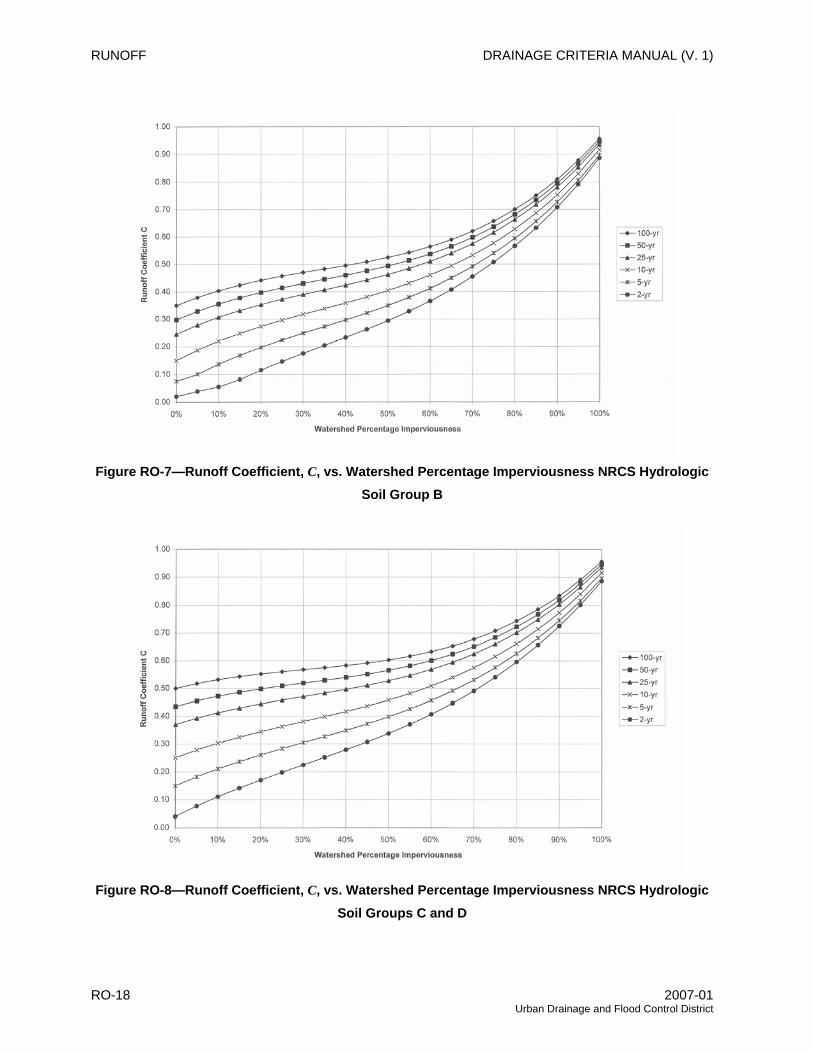
The values for various catchment imperviousnesses and storm return periods are presented graphically in
Figures RO-6 through RO-8, and are tabulated in Table RO-5. These coefficients were developed for the
Denver region to work in conjunction with the time of concentration recommendations in Section 2.4. Use
of these coefficients and this procedure outside of the semi-arid climate found in the Denver region may
not be valid. The UD-Rational spreadsheet performs all the needed calculations to find the runoff
coefficient given the soil type and imperviousness and the reader may want to take advantage of this
macro-enabled Excel workbook that is available for download from the District’s web site www.udfcd.org
under “Download” – “Technical Downloads.”
See Examples 7.1 and 7.2 that illustrate the Rational method. The use of the Rational method in storm
sewer design is illustrated in Example 6.13 of the STREETS/INLETS/STORM SEWERS chapter.
RO-10 2007-01 Urban Drainage and Flood Control District

DRAINAGE CRITERIA MANUAL (V. 1) RUNOFF
Table RO-5— Runoff Coefficients, C
Percentage Imperviousness Type C and D NRCS Hydrologic Soil Groups
2-yr 5-yr 10-yr 25-yr 50-yr 100-yr 0% 0.04 0.15 0.25 0.37 0.44 0.50 5% 0.08 0.18 0.28 0.39 0.46 0.52
10% 0.11 0.21 0.30 0.41 0.47 0.53 15% 0.14 0.24 0.32 0.43 0.49 0.54 20% 0.17 0.26 0.34 0.44 0.50 0.55 25% 0.20 0.28 0.36 0.46 0.51 0.56 30% 0.22 0.30 0.38 0.47 0.52 0.57 35% 0.25 0.33 0.40 0.48 0.53 0.57 40% 0.28 0.35 0.42 0.50 0.54 0.58 45% 0.31 0.37 0.44 0.51 0.55 0.59 50% 0.34 0.40 0.46 0.53 0.57 0.60 55% 0.37 0.43 0.48 0.55 0.58 0.62 60% 0.41 0.46 0.51 0.57 0.60 0.63 65% 0.45 0.49 0.54 0.59 0.62 0.65 70% 0.49 0.53 0.57 0.62 0.65 0.68 75% 0.54 0.58 0.62 0.66 0.68 0.71 80% 0.60 0.63 0.66 0.70 0.72 0.74 85% 0.66 0.68 0.71 0.75 0.77 0.79 90% 0.73 0.75 0.77 0.80 0.82 0.83 95% 0.80 0.82 0.84 0.87 0.88 0.89 100% 0.89 0.90 0.92 0.94 0.95 0.96
TYPE B NRCS HYDROLOGIC SOILS GROUP 0% 0.02 0.08 0.15 0.25 0.30 0.35 5% 0.04 0.10 0.19 0.28 0.33 0.38
10% 0.06 0.14 0.22 0.31 0.36 0.40 15% 0.08 0.17 0.25 0.33 0.38 0.42 20% 0.12 0.20 0.27 0.35 0.40 0.44 25% 0.15 0.22 0.30 0.37 0.41 0.46 30% 0.18 0.25 0.32 0.39 0.43 0.47 35% 0.20 0.27 0.34 0.41 0.44 0.48 40% 0.23 0.30 0.36 0.42 0.46 0.50 45% 0.26 0.32 0.38 0.44 0.48 0.51 50% 0.29 0.35 0.40 0.46 0.49 0.52 55% 0.33 0.38 0.43 0.48 0.51 0.54 60% 0.37 0.41 0.46 0.51 0.54 0.56 65% 0.41 0.45 0.49 0.54 0.57 0.59 70% 0.45 0.49 0.53 0.58 0.60 0.62 75% 0.51 0.54 0.58 0.62 0.64 0.66 80% 0.57 0.59 0.63 0.66 0.68 0.70 85% 0.63 0.66 0.69 0.72 0.73 0.75 90% 0.71 0.73 0.75 0.78 0.80 0.81 95% 0.79 0.81 0.83 0.85 0.87 0.88 100% 0.89 0.90 0.92 0.94 0.95 0.96
2007-01 RO-11 Urban Drainage and Flood Control District
RUNOFF DRAINAGE CRITERIA MANUAL (V. 1)
TABLE RO-5 (Continued)—Runoff Coefficients, C
Percentage Imperviousness Type A NRCS Hydrologic Soils Group
2-yr 5-yr 10-yr 25-yr 50-yr 100-yr 0% 0.00 0.00 0.05 0.12 0.16 0.20 5% 0.00 0.02 0.10 0.16 0.20 0.24
10% 0.00 0.06 0.14 0.20 0.24 0.28 15% 0.02 0.10 0.17 0.23 0.27 0.30 20% 0.06 0.13 0.20 0.26 0.30 0.33 25% 0.09 0.16 0.23 0.29 0.32 0.35 30% 0.13 0.19 0.25 0.31 0.34 0.37 35% 0.16 0.22 0.28 0.33 0.36 0.39 40% 0.19 0.25 0.30 0.35 0.38 0.41 45% 0.22 0.27 0.33 0.37 0.40 0.43 50% 0.25 0.30 0.35 0.40 0.42 0.45 55% 0.29 0.33 0.38 0.42 0.45 0.47 60% 0.33 0.37 0.41 0.45 0.47 0.50 65% 0.37 0.41 0.45 0.49 0.51 0.53 70% 0.42 0.45 0.49 0.53 0.54 0.56 75% 0.47 0.50 0.54 0.57 0.59 0.61 80% 0.54 0.56 0.60 0.63 0.64 0.66 85% 0.61 0.63 0.66 0.69 0.70 0.72 90% 0.69 0.71 0.73 0.76 0.77 0.79 95% 0.78 0.80 0.82 0.84 0.85 0.86 100% 0.89 0.90 0.92 0.94 0.95 0.96
RO-12 2007-01 Urban Drainage and Flood Control District

DRAINAGE CRITERIA MANUAL (V. 1) RUNOFF
Figure RO-1—Estimate of Average Overland Flow Velocity for Use With the Rational Formula
2007-01 RO-13 Urban Drainage and Flood Control District
RUNOFF DRAINAGE CRITERIA MANUAL (V. 1)
NOTE:INLETS 1, 2, 3 AND STORM SEWER X ARE EACH THE"FIRST DESIGN POINT" AND THE REGIONAL TcSHOULD BE CHECKED. STORM SEWER Y IS NOT THEFIRST DESIGN POINT.
CATCHMENTA
INLET 1
CATCHMENTB
CATCHMENT CATCHMENTC
INLET 2
D
SEWER XSTORM
CATCHMENT CATCHMENTE
STORMSEWER Y
FINLET 3
Figure RO-2—Diagram of First Design Point
RO-14 2007-01 Urban Drainage and Flood Control District
DRAINAGE CRITERIA MANUAL (V. 1) RUNOFF
Figure RO-3— Watershed Imperviousness, Single-Family Residential Ranch Style Houses
2007-01 RO-15 Urban Drainage and Flood Control District

RUNOFF DRAINAGE CRITERIA MANUAL (V. 1)
Figure RO-4—Watershed Imperviousness, Single-Family Residential Split-Level Houses
RO-16 2007-01 Urban Drainage and Flood Control District

DRAINAGE CRITERIA MANUAL (V. 1) RUNOFF
Figure RO-5—Watershed Imperviousness, Single-Family Residential Two-Story Houses
Figure RO-6—Runoff Coefficient, C, vs. Watershed Percentage Imperviousness NRCS Hydrologic Soil Group A
2007-01 RO-17 Urban Drainage and Flood Control District
RUNOFF DRAINAGE CRITERIA MANUAL (V. 1)
Figure RO-7—Runoff Coefficient, C, vs. Watershed Percentage Imperviousness NRCS Hydrologic Soil Group B
Figure RO-8—Runoff Coefficient, C, vs. Watershed Percentage Imperviousness NRCS Hydrologic Soil Groups C and D
RO-18 2007-01 Urban Drainage and Flood Control District
DRAINAGE CRITERIA MANUAL (V. 1) RUNOFF
3.0 COLORADO URBAN HYDROGRAPH PROCEDURE
3.1 Background
The Colorado Urban Hydrograph Procedure (CUHP) is a method of hydrologic analysis based upon the
unit hydrograph principle. It has been developed and calibrated using rainfall-runoff data collected in
Colorado (mostly in the Denver/Boulder metropolitan area). This section provides a general background
in the use of the computer version of CUHP to carry out stormwater runoff calculations. A detailed
description of the CUHP procedure and the assumptions and equations used, including a hand
calculation example, are provided in Appendix A to this chapter. For more detailed information regarding
the latest CUHP computer model including data requirements, data format, and model execution, the
reader is directed to the program’s users’ manual. The latest version of CUHP macro-enabled software is
CUHP 2005 and users’ manual are available for downloading from the District’s Web site www.udfcd.org
under “Downloads”.
3.2 Effective Rainfall for CUHP
Effective rainfall is that portion of precipitation during a storm event that runs off the land to drainageways.
Those portions of precipitation that do not reach drainageways are called abstractions and include
interception by vegetation, evaporation, infiltration, storage in all surface depressions, and long-time
surface retention. The total design rainfall depth for use with CUHP should be obtained from the
RAINFALL chapter of this Manual. This RUNOFF chapter illustrates a method for estimating the amount
of rainfall that actually becomes surface runoff whenever a design rainstorm is used.
3.2.1 Pervious-Impervious Areas As was described in Section 2.6, the urban landscape is comprised of pervious and impervious surfaces.
The degree of imperviousness is the primary variable that affects the volumes and rates of runoff
calculated using CUHP. When analyzing a watershed for design purposes, the probable future percent of
impervious area must first be estimated. A complete tabulation of recommended values of total
percentage imperviousness is provided in Table RO-3 and Figures RO-3 through RO-5. References to
impervious area and all calculations in this chapter are based on the input of total impervious areas. The
pervious-impervious area relationship can be further refined for use in CUHP as follows:
1. DCIA—Impervious area portion directly connected to the drainage system.
2. UIA—Impervious area portion that drains onto or across impervious surfaces.
3. RPA—The portion of pervious area receiving runoff from impervious portions.
4. SPA—The separate pervious area portion not receiving runoff from impervious surfaces.
This further refinement is explained in some detail in the CUHP users' manual and shown schematically
2007-01 RO-19 Urban Drainage and Flood Control District
RUNOFF DRAINAGE CRITERIA MANUAL (V. 1)
in Figure RO-A6 in Appendix A at the end of this chapter.
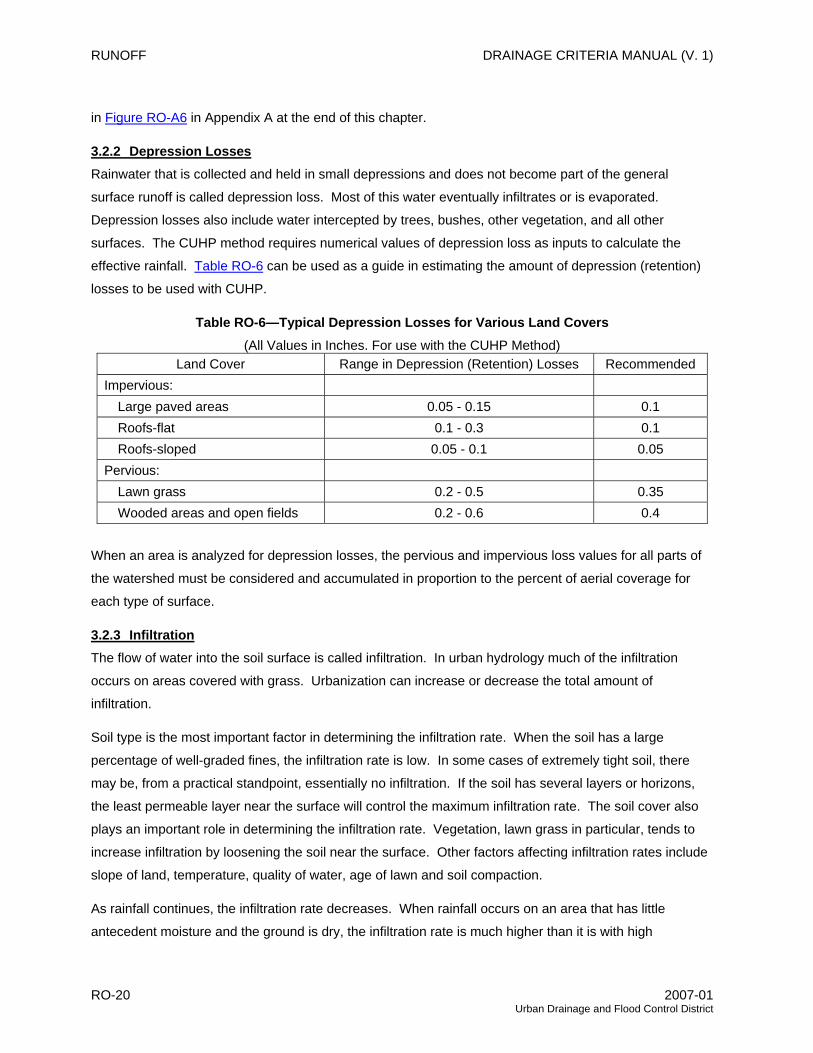
3.2.2 Depression Losses Rainwater that is collected and held in small depressions and does not become part of the general
surface runoff is called depression loss. Most of this water eventually infiltrates or is evaporated.
Depression losses also include water intercepted by trees, bushes, other vegetation, and all other
surfaces. The CUHP method requires numerical values of depression loss as inputs to calculate the
effective rainfall. Table RO-6 can be used as a guide in estimating the amount of depression (retention)
losses to be used with CUHP.
Table RO-6—Typical Depression Losses for Various Land Covers (All Values in Inches. For use with the CUHP Method)
Land Cover Range in Depression (Retention) Losses Recommended Impervious: Large paved areas 0.05 - 0.15 0.1 Roofs-flat 0.1 - 0.3 0.1 Roofs-sloped 0.05 - 0.1 0.05 Pervious: Lawn grass 0.2 - 0.5 0.35 Wooded areas and open fields 0.2 - 0.6 0.4
When an area is analyzed for depression losses, the pervious and impervious loss values for all parts of
the watershed must be considered and accumulated in proportion to the percent of aerial coverage for
each type of surface.
3.2.3 Infiltration The flow of water into the soil surface is called infiltration. In urban hydrology much of the infiltration
occurs on areas covered with grass. Urbanization can increase or decrease the total amount of
infiltration.
Soil type is the most important factor in determining the infiltration rate. When the soil has a large
percentage of well-graded fines, the infiltration rate is low. In some cases of extremely tight soil, there
may be, from a practical standpoint, essentially no infiltration. If the soil has several layers or horizons,
the least permeable layer near the surface will control the maximum infiltration rate. The soil cover also
plays an important role in determining the infiltration rate. Vegetation, lawn grass in particular, tends to
increase infiltration by loosening the soil near the surface. Other factors affecting infiltration rates include
slope of land, temperature, quality of water, age of lawn and soil compaction.
As rainfall continues, the infiltration rate decreases. When rainfall occurs on an area that has little
antecedent moisture and the ground is dry, the infiltration rate is much higher than it is with high
RO-20 2007-01 Urban Drainage and Flood Control District
DRAINAGE CRITERIA MANUAL (V. 1) RUNOFF
antecedent moisture resulting from previous storms or land irrigation such as lawn watering. Although
antecedent precipitation is very important when calculating runoff from smaller storms in non-urbanized
areas, the runoff data from urbanized basins indicates that antecedent precipitation has a limited effect on
runoff peaks and volumes in the urbanized portions of the District.
There are many infiltration models in use by hydrologists. These models vary significantly in complexity.
Because of the climatic condition in the semi-arid region and because runoff from urban watersheds is not
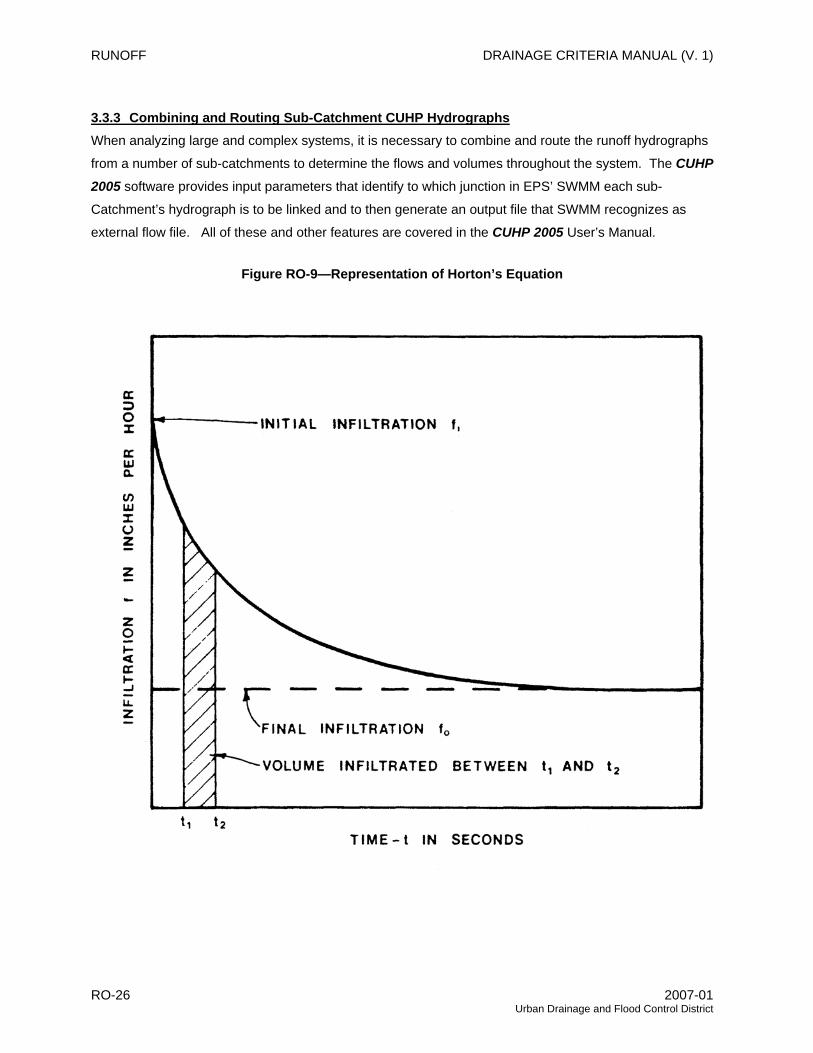
very sensitive to infiltration refinements, the infiltration model proposed by Horton was found to provide a
good balance between simplicity and reasonable physical description of the infiltration process for use in
CUHP. Horton’s infiltration model is described by Equation RO-8 and is illustrated graphically in Figure
RO-9.
( ) atoio effff −−+= (RO-8)
in which:
f = infiltration rate at any given time t from start of rainfall (in/hr)
fo = final infiltration rate (in/hr)
fi = initial infiltration rate (in/hr)
e = natural logarithm base
a = decay coefficient (1/second)
t = time (seconds)
In developing Equation RO-8, Horton observed that infiltration is high early in the storm and eventually
decays to a steady state constant value as the pores in the soil become saturated. The coefficients and
initial and final infiltration values are site specific and depend on the soils and vegetative cover complex.
It is possible to develop these values for each site if sufficient rainfall-runoff observations are made.
However, such an approach is rarely practical.
Since 1977, the District has analyzed a considerable amount of rainfall-runoff data. On the basis of this
analysis, the values in Table RO-7 are recommended for use within the District with CUHP. The NRCS
Hydrologic Soil Groups C and D occur most frequently within the District; however, areas of NRCS Group
A and B soils are also fairly common. Consult NRCS soil surveys for appropriate soil classifications.
2007-01 RO-21 Urban Drainage and Flood Control District

RUNOFF DRAINAGE CRITERIA MANUAL (V. 1)
Table RO-7—Recommended Horton’s Equation Parameters
NRCS Hydrologic Infiltration (inches per hour) Decay Soil Group Initial—fi Final—fo Coefficient—a
A 5.0 1.0 0.0007 B 4.5 0.6 0.0018 C 3.0 0.5 0.0018 D 3.0 0.5 0.0018
To calculate the maximum infiltration depths that may occur at each time increment, it is necessary to
integrate Equation RO-8 and calculate the values for each time increment. Very little accuracy is lost if,
instead of integrating Equation RO-8, the infiltration rate is calculated at the center of each time
increment. This “central” value can then be multiplied by the unit time increment to estimate the
infiltration depth. This was done for the four NRCS hydrologic soil groups, and the results are presented
in Table RO-8. Although Tables RO-7 and RO-8 provide recommended values for various Horton
equation parameters, these recommendations are being made specifically for the urbanized or urbanizing
watersheds in the Denver metropolitan area and may not be valid in different meteorologic and climatic
regions.
Table RO-8—Incremental Infiltration Depths in Inches*
NRCS Hydrologic Soil Group Time in Minutes** A B C and D
5 0.384 0.298 0.201 10 0.329 0.195 0.134 15 0.284 0.134 0.096 20 0.248 0.099 0.073 25 0.218 0.079 0.060 30 0.194 0.067 0.052 35 0.175 0.060 0.048 40 0.159 0.056 0.045 45 0.146 0.053 0.044 50 0.136 0.052 0.043 55 0.127 0.051 0.042 60 0.121 0.051 0.042 65 0.115 0.050 0.042 70 0.111 0.050 0.042 75 0.107 0.050 0.042 80 0.104 0.050 0.042 85 0.102 0.050 0.042 90 0.100 0.050 0.042 95 0.098 0.050 0.042
100 0.097 0.050 0.042 105 0.096 0.050 0.042 110 0.095 0.050 0.042 115 0.095 0.050 0.042 120 0.094 0.050 0.042
* Based on central value of each time increment in Horton's equation. ** Time at end of the time increment.
RO-22 2007-01 Urban Drainage and Flood Control District

DRAINAGE CRITERIA MANUAL (V. 1) RUNOFF
3.3 CUHP Parameter Selection
3.3.1 Rainfall The CUHP 2005 Excel-based computer program requires the input of a design storm, either as a detailed
hyetograph or as a 1-hour rainfall depth. A detailed hyetograph distribution is generated by the program
for the latter using the standard 2-hour storm distribution recommended in the RAINFALL chapter of this
Manual. In addition, this software will also distribute the one-hour values for longer storm durations with
area corrections accounted for cases where larger watersheds are studies.
3.3.2 Catchment Description The following catchment parameters are required for the program to generate a unit and storm
hydrograph.
1. Area—Catchment area in square miles. See Table RO-1 for catchment size limits.
2. Catchment Length—The length in miles from the downstream design point of the catchment or
sub-catchment along the main drainageway path to the furthest point on its respective catchment
or sub-catchment. When a catchment is subdivided into a series of sub-catchments, the sub-
catchment length used shall include the distance required for runoff to reach the major
drainageway from the farthest point in the sub-catchment.
3. Centroid Distance—Distance in miles from the design point of the catchment or sub-catchment
along the main drainageway path to its respective catchment or sub-catchment centroid.
4. Percent Impervious—The portion of the catchment’s total surface area that is impervious,
expressed as a percent value between 0 and 100. (See 3.2.1 for more details.)
5. Catchment Slope—The length-weighted, corrected average slope of the catchment in feet per
foot.
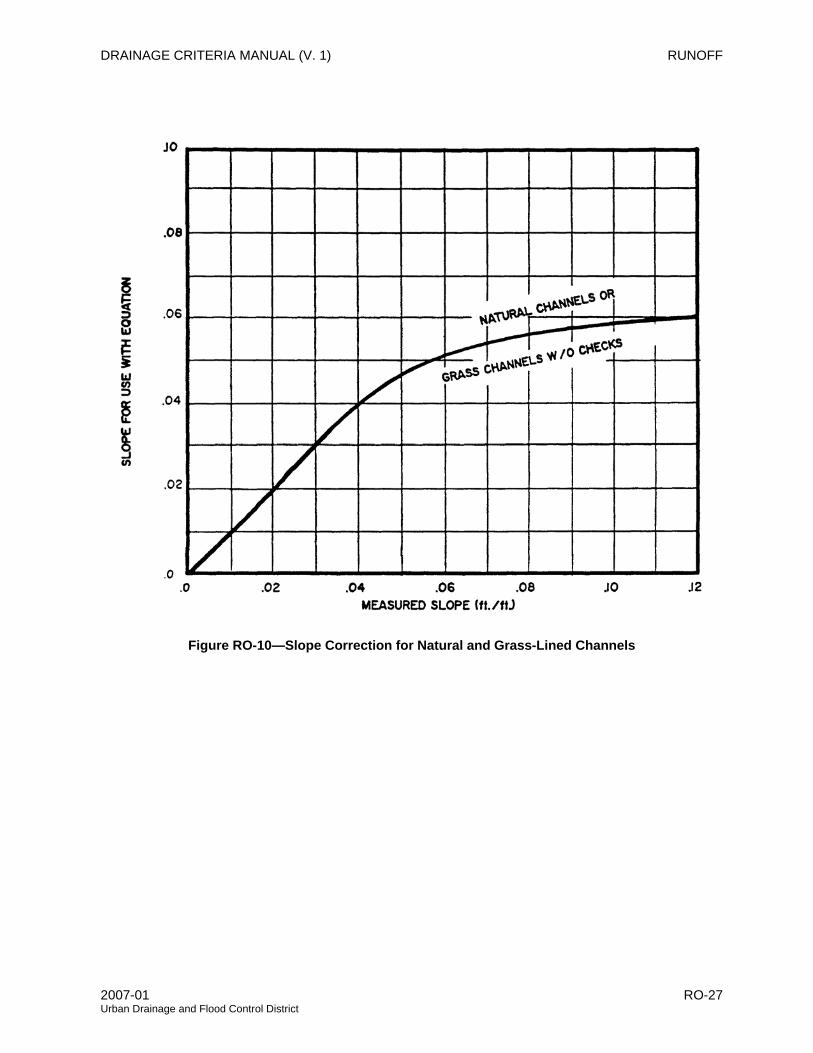
There are natural processes at work that limit the time to peak of a unit hydrograph as a natural
drainageway becomes steeper. To account for this phenomenon, it is recommended that the
slope used in CUHP for natural drainageways and existing manmade grass-lined channels be
adjusted using Figure RO-10.
When a riprap channel is evaluated, use the measured (i.e., uncorrected) average channel invert
slope.
In concrete-lined channels and buried conduits, the velocities can be very high. For this reason, it
is recommended that the average ground slope (i.e., not flow-line slope) be used where concrete-
lined channels and/or storm sewers dominate the basin drainageways. There is no correction
factor or upper limit recommended to the slope for concrete-lined channels and buried conduits.
2007-01 RO-23 Urban Drainage and Flood Control District
RUNOFF DRAINAGE CRITERIA MANUAL (V. 1)
Where the flow-line slope varies along the channel, calculate a weighted basin slope for use with
CUHP. Do this by first segmenting the major drainageway into reaches having similar
longitudinal slopes. Then calculate the weighted slope using the Equation RO-9.
17.4
321
24.024.022
24.011
....
....⎥⎦
⎤⎢⎣
⎡++
+++=
n
nn
LLLLSLSLSL
S (RO-9)
in which:
S = weighted basin waterway slopes in ft/ft
S1,S2,….Sn = slopes of individual reaches in ft/ft (after adjustments using Figure RO-10)
L1,L2,….Ln = lengths of corresponding reaches
6. Unit Hydrograph Time Increment—Typically a 5-minute unit hydrograph is used. For catchments
smaller than 90 acres, using a 1-minute unit hydrograph may be needed if significant differences
are found between the “excess precipitation” and “runoff hydrograph” volumes listed in the
summary output. For very small catchments (i.e. smaller than 10 acres), especially those with
high imperviousness the 1-minute unit hydrograph will be needed to preserve runoff volume
integrity.
7. Pervious Retention—Maximum depression storage on pervious surfaces in inches. (See Section
3.2.2 for more details.)
8. Impervious Retention—Maximum depression storage on impervious surfaces in inches. (See
Section 3.2.2 for more details.)
9. Infiltration Rate—Initial infiltration rate for pervious surfaces in the catchment in inches per hour.
If this entry is used by itself, it will be used as a constant infiltration rate throughout the storm.
(See Section 4.2.3 for more details.)
10. Decay—Exponential decay coefficient in Horton's equation in "per second" units.
11. Final Infiltration—Final infiltration rate in Horton's equation in inches per hour.
The program computes the coefficients Ct and Cp; however, values for these parameters can be specified
by the user as an option. The unit hydrograph is developed by the computer using the algorithm
described in CUHP 2005 User Manual.
The shaping of the unit hydrograph also relies on proportioning the widths at 50% and 75% of the unit
hydrograph peak. The proportioning is based on 0.35 of the width at 50% of peak being ahead of the
“time to peak” and 0.45 of the width at 75% of peak being ahead of the “time to peak.” These
RO-24 2007-01 Urban Drainage and Flood Control District

DRAINAGE CRITERIA MANUAL (V. 1) RUNOFF
proportioning factors were selected after observing a number of unit hydrographs derived from the
rainfall-runoff data collected by the USGS for the District. It is possible for the user to override the unit
hydrograph widths and the proportioning of these widths built into the program. For drainage and flood
studies within the District, the program values shall be used. If the user has derived unit hydrographs
from reliable rainfall-runoff data for a study catchment and can develop a “calibrated” unit hydrograph for
this catchment, this option permits reshaping the unit hydrograph accordingly.
The following catchment parameters are also optional inputs and are available to the user to account for
the effects of directly connected/disconnected impervious areas:
1. DCIA—Specifies the directly connected impervious area (DCIA) level of practice as defined in the
STRUCTURAL BMPs chapter in Volume 3 of this Manual. The user may specify 1 or 2 for the
level of DCIA to model.
2. D—Defines the fraction of the total impervious area directly connected to the drainage system.
Values range from 0.01 to 1.0.
3. R—Defines the fraction of total pervious area receiving runoff from the “disconnected” impervious
areas. Values range from 0.01 to 1.0.
A sample calculation for effective rainfall is presented in Example 7.3.
3.3.3 Catchment Delineation Criteria The maximum size of a catchment to be analyzed with a single unit hydrograph is limited to 5 square
miles. Whenever a larger catchment is studied, it should be subdivided into sub-catchments of 5 square
miles or less and individual sub-catchment storm hydrographs should be routed downstream using
appropriate channel routing procedures such as the EPA’s SWMM 5 model. The routed hydrographs are
then added to develop a single composite storm hydrograph. See Table RO-1 for a description of
catchment size limitations for CUHP.
The catchment shape can have a profound effect on the final results and, in some instances, can result in
underestimates of peak flows. Experience with the 1982 version of CUHP has shown that, whenever
catchment length is increased faster than its area, the storm hydrograph peak will tend to decrease.
Although hydrologic routing is an integral part of runoff analysis, the data used to develop CUHP are
insufficient to say that the observed CUHP response with disproportionately increasing basin length is
valid. For this reason, it is recommended to subdivide irregularly shaped or very long catchments (i.e.,
catchment length to width ratio of four or more) into more regularly shaped sub-catchments. A composite
catchment storm hydrograph can be developed using appropriate routing and by adding the individual
sub-catchment storm hydrographs.
2007-01 RO-25 Urban Drainage and Flood Control District
RUNOFF DRAINAGE CRITERIA MANUAL (V. 1)
3.3.3 Combining and Routing Sub-Catchment CUHP Hydrographs When analyzing large and complex systems, it is necessary to combine and route the runoff hydrographs
from a number of sub-catchments to determine the flows and volumes throughout the system. The CUHP 2005 software provides input parameters that identify to which junction in EPS’ SWMM each sub-
Catchment’s hydrograph is to be linked and to then generate an output file that SWMM recognizes as
external flow file. All of these and other features are covered in the CUHP 2005 User’s Manual.
Figure RO-9—Representation of Horton’s Equation
RO-26 2007-01 Urban Drainage and Flood Control District
DRAINAGE CRITERIA MANUAL (V. 1) RUNOFF
Figure RO-10—Slope Correction for Natural and Grass-Lined Channels
2007-01 RO-27 Urban Drainage and Flood Control District
RUNOFF DRAINAGE CRITERIA MANUAL (V. 1)
4.0 EPA SWMM AND HYDROGRAPH ROUTING
EPA’s SWMM 5 is a computer model that is used to generate surface runoff hydrographs from sub-
catchments and then route and combine these hydrographs. The procedure described here is limited to
the routing of hydrographs generated using CUHP software. Originally this was done using UDSWM, a
modified version of the Runoff Block of the Environmental Protection Agency’s (EPA's) SWMM (Storm
Water Management Model). It has been modified by the District so that it may be used conjunctively with
CUHP. In 2005 the District adopted the use of EPA’s SWMM 5.0 model and recommends its use for all
future hydrology studies.
The purpose of the discussion of SWMM in this chapter is to provide general background on the use of
the model with CUHP 2005 software to perform more complex stormwater runoff calculations using
SWMM. Complete details about this model’s use, specifics of data format and program execution is
provided in the users' manual for SWMM 5.0. Software, users manual and other information about EPA’s
SWMM 5.0 may be downloaded from http://www.epa.gov/ednnrmrl/models/swmm/index.htm.
4.1 Software Description
SWMM represents a watershed by an aggregate of idealized runoff planes, channels, gutters, pipes and
specialized units such as storage nodes, outlets, pumps, etc. The program can accept rainfall
hyetographs and make a step-by-step accounting of rainfall infiltration losses in pervious areas, surface
retention, overland flow, and gutter flow leading to the calculation of hydrographs. However, this portion
of the model is normally not used by the District because the calculation of hydrographs for each sub-
catchment is typically carried out using the CUHP software. If, however, the user wants to use SWMM to
calculate runoff, the model must be calibrated against the CUHP calculations for the same watershed
being studied.
After the CUHP 2005 software is used to calculate hydrographs from a number of sub-watersheds, the
resulting hydrographs from these sub-watersheds can be combined and routed through a series of links
(i.e., channels, gutters, pipes, dummy links, etc.) and nodes (i.e., junctures, storage, diversion, etc.) to
compute the resultant hydrographs at any number of design points within the watershed.
4.1.1 Surface Flows and Flow Routing Features Stormwater runoff hydrographs generated using CUHP 2005 can be routed through a system of
stormwater conveyance, diversion, storage, etc. elements of a complex urban watershed. In setting up
the SWMM model, it is critical that overflow links for storm sewers and diversion junctions are provided in
the model. The combination of these allows the user to model flows accurately when pipes and/or
smaller channels that do not have the capacity to convey higher flows, at which time the excess flows are
diverted to the overflow channels and a “choking” of the flow is avoided and errors in the calculated peak
flow values downstream are prevented.
RO-28 2007-01 Urban Drainage and Flood Control District

DRAINAGE CRITERIA MANUAL (V. 1) RUNOFF
There are several types of conveyance elements that one can select from a menu in SWMM. One
element that is now available, that was not available in older versions, is a user-defined irregular channel
cross-section, similar to the way cross-sections are defined in HEC-RAS. This makes the model very
flexible in modeling natural waterways and composite man-made channels. For a complete description of
the routing elements and junction types available for modeling see the SWMM User Manual published by
EPA and available from their web site mentioned earlier.
4.1.2 Flow Routing Method of Choice The District recommends the use of kinematic wave routing as the “routing” option in SWMM for planning
purposes. Dynamic wave routing for most projects is not necessary, does not improve the accuracy of
the runoff estimates and can be much more difficult to implement because it requires much information to
describe, in minute detail, the entire flow routing system. In addition, it has tendencies to go unstable
when modeling some of the more complex elements and/or junctions. When planning for growth, much
of the required detail may not even be available (e.g., location of all drop structures and their crest and
toe elevations for which a node has to be defined in the model). In addition, with dynamic routing setting
up of overflow links and related nodes is much more complicated and exacting.
The use of dynamic wave routing is appropriate when evaluating complex exiting elements of a larger
system. It is an option that can also offer some advantages in final design and its evaluation, as it
provides hydraulic grade lines and accounts for backwater effects.
4.2 Data Preparation for the SWMM Software
Use of SWMM requires three basic steps:
Step 1—Identify or define the geometries watershed, sub-watersheds and routing/storage elements.
Step 2—Estimates of roughness coefficients and functional/tabular relationships for storage
and other special elements.
Step 3—Prepare input data for the model.
4.2.1 Step 1—Method of Discretization Discretization is a procedure for the mathematical abstraction of the watershed and of the physical
drainage system. Discretization begins with the identification of drainage area boundaries, the location of
storm sewers, streets, and channels, and the selection of those routing elements to be included in the
system. For the computation of hydrographs, the watershed may be conceptually represented by a
network of hydraulic elements (i.e., sub-catchments, gutters, pipes, etc.) Hydraulic properties of each
element are then characterized by various parameters such as size, slope, and roughness coefficient.
4.2.2 Step 2—Estimate Coefficients and Functional/Tabular Characteristic of Storage and Outlets For hydrologic routing through conveyance elements such as pipes, gutters, and channels, the resistance
(Manning's n) coefficients should not necessarily be the same as those used in performing hydraulic
2007-01 RO-29 Urban Drainage and Flood Control District

RUNOFF DRAINAGE CRITERIA MANUAL (V. 1)
design calculations. As a general rule, it was found that increasing the "typical" values of Manning's n by
approximately 25 percent was appropriate when using UDSWM in the past and should be appropriate for
use in SWMM as well. Thus, if a pipe is estimated to have n = 0.013 for hydraulic calculations, it is
appropriate to use n = 0.016 in SWMM.
When modeling the hydrologic routing of natural streams, grass-lined channels, or riprap-lined channels
in Colorado, it is recommended that Manning's n be estimated for SWMM using Equation RO-10 (Jarrett
1984 and 1985).
16.038.0393.0 −= RSn (RO-10)
in which:
n = Manning's roughness coefficient
S = friction slope (ft/ft)
R = hydraulic radius (ft)
To estimate the hydraulic radius of a natural, grass-lined, or riprap-lined channel for Equation RO-10, it is
suggested that one half of the estimated hydrograph peak flow be used to account for the variable depth
of flow during a storm event.
SWMM does not have built-in shapes that define geometries of gutters or streets. The user can use the
irregular shape option to define the shape of the gutter and street. For storage junctions, the user can
define relationships such as stage vs. storage-surface area using mathematical functions or tables. For
storage outlets or downstream outfalls, the user can use tables or functions to define their stage-
discharge characteristics. As and alternative, the user can define geometries and characteristic for weirs
and orifices and let the program calculate the functional relationships. Use of the weirs can sometimes
be particularly troublesome when the dynamic wave routing option is used.
4.2.3 Step 3—Preparation of Data for Computer Input The major preparation effort is forming a tree structure of all the runoff and conveyance elements and
dividing the watershed into sub-watersheds. The conveyance elements network is developed using a
watershed map, subdivision plans, and "as-built" drawings of the drainage system. Pipes with little or no
backwater effects, channels, reservoirs, or flow dividers are usually designated as conveyance elements
for computation by SWMM. Once the conveyance element system is set and labeled, CUHP 2005 is
used to generate an output file that contains runoff hydrograph for all sub-watersheds. This file is called
in by SWMM as an external inflow file and the hydrograph data is then routed by SWMM. The reader
needs to study the SWMM users' manual for complete details about data input preparation.
RO-30 2007-01 Urban Drainage and Flood Control District

DRAINAGE CRITERIA MANUAL (V. 1) RUNOFF
5.0 OTHER HYDROLOGIC METHODS
5.1 Published Hydrologic Information
The District has prepared hydrologic studies for the majority of the major drainageways within District
boundaries. These studies contain information regarding peak flow and runoff volume from the 2-year
through 100-year storm events for numerous design points within the watershed. They also contain
information regarding watershed and sub-watershed boundaries, soil types, percentage imperviousness,
and rainfall. The studies are available at the District library. When published flow values are available
from the District for any waterway of interest, these values should be used for design unless there are
compelling reasons to modify the published values.
5.2 Statistical Methods
Statistical analysis of measured streamflow data is also an acceptable means of hydrologic analysis in
certain situations. Statistical analysis should be limited to streams with a long period of flow data (30
years as a recommended minimum) where there have been no significant changes in land use in the
tributary watershed during the period of the flow record. It should be recognized that there is no good
way to extrapolate calculated flow from a statistical analysis to estimate the flow for expected future
watershed development conditions.
2007-01 RO-31 Urban Drainage and Flood Control District
RUNOFF DRAINAGE CRITERIA MANUAL (V. 1)
6.0 SPREADSHEETS AND OTHER SOFTWARE
District provides following freeware to help with the calculations and protocols in this Manual. All of these
can be found on the District’s Web site (www.udfcd.org) under Downloads, Technical or Software.
The Colorado Urban Hydrograph Procedure has been computerized and is loaded using macro-driven
spreadsheet. The software package is titled CUHP 2005 Version x.x.x, and includes a Converter to
converts older version CUHP files and UDSWM files into CUHP 2005 and EPA’s SWMM 5.0 formats.
A spreadsheet has been prepared to facilitate runoff calculations using the Rational Method, namely,
UD-Rational (Guo 1995). Inputs needed include catchment area, runoff coefficient, 1-hour point rainfall
depth, and flow reach characteristics (length, slope, and type of ground surface). The spreadsheet then
calculates the peak runoff flow rate in cfs.
Storm sewers may be designed using the Rational Method with the aid of GUI-based software
Neo UD-Sewer. This software will pre-size storm sewers using the same input mentioned for UD-Rational,
except that it permits definition of existing sewer link and that it also checks to insure that the most critical
portions of the catchment are being accounted for in sizing the sewers. After the sewers are sized, or if
you have an existing system, it can be used to analyze the hydraulic and energy grade lines of the
system. A recent update includes a feature to generate a profile plot of the sewer, ground line, hydraulic
grade line and energy grade line.
UD-RainZone is a spreadsheet that help the user find the Intensity-Duration-Frequency curve for any
region in Colorado based on site elevation.
UD-Raincurve is a spreadsheet that helps the user develop design storm distributions for use with CUHP
or other models based on the protocols described in this Manual. It will generate design storm
hyetographs for small catchments (i.e., < 5 sq. mi.) all the way up to ones that are 75 sq. mi. in size, using
area correction factors for the latter.
Latest release of the EPA SWMM 5.0 software is available for downloading from EPA’s web site at
(http://www.epa.gov/ednnrmrl/models/swmm/index.htm)
It is recommended that the users of these software check for updates on regular basis. Corrections of discovered bugs and enhancements are constantly under development and are posted as they are completed.
RO-32 2007-01 Urban Drainage and Flood Control District

DRAINAGE CRITERIA MANUAL (V. 1) RUNOFF
7.0 EXAMPLES
7.1 Rational Method Example 1
Find the 100-year peak flow rate for a 60-acre catchment in an undeveloped grassland area located in
Section 13, R65W, T1S. The upper 400 feet of the catchment is sloped at 2%, the lower 1,500 feet is
grassed waterway that is sloped at 1%. The area has type C soils.
From Figure RA-6, the 1-hour point precipitation value is 2.7 inches. From Table RO-3, in the category
“Undeveloped Areas, historic flow analysis,” a percent impervious value of 2% (or 0.02) is selected.
Determine C5 from Equation RO-7:
( ) 04.0)02.0(774.0)02.0(786.0)02.0(858.011.0)02.0(10.0 235 ++−++−=C
= 0.16
Determine ti from Equation RO-3:
( )( ) 33.002.0
40016.01.1395.0 −=it
= 27.0 minutes
Find tt:
VLtt 60
=
From Table RO-2, for a grassed waterway, CV = 15
From Equation RO-4:
( ) 5.001.015=V
= 1.5 ft/sec
Find tt:
605.1500,1⋅
=tt
= 16.67 minutes
2007-01 RO-33 Urban Drainage and Flood Control District
RUNOFF DRAINAGE CRITERIA MANUAL (V. 1)
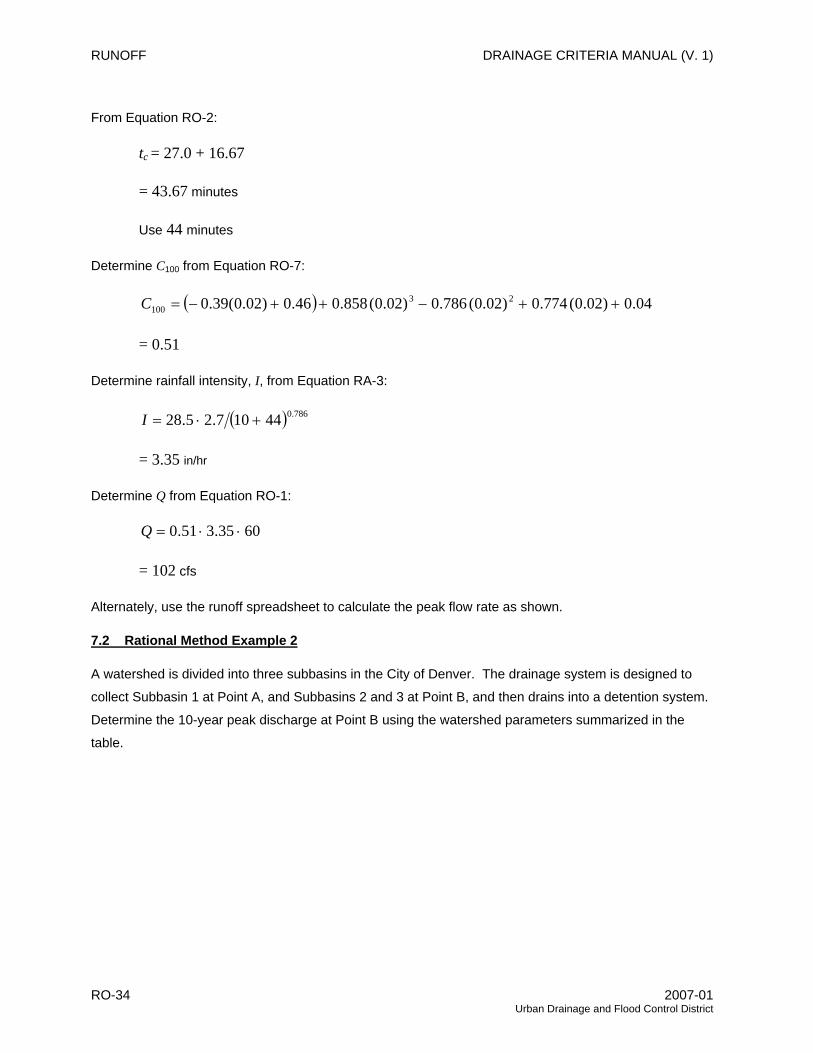
From Equation RO-2:
tc = 27.0 + 16.67
= 43.67 minutes
Use 44 minutes
Determine C100 from Equation RO-7:
( ) 04.0)02.0(774.0)02.0(786.0)02.0(858.046.0)02.0(39.0 23100 ++−++−=C
= 0.51
Determine rainfall intensity, I, from Equation RA-3:
( ) 786.044107.25.28 +⋅=I
= 3.35 in/hr
Determine Q from Equation RO-1:
6035.351.0 ⋅⋅=Q
= 102 cfs
Alternately, use the runoff spreadsheet to calculate the peak flow rate as shown.
7.2 Rational Method Example 2
A watershed is divided into three subbasins in the City of Denver. The drainage system is designed to
collect Subbasin 1 at Point A, and Subbasins 2 and 3 at Point B, and then drains into a detention system.
Determine the 10-year peak discharge at Point B using the watershed parameters summarized in the
table.
RO-34 2007-01 Urban Drainage and Flood Control District

DRAINAGE CRITERIA MANUAL (V. 1) RUNOFF
Subbasin Drainage Area A (acres) Runoff Coefficient C Time of Concentration Tc (minutes)
1.00 2.00 0.55 15.00 2.00 5.00 0.65 22.00 3.00 1.50 0.81 12.00
As shown in the figure, there are three flow paths to reach Point B. Their flow times are:
1. From Subbasin 2: T2 = 22 minutes
2. From Subbasin 3: T3 = 12 minutes
3. From Subbasin 1: The flow time includes the time of concentration of Subbasin 1, and the flow
time from Point A to Point B through the street. According to the SCS upland method, the
conveyance parameter for the paved gutter flow is 20.0. The flow time from Subbasin 1 to Point
B is the sum of the time of concentration of Subbasin 1 and the flow time through the 500-foot
gutter as:
17.1901.02060
50015 =⋅⋅
+=iT minutes
At Point B, the design rainfall duration Td = max (T1, T2, T3) = 22 minutes.
The 10-year design rainfall intensity for Denver is:
( )01.3
221061.15.28
786.0 =+⋅
=I in/hr
The total effective area at Point B is:
2007-01 RO-35 Urban Drainage and Flood Control District

RUNOFF DRAINAGE CRITERIA MANUAL (V. 1)
565.50.565.00.255.050.181.0 =⋅+⋅+⋅=eA acres
The 10-year peak discharge is:
75.16== eIAQ cfs
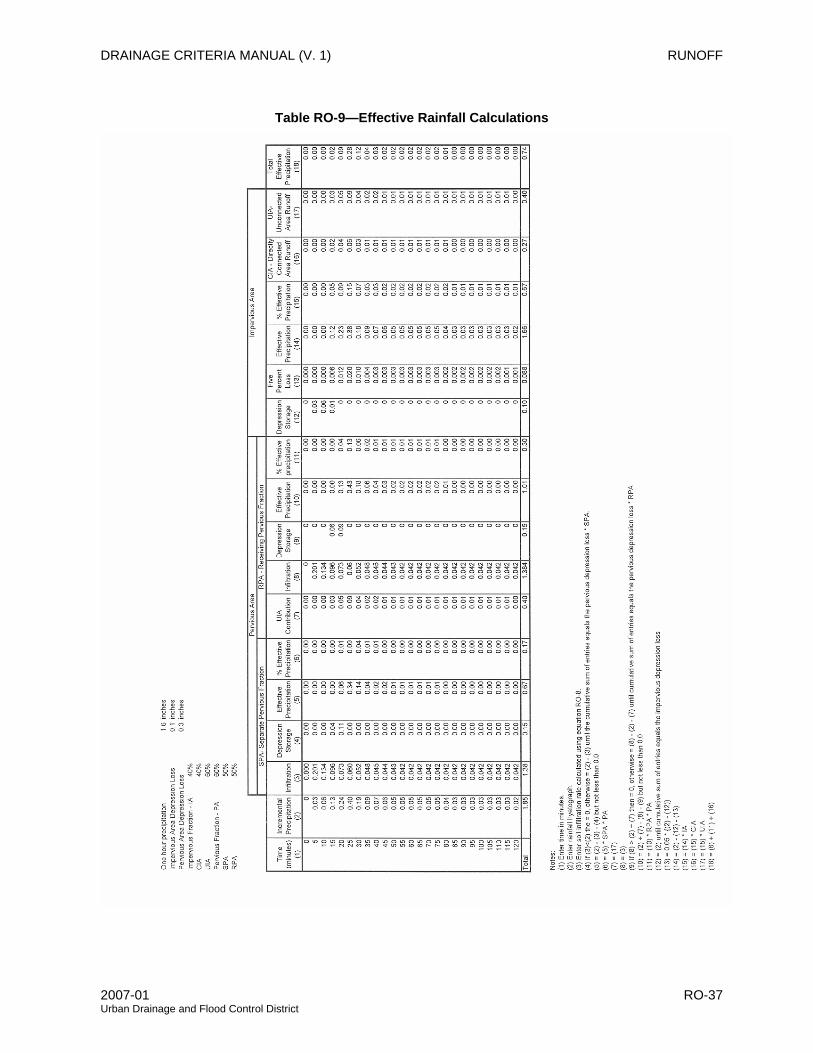
7.3 Effective Rainfall Example
Calculate the effective rainfall from a 1.6-inch storm for a catchment that is 40% impervious. Sixty
percent of the impervious area flows into pervious areas. Half of the pervious area receives flow from the
impervious area. The depression losses are 0.1 inches for impervious areas and 0.3 inches for pervious
areas.
Calculations are included in Table RO-9.
RO-36 2007-01 Urban Drainage and Flood Control District
DRAINAGE CRITERIA MANUAL (V. 1) RUNOFF
Table RO-9—Effective Rainfall Calculations
2007-01 RO-37 Urban Drainage and Flood Control District
RUNOFF DRAINAGE CRITERIA MANUAL (V. 1)
8.0 REFERENCES
Guo, J.C.Y. 1995. Storm Runoff Prediction Using the Computer Model RATIONAL. Denver, CO: Urban
Drainage and Flood Control District.
———. 1999. Streets Hydraulics and Inlet Sizing: Water Resources Publications, Littleton, CO.
Jarrett, R.D. 1984. Hydraulics of High-Gradient Streams. Journal of the Hydraulics Division
110(11)1519-1539.
———. 1985. Determination of Roughness Coefficients for Streams in Colorado. Water Resources
Investigation Report 85-4004. Denver, CO: U.S. Geological Survey.
Urban Drainage and Flood Control District. 2005. User Manual Colorado Urban Hydrograph Procedure
Computer Program—Excel-Based Computer Program (CUHP 2005). Denver, CO: UDFCD.
Urbonas, B., J.C.Y. Guo, and L.S. Tucker. 1990. Optimization Stormwater Quality Capture Volume. In
Urban Stormwater Quality Enhancement—Source Control, Retrofitting and Combined Sewer
Technology, ed. H.C. Torno, 94-110. New York: ASCE.
RO-38 2007-01 Urban Drainage and Flood Control District

DRAINAGE CRITERIA MANUAL (V. 1) RUNOFF
APPENDIX A - DETAILS OF THE COLORADO URBAN HYDROGRAPH PROCEDURE (CUHP)
For watersheds that are larger than 90 acres, the District recommends that the design storm runoff be
analyzed by deriving synthetic unit hydrographs. Sherman originally developed the unit hydrograph
principle in 1932. Snyder developed the synthetic unit hydrograph, which is used for analysis when there
are no rainfall-runoff data for the basin under study, as is often the case in the Denver region, in 1938.
The presentation given in this chapter is termed CUHP because coefficients and the form of the equation
are based upon data collected in the Denver region of Colorado and on studies conducted or financed by
the District. The U.S. Geological Survey (USGS) collected the data for use in the development of the
1982 version of CUHP between 1969 and 1981 under a cooperative agreement with the District. Data
collection activities are continuing under a similar cooperative agreement between the District and USGS;
however, the number of stations has been reduced. The goal of the currently ongoing data collection
effort is to develop a long-term database for further refinements to the hydrologic techniques in the
Denver region.
A.1 Definition
A unit hydrograph is defined as the hydrograph of one inch of direct runoff from the tributary area
resulting from a unit storm. The unit hydrograph thus represents the integrated effects of factors such as
tributary area, shape, street pattern, channel capacities, and street and land slopes.
The basic premise of the unit hydrograph is that individual hydrographs resulting from the successive
increments of rainfall excess that occur throughout a storm period will be proportional in discharge
throughout their runoff period. Thus, the hydrograph of total storm discharge is obtained by summing the
ordinates of the individual sub-hydrographs.
A.2 Basic Assumptions
The derivation and application of the unit hydrograph are based on the following assumptions:
1. The rainfall intensity is constant during the storm that produces the unit hydrograph.
2. The rainfall is uniformly distributed throughout the whole area of the watershed.
3. The time duration of the unit hydrograph resulting from an effective rainfall of unit duration is
constant.
4. The ordinates of the design runoff with a common unit time are directly proportional to the total
amount of direct runoff represented by each sub-hydrograph.
5. The effects of all physical characteristics of a given watershed, including shape, slope, detention,
2007-01 RO-39 Urban Drainage and Flood Control District

RUNOFF DRAINAGE CRITERIA MANUAL (V. 1)
infiltration, drainage pattern, channel storage, etc., are reflected in the shape of the unit
hydrograph for that watershed.
A.3 Equations
There are four basic equations used in defining the limits of the synthetic unit hydrograph. The first
equation defines the lag time of the basin in terms of time to peak, tp, which, for the CUHP method, is
defined as the time from the center of the unit duration storm to the peak of the unit hydrograph as shown
in Figure RO-A1.
Figure RO-A1—Example of Unit Hydrograph Shaping
RO-40 2007-01 Urban Drainage and Flood Control District

DRAINAGE CRITERIA MANUAL (V. 1) RUNOFF
48.0
⎟⎟⎠
⎞⎜⎜⎝
⎛=
SLL
Ct catp (RO-A1)
in which:
tp = time to peak of the unit hydrograph from midpoint of unit rainfall in hours
L = length along stream from study point to upstream limits of the basin in miles
Lca = length along stream from study point to a point along stream adjacent to the centroid of the
basin in miles
S = weighted average slope of basin along the stream to upstream limits of the basin in feet per
foot
Ct = coefficient reflecting time to peak
The time from the beginning of unit rainfall to the peak of the unit hydrograph is determined by:
upp ttT 5.060 += (RO-A2)
in which:
Tp = time from beginning of unit rainfall to peak of hydrograph in minutes
tu = time of unit rainfall duration in minutes
The unit peak of the unit hydrograph is defined by:
p
pp t
Cq
640= (RO-A3)
in which:
qp = peak rate of runoff in cfs per square mile
Cp = coefficient related to peak rate of runoff
Once qp is determined, the peak of the unit hydrograph for the basin is computed by:
AqQ pp = (RO-A4)
in which:
Qp = peak of the unit hydrograph in cfs
A = area of basin in square miles
2007-01 RO-41 Urban Drainage and Flood Control District

RUNOFF DRAINAGE CRITERIA MANUAL (V. 1)
A.4 Unit Storm Duration
For most urban studies, the unit storm duration, tu, should be 5 minutes. However, the unit duration may
be increased for larger watersheds. It is convenient to have the unit duration incremented in multiples of
5 minutes (i.e., 10 or 15 minutes) with the maximum unit duration recommended at 15 minutes.
An acceptable unit storm duration, whenever it is larger than 5 minutes, should not exceed one-third of tp.
As an example, if the watershed has a tp = 35 minutes, then an appropriate unit storm duration would be 5
minutes or 10 minutes (i.e., less than or equal to 1/3 tp).
A.5 Watershed Size Limits
The rainfall-runoff data used in the development of the current version of CUHP were obtained primarily
from small watersheds that ranged from 0.15 square miles to 3.08 square miles. Although some
extrapolation is justified, unlimited extrapolation of how the watershed responds to rainfall is not. It is
recommended that the maximum size of a watershed to be analyzed with a single unit hydrograph be
limited to 5 square miles. Whenever a larger watershed needs to be studied, it is suggested it be
subdivided into sub-watersheds of 5 square miles or less and individual sub-watershed storm
hydrographs be routed downstream using appropriate channel routing procedures such as SWMM. The
routed hydrographs then need to be added to develop a single composite storm hydrograph.
Because of the way a unit hydrograph responds, it is also suggested that the minimum watershed size be
90 acres. The 5-minute unit hydrograph procedure may be used for a smaller watershed provided tp is
greater than 10 minutes.
A.6 Watershed Shape Limits
The watershed shape can have a profound effect on the final results. It affects and suggested limitations
in the coding of individual watersheds is discussed in Pragraph 3.3.3 in the main body of this Runoff
Chapter.
A.7 Watershed Slope Limits and Considerations
The current version of CUHP was developed using data from watersheds having a range of major
drainageway slopes between 0.005 ft/ft and 0.037 ft/ft. Caution must be used when extrapolating beyond
this range.
A.7.1 Natural and Grass-Lined Waterways In natural and grass-lined drainageways, channels become unstable when a Froude Number of 1.0 is
approached. There are natural processes at work that limit the time to peak of a unit hydrograph as the
drainageway becomes steeper. To account for this phenomenon, it is recommended that the slope used
in Equation RO-9 for natural drainageways and existing manmade grass-lined channels be adjusted
RO-42 2007-01 Urban Drainage and Flood Control District

DRAINAGE CRITERIA MANUAL (V. 1) RUNOFF
using Figure RO-10.
A.7.2 Grass-Lined Channels Grass-lined channels designed and built using District criteria have a slope that limits maximum flow
velocities. A typical range in longitudinal slopes for such channels is 0.003 ft/ft to 0.006 ft/ft. It is
recommended that for preliminary estimating purposes a longitudinal slope of 0.005 ft/ft be used for
grass-lined channels that are to be designed using District criteria.
A.7.3 Riprap-Lined Channels The District’s criteria also limit the Froude Number to less than 0.8 for riprap-lined channels. For this
reason it is suggested that, for preliminary estimating purposes where riprap channels are contemplated,
a longitudinal slope of 0.01 be used with Figure RO-10. When a riprap channel is in existence, use the
measured average channel profile slope.
A.7.4 Concrete Channels and Storm Sewers In concrete-lined channels and buried conduits, the velocities can be very high. For this reason, it is
recommended that the average ground slope (i.e., not flow-line slope) be used where concrete-lined
channels and/or storm sewers dominate the watershed drainageways. There is no upper limit
recommended to the slope for such watersheds.
A.7.5 Weighted Watershed Slope Where the flow-line slope varies along the channel, calculate a weighted basin slope for use with
Equation RO-9. Do this by first segmenting the major drainageway path into reaches having similar
longitudinal slopes. Calculate the weighted slope using Equation RO-9.
A.8 Watershed Land Use Consideration
A lumped parameter model such as CUHP relies on data from watersheds having relatively uniform land
use. It is recommended that watersheds having zones of differing land use be subdivided into sub-
watersheds having relatively uniform land use. As an example, if the lower half of a watershed has been
urbanized and the upper half is to remain as open space, it is best to develop two distinct hydrographs.
The upper sub-watershed hydrograph will be based on the coefficients for undeveloped land, and the
lower sub-watershed hydrograph will be the result of coefficients for the developed area.
A.9 Determination of Ct and Cp Coefficients
2007-01 RO-43 Urban Drainage and Flood Control District

RUNOFF DRAINAGE CRITERIA MANUAL (V. 1)
The value of Ct in Equation RO-A1 may be determined using Figure RO-A2. Note that the curve in Figure
RO-A2 can be represented using parabolic equations having the percent imperviousness, Ia, as an
independent variable.
Figure RO-A2—Relationship Between Ct and Imperviousness
The value of Cp to be used in Equation RO-A3 may be determined using Figure RO-A3. The curve in
Figure RO-A3 is also represented with a parabolic equation. To determine Cp, first obtain the value of the
Peaking Parameter, P, from Figure RO-A3. Then calculate Cp using Equation RO-A5.
RO-44 2007-01 Urban Drainage and Flood Control District

DRAINAGE CRITERIA MANUAL (V. 1) RUNOFF
Figure RO-A3—Relationship Between Peaking Parameter and Imperviousness
15.0APCC tp = (RO-A5)
in which:
P = peaking parameter from Figure RO-A3
Ct = coefficient from Figure RO-A2
A = basin area in square miles
A.10 Unit Hydrograph Shape
The shape of the unit hydrograph is a function of the physical characteristics of the watershed. It
incorporates the effects of watershed size, shape, degree of development, slope, type, and size of
drainage system, soils, and many other watershed factors. The shape of the unit hydrograph is also
2007-01 RO-45 Urban Drainage and Flood Control District
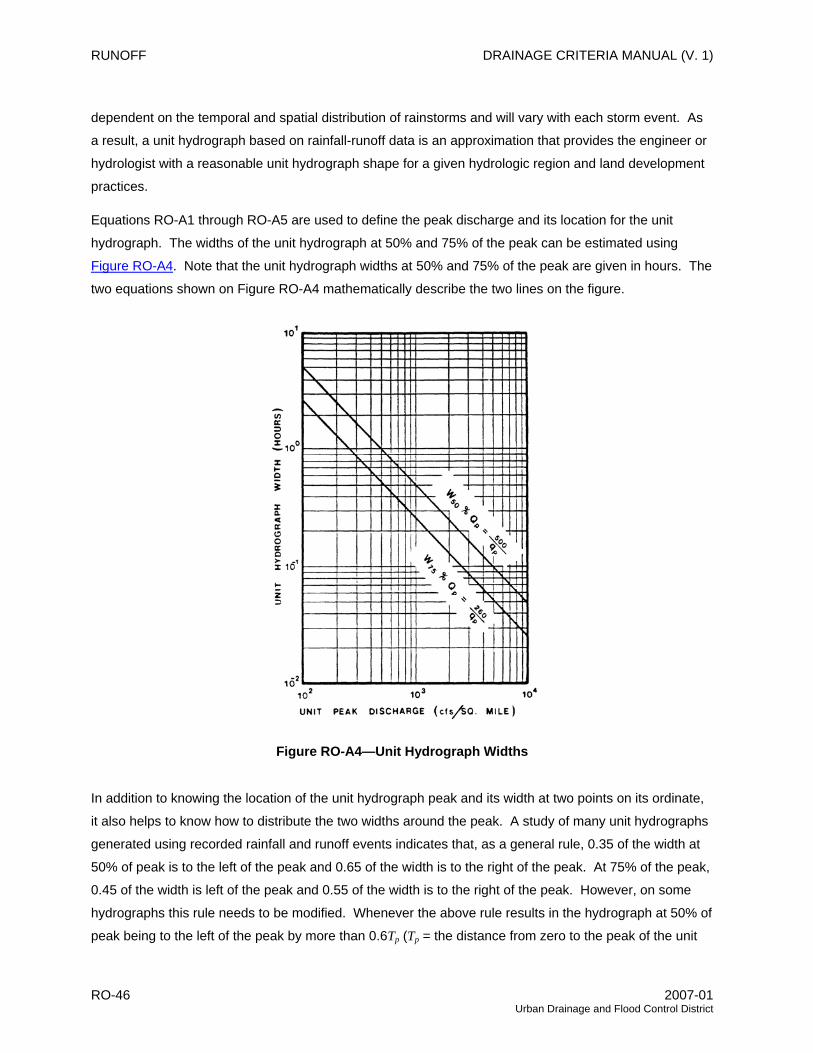
RUNOFF DRAINAGE CRITERIA MANUAL (V. 1)
dependent on the temporal and spatial distribution of rainstorms and will vary with each storm event. As
a result, a unit hydrograph based on rainfall-runoff data is an approximation that provides the engineer or
hydrologist with a reasonable unit hydrograph shape for a given hydrologic region and land development
practices.
Equations RO-A1 through RO-A5 are used to define the peak discharge and its location for the unit
hydrograph. The widths of the unit hydrograph at 50% and 75% of the peak can be estimated using
Figure RO-A4. Note that the unit hydrograph widths at 50% and 75% of the peak are given in hours. The
two equations shown on Figure RO-A4 mathematically describe the two lines on the figure.
Figure RO-A4—Unit Hydrograph Widths
In addition to knowing the location of the unit hydrograph peak and its width at two points on its ordinate,
it also helps to know how to distribute the two widths around the peak. A study of many unit hydrographs
generated using recorded rainfall and runoff events indicates that, as a general rule, 0.35 of the width at
50% of peak is to the left of the peak and 0.65 of the width is to the right of the peak. At 75% of the peak,
0.45 of the width is left of the peak and 0.55 of the width is to the right of the peak. However, on some
hydrographs this rule needs to be modified. Whenever the above rule results in the hydrograph at 50% of
peak being to the left of the peak by more than 0.6Tp (Tp = the distance from zero to the peak of the unit
RO-46 2007-01 Urban Drainage and Flood Control District
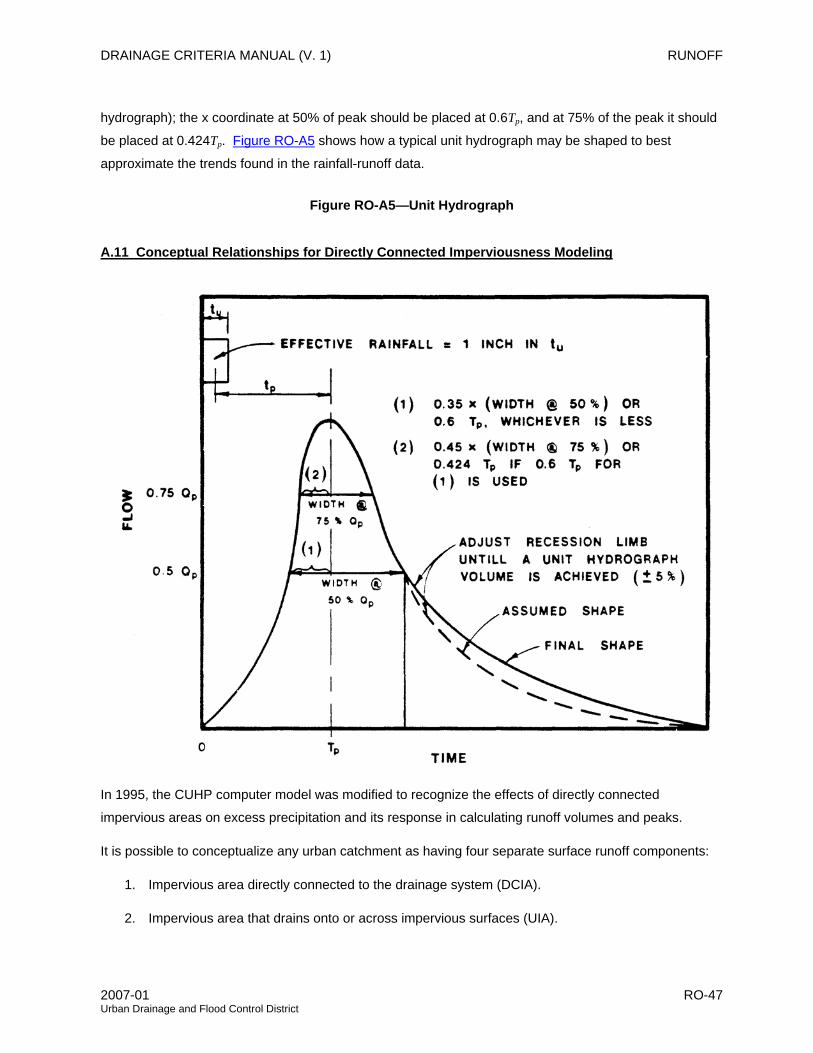
DRAINAGE CRITERIA MANUAL (V. 1) RUNOFF
hydrograph); the x coordinate at 50% of peak should be placed at 0.6Tp, and at 75% of the peak it should
be placed at 0.424Tp. Figure RO-A5 shows how a typical unit hydrograph may be shaped to best
approximate the trends found in the rainfall-runoff data.
Figure RO-A5—Unit Hydrograph
A.11 Conceptual Relationships for Directly Connected Imperviousness Modeling
In 1995, the CUHP computer model was modified to recognize the effects of directly connected
impervious areas on excess precipitation and its response in calculating runoff volumes and peaks.
It is possible to conceptualize any urban catchment as having four separate surface runoff components:
1. Impervious area directly connected to the drainage system (DCIA).
2. Impervious area that drains onto or across impervious surfaces (UIA).
2007-01 RO-47 Urban Drainage and Flood Control District
RUNOFF DRAINAGE CRITERIA MANUAL (V. 1)
3. The pervious area receiving runoff from impervious portions (RPA).
4. The separate pervious area (SPA) not receiving runoff from impervious surfaces.
This concept is illustrated in Figure RO-A6. To model the excess precipitation process and the losses to
it that occur within an urban catchment, the following variables were defined and used in the CUHPF/PC
version of the program:
IA = total impervious fraction
PA = total pervious fraction
PIA = effective precipitation from impervious fraction*
PPA = effective precipitation from impervious fraction*
CIA = directly (hydraulically) connected impervious fraction
ICIA = indirectly connected impervious area
UIA = unconnected impervious fraction
RPA = receiving pervious fraction
SPA = separate pervious fraction
D = CIA/IA, fraction of impervious area directly connected to drainage system
R = RPA/PA, fraction of pervious area receiving disconnected impervious runoff
K = UIA/RPA, the ratio of unconnected impervious area to pervious receiving area
* Effective precipitation before adjustment
RO-48 2007-01 Urban Drainage and Flood Control District

DRAINAGE CRITERIA MANUAL (V. 1) RUNOFF
Figure RO-A6—Runoff Flow Diagram for the CUHPF/PC Model
The CUHP model was modified in 1995 to account for the effects on runoff from impervious areas that
first travel over pervious areas before entering a drainageway. This was done to estimate the effects on
runoff rates and volumes of intentionally routing flow onto pervious areas. Based on field observations,
experience, and a lot of assumptions, a set of values was developed defining how much of the total
impervious area is likely to drain onto the catchment’s impervious area. Likewise, default estimates of
how much of the pervious area is likely to receive the “disconnected” impervious drainage were
developed. These were then incorporated as default values into the CUHPF/PC model. The flow chart
shown in Figure RO-A7 illustrates the concept in more detail.
The default relationships for D, the ratio of directly connected impervious area to the total impervious
area, and R, the ratio of pervious area receiving runoff from impervious areas to the total pervious area of
the catchment, as a function of the total impervious fraction used as default values in CUHPF are given in
Figure RO-A8 and Figure RO-A9. Level 1 of directly connected imperviousness (DCIA) assumes that all
roof gutters are disconnected form driveways, gutters and stormwater conveyance elements. All roof
drains are drained onto lawns. Level 2 of DCIA is for developments that already use Level 1 and do not
have any curbs and gutters, including concrete swale gutters. All runoff from streets and parking areas is
directed as sheet flow across grass surfaces. Intermittent curbs with frequent opening to the grass
surface qualifies as Level 2 DCIA.
2007-01 RO-49 Urban Drainage and Flood Control District
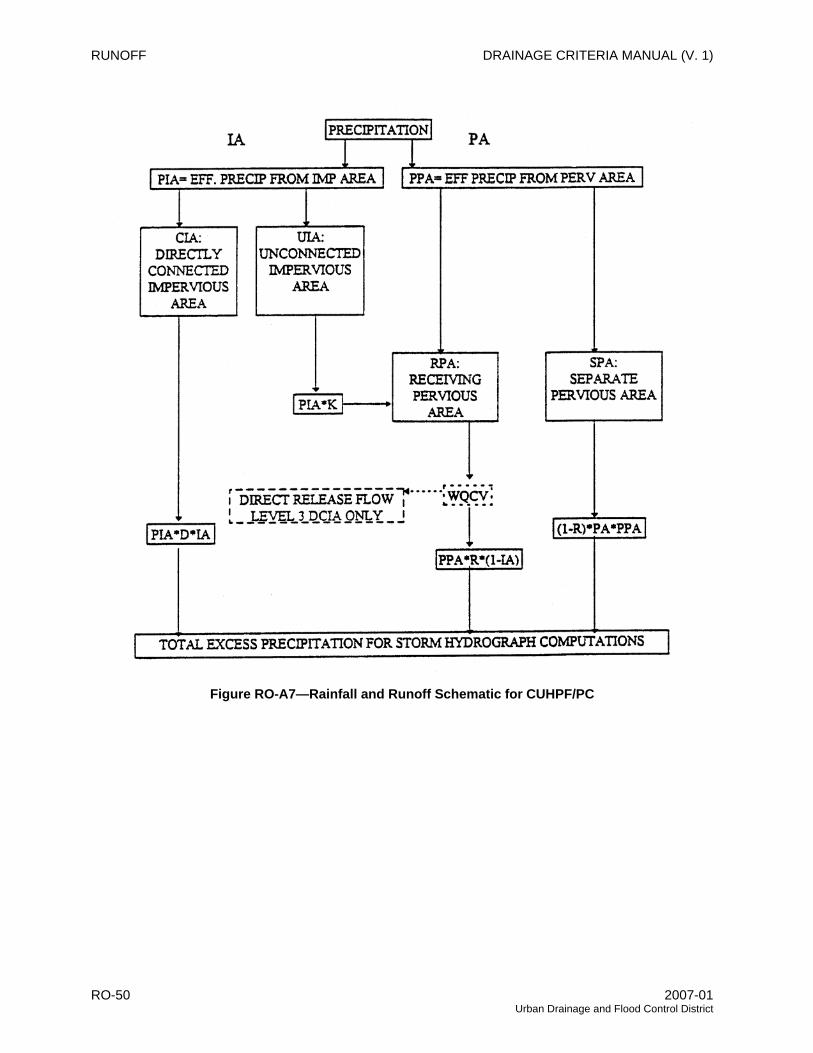
RUNOFF DRAINAGE CRITERIA MANUAL (V. 1)
Figure RO-A7—Rainfall and Runoff Schematic for CUHPF/PC
RO-50 2007-01 Urban Drainage and Flood Control District

DRAINAGE CRITERIA MANUAL (V. 1) RUNOFF
0
0.2
0.4
0.6
0.8
1
1.2
0 0.2 0.4 0.6 0.8 1 1
Impervious Fraction (IA = Perimp/100)
D =
(CIA
)/(IA
.2
)Std. Practice Level 1
Level 2
Figure RO-A8—Default Values for Directly Connected Impervious Fraction (D)
0
0.2
0.4
0.6
0.8
1
1.2
0 0.2 0.4 0.6 0.8 1 1.2
Impervious Fraction (IA = Perimp/100)
R =
(RP
A)/(
PA
)
Std. Practice
Level 1Level 2
Figure RO-A9—Default Values for Receiving Pervious Area Fraction (R)
The primary change from the earlier version of this software was in the setup and execution of the
Effective Rainfall worksheet. The calculations are done for each time increment, same as before, only
with the additional losses experienced within the receiving portion of the pervious area taken into account.
Whereas the old method was to simply multiply the effective precipitation, if any, by the percentage of the
impervious area (IA) and pervious area (PA) as appropriate, each of the four elements illustrated in
Figure RO-A7 are now taken into account. Pervious area calculations are segregated using (1-R) to
remove the RPA portion. The IA is multiplied by the effective precipitation for impervious area, PIA, and
2007-01 RO-51 Urban Drainage and Flood Control District

RUNOFF DRAINAGE CRITERIA MANUAL (V. 1)
the directly connected impervious area fraction, D, to find the excess precipitation from the hydraulically
connected fraction (CIA). The PIA is multiplied by (1-D)*IA to find the excess precipitation from the
unconnected impervious area, UIA, which is added to the incremental pervious area precipitation, PPA,
and R*PA to calculate the net water contributed to the receiving pervious area, RPA, during each time
step. The excess precipitation form the separate pervious area, SPA, is found by multiplying the
remaining fraction of pervious area, (1-R) by PA*PPA. The same values for retention/detention losses
are used for each pervious fraction, but they will obviously be filled at different rates. Finally, the sum of
the excess precipitations from SPA, CIA, and RPA become the total excess precipitation, sometimes
referred to as “effective rainfall.” All these calculations are illustrated in Table RO-9 in Section 7.3
Effective Rainfall Example.
UIA DCIA
RPA SPA
Excess Precipitation From UIA
UnitHydrograph
StormHydrograph
Figure RO-A10—Area and Runoff Diagram With Level 3 DCIA
The “effective” impervious area is determined using Figure ND-1 from the NEW DEVELOPMENT
PLANNING chapter of Volume 3 of this Manual. However, only 50% of the effects of the effective
imperviousness is used for Level 2 DCIA in adjusting lag time.
The user has the option of entering values to override the defaults. Any user-input values for D and R
must be accompanied by a specified level of DCIA (i.e., Level 1 or 2) for them to be considered. Note:
Since there are default values of D and R for “established practice,” the results of CUHP may be
somewhat different than from old versions of CUHP for the same catchment.
RO-52 2007-01 Urban Drainage and Flood Control District
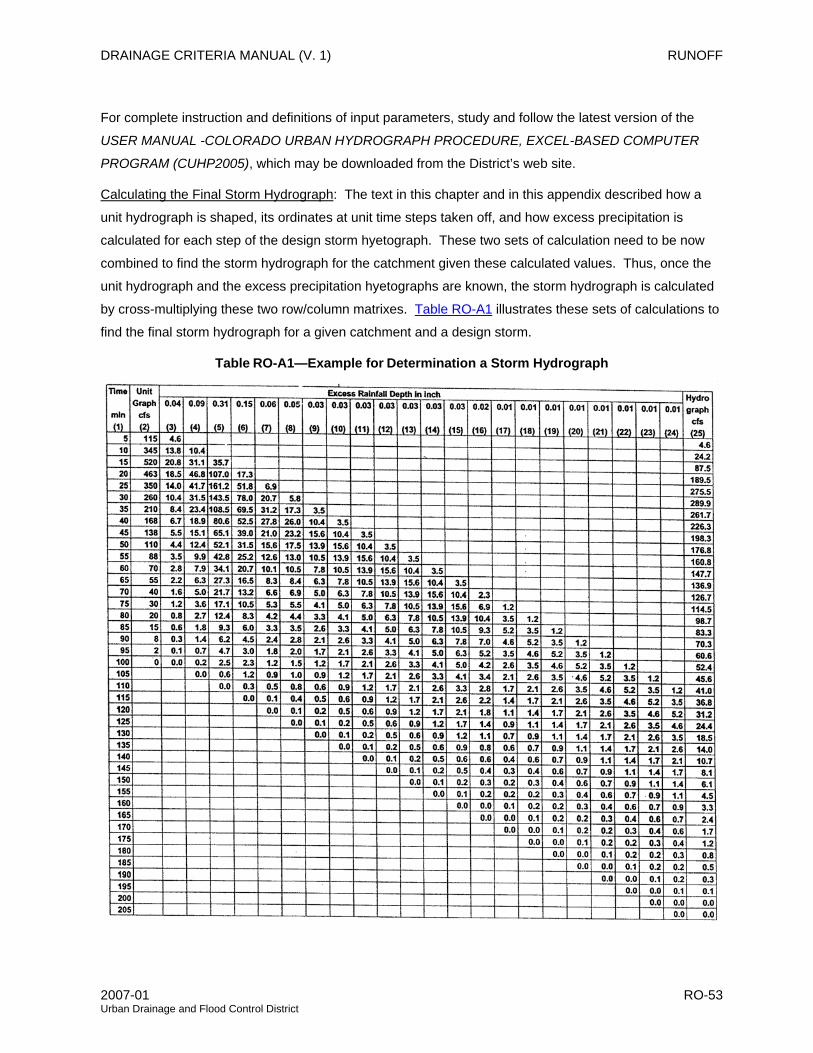
DRAINAGE CRITERIA MANUAL (V. 1) RUNOFF
For complete instruction and definitions of input parameters, study and follow the latest version of the
USER MANUAL -COLORADO URBAN HYDROGRAPH PROCEDURE, EXCEL-BASED COMPUTER
PROGRAM (CUHP2005), which may be downloaded from the District’s web site.
Calculating the Final Storm Hydrograph: The text in this chapter and in this appendix described how a
unit hydrograph is shaped, its ordinates at unit time steps taken off, and how excess precipitation is
calculated for each step of the design storm hyetograph. These two sets of calculation need to be now
combined to find the storm hydrograph for the catchment given these calculated values. Thus, once the
unit hydrograph and the excess precipitation hyetographs are known, the storm hydrograph is calculated
by cross-multiplying these two row/column matrixes. Table RO-A1 illustrates these sets of calculations to
find the final storm hydrograph for a given catchment and a design storm.
Table RO-A1—Example for Determination a Storm Hydrograph
2007-01 RO-53 Urban Drainage and Flood Control District

RUNOFF DRAINAGE CRITERIA MANUAL (V. 1)
A.15 Basis for the 1982 Version of the Colorado Urban Hydrograph Procedure
Rainfall and runoff data were collected by U.S. Geological Survey in the Denver metropolitan area since
1969 under a cooperative agreement with the Urban Drainage and Flood Control District. Analysis of this
data by the District staff began in earnest in 1977. Of the original thirty gaging stations, data from only
seven sites (nine different basin conditions) were used by the District to develop the 1982 version of the
Colorado Urban Hydrograph Procedure (CUHP). Data from other sites were also evaluated but were
determined not suitable for use due to various gaging problems and watershed definition problems.
Because the metropolitan area database lacked an undeveloped watershed, data from a small watershed
(Kiowa Creek Tributary at Elbert) recoded by USGS for the Colorado Highway Department was used.
Peak flows from each recorded hydrograph at all test sites were compared with the calculated peak flows
using the 1982 version of CUHP. These comparisons are plotted in Figure RO-A12 and substantiate the
validity of the CUHP procedure.
Those wishing to compare the older version (i.e., pre 1982) of the CUHP with the new version will find
that the new unit hydrograph have a significantly shorter time to peak. This is particularly true for smaller
urbanized catchments. However, the new version will often produce peak flow results comparable to
those obtained using the old version over a wide range of watershed conditions that are typically used in
drainage studies in the Denver Metropolitan Area.
RO-54 2007-01 Urban Drainage and Flood Control District
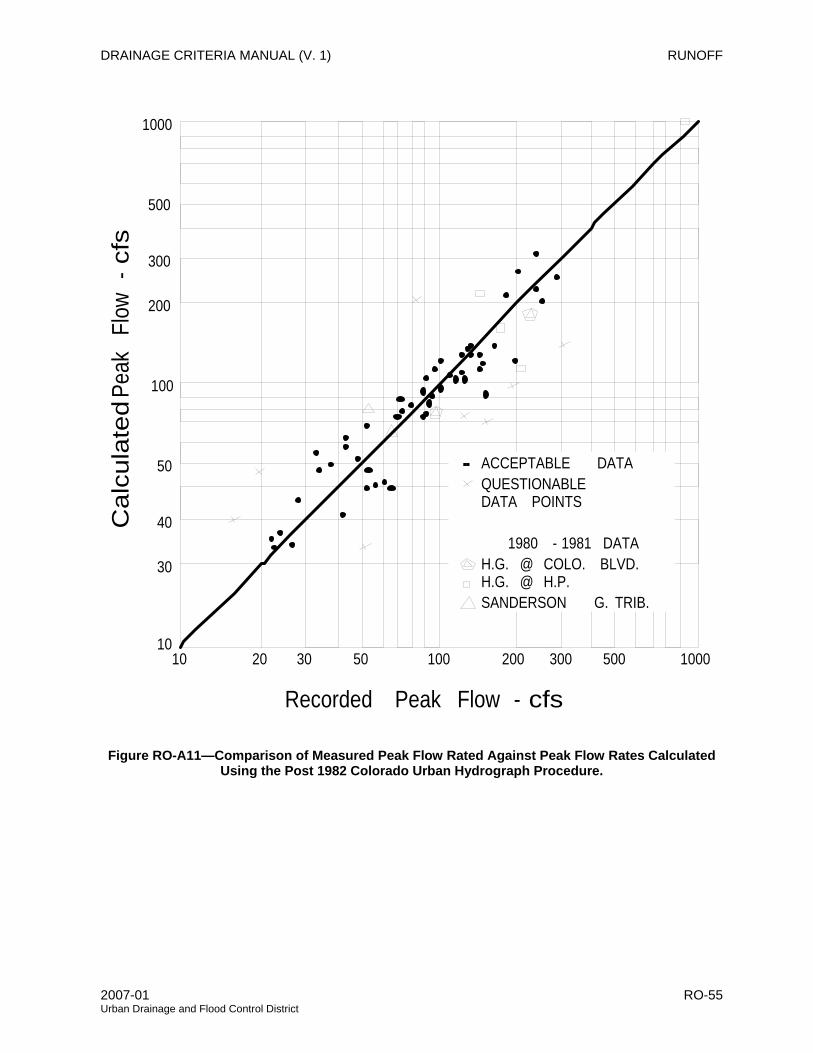
DRAINAGE CRITERIA MANUAL (V. 1) RUNOFF
10
30
40
50
100
200
300
500
1000
10 20 30 50 100 200 300 500 1000
Recorded Peak Flow - cfs
cfs
- Fl
ow
Peak
C
alcu
late
d
ACCEPTABLE DATAQUESTIONABLEDATA POINTS
1980 - 1981 DATAH.G. @ COLO. BLVD.H.G. @ H.P.SANDERSON G. TRIB.
Figure RO-A11—Comparison of Measured Peak Flow Rated Against Peak Flow Rates Calculated Using the Post 1982 Colorado Urban Hydrograph Procedure.
2007-01 RO-55 Urban Drainage and Flood Control District
Related Documents


![Hydrographs[Date] Today I will: - Be able to construct and understand flood hydrographs](https://static.cupdf.com/doc/110x72/56813b43550346895da41aa0/hydrographsdate-today-i-will-be-able-to-construct-and-understand-flood.jpg)