1 Running Head: Reliability and validity of the TSIA The Dutch Language Version of the Toronto Structured Interview for Alexithymia: Reliability, Factor Structure and Concurrent Validity. Ruth Inslegers a , Reitske Meganck a , Els Ooms a, Stijn Vanheule a , Graeme J. Taylor b , R. Michael Bagby c,d , Filip De Fruyt e , Mattias Desmet a a Department of Psychoanalysis and Clinical Consulting, Ghent University, H. Dunantlaan 2, B-9000 Ghent, Belgium b Departments of Psychiatry, University of Toronto and Mount Sinai Hospital, Toronto, Ontario, M5G1X5 Canada c Departments of Psychology and Psychiatry, University of Toronto, Toronto, Ontario, M5T1R8 Canada d Centre for Addiction and Mental Health, Toronto, Ontario, M5T1R8 Canada e Department of Developmental, Personality and Social Psychology, Ghent University, H. Dunantlaan 2, B-9000 Ghent, Belgium Correspondence: Ruth Inslegers, Ghent University, Department of Psychoanalysis and Clinical Consulting, H. Dunantlaan 2, B-9000 Ghent, Belgium. Tel: (0032) (0)9/2648696. E-mail: [email protected]

Welcome message from author
This document is posted to help you gain knowledge. Please leave a comment to let me know what you think about it! Share it to your friends and learn new things together.
Transcript

1
Running Head: Reliability and validity of the TSIA
The Dutch Language Version of the Toronto Structured Interview for Alexithymia:
Reliability, Factor Structure and Concurrent Validity.
Ruth Inslegersa, Reitske Megancka, Els Oomsa, Stijn Vanheulea, Graeme J. Taylorb , R.
Michael Bagbyc,d, Filip De Fruyte, Mattias Desmeta
a Department of Psychoanalysis and Clinical Consulting, Ghent University, H. Dunantlaan 2,
B-9000 Ghent, Belgium
bDepartments of Psychiatry, University of Toronto and Mount Sinai Hospital, Toronto,
Ontario, M5G1X5 Canada
cDepartments of Psychology and Psychiatry, University of Toronto, Toronto, Ontario,
M5T1R8 Canada
dCentre for Addiction and Mental Health, Toronto, Ontario, M5T1R8 Canada
e Department of Developmental, Personality and Social Psychology, Ghent University,
H. Dunantlaan 2, B-9000 Ghent, Belgium
Correspondence: Ruth Inslegers, Ghent University, Department of Psychoanalysis and
Clinical Consulting, H. Dunantlaan 2, B-9000 Ghent, Belgium. Tel: (0032) (0)9/2648696.
E-mail: [email protected]
2
Abstract
The aim of this study was to evaluate the psychometric properties of the Dutch version of the
Toronto Structured Interview for Alexithymia (TSIA) in a clinical sample. The TSIA and the
20-item Toronto Alexithymia Scale (TAS-20) were administered to 85 psychiatric inpatients
and to 76 medical outpatients with the symptom of tinnitus. Both internal and inter-rater
reliability were acceptable. Confirmatory factor analyses supported the hierarchical, 4-factor
structure with 4 lower-order factors nested within 2 higher-order latent factors, previously
obtained with English, German, and Italian versions. Concurrent validity was supported by
significant correlations between the TSIA and the TAS-20 total scores although there were
some differences between the psychiatric subsample and the medical subsample. While
further studies are needed to assess the convergent and discriminant validity of the TSIA, the
results support its use as a measure of alexithymia.
3
1. Introduction
The alexithymia construct was formulated by Nemiah and Sifneos (1970; Nemiah,
Freyberger, & Sifneos, 1976) on the basis of clinical observations on patients with classic
psychosomatic diseases. Many of these patients manifested “a striking incapacity for the
verbal description and expression of feelings”, and their associations and thoughts referred “to
external events and actions rather than to internal fantasies” (Nemiah & Sifneos, 1970, p.
159). The current conceptualization of alexithymia is that the construct consists of four
interrelated facets: (1) difficulty identifying feelings and distinguishing between feelings and
the bodily sensations of emotional arousal; (2) difficulty describing feelings to other people;
(3) restricted imaginal processes; and (4) a stimulus-bound, externally oriented cognitive style
(Taylor, Bagby, & Parker, 1997).
Numerous studies have shown that alexithymia is associated with a variety of medical and
psychiatric disorders including substance use disorders (e.g., Haviland, Hendryx, Shaw, &
Henry, 1994), eating disorders (e.g., Taylor, Parker, Bagby, & Bourke, 1996), posttraumatic
stress disorder (e.g., Frewen et al., 2008), somatisation disorders (e.g., De Gucht & Heiser,
2003), functional gastrointestinal disorders (Porcelli, Taylor, Bagby, & De Carne, 1999), and
a subtype of depression characterized by more somatic-affective symptoms (Vanheule,
Desmet, Verhaeghe, & Bogaerts, 2007) (for an overview see Taylor et al., 1997; Taylor,
2004). In most studies alexithymia was measured with the 20-item Toronto Alexithymia Scale
(TAS-20; Bagby, Parker, & Taylor, 1994; Bagby, Taylor, & Parker, 1994). This self-report
scale assesses three salient facets of the alexithymia construct: difficulty identifying feelings
(DIF), difficulty describing feelings to others (DDF), and externally oriented thinking (EOT).
The TAS-20 does not have an imaginal processing factor scale as it was noted, during the
development of the scale, that items for assessing reduced imaginal activity were confounded
by a social desirability response bias and had low magnitude corrected item-total correlations

4
with the full scale (Bagby, Parker et al., 1994). There is some evidence, however, that this
facet of the construct is assessed indirectly by the EOT factor scale (Bagby, Taylor et al.,
1994). A number of investigations with diverse cultures, most of which used different
translations of the TAS-20, have judged the psychometric properties of the scale to be
adequate (e.g., Taylor, Bagby, & Parker, 2003; Tsaousis et al., 2010; Zhu et al., 2007).
However, several authors have drawn attention to potential limitations when relying on self-
report scales to measure alexithymia. Waller and Scheidt (2004) point to the problem of
asking persons with alexithymia to judge a capacity they may lack. Other authors have argued
that negative affectivity may influence respondents’ answers to TAS-20 questions, especially
on the DIF and DDF factor scales (Lumley, 2000), or have discussed the possibility that the
TAS-20 total score primarily assesses general psychological distress (Leising, Grande, &
Faber, 2009). Several studies, however, have demonstrated relative stability of TAS-20
scores, even though the scores may show some variation in response to negative affective
states (e.g., Luminet, Bagby, & Taylor, 2001).
In general, a multi-method approach is recommended in psychology research (see Eid &
Diener, 2006; Meyer et al., 2001). Accordingly, the original authors of the TAS-20, as well as
several other authors, recommend the use of different measures for assessing alexithymia
(Taylor & Bagby, 2004) and to this end developed the Toronto Structured Interview for
Alexithymia (TSIA; Bagby, Taylor, Parker, & Dickens, 2006). Although much of the item
content of the TSIA is comparable with that of the TAS-20, the method of administration
requires that the interviewer request examples to clarify the responses to each item, and to
also feel free to ask for clarifications. In this way, the TSIA surmounts some of the potential
limitations of the self-report TAS-20.
Results from the initial validation process demonstrated that the original English-language
version of the TSIA had acceptable inter-rater, internal, and retest reliability as well as

5
concurrent validity in Canadian community and psychiatric outpatient samples (Bagby et al.,
2006). Comparable results were obtained in investigations with German and Italian language
translations of the TSIA (Caretti et al., 2011; Grabe et al., 2009). With the English, German,
and Italian language versions, confirmatory factor analyses supported a hierarchical, four-
factor structure of the TSIA with four lower order factors [difficulty identifying feelings
(DIF), difficulty describing feelings (DDF), externally oriented thinking (EOT), and imaginal
processes (IMP)] nested within two higher-order latent factors [affect awareness (AA)
containing DIF and DDF, and operative thinking (OT) containing EOT and IMP], although
the difference with other models (especially a non-hierarchical four-factor model) was
sometimes small.
There is a considerable amount of alexithymia research in Dutch-speaking countries in
medical and psychiatric patient populations using self-report alexithymia scales (e.g.,
Kooiman et al., 2004; Vanheule et al., 2007, Wingbermühle, Egger, Verhoeven, van der Burgt,
& Kessels, 2012). Moreover, a Dutch study in a clinical population is the first - to our
knowledge - that examined the convergence between more than two alexithymia measures
simultaneously (Meganck, Inslegers, Vanheule, & Desmet, 2011). In this study an exploratory
factor analysis was conducted of the subscales of four alexithymia measures [TAS-20, TSIA,
Observer Alexithymia Scale (OAS; Haviland, Warren, & Riggs, 2000), modified Beth Israel
Hospital Psychosomatic Questionnaire (mBIQ; Bagby, Taylor, et al., 1994)] and four facets of
the alexithymia construct rated by the treating psychologist. The results of the EFA supported
a three-factor structure (factor 1: significant factor loadings of the TAS-20 subscales, the
TSIA subscales, and mBIQ subscales, except for TAS-DIF and TSIA-IMP; factor 2: three
OAS subscales and all alexithymia facets rated by the psychologist; and factor 3: the
somatising subscale of the OAS). The loadings on the first two factors indicated that these
different methods for assessing alexithymia did not tap into one underlying alexithymia

6
construct but were substantially related to each other, whereas the third factor was composed
only of the somatising subscale of the OAS and was unrelated to the other two factors. The
results for the first two factors might reflect the influence of shared method variance since
there were very high correlations between the interviewer scored TSIA and mBIQ on the
one hand and the psychologist scored OAS and alexithymia dimensions on the other
hand. Although a one-factor solution was not indicated, the TSIA, mBIQ, and the
alexithymia facets scored by the psychologists showed the highest loadings.
Consequently, the authors suggested that the TSIA, given the more formalized and less
time consuming administration compared to the mBIQ, might be the best choice that is
currently available to measure alexithymia. Until now, however, no study has examined the
factorial validity and reliability of the Dutch version of the TSIA.
The aim of the current study was to investigate the factor structure, reliability, and
concurrent validity of the TSIA in a clinical sample composed of psychiatric inpatients and
medical outpatients. The medical patients were all suffering from the symptom of tinnitus and
were being investigated in a separate larger study. The symptom of tinnitus is described as a
phantom auditory perception (Jastreboff, 1990) and its prevalence in the general population is
10-15% (Davis & Rafaie, 2000). Research suggests that psychological factors play an
important role in the subjective experience of tinnitus. For example, Folmer, Griest, Meikle,
and Martin (1999) found that the loudness and pitch of tinnitus were similar in patient groups
with great annoyance of tinnitus and those without annoyance. Furthermore, a recent study
confirmed the lack of a relationship between psychoacoustic measures of tinnitus symptoms
and experienced tinnitus severity. Moreover, anxiety was found to be an important variable
for understanding the differences in subjective tinnitus (Ooms et al., 2011). To our knowledge
the only study that has investigated the association between alexithymia and tinnitus was with
a community sample of elderly people in Finland; about 25% of individuals with the symptom

7
of tinnitus scored in the high range of the TAS-20 compared with 15% of individuals without
tinnitus who scored in the high range (Salonen, Johansson, & Joukamaa, 2007). These
findings are comparable to reports from studies in which 27% of psychiatric inpatients in
Germany scored in the high range for alexithymia (Grabe et al., 2008), and about 10% of
people in large community samples in Finland and Germany scored in the high range for
alexithymia (Franz et al., 2007; Honkalampi et al., 2001). A higher rate of 55% has been
reported among Italian patients with essential hypertension (Todarello, Taylor, Parker, &
Fanelli, 1995), which is the diagnosis of all of the patients in the medical sample used to
validate the Italian version of the TSIA (Caretti et al., 2011). Based on these observations,
and because we wanted to increase the variability of TSIA scores across the various analyses,
we chose to investigate medical and psychiatric patient samples rather than community and
student samples. We anticipated that the patients with tinnitus would have lower alexithymia
scores than the hypertensive patients in the Italian validation study, but expected their
alexithymia scores to be comparable to the scores of the psychiatric patients and the scores of
the psychiatric samples in the Canadian, German, and Italian validation studies. Given the
frequent problems with affect awareness and affect regulation among medical and psychiatric
patients, and the possible limitations of self-report scales for assessing a capacity people may
lack, we consider it important to further investigate the psychometric properties of the TSIA.
In the current study we attempted to replicate previous validation studies for the original
English language TSIA and the German and Italian translations (Bagby et al., 2006; Caretti et
al., 2011; Grabe et al., 2009). Following these studies, we evaluated the factorial validity,
internal reliability, inter-rater reliability, and concurrent validity of the Dutch version of the
TSIA. Whereas these evaluations were conducted on a sample of psychiatric inpatients and
outpatients for the German version of the TSIA, and on a mixed sample comprised of medical
and psychiatric outpatients and healthy individuals for the Italian version, we examined the

8
factorial validity and internal reliability in the combined sample of psychiatric inpatients and
medical outpatients with the symptom of tinnitus, and the inter-rater reliability in a smaller
randomly selected subsample of the psychiatric inpatients. The concurrent validity of the
TSIA was evaluated by investigating its relations with the TAS-20 for the combined sample
and, in contrast to the study by Caretti et al. (2011), also separately for the psychiatric and
medical subsamples
2. Method
2.1. Instruments
The Toronto Structured Interview for Alexithymia (TSIA; Bagby et al., 2006) is
composed of 24 questions addressing the four facets of the alexithymia construct. Each
question is scored on a Likert scale from zero to two. For some items the scoring is based on
the frequency of the presence of a characteristic, and for other items it is based on the degree
of the presence of a characteristic. For each question there is a set of prompts and probes to
elicit information to assist in the accurate scoring of the item. In general a score of ‘0’ is
assigned if the characteristic is never or rarely present, or is not a feature of the respondent. A
score of ‘1’ is given when a characteristic is present some of the time or is a partial feature of
the respondent. A score of ‘2’ is assigned if a characteristic is present most of the time or is a
strong feature of the respondent. Higher scores indicate a greater degree of alexithymia. Total
scores range from 0 to 48. The interviews last between 30 and 45 minutes. The same set of
questions and prompts and probes of the original English language version was translated into
Dutch by means of a translation and back-translation procedure in consultation with two of
the authors of the English language version of the instrument.
The 20-item Toronto Alexithymia Scale (TAS-20; Bagby, Parker et al., 1994; Bagby,
Taylor, et al., 1994) consists of three factor scales: difficulty identifying feelings (DIF),

9
difficulty describing feelings (DDF), and externally oriented thinking (EOT). Each item is
rated on a five-point Likert scale ranging from 1 (strongly disagree) to 5 (strongly agree).
Total scores range from 20 to 100, with higher scores indicating a greater degree of
alexithymia. The Dutch version of the TAS-20 was developed using a translation and back-
translation procedure (Kooiman, Spinhoven, & Trijsburg, 2002); its psychometric properties
were found to be adequate in clinical and nonclinical samples (Kooiman et al., 2002;
Meganck, Vanheule, & Desmet, 2008). For example, Meganck et al. (2008) replicated the
three-factor structure and reported internal reliability coefficients that exceeded .70 for the
total TAS-20 and the DIF and DDF factors in both student and psychiatric outpatient samples;
however, as with several other translations of the TAS-20 (Taylor et al., 2003), Cronbach
alpha coefficients were rather low for the EOT factor (.56 in the psychiatric sample and .53 in
the student sample). Kooiman et al. (2002) demonstrated that the TAS-20 discriminates well
between psychiatric patients and adult non-patients, and has excellent three month retest
reliability (r =.74).
2.2. Participants
The sample was composed of 161 patients (81 women, 80 men) who were recruited from
hospitals in the Dutch-speaking region of Belgium. Patients received written and oral
information about the study and were invited to participate by their treating psychologist or
doctor. The mean age of the participants was 43.65 years (SD = 13.38). Overall, 13.7% of the
participants attended elementary school only; 18% completed a first cycle (3 years) and
39.8% a second cycle (6 years) in high school; 21.1% obtained a non-academic degree in
higher education and 7.5% an academic degree. Eighty-five of these 161 patients (52.8%)
were psychiatric inpatients with a mood and/or anxiety disorder. The mean age of the
psychiatric patients was 39.9 years (SD = 12.26) and 62.4% were women. These patients were

10
recruited from admission wards at five psychiatric hospitals. Psychotic patients and patients
hospitalised primarily for substance abuse were excluded. Thirty one percent of the
psychiatric patients had a comorbid personality disorder (PD) -- avoidant PD (11.8%),
obsessive compulsive PD (7%), borderline PD (5.9%), depressive PD (4.7%), passive-
aggressive PD (3.5%), PD not otherwise specified (3.5%), paranoid PD (1.2%) and
schizotypal PD (1.2%). Features of a PD were absent in 46 % of the patients, but diagnosis
was deferred for the remaining 23 % of the patients. Of the total sample of 161 patients, 76
(47.2%) were medical outpatients suffering from chronic tinnitus. The mean age of the
medical patients was 47.82 years (SD = 13.42) and 36.8% were women. The patients with
tinnitus were recruited from the Ear, Nose and Throat Department of the Ghent University
Hospital. All of these patients had an ear, nose and throat examination and an assessment by
an audiologist; for none of the patients was tinnitus a manifestation of another medical
condition. The average duration of tinnitus was 41.5 (SD = 56.11) months. At the time of the
investigation, 10.5% of these patients were receiving psychological counselling for tinnitus
related problems; 18.5 % had received psychological counselling in the past. Each of the 161
participants received information about the study and gave informed consent. The study was
approved by the Ethics Review Board of the Faculty of Psychology and Educational Sciences,
Ghent University.
2.3. Procedure
All participants completed a demographic information questionnaire and the TAS-20
before the TSIA was administered. One week after the TAS-20 was administered, the TSIA
interviews were conducted by three clinician/researchers at Ghent University (two for the
psychiatric sample and one for the medical sample); they were masked with respect to the
TAS-20 scores. The three interviewers were trained in the administration of the TSIA by

11
studying a manual, which provides guidelines for the administration and scoring of the TSIA
(Bagby, Taylor, Dickens, & Parker, unpublished manual, 2009), and through discussion,
based on scored interviews, of the scoring rules with the original authors. All interviews were
audio-recorded. To examine inter-rater reliability, 40 audio-recordings of TSIA
administration interviews were randomly selected from the psychiatric sample. Each of the
two interviewers for the psychiatric sample rated the audio-recordings of the 20 TSIAs
administered by the other interviewer. The inter-rater reliability was calculated on these data.
2.4. Statistical analysis
The internal consistency of the TSIA was evaluated using Cronbach’s alpha and mean
inter-item correlations (MIC). Cronbach alpha coefficients are considered good if greater than
.80, acceptable from .70 to .79, marginal from .60 to .69, and poor if less than .60 (Barker,
Pistrang, & Elliott, 2002). The optimal range for the MIC is .20 to .40 (Briggs & Cheek,
1986; Nunnally & Bernstein, 1994). Estimates of inter-rater reliability were calculated for the
TSIA total score and for the 2 domain and 4 facet scales.1
The factorial validity of the TSIA was tested in the combined sample (N = 161) using
confirmatory factor analysis (CFA) of the covariance matrices with Lisrel 8.7 (Jöreskog &
Sörbom, 1993). Goodness-of-fit (GOF) was assessed using the following GOF indices: the
χ²/df ratio, with values of 2 or less indicating a good fit; the comparative fit index (CFI), with
values greater than .90 indicating acceptable fit; the standardized root mean square residual
(SRMS), for which a cut-off value of .08 or less is recommended; and the root mean square
Intra-class correlation coefficients
(ICC) were used to assess the level of agreement between pairs of raters. ICCs are considered
excellent if greater than .74, good from .60 to .74, fair from .40 to .59, and poor if less than
.40 (Landis & Koch, 1977).
1 Although the subscales of the TSIA are factor scales that assess the 2 domains and 4 facets of the alexithymia construct, we refer to them as domain and facet scales to be consistent with other authors and to avoid confusion with the TAS-20 factor scales.

12
error of approximation (RMSEA), with values less than .06 indicating acceptable fit, and
higher boundary of RMSEA 90% confidence interval less than .08 (Browne & Cudeck, 1993;
Hu & Bentler, 1999; Jöreskog & Sörbom, 1993). Following the validation procedure for the
original English language TSIA (Bagby et al., 2006) and the German and Italian translations
of the instrument (Caretti et al., 2011; Grabe et al., 2009), we tested eight models in the
combined sample (the models are described in Table 4).
The Akaike information criterion (AIC) and the Expected Cross Validation Index
(ECVI) were used to compare the models that provided adequate fit in our study. The AIC
and ECVI give advantage to more parsimonious models (more degrees of freedom), and the
model with the lowest values for the AIC and ECVI is considered best when comparing
models (Burnham & Anderson, 2004; Tanaka, 1993).
Measurement invariance of the model with the best fit was investigated to exclude the
possibility that the factor structure would be different in the psychiatric and medical samples.
For this purpose we explored three different measurement models using multi-group CFA: an
unconstrained congeneric model H0 in which only the same pattern of loadings is assumed; a
tau-equivalent model H1 in which equal factor loadings are assumed, but in which the error
terms can differ; and finally a parallel model H2 in which equal factor loadings and equal
error terms are assumed (Byrne, 1998). The congeneric model H0 was evaluated by estimating
the baseline model simultaneously in both samples. If the fit of the tau-equivalent model was
worse (a significant result of the chi-square difference statistic and a difference larger than .01
of the CFI value) than the fit of the congeneric model, one can conclude that all the factor
loadings may not be equal. If the fit of the parallel model was significantly worse than the fit
of the tau-equivalent model, one can conclude that the error terms may not be equal.
Concurrent validity was examined using Pearson correlations between TSIA total,
domain, and facet scale scores and TAS-20 total and factor scale scores in the combined

13
sample and separately in the medical and psychiatric samples. Values of .10, .30, and .50
correspond to small, medium and large effects, respectively (Cohen, 1988).
3. Results
3.1. Descriptive statistics
The mean scores and standard deviations for the TSIA and its domain and facet scales
and for the TAS-20 and its factor scales are shown in Table 1 for the total sample and for the
psychiatric and medical samples separately. Also shown are Cohen’s d effect sizes for the
differences between the Dutch TSIA mean scores and the mean TSIA scores that have been
reported for Canadian, German, and Italian clinical samples. While there were no differences
between our psychiatric sample and the Canadian psychiatric sample, there were two
differences (small effect sizes for the AA domain scale and the DIF facet scale) between the
mean scores of our psychiatric sample and the mean scores of the German psychiatric sample.
However, the mean TSIA scores in the Italian psychiatric and medical samples were
significantly higher (medium to large effect sizes) for the total TSIA and for most of the
domain and facet scales. For the combined sample the mean total scores were 20.37 for the
TSIA and 54.90 for the TAS-20. The mean TSIA total scores for the psychiatric and medical
samples were not significantly different, t(159) = 0.51; p = .61; d = .04. The mean TAS-20
score for the psychiatric sample was significantly higher than the mean TAS-20 score for the
medical sample, t(156) = 6.30; p < .01; d = .45. At the subscale level, for the TSIA only the
IMP facet scale was significantly higher in the psychiatric sample, t(159) = 7.59; p < .01; d =
.39. For the TAS-20, both the DIF subscale [t(156) = 6.54; p < .01; d = 1.04.] and the DDF
subscale [t(156) = 5.38; p < .01; d = .87.] were higher in the psychiatric sample.
3.2. Reliability
14
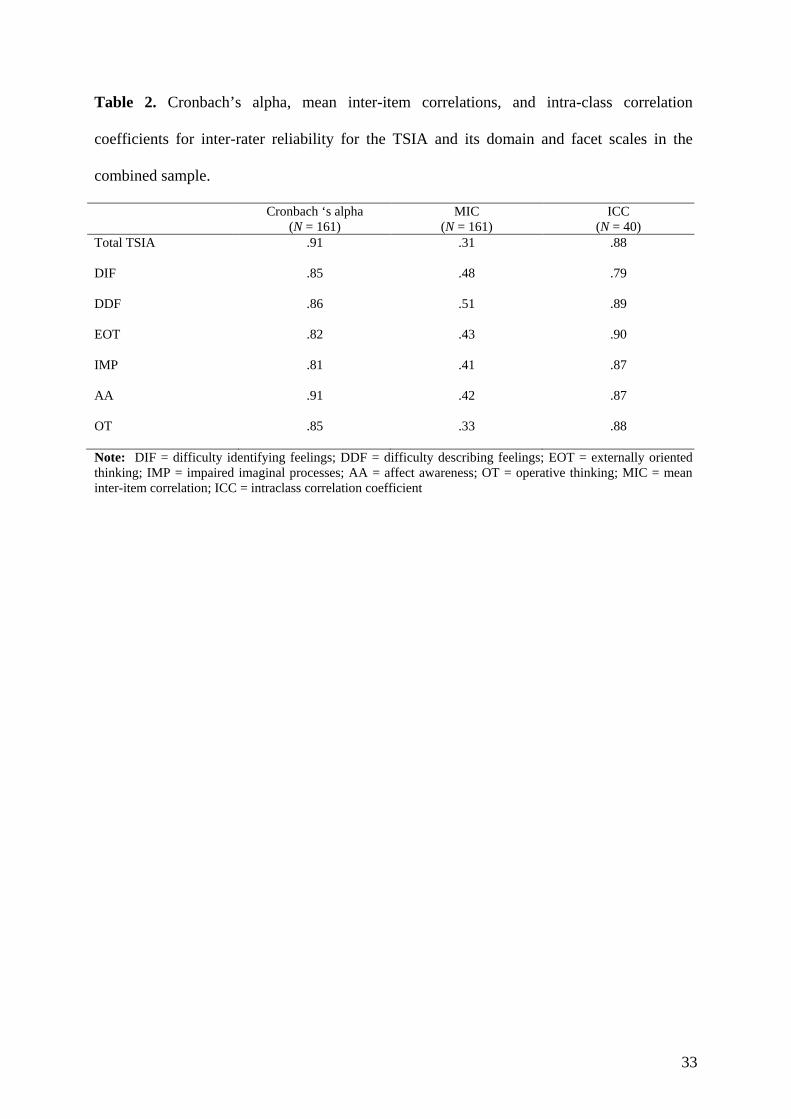
Cronbach alphas and MICs for the TSIA and its domain and facet scales are displayed
in Table 2 for the combined sample. Also displayed are the ICCs for the randomly selected
psychiatric patient subsample. Cronbach alphas for the TSIA total score and for the domain
and facet scales exceed .80, which can be considered good (Barker et al., 2002). The MICs of
the domain and facet scales range between .31 and .51; although some values are outside the
optimal range of .20 to .40, a range of .10 to .50 is considered acceptable for multifactor
scales (Briggs & Cheek, 1986). All ICCs for the TSIA total score and domain and facet scales
are greater than .74, indicating excellent inter-rater agreement (Landis & Koch, 1997).
3.3. Intercorrelations of the TSIA and its scales
Pearson correlations between the TSIA total scores and its domain and facet scale
scores are displayed in Table 3; all correlations are significant (p < .01). The correlation
between the Affect Awareness (AA) and Operatory Thinking (OT) domain scales is .60.
3.4. Confirmatory Factor Analysis
The GOF indices for the tested models are shown in Table 4. For models 1a, 2a, and 2b none
of the indices were acceptable; for models 3a and 3b only the SRMR is acceptable. For model
4b the χ²/df and the SRMR indicate an acceptable fit. For models 4a and 4c the values of the
fit indices show an adequate fit: the χ²/df ratios are less than 2; the CFI is .90 and the SRMR is
.07 for both models. The RMSEA with a value of .061 just exceeds the cut-off of .060 for a
good fit, but is still acceptable and a higher boundary of RMSEA 90% confidence interval of
.07 indicates a good fit as well (Hu & Bentler, 1999; Jöreskog & Sörbom, 1993). There is
only a slight difference in the χ²/df ratio between model 4a, the four-factor non-hierarchical
model, and model 4c, the four-factor hierarchical model with the four factors nested under
two higher order factors AA and OT. The χ²/df ratio is slightly better for model 4b, the four-
factor, hierarchical model with each of the four item-facets nested under a single higher-order

15
factor. A comparison of the AIC and ECVI values, however, indicates that both models 4a
and 4c are preferable over model 4b and although the difference is small, model 4c is
preferable to model 4a (see Table 4). Finally, we tested metric invariance of the hierarchical
four-factor solution (model 4c) across the psychiatric and medical samples. We observed the
following fit indices: CFI H0 = .849; CFI H1 = .839; and CFI H2 = .792. Since a difference of
.01 was observed between the congeneric model and the tau-equivalent model, measurement
invariance can be assumed for the tau-equivalent model indicating that factor loadings are
similar across the two samples. These results were confirmed when using the chi-square
difference test to compare models H0 and H1 as the chi-square increase was not significant (Δ
χ² (24) = 41.71, p >.05). However, both the difference in CFI (>.1) between model H1 and H2
as well as the chi-square increase (Δ χ² (20) = 116.80,p <.01) indicated that error loadings
were not the same across the two samples and thus the parallel model could not be
considered invariant.
3.5. Concurrent validity
Relations between the TSIA and the TAS-20 were examined in the combined sample
and separately in the psychiatric and medical samples. In the medical sample, three patients
did not complete the TAS-20 resulting in a sample size of 158 for the combined sample, 85
for the psychiatric sample, and 73 for the medical sample. The internal consistency estimates
for the TAS-20 in the combined sample were acceptable for the total scale (α = .82; MIC =
.17), and good for the DIF (α = .86; MIC = .46) and DDF factor scales (α = .77; MIC = .39),
but poor for the EOT factor scale (α = .48; MIC = .10).
Pearson correlations between the TSIA and its domain and facet scales and the TAS-20
and its factor scales for the combined sample and the psychiatric and medical samples are
shown separately in Table 5. For the combined sample most of the correlations are

16
significant; the total TAS-20 correlates significantly with the TSIA and with all of its domain
and facet scales, and as expected, the three TAS-20 factor scales correlate significantly with
their corresponding TSIA facet scales. A similar pattern of correlations is found in the
psychiatric sample, but the magnitude of the correlations between the total TAS-20 and the
TSIA and its domain and facet scales are generally higher except for a non-significant
correlation with IMP. In the medical sample, the TAS-20 correlates significantly with the
TSIA, and with its AA domain scale and DIF, DDF, and EOT facet scales. Both the DDF and
EOT factor scales of the TAS-20 correlate significantly with their corresponding TSIA facet
scales. It should be noted, however, that the DIF factor scale of the TAS-20 does not correlate
with the TSIA DIF facet scale or with the domain and other facet scales in the medical
sample.
Given the observed differences between the two subsamples, we compared the
correlation between TSIA total score and TAS-20 total score in the psychiatric sample (r =
.43) and the medical sample (r = .31) using the Fisher r-to-z transformation and observed that
these correlations did not differ significantly (z =.86, p = .39). When using the Fisher r-to-z
transformation to compare the corresponding correlations between the subscales, only the
correlation between the TSIA EOT facet scale and the TAS-20 DIF factor scale differed
significantly (z = 2.14, p < .05) in the two samples (see underlined correlations in Table 5).
4. Discussion
In this study we demonstrated that the Dutch version of the TSIA has adequate internal
consistency and inter-rater reliability and a factor structure consistent with the original
English TSIA and with the German and Italian translations of the instrument (Bagby et al.,
2006; Caretti et al., 2011; Grabe et al., 2009). As with these other versions of the TSIA, the
testing and comparison of multiple CFA models revealed that the non-hierarchical four-factor

17
model and the hierarchical four-factor model with four lower order factors nested within two
higher order factors provided the best fit. Although the fit indices were virtually the same for
these two models, the AIC and ECVI values, which favour more parsimonious models,
indicated that the hierarchical model provided a slightly better fit. As indicated by the fit of
the congeneric and the tau-equivalent models, construct equivalence for the hierarchical four-
factor model over both samples was demonstrated and factor loadings proved to be invariant.
Since the parallel model was significantly worse than the fit of the tau-equivalent model, one
can conclude that the error terms may not be equal.
As stated in the studies by Bagby and colleagues (2006) and Grabe and colleagues
(2009), this hierarchical four-factor model also proved to be most consistent with Nemiah and
Sifneos’s (1970; Nemiah, Freyberger et al., 1976) formulation that the alexithymia construct
is comprised of deficits in affect awareness (difficulties in identifying and describing
subjective emotional feelings) and an operative thinking style (a preoccupation with the
details of external events and a paucity of fantasies). The theoretical view that alexithymia is a
coherent, but multifaceted construct (Taylor et al., 1997) is also supported by good levels of
internal consistency of the Affect Awareness and Operatory Thinking domain scales, a
significant correlation between these two domain scales, and significant correlations with the
facet scales and the total TSIA as observed in our study and in previous research (Bagby et
al., 2006; Caretti et al., 2011; Grabe et al., 2009). However, since the fit indices of the non-
hierarchical four-factor model were only slightly weaker than those of the hierarchical four-
factor model, and taking into account reasons of parsimony, it is important to explore what a
non-hierarchical model would imply for the research field. Whereas in the hierarchical model,
Affect Awareness represents the common trait shared by all items of the DIF and DDF facets
of the TSIA and Operatory Thinking represents the common trait shared by all items of the
EOT and IMP facets, the common traits of these facets are not represented in the non-

18
hierarchical model. In line with previous validation studies, the correlation between the DIF
and DDF facet scales is higher than the correlations between these facet scales and the EOT
and IMP facet scales, whereas the correlation between the EOT and IMP facet scales is lower
than the correlations between the EOT facet scale and the DIF and DDF facet scales. This
might indicate that DIF and DDF indeed share a common trait represented by Affect
Awareness, however this is less clear for the EOT and IMP facets. Further studies are
therefore needed to investigate whether OT indeed represents the common trait shared by the
EOT and IMP items.
Regarding the concurrent validity of the TSIA, the correlation in the combined sample
between TSIA and TAS-20 total scores was significant with a magnitude corresponding to a
moderate effect size (Cohen, 1988). Correlations between self and expert observer reports are
often of a similar magnitude, which is mostly ascribed to the use of different methods of
measurement (Meyer et al., 2001). Indeed, Diener and Eid (2006) indicate that low to
moderate correlations between measures using different methods is not uncommon, and that
the measures may even show different patterns of relations with external variables. The
magnitude of the correlation found in our study is also comparable to that reported for an
English-speaking community sample (Bagby et al., 2006). It is somewhat lower however,
than the correlations reported in other clinical samples (Bagby et al., 2006; Caretti et al.,
2011; Grabe et al., 2009). Bagby and colleagues refer to the more restricted variance of the
TSIA total and facet scale scores in explaining the lower magnitude of the correlations in their
community sample, compared to those in their psychiatric sample. However, we observed that
in our combined sample the range of the TSIA total score and facet scale scores was not
restricted (TSIA total scores range from 0 to 46) and no outliers could be identified when
checking the scatter plot of the TSIA total scores. Consequently, the lower effect size of the
correlation between the TSIA and the TAS-20 in our combined sample could not be explained
19
by a restricted variance. To consider other possible explanations for the lower effect size in
our sample, we took a closer look at results for the two subsamples. We observed that the
correlations between the total TAS-20 and the TSIA and its domain and facet scales in the
psychiatric sample are closer in magnitude to those reported for a sample of German-speaking
psychiatric patients (Grabe et al., 2009). We observed also that the correlation between the
TAS-20 DIF scale and the TSIA EOT scale in the medical sample was significantly lower
than in the psychiatric sample. In addition, there was a significant difference in mean TAS-20
total scores (and the TAS-20 DIF and DDF factor scale scores) with medical patients scoring
lower than psychiatric patients, while TSIA scores did not differ significantly. Although our
study does not allow us to draw any firm conclusion, these observations may be related to
clinical characteristics of the two subsamples. Some authors have argued that the DIF and
DDF factor scales of the self-report TAS-20 possibly measure an individual’s beliefs about
his or her difficulties in identifying and describing emotions, which could result in too low
scores for individuals who lack knowledge about these meta-emotional difficulties (e.g.
Lundh, Johnsson, Sundqvist, & Olsson, 2002). The observation that the TAS-20 DIF factor
did not correlate significantly with the TSIA or any of its domain or facet scales in the
medical sample might be in line with these observations. We can speculate that patients
suffering from chronic tinnitus may be inclined to somatic attributions and be less likely to
present with emotional difficulties (Rief, Weise, Kley, & Martin, 2005). Possibly these
patients lack knowledge about their difficulties in identifying and describing feelings and
receive too low scores on the self-report TAS-20 DIF and DDF factor scales, whereas the
TSIA may avoid this bias as the interviewer asks for specific examples and uses probes to
carefully assess the extent to which the patient has difficulties in affect awareness. This
speculation could be examined in future research to determine whether differences in self-
report alexithymia measures and interview-based measures are consistently found in medical

20
patients suffering from somatic symptoms like tinnitus. Since the TAS-20 does not include
items that assess fantasy and other imaginal mental activity, it is not surprising that it did not
correlate significantly with the IMP facet scale of the TSIA in our psychiatric and medical
samples, and only weakly in the combined sample.
It is interesting that despite the low internal reliability of the EOT factor of the TAS-
20, this factor scale correlated significantly with the TSIA and with all of its domain and facet
scales in the combined sample and in the separate psychiatric and medical samples, except for
the DIF and IMP facet scales in the psychiatric sample. Similar or even higher magnitude
correlations between the TAS-20 EOT factor scale and the TSIA and its domain and facet
scales were reported in the validation studies with Canadian and German clinical samples and
with the Italian mixed clinical and nonclinical sample (Bagby et al., 2006; Caretti et al., 2011;
Grabe et al., 2009). Given the excellent internal consistency of the EOT facet scale of the
TSIA, this may be a much better measure of the externally oriented thinking facet of the
alexithymia construct than the EOT factor scale of the TAS-20, which has also demonstrated
low internal consistency in many other studies (e.g., Kooiman et al., 2002; Meganck et al.,
2008).
As mentioned in the results section, the mean TSIA total, facet and domain scores for
the psychiatric and medical samples are comparable to the mean scores obtained for a
German-speaking mixed inpatient and outpatient psychiatric sample (Grabe et al., 2009) and
for a Canadian psychiatric outpatient sample (Bagby et al., 2006), but are lower (moderate to
large effect sizes) than mean scores reported for Italian psychiatric and medical outpatient
samples (Caretti et al., 2011). The significantly lower mean TAS-20 score for the medical
sample when compared with the mean TAS-20 score for the psychiatric sample is difficult to
interpret, especially since these samples did not differ on TSIA total scores. However, the
mean TAS-20 for the medical sample is similar to the mean TAS-20 score reported for a

21
sample of Finnish patients with tinnitus (Salonen et al., 2007), and also similar to the mean
TAS-20 scores reported for medical and psychiatric samples in studies validating the German
and Italian translations of the TSIA (Caretti et al., 2011; Grabe et al., 2009). It is possible that
the TAS-20 scores for our psychiatric sample were influenced by the presence of negative
affect (Lumley, 2000; Lumley, Neely, & Burger, 2007), an influence that can be addressed by
the interviewer when scoring the TSIA.
Limitations of the study are the small sample size and the use of a medical sample
comprised of patients with the primary complaint of tinnitus. Future studies need to employ
larger and more diagnostically heterogeneous medical samples with a wide range of
symptoms in combination with non-clinical samples. It is likely that TSIA scores will be
significantly higher in heterogeneous medical samples when compared with healthy samples.
The study is limited also by the use of only the TAS-20 to evaluate the concurrent validity of
the TSIA. However, there is evidence from the study mentioned earlier that the TSIA shows
concurrent validity with other non-self-report measures of alexithymia, including the mBIQ
and the OAS (Meganck et al., 2011). The convergent, discriminant, and predictive validity of
the TSIA also need to be evaluated in future research. Finally, the assessment of inter-rater
reliability in only a single sample of psychiatric patients likely compromises the
generalizability of our results. Nonetheless, since we obtained an excellent level of inter-rater
reliability, comparable to levels of agreement reported in other studies with clinical and
nonclinical samples (Bagby et al., 2006; Caretti et al., 2011; Grabe et al., 2009), a similar
level of inter-rater reliability could be expected for other Dutch-speaking samples, provided
that the interviewers are adequately trained in the administration and scoring of the TSIA.
Notwithstanding these limitations, the results of this study indicate that the TSIA is a
sufficiently reliable and valid instrument to be recommended for clinical and research
purposes The TSIA may be especially useful in the following research or clinical situations.

22
First, the TSIA is preferable to the TAS-20 if assessing patients with poor reading ability. As
shown by Parker, Eastabrook, Keefer and Wood (2010), the quality of assessment with the
TAS-20 deteriorates with increasing reading difficulty. This is an important consideration for
patients with low education and from low socioeconomic groups. Second, as noted in the
Introduction, a limitation of the TAS-20 is that individuals with higher degrees of alexithymia
may not be able to reliably assess their own deficits in affect awareness on a self-report scale.
The TSIA, with its method of inquiry which includes prompts and probes, allows for a more
accurate appraisal. In addition, the interviewer can judge and score accordingly whether a
patient’s response to a question reflects another psychological construct such as inhibition,
suppression, or avoidance of affect, as opposed to an alexithymic deficit. Since the TSIA
provides a more comprehensive evaluation than does the TAS-20, including an assessment of
the restricted imaginal processes facet of the alexithymia construct, its use might be warranted
when selecting subjects for certain types of research, especially experimental studies and
studies examining relations between alexithymia and impaired mentalization or social
cognition (e.g., Subic-Wrana, Beutel, Knebel, & Lane, 2010; Wingbermühle, Theunissen,
Verhoeven, Kessels, & Egger, 2012), or for clinicians who need to make a more in-depth
assessment of alexithymia. Indeed, in contrast to the TAS-20 factors, which do not contain the
same number of items and were not developed with the intention they be used as subscales,
the TSIA factor scales contain the same number of items and were developed specifically to
assess the different facets of the alexithymia construct.
The TSIA can also be recommended as part of a multi-method approach to the
assessment of alexithymia; such an approach can control for potential measurement artefacts
associated with the use of a single method, and thereby increase the validity of research
findings. Using both the TSIA and the TAS-20, for example, researchers can form groups of
high and low alexithymia individuals by selecting only those who score in the very high or

23
very low range of both measures. The use of both the TAS-20 and the TSIA might be
warranted in investigations requiring only small samples, including brain imaging studies,
such as those conducted by Japanese researchers who have previously used the TAS-20 and
the mBIQ to select subjects with either high or low degrees of alexithymia (e.g., Moriguchi et
al., 2006). In clinical situations and studies in large populations, self-report measures of
alexithymia are quick, inexpensive, and easy to administer and score, but patients must be
able to understand and correctly interpret the intention of the items.
References
Bagby, R. M., Parker, J. D. A., & Taylor, G. J. (1994). The twenty-item Toronto Alexithymia
Scale - I. Item selection and cross-validation of the factor structure. Journal of
Psychosomatic Research, 38, 23-32.doi:10.1016/0022-3999(94)90005-1
Bagby, R. M., Taylor, G. J., Dickens, S. E, & Parker, J. D. A. (2009). The Toronto Structured
Interview for Alexithymia (TSIA). Administration and scoring guidelines. Version 2.
Unpublished manual.
Bagby, R. M., Taylor, G. J., & Parker, J. D. A. (1994). The twenty-item Toronto Alexithymia
Scale – II. Convergent, discriminant, and concurrent validity. Journal of Psychosomatic
Research, 38, 33-40.doi:10.1016/0022-3999(94)90006-X
Bagby, R. M., Taylor, G. J., Parker, J. D. A., & Dickens, S. E. (2006). The development of
the Toronto Structured Interview for Alexithymia: Item selection, factor structure,
reliability and concurrent validity. Psychotherapy and Psychosomatics, 75, 25-39.
doi:10.1159/000089224
24
Barker, C., Pistrang, N., & Elliott, R. (2002). Research Methods in Clinical Psychology. (2nd
ed.). John Wiley & Sons, LTD.
Briggs, S. R., & Cheek, J. M. (1986). The role of factor analysis in the development and
evaluation of personality scales. Journal of Personality, 54, 106-148. doi:10.1111/j.1467-
6494.1986.tb00391.x
Browne, M. W., & Cudeck, R. (1993). Alternative ways of assessing model fit. In K.A.
Bollen & J. S. Long (Eds.), Testing structural equation models (pp. 136-162). Newbury
Park, CA: Sage.
Byrne, B. M. (1998) Structural equitation modelling with LISREL, PRELIS and SIMPLIS:
basic concepts, applications and programming. Mahwah, NJ: Lawrence, Erlbaum.
Burnham, K. P., & Anderson, D.R. (2004). Multimodel inference- Understanding AIC and
BIC in model selection. Sociological Methods & Research, 33, 261-304. doi:
10.1177/0049124104268644
Caretti, V., Porcelli, P., Solano, L., Schimmenti, A., Bagby, R. M., & Taylor, G. J. (2011).
Reliability and validity of the Toronto Structured Interview for Alexithymia in a mixed
clinical and nonclinical sample from Italy. Psychiatry Research, 187, 432-436. doi:
10.1016/j.psychres.2011.02.015
Chueng, G. W., & Rensvold, R. B. (2002). Evaluating goodness-of-fit indexes for testing
measurement invariance. Structural Equation Modeling, 9, 233-255.
Cohen, J. (1988). Statistical power analysis for the behavioral sciences (2nd ed.). Hillsdale,
NJ: Erlbaum.
Davis, A., Rafaie, E. A. (2000). Epidemiology of tinnitus. In: Tyler RS, ed. Tinnitus
Handbook. (pp.1-22). New York: Thomson Delmar Learning.

25
De Gucht, V., & Heiser, W. (2003). Alexithymia and somatisation. A quantitative review of
the literature. Journal of Psychosomatic Research, 54, 425-434. doi:10.1016/S0022-
3999(02)00467-1
Diener, E. & Eid, M. (2006). “The finale: Take-home messages from the editor.” In M. Eid, E.
Diener (Eds.), Handbook of multimethod measurement in psychology (pp. 457-463).
Washington, DC: American Psychological Association.
Eid, M., & Diener, E. (2007). Handbook of multimethod measurement in psychology.
Washington, DC: American Psychological Association.
Eid, M. & Diener, E. (2006). “Introduction: The need for multimethod measurement in
psychology.” In M. Eid, E. Diener (Eds.), Handbook of multimethod measurement in
psychology (pp. 3-8). Washington, DC: American Psychological Association.
Folmer, R.L., Griest, S. E., Meikle, M. B., Martin, W.H. (1999) Tinnitus severity, loudness,
and depression. Otolaryngology Head Neck Surgery, 121, 48-51. doi: 10.1016/S0194-
5998(99)70123-3
Franz, M., Popp, K., Schaefer, R., Sitte, W., Schneider, C., Hardt, J., Decker, A., Braehler, E.
(2007). Alexithymia in the German general population. Social Psychiatry and Psychiatric
Epidemiology, 43, 54-62. doi: 10.1007/s00127-007-0265-1
Frewen, P. A., Lanius, R. A., Dozois, D. J. A., Neufeld, W. J., Pain, C., Hopper, J. W., …&
Stevens, T. K. (2008). Clinical and neural correlates of alexithymia in posttraumatic stress
disorder. Journal of Abnormal Psychology, 117, 171-181. doi:10.1037/0021-
843X.117.1.171
Grabe, H. J., Frommer, J., Ankerhold, A., Ulrich, C., Groeger, R., Franke, G. H., ...& Spitzer,
C. (2008). Alexithymia and outcome in psychotherapy. Psychotherapy and
Psychosomatics, 7, 189-194. doi:10.1159/000119739

26
Grabe, H. J., Löbel, S., Dittrich, D., Bagby, M., Taylor, G. J., Quilty, L. C., ...& Rufer, M.
(2009). The German version of the Toronto Structured Interview for Alexithymia : factor
structure, reliability, and concurrent validity in a psychiatric inpatient sample.
Comprehensive Psychiatry, 50, 424-430.doi:10.1016/j.comppsych.2008.11.008
Haviland, M. G., Hendryx, M. S., Shaw, D.G., & Henry, J. P. (1994). Alexithymia in women
and men hospitalized for psychoactive substance dependence. Comprehensive Psychiatry,
35, 124-128. doi:10.1016/0010-440X(94)90056-N
Haviland, M. G., Warren, W. L., & Riggs, M. L. (2000). An observer scale to measure
alexithymia. Psychosomatics, 41, 385-392. doi:10.1176/appi.psy.41.5.385
Hendryx, M. S., Haviland, M. G., & Shaw, D. G. (1991). Dimensions of alexithymia and their
relationships to anxiety and depression. Journal of Personality Assessment, 56, 227- 237.
doi:10.1207/s15327752jpa5602_4
Honkalampi, K., Koivumaa-Honkanen, H., Tanskanen, A., Hintikka, J., Lehtonen, J., &
Viinamaki, H. (2001). Why do alexithymic features appear to be stable? A 12-month
follow-up study of a general population. Psychotherapy and Psychosomatics, 70, 247-253.
doi:10.1159/000056262
Hu, L. & Bentler, P. M. (1999). Cutoff criteria for fit indexes in covariance structure
analysis : conventional criteria versus new alternatives. Structural Equation Modeling, 6,
1-55. doi:10.1080/10705519909540118
Jastreboff, P.J. (1990). Phantom auditory perception (tinnitus): mechanisms of generation and
perception. Neuroscience Research, 8, 221-54. doi:10.1016/0168-0102(90)90031-9
Jöreskog, K. G., & Sörbom, D. (1993). LISREL 8: Structural equation modeling with the
SIMPLIS command language. Chicago: SSI Scientific Software International.
Kooiman, C. G., Spinhoven, P., & Trijsburg, R. W. (2002). The assessment of alexithymia. A
critical review of the literature and a psychometric study of the Toronto Alexithymia

27
Scale-20. Journal of Psychosomatic Research, 53, 1083-1090. doi:10.1016/S0022-
3999(02)00348-3
Kooiman, C.G., van Rees Vellinga, S., Spinhoven, P., Draijer, N., Trijsburg, R.W., &
Rooijmans, H.G.W. (2004). Childhood adversities as risk factors for alexithymia and
other aspects of affect regulation in adult life. Psychotherapy and Psychosomatics, 73,
107-116. doi:10.1159/000075542
Landis, J. R., & Koch, G. G. (1977). The measurement of observer agreement for categorical
data. Biometrics, 33, 159-174. doi:10.2307/2529310
Leising, D., Grande, T. & Faber, R. (2009). The Toronto Alexithymia Scale (TAS-20): A
measure of general psychological distress. Journal of Research in Personality, 43, 707-
710. doi:10.1016/j.jrp.2009.03.009
Luminet, O., Bagby, R. M., & Taylor, G. J. (2001). An evaluation of the absolute and relative
stability of alexithymia in patients with major depression. Psychotherapy and
Psychosomatics, 70, 254-260. doi:10.1159/000056263
Lumley, M.A. (2000). Alexithymia and negative emotional conditions. Journal of
Psychosomatic Research, 49, 51-54. doi:10.1016/S0022-3999(00)00161-6
Lumley, M.A., Neely, L.C., & Burger, A.J. (2007). The assessment of alexithymia in medical
settings: Implications for understanding and treating health problems. Journal of
Personality Assessment, 89, 230-246. doi: 10.1080/00223890701629698
Meganck, R., Inslegers, R., Vanheule, S., & Desmet, M. (2011). The Convergence of
Alexithymia Measures. Psychologica Belgica, 51, 237-250.
Meganck, R., Vanheule, S., & Desmet, M. (2008). Factorial validity and measurement
invariance of the 20-item Toronto Alexithymia Scale in clinical and nonclinical samples.
Assessment, 15, 36-47. doi:10.1177/1073191107306140
28
Meganck, R., Vanheule, S., Desmet, M., & Inslegers, R. (2010). The Observer Alexithymia
Scale: A reliable and valid alternative for alexithymia measurement? Journal of
Personality Assessment, 92, 175-185. doi:10.1080/00223890903510449
Meyer, G. J., Finn, S. E., Eyde, L. D., Kay, G. G., Moreland, K. L., Dies, R. R.,… & Reed,
G.M. (2001). Psychological testing and psychological assessment: a review of evidence
and issues. American Psychologist, 56, 128-165. doi:10.1037//0003-066X.56.2.128
Moriguchi, Y., Ohnishi, T., Lane, R. D., Maeda, M., Mori, T., Nemoto, K., Matsuda, H., &
Komaki, G. (2006). Impaired self-awareness and theory of mind: An fMRI study of
mentalizing in alexithymia. NeuroImage, 32, 1472-1482.
doi:10.1016/j.neuroimage.2006.04.186
Nemiah, J. C., & Sifneos, P. E. (1970). Psychosomatic illness: A problem in communication.
Psychotherapy and Psychosomatics, 18, 154-160.
Nemiah, J. C., Freyberger, H., & Sifneos, P. E. (1976). Alexithymia: a view of the
psychosomatic process. In O.W. Hill (Ed.), Modern trends in psychosomatic medicine,
Vol. 3 (pp. 430-439). London: Butterworths.
Nunnally, J., & Bernstein, I. (1994). Psychometric Theory. McGraw-Hill, New York.
Ooms, E., Vanheule, S., Meganck, R., Vinck, B., Watelet, J.B., & Dhooge I. (2011). Tinnitus
Severity and its relation with cognitive and somatic anxiety: A Critical Study.
Otolaryngology - Head and Neck Surgery, e-publication. doi: 10.1007/s00405-011-1887-1
Parker, J.D.A., Eastabrook, J.M., Keefer, K.V., & Wood, L.M. (2010). Can alexithymia be
assessed in adolescents? Psychometric properties of the 20-Item Toronto Alexithymia
Scale in younger, middle, and older adolescents. Psychological Assessment, 22, 798-808.
doi: 10.1037/a0020256
29
Porcelli, P., Taylor, G.J., Bagby, R.M., & De Carne, M. (1999). Alexithymia and functional
gastrointestinal disorders. Psychotherapy and Psychosomatics, 68, 263-269. doi:
10.1159/000012342
Rief, W., Weise, C., Kley, N., & Martin, A. (2005). Psychophysiologic treatment of chronic
tinnitus: A randomized clinical trial. Psychosomatic Medicine, 67, 833-838. doi:
10.1097/01.psy.0000174174.38908.c6
Salonen, J., Johansson, R., & Joukamaa, M. (2007). Alexithymia, depression and tinnitus in
elderly people. General Hospital Psychiatry, 29, 431-435.
doi: 10.1016/j.genhosppsych.2007.05.002
Subic-Wrana, C., Beutel, M. E., Knebel, A., & Lane, R. D. (2010). Theory of mind and
emotional awareness deficits in patients with somatoform disorders. Psychosomatic
Medicine, 72, 404-411. doi: 10.1097/PSY.Ob013e3181d35e83
Tanaka, J. S. (1993). Multifaceted conceptions of fit in structural equation models. In K.A.
Bollen, & J.S. Long (Eds.), Testing structural equation models (pp.10-39). London: Sage.
Taylor, G. J. (2004). Alexithymia: 25 years of theory and research. In I. Nyklίček, L.
Temoshok, & A. Vingerhoets (Eds,) Emotion expression and health: Advances in theory,
assessment, and clinical applications (pp. 137-153). New York: Brunner-Routledge.
Taylor, G. J., & Bagby, R. M. (2004). New trends in alexithymia research. Psychotherapy
and Psychosomatics, 73, 68-77. doi:10.1159/000075537
Taylor, G. J., Bagby, R. M., & Parker, J. D. A. (1997). Disorders of affect regulation:
Alexithymia in medical and psychiatric illness. Cambridge: Cambridge University Press.
Taylor, G. J., Bagby, R. M., & Parker, J. D. A. (2003). The 20-item Toronto Alexithymia
Scale. IV. Reliability and factorial validity in different languages and cultures. Journal of
Psychosomatic Research, 55, 227-283. doi:10.1016/S0022-3999(02)00601-3

30
Taylor, G. J., Parker, J. D. A., Bagby, R. M., & Bourke, M. P. (1996). Relationships between
alexithymia and psychological characteristics associated with eating disorders. Journal of
Psychosomatic Research, 41, 561-568. doi:10.1016/S0022-3999(96)00224-3
Todarello, O., Taylor, G.J., Parker, J.D.A., & Fanelli, M. (1995). Alexithymia in essential
hypertension and psychiatric outpatients: A comparative study. Journal of Psychosomatic
Research, 39, 987-994. doi: 10.1016/0022-3999(95)00506-4
Tsaousis, I., Taylor, G., Quilty, L., Georgiades, S., Stavrogiannopoulos, M., & Bagby, R. M.
(2007). Validation of a Greek adaptation of the 20-item Toronto alexithymia Scale.
Comprehensive Psychiatry, 51, 443-448. doi :10.1016/j.comppsych.2009.09.005
Vanheule, S., Desmet, M., Verhaeghe, P., & Bogaerts, S. (2007). Alexithymic depression:
Evidence for a depression subtype? Psychotherapy and Psychosomatics, 76, 135-136. doi:
10.1159/000104710
Waller, E., & Scheidt, C. E. (2004). Somatoform disorders as disorders of affect regulations.
A study comparing the TAS-20 with non-self-report measures of alexithymia. Journal of
Psychosomatic Research, 57, 239-247. doi:10.1016/S0022-3999(03)00613-5
Wingbermühle, E., Egger, J. I. M., Verhoeven, W. M. A., van der Burgt, I., & Kessels, R. P.
C. (2012). Affective functioning and social cognition in Noonan syndrome. Psychological
Medicine, 42, 419-426. doi:10.1017/S0033291711001115.
Wingbermühle, E., Theunissen, H., Verhoeven, W. M. A., Kessels, R. P. C., & Egger, J. I. M.
(2012). The neurocognition of alexithymia: evidence from neuropsychological and
neuroimaging studies. Acta Neuropsychiatrica, 24, 67-80. doi:10.1111/j.1601-
5215.2011.00613.x

31
Zhu, X. Z., Yi, J. Y., Yao, S. Q., Ryder, A. G., Taylor, G. J., & Bagby, M. (2007). The cross-
cultural validation of a Chinese translation of the 20-item Toronto Alexithymia Scale.
Comprehensive Psychiatry, 48, 489-496. doi: 10.1016/j.comppsch.2007.04.007

32
Table 1. Descriptive statistics of the TSIA and TAS-20 and comparison with Canadian,
German, and Italian samples
Sample Factors TSIA
TSIA Can
TSIA Ger
TSIA Ita
TAS-20
Mean (SD) d d d Mean (SD)
Total Total 20.37 (10.91) / / / 54.90 (12.16)
DIF 3.91 (3.29) / / / 19.50 (7.10)
DDF 5.65 (3.73) / / / 15.53 (4.67)
EOT 5.61 (3.48) / / / 19.87 (4.31)
IMP 5.20 (3.43) / / / /
AA 9.56 (6.28) / / / /
OT 10.81 (5.95) / / / /
Psychiatric Total 20.79 (9.47) -.06 -.18 .50** 59.95°° (11.12)
DIF 4.08 (3.13) .00 -.33* .72** 22.54°° (6.27)
DDF 5.47 (3.30) .03 -.45 .59** 17.24°° (4.54)
EOT 5.41 (3.28) -.03 .14 .33* 20.18 (4.45)
IMP 5.82° (2.74) -.21 .10 .-12 /
AA 9.57 (6.84) .00 -.39* .66** /
OT 10.34 (6.82) .02 .26 .26 /
Medical Total 19.91 (12.37) / / .50** 49.01°° (10.62)
DIF 3.71 (3.47) / / .46* 15.96°° (6.36)
DDF 5.86 (4.16) / / .10 13.53°° (3.99)
EOT 5.84 (3.70) / / .33* 19.52 (4.15)
IMP 4.50° (3.96) / / .69** /
AA 9.55 (5.77) / / .32* /
OT 11.24 (5.05) / / .53** / Note: DIF: difficulty identifying feelings; DDF: difficulty describing feelings; EOT: externally oriented thinking; IMP: impaired imaginal processes. TSIA Can: Toronto Structured Interview in Canadian sample, TSIA Ger: TSIA in German sample, TSIA Ita: TSIA in Italian Sample; Total Sample N = 161 for TSIA; 158 for TAS-20; Psychiatric Sample N = 85 for TSIA and TAS-20; Tinnitus Sample N = 76 for TSIA and N = 73 for TAS-20. ° : Cohen’s d >.30; °°: Cohen’s d >.50 for the difference between TSIA and TAS-20 mean scores of the medical and psychiatric samples. * : Cohen’s d >.30; **: Cohen’s d >.50 for the difference between the TSIA mean scores in the Dutch versus other language groups.
33
Table 2. Cronbach’s alpha, mean inter-item correlations, and intra-class correlation
coefficients for inter-rater reliability for the TSIA and its domain and facet scales in the
combined sample.
Cronbach ‘s alpha (N = 161)
MIC (N = 161)
ICC (N = 40)
Total TSIA .91 .31 .88
DIF .85 .48 .79
DDF .86 .51 .89
EOT .82 .43 .90
IMP .81 .41 .87
AA .91 .42 .87
OT .85 .33 .88
Note: DIF = difficulty identifying feelings; DDF = difficulty describing feelings; EOT = externally oriented thinking; IMP = impaired imaginal processes; AA = affect awareness; OT = operative thinking; MIC = mean inter-item correlation; ICC = intraclass correlation coefficient

34
Table 3. Pearson correlations among the TSIA and its domain and facet scales in the
combined sample (N = 161).
TSIA AA OT DIF DDF EOT IMP
TSIA --
AA .89** --
OT .90** .60** --
DIF .77** .88** .48** --
DDF .84** .91** .58** .60** --
EOT .82** .61** .86** .49** .59** --
IMP .71** .41** .86** .32** .41** .48** --
Note: AA = affect awareness; OT = operative thinking; DIF = difficulty identifying feelings; DDF = difficulty describing feelings; EOT = externally oriented thinking; IMP = imaginal processes ** p < .01

35
Table 4. Goodness-of-fit indices for the tested models in the combined sample (N = 161).
Model Goodness of fit indices
χ² (df) χ²/df SRMR RMSEA (90%CI) CFI AIC ECVI
Model 1a: 1-factor model, in which all items load on a single factor. 1078.62 (252) 4.28 .104 .143 (.134- .152) .65 1174.62 7.34
Model 2a: 2-factor, non-hierarchical model, in which all items from the DIF and DDF scales load on one domain factor Affect Awareness (AA), and all items from the EOT and IMP scales load on a second correlated domain factor Operatory Thinking (OT).
774.76 (251) 3.09 .090 .114 (.105 - .123) .75 872.76 5.46
Model 2b: 2-factor, hierarchical model, with the two factors identified in Model 2a nested under one higher-order factor.
774.76 (250) 3.10 .090 .115 (.105 - .124) .75 874.76 5.47
Model 3a: 3-factor, non-hierarchical model, in which all of the items from the DIF and DDF scales load on one factor and the items from the EOT and IMP scales load on separate correlated factors.
594.48 (249) 2.39 .078 .093 (.084 - .103) .82 696.48 4.35
Model 3b: 3-factor, hierarchical model with each of the three factors identified in Model 3a nested under one higher-order factor.
594.47 (249) 2.39 .078 .093 (.084 - .103) .82 696.47 4.35
Model 4a: 4-factor, non-hierarchical model, in which the items from DIF, DDF, EOT and IMP each load on four separate, correlated facet factors.
422.83 (246) 1.72 .073 .061 (.050 - .072)
.90 502.36 3.14
Model 4b: 4-factor, hierarchical model, in which each of the separate facet factors are nested under a single higher-order factor.
409.25 (248) 1.65 .076 .064 (.053 - .075) .89 513.25 3.21
Model 4c: 4-factor, hierarchical model in which the first two facet factors (DIF and DDF items) are nested under one higher-order domain factor AA, and the second two facet factors (EOT and IMP items) are nested under a second higher-order domain factor OT.
422.83 (247)
1.71 .073 .061 (.050 - .072)
.90 500.34 3.13
Note. df = degrees of freedom; SRMR = standardized root mean square residual; RMSEA = root mean square error of approximation; (90%CI) = 90% confidence interval of
RMSEA; CFI = comparative fit index; AIC = Akaike Information Criterion; ECVI = expected cross validation index.

36
Table 5. Pearson correlations between the TSIA and its domain and facet scales and the TAS-
20 and its factor scales in the combined sample, and in the psychiatric and medical samples.
TAS-20 TOT TAS-20 DIF TAS-20 DDF TAS-20 EOT
Combined Samplea TSIA TOT .34** .16* .29** .40**
TSIA AA .35** .20* .32** .32**
TSIA OT .26** .08 .19* .39**
TSIA DIF .30** .22** .23** .24**
TSIA DDF .33** .14 .33** .33**
TSIA EOT .27** .08 .22** .41**
TSIA IMP .18* .06 .12 .27**
Psychiatric Sampleb TSIA TOT .43** .24* .37** .35**
TSIA AA .40** .25* .39** .26*
TSIA OT .34** .17 .25* .36**
TSIA DIF .29** .23* .25* .16
TSIA DDF .42** .22* .44** .30**
TSIA EOT .44** .29** .30** .38**
TSIA IMP .10 -.03 .09 .20
Medical Samplec TSIA TOT .31** .08 .23 .45**
TSIA AA .37** .18 .29* .39**
TSIA OT .19 -.04 .13 .43**
TSIA DIF .31** .19 .19 .32**
TSIA DDF .36** .14 .32** .38**
TSIA EOT .23* -.05 .23 .45**
TSIA IMP .11 -.03 .01 .33**
Note: a: N = 158; b: N = 85; c: N = 73. AA = affect awareness; OT = operative thinking; DIF = difficulty
identifying feelings; DDF = difficulty describing feelings; EOT = externally oriented thinking; IMP = imaginal
processes; Corresponding correlations that differ significantly (p< .05) between the psychiatric and the medical
sample are underlined. * p < .05; ** p < .01
Related Documents