Running head: RELATION BETWEEN MATH ANXIETY AND MATH ACHIEVEMENT 1 A Meta-analysis of the Relation Between Math Anxiety and Math Achievement Connie Barroso 1, 2 , Colleen M. Ganley 2, 3 , Amanda L. McGraw 4 , Elyssa A. Geer 2 , Sara A. Hart 2, 5 , and Mia C. Daucourt 2 1 Department of Educational Psychology, Texas A&M University, College Station, TX, US 2 Department of Psychology, Florida State University, Tallahassee, FL, US 3 Florida Center for Research in Science, Technology, Engineering, and Mathematics, Learning Systems Institute, Tallahassee, FL, US 4 Jacksonville University, Jacksonville, FL, US 5 Florida Center for Reading Research, Florida State University, Tallahassee, FL, US The data and associated files for this meta-analysis are available at https://osf.io/szrhx The research reported in this paper was supported in part by the Eunice Kennedy Shriver National Institute of Child Health and Human Development, National Institutes of Health (Award #HD052120) and Institute of Education Sciences, U.S. Department of Education, through Grant R305A170463 to Florida State University. Views expressed herein are those of the authors and have neither been reviewed nor approved by the granting agencies. Correspondence concerning this article should be addressed to Connie Barroso, Department of Educational Psychology, Texas A&M University, 704 Harrington Tower, College Station, TX 77843. E-mail: [email protected] ©American Psychological Association, 2020. This paper is not the copy of record and may not exactly replicate the authoritative document published in the APA journal. Please do not copy or cite without author's permission. The final article is available, upon publication, at: https://doi.org/10.1037/bul0000307.

Welcome message from author
This document is posted to help you gain knowledge. Please leave a comment to let me know what you think about it! Share it to your friends and learn new things together.
Transcript

Running head: RELATION BETWEEN MATH ANXIETY AND MATH ACHIEVEMENT
1
A Meta-analysis of the Relation Between Math Anxiety and Math Achievement
Connie Barroso1, 2, Colleen M. Ganley2, 3, Amanda L. McGraw4, Elyssa A. Geer2,
Sara A. Hart2, 5, and Mia C. Daucourt2
1Department of Educational Psychology, Texas A&M University, College Station, TX, US 2Department of Psychology, Florida State University, Tallahassee, FL, US 3Florida Center for Research in Science, Technology, Engineering, and Mathematics, Learning Systems Institute, Tallahassee, FL, US 4Jacksonville University, Jacksonville, FL, US 5Florida Center for Reading Research, Florida State University, Tallahassee, FL, US
The data and associated files for this meta-analysis are available at https://osf.io/szrhx
The research reported in this paper was supported in part by the Eunice Kennedy Shriver
National Institute of Child Health and Human Development, National Institutes of Health
(Award #HD052120) and Institute of Education Sciences, U.S. Department of Education,
through Grant R305A170463 to Florida State University. Views expressed herein are those of
the authors and have neither been reviewed nor approved by the granting agencies.
Correspondence concerning this article should be addressed to Connie Barroso, Department of
Educational Psychology, Texas A&M University, 704 Harrington Tower, College Station, TX
77843. E-mail: [email protected]
©American Psychological Association, 2020. This paper is not the copy of record and may not exactly replicate the authoritative document published in the APA journal. Please do not copy or cite without author's permission. The final article is available, upon publication, at: https://doi.org/10.1037/bul0000307.
RELATION BETWEEN MATH ANXIETY AND MATH ACHIEVEMENT
2
Abstract
Meta-analyses from the 1990s have previously established a significant, small-to-
moderate, and negative correlation between math achievement and math anxiety. Since these
publications, research has continued to investigate this relation with more diverse samples and
measures. Thus, the goal of the present meta-analysis was to provide an update of the math
anxiety-math achievement relation and its moderators. Analyzing 747 effect sizes accumulated
from research conducted between 1992 and 2018, we found a small-to-moderate, negative, and
statistically significant correlation (r = -.28) between math anxiety and math achievement. The
relation was significant for all moderator subgroups, with the exception of the relation between
math anxiety and assessments measuring the approximate number system. Grade level, math
ability level, adolescent/adult math anxiety scales, math topic of anxiety scale, and math
assessments were significant moderators of this relation. There is also a tendency for published
studies to report significantly stronger correlations than unpublished studies but, overall, large,
negative effect sizes are under-reported. Our results are consistent with previous findings of a
significant relation between math anxiety and math achievement. This association starts in
childhood, remains significant through adulthood, is smaller for students in grades 3 through 5
and postsecondary school, is larger for math anxiety than for statistics anxiety and for certain
math anxiety scales, and is smaller for math exam grades and samples selected for low math
ability. This work supports future research efforts to determine effective math achievement and
math anxiety interventions, which may be most helpful to implement during childhood.
Keywords: meta-analysis, math anxiety, math achievement, grade level
RELATION BETWEEN MATH ANXIETY AND MATH ACHIEVEMENT
3
Public Significance Statement: The present meta-analysis finds a robust association between
math anxiety and math achievement, indicating that people who report higher feelings of anxiety
towards math tend to have lower math achievement. The relation is weaker for people at certain
grade levels (grades 3 through 5 and college students), depends on the scales used to measure
math anxiety, is stronger for math anxiety compared to statistics anxiety, and is weaker for math
exam grades and for low math ability samples. Math anxiety is experienced by many individuals
throughout development. Its association with math achievement makes math anxiety an
important factor to consider for improving math experiences, academic outcomes, and STEM
career participation.
RELATION BETWEEN MATH ANXIETY AND MATH ACHIEVEMENT
4
A Meta-analysis of the Relation Between Math Anxiety and Math Achievement
Research aimed at understanding how to improve achievement in mathematics has long
been stimulated by the importance of its use in everyday life (OECD, 1999). More recently, a
clear national and international priority has been made to increase engagement in fields that
require strong mathematics skills, such as fields in science, technology, engineering, and
mathematics (STEM; Corbett & Hill, 2015; Olson & Riordan, 2012). Despite this importance,
recent work has shown declines in math achievement in students across the globe (Gottfried,
Marcoulides, Gottfried, Oliver, & Guerin, 2007; Kastberg, Chan, & Murray, 2016; Wijsman,
Warrens, Saab, Van Driel, & Westenberg, 2016). For example, the 2015 Program for
International Student Assessments (PISA) report found a significant decline from 2012 to 2015
in the average 15-year-old students’ math achievement scores from at least a third of countries
sampled, including the United States, China (i.e., Hong Kong), and Brazil (OECD, 2016). In
light of this decline, it is imperative to continue to work to understand the nature of math
achievement and associated factors.
Negative affect related to math has been a critical focus of the research aimed at
understanding how to increase math knowledge (Aiken, 1970; Foley et al., 2017; McLeod,
1994). One affective factor that has been found to play a central role in math achievement is
math anxiety, defined as the fear and worry related to math stimuli and situations (Ashcraft,
2002; Richardson & Suinn, 1972). Meta-analyses investigating the relation between math
anxiety and math achievement from the 1990s highlight the primacy of this relation; both
Hembree’s (1990) and Ma’s (1999) statistical analyses of the strength of the association found
significant small-to-moderate negative associations between math anxiety and math achievement
(Hembree: rs ranged from -.25 to -.40; Ma: r = -.27). Overall, aggregated evidence from these
RELATION BETWEEN MATH ANXIETY AND MATH ACHIEVEMENT
5
two meta-analyses suggest that many students with higher levels of math anxiety tend to also
have lower levels of math achievement.
Over the past twenty years since the last of these statistical reviews, research studying the
relation between math anxiety and math achievement has continued to flourish. A closer look at
these previous meta-analyses, along with publications that have surfaced since their release,
reveals that there are specific questions that need to be clarified surrounding the nature of the
relation between math anxiety and math achievement. For example, although recent work has
been conducted with different age groups, it is unclear whether the relation is consistently
evident in student populations younger than grade 4 (Ganley & McGraw, 2016; Harari, Vukovic,
& Bailey, 2013) or in non-student adult populations (Hart & Ganley, 2019). The scope of recent
research has become more nuanced with regard to the demographics of samples studied and
measures used to assess math anxiety and math achievement. As such, a synthesis of this work
can provide a clearer picture of the magnitude of the relation, particularly for complexities of the
relation that remain unclear.
There were two aims for the present study. The primary aim was to conduct a meta-
analysis that takes into account the surge of research that has occurred since Ma’s (1999) meta-
analysis on the overall association between math anxiety and math achievement. The secondary
aim was to investigate whether this relation is moderated by certain factors. Specifically, we
examined whether sample demographic characteristics of gender, race/ethnicity, country, or
grade level moderated the relation between math anxiety and math achievement. We also
examined whether teachers or samples selected for low math ability had differential relations
compared to non-teacher samples and samples not selected for low math ability, respectively.
Finally, we examined whether measure characteristics, such as the types of measures used to
RELATION BETWEEN MATH ANXIETY AND MATH ACHIEVEMENT
6
assess math anxiety and math achievement or the content area assessed by the math assessment,
moderated the relation.
Importance of Math Anxiety and Math Achievement
Math anxiety and math achievement have both been theorized to be important correlates
of educational and career outcomes (Wigfield & Eccles, 2000). High levels of math anxiety as
well as low math achievement and beliefs about math ability early in development have been
found to significantly relate to avoidance of later educational opportunities in math (Espino,
Pereda, Recon, Perculeza, & Umali, 2017; Hembree, 1990; Hurst & Cordes, 2017; Meece,
Wigfield, & Eccles, 1990). Math anxiety has also been found to relate to the adoption of
achievement goal types that are linked with reduced content mastery, such as performance-
avoidance and mastery-avoidance goal orientations (Gonzalez-DeHass, Furner, Vásquez-Colina,
& Morris, 2017). Furthermore, math anxiety and math achievement have been associated,
separately, with high school and college career interests and choices in STEM fields (Ahmed,
2018; Lauermann, Chow, & Eccles, 2015; Watt, et al., 2017). For example, one study found that
students who had consistently low or decreasing math anxiety from middle school through high
school were more likely to choose STEM majors during postsecondary education than were
students with consistently high or increasing math anxiety from middle to high school (Ahmed,
2018).
Throughout development, math anxiety and math achievement guide people down
pathways that lead to different learning outcomes, educational pursuits, and career choices.
Despite the importance of math anxiety and math achievement in shaping these pathways,
inequities in these factors have been reported for certain groups, including females, people of
racial and ethnic minority backgrounds, and students with learning disabilities (Catsambis, 1994;
RELATION BETWEEN MATH ANXIETY AND MATH ACHIEVEMENT
7
Devine et al., 2012; Dowker, Sarkar, & Looi, 2016; Else-Quest, Hyde, & Linn, 2010; Fan, Chen,
& Matsumoto, 1997; Hall, Davis, Bolen, & Chia, 1999; Sonnenschein & Galindo, 2015; Suárez-
Pellicioni, Núñez-Peña, & Colomé, 2016). For example, some evidence suggests a greater
tendency for females to self-report high levels of math anxiety compared to males (Devine,
Fawcett, Szűcs, & Dowker, 2012; Hart & Ganley, 2018; Wigfield & Meece, 1988). Regarding
math achievement, other work has found gender differences that vary in direction of math
performance levels. Some findings have suggested that boys have lower math achievement and
other findings have suggested the same for girls, with many of the differences in findings
between studies primarily depending on the measure of math achievement used, age of sample,
and ability level of students (Cimpian, Lubienski, Timmer, Makowski, & Miller, 2016; Voyer &
Voyer, 2014). As another example of group inequities, some studies have found that samples of
African American students achieve lower math scores compared to samples of mostly European
American students (Else-Quest, Mineo, & Higgins, 2013; Hall et al., 1999; Sonnenschein &
Galindo, 2015), although socioeconomic status may explain these racial and ethnic differences
(Lubienski, 2002). Given that math anxiety and math achievement are instrumental in
understanding a person’s academic and career choices, it is important to understand whether
group inequities found in math anxiety and math achievement, separately, are also prevalent in
their relation. In the case where there is a stronger relation between math anxiety and math
achievement for certain groups that also tend to have lower achievement or higher anxiety, these
groups would be most in need of targeted interventions to reduce math anxiety or improve math
skills in order to minimize negative academic-related outcomes.
RELATION BETWEEN MATH ANXIETY AND MATH ACHIEVEMENT
8
Math Anxiety-Math Achievement Link
Numerous theories have been posited to explain the negative relation between math
anxiety and math achievement, with much of the initial work rooted in theories derived from the
general anxiety and test anxiety literatures (Eysenck & Calvo, 1992; Liebert & Morris, 1967;
Wine, 1971) and adapted to accommodate the math-specific context. The primary theories
explaining the anxiety-performance relation are described briefly below (for detailed reviews,
see Beilock & Maloney, 2015, Carey, Hill, Devine, & Szucs, 2016, or Foley et al., 2017).
One major theory explaining the anxiety-performance link is the processing efficiency
theory. In this theory, cognitive worry interferes with cognitive capacities required for efficient
and accurate performance (Eysenck & Calvo, 1992). This reduction in efficiency is theorized to
be attributable primarily to an overload of working memory resources (Ashcraft, Kirk, & Hopko,
1998; Caviola, Mammarella, Cornoldi, & Lucangeli, 2012). Thus, in the presence of a math-
related stressor such as solving a multiplication problem or learning about the commutative
property of multiplication, math anxiety is proposed to use working memory resources, which
would otherwise be available to solve the problem or learn math content. An expanded version of
this theory, the attentional control theory, further proposes that initial attention to a task is
controlled by either the stimulus-driven system or the goal-directed system (Eysenck, Derakshan,
Santos, & Calco, 2007). In the case of math anxiety, a math stressor activates the stimulus-driven
system, which then undermines the goal-directed system of completing the math task (Eysenck et
al., 2007). Furthermore, negative cognitive biases, such as tendencies to attend to specific stimuli
and interpret them as threatening, are thought to be part of the initial processing components that
enable the distraction, making it difficult for an individual to focus on the details of a math
problem and instead fixate on the negative thoughts (Macleod & Mathews, 2012). Taken
RELATION BETWEEN MATH ANXIETY AND MATH ACHIEVEMENT
9
together, these theories suggest that, in the presence of math stimuli, the attention of a person
with math anxiety, who may have a tendency to attend to and interpret math stimuli as
threatening, gets redirected from the goal of completing the task to the math stressor. Ultimately,
this redirection of attention reduces the available working memory to efficiently and accurately
complete the math task at hand.
Another theory has suggested a causal relation in the opposite direction of the attentional
control theory, whereby poor math achievement causes heightened math anxiety. The deficit
model suggests that poor basic number processing (e.g., counting, subitizing) is the primary
reason for anxiety during math situations (Maloney, Risko, Ansari, & Fugelsang, 2010; Núñez-
Peña & Suárez-Pellicioni, 2014; Tobias, 1986). This theory suggests that deficits in basic
numerical processing lead to negative encounters with math, which then creates anxiety during
subsequent math-related experiences and tasks. Several studies have provided empirical support
for this model, finding that students with high math anxiety perform worse than their lower math
anxiety counterparts in number magnitude representation skills (Maloney et al., 2010; Núñez-
Peña & Suárez-Pellicioni, 2014). Some researchers have further extended the math deficit model
to individuals with math learning disabilities, providing empirical evidence suggesting that these
populations are more susceptible to math anxiety than individuals without math learning
disability (Lai, Zhu, Chen, & Li, 2015; Wu, Wilcutt, Escovar, & Menon, 2014). However, other
work has failed to find support for this interpretation (Devine, Hill, Carey, & Szűcs, 2017).
Though the attentional control theory and the deficit model could be seen as competing
conceptualizations of the math anxiety-math achievement link, the opposing causal directions
found between studies testing these theories may instead be artifacts of study design.
Specifically, longitudinal studies often find that early math achievement influences later math
RELATION BETWEEN MATH ANXIETY AND MATH ACHIEVEMENT
10
anxiety (Ma & Xu, 2004; Meece, Wigfield, & Eccles, 1990), while experimental studies find that
math anxiety causes math achievement difficulties due to math anxiety’s online use of working
memory capacities (Ashcraft, Krause, & Hopko, 2007). Importantly, some work has attempted to
reconcile both theories by suggesting that these two causal pathways occur simultaneously
(Ashcraft et al., 2007; Carey et al., 2016; Pekrun, 2006). More generally, Pekrun’s control-value
theory of achievement emotions suggests that achievement emotions and achievement are
reciprocally related in a feedback loop (Pekrun, 2006). With regard to the domain of math and
the emotion of anxiety, the reciprocal theory combines the two theoretical perspectives of the
attentional control theory and the deficit model that assume different causal relations, and
proposes that math anxiety and math achievement are causally related to each other
bidirectionally (Devine et al., 2012; Gunderson, Park, Maloney, Beilock, & Levine, 2018; Ma &
Xu, 2004). Research has found supporting evidence for this perspective, finding differing
magnitudes of causal importance between math anxiety and math achievement depending on the
age of the sample (Cargnelutti, Tomasetto, & Passolunghi, 2017; Gunderson et al., 2018; Pekrun
et al., 2017).
Potential Moderators of the Math Anxiety-Math Achievement Link
Based on previous empirical evidence, the relation between math anxiety and math
achievement has been theorized to vary depending on a number of sample and study factors. For
example, the two meta-analyses from the 1990s that investigated this relation found several
factors differentiated the strength of the negative correlation, including the gender of primary and
secondary school students (Hembree, 1990) and the assessments used to measure math
achievement (Ma, 1999). Of importance, many changes in social-contextual factors and study
measures have occurred over the last 25 years that may contribute to varying strengths in the
RELATION BETWEEN MATH ANXIETY AND MATH ACHIEVEMENT
11
relation that were not evident or have changed since the publication of previous meta-analyses.
Accordingly, it is important to conduct an updated and thorough moderator analysis on the
current available work in order to understand the nuanced between-study differences that may
impact the strength of the reported math achievement-math anxiety relation. It is also important
to note that, for the moderators, the difference in the relations between subgroups (i.e., males,
females) is generally theorized to vary in magnitude (i.e., small versus moderate correlation) and
not in direction (i.e., positive versus negative correlation), which is generally found to be
negative.
Demographics of sample.
Gender. Previous research has found gender differences in self-reported math anxiety,
with higher self-reported scores found for girls than for boys and for women than for men
(Devine, et al., 2012; Hart & Ganley, 2019). Small gender differences have also been found in
math achievement, although the direction is less clear-cut (Cimpian et al., 2016; Hyde, Fennema,
& Lamon, 1990). The evidence so far on gender differences in the relation between math
anxiety and math achievement has also been mixed. The two meta-analyses from the 1990s that
investigated this relation each came to a different conclusion on this topic: Hembree (1990)
found a stronger negative correlation for male students compared to female students in grades 5
through 12 but not for students in postsecondary school, whereas Ma (1999) found the
correlations to be similar for females and males. Some theory (Aiken, 1970) as well as recent
empirical evidence (Hill et al., 2016) adds yet another possible conclusion, suggesting that a
stronger negative relation between math anxiety and math achievement exists for females
compared to males. In the present meta-analysis, we will attempt to clarify these contradictory
findings by empirically testing whether gender moderates the relation between math anxiety and
RELATION BETWEEN MATH ANXIETY AND MATH ACHIEVEMENT
12
math achievement, using the combined power of effect sizes from studies reporting correlations
for completely male or female samples.
Race, ethnicity, and country. In addition to gender differences in the relation between
math anxiety and math achievement, there may be significant differences that are evident
between racial groups, ethnic groups, or country of origin. Variability in math achievement and
math anxiety, separately, has been found between samples from different countries and samples
of different racial and ethnic backgrounds (Cipora, Szczygiel, Willmes, & Nuerk, 2015; Else-
Quest, Mineo, & Higgins, 2013; OECD, 2016; Pretorius & Norman, 1992; Young & Young,
2016; Zabulionis, 2001). Importantly, there may be variations that stem from the education
systems between countries and within countries that may be associated with the differences seen
in math anxiety and math achievement between racial/ethnic groups and countries. Investigating
whether the differences further appear in the relation between math anxiety and math
achievement will serve to better inform the roles of educational practices and policies between
countries and for different racial/ethnic groups.
When examining the influence of race on the correlation between math anxiety and math
achievement, previous work has found that the magnitude of the correlation did not differ for
samples that consisted of a homogenous race (e.g., effect sizes from majority European sample
or majority Asian sample combined into one group) compared to samples that were racially
diverse (Ma, 1999). However, it is unclear whether there is enough information available from
different racial groups within a specific country in the current literature that will allow for
meaningful comparisons between these more specific groups (e.g., majority African American
sample, majority Asian American sample, majority European American sample). We will
examine whether these potential differences can be tested in the present study.

RELATION BETWEEN MATH ANXIETY AND MATH ACHIEVEMENT
13
Additionally, some work has been done to clarify whether there are differences in the
relation between math anxiety and math achievement between countries (Engelhard, 1990; Foley
et al., 2017; Verkijika & De Wet, 2015). However, confounds related to the age of the study
samples may limit the generalizability of study findings. For example, analyses conducted from
international, large-cohort data sets of 15-year-old students, such as the PISA, have reported
significant differences across countries in the magnitude of the negative relation between math
anxiety and math achievement (Foley et al., 2017; Lee, 2009). Several other studies investigating
this relation in younger student samples across different countries have found varying
correlations, ranging from not significant to significant (Hill et al., 2016; Ganley & McGraw,
2016; Krinzinger et al., 2009; Vukovic, Kieffer, Bailey, & Harari, 2013). Both of these examples
suggest that differences in the size and significance of the relation for between different countries
may be due to the age of the sample as well as the country of the sample. To date, no work has
examined between-country differences in the relation between math anxiety and math
achievement with a study sample encompassing participants of various age levels. Thus in the
present meta-analysis, we aim to fill these gaps and examine whether the relation between math
anxiety and math achievement appears different across varying racial and ethnic groups and
across countries with samples of all ages.
Age and grade level. Research has investigated the relation between math anxiety and
math achievement in students of different ages. Notably though, the two meta-analyses from the
1990s did not report effect sizes from samples of students younger than grade 4 (Hembree, 1990;
Ma, 1999). The absence of younger samples in these two meta-analyses likely occurred because
no research investigating this relation had been conducted on younger students; at this point in
RELATION BETWEEN MATH ANXIETY AND MATH ACHIEVEMENT
14
time, there were not many, if any, valid measures available to assess math anxiety in students
younger than grade 4 (Suinn, Taylor, & Edwards, 1988).
In the years since these publications, multiple researchers have developed and validated
math anxiety measures for use with students as young as grade 1, with some of this work finding
evidence for high levels of math anxiety in some students at these young ages (Ganley &
McGraw, 2016; Harari et al., 2013; Ramirez, Gunderson, Levine, & Beilock, 2013; Wu, Amin,
Barth, Malcarne, & Menon, 2012). Importantly though, studies investigating the relation between
math anxiety and math achievement in young children have found inconsistent results (Harari et
al., 2013; Hill et al., 2016; Jameson, 2014; Krinzinger, Kaufmann, & Willmes, 2007; Thomas &
Dowker, 2000). Some evidence suggests that the association between math anxiety and math
achievement for 6 to 9-year-olds is not significant (Thomas & Dowker, 2000), whereas other
research has found significant associations in samples of young children (Harari et al., 2013;
Krinzinger et al., 2007). Some of this work suggests that, when found to be significant, this
relation in younger children is due to general anxiety that is not math-specific (Hill et al., 2016).
The relation found in samples of young children may also be confounded by geographic
differences or anxiety measure differences, a possibility that is discussed in other sections of this
manuscript.
As for adolescents and young adults, a large body of research has found small-to-
moderate negative correlations between math anxiety and math achievement in middle school,
high school, and undergraduate student samples (Hembree, 1990; Ma, 1999). A large amount of
this work has been with undergraduate college students, and this methodological choice is likely
due to the ease with which an undergraduate sample can be accessed for research purposes in a
university setting. Some recent work has also examined whether the relation may differ in non-

RELATION BETWEEN MATH ANXIETY AND MATH ACHIEVEMENT
15
student adult samples (Beilock, Gunderson, Ramirez, & Levine, 2010; Hart & Ganley, 2019;
Maloney, Ramirez, Gunderson, Levine, & Beilock, 2015), finding similar small-to-moderate
correlations in these samples. Overall though, it is currently unclear whether the magnitude of
the relation varies in size at different points of development.
Teachers. In addition to demographic characteristics such as gender, race, and age, a
person’s career choice may moderate the relation between math anxiety and math achievement.
Specifically, teachers, often elementary-level educators, have been a group of professionals that
have been studied with regard to their math anxiety. Previous research has found higher levels of
math anxiety for elementary education majors compared to people in other college majors like
the social sciences and business (Hembree, 1990). This higher than typical math anxiety in
teacher samples may have short- and long-term impacts on the students they educate. Some
research further suggests that teachers’ math anxiety may impact their students’ math
performance (Beilock et al., 2010; Ramirez, Hooper, Kersting, Ferguson, & Yeager, 2018).
Thus, a comparison of this relation for teacher samples compared to other samples is imperative
as it is unclear whether teacher math anxiety is more or less related to their math knowledge
when compared to the rest of the population.
Students with low math ability. Another subsample where we may find a different
relation between math anxiety and math achievement is students with low math ability. More
broadly, research has found that math anxiety levels were similar for students with low and
average levels of math ability (Hembree, 1990). Importantly though, according to the deficit
model described earlier in this paper, which theorizes that poor math performance leads to math
anxiety, it is suggested that students with low math ability may have higher math anxiety than
their counterparts with average math abilities. Some behavioral studies as well as brain imaging
RELATION BETWEEN MATH ANXIETY AND MATH ACHIEVEMENT
16
studies have found supporting evidence for this hypothesis (Lindskog, Winman, & Poom, 2017;
Maloney et al., 2010; Núñez-Peña & Suárez-Pelicioni, 2014). However, whether there is a
difference in the magnitude of the relation between math anxiety and math achievement for
students with low math ability compared to students who do not have low math ability is still
unclear. Therefore, it is important to understand whether a differential trend exists in this relation
for students with low math ability compared to samples that are not selected for low math ability.
Measure characteristics.
Math anxiety scales. With the current availability of a variety of scales to assess math
anxiety, it may be useful for researchers to know how each scale differentially relates to math
achievement when selecting their study measures. One of the first and most well-known scales to
measure math anxiety is the 98-item Math Anxiety Rating Scale (MARS; Richardson & Suinn,
1972). In his 1999 meta-analysis, Ma compared the correlations of samples using the MARS (k =
15) to samples using other, non-MARS scales (k = 22). Importantly, he found no differences in
the correlations between these two groups of studies, suggesting that the MARS and non-MARS
scales produced similar correlations with math achievement.
However, since Ma’s (1999) meta-analysis, many newer and shorter math anxiety scales
have been developed using the most current psychometric methods (e.g., Ganley & McGraw,
2016; Harari et al., 2013; Hopko, Mahadevan, Bare, & Hunt, 2003; Núñez-Peña, Guilera, &
Suárez-Pellicioni, 2014). Some scales have also been adapted from previous scales for a variety
of reasons, such as to accommodate young children’s language abilities (e.g., Ganley &
McGraw, 2016; Harari et al., 2013), to be translated and better understood in other languages and
countries (e.g., Carey, Hill, Devine, & Fuchs, 2017), and to assess anxiety in more specific math
content areas like statistics (e.g., Baloğlu, 2002). In light of the number of novel math anxiety
RELATION BETWEEN MATH ANXIETY AND MATH ACHIEVEMENT
17
scales, it is important to examine whether the math anxiety scale used moderates the relation
between math anxiety and math achievement.
Components of math anxiety. Some of the work investigating math anxiety has treated it
as a unidimensional construct (Richardson & Suinn, 1972); however, some researchers have
investigated whether math anxiety is multidimensional (Ganley & McGraw, 2016; Lukowski et
al., 2016; Rounds & Hendel, 1980; Plake & Parker, 1982). Evidence from factor analyses has
indicated that math anxiety is multidimensional, suggesting that, depending on the items used
within a scale, math anxiety can be made up of a variety of components. One distinction that has
been made is between worry, or the cognitive dimension of anxiety, and emotionality, or the
physiological dimension of anxiety (Liebert & Morris, 1967). Worry consists of negative
expectations and self-deprecating thoughts about a math situation, whereas emotionality refers to
the dread and unpleasant physical sensations associated with a math situation.
Another distinction has been made between math learning anxiety and math evaluation
anxiety (Plake & Parker, 1982; Hopko et al., 2003). Math learning anxiety involves responses to
situations surrounding learning in a math classroom, such as seeing the teacher write a math
equation on the board and opening up a math textbook. Math evaluation anxiety involves
responses to studying for and taking math tests. These two components were found to make up a
shortened 24-item version of the 98-item MARS (Richardson & Suinn, 1972), developed by
Plake & Parker (1982). Beyond these four components, research has also found other similar
components to these that involve anxiety associated with various aspects of math situations and
tasks, such as numerical processing anxiety (Wu et al., 2012), math problem-solving anxiety
(Gierl & Bisanz, 1995), and math error anxiety (Jameson, 2013). Although there may be overlap
between these categories (i.e., an item may ask about feeling worried while learning math,
RELATION BETWEEN MATH ANXIETY AND MATH ACHIEVEMENT
18
combining components of worry and math learning anxiety), researchers have primarily
distinguished math anxiety between worry and emotionality or between math learning anxiety
and math evaluation anxiety components of math anxiety.
Some research has been done to examine whether there are differences in the relations
with math achievement for different components of math anxiety (Ganley & McGraw, 2016;
Lukowski et al., 2016). For example, Wigfield & Meece (1982) found that the component of
worry had weaker relations with two assessments of math achievement (both rs = .02) than did
the component of negative affective reactions and math achievement (rs = -.22 and -.26). Thus, it
is important to understand whether, in the work currently available, the component of math
anxiety is an important distinction to take into account when examining the relation between
math anxiety and math achievement.
Math assessments. In addition to the math anxiety scale used, the strength of the relation
between math anxiety and math achievement may also depend on the type of assessment used to
measure math achievement. In general, the strength of the relation between anxiety and
performance is strong for high-stakes achievement measures, such as the SAT (Cassady &
Johnson, 2002). High-stakes testing situations may invoke high levels of anxiety and, as
suggested by the attentional control theory, this may lead to a stronger association with
achievement than other testing situations. However, meta-analytic work has shown a lower-
magnitude correlation between math anxiety and math achievement for standardized
achievement tests in comparison to researcher-made math tests and teacher reports of children’s
math achievement (Ma, 1999). It is not yet known whether evidence from recent work supports
the potential theory that a stronger relation exists between math anxiety and high-stakes,
standardized math tests compared to low-pressure testing situations, like researcher-developed
RELATION BETWEEN MATH ANXIETY AND MATH ACHIEVEMENT
19
measures. Additionally, it may be important to test whether there are differences in the relation
with math anxiety for more diverse math achievement measures, such as exam scores in math
classes, and between more specific contexts of standardized achievement measures, such as
college entrance exams and tests administered in lab experiments.
Math content. Previous work has found significant, small-to-moderate correlations
between math anxiety and different math content areas, such as computation (r = -.25), math
concepts (r = -.27), problem solving (r = -.27), and abstract reasoning (r = -.40; Hembree, 1990).
Despite these significant correlations, most of these effect sizes were constrained to samples in
grade 7, high school, and postsecondary school. To extend this work, it is prudent to further
examine what the relation between math anxiety and math achievement looks like for more
specific math content areas typically developed or learned during childhood, such as
approximate number system or basic number knowledge. Additionally, with the number of
studies that have examined this relation in the past 25 years, it may be possible to expand the
search to include samples of a wider range of ages.
Though previous work did find significant relations between math anxiety and math
achievement for some content areas (Hembree, 1990), math content area has yet to be tested as a
moderator of the relation between math anxiety and math achievement. There is some empirical
evidence indicating that there may be different relations between math anxiety and math tests
that assess certain math content; for example, difficult math problems with high cognitive
demands are more impacted by math anxiety in comparison to those math problems demanding
less cognitive resources (Ashcraft, 2002). Additionally, early math skills have been found to be
important for later math skills (Jordan, Kaplan, Raminemi, & Locuniak, 2009; Siegler et al.,
2012); as such, testing whether there are differential relations between math anxiety and different
RELATION BETWEEN MATH ANXIETY AND MATH ACHIEVEMENT
20
content areas that typically develop and are learned during specific points in development could
have important implications on our understanding of math learning and practices in education.
The Present Study
Throughout the past several decades, researchers have made a strong collective effort to
understand the factors that significantly relate to math achievement, homing in on math anxiety
as a crucial correlate. In the current meta-analysis, we investigated two main research questions.
First, we examined the strength of the overall correlation between math anxiety and math
achievement across studies investigating this relation from 1992 through 2018. Second, we
conducted a moderator analysis to investigate whether the size of the correlation between math
anxiety and math achievement differed depending on study and sample characteristics,
specifically 1) gender, 2) race/ethnicity, 3) country, 4) grade level, 5) teacher samples, 6) low
math ability samples, 7) math anxiety scale, 8) component of math anxiety, 9) math assessment
type, and 10) content area of math assessment.
Method
Study Search and Selection
The search for relevant articles for the present study consisted of two techniques. The
first technique was based on Ma’s (1999) meta-analytic search techniques. We conducted an
online database search across three journal databases that focus on literature in psychology,
education, and medicine: PsycInfo, Educational Resources Information Center (ERIC), and
Medline. In order to remain consistent with the search terms and Boolean operators across
databases, we used the ProQuest platform for each database search. We queried any available
document that contained our search terms, including both peer-reviewed publications and grey
literature, such as dissertations, theses, reports, and conference proceedings. The selected year
RELATION BETWEEN MATH ANXIETY AND MATH ACHIEVEMENT
21
criteria for these database searches ranged from January of 1992, the year of Ma’s (1999) last
relevant study, to any documents or publications available in May of 2018.
In order to conduct an exhaustive search through our query of online databases, we
expanded on the three search terms of mathematics, anxiety, and achievement originally used by
Ma (1999). We included the following search terms, making sure to select for articles that
included both the word math, or a related synonym, and the word anxiety (denoted by the
connecting AND): mathematics, math, maths, arithmetic, numerical, geometry, statistics,
calculus, OR algebra AND statistics anxiety, mathematics anxiety, math anxiety, OR maths
anxiety. We specifically searched for these terms if they appeared anywhere in a document.
For our second search technique to procure relevant studies for our literature search, we
sent a message to the Cognitive Development Society (CDS) listserv and requested unpublished
data or manuscripts on the relation of math anxiety and math achievement that could be included
in the present meta-analysis. Of note, this solicitation of data from the CDS listserv also included
several unpublished effect sizes from studies in the labs headed by two of the authors of the
current study.
Studies were eligible to be included in the meta-analysis if they met the following
inclusionary criteria. First, studies had to either report a zero-order correlation coefficient
between math anxiety and math achievement or have collected data that made the calculation of
a zero-order correlation coefficient possible. If the relation was not reported directly in the paper
but data were collected, or if multivariate regression coefficients were reported, zero-order
correlations were requested from authors via email. Second, studies had to measure math
achievement or math performance using a math-related assessment. Studies assessing math
achievement as student’s self-reported beliefs about their math ability or overall GPA scores that

RELATION BETWEEN MATH ANXIETY AND MATH ACHIEVEMENT
22
were not specific to math were excluded. Third, if a study tested an intervention, we included
effect sizes from experimental groups only if data were available for both math anxiety and math
achievement prior to the intervention. For experimental study control groups, effect sizes from
assessments measured before and after the intervention were included.
As a fourth inclusion criterion, we chose to examine only studies published in the English
language to reduce potential errors in translation or interpretation. A fifth inclusion criterion was
that the achievement and anxiety measures had to be collected and matched by participant and
not be collected on separate groups of people (e.g., they could not have math achievement for
teachers and math anxiety for students). The sixth, and final, inclusion criterion was that
correlational studies were to be included even if they reported on longitudinal data. Correlation
coefficients from longitudinal studies with up to two time points were obtained between time
point (i.e., time 1 math anxiety with time 1 math achievement, time 1 math anxiety with time 2
math achievement, etc.). Correlation coefficients from longitudinal studies with more than two
time points were obtained for each time point separately, rather than for a composite of all time
points or between each and every time point (e.g., for three time points, we coded three
correlations: time 1 math anxiety with time 1 math achievement, time 2 math anxiety with time 2
math achievement, and time 3 math anxiety with time 3 math achievement).
Coding Procedures and Included Studies
Figure 1 displays a flow chart of the article selection process. The two database searches
yielded a total of 1556 relevant documents. We excluded 293 repeated titles, making a final
count of 1263 independent documents found through the initial database search. These
documents were then subject to close review using the previously outlined inclusion criteria. At
each round, questions regarding coding specific articles were discussed as a group through a
RELATION BETWEEN MATH ANXIETY AND MATH ACHIEVEMENT
23
private, online messaging system and through ad hoc meetings as needed, with the first and
second authors resolving any questions unanimously. Training for each round of coding
consisted of reviewing the inclusion criteria as a group prior to coding articles and answering any
questions that arose until all criteria were well understood.
In Round 1 of narrowing down a final study sample, the first four authors reviewed the
study titles and abstracts obtained from the online database search and separated these articles
into yes, no, and maybe categories based on inclusion criteria. During Round 1, we excluded the
658 articles that were coded no, included the 266 articles that were coded yes, and determined
that the inclusion of the remaining 339 maybe documents was unclear and subject to further
inspection in Round 2.
Round 2 consisted of reviewing full-text documents separately for each of the articles
identified as maybes from Round 1 and categorizing them into yes or no categories, again based
on inclusion criteria. We split the articles so that each article was coded by two coders selected
from the first four authors. If the two coders’ category choices did not match for an article, these
articles were discussed at a roundtable discussion among the first four authors to determine
whether or not the study was eligible to be included, using the abstract and full text of the article
to make the decision. Out of the 339 articles subject to Round 2, we excluded 192 studies and
included 147 studies.
The 413 included articles from Round 1 and Round 2 were coded for descriptive
information and information for moderation analyses during Round 3. The following study
information from included studies in Rounds 1 and 2 were entered into a Qualtrics survey:
correlation coefficients, sample size, gender, race/ethnicity, country, age and grade level, teacher
sample, low math ability sample, math anxiety scale, math assessment type, and math content
RELATION BETWEEN MATH ANXIETY AND MATH ACHIEVEMENT
24
area. These studies were divided between all six authors, all of whom attended a 1-hour training
session to learn how to extract the necessary information for each relevant variable prior to
coding. In this round, we further excluded 86 studies. Out of the remaining 327 studies that were
included and coded during Round 3, 128 studies reported at least 1 correlation coefficient that
could be used in this meta-analysis.
The remaining 199 studies did not include the necessary correlation coefficient(s) and
were subject to Round 4, where authors were emailed to request correlation information.
Corresponding authors of specific studies were contacted by email by the first or second author.
During Round 4, we received responses with the information that we needed from authors for 69
of these studies (35%). We excluded the remaining 130 studies from the 199 studies subject to
Round 4 because we were unable to obtain the effect size information needed for inclusion.
Thus, overall, the two online database search waves yielded 197 relevant studies to
include in this meta-analysis. The second search technique of emailing the CDS listserv yielded
information from 26 unpublished data sets and manuscripts. In total, we included 223 studies in
the present meta-analysis.
Inter-rater reliability. Twenty percent of the studies included in Round 3 were selected
to be double-coded and split between all six coders. The index of agreement rate was calculated
for all data extracted by coders who double-coded the article for the inclusion variable, the
number of effect sizes, correlation, sample size, gender, race/ethnicity, country, grade level,
teachers, students with low math ability, math anxiety scale (separate for child, adolescent/adult,
and scale topic), components of math anxiety, math achievement scale, and math content.
We first calculated the agreement rate for the inclusion variable that indicated whether
the coder decided to include the study in our sample, based on our inclusion criteria. We then
RELATION BETWEEN MATH ANXIETY AND MATH ACHIEVEMENT
25
calculated the agreement rate for the number of effect sizes that each coder decided was pertinent
from each study. If coders disagreed on the inclusion variable, the study was not included in the
agreement rate calculation for the number of effect sizes and moderator variables. Finally, we
calculated the agreement rate for each of the moderator variables, based on the final codes that
these originally entered codes would have been categorized into for the moderator analyses (see
Coding Procedures section). If coders disagreed on the number of effect sizes, we only coded the
agreement rate for moderator variables for the effect sizes that overlapped between the coders.
Because we had different pairs of raters selected from six possible raters code a random subset of
these studies, agreement rate was calculated for each pair of raters (15 possible pairs) and
averaged across them for each variable.
The average agreement rate for each variable is reported in Table S1. The average
agreement rate was 91% for the inclusion variable, 75% for the number of effect sizes, 85% for
the correlation coefficient, and 72% for the sample size. Average agreement rates for the
moderator variables ranged from 84% to 100%, with an average of 94.8%. To ensure accurate
coding of variables from included studies, most included study variables were checked for
accuracy by another independent coder or verified by the first author.
Demographic information. For each effect size, demographic and measure information
were recorded in an online Qualtrics survey and then coded for the moderator analysis into
particular categories. The coding scheme is outlined below.
Gender. Gender was entered as the percentage of males reported in the sample for each
effect size. If gender information was not available in the document, gender was entered as not
reported. Reported gender information was then coded into two categories: 1) samples made up
of 100% male participants (k = 38) and 2) samples made up of 100% female participants (k =
RELATION BETWEEN MATH ANXIETY AND MATH ACHIEVEMENT
26
52). Any samples with greater than 0, less than 100%, or not reported male percentages were not
included in the gender moderator analysis (k = 657).
Race/ethnicity. Race/ethnicity was entered as whether the sample associated with each
effect size consisted of 75% or more 1) White, 2) Black, 3) Hispanic, or 4) Asian participants, 5)
whether the sample consisted of a racially or ethnically diverse group (i.e., no race or ethnicity
was more than 75% of the sample), or 6) whether the racial or ethnic breakdown of the sample
was not reported. From this initial coding scheme, we found few effect sizes that consisted of
primarily Black (k = 1), Hispanic (k = 1), or Asian participants (k = 42). We also found that a
large percentage of the effect sizes that had reported race/ethnicity information were from the
United States (75%), and that all except one of the Asian samples were from Asia. Thus, to
reduce potential confounds related to country, we only included effect sizes for samples from the
United States in the race/ethnicity moderator analysis. We ended up coding our race/ethnicity
variable into two categories: 1) effect sizes with samples consisting of 75% or more White
participants (k = 104) and 2) effect sizes with samples consisting of less than 75% White
participants (k = 72). Any effect sizes without race/ethnicity information reported were not
included in the race/ethnicity moderator analysis (k = 571).
Country. Country information was entered as either the country or countries reported by
the paper for the sample for each effect size or as not reported if country information was not
available. There were 52 countries represented (see Table S2 for individual country correlations),
and 23 out of these 52 countries (44.2%) had only k=1 (i.e., only one effect size represented the
relation for that one country). Thus, we grouped countries according to their respective continent.
We will refer to the “country” moderator as the “continent” moderator when describing our
analyses in the remainder of the paper. We had effect sizes representing samples from six

RELATION BETWEEN MATH ANXIETY AND MATH ACHIEVEMENT
27
continents: North America (k = 389), South America (k = 26), Europe (k = 204), Asia (k = 103),
Africa (k = 11), and the geographic region of Oceania, which includes the countries of Australia
and New Zealand (k = 8). Samples that did not report country information were not included in
the continent moderator analysis (k = 6).
To account for the variation in cultures among the many countries within these
continents, we conducted supplemental moderator analyses by country or region for each
continent. North America, South America, Oceania, and Africa each had a small enough number
of countries to compare at the country level. However, Asia and Europe were represented by
effect size estimates from a large number of countries (i.e., Asia = 16 countries; Europe = 26
countries). Thus, we tested region as a moderator. Asia was divided into five regions (i.e., North,
South, East, West, Southeast; Pariona, 2018) and Europe into four regions (i.e., North, South,
East, West; Nag, 2018). We have included a figure of the overall effect sizes for these Asian and
European regions (as well as the other continents) in Figure S1. Supplemental moderator
analyses for each continent and region, separately, are presented in Table S3 and pairwise
comparisons for significant moderators are presented in Table S4.
Grade level. Grade level(s) (i.e., year in school) of the sample for each effect size was
selected from one or more of the following choices: kindergarten, grade 1, grade 2, grade 3,
grade 4, grade 5, grade 6, grade 7, grade 8, grade 9, grade 10, grade 11, grade 12, community
college students, undergraduate students, graduate students, non-student adults, or not reported.
Mean age, standard deviation of age, minimum age, and maximum age of each sample were also
recorded if reported in the study.
For samples with no reported grade level but with a reported age, we estimated the grade
according to the average compulsory age for students entering into each grade from the United
RELATION BETWEEN MATH ANXIETY AND MATH ACHIEVEMENT
28
States, based on the mean age or the highest category for the range of age if reported (Education
Commission of the States, 2018). For samples that included participants from two grades across
multiple categories (e.g., grades 5 and 6) we first estimated the grade based on mean age if
available. If mean age was not reported and samples were from consecutive grades (i.e., grades 8
and 9), we coded the sample into the category for the highest grade of the two. If mean age was
not reported and the samples were from two nonconsecutive grades (e.g., grades 6 and 9), we
coded the sample into the category for the average grade rounded up (e.g., rounded up to grade 8
from grade 7.5). If more than two consecutive grades were reported with an odd number of
grades, and several of them overlapped across multiple groups (e.g., grades 6 through 10), we
first estimated the grade based on mean age, if available. If the mean age was not reported, a
mean grade was calculated based on the median grade of the total grade range reported, and
subsequently coded into the grade category in which that median grade was included (e.g.,
samples with students in grades 7 through 9 were calculated to be in grade 8 and coded as being
in the grade category for grades 6 through 8). If more than two grades were reported that were
not consecutive (e.g., grades 7, 8, and 10), the average grade was taken, rounded to the closest
integer, and coded into the corresponding category (e.g., the average of grades 7, 8, and 10 is
grade 8.33 and would be rounded to grade 8 and would fall under the category for grades 6
through 8). For those samples that included students in an even number of multiple, consecutive
grade levels that spanned across multiple categories, we coded them into the higher of the middle
categories (e.g., samples with students in grades 7 through 10 were coded into the high school
category because grade 9 is high school).
There were no samples of kindergarten participants. For our analysis, we coded grade
levels into six broader categories: (1) grades 1 through 2 (early elementary; k = 68), (2) grades 3
RELATION BETWEEN MATH ANXIETY AND MATH ACHIEVEMENT
29
through 5 (late elementary; k = 89), (3) grades 6 through 8 (middle/junior-high school; k = 116),
(4) grades 9 through 12 (high school or pre-university; k = 99), (5) undergraduate and graduate
students (postsecondary; k = 355), and (6) non-student adult samples (k = 20).
Teachers. Effect sizes were coded as representing teacher samples if the study reported
that the sample was made up of pre-service or practicing teachers (k = 58). We compared the
average effect size obtained with teacher samples to the average effect size obtained for non-
teacher samples (k = 689).
Students with low math ability. If the study reported that the authors selected a complete
sample based on having low math ability, we coded them as such (k = 18). We compared effect
sizes of selected samples with low math ability to effect sizes for samples not selected based on
ability level (k = 729).
Measures information.
Math anxiety scale. Math anxiety measures were categorized in three different ways.
Table 1 lists definitions and examples of each of these three categorizations for math anxiety
scale. We first categorized math anxiety scales based on whether they were originally developed
to assess children’s math anxiety. Child math anxiety scales were coded into six categories: 1)
Math Anxiety Rating Scale – Elementary (MARS-E; k = 42; Suinn, Taylor, & Edwards, 1988),
2) Scale for Early Mathematics Anxiety (SEMA; k = 19; Wu et al., 2012), 3) versions of the
Math Anxiety Scale for Young Children (MASYC; k = 22; Harari et al., 2013; Ganley &
McGraw, 2016), 4) Children’s Math Anxiety Questionnaire (CMAQ; k = 36; Ramirez et al.,
2013), 5) Math Anxiety Questionnaire (MAQ; k = 11; Thomas & Dowker, 2000), and 6) all other
math anxiety scales made for children (k = 25). For this variable, any math anxiety scale that was
RELATION BETWEEN MATH ANXIETY AND MATH ACHIEVEMENT
30
not developed to assess math anxiety in children was coded as missing and excluded from the
moderator analysis for children’s math anxiety scales (k = 592).
We then categorized math anxiety scales based on whether they were originally
developed to assess adolescent and postsecondary/adult math anxiety. Ten categories were coded
for adolescent and postsecondary/adult math anxiety measures: 1) Math Anxiety Rating Scale
(MARS) and MARS-based measures (k = 197; e.g., Hopko et al., 2003; Richardson & Suinn,
1972), 2) one-item math anxiety measures (k = 18; e.g., Núñez-Peña et al., 2014), 3) Fennema
Sherman Math Anxiety Scale (FSMAS; k = 44; Fennema & Sherman, 1976), 4) MARS-based
measures created for adolescents (k = 8), like the MARS-Adolescents (MARS-A; Suinn &
Edwards, 1982), 5) the math anxiety scale used by the Programme for International Student
Assessment (PISA; k = 56), 6) Achievement Emotion Questionnaire Math Anxiety Subscale
(AEQ; k = 7; Pekrun, Goetz, Frenzel, Barchfeld, & Perry, 2011), 7) Math Anxiety Scale created
by Betz (MAS; k = 25; Betz, 1978), 8) Math Anxiety Scale created by Meece (MAS; k = 15;
Meece, 1981), 9) Math Anxiety Scale created by Bai and colleagues (k = 19; Bai, Wang, Pan, &
Frey, 2009), and 10) all other measures (k = 123). For this variable, any math anxiety scale that
was specified to assess math anxiety in children was coded as missing and excluded from the
moderator analysis for adolescent and adult math anxiety scales (k = 235).
Math anxiety topic. We also created a third math anxiety scale variable where we coded
whether the anxiety topic assessed was math or statistics specific. For this variable, if the anxiety
scale explicitly stated that the anxiety topic being assessed was for statistics then the scale was
coded as statistics anxiety (k = 80). If the scale did not specify that it assessed anxiety in the
subject of statistics, then it was coded as math anxiety (k = 667).

RELATION BETWEEN MATH ANXIETY AND MATH ACHIEVEMENT
31
Components of math anxiety. Table 1 lists definitions and example items for four of the
most commonly measured components of math anxiety: worry, emotionality, math evaluation
anxiety, and math learning anxiety. This moderator was coded into six categories that
differentiated between these four components: 1) worry (k = 14), 2) emotionality, including
affect, dread, and negative reactions (k = 7), 3) both worry and emotionality (k = 11), 4) math
evaluation anxiety, including test and examination anxiety (k = 55), 5) math learning anxiety,
including class/course anxiety (k = 35), and 6) both math evaluation and math learning anxiety (k
= 120). If the study explicitly specified that the correlation was between one of these specific
components of math anxiety and math achievement, then it was coded in its respective category.
In addition, widely-used scales that had previous factor analyses conducted, like the MARS
(Richardson & Suinn, 1972) with factor analysis done by Rounds & Hendel (1978) and the
AMAS (Hopko et al., 2003), were coded using the factor structure found in the construct
validation studies, unless a different factor structure was found and stated for a newer individual
study or if the effect size was for one of the multiple components. If the effect size did not
explicitly specify that the math anxiety scale was assessing one of these categories or if it was
measuring categories that overlapped with other categories that were not included (e.g., math
performance adequacy anxiety) then it was excluded from the moderator analysis (k = 505).
Math assessment. Table 1 lists definitions and examples of each category for type of
math assessment. Math assessments were coded into five categories that characterized the type of
assessment: 1) standardized criterion-referenced or norm-referenced assessment used for high-
stakes testing (k = 56), 2) standardized assessment used for research purposes (k = 322), 3) non-
standardized researcher-made or other assessments (k = 166), 4) course grades (k = 113), and 5)
class exam grades (k = 90). If a math assessment contained a composite score made up of several
RELATION BETWEEN MATH ANXIETY AND MATH ACHIEVEMENT
32
measures that could be coded into one of the five categories, that measure was coded into the
appropriate category. If assessments overlapped across more than one category, these effect sizes
were coded in the “non-standardized researcher-made or other assessments” category.
Math content. We adapted the math content category definitions from Peng, Namkung,
Barnes, & Sun (2016) as a model for coding math content in the current meta-analysis. Table 1
provides definitions and examples of these categories. The content of the math assessment was
determined from each article and initially coded into whichever content area(s) they measured.
Effect sizes were then used for the moderator analysis if the assessment measured achievement
in only one content area: 1) approximate number system (k = 14), 2) basic number knowledge (k
= 30), 3) whole number calculation (k = 113), 4) word problem solving (k = 20), 5) fractions,
decimals, or percentages (k = 10), 6) geometry (k = 9), 7) algebra (k = 34), and 8) statistics, data
analysis, and probability (k = 105). If the math assessment assessed multiple content areas, the
effect size was excluded from the math content moderator analysis (k = 412).
Data Analysis
Overall average effect size. We used Pearson’s r correlation coefficient as the effect
size for the present meta-analysis. Under the assumption that the effect size would be based on
variables using scales that were continuous rather than rank-ordered or categorical, we requested
Pearson correlation coefficients from authors who reported Spearman’s correlation coefficient.
Pearson correlation coefficients were converted to Fisher’s Z-scores to approximate a normal
distribution of the population effect sizes (Cohn & Becker, 2003).
Due to varying sample and measure characteristics used to assess math anxiety and math
achievement, the overall average effect size model was fitted as a random-effects model. The
sample of included effect sizes was considered to come from a universal number of populations
RELATION BETWEEN MATH ANXIETY AND MATH ACHIEVEMENT
33
instead of one single population; therefore, the true effect size that a study estimates is
considered to be random and made up of the true estimate plus the sampling error variance and
between-studies variance. Once the true effect size estimate was calculated, we transformed the
overall Fisher’s z-score back to a Pearson’s r correlation coefficient for interpretation and
reporting purposes.
Effect sizes for samples with multiple reported correlation coefficients (i.e., dependent
samples) violate the assumption of independent samples; therefore, we conducted multilevel
meta-analyses to model the nested structure of the data. This technique accounts for correlations
between the dependent effect sizes and models the Level-1 (effect size) and Level-2 (sample)
correlations (Maas & Hox, 2004). To conduct these multilevel meta-analyses, the metafor
package from the statistical program R was used with the restricted maximum likelihood
estimation method (Viechtabauer, 2010).
Heterogeneity of effect sizes. To determine if there was a significant amount of
unexplained between-study heterogeneity (i.e., large between-samples variance beyond within-
sample variance) in the combined estimate of overall effect size and whether it would be
appropriate to test for moderators to account for this unexplained heterogeneity (Cooper, Hedges,
& Valentine, 2009), we calculated the Q-statistic and its significance. This statistic tests the null
hypothesis that the study effect sizes are estimates from a single population against the
alternative hypothesis that the observed variance in study effect sizes is greater than would be
expected by chance if all studies shared a common population effect size (Cochran, 1954). In
addition, we also calculated the associated I2 -statistic. This is a descriptive statistic that indicates
how much of the variability across studies is due to heterogeneity as opposed to chance due to
sampling error (Higgins & Thompson, 2002).
RELATION BETWEEN MATH ANXIETY AND MATH ACHIEVEMENT
34
Analyzing variability in effect sizes. We tested whether the amount of unexplained
variance across the effect sizes was attributable to specific demographic or measure
characteristics from the sample of studies. We used an ANOVA framework and performed
separate omnibus tests for each moderator variable to determine whether there were significant
differences in the size of the effect sizes between the groups in each moderator. If the omnibus
test was significant, we tested for further significant differences between effect sizes for each
subgroup of the moderator using pair-wise comparisons for every possible pair of subgroups. To
reduce the false discovery rate, we applied the Benjamini-Hochberg correction to each group of
pair-wise comparisons (Benjamini & Hochberg, 1995). Finally, to obtain overall effect sizes for
each subgroup within a moderator, we conducted random-effects multi-level models for each
subgroup using datasets that only contained effect sizes for the specific subgroup.
Publication bias. We used several indices to assess publication bias. First, we tested
whether there were significantly different correlations for effect sizes that came from published
studies compared to unpublished work. We categorized the moderator variable of publication
status into two groups, 1) published studies (k = 520) and 2) unpublished work including theses,
dissertations, and unpublished studies (k = 227).
Next, we checked whether the effect sizes included in the meta-analytic sample are
distributed symmetrically around the average overall effect size. This method to assess potential
publication bias provides a visual and statistical test that detects the difference in effect sizes
from large study samples compared to effect sizes from small study samples. Small study
samples are more likely to be published only if they produce positive results, compared to large
study samples that are more likely to be published regardless of the result (Sterne & Harbord,
2004). We created and visually inspected a funnel plot, which graphs each effect size by its
RELATION BETWEEN MATH ANXIETY AND MATH ACHIEVEMENT
35
standard error in a scatter plot, which is an indicator of the sample size of the study. We expect
the funnel plot to show an even distribution of the effect sizes around the true population effect
size, with effect sizes getting more precise and closer to the true effect size as the sample size
increases. The funnel plot would indicate publication bias against small studies if it is visually
evident that negative results (i.e., weak or positive correlations between math anxiety and math
achievement) are associated with large standard errors (i.e., lower half of plot).
We also statistically tested for asymmetry by conducting Egger’s test, a meta-regression
analysis that estimates effect size precision (i.e., the standard error) as a predictor of the
correlation coefficient, in a multi-level model (Egger, Smith, Schneider, & Minder, 1997). If the
meta-regression analysis is significant, it indicates the intercept of the dependent variable (i.e.,
the correlation coefficient) is significantly different from zero, suggesting that the effect sizes are
not distributed evenly around the true population effect size.
Finally, we also used the trim-and-fill method on the effect sizes in the meta-analytic
sample. The trim-and-fill method determines the adjusted estimate of the average overall effect
size and its significance after filling in sparse areas of the funnel plot and removing outliers
(Duval & Tweedie, 2000). The trim-and-fill method is an indicator of how biased an overall
effect size is from the current meta-analytic sample compared to the effect size from a sample
that may more accurately account for the missing effect sizes that may not have been published
and therefore are not represented on the funnel plot (i.e., file drawer problem; Rosenthal, 1979).
RELATION BETWEEN MATH ANXIETY AND MATH ACHIEVEMENT
36
Results
Overall Average Correlation Between Math Anxiety and Math Achievement
The 223 studies included in the present meta-analysis consisted of 747 correlation
coefficients from 332 independent samples with approximately 385,441 individual participants
(see supplemental materials for coded information for each effect size [Tables S5 and S6] and
references of included studies). Overall, the average correlation between math anxiety and math
achievement was small-to-moderate, negative, and significant (r = -.28, 95% Confidence Interval
[CI] [-.29, -.26]). As indicated by the Q-statistic and I2-statistic, there was a significant amount of
unexplained variance across the range of effect sizes included in the calculation of the overall
average effect size (Q = 7784.61, p < .0001, df = 747; I2 = 90.42), suggesting that these effect
sizes did not come from the same population and validating our use of a random-effects model.
Moderation Effects of Demographic and Measure Characteristics
Next, we conducted moderator analyses to examine potential demographic or measure
characteristics that might explain the variation found in the relation between math anxiety and
math achievement. Average effect sizes for subgroups within each moderator were negative and
statistically significant, with the exception of the average effect size for the approximate number
system subgroup within the math content moderator (r = -.09, 95% CI [-.18, .005], p = .06).
Table 2 shows F-test results, Q-statistics, variance explained by Level-1 and Level-2 for each
moderator analysis, and I2-statistics. Even after accounting for differences in the subgroups
within each moderator, a significant amount of heterogeneity still remained in the overall effect
size for each moderator analysis. P-values obtained from pairwise comparisons for subgroups of
significant moderators were interpreted based on Benjamini-Hochberg adjusted cutoffs. We
RELATION BETWEEN MATH ANXIETY AND MATH ACHIEVEMENT
37
report comparisons that remained significant after the Benjamini-Hochberg correction was taken
into account.
Moderation Effects of Demographic Characteristics
Gender. Figure 2 contains a forest plot for effect sizes across demographic
characteristics. The subgroups for testing gender as a moderator were samples with 100% male
participants (k = 38; r = -.24, 95% CI [-.29, -.17]) and those with 100% female participants (k =
52; r = -.28, 95% CI [-.34, -.23]). The analysis indicated that the average effect size for males
was not significantly different from the average for females (F[1, 88] = 1.19, p = .28).
Race/ethnicity. The subgroups for testing race/ethnicity as a moderator were samples
with greater than 75% White participants (k = 72; r = -.26, 95% CI [-.30, -.22]) and samples with
less than 75% White participants (k = 104; r = -.24, 95% CI [-.28, -.21]). The moderator analysis
indicated that the average effect sizes for these two groups did not significantly differ from one
another (F[1, 174] = 0.28, p = .60).
Continent. The subgroups for testing continent as a moderator were North America (k =
389; r = -.26, 95% CI [-.29, -.24]), South America (k = 26; r = -.20, 95% CI [-.37, .00]), Europe
(k = 204; r = -.27, 95% CI [-.31, -.24]), Asia (k = 103; r = -.31, 95% CI [-.36, -.25]), Africa (k =
11; r = -.25, 95% CI [-.31, -.19]), and Oceania (k = 8; r = -.38, 95% CI [-.55, -.18]). The omnibus
test for the continent moderator analysis was not statistically significant (F[5, 735] = 1.56, p =
.17), indicating that there were no statistically significant differences in the relations between
math anxiety and math achievement between samples from each of the six continents. The
results of the supplemental continent moderator analyses and pairwise comparisons are reported
in Tables S3 and S4.
RELATION BETWEEN MATH ANXIETY AND MATH ACHIEVEMENT
38
Grade. The subgroups for testing grade level as a moderator were Grades 1 and 2 (k =
68, r = -.26; 95% CI [-.31, -.23]), Grades 3 through 5 (k = 89, r = -.20; 95% CI [-.25, -.14]),
Grades 6 through 8 (k = 116, r = -.30; 95% CI [-.35, -.26]), Grades 9 through 12 (k = 99, r = -.34;
95% CI [-.36, -.31]), undergraduate and graduate students (k = 355, r = -.24; 95% CI [-.27, -
.22]), and non-student adult samples (k = 20, r = -.32; 95% CI [-.39, -.25]). The omnibus test for
the grade level moderator analysis was statistically significant (F[5, 741] = 6.64, p < .001),
indicating that at least one of the subgroups within the grade level moderator variable is
statistically significantly different from at least one of the other subgroups.
Pairwise comparisons indicated several statistically significant differences between grade
levels in the average correlation between math anxiety and math achievement (Table 3). Students
in Grades 1 and 2 demonstrated a statistically significantly lower magnitude correlation than
students in Grades 9 through 12 (b = -.07, p = .02). The average correlation for students in
Grades 3 through 5 was significantly weaker than the average correlation between math anxiety
and math achievement for students in Grades 6 through 8 (b = -.11, p = .004), Grades 9 through
12 (b = -.14, p < .001), and non-student adults (b = -.14, p = .02). In addition, the average
correlation between math anxiety and math achievement for students in Grades 6 through 8 (b =
.07, p = .01) and Grades 9 through 12 (b = .10, p < .001) were significantly stronger than the
average correlation found for postsecondary student samples.
We also were interested in further examining this relation to determine whether the grade
level differences in the relation between math anxiety and math achievement were evident across
all math content areas or just specific math content areas. We conducted post-hoc grade level
moderator analyses separately for samples with achievement measures that assessed only one
math content area (Table S7). We found that relations between math anxiety and specific math
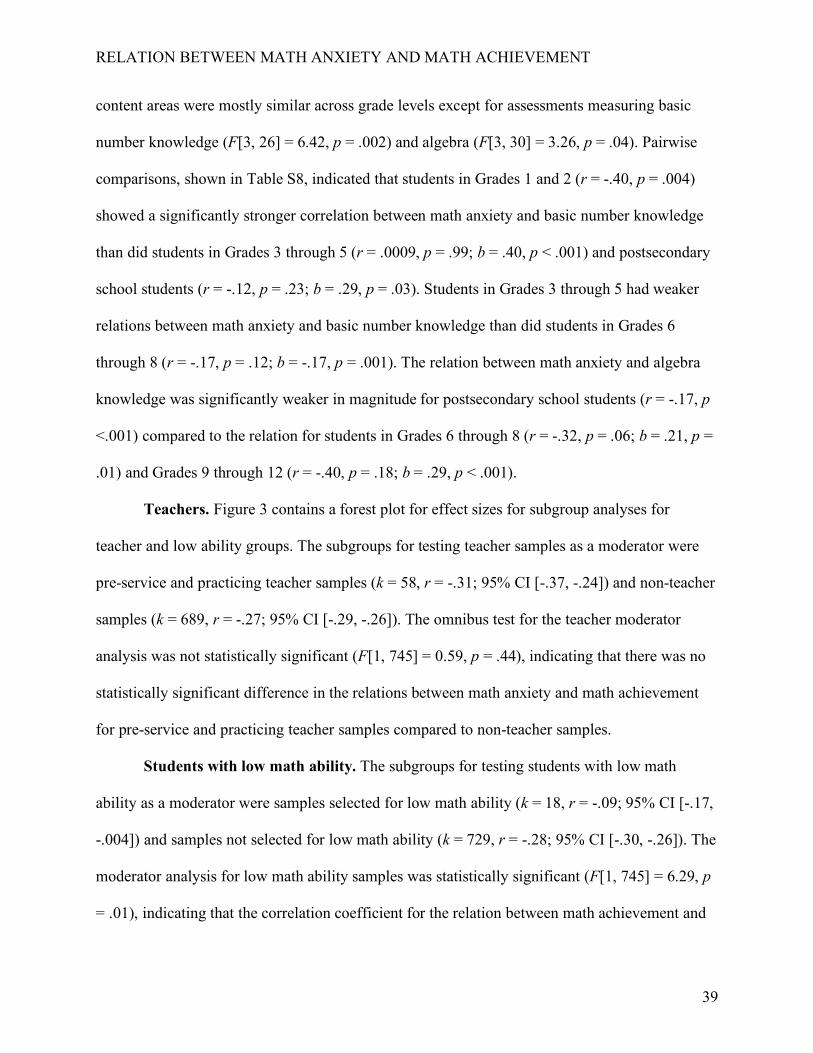
RELATION BETWEEN MATH ANXIETY AND MATH ACHIEVEMENT
39
content areas were mostly similar across grade levels except for assessments measuring basic
number knowledge (F[3, 26] = 6.42, p = .002) and algebra (F[3, 30] = 3.26, p = .04). Pairwise
comparisons, shown in Table S8, indicated that students in Grades 1 and 2 (r = -.40, p = .004)
showed a significantly stronger correlation between math anxiety and basic number knowledge
than did students in Grades 3 through 5 (r = .0009, p = .99; b = .40, p < .001) and postsecondary
school students (r = -.12, p = .23; b = .29, p = .03). Students in Grades 3 through 5 had weaker
relations between math anxiety and basic number knowledge than did students in Grades 6
through 8 (r = -.17, p = .12; b = -.17, p = .001). The relation between math anxiety and algebra
knowledge was significantly weaker in magnitude for postsecondary school students (r = -.17, p
<.001) compared to the relation for students in Grades 6 through 8 (r = -.32, p = .06; b = .21, p =
.01) and Grades 9 through 12 (r = -.40, p = .18; b = .29, p < .001).
Teachers. Figure 3 contains a forest plot for effect sizes for subgroup analyses for
teacher and low ability groups. The subgroups for testing teacher samples as a moderator were
pre-service and practicing teacher samples (k = 58, r = -.31; 95% CI [-.37, -.24]) and non-teacher
samples (k = 689, r = -.27; 95% CI [-.29, -.26]). The omnibus test for the teacher moderator
analysis was not statistically significant (F[1, 745] = 0.59, p = .44), indicating that there was no
statistically significant difference in the relations between math anxiety and math achievement
for pre-service and practicing teacher samples compared to non-teacher samples.
Students with low math ability. The subgroups for testing students with low math
ability as a moderator were samples selected for low math ability (k = 18, r = -.09; 95% CI [-.17,
-.004]) and samples not selected for low math ability (k = 729, r = -.28; 95% CI [-.30, -.26]). The
moderator analysis for low math ability samples was statistically significant (F[1, 745] = 6.29, p
= .01), indicating that the correlation coefficient for the relation between math achievement and
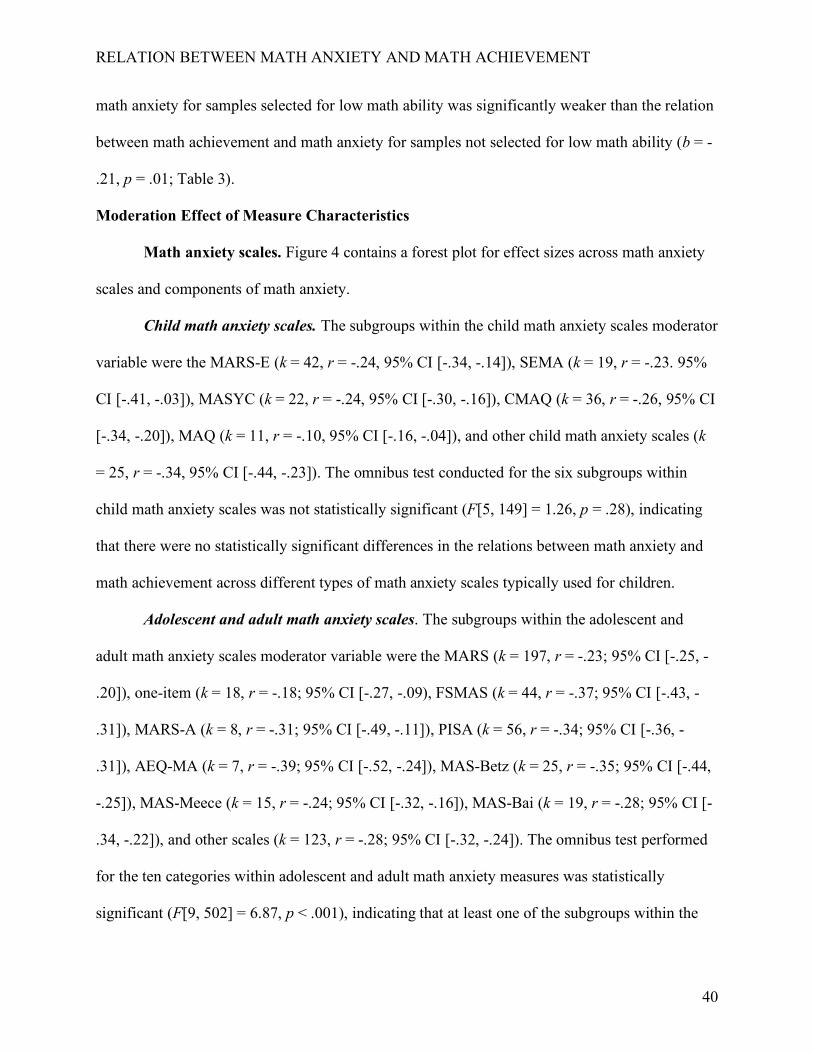
RELATION BETWEEN MATH ANXIETY AND MATH ACHIEVEMENT
40
math anxiety for samples selected for low math ability was significantly weaker than the relation
between math achievement and math anxiety for samples not selected for low math ability (b = -
.21, p = .01; Table 3).
Moderation Effect of Measure Characteristics
Math anxiety scales. Figure 4 contains a forest plot for effect sizes across math anxiety
scales and components of math anxiety.
Child math anxiety scales. The subgroups within the child math anxiety scales moderator
variable were the MARS-E (k = 42, r = -.24, 95% CI [-.34, -.14]), SEMA (k = 19, r = -.23. 95%
CI [-.41, -.03]), MASYC (k = 22, r = -.24, 95% CI [-.30, -.16]), CMAQ (k = 36, r = -.26, 95% CI
[-.34, -.20]), MAQ (k = 11, r = -.10, 95% CI [-.16, -.04]), and other child math anxiety scales (k
= 25, r = -.34, 95% CI [-.44, -.23]). The omnibus test conducted for the six subgroups within
child math anxiety scales was not statistically significant (F[5, 149] = 1.26, p = .28), indicating
that there were no statistically significant differences in the relations between math anxiety and
math achievement across different types of math anxiety scales typically used for children.
Adolescent and adult math anxiety scales. The subgroups within the adolescent and
adult math anxiety scales moderator variable were the MARS (k = 197, r = -.23; 95% CI [-.25, -
.20]), one-item (k = 18, r = -.18; 95% CI [-.27, -.09), FSMAS (k = 44, r = -.37; 95% CI [-.43, -
.31]), MARS-A (k = 8, r = -.31; 95% CI [-.49, -.11]), PISA (k = 56, r = -.34; 95% CI [-.36, -
.31]), AEQ-MA (k = 7, r = -.39; 95% CI [-.52, -.24]), MAS-Betz (k = 25, r = -.35; 95% CI [-.44,
-.25]), MAS-Meece (k = 15, r = -.24; 95% CI [-.32, -.16]), MAS-Bai (k = 19, r = -.28; 95% CI [-
.34, -.22]), and other scales (k = 123, r = -.28; 95% CI [-.32, -.24]). The omnibus test performed
for the ten categories within adolescent and adult math anxiety measures was statistically
significant (F[9, 502] = 6.87, p < .001), indicating that at least one of the subgroups within the
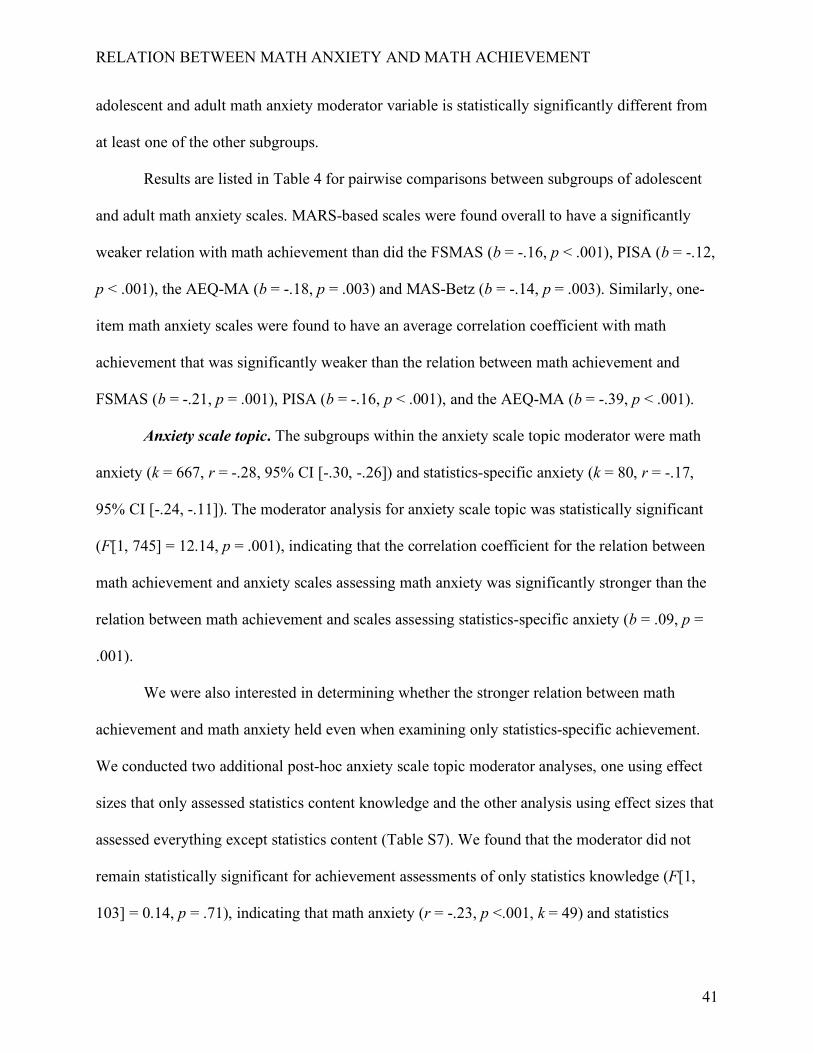
RELATION BETWEEN MATH ANXIETY AND MATH ACHIEVEMENT
41
adolescent and adult math anxiety moderator variable is statistically significantly different from
at least one of the other subgroups.
Results are listed in Table 4 for pairwise comparisons between subgroups of adolescent
and adult math anxiety scales. MARS-based scales were found overall to have a significantly
weaker relation with math achievement than did the FSMAS (b = -.16, p < .001), PISA (b = -.12,
p < .001), the AEQ-MA (b = -.18, p = .003) and MAS-Betz (b = -.14, p = .003). Similarly, one-
item math anxiety scales were found to have an average correlation coefficient with math
achievement that was significantly weaker than the relation between math achievement and
FSMAS (b = -.21, p = .001), PISA (b = -.16, p < .001), and the AEQ-MA (b = -.39, p < .001).
Anxiety scale topic. The subgroups within the anxiety scale topic moderator were math
anxiety (k = 667, r = -.28, 95% CI [-.30, -.26]) and statistics-specific anxiety (k = 80, r = -.17,
95% CI [-.24, -.11]). The moderator analysis for anxiety scale topic was statistically significant
(F[1, 745] = 12.14, p = .001), indicating that the correlation coefficient for the relation between
math achievement and anxiety scales assessing math anxiety was significantly stronger than the
relation between math achievement and scales assessing statistics-specific anxiety (b = .09, p =
.001).
We were also interested in determining whether the stronger relation between math
achievement and math anxiety held even when examining only statistics-specific achievement.
We conducted two additional post-hoc anxiety scale topic moderator analyses, one using effect
sizes that only assessed statistics content knowledge and the other analysis using effect sizes that
assessed everything except statistics content (Table S7). We found that the moderator did not
remain statistically significant for achievement assessments of only statistics knowledge (F[1,
103] = 0.14, p = .71), indicating that math anxiety (r = -.23, p <.001, k = 49) and statistics
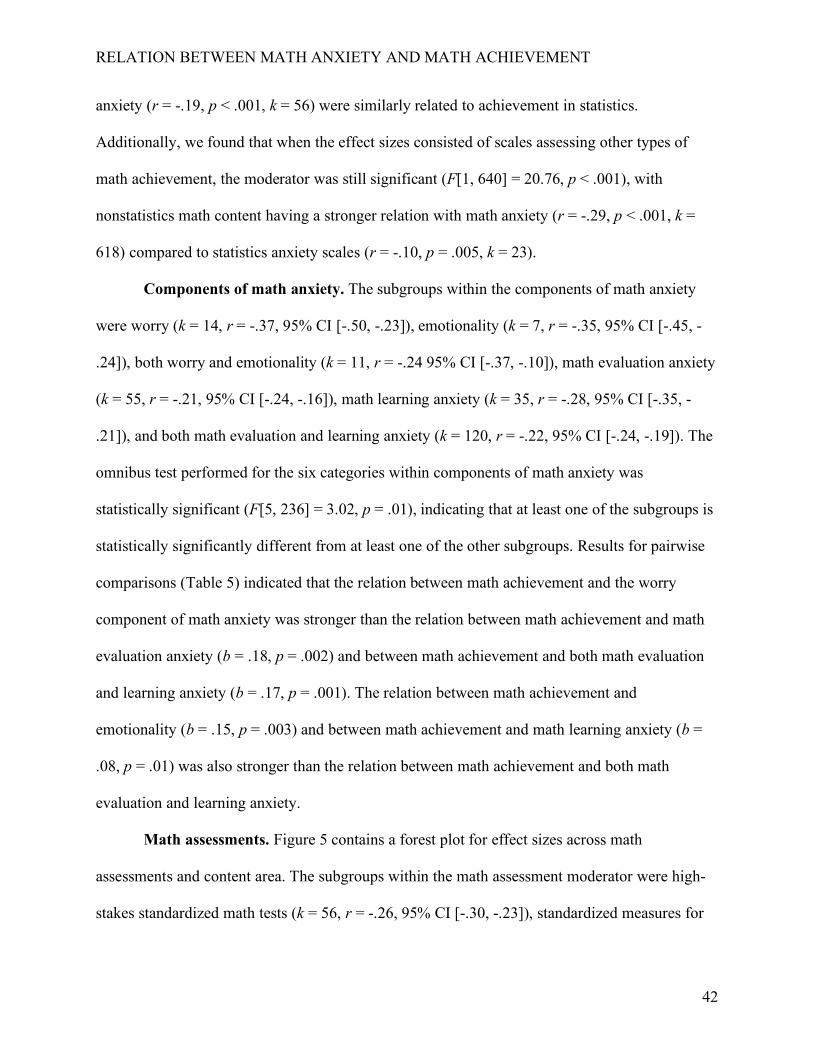
RELATION BETWEEN MATH ANXIETY AND MATH ACHIEVEMENT
42
anxiety (r = -.19, p < .001, k = 56) were similarly related to achievement in statistics.
Additionally, we found that when the effect sizes consisted of scales assessing other types of
math achievement, the moderator was still significant (F[1, 640] = 20.76, p < .001), with
nonstatistics math content having a stronger relation with math anxiety (r = -.29, p < .001, k =
618) compared to statistics anxiety scales (r = -.10, p = .005, k = 23).
Components of math anxiety. The subgroups within the components of math anxiety
were worry (k = 14, r = -.37, 95% CI [-.50, -.23]), emotionality (k = 7, r = -.35, 95% CI [-.45, -
.24]), both worry and emotionality (k = 11, r = -.24 95% CI [-.37, -.10]), math evaluation anxiety
(k = 55, r = -.21, 95% CI [-.24, -.16]), math learning anxiety (k = 35, r = -.28, 95% CI [-.35, -
.21]), and both math evaluation and learning anxiety (k = 120, r = -.22, 95% CI [-.24, -.19]). The
omnibus test performed for the six categories within components of math anxiety was
statistically significant (F[5, 236] = 3.02, p = .01), indicating that at least one of the subgroups is
statistically significantly different from at least one of the other subgroups. Results for pairwise
comparisons (Table 5) indicated that the relation between math achievement and the worry
component of math anxiety was stronger than the relation between math achievement and math
evaluation anxiety (b = .18, p = .002) and between math achievement and both math evaluation
and learning anxiety (b = .17, p = .001). The relation between math achievement and
emotionality (b = .15, p = .003) and between math achievement and math learning anxiety (b =
.08, p = .01) was also stronger than the relation between math achievement and both math
evaluation and learning anxiety.
Math assessments. Figure 5 contains a forest plot for effect sizes across math
assessments and content area. The subgroups within the math assessment moderator were high-
stakes standardized math tests (k = 56, r = -.26, 95% CI [-.30, -.23]), standardized measures for
RELATION BETWEEN MATH ANXIETY AND MATH ACHIEVEMENT
43
research purposes (k = 322, r = -.29, 95% CI [-.31, -.27]), researcher-made and non-standardized
measures for research (k = 166, r = -.29, 95% CI [-.34, -.25]), course grades in math classes (k =
113, r = -.27, 95% CI [-.31, -.23]), and exam grades on math assessments (k = 90, r = -.20, 95%
CI [-.24, -.15]). The omnibus test for the math assessment moderator was statistically significant
(F[4, 742] = 2.34, p = .054) and pairwise comparisons for this moderator are shown in Table 6.
Specifically, the overall relation found between math anxiety and math exam grades was weaker
than the relation between math anxiety and standardized assessments used for research (b = -.08,
p = .002) and between math anxiety and non-standardized research measures and other math
assessments (b = -.09, p = .01).
Math content. The subgroups within the math content area moderator were approximate
number system (k = 14, r = -.09, 95% CI [-.18, .005]), basic number knowledge (k = 30, r = -.16,
95% CI [-.25, -.07]), whole number calculation (k = 113, r = -.23, 95% CI [-.25, -.20]), word
problem solving (k = 20, r = -.27, 95% CI [-.40, -.15]), fractions, decimals, and percentages (k =
10, r = -.37, 95% CI [-.52, -.20]), geometry (k = 9, r = -.32, 95% CI [-.46, -.16]), algebra (k = 34,
r = -.23, 95% CI [-.30, -.15]), and statistics knowledge (k = 105, r = -.23, 95% CI [-.28, -.17]).
The omnibus test for the math content area moderator analysis was not statistically significant
(F[7, 327] = 1.40, p = .21), indicating that there were no statistically significant differences in the
relations between math anxiety and math assessments in different math content areas.
Publication bias
The moderator analysis for publication status was statistically significant (F[1, 745] =
12.02, p < .001). There was a significantly stronger negative correlation between math anxiety
and math achievement reported in published studies (k = 520, r = -.29, 95% CI [-.32, -.27]) than
for unpublished studies (k = 227, r = -.23, 95% CI [-.25, -.21]).
RELATION BETWEEN MATH ANXIETY AND MATH ACHIEVEMENT
44
Visual inspection of the funnel plot of the effect sizes by their standard errors (black dots
in Figure 6), with higher standard errors at the bottom of the plot, indicated that the spread of the
effect sizes was not perfectly symmetrical. Many of the effect sizes were located around and just
to the right of the line denoting the overall average correlation (r = -.28), suggesting that most of
the effect sizes in the meta-analytic sample represent reporting small-to-moderate negative effect
sizes from studies with various sample sizes. A statistically significant Egger test (z = 2.59, p =
.01) confirmed the presence of funnel plot asymmetry. The potential missing studies in the left
half of the plot, as shown by the sparseness of effect sizes in that area compared to the right half,
may indicate higher magnitude negative effect sizes from samples of all sizes are missing from
our meta-analytic sample. The trim-and-fill analysis indicated that 129 effect sizes (white dots in
Figure 6), primarily clustered in the left half of the asymmetrical plot, are potentially missing and
needed to fill in the sparse areas of the funnel plot. The result of the trim-and-fill analysis
suggested that, after adjusting the funnel plot to become symmetrical, the adjusted overall
correlation coefficient would remain statistically significant and similar in magnitude to the
original overall correlation coefficient (r = -.29, p < .001).
Discussion
Math achievement and math anxiety have been studied together for more than half a
century (Dreger & Aiken, 1957). Previous meta-analyses have provided us with some knowledge
about the association between math anxiety and math achievement, specifically that the
association is negative and small-to-moderate, with patterns of high math anxiety often co-
occurring with low math achievement (Hembree, 1990; Ma, 1999). Since the publication of
previous meta-analyses in the 90s, the trend to study these constructs together has continued to
grow. Reviews summarizing the wave of research from more recent years have primarily focused
RELATION BETWEEN MATH ANXIETY AND MATH ACHIEVEMENT
45
on examining the potential mechanisms behind the association between math anxiety and math
achievement (Beilock & Maloney, 2015; Foley et al., 2017), leaving a need for an updated and
thorough statistical summary of the work conducted on this relation since the start of the 21st
century. Thus, the aims of the present meta-analysis were to 1) calculate an overall average
weighted effect size based on recent work on the relation between math anxiety and math
achievement and 2) conduct moderator analyses in order to determine whether the magnitude of
the correlation differs depending on the demographic characteristics of the sample or the
measures used to assess math anxiety or math achievement.
Overall Average Effect Size
We found an overall average correlation of -.28 across all included samples in our meta-
analysis, indicating that math anxiety and math achievement tend to have a small-to-moderate
negative association. Our findings are similar to the overall average correlation of -.27 found by
Ma (1999) and fall within the range of correlations of -.25 to -.40 reported by Hembree (1990).
Our results also reveal that there is significant heterogeneity in the spread of effect sizes that
estimate the overall relation between math anxiety and math achievement. This suggests that
variability in these effect sizes is due to the inclusion of samples that do not represent a
homogenous population, supporting our methodological choice to conduct random-effects and
mixed-effects models.
Moderators
We found that, after grouping effect sizes by subgroups within our moderators,
significant negative relations between math anxiety and math achievement remained for most of
our subgroups. We also found there were several significant differences in the size of the relation
between subgroups within some moderators. Importantly, although our moderator analyses were
RELATION BETWEEN MATH ANXIETY AND MATH ACHIEVEMENT
46
able to provide some valuable information about potential sources of variability in the size of the
effect sizes for the relation between math anxiety and math achievement, the estimates of
heterogeneity for all the moderator analyses indicated that there was still a significant amount of
variance left unexplained. These findings suggest that there may be other factors, like different
levels of working memory (Ramirez, Chang, Maloney, Levine, & Beilock, 2016) or motivation
in math (Wang et al., 2015), or a combination of factors including those not currently
incorporated in the present study, that may be able to explain remaining variability found in the
correlations included in this meta-analysis. Another important note to consider is that, despite
weighting effect sizes by their standard errors and testing moderators of math assessments and
anxiety scales, there still may be differences in the relation between math anxiety and math
achievement that are due to the inherent differences between large-scale samples with equivalent
and standardized measures (such as the PISA) and small-scale studies that use convenience
samples and often use researcher-developed measures.
Demographic characteristics as moderators.
Gender, race/ethnicity, and continent. It has been hypothesized in some work that the
relation between math anxiety and achievement would be stronger for women than for men
(Aiken, 1970), but that has not been found overall in either the current or previous meta-
analyses. Specifically, Hembree (1990) found the opposite, that males in grades 5 through 12
demonstrated a stronger correlation between math anxiety and math achievement compared to
females in that same age group. Contrary to these findings, we found in the current meta-analysis
that the correlations for gender, when broken down by samples with either 100% male or 100%
female participants, were similar in strength and magnitude, as did Ma (1999). Previous research
has found gender differences in levels of self-reported math anxiety, with greater math anxiety
RELATION BETWEEN MATH ANXIETY AND MATH ACHIEVEMENT
47
reported by girls than by boys (Devine, Fawcett, Szűcs, & Dowker, 2012). Small gender
differences have also been found in math achievement during middle childhood and adolescence,
with the slight advantage switching between males and females and depending on the age of the
sample and the type of math assessment (Else-Quest, Hyde, & Linn, 2010). Despite these
differences in levels of math anxiety and math achievement scores separately, our meta-analytic
results based on a pooled, diverse sample of studies, found that the association between math
achievement and math anxiety is similar for males and females.
With regard to differences in the math anxiety-math achievement relation among
different racial and ethnic groups, we found similar relations for samples from the United States
made up of 75% or more White participants and samples that consisted of 75% or less White
participants (i.e., majority non-White participants or racially diverse sample). This finding aligns
with the results from Ma’s (1999) meta-analysis where he found similar magnitude correlations
for ethnically homogenous versus ethnically heterogeneous samples. Importantly though, the
present moderation analysis of race and ethnicity differences is subject to certain limitations.
Specifically, the number of effect sizes from different race and ethnic groups was small and only
data from samples within the United States were analyzed. However, given that cultural
differences within racial and ethnic groups vary greatly depending on the specific racial and
ethnic group being studied (Betancourt & López, 1993), it may be that differences in the relation
between math anxiety and math achievement may only arise when looking across a variety of
racial and ethnic groups from different countries rather than examining all minority groups from
only one country. Thus, future work should examine the relation between math anxiety and math
achievement from a variety of racial and ethnic groups from different countries in order to
provide insight on the role of specific cultural practices within a specific racial or ethnic group.
RELATION BETWEEN MATH ANXIETY AND MATH ACHIEVEMENT
48
The results of the previously untested moderator of the continent of origin of the study
sample suggest that there are no significant differences in the strength of the relation between
math anxiety and math achievement across the six continents tested in the current paper.
Although some work has found that, overall, the correlation tends to be smaller in magnitude for
samples from Asian countries (i.e., rs = -.12 to -.31) compared to North American and many
European countries (i.e., rs = -.26 to -.51, Lee, 2009), this was not found to be the case in the
current paper when testing for differences in effect size magnitude between continents, rather
than between countries. However, as previously noted, cultures and educational systems between
the countries within a continent are very different. We do provide some evidence in our
supplemental analyses that there are differences in the relation at the country- and region-level
within continents, yet many of these overall effect sizes are represented by only one sample.
Although there may not be significant differences in the relation between math anxiety and math
achievement at the continent-level, there is some support for the idea that the correlation varies
depending on the country or region being studied. As such, research to collect more data in a
larger number of samples from different countries is needed in order to gain a more precise
understanding of where around the globe the relation differs and to further study cultural
mechanisms that may be driving these differences.
Grade level. Previous meta-analyses have found significant associations between math
anxiety and achievement for students in grades ranging from grade 4 to college level (Hembree,
1990) but no significant differences in the magnitude of the relation based on grade level (Ma,
1999). In the current meta-analysis, we were able to include data from students in grades as early
as grade 1 all the way up to samples made up of non-student adults. Our findings support
previous work indicating that a significant relation between math anxiety and math achievement
RELATION BETWEEN MATH ANXIETY AND MATH ACHIEVEMENT
49
exists throughout different development periods, as well as adding that a significant relation
exists for samples in early elementary school and beyond formal schooling in adulthood.
The significant differences we did find between grade level categories in the relation
between math anxiety and math achievement suggest that the magnitude of the association varies
across development. During early elementary school, the relation between math anxiety and
achievement is significantly stronger compared to the same relation during high school.
However, some research has found that general anxiety, a factor not considered in the present
meta-analysis, explains the relation found between math anxiety and math achievement in young
children (Dowker et al., 2016; Hill et al., 2016). As such, more work is needed to address and
understand the mechanisms driving the stronger relation found between math anxiety and math
achievement during early childhood.
Our findings also suggest that the relation between math anxiety and math achievement
across grades does not follow a linear trend across development. Specifically, the correlation for
students in grades 3 through 5 was significantly weaker than the relation for students in each of
the other grade categories, with the exception of grades 1 and 2 and postsecondary students. Our
supplemental analyses suggest that the weaker relation could be driven by differences in the
relation between math anxiety and basic number knowledge for students in grades 3 through 5
compared to students in grades 1 and 2 and grades 6 through 8 (Tables S7 and S8). Overall,
future research should consider the math content area as an important factor that may contribute
to grade-level differences, particularly for students in late elementary school, in the math
anxiety–math achievement association.
Moving on from late elementary to middle school, we do see a statistically significant
increase in the relation between math anxiety and math achievement. Once students reach high
RELATION BETWEEN MATH ANXIETY AND MATH ACHIEVEMENT
50
school, the relation is found to be significantly stronger than that of the relation during late
elementary school. High school students may experience increased pressure to perform well in
school while preparing for selection into postsecondary school entry (Clinedinst & Koranteng,
2017), which could explain this increase in the co-occurrence of high math anxiety with low
math achievement. Postsecondary school students, on the other hand, demonstrate a weaker
relation in comparison to students in earlier development. Students who reach postsecondary
education may represent a population of students with higher math achievement that experience
less math anxiety as a result of their higher math ability, potentially reducing the strength of the
relation between math anxiety and math achievement at that point in development.
Finally, we found that the relation does not disappear for non-student samples. Instead,
the magnitude of the correlation is equivalent to the correlation for students in most of the other
grade levels, with the exception of postsecondary school students, who demonstrate a weaker
relation between math anxiety and math achievement than do non-student adults. This overall
finding suggests a need for more research to further understand how the association between
math anxiety and math achievement develops from childhood to adulthood.
It is important to note that the grade levels we coded in this study are based on the ages
typically included in grade levels within the United States, and therefore these grades may differ
internationally. In addition, some samples represented participants across a wide age range
spanning across multiple grade level categories, yet we coded these groups into one category that
matched the average age.
Teachers. With regard to pre-service and practicing teacher samples, we found that, on
average, studies examining these samples reported significant correlations between math anxiety
and math achievement. In addition to the significant correlations found for non-student adult
RELATION BETWEEN MATH ANXIETY AND MATH ACHIEVEMENT
51
samples, these findings further emphasize why it is important to study this relation after high
school graduation; clearly, this association is not a phenomenon that develops and then
disappears once people have graduated from primary and secondary school. Future work should
not only aim to create and implement interventions geared toward math anxiety or math
achievement for student samples, but they may also explore the implementation of these
interventions to non-student adults and teachers. Furthermore, there is some work suggesting that
students majoring in elementary education have higher math anxiety than people in other college
majors (Hembree, 1990), and that this math anxiety can influence their students’ beliefs and
math achievement (Beilock et al., 2010). Importantly, we did not find the relation between math
anxiety and math achievement to be significantly different between teacher and non-teacher
samples. Though teachers have become a focus of research due to higher levels of anxiety, their
anxiety does not appear to be more or less related to their math performance compared to other
segments of the population.
Students with low math ability. For the moderator analyses for low math ability samples,
we did find a significant difference in the relation between math anxiety and math achievement
for samples selected for low math ability compared to those not selected. Specifically, samples
selected for low math ability had weaker, although still significant, associations than did samples
not selected for low math ability. These findings are contrary to some work extending the deficit
model of the relation between math anxiety and math achievement to populations with math
learning disabilities (Lai, Zhu, Chen, & Li, 2015; Wu, Wilcutt, Escovar, & Menon, 2014).
Instead, we find that, overall, the achievement of samples with low math ability is less related to
math anxiety than it is for those samples that represent a wider range of math ability. Of course,
it is important to note that the range of math achievement for many of these selected samples is
RELATION BETWEEN MATH ANXIETY AND MATH ACHIEVEMENT
52
typically restricted due to the cutoffs used for selection, and as such a stronger relation may not
be as clear as it is for samples with more variability in their math achievement. In sum, more
work needs to be done to better understand the weaker relations found for samples selected for
low math ability compared to samples representing a larger range of math ability.
Measure characteristics as moderators.
Math anxiety scales. With regard to the scales used to measure math anxiety, Ma (1999)
previously found that the relations with math achievement did not significantly differ when using
the MARS compared to a non-MARS measure. However, the 37 studies included in Ma’s (1999)
meta-analysis represented only six individual math anxiety instruments. A number of new scales
to measure math anxiety have emerged since then, and therefore we were able to test for effect
size differences between scales that were developed to measure math anxiety separately in
children and in adolescents and adults. Although some studies utilized child-, adolescent-, or
adult-oriented measures in samples other than the age group they were intended for, creating
separate variables for child as well as adolescent and adult anxiety measures allowed us to
account for a majority of the confounding effect of age.
Overall, we found that math anxiety had a significant relation with math achievement for
all math anxiety scale groups coded in this meta-analysis for children, adolescents, and adults.
For the six child math anxiety scales, our results suggested that a similar relation can be expected
with math achievement no matter which child math anxiety scale is used.
However, for adolescent and adult math anxiety scales, we found that several measures,
specifically the group made up of MARS-based scales and one-item scales, had significantly
weaker relations with math achievement than did the PISA math anxiety scale, the Fennema
Sherman Math Anxiety Scale (FSMAS), the Achievement Emotion Questionnaire Math Anxiety
RELATION BETWEEN MATH ANXIETY AND MATH ACHIEVEMENT
53
Scale (AEQ), and the Math Anxiety Scale by Betz (MAS [Betz]; 1988). On the one hand, the
one-item scale may not tap enough into specific math situations (due to only being one item
rather than having a range of situations from multiple items) to consistently be associated with
math achievement. On the other hand, scales like the original 98-item MARS may have way too
many items that may lead to poor data quality and similarly reduce the potential association that
math anxiety can have with math achievement. The MARS category in the current paper,
however, includes shorter MARS-based measures also, like the MARS-revised (Plake & Parker,
1982) and the Abbreviated Math Anxiety Scale (Hopko et al., 2003); thus, the number of items
may not fully explain the differences. It could also be that another one of the moderators we
tested, specifically the components of math anxiety, plays a role in the differences found in the
relations between math achievement and these scales (results discussed in next section).
However, none of the math anxiety scales that were stronger (i.e., PISA, AEQ, FSMAS, MAS
[Betz]) or weaker (i.e., MARS-based, one item) were consistently in any of the categories that
we coded for in the components of math anxiety variable. Thus, the reason for the differences
found here still remains an unanswered question. Overall, future research is needed to investigate
these and other potential reasons why differences exist in the relations between math
achievement and scores on these adolescent and adult math anxiety scales.
We also found that math anxiety scales assessing anxiety in the broader subject of math
were significantly more related to math achievement than scales assessing anxiety in statistics.
This finding suggests that the relation between math anxiety and math achievement is different
depending on the math content of the anxiety scale. However, we also found that math anxiety
topic is a significant moderator only in the case of assessments testing non-statistics math content
(i.e., more related to math anxiety scales that to statistics anxiety scales). Statistics anxiety and
RELATION BETWEEN MATH ANXIETY AND MATH ACHIEVEMENT
54
math anxiety were similarly related to math achievement when the assessment was testing
statistics content. These findings indicate that the content of the math assessment is also an
important moderator of this relation, with the content of statistics playing a role in whether we
find differences in the relation between math achievement and broader math anxiety scales
compared to the relation between math achievement and statistics-specific anxiety scales.
Components of math anxiety. With regard to the moderator of components of math
anxiety, one might have expected that the strongest correlation would be between math
evaluation anxiety and math achievement, because math achievement was primarily represented
by math tests in this meta-analysis and the component of math evaluation anxiety specifically
targets the situation of a math test. However, we found stronger relations between math
achievement and the cognitive worry component of math anxiety compared to those effect sizes
measuring math anxiety through the single component of math evaluation and through both
components of math evaluation and learning anxiety. The relation with math achievement was
also stronger with math anxiety measured as math learning anxiety and emotionality, separately,
than those relations measured with both components of math evaluation and learning anxiety.
This suggests that the negative relation between math anxiety and math achievement is stronger,
at least when compared to items that ask about testing or testing and both learning situations in
math, when the anxiety items ask about negative expectations and self-deprecating thoughts
related to math stimuli or situations or when they ask about the process of learning in math as
well as when they ask about physiological reactions during math situations. The stronger
correlations found with the worry component of anxiety provide some evidence for the
attentional control theory. This theory hypothesizes that, in a math context, anxious thoughts and

RELATION BETWEEN MATH ANXIETY AND MATH ACHIEVEMENT
55
worry take up limited cognitive resources that are needed to complete a math-related task, which
subsequently reduces both efficiency and accuracy on the task (Eysenck et al., 2007).
Math assessments. Regarding math achievement measures, a previous meta-analysis
found weaker relations between math anxiety and commercially-developed and
psychometrically-validated assessments than between math anxiety and researcher-made
achievement measures and math teachers’ grades (Ma, 1999). This finding is unexpected when
considering other work that shows that greater levels of anxiety are more often associated with
high-stakes testing (Cassady & Johnson, 2002), which would fit into the psychometrically-
validated test group from Ma’s (1999) meta-analysis. In the present meta-analysis, we were able
to expand on the types of math assessments to include high-stakes standardized testing situations,
standardized tests used for research, non-standardized research tests, math course grades, and
math exam grades.
Similar to the previous meta-analysis, we found significant relations between math
anxiety and each of these types of math assessments; however, the moderator effect we found
was different from that found in Ma’s 1999 meta-analysis. We were able to separate what the
1999 meta-analysis considered to be an “other” category into three categories of non-
standardized researcher-made math assessments, exam grades, and math course grades (or math
GPA). We found that the relation was weaker between math anxiety and math exam grades
compared to the relations between math anxiety and standardized measures for research and
between math anxiety and non-standard researcher made measures. In other words, the relation
between math achievement and math anxiety was significantly stronger, and more negative,
when the achievement measure consisted of standardized tests used for research and non-
standardized research-made compared to when the math assessment consisted of a math test or
RELATION BETWEEN MATH ANXIETY AND MATH ACHIEVEMENT
56
exam that were not high-stakes and mostly math class-level exams. Our lack of significant
findings with regard to the high-stakes math tests subgroup also opposes the notion that,
specifically with math-related tests, high-stakes exams are more related with math anxiety than
other forms of math assessments. We find that the relation between math anxiety and high-stakes
exams is similar to the relation between math anxiety and other types of math tests.
These findings have implications for education practitioners, parents, and researchers
alike. For educators, knowing that the relation between math achievement and math anxiety is
consistently weaker when the math assessment consists of a math exam that is often encountered
in a regular classroom setting may be useful when preparing curriculum and using class math
tests as sources of math knowledge that are less related with the math anxiety that a student may
have. For parents, the weaker relation can also provide some relief for the various types of math
assessments their children encounter throughout the school year. For researchers investigating
the math anxiety-math achievement association in lab studies and experiments, this finding
suggests that results from lab experiments and research projects are more likely to find stronger
relations with math anxiety than when using math exam grades as measures of math
achievement. Thus, it may be beneficial for researchers to know ahead of time that the relation
between math anxiety and math achievement may be different depending on the measure of
achievement they decide to use, whether it be already available exam grades provided by
teachers or whether they decide to collect their own math achievement data.
Math content. In the final moderation analysis based on measure characteristics, we
tested whether the math content area of the math achievement measure was a moderator of the
relation between math anxiety and math achievement. Hembree (1990) had previously reported
significant relations, but did not test for differences in the relations between math anxiety and a
RELATION BETWEEN MATH ANXIETY AND MATH ACHIEVEMENT
57
variety of math content areas, such as computation, math concepts, problem solving, abstract
reasoning, and spatial ability, for students in grade 7, high school, and postsecondary school. In
the present analysis, we tested the relations between math anxiety and math achievement for
assessments testing knowledge in a single content area for samples representing a wider grade
level range than previously tested (i.e., grade 1 students through non-student adults). Our results
indicated that there are significant negative correlations between math anxiety and most types of
single-content math assessments, with the exception of the content area of approximate number
system (ANS: r = -.09; other areas: rs ranged from -.20 to -.38).
We did not find evidence that math content area moderated the relation with math
anxiety. Our supplemental analyses did suggest that there are grade-level differences for certain
math content areas, but this is not the case when taking all grade levels into account. Some
theories, such as the attentional control theory described earlier in this paper, have suggested that
math anxiety disrupts cognitive resources such as working memory during achievement tasks
(Eysenck, Derakshan, Santos, & Calco, 2007). Some previous research also indicates that math
anxiety has negative consequences with complex math that requires greater use of cognitive
resources (Ashcraft, 2002); however, our current findings suggest that the relation is similar
across math content areas, whether they measure achievement in more basic math knowledge or
more advanced content.
Publication Bias
Publication bias was assessed in the present meta-analysis in order to examine whether
there is a tendency to publish stronger effect sizes compared to weaker ones and whether the
available effect sizes included in our meta-analytic samples are representative of the true effect
size or skewed due to missing studies (i.e., the “file drawer problem”; Rosenthal, 1979). Previous
RELATION BETWEEN MATH ANXIETY AND MATH ACHIEVEMENT
58
work has found that published studies reported weaker correlation between math anxiety and
math achievement than did unpublished studies, which suggests an unexpected “positive
publication bias” (Ma, 1999). In the current meta-analysis, we found the opposite to be the case,
where effect sizes published in peer-reviewed journals were significantly stronger than the effect
sizes reported in unpublished and grey literature. This finding supports the typical pattern of
“negative” publication bias, in which smaller effect sizes and non-significant findings tend to not
be published.
Additionally, our funnel plot and Egger test results indicate the presence of a skew
against large effect sizes for all sample sizes in the distribution of the included effect sizes within
the meta-analytic sample. The trim-and-fill method results further suggest that there are effect
sizes missing and that inclusion of those effect sizes would produce a statistically significant,
moderate, and negative adjusted overall effect size, similar to the original effect size reported
here. Based on all of our publication indices, although the file drawer problem is an issue, our
average weighted effect size is not significantly impacted by the potentially missing studies.
Moreover, previous work has suggested that the trim-and-fill method should be used as a
sensitivity analysis instead of an index of publication bias (Peters et al., 2007). It is unknown
whether publication bias is the only cause of funnel plot asymmetry; often meta-analyses with
large between-study heterogeneity in their effect sizes are due to tested or untested moderators.
In these cases, use of the trim-and-fill method underestimates the true effect size when there is
no publication bias. Overall, the publication bias evidenced by our indices is likely not a critical
issue that would negatively impact the interpretation or significance of our main meta-analytic
results.
RELATION BETWEEN MATH ANXIETY AND MATH ACHIEVEMENT
59
Connections with Recent Work
One important note to mention is that, simultaneous to us working on this meta-analysis,
two other research groups worked on and subsequently published meta-analyses of the relation
between math anxiety and math performance (Namkung, Peng, & Lin, 2019; Zhang, Zhao, &
Kong, 2019). There are some key differences in the search strategies, inclusion and exclusion
criteria, and effect size extraction techniques between these two recently published meta-
analyses and the present one that should be mentioned. In general, our study was more thorough
and inclusive, as we chose to include adult samples, include unpublished data, and conduct
author queries for missing information. This led us to have many more effect sizes (k = 747)
compared to Zhang et al. (k = 84) and Namkung et al. (k = 478). Despite these differences, the
main findings were generally similar across studies, suggesting that we are homing in on the
magnitude of the relation between math anxiety and achievement. Our overall correlation was -
.28 compared to a correlation of -.32 in Zhang et al. and -.34 in Namkung et al. An investigation
of the articles included across the meta-analyses shows a lot of overlap, suggesting that we did
not miss research included in these other studies. Therefore, our study makes an important
unique contribution to this literature, while also being generally consistent with the findings of
these other research groups.
Limitations
Although meta-analyses provide an opportunity to aggregate a large number of effect
sizes from many studies that assess relevant factors, which then increases the power to draw
more accurate, statistically-driven conclusions about the relations, the current set of analyses is
not exhaustive in explaining the relation between math anxiety and math achievement. One
limitation of a meta-analysis that considers only the zero-order correlation is that other relevant

RELATION BETWEEN MATH ANXIETY AND MATH ACHIEVEMENT
60
factors that may account for the relation, such as test anxiety (Devine et al., 2012) or math
confidence (Hembree, 1990), are not examined in conjunction with the variables of interest.
Thus, there may be confounding variables we do not account for that are influencing the relations
we found between math anxiety and math achievement.
Another limitation is that any unexplained variance that remains in the accumulated
effect sizes after accounting for all moderators tested suggests that there are other study factors,
not included in the meta-analysis, that may also moderate the relation tested. For example,
environmental factors, such as math activities done in the home (del Rio, Susperreguy, Strasser,
& Salinas, 2017), have been previously highlighted as potentially important moderators of the
relation between math anxiety and math achievement. Although many of the reasons posited to
explain the significant moderators require direct testing through studies beyond a meta-analysis,
additional work is needed to better explain the factors that influence the strength of the relation
between math anxiety and math achievement.
Additionally, this study is limited to the relation between the emotion of anxiety in math
and achievement. However, the study of the relations between different emotions and math
achievement and how it differs from the relation between math anxiety and math achievement
may also be an important gap to fill for future meta-analytic work.
Meta-analyses are dependent on the quality of the studies that are included in them,
particularly because they rely on effect size parameters from studies that vary in the rigor of their
study designs (Gersten, Baker, & Lloyd, 2000). Thus, another limitation of this meta-analysis is
that the quality of the included studies was not examined as a moderator. There are instruments
that have been previously developed to measure quality of reviews (Oxman & Guyatt, 1991),
which have been used as templates for researchers to assess study quality in a meta-analysis
RELATION BETWEEN MATH ANXIETY AND MATH ACHIEVEMENT
61
(Downs & Black, 1998). Future meta-analyses on this topic should consider study quality as an
important potential moderator.
There were also some limitations related to our search strategy and timeline. The search
was done for articles available or published between January of 1992 through May of 2018.
Thus, we may be missing studies that have been published since our last search that may impact
the findings reported in our meta-analysis. Importantly though, we did solicit effect sizes from
unpublished and ongoing studies from researchers in the area and were able to include 26
additional effect sizes from unpublished data that may have been published in the interim
between our last search and our writing up of the results. Second, the search terms and databases
used may not be expansive or broad enough to capture all available and relevant articles.
Specifically, relevant studies, may have been missing due to the narrowness of the search terms
used (i.e., math anxiety versus anxiety). While the results may still be generalizable, it is
important to consider that there are likely some missing effect sizes that may be relevant for
understanding the relation between math anxiety and math achievement.
An additional issue with our search strategy is the omission of the OECD 2013 report
containing PISA 2012 data (OECD, 2013). PISA is a large international effort to gauge
achievement levels every four years from over 510,000 high school students from 65 countries
(OECD, 2013). The PISA 2012 data were published in a 2013 report, but this report was not
found in the three journal databases we searched and therefore we did not include it in our
sample. However, we did include effect sizes from previous PISA years and a few country’s
effect sizes from PISA 2012 when empirical studies contained these effect sizes (i.e., Lee, 2013;
Thien & Ong, 2015). The PISA 2012 sample consists of 15-year old students, and their average
correlation across countries was -.34, which is the same magnitude of the correlation for high
RELATION BETWEEN MATH ANXIETY AND MATH ACHIEVEMENT
62
school students in the present study. This suggests the findings from our meta-analysis would
likely not change with the inclusion of all PISA 2012 results.
Another limitation of the current meta-analysis is related to the low response rate by
contacted authors for correlation information from potentially included studies. We sent first- or
corresponding-authors email requests for correlation coefficient information for almost 200
studies, but the response rate was only 35%. The date criteria we chose extended as far back as
1992, and many researchers had likely moved from their original institutions or changed their
originally listed email addresses by the time they were contacted. We opted to email authors
rather than contact them through other modes of communication, which may have impacted the
response rate. Although the response rate was low, the trim-and-fill analysis indicated that even
if we were to uncover the file drawer problem and add 130 missing studies to fill in the
unrepresented areas of our funnel plot, this addition would not have impacted the magnitude of
the average correlation we found in our meta-analysis.
Additionally, the inter-rater reliabilities for two variables had lower-than-desired values
(<80%; sample size: 72%; number of effect sizes: 75%). One reason for the low inter-rater
reliability was because of the challenge of accurately coding information from experimental
studies, specifically for control and experimental groups, separately. Some other reasons include
one coder not finding the sample size in the paper and listing it as needing an author query, one
coder reporting the full sample and the other coder reporting the analytic sample for that effect
size, and true coding errors. Importantly though, a large number of the codes from experimental
studies required an author query and thus the number of effect sizes and sample size variables
were subsequently checked by the first author, which may help to increase the overall inter-rater
reliability for these variables.
RELATION BETWEEN MATH ANXIETY AND MATH ACHIEVEMENT
63
Finally, many of the effect sizes in our meta-analytic sample come from small
convenience samples. Additionally, many of the samples are from Western countries (N =
626/744; 84%) and college students (N = 355/750; 47%). This minimal diversity and lack of
representativeness are a limitation of our meta-analytic results, specifically for the race and
ethnicity and continent moderator analyses we were able to conduct and present in this paper.
Research on the relation between math anxiety and math achievement needs to continue to seek
out more diverse and more representative samples to fully understand whether there are truly
varying associations between math anxiety and math achievement for certain moderators.
Implications
In the ever-evolving sectors of education, researchers, teachers, and education policy-
makers must constantly stay updated on the factors related to math achievement. Moreover, the
implications of this relation during childhood and adolescence on future career and educational
pathways is significant for both individuals’ career successes and society’s needs of a larger
STEM workforce (Wigfield & Eccles, 2000; Wang & Degol, 2013). Math anxiety has been
previously implicated as an important factor related to math achievement (Hembree, 1990; Ma,
1999). The present meta-analysis provides further support for the importance of the co-
occurrence of math anxiety and math achievement. This relation is critical for people of all ages,
a diverse set of demographics, and for different scale and assessment characteristics.
These current findings inform the development and implementation of interventions that
aim to reduce math anxiety and/or increase math achievement. Previous experimental work has
investigated the effectiveness of strategies such as writing sessions prior to a math task (Park,
Ramirez, & Beilock, 2014) or reappraisal of anxiety (Jamieson, Mendes, Blackstock, &
Schmader, 2010) to reduce math anxiety. Other work has focused on reducing the math
RELATION BETWEEN MATH ANXIETY AND MATH ACHIEVEMENT
64
achievement-math anxiety link by targeting math problem solving through cognitive tutoring
(Supekar, Iuculano, Chen, & Menon, 2015). Importantly, the present work indicates that the
association is detectable in children as young as students in grade 1. Thus, interventions such as
those just described may be prudent for students as young as those in early elementary and could
target math anxiety or achievement in content areas as foundational as basic number knowledge
and whole number calculations.
Conclusions
The present meta-analysis provides an updated summary of the association between math
anxiety and math achievement and moderators of the relation. We found that a small-to-moderate
negative association is evident and robust for students as young as grades 1 and 2 all the way to
up to non-student adults. These significant, small-to-moderate relations are evident across all
types of math content areas, with the exception of content measuring the approximate number
system. The strength of the relation with math achievement differs depending on the math
anxiety scale used and the math topic that the anxiety scale asks about, a finding that can inform
the choice of math anxiety scales for future research. Finally, the relation between math anxiety
and math achievement is stronger for samples that are not selected for low math ability compared
to samples that are selected for low math ability, providing some evidence against current
research suggesting that samples selected for low math ability tend to have stronger relations
between their achievement in math and of math anxiety. Overall, this work has both theoretical
implications for current theories explaining the math anxiety math achievement and practical
implications that will advise the future development of effective interventions to lower math
anxiety, reduce its relation with math achievement, and improve math achievement in the long
run.
RELATION BETWEEN MATH ANXIETY AND MATH ACHIEVEMENT
65
References
*References with effect sizes included in the present meta-analysis **References with effect sizes of unpublished manuscripts or raw data at the time of request for unpublished literature included in the present meta-analysis *Abu-Hilal, M. M. (2000). A structural model for predicting mathematics achievement: Its
relation with anxiety and self-concept in mathematics. Psychological Reports, 86(3), 835-847. https://doi.org/10.2466/pr0.2000.86.3.835
*Ader, E., & Erktin, E. (2010). Coping as self-regulation of anxiety: A model for math
achievement in high-stakes tests. Cognition, Brain, Behavior, 14(4), 311-332. https://search.proquest.com/docview/820543402?accountid=6724
*Agus, M., Penna, M. P., Peró-Cebollero, M., Guàrdia-Olmos, J., & Pessa, E. (2016).
Investigating the probabilistic reasoning in verbal–numerical and graphical–pictorial formats in relation to cognitive and non-cognitive dimensions: The proposal of a model. Personality and Individual Differences, 94, 44-53. https://doi.org/10.1016/j.paid.2016.01.003Get
Ahmed, W. (2018). Developmental trajectories of math anxiety during adolescence: Associations
with STEM career choice. Journal of Adolescence, 67, 158-166. doi: 10.1016/j.adolescence.2018.06.010
Aiken Jr, L. R. (1970). Attitudes toward mathematics. Review of Educational Research, 40(4),
551-596. doi: 10.3102/00346543040004551 *Aoude, S. G. (2014). Factors affecting the performance of students in university remedial
mathematics courses [ProQuest Information & Learning]. In Dissertation Abstracts International Section A: Humanities and Social Sciences (Vol. 75, Issue 1–A(E)).
*Ariapooran, S. (2017). Mathematics motivation, anxiety, and Pprformance in female deaf/hard-
of-hearing and hearing students. Communication Disorders Quarterly, 38(3), 172-178. https://doi.org/10.1177/1525740116681271
**Arias, J. M. (2016). Replication of study 2 in “Is math anxiety always bad for math learning?
The role of math motivation” by Wang, Z., Lukowski, S.L., Hart, S.A., Lyons, I.M., Thompson, L.A., Kovas, Y., Mazzocco, M.M., Plomin, R. & Petrill, S.A. (2015, Psychological Science). Unpublished manuscript. Stanford University, Stanford, California.
Ashcraft, M. H. (2002). Math anxiety: Personal, educational, and cognitive
consequences. Current Directions in Psychological Science, 11(5), 181-185. doi: 10.1111/1467-8721.00196
RELATION BETWEEN MATH ANXIETY AND MATH ACHIEVEMENT
66
Ashcraft, M. H., Kirk, E. P., & Hopko, D. (1998). On the cognitive consequences of mathematics anxiety. In C. Donlan (Ed.), Studies in Developmental Psychology. The Development of Mathematical Skills (pp. 175-196). Hove, England: Psychology Press/Taylor & Francis (UK).
Ashcraft, M. H., Krause, J. A., and Hopko, D. (2007). Is math anxiety a mathematical learning
disability? In D. B. Berch and M. M. M. Mazzocco (Eds.), Why Is Math So Hard For Some Children? The Nature and Origins of Mathematical Learning Difficulties and Disabilities (pp. 329-348). Baltimore, MD: Paul H Brookes Publishing Co.
*Auxter, A. E. (2017). The problem with word problems: An exploratory study of factors related
to word problem success [ProQuest Information & Learning]. In Dissertation Abstracts International Section A: Humanities and Social Sciences (Vol. 77, Issue 12–A(E)).
*Ayotola, A., & Adedeji, T. (2009). The relationship between gender, age, mental ability,
anxiety, mathematics self-efficacy and achievement in mathematics. Cypriot journal of educational sciences, 4(2), 113-124. https://doi.org/10.1016/j.sbspro.2009.01.169
*Bai, H. (2011). Cross-validating a bidimensional mathematics anxiety scale. Assessment, 18(1),
115-122. https://doi.org/10.1177/1073191110364312 Bai, H., Wang, L., Pan, W., & Frey, M. (2009). Measuring mathematics anxiety: Psychometric
analysis of a bidimensional affective scale. Journal of Instructional Psychology, 36(3), 185-193.
*Baloglu, M. (2001). An application of structural equation modeling techniques in the prediction
of statistics anxiety among college students [ProQuest Information & Learning]. In Dissertation Abstracts International Section A: Humanities and Social Sciences (Vol. 62, Issue 2–A, p. 456).
Baloğlu, M. (2002). Psychometric properties of the statistics anxiety rating scale. Psychological
Reports, 90(1), 315-325. doi: 10.2466/pr0.2002.90.1.315 *Bandalos, D. L., Yates, K., & Thorndike-Christ, T. (1995). Effects of math self-concept,
perceived self-efficacy, and attributions for failure and success on test anxiety. Journal of Educational Psychology, 87(4), 611-623. https://doi.org/10.1037/0022-0663.87.4.611
*Bangert, A. W. (1996). Peer assessment: An instructional strategy for effectively implementing
performance-based assessments [ProQuest Information & Learning]. In Dissertation Abstracts International Section A: Humanities and Social Sciences (Vol. 56, Issue 9–A, p. 3505).
**Barner, D., Alvarez, G., Sullivan, J., Brooks, N., Srinivasan, M., & Frank, M. C. (2016).
Learning mathematics in a visuospatial format: A randomized, controlled trial of mental abacus instruction. Raw data.

RELATION BETWEEN MATH ANXIETY AND MATH ACHIEVEMENT
67
**Barner, D., Athanasopoulou, A., Chu, J., Lewis, M., Marchand, E., Schneider, R., & Frank, M. (2016). A one-year classroom-randomized trial of mental abacus instruction for first- and second-grade students. Raw data.
**Barroso, C., Ganley, C.M., & Hart, S.A. (2017). Psychology majors study cohort 2. Raw data. **Barroso, C., Ganley, C.M., & Hart, S.A., Clendinning, J., Rogers, N. (2018). Undergraduate
music theory majors sample. Raw data. *Batchelor, J. H. (2016). A mixed methods study of the effects of clicker use on math anxiety and
achievement in mathematics. (Doctoral dissertation, Iowa State University). https://doi.org/10.31274/etd-180810-5502
*Beasley, T. M., Long, J. D., & Natali, M. (2001). A confirmatory factor analysis of the
mathematics anxiety scale for children. Measurement and Evaluation in Counseling and Development, 34(1), 14-26. https://doi.org/10.1080/07481756.2001.12069019
Beilock, S. L., Gunderson, E. A., Ramirez, G., & Levine, S. C. (2010). Female teachers’ math
anxiety affects girls’ math achievement. Proceedings of the National Academy of Sciences, 107(5), 1860-1863. doi: 10.1073/pnas.0910967107
Beilock, S. L., & Maloney, E. A. (2015). Math anxiety: A factor in math achievement not to be
ignored. Policy Insights from the Behavioral and Brain Sciences, 2(1), 4-12. doi: 10.1177/2372732215601438
**Benedict, M. (2017). The Effect of Gender on Math Anxiety: How adults think they feel versus
how they actually feel. (Unpublished masters thesis). Carleton University, Ottawa, Canada.
Benjamini, Y., & Hochberg, Y. (1995). Controlling the false discovery rate: a practical and
powerful approach to multiple testing. Journal of the Royal Statistical Society: Series B (Methodological), 57(1), 289-300.
*Bessant, K. C. (2000). Affective and cognitive components of statistics course performance.
(Doctoral dissertation, University of Manitoba). http://hdl.handle.net/1993/19534 Betancourt, H., & López, S. R. (1993). The study of culture, ethnicity, and race in American
psychology. American Psychologist, 48(6), 629-637. doi: 10.1037/0003-066X.48.6.629 Betz, N. (1978). Prevalence, distribution and correlates of math anxiety in college students.
Journal of Counseling Psychology, 24, 551-558. doi: 10.1037/0022-0167.25.5.441 *Birenbaum, M., & Eylath, S. (1994). Who is afraid of statistics? Correlates of statistics anxiety
among students of educational sciences. Educational Research, 36(1), 93-98. https://doi.org/10.1080/0013188940360110
RELATION BETWEEN MATH ANXIETY AND MATH ACHIEVEMENT
68
*Birgin, O., Baloğlu, M., Çatlıoğlu, H., & Gürbüz, R. (2010). An investigation of mathematics anxiety among sixth through eighth grade students in Turkey. Learning and Individual Differences, 20(6), 654-658. https://doi.org/10.1016/j.lindif.2010.04.006
*Bisse, W. H. (1995). Mathematics anxiety: A multi-method study of causes and effects with
community college students. (Unpublished doctoral dissertation). Northern Arizona University, Flagstaff, Arizona.
*Bosmans, G., & De Smedt, B. (2015). Insecure attachment is associated with math anxiety in
middle childhood. Frontiers in Psychology, 6, 1596. https://doi.org/10.3389/fpsyg.2015.01596
**Braham, E. J., & Libertus, M. E. (2018). When approximate number acuity predicts math
performance: The moderating role of math anxiety. PloS one, 13(5), e0195696. *Buelow, M. T., & Barnhart, W. R. (2017). The influence of math anxiety, math performance,
worry, and test anxiety on the Iowa gambling task and balloon analogue risk task. Assessment, 24(1), 127-137. https://doi.org/10.1177/1073191115602554
*Buelow, M. T., & Frakey, L. L. (2013). Math anxiety differentially affects WAIS-IV arithmetic
performance in undergraduates. Archives of Clinical Neuropsychology, 28(4), 356-362. https://doi.org/10.1093/arclin/act006
*Bull, H. (2009). Identifying maths anxiety in student nurses and focusing remedial work.
Journal of Further and Higher Education, 33(1), 71-81. doi: 10.1080/03098770802638689
*Canu, W. H., Elizondo, M., & Broman-Fulks, J. J. (2017). History of ADHD traits related to
general test and specific math anxiety in college students. Learning and Individual Differences, 58, 56-63. https://doi.org/10.1016/j.lindif.2017.07.008
Carey, E., Hill, F., Devine, A., & Szücs, D. (2016). The chicken or the egg? The direction of the
relationship between mathematics anxiety and mathematics performance. Frontiers in Psychology, 6, 1987. doi: 10.3389/fpsyg.2015.01987
Carey, E., Hill, F., Devine, A., & Szűcs, D. (2017). The modified abbreviated math anxiety
scale: A valid and reliable instrument for use with children. Frontiers in Psychology, 8, 11. doi: 10.3389/fpsyg.2017.00011
*Cargnelutti, E., Tomasetto, C., & Passolunghi, M. C. (2017). How is anxiety related to math
performance in young students? A longitudinal study of Grade 2 to Grade 3 children. Cognition and Emotion, 31(4), 755-764. doi: 10.1080/02699931.2016.1147421
RELATION BETWEEN MATH ANXIETY AND MATH ACHIEVEMENT
69
*Casad, B. J., Hale, P., & Wachs, F. L. (2015). Parent-child math anxiety and math-gender stereotypes predict adolescents' math education outcomes. Frontiers in Psychology, 6, 1597. https://doi.org/10.3389/fpsyg.2015.01597
*Casey, M. B., Nuttall, R. L., & Pezaris, E. (1997). Mediators of gender differences in
mathematics college entrance test scores: A comparison of spatial skills with internalized beliefs and anxieties. Developmental psychology, 33(4), 669-680. https://doi.org/10.1037//0012-1649.33.4.669
Cassady, J. C., & Johnson, R. E. (2002). Cognitive test anxiety and academic
performance. Contemporary Educational Psychology, 27(2), 270-295. doi: 10.1006/ceps.2001.1094
*Catapano, M. (2013). Tenth-grade high school students' mathematical self-efficacy,
mathematics anxiety, attitudes toward mathematics, and performance on the New York State Integrated Algebra Regents Examination. (Order No. 3572381). Available From ProQuest Central Student. (1442456200). Retrieved from https://search.proquest.com/docview/1442456200?accountid=6724
*Çatlıoğlu, H., Gürbüz, R., & Birgin, O. (2014). Do pre-service elementary school teachers still
have mathematics anxiety? Some factors and correlates. Bolema: Boletim de Educação Matemática, 28(48), 110-127. https://doi.org/10.1590/1980-4415v28n48a06
Catsambis, S. (1994). The path to math: Gender and racial-ethnic differences in mathematics
participation from middle school to high school. Sociology of Education, 67, 199-215. doi: 10.2307/2112791
Caviola, S., Mammarella, I. C., Cornoldi, C., & Lucangeli, D. (2012). The involvement of
working memory in children’s exact and approximate mental addition. Journal of Experimental Child Psychology, 112(2), 141-160. doi: 10.1016/j.jecp.2012.02.005
*Caviola, S., Primi, C., Chiesi, F., & Mammarella, I. C. (2017). Psychometric properties of the
Abbreviated Math Anxiety Scale (AMAS) in Italian primary school children. Learning and Individual Differences, 55, 174-182. https://doi.org/10.1016/j.lindif.2017.03.006
*Cheema, J. R., & Sheridan, K. (2015). Time spent on homework, mathematics anxiety and
mathematics achievement: Evidence from a US sample. Issues in Educational Research, 25(3), 246-259. http://www.iier.org.au/iier25/cheema.html
*Cheung, K. C. (2017). The effects of resilience in learning variables on mathematical literacy
performance: a study of learning characteristics of the academic resilient and advantaged low achievers in Shanghai, Singapore, Hong Kong, Taiwan and Korea. Educational Psychology, 37(8), 965-982. https://doi.org/10.1080/01443410.2016.1194372
RELATION BETWEEN MATH ANXIETY AND MATH ACHIEVEMENT
70
*Chiesi, F., & Primi, C. (2010). Cognitive and non-cognitive factors related to students' statistics achievement. Statistics Education Research Journal, 9(1), 6-26. https://doi.org/10.1177/0734282911404985
*Chiesi, F., Primi, C., & Carmona, J. (2011). Measuring statistics anxiety: Cross-country validity
of the Statistical Anxiety Scale (SAS). Journal of Psychoeducational Assessment, 29(6), 559-569. https://doi.org/10.3389/fpsyg.2015.01833
Cimpian, J. R., Lubienski, S. T., Timmer, J. D., Makowski, M. B., & Miller, E. K. (2016). Have
gender gaps in math closed? Achievement, teacher perceptions, and learning behaviors across two ECLS-K cohorts. AERA Open, 2(4), 1-19. doi: 10.1177/2332858416673617
*Cipora, K., Szczygieł, M., Willmes, K., & Nuerk, H. C. (2015). Math anxiety assessment with
the abbreviated math anxiety scale: applicability and usefulness: insights from the polish adaptation. Frontiers in Psychology, 6, 1833. doi: 10.3389/fpsyg.2015.01833
Clinedinst, M., & Koranteng, A. M. (2017). State of college admission.
http://hdl.handle.net/10919/83148. *Coates, J. D. (1998). Mathematics anxiety and its relationship to students' perceived teacher
and parent attitudes toward mathematics. Mathematics anxiety and its relationship to students’ perceived teacher and parent attitudes toward mathematics [ProQuest Information & Learning]. In Dissertation Abstracts International Section A: Humanities and Social Sciences (Vol. 58, Issue 12–A, p. 4590).
Cochran, W. G. (1954). The combination of estimates from different experiments. Biometrics
10(1), 101-129. doi: 10.2307/3001666 Cohn, L. D., & Becker, B. J. (2003). How meta-analysis increases statistical
power. Psychological Methods, 8(3), 243-253. doi: 10.1037/1082-989X.8.3.243 **Conlon, R., Hicks, A., Barroso, C., & Ganley, C. M. (2018). Anxiety Timing Study. Raw data. *Cook, R. P. (1998). An exploration of the relationship between mathematics anxiety level and
perceptual learning style of adult learners in a community college setting [ProQuest Information & Learning]. In Dissertation Abstracts International Section A: Humanities and Social Sciences (Vol. 58, Issue 10–A, p. 3801).
Cooper, H., Hedges, L. V., & Valentine, J. C. (Eds.). (2009). The Handbook of Research
Synthesis and Meta-analysis. Russell Sage Foundation. Corbett, C., & Hill, C. (2015). Solving the Equation: The Variables for Women's Success in
Engineering and Computing. American Association of University Women. 1111 Sixteenth Street NW, Washington, DC 20036.
RELATION BETWEEN MATH ANXIETY AND MATH ACHIEVEMENT
71
*Cortina, J. M. (1995). On the meaning and measurement of test appropriateness. (Unpublished doctoral dissertation). Michigan State University, East Lansing, Michigan.
*D'Aloisio, B. E. (2016). Investigating predictors of academic success in a foundational
business mathematics course. (Doctoral dissertation, Rhode Island College). https://doi.org/10.28971/242016db105
*Daches Cohen, L., & Rubinsten, O. (2017). Mothers, intrinsic math motivation, arithmetic
skills, and math anxiety in elementary school. Frontiers in psychology, 8, 1939. https://doi.org/10.3389/fpsyg.2017.01939
*Davis, M. M. (2010). An exploration of factors affecting the academic success of students in a
college quantitative business course [ProQuest Information & Learning]. In Dissertation Abstracts International Section A: Humanities and Social Sciences (Vol. 71, Issue 1–A, p. 102).
del Río, M. F., Susperreguy, M. I., Strasser, K., & Salinas, V. (2017). Distinct Influences of
Mothers and Fathers on Kindergartners’ Numeracy Performance: The Role of Math Anxiety, Home Numeracy Practices, and Numeracy Expectations. Early Education and Development, 28(8), 939-955. doi: 10.1080/10409289.2017.1331662
Devine, A., Hill, F., Carey, E., & Szűcs, D. (2018). Cognitive and emotional math problems largely dissociate: Prevalence of developmental dyscalculia and mathematics anxiety. Journal of Educational Psychology, 110(3), 431-444. doi: 10.1037/edu0000222
*Devine, A., Fawcett, K., Szűcs, D., & Dowker, A. (2012). Gender differences in mathematics
anxiety and the relation to mathematics performance while controlling for test anxiety. Behavioral and Brain Functions, 8(33). doi: 10.1186/1744-9081-8-33
*Devine, A., Hill, F., Carey, E., & Szűcs, D. (2018). Cognitive and emotional math problems
largely dissociate: Prevalence of developmental dyscalculia and mathematics anxiety. Journal of Educational Psychology, 110(3), 431-444. https://doi.org/10.1037/edu0000222
*Donelle, L. (2008). Risk comprehension of online colorectal cancer information: An assessment
of health numeracy [ProQuest Information & Learning]. In Dissertation Abstracts International Section A: Humanities and Social Sciences (Vol. 68, Issue 11–A, p. 4531).
**Douglas, H., & LeFevre, J. (2016). Modeling Relations Between Math Anxiety and Cognition:
Limited evidence for a cognitive deficits hypothesis. Unpublished manuscript. Dowker, A., Sarkar, A., & Looi, C. Y. (2016). Mathematics anxiety: what have I learned in 60
years?. Frontiers in Psychology, 7, 508. doi: 10.3389/fpsyg.2016.00508
RELATION BETWEEN MATH ANXIETY AND MATH ACHIEVEMENT
72
Downs, S. H., & Black, N. (1998). The feasibility of creating a checklist for the assessment of the methodological quality both of randomised and non-randomised studies of health care interventions. Journal of Epidemiology & Community Health, 52(6), 377-384. doi: 10.1136/jech.52.6.377
Dreger, R. M., & Aiken Jr, L. R. (1957). The identification of number anxiety in a college
population. Journal of Educational Psychology, 48(6), 344-351. doi: 10.1037/h0045894 Duval, S., & Tweedie, R. (2000). Trim and fill: a simple funnel-plot–based method of testing and
adjusting for publication bias in meta-analysis. Biometrics, 56(2), 455-463. doi: 10.1111/j.0006-341X.2000.00455.x
*Dutko, J. A. (2016). Understanding mathematics anxiety: The relationships between fourth
grade students’ math anxiety, multiplication fact fluency, and problem solving ability [ProQuest Information & Learning]. In Dissertation Abstracts International Section A: Humanities and Social Sciences (Vol. 76, Issue 9–A(E)).
Education Commission of the States (2018). 50-State Comparison: State Kindergarten Through
Third Grade Policies, retrieved from https://www.ecs.org/kindergarten-policies/. Egger, M., Smith, G. D., Schneider, M., & Minder, C. (1997). Bias in meta-analysis detected by
a simple, graphical test. Bmj, 315(7109), 629-634. doi: 10.1136/bmj.315.7109.629 Else-Quest, N. M., Hyde, J. S., & Linn, M. C. (2010). Cross-national patterns of gender
differences in mathematics: a meta-analysis. Psychological Bulletin, 136(1), 103-127. doi: 10.1037/a0018053
Else-Quest, N. M., Mineo, C. C., & Higgins, A. (2013). Math and science attitudes and
achievement at the intersection of gender and ethnicity. Psychology of Women Quarterly, 37(3), 293-309. doi: 10.1177/0361684313480694
Engelhard, G. (1990). Math anxiety, mother's education, and the mathematics performance of
adolescent boys and girls: Evidence from the United States and Thailand. The Journal of Psychology, 124(3), 289-298. doi: 10.1080/00223980.1990.10543224
*Erturan, S., & Jansen, B. (2015). An investigation of boys’ and girls’ emotional experience of
math, their math performance, and the relation between these variables. European Journal of Psychology of Education, 30(4), 421-435. https://doi.org/10.1007/s10212-015-0248-7
Espino, M., Pereda, J., Recon, J., Perculeza, E., & Umali, C. (2017). Mathematics anxiety and its
impact on the course and career choice of grade 11 students. International Journal of Education, Psychology and Counselling, 2, 99-119. http://www.ijepc.com/PDF/IJEPC-2017-05-09-08.pdf
RELATION BETWEEN MATH ANXIETY AND MATH ACHIEVEMENT
73
Eysenck, M. W., & Calvo, M. G. (1992). Anxiety and performance: The processing efficiency theory. Cognition & Emotion, 6(6), 409-434. doi: 10.1080/02699939208409696
Eysenck, M. W., Derakshan, N., Santos, R., & Calvo, M. G. (2007). Anxiety and cognitive
performance: attentional control theory. Emotion, 7(2), 336. doi: 10.1037/1528-3542.7.2.336
Fan, X., Chen, M., & Matsumoto, A. R. (1997). Gender differences in mathematics achievement:
Findings from the National Education Longitudinal Study of 1988. The Journal of Experimental Education, 65(3), 229-242. doi: 10.1080/00220973.1997.9943456
*Fannin-Carroll, K. D. (2015). The effect of math anxiety on the academic success of
developmental mathematics students at a texas community college [ProQuest Information & Learning]. In Dissertation Abstracts International Section A: Humanities and Social Sciences (Vol. 75, Issue 9–A(E)).
*Farnsworth Jr., D. M. (2009). Math Performance as a Function of Math Anxiety and Arousal
Performance Theory. (Doctoral dissertation, The University of North Dakota, Grand Forks, North Dakota). https://commons.und.edu/theses/896
*Farquharson, F. (2005). A comparison of community college students’ anxiety, motivation, and
achievement in two learning models for teaching developmental algebra: Instructor-directed computer-mediated model and traditional lecture model [ProQuest Information & Learning]. In Dissertation Abstracts International Section A: Humanities and Social Sciences (Vol. 65, Issue 11–A, p. 4138).
*Faust, M. W., Ashcraft, M.H., & Fleck, D.E. (1996). Mathematics anxiety effects in simple and
complex addition. Mathematical Cognition, 2(1), 25-62. https://doi.org/10.1080/135467996387534
*Federici, R. A., & Skaalvik, E. M. (2014). Students' Perceptions of Emotional and Instrumental
Teacher Support: Relations with Motivational and Emotional Responses. International Education Studies, 7(1), 21-36. https://doi.org/10.5539/ies.v7n1p21
Fennema, E., & Sherman, J. A. (1976). Fennema-Sherman mathematics attitudes scales:
Instruments designed to measure attitudes toward the learning of mathematics by females and males. Journal for Research in Mathematics Education, 7(5), 324-326. doi: 10.2307/748467
*Ferla, J., Valcke, M., & Cai, Y. (2009). Academic self-efficacy and academic self-concept:
Reconsidering structural relationships. Learning and individual differences, 19(4), 499-505. https://doi.org/10.1016/j.lindif.2009.05.004

RELATION BETWEEN MATH ANXIETY AND MATH ACHIEVEMENT
74
*Finney, S. J., & Schraw, G. (2003). Self-efficacy beliefs in college statistics courses. Contemporary Educational Psychology, 28(2), 161-186. https://doi.org/ 10.1016/S0361-476X(02)00015-2
**Foley, A. (2015). Visuospatial working memory and arithmetic strategies. Unpublished
manuscript. University of Chicago, Chicago, Illinois. Foley, A. E., Herts, J. B., Borgonovi, F., Guerriero, S., Levine, S. C., & Beilock, S. L. (2017).
The math anxiety-performance link: A global phenomenon. Current Directions in Psychological Science, 26(1), 52-58. doi: 10.1177/0963721416672463
*Frenzel, A. C., Pekrun, R., & Goetz, T. (2007). Girls and mathematics—A “hopeless” issue? A
control-value approach to gender differences in emotions towards mathematics. European Journal of Psychology of Education, 22(4), 497. https://doi.org/10.1007/BF03173468
*Gan, S. K. E., Lim, K. M. J., & Haw, Y. X. (2016). The relaxation effects of stimulative and
sedative music on mathematics anxiety: A perception to physiology model. Psychology of Music, 44(4), 730-741. https://doi.org/10.1177/0305735615590430
**Ganley, C.M. (2014). Test framing study. Raw data. **Ganley, C. M., & Hart, S. A. (2017). Common Core Paper. Raw data. *Ganley, C. M., & McGraw, A. L. (2016). The development and validation of a revised version
of the math anxiety scale for young children. Frontiers in psychology, 7, 1181. https://doi.org/10.3389/fpsyg.2016.01181
**Ganley, C. M., Conlon, R., McGraw, A. L., Barroso, C., & Geer, E. A. (2016). Anxiety
Intervention Study. Raw data. *Ganley, C. M., & Vasilyeva, M. (2011). Sex differences in the relation between math
performance, spatial skills, and attitudes. Journal of Applied Developmental Psychology, 32(4), 235-242. https://doi.org/10.1016/j.appdev.2011.04.001
**Gashaj, & Roebers (2015). Mathematics and Motor Study. Unpublished Manuscript. **Geer, E. A., & Ganley, C. M. (2017). Spatial and social project. Raw data. *Gibson-Dee, K. A. (2016). Hope, expectation, math anxiety, and achievement in college
algebra students: Examining an instructional strategy using multi-level modeling. (Doctoral dissertation, University of South Florida, Tampa, Florida). https://scholarcommons.usf.edu/etd/6506
RELATION BETWEEN MATH ANXIETY AND MATH ACHIEVEMENT
75
Gierl, M. J., & Bisanz, J. (1995). Anxieties and attitudes related to mathematics in grades 3 and 6. The Journal of experimental education, 63(2), 139-158.
Gersten, R., Baker, S., & Lloyd, J. W. (2000). Designing high-quality research in special
education: Group experimental design. The Journal of Special Education, 34(1), 2-18. doi: 10.1177/002246690003400101
**Gilligan, K .A., Thomas, M. S. C, & Farran, E. K. (2016). Mathematics in the Primary Years:
The role of dispositional factors. Unpublished Manuscript. University of Surrey, Guildford, England.
*Goetz, T., Bieg, M., Lüdtke, O., Pekrun, R., & Hall, N. C. (2013). Do girls really experience
more anxiety in mathematics?. doi: Psychological science, 24(10), 2079-2087. https://doi.org/10.1177/0956797613486989
*González, A., Rodríguez, Y., Faílde, J. M., & Carrera, M. V. (2016). Anxiety in the statistics
class: Structural relations with self-concept, intrinsic value, and engagement in two samples of undergraduates. Learning and Individual Differences, 45, 214-221. https://doi.org/10.1016/j.lindif.2015.12.019
Gonzalez-DeHass, A. R., Furner, J. M., Vásquez-Colina, M. D., & Morris, J. D. (2017). Pre-
service elementary teachers' achievement goals and their relationship to math anxiety. Learning and Individual Differences, 60, 40-45. doi: 10.1016/j.lindif.2017.10.002
*Gorvine, B. J., & Smith, H. D. (2015). Predicting student success in a psychological statistics
course emphasizing collaborative learning. Teaching of Psychology, 42(1), 56-59. https://doi.org/10.1177/0098628314562679
Gottfried, A. E., Marcoulides, G. A., Gottfried, A. W., Oliver, P. H., & Guerin, D. W. (2007).
Multivariate latent change modeling of developmental decline in academic intrinsic math motivation and achievement: Childhood through adolescence. International Journal of Behavioral Development, 31(4), 317-327. doi: 10.1177/0165025407077752
Gunderson, E. A., Park, D., Maloney, E. A., Beilock, S. L., & Levine, S. C. (2018). Reciprocal
relations among motivational frameworks, math anxiety, and math achievement in early elementary school. Journal of Cognition and Development, 19(1), 21-46. doi: 10.1080/15248372.2017.1421538
*Guven, B., & Cabakcor, B. O. (2013). Factors influencing mathematical problem-solving
achievement of seventh grade Turkish students. Learning and Individual Differences, 23, 131-137. https://doi.org/10.1016/j.lindif.2012.10.003

RELATION BETWEEN MATH ANXIETY AND MATH ACHIEVEMENT
76
*Hadfield, O. D., Littleton, C. E., Steiner, R. L., & Woods, E. S. (1998). Predictors of preservice elementary teacher effectiveness in the micro-teaching of mathematics lessons. Journal of Instructional Psychology, 25(1), 34-47.
*Hafner, E. W. (2008). The relationship between math anxiety, math self-efficacy, and
achievement among a sample of eighth grade students [ProQuest Information & Learning]. In Dissertation Abstracts International Section A: Humanities and Social Sciences (Vol. 69, Issue 2–A, p. 503)
Hall, C. W., Davis, N. B., Bolen, L. M., & Chia, R. (1999). Gender and racial differences in
mathematical performance. The Journal of Social Psychology, 139(6), 677-689. doi: 10.1080/00224549909598248
*Hamid, M. H. S., Shahrill, M., Matzin, R., Mahalle, S., & Mundia, L. (2013). Barriers to
Mathematics Achievement in Brunei Secondary School Students: Insights into the roles of mathematics anxiety, self-esteem, proactive coping, and test stress. International Education Studies, 6(11), 1-14. https://doi.org/10.5539/ies.v6n11p1
*Hanna, D., & Dempster, M. (2009). The effect of statistics anxiety on students’ predicted and
actual test scores. The Irish Journal of Psychology, 30(3-4), 201-209. https://doi.org/10.1080/03033910.2009.10446310
*Harari, R. R., Vukovic, R. K., & Bailey, S. P. (2013). Mathematics anxiety in young children:
an exploratory study. The Journal of Experimental Education, 81(4), 538-555. doi: doi.org/10.1080/00220973.2012.727888
*Harding, J. L. (2015). The effect of cooperative learning groups on mathematics and statistics
anxiety in a college mathematics class. (Unpublished doctoral dissertation). Robert Morris University, Pittsburgh, Pennsylvania.
*Harpole, C. A. (1996). Effects of a mental rotations curriculum on mathematical
conceptualization and math anxiety in eighth-grade male and female students [ProQuest Information & Learning]. In Dissertation Abstracts International Section A: Humanities and Social Sciences (Vol. 57, Issue 2–A, p. 0612).
*Hart, S. A, Daucourt, M., & Ganley, C. M. (2017). Individual differences related to college
students’ course performance in calculus II. Journal of Learning Analytics, 4(2), 129-153. https://doi.org/10.18608/jla.2017.42.11
**Hart, S. A, & Ganley, C. M. (2016). Psychology Majors Study Cohort 1. Raw data. *Hart, S. A., & Ganley, C. M. (2019). The nature of math anxiety in adults: Prevalence and
correlates. Journal of Numerical Cognition, 5(2), 122-139. https://doi.org/10.5964/jnc.v5i2.195

RELATION BETWEEN MATH ANXIETY AND MATH ACHIEVEMENT
77
*Hart, S. A., Ganley, C. M., & Purpura, D. J. (2016). Understanding the home math environment and its role in predicting parent report of children’s math skills. PloS one, 11(12), e0168227. https://doi.org/10.1371/journal.pone.0168227
*Hart, S. A., Logan, J. A., Thompson, L., Kovas, Y., McLoughlin, G., & Petrill, S. A. (2016). A
latent profile analysis of math achievement, numerosity, and math anxiety in twins. Journal of educational psychology, 108(2), 181. https://doi.org/10.1037/edu0000045
*Helming, L. (2013). Motivation and Math Anxiety for Ability Grouped College Math Students.
(Doctoral dissertation). ERIC. (1773213371; ED563200). Hembree, R. (1990). The nature, effects, and relief of mathematics anxiety. Journal for Research
in Mathematics Education, 21(1), 33-46. doi: 10.2307/749455 *Henschel, S., & Roick, T. (2017). Relationships of mathematics performance, control and value
beliefs with cognitive and affective math anxiety. Learning and Individual Differences, 55, 97-107. https://doi.org/10.1016/j.lindif.2017.03.009
Higgins, J. P., & Thompson, S. G. (2002). Quantifying heterogeneity in a meta-
analysis. Statistics in Medicine, 21(11), 1539-1558. doi: 10.1002/sim.1186 *Hill, F., Mammarella, I. C., Devine, A., Caviola, S., Passolunghi, M. C., & Szűcs, D. (2016).
Maths anxiety in primary and secondary school students: Gender differences, developmental changes and anxiety specificity. Learning and Individual Differences, 48, 45-53. doi: 10.1016/j.lindif.2016.02.006
*Hoffman, B. (2010). “I think I can, but I'm afraid to try”: The role of self-efficacy beliefs and
mathematics anxiety in mathematics problem-solving efficiency. Learning and Individual Differences, 20(3), 276-283. https://doi.org/10.1016/j.lindif.2010.02.001
*Hong, E., & Karstensson, L. (2002). Antecedents of state test anxiety. Contemporary
Educational Psychology, 27(2), 348-367. https://doi.org/10.1006/ceps.2001.1095 *Hoover, J. D., & Healy, A. F. (2017). Algebraic reasoning and bat-and-ball problem variants:
Solving isomorphic algebra first facilitates problem solving later. Psychonomic Bulletin & Review, 24(6), 1922-1928. https://doi.org/10.3758/s13423-017-1241-8
*Hopko, D. R., Hunt, M. K., & Armento, M. E. (2005). Attentional task aptitude and
performance anxiety. International Journal of Stress Management, 12(4), 389. https://doi.org/10.1037/1072-5245.12.4.389

RELATION BETWEEN MATH ANXIETY AND MATH ACHIEVEMENT
78
Hopko, D. R., Mahadevan, R., Bare, R. L., & Hunt, M. K. (2003). The abbreviated math anxiety scale (AMAS) construction, validity, and reliability. Assessment, 10(2), 178-182. doi: 10.1177/1073191103010002008
*Hunt, T. E., Bhardwa, J., & Sheffield, D. (2017). Mental arithmetic performance, physiological
reactivity and mathematics anxiety amongst UK primary school children. Learning and Individual Differences, 57, 129-132. https://doi.org/10.1016/j.lindif.2017.03.016
*Hunt, T. E., Clark-Carter, D., & Sheffield, D. (2015). Exploring the Relationship Between
Mathematics Anxiety and Performance: An eye-tracking approach. Applied Cognitive Psychology, 29(2), 226-231. https://doi.org/10.1002/acp.3099
**Hurst, M., & Cordes, S. (2012). FDN Study 1. Unpublished Manuscript. Boston College,
Boston, Massachusetts. **Hurst, M., & Cordes, S. (2013). FDN Study 2. Unpublished Manuscript. Boston College,
Boston, Massachusetts. Hurst, M., & Cordes, S. (2017). When Being Good at Math Is Not Enough: How Students’
Beliefs About the Nature of Mathematics Impact Decisions to Pursue Optional Math Education. In Understanding Emotions in Mathematical Thinking and Learning (pp. 221-241). Academic Press.
*Hutt, G. K. (2007). Experiential learning spaces: Hermetic transformational leadership for
psychological safety, consciousness development and math anxiety related inferiority complex depotentiation (Doctoral dissertation, Case Western Reserve University, Columbus, Ohio). http://rave.ohiolink.edu/etdc/view?acc_num=case1175892374
Hyde, J. S., Fennema, E., & Lamon, S. J. (1990). Gender differences in mathematics
performance: a meta-analysis. Psychological Bulletin, 107(2), 139-155. doi: 10.1037/0033-2909.107.2.139
*Imbo, I., & Vandierendonck, A. (2007). Do multiplication and division strategies rely on
executive and phonological working memory resources?. Memory & Cognition, 35(7), 1759-1771. https://doi.org/10.3758/BF03193508
*Imbo, I., & Vandierendonck, A. (2007). The development of strategy use in elementary school
children: Working memory and individual differences. Journal of experimental child psychology, 96(4), 284-309. https://doi.org/10.1016/j.jecp.2006.09.001
*Iossi, L. H. (2009). The mathematics anxiety of bilingual community college students.
(Doctoral Dissertation, Florida International University).
RELATION BETWEEN MATH ANXIETY AND MATH ACHIEVEMENT
79
*Ironsmith, M., Marva, J., Harju, B., & Eppler, M. (2003). Motivation and Performance in College Students Enrolled in Self-Paced Versus Lecture-Format Remedial Mathematics Courses. Journal of Instructional Psychology, 30(4). 276-284.
*Jameson, M. M. (2013). The development and validation of the Children’s Anxiety in Math
Scale. Journal of Psychoeducational Assessment, 31(4), 391-395. Jameson, M. M. (2014). Contextual factors related to math anxiety in second-grade children. The
Journal of Experimental Education, 82(4), 518-536. doi: 10.1080/00220973.2013.813367 Jamieson, J.P., Mendes, W.B., Blackstock, E., & Schmader, T. (2010). Turning the knotw in
your stomach into bows: Reappraising arousal improves performance on the GRE. Journal of Experimental Social Psychology, 46(1), 208-212. doi: 10.1016/j.jesp.2009.08.015
*Jamieson, J. P., Peters, B. J., Greenwood, E. J., & Altose, A. J. (2016). Reappraising stress
arousal improves performance and reduces evaluation anxiety in classroom exam situations. Social Psychological and Personality Science, 7(6), 579-587. https://doi.org/10.1177/1948550616644656
*Jansen, B. R., Louwerse, J., Straatemeier, M., Van der Ven, S. H., Klinkenberg, S., & Van der
Maas, H. L. (2013). The influence of experiencing success in math on math anxiety, perceived math competence, and math performance. Learning and Individual Differences, 24, 190-197. https://doi.org/10.1016/j.lindif.2012.12.014
*Jansen, B. R., Schmitz, E. A., & van der Maas, H. L. (2016). Affective and motivational factors
mediate the relation between math skills and use of math in everyday life. Frontiers in psychology, 7, 513. https://doi.org/10.3389/fpsyg.2016.00513
*Jenßen, L., Dunekacke, S., Eid, M., & Blömeke, S. (2015). The relationship of mathematical
competence and mathematics anxiety. Zeitschrift für Psychologie. https://doi.org/10.1027/2151-2604/a000197
Jordan, N. C., Kaplan, D., Ramineni, C., & Locuniak, M. N. (2009). Early math matters:
kindergarten number competence and later mathematics outcomes. Developmental Psychology, 45(3), 850-867. doi: 10.1037/a0014939
*Justicia-Galiano, M. J., Martín-Puga, M. E., Linares, R., & Pelegrina, S. (2017). Math anxiety
and math performance in children: The mediating roles of working memory and math self-concept. British Journal of Educational Psychology, 87(4), 573-589. https://doi.org/10.1111/bjep.12165

RELATION BETWEEN MATH ANXIETY AND MATH ACHIEVEMENT
80
*Justicia-Galiano, M. J., Pelegrina, S., Lechuga, M. T., Gutiérrez-Palma, N., Martín-Puga, E. M., & Lendínez, C. (2016). Math anxiety and its relationship to inhibitory abilities and perceived emotional intelligence. Anales De Psicología/Annals of Psychology, 32(1), 125-131. https://doi.org/10.6018/analesps.32.1.194891
*Karimi, A., & Venkatesan, S. (2009). Mathematics anxiety, mathematics performance and
overall academic performance in high school students. Management and Labour Studies, 34(4), 556-562. https://doi.org/10.1177/0258042X0903400406
Kastberg, D., Chan, J. Y., & Murray, G. (2016). Performance of US 15-Year-Old Students in
Science, Reading, and Mathematics Literacy in an International Context: First Look at PISA 2015. NCES 2017-048. National Center for Education Statistics.
*Keeley, J., Zayac, R., & Correia, C. (2008). Curvilinear relationships between statistics anxiety
and performance among undergraduate students: Evidence for optimal anxiety. Statistics Education Research Journal, 7(1), 4-15.
*Khabiri, P. S. (1994). The role of metacognition, effort and worry in math problem-solving
requiring problem translation [ProQuest Information & Learning]. In Dissertation Abstracts International Section A: Humanities and Social Sciences (Vol. 54, Issue 9–A, p. 3379).
*Kim, J., & McLean, J. E. (1994). The Relationships between Individual Difference Variables
and Test Performance in Computerized Adaptive Testing. Paper presented at the Annual Meeting of the Mid-South Educational Research Association, Nashville, TN.
*Kimber, C. T. (2009). The effect of training in self-regulated learning on math anxiety and
achievement among preservice elementary teachers in a freshman course in mathematics concepts. (Doctoral dissertation, Temple University, Philadelphia, Pennsylvania). https://digital.library.temple.edu/digital/collection/p245801coll10/id/27309/
*Koponen, V., & Lasonen, J. (1994). Finnish Vocational High School Students' Perceptions of
Themselves as Learners of Mathematics. International Journal of Vocational Education and Training, 2(1), 21-37.
**Kowalsky, A.L. (2017). The role of fingers in adults’ numerical processing. Unpublished
manuscript. Florida State University, Tallahassee, Florida. **Krinzinger, H. (2016). Math anxiety questionnaire cross-sectional (group testing of MAQ).
Unpublished manuscript. RWTH Aachen University, Aachen, Germany. *Krinzinger, H., Kaufmann, L., & Willmes, K. (2009). Math anxiety and math ability in early
primary school years. Journal of Psycho-Educational Assessment, 27(3), 206–225. http://dx.doi.org/10.1177/0734282908330583.
RELATION BETWEEN MATH ANXIETY AND MATH ACHIEVEMENT
81
*Kyttälä, M., & Björn, P. M. (2010). Prior mathematics achievement, cognitive appraisals and anxiety as predictors of Finnish students’ later mathematics performance and career orientation. Educational Psychology, 30(4), 431-448. https://doi.org/10.1080/01443411003724491
*Kyttälä, M., & Björn, P. M. (2014). The role of literacy skills in adolescents' mathematics word
problem performance: Controlling for visuo-spatial ability and mathematics anxiety. Learning and Individual Differences, 29, 59-66. https://doi.org/10.1016/j.lindif.2013.10.010
*Lai, Y., Zhu, X., Chen, Y., & Li, Y. (2015). Effects of mathematics anxiety and mathematical
metacognition on word problem solving in children with and without mathematical learning difficulties. PloS one, 10(6), e0130570. doi: 10.1371/journal.pone.0130570
*Lalonde, R. N., & Gardner, R. C. (1993). Statistics as a second language? A model for
predicting performance in psychology students. Canadian Journal of Behavioural Science/Revue canadienne des sciences du comportement, 25(1), 108-125. https://doi.org/10.1037/h0078792
**Lauer, J. E., Esposito, A. G., & Bauer, P. J. (2016). The role of anxiety in math and spatial
performance: Developmental change and specificity across the elementary-school years. Unpublished manuscript. Emory University, Atlanta, Georgia.
Lauermann, F., Chow, A., & Eccles, J. S. (2015). Differential effects of adolescents’ expectancy
and value beliefs about math and English on math/science-related and human services-related career plans. International Journal of Gender, Science and Technology, 7(2), 205-228. http://genderandset.open.ac.uk/index.php/genderandset/article/view/393
*Lawson, V. J. (1993). Mathematics anxiety, test anxiety, instructional methods, and
achievement in a developmental mathematics class [ProQuest Information & Learning]. In Dissertation Abstracts International Section A: Humanities and Social Sciences (Vol. 53, Issue 10–A, p. 3479).
*Leap, E. M. (2013). A Quasi-Experimental Study Investigating the Effect of Scent on Students'
Memory of Multiplication Facts and Math Anxiety. ERIC. (1720060993; ED557536). *Lee, J. (2009). Universals and specifics of math self-concept, math self-efficacy, and math
anxiety across 41 PISA 2003 participating countries. Learning and Individual Differences, 19(3), 355-365. doi: 10.1016/j.lindif.2008.10.009
*Lee, K., & Cho, S. (2018). Magnitude processing and complex calculation is negatively
impacted by mathematics anxiety while retrieval-based simple calculation is not. International Journal of Psychology, 53(4), 321-329. https://doi.org/10.1002/ijop.12412
RELATION BETWEEN MATH ANXIETY AND MATH ACHIEVEMENT
82
**LeFevre, J. A., Penner-Wilger, M., Pyke, A. A., Shanahan, T., & Deslauriers, W. A. (2014). Putting Two and Two Together: Declines in Arithmetic Fluency among Young Canadian Adults, 1993 to 2005. Technical Report 2014-01 (No. 2014-01). https://ir.library.carleton.ca/pub/20945/
*Lester, D. (2007). Predicting performance in a psychological statistics course. Psychological
Reports, 101(1), 334-334. https://doi.org/10.10.2466/PR0.101.1.334 *Lester, D. (2016). Predicting success in psychological statistics courses. Psychological
Reports, 118(3), 772-777. https://doi.org/10.1177/0033294116647687 Liebert, R. M., & Morris, L. W. (1967). Cognitive and emotional components of test anxiety: A
distinction and some initial data. Psychological Reports, 20(3), 975-978. doi: 10.2466/pr0.1967.20.3.975
*Lim, S. Y., & Chapman, E. (2013). An investigation of the Fennema-Sherman mathematics
anxiety subscale. Measurement and Evaluation in Counseling and Development, 46(1), 26-37. https://doi.org/10.1177/0748175612459198
*Lim, S. Y., & Chapman, E. (2013). Development of a short form of the attitudes toward
mathematics inventory. Educational Studies in Mathematics, 82(1), 145-164. https://doi.org/10.1007/s10649-012-9414-x
*Lim, S. Y., & Chapman, E. (2015). Identifying affective domains that correlate and predict
mathematics performance in high-performing students in Singapore. Educational Psychology, 35(6), 747-764. https://doi.org/10.1080/01443410.2013.860221
*Lindskog, M., Winman, A., & Poom, L. (2017). Individual differences in nonverbal number
skills predict math anxiety. Cognition, 159, 156-162. doi: 10.1016/j.cognition.2016.11.014
*Lloyd, S. A., & Robertson, C. L. (2012). Screencast tutorials enhance student learning of
statistics. Teaching of Psychology, 39(1), 67-71. https://doi.org/10.1177/0098628311430640
Lubienski, S. T. (2002). A closer look at Black-White mathematics gaps: Intersections of race
and SES in NAEP achievement and instructional practices data. Journal of Negro Education, 269-287. doi: 10.2307/3211180
*Lukowski, S. L., DiTrapani, J., Jeon, M., Wang, Z., Schenker, V. J., Doran, M. M., ... & Petrill,
S. A. (2016). Multidimensionality in the measurement of math-specific anxiety and its relationship with mathematical performance. Learning and individual differences. https://doi.org/10.1016/j.lindif.2016.07.007

RELATION BETWEEN MATH ANXIETY AND MATH ACHIEVEMENT
83
*Luo, W., Hogan, D., Tan, L. S., Kaur, B., Ng, P. T., & Chan, M. (2014). Self-construal and students’ math self-concept, anxiety and achievement: An examination of achievement goals as mediators. Asian Journal of Social Psychology, 17(3), 184-195. https://doi.org/10.1111/ajsp.12058
*Luo, W., Lee, K., Ng, P. T., & Ong, J. X. W. (2014). Incremental beliefs of ability,
achievement emotions and learning of Singapore students. Educational Psychology, 34(5), 619-634. https://doi.org/10.1080/01443410.2014.909008
Ma, X. (1999). A meta-analysis of the relationship between anxiety toward mathematics and
achievement in mathematics. Journal for Research in Mathematics Education, 520-540. Ma, X., & Xu, J. (2004). The causal ordering of mathematics anxiety and mathematics
achievement: a longitudinal panel analysis. Journal of Adolescence, 27(2), 165-179. doi: 10.1016/j.adolescence.2003.11.003
Maas, C. J., & Hox, J. J. (2004). Robustness issues in multilevel regression analysis. Statistica
Neerlandica, 58(2), 127-137. doi: 10.1046/j.0039-0402.2003.00252.x *Macher, D., Paechter, M., Papousek, I., & Ruggeri, K. (2011). Statistics anxiety, trait anxiety,
learning behavior, and academic performance. European Journal of Psychology of Education, 27(4), 483-498. https://doi.org/10.1007/s10212-011-0090-5
*Macher, D., Paechter, M., Papousek, I., Ruggeri, K., Freudenthaler, H. H., & Arendasy, M.
(2013). Statistics anxiety, state anxiety during an examination, and academic achievement. British Journal of Educational Psychology, 83(4), 535-549. https://doi.org/10.1111/j.2044-8279.2012.02081.x
MacLeod, C., & Mathews, A. (2012). Cognitive bias modification approaches to anxiety. Annual
Review of Clinical Psychology, 8, 189-217. doi: 10.1146/annurev-clinpsy-032511-143052
*Maloney, E. A., Ramirez, G., Gunderson, E. A., Levine, S. C., & Beilock, S. L. (2015).
Intergenerational effects of parents’ math anxiety on children’s math achievement and anxiety. Psychological Science, 26(9), 1480-1488. doi: 10.1177/0956797615592630
Maloney, E. A., Risko, E. F., Ansari, D., & Fugelsang, J. (2010). Mathematics anxiety affects
counting but not subitizing during visual enumeration. Cognition, 114(2), 293-297. doi: 10.1016/j.cognition.2009.09.013
*Maree, J. G., Fletcher, L., & Erasmus, P. (2013). The relationship between emotional
intelligence, study orientation in mathematics and the mathematics achievement of the middle adolescent. Journal of Psychology in Africa, 23(2), 205-211. https://doi.org/10.1080/14330237.2013.10820616
RELATION BETWEEN MATH ANXIETY AND MATH ACHIEVEMENT
84
*Maree, J. G., Van Der Walt, M. S., & Ellis, S. M. (2009). Developing a study orientation questionnaire in mathematics for primary school students. Psychological Reports, 104(2), 425-438. https://doi.org/10.2466/PR0.104.2.425-438
McLeod, D. B. (1994). Research on affect and mathematics learning in the JRME: 1970 to the
present. Journal for Research in Mathematics Education, 25(6), 637-647. doi: 10.2307/749576
*McMullan, M., Jones, R., & Lea, S. (2012). Math anxiety, self-efficacy, and ability in British
undergraduate nursing students. Research in Nursing & Health, 35(2), 178-186. https://doi.org/10.1002/nur.21460
Meece, J. L. (1981). Individual differences in the affective reactions of middle and high school
students to mathematics: A social cognitive perspective [ProQuest Information & Learning]. In Dissertation Abstracts International Section A: Humanities and Social Sciences (Vol. 42, Issue 5–A, pp. 2035–2036).
Meece, J. L., Wigfield, A., & Eccles, J. S. (1990). Predictors of math anxiety and its influence on
young adolescents' course enrollment intentions and performance in mathematics. Journal of Educational Psychology, 82(1), 60-70. doi: 10.1037/0022-0663.82.1.60
*Melius, J. (2012). Mathematics anxiety and mathematics self-efficacy in relation to medication
calculation performance in nurses (Doctoral dissertation, University of North Texas , Denton, Texas). https://digital.library.unt.edu/ark:/67531/metadc115119/m1/116/
*Merritt, W. P. (2012). Exploring math anxiety as it relates to math achievement, gender, and
race [ProQuest Information & Learning]. In Dissertation Abstracts International Section A: Humanities and Social Sciences (Vol. 73, Issue 3–A, p. 943).
*Miller, H., & Bichsel, J. (2004). Anxiety, working memory, gender, and math performance.
Personality and Individual Differences, 37(3), 591-606. https://doi.org/10.1016/j.paid.2003.09.029
*Mkhize, M. V., & Maistry, S. M. (2017). Pre-service accounting teachers’ attitudes to
mathematics. South African Journal of Education, 37(2). http://dx.doi.org/10.15700/saje.v37n2a1372
*Morony, S., Kleitman, S., Lee, Y. P., & Stankov, L. (2013). Predicting achievement:
Confidence vs self-efficacy, anxiety, and self-concept in Confucian and European countries. International Journal of Educational Research, 58, 79-96. https://doi.org/10.1016/j.ijer.2012.11.002
RELATION BETWEEN MATH ANXIETY AND MATH ACHIEVEMENT
85
*Morsanyi, K., Primi, C., Handley, S. J., Chiesi, F., & Galli, S. (2012). Are systemizing and autistic traits related to talent and interest in mathematics and engineering? Testing some of the central claims of the empathizing–systemizing theory. British Journal of Psychology, 103(4), 472-496. https://doi.org/10.1186/1744-9081-10-31
*Morsanyi, K., Busdraghi, C., & Primi, C. (2014). Mathematical anxiety is linked to reduced
cognitive reflection: a potential road from discomfort in the mathematics classroom to susceptibility to biases. Behavioral and Brain Functions, 10(1), 31.
Nag, O. S. (2018, February 1). Europe Countries and Regions. Retrieved from
https://www.worldatlas.com/articles/the-four-european-regions-as-defined-by-the-united-nations-geoscheme-for-europe.html
Namkung, J. M., Peng, P., & Lin, X. (2019). The relation between mathematics anxiety and
mathematics performance among school-aged students: a meta-analysis. Review of Educational Research, 89(3), 459-496.
*Nasser, F. M. (2004). Structural model of the effects of cognitive and affective factors on the
achievement of Arabic-speaking pre-service teachers in introductory statistics. Journal of Statistics Education, 12(1), 1-19. http://jse.amstat.org/v12n1/nasser.html
*Nasser, F., & Birenbaum, M. (2005). Modeling mathematics achievement of Jewish and Arab
eighth graders in Israel: The effects of learner-related variables. Educational Research and Evaluation, 11(3), 277-302. https://doi.org/10.1080/13803610500101108
*Necka, E. A., Sokolowski, H. M., & Lyons, I. M. (2015). The role of self-math overlap in
understanding math anxiety and the relation between math anxiety and performance. Frontiers In Psychology, 6, 1543. https://doi.org/10.3389/fpsyg.2015.01543
*Novak, E., & Tassell, J. L. (2015). A dataset for education-related majors' performance
measures with pre/post-video game practice. British Journal of Educational Technology, 46(5), 932-936. https://doi.org/10.1111/bjet.12287
*Novak, E., & Tassell, J. L. (2017). Studying preservice teacher math anxiety and mathematics
performance in geometry, word, and non-word problem solving. Learning and Individual Differences, 54, 20-29. https://doi.org/10.1016/j.lindif.2017.01.005
*Núñez-Peña, M. I (2013). 2013 undergraduate student data. Raw data. *Núñez-Peña, M. I. (2014). 2014 undergraduate student data. Raw data. Núñez-Peña, M. I., Guilera, G., & Suárez-Pellicioni, M. (2014). The single-item math anxiety
scale: An alternative way of measuring mathematical anxiety. Journal of Psychoeducational Assessment, 32(4), 306-317. doi: 10.1177/0734282913508528
RELATION BETWEEN MATH ANXIETY AND MATH ACHIEVEMENT
86
Núñez-Peña, M. I., & Suárez-Pellicioni, M. (2014). Less precise representation of numerical magnitude in high math-anxious individuals: an ERP study of the size and distance effects. Biological Psychology, 103, 176-183. doi: 10.1177/0734282913508528
Organisation for Economic Co-operation and Development (1999). Measuring Student
Knowledge and Skills: A New Framework for Assessment. OECD Publishing. OECD. (2013). PISA 2012 Results: Ready to Learn (Volume III): Students' Engagement, Drive
and Self-Beliefs, PISA, OECD Publishing, Paris, https://doi.org/10.1787/9789264201170-en.
Organisation for Economic Co-operation and Development (2016). PISA 2015 Results (Volume
I): Excellence and Equity in Education. OECD Publishing. doi: 10.1787/9789264266490-en.
Olson, S., & Riordan, D. G. (2012). Engage to Excel: Producing One Million Additional College
Graduates with Degrees in Science, Technology, Engineering, and Mathematics. Report to the President. Executive Office of the President.
*Otts, C. D. (2010). Self-Regulation and math attitudes: effects on academic performance in
developmental math courses at a community college. (Ed. D. Dissertation, University of Kansas, Lawrence, Kansas). http://hdl.handle.net/1808/7081
*Owens, A. R. (1993). The relationship between selected affective and cognitive variables to
academic achievement and persistence with peer tutoring [ProQuest Information & Learning]. In Dissertation Abstracts International Section A: Humanities and Social Sciences (Vol. 54, Issue 1–A, p. 108).
Oxman, A. D., & Guyatt, G. H. (1991). Validation of an index of the quality of review
articles. Journal of clinical epidemiology, 44(11), 1271-1278. doi: 10.1016/0895-4356(91)90160-B
*Paechter, M., Macher, D., Martskvishvili, K., Wimmer, S., & Papousek, I. (2017). Mathematics
anxiety and statistics anxiety. Shared but also unshared components and antagonistic contributions to performance in statistics. Frontiers In Psychology, 8, 1196. https://doi.org/10.3389/fpsyg.2017.01196
*Pajares, M. F. (1995). Mathematics self-efficacy as a mediating mechanism on mathematics
problem-solving performance: A path analysis. (Doctoral Dissertation, University of Florida, Gainesville, Florida). https://ufdc.ufl.edu/AA00034641/00001
*Pajares, F. (1996). Self-efficacy beliefs and mathematical problem-solving of gifted students.
Contemporary Educational Psychology, 21(4), 325-344. https://doi.org/10.1006/ceps.1996.0025
RELATION BETWEEN MATH ANXIETY AND MATH ACHIEVEMENT
87
*Pajares, F., & Graham, L. (1999). Self-efficacy, motivation constructs, and mathematics performance of entering middle school students. Contemporary Educational Psychology, 24(2), 124-139. https://doi.org/10.1006/ceps.1998.0991
*Pajares, F., & Kranzler, J. (1995). Self-efficacy beliefs and general mental ability in
mathematical problem-solving. Contemporary Educational Psychology, 20(4), 426-443. https://doi.org/10.1006/ceps.1995.1029
Pariona, A. (2018, February 10). The Five Regions of Asia - Asia Countries and Regions.
Retrieved from https://www.worldatlas.com/articles/the-four-regions-of-asia.html. *Park, D. E. (2015). Motivational frameworks among children in early elementary school
[ProQuest Information & Learning]. In Dissertation Abstracts International: Section B: The Sciences and Engineering (Vol. 76, Issue 2–B(E)).
Park, D., Ramirez, G., & Beilock, S.L (2014). The role of expressive writing in math anxiety.
Journal of Experimental Psychology: Applied, 20(2), 103-111. doi: 10.1037/xap0000013 *Parks, M. Q. (2009). Possible effects of calculators on the problem-solving abilities and
mathematical anxiety of students with learning disabilities or attention deficit hyperactivity disorder. (Unpublished doctoral dissertation). Walden University, Minneapolis, Minnesota.
Pekrun, R. (2006). The control-value theory of achievement emotions: Assumptions, corollaries,
and implications for educational research and practice. Educational psychology review, 18(4), 315-341. doi: 10.1007/s10648-006-9029-9
Pekrun, R., Goetz, T., Frenzel, A. C., Barchfeld, P., & Perry, R. P. (2011). Measuring emotions
in students’ learning and performance: The Achievement Emotions Questionnaire (AEQ). Contemporary Educational Psychology, 36(1), 36-48. doi: 10.1016/j.cedpsych.2010.10.002
Pekrun, R., Lichtenfeld, S., Marsh, H. W., Murayama, K., & Goetz, T. (2017). Achievement
emotions and academic performance: Longitudinal models of reciprocal effects. Child development, 88(5), 1653-1670. doi: 10.1111/cdev.12704
Peng, P., Namkung, J., Barnes, M., & Sun, C. (2016). A meta-analysis of mathematics and
working memory: Moderating effects of working memory domain, type of mathematics skill, and sample characteristics. Journal of Educational Psychology, 108(4), 455-473. doi: 10.1037/edu0000079
RELATION BETWEEN MATH ANXIETY AND MATH ACHIEVEMENT
88
Peters, J. L., Sutton, A. J., Jones, D. R., Abrams, K. R., Rushton, L., & Moreno, S. G. (2010). Assessing publication bias in meta-analyses in the presence of between-study heterogeneity. Journal of the Royal Statistical Society: Series A (Statistics in Society), 173(3), 575-591.
*Piearcy, R. K. (1997). The relationship between mathematics anxiety, cerebral hemispheric
dominance, and final course grade of students in college algebra [ProQuest Information & Learning]. In Dissertation Abstracts International Section A: Humanities and Social Sciences (Vol. 57, Issue 7–A, p. 2926).
Plake, B. S., & Parker, C. S. (1982). The development and validation of a revised version of the
Mathematics Anxiety Rating Scale. Educational and Psychological Measurement, 42(2), 551-557. doi: 10.1177/001316448204200218
*Pletzer, B., Wood, G., Moeller, K., Nuerk, H. C., & Kerschbaum, H. H. (2010). Predictors of
performance in a real-life statistics examination depend on the individual cortisol profile. Biological Psychology, 85(3), 410-416. https://doi.org/10.1016/j.biopsycho.2010.08.015
Pretorius, T. B., & Norman, A. M. (1992). Psychometric data on the statistics anxiety scale for a
sample of South African students. Educational and Psychological Measurement, 52(4), 933-937. doi: 10.1177/0013164492052004015
*Prieto, G., & Delgado, A. R. (2007). Measuring math anxiety (in Spanish) with the Rasch rating
scale model. Journal of Applied Measurement, 8(2), 149. *Radišić, J., Videnović, M., & Baucal, A. (2015). Math anxiety—contributing school and
individual level factors. European Journal of Psychology of Education, 30(1), 1-20. https://doi.org/10.1007/s10212-014-0224-7
*Ramirez, G. (2014). The cognitive mechanism underlying the math anxiety-performance
relationship in early elementary school [ProQuest Information & Learning]. In Dissertation Abstracts International: Section B: The Sciences and Engineering (Vol. 75, Issue 1–B(E)).
*Ramirez, G. (2017). Motivated forgetting in early mathematics: A proof-of-concept study.
Frontiers in Psychology, 8, 2087. https://doi.org/10.3389/fpsyg.2017.02087 *Ramirez, G., Chang, H., Maloney, E.A., Levine, S.C., & Beilock, S.L. (2016). On the
relationship between math anxiety and math achievement in early elementary school: The role of problem solving strategies. Journal of Experimental Child Psychology, 141, 83-100. doi: 10.1016/j,jecp.2015.07.014
*Ramirez, G., Gunderson, E. A., Levine, S. C., & Beilock, S. L. (2013). Math anxiety, working
memory, and math achievement in early elementary school. Journal of Cognition and Development, 14(2), 187-202. doi: 10.1080/15248372.2012.664593

RELATION BETWEEN MATH ANXIETY AND MATH ACHIEVEMENT
89
Ramirez, G., Hooper, S. Y., Kersting, N. B., Ferguson, R., & Yeager, D. (2018). Teacher math anxiety relates to adolescent students’ math achievement. AERA Open, 4(1), 1-13. doi: 10.1177/2332858418756052
*Rayner, V., Pitsolantis, N., & Osana, H. (2009). Mathematics anxiety in preservice teachers: Its
relationship to their conceptual and procedural knowledge of fractions. Mathematics Education Research Journal, 21(3), 60-85. https://doi.org/10.1007/BF03217553
*Ribeiro, F. S., Tonoli, M. C., Ribeiro, D. P. D. S. A., & Santos, F. H. D. (2017). Numeracy
deficits scrutinized: Evidences of primary developmental dyscalculia. Psychology & Neuroscience, 10(2), 189. https://doi.org/10.1037/pne0000082
Richardson, F. C., & Suinn, R. M. (1972). The mathematics anxiety rating scale: psychometric
data. Journal of Counseling Psychology, 19(6), 551-554. doi: 10.1037/h0033456 *Roberts, S. O., & Vukovic, R. K. (2011). The relation between parental involvement and math
anxiety: implications for mathematics achievement. Paper presented at the meeting of the Society for Research on Educational Effectiveness, Washington, D.C.
*Rolison, J. J., Morsanyi, K., & O’Connor, P. A. (2016). Can I count on getting better?
Association between math anxiety and poorer understanding of medical risk reductions. Medical Decision Making, 36(7), 876-886. https://doi.org/10.1177/0272989X15602000
Rounds, J. B., & Hendel, D. D. (1980). Measurement and dimensionality of mathematics
anxiety. Journal of Counseling Psychology, 27(2), 138. Rosenthal, R. (1979). The file drawer problem and tolerance for null results. Psychological
Bulletin, 86(3), 638-641. doi: 10.1037/0033-2909.86.3.638 *Rushing, B. H., Jr. (1997). Effects of study skill and systematic desensitization training on
mathematics anxiety, mathematics achievement, mathematics self-efficacy, and cognitive interference among university students enrolled in developmental mathematics [ProQuest Information & Learning]. In Dissertation Abstracts International Section A: Humanities and Social Sciences (Vol. 57, Issue 7–A, p. 2927).
*Sandoz, E. K., Butcher, G., & Protti, T. A. (2017). A preliminary examination of willingness
and importance as moderators of the relationship between statistics anxiety and performance. Journal of Contextual Behavioral Science, 6(1), 47-52. https://doi.org/10.1016/j.jcbs.2017.02.002
*Satake, E., & Amato, P. P. (1995). Mathematics anxiety and achievement among Japanese
elementary school students. Educational and Psychological Measurement, 55(6), 1000-1007. https://doi.org/10.1177/0013164495055006009
RELATION BETWEEN MATH ANXIETY AND MATH ACHIEVEMENT
90
**Schmitz, E. A., Salemink, E., Wiers, R. W., & Jansen, B. R. (2015). Development of the Components of the Math Anxiety Questionnaire. Unpublished data.
*Schnell, K., Tibubos, A. N., Rohrmann, S., & Hodapp, V. (2013). Test and math anxiety: A
validation of the German Test Anxiety Questionnaire. Polish Psychological Bulletin, 44(2), 193-200. https://doi.org/10.2478/ppb-2013-0022
*Schoeck, A. M. (1994). The effectiveness of cognitive/relaxation training in reducing test
anxiety and math anxiety and improving arithmetic performance with ninth- and tenth-grade students [ProQuest Information & Learning]. In Dissertation Abstracts International Section A: Humanities and Social Sciences (Vol. 54, Issue 12–A, p. 4395).
*Schommer-Aikins, M., Unruh, S., & Morphew, J. (2015). Epistemological belief congruency in
mathematics between vocational technology students and their instructors. Journal of Education and Training Studies, 3(4), 137-145. https://doi.org/10.11114/jets.v3i4.859
*Scott, J. S. (2002). Modeling aspects of students’ attitudes and performance in an undergraduate
introductory statistics course [ProQuest Information & Learning]. In Dissertation Abstracts International Section A: Humanities and Social Sciences (Vol. 62, Issue 9–A, p. 2973).
*Scott, S. (2014). The Effects of Math Tutoring Sessions for Parents on Eighth Grade Students'
Mathematics Achievement and Anxiety. (Doctoral dissertation, Liberty University, Lynchburg, Virginia). https://digitalcommons.liberty.edu/doctoral/838/
*Seng, E. L. K. (2015). The influence of pre-university students' mathematics test anxiety and
numerical anxiety on mathematics achievement. International Education Studies, 8(11), 162-168. https://doi.org/10.5539/ies.v8n11p162
*Si, J., Li, H., Sun, Y., Xu, Y., & Sun, Y. (2016). Age-related differences of individuals’
arithmetic strategy utilization with different level of math anxiety. Frontiers in Psychology, 7, 1612. https://doi.org/10.3389/fpsyg.2016.01612
*Siebers, W. M. (2015). Relationship between math anxiety and student achievement of middle
school students (Doctoral dissertation, Colorado State University, Fort Collins, Colorado). http://hdl.handle.net/10217/166940
Siegler, R. S., Duncan, G. J., Davis-Kean, P. E., Duckworth, K., Claessens, A., Engel, M., ... &
Chen, M. (2012). Early predictors of high school mathematics achievement. Psychological Science, 23(7), 691-697. doi: 10.1177/0956797612440101
RELATION BETWEEN MATH ANXIETY AND MATH ACHIEVEMENT
91
*Skaalvik, E. M. (2002). Self-enhancing and self-defeating ego goals in mathematics lessons: Relationships among task and avoidance goals, achievement, self-perceptions, anxiety, and motivation (A Scientific Educology). International Journal of Educology, 16(1), 54-76.
*Solazzo, L. A. (2008). The role of gender, cognition, anxiety, and competence beliefs in
predicting mathematics achievement (Doctoral dissertation, Fordham University, Bronx, New York). https://research.library.fordham.edu/dissertations/AAI3303095).
*Soni, A., & Kumari, S. (2017). The role of parental math anxiety and math attitude in their
children’s math achievement. International Journal of Science and Mathematics Education, 15(2), 331-347. https://doi.org/10.1007/s10763-015-9687-5
Sonnenschein, S., & Galindo, C. (2015). Race/ethnicity and early mathematics skills: Relations
between home, classroom, and mathematics achievement. The Journal of Educational Research, 108(4), 261-277. doi: 10.1080/00220671.2014.880394
**Sowinski, C. (2016). Numerical Building Blocks: Exploring Domain-Specific Cognitive
Predictors of Mathematics. Unpublished manuscript. **Sowinski, C., Dunbar, K., & LeFevre, J. (2014). Calculation fluency test. Unpublished
technical report). Math Lab, Carleton University, Ottawa, Canada. *Standing, L. G., Sproule, R. A., & Leung, A. (2006). Can business and economics students
perform elementary arithmetic?. Psychological Reports, 98(2), 549-555. https://doi.org/10.2466/pr0.98.2.549-555
*Stankov, L., Morony, S., & Lee, Y. P. (2014). Confidence: the best non-cognitive predictor of
academic achievement?. Educational Psychology, 34(1), 9-28. https://doi.org/10.1080/01443410.2013.814194
*Steiner, E. T., & Ashcraft, M. H. (2012). Three brief assessments of math achievement.
Behavior Research Methods, 44(4), 1101-1107. https://doi.org/10.3758/s13428-011-0185-6
Sterne, J.A., & Harbord, R.M. (2004). Funnel plots in meta-analysis. The Stata Journal, 4(2),
127-141. *Stiegelmeyer, C. (2012). The relationship between mathematical knowledge of numbers and
operations and mathematics beliefs of prospective teachers. (Doctoral dissertation). ERIC. (1651830853; ED545857).
RELATION BETWEEN MATH ANXIETY AND MATH ACHIEVEMENT
92
Suárez-Pellicioni, M., Núñez-Peña, M. I., & Colomé, À. (2016). Math anxiety: A review of its cognitive consequences, psychophysiological correlates, and brain bases. Cognitive, Affective, & Behavioral Neuroscience, 16(1), 3-22. doi: 10.3758/s13415-015-0370-7
Suinn, R. M., & Edwards, R. (1982). The measurement of mathematics anxiety: The
mathematics anxiety rating scale for adolescents—MARS-A. Journal of Clinical Psychology, 38(3), 576-580. doi: 10.1002/1097-4679(198207)38:3<576::AID-JCLP2270380317>3.0.CO;2-V
Suinn, R. M., Taylor, S., & Edwards, R. W. (1988). Suinn mathematics anxiety rating scale for
elementary school students (MARS-E): Psychometric and normative data. Educational and Psychological Measurement, 48(4), 979-986. doi: 10.1177/0013164488484013
*Suinn, R. M., & Winston, E. H. (2003). The mathematics anxiety rating scale, a brief version:
Psychometric data. Psychological Reports, 92(1), 167-173. https://doi.org/10.2466/pr0.2003.92.1.167
Supekar, K., Iuculano, T., Chen, L., & Menon, V. (2015). Remediation of childhood math
anxiety and associated neural circuits through cognitive tutoring. Journal of Neuroscience, 35(36), 12574-12583. doi: 10.1523/JNEUROSCI.0786-15.2015
*Thien, L. M., & Ong, M. Y. (2015). Malaysian and Singaporean students’ affective
characteristics and mathematics performance: evidence from PISA 2012. SpringerPlus, 4(1), 563.
Thomas, G., & Dowker, A. (2000). Mathematics anxiety and related factors in young children.
Paper presented at British Psychological Society Developmental Section Conference, Bristol, UK.
*Thompson, R., Wylie, J., Mulhern, G., & Hanna, D. (2015). Predictors of numeracy
performance in undergraduate psychology, nursing and medical students. Learning and Individual Differences, 43, 132-139. https://doi.org/10.1016/j.lindif.2015.08.008
*Tissot, S. L. (1997). An examination of ethnic variation in gender differences in mathematics
attitudes and performance [ProQuest Information & Learning]. In Dissertation Abstracts International: Section B: The Sciences and Engineering (Vol. 58, Issue 4–B, p. 2158).
Tobias, S. (1986). Anxiety and cognitive processing of instruction. In R. Schwarzer (Ed.), Self-
related cognitions in anxiety and motivation (pp. 35–54). Hillsdale, NJ: Erlbaum. *Tobias, S., & Everson, H. (1995). Development and Validation of an Objective Measure of
Metacognition. Paper presented at the annual meeting of the American Educational Research Association in San Francisco, CA.
RELATION BETWEEN MATH ANXIETY AND MATH ACHIEVEMENT
93
*Townsend, M. A., Moore, D. W., Tuck, B. F., & Wilton, K. M. (1998). Self-concept and anxiety in university students studying social science statistics within a co-operative learning structure. Educational Psychology, 18(1), 41-54. https://doi.org/10.1080/0144341980180103
*Trezise, K., & Reeve, R. A. (2014). Working memory, worry, and algebraic ability. Journal Of
Experimental Child Psychology, 121, 120-136. https://doi.org/10.1016/j.jecp.2013.12.001 *Tsao, Y. L. (2004). Exploring the connections among number sense, mental computation
performance, and the written computation performance of elementary preservice school teachers. Journal of College Teaching & Learning, 1(12), 71-90. https://doi.org/10.19030/tlc.v1i12.2022
*Tubbs, L. (2015). Teaching methods in mathematics and their impact on sixth-grade students’
mathematics anxiety, attitudes, and achievement [ProQuest Information & Learning]. In Dissertation Abstracts International Section A: Humanities and Social Sciences (Vol. 76, Issue 1–A(E)).
*Van der Beek, J. P., Van der Ven, S. H., Kroesbergen, E. H., & Leseman, P. P. (2017). Self-
concept mediates the relation between achievement and emotions in mathematics. British Journal of Educational Psychology, 87(3), 478-495. https://doi.org/10.1111/bjep.12160
Verkijika, S. F., & De Wet, L. (2015). Using a brain-computer interface (BCI) in reducing math
anxiety: Evidence from South Africa. Computers & Education, 81, 113-122. doi: 10.1016/j.compedu.2014.10.002
*Vidović, V. V. (1999). Self-referenced cognitions and mathematics grades in secondary school.
Studia Psychologica, 41(2), 133-142. Viechtbauer, W. (2010). Conducting meta-analyses in R with the metafor package. Journal of
Statistical Software, 36(3). doi: 10.18637/jss.v036.i03 Voyer, D., & Voyer, S. D. (2014). Gender differences in scholastic achievement: A meta-
analysis. Psychological Bulletin, 140(4), 1174-1204. doi: 10.1037/a0036620 *Vukovic, R. K., Kieffer, M. J., Bailey, S. P., & Harari, R. R. (2013). Mathematics anxiety in
young children: Concurrent and longitudinal associations with mathematical performance. Contemporary Educational Psychology, 38(1), 1-10. doi: 10.1016/j.cedpsych.2012.09.001
*Vukovic, R. K., Roberts, S. O., & Green Wright, L. (2013). From parental involvement to
children's mathematical performance: The role of mathematics anxiety. Early Education & Development, 24(4), 446-467. https://doi.org/10.1080/10409289.2012.693430

RELATION BETWEEN MATH ANXIETY AND MATH ACHIEVEMENT
94
Wang, M.T., & Degol, J. (2013). Motivational pathways to STEM career choices: Using expectancy-value perspective to understand individual and gender differences in STEM fields. Developmental Review, 33(4), 304-340. doi: 10.1016/j.dr.2013.08.001
*Wang, Z., Hart, S. A., Kovas, Y., Lukowski, S., Soden, B., Thompson, L. A., ... & Petrill, S. A.
(2014). Who is afraid of math? Two sources of genetic variance for mathematical anxiety. Journal of Child Psychology and Psychiatry, 55(9), 1056-1064. https://doi.org/10.1111/jcpp.12224
*Wang, Z., Lukowksi, S.L., Hart, S.A., Lyons, I.M., Thompson, L.A., Kovas, Y., … & Petrill,
S.A. (2015). Is math anxiety always bad for math learning? The role of math motivation. Psychological Science, 26(12), 1863-1876. doi: 10.1177/0956797615602471
Watt, H. M., Hyde, J. S., Petersen, J., Morris, Z. A., Rozek, C. S., & Harackiewicz, J. M. (2017).
Mathematics—A critical filter for STEM-related career choices? A longitudinal examination among Australian and US adolescents. Sex Roles, 77(3-4), 254-271. doi: 10.1007/s11199-016-0711-1
*Watts, B. K. (2011). Relationships of mathematics anxiety, mathematics self-efficacy and
mathematics performance of adult basic education students (Doctoral dissertation, Capella University, Minneapolis, Minnesota). https://search.proquest.com/docview/862498506
Wigfield, A., & Eccles, J. S. (2000). Expectancy–value theory of achievement
motivation. Contemporary Educational Psychology, 25(1), 68-81. doi: 10.1006/ceps.1999.1015
Wigfield, A., & Meece, J. L. (1988). Math anxiety in elementary and secondary school
students. Journal of Educational Psychology, 80(2), 210-216. doi: 10.1037/0022-0663.80.2.210
Wijsman, L. A., Warrens, M. J., Saab, N., Van Driel, J. H., & Westenberg, P. M. (2016).
Declining trends in student performance in lower secondary education. European Journal of Psychology of Education, 31(4), 595-612. doi: 10.1007/s10212-015-0277-2
*Wilder, S. (2012). Gender differences in factors pertaining to math anxiety among college
students (Doctoral dissertation, University of Akron, Akron, Ohio). http://rave.ohiolink.edu/etdc/view?acc_num=akron1327538414
*Williams, J. E. (1994). Anxiety measurement: Construct validity and test performance.
Measurement and Evaluation in Counseling and Development, 27(1), 302-7. Wine, J. (1971). Test anxiety and direction of attention. Psychological Bulletin, 76(2), 92-104.
doi: 10.1037/h0031332
RELATION BETWEEN MATH ANXIETY AND MATH ACHIEVEMENT
95
*Wu, S., Amin, H., Barth, M., Malcarne, V., & Menon, V. (2012). Math anxiety in second and third graders and its relation to mathematics achievement. Frontiers in psychology, 3, 162. doi: 10.3389/fpsyg.2012.00162
*Wu, S. S., Chen, L., Battista, C., Watts, A. K. S., Willcutt, E. G., & Menon, V. (2017). Distinct
influences of affective and cognitive factors on children’s non-verbal and verbal mathematical abilities. Cognition, 166, 118-129. https://doi.org/10.1016/j.cognition.2017.05.016
*Wu, S. S., Willcutt, E. G., Escovar, E., & Menon, V. (2013). Mathematics achievement and
anxiety and their relation to internalizing and externalizing behaviors. Journal of Learning Disabilities, 47(6), 503-514. doi: 10.1177/0022219412473154
*Yáñez-Marquina, L., & Villardón-Gallego, L. (2017). Math anxiety, a hierarchical construct:
Development and validation of the scale for assessing math anxiety in secondary education. Ansiedad y Estrés, 23(2-3), 59-65. https://doi.org/10.1016/j.anyes.2017.10.001
Young, J. R., & Young, J. L. (2016). Young, Black, and anxious: Describing the Black student
mathematics anxiety research using confidence intervals. Journal of Urban Mathematics Education, 9(1), 79-93. https://doi.org/10.21423/jume-v9i1a275
Zabulionis, A. (2001). Mathematics and science achievement of various nations. Education
Policy Analysis Archives, 9, 33. *Zachai, J. (1999). Adult learners’ math self-concept as a barrier to passing California State
University’s Entry Level Mathematics (ELM) Test [ProQuest Information & Learning]. In Dissertation Abstracts International Section A: Humanities and Social Sciences (Vol. 60, Issue 4–A, p. 1048).
*Zakaria, E., & Nordin, N. M. (2007). The effects of mathematics anxiety on matriculation
students as related to motivation and achievement. Eurasia Journal of Mathematics, Science & Technology Education, 4(1). 27-30. https://doi.org/10.12973/ejmste/75303
*Zettle, R. D. (2003). Acceptance and commitment therapy (ACT) vs. systematic desensitization
in treatment of mathematics anxiety. The Psychological Record, 53(2), 197-215. https://doi.org/10.1007/BF03395440
Zhang, J., Zhao, N., & Kong, Q. P. (2019). The relationship between math anxiety and math
performance: a meta-analytic investigation. Frontiers in psychology, 10.
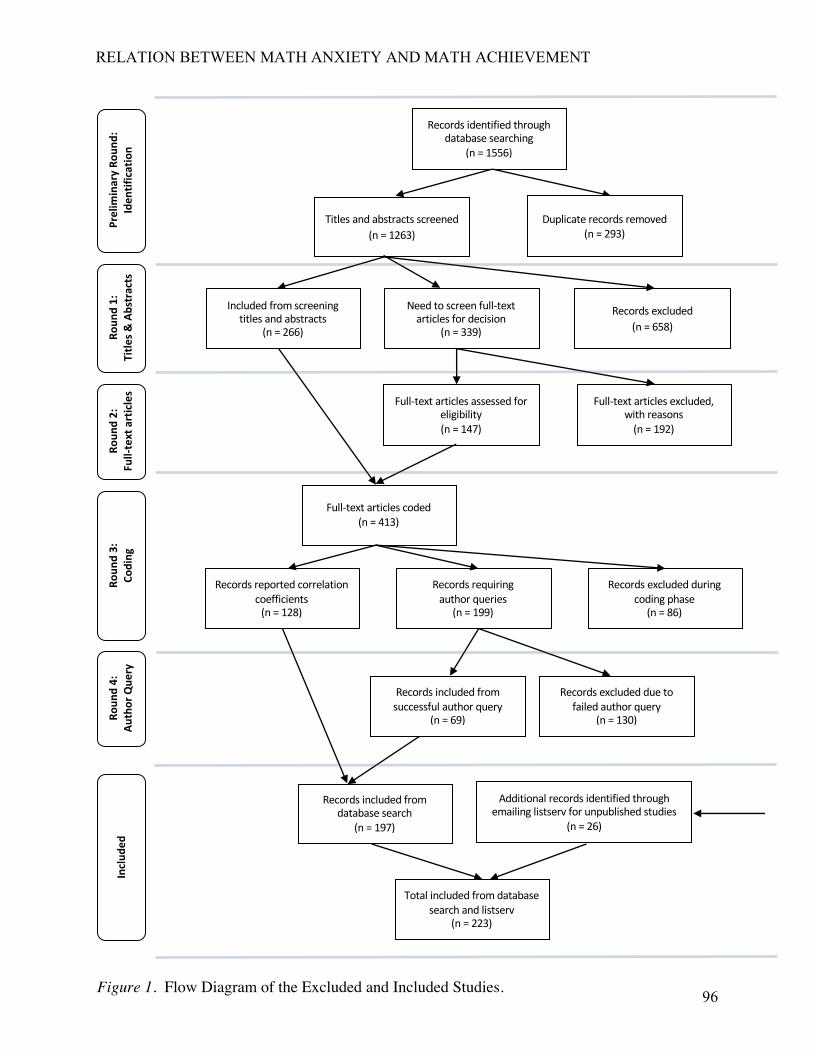
RELATION BETWEEN MATH ANXIETY AND MATH ACHIEVEMENT
96
Figure 1. Flow Diagram of the Excluded and Included Studies.
Prel
imin
ary
Roun
d:
Iden
tifica
tion
Roun
d 1:
Ti
tles &
Abs
trac
ts
R oun
d 4:
Au
thor
Que
ry
Inclu
ded
Records identified through database searching
(n = 1556)
Additional records identified through emailing listserv for unpublished studies
(n = 26)
Duplicate records removed (n = 293)
Titles and abstracts screened (n = 1263)
Records excluded (n = 658)
Included from screening titles and abstracts
(n = 266)
Need to screen full-text articles for decision
(n = 339)
Full-text articles excluded, with reasons
(n = 192)
Full-text articles assessed for eligibility (n = 147)
Full-text articles coded (n = 413)
Roun
d 2:
Fu
ll -te
xt a
rticl
es
R oun
d 3:
Co
ding
Records reported correlation coefficients
(n = 128)
Records excluded during coding phase
(n = 86)
Records requiring author queries
(n = 199)
Records included from successful author query
(n = 69)
Records excluded due to failed author query
(n = 130)
Records included from database search
(n = 197)
Total included from database search and listserv
(n = 223)

RELATION BETWEEN MATH ANXIETY AND MATH ACHIEVEMENT
97
Table 1 Math Assessment and Math Anxiety Scale Categories, Definitions, and Examples
Category Definition Example measures/items Type of Math Anxiety Scale Child Math Anxiety Developed for the intended use of measuring math anxiety in children Scale for Early Math Anxiety
Adolescent and Adult Math Anxiety
Developed with the intended or primary use of measuring math anxiety in adolescents or adults or with no intention of measuring a specific age group/grade level during childhood
Math Anxiety Rating Scale
Math Anxiety Items in a measure developed for the intended use of measuring anxiety in a broad math context
Math Anxiety Rating Scale
Statistics Anxiety Items in a measure developed for the intended use of measuring anxiety in a statistics context
Statistics Anxiety Scale
Components of Math Anxiety Worry Cognitive dimension of anxiety; negative expectations and self-deprecating thoughts
about a math situation* --
Emotionality Physiological dimension of anxiety; feelings of dread, nervousness, and unpleasant physiological reactions to math situations*
--
Math Evaluation Anxiety Anxiety felt while taking a math test or while doing math in front of others -- Math Learning Anxiety Anxiety felt in the classroom or while engaging in a math task -- Type of Math Assessment Standardized high-stakes Measures used for selection into institutions or receipt of license or degree SAT, ACT Standardized measures for research Measures with a standard protocol, often validated to measure achievement, may have
manual Woodcock-Johnson Applied Problems
Non-standardized or research-made Measures with no standard protocol or created by the researcher without validation Subtraction problems created by researcher
Course grade Grade assigned for a particular math course Developmental Algebra course grade Exam/test grade Grade from course exam on specific math material Statistics mid-term exam Content of Math Assessment Approximate Number System Tasks that measure intuitive number and magnitude system with non-symbolic
representations The Dots Task
Basic Number Knowledge Knowledge about numerosity, relations of numbers, counting words, and symbolic numbers**
Number line task
Whole Number Calculation Single or multi-digit addition, subtraction, multiplication, and division** Woodcock-Johnson Math Fluency Word Problem Solving Tasks with a problem narrative where relevant information needs to be isolated, number
sentences constructed, and missing numbers solved for in order to find the answer WIAT Math Reasoning Subtest
Fractions, Decimals, & Percentages Knowledge of part-whole relation and interpreting measurement of fractions** Knowledge of Fractions Assessment Geometry Tasks asking about shape, size, position of figures relative to others, and properties of
space** KeyMath3 Geometry Subtest
Algebra Knowledge and application of pre-learned symbol manipulation arguments** KeyMath3 Algebra Subtest Statistics, Data Analysis, & Probability Knowledge in analysis and interpretation of data Statistics Concept Inventory Note. *definition adapted from Liebert & Morris, 1967; **definition adapted from Peng, Namkung, Barnes, & Sun, 2015.
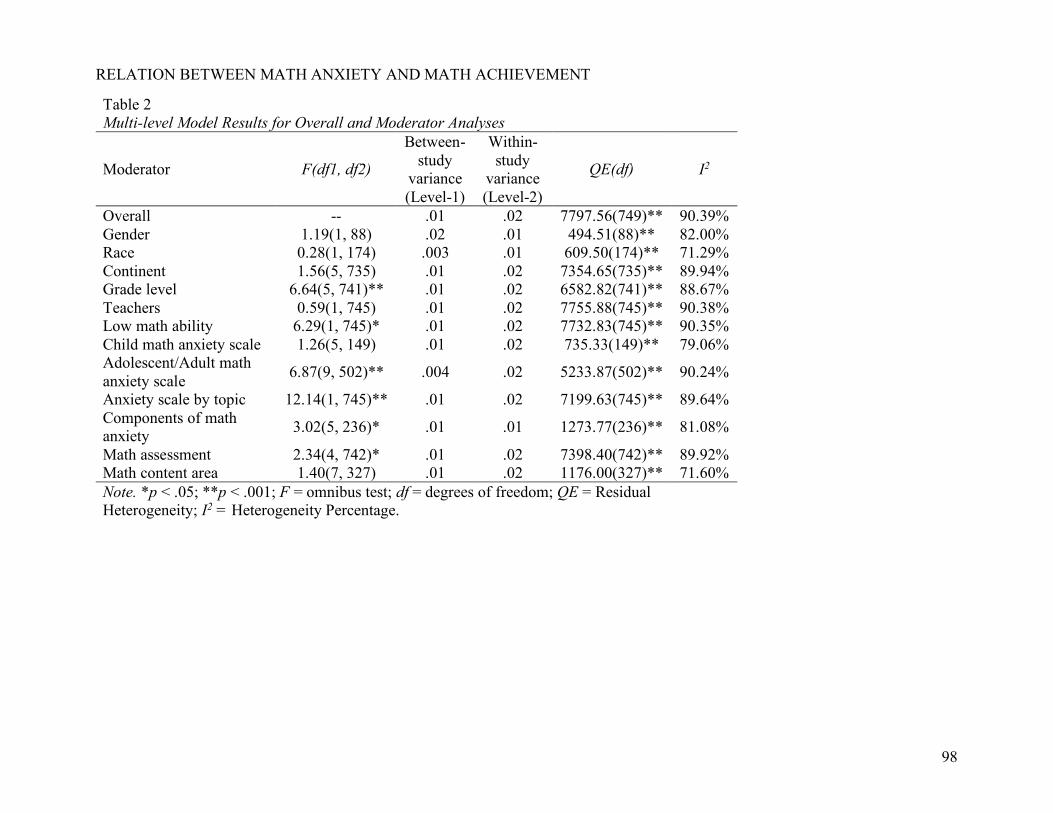
RELATION BETWEEN MATH ANXIETY AND MATH ACHIEVEMENT
98
Table 2 Multi-level Model Results for Overall and Moderator Analyses
Moderator F(df1, df2)
Between-study
variance (Level-1)
Within-study
variance (Level-2)
QE(df) I2
Overall -- .01 .02 7797.56(749)** 90.39% Gender 1.19(1, 88) .02 .01 494.51(88)** 82.00% Race 0.28(1, 174) .003 .01 609.50(174)** 71.29% Continent 1.56(5, 735) .01 .02 7354.65(735)** 89.94% Grade level 6.64(5, 741)** .01 .02 6582.82(741)** 88.67% Teachers 0.59(1, 745) .01 .02 7755.88(745)** 90.38% Low math ability 6.29(1, 745)* .01 .02 7732.83(745)** 90.35% Child math anxiety scale 1.26(5, 149) .01 .02 735.33(149)** 79.06% Adolescent/Adult math anxiety scale 6.87(9, 502)** .004 .02 5233.87(502)** 90.24%
Anxiety scale by topic 12.14(1, 745)** .01 .02 7199.63(745)** 89.64% Components of math anxiety 3.02(5, 236)* .01 .01 1273.77(236)** 81.08%
Math assessment 2.34(4, 742)* .01 .02 7398.40(742)** 89.92% Math content area 1.40(7, 327) .01 .02 1176.00(327)** 71.60% Note. *p < .05; **p < .001; F = omnibus test; df = degrees of freedom; QE = Residual Heterogeneity; I2 = Heterogeneity Percentage.

RELATION BETWEEN MATH ANXIETY AND MATH ACHIEVEMENT
99
Figure 2. Average Effect Sizes for Demographic Moderators.
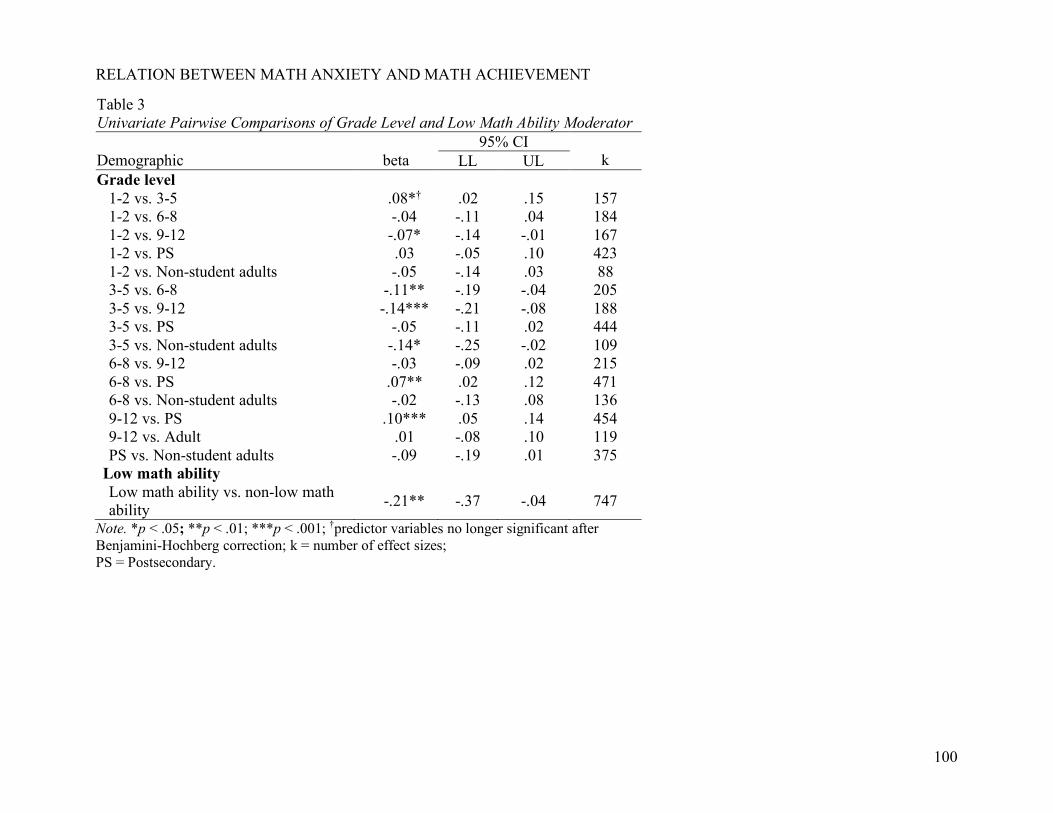
RELATION BETWEEN MATH ANXIETY AND MATH ACHIEVEMENT
100
Table 3 Univariate Pairwise Comparisons of Grade Level and Low Math Ability Moderator
Demographic
beta
95% CI k LL UL
Grade level 1-2 vs. 3-5 .08*† .02 .15 157 1-2 vs. 6-8 -.04 -.11 .04 184 1-2 vs. 9-12 -.07* -.14 -.01 167 1-2 vs. PS .03 -.05 .10 423 1-2 vs. Non-student adults -.05 -.14 .03 88 3-5 vs. 6-8 -.11** -.19 -.04 205 3-5 vs. 9-12 -.14*** -.21 -.08 188 3-5 vs. PS -.05 -.11 .02 444 3-5 vs. Non-student adults -.14* -.25 -.02 109 6-8 vs. 9-12 -.03 -.09 .02 215 6-8 vs. PS .07** .02 .12 471 6-8 vs. Non-student adults -.02 -.13 .08 136 9-12 vs. PS .10*** .05 .14 454 9-12 vs. Adult .01 -.08 .10 119 PS vs. Non-student adults -.09 -.19 .01 375
Low math ability Low math ability vs. non-low math ability -.21** -.37 -.04 747
Note. *p < .05; **p < .01; ***p < .001; †predictor variables no longer significant after Benjamini-Hochberg correction; k = number of effect sizes; PS = Postsecondary.
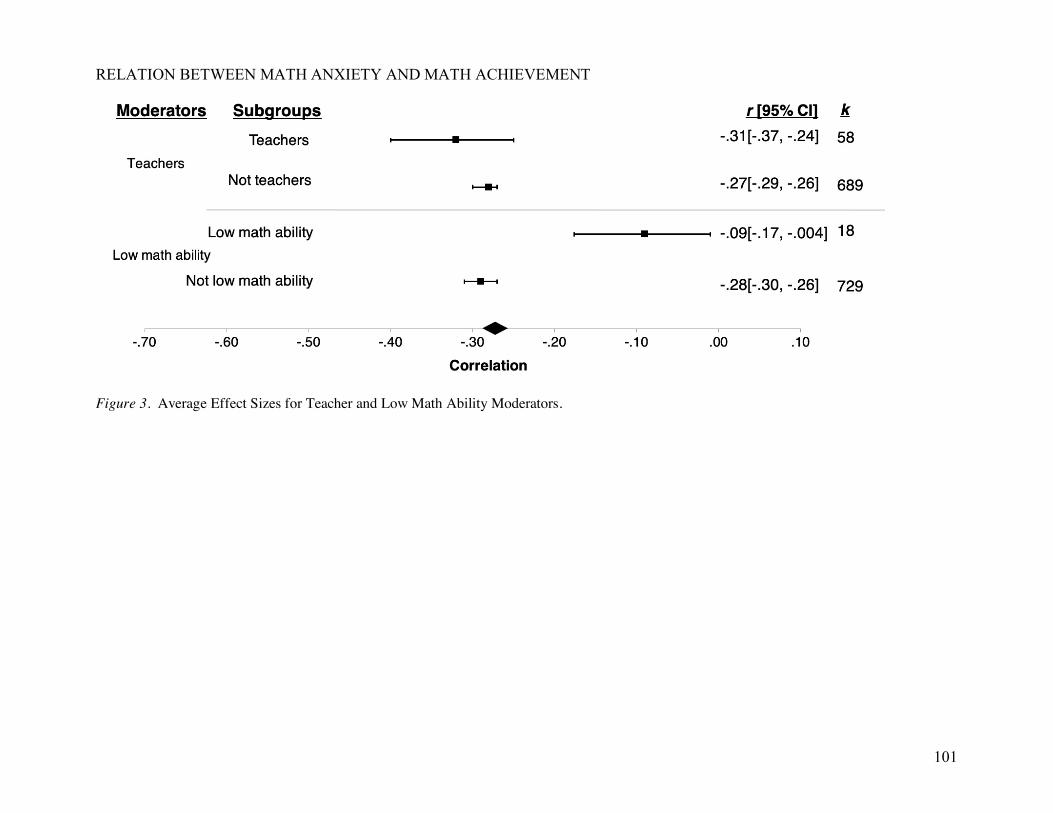
RELATION BETWEEN MATH ANXIETY AND MATH ACHIEVEMENT
101
Figure 3. Average Effect Sizes for Teacher and Low Math Ability Moderators.

RELATION BETWEEN MATH ANXIETY AND MATH ACHIEVEMENT
102
Figure 4. Average Effect Sizes for Math Anxiety Scale and Components of Math Anxiety Moderators.
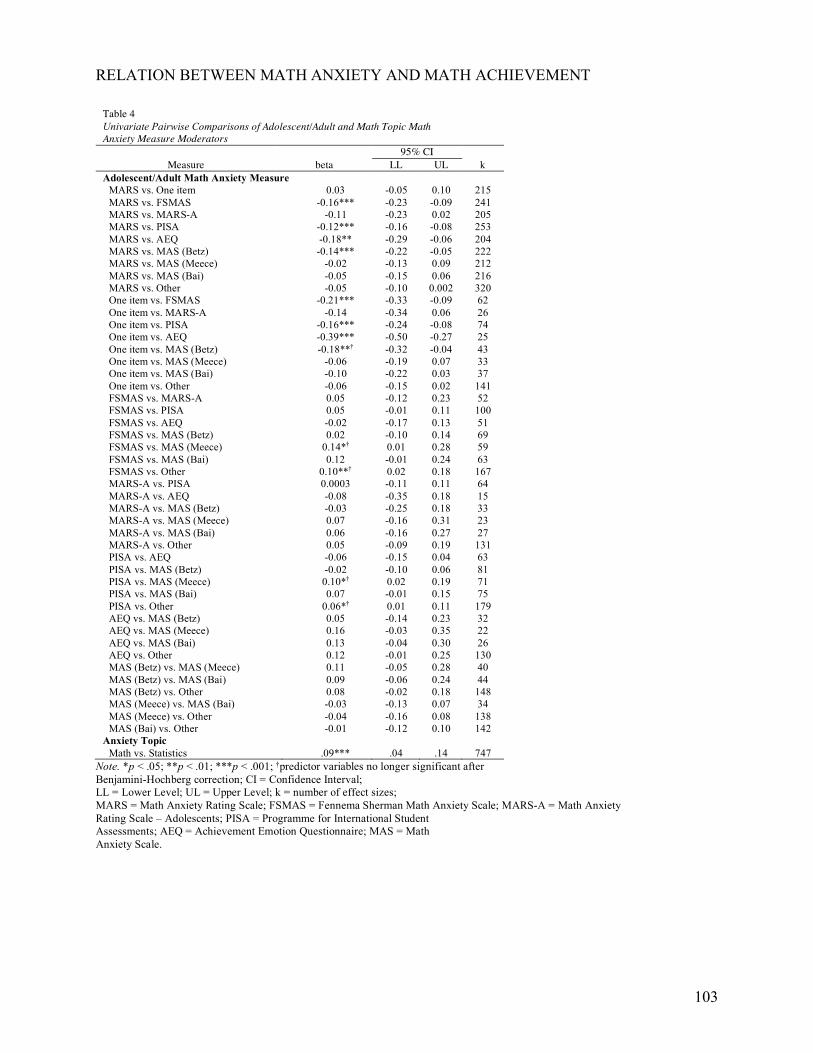
RELATION BETWEEN MATH ANXIETY AND MATH ACHIEVEMENT
103
Table 4 Univariate Pairwise Comparisons of Adolescent/Adult and Math Topic Math Anxiety Measure Moderators
95% CI Measure beta LL UL k
Adolescent/Adult Math Anxiety Measure MARS vs. One item 0.03 -0.05 0.10 215 MARS vs. FSMAS -0.16*** -0.23 -0.09 241 MARS vs. MARS-A -0.11 -0.23 0.02 205 MARS vs. PISA -0.12*** -0.16 -0.08 253 MARS vs. AEQ -0.18** -0.29 -0.06 204 MARS vs. MAS (Betz) -0.14*** -0.22 -0.05 222 MARS vs. MAS (Meece) -0.02 -0.13 0.09 212 MARS vs. MAS (Bai) -0.05 -0.15 0.06 216 MARS vs. Other -0.05 -0.10 0.002 320 One item vs. FSMAS -0.21*** -0.33 -0.09 62 One item vs. MARS-A -0.14 -0.34 0.06 26 One item vs. PISA -0.16*** -0.24 -0.08 74 One item vs. AEQ -0.39*** -0.50 -0.27 25 One item vs. MAS (Betz) -0.18**† -0.32 -0.04 43 One item vs. MAS (Meece) -0.06 -0.19 0.07 33 One item vs. MAS (Bai) -0.10 -0.22 0.03 37 One item vs. Other -0.06 -0.15 0.02 141 FSMAS vs. MARS-A 0.05 -0.12 0.23 52 FSMAS vs. PISA 0.05 -0.01 0.11 100 FSMAS vs. AEQ -0.02 -0.17 0.13 51 FSMAS vs. MAS (Betz) 0.02 -0.10 0.14 69 FSMAS vs. MAS (Meece) 0.14*† 0.01 0.28 59 FSMAS vs. MAS (Bai) 0.12 -0.01 0.24 63 FSMAS vs. Other 0.10**† 0.02 0.18 167 MARS-A vs. PISA 0.0003 -0.11 0.11 64 MARS-A vs. AEQ -0.08 -0.35 0.18 15 MARS-A vs. MAS (Betz) -0.03 -0.25 0.18 33 MARS-A vs. MAS (Meece) 0.07 -0.16 0.31 23 MARS-A vs. MAS (Bai) 0.06 -0.16 0.27 27 MARS-A vs. Other 0.05 -0.09 0.19 131 PISA vs. AEQ -0.06 -0.15 0.04 63 PISA vs. MAS (Betz) -0.02 -0.10 0.06 81 PISA vs. MAS (Meece) 0.10*† 0.02 0.19 71 PISA vs. MAS (Bai) 0.07 -0.01 0.15 75 PISA vs. Other 0.06*† 0.01 0.11 179 AEQ vs. MAS (Betz) 0.05 -0.14 0.23 32 AEQ vs. MAS (Meece) 0.16 -0.03 0.35 22 AEQ vs. MAS (Bai) 0.13 -0.04 0.30 26 AEQ vs. Other 0.12 -0.01 0.25 130 MAS (Betz) vs. MAS (Meece) 0.11 -0.05 0.28 40 MAS (Betz) vs. MAS (Bai) 0.09 -0.06 0.24 44 MAS (Betz) vs. Other 0.08 -0.02 0.18 148 MAS (Meece) vs. MAS (Bai) -0.03 -0.13 0.07 34 MAS (Meece) vs. Other -0.04 -0.16 0.08 138 MAS (Bai) vs. Other -0.01 -0.12 0.10 142
Anxiety Topic Math vs. Statistics .09*** .04 .14 747
Note. *p < .05; **p < .01; ***p < .001; †predictor variables no longer significant after Benjamini-Hochberg correction; CI = Confidence Interval; LL = Lower Level; UL = Upper Level; k = number of effect sizes; MARS = Math Anxiety Rating Scale; FSMAS = Fennema Sherman Math Anxiety Scale; MARS-A = Math Anxiety Rating Scale – Adolescents; PISA = Programme for International Student Assessments; AEQ = Achievement Emotion Questionnaire; MAS = Math Anxiety Scale.
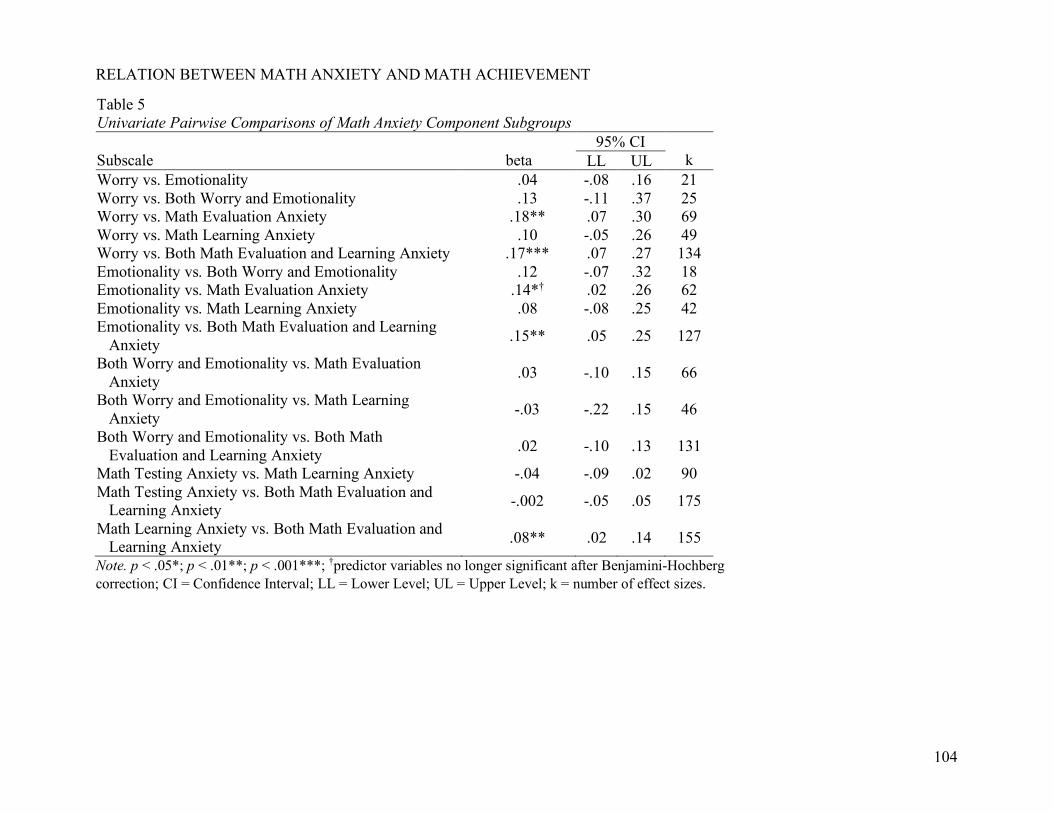
RELATION BETWEEN MATH ANXIETY AND MATH ACHIEVEMENT
104
Table 5 Univariate Pairwise Comparisons of Math Anxiety Component Subgroups
Subscale
beta
95% CI k LL UL
Worry vs. Emotionality .04 -.08 .16 21 Worry vs. Both Worry and Emotionality .13 -.11 .37 25 Worry vs. Math Evaluation Anxiety .18** .07 .30 69 Worry vs. Math Learning Anxiety .10 -.05 .26 49 Worry vs. Both Math Evaluation and Learning Anxiety .17*** .07 .27 134 Emotionality vs. Both Worry and Emotionality .12 -.07 .32 18 Emotionality vs. Math Evaluation Anxiety .14*† .02 .26 62 Emotionality vs. Math Learning Anxiety .08 -.08 .25 42 Emotionality vs. Both Math Evaluation and Learning
Anxiety .15** .05 .25 127
Both Worry and Emotionality vs. Math Evaluation Anxiety .03 -.10 .15 66
Both Worry and Emotionality vs. Math Learning Anxiety -.03 -.22 .15 46
Both Worry and Emotionality vs. Both Math Evaluation and Learning Anxiety .02 -.10 .13 131
Math Testing Anxiety vs. Math Learning Anxiety -.04 -.09 .02 90 Math Testing Anxiety vs. Both Math Evaluation and
Learning Anxiety -.002 -.05 .05 175
Math Learning Anxiety vs. Both Math Evaluation and Learning Anxiety .08** .02 .14 155
Note. p < .05*; p < .01**; p < .001***; †predictor variables no longer significant after Benjamini-Hochberg correction; CI = Confidence Interval; LL = Lower Level; UL = Upper Level; k = number of effect sizes.
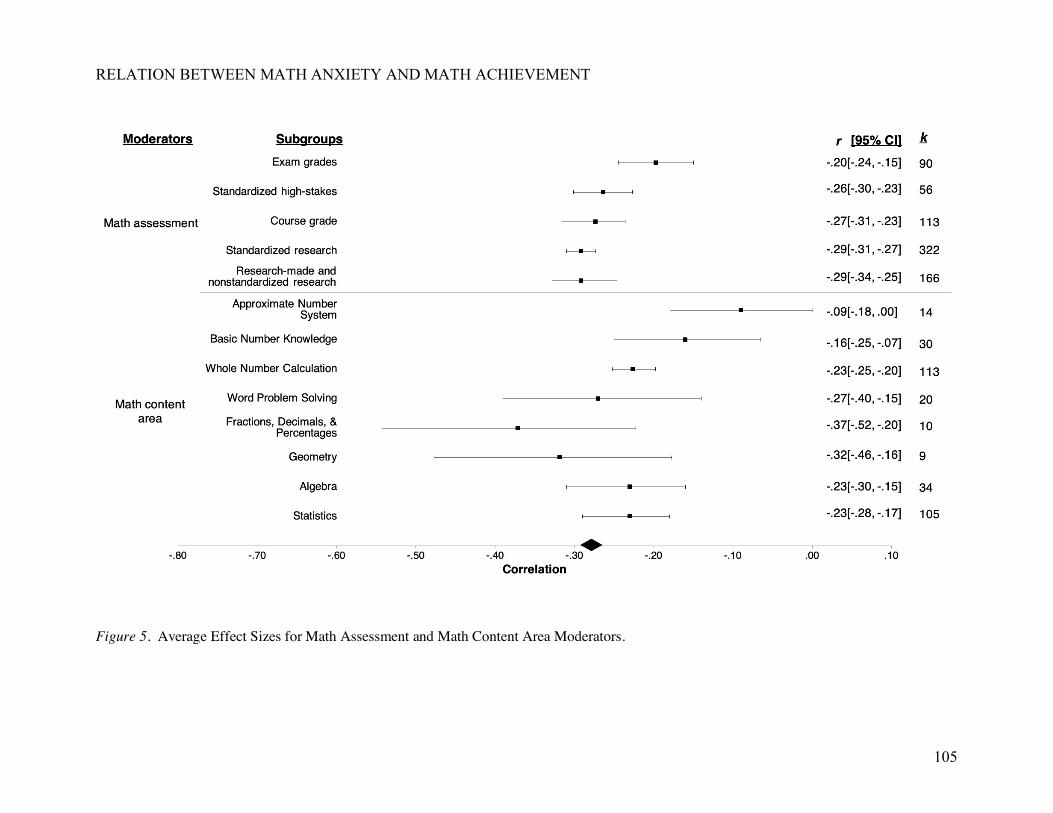
RELATION BETWEEN MATH ANXIETY AND MATH ACHIEVEMENT
105
Figure 5. Average Effect Sizes for Math Assessment and Math Content Area Moderators.

RELATION BETWEEN MATH ANXIETY AND MATH ACHIEVEMENT
106
Table 6 Univariate Pairwise Comparisons of Math Assessment Subgroups
Subscale
beta
95% CI k LL UL
High stakes tests vs. Standardized research assessments -.005 -.06 .05 378 High stakes tests vs. Nonstandardized research
assessments and Other tests -.05 -.12 .01 222
High stakes tests vs. Course grade -.02 -.08 .04 169 High stakes tests vs. Exam grade .06 -.002 .13 146 Standardized research assessments vs. Nonstandardized
research assessments and Other tests .01 -.03 .05 488
Standardized research assessments vs. Course grade .01 -.03 .05 435 Standardized research assessments vs. Exam grade .08** .03 .14 412 Nonstandardized research assessments and Other tests
vs. Course grade .02 -.05 .08 279
Nonstandardized research assessments and Other tests vs. Exam grade .09* .02 .15 256
Course grade vs. Exam grade .06*† .003 .11 203 Note. p < .05*; p < .01**; †predictor variables no longer significant after Benjamini-Hochberg correction; CI = Confidence Interval; LL = Lower Level; UL = Upper Level; k = number of effect sizes.
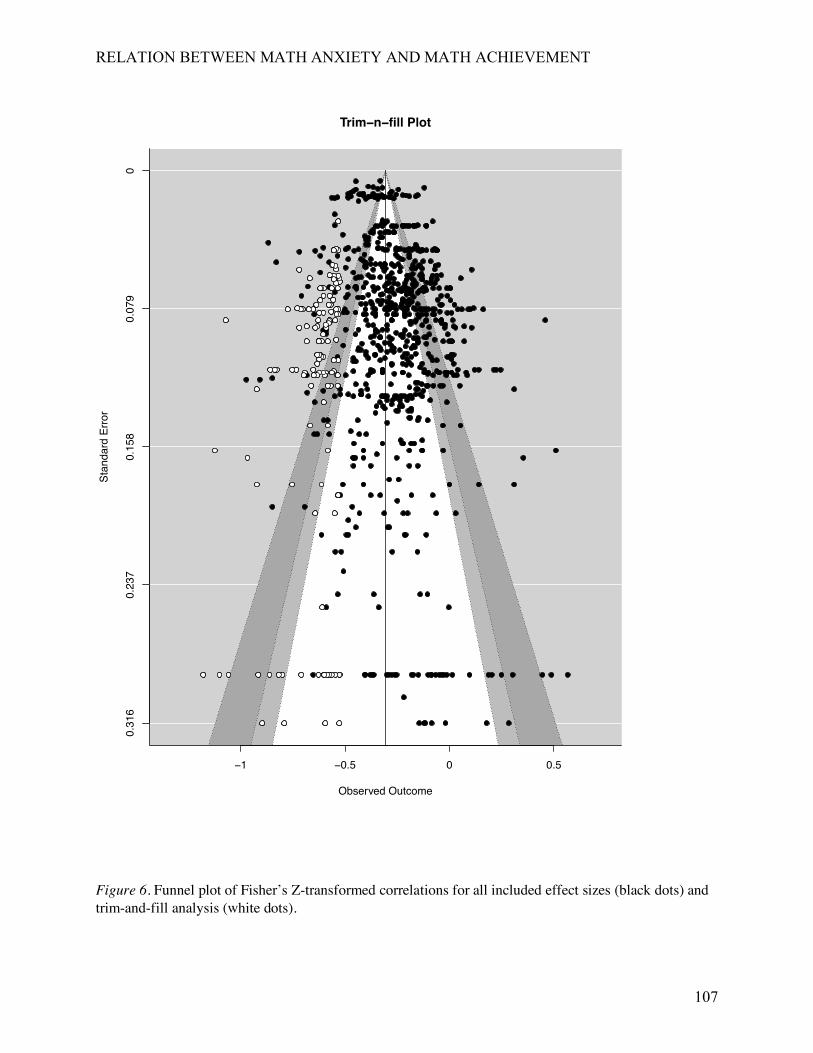
RELATION BETWEEN MATH ANXIETY AND MATH ACHIEVEMENT
107
Figure 6. Funnel plot of Fisher’s Z-transformed correlations for all included effect sizes (black dots) and trim-and-fill analysis (white dots).
Trim−n−fill Plot
Observed Outcome
Stan
dard
Erro
r
0.31
60.
237
0.15
80.
079
0
−1 −0.5 0 0.5
Related Documents


![[Achievement Motivation and Anxiety] 1 Running head ......[Achievement Motivation and Anxiety] 2 ABSTRACT Maternal achievement motivation and anxiety were evaluated in relation to](https://static.cupdf.com/doc/110x72/5e7e8fe62ed36e63a53d9f59/achievement-motivation-and-anxiety-1-running-head-achievement-motivation.jpg)