Zürich, 04.01.2017 / Version 1.1 ©TESTEX AG, Gotthardstrasse 61, CH‐8027 Zürich TESTEX RUNDTEST FUNCTION NO. 7 AUSWERTUNG / EVALUATION REVISED VERSION Anmerkung Remark 2 Wasserdurchgangswiderstand Resistance to water penetration (ISO 811) 4 Wasserdampf- / Wärmedurchgangswiderstand Water-vapour resistance / Thermal resistance (ISO 11092) 6 Luftdurchlässigkeit Permeability to air (ISO 9237) 8 Farbmessung Hintergrundmaterial Colour measurement background material (EN ISO 20471:2013) 10 Elektrostatische Eigenschaften Electrostatic properties (EN 1149-5) 16 Begrenzte Flammenausbildung Limited flame spread (EN ISO 15025) 17 Kommentare Comments 20 Lexikon Dictionary 21 Änderungen revidierte Version Amendments revised version 22

Welcome message from author
This document is posted to help you gain knowledge. Please leave a comment to let me know what you think about it! Share it to your friends and learn new things together.
Transcript

Zürich, 04.01.2017 / Version 1.1 ©TESTEX AG, Gotthardstrasse 61, CH‐8027 Zürich
TESTEX RUNDTEST
FUNCTION
NO. 7
AUSWERTUNG / EVALUATION REVISED VERSION
Anmerkung Remark 2 Wasserdurchgangswiderstand Resistance to water penetration (ISO 811) 4 Wasserdampf- / Wärmedurchgangswiderstand Water-vapour resistance / Thermal resistance (ISO 11092) 6 Luftdurchlässigkeit Permeability to air (ISO 9237) 8 Farbmessung Hintergrundmaterial Colour measurement background material (EN ISO 20471:2013) 10 Elektrostatische Eigenschaften Electrostatic properties (EN 1149-5) 16 Begrenzte Flammenausbildung Limited flame spread (EN ISO 15025) 17 Kommentare Comments 20 Lexikon Dictionary 21 Änderungen revidierte Version Amendments revised version 22

RUNDTEST Function No. 7
Zürich, 04.01.2017 / Version 1.1 Page 2 ©TESTEX AG, Gotthardstrasse 61, CH‐8027 Zürich
Anmerkung / Remark
Anmerkung
Ganz zu Beginn soll vorweggenommen werden, dass für alle untersuchten Proben kein wirklich wahrer Wert (true value) bekannt ist. Die erhaltenen Werte können also nicht mit einem Referenzwert verglichen werden.
Wenn keine Angabe zu der Anzahl durchgeführter Tests gemacht wurde, ist von der vorgegebenen Mindestanzahl ausgegangen worden, um die Be-rechnungen durchzuführen. Diese Angaben werden kursiv dargestellt.
Verschiedentlich zeigen einzelne Resultate eines Labors eine unerwartet hohe Abweichung zu den Resultaten anderer Labors. Werte mit einer Abwei-chung von > +/- 1.5s zum Mittelwert werden in der Auswertung mit einem "o" gekennzeichnet.
Resultate, die sich statistisch nicht sinnvoll auswer-ten lassen, da sie ausserhalb der Grenze von +/- 2s zum Mittelwert liegen (Cochran-Test auf Ausreis-ser, resp. 95% Wahrscheinlichkeitstest), und Resul-tate ohne Angabe des CV%-Wertes, werden in der Auswertung mit einem "x“ gekennzeichnet. Diese Werte werden nicht in den definitiven Mittelwert miteinbezogen und, mit Ausnahme von EN ISO 20471, in den Grafiken nicht mehr dargestellt.
In der Auswertung sind sowohl der Mittelwert und die Standardabweichung sowie der CV% angege-ben.
Der z-Wert gibt an, wie viel Abweichung und in welcher Richtung (+/-) der jeweilige Messwert (La-bor) vom Mittelpunkt 0 abweicht.
Interpretation z-Werte:
z-Wert ≤ 1.5, zufriedenstellend
1.5 < z-Wert ≤ 2.5, bedenklich
z-Wert > 2.5, ungenügend
In Einzelfällen kann es zu Diskrepanzen zwischen Ausreissern nach „Cochran-Test“ und Interpreta-tions-Schema gemäss z-Wert kommen, da diese beiden Verfahren keinen direkten Zusammenhang haben und daher kein 1:1 Vergleich möglich ist.
Es werden diverse Graphiken dargestellt, welche sich den Werten entsprechend im Typ unterschei-den können. Grundsätzlich ist aber die Gegenüber-stellung der ermittelten Werte des Einzelnen (Labor) angestrebt, als Vergleich zum Mittelwert aller Labors und der jeweiligen Abweichung & Streuung.
Remark
At first is to be mentioned that for all analysed samples the true value is not known. The deter-mined values and results can therefore not be compared with a reference value.
If the number of tests performed was not indicated, the specified minimum number was taken for the calculations. Those numbers are printed in cursive characters.
Sometimes single results of a lab show an unusu-al high deviation compared to the results of other laboratories. Values with a deviation > +/- 1.5s of the mean value are being marked with an "o" in the evaluation.
Results that cannot be used for statistical calcula-tions since they are out of the range of +/- 2s to the mean value (Cochran-Test for outlier, 95% statistical probability for proficiency assessment) and results without CV%-value will be marked in the evaluation with an “x“. Those values are not integrated into the final mean value either and except on the trapeze from EN ISO 20471, are not shown in any of the graphs.
Generally, besides the mean value and standard deviation, also the CV% is indicated.
The z-score indicates the deviation and its direc-tion (+/-) from the mean value 0 of the single val-ues of each lab.
Interpretation of z-score:
z-score ≤ 1.5, satisfactory
1.5 < z-score ≤ 2.5, questionable
z-score > 2.5, unsatisfactory
In some cases there might be discrepancies be-tween the outliers by the "Cochran test" and those according to the interpretation scheme of z-scores: The two procedures have no concrete relationship and are not comparable 1:1.
Different types of graphics are shown sometimes, which depend on the type of the single values given. In general the main goal of the graphs shall be to compare the single values of each lab with the mean value of all labs, as well as it's variation & deviation.

RUNDTEST Function No. 7
Zürich, 04.01.2017 / Version 1.1 Page 3 ©TESTEX AG, Gotthardstrasse 61, CH‐8027 Zürich
Anmerkung / Remark
In den vorliegenden Graphiken auf Seite 5, 7, 9, 12 & 15 ist die Kontrollgrenze 1s mittels durch-gehender Linie und der Bereich 1.5s mit gestri-chelter Linie gekennzeichnet.
Bei den Werten aus EN 1149-1/ resp. /-3 wurde auf eine graphische Darstellung verzichtet, da sich diese durch die Charakteristika der Werte schlecht in einer aussagekräftigen Grafik darstel-len lassen.
Aus denselben Gründen wurde auch bei EN ISO 15025 auf eine graphische Darstellung verzich-tet. Um die Resultate in einen Vergleich zu set-zen, wurde die Klassifizierung gemäss Anforde-rungsnorm EN ISO 14116:2015 eingesetzt. Der zugewiesene Index ist in der Tabelle auf Seite 17 aufgeführt.
Spezielle Anmerkung
Wasserdurchgangswiderstand: Aus Vergleichbarkeitsgründen wurden nur Werte in die Auswertung integriert, welche mit einer Druckgeschwindigkeit von 60 cm/min gemessen wurden.
Luftdurchlässigkeit: Da die Prüfung nicht von allen Labors gemäss Anleitung durchgeführt werden konnte, was auch auf die ungünstige Musterwahl zurück zu führen ist, sind auf Seiten 8 und 9 jeweils zwei Auswer-tungen zu finden. Jeweils eine für Ergebnisse, welche mit 1 mbar Unterdruck und eine für Er-gebnisse, welche mit 2 mbar Unterdruck gemes-sen wurden.
Elektrostatische Eigenschaften: Ausgewertet wurde der gemessene Oberflä-chenwiderstand, nach der Messung 'R'. Die Spal-te "Erfüllt nach EN 1149-5" ist rein informativ angebracht.
In the existing graphics on page 5, 7, 9, 12 & 15 the control limit value 1s is characterized with a continuous line and the range 1.5s with a broken line.
For the values from the tests of EN 1149-1/-3 respectively, we have decided to go without a graph of the single values, as their characteristics would have been very hard to put into a mean-ingful graph.
For the same reasons no graph is displayed for EN ISO 15025. In order to compare the results the classification system according to EN ISO 14116:2015 is used. The allocated Index is shown in the table on page 17.
Special Note
Resistance to water penetration: For comparability reasons, only values that were measured with a pressure speed of 60 cm/min are integrated in the evaluation.
Permeability to air: Since not all laboratories could perform the test according to the guideline due to the inconven-ient selection of the sample, two evaluations can be found on pages 8 and 9. One with results that were measured with an under-inflation of 1 mbar and one with results that were measured with an under-inflation of 2 mbar.
Electrostatic properties: For the report, only the surface resistance 'R' was taken into the evaluation. The column "Fulfils requirement of 1149-5" is for information only.

RUNDTEST Function No. 7
Zürich, 04.01.2017 / Version 1.1 Page 4 ©TESTEX AG, Gotthardstrasse 61, CH‐8027 Zürich
Wasserdurchgangswiderstand / Resistance to water penetration ISO 811
Muster: Gewebe imprägniert und laminiert, 80% PES / 20% PUR, Farbe Neongrün Sample: Woven fabric impregnated and laminated, 80% PES / 20% PUR, col. neon green
Lab Code
Testing equipment test size [cm2]
pressure speed
[cm /min]
water temp[oC]
No. of tests
indicated value unit
s CV (%)ø [mbar] z-score ø [cm] z-score
35 Textest FX 3000 100 60 20 5 231.42 -1.16 236.00 -1.15 6.32 2.68 44 Textest FX 3000 100 60 20 5 238.29 -0.19 243.00 -0.19 12.10 o 5.00 71 Textest FX 3100 100 60 20 5 248.00 1.18 252.89 1.18 7.16 2.88 72 Textest FX 3000 100 60 20 5 240.00 0.05 244.73 0.05 8.93 3.73 79 Textest FX 3000 G-H 100 60 20 5 240.60 0.14 245.34 0.14 8.76 3.64 79 Textest FX 3000 Gent 100 60 20 5 243.00 0.48 247.79 0.47 4.97 2.05 84 SDL 018 100 60 20 5 247.50 1.11 252.40 1.11 12.10 o 4.80 85 Atlas 100 60 20 5 237.31 -0.33 242.00 -0.33 4.50 1.80 89 Textest FX 3000 100 60 21 6 248.00 1.18 252.89 1.18 10.51 x 0.04 91 Textest FX 3000 Hydrotester III 100 60 21 5 248.00 1.18 252.89 1.18 6.30 2.60
101 Hydrotester 4 100 60 20 5 o 228.30 -1.60 232.80 -1.60 6.00 2.60 101 Hydrotester 4 100 60 20 5 o 228.28 -1.60 232.80 -1.60 6.00 2.60 107 Textest FX 3000 Hydrotester 100 60 20 5 235.93 -0.52 240.60 -0.52 5.86 2.40 142 Textest FX 3000 Hydrotester III 100 60 21 5 245.35 0.81 250.20 0.81 5.70 2.20 145 Textest FX 3000 100 60 20 5 o 251.00 1.60 255.94 1.60 9.61 3.83 180 Textest FX 3000 100 60 20 6 244.66 0.71 249.48 0.71 8.70 3.54 181 Textest FX 3000 100 60 20 5 236.00 -0.51 240.65 -0.51 3.42 1.45 190 SDL Hydrostatic Head Tester M018 100 60 20 5 237.70 -0.27 242.40 -0.27 10.50 4.30 203 Textest FX 3000 Hydrotester III 100 60 20 5 238.40 -0.17 243.10 -0.17 10.74 4.50 212 Textest FX 3000 100 60 20 5 x 263.00 3.29 268.18 3.29 8.30 3.16 233 Textest FX 3000 100 60 20 5 234.00 -0.79 238.61 -0.79 16.59 x 7.10 241 ? 100 60 20 5 247.31 1.08 252.20 1.08 10.20 4.04 242 Textest FX 3000 Hydrotester 100 60 20 5 244.20 0.64 249.01 0.64 107.90 4.30 261 Textest FX 3000 Hydrotester III 100 60 25 6 o 262.00 3.15 267.16 3.15 3.76 1.43 269 Textest FX 3000 IV 100 60 20 5 234.00 -0.79 238.61 -0.79 5.89 2.51 271 ? 100 60 20 5 242.00 0.33 246.77 0.33 6.30 2.62 271 ? 100 61 20 5 241.23 0.23 246.00 0.23 5.90 2.38 272 Textest FX 3000 100 60 22 5 o 253.00 1.88 257.98 1.88 5.10 2.00 278 Textest FX 3000 100 60 20 6 234.36 -0.74 239.00 -0.74 5.30 2.20 281 ? 100 60 21 5 244.00 0.62 248.81 0.61 8.52 3.50 284 SDL Hydrostatic Head Tester M018 100 60 20 5 232.89 -0.95 237.50 -0.95 10.40 4.36 292 Textest FX 3000 Hydrotester IV 100 60 20 6 234.00 -0.79 238.61 -0.79 6.90 2.90 298 ? 100 60 21 6 237.30 -0.33 241.97 -0.33 9.50 4.00 303 Textest FX 3000 100 60 20 6 235.34 -0.60 240.00 -0.60 7.70 3.20 376 ? 100 60 20 5 o 228.00 -1.64 232.49 -1.64 10.90 o 4.80 379 ? 100 60 20 5 235.34 -0.60 240.00 -0.60 9.20 3.80 383 Textest FX 3000 Hydrotester IV 100 60 21 6 232.16 -1.05 236.73 -1.05 7.17 3.09 387 ? 100 60 20 5 246.33 0.94 251.20 0.95 4.60 1.90 389 ? 113 60 18 5 x 176.51 -8.89 180.00 -8.89 0.11 x 0.06 390 Satra Hydrostatic head 100 60 20 6 239.27 -0.05 244.00 -0.05 6.05 2.48 392 Hydrostatic pressure tester 100 60 23 5 239.46 -0.02 244.20 -0.02 5.63 2.30 397 Water Permeability Tester 100 60 22 6 241.23 0.23 246.00 0.23 8.00 3.00 400 ? 100 60 21 5 234.36 -0.74 239.00 -0.74 6.60 2.80 401 Textest FX 3000 100 60 20 5 238.87 -0.11 243.60 -0.10 5.98 2.50 414 Textest FX 3000 100 60 ? 5 229.60 -1.41 234.12 -1.41 1.30 o 0.60 415 Textest FX 3000 100 60 20 5 239.80 0.02 244.52 0.02 7.66 3.20 422 Textest FX 3000 100 60 21 5 235.34 -0.60 240.00 -0.60 1.70 o 0.70
n 45 45 44 Ø 239.63 244.36 2.96 s 7.10 7.24 1.05 CV % 2.96 2.96 35.45
(x) unexpected value (o) beyond control limit

RUNDTEST Function No. 7
Zürich, 04.01.2017 / Version 1.1 Page 5 ©TESTEX AG, Gotthardstrasse 61, CH‐8027 Zürich
Wasserdurchgangswiderstand / Resistance to water penetration ISO 811
-8%
-6%
-4%
-2%
0%
2%
4%
6%
8%
35
44
71
72
79
79
84
85
89
91
101
101
107
142
145
180
181
190
203
233
241
242
261
269
271
271
272
278
281
284
292
298
303
376
379
383
387
390
392
397
400
401
414
415
422
Lab code
Deviation to mean value in %

RUNDTEST Function No. 7
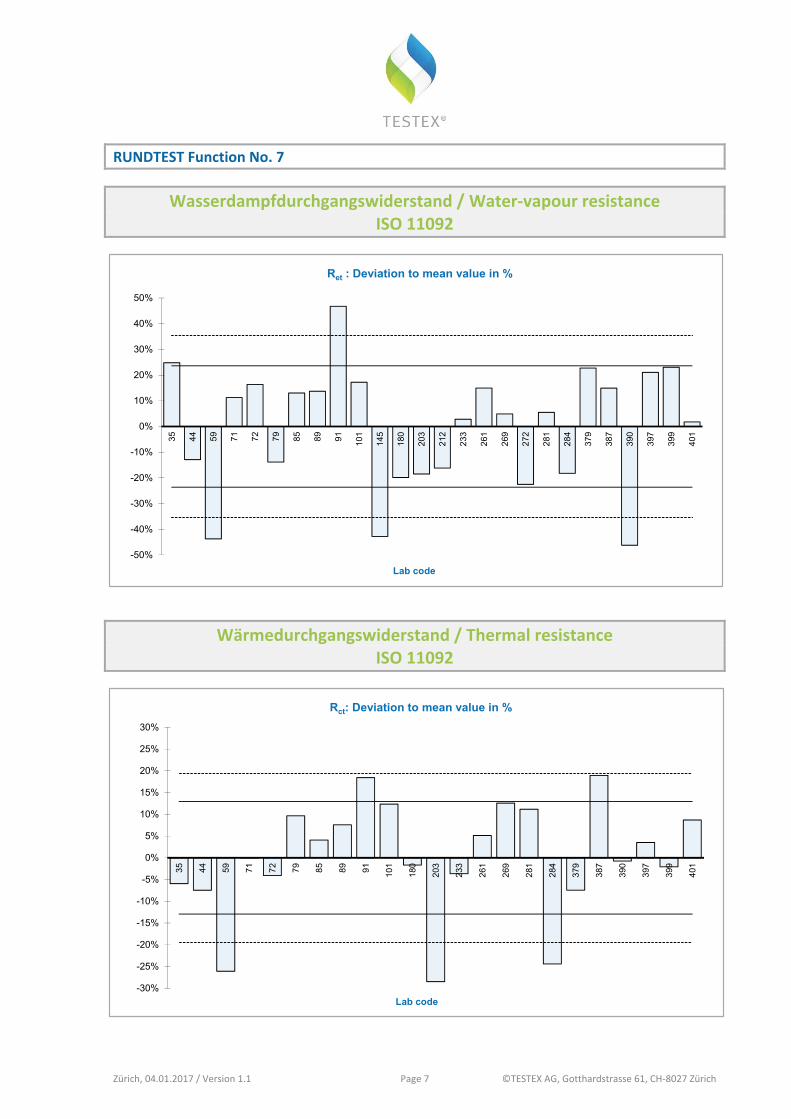
Wasserdampf‐ / Wärmedurchgangswiderstand / Water‐vapour resistance / Thermal resistance ISO 11092
Zürich, 04.01.2017 / Version 1.1 Page 6 ©TESTEX AG, Gotthardstrasse 61, CH‐8027 Zürich
Muster: Ret / Rct = Gewebe 39% MAC / 35% CLY / 17% CO / 8% PA, 1% CF, Farbe Dunkelblau Sample: Ret / Rct = Woven fabric 39% MAC / 35% CLY / 17% CO / 8% PA, 1% CF, colour navy blue
(x) unexpected value (o) beyond control limit
Lab Code
Testing equipment
testing temp. [oC]
Ret / Rct
humidity rel. [%]
Ret / Rct
No. of tests
Results Ret Results Rct
⌀ Ret
[m2Pa/W] z-score s CV (%)
⌀ Rct [m2 K/W]
z-score s CV (%)
35 Skin Model 35 / 20 40 / 65 3 31.42 1.05 1.19 3.80 0.25 -0.46 0.02 7.50 44 SDL Atlas Sweating Guarded Hotplate 35 / 20 40 / 65 3 21.92 -0.55 0.34 1.54 0.25 -0.58 0.01 2.64 59 Hohenstein Skin Model 35 / 20 40 / 65 3 o 14.16 -1.85 0.42 3.00 o 0.20 -2.02 0.01 6.70 71 640 ABT/10 JMU-S 35 / 20 40 / 65 3 28.00 0.48 0.30 0.90 0.27 0.00 0.02 6.68 72 MTNW Hotplate 35 / 20 40 / 65 3 29.29 0.69 1.84 6.29 0.26 -0.32 0.01 2.21 79 SDL Atlas M259B / Thermetrics ISGHP 35 / 20 40 / 65 3 21.69 -0.59 0.22 1.02 0.30 0.75 0.01 3.75 85 Hohenstein Skin Model 35 / 20 40 / 65 3 28.45 0.55 1.55 5.46 0.28 0.32 0.03 9.62 89 Skin Model 35 / 20 40 / 65 3 28.62 0.58 0.25 0.90 0.29 0.59 0.01 4.60 91 Integrated sweating guarded hotplate 8.2 35 / 20 40 / 65 3 o 36.93 1.98 1.08 2.90 0.32 1.42 0.02 5.40
101 Mesdan 3123 35 / 20 40 / 65 3 29.51 0.73 1.16 3.90 0.30 0.95 0.01 1.60 145 Permetester 23 50 5 o 14.40 -1.81 0.75 5.20 180 SDL Atlas M 259 B 35 / 20 40 / 65 3 20.17 -0.84 1.31 5.14 0.26 -0.13 0.04 10.93 203 SDL Atlas Skin Model 35 / 20 40 / 65 3 20.51 -0.78 0.79 3.84 o 0.19 -2.20 0.01 5.00 212 SDL Atlas 35 40 3 21.10 -0.69 1.20 5.69 233 Hohenstein Skin Model 35 / 20 40 / 65 3 25.88 0.12 2.34 9.04 0.26 -0.28 0.23 8.68 258 SDL Atlas - SGHP 35 / 20 40 / 65 3 x 24.91 -0.04 x 0.54 7.78 261 Sweat Guard hot plate 35 / 20 40 / 65 2 28.93 0.63 3.96 13.69 0.28 0.40 0.00 1.20 269 Wenzhou Darong YG 606G 35 / 20 40 / 65 3 26.40 0.21 0.26 0.98 0.30 0.97 0.00 0.53 272 Permetester 23 50 5 19.50 -0.95 1.10 5.80 x 0.09 -5.10 0.01 7.8 281 Hotplate MTNW 35 / 20 40 / 65 3 26.56 0.23 2.06 7.80 0.30 0.86 0.01 4.30 284 Sweating Guard Hotplate 35 / 20 40 / 65 5 20.58 -0.77 0.90 4.48 o 0.20 -1.89 0.01 4.47 379 Sweating Guarded Hotplate SGHP-8.2 35 / 20 40 / 65 3 30.90 0.96 0.89 2.88 0.25 -0.57 0.01 4.21 387 MPP220 35 / 20 40 / 65 3 28.93 0.63 0.98 3.38 0.32 1.46 0.01 1.61 390 SATRA 35 / 20 40 / 65 3 o 13.54 -1.96 0.08 6.20 0.27 -0.06 0.02 6.85 397 iSGHP 35 / 20 40 / 65 3 30.47 0.89 0.97 3.17 0.28 0.27 0.01 2.46 399 Sweating Hotplate SGHP-10.5 35 / 20 40 / 65 3 30.98 0.98 2.09 6.73 0.26 -0.16 0.02 8.02 401 Hohenstein Skin Model 35 / 20 40 / 65 3 25.62 0.08 0.30 1.17 0.29 0.67 0.01 4.19
n 26 23 Ø 25.17 0.27 s 5.94 0.03 CV % 23.61 12.95
RUNDTEST Function No. 7
Zürich, 04.01.2017 / Version 1.1 Page 7 ©TESTEX AG, Gotthardstrasse 61, CH‐8027 Zürich
Wasserdampfdurchgangswiderstand / Water‐vapour resistance ISO 11092
Wärmedurchgangswiderstand / Thermal resistance ISO 11092
-50%
-40%
-30%
-20%
-10%
0%
10%
20%
30%
40%
50%
35
44
59
71
72
79
85
89
91
101
145
180
203
212
233
261
269
272
281
284
379
387
390
397
399
401
Lab code
Ret : Deviation to mean value in %
-30%
-25%
-20%
-15%
-10%
-5%
0%
5%
10%
15%
20%
25%
30%
35
44
59
71
72
79
85
89
91
101
180
203
233
261
269
281
284
379
387
390
397
399
401
Lab code
Rct: Deviation to mean value in %

RUNDTEST Function No. 7
Zürich, 04.01.2017 / Version 1.1 Page 8 ©TESTEX AG, Gotthardstrasse 61, CH‐8027 Zürich
Luftdurchlässigkeit / Permeability to air ISO 9237
Muster: Gestrick 100% PES, Farbe Beige Sample: Knitted fabric 100% PES, colour beige
Lab Code
Testing equipment test size
[cm2]
under-inflation [mbar]
No. of tests
ø [l/m2s] z-score s CV (%)
35 TEXTEST FX 3300 20 ? 10 2867.00 -0.53 43.00 1.50 44 TEXTEST FX 3300 20 2 5 2998.00 0.73 37.00 1.20 71 TEXTEST FX 3300 20 2 10 2876.00 -0.44 55.80 1.94 72 TEXTEST FX 3300 III 20 2 10 2880.00 -0.40 51.40 1.80 79 TEXTEST FX 3300 20 2 10 2979.00 0.55 62.62 2.10 84 SDM 021A 20 2 10 2856.00 -0.63 62.00 2.20 89 TEXTEST FX 3300 20 2 10 2834.80 -0.84 31.62 o 0.01 91 TEXTEST FX 3300 III 20 7 5 2966.00 0.42 18.17 o 0.60
142 TEXTEST FX 3300 II 20 2 10 3017.00 0.91 38.60 1.30 145 TEXTEST FX 3300 20 2 5 o 2698.00 -2.15 44.00 1.63 180 Karl Schröder KG 20 2 10 o 3245.94 3.11 64.03 1.98 181 TEXTEST FX 3300 Labair IV 20 2 10 2865.00 -0.55 72.60 2.40 190 TEXTEST FX 3300 20 2 10 3009.00 0.84 46.06 1.53 203 TEXTEST FX 3300 20 2 10 2802.31 -1.15 50.26 1.79 212 Karl Schröder 20 2 5 2959.00 0.36 39.20 1.33 233 TEXTEST FX 3000 20 2 10 2790.00 -1.27 52.03 1.86 242 TEXTEST FX 3300 20 2 5 x 2872.00 -0.48 261 TEXTEST FX 3300 20 2 6 2956.67 0.33 74.21 2.51 272 TEXTEST FX 3300 20 2 5 2870.00 -0.50 78.40 o 2.70 278 TEXTEST FX 3300 20 2 5 2894.00 -0.27 41.00 1.40 281 TEXTEST FX 3300 20 2 10 2878.00 -0.42 84.30 o 2.93 292 TEXTEST FX 3300 20 2 10 2907.00 -0.14 43.70 1.50 298 Air Permeability Tester 20 2 10 x 3470.00 5.26 422.00 x 12.20 303 TEXTEST FX 3300 20 2 5 2968.00 0.44 19.20 0.65 379 Air Permeability Tester III 20 2 10 2946.00 0.23 34.40 1.20 387 Mefevet FF 13/A 5 2 10 x 2361.00 -5.38 85.00 2.00 390 Shirley SDL 21 20 3 5 2990.00 0.65 6.52 2.18 397 Air Permeability Tester 20 2 10 3048.90 1.22 18.10 o 0.60 413 TEXTEST FX 3300 III 20 2 10 2866.00 -0.54 52.57 1.83 415 TEXTEST FX 3300 20 2 10 x 2200.00 -6.93 21.10 0.96
n 26 28
Ø 2921.83 1.63
s 104.17 0.68
CV % 3.57 41.53
Lab Code
Testing equipment test size
[cm2]
under-inflation [mbar]
No. of tests
ø [l/m2s] z-score s CV (%)
59 ÖTI equipment engineering 20 1 10 o 1270.00 -1.85 28.75 2.30 101 Branca Idelair 10 1 10 1984.00 1.11 7.90 0.40 107 TEXTEST FX 3030 10 1 10 1776.90 0.25 8.60 0.50 271 TEXTEST FX 3300 20 1 21 1694.00 -0.09 39.90 2.36 401 TEXTEST FX 3300 IV 20 1 10 1731.00 0.06 2.24 414 TEXTEST FX 3300 20 1 10 1838.00 0.51 1.00 1.10
n 6 6
Ø 1715.65 1.48
s 240.85 0.93
CV % 14.04 62.49
(x) unexpected value (o) beyond control limit

RUNDTEST Function No. 7
Zürich, 04.01.2017 / Version 1.1 Page 9 ©TESTEX AG, Gotthardstrasse 61, CH‐8027 Zürich
Luftdurchlässigkeit / Permeability to air ISO 9237
-8%
-6%
-4%
-2%
0%
2%
4%
6%
8%
35 44 71 72 79 84 89 91
142
145
180
181
190
203
212
233
261
272
278
281
292
303
379
390
397
413
Lab code
Deviation to mean value in % 2mbar under-inflation
-30%
-20%
-10%
0%
10%
20%
30%
59 101
107
271
401
414
Lab code
Deviation to mean value in % 1mbar under-inflation

RUNDTEST Function No. 7
Farbmessung Hintergrundmaterial / Colour measurement background material EN ISO 20471:2013
Zürich, 04.01.2017 / Version 1.1 Page 10 ©TESTEX AG, Gotthardstrasse 61, CH‐8027 Zürich
Muster: Softshell, Farbe Warnorange-rot Sample: Softshell, colour Hi-Vis Orange-Red
Lab Code
Testing equipment
No. of tests
(in each condition)
Results NEW Results EXPOSED TO LIGHT Results AFTER AGEING
⌀ Chroma-ticy [x]
⌀ Chroma-ticy [y]
⌀ luminancefactor
[ ß min] z-score
⌀ Chroma-ticy [x]
⌀ Chroma-ticy [y]
⌀ luminance factor
[ ß min] z-score
⌀ Chroma-ticy [x]
⌀ Chroma-ticy [y]
⌀ luminance factor
[ ß min] z-score
35 Konica Minolta CM-2500c 3 0.5840 0.3770 0.5390 1.21 0.5170 0.3740 0.6340 1.41 0.5860 0.3760 0.5430 1.18 44 Gretag Macbeth 2145 4 0.5818 0.3767 0.4953 -0.93 0.5438 0.3769 0.5644 -1.44 0.5810 0.3765 o 0.4877 -1.56 59 Konica Minolta CM-2500c 1 0.5846 0.3767 0.5300 0.77 0.5352 0.3771 0.6100 0.43 0.5840 0.3766 0.5300 0.53 71 Konica Minolta CM-2500c 4 0.5837 0.3767 0.5427 1.39 0.5504 0.3777 0.6165 0.69 0.5844 0.3759 0.5406 1.06 72 Konica Minolta CM-2500c 4 0.5836 0.3751 0.4860 -1.38 0.5216 0.3737 0.5830 -0.68 0.5810 0.3767 o 0.4800 -1.94 79 Konica Minolta CM-2500 4 0.5866 0.3746 0.5255 0.55 0.5255 0.3753 0.6239 1.00 0.5871 0.3744 0.5326 0.66 89 Datacolor 245 4 0.5873 0.3744 0.5400 1.26 0.5411 0.3763 0.6200 0.84 0.5859 0.3754 0.5300 0.53
101 Konica Minolta CM-2500cCT 4 0.5865 0.3751 0.5300 0.77 0.5365 0.3759 0.6100 0.43 0.5859 0.3749 0.5300 0.53 142 Hunterlab 5 0.5910 0.3760 x 0.6000 4.19 0.5040 0.3710 x 0.7000 4.11 0.5910 0.3770 x 0.7000 8.95 145 Datacolor DC 245 3 0.5907 0.3721 0.5282 0.68 0.5902 0.3724 0.5276 0.41 180 Konica Minolta CM-2500c 5 0.6046 0.3788 0.4850 -1.43 0.4947 0.3705 0.6240 1.00 0.5846 0.3744 0.5060 -0.66 190 Konica Minolta CM-3600a 3 0.5830 0.3750 0.5210 0.33 0.5820 0.3760 0.5060 -0.66 203 Hunterlab ColorFlex EZ 5 0.5878 0.3753 0.5100 -0.21 0.5185 0.3743 0.6100 0.43 0.5873 0.3754 0.5000 -0.95 241 Konica Minolta CM-2500c 3 0.6003 0.3788 0.5454 1.30 242 Konica Minolta CM-2500c 3 0.5830 0.3770 0.4900 -1.18 0.5380 0.3760 0.5700 -1.21 258 Perkin Elmer 4 0.5847 0.3750 0.4949 -0.94 0.5327 0.3754 0.5857 -0.56 0.5855 0.3748 0.5040 -0.75 261 Konica Minolta CM-2500c 6 0.5813 0.3767 0.5029 -0.55 0.5507 0.3770 o 0.5614 -1.56 0.5828 0.3766 0.5150 -0.21 269 Hunterlab ColorFlex EZ 2 0.5870 0.3746 0.5000 -0.70 0.5352 0.3748 0.6000 0.02 0.5868 0.3746 0.5100 -0.46 278 Hunterlab ColorFlex EZ 5 0.5876 0.3758 o 0.5490 1.70 0.5255 0.3732 0.6319 1.32 0.6057 0.3695 0.5427 1.16 281 Konica Minolta CM-2500c 6 0.5851 0.3759 0.5320 0.87 0.4973 0.3692 0.6350 1.45 0.5856 0.3757 0.5250 0.29 292 Hunterlab ColorFlex EZ 3 0.5881 0.3748 0.4900 -1.18 0.5381 0.3753 0.5800 -0.80 0.5888 0.3745 0.5100 -0.46 379 Hunterlab ColorFlex EZ 4 0.5860 0.3760 0.5000 -0.70 0.5470 0.3770 0.5900 -0.39 0.5880 0.3750 0.5200 0.04 387 Hunterlab EZ 4 0.5845 0.3765 0.5400 1.26 0.5601 0.3771 0.5900 -0.39 0.5852 0.3762 o 0.5500 1.52 390 Konica Minolta CM-2500c 10 0.5843 0.3757 0.5177 0.17 0.5843 0.3758 0.5135 -0.28 392 Datacolor CS-3 3 0.5845 0.3751 0.5200 0.28 0.5856 0.3742 0.5300 0.53 399 Hunterlab MiniScan EZ 6 0.5732 0.3778 0.5114 -0.14 0.5867 0.3761 0.5209 0.08 401 Konica Minolta CM-2500c 4 0.5840 0.3760 o 0.4800 -1.67 0.5300 0.3750 o 0.5600 -1.62 0.5830 0.3760 o 0.4700 -2.44 415 x-rite coliori7 spectrophom. 3 0.5797 0.3762 0.5100 -0.21 0.5390 0.3750 0.5900 -0.39 0.5799 0.3762 0.5300 0.53
n 26 21 26 Ø 0.514 0.600 0.519 s 0.020 0.024 0.020 CV % 3.98 4.08 3.89
(x) unexpected value (o) beyond control limit

RUNDTEST Function No. 7
Farbmessung Hintergrundmaterial / Colour measurement background material EN ISO 20471:2013
Zürich, 04.01.2017 / Version 1.1 Page 11 ©TESTEX AG, Gotthardstrasse 61, CH‐8027 Zürich
0.330
0.340
0.350
0.360
0.370
0.380
0.390
0.400
0.520 0.540 0.560 0.580 0.600 0.620 0.640 0.660
y
x
Corner Mark 35 44 59
71 72 79 89
101 142 145 180
190 203 242 258
261 269 278 281
292 379 387 390
392 399 401 415
MEASUREMENTS HV-ORANGE-RED, NEW
0.330
0.340
0.350
0.360
0.370
0.380
0.390
0.400
0.480 0.500 0.520 0.540 0.560 0.580 0.600 0.620 0.640 0.660
y
x
Corner Mark 35 44 59
71 72 79 89
101 142 180 203
242 258 261 269
278 281 292 379
387 401 415
MEASUREMENTS HV-ORANGE-RED, EXPOSED
0.330
0.340
0.350
0.360
0.370
0.380
0.390
0.400
0.520 0.540 0.560 0.580 0.600 0.620 0.640 0.660
y
xCorner Mark 35 44 59
71 72 79 89
101 142 145 180
190 203 241 258
261 269 278 281
292 379 387 390
392 399 401 415
MEASUREMENTS HV-ORANGE-RED, AFTER AGEING

RUNDTEST Function No. 7
Zürich, 04.01.2017 / Version 1.1 Page 12 ©TESTEX AG, Gotthardstrasse 61, CH‐8027 Zürich
Farbmessung Hintergrundmaterial / Colour measurement background material EN ISO 20471:2013
-8%
-6%
-4%
-2%
0%
2%
4%
6%
8%
35
44
59
71
72
79
89
101
145
180
190
203
242
258
261
269
278
281
292
379
387
390
392
399
401
415
Lab code
Luminance factor: Deviation to mean value in % NEW HV-ORANGE-RED
-10.0%
-7.5%
-5.0%
-2.5%
0.0%
2.5%
5.0%
7.5%
10.0%
35
44
59
71
72
79
89
101
180
203
242
258
261
269
278
281
292
379
387
401
415
Lab code
Luminance factor: Deviation to mean value in % EXPOSED TO LIGHT HV-ORANGE-RED
-10.0%
-7.5%
-5.0%
-2.5%
0.0%
2.5%
5.0%
7.5%
10.0%
35
44
59
71
72
79
89
101
145
180
190
203
241
258
261
269
278
281
292
379
387
390
392
399
401
415
Lab code
Luminance factor: Deviation to mean value in % AFTER AGEING HV-ORANGE-RED

RUNDTEST Function No. 7
Farbmessung Hintergrundmaterial / Colour measurement background material EN ISO 20471:2013
Zürich, 04.01.2017 / Version 1.1 Page 13 ©TESTEX AG, Gotthardstrasse 61, CH‐8027 Zürich
Muster: Gewebe 55% Protex / 43% CO / 2% Negastat, Farbe Warngelb Sample: Woven fabric 55% Protex / 43% CO / 2% Negastat, colour Hi-Vis yellow
Lab Code
Testing equipment
No. of tests
(in each condition)
Results NEW Results EXPOSED TO LIGHT Results AFTER AGEING
⌀ Chroma-ticy [x]
⌀ Chroma-ticy [y]
⌀ luminancefactor
[ ß min] z-score
⌀ Chroma-ticy [x]
⌀ Chroma-ticy [y]
⌀ luminance factor
[ ß min] z-score
⌀ Chroma-ticy [x]
⌀ Chroma-ticy [y]
⌀ luminance factor
[ ß min] z-score
35 Konica Minolta CM-2500c 3 0.3790 0.5190 0.9000 -0.28 0.3740 0.4940 0.8440 1.22 0.3790 0.5220 0.9020 -0.09 44 Gretag Macbeth 2145 4 0.3814 0.5186 0.8940 -0.50 0.3746 0.4805 0.8075 -0.14 0.3823 0.5182 0.8652 -1.32 59 Konica Minolta CM-2500c 1 0.3777 0.5187 0.9100 0.07 0.3678 0.4647 0.8000 -0.42 0.3767 0.5203 0.9100 0.17 71 Konica Minolta CM-2500c 4 0.3786 0.5203 0.9197 0.42 0.3732 0.4793 0.8180 0.25 0.3775 0.5203 0.9102 0.18 72 Konica Minolta CM-2500c 4 0.3820 0.5146 o 0.8621 -1.63 0.3681 0.4425 x 0.7318 -2.95 0.3779 0.5168 o 0.8352 -2.31 79 Konica Minolta CM-2500 4 0.3795 0.5206 0.9306 0.81 0.3702 0.4601 0.7975 -0.51 0.3793 0.5232 0.9024 -0.08 89 Datacolor 245 4 0.3795 0.5228 0.9400 1.14 0.3723 0.4786 0.8300 0.70 0.3782 0.5235 0.9500 1.50
101 Konica Minolta CM-2500cCT 4 0.3800 0.5198 0.9000 -0.28 0.3724 0.4821 0.8200 0.33 0.3790 0.5209 0.9000 -0.16 142 Hunterlab 5 0.3940 0.5130 x 1.0000 3.28 0.3740 0.4330 0.8000 -0.42 0.3910 0.5180 x 0.9900 2.83 145 Datacolor DC 245 3 0.3838 0.5218 o 0.9502 1.51 0.3810 0.5238 0.9477 1.42 180 Konica Minolta CM-2500c 5 0.3877 0.5270 0.9050 -0.10 0.3701 0.4470 0.7880 -0.86 0.3820 0.5194 0.9140 0.30 190 Konica Minolta CM-3600a 3 0.3830 0.5160 0.9030 -0.18 0.3790 0.5180 0.8710 -1.12 203 Hunterlab ColorFlex EZ 5 0.3783 0.5207 0.9100 0.07 0.3660 0.4518 0.7800 -1.16 0.3773 0.5219 0.8900 -0.49 241 Konica Minolta CM-2500c 3 0.3761 0.5227 0.9296 0.82 242 Konica Minolta CM-2500c 3 0.3950 0.5100 o 0.8500 -2.07 0.3790 0.4600 o 0.7600 -1.90 0.3840 0.5120 x 0.8000 -3.48 258 Perkin Elmer 4 0.3797 0.5177 0.8888 -0.68 0.3668 0.4521 0.7744 -1.37 0.3799 0.5180 0.8919 -0.43 261 Konica Minolta CM-2500c 6 0.3822 0.5155 0.8773 -1.09 0.3784 0.4944 0.8233 0.45 0.3807 0.5196 0.8975 -0.24 269 Hunterlab ColorFlex EZ 2 0.3790 0.5210 0.9300 0.79 0.3742 0.4870 0.8400 1.07 0.3798 0.5231 0.9300 0.84 278 Hunterlab ColorFlex EZ 5 0.3813 0.5205 o 0.9613 1.90 0.3750 0.4754 0.8489 1.40 0.3768 0.5240 0.9327 0.92 281 Konica Minolta CM-2500c 6 0.3772 0.5199 0.9130 0.18 0.3689 0.4678 0.8020 -0.34 0.3776 0.5209 0.9040 -0.03 292 Hunterlab ColorFlex EZ 3 0.3783 0.5213 0.9000 -0.28 0.3744 0.4839 0.8200 0.33 0.3775 0.5245 0.9200 0.50 379 Hunterlab ColorFlex EZ 4 0.3780 0.5220 0.9300 0.79 0.3720 0.4810 0.8300 0.70 0.3760 0.5210 0.9200 0.50 387 Hunterlab EZ 4 0.3775 0.5207 0.9300 0.79 0.3712 0.4998 x 0.8800 2.56 0.3803 0.5229 0.9100 0.17 390 Konica Minolta CM-2500c 10 0.3799 0.5174 0.8949 -0.46 0.3806 0.5210 0.8918 -0.43 392 Datacolor CS-3 3 0.3805 0.5098 0.9000 -0.28 0.3786 0.5131 0.9000 -0.16 399 Hunterlab MiniScan EZ 6 0.3776 0.5227 0.9166 0.31 0.3755 0.5216 0.9210 0.54 401 Konica Minolta CM-2500c 4 0.3970 0.5110 o 0.8500 -2.07 0.3830 0.4720 0.7800 -1.16 0.3960 0.5110 o 0.8300 -2.49 415 x-rite coliori7 spectrophom. 3 0.3986 0.5100 0.9400 1.14 0.3867 0.4725 o 0.8600 1.81 0.3975 0.5114 0.9500 1.50
n 26 20 26 Ø 0.908 0.811 0.905 s 0.028 0.027 0.030 CV % 3.09 3.32 3.33
(x) unexpected value (o) beyond control limit

RUNDTEST Function No. 7
Farbmessung Hintergrundmaterial / Colour measurement background material EN ISO 20471:2013
Zürich, 04.01.2017 / Version 1.1 Page 14 ©TESTEX AG, Gotthardstrasse 61, CH‐8027 Zürich
0.440
0.460
0.480
0.500
0.520
0.540
0.560
0.580
0.600
0.620
0.350 0.370 0.390 0.410 0.430 0.450 0.470
y
x
MEASUREMENTS HV-YELLOW, NEW
Corner Mark 35 44 59
71 72 79 89
101 142 145 180
190 203 242 258
261 269 278 281
292 379 387 390
392 399 401 415
0.420
0.440
0.460
0.480
0.500
0.520
0.540
0.560
0.580
0.600
0.620
0.350 0.370 0.390 0.410 0.430 0.450 0.470
y
x
MEASUREMENTS HV-YELLOW, EXPOSED
Corner Mark 35 44 59
71 72 79 89
101 142 180 203
242 258 261 269
278 281 292 379
387 401 415
0.440
0.460
0.480
0.500
0.520
0.540
0.560
0.580
0.600
0.620
0.350 0.370 0.390 0.410 0.430 0.450 0.470
y
x
MEASUREMENTS HV-YELLOW, AFTER AGEING
Corner Mark 35 44 5971 72 79 89101 142 145 180190 203 241 242258 261 269 278281 292 379 387390 392 399 401415

RUNDTEST Function No. 7
Zürich, 04.01.2017 / Version 1.1 Page 15 ©TESTEX AG, Gotthardstrasse 61, CH‐8027 Zürich
Farbmessung Hintergrundmaterial / Colour measurement background material EN ISO 20471:2013
-8%
-6%
-4%
-2%
0%
2%
4%
6%
8%
35 44 59 71 72 79 89
101
145
180
190
203
242
258
261
269
278
281
292
379
387
390
392
399
401
415
Lab code
Luminance factor: Deviation to mean value in % NEW HV-YELLOW
-8%
-6%
-4%
-2%
0%
2%
4%
6%
8%
35
44
59
71
79
89
101
142
180
203
242
258
261
269
278
281
292
379
401
415
Lab code
Luminance factor: Deviation to mean value in % EXPOSED TO LIGHT HV- YELLOW
-8%
-6%
-4%
-2%
0%
2%
4%
6%
8%
35 44 59 71 72 79 89
101
145
180
190
203
241
258
261
269
278
281
292
379
387
390
392
399
401
415
Lab code
Luminance factor: Deviation to mean value in % AFTER AGEING HV-YELLOW

RUNDTEST Function No. 7
Elektrostatische Eigenschaften / Electrostatic properties EN 1149‐5
Zürich, 04.01.2017 / Version 1.1 Page 16 ©TESTEX AG, Gotthardstrasse 61, CH‐8027 Zürich
Muster: 1149-1= Gewebe 39%MAC/35%CLY/17%CO/8%PA/1%CF, Farbe Dunkelblau 1149-3= Gewebe 55%Protex/43%CO/2%Negastat, Farbe Warngelb Sample: 1149-1= Woven fabric 39%MAC/35%CLY/17%CO/8%PA/1%CF, colour navy blue 1149-3= Woven fabric 55%Protex/43%CO/2%Negastat, colour Hi-Vis yellow
Lab Code
Testing equipment conditioning
time [h]
testing temp. [ oC]
humidity rel. [%]
No. of tests per
sample
EN 1149-1 EN 1149-3 (method 2)
⌀ Resistance [Ω]
⌀Resistance value in milliions
[Ω] =>106
z-score
Fulfils requirement
of 1149-5 [Y/ N]
⌀ Shield factor
S
z-score
⌀ Half decay time
T50 [s]
Fulfils requirement
of 1149-5 [Y/ N]
35 Ohmmeter / IMC-1 24 23 25 5 / 3 4.85*10^11 485000 -0.33 NO 0.77 -0.85 <0.01 YES 44 SDL Atlas / STFI-ICM 24 23 25 5 / 3 4.51*10^10 45100 -0.50 NO 0.81 1.10 <0.01 YES 59 Ohmmeter 4329A 24 23 25 5 1.70*10^11 170000 -0.45 NO 71 HP 4339B / ICM-1 24 23 25 5 1.30*10^11 130000 -0.47 NO 0.81 1.10 <0.01 YES 72 High Resistance Meter / ICM-1 24 / 48 22 28 5 4.00*10^12 4000000 1.07 NO 0.79 0.12 <0.01 YES 79 Keithley 6517A 24 23 25 5 2.58*10^11 258000 -0.42 NO 79 Keithley 610C / ICM 24 23 25 5 / 3 2.62*10^11 262000 -0.42 NO 0.78 -0.37 <0.01 YES 89 Milli - TO / ICM 24 23 25 5 1.67*10^11 167000 -0.45 NO 0.80 0.61 <0.01 YES
101 Tera-Ohm-Meter 291B 24 23 25 5 4.07*10^11 407000 -0.36 NO 145 ICM-1 48 22 20 3 0.79 0.12 <0.01 YES 181 Ohmmeter HM 306 72 22 27 5 2.80*10^11 280000 -0.41 NO 190 MESDAN LAB Conductivity Tester 24 23 25 5 3.50*10^10 35000 -0.51 NO 203 Tera-Ohmmeter TO-3 24 23 25 5 5.89*10^11 589000 -0.29 NO 212 High Resistance Meter 24 24 26 5 o 6.00*10^12 6000000 1.86 NO 233 Sefelec M 1501 M / ICM-1 24 23 25 5 / 3 6.30*10^11 630000 -0.27 NO 0.75 -1.83 <0.01 YES 242 Tera-Ohmmeter TQ3 48 23 25 5 x 2.90*10^13 29000000 11.00 NO 261 Agilient High Resistance Meter 24 23 25 10 7.28*10^10 72800 -0.49 NO 269 CHT 3530 24 23 25 5 1.00*10^11 100000 -0.48 NO 284 Electrostatic Properties Tester 24 23 25 5 5.73*10^10 57300 -0.50 NO 292 Ultra Megohmmeter SM-8220 24 23 25 5 1.85*10^11 185000 -0.45 NO 379 Burst Megohmmeter Resistomat 24 23 25 5 1.45*10^11 145000 -0.46 NO 387 ISOL 100 N 24 23 25 5 o 5.35*10^12 5350000 1.61 NO 390 Seflec megometer M1500M 24 23 25 10 o 9.41*10^12 9410000 3.22 NO 399 Tera Ohmmeter Milli TO3 24 23 30 5 1.22*10^10 12200 -0.52 NO
n 22 8
Ø 1308655 0.79
s 2516641 0.02
CV % 192 2.61
(x) unexpected value (o) beyond control limit

RUNDTEST Function No. 7
Zürich, 04.01.2017 / Version 1.1 Page 17 ©TESTEX AG, Gotthardstrasse 61, CH‐8027 Zürich
Schutzkleidung ‐ Prüfverfahren für die begrenzte Flammenausbildung Protective clothing ‐ Method for limited flame spread
Verfahren A ‐ ISO 15025 ‐ Procedure A
Muster: Gewebe, 98% Trevira / 2% CF, Farbe Grau Sample: Woven fabric, 98% Trevira / 2% CF, colour grey
Lab Code
Testing equipment Type of
gas used
Climate condition Allocation of Index EN ISO
14116:2015 new condition
Washing condition Allocation of Index EN ISO
14116:2015 after washing
Temp. [°C]
rel. humidity
[%] standard used
proce-dure
Temp. [°C]
35 Flexi Burn James Heal Propane 22 45 Index 1 ISO 6330 6N 60 Index 1
44 Flexiburn Propane 19 64 Index 1 ISO 6330:2012 6N, F 60 Index 1
59 Öti equipment engineering Propane 24 32 Index 1 ISO 6330 6N 60 Index 1
71 Flexiburn Propane 20 65 Index 1 ISO 6330:2013 6N, F 60 Index 1
72 EQ 284 - Flame propagation Propane 23 56 Index 1 ISO 6330 6N 60 Index 1
79 ? ? ? ? Index 1 ISO 6330 6N 60 Index 1
84 ? Propane 21 62 Index 1 ISO 6330 6N, F 60 Index 1
85 Swerea IVF Propane 20 19 Index 1 ISO 6330:2012 6N 60 Index 1
89 Flexi Burn James Heal Propane 21 65 Index 1 ISO 6330:2013 6N, F 60 Index 1
91 Intern manual equipment Propane 21 45 Index 1 ISO 6330:2012 6N, F 60 Index 1
101 Rhoburn Tester J.H. 480 Propane 18 57 Index 1 ISO 6330:2012 6N, F 60 Index 1
142 SDL Flamability Tester Propane 20 65 Index 1 ISO 6330 6N 60 Index 1
145 Flexiburn Propane 20 65 Index 1 ISO 6330:2013 6N 60 Index 1
190 SDL Autom. Flammability Tester Butane 21 41 Index 1 ISO 6330:2012 6N 60 Index 1
203 Flexiburn Propane 20 65 Index 1 ISO 6330:2013 ? 60 Index 1
233 Burning chamber Atlas Propane 24 45 Index 1 ISO 6330 6M 60 Index 1
241 Burning chamber Prop./But. 22 25 Index 1 ISO 6330 6N 60 Index 1
242 Burning chamber Propane 23 45 Index 1 ISO 6330:2012 6N 60 Index 1
244 WAZAU ? ? ? Index 1 ISO 6330 6N 60 Index 1
261 Flexiburn Butane 23 65 Index 1 ISO 6330:2012 6N 60 Index 1
269 ? Propane 20 65 Index 1 ISO 6330 2A 60 Index 1
272 Selfmade equipment Propane 20 65 Index 1 ISO 6330:2013 6M 60 Index 1
278 Flexi Burn James Heal Propane 21 69 Index 1 ISO 6330 6N 60 Index 1
292 FlexiBurn Flammablilty Tester Propane 23 46 Index 1 ISO 6330:2012 6N 60 Index 1
303 Selfmade equipment Prop./But. 21 40 Index 1 ISO 6330:2012 6N 60 Index 1
376 ? ? ? ? Index 3 ? ? ? Index 3
379 Flexi Burn James Heal Butane 20 65 Index 1 ISO 6330:2012 6N 60 Index 1
387 ? Propane 20 50 Index 1 ISO 6330 6N 60 Index 1
389 ? But./Prop. 23 36 Index 1 ISO 6330 6N, F 60 Index 1
390 Rhoburn Propane 22 38 x ISO 6330 6N 60 x
392 Burning chamber Wazau Propane 20 65 Index 1 ISO 6330:2013 6N, F 60 Index 1
397 Flammability Tester Propane 21 69 Index 1 ISO 6330 ? 60 Index 1
399 Selfmade equipment Propane 21 53 Index 1 ISO 6330 6N 60 Index 1
401 Rhoburn Propane 20 65 Index 1 ISO 6330:2012 6N 60 Index 1
Total x 1 Total x 1
Total Index 1 32 Total Index 1 32
Total Index 2 0 Total Index 2 0
Total Index 3 1 Total Index 3 1
x = no classification possible due to non-fulfilment of requirements

RUNDTEST Function No. 7
Protective clothing ‐ Method for limited flame spread ISO 15025 ‐ Procedure A
Zürich, 04.01.2017 / Version 1.1 Page 18 ©TESTEX AG, Gotthardstrasse 61, CH‐8027 Zürich
Muster: Gewebe, 98% Trevira / 2% CF, Farbe Grau Neuzustand / New condition Sample: Woven fabric, 98% Trevira / 2% CF, colour grey
N = no, Y = yes
Lab Code 35 44 59 71 72 79 84 85 89 91 101 142 145 190 203 233 241 242 244 261 269 272 278 292 303 376 379 387 389 390 392 397 399 401
Does the flame reach upper or vertical edge of
specimen?
War
p
1 N N N N N N N N N N N N N N N N N N N N N N N N N N N N N N N N N N 2 N N N N N N N N N N N N N N N N N N N N N N N N N N N N N N N N N N 3 N N N N N N N N N N N N N N N N N N N N N N N N N N N N N N N N N N
Wef
t 1 N N N N N N N N N N N N N N N N N N N N N N N N N N N N N N N N N N 2 N N N N N N N N N N N N N N N N N N N N N N N N N N N N N N N N N N 3 N N N N N N N N N N N N N N N N N N N N N N N N N N N N N N N N N N
Afterflame time [s]
War
p
1 0 0 0 0 0 0 0 7 0 0 0 2 9.6 0 0 0 0 0 0 0 0 0 0 0 2 0 0 0 0 0 0 0 0 0 2 0 0 0 0 0 0 0 6 0 0 0 2 0 0 0 0 0 0 0 0 0 0 0 0 2 0 0 0 0 0 0 0 0 0 3 0 0 17 0 0 0 0 0 0 0 0 2 0 0 0 0 0 0 0 0 0 0 0 0 2 0 0 0 0 25 0 0 0 0
Wef
t 1 0 0 0 0 0 0 0 0 0 0 4 2 0 0 0 0 0 0 0 0 0 0 0 0 2 0 0 0 10 15 0 0 0 0 2 0 0 0 0 0 0 0 2 0 0 0 2 0 0 0 0 0 0 0 0 0 0 0 0 5 0 0 0 0 0 0 0 0 0 3 0 0 0 0 0 0 0 0 0 0 0 2 0 0 0 0 0 0 0 0 0 0 0 0 2 0 0 0 0 0 0 0 0 0
Does afterglow spread beyond flame spread
area?
War
p
1 N N N N N N N N N N N N N N N N N N N N N N N N N N N N N N N N N N 2 N N N N N N N N N N N N N N N N N N N N N N N N N N N N N N N N N N 3 N N N N N N N N N N N N N N N N N N N N N N N N N N N N N N N N N N
Wef
t 1 N N N N N N N N N N N N N N N N N N N N N N N N N N N N N N N N N N 2 N N N N N N N N N N N N N N N N N N N N N N N N N N N N N N N N N N 3 N N N N N N N N N N N N N N N N N N N N N N N N N N N N N N N N N N
Afterglow time [s]
War
p
1 0 0 0 0 0 0 0 0 0 0 0 2 0 0 0 0 0 0 0 0 0 0 0 0 2 0 0 0 0 0 0 0 0 0 2 0 0 0 0 0 0 0 0 0 0 0 2 0 0 0 0 0 0 0 0 0 0 0 0 2 0 0 0 0 0 0 0 0 0 3 0 0 0 0 0 0 0 0 0 0 0 2 0 0 0 0 0 0 0 0 0 0 0 0 2 0 0 0 0 1.1 0 0 0 0
Wef
t 1 0 0 0 0 0 0 0 0 0 0 0 2 0 0 0 0 0 0 0 0 0 0 0 0 2 0 0 0 0 0 0 0 0 0 2 0 0 0 0 0 0 0 0 0 0 0 2 0 0 0 0 0 0 0 0 0 0 0 0 2 0 0 0 0 2.6 0 0 0 0 3 0 0 0 0 0 0 0 0 0 0 0 2 0 0 0 0 0 0 0 0 0 0 0 0 2 0 0 0 0 0 0 0 0 0
Occurrence of debris?
War
p
1 N N N N N N N N N N N N N N N N N N N N N N N N N N N N N N N N N N 2 N N N N N N N N N N N N N N N N N N N N N N N N N N N N N N N N N N 3 N N N N N N N N N N N N N N N N N N N N N N N N N N N N N N N N N N
Wef
t 1 N N N N N N N N N N N N N N N N N N N N N N N N N N N N N N N N N N 2 N N N N N N N N N N N N N N N N N N N N N N N N N N N N N N N N N N 3 N N N N N N N N N N N N N N N N N N N N N N N N N N N N N N N N N N
Do debris ignite filter
paper (flaming debris)?
War
p
1 N N N N N N N N N N N N N N N N N N N N N N N N N N N N N N N N N N 2 N N N N N N N N N N N N N N N N N N N N N N N N N N N N N N N N N N 3 N N N N N N N N N N N N N N N N N N N N N N N N N N N N N N N N N N
Wef
t 1 N N N N N N N N N N N N N N N N N N N N N N N N N N N N N N N N N N 2 N N N N N N N N N N N N N N N N N N N N N N N N N N N N N N N N N N 3 N N N N N N N N N N N N N N N N N N N N N N N N N N N N N N N N N N
Hole develo-ped?
War
p
1 Y Y Y Y Y Y Y Y Y Y Y Y Y Y Y Y Y Y Y Y Y Y Y Y Y N Y Y Y Y Y Y Y Y 2 Y Y Y Y Y Y Y Y Y Y Y Y Y Y Y Y Y Y Y Y Y Y Y Y Y N Y Y Y Y Y Y Y Y 3 Y Y Y Y Y Y Y Y Y Y Y Y Y Y Y Y Y Y Y Y Y Y Y Y Y N Y Y Y Y Y Y Y Y
Wef
t 1 Y Y Y Y Y Y Y Y Y Y Y Y Y Y Y Y Y Y Y Y Y Y Y Y Y N Y Y Y Y Y Y Y Y 2 Y Y Y Y Y Y Y Y Y Y Y Y Y Y Y Y Y Y Y Y Y Y Y Y Y N Y Y Y Y Y Y Y Y 3 Y Y Y Y Y Y Y Y Y Y Y Y Y Y Y Y Y Y Y Y Y Y Y Y Y N Y Y Y Y Y Y Y Y

RUNDTEST Function No. 7
Protective clothing ‐ Method for limited flame spread ISO 15025 ‐ Procedure A
Zürich, 04.01.2017 / Version 1.1 Page 19 ©TESTEX AG, Gotthardstrasse 61, CH‐8027 Zürich
Muster: Gewebe, 98% Trevira / 2% CF, Farbe Grau Gewaschen / Washed condition Sample: Woven fabric, 98% Trevira / 2% CF, colour grey
N = no, Y = yes
Lab Code 35 44 59 71 72 79 84 85 89 91 101 142 145 190 203 233 241 242 244 261 269 272 278 292 303 376 379 387 389 390 392 397 399 401
Does the flame reach upper or vertical edge of
specimen?
War
p
1 N N N N N N N N N N N N N N N N N N N N N N N N N N N N N N N N N N 2 N N N N N N N N N N N N N N N N N N N N N N N N N N N N N N N N N N 3 N N N N N N N N N N N N N N N N N N N N N N N N N N N N N N N N N N
Wef
t 1 N N N N N N N N N N N N N N N N N N N N N N N N N N N N N N N N N N 2 N N N N N N N N N N N N N N N N N N N N N N N N N N N N N N N N N N 3 N N N N N N N N N N N N N N N N N N N N N N N N N N N N N N N N N N
Afterflame time [s]
War
p
1 0 0 0 0 0 0 0 0 0 0 2 2 0 0 0 0 0 0 0 0 0 0 0 0 2 0 0 0 0 0 0 0 0 0 2 0 0 0 0 0 0 0 0 0 0 0 2 0 0 0 0 0 0 0 0 0 0 0 0 2 0 0 0 0 15 0 0 0 0 3 0 0 0 0 0 18 0 0 0 0 0 2 0 0 0 0 0 0 0 0 0 0 0 0 2 0 0 0 0 0 0 0 6 0
Wef
t 1 0 0 0 0 0 0 0 0 0 0 0 2 0 0 0 0 0 0 0 0 0 0 0 0 2 0 0 0 0 14 0 0 0 0 2 0 0 0 0 0 7 0 0 0 0 0 2 0 0 0 0 0 0 0 0 0 0 0 0 2 0 0 0 0 2.2 0 0 0 0 3 0 0 0 0 0 5 0 0 0 0 0 2 7.1 0 0 0 0 0 0 0 0 0 0 0 2 0 0 0 0 9.5 0 0 19 0
Does afterglow spread beyond flame spread
area?
War
p
1 N N N N N N N N N N N N N N N N N N N N N N N N N N N N N N N N N N 2 N N N N N N N N N N N N N N N N N N N N N N N N N N N N N N N N N N 3 N N N N N N N N N N N N N N N N N N N N N N N N N N N N N N N N N N
Wef
t 1 N N N N N N N N N N N N N N N N N N N N N N N N N N N N N N N N N N 2 N N N N N N N N N N N N N N N N N N N N N N N N N N N N N N N N N N 3 N N N N N N N N N N N N N N N N N N N N N N N N N N N N N N N N N N
Afterglow time [s]
War
p
1 0 0 0 0 0 0 0 0 0 0 0 2 0 0 0 0 0 0 0 0 0 0 0 0 2 0 0 0 0 0 0 0 0 0 2 0 0 0 0 0 0 0 0 0 0 0 2 0 0 0 0 0 0 0 0 0 0 0 0 2 0 0 0 0 0 0 0 0 0 3 0 0 0 0 0 0 0 0 0 0 0 2 0 0 0 0 0 0 0 0 0 0 0 0 2 0 0 0 0 0 0 0 0 0
Wef
t 1 0 0 0 0 0 0 0 0 0 0 0 2 0 0 0 0 0 0 0 0 0 0 0 0 2 0 0 0 0 1.2 0 0 0 0 2 0 0 0 0 0 0 0 0 0 0 0 2 0 0 0 0 0 0 0 0 0 0 0 0 2 0 0 0 0 2.2 0 0 0 0 3 0 0 0 0 0 0 0 0 0 0 0 2 0 0 0 0 0 0 0 0 0 0 0 0 2 0 0 0 0 1.7 0 0 0 0
Occurrence of debris?
War
p
1 N N N N N N N N N N N N N N N N N N N N N N N N N N N N N N N N N N 2 N N N N N N N N N N N N N N N N N N N N N N N N N N N N N N N N N N 3 N N N N N N N N N N N N N N N N N N N N N N N N N N N N N N N N N N
Wef
t 1 N N N N N N N N N N N N N N N N N N N N N N N N N N N N N N N N N N 2 N N N N N N N N N N N N N N N N N N N N N N N N N N N N N N N N N N 3 N N N N N N N N N N N N N N N N N N N N N N N N N N N N N N N N N N
Do debris ignite filter paper (flaming de-
bris)?
War
p
1 N N N N N N N N Y N N N N N N N N N N N N N N N N N N N N N N N N N 2 N N N N N N N N N N N N N N N N N N N N N N N N N N N N N N N N N N 3 N N N N N N N N N N N N N N N N N N N N N N N N N N N N N N N N N N
Wef
t 1 N N N N N N N N N N N N N N N N N N N N N N N N N N N N N N N N N N 2 N N N N N N N N N N N N N N N N N N N N N N N N N N N N N N N N N N 3 N N N N N N N N N N N N N N N N N N N N N N N N N N N N N N N N N N
Hole develo-ped?
War
p
1 Y Y Y Y Y Y Y Y Y Y Y Y Y Y Y Y Y Y Y Y Y Y Y Y Y N Y Y Y Y Y Y Y Y 2 Y Y Y Y Y Y Y Y Y Y Y Y Y Y Y Y Y Y Y Y Y Y Y Y Y N Y Y Y Y Y Y Y Y 3 Y Y Y Y Y Y Y Y Y Y Y Y Y Y Y Y Y Y Y Y Y Y Y Y Y N Y Y Y Y Y Y Y Y
Wef
t 1 Y Y Y Y Y Y Y Y Y Y Y Y Y Y Y Y Y Y Y Y Y Y Y Y Y N Y Y Y Y Y Y Y Y 2 Y Y Y Y Y Y Y Y Y Y Y Y Y Y Y Y Y Y Y Y Y Y Y Y Y N Y Y Y Y Y Y Y Y 3 Y Y Y Y Y Y Y Y Y Y Y Y Y Y Y Y Y Y Y Y Y Y Y Y Y N Y Y Y Y Y Y Y Y

RUNDTEST Function No. 7
Zürich, 04.01.2017 / Version 1.1 Page 20 ©TESTEX AG, Gotthardstrasse 61, CH‐8027 Zürich
Kommentare & Anregungen General comments & Inputs
Type of Test Lab
Code Feedback
ISO 11092 Ret & Rct 44 Sample no. 2 for thermal resistance and water vapour resistance test is difficult to handle due to the loose filling.
EN 20811 (ISO 811) 59 Maximum measuring range of testing equipment is 200mbar
ISO 9237 241 ø [l/m2s]: >1430
ISO 9237 376 ø [l/m2s]: >1113.30

RUNDTEST Function No. 7
Zürich, 04.01.2017 / Version 1.1 Page 21 ©TESTEX AG, Gotthardstrasse 61, CH‐8027 Zürich
Lexikon / Dictionary Abkürzungen Abbreviations
English Deutsch
n Ø s CV% Ret [m2Pa/W] Rct [m2 K/W] [ß min] Resistance R [Ω] Resistivity ρ [Ω] [Ω] =>106 Hi‐Vis
Number of values Mean value Standard deviation Coefficient of variation (%) squaremeter Pascal per Watt squaremeter Kelvin per Watt Minimum luminance factor Surface resistance measured Surface resistivity calculated Resistivity values in millions High visibility allocation chromaticity humidity rel. % increase pressure pressure speed sample patched shield factor testing equipment underinflation water temperature z‐score
Anzahl Werte Mittelwert Standardabweichung Variationskoeffizient (%) Quadratmeter Pascal je Watt Quadratmeter Kelvin je Watt Mindestleuchtdichtefaktor Oberflächenwiderstand gemessen spezifischer Oberflächenwiderstand Oberflächenwiderstand in Millionen Sehr hohe Sichtbarkeit Zuweisung Farbwert Feuchtigkeit in % Steigdruck Druckgeschwindigkeit Musterabschnitte Abschirmfaktor Prüfgerät Unterdruck Wassertemperatur z‐Wert

RUNDTEST Function No. 7
Zürich, 04.01.2017 / Version 1.1 Page 22 ©TESTEX AG, Gotthardstrasse 61, CH‐8027 Zürich
Änderungen revidierte Version 1.1 / Amendments revised version 1.1
Aufgrund einiger zusätzlichen Ergebnisse und An‐gaben (2 Labors) sowie einigen korrigierten Ergeb‐nissen und Angaben (4 Labors), welche uns zuge‐sandt wurden, haben wir die Auswertung bei fol‐genden Prüfungen/Angaben angepasst: *Wasserdurchgangswiderstand *Wasserdampf‐/Wärmedurchgangswiderstand *Luftdurchlässigkeit *Farbmessung Hintergrundmaterial *Elektrostatische Eigenschaften *Begrenzte Flammenausbildung
*Zusätzliche oder korrigierte Ergebnisse ‐ Keine oder nur geringfügige Veränderung der statisti‐schen Angaben. °Zusätzliche oder korrigierte Angaben ‐ Keine Ver‐änderung der statistischen Angaben. Korrektur in der Berechnung ‐ Veränderung der statistischen Angaben
Due to some additional results and specifications (2 labs) as well as some corrected results and spec‐ifications (4 labs) received, we have amended the evaluation of the following tests/specifications: *Resistance to water penetration *Watervapour resistance/Thermal resistance *Permeability to air *Colour measurement background material *Electrostatic properties *Limited flame spread
*Additional or corrected results ‐ No or only minor changes of the statistical data. °Additional or corrected specifications ‐ No chang‐es of the statistical data. Correction of the calculation ‐ Changes of the statistical data
REPORT EVALUATED BY / AUSGEWERTET DURCH:
Chantal Blanc / Industrial & Institute Service
REPORT APPROVED BY / FREIGEGEBEN DURCH:
Adrian Meili / Manager Industrial & Institute Service
REPORT REVISED ON / BERICHT REVIDIERT AM: 04.01.2017
Related Documents


