Runcharts 101 Geoff Schierbeck Quality Leader Surgery BCPSQC

Welcome message from author
This document is posted to help you gain knowledge. Please leave a comment to let me know what you think about it! Share it to your friends and learn new things together.
Transcript

Runcharts 101
Geoff SchierbeckQuality Leader SurgeryBCPSQC

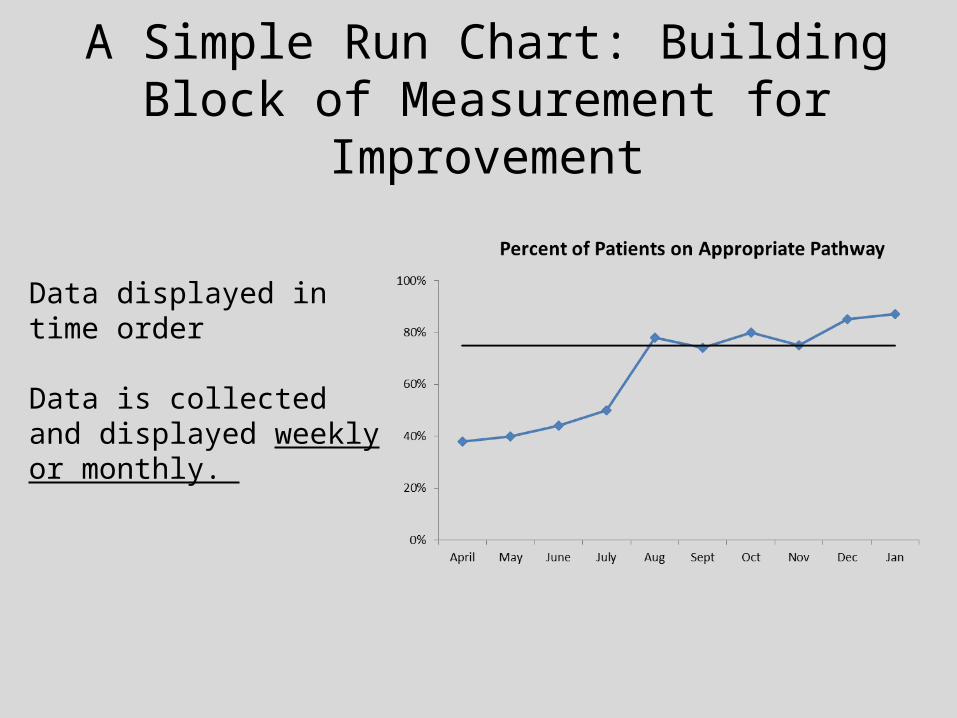
A Simple Run Chart: Building Block of Measurement for Improvement
Data displayed in time order
Data is collected and displayed weekly or monthly.
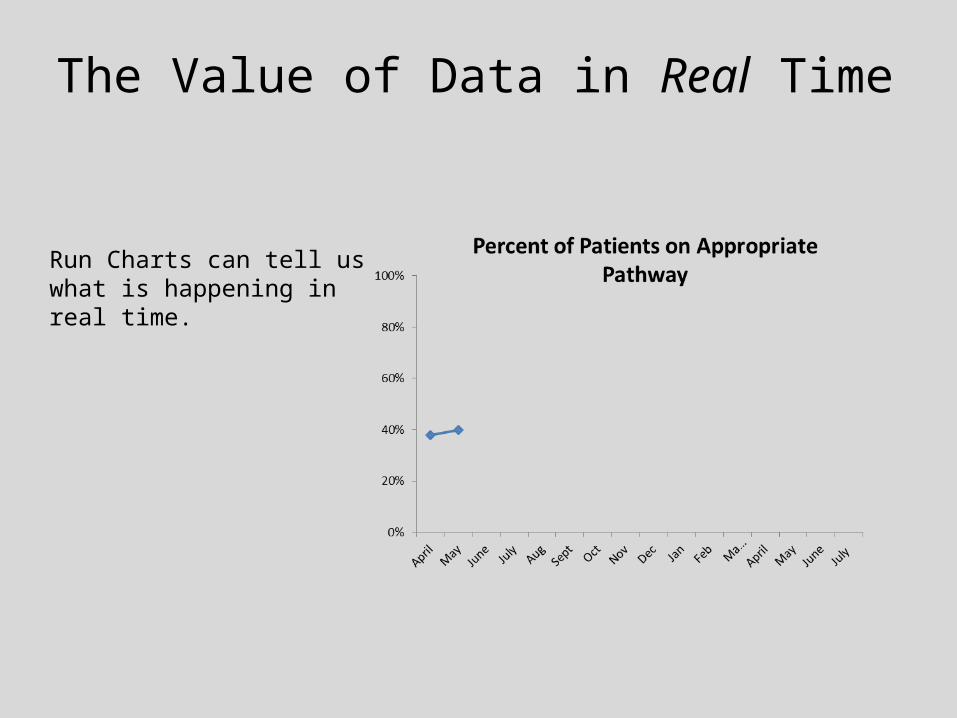
Run Charts can tell us what is happening in real time.
The Value of Data in Real Time

Why not before and after?
Adapted from Health Care Data Guide, p. 16 Figure 1.5 and 1.6 , Provost and Murray, 2011. San Francisco: Jossey Boss

Scenario 1
Adapted from Health Care Data Guide, p. 16 Figure 1.5 and 1.6 , Provost and Murray, 2011. San Francisco: Jossey Boss

Scenario 2
Adapted from Health Care Data Guide, p. 16 Figure 1.5 and 1.6 , Provost and Murray, 2011. San Francisco: Jossey Boss
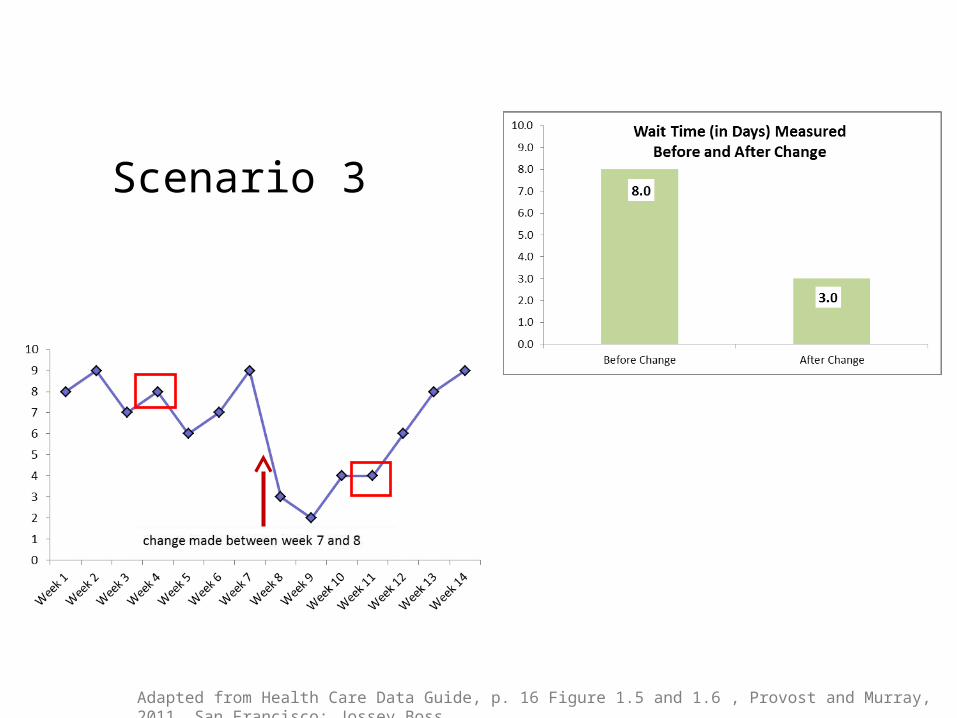
Scenario 3
Adapted from Health Care Data Guide, p. 16 Figure 1.5 and 1.6 , Provost and Murray, 2011. San Francisco: Jossey Boss
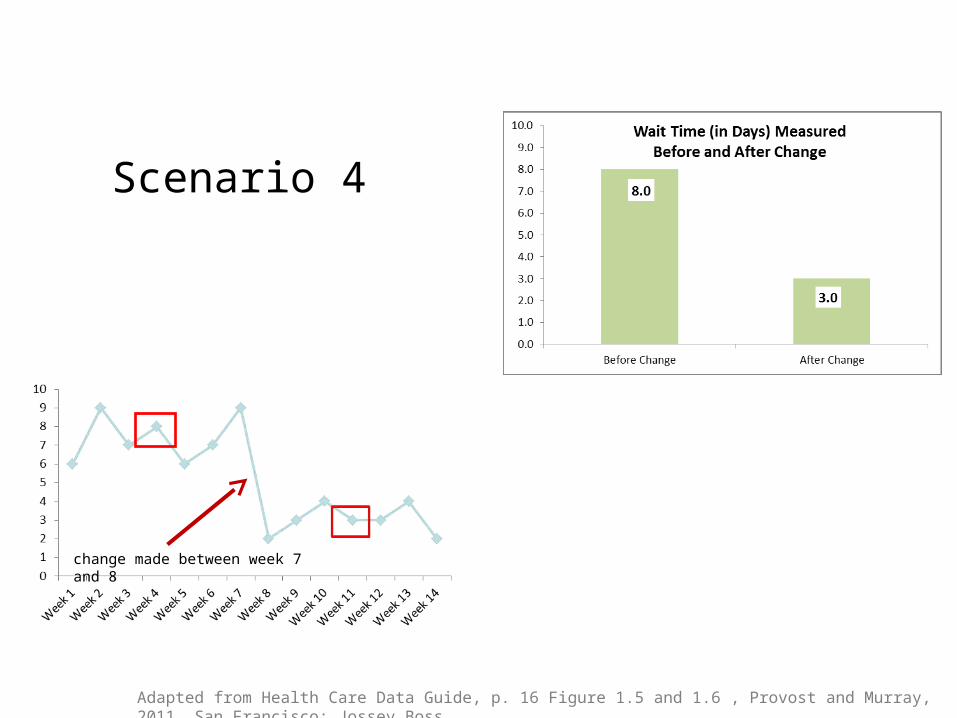
Scenario 4
change made between week 7 and 8
Adapted from Health Care Data Guide, p. 16 Figure 1.5 and 1.6 , Provost and Murray, 2011. San Francisco: Jossey Boss

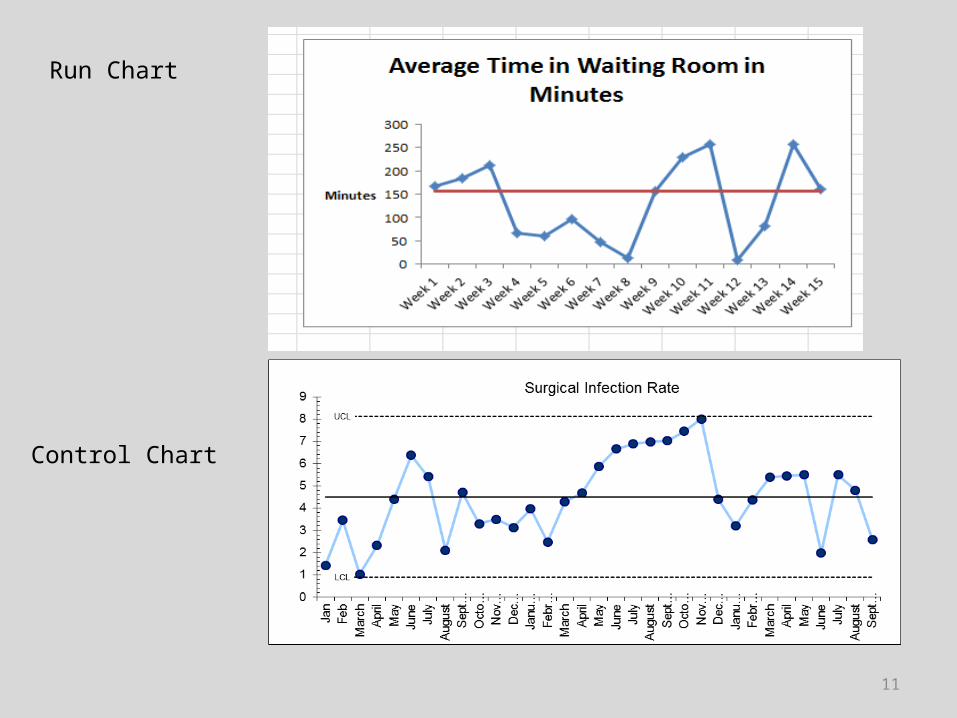
Run Chart
Control Chart
11

Displaying Key Measures over Time - Run Chart
12
-Data displayed in time order
-Time is along X axis
-Result along Y axis
-Centre line = median
-One “dot” = one sample of data
-Sample size = each “dot” should have the same n 0
20
40
60
80
100
Perc
ent
Process: Cardiac Surgical Patients with Controlled Post-operative Serum Glucose
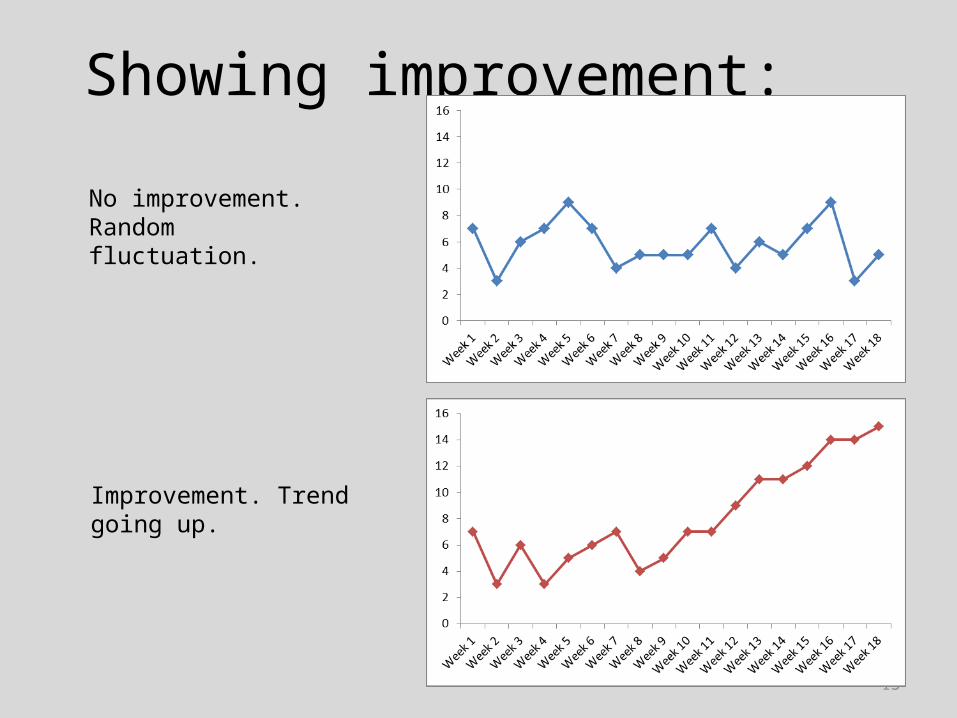
Showing improvement:
13
No improvement. Random fluctuation.
Improvement. Trend going up.

Making the Run Chart in Excel
14
1. Data will be in two columns. Column A will have dates or times, and Column B will have the result of your data collection.
2. Highlight this data
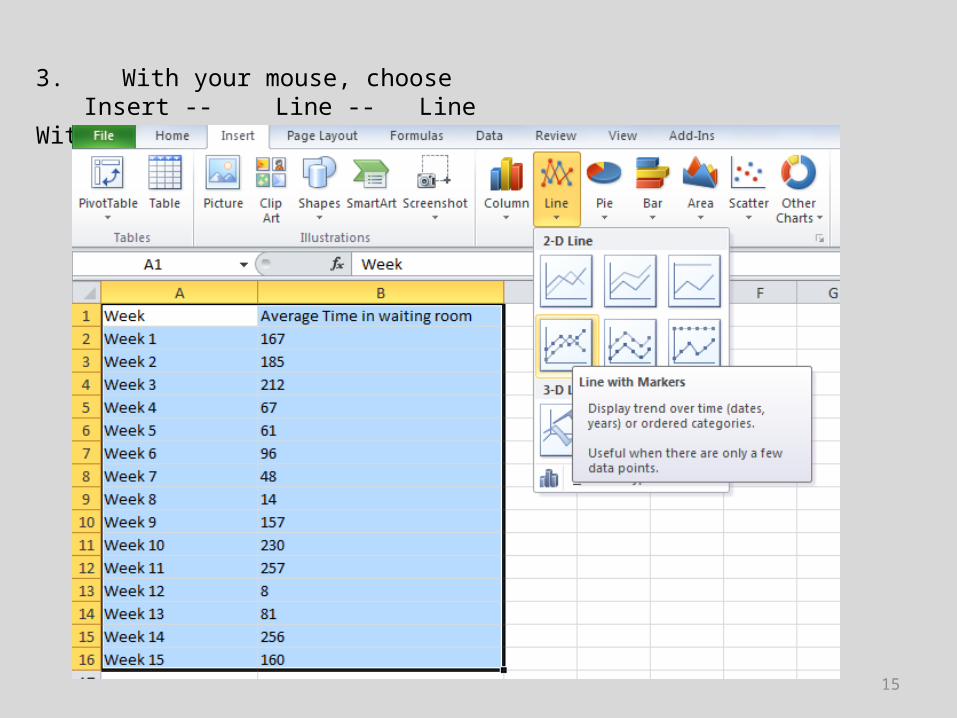
3. With your mouse, choose Insert -- Line -- Line With Markers
15

Making the Run Chart in Excel
16
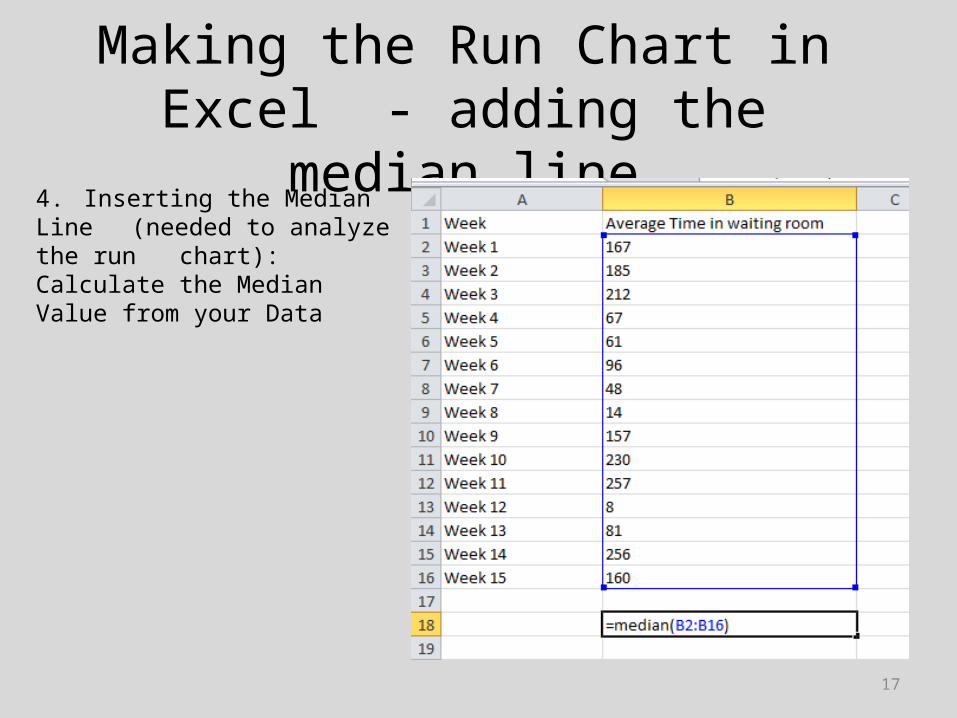
Making the Run Chart in Excel - adding the median line
17
4. Inserting the Median Line (needed to analyze the run chart): Calculate the Median Value from your Data
Making the Run Chart in Excel – adding the median line
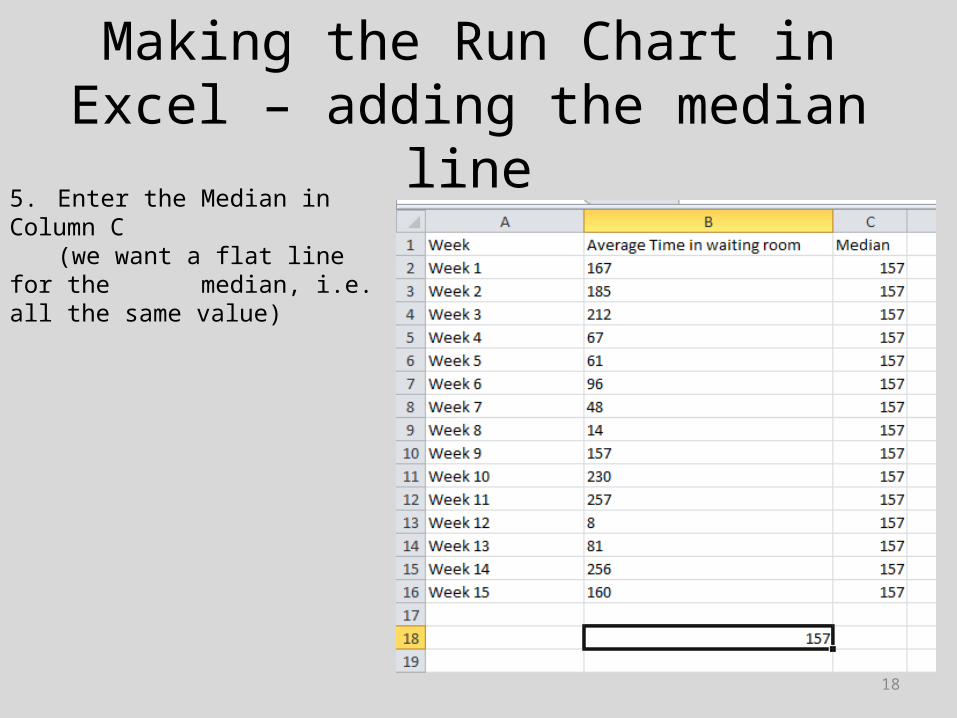
18
5. Enter the Median in Column C (we want a flat line for the median, i.e. all the same value)
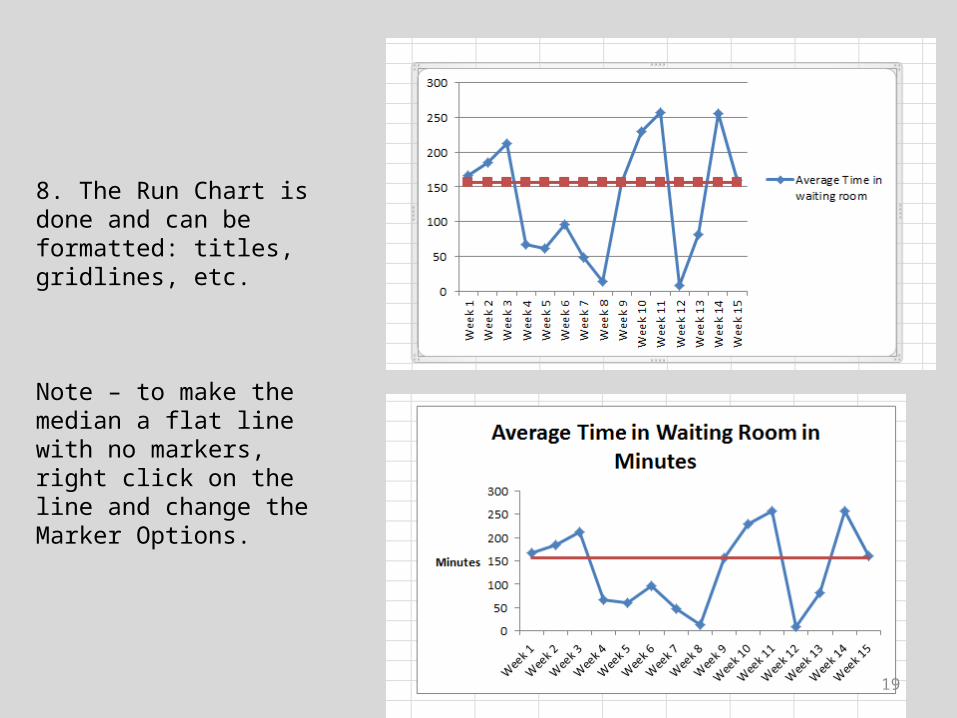
8. The Run Chart is done and can be formatted: titles, gridlines, etc.
Note – to make the median a flat line with no markers, right click on the line and change the Marker Options.
19
20
How Do We Analyze a Run Chart?
• Visual analysis first• If pattern is not clear, then apply probability based rules

21
22
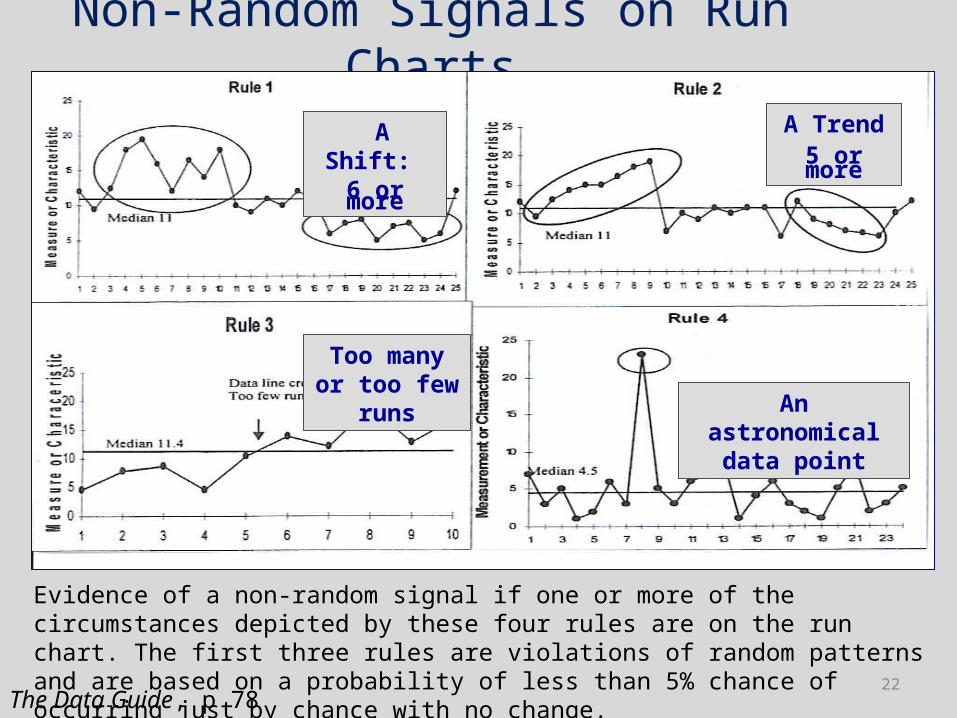
Non-Random Signals on Run Charts
A Shift: 6 or more
An astronomical data point
Too many or too few runs
A Trend5 or more
The Data Guide, p 78
Evidence of a non-random signal if one or more of the circumstances depicted by these four rules are on the run chart. The first three rules are violations of random patterns and are based on a probability of less than 5% chance of occurring just by chance with no change.

Data Display Principles
23

24

25
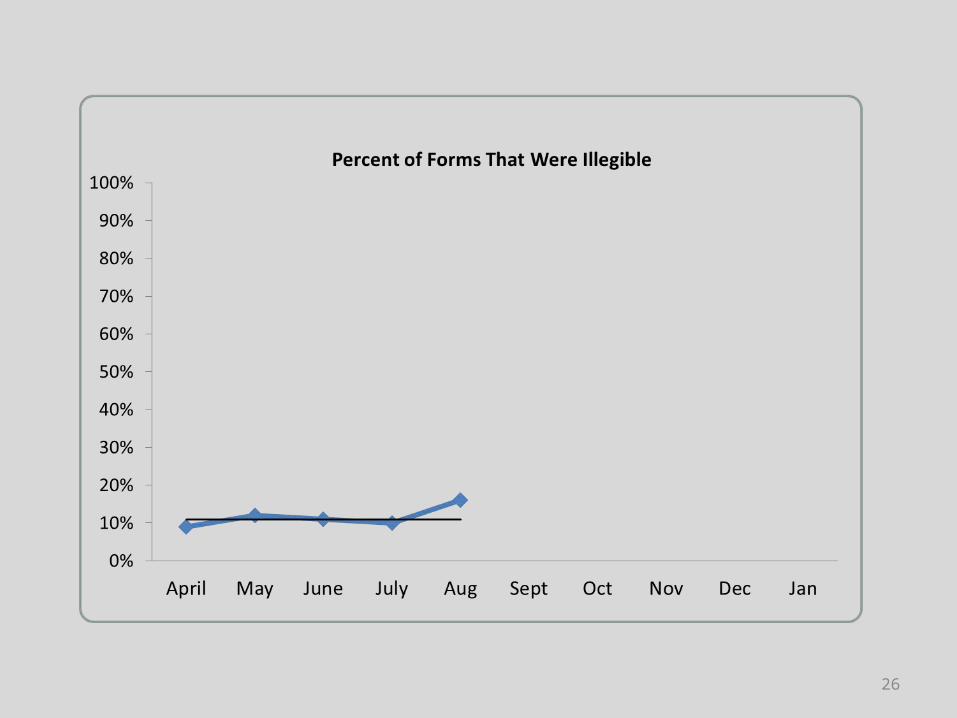
26

27
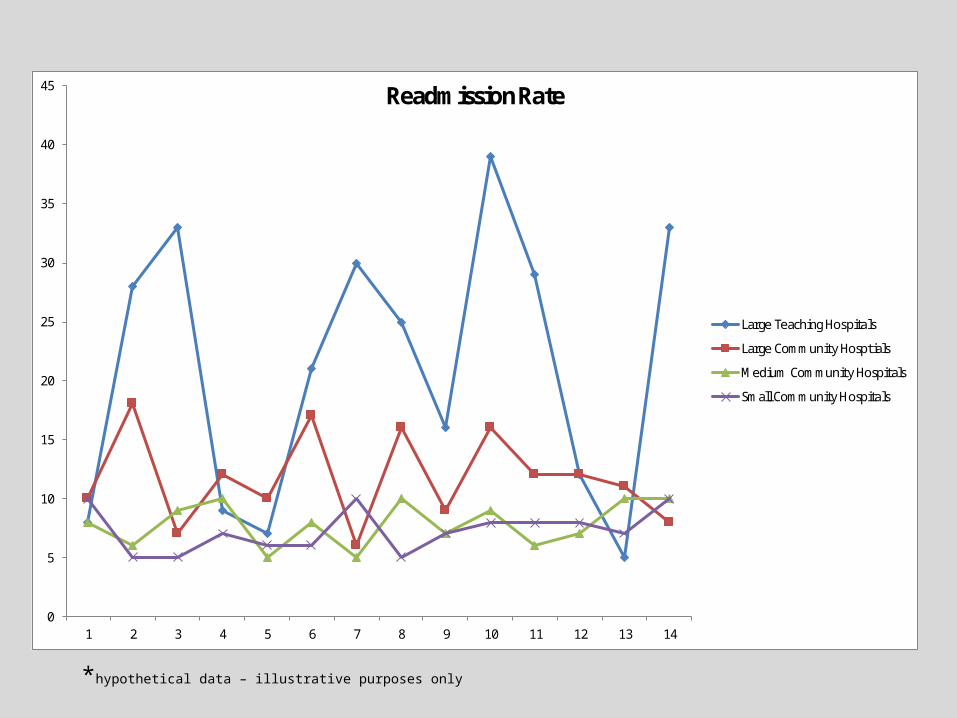
*hypothetical data – illustrative purposes only
0
5
10
15
20
25
30
35
40
45
1 2 3 4 5 6 7 8 9 10 11 12 13 14
Readmission Rate
Large Teaching Hospitals
Large Community Hosptials
Medium Community Hospitals
Small Community Hospitals

SMALL MULTIPLES – all info on one page
29
0
10
20
30
40
1/1/09
2/1/09
3/1/09
4/1/09
5/1/09
6/1/09
7/1/09
8/1/09
9/1/09
10/1/
09
11/1/
09
12/1/
09
1/1/10
2/1/10
ProvincialReadmission Rate
0
10
20
30
40Large Teaching
Hospitals
010203040
Large Community Hospitals
010203040
Medium Community Hospitals
010203040 Small Community
Hospitals
*hypothetical data – illustrative purposes only

Related Documents