Rule-based clustering for gene promoter structure discovery T Curk a,* , U Petrovic b , G Shaulsky c , and B Zupan a,c a University of Ljubljana, Faculty of Computer and Information Science, Ljubljana, Slovenia b J. Stefan Institute, Department of Molecular and Biomedical Sciences, Ljubljana, Slovenia c Baylor College of Medicine, Department of Molecular and Human Genetics, Houston, TX Summary Background—The genetic cellular response to internal and external changes is determined by the sequence and structure of gene regulatory promoter regions. Objectives—Using data on gene regulatory elements (i.e., either putative or known transcription factor binding sites) and data on gene expression profiles we can discover structural elements in promoter regions and infer the underlying programs of gene regulation. Such hypotheses obtained in silico can greatly assist us in experiment planning. The principal obstacle for such approaches is the combinatorial explosion in different combinations of promoter elements to be examined. Methods—Stemming from several state-of-the-art machine learning approaches we here propose a heuristic, rule-based clustering method that uses gene expression similarity to guide the search for informative structures in promoters, thus exploring only the most promising parts of the vast and expressively rich rule-space. Results—We present the utility of the method in the analysis of gene expression data on budding yeast S. cerevisiae where cells were induced to proliferate peroxisomes. Conclusions—We demonstrate that the proposed approach is able to infer informative relations uncovering relatively complex structures in gene promoter regions that regulate gene expression. Keywords promoter analysis; gene expression analysis; machine learning; rule-based clustering 1 Introduction Regulation of gene expression is a complex mechanism in the biology of eukaryotic cells. Cells carry their function and respond to the environment by an orchestration of transcription factors and other signaling molecules that influence gene expression. The resulting products regulate expression of other genes thus forming diverse sets of regulatory pathways. To better understand gene function and gene interactions we need to uncover and analyze the programs of gene regulation. Computational analysis (1) of gene regulatory regions that can use information from known gene sequences, putative binding sites and sets of gene expression studies, can greatly speed-up and automate the tedious discovery process performed by classical genetics. *Contact: Tomaz Curk, University of Ljubljana, Faculty of Comp. and Inf. Science, Trzaska c. 25, SI-1000 Ljubljana, Slovenija, [email protected], phone: +386-1-4768267. NIH Public Access Author Manuscript Methods Inf Med. Author manuscript; available in PMC 2009 September 18. Published in final edited form as: Methods Inf Med. 2009 ; 48(3): 229–235. doi:10.3414/ME9225. NIH-PA Author Manuscript NIH-PA Author Manuscript NIH-PA Author Manuscript

Welcome message from author
This document is posted to help you gain knowledge. Please leave a comment to let me know what you think about it! Share it to your friends and learn new things together.
Transcript
Rule-based clustering for gene promoter structure discovery
T Curka,*, U Petrovicb, G Shaulskyc, and B Zupana,caUniversity of Ljubljana, Faculty of Computer and Information Science, Ljubljana, SloveniabJ. Stefan Institute, Department of Molecular and Biomedical Sciences, Ljubljana, SloveniacBaylor College of Medicine, Department of Molecular and Human Genetics, Houston, TX
SummaryBackground—The genetic cellular response to internal and external changes is determined by thesequence and structure of gene regulatory promoter regions.
Objectives—Using data on gene regulatory elements (i.e., either putative or known transcriptionfactor binding sites) and data on gene expression profiles we can discover structural elements inpromoter regions and infer the underlying programs of gene regulation. Such hypotheses obtainedin silico can greatly assist us in experiment planning. The principal obstacle for such approaches isthe combinatorial explosion in different combinations of promoter elements to be examined.
Methods—Stemming from several state-of-the-art machine learning approaches we here proposea heuristic, rule-based clustering method that uses gene expression similarity to guide the search forinformative structures in promoters, thus exploring only the most promising parts of the vast andexpressively rich rule-space.
Results—We present the utility of the method in the analysis of gene expression data on buddingyeast S. cerevisiae where cells were induced to proliferate peroxisomes.
Conclusions—We demonstrate that the proposed approach is able to infer informative relationsuncovering relatively complex structures in gene promoter regions that regulate gene expression.
Keywordspromoter analysis; gene expression analysis; machine learning; rule-based clustering
1 IntroductionRegulation of gene expression is a complex mechanism in the biology of eukaryotic cells. Cellscarry their function and respond to the environment by an orchestration of transcription factorsand other signaling molecules that influence gene expression. The resulting products regulateexpression of other genes thus forming diverse sets of regulatory pathways. To betterunderstand gene function and gene interactions we need to uncover and analyze the programsof gene regulation. Computational analysis (1) of gene regulatory regions that can useinformation from known gene sequences, putative binding sites and sets of gene expressionstudies, can greatly speed-up and automate the tedious discovery process performed byclassical genetics.
*Contact: Tomaz Curk, University of Ljubljana, Faculty of Comp. and Inf. Science, Trzaska c. 25, SI-1000 Ljubljana, Slovenija,[email protected], phone: +386-1-4768267.
NIH Public AccessAuthor ManuscriptMethods Inf Med. Author manuscript; available in PMC 2009 September 18.
Published in final edited form as:Methods Inf Med. 2009 ; 48(3): 229–235. doi:10.3414/ME9225.
NIH
-PA Author Manuscript
NIH
-PA Author Manuscript
NIH
-PA Author Manuscript
The regulatory region of a gene is defined as a stretch of DNA, which is normally locatedupstream of the gene’s coding region. Transcription factors are special proteins that bind tospecific sequences (binding sites) in the regulatory regions, thus inhibiting or exciting geneexpression of target genes. Regulation by binding of transcription factors is just one of themany regulatory mechanisms. Expression is also determined by chromatin structure (2),epigenetic effects, post-transcriptional, translational, post-translational and other forms ofregulation (3). Because there is a general lack of these kinds of data, most current computationalstudies focus on inference of relations between gene regulatory content and gene expressionmeasured using DNA microarrays (4).
Determination of the regulatory region and putative binding sites are the first crucial steps insuch analyses. Regulatory and coding regions differ in nucleotide and codon frequency. Thisfact is successfully exploited by many prediction algorithms (5), and promoter (regulatory)sequences are readily available in public data bases for most model organisms. The next crucial,well studied, and notoriously difficult step is to determine the transcription factors’ putativebinding sites in promoter regions. These are 4 to 20 nucleotide long DNA sequences (3) whichare highly conserved in the promoter regions of regulated genes. A matrix representation ofthe frequencies of the four nucleotides (A, T, C, G) at each position in the binding site isnormally used in computational analysis. The TRANSFAC data base (6) is a good source ofexperimentally confirmed and computationally inferred binding sites. Candidate binding sitesfor genes with unknown regulations can be found using local sequence alignment programssuch as MEME (7). A detailed description and evaluation of such tools is presented in the paperby Tompa et al. (8).
Most contemporary methods that try to relate gene structure and expression start with geneexpression clustering and then determine cluster-specific binding sites (4,9). The success ofsuch approaches strongly relies on the number and composition of gene clusters. Slightparameter changes in clustering procedures can lead to significantly different clustering (10,11), and consequently to inference of different cluster-specific binding sites. Most often thesemethods search for non-overlapping clusters and may miss interesting relations, as it is knownthat genes can respond in many different ways and perform various functions (12).
An alternative to clustering-first approaches are methods that start with information on bindingsites and search for descriptions shared by similarly expressed genes. For example, in anapproach by Chiang et al. (13) the group’s pair-wise gene expression intra-correlation iscomputed for each set of genes comprising a specific binding site in the promoter region. Theirmethod reports on binding sites where this correlation is statistically significant, but fails toinvestigate the combinations of two or more putative binding sites: it is known that regulationof gene expression can be highly combinatorial and requires the coordinated presence of manytranscription factors. There are other approaches where combinations of binding sites areinvestigated, but they are often limited to the presence of two sites due to the combinatorialexplosion of the search (4,14). For example, the number of all possible combinations of threebinding sites, from a base of a thousand binding sites available for modeling, quickly growsinto hundreds of millions. Transcription is also affected by absolute or relative orientation anddistance between binding sites and other landmarks in the promoter region (i.e., the translationstart ATG), further complicating the language that should be used to model promoter structureand subsequently increasing the search space.
To overcome the limitations described above, we have devised a new algorithm that can inferpotentially complex promoter sequence patterns and relate them to gene expression. In theapproach, which we call rule-based clustering (RBC), we essentially borrowed from severalapproaches developed within machine learning that use heuristic search to cope with potentiallyhuge search space. The uniqueness of the presented algorithm is its ability to discover groups
Curk et al. Page 2
Methods Inf Med. Author manuscript; available in PMC 2009 September 18.
NIH
-PA Author Manuscript
NIH
-PA Author Manuscript
NIH
-PA Author Manuscript
of genes that share any combination of promoter elements that can be in placement andorientation specific to the start of the gene or to another promoter element. Below, we firstdefine the language we use to describe the constitution of promoter region, then describe theRBC algorithm and finally illustrate its application on the analysis of peroxisome proliferationdata on S. cerevisiae.
2 Rule-based clustering methodThe inputs to the proposed rule-based clustering (RBC) method are gene expression profilesand data on their promoter regulatory elements. The algorithm does not include anypreprocessing of expression data (e.g., normalization, scaling) and considers the data asprovided. For each gene, the data on regulatory elements is given as a set of sequence motifswith their position relative to the start of the gene and orientation. The motifs are representedeither by a position weight matrix (7) or a single line consensus; the former was used in all ourexperiments. The RBC algorithm aims to find clusters of similarly expressed genes withstructurally similar promoter regions. The output of the algorithm are rules of the form “IFstructure THEN expression profile”, where structure is an assertion over the regulatoryelements in the gene promoter sequence and expression profile is a set of expression profilesof matching genes.
2.1 Descriptive language for assertions on promoter structureRBC discovers rules that contain assertions-conditions on the structure of the promoter regionthat include the presence of binding sites, the distance of the binding sites from transcriptionand translation start site (ATG), the distance between binding sites, and the orientation ofbinding sites. We have devised a simple language to represent these assertions. For instance,the expression “S1” says that site S1 (in whichever orientation) must be present in the promoter,and the expression “S1−@−d1(ref:S2)” asserts that both sites S1 and S2 should be present inthe promoter region such that S1, in the non-sense direction, appears d1 nucleotides upstreamof S2.
The proposed description language is not unequivocal: the same promoter structure may oftenbe described in several different ways. For example, any of the following rules may describethe same structure : “S1+@−d1(ref:ATG) and S2−@d2(ref:s1),” “S2−@−d3(ref:ATG) andS1+@−d2(ref:S2),” and “S1+@−d1(ref:ATG) and S2−@−d3(ref:ATG)”. All three descriptionsrequire sites S1 and S2 to be oriented in the sense and non-sense directions, respectively. Thefirst rule requires site S1 to be positioned at distance d1 from the reference ATG (translationstart site) and the position S2 to be relative to S1. According to the second rule, the position ofS1 is relative to the absolutely positioned S2 at distance d3 from ATG. The third rule definesthe position of both sites relative to ATG. In such cases, the RBC algorithm will return onlyone of the semantically equivalent descriptions, depending on the order in which they werefound in the heuristic search.
2.2 RBC algorithmThe proposed algorithm is outlined in Fig. 2. In its input it requires data on gene expressionprofiles Pall and data on promoter elements in the corresponding gene regulatory regions. Thealgorithm returns a list of inferred rules of the form R = (C, P) with condition on the promoterstructure C contained in genes with similar gene expression profiles P.
RBC uses a beam-search approach (lines 3–12) followed by two post-processing steps (lines13 and 14 of the algorithm). Beam is a list of at most L currently inferred rules considered forfurther refinement that are ordered according to their associated scores (see below). ParameterL is a user-defined parameter (with a default value of 1000) that affects the scope of the search
Curk et al. Page 3
Methods Inf Med. Author manuscript; available in PMC 2009 September 18.
NIH
-PA Author Manuscript
NIH
-PA Author Manuscript
NIH
-PA Author Manuscript
and thus the runtime. At the start of the search Beam is initialized with a rule “IF True THENPall” that covers all genes under consideration.
In every iteration of the main loop (lines 3 to 12), the search focuses on the best-scored ruleR = (C, P) from Beam and considers all possible single-term extensions of its condition C,which are allowed by the given descriptive language. Each such refinement results in a newcandidate rule, which is added into the list of Candidates (line 6). The refinements includeadding the terms with assertion on the presence of a site, presence of a site with its orientation,or the presence of a site (with or without the information on orientation) at a relative distanceof a specific landmark (another site or start of gene). Refined rules are then represented in asimplified form. For instance, adding a single-site presence condition S1 to the initial rule“(True, Pall)” yields a rule “True and S1” which is simplified to its logical equivalent “S1.”Adding a term with the same site but non-sense orientation to the latter yields the rule “S1 andS1−” which is simplified to “S1−.” Similarly, adding a term with the same site but withinformation on a distance of 100 to 80 nucleotides to the ATG may result in a rule such as“S1@−100.. − 80(ref:ATG).” Requirements of other binding sites may be added, either simplyby requiring their presence (e.g., rule “S1 and S2”) or by adding them as a reference to thepresently included sites in conditions (e.g., “S1@−100..− 80(ref:S2)”). Candidate rules willinclude those with matching at least N genes, where N being a user-defined parameter with adefault value of six.
Candidate rules are then compared to their (non-refined) parent rule based on the intra-clusterpair-wise gene expression profiles distance of the covered genes. To identify co-expressedgenes, the algorithm uses Pearson correlation as a default distance measure, which – whencomputing the distance between two genes – ignores experiments where for any of these twogenes the expression is missing. The user can replace it with any other type of distance functionthat suits the particular type of expression profiles or the biological question addressed. For aset of candidate rules, only those with a significant reduction of this distance are retained inthe list of Candidates (line 7). This decrease of variance in the intra-cluster pair-wise distancesis tested using the F-test statistic:
where SSR and SSCandidate are sums of squared differences from mean inside the cluster ofgenes covered by the parent rule R and by a refined Candidate rule, respectively, and valuesnR and nCandidate are the total number of genes in each of the two clusters. A p-value iscalculated from the F score and used to determine the significance of change (the threshold,αF, defaults to 0.05). Figure 1 shows an example of explored refinements during rule searchthat may lead to the identification of profile-coherent gene clusters.
The resulting refined rules stored in the Candidates list are added to Beam (line 9), whichretains at most L best-scored rules (line 10). Because the goal is to discover the mosthomogeneous clusters, each rule is scored according to the potential coherence of itscorresponding sub-cluster potentially obtained after the refinement of the rule. Potentialcoherence estimates how promising the cluster is in terms of finding a good subset of genes.While examining all subgroups of genes in the cluster would be an option, such an estimate iscomputationally expensive because of potentially large number of subgroups. Instead, wedefine the potential coherence of a cluster as the average of k·N·(k·N-1)/2 minimal pair-wiseprofile distances. This in a way approximates a choice of a subset with k·N most similar genes.If the cluster being estimated contains less then k·N genes, its estimated potential equals to theaverage of all pair-wise gene distances.
Curk et al. Page 4
Methods Inf Med. Author manuscript; available in PMC 2009 September 18.
NIH
-PA Author Manuscript
NIH
-PA Author Manuscript
NIH
-PA Author Manuscript
Rules for which the above procedure finds no suitable refinements and whose intra-clusterpair-wise distance is below a user-defined threshold D are added to Rules, the list that storesthe terminal rules discovered by RBC algorithm (line 12). Note that a process of taking thebest-scored rule from the Beam, refining it and adding newly found rules (if any) withimprovements in intra-cluster profile distances is repeated until Beam is left empty.
To further reduce the potentially large number of rules found by the beam search, RBC usestwo post-processing steps (lines 13 and 14). RBC may infer rules that describe exactly the samecluster of genes. Each such rule set is considered individually, with the aim to retain only themost general rules from it. That is, for each pair of rules with conditions C1 and C2, only thefirst rule from the pair is retained in the rule set if its condition C1 subsumes condition C2, thatis, it covers the same genes but is more general in terms of logic. For instance, condition“S1” subsumes condition “S1 and S2.” The remaining list of Rules is further filtered by keepingonly the most coherent rules so that on average no more than a limited number of rules describeany gene (parameter M set by the user, default is five). The final set of rules is formed byselecting the rules with lowest intra-cluster distance first, and adding them to the final set onlyif their inclusion does not increase the rule-coverage for any gene beyond M.
Alternatively to considering all the genes in its input data, RBC can additionally deal with theinformation on a set of target genes for which the user wants to focus the analysis. Typically,target genes would comprise a subgroup of similarly annotated genes, or a subset ofdifferentially expressed genes. If a target set is given, discovered rules are included in Beamand in the final set only if they cover at least N target genes. Because the algorithm starts withone rule (line 1), which describes all genes, the discovered rules can cover genes outside thetarget set. The method is thus able to identify genes that were initially left out of a target setbut should have been included based on their regulatory content and gene expression.
The proposed rule-based clustering method was inspired by the beam-search proceduresuccessfully used in a well known, supervised machine learning algorithm CN2 (15), and byan unsupervised approach of clustering trees developed by Blockeel et al. (16), but is in itsimplementation and application substantially different from both. CN2 infers rules that relateattribute-value based description of the objects to their discrete class, while clustering treesidentify attribute-value based description of non-overlapping clusters of similar objects.
RBC combines both approaches by using a beam search to infer symbolic descriptions ofpotentially overlapping clusters of similarly regulated genes. Compared to beam search in CN2,where the size of the beam is relatively small (ten to twenty best rules are most often consideredfor further refinements), RBC uses a much wider beam but also generates potentiallyoverlapping rules in a single loop. In contrast, in CN2, only the best-found rule is retained,objects covered by it removed from the data, and the procedure is restarted until no objects tobe explored remain. Similar to CN2, the essence of our algorithm is rule refinement, for which,in the area of machine learning, the beam search proved to be an appropriate heuristic method.
3 A case study and experimental validationWe applied the proposed RBC method to data from a microarray transcription profiling studywhere budding yeast S. cerevisiae cells were induced to proliferate peroxisomes – organellesthat compartmentalize several oxidative reactions – due to the cell’s regulated response to theexposure to oleic fatty acid (oleate) and to the absence of glucose, which causes peroxisomerepression (17). The transcriptional profile of each gene consists of six microarraymeasurements on oleate induction time course, and two measurements in “oleate vs. glucose”and “glucose vs. glycerol” growth conditions. In total, gene pair-wise distance was calculatedon gene expression profiles consisting of eight micro-array measurements. We defined the
Curk et al. Page 5
Methods Inf Med. Author manuscript; available in PMC 2009 September 18.
NIH
-PA Author Manuscript
NIH
-PA Author Manuscript
NIH
-PA Author Manuscript
pair-wise distance function to be 1.0−r, where r is the Pearson correlation between two geneprofiles.
For the target group we selected a set of 224 genes identified by the study to have similarexpression profiles to those of genes involved in peroxisome biogenesis and peroxisomefunction. The goal of our analysis was to further divide the target group into smaller subgroupsof genes with common promoter structure and possibly identify genes that were inadvertentlyleft out of the target group but should have been included based on their expression andpromoter structure similarity.
We analyzed data on 2,135 putative binding sites which were identified using a local sequencealignment software tool MEME (7). We searched for presence of these binding sites in 1Kbpromoter regions taken upstream from the translation start site (ATG) for ~6,700 genes. Thesearch identified ~302,000 matches of putative binding sites that were then used to infer ruleswith RBC. The algorithm was run with the default values of parameters. Distances betweenbinding sites were rounded to increments of 40 bases; the maximum possible range of 2Kb (forthe given promoter length, relative distances can be from −1Kb to +1Kb) was thus reduced to50 different values (= 2000b/40b). This largely reduced the number of possible subintervalsthat needed to be considered during rule inference.
The search returned 41 rules that described and divided 114 target genes (51% of target genes)into 37 subgroups (see Fig. 3b). No rule could be found to describe the remaining 110 targetgenes. Most of the discovered gene groups are composed of five genes with high pair-wiseintra-group correlation (above 0.927). Many genes are shared (overlap) between the 37discovered groups, resulting in six major gene groups visible in Figure 3a and 3b. Seven genesoutside the target set were also identified by the method (marked in black in Fig. 3a). Forexample, the smallest eight-gene group in the top-left corner in Fig. 3a includes two outsiders(INP53 and YIL168W - also named SDL1). Gene ontology annotation shows that INP53 isinvolved together with two target genes (ATP3 and VHS1) in the biological process phosphatemetabolism. Gene SDL1 is annotated to function together with the group’s target geneLYS14 in the biological process amino acid metabolism and other similar parent GO terms(results not shown). Details on the promoter structure and gene expression are given in Fig. 3cand 3d. These examples confirm the method’s ability to identify functionally related genes thatwere not initially included in the target set.
The majority of the discovered rules in the case study include conditions that are composed ofthree terms, describing the binding site’s orientation and distance relative to ATG or otherbinding sites. There is no general binding site that would appear in many rules; only two rulesinclude the same binding site (results not shown).
Exhaustive search of even relatively simple rules can quickly grow into a prohibitively hardproblem due to combinatorial explosion. Exhaustive search for all possible rules composed ofthree binding sites with defined orientation (three possible values: positive, negative, nopreference) and distance (distance range is reduced into 50 different values) would, for thiscase study, require checking a huge number of rules:
Our method checked 2 × 11 × 109 of the most promising rules, or less than 0.00004% of theentire three-term rule space. The search took 40 minutes on a Pentium 4, 3.4 GHz workstation.This demonstrates RBC’s ability to efficiently derive potentially complex rules withinreasonable time frame.
Curk et al. Page 6
Methods Inf Med. Author manuscript; available in PMC 2009 September 18.
NIH
-PA Author Manuscript
NIH
-PA Author Manuscript
NIH
-PA Author Manuscript
To evaluate the predictive ability of the approach we used a data set on 1364 S. cerevisiaegenes that includes accurate binding sites data for 83 transcription factors (18). We modeledthe regulatory region spanning from −800bp to 0bp relative to ATG. Pair-wise gene distancewas calculated as the average pair-wise distance across nineteen gene expression microarraystudies available at SGD’s Expression Connection data base (http://www.yeastgenome.org/).All genes were considered to be target genes.
Five-fold cross-validation was used that randomly splits genes into five sets. Clustering andtesting of the inferred rules was repeated five times, each time with a different set of genes forvalidation of a model constructed using the remaining four sets. Each discovered rule wastested on genes in the test set. If a rule matched the promoter region of a test gene, then wecalculated the prediction error by calculating the distance between the true gene expression ofthe test gene and its predicted expression. When more than one rule could be applied to predictthe expression of a test gene, the average prediction error was returned for that gene. Overall,the method successfully predicted the expression of 286 genes (21% of all genes considered),with an average cross-validation prediction error of 0.75. If we were to use “random” rules,which would randomly cluster genes into groups of the same size as those by inferred rules,we could expect the prediction error to be 0.96. We believe that the achieved prediction erroris a good indication of the predictive quality of inferred rules.
4 ConclusionThe proposed rule-based clustering method can efficiently find rules of gene regulation bysearching for groups of similarly expressed genes and with similar structure of the regulatoryregion. Starting from a target set of genes of interest, the method was able to cluster them intosubgroups. Concurrently, RBC may expand the target set by identifying other similarlyregulated genes that were initially overlooked by the user. Rule-search is guided and is madeefficient by the proposed search heuristics. An important feature of RBC is its ability to discoveroverlapping groups of genes, potentially indicating common regulation or function.
The algorithm uses a number of parameters that essentially determine the size of the searchspace being examined. The default values provided with the algorithm were set according toparticular characteristics of the domain (e.g., about ten thousand genes, small subset of genessharing some motif pattern, most known patterns include from one to five motifs (19)). Thechoice of parameters also affects the run time, and the defaults were chosen to makeimplementation practical and to infer the rules within one hour of computational time on astandard personal computer.
We have experimentally confirmed the ability of RBC algorithm with default settings to inferrules that describe a complex regulatory structure and which can be used to reliably predictgene expression from regulatory content. In contrast with other contemporary methods thatmainly use information on the presence of binding sites, a principal novelty of our approachis the use of a rich descriptive language to model the promoter structure. The language can beeasily extended to accommodate other descriptive features, such as chromatin structure, whensuch kinds of data become available on a genome-wide scale.
To summarize and display the findings of the analysis at different levels of abstraction we haveapplied different visualizations, which proved useful for understanding and biologicalinterpretation. We believe that the main application of RBC is an exploratory search foradditional evidence that genes, in theoretically or experimentally defined groups, actually sharea common regulatory mechanism. The biologist can then gain insight by looking at thepresented evidence and can better decide which inferred patterns are worth testing in thelaboratory.
Curk et al. Page 7
Methods Inf Med. Author manuscript; available in PMC 2009 September 18.
NIH
-PA Author Manuscript
NIH
-PA Author Manuscript
NIH
-PA Author Manuscript
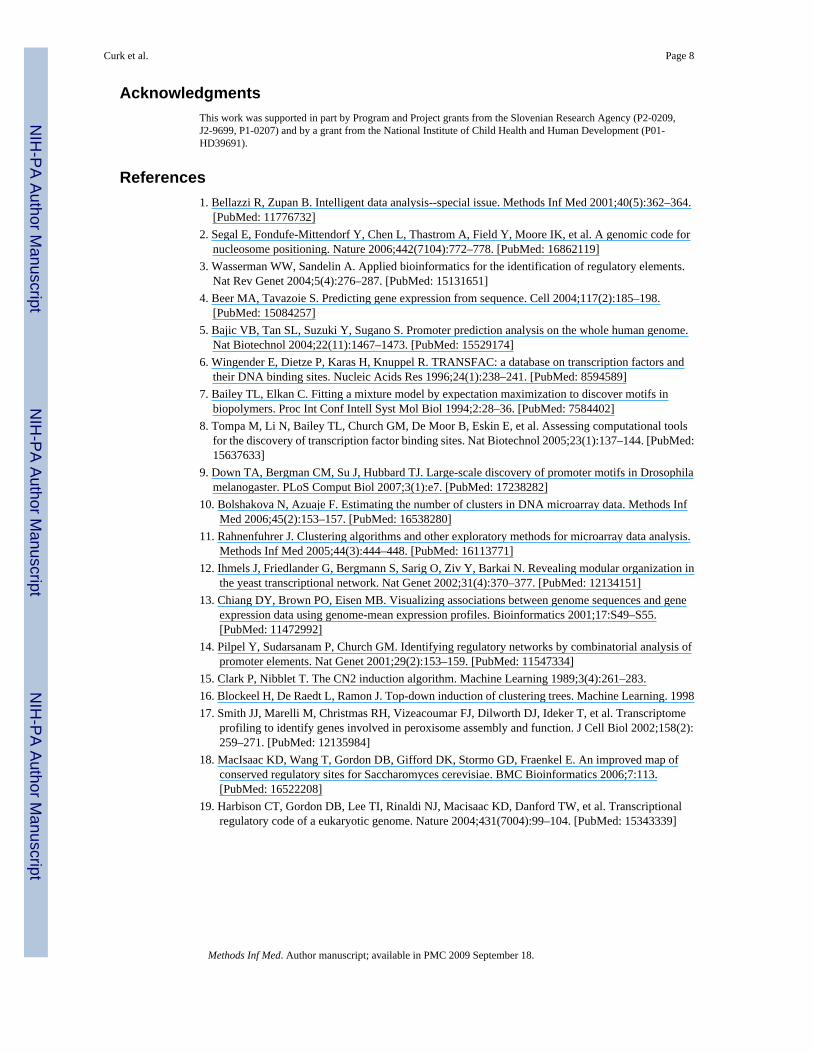
AcknowledgmentsThis work was supported in part by Program and Project grants from the Slovenian Research Agency (P2-0209,J2-9699, P1-0207) and by a grant from the National Institute of Child Health and Human Development (P01-HD39691).
References1. Bellazzi R, Zupan B. Intelligent data analysis--special issue. Methods Inf Med 2001;40(5):362–364.
[PubMed: 11776732]2. Segal E, Fondufe-Mittendorf Y, Chen L, Thastrom A, Field Y, Moore IK, et al. A genomic code for
nucleosome positioning. Nature 2006;442(7104):772–778. [PubMed: 16862119]3. Wasserman WW, Sandelin A. Applied bioinformatics for the identification of regulatory elements.
Nat Rev Genet 2004;5(4):276–287. [PubMed: 15131651]4. Beer MA, Tavazoie S. Predicting gene expression from sequence. Cell 2004;117(2):185–198.
[PubMed: 15084257]5. Bajic VB, Tan SL, Suzuki Y, Sugano S. Promoter prediction analysis on the whole human genome.
Nat Biotechnol 2004;22(11):1467–1473. [PubMed: 15529174]6. Wingender E, Dietze P, Karas H, Knuppel R. TRANSFAC: a database on transcription factors and
their DNA binding sites. Nucleic Acids Res 1996;24(1):238–241. [PubMed: 8594589]7. Bailey TL, Elkan C. Fitting a mixture model by expectation maximization to discover motifs in
biopolymers. Proc Int Conf Intell Syst Mol Biol 1994;2:28–36. [PubMed: 7584402]8. Tompa M, Li N, Bailey TL, Church GM, De Moor B, Eskin E, et al. Assessing computational tools
for the discovery of transcription factor binding sites. Nat Biotechnol 2005;23(1):137–144. [PubMed:15637633]
9. Down TA, Bergman CM, Su J, Hubbard TJ. Large-scale discovery of promoter motifs in Drosophilamelanogaster. PLoS Comput Biol 2007;3(1):e7. [PubMed: 17238282]
10. Bolshakova N, Azuaje F. Estimating the number of clusters in DNA microarray data. Methods InfMed 2006;45(2):153–157. [PubMed: 16538280]
11. Rahnenfuhrer J. Clustering algorithms and other exploratory methods for microarray data analysis.Methods Inf Med 2005;44(3):444–448. [PubMed: 16113771]
12. Ihmels J, Friedlander G, Bergmann S, Sarig O, Ziv Y, Barkai N. Revealing modular organization inthe yeast transcriptional network. Nat Genet 2002;31(4):370–377. [PubMed: 12134151]
13. Chiang DY, Brown PO, Eisen MB. Visualizing associations between genome sequences and geneexpression data using genome-mean expression profiles. Bioinformatics 2001;17:S49–S55.[PubMed: 11472992]
14. Pilpel Y, Sudarsanam P, Church GM. Identifying regulatory networks by combinatorial analysis ofpromoter elements. Nat Genet 2001;29(2):153–159. [PubMed: 11547334]
15. Clark P, Nibblet T. The CN2 induction algorithm. Machine Learning 1989;3(4):261–283.16. Blockeel H, De Raedt L, Ramon J. Top-down induction of clustering trees. Machine Learning. 199817. Smith JJ, Marelli M, Christmas RH, Vizeacoumar FJ, Dilworth DJ, Ideker T, et al. Transcriptome
profiling to identify genes involved in peroxisome assembly and function. J Cell Biol 2002;158(2):259–271. [PubMed: 12135984]
18. MacIsaac KD, Wang T, Gordon DB, Gifford DK, Stormo GD, Fraenkel E. An improved map ofconserved regulatory sites for Saccharomyces cerevisiae. BMC Bioinformatics 2006;7:113.[PubMed: 16522208]
19. Harbison CT, Gordon DB, Lee TI, Rinaldi NJ, Macisaac KD, Danford TW, et al. Transcriptionalregulatory code of a eukaryotic genome. Nature 2004;431(7004):99–104. [PubMed: 15343339]
Curk et al. Page 8
Methods Inf Med. Author manuscript; available in PMC 2009 September 18.
NIH
-PA Author Manuscript
NIH
-PA Author Manuscript
NIH
-PA Author Manuscript
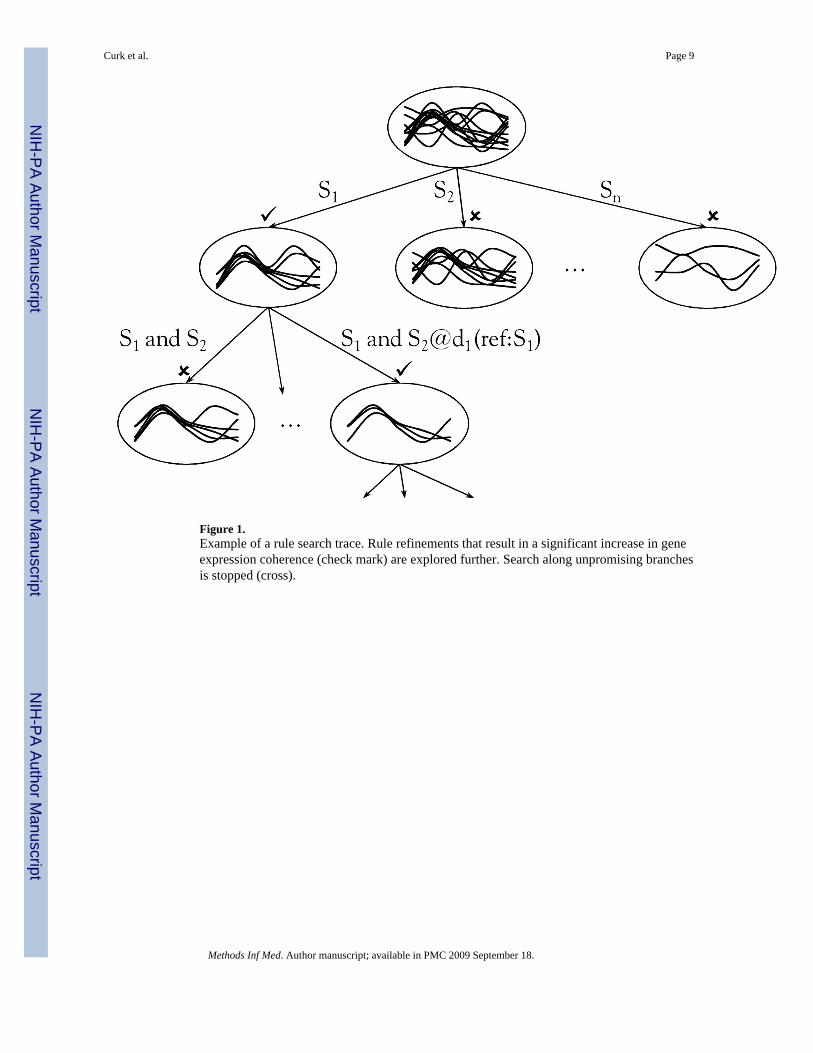
Figure 1.Example of a rule search trace. Rule refinements that result in a significant increase in geneexpression coherence (check mark) are explored further. Search along unpromising branchesis stopped (cross).
Curk et al. Page 9
Methods Inf Med. Author manuscript; available in PMC 2009 September 18.
NIH
-PA Author Manuscript
NIH
-PA Author Manuscript
NIH
-PA Author Manuscript
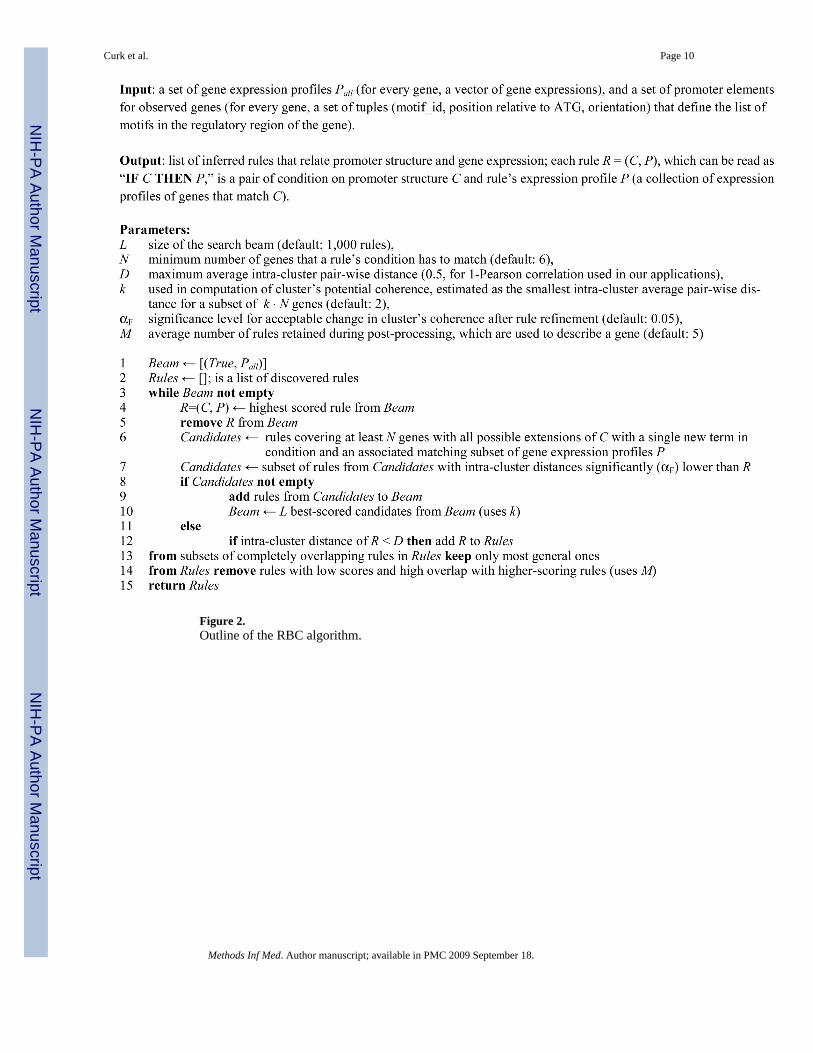
Figure 2.Outline of the RBC algorithm.
Curk et al. Page 10
Methods Inf Med. Author manuscript; available in PMC 2009 September 18.
NIH
-PA Author Manuscript
NIH
-PA Author Manuscript
NIH
-PA Author Manuscript
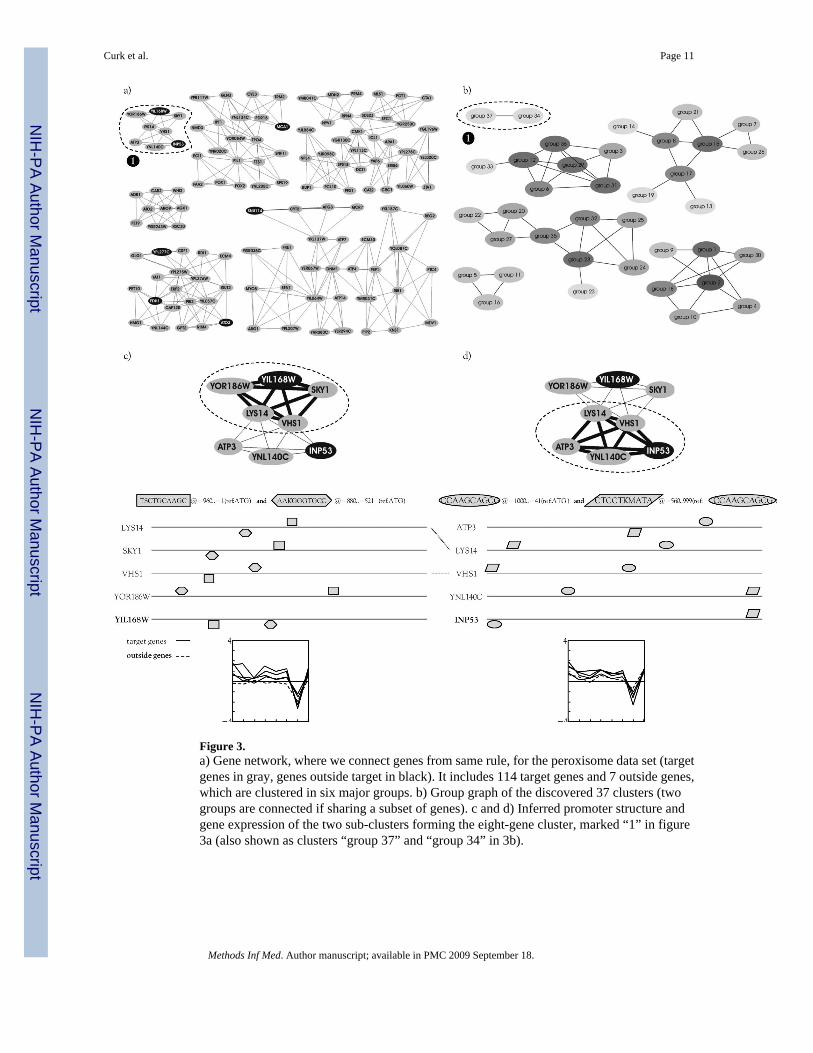
Figure 3.a) Gene network, where we connect genes from same rule, for the peroxisome data set (targetgenes in gray, genes outside target in black). It includes 114 target genes and 7 outside genes,which are clustered in six major groups. b) Group graph of the discovered 37 clusters (twogroups are connected if sharing a subset of genes). c and d) Inferred promoter structure andgene expression of the two sub-clusters forming the eight-gene cluster, marked “1” in figure3a (also shown as clusters “group 37” and “group 34” in 3b).
Curk et al. Page 11
Methods Inf Med. Author manuscript; available in PMC 2009 September 18.
NIH
-PA Author Manuscript
NIH
-PA Author Manuscript
NIH
-PA Author Manuscript
Related Documents