RTOS-QNX Technical Information 21.02.17 RTOS-QNX RTOS Debugger for QNX ■ Real Time, non-intrusive Display of QNX System Resources ■ Kernel and/or Application Debugging ■ Debugging Several QNX Applications At Once ■ Dynamic Thread Performance Measurement ■ QNX Specific Evaluation of Real Time Trace Listing ■ Statistical and Graphic Display of Thread Run Times ■ Thread related Evaluation of Function Run Times ■ Thread Stack Coverage ■ PRACTICE Functions for OS Data ■ QNX related Pull-Down Menu The TRACE32 System includes a configurable RTOS debugger to provide symbolic debugging in real time oper- ating systems. Our software package contains a ready-to- run configuration for the QNX Real Time Kernel from QNX Software Systems Ltd. In close cooperation with QSSL, we built a high sophisti- cated QNX awareness, which enables you to do a most effective debugging with the TRACE32 systems on tar- gets running QNX. ARM Atom PowerPC SuperH x86 XScale

Welcome message from author
This document is posted to help you gain knowledge. Please leave a comment to let me know what you think about it! Share it to your friends and learn new things together.
Transcript
RTO
S-Q
NX
Tech
nic
al In
form
atio
n
21.0
2.17
RTOS-QNX
RTOS Debugger for QNX
■ Real Time, non-intrusive Display of QNX System Resources
■ Kernel and/or Application Debugging■ Debugging Several QNX Applications At Once■ Dynamic Thread Performance Measurement■ QNX Specific Evaluation of Real Time Trace
Listing■ Statistical and Graphic Display of Thread Run
Times■ Thread related Evaluation of Function Run
Times■ Thread Stack Coverage■ PRACTICE Functions for OS Data■ QNX related Pull-Down Menu
The TRACE32 System includes a configurable RTOSdebugger to provide symbolic debugging in real time oper-ating systems. Our software package contains a ready-to-run configuration for the QNX Real Time Kernel from QNXSoftware Systems Ltd.
In close cooperation with QSSL, we built a high sophisti-cated QNX awareness, which enables you to do a mosteffective debugging with the TRACE32 systems on tar-gets running QNX.
ARMAtomPowerPCSuperHx86XScale
TRACE32 - Technical Information 2
RTOS Debugging in TRACE32 with QNX
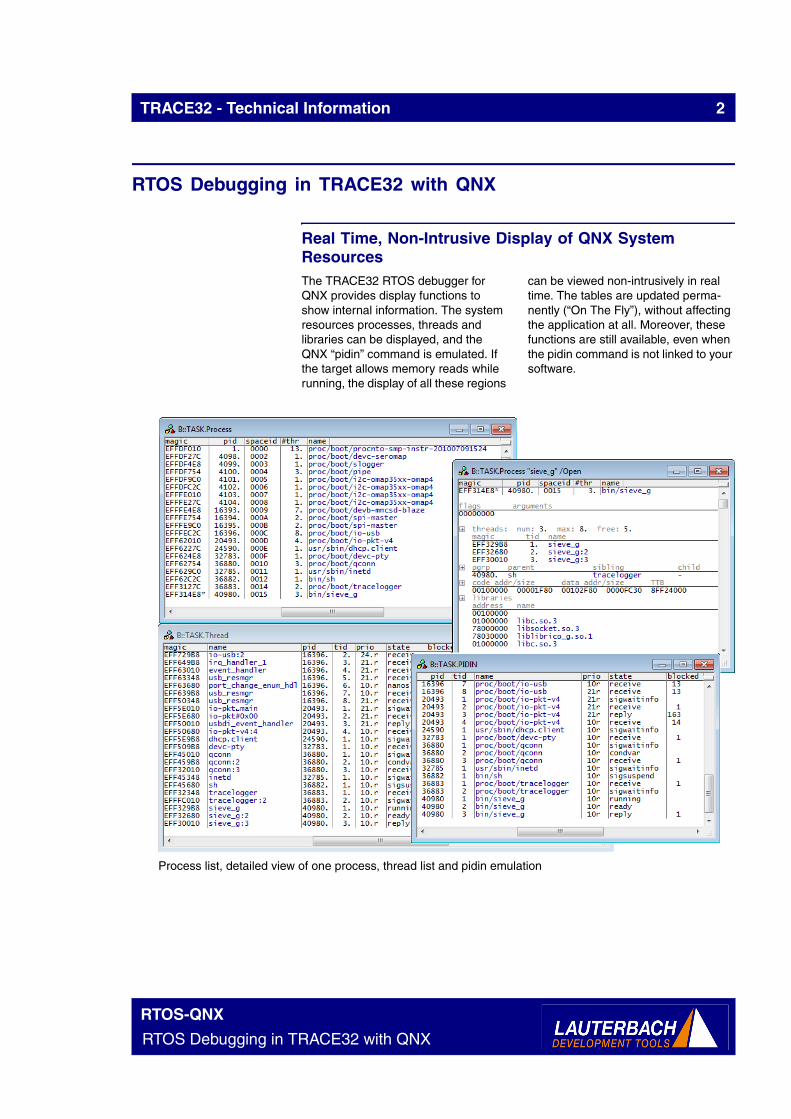
Real Time, Non-Intrusive Display of QNX System ResourcesThe TRACE32 RTOS debugger for QNX provides display functions to show internal information. The system resources processes, threads and libraries can be displayed, and the QNX “pidin” command is emulated. If the target allows memory reads while running, the display of all these regions
can be viewed non-intrusively in real time. The tables are updated perma-nently (“On The Fly”), without affecting the application at all. Moreover, these functions are still available, even when the pidin command is not linked to your software.
Process list, detailed view of one process, thread list and pidin emulation
RTOS-QNX
RTOS Debugging in TRACE32 with QNX
TRACE32 - Technical Information 3
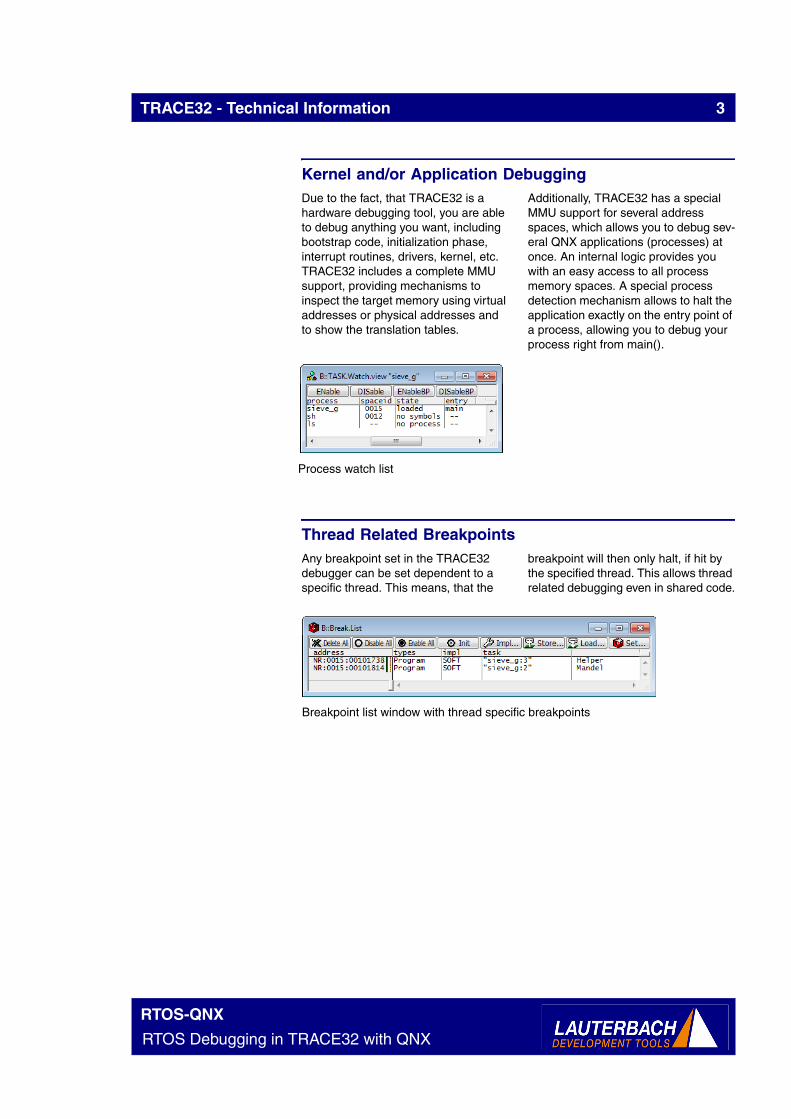
Kernel and/or Application DebuggingDue to the fact, that TRACE32 is a hardware debugging tool, you are able to debug anything you want, including bootstrap code, initialization phase, interrupt routines, drivers, kernel, etc.TRACE32 includes a complete MMU support, providing mechanisms to inspect the target memory using virtual addresses or physical addresses and to show the translation tables.
Additionally, TRACE32 has a special MMU support for several address spaces, which allows you to debug sev-eral QNX applications (processes) at once. An internal logic provides you with an easy access to all process memory spaces. A special process detection mechanism allows to halt the application exactly on the entry point of a process, allowing you to debug your process right from main().
Thread Related BreakpointsAny breakpoint set in the TRACE32 debugger can be set dependent to a specific thread. This means, that the
breakpoint will then only halt, if hit by the specified thread. This allows thread related debugging even in shared code.
Process watch list
Breakpoint list window with thread specific breakpoints
RTOS-QNX
RTOS Debugging in TRACE32 with QNX
TRACE32 - Technical Information 4
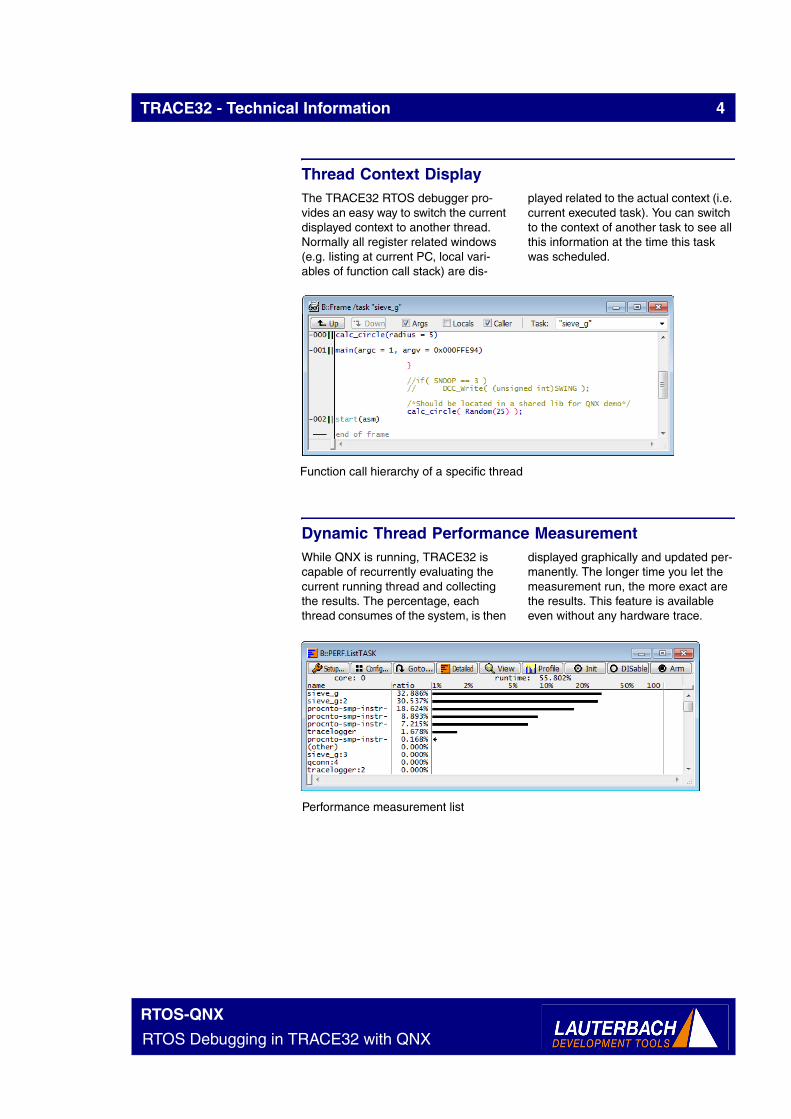
Thread Context DisplayThe TRACE32 RTOS debugger pro-vides an easy way to switch the current displayed context to another thread. Normally all register related windows (e.g. listing at current PC, local vari-ables of function call stack) are dis-
played related to the actual context (i.e. current executed task). You can switch to the context of another task to see all this information at the time this task was scheduled.
Dynamic Thread Performance MeasurementWhile QNX is running, TRACE32 is capable of recurrently evaluating the current running thread and collecting the results. The percentage, each thread consumes of the system, is then
displayed graphically and updated per-manently. The longer time you let the measurement run, the more exact are the results. This feature is available even without any hardware trace.
Function call hierarchy of a specific thread
Performance measurement list
RTOS-QNX
RTOS Debugging in TRACE32 with QNX
TRACE32 - Technical Information 5
QNX Specific Display of Trace ListingThe data recorded in the real time trace buffer (if available) can be displayed and interpreted specific to the operat-ing system. The thread switches are
displayed symbolically, either exclu-sively or in addition to other informa-tion.
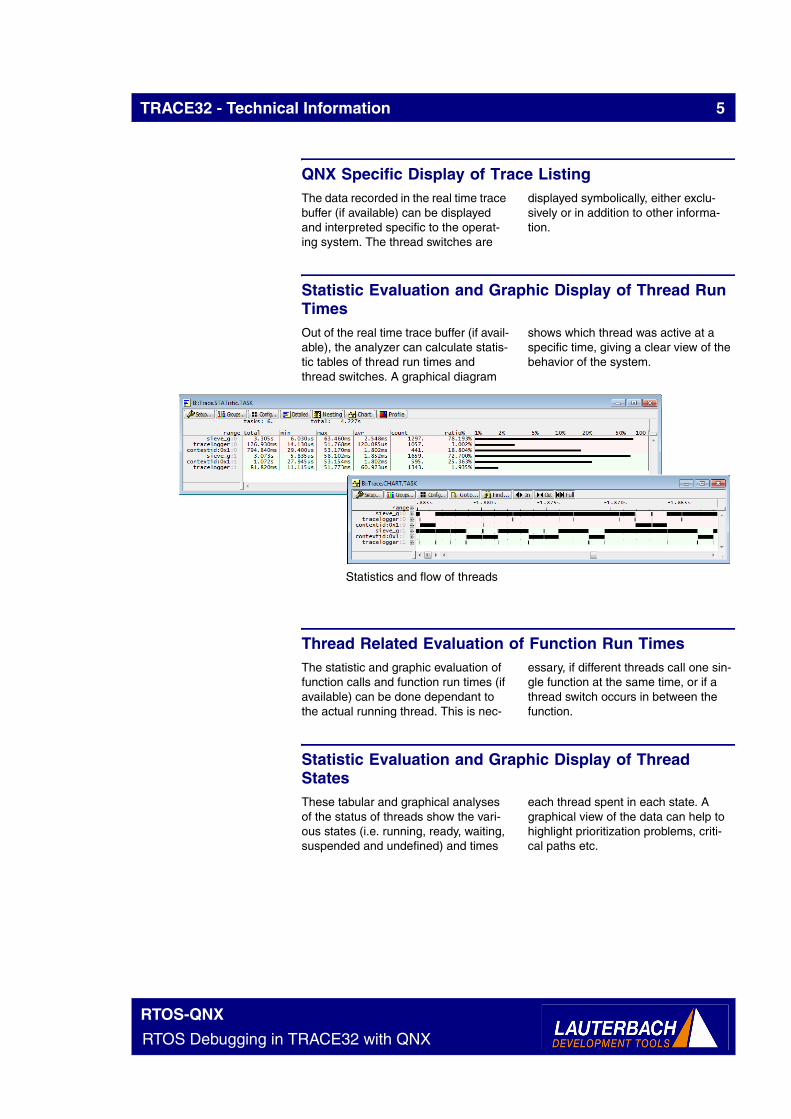
Statistic Evaluation and Graphic Display of Thread Run TimesOut of the real time trace buffer (if avail-able), the analyzer can calculate statis-tic tables of thread run times and thread switches. A graphical diagram
shows which thread was active at a specific time, giving a clear view of the behavior of the system.
Thread Related Evaluation of Function Run TimesThe statistic and graphic evaluation of function calls and function run times (if available) can be done dependant to the actual running thread. This is nec-
essary, if different threads call one sin-gle function at the same time, or if a thread switch occurs in between the function.
Statistic Evaluation and Graphic Display of Thread StatesThese tabular and graphical analyses of the status of threads show the vari-ous states (i.e. running, ready, waiting, suspended and undefined) and times
each thread spent in each state. A graphical view of the data can help to highlight prioritization problems, criti-cal paths etc.
Statistics and flow of threads
RTOS-QNX
RTOS Debugging in TRACE32 with QNX
TRACE32 - Technical Information 6
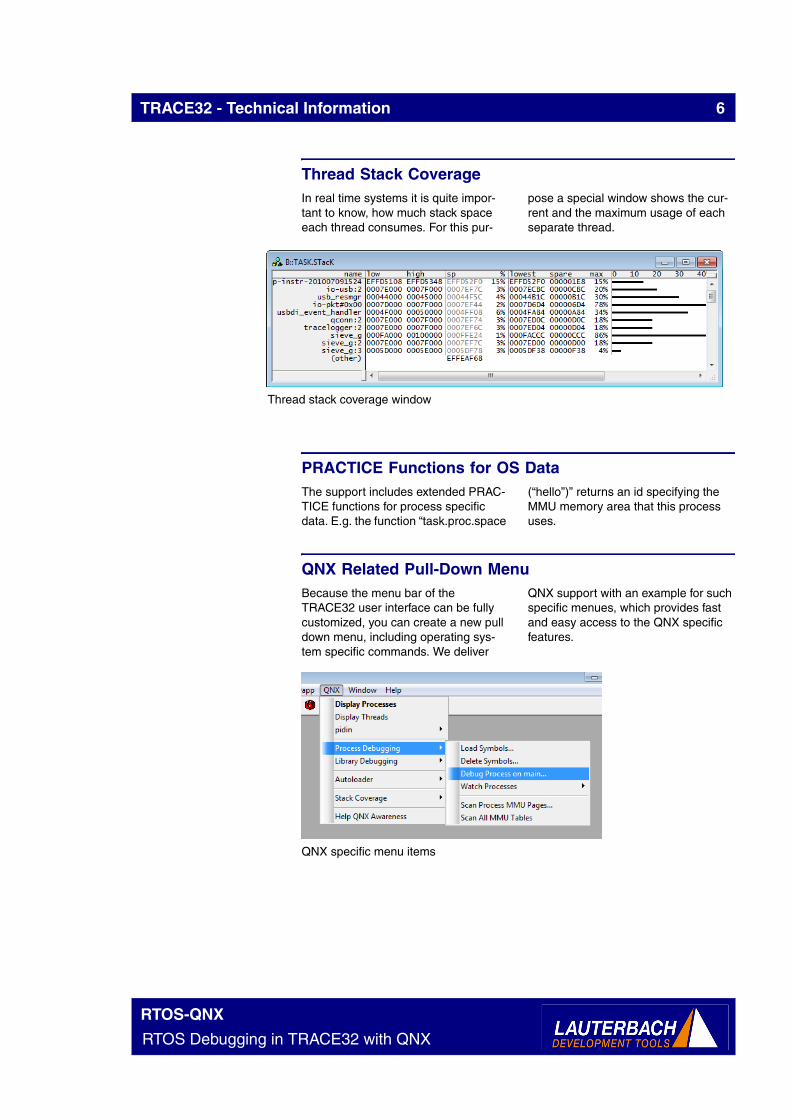
Thread Stack CoverageIn real time systems it is quite impor-tant to know, how much stack space each thread consumes. For this pur-
pose a special window shows the cur-rent and the maximum usage of each separate thread.
PRACTICE Functions for OS DataThe support includes extended PRAC-TICE functions for process specific data. E.g. the function “task.proc.space
(“hello”)” returns an id specifying the MMU memory area that this process uses.
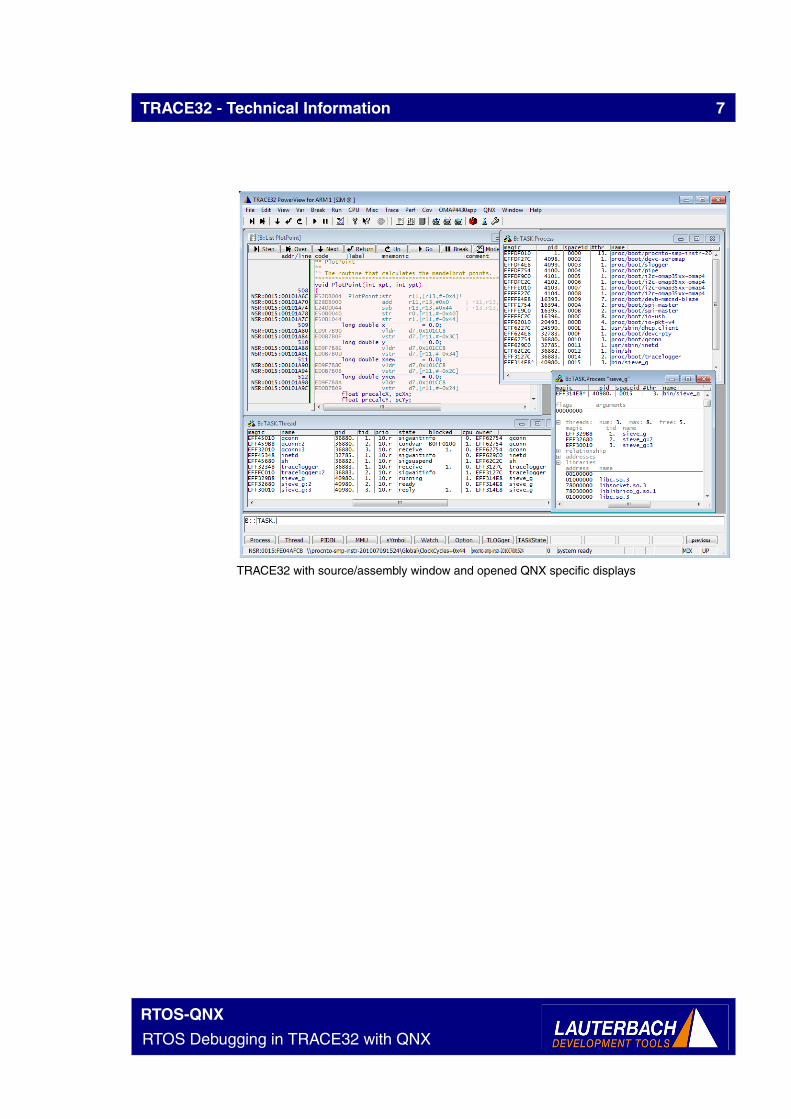
QNX Related Pull-Down MenuBecause the menu bar of the TRACE32 user interface can be fully customized, you can create a new pull down menu, including operating sys-tem specific commands. We deliver
QNX support with an example for such specific menues, which provides fast and easy access to the QNX specific features.
Thread stack coverage window
QNX specific menu items
RTOS-QNX
RTOS Debugging in TRACE32 with QNX
TRACE32 - Technical Information 7
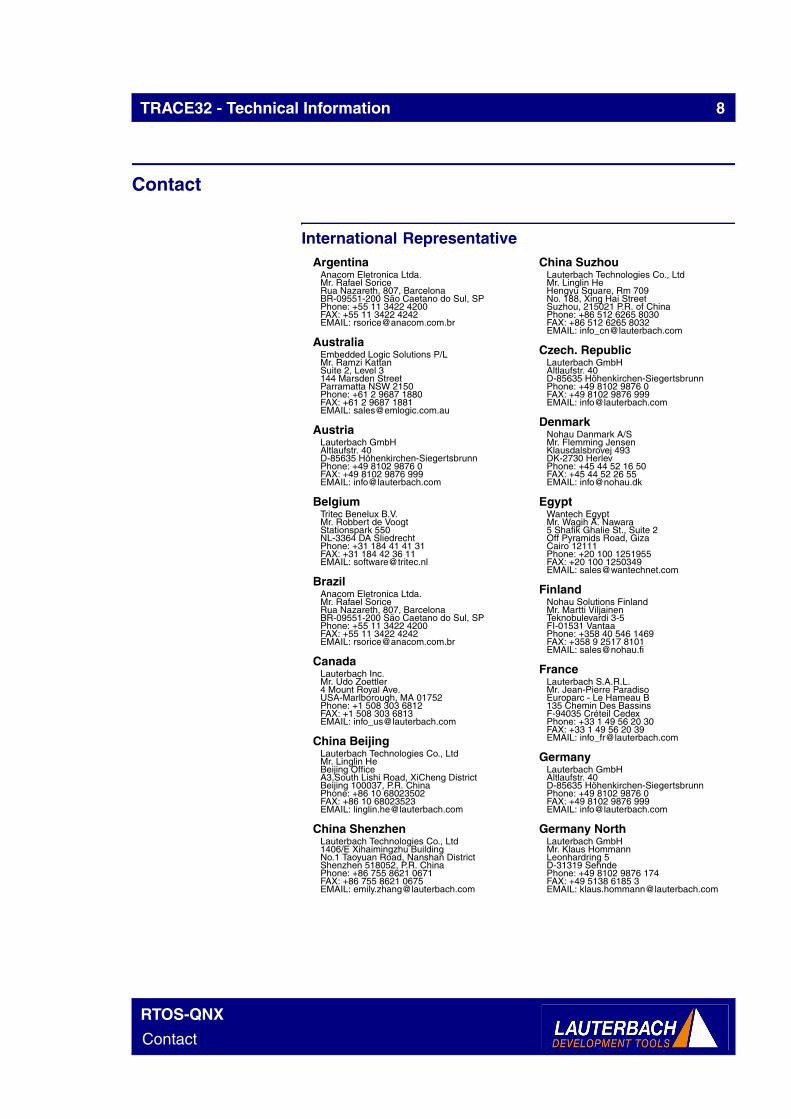
TRACE32 with source/assembly window and opened QNX specific displays
RTOS-QNX
RTOS Debugging in TRACE32 with QNX
TRACE32 - Technical Information 8
Contact
International RepresentativeArgentina
Anacom Eletronica Ltda.Mr. Rafael SoriceRua Nazareth, 807, BarcelonaBR-09551-200 São Caetano do Sul, SPPhone: +55 11 3422 4200FAX: +55 11 3422 4242EMAIL: [email protected]
AustraliaEmbedded Logic Solutions P/LMr. Ramzi KattanSuite 2, Level 3144 Marsden StreetParramatta NSW 2150Phone: +61 2 9687 1880FAX: +61 2 9687 1881EMAIL: [email protected]
AustriaLauterbach GmbHAltlaufstr. 40D-85635 Höhenkirchen-SiegertsbrunnPhone: +49 8102 9876 0FAX: +49 8102 9876 999EMAIL: [email protected]
BelgiumTritec Benelux B.V.Mr. Robbert de VoogtStationspark 550NL-3364 DA SliedrechtPhone: +31 184 41 41 31FAX: +31 184 42 36 11EMAIL: [email protected]
BrazilAnacom Eletronica Ltda.Mr. Rafael SoriceRua Nazareth, 807, BarcelonaBR-09551-200 São Caetano do Sul, SPPhone: +55 11 3422 4200FAX: +55 11 3422 4242EMAIL: [email protected]
CanadaLauterbach Inc.Mr. Udo Zoettler4 Mount Royal Ave.USA-Marlborough, MA 01752Phone: +1 508 303 6812FAX: +1 508 303 6813EMAIL: [email protected]
China BeijingLauterbach Technologies Co., LtdMr. Linglin HeBeijing OfficeA3,South Lishi Road, XiCheng DistrictBeijing 100037, P.R. ChinaPhone: +86 10 68023502FAX: +86 10 68023523EMAIL: [email protected]
China ShenzhenLauterbach Technologies Co., Ltd1406/E Xihaimingzhu BuildingNo.1 Taoyuan Road, Nanshan DistrictShenzhen 518052, P.R. ChinaPhone: +86 755 8621 0671FAX: +86 755 8621 0675EMAIL: [email protected]
China SuzhouLauterbach Technologies Co., LtdMr. Linglin HeHengyu Square, Rm 709No. 188, Xing Hai StreetSuzhou, 215021 P.R. of ChinaPhone: +86 512 6265 8030FAX: +86 512 6265 8032EMAIL: [email protected]
Czech. RepublicLauterbach GmbHAltlaufstr. 40D-85635 Höhenkirchen-SiegertsbrunnPhone: +49 8102 9876 0FAX: +49 8102 9876 999EMAIL: [email protected]
DenmarkNohau Danmark A/SMr. Flemming JensenKlausdalsbrovej 493DK-2730 HerlevPhone: +45 44 52 16 50FAX: +45 44 52 26 55EMAIL: [email protected]
EgyptWantech EgyptMr. Wagih A. Nawara5 Shafik Ghalie St., Suite 2Off Pyramids Road, GizaCairo 12111Phone: +20 100 1251955FAX: +20 100 1250349EMAIL: [email protected]
FinlandNohau Solutions FinlandMr. Martti ViljainenTeknobulevardi 3-5FI-01531 VantaaPhone: +358 40 546 1469FAX: +358 9 2517 8101EMAIL: [email protected]
FranceLauterbach S.A.R.L.Mr. Jean-Pierre ParadisoEuroparc - Le Hameau B135 Chemin Des BassinsF-94035 Créteil CedexPhone: +33 1 49 56 20 30FAX: +33 1 49 56 20 39EMAIL: [email protected]
GermanyLauterbach GmbHAltlaufstr. 40D-85635 Höhenkirchen-SiegertsbrunnPhone: +49 8102 9876 0FAX: +49 8102 9876 999EMAIL: [email protected]
Germany NorthLauterbach GmbHMr. Klaus HommannLeonhardring 5D-31319 SehndePhone: +49 8102 9876 174FAX: +49 5138 6185 3EMAIL: [email protected]
RTOS-QNX
Contact

TRACE32 - Technical Information 9
Germany SouthLauterbach GmbHAndreas GrimmAltlaufstr. 40D-85635 Höhenkirchen-SiegertsbrunnPhone: +49 8102 9876 190FAX: +49 8102 9876 187EMAIL: [email protected]
GreeceLauterbach GmbHAltlaufstr. 40D-85635 Höhenkirchen-SiegertsbrunnPhone: +49 8102 9876 0FAX: +49 8102 9876 999EMAIL: [email protected]
HungaryLauterbach GmbHAltlaufstr. 40D-85635 Höhenkirchen-SiegertsbrunnPhone: +49 8102 9876 0FAX: +49 8102 9876 999EMAIL: [email protected]
India-BangaloreElectro Systems Associates Pvt. Ltd.Mr. G. V. GurunathamS-606, World Trade CenterMalleswaram West, No.26/1, Dr. Rajkumar
RoadIndia - Bangalore 560055Phone: +91 80 67648888FAX: +91 80 23475615EMAIL: [email protected]
India-ChennaiElectro Systems Associates Pvt. Ltd.Mr. D. KannanNo.109 /59A , Ground FloorIV Avenue, Ashok NagarIndia - Chennai - 600 083 TamilnaduPhone: +91 044-24715750FAX: ++91 44 24715750EMAIL: [email protected]
India-DelhiElectro Systems Associates Pvt. Ltd.Mr. R.K. BhandariNo. 705, 7th Floor, Laxmi DeepShivajinagarIndia - Delhi - 110 092Phone: +91 11-22549351FAX:EMAIL: [email protected]
India-HyderabadElectro Systems Associates Pvt. Ltd.Mr. C.V.M. Sri Ram MurthyShop No. 14, "Global Enclave"Bhagyanagar Colony, Kukat pallyIndia - Hyderabad 500 072Phone: +91 40-23063346FAX: +91 40-23063346EMAIL: [email protected]
India-PuneElectro Systems Associates Pvt. Ltd.Mr. R K BhandariShriram Complex,1126/1, Model ColonyShivajinagarIndia - Pune - 411 016Phone: +91 20 - 30462035 / 25663FAX: +91 20-25677202EMAIL: [email protected]
IrelandLauterbach Ltd.Mr. Barry Lock11 Basepoint Enterprise CentreStroudley RoadBasingstoke, Hants RG24 8UPPhone: +44-1256-333-690FAX: +44-1256-336-661EMAIL: [email protected]
IsraelItec Ltd.Mr. Mauri GottliebP.O.Box 10002IL-Tel Aviv 61100Phone: +972 3 6491202FAX: +972 3 6497661EMAIL: [email protected]
ItalyLauterbach SrlMr. Maurizio MenegottoVia Enzo Ferrieri 12I-20153 MilanoPhone: +39 02 45490282FAX: +39 02 45490428EMAIL: [email protected]
JapanLauterbach Japan, Ltd.Mr. Kenji Furukawa3-8-8 ShinyokohamaKouhoku-ku, Nisso 16th BuildingYokohama-shi, Japan 222-0033Phone: +81 45 477 4511FAX: +81 45 477 4519EMAIL: [email protected]
LuxembourgTritec Benelux B.V.Mr. Robbert de VoogtStationspark 550NL-3364 DA SliedrechtPhone: +31 184 41 41 31FAX: +31 184 42 36 11EMAIL: [email protected]
MalaysiaFlash TechnologyMr. Teo Kian HockNo 61, # 04-15 Kaki Bukit Av 1Shun Li Industrial ParkSGP-Singapore 417943Phone: +65 6749 6168FAX: +65 6749 6138EMAIL: [email protected]
MexicoLauterbach Inc.Mr. Udo Zoettler4 Mount Royal Ave.USA-Marlborough, MA 01752Phone: +1 508 303 6812FAX: +1 508 303 6813EMAIL: [email protected]
NetherlandsTritec Benelux B.V.Mr. Robbert de VoogtStationspark 550NL-3364 DA SliedrechtPhone: +31 184 41 41 31FAX: +31 184 42 36 11EMAIL: [email protected]
New ZealandEmbedded Logic Solutions P/LMr. Ramzi KattanSuite 2, Level 3144 Marsden StreetParramatta NSW 2150Phone: +61 2 9687 1880FAX: +61 2 9687 1881EMAIL: [email protected]
NorwayNohau Solutions ABMr. Jörgen NilssonDerbyvägen 4SE-21235 MalmoePhone: +46 40 592 206FAX: +46-40 592 229EMAIL: [email protected]
PolandQUANTUM Sp. z o.o.Mr. Aleksander Bilul. Jeleniogorska 654-056 WroclawPhone: +48 71 362 6356FAX: +48 71 362 6357EMAIL: [email protected]
RTOS-QNX
Contact
TRACE32 - Technical Information 10
PortugalCaptura Electronica,SCCLMr. Juan Martinezc/Duero, 40E-08031 BarcelonaPhone: +34 93 429 5730FAX: +34 93 407 0778EMAIL: [email protected]
RomaniaLauterbach GmbHAltlaufstr. 40D-85635 Höhenkirchen-SiegertsbrunnPhone: +49 8102 9876 0FAX: +49 8102 9876 999EMAIL: [email protected]
RussiaRTSoftMr. Alexey IsaevNikitinskaya 3RUS-105037 MoscowPhone: +7 495 742 6828FAX: +7 495 742 6829EMAIL: [email protected]
SingaporeFlash TechnologyMr. Teo Kian HockNo 61, # 04-15 Kaki Bukit Av 1Shun Li Industrial ParkSGP-Singapore 417943Phone: +65 6749 6168FAX: +65 6749 6138EMAIL: [email protected]
South Korea, PangyoMDS Technology Co.,Ltd.Mr. Sangheon Lee3FL. Hancom Tower49, Daewangpangyo-ro 644, Bundang-guSeongnam-si, Gyeonggi-do, 463-400, ROKPhone: +82-31-627-3000FAX: +82-31-627-3100EMAIL: [email protected]
SpainCaptura Electronica,SCCLMr. Juan Martinezc/Duero, 40E-08031 BarcelonaPhone: +34 93 429 5730FAX: +34 93 407 0778EMAIL: [email protected]
SwedenNohau Solutions ABMr. Jörgen NilssonDerbyvägen 4SE-21235 MalmoePhone: +46 40 592 206FAX: +46 40 592 229EMAIL: [email protected]
SwitzerlandJDT Jberg DatenTechnikMr. Andreas JbergZimmereistrasse 2CH-5734 Reinach AGPhone: +41 62 7710 886FAX:EMAIL: [email protected]
TaiwanSuperlink Technology Corp.Mr. Sulin Huang3F-8,No.77,Sec.1,Xintaiwu Rd.,Xizhi District,New Taipei City 22101, Taiwan, R.O.C.Phone: +886 2 26983456FAX: +886 2 26983535EMAIL: [email protected]
TunisiaLauterbach Consulting S.A.R.L.Mr. Khaled JmalRoute El Ain Km 3.5TN-3062 SfaxPhone: +216-74611730FAX: +216-74611723EMAIL: [email protected]
Turkey-1Tektronik Muh. ve Tic. A.S.Mr. Hakan YavuzCyberPlaza B-Blok, 702BBilkent06800 AnkaraPhone: +90 312 437 3000FAX: +90 312 437 1616EMAIL: [email protected]
Turkey-2G3TEK Embedded Technologies Ltd.Mr. Celal AygunIlkyerlesim Mah. 445.Sok. No: 4806370 Batikent/AnkaraPhone: +90 312 3324769FAX: +90 312 3324769EMAIL: [email protected]
UKLauterbach Ltd.Mr. Barry Lock11 Basepoint Enterprise CentreStroudley RdBasingstoke, Hants RG24 8UPPhone: +44 1256 333 690FAX: +44 1256 350 301EMAIL: [email protected]
USA EastLauterbach Inc.Mr. Udo Zoettler4 Mount Royal Ave.USA-Marlborough, MA 01752Phone: +1 508 303 6812FAX: +1 508 303 6813EMAIL: [email protected]
USA WestLauterbach Inc.Mr. Bob Kupyn1111 Main Street, Suite 620USA-Vancouver, WA. 98660Phone: +1 503 524 2222FAX: +1 503 524 2223EMAIL: [email protected]
RTOS-QNX
Contact
TRACE32 - Technical Information 11
Additional Information
Lauterbach GmbHAltlaufstr. 40 D-85635 Höhenkirchen-SiegertsbrunnTel. ++49 8102 9876-0 FAX [email protected]://www.lauterbach.de
Lauterbach Inc.4 Mount Royal Ave.Marlboro MA 01752Phone (508) 303 6812 FAX (508) 303 [email protected]://www.us.lauterbach.com
Lauterbach Ltd.11 Basepoint Enterprise Ctre Stroudley RoadBasingstoke, Hants RG24 8UP Phone ++44-1256-333-690 FAX -661 [email protected]:/www.lauterbach.co.uk
Lauterbach S.A.R.L.135 Chemin Des BassinsF-94035 Créteil CedexPhone ++33-149-562-030 FAX ++33-149-562-039 [email protected]:/www.lauterbach.fr
Lauterbach Japan, Ltd.3-9-5 Shinyokohama Kouhoku-kuYokohama-shi Japan 222-0033Phone ++81-45-477-4511 FAX [email protected]://www.lauterbach.co.jp
Lauterbach s.r.l.Lauterbach s.r.l. Via Enzo Ferrieri 12I-20153 MilanoPhone ++39 02 45490282FAX ++39 02 [email protected]://www.lauterbach.it
Suzhou Lauterbach Consulting Co.,Ltd.
Room 1605, Xing Hai International SquareNo.200, Xing Hai StreetSuzhou, 215021 PR of ChinaPhone: 0086-512 6265 8030FAX: 0086-512 6265 [email protected]://www.lauterbach.cn
Disclaimer
http://www.lauterbach.com
The information presented is intended to give overview information only. Changes and technical enhancements or modifications can be made with-out notice.
RTOS-QNX
Contact
TRACE32 - Technical Information 12
RTOS-QNX
Related Documents


![BlackBerry PlayBook Security: Part one - NCC Group · 2. Previous work and QNX security history The PlayBook is based on the QNX Real Time operating system (RTOS)[1], a POSIX-compliant](https://static.cupdf.com/doc/110x72/5f050e9c7e708231d4110b6a/blackberry-playbook-security-part-one-ncc-group-2-previous-work-and-qnx-security.jpg)

