Confidently. Accurately. RT-Range Lane position and vehicle-to-vehicl e measuremen t User Manual Covers all RT-Range models

Welcome message from author
This document is posted to help you gain knowledge. Please leave a comment to let me know what you think about it! Share it to your friends and learn new things together.
Transcript
Confidently. Accurately.
RT-Range Lane position andvehicle-to-vehicle
measurement
User Manual User Manual
Covers all RT-Range
models
2 Oxford Technical Solutions
Legal Notice
The software is protected by copyright of Oxford Technical Solutions at oxts.com.
© 2008–2016, Oxford Technical Solutions Ltd.
Unauthorised use, copying or distribution is not permitted.
The software also includes software in binary form from:
Xiph.Org Foundation at xiph.org.
Copyright (c) 2002, Xiph.org Foundation
QNX at qnx.com.
© 1982–2008, QNX Software Systems Ltd. All rights reserved.
Any redistribution of the software must reproduce the above copyright notices, this list of conditions and the following disclaimer in the documentation and/or other materials provided with the distribution.
None of the name of the Xiph.org Foundation and QNX, nor the names of its contributors may be used to endorse or promote this product or products using this software without specific prior written permission.
The software is provided by the copyright holders and contributors “as is” and any express or implied warranties, including, but not limited to, the implied warranties of merchantability and fitness for a particular purpose are disclaimed. In no event shall the copyright holders or contributors be liable for any direct, indirect, incidental, special, exemplary, or consequential damages (including, but not limited to, procurement of substitute goods or services; loss of use, data, or profits; or business interruption) however caused and on any theory of liability, whether in contract, strict liability, or tort (including negligence or otherwise) arising in any way out of the use of this software, even if advised of the possibility of such damage.

RT-Range User Manual
Revision: 161102
3
Copyright Notice
© Copyright 2016, Oxford Technical Solutions.
Revision
Document Revision: 161102 (See Revision History for detailed information).
Contact Details
Oxford Technical Solutions Limited 77 Heyford Park Upper Heyford Oxfordshire OX25 5HD United Kingdom
Tel: +44 (0) 1869 238 015 Fax: +44 (0) 1869 238 016 Web: http://www.oxts.com Email: [email protected]

4 Oxford Technical Solutions
Table of contents
Introduction 8
Lane position methodology 8
Distance between multiple vehicles methodology 10
Distance to Fixed points and Feature points methodology 11
Steering robot connection 11
RT-Backpack for pedestrians 11
Outputs 12 Target CAN 12
Scope of Delivery 13
Battery 16
Specification 18
Warranty 20
Conformance notices 21
Regulator testing standards 21
Installation 22
RT-Range S connections 22
LED definitions 23
Hunter vehicle wiring 23
Target vehicle wiring 24
Physical Installation 25
CAN Bus 26
RT Configuration 27
RT Processing Platform 27
IP Addresses 27 RT-Range S system 28 Standard RT-Range system 29
Survey Trolley Assembly 30
Survey Trolley installation 31
Software 35
PC configuration 36
RT-Range User Manual
Revision: 161102
5
Anti-virus software 37
Feature point Survey Wizard 38 Creating Feature points using real-time measurements 39 Deleting Feature points 40 Editing Feature points 40
Main controls 42 View Options control 42 Add Point control 42 Finish Options control 43 Display Data control 43
Lane Survey Wizard 44 Overview 44 Selecting a line filename 45 Connecting to the RT 45 Add point option menu 46 Finish option menu 47 Display data menu 48 Spreadsheet Viewer 52
Map Creation Wizard 53 Selecting a map filename 53 Overview 53 Add Line Options 54 Start Line Option 55 Finish Options 56 View Options 57 Clean Up Line 57 Map View 59 Spreadsheet Viewer 60
Real-Time Display 61 Overview 61 Configure RT-Range menu 62 RT-Range Quick Config 63 File Selection menu 71 Display Data menu 71 Connection configuration using the NAVconnect window 72 Associations and tags 72 Bird’s Eye View 73 Save Data 76
Stop Page 82
Display tab 83
RT-Range Configuration Wizard 84 Overview 84
6 Oxford Technical Solutions
Reading the Initial Configuration 84 Hunter/Targets Setup 85 Lane Measurements 87 Range Measurements 88
Defining polygons 92 Options 93 Committing the configuration to the RT-Range 104 Saving a copy of the RT-Range configuration locally 105
RT-Range Post Processing Wizard 106 Overview 106 Select Data Source 108 Read Configuration 109 Lane Tracking Mode 110 Target Setup 111 Lane Measurements Setup 112 Range Measurements 113 Options 113 Select Fields 113 Output Config 114 Output File 116 Finish Page 116
Outputs 118
CAN bus messages 118 Heartbeat messages 120
Table heading definitions 121
Signals 121
Calculation details 136
Range measurement effects 136 2D and 3D measurement planes 136 Polygons 137 Range velocity with polygons 138 Errors in heading 139 Lateral velocity effects 139 Transient errors due to communication link delay 140
Lane position measurement effects 141 Discontinuous distance 143 Co-ordinates for measurements with respect to the Lines 143 Acceleration on curves 144 Effect of the line survey on the accuracy 145 Rules for the Clean Up Line tool in the Map Creation Wizard 146
RT-Range User Manual
Revision: 161102
7
Line, map and Feature point file format descriptions 147
Line file format 147
Map file format 147 Header fields 148 Line fields 149
Feature point file format 149
RT-Range and the Ibeo feature fusion ADAS reference-system 152
Introduction to the Ibeo Feature Fusion System 152
Benefits of adding the Ibeo Feature Fusion System to the RT-Range system 152
Ibeo Laser View (ILV) visualization 153
Revision history 156
8 Oxford Technical Solutions
Introduction
The RT-Range is a bolt-on system to our RT GNSS-aided inertial and navigation systems. The RT-Range performs two tasks:
1. It measures the position of a vehicle relative to lane markings and other objects.
2. It measures the relative position, i.e. range, between multiple vehicles.
The lane position feature of the RT-Range is useful for testing and validating other technologies for lane position measurement, such as lasers or vision. The range or distance between multiple vehicles is useful for validating cruise control radar and other advanced accident avoidance systems.
The RT-Range is designed to be used with the RT series of products (100 Hz and 250 Hz). The output rate of the RT-Range is determined by the output rate of the RT in the hunter vehicle.
Following a redesign of the RT-Range housing and vehicle-to-vehicle communication hardware, the latest version of the RT-Range is now called the RT-Range S. The RT-Range S is essentially the same as the standard version, but has been re-designed with more robust internal and external connections and uses the RT-XLAN as the preferred method of vehicle-to-vehicle data communication rather than the internal WLANs in the previous design. The use of the RT-XLAN device in the new design will provide a far greater communication range than previously possible.
Throughout the manual there are references to the RT3000. These apply equally to other RT products as well, unless stated otherwise. There will also be references to RT-Range accessories, cables and connections, which may be slightly different depending on whether you have an RT-Range or RT-Range S.
RT-Range software version 141216 (reverse date format) and onwards allow the RT-Range to become a fully featured CAN acquisition system, displaying and logging real-time CAN data from multiple sources within each vehicle alongside RT-Range data. This feature can significantly reduce the complexity of the data collection process. Its use for CAN data is dependent on the RT in the relevant vehicles having the CAN acquisition feature enabled. Please contact OxTS or your local representative for more information.
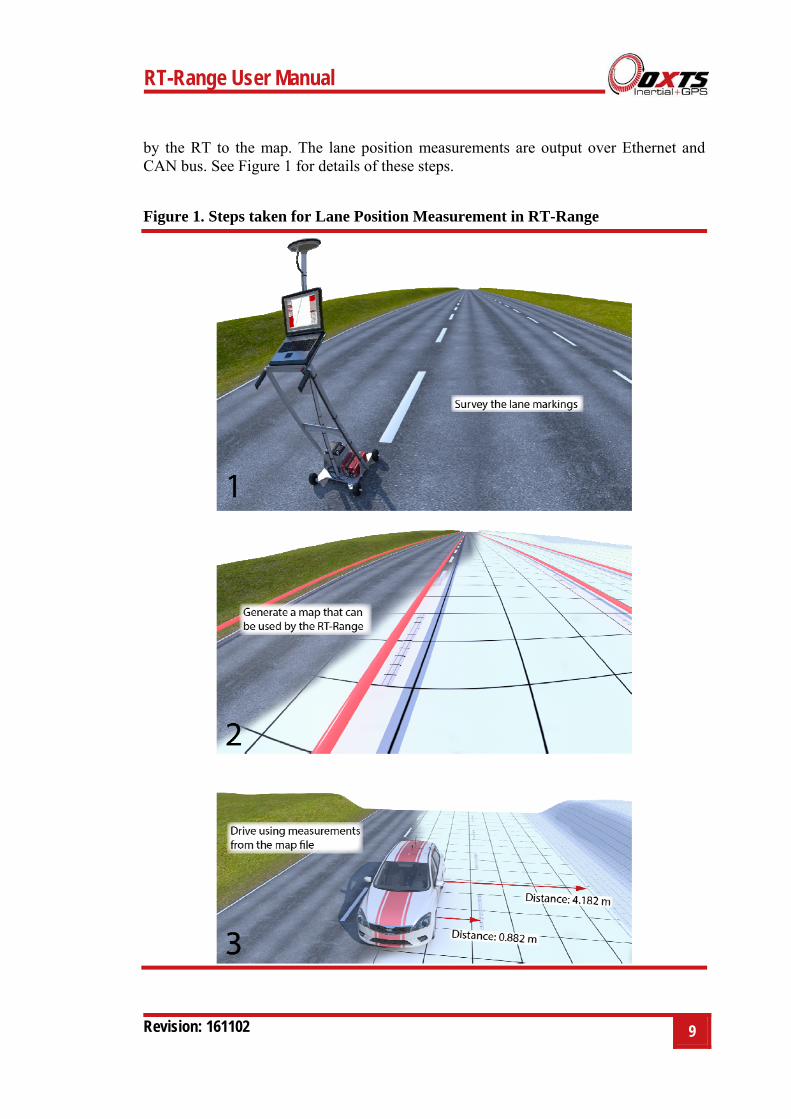
Lane position methodology
Lane position is measured by surveying the road markings using an RT system and generating a map from the data. The RT system is then fitted to the car and the map is downloaded to the RT-Range. The RT-Range compares the current position reported
RT-Range User Manual
Revision: 161102
9
by the RT to the map. The lane position measurements are output over Ethernet and CAN bus. See Figure 1 for details of these steps.
Figure 1. Steps taken for Lane Position Measurement in RT-Range
10 Oxford Technical Solutions
The RT-Range allows up to eight lane markings to be measured. In addition, the RT-Range provides three separate measurement points on the vehicle and gives the distances from these three points to the lane markings. As well as distance, the RT-Range measures velocity and acceleration relative to the lane markings. To help plot the data, the RT-Range also gives the distance travelled along the reference line (Line 1).
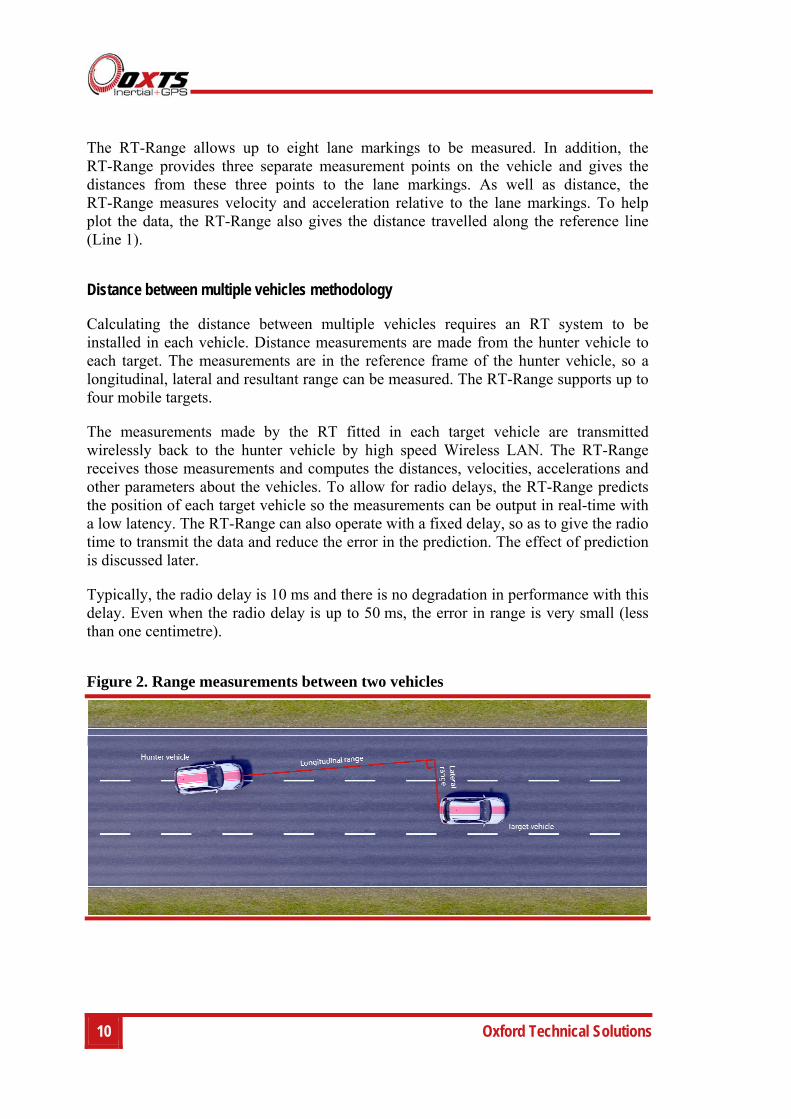
Distance between multiple vehicles methodology
Calculating the distance between multiple vehicles requires an RT system to be installed in each vehicle. Distance measurements are made from the hunter vehicle to each target. The measurements are in the reference frame of the hunter vehicle, so a longitudinal, lateral and resultant range can be measured. The RT-Range supports up to four mobile targets.
The measurements made by the RT fitted in each target vehicle are transmitted wirelessly back to the hunter vehicle by high speed Wireless LAN. The RT-Range receives those measurements and computes the distances, velocities, accelerations and other parameters about the vehicles. To allow for radio delays, the RT-Range predicts the position of each target vehicle so the measurements can be output in real-time with a low latency. The RT-Range can also operate with a fixed delay, so as to give the radio time to transmit the data and reduce the error in the prediction. The effect of prediction is discussed later.
Typically, the radio delay is 10 ms and there is no degradation in performance with this delay. Even when the radio delay is up to 50 ms, the error in range is very small (less than one centimetre).
Figure 2. Range measurements between two vehicles

RT-Range User Manual
Revision: 161102
11
The measurement points on the hunter vehicle and on the target vehicles can be different to the position of the RTs and different to the positions of the lane measurement positions. This makes it easy to compare the RT-Range measurements to those of a radar mounted on the front of the car. The target vehicles can be represented as polygons and the hunter will then track the closest point on the polygon’s perimeter, including interpolating between the polygon points.
Distance to Fixed points and Feature points methodology
Just as the RT-Range measures the distance to a mobile target (another vehicle or pedestrian), it can also measure the distance to a Fixed point (e.g. a balloon car). The RT-Range includes tools to measure the position of Fixed points accurately and quickly.
The RT-Range can also recognise Feature points. Feature points are a large collection of Fixed points representing signs, road markings and other street furniture at known positions. Unlike Fixed points, which are active all the time, a field of view can be defined in the RT-Range to represent a camera. When Feature points enter the “camera’s” field of view, the distance to those Feature points can be computed. For example, along a test route on the public highway, the position and classification of 10,000 Feature points is known; as the vehicle drives along the route, the RT-Range will output the distance to the Feature points that are currently in view.
Steering robot connection
The RT-Range can provide feedback to a steering robot like those supplied by AB Dynamics. This allows the robot to trigger tests based on distance measurements, which is useful for repeatability in Adaptive Cruise Control (ACC) tests. Other Advanced Driver Assistance System (ADAS) tests also benefit from having the AB Dynamics robot triggered by distance measurements. The AB Dynamics robot software can also acquire measurements from the RT-Range and merge it with robot data.
RT-Backpack for pedestrians
The RT-Backpack is designed to work with the RT-Range. It is a target system in a backpack that can be carried by a pedestrian. The RT-Backpack transmits all the signals to the hunter vehicle in the same way as vehicle-based mobile target. The RT-Backpack is designed to be used with the RT2000, RT3000 or RT4000 products, which are fitted in to the RT-Backpack.

12 Oxford Technical Solutions
Outputs
The RT-Range outputs its data over Ethernet and over CAN bus in real-time. The Ethernet values can be picked up by the RT-Range software and displayed on a PC.
Target CAN
The navigation CAN messages from target vehicles are output by the RT-Range Hunter. This allows the acquisition system in the hunter vehicle to collect all the measurements from the hunter vehicle and the target vehicles together.
Note that the CAN bus will be overloaded if all the messages from all the vehicles are put on the CAN bus at one time. The RT-Range software can select the CAN messages and the data rates for all the messages that are put on to the bus.
RT-Range User Manual
Revision: 161102
13
Scope of Delivery
The RT-Range consists of several different sections, these are broken down into:
1. Hunter vehicle components
2. Target vehicle components
3. Survey Trolley and accessories (optional)
A separate table has been made for each section.
In addition to these components an RT (RT2000, RT3000 or RT4000) system is required. Please see the RT manual for the components in an RT system.
14 Oxford Technical Solutions
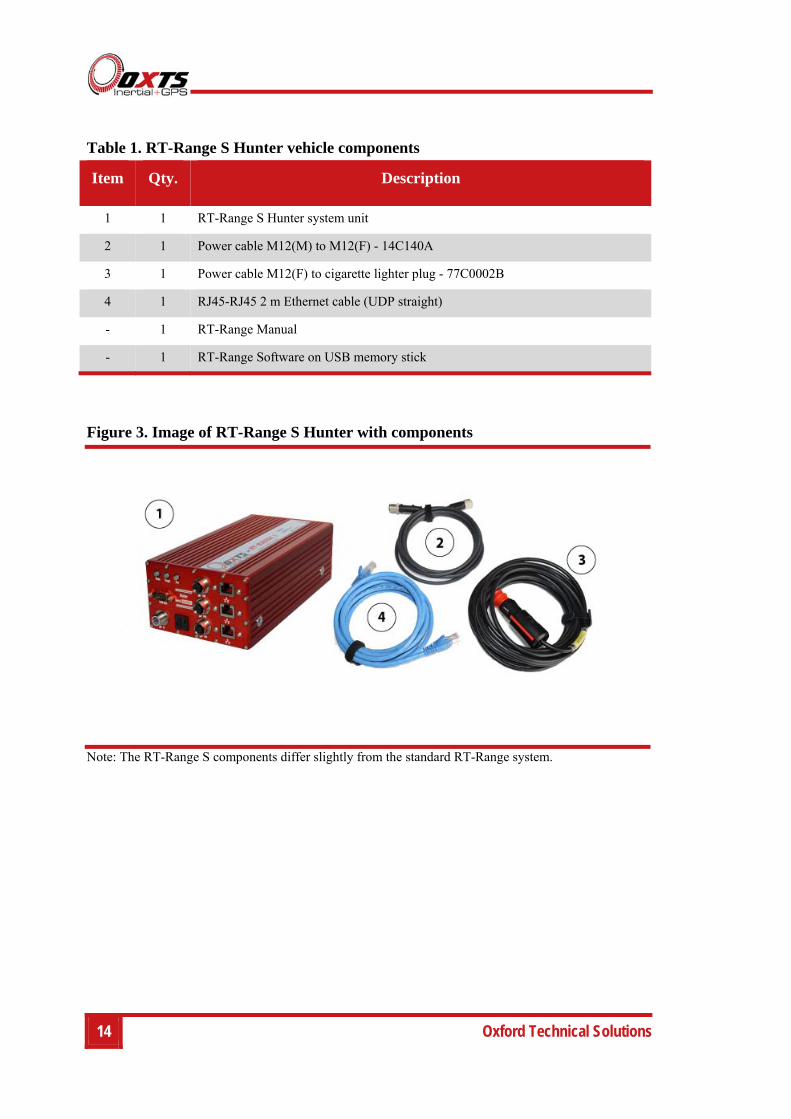
Table 1. RT-Range S Hunter vehicle components
Item Qty. Description
1 1 RT-Range S Hunter system unit
2 1 Power cable M12(M) to M12(F) - 14C140A
3 1 Power cable M12(F) to cigarette lighter plug - 77C0002B
4 1 RJ45-RJ45 2 m Ethernet cable (UDP straight)
- 1 RT-Range Manual
- 1 RT-Range Software on USB memory stick
Figure 3. Image of RT-Range S Hunter with components
Note: The RT-Range S components differ slightly from the standard RT-Range system.

RT-Range User Manual
Revision: 161102
15
Table 2. RT-Range S Target vehicle components
Item Qty. Description
1 1 RT-Range S target system unit
2 1 Power cable M12(M) to M12(F) - 14C140A
3 1 Power cable M12(F) to cigarette lighter plug - 77C0002B
4 1 RJ45-RJ45 2 m Ethernet cable (UDP straight)
- 1 RT-Range Manual
- 1 RT-Range Software on USB memory stick
Figure 4. Image of RT-Range S target with components
Note: The RT-Range S components differ slightly from the standard RT-Range system.
16 Oxford Technical Solutions
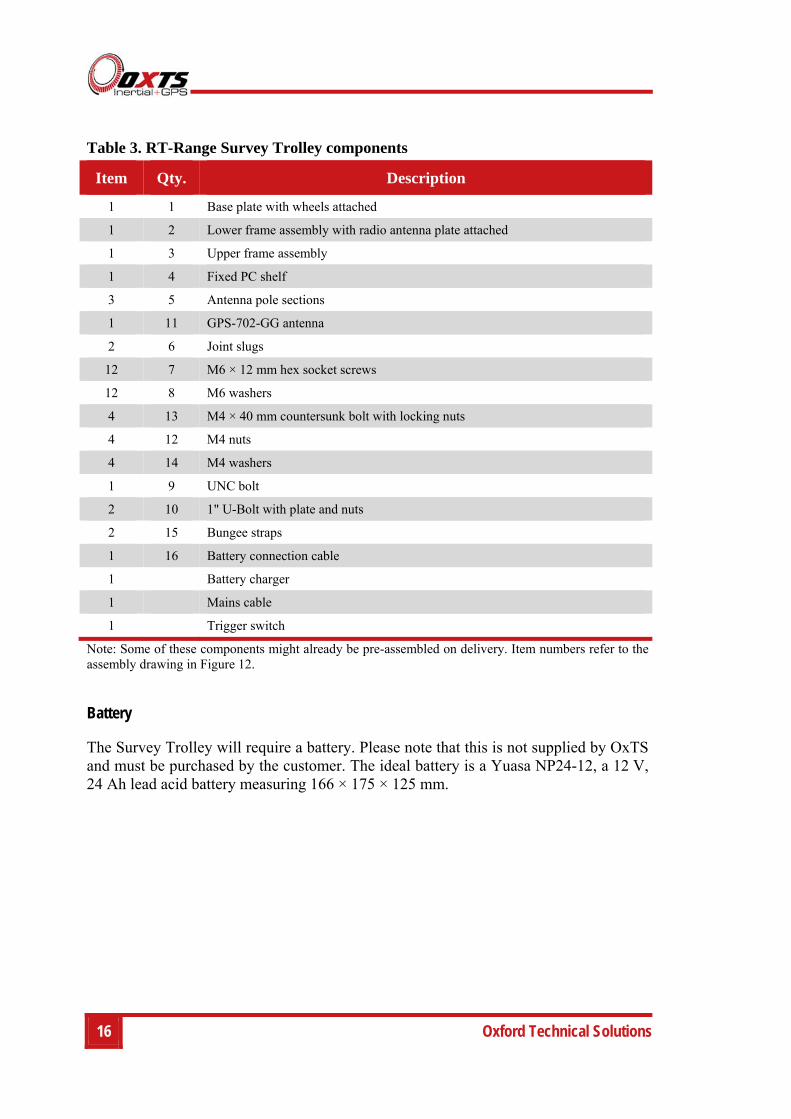
Table 3. RT-Range Survey Trolley components
Item Qty. Description
1 1 Base plate with wheels attached
1 2 Lower frame assembly with radio antenna plate attached
1 3 Upper frame assembly
1 4 Fixed PC shelf
3 5 Antenna pole sections
1 11 GPS-702-GG antenna
2 6 Joint slugs
12 7 M6 × 12 mm hex socket screws
12 8 M6 washers
4 13 M4 × 40 mm countersunk bolt with locking nuts
4 12 M4 nuts
4 14 M4 washers
1 9 UNC bolt
2 10 1" U-Bolt with plate and nuts
2 15 Bungee straps
1 16 Battery connection cable
1 Battery charger
1 Mains cable
1 Trigger switch
Note: Some of these components might already be pre-assembled on delivery. Item numbers refer to the assembly drawing in Figure 12.
Battery
The Survey Trolley will require a battery. Please note that this is not supplied by OxTS and must be purchased by the customer. The ideal battery is a Yuasa NP24-12, a 12 V, 24 Ah lead acid battery measuring 166 × 175 × 125 mm.
RT-Range User Manual
Revision: 161102
17
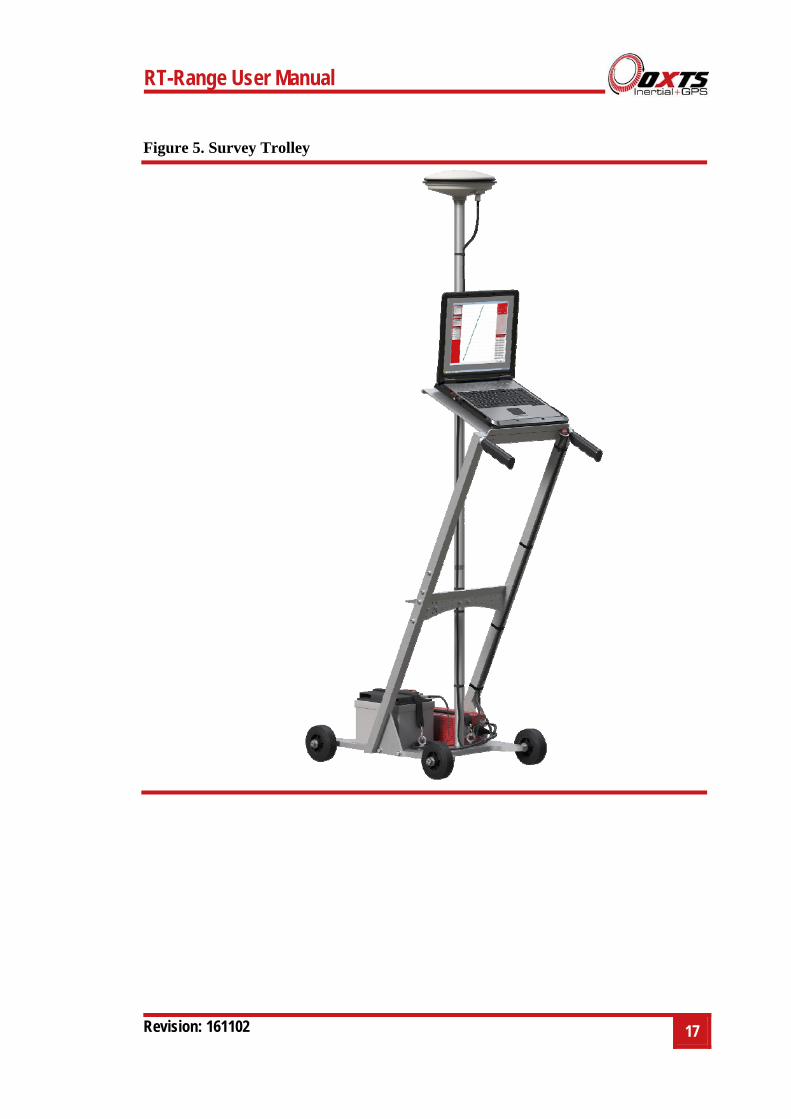
Figure 5. Survey Trolley
18 Oxford Technical Solutions
Specification
The technical specification of the RT-Range depends on both the type of wireless LAN communication link and RT systems being used.
We recommend the use of the RT-XLAN on the RT-Range. Using the RT-XLAN will make it possible to achieve longitudinal ranges in of around 1 km and will improve the data integrity at the lower ranges. However, its use does depend on your location and the local wireless LAN radio laws governing your particular area for suitability. If you are unsure, please contact your local representative for advice.
The RT systems we recommend using are the RT3002, RT3003 or RT2002; these all provide 1–2 cm positioning accuracy depending on the model. If a 250 Hz output rate is required, use an RT4002 or RT4003 series product. The RT-Range can work with lower accuracy and lower cost RT systems, which may be acceptable in long range applications where accuracy is less important.
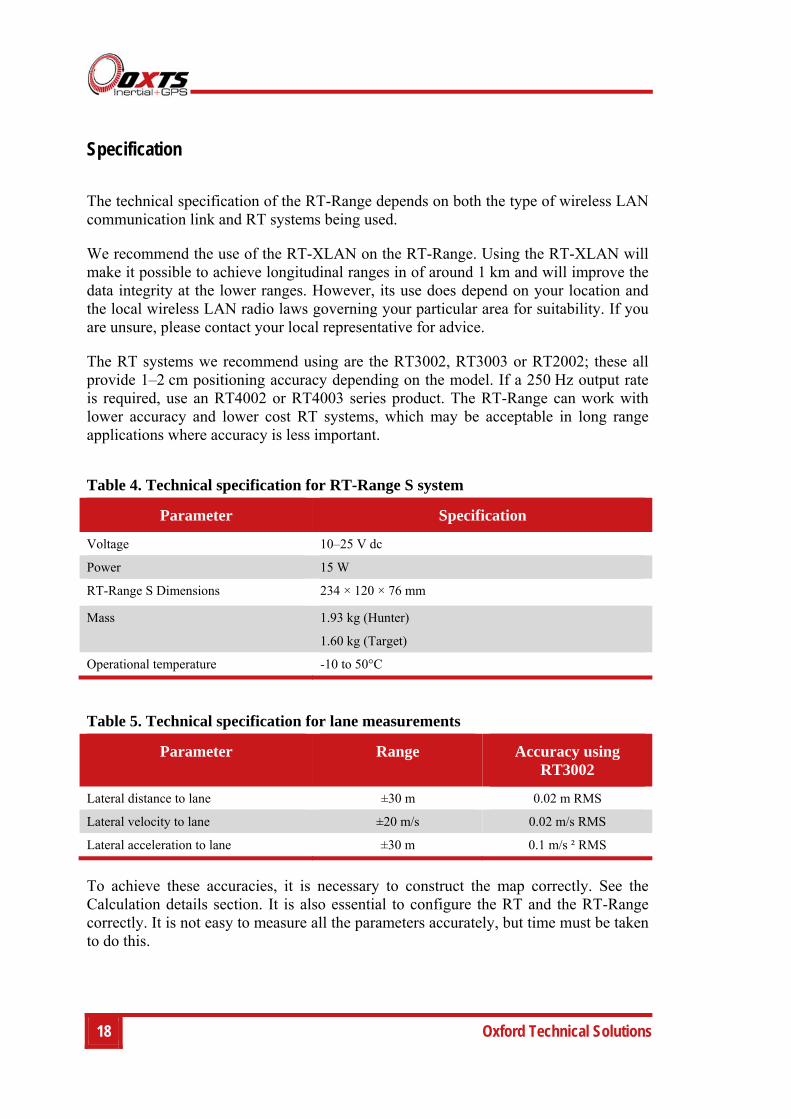
Table 4. Technical specification for RT-Range S system
Parameter Specification
Voltage 10–25 V dc
Power 15 W
RT-Range S Dimensions 234 × 120 × 76 mm
Mass 1.93 kg (Hunter)
1.60 kg (Target)
Operational temperature -10 to 50°C
Table 5. Technical specification for lane measurements
Parameter Range Accuracy using RT3002
Lateral distance to lane ±30 m 0.02 m RMS
Lateral velocity to lane ±20 m/s 0.02 m/s RMS
Lateral acceleration to lane ±30 m 0.1 m/s ² RMS
To achieve these accuracies, it is necessary to construct the map correctly. See the Calculation details section. It is also essential to configure the RT and the RT-Range correctly. It is not easy to measure all the parameters accurately, but time must be taken to do this.
RT-Range User Manual
Revision: 161102
19
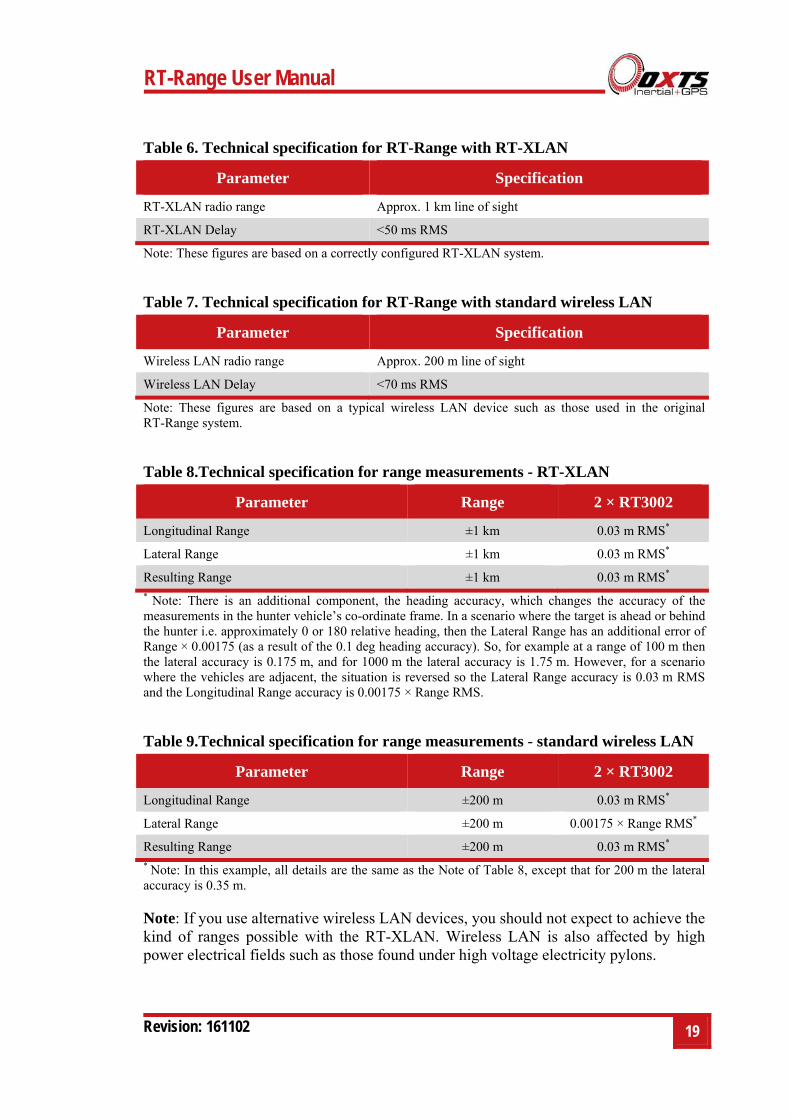
Table 6. Technical specification for RT-Range with RT-XLAN
Parameter Specification
RT-XLAN radio range Approx. 1 km line of sight
RT-XLAN Delay <50 ms RMS
Note: These figures are based on a correctly configured RT-XLAN system.
Table 7. Technical specification for RT-Range with standard wireless LAN
Parameter Specification
Wireless LAN radio range Approx. 200 m line of sight
Wireless LAN Delay <70 ms RMS
Note: These figures are based on a typical wireless LAN device such as those used in the original RT-Range system.
Table 8.Technical specification for range measurements - RT-XLAN
Parameter Range 2 × RT3002
Longitudinal Range ±1 km 0.03 m RMS*
Lateral Range ±1 km 0.03 m RMS*
Resulting Range ±1 km 0.03 m RMS* * Note: There is an additional component, the heading accuracy, which changes the accuracy of the measurements in the hunter vehicle’s co-ordinate frame. In a scenario where the target is ahead or behind the hunter i.e. approximately 0 or 180 relative heading, then the Lateral Range has an additional error of Range × 0.00175 (as a result of the 0.1 deg heading accuracy). So, for example at a range of 100 m then the lateral accuracy is 0.175 m, and for 1000 m the lateral accuracy is 1.75 m. However, for a scenario where the vehicles are adjacent, the situation is reversed so the Lateral Range accuracy is 0.03 m RMS and the Longitudinal Range accuracy is 0.00175 × Range RMS.
Table 9.Technical specification for range measurements - standard wireless LAN
Parameter Range 2 × RT3002
Longitudinal Range ±200 m 0.03 m RMS*
Lateral Range ±200 m 0.00175 × Range RMS*
Resulting Range ±200 m 0.03 m RMS* * Note: In this example, all details are the same as the Note of Table 8, except that for 200 m the lateral accuracy is 0.35 m.
Note: If you use alternative wireless LAN devices, you should not expect to achieve the kind of ranges possible with the RT-XLAN. Wireless LAN is also affected by high power electrical fields such as those found under high voltage electricity pylons.

20 Oxford Technical Solutions
Warranty
Oxford Technical Solutions Limited warrants its products to be free of defects in materials and workmanship, subject to the conditions set forth below, for a period of one year from the Date of Sale.
‘Date of Sale’ shall mean the date of the Oxford Technical Solutions Limited invoice issued on delivery of the product. The responsibility of Oxford Technical Solutions Limited in respect of this warranty is limited solely to product replacement or product repair at an authorised location only. Determination of replacement or repair will be made by Oxford Technical Solutions Limited personnel or by personnel expressly authorised by Oxford Technical Solutions Limited for this purpose.
In no event will Oxford Technical Solutions Limited be liable for any indirect, incidental, special or consequential damages whether through tort, contract or otherwise. This warranty is expressly in lieu of all other warranties, expressed or implied, including without limitation the implied warranties of merchantability or fitness for a particular purpose. The foregoing states the entire liability of Oxford Technical Solutions Limited with respect to the products herein.
RT-Range User Manual
Revision: 161102
21
Conformance notices
The RT-Range S complies with the radiated emission limits for 47CFR15.109:2014 class A of Part 15 subpart B of the FCC rules, and with the emission and immunity limits for class A of EN 55022. These limits are designed to provide reasonable protection against harmful interference in business, commercial and industrial uses. This equipment generates, uses and can radiate radio frequency energy and, if not installed and used in accordance with the instructions, may cause harmful interference to radio communications. However, there is no guarantee that interference will not occur in a particular installation. If this equipment does cause harmful interference to radio or television reception, which can be determined by turning the equipment off and on, the user is encouraged to try to correct the interference by one or more of the following:
Re-orient or relocate the receiving antenna.
Increase the separation between the equipment and the receiver.
The RT-Range S conforms to the requirements for CE.
Regulator testing standards
FCC rules, Title 47 CFR (March 2014), Part 15.109, Class A limits
EN 55022:2010
EN 55024:2010
EN 61326-2-1:2006 using the general requirements of EN 61326-1:2006
EN 61326-1-1:2013 using the general requirements of EN 61326-1:2013
22 Oxford Technical Solutions
Installation
The installation of the RT-Range assumes that the RT systems have already been installed correctly in the vehicle. It also assumes that you have an RT-Range S system with an RT-XLAN vehicle-to-vehicle communication device. If you have a standard RT-Range system, then the wiring is similar to that shown here except that it uses a standard WLAN integrated into the RT-Range case.
It is possible to use the RT-XLAN with the standard RT-Range system or directly to the RT in the target vehicle and this is described in the RT-XLAN manual.
Please contact [email protected] if further wiring or configuration advice is required.
RT-Range S connections
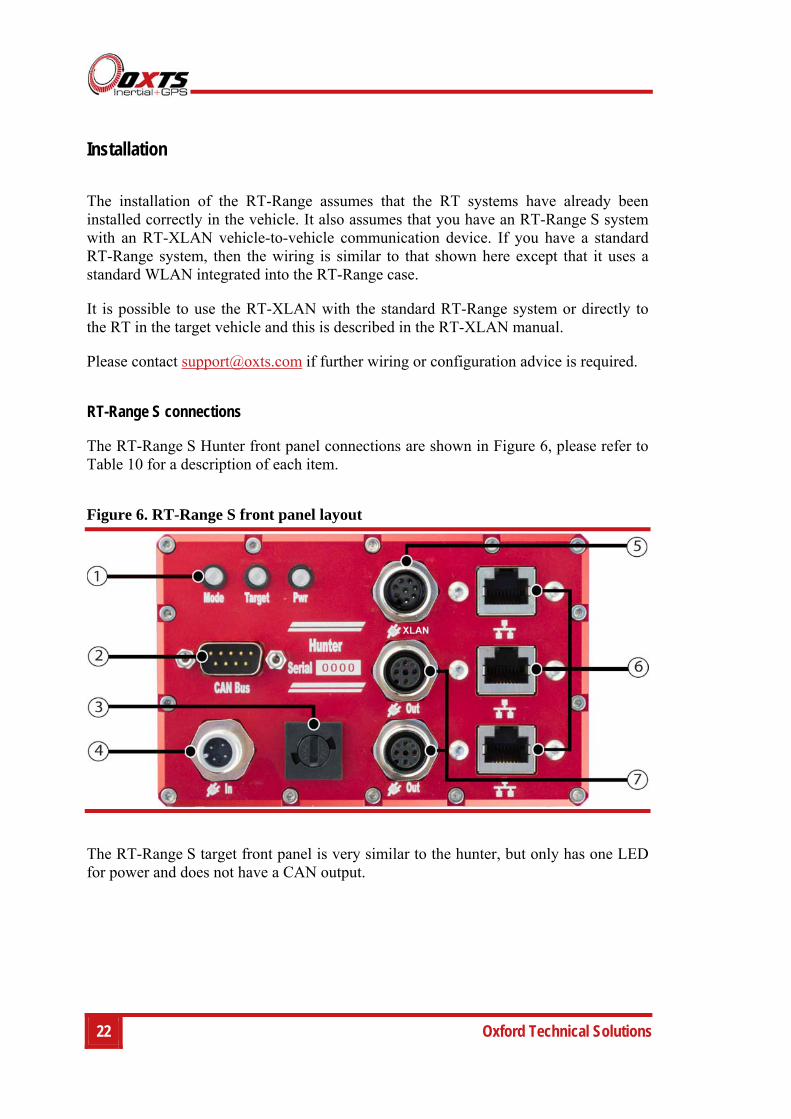
The RT-Range S Hunter front panel connections are shown in Figure 6, please refer to Table 10 for a description of each item.
Figure 6. RT-Range S front panel layout
The RT-Range S target front panel is very similar to the hunter, but only has one LED for power and does not have a CAN output.
RT-Range User Manual
Revision: 161102
23
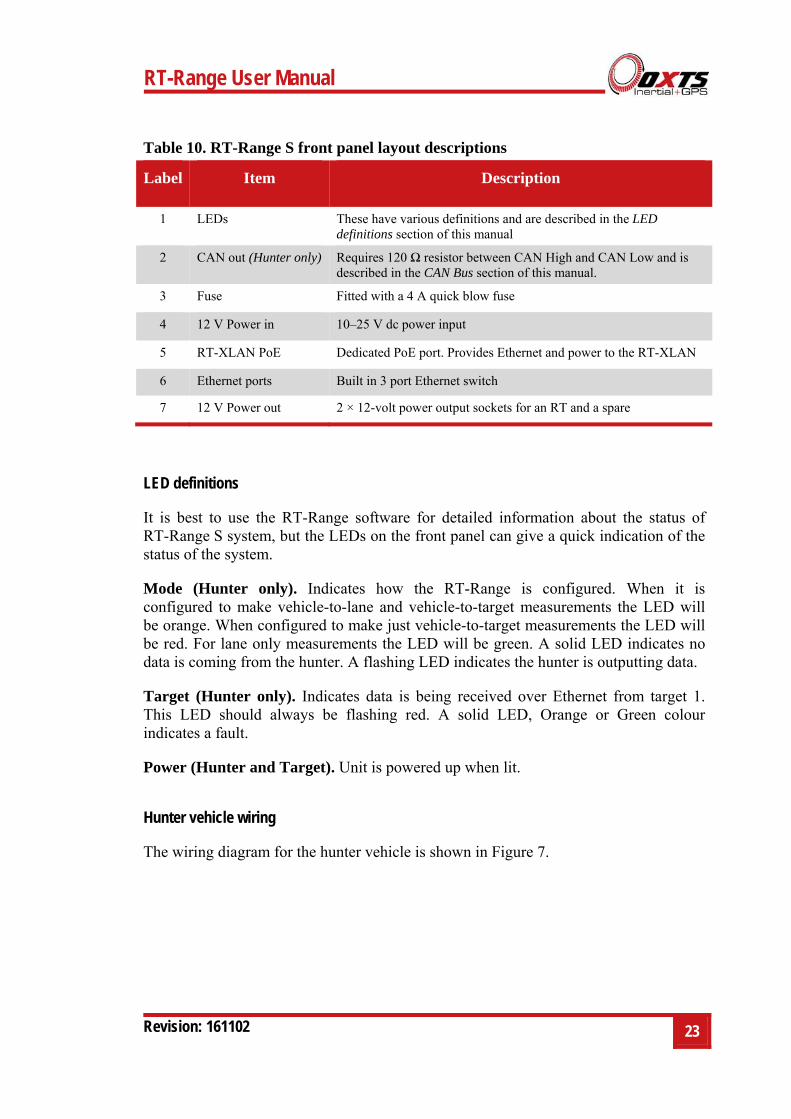
Table 10. RT-Range S front panel layout descriptions
Label Item Description
1 LEDs These have various definitions and are described in the LED definitions section of this manual
2 CAN out (Hunter only) Requires 120 Ω resistor between CAN High and CAN Low and is described in the CAN Bus section of this manual.
3 Fuse Fitted with a 4 A quick blow fuse
4 12 V Power in 10–25 V dc power input
5 RT-XLAN PoE Dedicated PoE port. Provides Ethernet and power to the RT-XLAN
6 Ethernet ports Built in 3 port Ethernet switch
7 12 V Power out 2 × 12-volt power output sockets for an RT and a spare
LED definitions
It is best to use the RT-Range software for detailed information about the status of RT-Range S system, but the LEDs on the front panel can give a quick indication of the status of the system.
Mode (Hunter only). Indicates how the RT-Range is configured. When it is configured to make vehicle-to-lane and vehicle-to-target measurements the LED will be orange. When configured to make just vehicle-to-target measurements the LED will be red. For lane only measurements the LED will be green. A solid LED indicates no data is coming from the hunter. A flashing LED indicates the hunter is outputting data.
Target (Hunter only). Indicates data is being received over Ethernet from target 1. This LED should always be flashing red. A solid LED, Orange or Green colour indicates a fault.
Power (Hunter and Target). Unit is powered up when lit.
Hunter vehicle wiring
The wiring diagram for the hunter vehicle is shown in Figure 7.
24 Oxford Technical Solutions
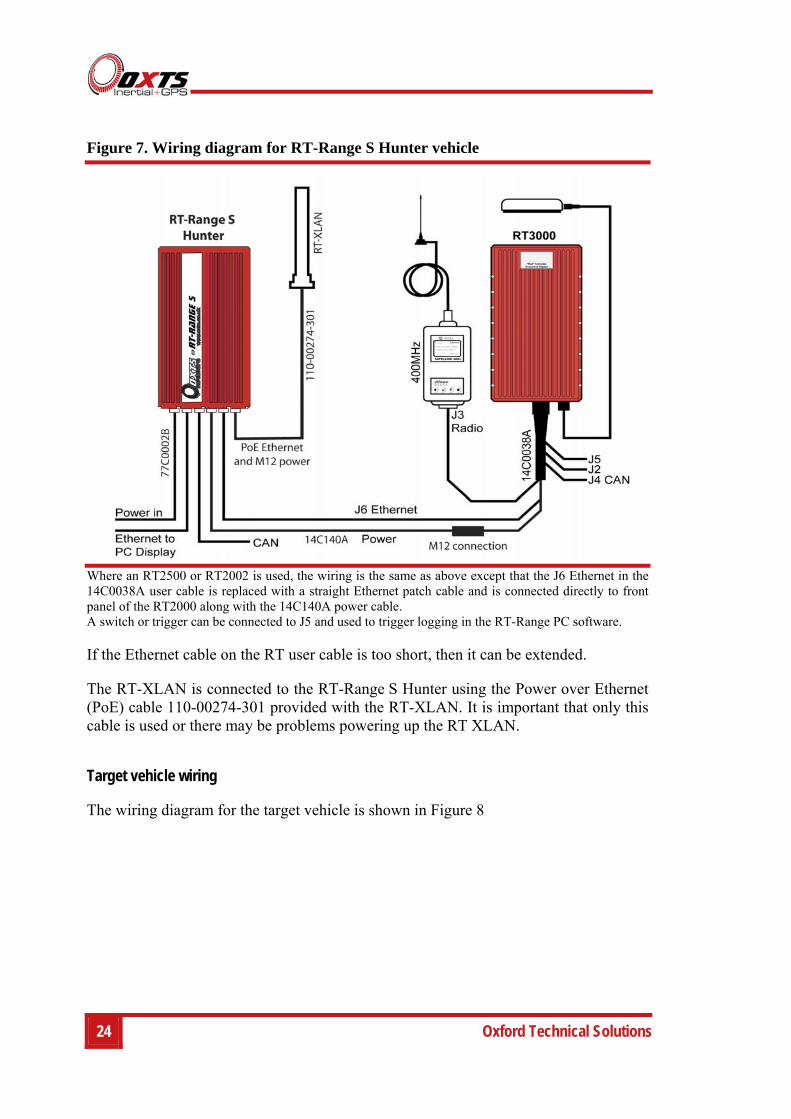
Figure 7. Wiring diagram for RT-Range S Hunter vehicle
Where an RT2500 or RT2002 is used, the wiring is the same as above except that the J6 Ethernet in the 14C0038A user cable is replaced with a straight Ethernet patch cable and is connected directly to front panel of the RT2000 along with the 14C140A power cable. A switch or trigger can be connected to J5 and used to trigger logging in the RT-Range PC software.
If the Ethernet cable on the RT user cable is too short, then it can be extended.
The RT-XLAN is connected to the RT-Range S Hunter using the Power over Ethernet (PoE) cable 110-00274-301 provided with the RT-XLAN. It is important that only this cable is used or there may be problems powering up the RT XLAN.
Target vehicle wiring
The wiring diagram for the target vehicle is shown in Figure 8
RT-Range User Manual
Revision: 161102
25
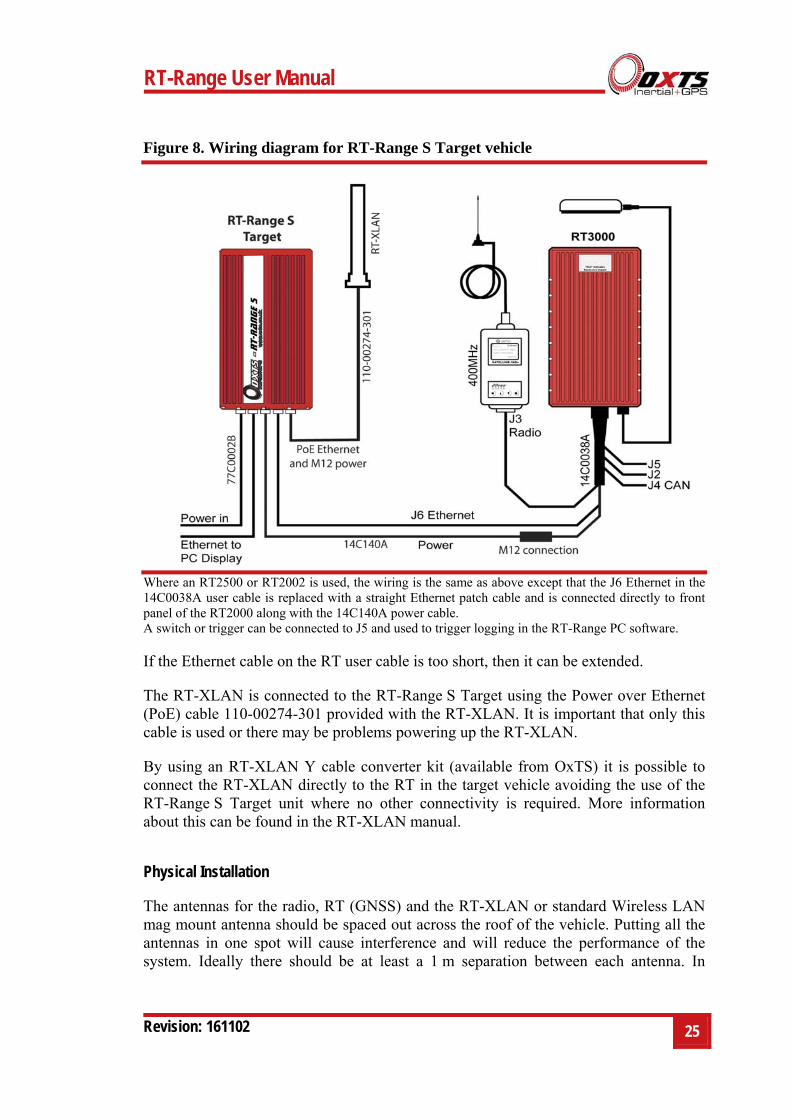
Figure 8. Wiring diagram for RT-Range S Target vehicle
Where an RT2500 or RT2002 is used, the wiring is the same as above except that the J6 Ethernet in the 14C0038A user cable is replaced with a straight Ethernet patch cable and is connected directly to front panel of the RT2000 along with the 14C140A power cable. A switch or trigger can be connected to J5 and used to trigger logging in the RT-Range PC software.
If the Ethernet cable on the RT user cable is too short, then it can be extended.
The RT-XLAN is connected to the RT-Range S Target using the Power over Ethernet (PoE) cable 110-00274-301 provided with the RT-XLAN. It is important that only this cable is used or there may be problems powering up the RT-XLAN.
By using an RT-XLAN Y cable converter kit (available from OxTS) it is possible to connect the RT-XLAN directly to the RT in the target vehicle avoiding the use of the RT-Range S Target unit where no other connectivity is required. More information about this can be found in the RT-XLAN manual.
Physical Installation
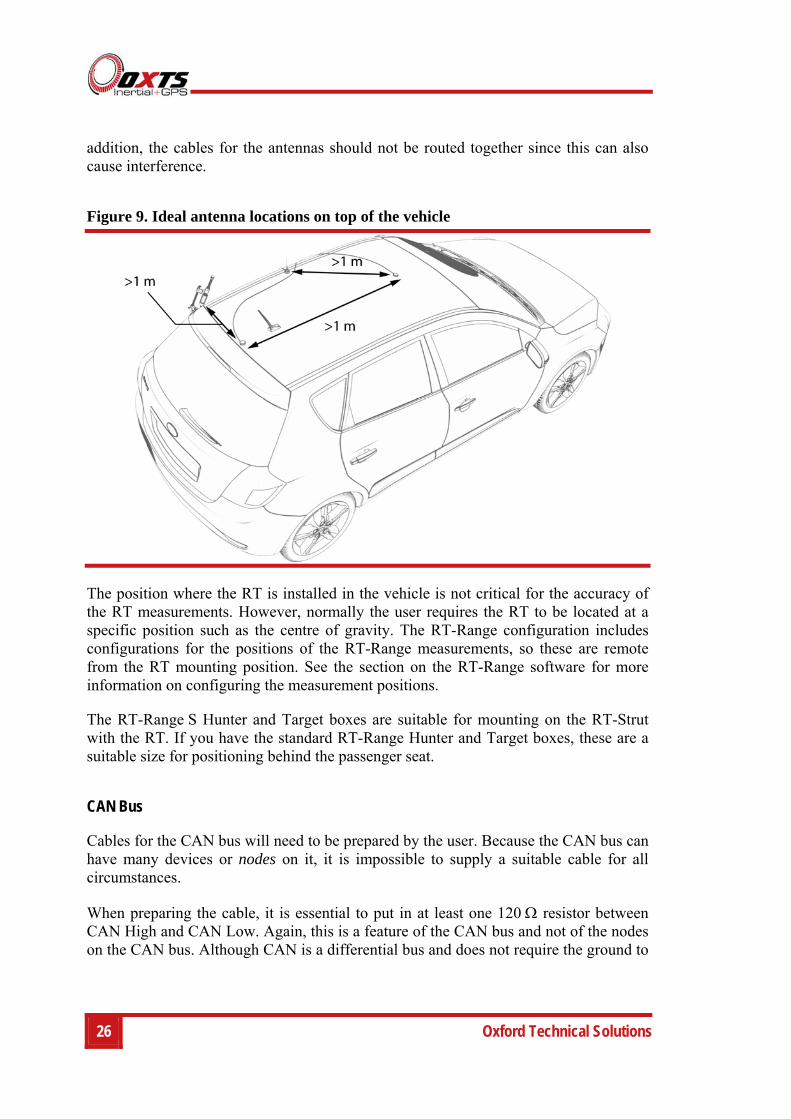
The antennas for the radio, RT (GNSS) and the RT-XLAN or standard Wireless LAN mag mount antenna should be spaced out across the roof of the vehicle. Putting all the antennas in one spot will cause interference and will reduce the performance of the system. Ideally there should be at least a 1 m separation between each antenna. In
26 Oxford Technical Solutions
addition, the cables for the antennas should not be routed together since this can also cause interference.
Figure 9. Ideal antenna locations on top of the vehicle
The position where the RT is installed in the vehicle is not critical for the accuracy of the RT measurements. However, normally the user requires the RT to be located at a specific position such as the centre of gravity. The RT-Range configuration includes configurations for the positions of the RT-Range measurements, so these are remote from the RT mounting position. See the section on the RT-Range software for more information on configuring the measurement positions.
The RT-Range S Hunter and Target boxes are suitable for mounting on the RT-Strut with the RT. If you have the standard RT-Range Hunter and Target boxes, these are a suitable size for positioning behind the passenger seat.
CAN Bus
Cables for the CAN bus will need to be prepared by the user. Because the CAN bus can have many devices or nodes on it, it is impossible to supply a suitable cable for all circumstances.
When preparing the cable, it is essential to put in at least one 120 resistor between CAN High and CAN Low. Again, this is a feature of the CAN bus and not of the nodes on the CAN bus. Although CAN is a differential bus and does not require the ground to
RT-Range User Manual
Revision: 161102
27
be connected, many systems will not work unless the ground is connected. You are advised to always connect the grounds of the systems.
See the cable drawings for details of the connections required for the CAN bus.
RT Configuration
Full instructions on how to configure the RT are supplied in the RT User Manual. Only the settings applicable to the RT-Range are listed here.
The RT-Range and the RT can both displace their measurements to a remote position. If the RT has a displaced output, then the RT-Range will work from that displaced output position and not from the mounting location of the RT. In other words, the RT’s output displacement will displace all the measurement points of the RT-Range.
For simplicity, you are advised to disable the Output Displacement option of the RT systems and only use the output displacement options of the RT-Range.
The CAN baud rate for the RT-Range, the RT and for the other nodes on the CAN bus must be the same.
The performance of the wireless LAN can be improved by delaying the Ethernet output of some of the RTs. Normally each target is delayed by a different amount so that their output on the wireless LAN does not clash. This can be configured on the Ethernet option of NAVconfig.
RT Processing Platform
Only the latest “TP500” and “TP600” processing platforms can work with 250 Hz products or in installations where there are 4 targets. The older platforms, such as the TP400, do not have sufficient processing power and will give incorrect results. The following FAQ describes how to find which processing platform is in an RT system:
http://support.oxts.com/faqs/topic/how-can-i-check-what-model-of-processor-card-is-fitted-in-my-unit/
IP Addresses
The RT-Range and the RTs communicate using TCP/IP. If some of the RTs have the same IP address, then it will be necessary to change the IP addresses so that they do not clash. The RT-Range will identify which RT is performing each task by the IP address of the relevant RT. You must not have two (or more) devices on the same network with the same IP address.
28 Oxford Technical Solutions
Each RT has a static IP address. This is normally in the range 195.0.0.10 to 195.0.0.99. Some early systems are not in this range.
The RT-Range Hunter has its own IP address. This is normally in the range 195.0.0.110 to 195.0.0.120. Again, some early systems are not in this range.
The IP configurations of the wireless LAN devices used for vehicle-to-vehicle communication will vary depending on whether you have an RT-Range S with RT-XLAN or the standard RT-Range system. The differences are shown in Figure 10 and Figure 11.
The RT-Range S system can be used with other types of wireless LAN devices if required. For configuration, you should follow the basic examples shown in this manual while referring to the guidelines of the relevant manual for the wireless LAN device you are using.
RT-Range S system
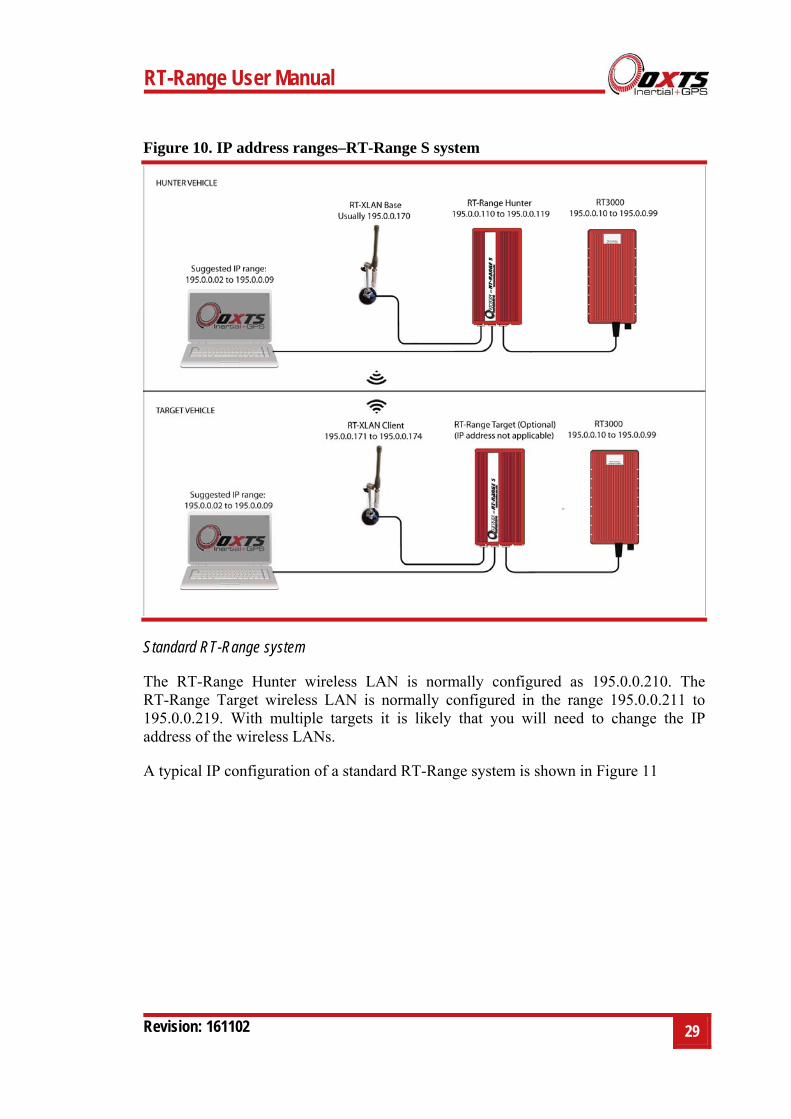
For the purposes of this illustration, the manual will refer to the RT-XLAN for configuration of the RT-Range S system.
The RT-XLAN will normally be factory configured as follows:
RT-XLAN Base [Hunter]: 195.0.0.170
RT-XLAN Client [Target 1,2,3,4]: In the range of 195.0.0.171 to 195.0.0.174
Each RT-XLAN will be marked showing its IP address and configuration. This may be especially useful if you have ordered different IP addresses to the standard ones.
For more information about the RT-XLAN configuration please refer to the RT-XLAN user manual.
For alternative wireless LAN devices, the “Base” should be configured as an “Access Point” in “network bridge” mode, and the “Client” should be configured as a “station” in “network bridge” mode. There may be variations to this for different wireless LAN devices and we recommend speaking to the WLAN device manufacturer, asking them for the best way to achieve a Base - Client configuration as specified above.
A typical IP configuration of an RT-Range S system is shown in Figure 10.
RT-Range User Manual
Revision: 161102
29
Figure 10. IP address ranges–RT-Range S system
Standard RT-Range system
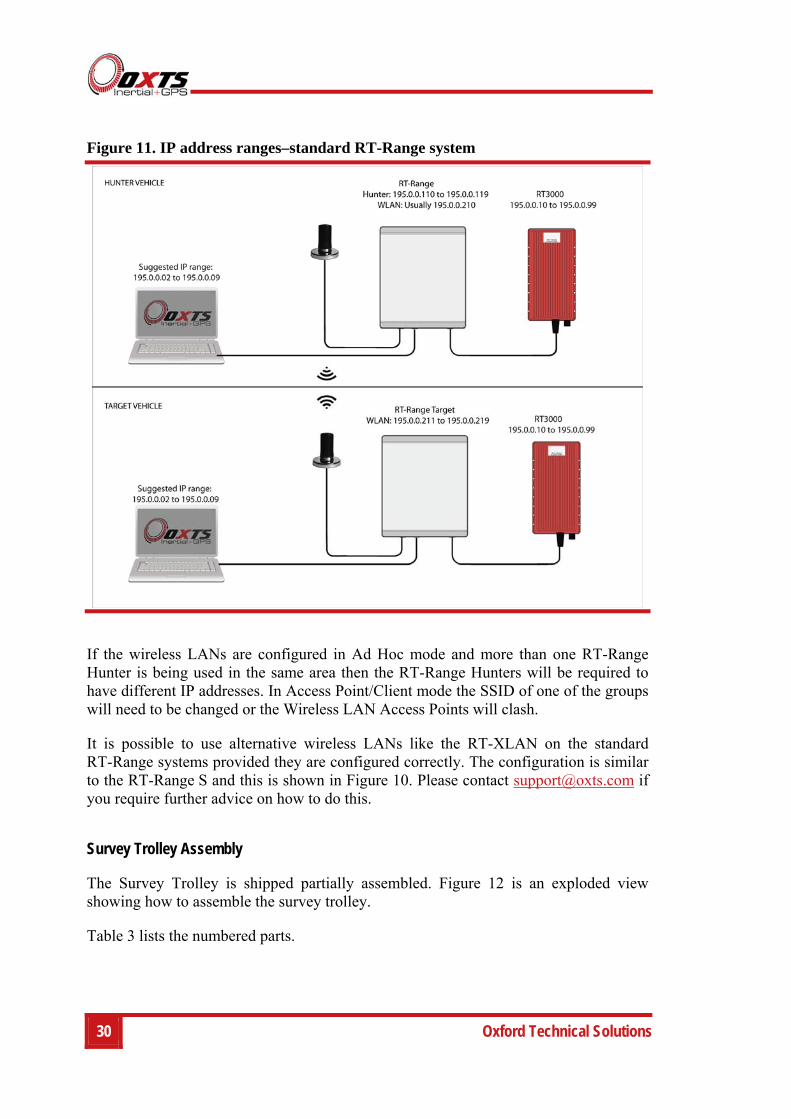
The RT-Range Hunter wireless LAN is normally configured as 195.0.0.210. The RT-Range Target wireless LAN is normally configured in the range 195.0.0.211 to 195.0.0.219. With multiple targets it is likely that you will need to change the IP address of the wireless LANs.
A typical IP configuration of a standard RT-Range system is shown in Figure 11
30 Oxford Technical Solutions
Figure 11. IP address ranges–standard RT-Range system
If the wireless LANs are configured in Ad Hoc mode and more than one RT-Range Hunter is being used in the same area then the RT-Range Hunters will be required to have different IP addresses. In Access Point/Client mode the SSID of one of the groups will need to be changed or the Wireless LAN Access Points will clash.
It is possible to use alternative wireless LANs like the RT-XLAN on the standard RT-Range systems provided they are configured correctly. The configuration is similar to the RT-Range S and this is shown in Figure 10. Please contact [email protected] if you require further advice on how to do this.
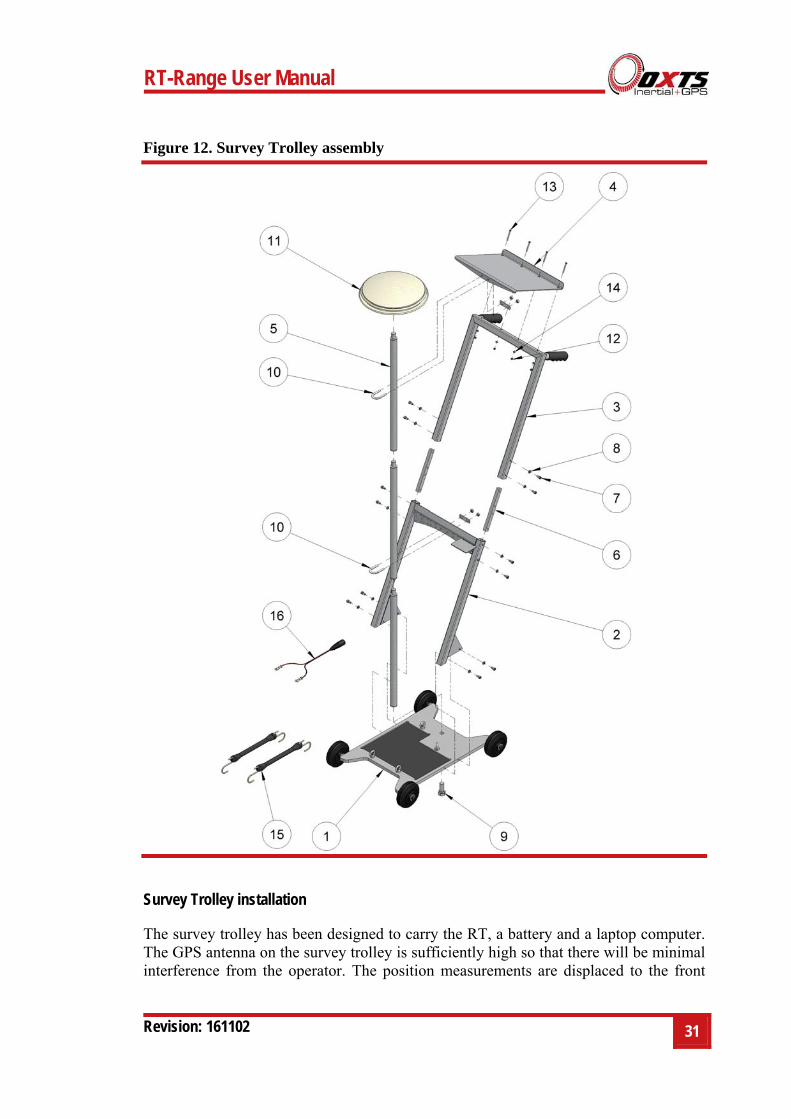
Survey Trolley Assembly
The Survey Trolley is shipped partially assembled. Figure 12 is an exploded view showing how to assemble the survey trolley.
Table 3 lists the numbered parts.
RT-Range User Manual
Revision: 161102
31
Figure 12. Survey Trolley assembly
Survey Trolley installation
The survey trolley has been designed to carry the RT, a battery and a laptop computer. The GPS antenna on the survey trolley is sufficiently high so that there will be minimal interference from the operator. The position measurements are displaced to the front
32 Oxford Technical Solutions
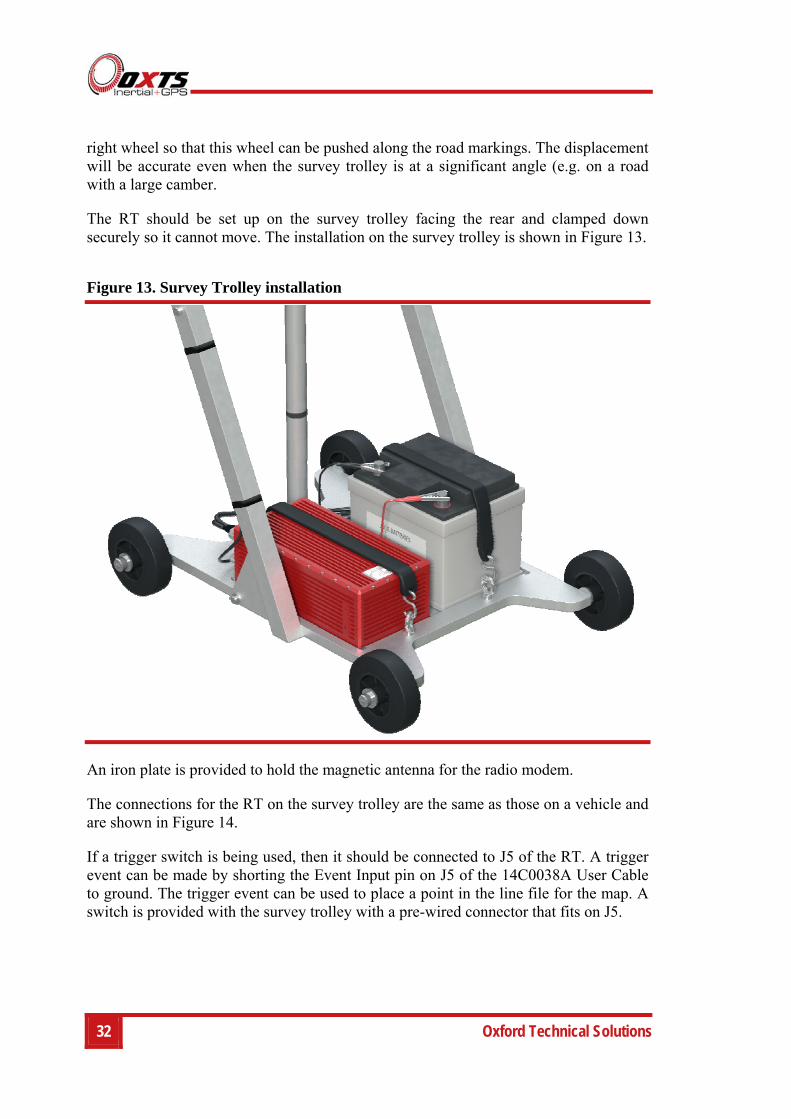
right wheel so that this wheel can be pushed along the road markings. The displacement will be accurate even when the survey trolley is at a significant angle (e.g. on a road with a large camber.
The RT should be set up on the survey trolley facing the rear and clamped down securely so it cannot move. The installation on the survey trolley is shown in Figure 13.
Figure 13. Survey Trolley installation
An iron plate is provided to hold the magnetic antenna for the radio modem.
The connections for the RT on the survey trolley are the same as those on a vehicle and are shown in Figure 14.
If a trigger switch is being used, then it should be connected to J5 of the RT. A trigger event can be made by shorting the Event Input pin on J5 of the 14C0038A User Cable to ground. The trigger event can be used to place a point in the line file for the map. A switch is provided with the survey trolley with a pre-wired connector that fits on J5.
RT-Range User Manual
Revision: 161102
33
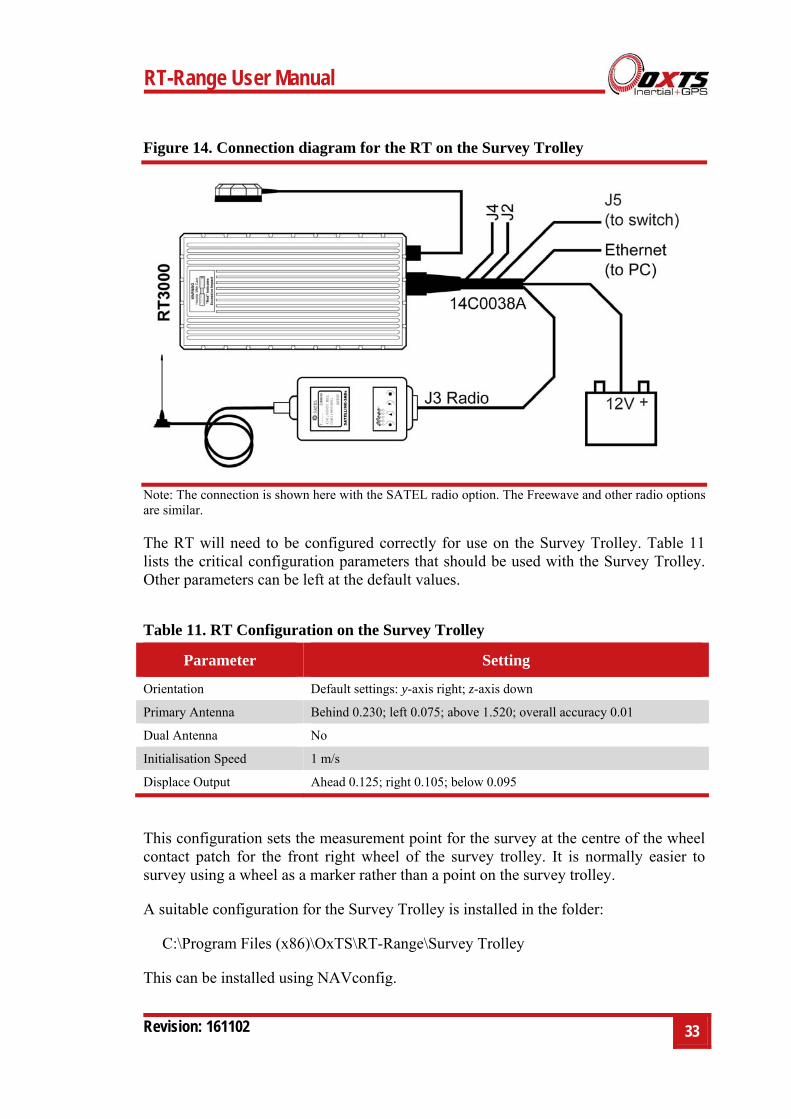
Figure 14. Connection diagram for the RT on the Survey Trolley
Note: The connection is shown here with the SATEL radio option. The Freewave and other radio options are similar.
The RT will need to be configured correctly for use on the Survey Trolley. Table 11 lists the critical configuration parameters that should be used with the Survey Trolley. Other parameters can be left at the default values.
Table 11. RT Configuration on the Survey Trolley
Parameter Setting
Orientation Default settings: y-axis right; z-axis down
Primary Antenna Behind 0.230; left 0.075; above 1.520; overall accuracy 0.01
Dual Antenna No
Initialisation Speed 1 m/s
Displace Output Ahead 0.125; right 0.105; below 0.095
This configuration sets the measurement point for the survey at the centre of the wheel contact patch for the front right wheel of the survey trolley. It is normally easier to survey using a wheel as a marker rather than a point on the survey trolley.
A suitable configuration for the Survey Trolley is installed in the folder:
C:\Program Files (x86)\OxTS\RT-Range\Survey Trolley
This can be installed using NAVconfig.

34 Oxford Technical Solutions
To initialise the RT on the Survey Trolley push the Survey Trolley in a forward direction at a speed exceeding 1 m/s. You should be going straight when the RT initialises. Afterwards you should make some turns, accelerate and brake so that the RT can estimate some of the errors in its sensors.
The battery recommended for use with the Survey Trolley is a lead-acid battery. This should be kept in a charged state; it should be recharged immediately after each use. Lead-acid batteries tend to degrade if left in an uncharged state.
To charge the battery, connect the charger to the battery and plug the charger into the mains. The light on the charger will indicate green when the battery is fully charged. The charger can be left on the battery at all times when the battery is not in use.
Lead-acid batteries require special disposal in most countries. To dispose of the battery take it to the appropriate waste disposal place.
RT-Range User Manual
Revision: 161102
35
Software
RT-Range Software consists of five modules. These are:
1. Feature point Survey
2. Lane Survey
3. Map Creation
4. Real-Time Display
5. Post Processing
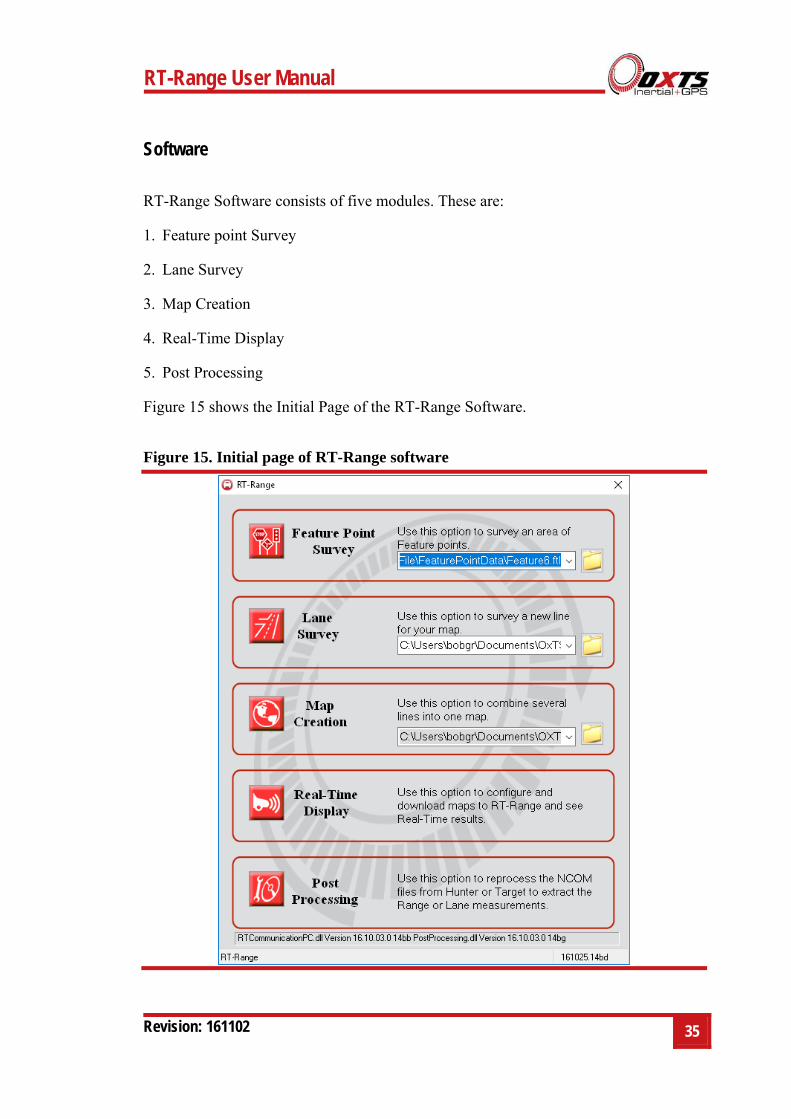
Figure 15 shows the Initial Page of the RT-Range Software.
Figure 15. Initial page of RT-Range software
36 Oxford Technical Solutions
Feature Point Survey. The Feature point Survey Wizard is used to quickly build Feature point files using information from a live RT. Up to 65,000 Feature points can be contained in a single file. The main window of the Feature point Survey Wizard shows each Feature point and can be used to edit the properties of each point. Once complete, a Feature point map can be uploaded to the RT-Range S.
Lane Survey. The Lane Survey Wizard is used to survey the lane markings on the road. Several lines are used to generate a map. Each line file has an RTRL extension and consist of GPS information such as latitude, longitude, altitude, number of satellites and measurement accuracy. The main window of the Lane Survey Wizard will show the position and orientation of added points. It also updates the current position and orientation in real-time using the measurements from the RT.
Map Creation. The Map Creation Wizard creates maps using the line files that have been recorded using the Lane Survey Wizard. This wizard gives the flexibility of adding new points to a line, deleting points from a line or changing the position of the point on the map using the mouse. Lines added to the map can be deleted from the map and the order of points in the line can be reversed so that surveys conducted in reverse make sense. A map file may contain up to eight lines. The file extension for the map files is RTRM. Using the Map Creation Wizard you can add the start line to the map.
Real-Time Display. Once the map files are created the Real-Time Display can be used to download the map files and Feature point files to the RT-Range, configure other RT-Range settings and display the RT-Range measurements in real-time. RT-Range measurements can be stored to files using the Real-Time Display.
Post-Processing Wizard. The Post-Processing Wizard can be used to reprocess the NCOM files from the hunter vehicle and target vehicles for range measurements; use a map file for lane position measurements and/or use Fixed point file for Fixed point range measurements. The lane and range measurements are saved in a CSV file format. The Post-Processing Wizard can also be used to convert the binary files stored by the Real-Time Display into CSV format.
PC configuration
The RT-Range software communicates with the RT-Range hardware and the RTs using Ethernet. For this communication to work, the Ethernet of the PC must be configured correctly.
The PC should have an IP address in the range 195.0.0.2 to 195.0.0.9, or any other Ethernet address on this network that is not used. The subnet mask should be 255.255.255.0.
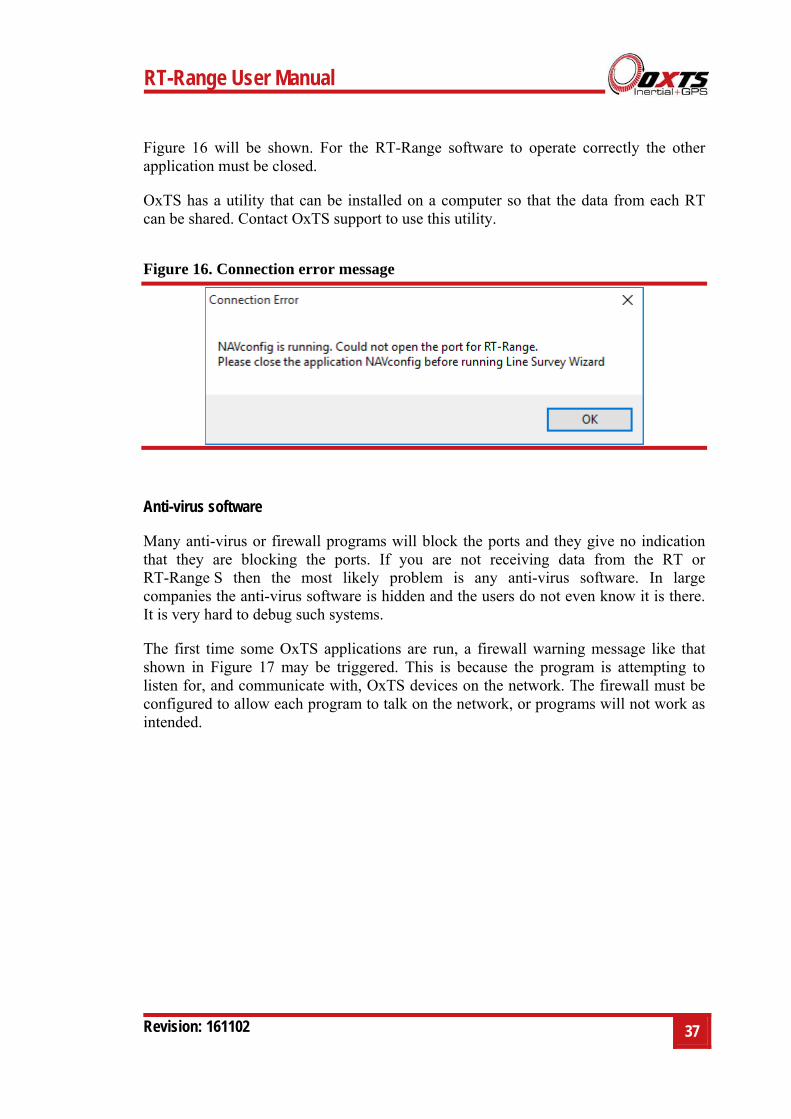
The RT-Range software needs to open Ethernet port 3000 to communicate with the RT in the hunter (or target) vehicle. This port can only be opened by one application at a time; if any other application is running and has the port open then the error message in
RT-Range User Manual
Revision: 161102
37
Figure 16 will be shown. For the RT-Range software to operate correctly the other application must be closed.
OxTS has a utility that can be installed on a computer so that the data from each RT can be shared. Contact OxTS support to use this utility.
Figure 16. Connection error message
Anti-virus software
Many anti-virus or firewall programs will block the ports and they give no indication that they are blocking the ports. If you are not receiving data from the RT or RT-Range S then the most likely problem is any anti-virus software. In large companies the anti-virus software is hidden and the users do not even know it is there. It is very hard to debug such systems.
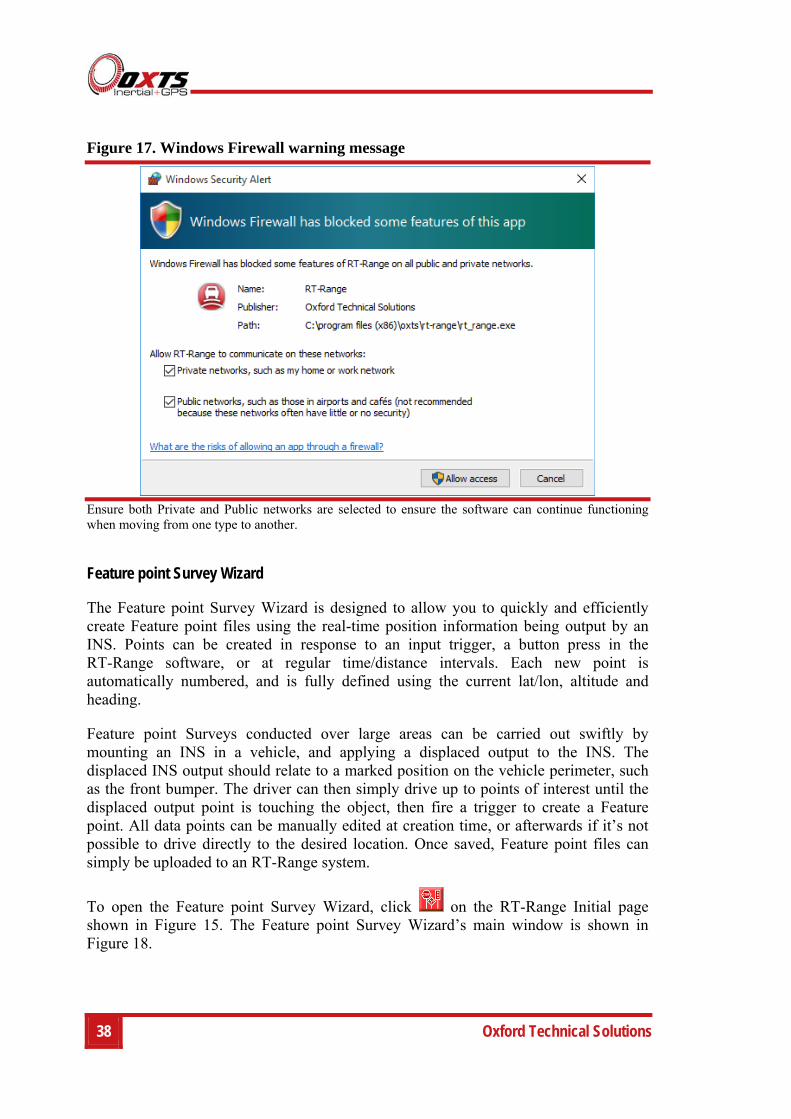
The first time some OxTS applications are run, a firewall warning message like that shown in Figure 17 may be triggered. This is because the program is attempting to listen for, and communicate with, OxTS devices on the network. The firewall must be configured to allow each program to talk on the network, or programs will not work as intended.
38 Oxford Technical Solutions
Figure 17. Windows Firewall warning message
Ensure both Private and Public networks are selected to ensure the software can continue functioning when moving from one type to another.
Feature point Survey Wizard
The Feature point Survey Wizard is designed to allow you to quickly and efficiently create Feature point files using the real-time position information being output by an INS. Points can be created in response to an input trigger, a button press in the RT-Range software, or at regular time/distance intervals. Each new point is automatically numbered, and is fully defined using the current lat/lon, altitude and heading.
Feature point Surveys conducted over large areas can be carried out swiftly by mounting an INS in a vehicle, and applying a displaced output to the INS. The displaced INS output should relate to a marked position on the vehicle perimeter, such as the front bumper. The driver can then simply drive up to points of interest until the displaced output point is touching the object, then fire a trigger to create a Feature point. All data points can be manually edited at creation time, or afterwards if it’s not possible to drive directly to the desired location. Once saved, Feature point files can simply be uploaded to an RT-Range system.
To open the Feature point Survey Wizard, click on the RT-Range Initial page shown in Figure 15. The Feature point Survey Wizard’s main window is shown in Figure 18.
RT-Range User Manual
Revision: 161102
39
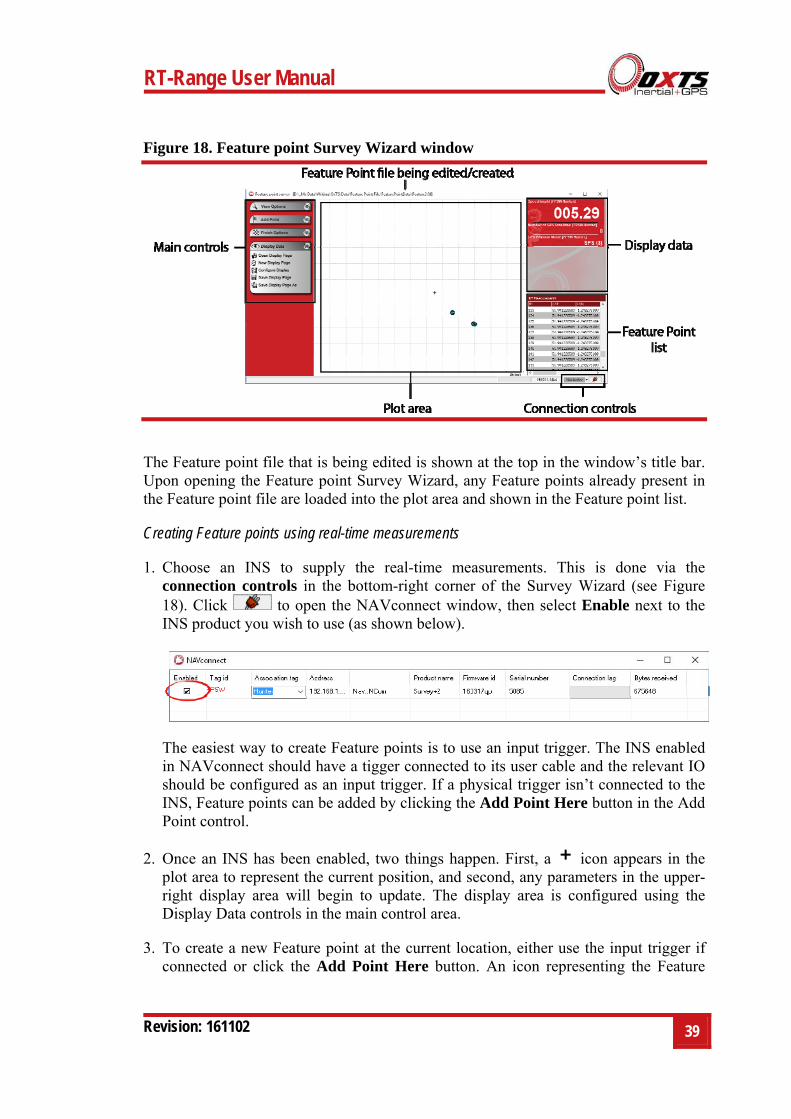
Figure 18. Feature point Survey Wizard window
The Feature point file that is being edited is shown at the top in the window’s title bar. Upon opening the Feature point Survey Wizard, any Feature points already present in the Feature point file are loaded into the plot area and shown in the Feature point list.
Creating Feature points using real-time measurements
1. Choose an INS to supply the real-time measurements. This is done via the connection controls in the bottom-right corner of the Survey Wizard (see Figure 18). Click to open the NAVconnect window, then select Enable next to the INS product you wish to use (as shown below).
The easiest way to create Feature points is to use an input trigger. The INS enabled in NAVconnect should have a tigger connected to its user cable and the relevant IO should be configured as an input trigger. If a physical trigger isn’t connected to the INS, Feature points can be added by clicking the Add Point Here button in the Add Point control.
2. Once an INS has been enabled, two things happen. First, a icon appears in the plot area to represent the current position, and second, any parameters in the upper-right display area will begin to update. The display area is configured using the Display Data controls in the main control area.
3. To create a new Feature point at the current location, either use the input trigger if connected or click the Add Point Here button. An icon representing the Feature
40 Oxford Technical Solutions
point is added. The direction of the arrow within the icon show the heading. Immediately after a point is created it can be edited by pressing the Spacebar, which opens the Feature point editor (Figure 19).
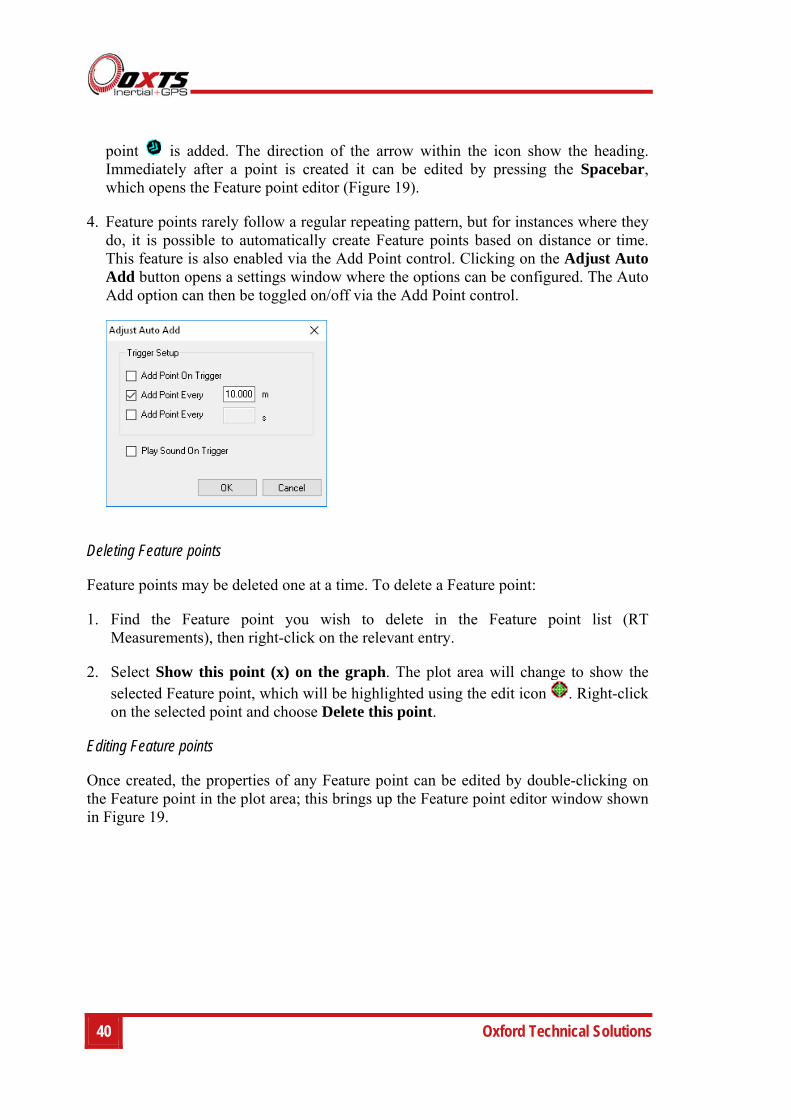
4. Feature points rarely follow a regular repeating pattern, but for instances where they do, it is possible to automatically create Feature points based on distance or time. This feature is also enabled via the Add Point control. Clicking on the Adjust Auto Add button opens a settings window where the options can be configured. The Auto Add option can then be toggled on/off via the Add Point control.
Deleting Feature points
Feature points may be deleted one at a time. To delete a Feature point:
1. Find the Feature point you wish to delete in the Feature point list (RT Measurements), then right-click on the relevant entry.
2. Select Show this point (x) on the graph. The plot area will change to show the selected Feature point, which will be highlighted using the edit icon . Right-click on the selected point and choose Delete this point.
Editing Feature points
Once created, the properties of any Feature point can be edited by double-clicking on the Feature point in the plot area; this brings up the Feature point editor window shown in Figure 19.
RT-Range User Manual
Revision: 161102
41
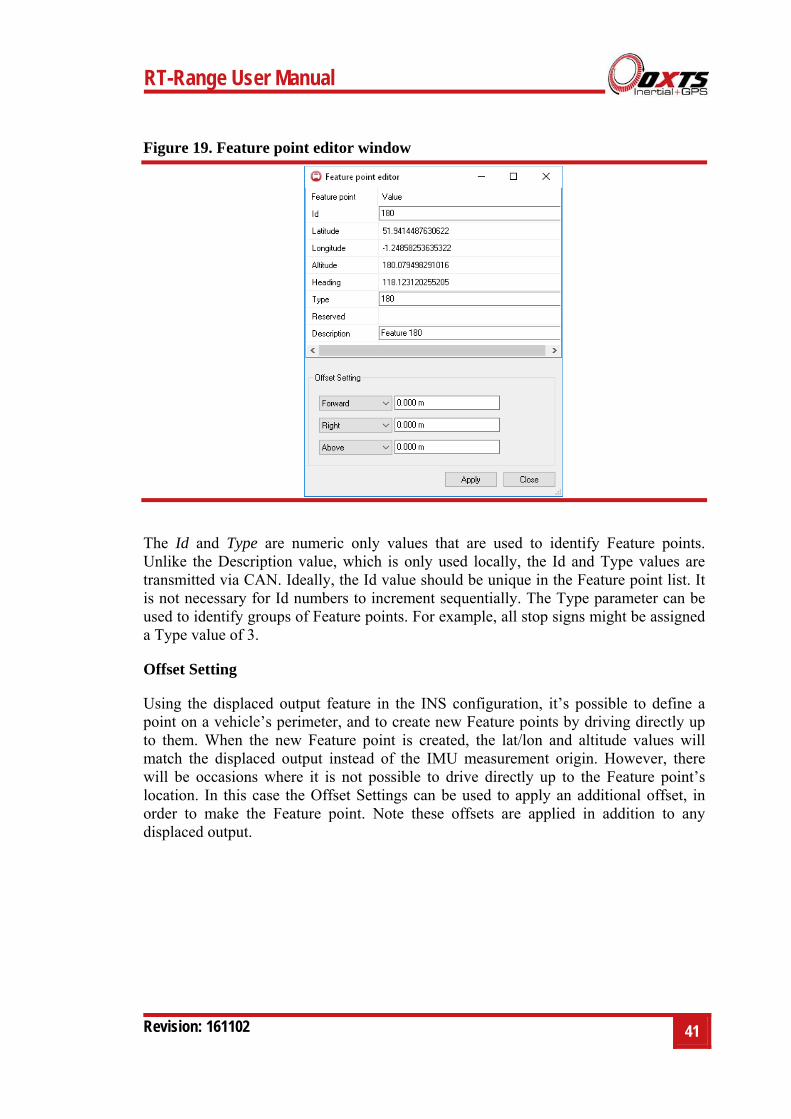
Figure 19. Feature point editor window
The Id and Type are numeric only values that are used to identify Feature points. Unlike the Description value, which is only used locally, the Id and Type values are transmitted via CAN. Ideally, the Id value should be unique in the Feature point list. It is not necessary for Id numbers to increment sequentially. The Type parameter can be used to identify groups of Feature points. For example, all stop signs might be assigned a Type value of 3.
Offset Setting
Using the displaced output feature in the INS configuration, it’s possible to define a point on a vehicle’s perimeter, and to create new Feature points by driving directly up to them. When the new Feature point is created, the lat/lon and altitude values will match the displaced output instead of the IMU measurement origin. However, there will be occasions where it is not possible to drive directly up to the Feature point’s location. In this case the Offset Settings can be used to apply an additional offset, in order to make the Feature point. Note these offsets are applied in addition to any displaced output.
42 Oxford Technical Solutions
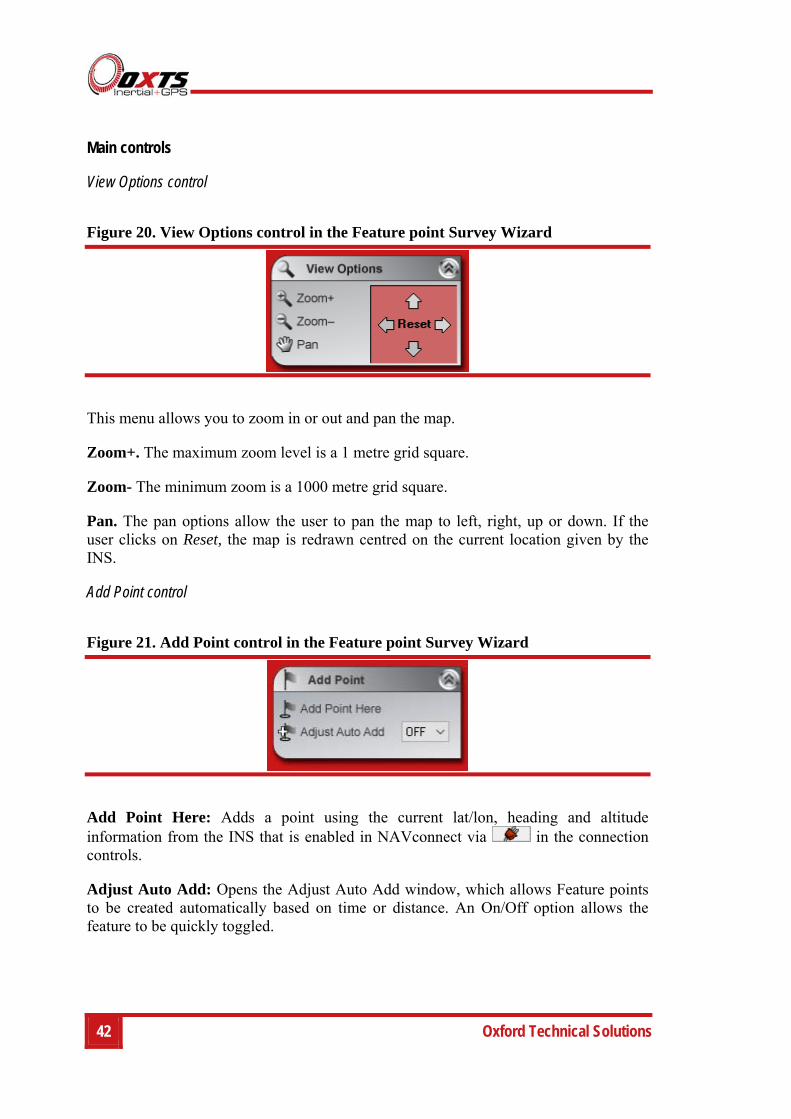
Main controls
View Options control
Figure 20. View Options control in the Feature point Survey Wizard
This menu allows you to zoom in or out and pan the map.
Zoom+. The maximum zoom level is a 1 metre grid square.
Zoom- The minimum zoom is a 1000 metre grid square.
Pan. The pan options allow the user to pan the map to left, right, up or down. If the user clicks on Reset, the map is redrawn centred on the current location given by the INS.
Add Point control
Figure 21. Add Point control in the Feature point Survey Wizard
Add Point Here: Adds a point using the current lat/lon, heading and altitude information from the INS that is enabled in NAVconnect via in the connection controls.
Adjust Auto Add: Opens the Adjust Auto Add window, which allows Feature points to be created automatically based on time or distance. An On/Off option allows the feature to be quickly toggled.
RT-Range User Manual
Revision: 161102
43
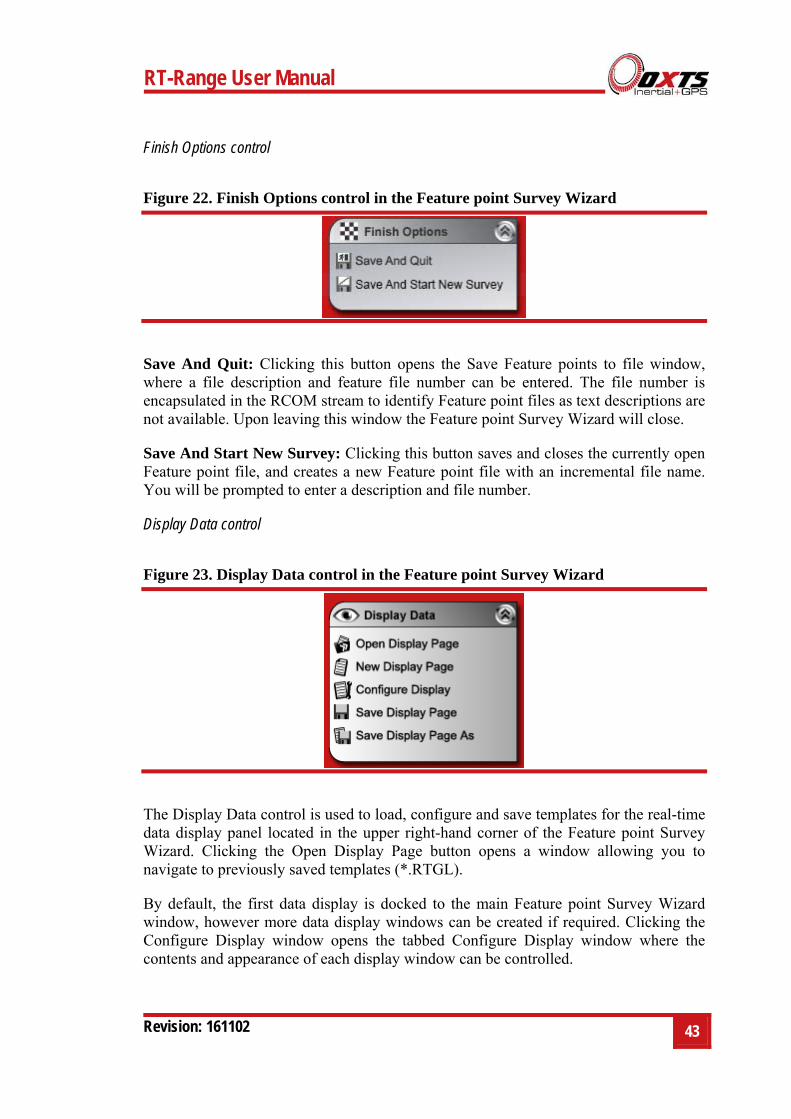
Finish Options control
Figure 22. Finish Options control in the Feature point Survey Wizard
Save And Quit: Clicking this button opens the Save Feature points to file window, where a file description and feature file number can be entered. The file number is encapsulated in the RCOM stream to identify Feature point files as text descriptions are not available. Upon leaving this window the Feature point Survey Wizard will close.
Save And Start New Survey: Clicking this button saves and closes the currently open Feature point file, and creates a new Feature point file with an incremental file name. You will be prompted to enter a description and file number.
Display Data control
Figure 23. Display Data control in the Feature point Survey Wizard
The Display Data control is used to load, configure and save templates for the real-time data display panel located in the upper right-hand corner of the Feature point Survey Wizard. Clicking the Open Display Page button opens a window allowing you to navigate to previously saved templates (*.RTGL).
By default, the first data display is docked to the main Feature point Survey Wizard window, however more data display windows can be created if required. Clicking the Configure Display window opens the tabbed Configure Display window where the contents and appearance of each display window can be controlled.
44 Oxford Technical Solutions
Note: Measurements can only be added to display windows when an INS has been ‘enabled’ in NAVconnect.
Lane Survey Wizard
The Lane Survey Wizard is used with an RT that is mounted on a trolley, such as the Survey Trolley option. It is also possible to survey the lines with the RT in a car but it is very hard, if not impossible, to drive the car along the lane markings accurate to 2 cm or better. The quality of the driving, or how the trolley is pushed, will directly affect the performance of the lane position measurements. The Line Survey software is not designed to add more than one point per second, so car based surveys will need to be driven slowly or have a large gap between the line points.
Before attempting to use the Lane Survey Wizard module the user must set up the RT on the Survey Trolley. The RT needs to be initialised and operating correctly. Waiting for the warm-up period is not strictly required but the RT will be able to smooth GPS jumps if it is allowed to warm-up correctly and if it is given some motion during the warm-up period. More information is given in the Survey Trolley section.
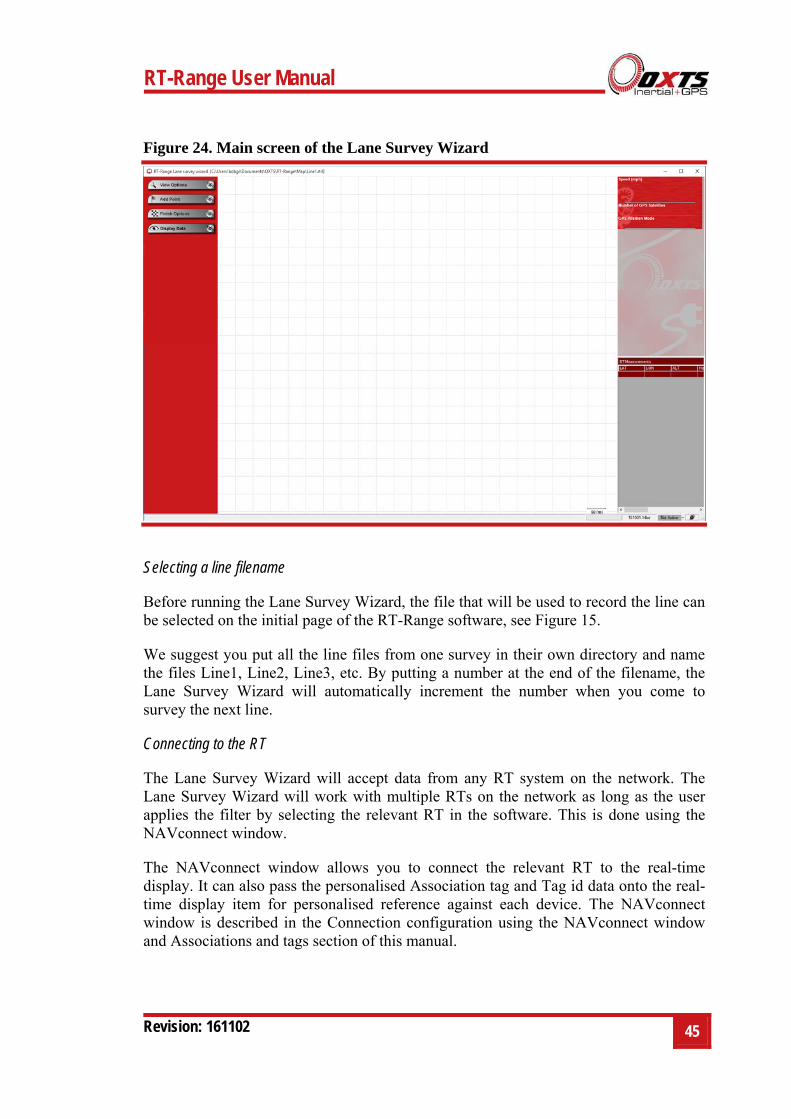
Overview
The Lane Survey Wizard has four parts to its screen, the menus, the map, the RT measurement viewer and the spreadsheet viewer.
On the left-hand side are the menus and buttons that control the software. In the middle is a map that displays the current position and the position of points that have been added to the line. In the top-right corner is the RT measurement viewer; this can be configured to show measurements from the RT such as velocity, heading, GPS position mode, number of satellites and other measurements useful when surveying. In the bottom-right is the spreadsheet viewer, showing numerical values for the points that have been added to the line.
RT-Range User Manual
Revision: 161102
45
Figure 24. Main screen of the Lane Survey Wizard
Selecting a line filename
Before running the Lane Survey Wizard, the file that will be used to record the line can be selected on the initial page of the RT-Range software, see Figure 15.
We suggest you put all the line files from one survey in their own directory and name the files Line1, Line2, Line3, etc. By putting a number at the end of the filename, the Lane Survey Wizard will automatically increment the number when you come to survey the next line.
Connecting to the RT
The Lane Survey Wizard will accept data from any RT system on the network. The Lane Survey Wizard will work with multiple RTs on the network as long as the user applies the filter by selecting the relevant RT in the software. This is done using the NAVconnect window.
The NAVconnect window allows you to connect the relevant RT to the real-time display. It can also pass the personalised Association tag and Tag id data onto the real-time display item for personalised reference against each device. The NAVconnect window is described in the Connection configuration using the NAVconnect window and Associations and tags section of this manual.
46 Oxford Technical Solutions
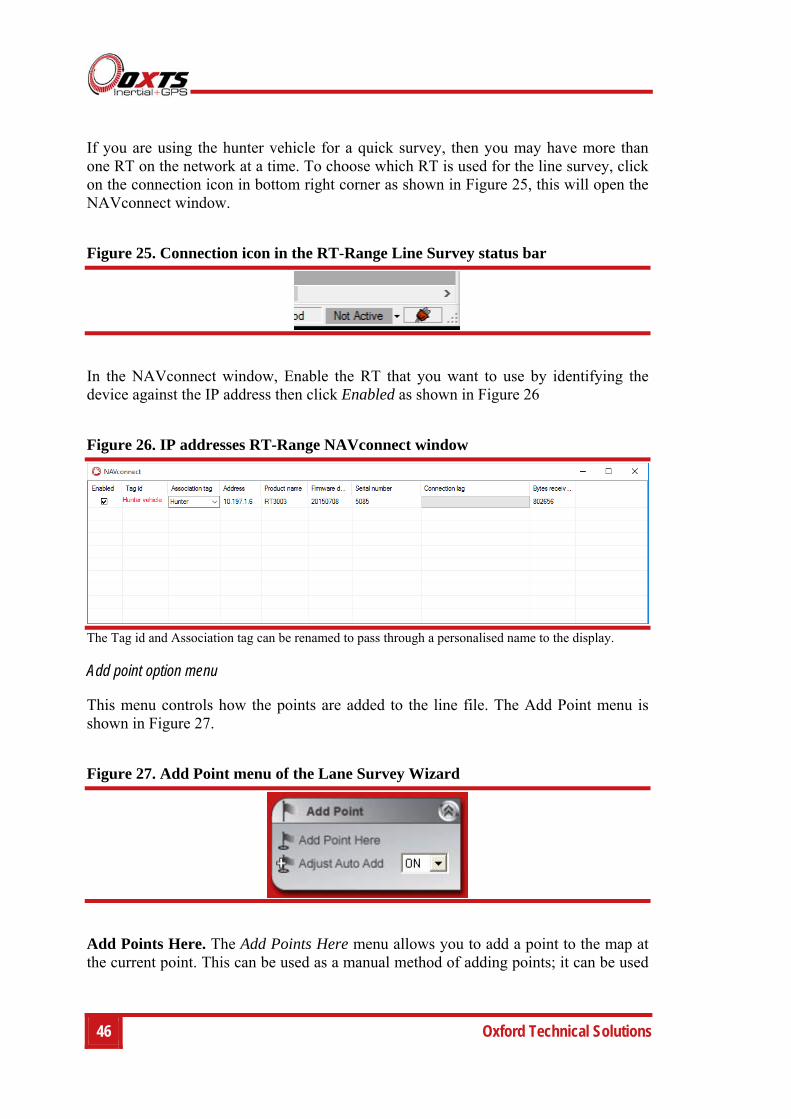
If you are using the hunter vehicle for a quick survey, then you may have more than one RT on the network at a time. To choose which RT is used for the line survey, click on the connection icon in bottom right corner as shown in Figure 25, this will open the NAVconnect window.
Figure 25. Connection icon in the RT-Range Line Survey status bar
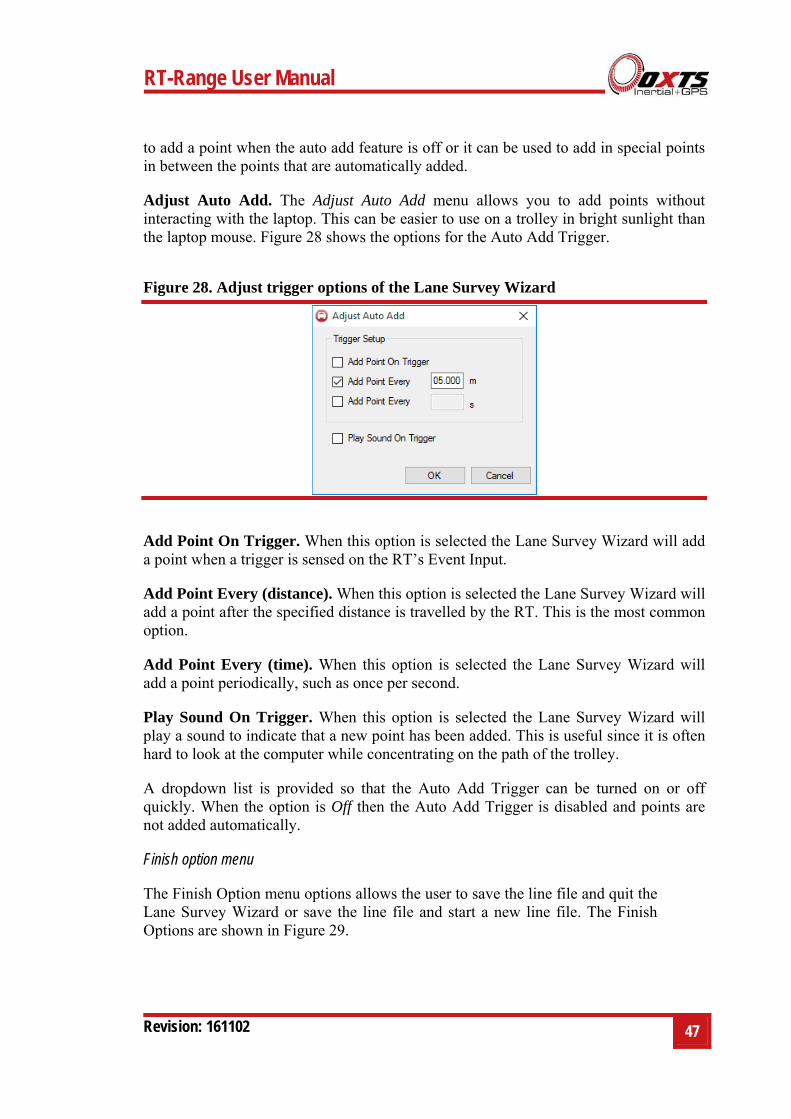
In the NAVconnect window, Enable the RT that you want to use by identifying the device against the IP address then click Enabled as shown in Figure 26
Figure 26. IP addresses RT-Range NAVconnect window
The Tag id and Association tag can be renamed to pass through a personalised name to the display.
Add point option menu
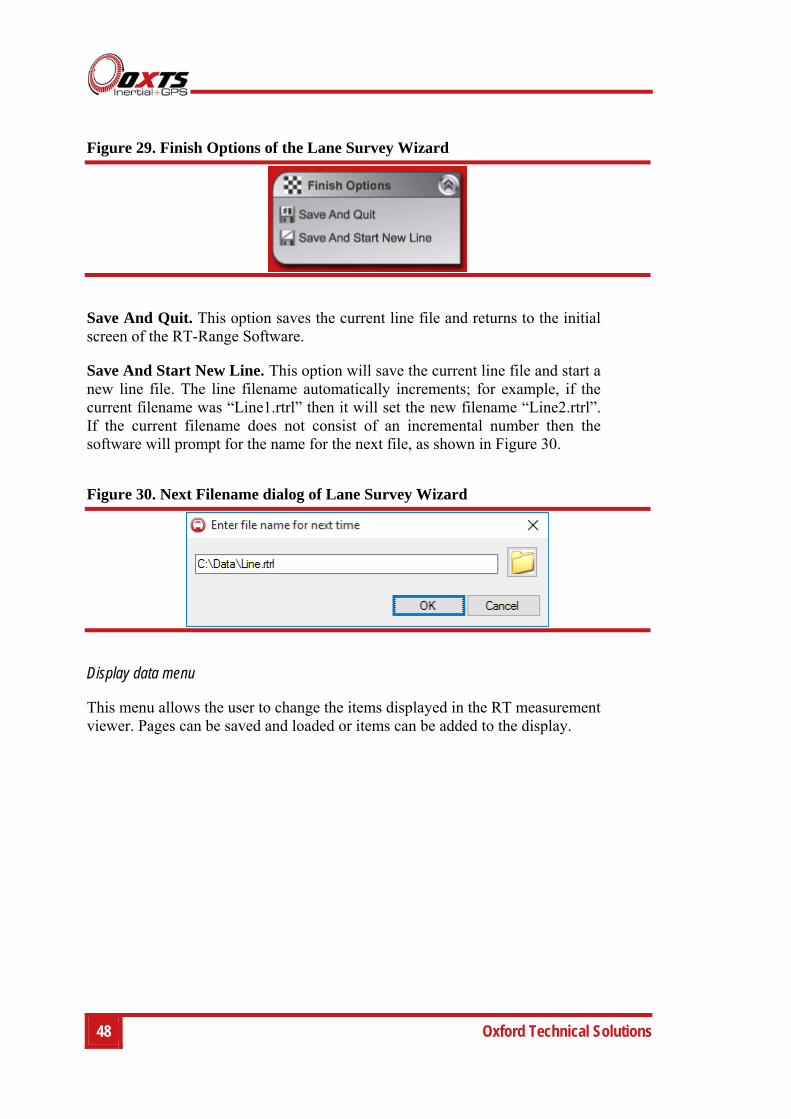
This menu controls how the points are added to the line file. The Add Point menu is shown in Figure 27.
Figure 27. Add Point menu of the Lane Survey Wizard
Add Points Here. The Add Points Here menu allows you to add a point to the map at the current point. This can be used as a manual method of adding points; it can be used
RT-Range User Manual
Revision: 161102
47
to add a point when the auto add feature is off or it can be used to add in special points in between the points that are automatically added.
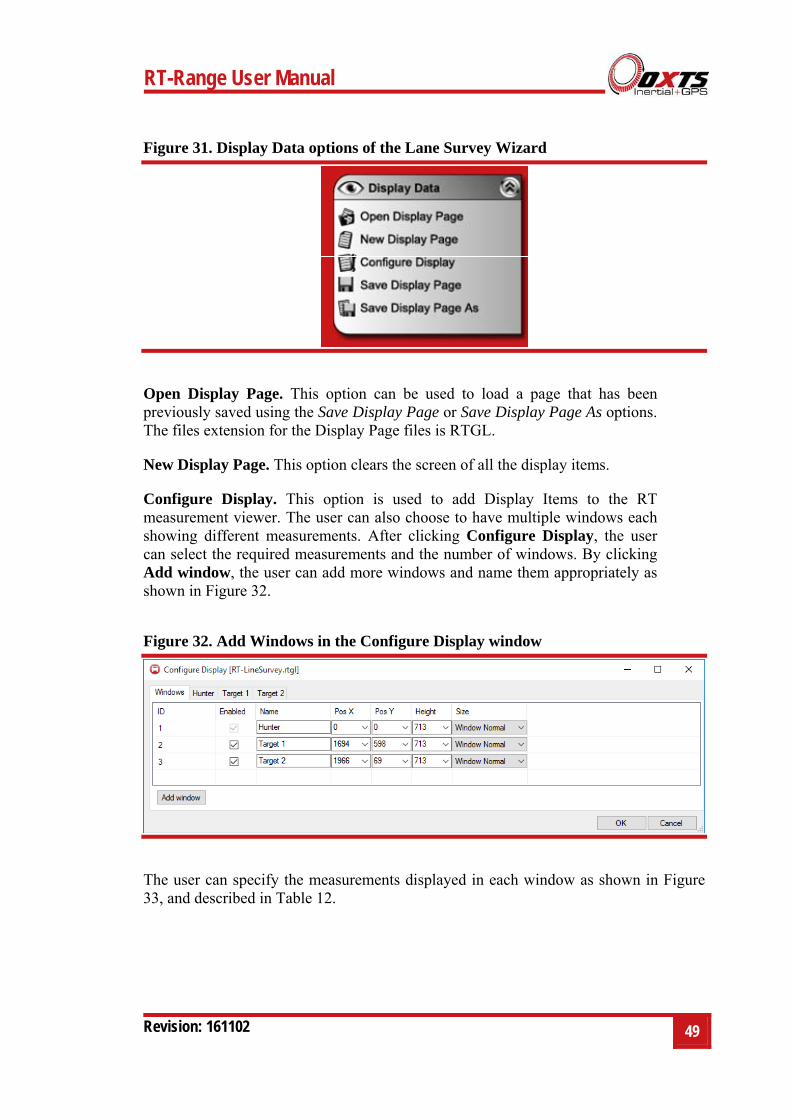
Adjust Auto Add. The Adjust Auto Add menu allows you to add points without interacting with the laptop. This can be easier to use on a trolley in bright sunlight than the laptop mouse. Figure 28 shows the options for the Auto Add Trigger.
Figure 28. Adjust trigger options of the Lane Survey Wizard
Add Point On Trigger. When this option is selected the Lane Survey Wizard will add a point when a trigger is sensed on the RT’s Event Input.
Add Point Every (distance). When this option is selected the Lane Survey Wizard will add a point after the specified distance is travelled by the RT. This is the most common option.
Add Point Every (time). When this option is selected the Lane Survey Wizard will add a point periodically, such as once per second.
Play Sound On Trigger. When this option is selected the Lane Survey Wizard will play a sound to indicate that a new point has been added. This is useful since it is often hard to look at the computer while concentrating on the path of the trolley.
A dropdown list is provided so that the Auto Add Trigger can be turned on or off quickly. When the option is Off then the Auto Add Trigger is disabled and points are not added automatically.
Finish option menu
The Finish Option menu options allows the user to save the line file and quit the Lane Survey Wizard or save the line file and start a new line file. The Finish Options are shown in Figure 29.
48 Oxford Technical Solutions
Figure 29. Finish Options of the Lane Survey Wizard
Save And Quit. This option saves the current line file and returns to the initial screen of the RT-Range Software.
Save And Start New Line. This option will save the current line file and start a new line file. The line filename automatically increments; for example, if the current filename was “Line1.rtrl” then it will set the new filename “Line2.rtrl”. If the current filename does not consist of an incremental number then the software will prompt for the name for the next file, as shown in Figure 30.
Figure 30. Next Filename dialog of Lane Survey Wizard
Display data menu
This menu allows the user to change the items displayed in the RT measurement viewer. Pages can be saved and loaded or items can be added to the display.
RT-Range User Manual
Revision: 161102
49
Figure 31. Display Data options of the Lane Survey Wizard
Open Display Page. This option can be used to load a page that has been previously saved using the Save Display Page or Save Display Page As options. The files extension for the Display Page files is RTGL.
New Display Page. This option clears the screen of all the display items.
Configure Display. This option is used to add Display Items to the RT measurement viewer. The user can also choose to have multiple windows each showing different measurements. After clicking Configure Display, the user can select the required measurements and the number of windows. By clicking Add window, the user can add more windows and name them appropriately as shown in Figure 32.
Figure 32. Add Windows in the Configure Display window
The user can specify the measurements displayed in each window as shown in Figure 33, and described in Table 12.
50 Oxford Technical Solutions
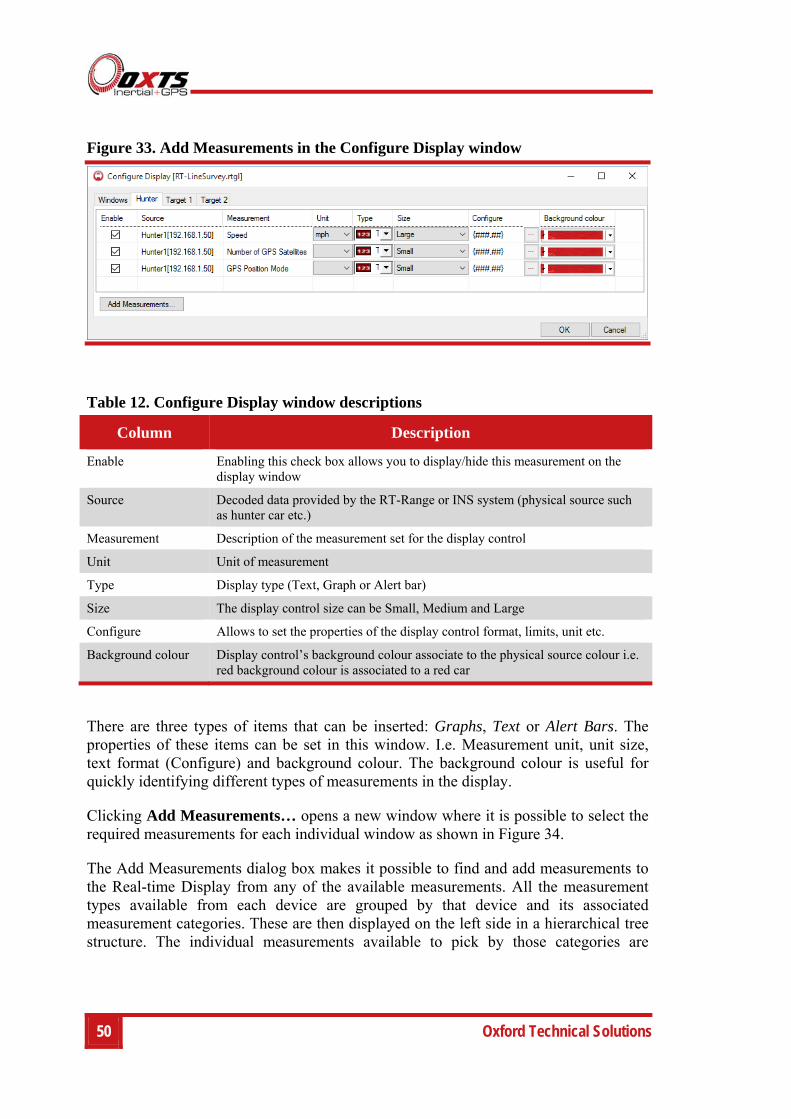
Figure 33. Add Measurements in the Configure Display window
Table 12. Configure Display window descriptions
Column Description
Enable Enabling this check box allows you to display/hide this measurement on the display window
Source Decoded data provided by the RT-Range or INS system (physical source such as hunter car etc.)
Measurement Description of the measurement set for the display control
Unit Unit of measurement
Type Display type (Text, Graph or Alert bar)
Size The display control size can be Small, Medium and Large
Configure Allows to set the properties of the display control format, limits, unit etc.
Background colour Display control’s background colour associate to the physical source colour i.e. red background colour is associated to a red car
There are three types of items that can be inserted: Graphs, Text or Alert Bars. The properties of these items can be set in this window. I.e. Measurement unit, unit size, text format (Configure) and background colour. The background colour is useful for quickly identifying different types of measurements in the display.
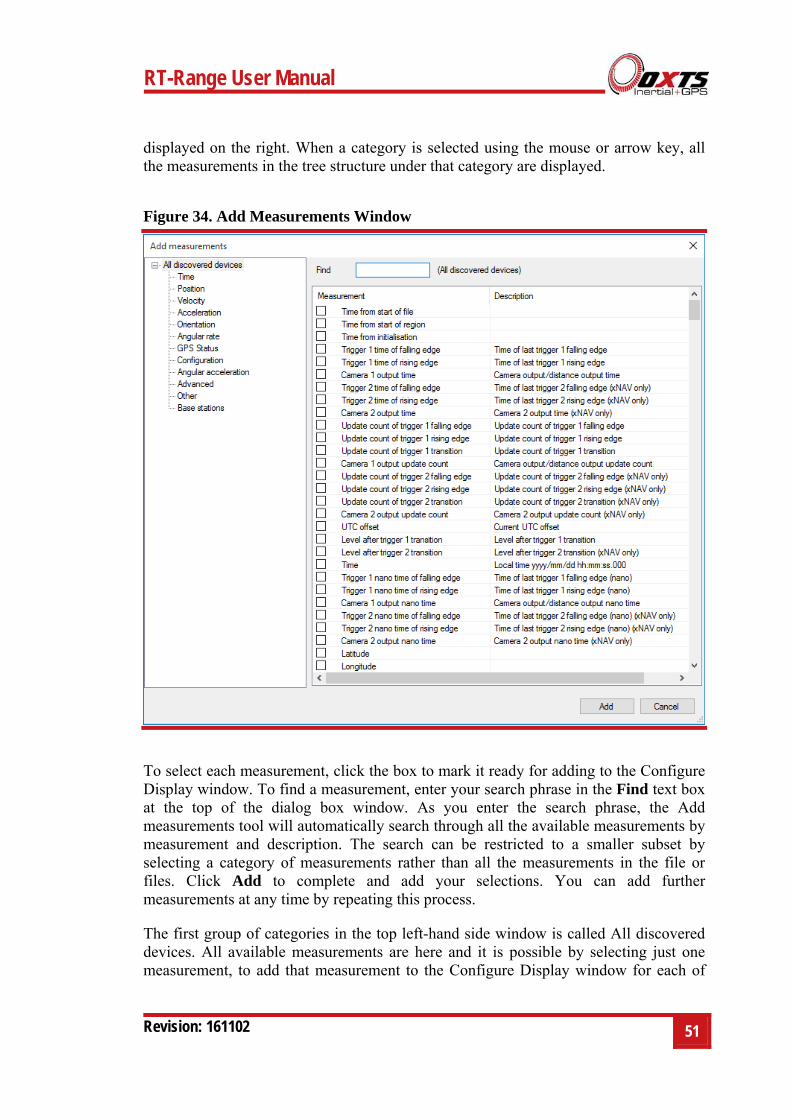
Clicking Add Measurements… opens a new window where it is possible to select the required measurements for each individual window as shown in Figure 34.
The Add Measurements dialog box makes it possible to find and add measurements to the Real-time Display from any of the available measurements. All the measurement types available from each device are grouped by that device and its associated measurement categories. These are then displayed on the left side in a hierarchical tree structure. The individual measurements available to pick by those categories are
RT-Range User Manual
Revision: 161102
51
displayed on the right. When a category is selected using the mouse or arrow key, all the measurements in the tree structure under that category are displayed.
Figure 34. Add Measurements Window
To select each measurement, click the box to mark it ready for adding to the Configure Display window. To find a measurement, enter your search phrase in the Find text box at the top of the dialog box window. As you enter the search phrase, the Add measurements tool will automatically search through all the available measurements by measurement and description. The search can be restricted to a smaller subset by selecting a category of measurements rather than all the measurements in the file or files. Click Add to complete and add your selections. You can add further measurements at any time by repeating this process.
The first group of categories in the top left-hand side window is called All discovered devices. All available measurements are here and it is possible by selecting just one measurement, to add that measurement to the Configure Display window for each of
52 Oxford Technical Solutions
the devices. For example, if the measurement Time is picked from All discovered devices, one instance of the Time measurement will (where time is a valid measurement for that device) be added to the Configure Display window for each device found.
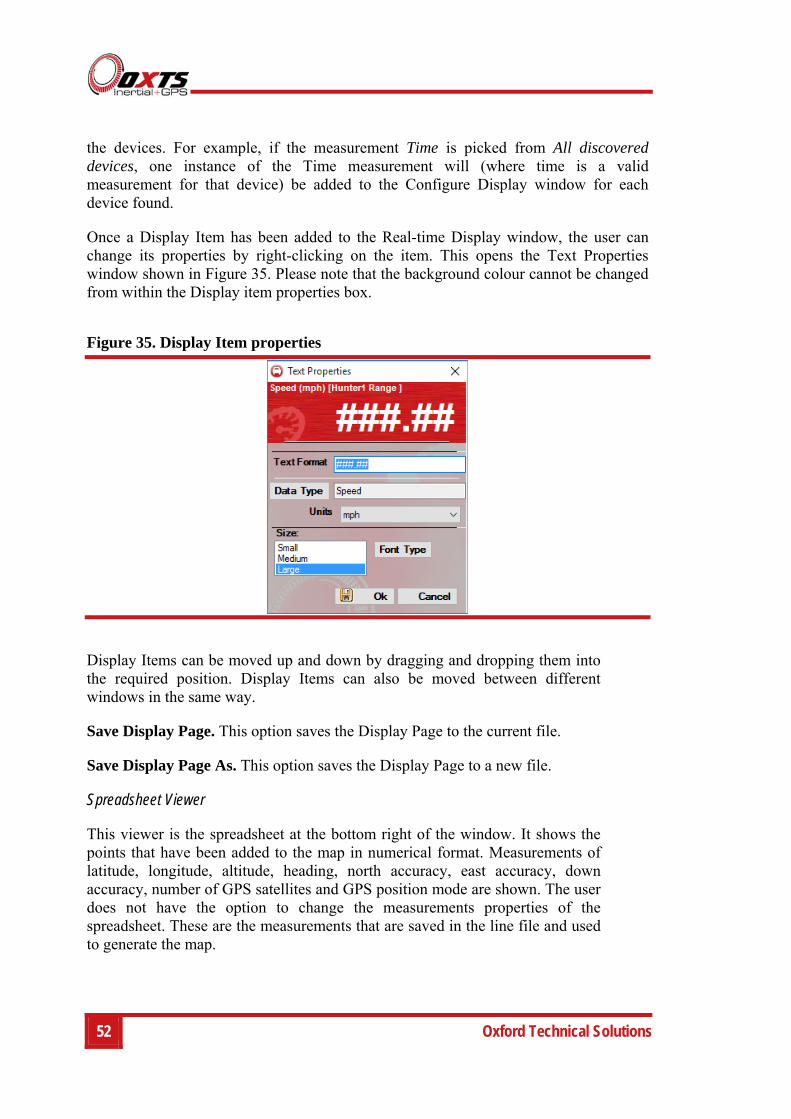
Once a Display Item has been added to the Real-time Display window, the user can change its properties by right-clicking on the item. This opens the Text Properties window shown in Figure 35. Please note that the background colour cannot be changed from within the Display item properties box.
Figure 35. Display Item properties
Display Items can be moved up and down by dragging and dropping them into the required position. Display Items can also be moved between different windows in the same way.
Save Display Page. This option saves the Display Page to the current file.
Save Display Page As. This option saves the Display Page to a new file.
Spreadsheet Viewer
This viewer is the spreadsheet at the bottom right of the window. It shows the points that have been added to the map in numerical format. Measurements of latitude, longitude, altitude, heading, north accuracy, east accuracy, down accuracy, number of GPS satellites and GPS position mode are shown. The user does not have the option to change the measurements properties of the spreadsheet. These are the measurements that are saved in the line file and used to generate the map.
RT-Range User Manual
Revision: 161102
53
Map Creation Wizard
The Map Creation Wizard takes the line files made by the Lane Survey Wizard and assembles them into a map.
Selecting a map filename
Before running the Map Creation Wizard, the filename that will be used to save the map can be selected from the initial page of the RT-Range software, see Figure 15. We recommend you create the map file in the same directory as the line survey files as this will make it quicker to select and add each line survey file. The filename extension for a map file is RTRM.
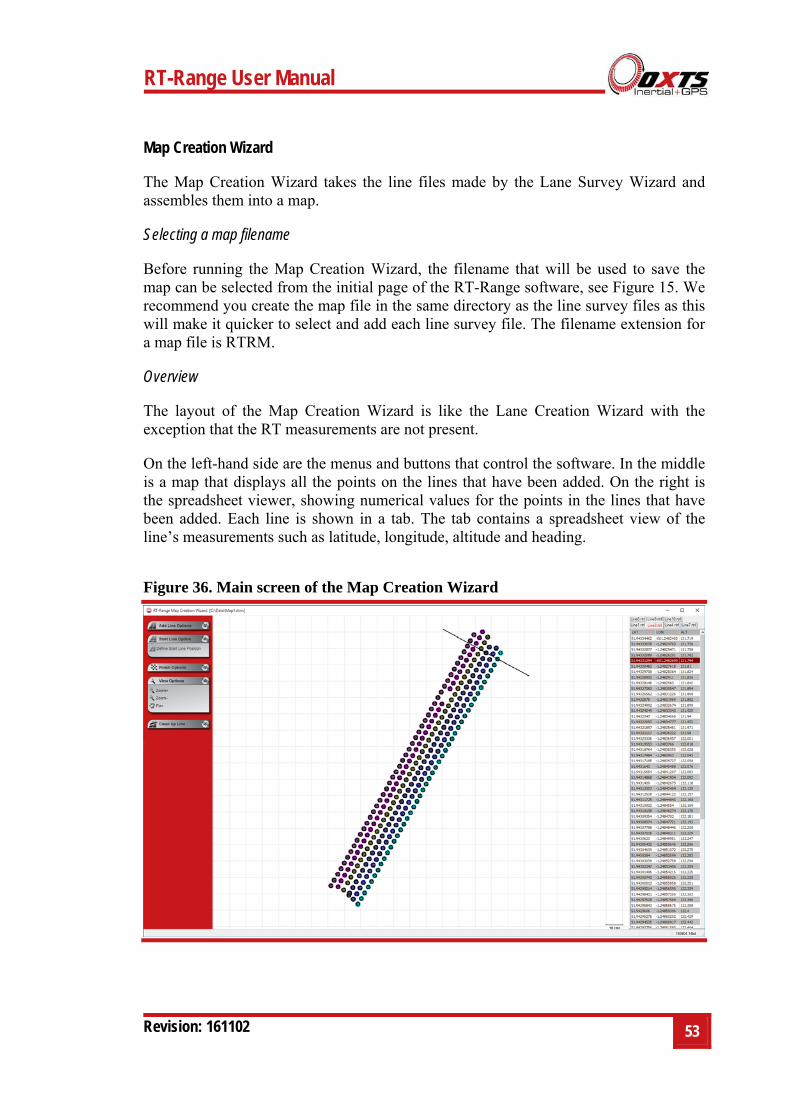
Overview
The layout of the Map Creation Wizard is like the Lane Creation Wizard with the exception that the RT measurements are not present.
On the left-hand side are the menus and buttons that control the software. In the middle is a map that displays all the points on the lines that have been added. On the right is the spreadsheet viewer, showing numerical values for the points in the lines that have been added. Each line is shown in a tab. The tab contains a spreadsheet view of the line’s measurements such as latitude, longitude, altitude and heading.
Figure 36. Main screen of the Map Creation Wizard
54 Oxford Technical Solutions
Add Line Options
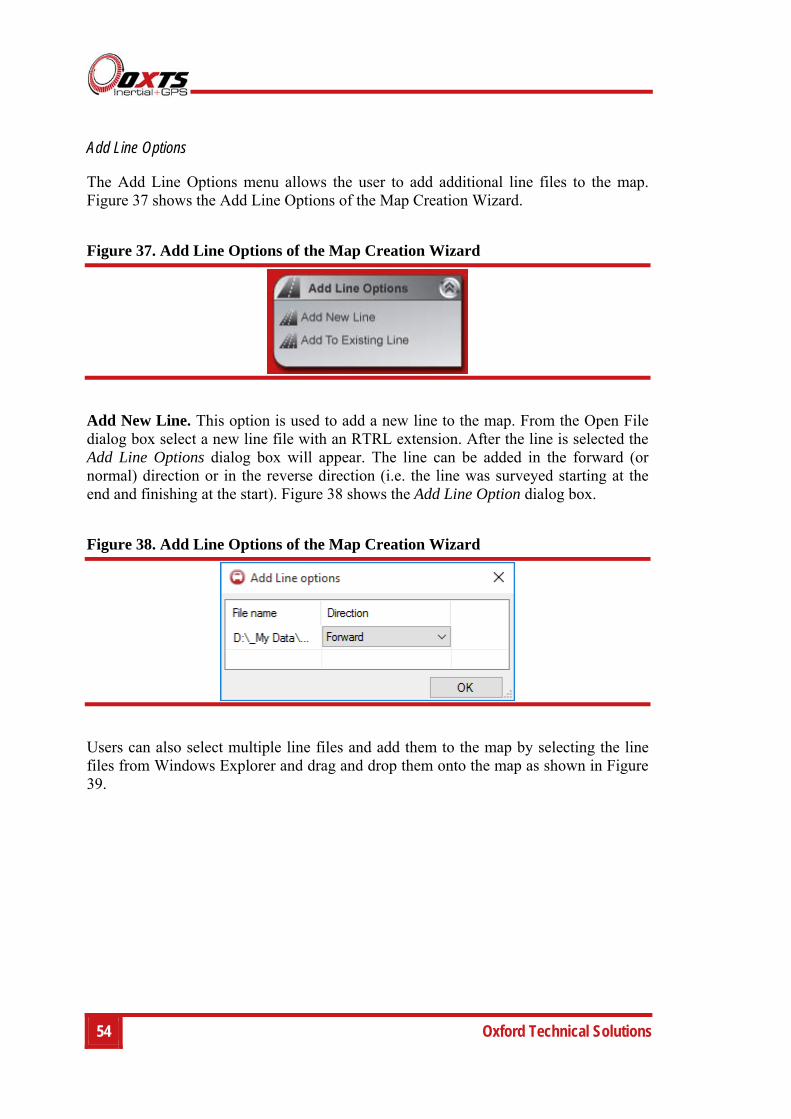
The Add Line Options menu allows the user to add additional line files to the map. Figure 37 shows the Add Line Options of the Map Creation Wizard.
Figure 37. Add Line Options of the Map Creation Wizard
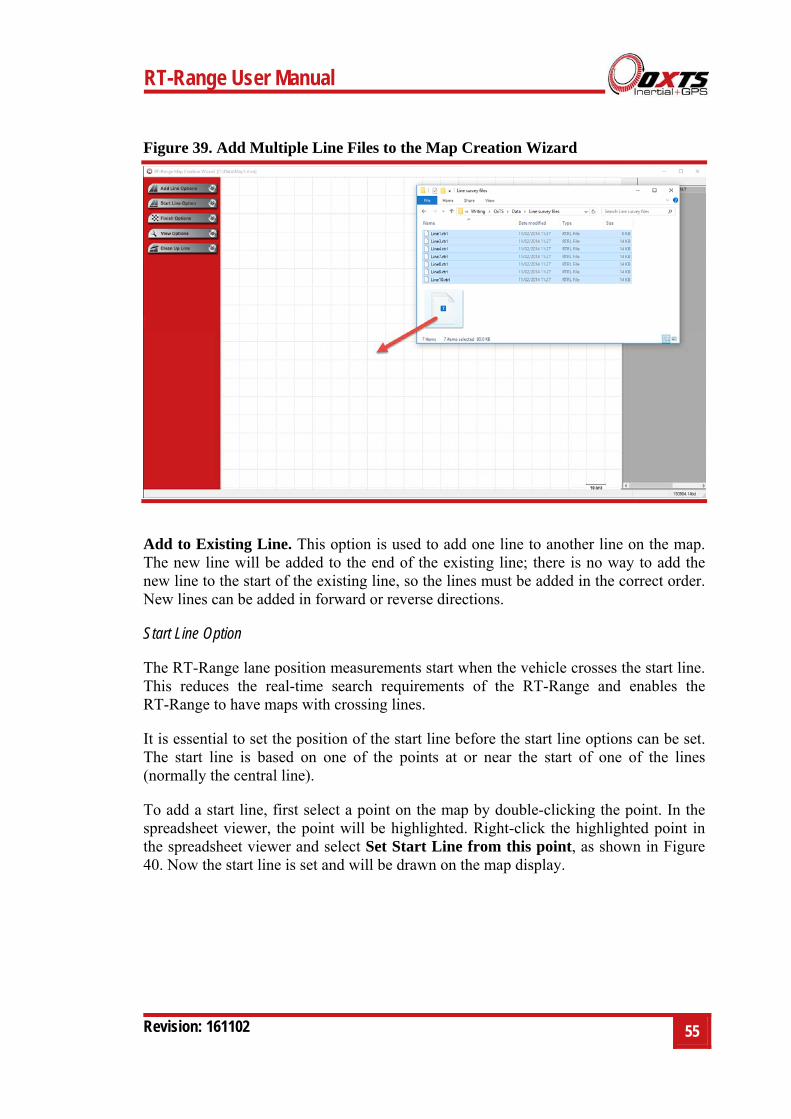
Add New Line. This option is used to add a new line to the map. From the Open File dialog box select a new line file with an RTRL extension. After the line is selected the Add Line Options dialog box will appear. The line can be added in the forward (or normal) direction or in the reverse direction (i.e. the line was surveyed starting at the end and finishing at the start). Figure 38 shows the Add Line Option dialog box.
Figure 38. Add Line Options of the Map Creation Wizard
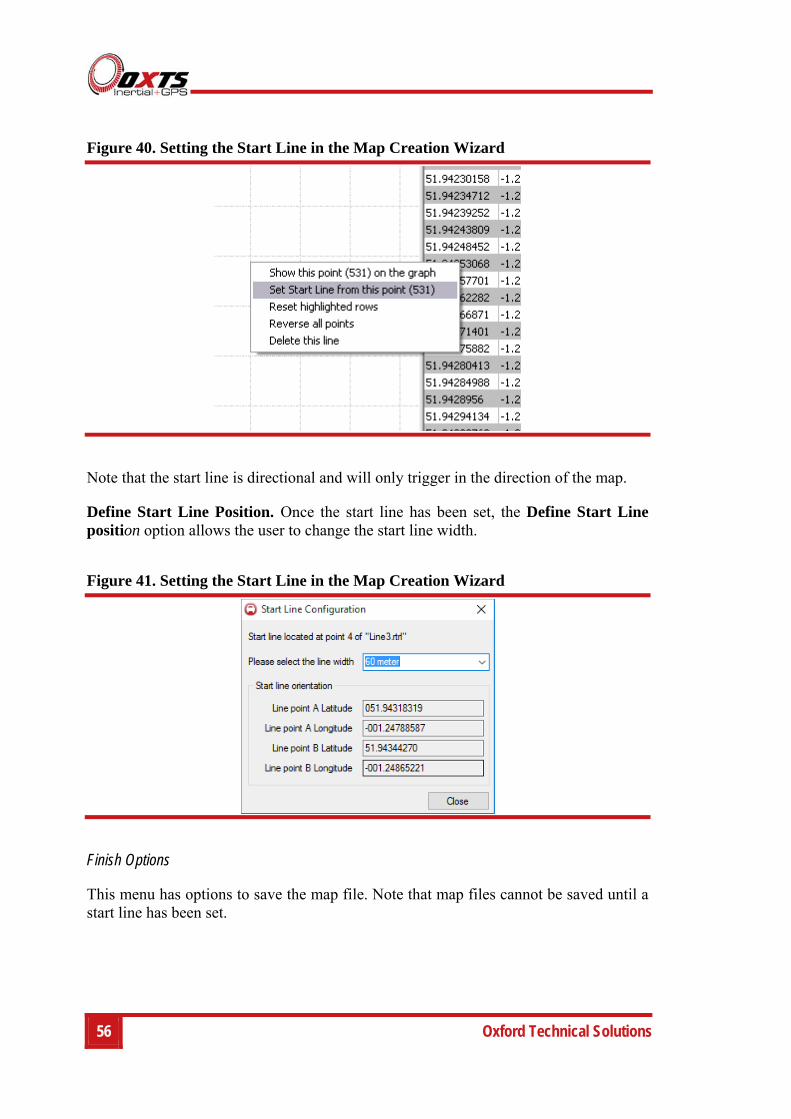
Users can also select multiple line files and add them to the map by selecting the line files from Windows Explorer and drag and drop them onto the map as shown in Figure 39.
RT-Range User Manual
Revision: 161102
55
Figure 39. Add Multiple Line Files to the Map Creation Wizard
Add to Existing Line. This option is used to add one line to another line on the map. The new line will be added to the end of the existing line; there is no way to add the new line to the start of the existing line, so the lines must be added in the correct order. New lines can be added in forward or reverse directions.
Start Line Option
The RT-Range lane position measurements start when the vehicle crosses the start line. This reduces the real-time search requirements of the RT-Range and enables the RT-Range to have maps with crossing lines.
It is essential to set the position of the start line before the start line options can be set. The start line is based on one of the points at or near the start of one of the lines (normally the central line).
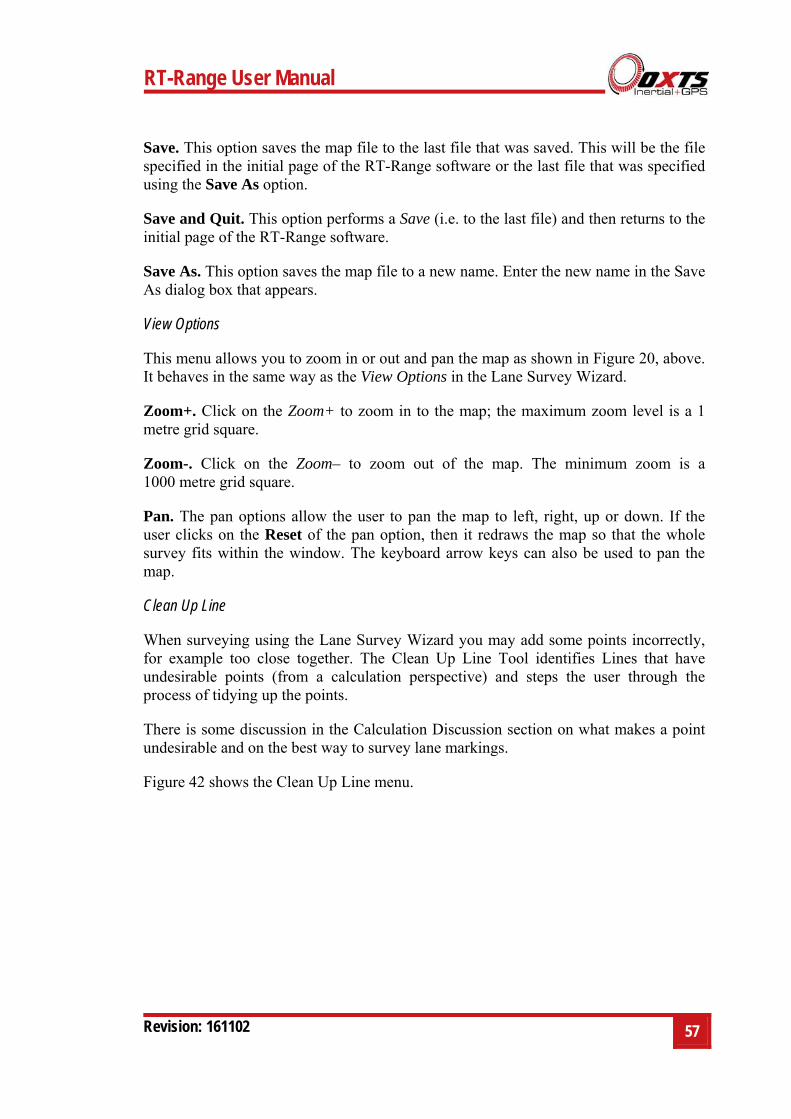
To add a start line, first select a point on the map by double-clicking the point. In the spreadsheet viewer, the point will be highlighted. Right-click the highlighted point in the spreadsheet viewer and select Set Start Line from this point, as shown in Figure 40. Now the start line is set and will be drawn on the map display.
56 Oxford Technical Solutions
Figure 40. Setting the Start Line in the Map Creation Wizard
Note that the start line is directional and will only trigger in the direction of the map.
Define Start Line Position. Once the start line has been set, the Define Start Line position option allows the user to change the start line width.
Figure 41. Setting the Start Line in the Map Creation Wizard
Finish Options
This menu has options to save the map file. Note that map files cannot be saved until a start line has been set.
RT-Range User Manual
Revision: 161102
57
Save. This option saves the map file to the last file that was saved. This will be the file specified in the initial page of the RT-Range software or the last file that was specified using the Save As option.
Save and Quit. This option performs a Save (i.e. to the last file) and then returns to the initial page of the RT-Range software.
Save As. This option saves the map file to a new name. Enter the new name in the Save As dialog box that appears.
View Options
This menu allows you to zoom in or out and pan the map as shown in Figure 20, above. It behaves in the same way as the View Options in the Lane Survey Wizard.
Zoom+. Click on the Zoom+ to zoom in to the map; the maximum zoom level is a 1 metre grid square.
Zoom-. Click on the Zoom– to zoom out of the map. The minimum zoom is a 1000 metre grid square.
Pan. The pan options allow the user to pan the map to left, right, up or down. If the user clicks on the Reset of the pan option, then it redraws the map so that the whole survey fits within the window. The keyboard arrow keys can also be used to pan the map.
Clean Up Line
When surveying using the Lane Survey Wizard you may add some points incorrectly, for example too close together. The Clean Up Line Tool identifies Lines that have undesirable points (from a calculation perspective) and steps the user through the process of tidying up the points.
There is some discussion in the Calculation Discussion section on what makes a point undesirable and on the best way to survey lane markings.
Figure 42 shows the Clean Up Line menu.
58 Oxford Technical Solutions
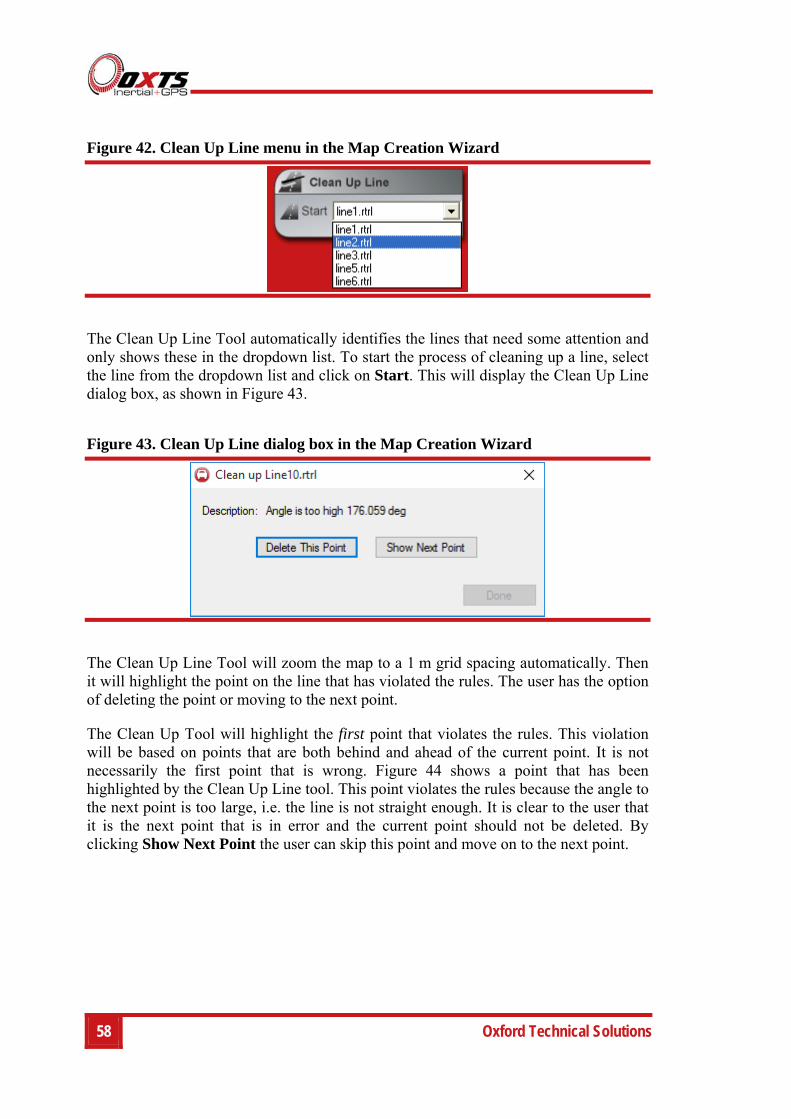
Figure 42. Clean Up Line menu in the Map Creation Wizard
The Clean Up Line Tool automatically identifies the lines that need some attention and only shows these in the dropdown list. To start the process of cleaning up a line, select the line from the dropdown list and click on Start. This will display the Clean Up Line dialog box, as shown in Figure 43.
Figure 43. Clean Up Line dialog box in the Map Creation Wizard
The Clean Up Line Tool will zoom the map to a 1 m grid spacing automatically. Then it will highlight the point on the line that has violated the rules. The user has the option of deleting the point or moving to the next point.
The Clean Up Tool will highlight the first point that violates the rules. This violation will be based on points that are both behind and ahead of the current point. It is not necessarily the first point that is wrong. Figure 44 shows a point that has been highlighted by the Clean Up Line tool. This point violates the rules because the angle to the next point is too large, i.e. the line is not straight enough. It is clear to the user that it is the next point that is in error and the current point should not be deleted. By clicking Show Next Point the user can skip this point and move on to the next point.
RT-Range User Manual
Revision: 161102
59
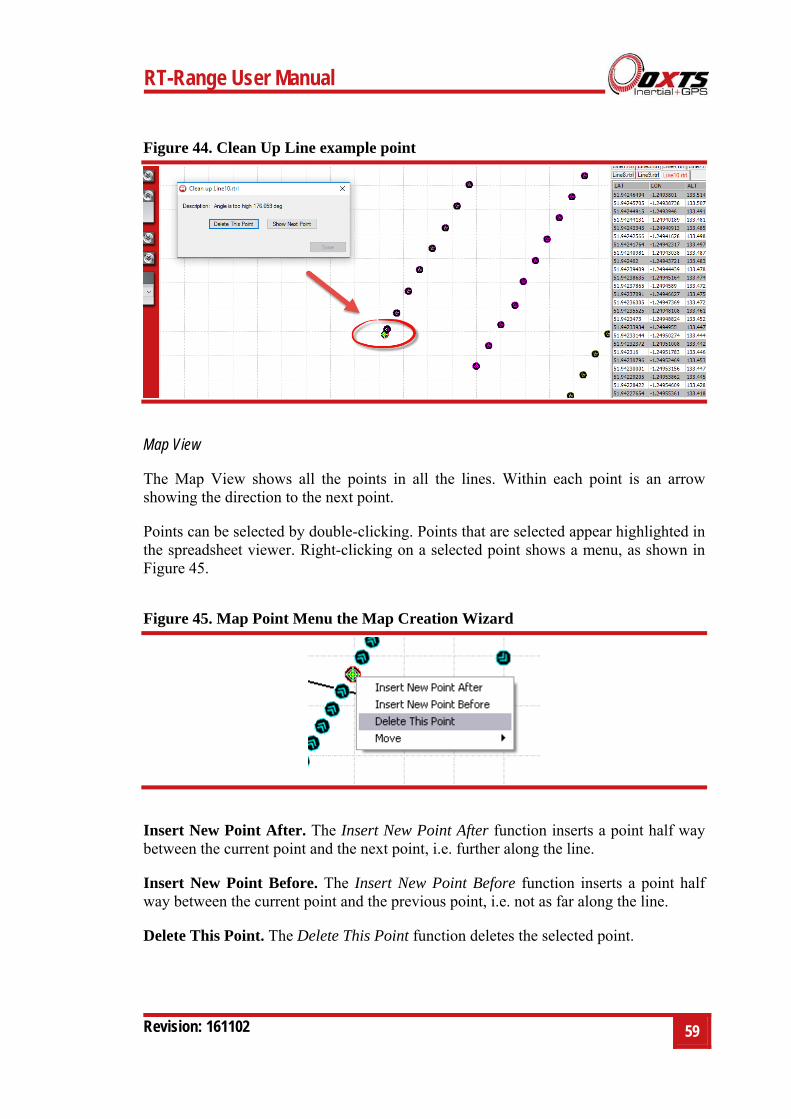
Figure 44. Clean Up Line example point
Map View
The Map View shows all the points in all the lines. Within each point is an arrow showing the direction to the next point.
Points can be selected by double-clicking. Points that are selected appear highlighted in the spreadsheet viewer. Right-clicking on a selected point shows a menu, as shown in Figure 45.
Figure 45. Map Point Menu the Map Creation Wizard
Insert New Point After. The Insert New Point After function inserts a point half way between the current point and the next point, i.e. further along the line.
Insert New Point Before. The Insert New Point Before function inserts a point half way between the current point and the previous point, i.e. not as far along the line.
Delete This Point. The Delete This Point function deletes the selected point.
60 Oxford Technical Solutions
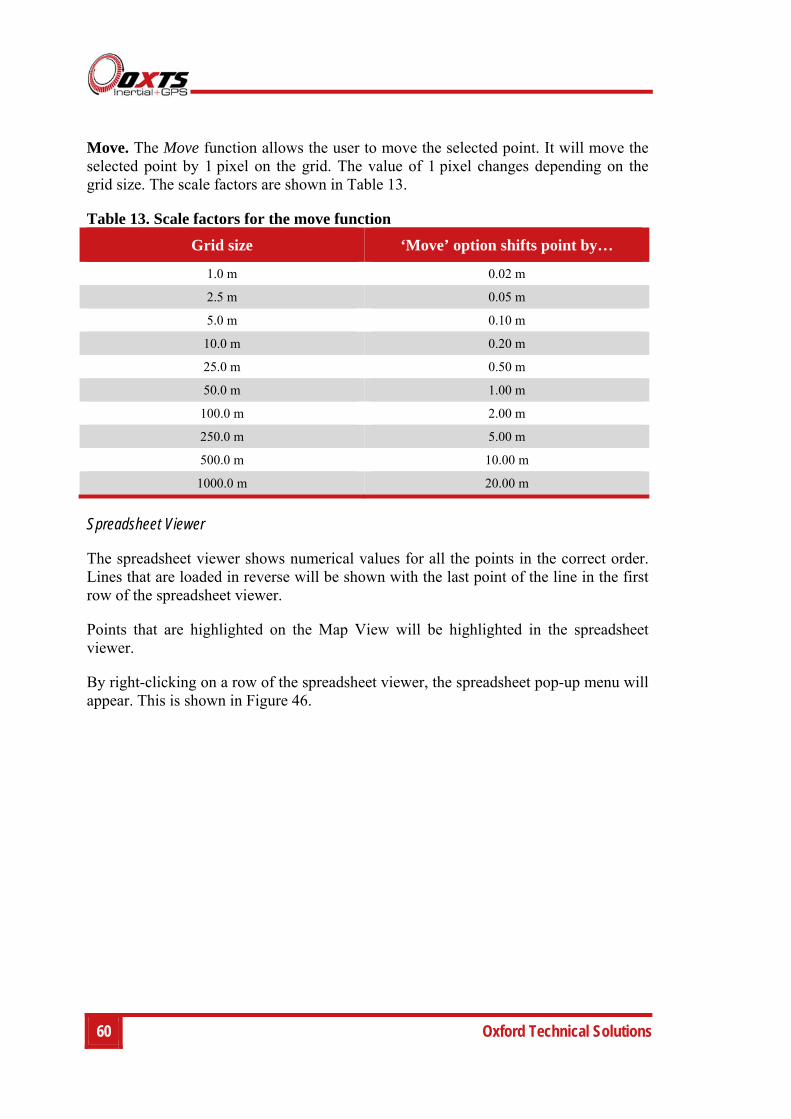
Move. The Move function allows the user to move the selected point. It will move the selected point by 1 pixel on the grid. The value of 1 pixel changes depending on the grid size. The scale factors are shown in Table 13.
Table 13. Scale factors for the move function
Spreadsheet Viewer
The spreadsheet viewer shows numerical values for all the points in the correct order. Lines that are loaded in reverse will be shown with the last point of the line in the first row of the spreadsheet viewer.
Points that are highlighted on the Map View will be highlighted in the spreadsheet viewer.
By right-clicking on a row of the spreadsheet viewer, the spreadsheet pop-up menu will appear. This is shown in Figure 46.
Grid size ‘Move’ option shifts point by…
1.0 m 0.02 m
2.5 m 0.05 m
5.0 m 0.10 m
10.0 m 0.20 m
25.0 m 0.50 m
50.0 m 1.00 m
100.0 m 2.00 m
250.0 m 5.00 m
500.0 m 10.00 m
1000.0 m 20.00 m
RT-Range User Manual
Revision: 161102
61
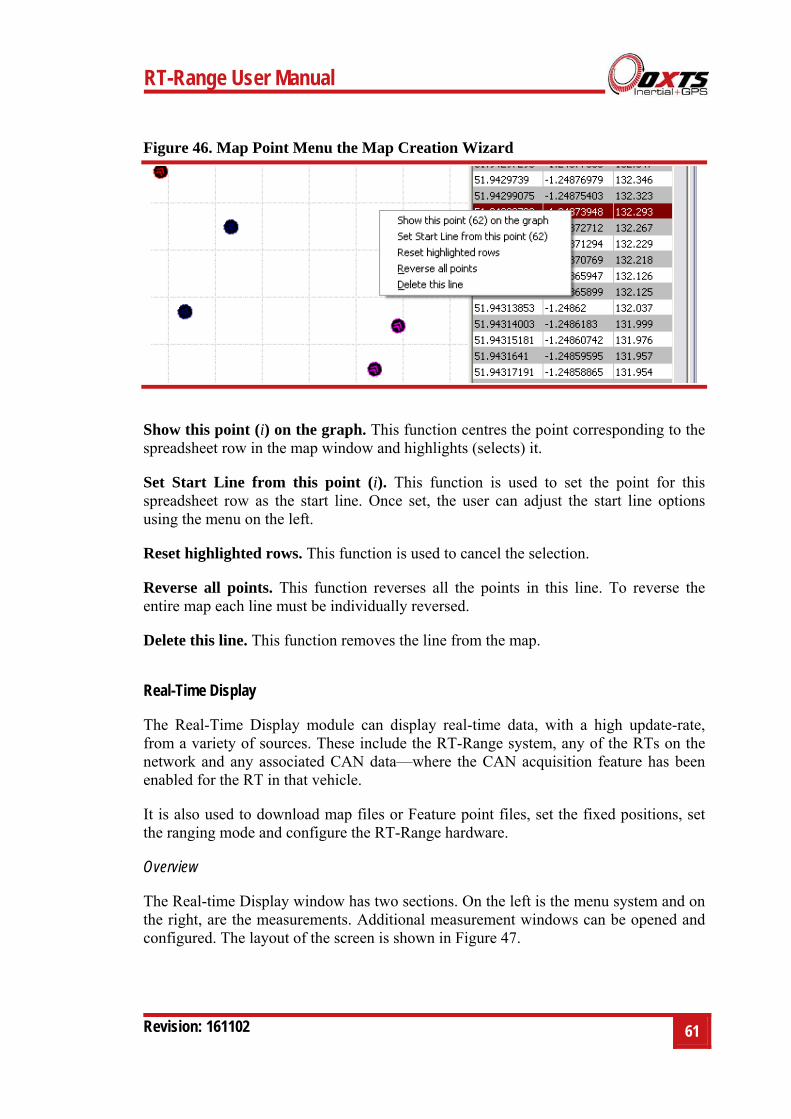
Figure 46. Map Point Menu the Map Creation Wizard
Show this point (i) on the graph. This function centres the point corresponding to the spreadsheet row in the map window and highlights (selects) it.
Set Start Line from this point (i). This function is used to set the point for this spreadsheet row as the start line. Once set, the user can adjust the start line options using the menu on the left.
Reset highlighted rows. This function is used to cancel the selection.
Reverse all points. This function reverses all the points in this line. To reverse the entire map each line must be individually reversed.
Delete this line. This function removes the line from the map.
Real-Time Display
The Real-Time Display module can display real-time data, with a high update-rate, from a variety of sources. These include the RT-Range system, any of the RTs on the network and any associated CAN data—where the CAN acquisition feature has been enabled for the RT in that vehicle.
It is also used to download map files or Feature point files, set the fixed positions, set the ranging mode and configure the RT-Range hardware.
Overview
The Real-time Display window has two sections. On the left is the menu system and on the right, are the measurements. Additional measurement windows can be opened and configured. The layout of the screen is shown in Figure 47.
62 Oxford Technical Solutions
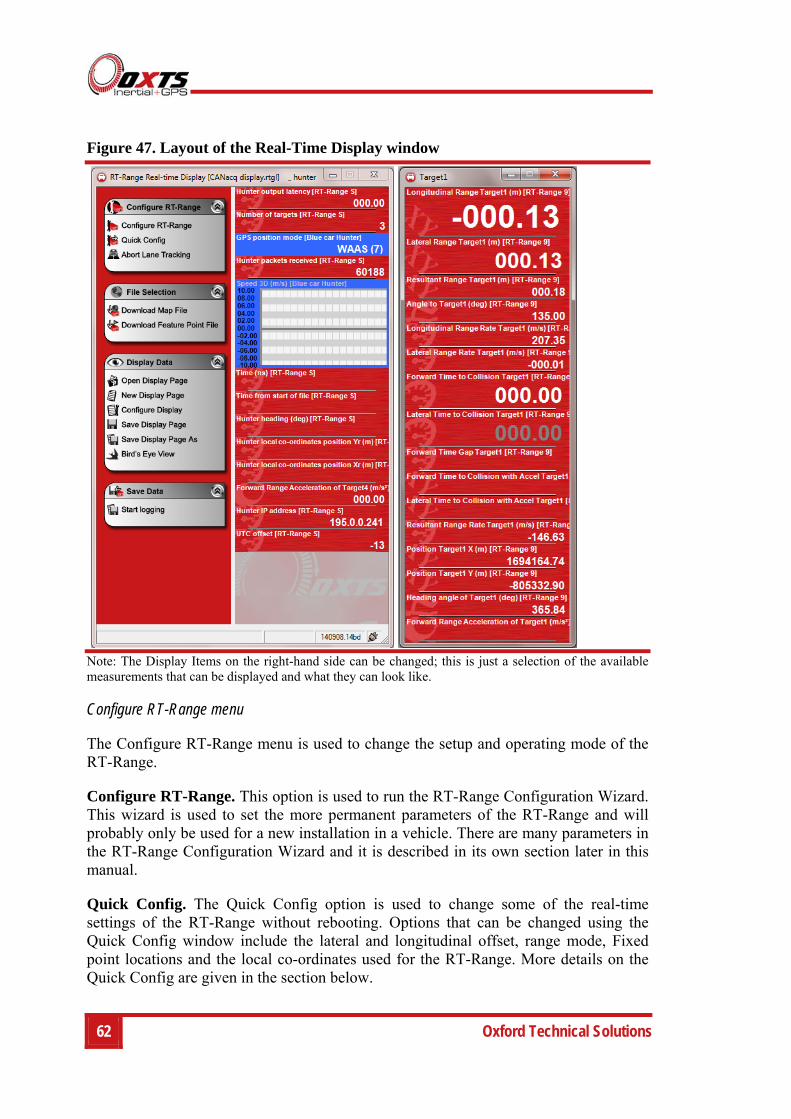
Figure 47. Layout of the Real-Time Display window
Note: The Display Items on the right-hand side can be changed; this is just a selection of the available measurements that can be displayed and what they can look like.
Configure RT-Range menu
The Configure RT-Range menu is used to change the setup and operating mode of the RT-Range.
Configure RT-Range. This option is used to run the RT-Range Configuration Wizard. This wizard is used to set the more permanent parameters of the RT-Range and will probably only be used for a new installation in a vehicle. There are many parameters in the RT-Range Configuration Wizard and it is described in its own section later in this manual.
Quick Config. The Quick Config option is used to change some of the real-time settings of the RT-Range without rebooting. Options that can be changed using the Quick Config window include the lateral and longitudinal offset, range mode, Fixed point locations and the local co-ordinates used for the RT-Range. More details on the Quick Config are given in the section below.
RT-Range User Manual
Revision: 161102
63
Abort Lane Tracking. The RT-Range will continue tracking the lane position until the car drives past the final point on Line 1. The lane position measurement can be aborted early by clicking on this button.
It is not normally necessary to abort the lane tracking since the lane tracking will start from the beginning as soon as the start line is crossed. However, if you need to have negative Distance along Lane1 before your test, then you may need to use this feature to cancel the current lane tracking before starting a new test.
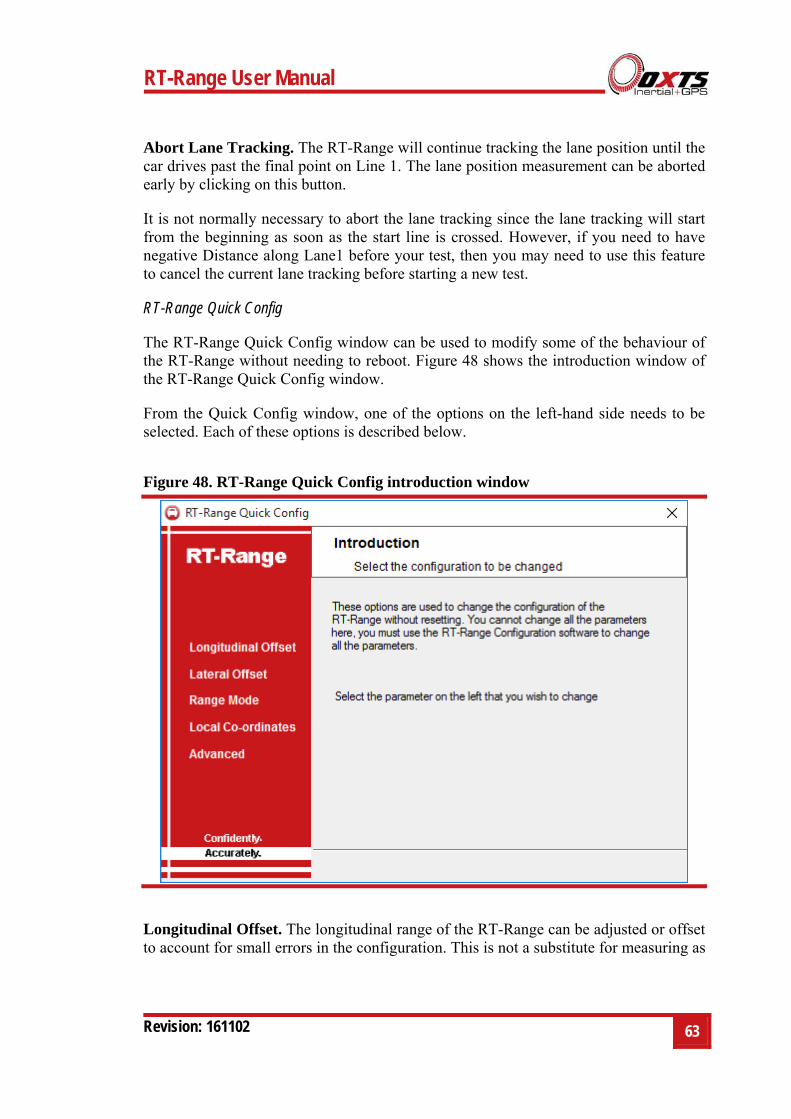
RT-Range Quick Config
The RT-Range Quick Config window can be used to modify some of the behaviour of the RT-Range without needing to reboot. Figure 48 shows the introduction window of the RT-Range Quick Config window.
From the Quick Config window, one of the options on the left-hand side needs to be selected. Each of these options is described below.
Figure 48. RT-Range Quick Config introduction window
Longitudinal Offset. The longitudinal range of the RT-Range can be adjusted or offset to account for small errors in the configuration. This is not a substitute for measuring as
64 Oxford Technical Solutions
accurately as possible; it is a quick technique for making small changes to the longitudinal range.
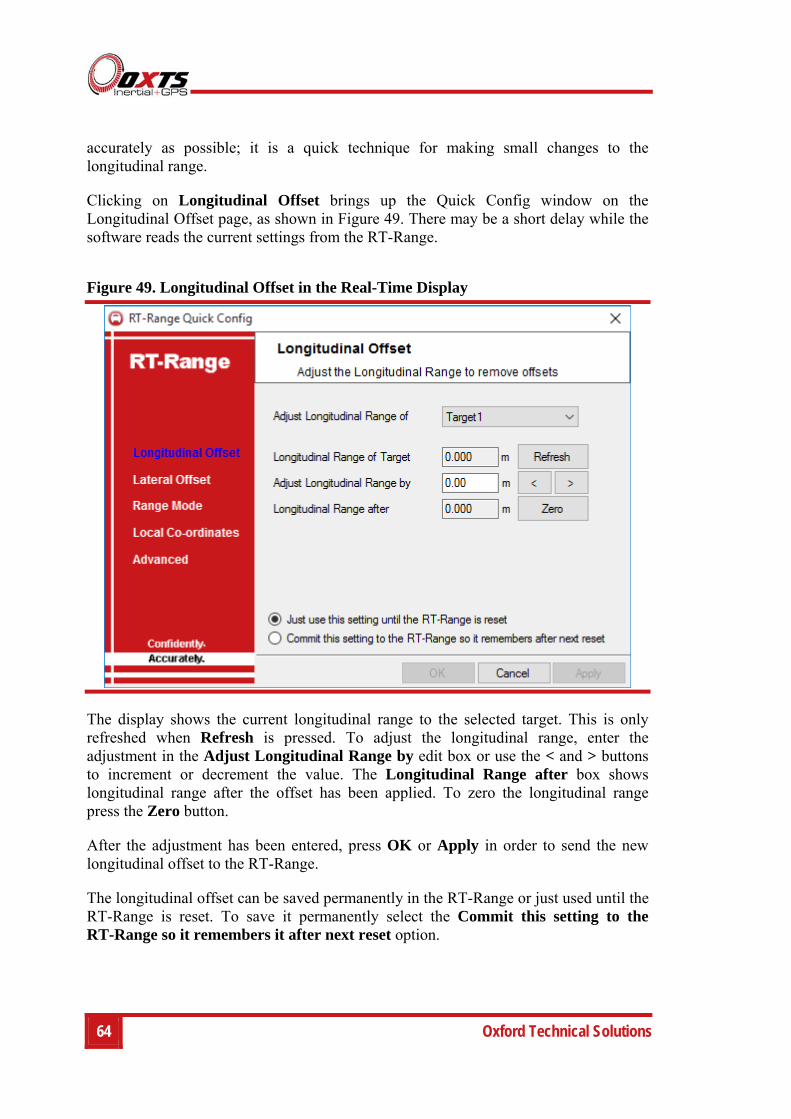
Clicking on Longitudinal Offset brings up the Quick Config window on the Longitudinal Offset page, as shown in Figure 49. There may be a short delay while the software reads the current settings from the RT-Range.
Figure 49. Longitudinal Offset in the Real-Time Display
The display shows the current longitudinal range to the selected target. This is only refreshed when Refresh is pressed. To adjust the longitudinal range, enter the adjustment in the Adjust Longitudinal Range by edit box or use the < and > buttons to increment or decrement the value. The Longitudinal Range after box shows longitudinal range after the offset has been applied. To zero the longitudinal range press the Zero button.
After the adjustment has been entered, press OK or Apply in order to send the new longitudinal offset to the RT-Range.
The longitudinal offset can be saved permanently in the RT-Range or just used until the RT-Range is reset. To save it permanently select the Commit this setting to the RT-Range so it remembers it after next reset option.
RT-Range User Manual
Revision: 161102
65
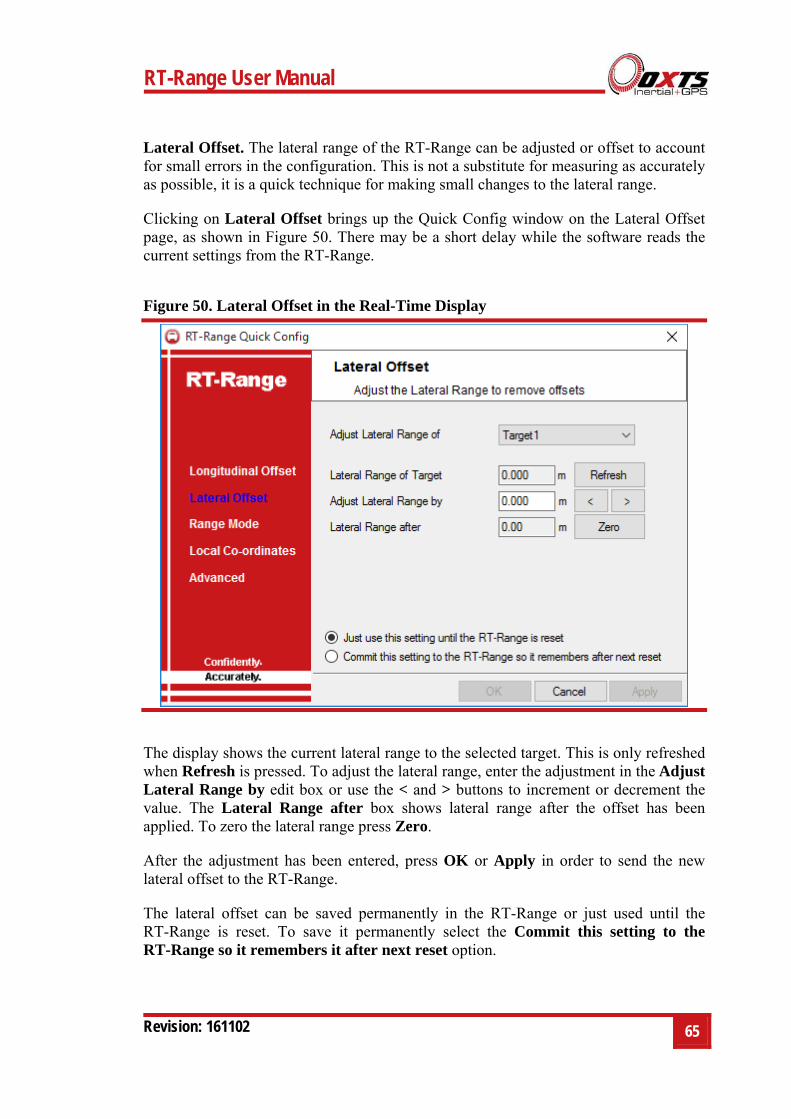
Lateral Offset. The lateral range of the RT-Range can be adjusted or offset to account for small errors in the configuration. This is not a substitute for measuring as accurately as possible, it is a quick technique for making small changes to the lateral range.
Clicking on Lateral Offset brings up the Quick Config window on the Lateral Offset page, as shown in Figure 50. There may be a short delay while the software reads the current settings from the RT-Range.
Figure 50. Lateral Offset in the Real-Time Display
The display shows the current lateral range to the selected target. This is only refreshed when Refresh is pressed. To adjust the lateral range, enter the adjustment in the Adjust Lateral Range by edit box or use the < and > buttons to increment or decrement the value. The Lateral Range after box shows lateral range after the offset has been applied. To zero the lateral range press Zero.
After the adjustment has been entered, press OK or Apply in order to send the new lateral offset to the RT-Range.
The lateral offset can be saved permanently in the RT-Range or just used until the RT-Range is reset. To save it permanently select the Commit this setting to the RT-Range so it remembers it after next reset option.
66 Oxford Technical Solutions
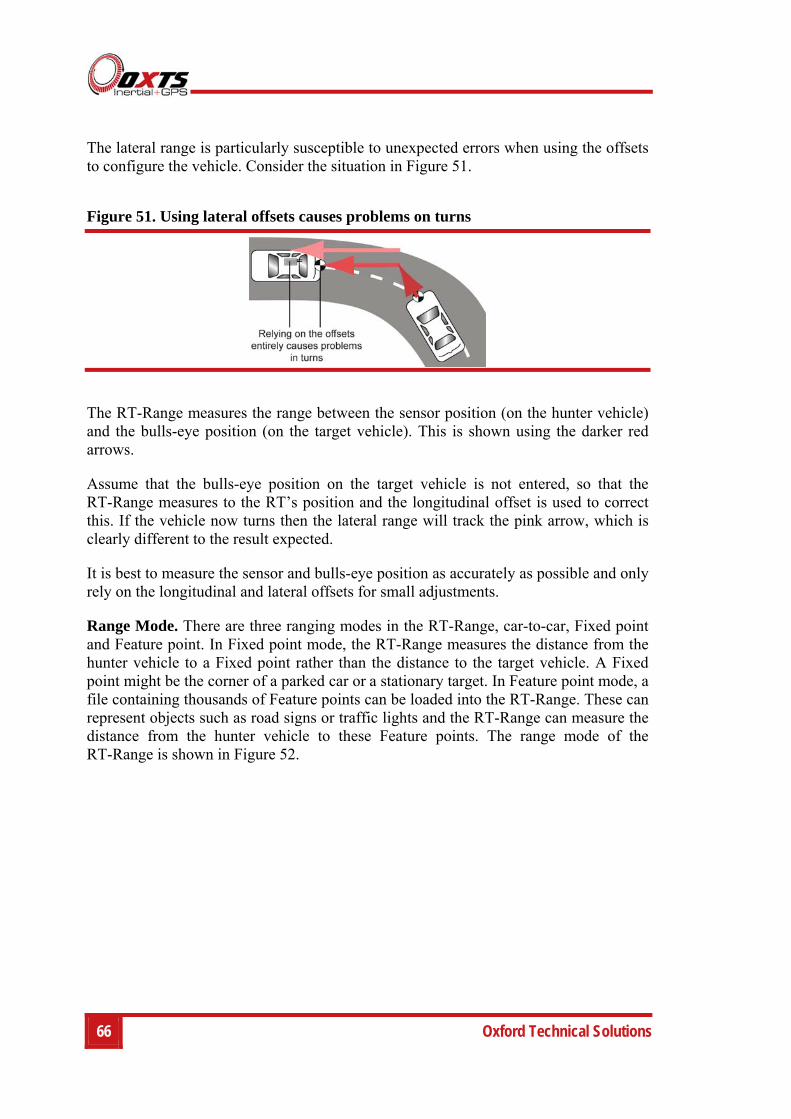
The lateral range is particularly susceptible to unexpected errors when using the offsets to configure the vehicle. Consider the situation in Figure 51.
Figure 51. Using lateral offsets causes problems on turns
The RT-Range measures the range between the sensor position (on the hunter vehicle) and the bulls-eye position (on the target vehicle). This is shown using the darker red arrows.
Assume that the bulls-eye position on the target vehicle is not entered, so that the RT-Range measures to the RT’s position and the longitudinal offset is used to correct this. If the vehicle now turns then the lateral range will track the pink arrow, which is clearly different to the result expected.
It is best to measure the sensor and bulls-eye position as accurately as possible and only rely on the longitudinal and lateral offsets for small adjustments.
Range Mode. There are three ranging modes in the RT-Range, car-to-car, Fixed point and Feature point. In Fixed point mode, the RT-Range measures the distance from the hunter vehicle to a Fixed point rather than the distance to the target vehicle. A Fixed point might be the corner of a parked car or a stationary target. In Feature point mode, a file containing thousands of Feature points can be loaded into the RT-Range. These can represent objects such as road signs or traffic lights and the RT-Range can measure the distance from the hunter vehicle to these Feature points. The range mode of the RT-Range is shown in Figure 52.
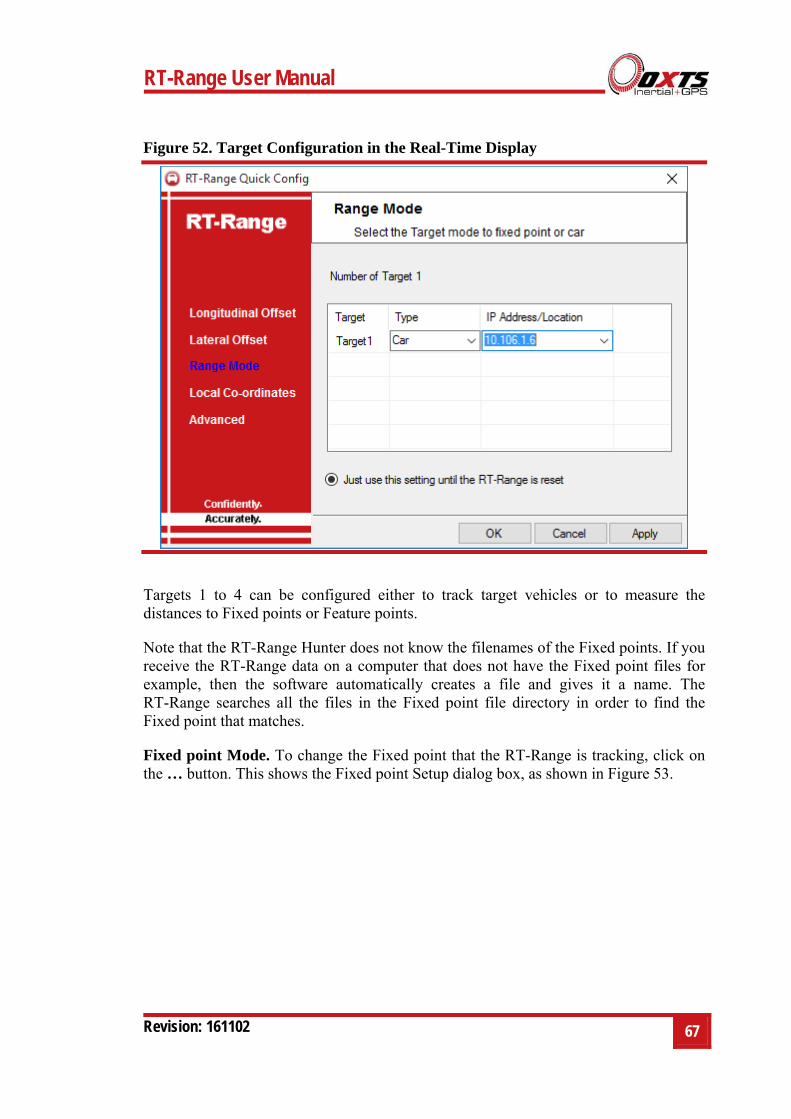
RT-Range User Manual
Revision: 161102
67
Figure 52. Target Configuration in the Real-Time Display
Targets 1 to 4 can be configured either to track target vehicles or to measure the distances to Fixed points or Feature points.
Note that the RT-Range Hunter does not know the filenames of the Fixed points. If you receive the RT-Range data on a computer that does not have the Fixed point files for example, then the software automatically creates a file and gives it a name. The RT-Range searches all the files in the Fixed point file directory in order to find the Fixed point that matches.
Fixed point Mode. To change the Fixed point that the RT-Range is tracking, click on the … button. This shows the Fixed point Setup dialog box, as shown in Figure 53.
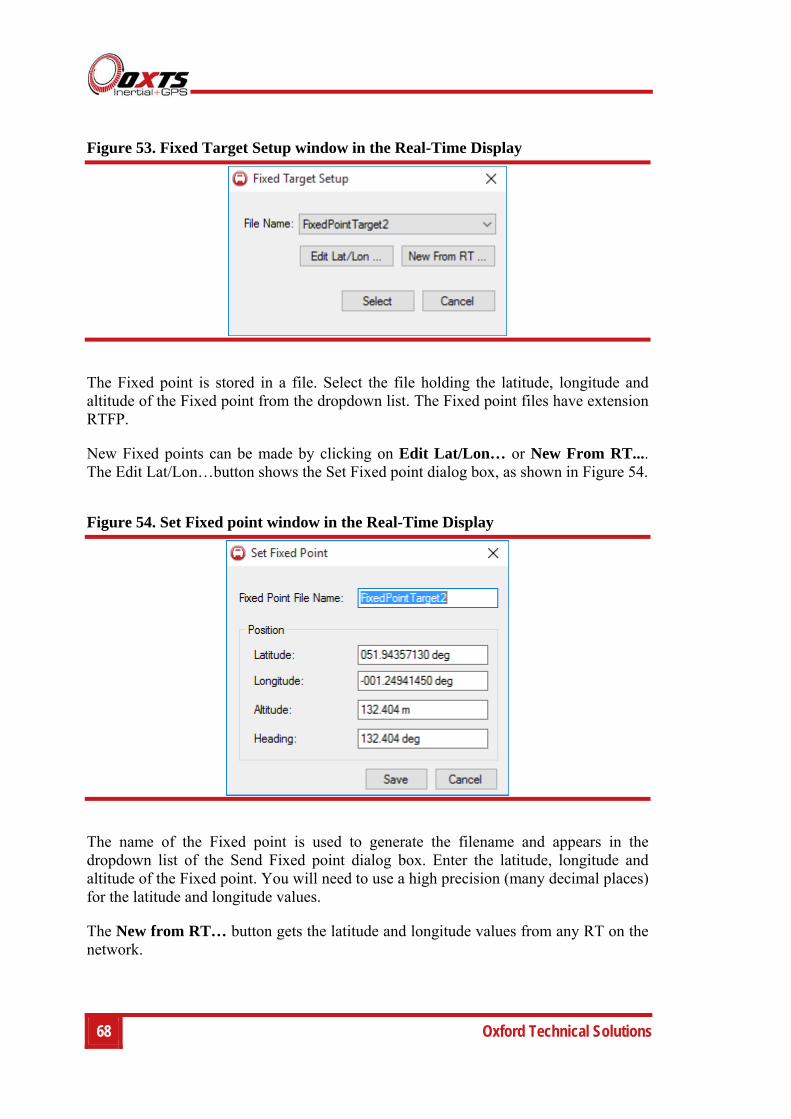
68 Oxford Technical Solutions
Figure 53. Fixed Target Setup window in the Real-Time Display
The Fixed point is stored in a file. Select the file holding the latitude, longitude and altitude of the Fixed point from the dropdown list. The Fixed point files have extension RTFP.
New Fixed points can be made by clicking on Edit Lat/Lon… or New From RT.... The Edit Lat/Lon…button shows the Set Fixed point dialog box, as shown in Figure 54.
Figure 54. Set Fixed point window in the Real-Time Display
The name of the Fixed point is used to generate the filename and appears in the dropdown list of the Send Fixed point dialog box. Enter the latitude, longitude and altitude of the Fixed point. You will need to use a high precision (many decimal places) for the latitude and longitude values.
The New from RT… button gets the latitude and longitude values from any RT on the network.
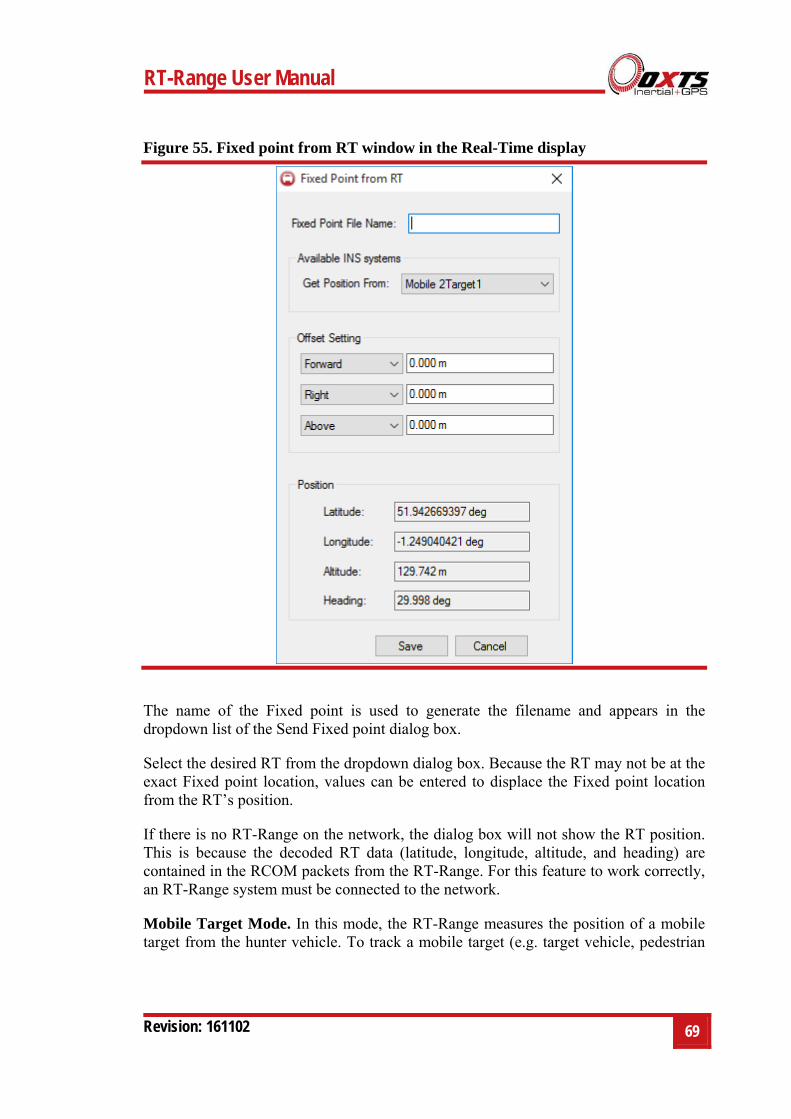
RT-Range User Manual
Revision: 161102
69
Figure 55. Fixed point from RT window in the Real-Time display
The name of the Fixed point is used to generate the filename and appears in the dropdown list of the Send Fixed point dialog box.
Select the desired RT from the dropdown dialog box. Because the RT may not be at the exact Fixed point location, values can be entered to displace the Fixed point location from the RT’s position.
If there is no RT-Range on the network, the dialog box will not show the RT position. This is because the decoded RT data (latitude, longitude, altitude, and heading) are contained in the RCOM packets from the RT-Range. For this feature to work correctly, an RT-Range system must be connected to the network.
Mobile Target Mode. In this mode, the RT-Range measures the position of a mobile target from the hunter vehicle. To track a mobile target (e.g. target vehicle, pedestrian
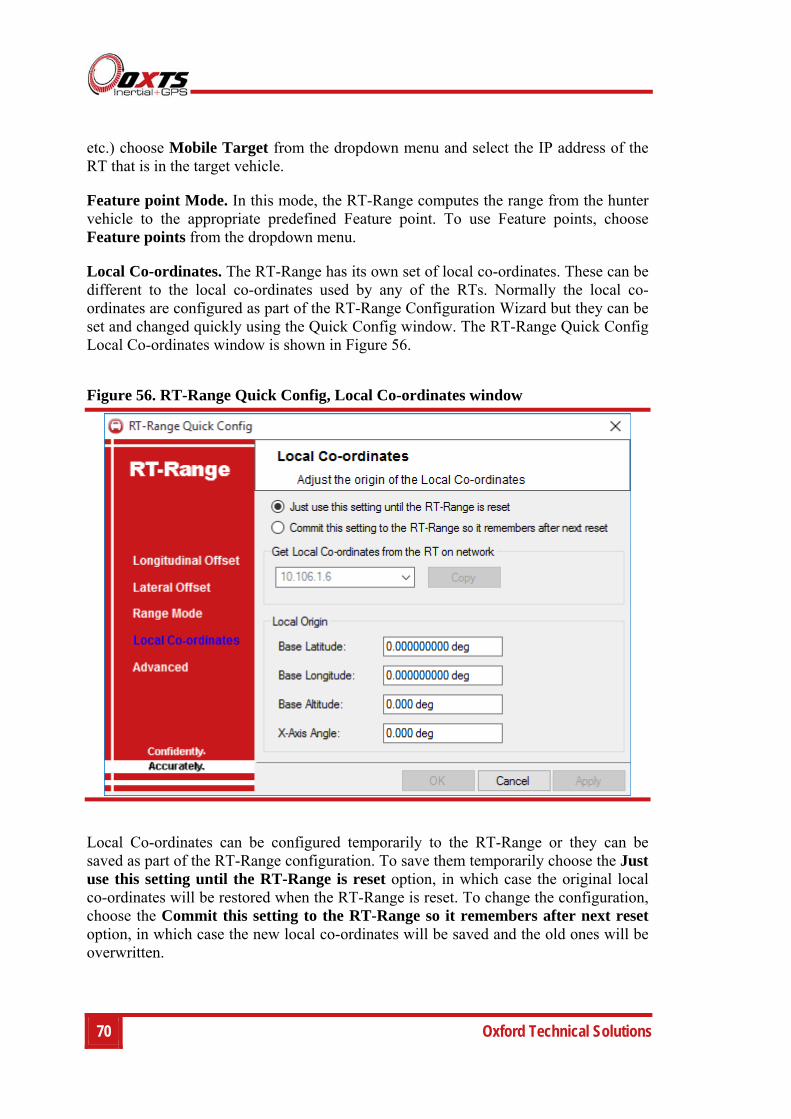
70 Oxford Technical Solutions
etc.) choose Mobile Target from the dropdown menu and select the IP address of the RT that is in the target vehicle.
Feature point Mode. In this mode, the RT-Range computes the range from the hunter vehicle to the appropriate predefined Feature point. To use Feature points, choose Feature points from the dropdown menu.
Local Co-ordinates. The RT-Range has its own set of local co-ordinates. These can be different to the local co-ordinates used by any of the RTs. Normally the local co-ordinates are configured as part of the RT-Range Configuration Wizard but they can be set and changed quickly using the Quick Config window. The RT-Range Quick Config Local Co-ordinates window is shown in Figure 56.
Figure 56. RT-Range Quick Config, Local Co-ordinates window
Local Co-ordinates can be configured temporarily to the RT-Range or they can be saved as part of the RT-Range configuration. To save them temporarily choose the Just use this setting until the RT-Range is reset option, in which case the original local co-ordinates will be restored when the RT-Range is reset. To change the configuration, choose the Commit this setting to the RT-Range so it remembers after next reset option, in which case the new local co-ordinates will be saved and the old ones will be overwritten.
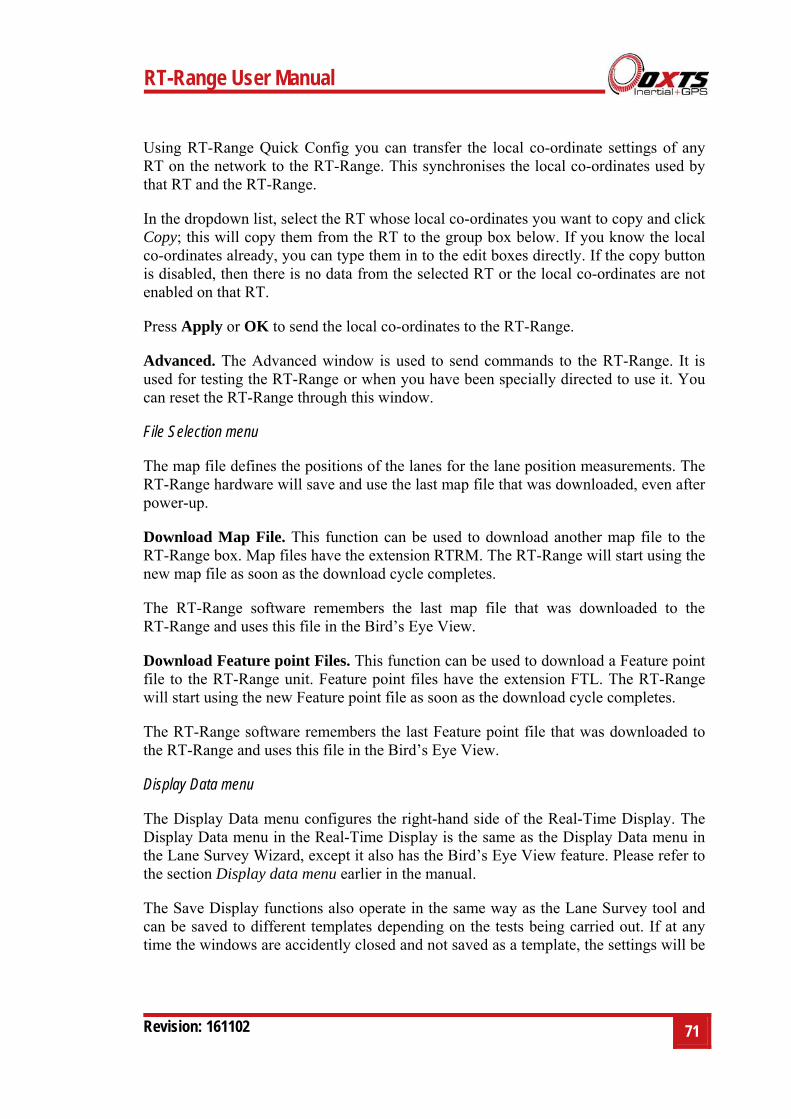
RT-Range User Manual
Revision: 161102
71
Using RT-Range Quick Config you can transfer the local co-ordinate settings of any RT on the network to the RT-Range. This synchronises the local co-ordinates used by that RT and the RT-Range.
In the dropdown list, select the RT whose local co-ordinates you want to copy and click Copy; this will copy them from the RT to the group box below. If you know the local co-ordinates already, you can type them in to the edit boxes directly. If the copy button is disabled, then there is no data from the selected RT or the local co-ordinates are not enabled on that RT.
Press Apply or OK to send the local co-ordinates to the RT-Range.
Advanced. The Advanced window is used to send commands to the RT-Range. It is used for testing the RT-Range or when you have been specially directed to use it. You can reset the RT-Range through this window.
File Selection menu
The map file defines the positions of the lanes for the lane position measurements. The RT-Range hardware will save and use the last map file that was downloaded, even after power-up.
Download Map File. This function can be used to download another map file to the RT-Range box. Map files have the extension RTRM. The RT-Range will start using the new map file as soon as the download cycle completes.
The RT-Range software remembers the last map file that was downloaded to the RT-Range and uses this file in the Bird’s Eye View.
Download Feature point Files. This function can be used to download a Feature point file to the RT-Range unit. Feature point files have the extension FTL. The RT-Range will start using the new Feature point file as soon as the download cycle completes.
The RT-Range software remembers the last Feature point file that was downloaded to the RT-Range and uses this file in the Bird’s Eye View.
Display Data menu
The Display Data menu configures the right-hand side of the Real-Time Display. The Display Data menu in the Real-Time Display is the same as the Display Data menu in the Lane Survey Wizard, except it also has the Bird’s Eye View feature. Please refer to the section Display data menu earlier in the manual.
The Save Display functions also operate in the same way as the Lane Survey tool and can be saved to different templates depending on the tests being carried out. If at any time the windows are accidently closed and not saved as a template, the settings will be
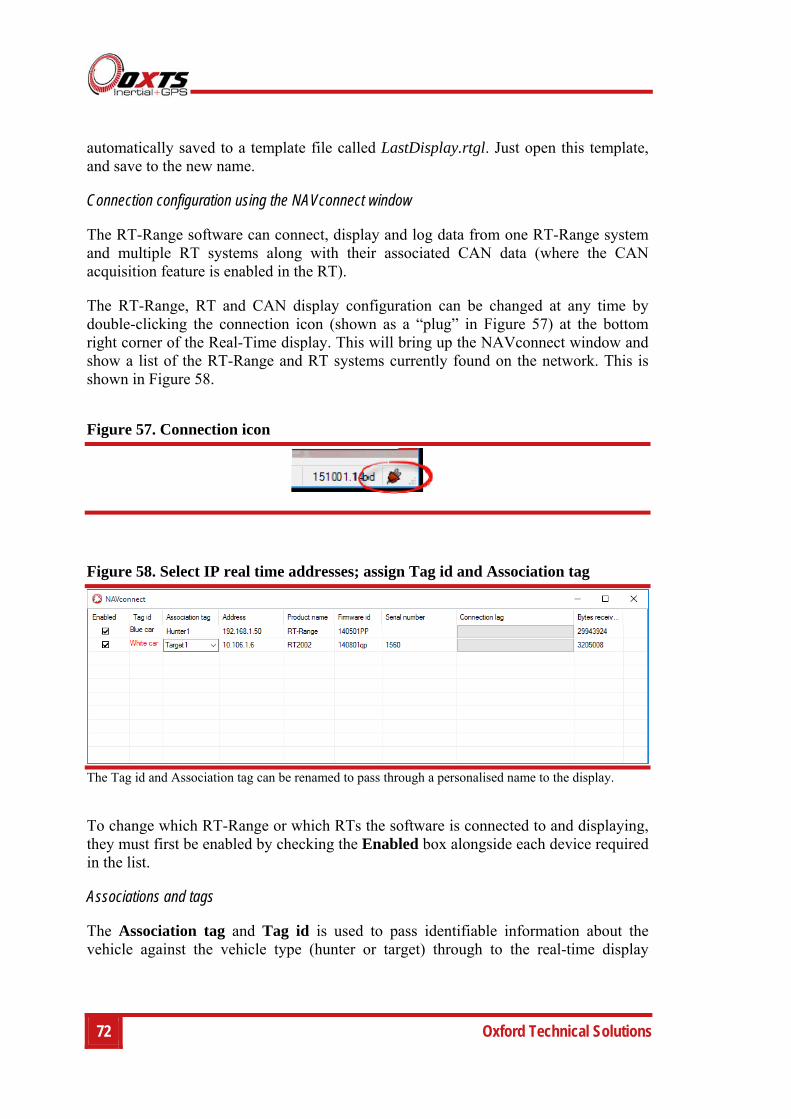
72 Oxford Technical Solutions
automatically saved to a template file called LastDisplay.rtgl. Just open this template, and save to the new name.
Connection configuration using the NAVconnect window
The RT-Range software can connect, display and log data from one RT-Range system and multiple RT systems along with their associated CAN data (where the CAN acquisition feature is enabled in the RT).
The RT-Range, RT and CAN display configuration can be changed at any time by double-clicking the connection icon (shown as a “plug” in Figure 57) at the bottom right corner of the Real-Time display. This will bring up the NAVconnect window and show a list of the RT-Range and RT systems currently found on the network. This is shown in Figure 58.
Figure 57. Connection icon
Figure 58. Select IP real time addresses; assign Tag id and Association tag
The Tag id and Association tag can be renamed to pass through a personalised name to the display.
To change which RT-Range or which RTs the software is connected to and displaying, they must first be enabled by checking the Enabled box alongside each device required in the list.
Associations and tags
The Association tag and Tag id is used to pass identifiable information about the vehicle against the vehicle type (hunter or target) through to the real-time display
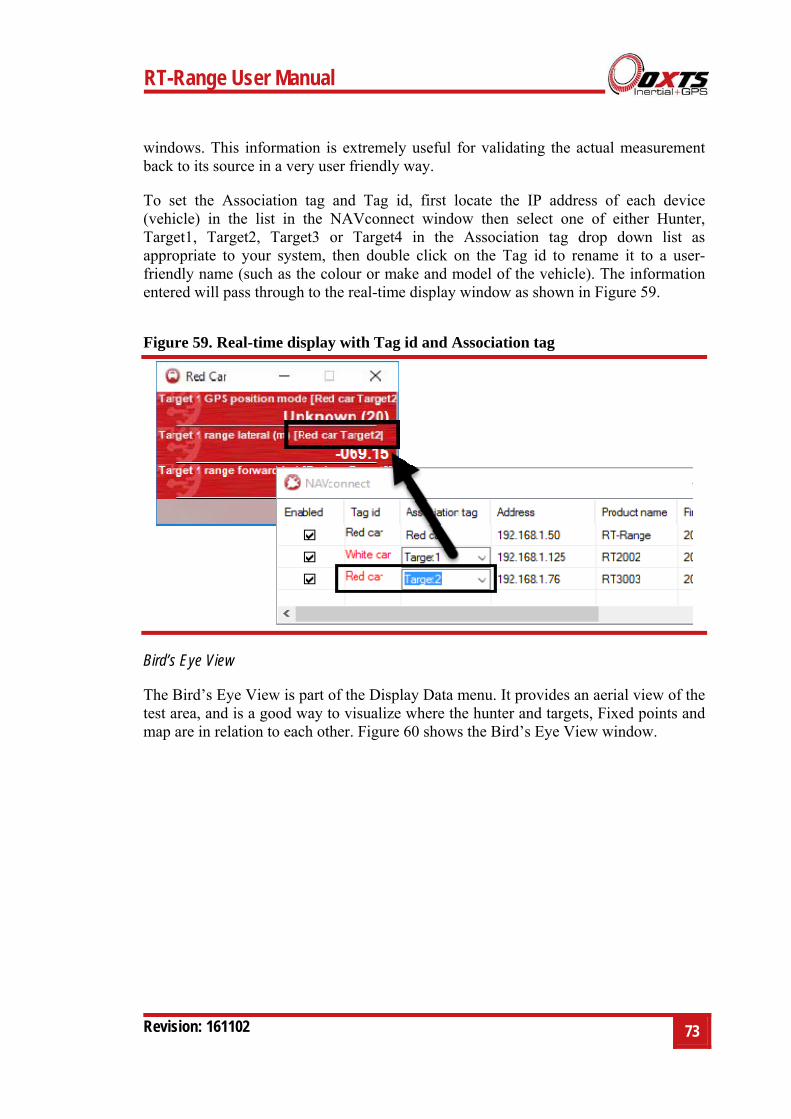
RT-Range User Manual
Revision: 161102
73
windows. This information is extremely useful for validating the actual measurement back to its source in a very user friendly way.
To set the Association tag and Tag id, first locate the IP address of each device (vehicle) in the list in the NAVconnect window then select one of either Hunter, Target1, Target2, Target3 or Target4 in the Association tag drop down list as appropriate to your system, then double click on the Tag id to rename it to a user-friendly name (such as the colour or make and model of the vehicle). The information entered will pass through to the real-time display window as shown in Figure 59.
Figure 59. Real-time display with Tag id and Association tag
Bird’s Eye View
The Bird’s Eye View is part of the Display Data menu. It provides an aerial view of the test area, and is a good way to visualize where the hunter and targets, Fixed points and map are in relation to each other. Figure 60 shows the Bird’s Eye View window.
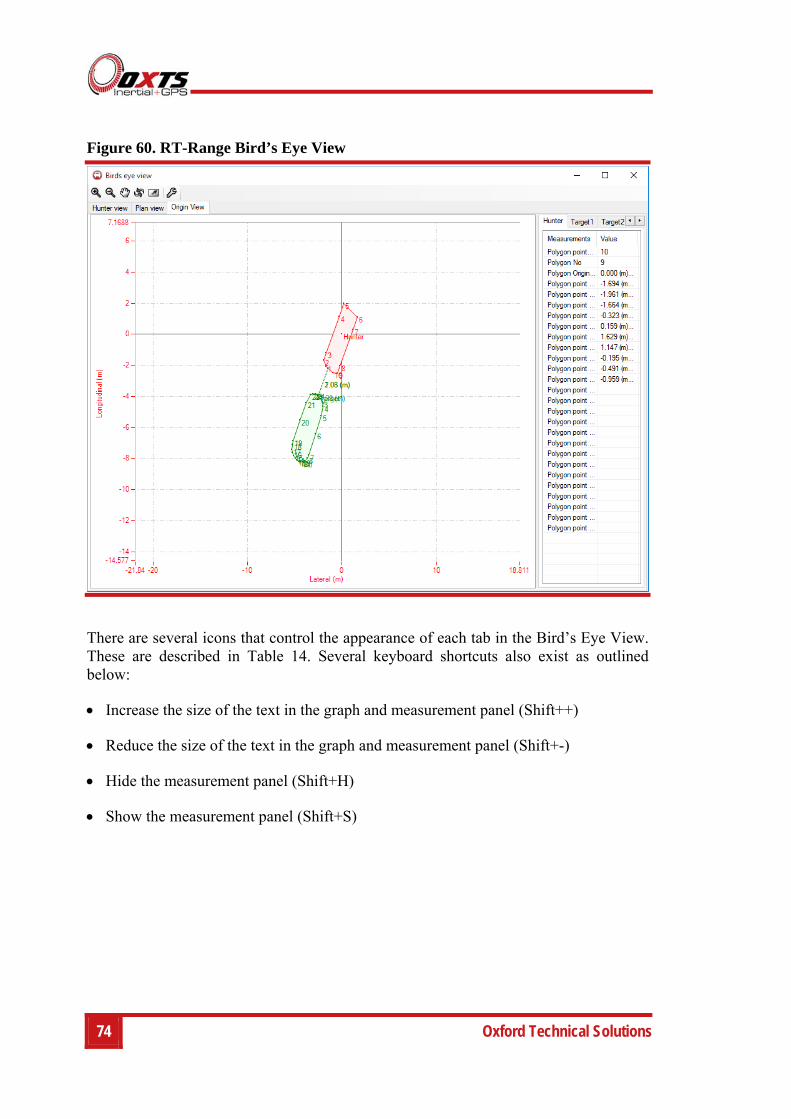
74 Oxford Technical Solutions
Figure 60. RT-Range Bird’s Eye View
There are several icons that control the appearance of each tab in the Bird’s Eye View. These are described in Table 14. Several keyboard shortcuts also exist as outlined below:
Increase the size of the text in the graph and measurement panel (Shift++)
Reduce the size of the text in the graph and measurement panel (Shift+-)
Hide the measurement panel (Shift+H)
Show the measurement panel (Shift+S)
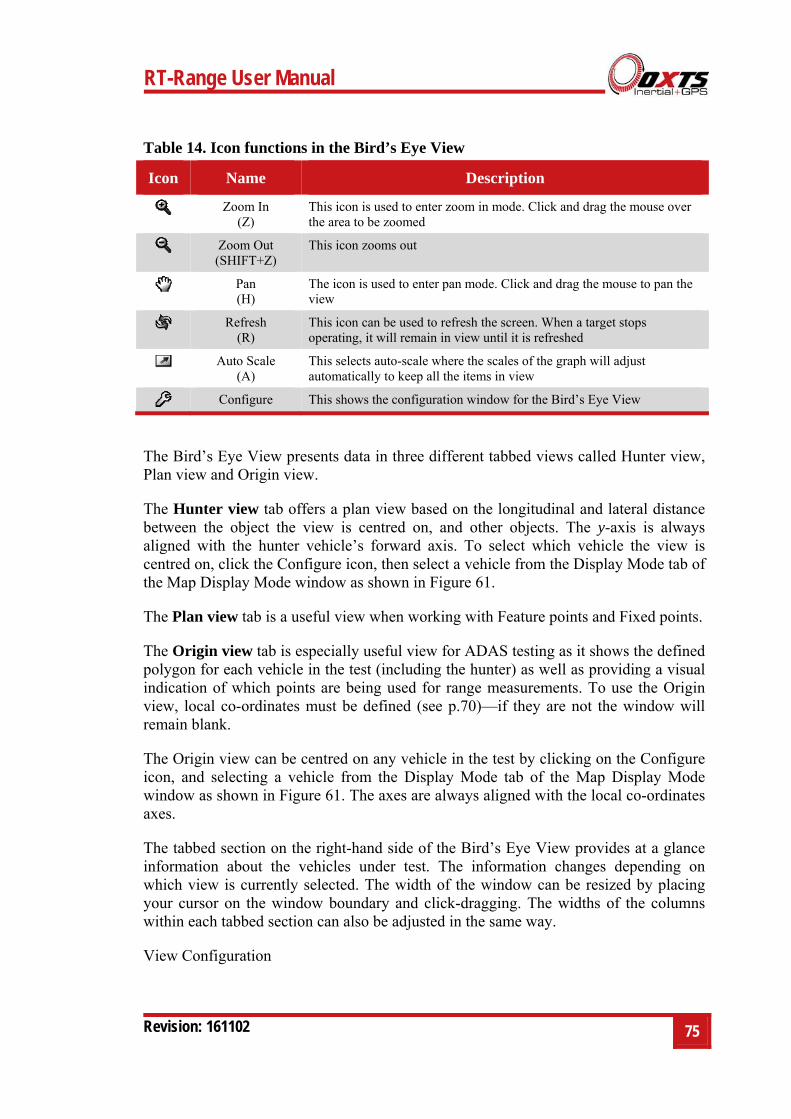
RT-Range User Manual
Revision: 161102
75
Table 14. Icon functions in the Bird’s Eye View
Icon Name Description
Zoom In (Z)
This icon is used to enter zoom in mode. Click and drag the mouse over the area to be zoomed
Zoom Out (SHIFT+Z)
This icon zooms out
Pan (H)
The icon is used to enter pan mode. Click and drag the mouse to pan the view
Refresh (R)
This icon can be used to refresh the screen. When a target stops operating, it will remain in view until it is refreshed
Auto Scale (A)
This selects auto-scale where the scales of the graph will adjust automatically to keep all the items in view
Configure This shows the configuration window for the Bird’s Eye View
The Bird’s Eye View presents data in three different tabbed views called Hunter view, Plan view and Origin view.
The Hunter view tab offers a plan view based on the longitudinal and lateral distance between the object the view is centred on, and other objects. The y-axis is always aligned with the hunter vehicle’s forward axis. To select which vehicle the view is centred on, click the Configure icon, then select a vehicle from the Display Mode tab of the Map Display Mode window as shown in Figure 61.
The Plan view tab is a useful view when working with Feature points and Fixed points.
The Origin view tab is especially useful view for ADAS testing as it shows the defined polygon for each vehicle in the test (including the hunter) as well as providing a visual indication of which points are being used for range measurements. To use the Origin view, local co-ordinates must be defined (see p.70)—if they are not the window will remain blank.
The Origin view can be centred on any vehicle in the test by clicking on the Configure icon, and selecting a vehicle from the Display Mode tab of the Map Display Mode window as shown in Figure 61. The axes are always aligned with the local co-ordinates axes.
The tabbed section on the right-hand side of the Bird’s Eye View provides at a glance information about the vehicles under test. The information changes depending on which view is currently selected. The width of the window can be resized by placing your cursor on the window boundary and click-dragging. The widths of the columns within each tabbed section can also be adjusted in the same way.
View Configuration
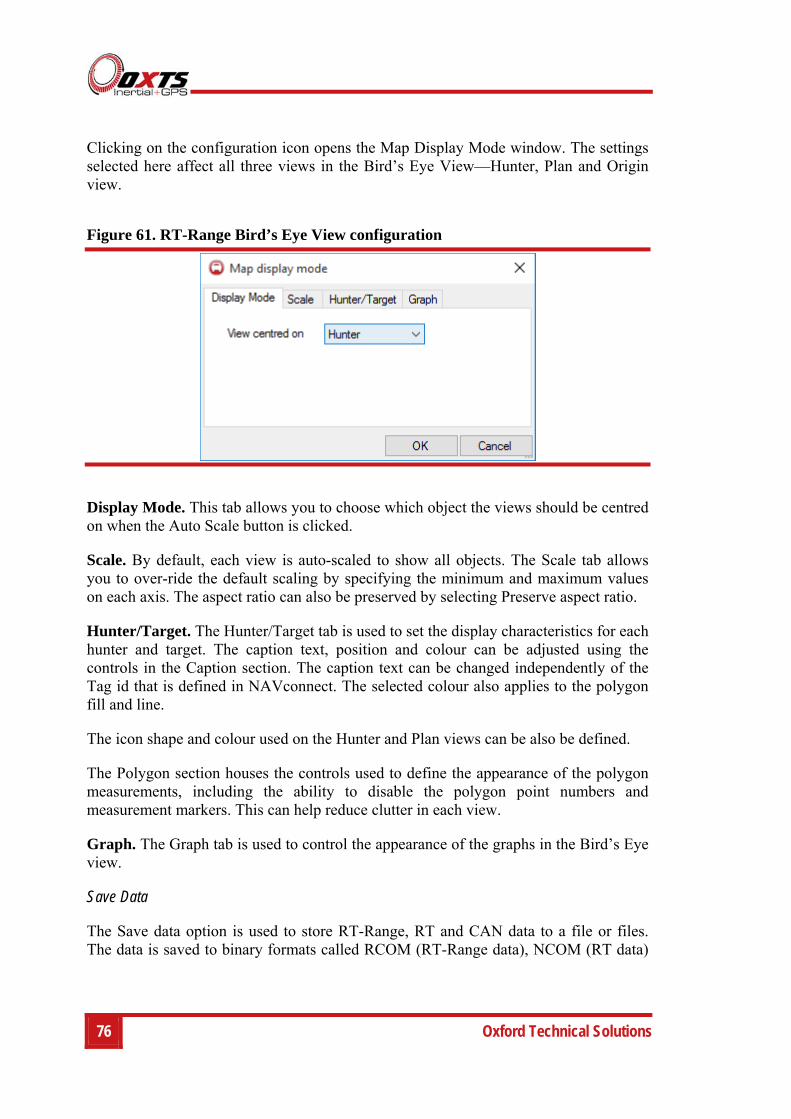
76 Oxford Technical Solutions
Clicking on the configuration icon opens the Map Display Mode window. The settings selected here affect all three views in the Bird’s Eye View—Hunter, Plan and Origin view.
Figure 61. RT-Range Bird’s Eye View configuration
Display Mode. This tab allows you to choose which object the views should be centred on when the Auto Scale button is clicked.
Scale. By default, each view is auto-scaled to show all objects. The Scale tab allows you to over-ride the default scaling by specifying the minimum and maximum values on each axis. The aspect ratio can also be preserved by selecting Preserve aspect ratio.
Hunter/Target. The Hunter/Target tab is used to set the display characteristics for each hunter and target. The caption text, position and colour can be adjusted using the controls in the Caption section. The caption text can be changed independently of the Tag id that is defined in NAVconnect. The selected colour also applies to the polygon fill and line.
The icon shape and colour used on the Hunter and Plan views can be also be defined.
The Polygon section houses the controls used to define the appearance of the polygon measurements, including the ability to disable the polygon point numbers and measurement markers. This can help reduce clutter in each view.
Graph. The Graph tab is used to control the appearance of the graphs in the Bird’s Eye view.
Save Data
The Save data option is used to store RT-Range, RT and CAN data to a file or files. The data is saved to binary formats called RCOM (RT-Range data), NCOM (RT data)
RT-Range User Manual
Revision: 161102
77
and XCOM (RT and CAN data combined from a CAN enabled RT). If the device is outputting CAN data, the file extension will always be XCOM rather than NCOM.
The Data logging module logs the data from the Hunter, Targets and selected RT-Range as they appear in the NAVconnect window. The logged files will have their file names saved using the following format:
filename-000_ Tag id [Association Tag].xcom
filename-000_ Tag id [Association Tag].rcom
There will be a file logged for each of the enabled devices in the NAVconnect connection manager window.
Once all the data files have been logged, open the RCOM file using NAVgraph. NAVgraph will load all the files and display the RCOM, NCOM or XCOM data in graph form along with a table using a chosen template. From here, it is then possible to export all data to separate CSV files, or directly to a single CSV file. Please read the NAVgraph manual for more information about how to do this.
Note: RT-Range Post-Process does not currently support the XCOM file.
The Data Logging dialog box is shown in Figure 62.
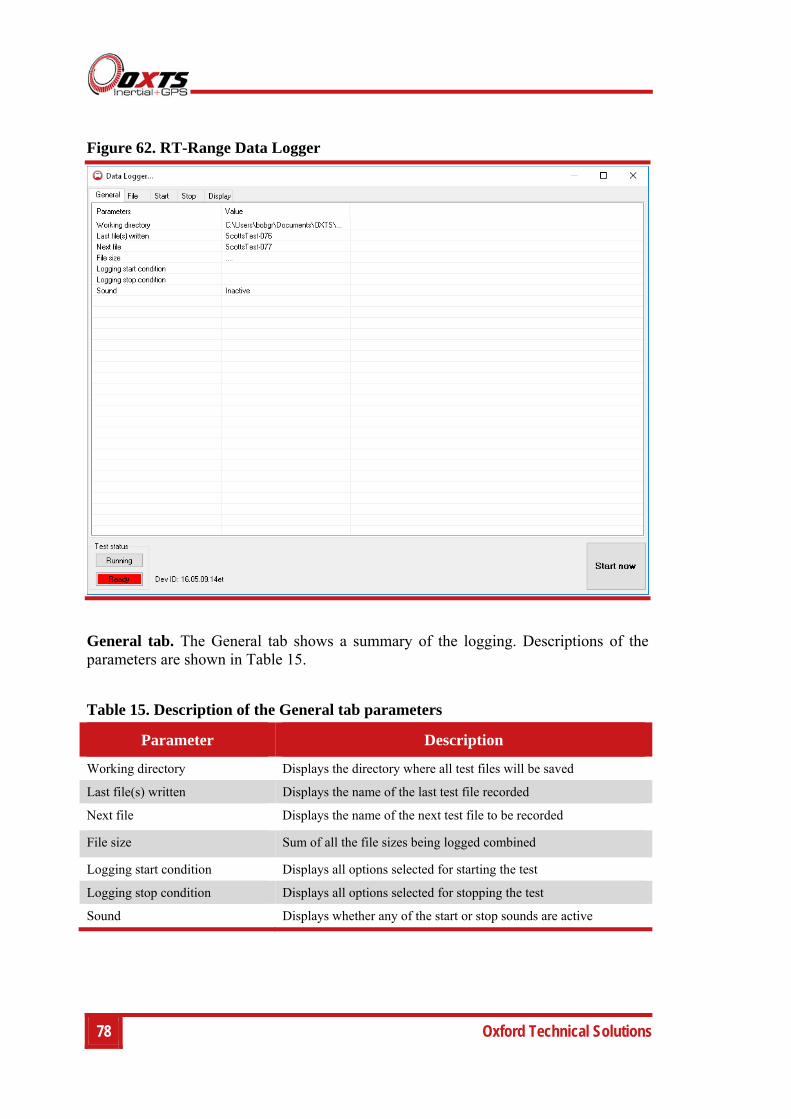
78 Oxford Technical Solutions
Figure 62. RT-Range Data Logger
General tab. The General tab shows a summary of the logging. Descriptions of the parameters are shown in Table 15.
Table 15. Description of the General tab parameters
Parameter Description
Working directory Displays the directory where all test files will be saved
Last file(s) written Displays the name of the last test file recorded
Next file Displays the name of the next test file to be recorded
File size Sum of all the file sizes being logged combined
Logging start condition Displays all options selected for starting the test
Logging stop condition Displays all options selected for stopping the test
Sound Displays whether any of the start or stop sounds are active
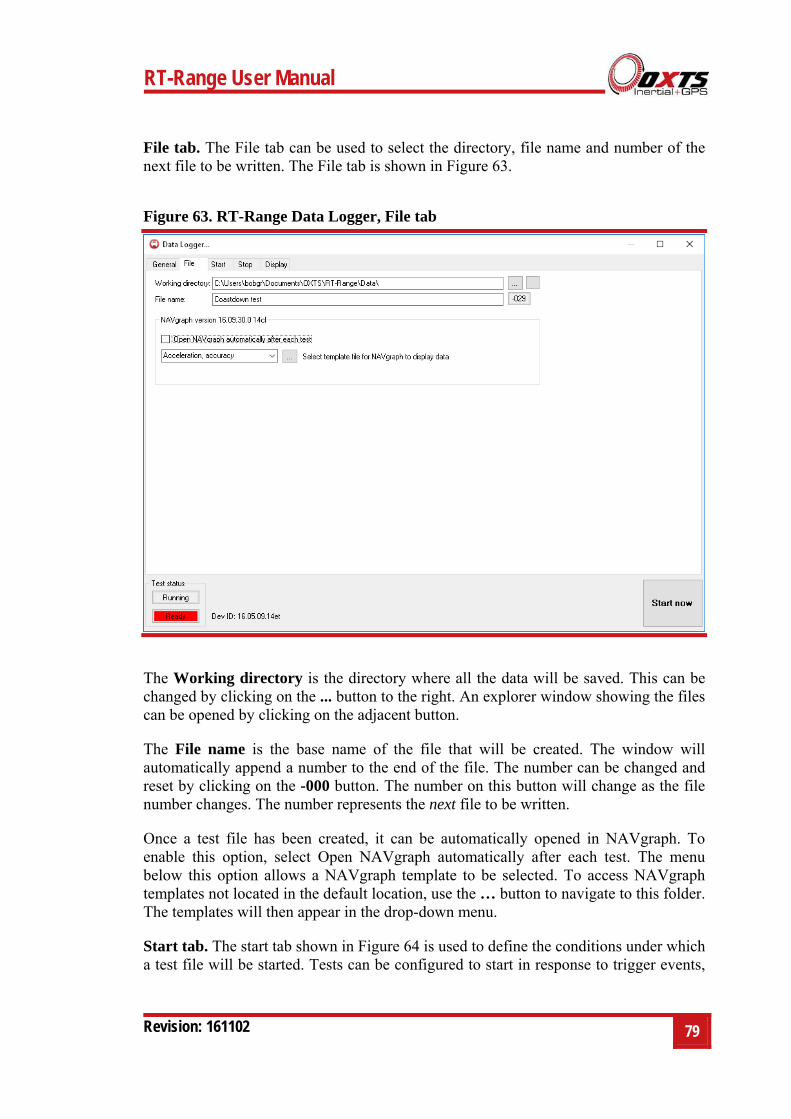
RT-Range User Manual
Revision: 161102
79
File tab. The File tab can be used to select the directory, file name and number of the next file to be written. The File tab is shown in Figure 63.
Figure 63. RT-Range Data Logger, File tab
The Working directory is the directory where all the data will be saved. This can be changed by clicking on the ... button to the right. An explorer window showing the files can be opened by clicking on the adjacent button.
The File name is the base name of the file that will be created. The window will automatically append a number to the end of the file. The number can be changed and reset by clicking on the -000 button. The number on this button will change as the file number changes. The number represents the next file to be written.
Once a test file has been created, it can be automatically opened in NAVgraph. To enable this option, select Open NAVgraph automatically after each test. The menu below this option allows a NAVgraph template to be selected. To access NAVgraph templates not located in the default location, use the … button to navigate to this folder. The templates will then appear in the drop-down menu.
Start tab. The start tab shown in Figure 64 is used to define the conditions under which a test file will be started. Tests can be configured to start in response to trigger events,
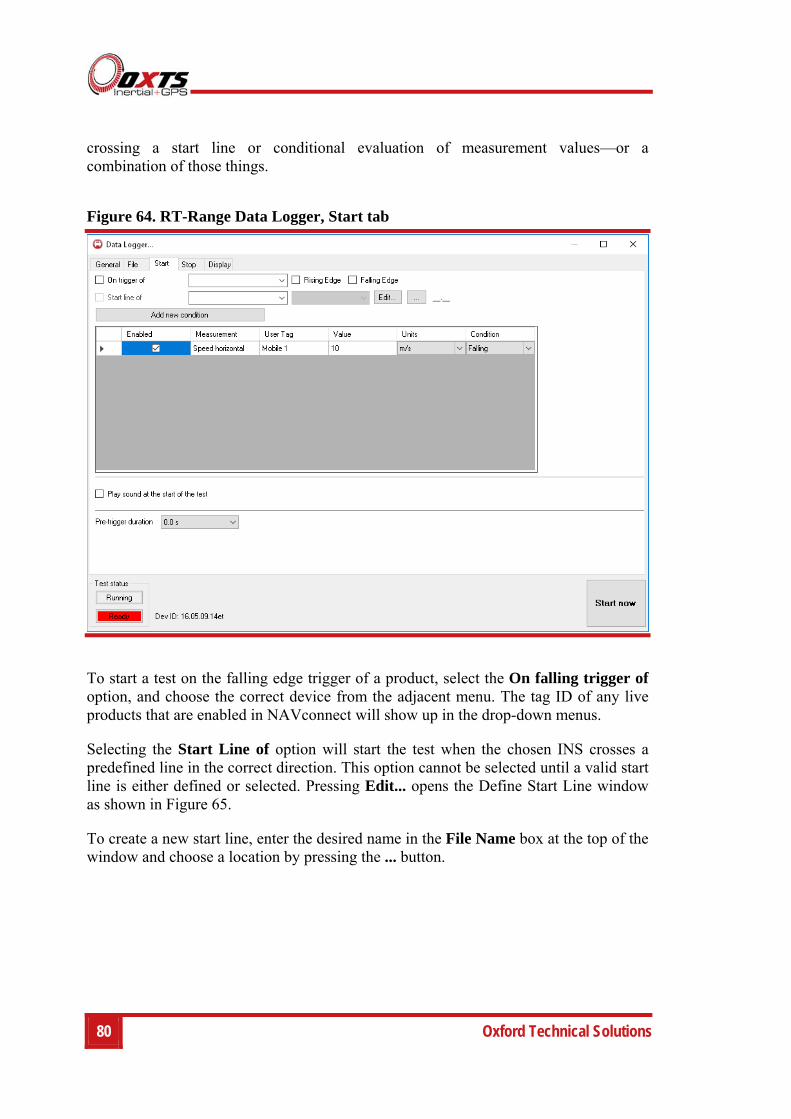
80 Oxford Technical Solutions
crossing a start line or conditional evaluation of measurement values—or a combination of those things.
Figure 64. RT-Range Data Logger, Start tab
To start a test on the falling edge trigger of a product, select the On falling trigger of option, and choose the correct device from the adjacent menu. The tag ID of any live products that are enabled in NAVconnect will show up in the drop-down menus.
Selecting the Start Line of option will start the test when the chosen INS crosses a predefined line in the correct direction. This option cannot be selected until a valid start line is either defined or selected. Pressing Edit... opens the Define Start Line window as shown in Figure 65.
To create a new start line, enter the desired name in the File Name box at the top of the window and choose a location by pressing the ... button.
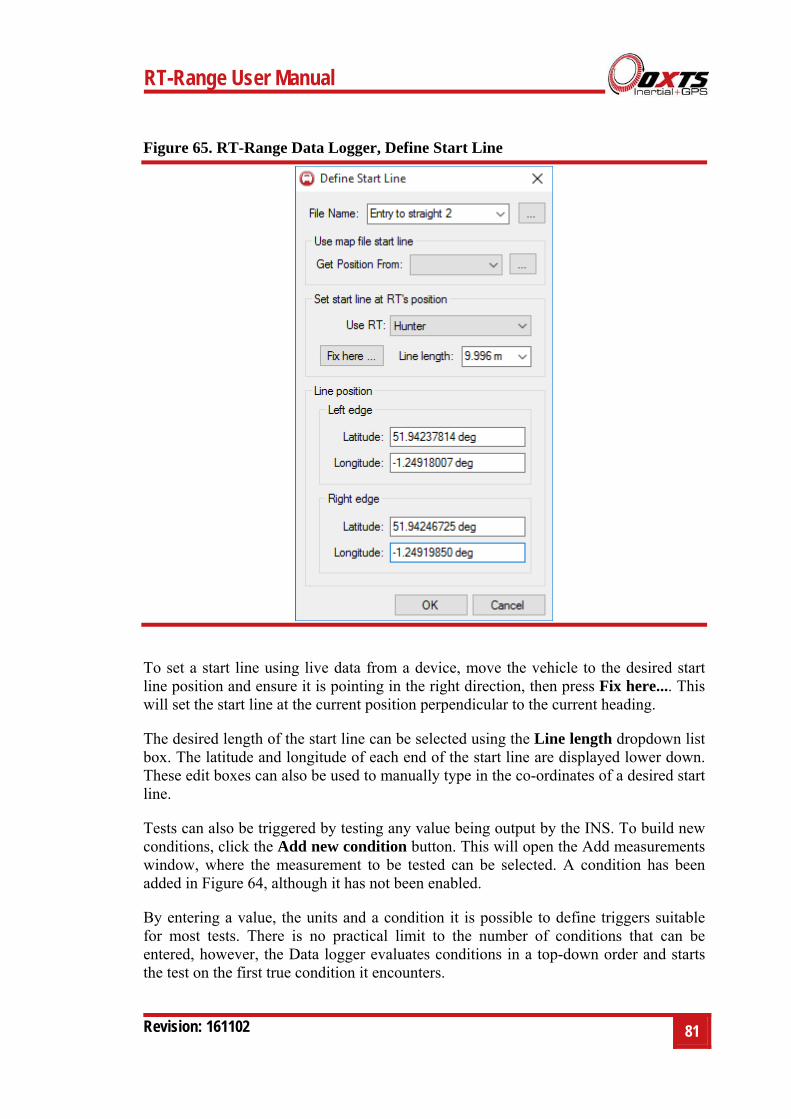
RT-Range User Manual
Revision: 161102
81
Figure 65. RT-Range Data Logger, Define Start Line
To set a start line using live data from a device, move the vehicle to the desired start line position and ensure it is pointing in the right direction, then press Fix here.... This will set the start line at the current position perpendicular to the current heading.
The desired length of the start line can be selected using the Line length dropdown list box. The latitude and longitude of each end of the start line are displayed lower down. These edit boxes can also be used to manually type in the co-ordinates of a desired start line.
Tests can also be triggered by testing any value being output by the INS. To build new conditions, click the Add new condition button. This will open the Add measurements window, where the measurement to be tested can be selected. A condition has been added in Figure 64, although it has not been enabled.
By entering a value, the units and a condition it is possible to define triggers suitable for most tests. There is no practical limit to the number of conditions that can be entered, however, the Data logger evaluates conditions in a top-down order and starts the test on the first true condition it encounters.
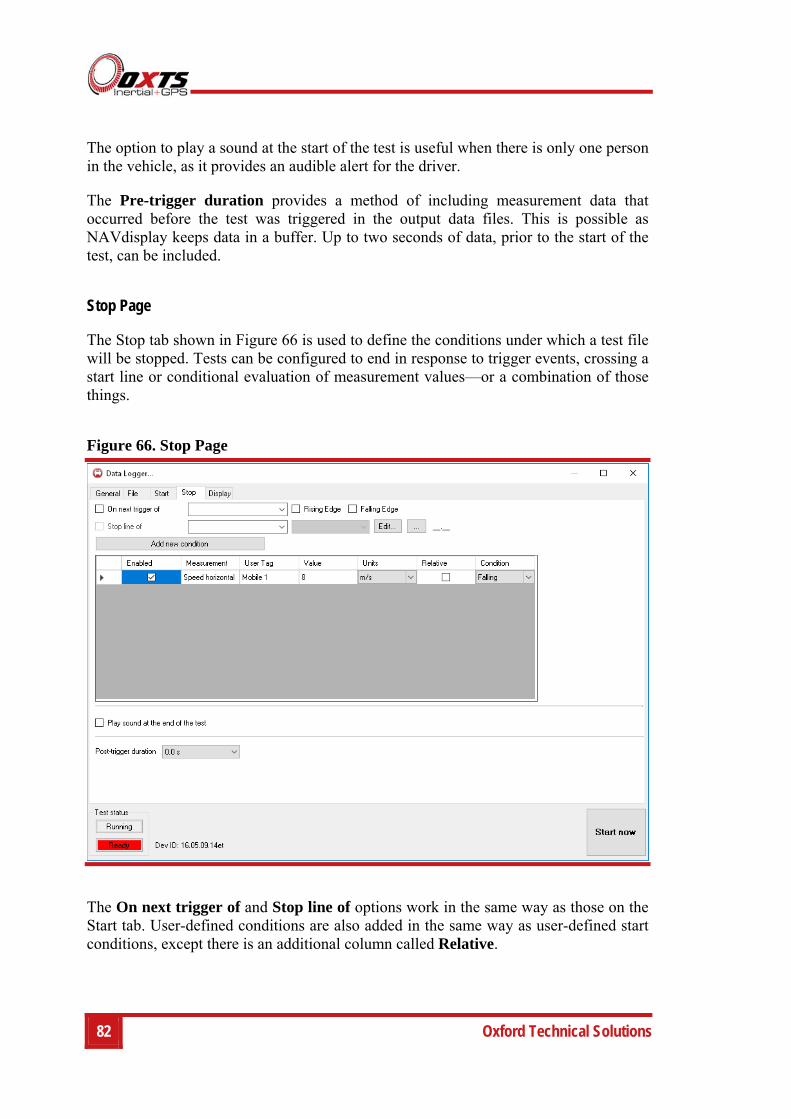
82 Oxford Technical Solutions
The option to play a sound at the start of the test is useful when there is only one person in the vehicle, as it provides an audible alert for the driver.
The Pre-trigger duration provides a method of including measurement data that occurred before the test was triggered in the output data files. This is possible as NAVdisplay keeps data in a buffer. Up to two seconds of data, prior to the start of the test, can be included.
Stop Page
The Stop tab shown in Figure 66 is used to define the conditions under which a test file will be stopped. Tests can be configured to end in response to trigger events, crossing a start line or conditional evaluation of measurement values—or a combination of those things.
Figure 66. Stop Page
The On next trigger of and Stop line of options work in the same way as those on the Start tab. User-defined conditions are also added in the same way as user-defined start conditions, except there is an additional column called Relative.
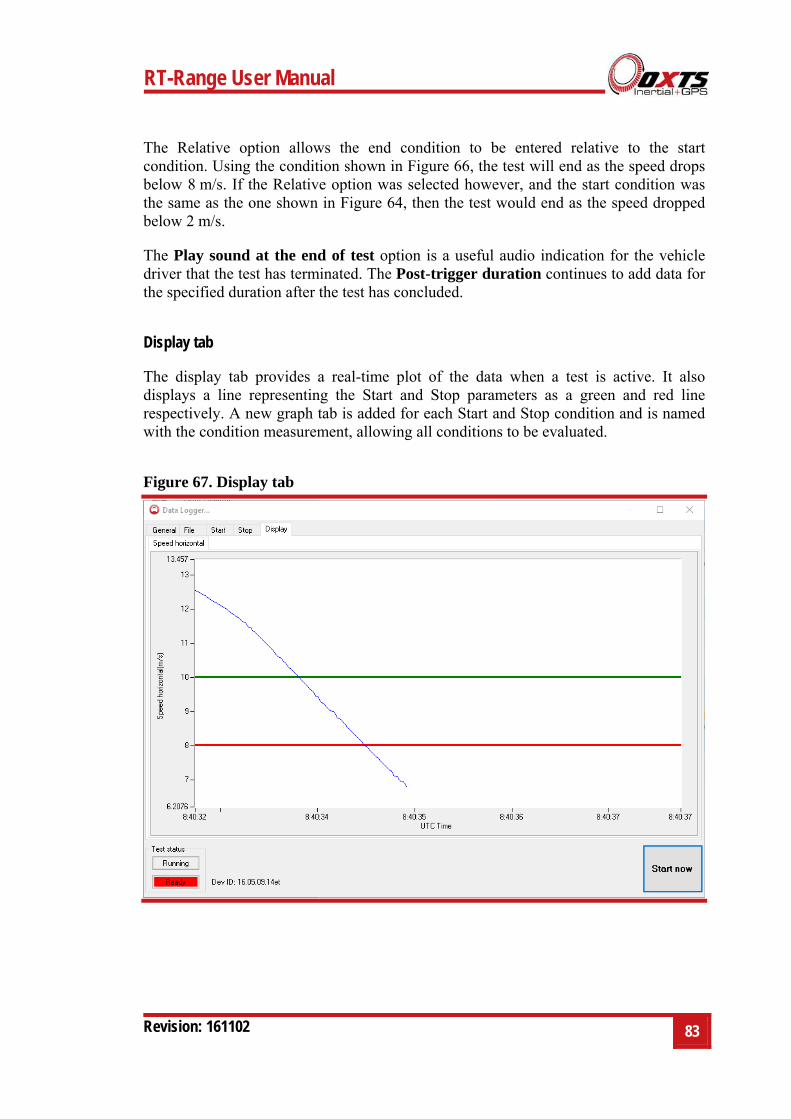
RT-Range User Manual
Revision: 161102
83
The Relative option allows the end condition to be entered relative to the start condition. Using the condition shown in Figure 66, the test will end as the speed drops below 8 m/s. If the Relative option was selected however, and the start condition was the same as the one shown in Figure 64, then the test would end as the speed dropped below 2 m/s.
The Play sound at the end of test option is a useful audio indication for the vehicle driver that the test has terminated. The Post-trigger duration continues to add data for the specified duration after the test has concluded.
Display tab
The display tab provides a real-time plot of the data when a test is active. It also displays a line representing the Start and Stop parameters as a green and red line respectively. A new graph tab is added for each Start and Stop condition and is named with the condition measurement, allowing all conditions to be evaluated.
Figure 67. Display tab

84 Oxford Technical Solutions
RT-Range Configuration Wizard
The RT-Range Configuration Wizard is accessed through the Real-Time Display. The parameters in the RT-Range Configuration Wizard are normally only changed when the system is installed in a vehicle.
Overview
To configure the RT-Range correctly the following information is required:
IP Addresses of the RTs and of the RT-Range.
Position(s) in the hunter vehicle of the sensors that measure the lane position.
Positions of the sensors on all vehicles that measure the distance between the vehicles.
Shapes of the target vehicles and Fixed points, if polygons are going to be used.
CAN bus, Local Co-ordinate Origin, Range Latency, etc.
The RT-Range is a very precise instrument and these measurements are critical to getting the best results from it. It is not easy to get all the measurements accurate to 1 cm or better. However, a 1 cm error on the RT-Range configuration will result in a 1 cm error in the outputs. It is critical to get these measurements accurate.
Reading the Initial Configuration
Figure 68 shows the first page of the wizard.
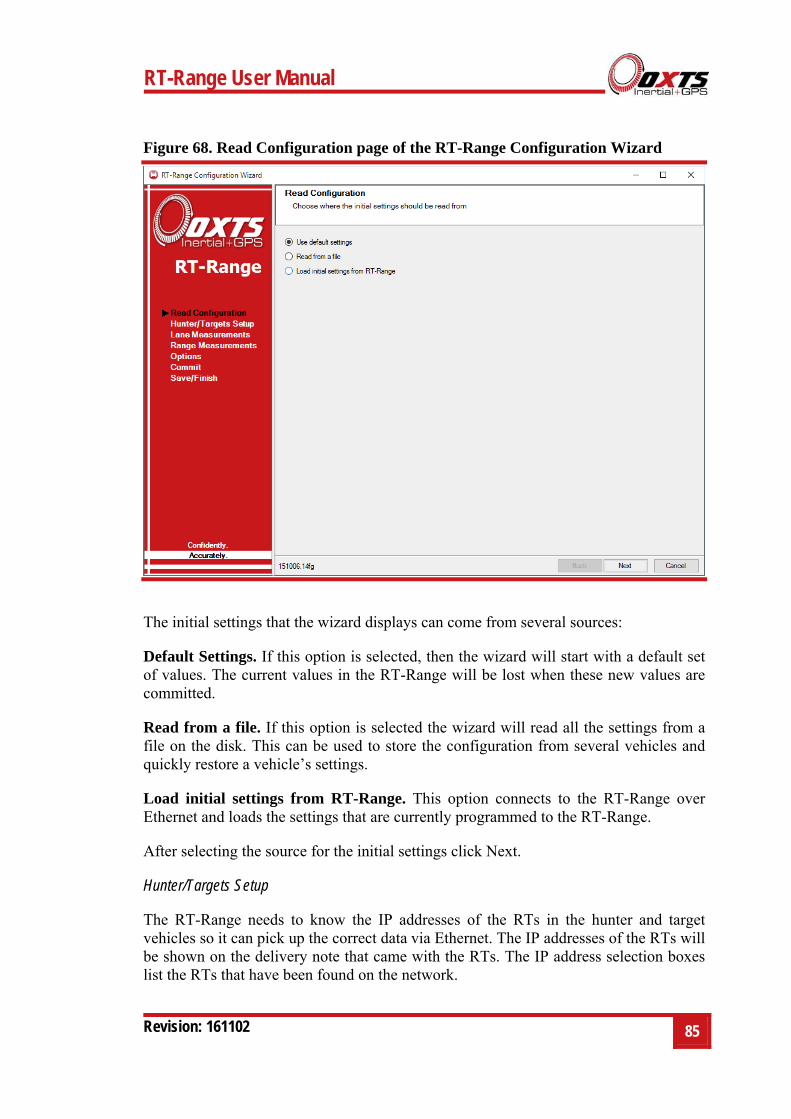
RT-Range User Manual
Revision: 161102
85
Figure 68. Read Configuration page of the RT-Range Configuration Wizard
The initial settings that the wizard displays can come from several sources:
Default Settings. If this option is selected, then the wizard will start with a default set of values. The current values in the RT-Range will be lost when these new values are committed.
Read from a file. If this option is selected the wizard will read all the settings from a file on the disk. This can be used to store the configuration from several vehicles and quickly restore a vehicle’s settings.
Load initial settings from RT-Range. This option connects to the RT-Range over Ethernet and loads the settings that are currently programmed to the RT-Range.
After selecting the source for the initial settings click Next.
Hunter/Targets Setup
The RT-Range needs to know the IP addresses of the RTs in the hunter and target vehicles so it can pick up the correct data via Ethernet. The IP addresses of the RTs will be shown on the delivery note that came with the RTs. The IP address selection boxes list the RTs that have been found on the network.
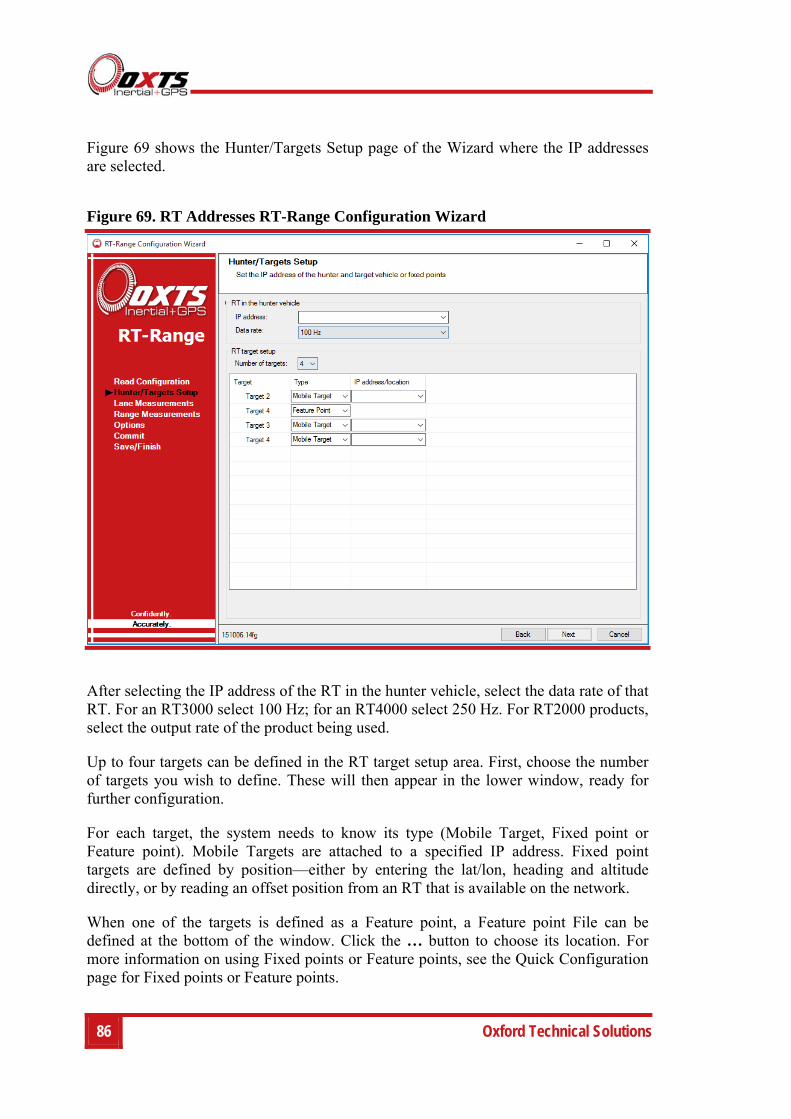
86 Oxford Technical Solutions
Figure 69 shows the Hunter/Targets Setup page of the Wizard where the IP addresses are selected.
Figure 69. RT Addresses RT-Range Configuration Wizard
After selecting the IP address of the RT in the hunter vehicle, select the data rate of that RT. For an RT3000 select 100 Hz; for an RT4000 select 250 Hz. For RT2000 products, select the output rate of the product being used.
Up to four targets can be defined in the RT target setup area. First, choose the number of targets you wish to define. These will then appear in the lower window, ready for further configuration.
For each target, the system needs to know its type (Mobile Target, Fixed point or Feature point). Mobile Targets are attached to a specified IP address. Fixed point targets are defined by position—either by entering the lat/lon, heading and altitude directly, or by reading an offset position from an RT that is available on the network.
When one of the targets is defined as a Feature point, a Feature point File can be defined at the bottom of the window. Click the … button to choose its location. For more information on using Fixed points or Feature points, see the Quick Configuration page for Fixed points or Feature points.
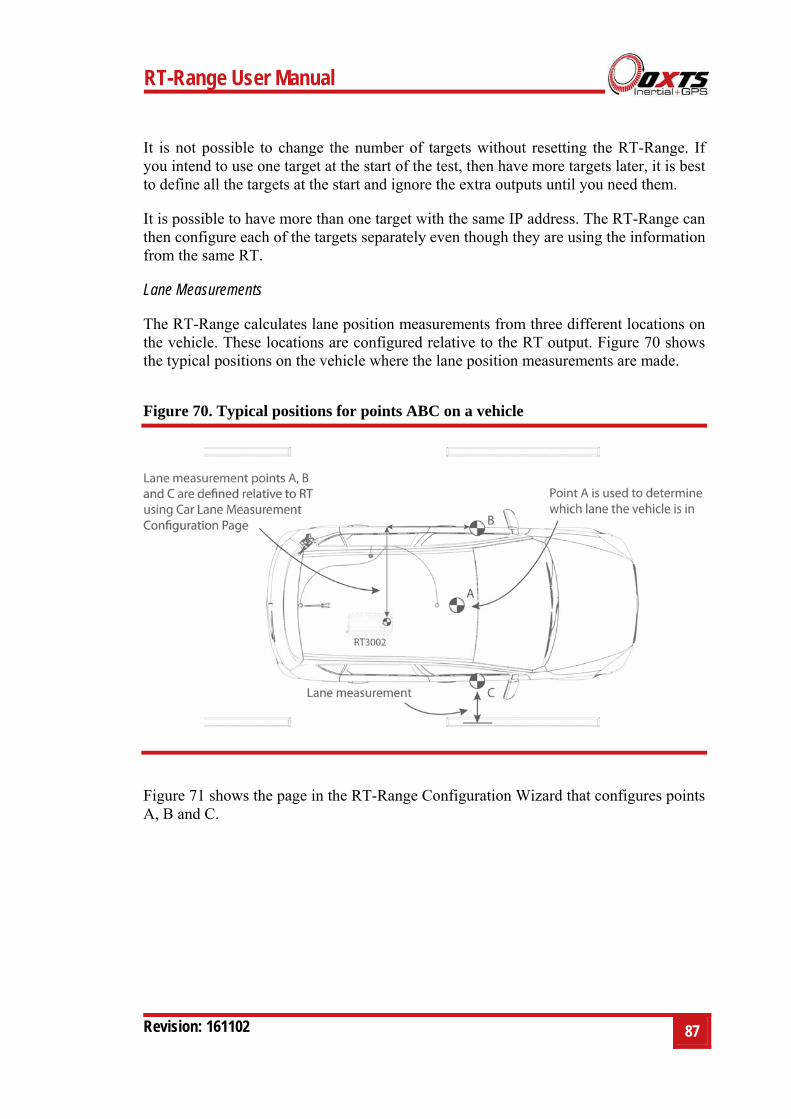
RT-Range User Manual
Revision: 161102
87
It is not possible to change the number of targets without resetting the RT-Range. If you intend to use one target at the start of the test, then have more targets later, it is best to define all the targets at the start and ignore the extra outputs until you need them.
It is possible to have more than one target with the same IP address. The RT-Range can then configure each of the targets separately even though they are using the information from the same RT.
Lane Measurements
The RT-Range calculates lane position measurements from three different locations on the vehicle. These locations are configured relative to the RT output. Figure 70 shows the typical positions on the vehicle where the lane position measurements are made.
Figure 70. Typical positions for points ABC on a vehicle
Figure 71 shows the page in the RT-Range Configuration Wizard that configures points A, B and C.
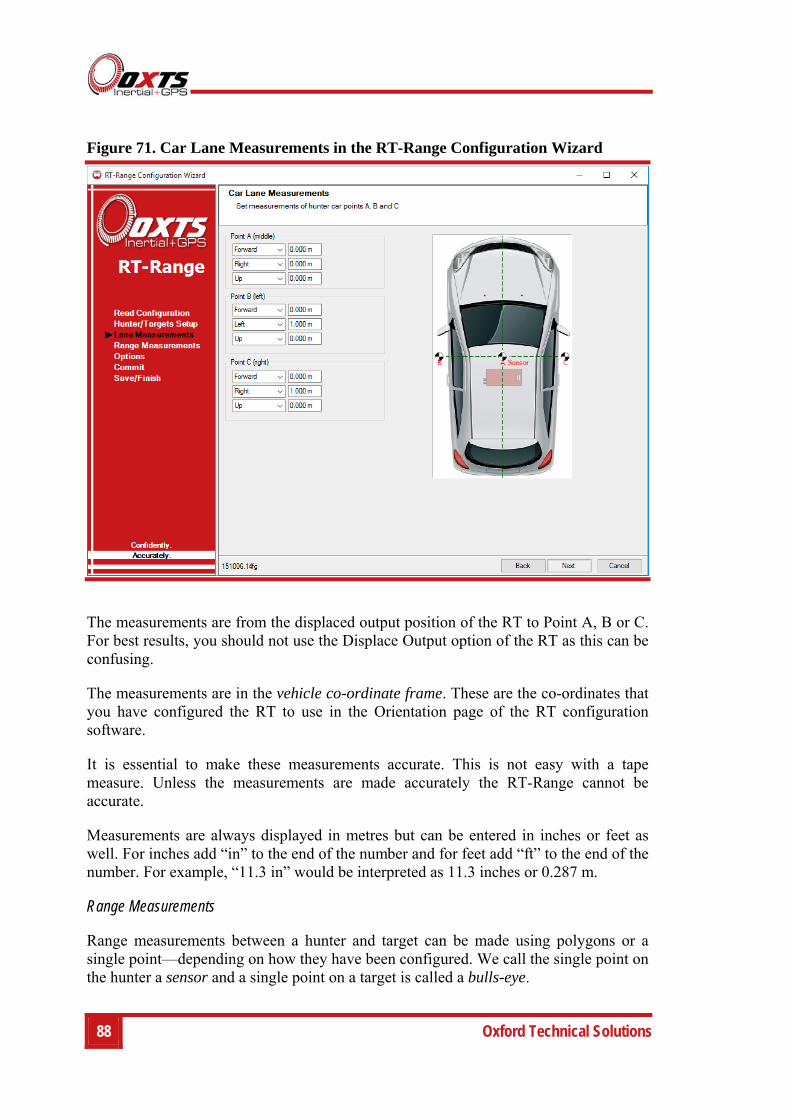
88 Oxford Technical Solutions
Figure 71. Car Lane Measurements in the RT-Range Configuration Wizard
The measurements are from the displaced output position of the RT to Point A, B or C. For best results, you should not use the Displace Output option of the RT as this can be confusing.
The measurements are in the vehicle co-ordinate frame. These are the co-ordinates that you have configured the RT to use in the Orientation page of the RT configuration software.
It is essential to make these measurements accurate. This is not easy with a tape measure. Unless the measurements are made accurately the RT-Range cannot be accurate.
Measurements are always displayed in metres but can be entered in inches or feet as well. For inches add “in” to the end of the number and for feet add “ft” to the end of the number. For example, “11.3 in” would be interpreted as 11.3 inches or 0.287 m.
Range Measurements
Range measurements between a hunter and target can be made using polygons or a single point—depending on how they have been configured. We call the single point on the hunter a sensor and a single point on a target is called a bulls-eye.
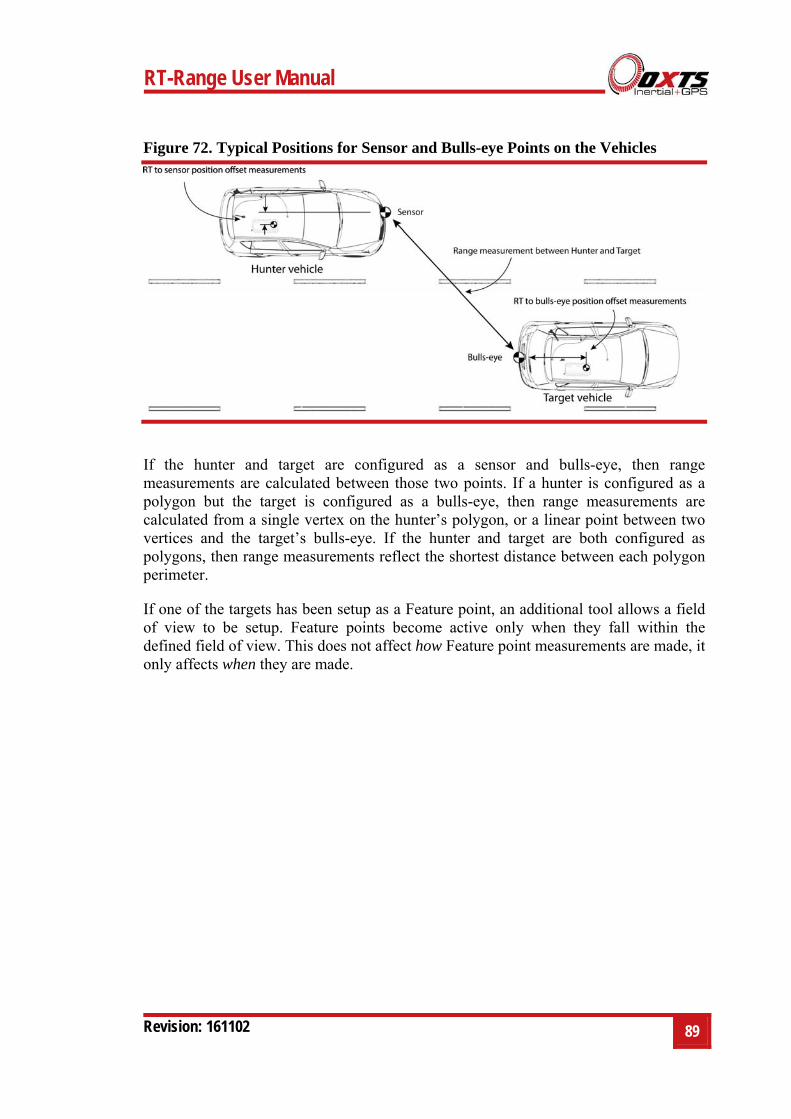
RT-Range User Manual
Revision: 161102
89
Figure 72. Typical Positions for Sensor and Bulls-eye Points on the Vehicles
If the hunter and target are configured as a sensor and bulls-eye, then range measurements are calculated between those two points. If a hunter is configured as a polygon but the target is configured as a bulls-eye, then range measurements are calculated from a single vertex on the hunter’s polygon, or a linear point between two vertices and the target’s bulls-eye. If the hunter and target are both configured as polygons, then range measurements reflect the shortest distance between each polygon perimeter.
If one of the targets has been setup as a Feature point, an additional tool allows a field of view to be setup. Feature points become active only when they fall within the defined field of view. This does not affect how Feature point measurements are made, it only affects when they are made.
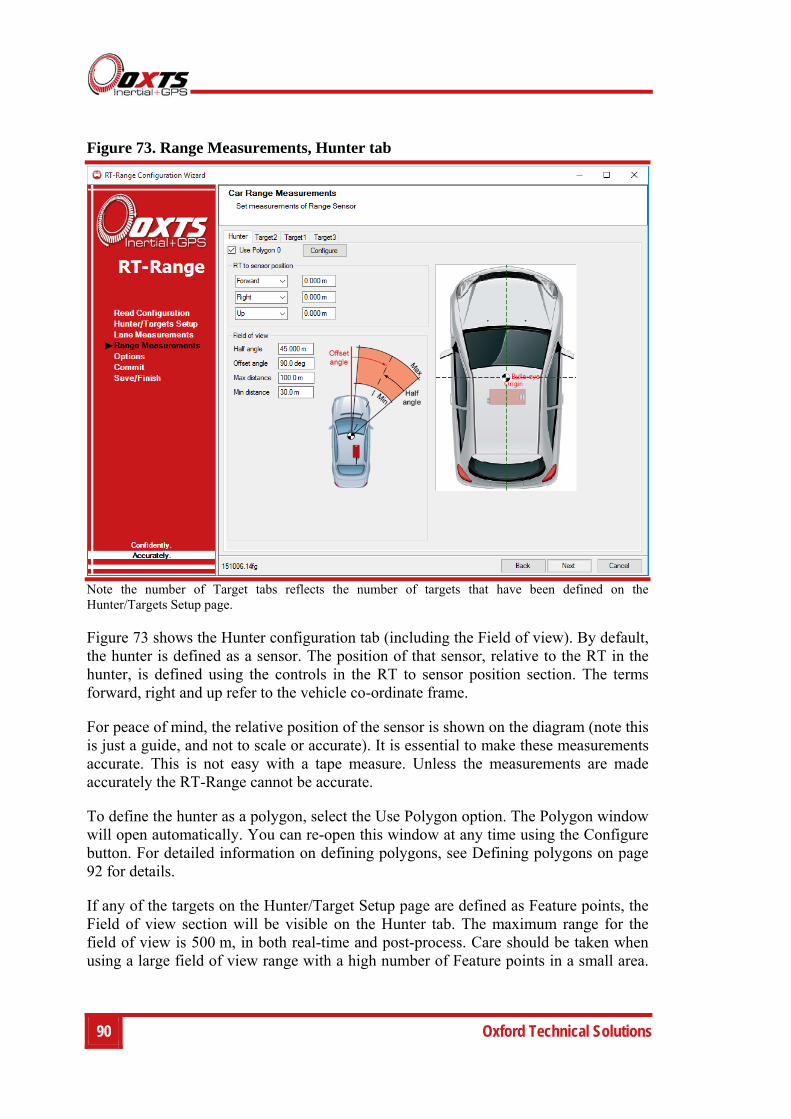
90 Oxford Technical Solutions
Figure 73. Range Measurements, Hunter tab
Note the number of Target tabs reflects the number of targets that have been defined on the Hunter/Targets Setup page.
Figure 73 shows the Hunter configuration tab (including the Field of view). By default, the hunter is defined as a sensor. The position of that sensor, relative to the RT in the hunter, is defined using the controls in the RT to sensor position section. The terms forward, right and up refer to the vehicle co-ordinate frame.
For peace of mind, the relative position of the sensor is shown on the diagram (note this is just a guide, and not to scale or accurate). It is essential to make these measurements accurate. This is not easy with a tape measure. Unless the measurements are made accurately the RT-Range cannot be accurate.
To define the hunter as a polygon, select the Use Polygon option. The Polygon window will open automatically. You can re-open this window at any time using the Configure button. For detailed information on defining polygons, see Defining polygons on page 92 for details.
If any of the targets on the Hunter/Target Setup page are defined as Feature points, the Field of view section will be visible on the Hunter tab. The maximum range for the field of view is 500 m, in both real-time and post-process. Care should be taken when using a large field of view range with a high number of Feature points in a small area.
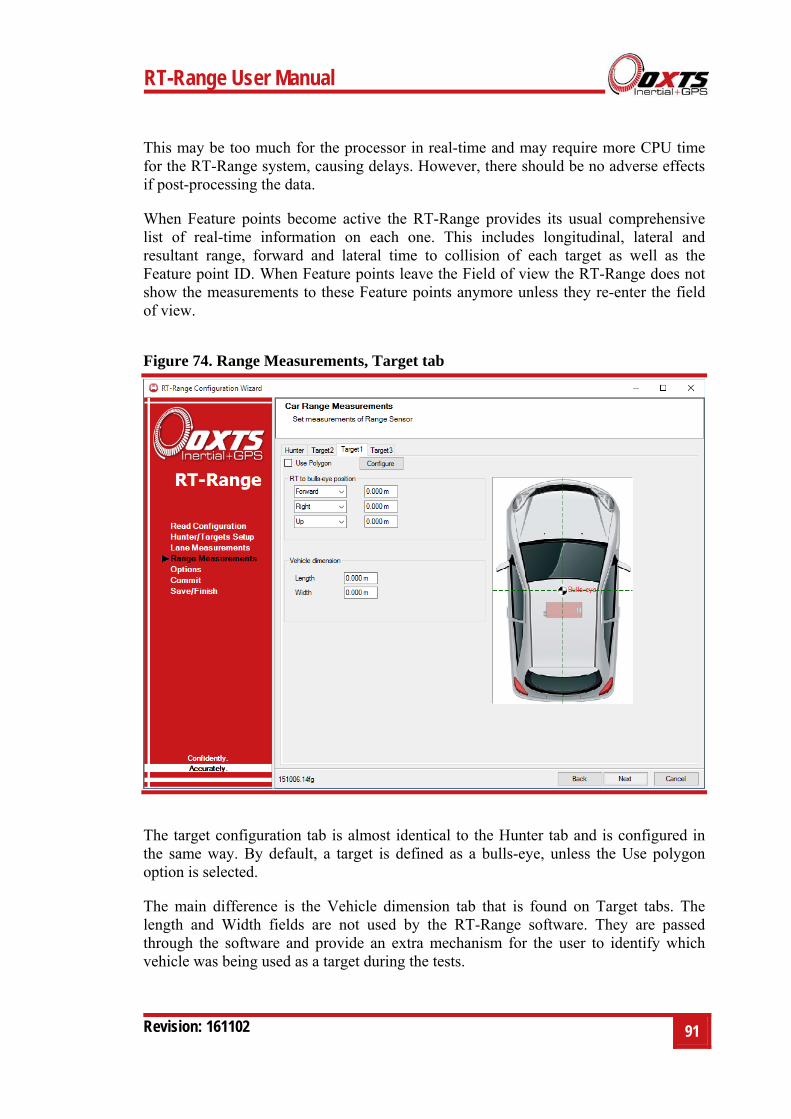
RT-Range User Manual
Revision: 161102
91
This may be too much for the processor in real-time and may require more CPU time for the RT-Range system, causing delays. However, there should be no adverse effects if post-processing the data.
When Feature points become active the RT-Range provides its usual comprehensive list of real-time information on each one. This includes longitudinal, lateral and resultant range, forward and lateral time to collision of each target as well as the Feature point ID. When Feature points leave the Field of view the RT-Range does not show the measurements to these Feature points anymore unless they re-enter the field of view.
Figure 74. Range Measurements, Target tab
The target configuration tab is almost identical to the Hunter tab and is configured in the same way. By default, a target is defined as a bulls-eye, unless the Use polygon option is selected.
The main difference is the Vehicle dimension tab that is found on Target tabs. The length and Width fields are not used by the RT-Range software. They are passed through the software and provide an extra mechanism for the user to identify which vehicle was being used as a target during the tests.
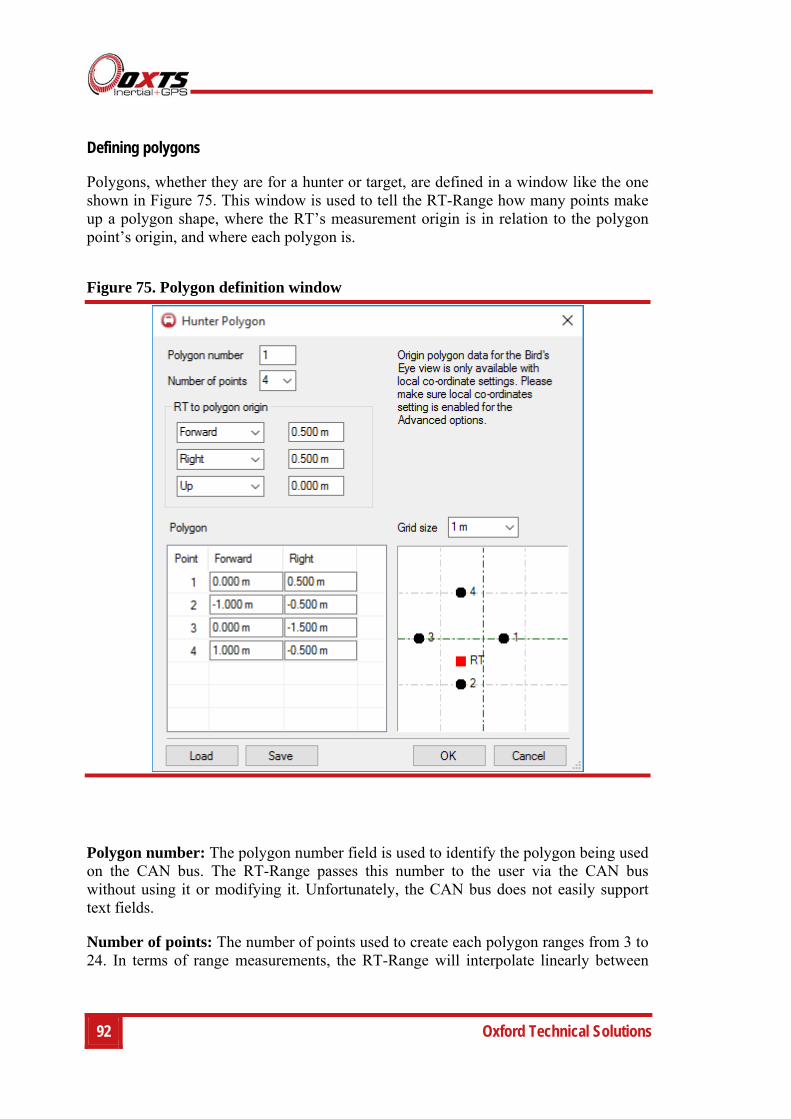
92 Oxford Technical Solutions
Defining polygons
Polygons, whether they are for a hunter or target, are defined in a window like the one shown in Figure 75. This window is used to tell the RT-Range how many points make up a polygon shape, where the RT’s measurement origin is in relation to the polygon point’s origin, and where each polygon is.
Figure 75. Polygon definition window
Polygon number: The polygon number field is used to identify the polygon being used on the CAN bus. The RT-Range passes this number to the user via the CAN bus without using it or modifying it. Unfortunately, the CAN bus does not easily support text fields.
Number of points: The number of points used to create each polygon ranges from 3 to 24. In terms of range measurements, the RT-Range will interpolate linearly between
RT-Range User Manual
Revision: 161102
93
vertices, so you only need to add enough points to define the desired shape. Select the number or points you wish to use using the Number of points box.
RT to polygon origin: To define each point or vertex that will make up a polygon, you need to enter a two-dimensional Cartesian co-ordinate. The y-axis of the co-ordinate system is aligned to the vehicle’s longitudinal axis (positive forwards); the x-axis of co-ordinate system is aligned to the vehicle’s lateral axis (positive right). However, the system needs to know where the origin of your measurements is, with respect to the RT in that vehicle. The controls in the RT to polygon origin allow you to describe where your measurement origin is in relation the RT installed in that vehicle.
Polygon: The lower half of the window is dedicated to the polygon shape. On the left-hand side is a list of numbers where the co-ordinates of each point can be entered. To the right is a visual representation of the resultant shape. The Grid size menu can be used to increase the visibility in the window when working with large polygons.
It does not matter if the points are added in a clockwise or anti-clockwise way, but they should be entered consecutively. Do not add the front left point, followed by the rear right point for example—shapes that cross are not supported. Concave shapes should also be avoided.
A red square is used to represent the relative position of the RT installed in the vehicle. This is useful to confirm that the offset you have specified in the RT to polygon origin section is correct.
Load/Save: Polygons can be saved to and loaded from files using the Load and Save buttons. If you often use the same car, it is quicker to load the polygon shape then check the RT to polygon origin is still valid.
Options
The Options page is used to configure the RT-Range options. Figure 76 shows the Options page of the RT-Range Configuration Wizard. Each of the options are described below. To edit options, click in the settings column.
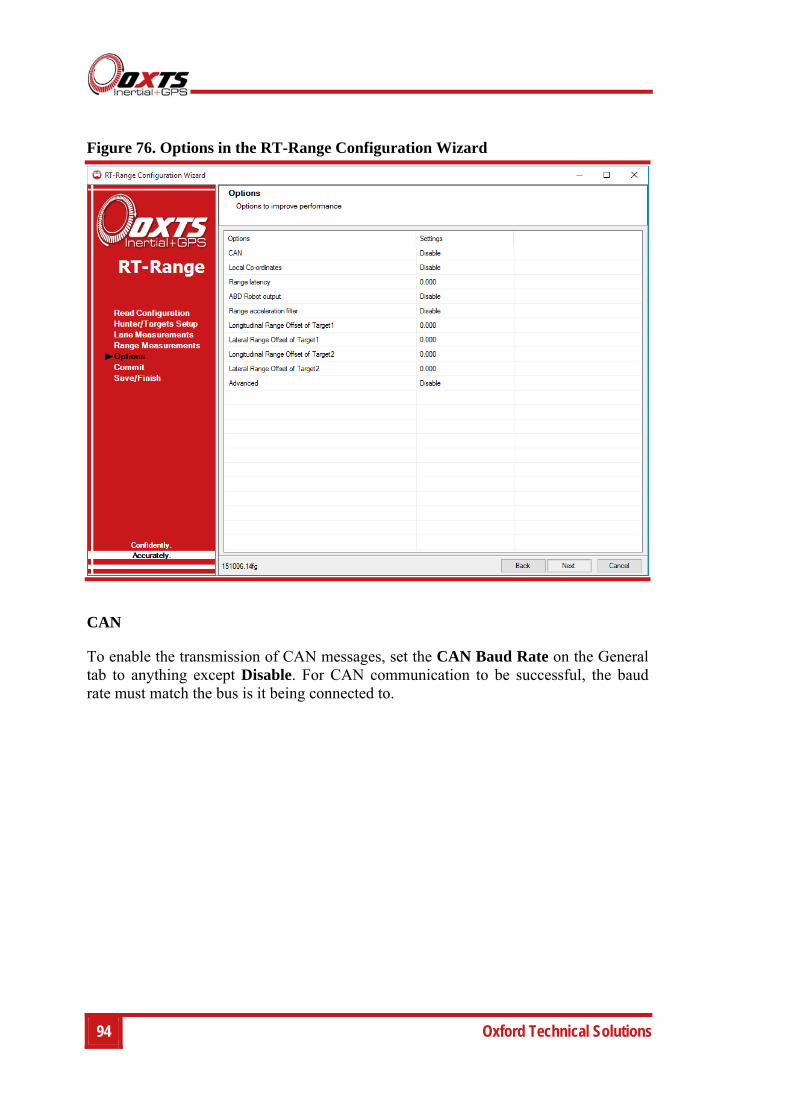
94 Oxford Technical Solutions
Figure 76. Options in the RT-Range Configuration Wizard
CAN
To enable the transmission of CAN messages, set the CAN Baud Rate on the General tab to anything except Disable. For CAN communication to be successful, the baud rate must match the bus is it being connected to.
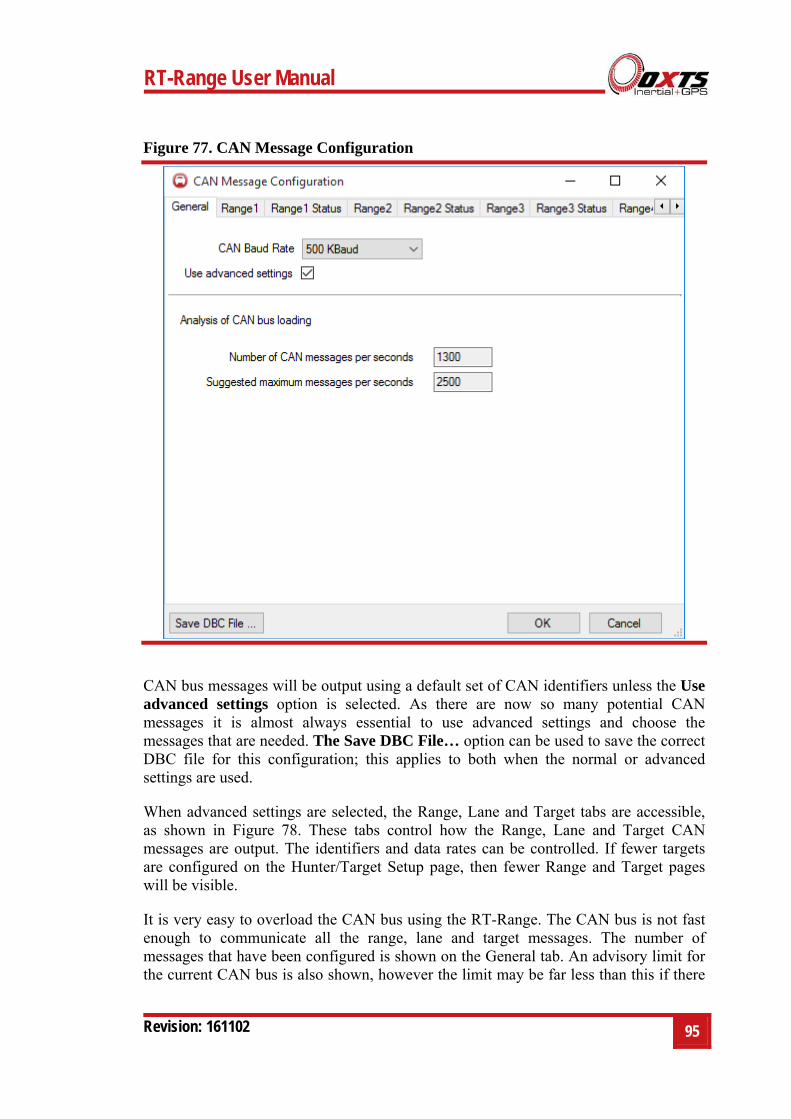
RT-Range User Manual
Revision: 161102
95
Figure 77. CAN Message Configuration
CAN bus messages will be output using a default set of CAN identifiers unless the Use advanced settings option is selected. As there are now so many potential CAN messages it is almost always essential to use advanced settings and choose the messages that are needed. The Save DBC File… option can be used to save the correct DBC file for this configuration; this applies to both when the normal or advanced settings are used.
When advanced settings are selected, the Range, Lane and Target tabs are accessible, as shown in Figure 78. These tabs control how the Range, Lane and Target CAN messages are output. The identifiers and data rates can be controlled. If fewer targets are configured on the Hunter/Target Setup page, then fewer Range and Target pages will be visible.
It is very easy to overload the CAN bus using the RT-Range. The CAN bus is not fast enough to communicate all the range, lane and target messages. The number of messages that have been configured is shown on the General tab. An advisory limit for the current CAN bus is also shown, however the limit may be far less than this if there
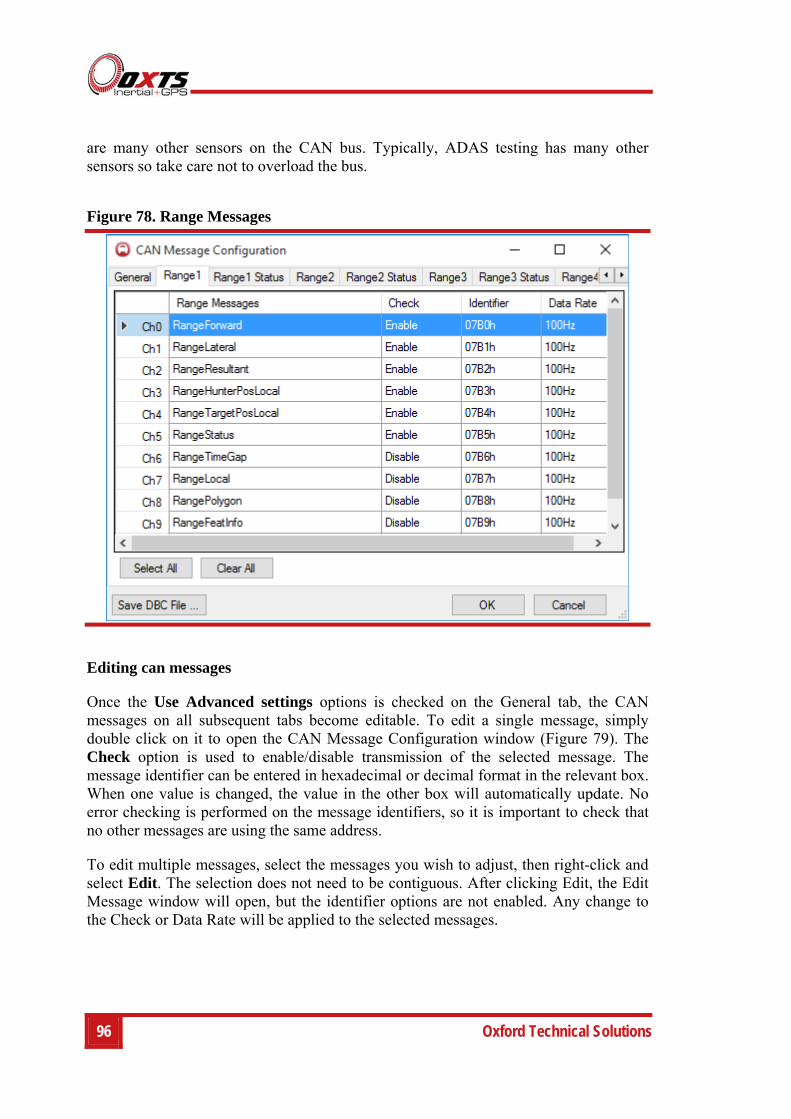
96 Oxford Technical Solutions
are many other sensors on the CAN bus. Typically, ADAS testing has many other sensors so take care not to overload the bus.
Figure 78. Range Messages
Editing can messages
Once the Use Advanced settings options is checked on the General tab, the CAN messages on all subsequent tabs become editable. To edit a single message, simply double click on it to open the CAN Message Configuration window (Figure 79). The Check option is used to enable/disable transmission of the selected message. The message identifier can be entered in hexadecimal or decimal format in the relevant box. When one value is changed, the value in the other box will automatically update. No error checking is performed on the message identifiers, so it is important to check that no other messages are using the same address.
To edit multiple messages, select the messages you wish to adjust, then right-click and select Edit. The selection does not need to be contiguous. After clicking Edit, the Edit Message window will open, but the identifier options are not enabled. Any change to the Check or Data Rate will be applied to the selected messages.
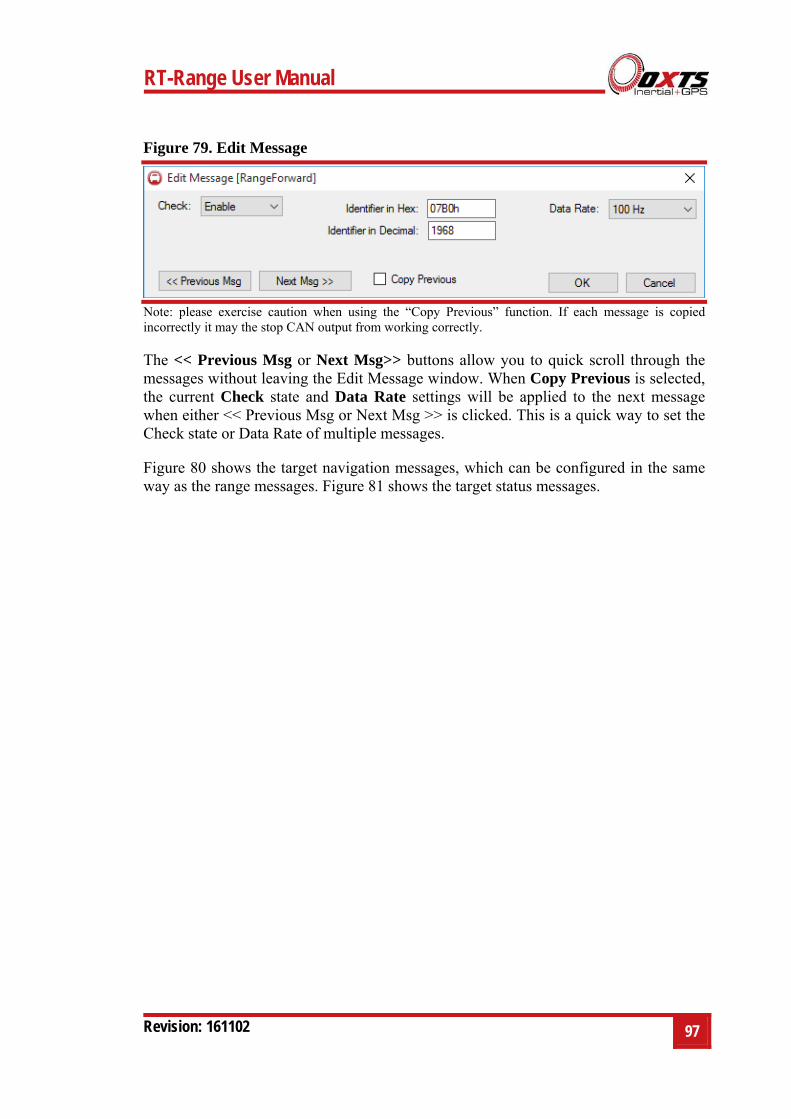
RT-Range User Manual
Revision: 161102
97
Figure 79. Edit Message
Note: please exercise caution when using the “Copy Previous” function. If each message is copied incorrectly it may the stop CAN output from working correctly.
The << Previous Msg or Next Msg>> buttons allow you to quick scroll through the messages without leaving the Edit Message window. When Copy Previous is selected, the current Check state and Data Rate settings will be applied to the next message when either << Previous Msg or Next Msg >> is clicked. This is a quick way to set the Check state or Data Rate of multiple messages.
Figure 80 shows the target navigation messages, which can be configured in the same way as the range messages. Figure 81 shows the target status messages.
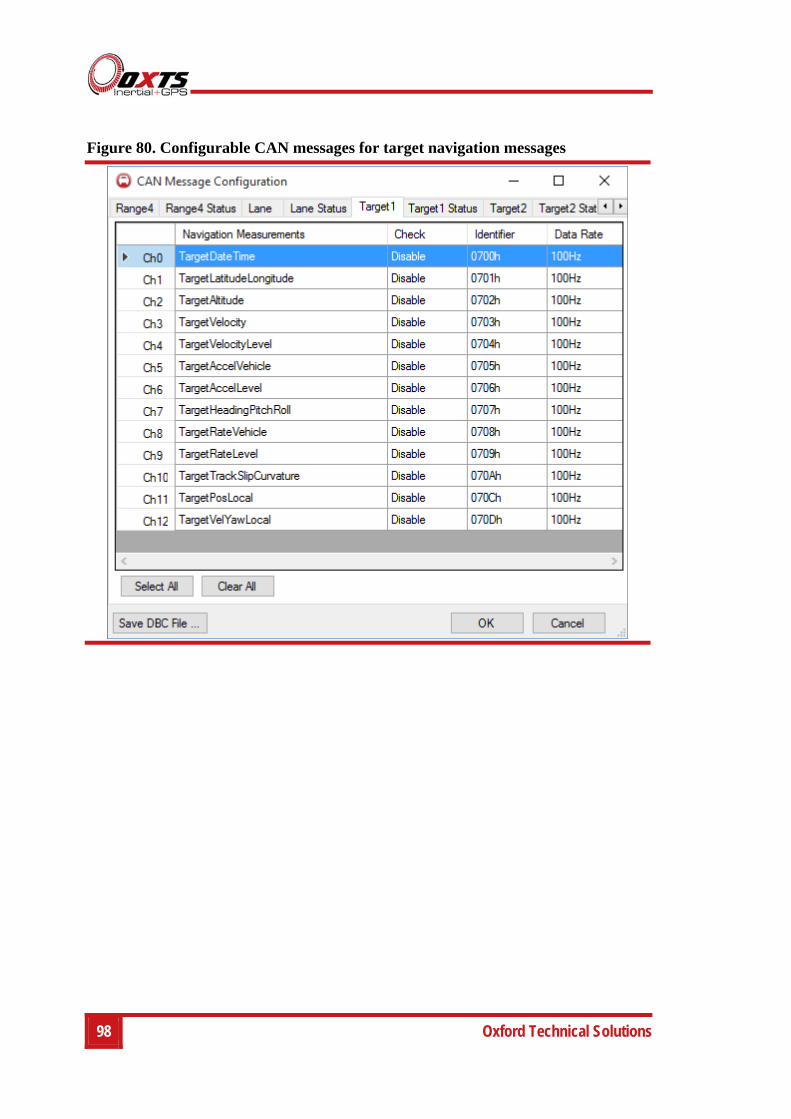
98 Oxford Technical Solutions
Figure 80. Configurable CAN messages for target navigation messages
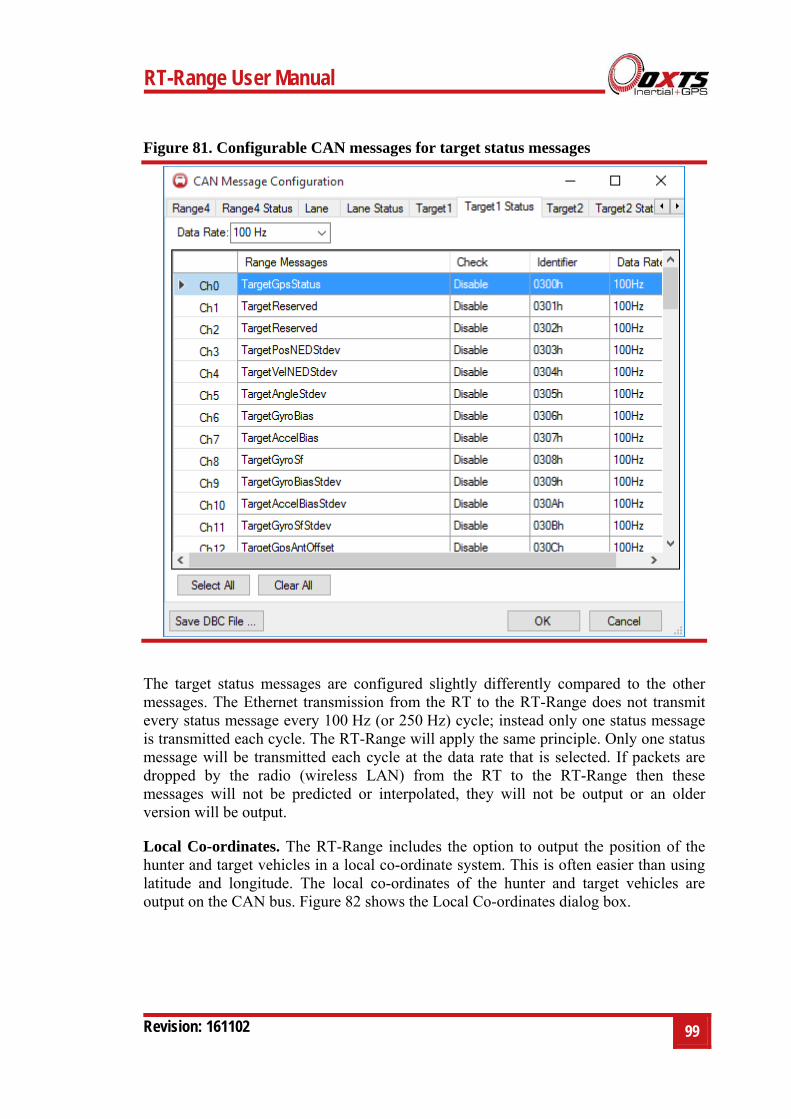
RT-Range User Manual
Revision: 161102
99
Figure 81. Configurable CAN messages for target status messages
The target status messages are configured slightly differently compared to the other messages. The Ethernet transmission from the RT to the RT-Range does not transmit every status message every 100 Hz (or 250 Hz) cycle; instead only one status message is transmitted each cycle. The RT-Range will apply the same principle. Only one status message will be transmitted each cycle at the data rate that is selected. If packets are dropped by the radio (wireless LAN) from the RT to the RT-Range then these messages will not be predicted or interpolated, they will not be output or an older version will be output.
Local Co-ordinates. The RT-Range includes the option to output the position of the hunter and target vehicles in a local co-ordinate system. This is often easier than using latitude and longitude. The local co-ordinates of the hunter and target vehicles are output on the CAN bus. Figure 82 shows the Local Co-ordinates dialog box.
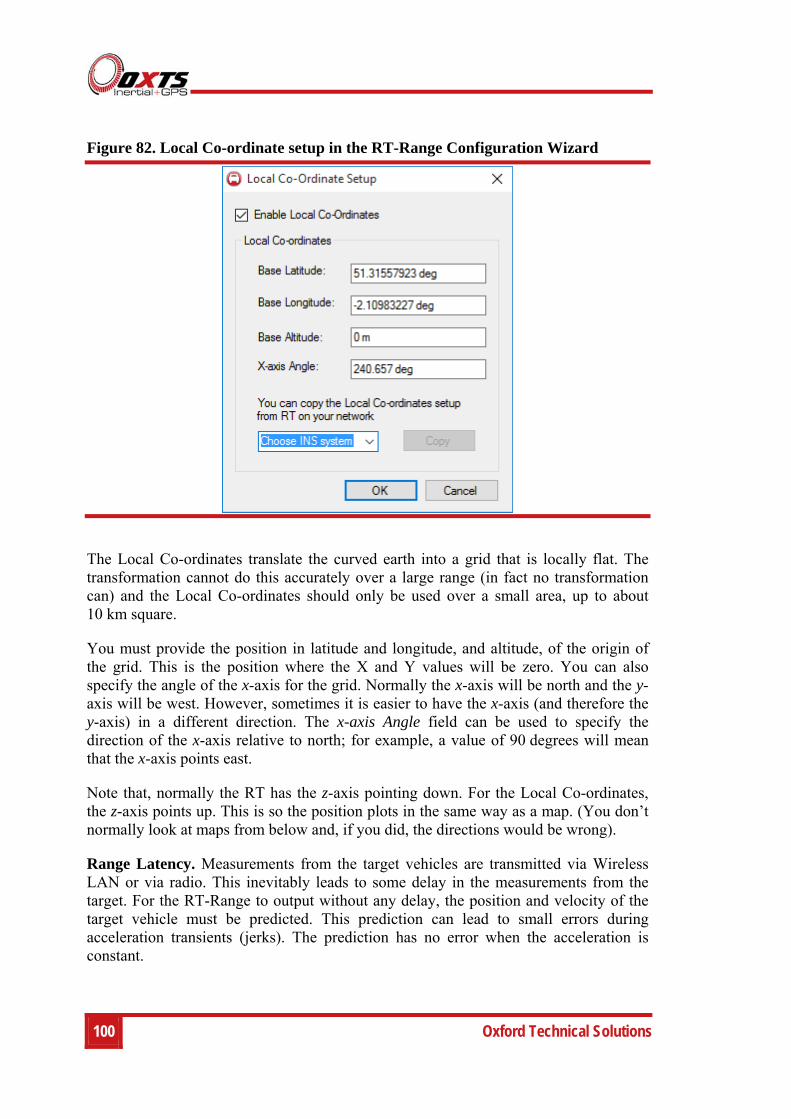
100 Oxford Technical Solutions
Figure 82. Local Co-ordinate setup in the RT-Range Configuration Wizard
The Local Co-ordinates translate the curved earth into a grid that is locally flat. The transformation cannot do this accurately over a large range (in fact no transformation can) and the Local Co-ordinates should only be used over a small area, up to about 10 km square.
You must provide the position in latitude and longitude, and altitude, of the origin of the grid. This is the position where the X and Y values will be zero. You can also specify the angle of the x-axis for the grid. Normally the x-axis will be north and the y-axis will be west. However, sometimes it is easier to have the x-axis (and therefore the y-axis) in a different direction. The x-axis Angle field can be used to specify the direction of the x-axis relative to north; for example, a value of 90 degrees will mean that the x-axis points east.
Note that, normally the RT has the z-axis pointing down. For the Local Co-ordinates, the z-axis points up. This is so the position plots in the same way as a map. (You don’t normally look at maps from below and, if you did, the directions would be wrong).
Range Latency. Measurements from the target vehicles are transmitted via Wireless LAN or via radio. This inevitably leads to some delay in the measurements from the target. For the RT-Range to output without any delay, the position and velocity of the target vehicle must be predicted. This prediction can lead to small errors during acceleration transients (jerks). The prediction has no error when the acceleration is constant.
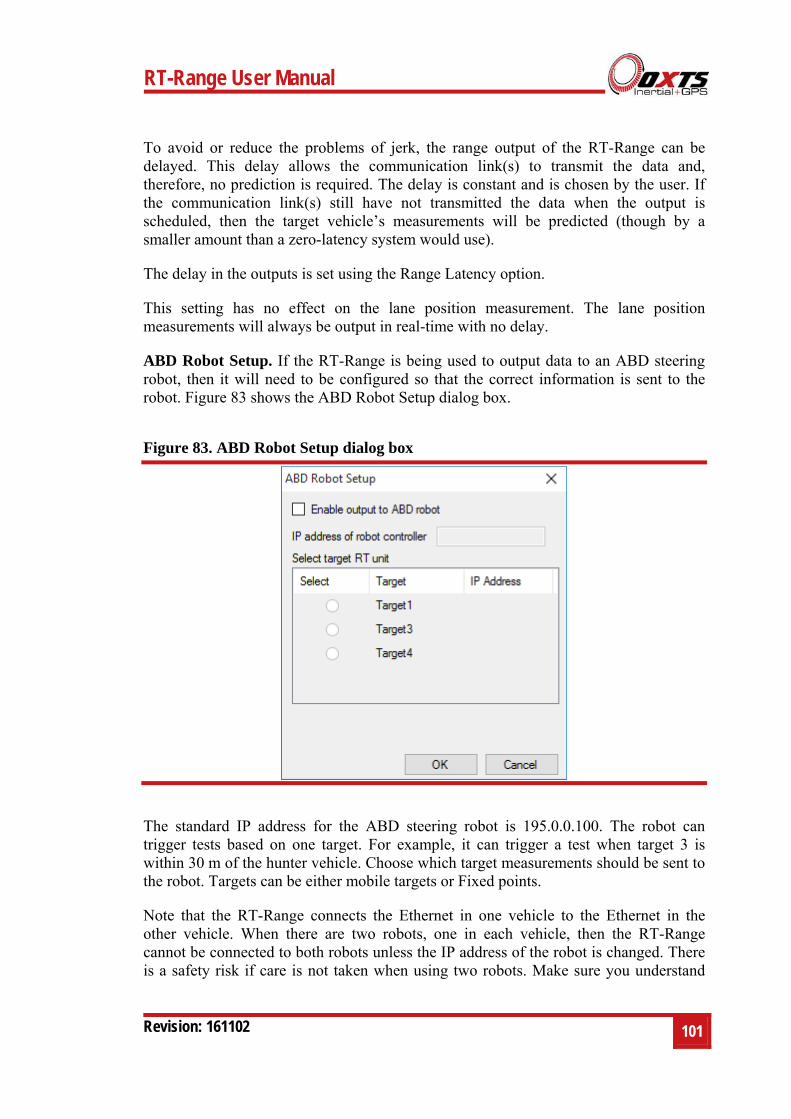
RT-Range User Manual
Revision: 161102
101
To avoid or reduce the problems of jerk, the range output of the RT-Range can be delayed. This delay allows the communication link(s) to transmit the data and, therefore, no prediction is required. The delay is constant and is chosen by the user. If the communication link(s) still have not transmitted the data when the output is scheduled, then the target vehicle’s measurements will be predicted (though by a smaller amount than a zero-latency system would use).
The delay in the outputs is set using the Range Latency option.
This setting has no effect on the lane position measurement. The lane position measurements will always be output in real-time with no delay.
ABD Robot Setup. If the RT-Range is being used to output data to an ABD steering robot, then it will need to be configured so that the correct information is sent to the robot. Figure 83 shows the ABD Robot Setup dialog box.
Figure 83. ABD Robot Setup dialog box
The standard IP address for the ABD steering robot is 195.0.0.100. The robot can trigger tests based on one target. For example, it can trigger a test when target 3 is within 30 m of the hunter vehicle. Choose which target measurements should be sent to the robot. Targets can be either mobile targets or Fixed points.
Note that the RT-Range connects the Ethernet in one vehicle to the Ethernet in the other vehicle. When there are two robots, one in each vehicle, then the RT-Range cannot be connected to both robots unless the IP address of the robot is changed. There is a safety risk if care is not taken when using two robots. Make sure you understand
102 Oxford Technical Solutions
which RT-Range and which RT is sending data to which robot and how it is getting there.
Later versions of the RT-Range and robot software can identify problems by identifying the serial number of the RT in the robot software. Older versions cannot do this and it is essential to get the configuration right.
Range acceleration filter. The Range acceleration filter window allows the relative acceleration between hunter and individual targets to be filtered. The accelerations are filtered before they are used in any calculations. One tab is shown for each defined target. Once Enable Range acceleration filter has been selected, it is possible to choose from one of five different filters:
General
Butterworth
Bessel
Chebyshev (0.5 dB)
Chebyshev (2.0 dB)
The Cut off frequency of each filter can be defined as well as the Damping ratio of the General filter. The effects of the filter are summarised in the lower half of the Acceleration filter window.
Note that, if the data from the target has too many dropped packets because of the radio then the filter will automatically be reset. The RT-Range will fill in occasional dropped packets and try to maintain the filter.
Longitudinal Range Offset of Target... The Longitudinal Range Offset is normally configured using the Quick Config, Longitudinal Offset page. It can be configured here too. This value will show the value that is committed to the RT-Range. If the value has not been committed using the Longitudinal Offset page, but is being used until the RT-Range is reset, then the real-time value will not be read from the RT-Range.
The Longitudinal Range Offset will be added to the longitudinal range that has been computed. This allows for small adjustments to the longitudinal range that is output.
Lateral Range Offset of Target... The Lateral Range Offset is normally configured using the Quick Config, Lateral Offset page. It can be configured here too. This value will show the value that is committed to the RT-Range. If the value has not been committed using the Lateral Offset page, but is being used until the RT-Range is reset, then the real-time value will not be read from the RT-Range.
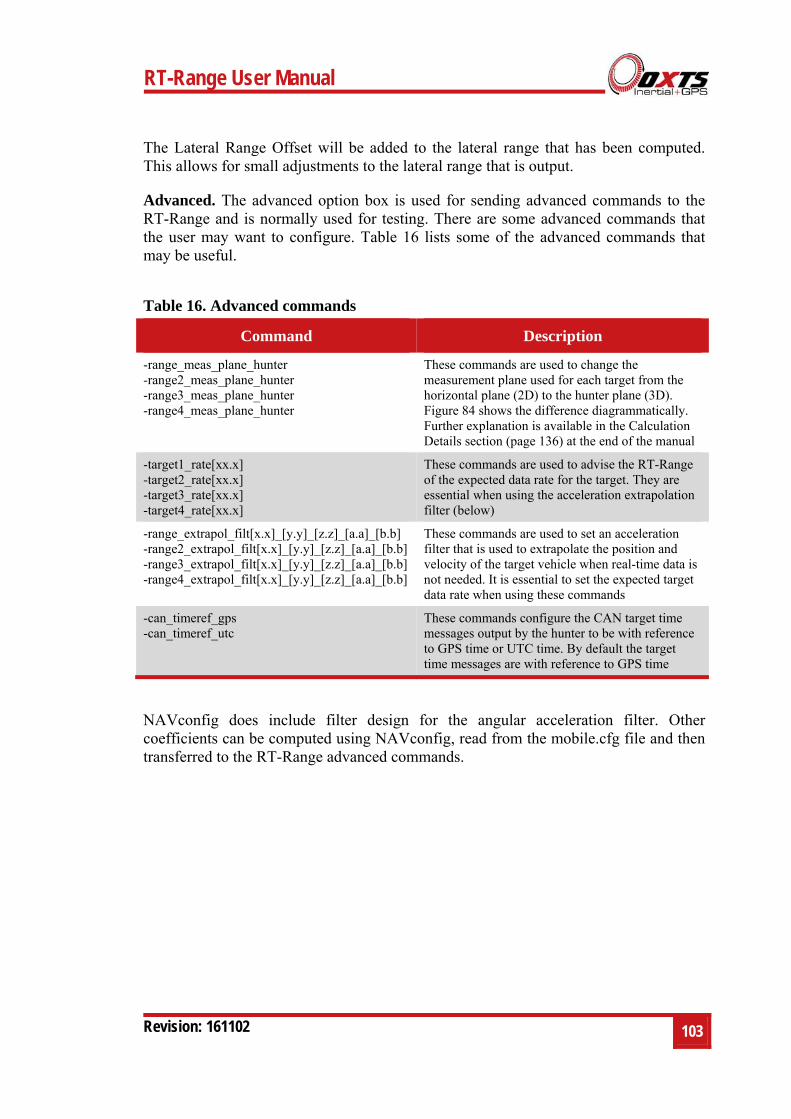
RT-Range User Manual
Revision: 161102
103
The Lateral Range Offset will be added to the lateral range that has been computed. This allows for small adjustments to the lateral range that is output.
Advanced. The advanced option box is used for sending advanced commands to the RT-Range and is normally used for testing. There are some advanced commands that the user may want to configure. Table 16 lists some of the advanced commands that may be useful.
Table 16. Advanced commands
Command Description
-range_meas_plane_hunter -range2_meas_plane_hunter -range3_meas_plane_hunter -range4_meas_plane_hunter
These commands are used to change the measurement plane used for each target from the horizontal plane (2D) to the hunter plane (3D). Figure 84 shows the difference diagrammatically. Further explanation is available in the Calculation Details section (page 136) at the end of the manual
-target1_rate[xx.x] -target2_rate[xx.x] -target3_rate[xx.x] -target4_rate[xx.x]
These commands are used to advise the RT-Range of the expected data rate for the target. They are essential when using the acceleration extrapolation filter (below)
-range_extrapol_filt[x.x]_[y.y]_[z.z]_[a.a]_[b.b] -range2_extrapol_filt[x.x]_[y.y]_[z.z]_[a.a]_[b.b]-range3_extrapol_filt[x.x]_[y.y]_[z.z]_[a.a]_[b.b]-range4_extrapol_filt[x.x]_[y.y]_[z.z]_[a.a]_[b.b]
These commands are used to set an acceleration filter that is used to extrapolate the position and velocity of the target vehicle when real-time data is not needed. It is essential to set the expected target data rate when using these commands
-can_timeref_gps -can_timeref_utc
These commands configure the CAN target time messages output by the hunter to be with reference to GPS time or UTC time. By default the target time messages are with reference to GPS time
NAVconfig does include filter design for the angular acceleration filter. Other coefficients can be computed using NAVconfig, read from the mobile.cfg file and then transferred to the RT-Range advanced commands.
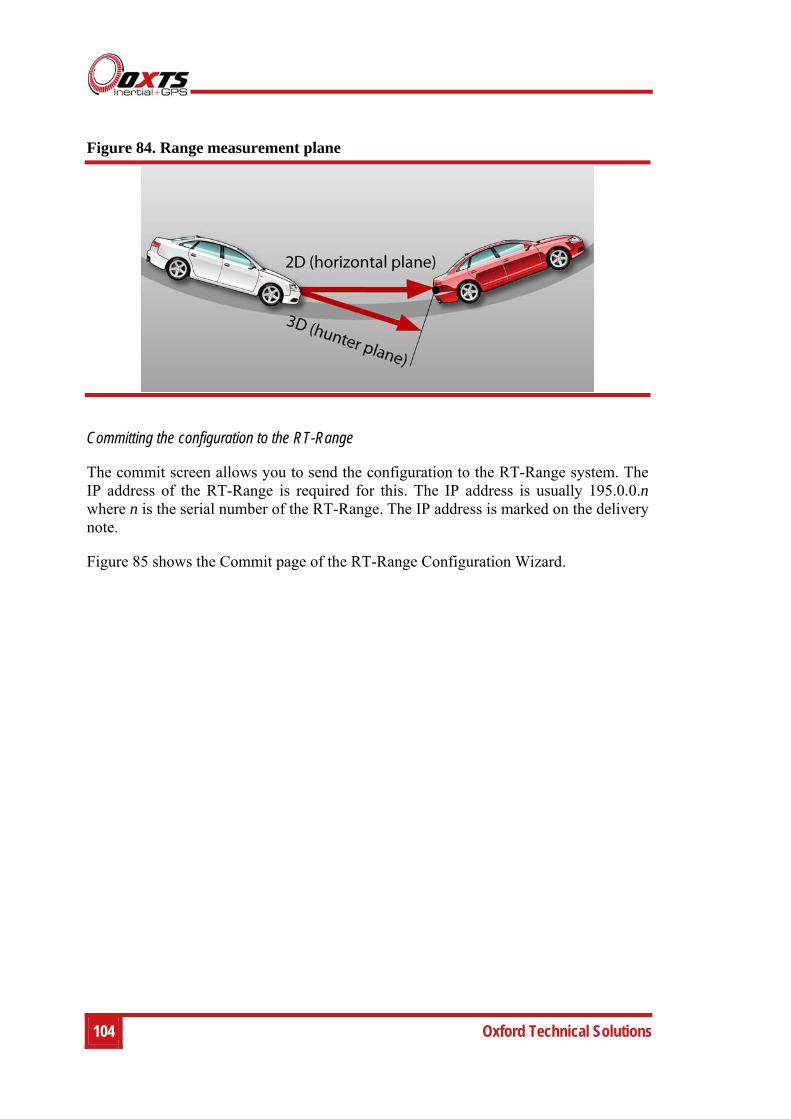
104 Oxford Technical Solutions
Figure 84. Range measurement plane
Committing the configuration to the RT-Range
The commit screen allows you to send the configuration to the RT-Range system. The IP address of the RT-Range is required for this. The IP address is usually 195.0.0.n where n is the serial number of the RT-Range. The IP address is marked on the delivery note.
Figure 85 shows the Commit page of the RT-Range Configuration Wizard.
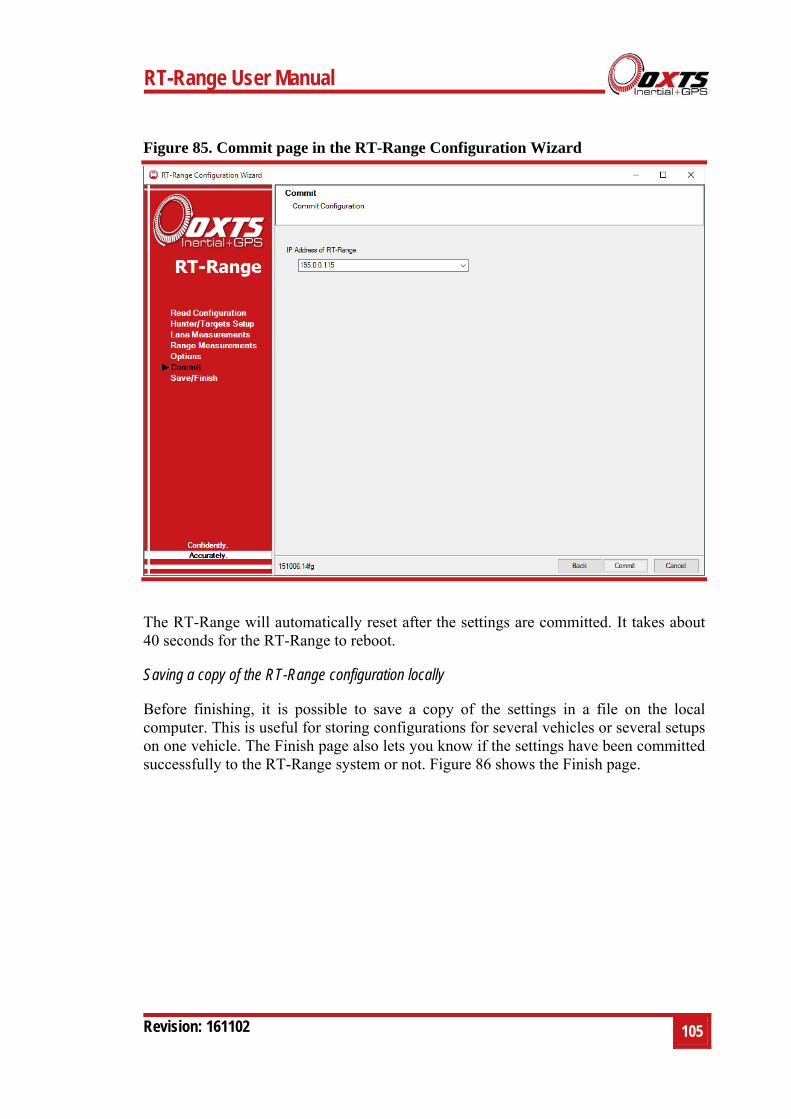
RT-Range User Manual
Revision: 161102
105
Figure 85. Commit page in the RT-Range Configuration Wizard
The RT-Range will automatically reset after the settings are committed. It takes about 40 seconds for the RT-Range to reboot.
Saving a copy of the RT-Range configuration locally
Before finishing, it is possible to save a copy of the settings in a file on the local computer. This is useful for storing configurations for several vehicles or several setups on one vehicle. The Finish page also lets you know if the settings have been committed successfully to the RT-Range system or not. Figure 86 shows the Finish page.
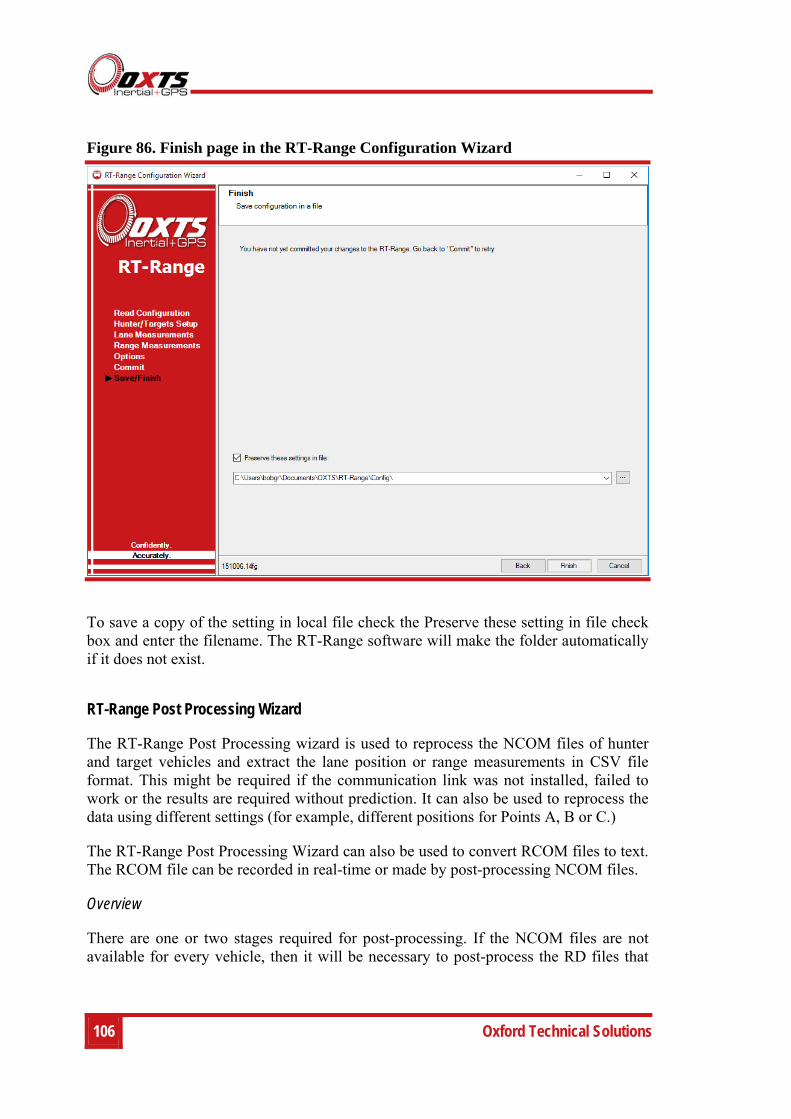
106 Oxford Technical Solutions
Figure 86. Finish page in the RT-Range Configuration Wizard
To save a copy of the setting in local file check the Preserve these setting in file check box and enter the filename. The RT-Range software will make the folder automatically if it does not exist.
RT-Range Post Processing Wizard
The RT-Range Post Processing wizard is used to reprocess the NCOM files of hunter and target vehicles and extract the lane position or range measurements in CSV file format. This might be required if the communication link was not installed, failed to work or the results are required without prediction. It can also be used to reprocess the data using different settings (for example, different positions for Points A, B or C.)
The RT-Range Post Processing Wizard can also be used to convert RCOM files to text. The RCOM file can be recorded in real-time or made by post-processing NCOM files.
Overview
There are one or two stages required for post-processing. If the NCOM files are not available for every vehicle, then it will be necessary to post-process the RD files that
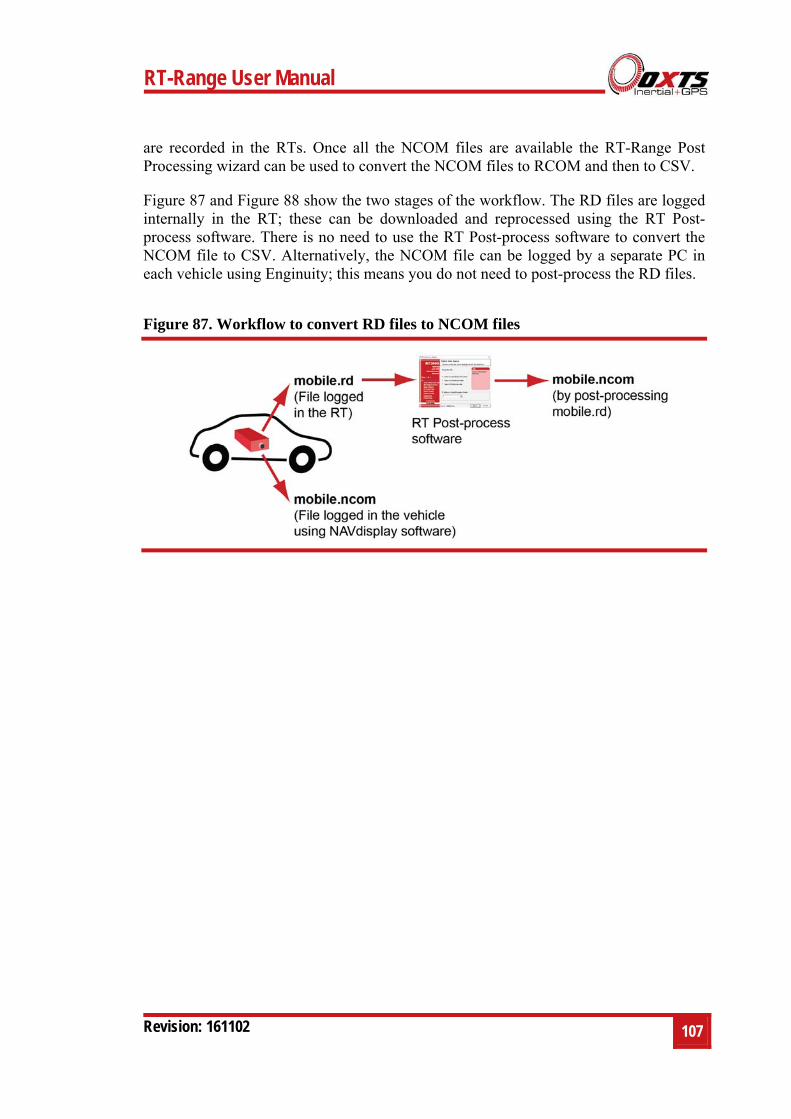
RT-Range User Manual
Revision: 161102
107
are recorded in the RTs. Once all the NCOM files are available the RT-Range Post Processing wizard can be used to convert the NCOM files to RCOM and then to CSV.
Figure 87 and Figure 88 show the two stages of the workflow. The RD files are logged internally in the RT; these can be downloaded and reprocessed using the RT Post-process software. There is no need to use the RT Post-process software to convert the NCOM file to CSV. Alternatively, the NCOM file can be logged by a separate PC in each vehicle using Enginuity; this means you do not need to post-process the RD files.
Figure 87. Workflow to convert RD files to NCOM files
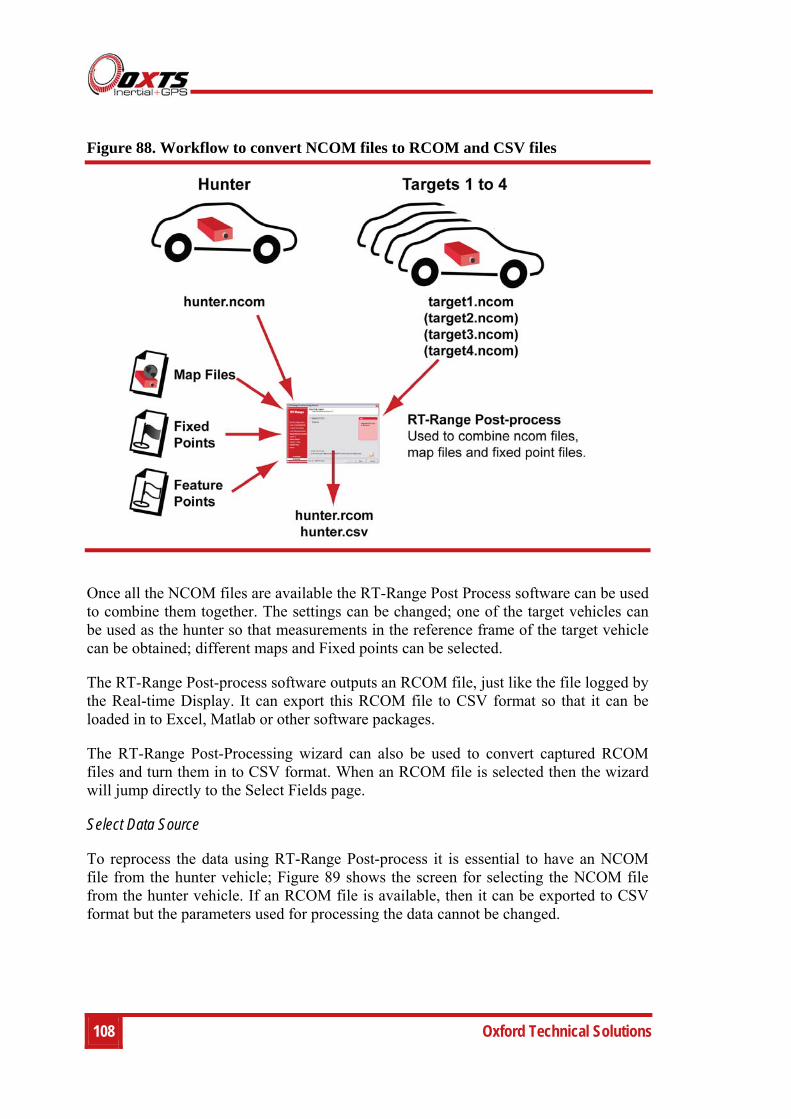
108 Oxford Technical Solutions
Figure 88. Workflow to convert NCOM files to RCOM and CSV files
Once all the NCOM files are available the RT-Range Post Process software can be used to combine them together. The settings can be changed; one of the target vehicles can be used as the hunter so that measurements in the reference frame of the target vehicle can be obtained; different maps and Fixed points can be selected.
The RT-Range Post-process software outputs an RCOM file, just like the file logged by the Real-time Display. It can export this RCOM file to CSV format so that it can be loaded in to Excel, Matlab or other software packages.
The RT-Range Post-Processing wizard can also be used to convert captured RCOM files and turn them in to CSV format. When an RCOM file is selected then the wizard will jump directly to the Select Fields page.
Select Data Source
To reprocess the data using RT-Range Post-process it is essential to have an NCOM file from the hunter vehicle; Figure 89 shows the screen for selecting the NCOM file from the hunter vehicle. If an RCOM file is available, then it can be exported to CSV format but the parameters used for processing the data cannot be changed.
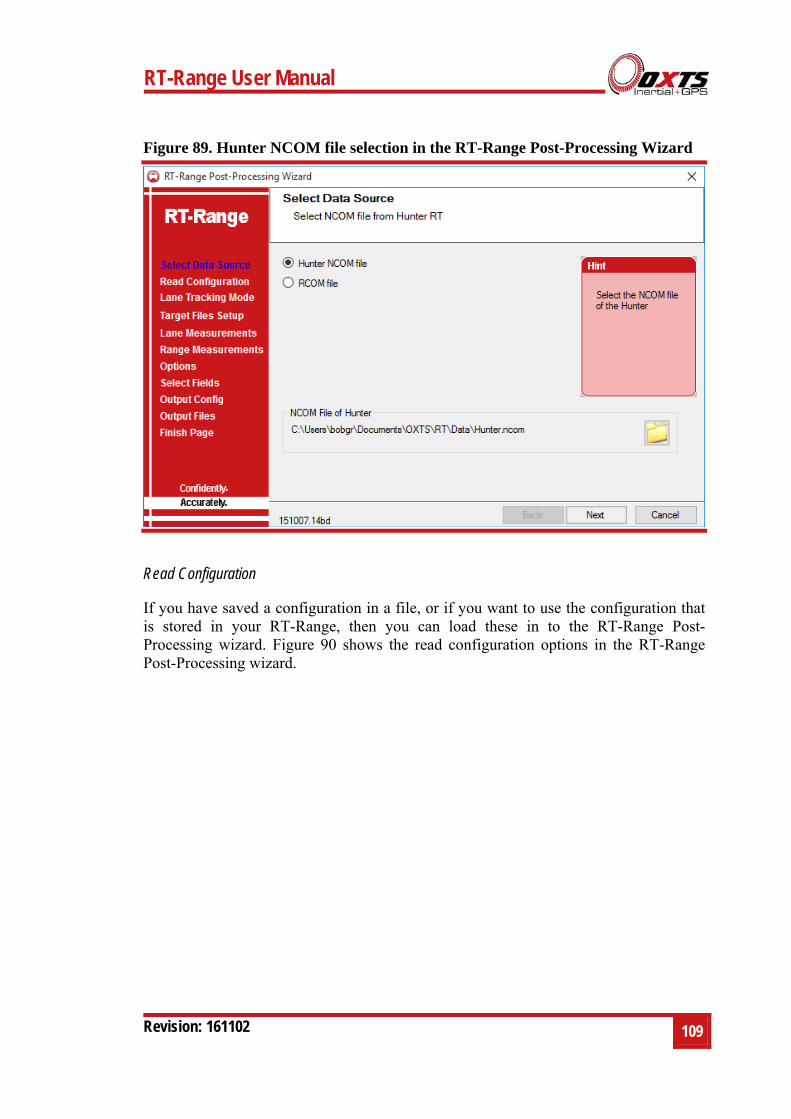
RT-Range User Manual
Revision: 161102
109
Figure 89. Hunter NCOM file selection in the RT-Range Post-Processing Wizard
Read Configuration
If you have saved a configuration in a file, or if you want to use the configuration that is stored in your RT-Range, then you can load these in to the RT-Range Post-Processing wizard. Figure 90 shows the read configuration options in the RT-Range Post-Processing wizard.
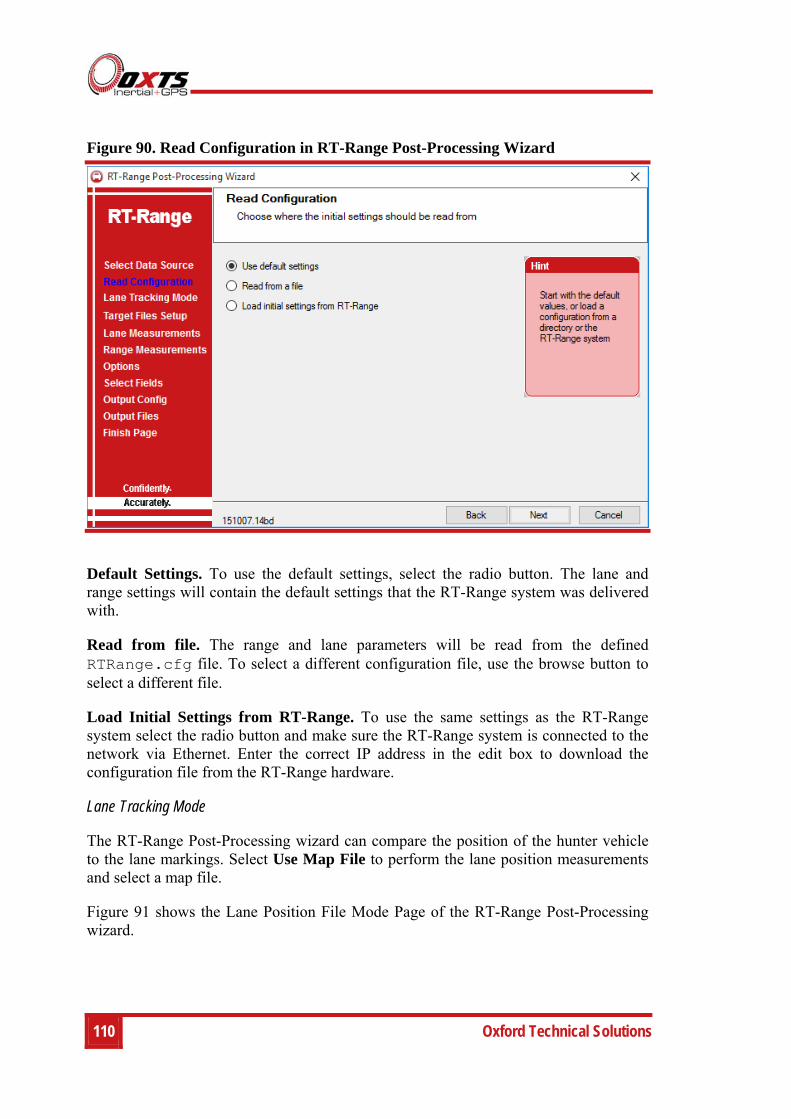
110 Oxford Technical Solutions
Figure 90. Read Configuration in RT-Range Post-Processing Wizard
Default Settings. To use the default settings, select the radio button. The lane and range settings will contain the default settings that the RT-Range system was delivered with.
Read from file. The range and lane parameters will be read from the defined RTRange.cfg file. To select a different configuration file, use the browse button to select a different file.
Load Initial Settings from RT-Range. To use the same settings as the RT-Range system select the radio button and make sure the RT-Range system is connected to the network via Ethernet. Enter the correct IP address in the edit box to download the configuration file from the RT-Range hardware.
Lane Tracking Mode
The RT-Range Post-Processing wizard can compare the position of the hunter vehicle to the lane markings. Select Use Map File to perform the lane position measurements and select a map file.
Figure 91 shows the Lane Position File Mode Page of the RT-Range Post-Processing wizard.
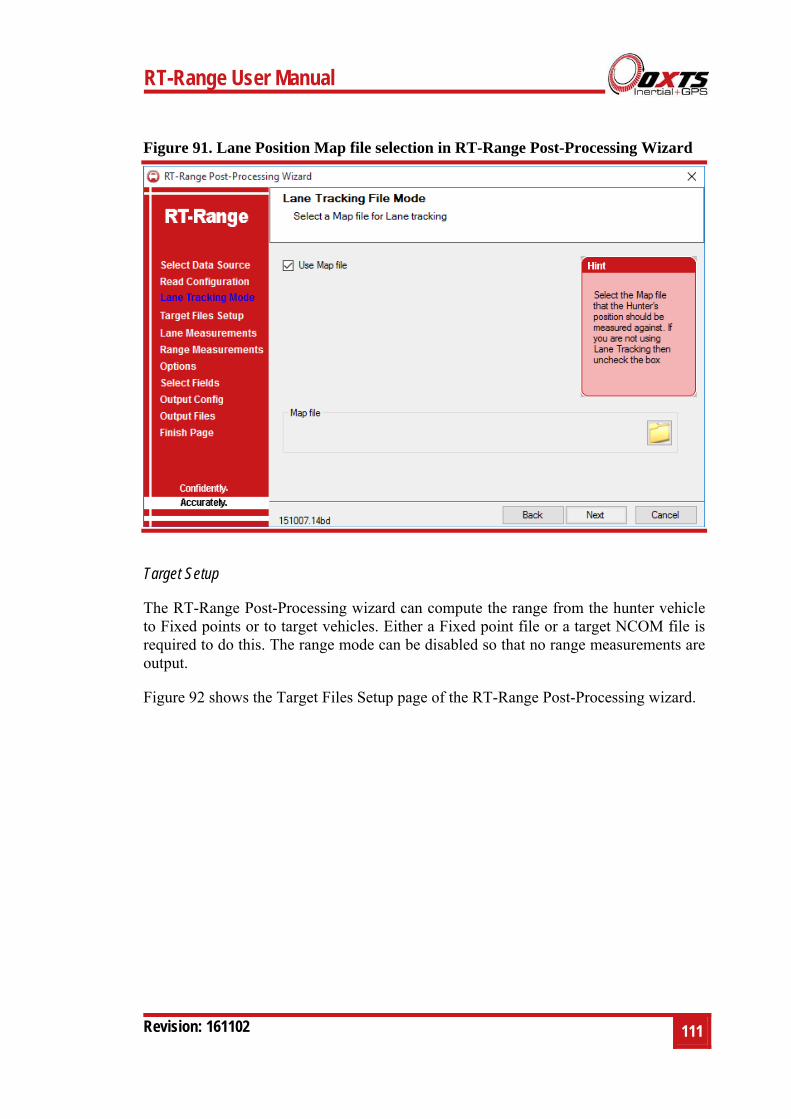
RT-Range User Manual
Revision: 161102
111
Figure 91. Lane Position Map file selection in RT-Range Post-Processing Wizard
Target Setup
The RT-Range Post-Processing wizard can compute the range from the hunter vehicle to Fixed points or to target vehicles. Either a Fixed point file or a target NCOM file is required to do this. The range mode can be disabled so that no range measurements are output.
Figure 92 shows the Target Files Setup page of the RT-Range Post-Processing wizard.
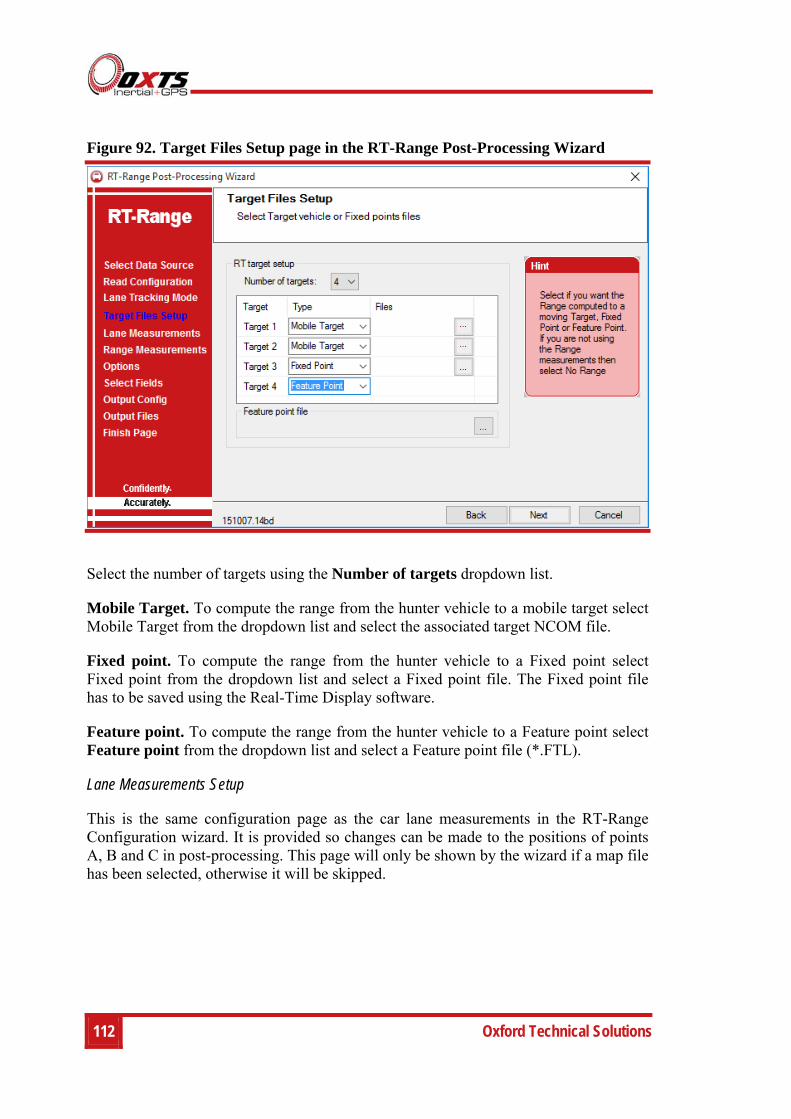
112 Oxford Technical Solutions
Figure 92. Target Files Setup page in the RT-Range Post-Processing Wizard
Select the number of targets using the Number of targets dropdown list.
Mobile Target. To compute the range from the hunter vehicle to a mobile target select Mobile Target from the dropdown list and select the associated target NCOM file.
Fixed point. To compute the range from the hunter vehicle to a Fixed point select Fixed point from the dropdown list and select a Fixed point file. The Fixed point file has to be saved using the Real-Time Display software.
Feature point. To compute the range from the hunter vehicle to a Feature point select Feature point from the dropdown list and select a Feature point file (*.FTL).
Lane Measurements Setup
This is the same configuration page as the car lane measurements in the RT-Range Configuration wizard. It is provided so changes can be made to the positions of points A, B and C in post-processing. This page will only be shown by the wizard if a map file has been selected, otherwise it will be skipped.
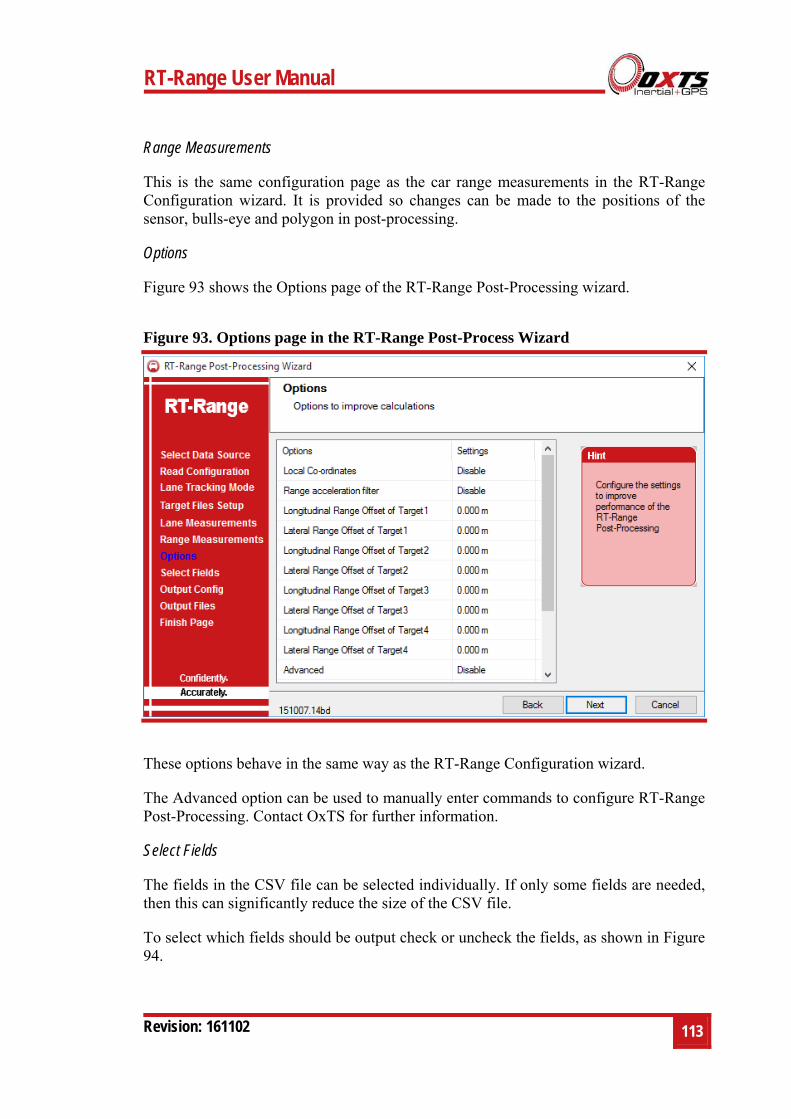
RT-Range User Manual
Revision: 161102
113
Range Measurements
This is the same configuration page as the car range measurements in the RT-Range Configuration wizard. It is provided so changes can be made to the positions of the sensor, bulls-eye and polygon in post-processing.
Options
Figure 93 shows the Options page of the RT-Range Post-Processing wizard.
Figure 93. Options page in the RT-Range Post-Process Wizard
These options behave in the same way as the RT-Range Configuration wizard.
The Advanced option can be used to manually enter commands to configure RT-Range Post-Processing. Contact OxTS for further information.
Select Fields
The fields in the CSV file can be selected individually. If only some fields are needed, then this can significantly reduce the size of the CSV file.
To select which fields should be output check or uncheck the fields, as shown in Figure 94.
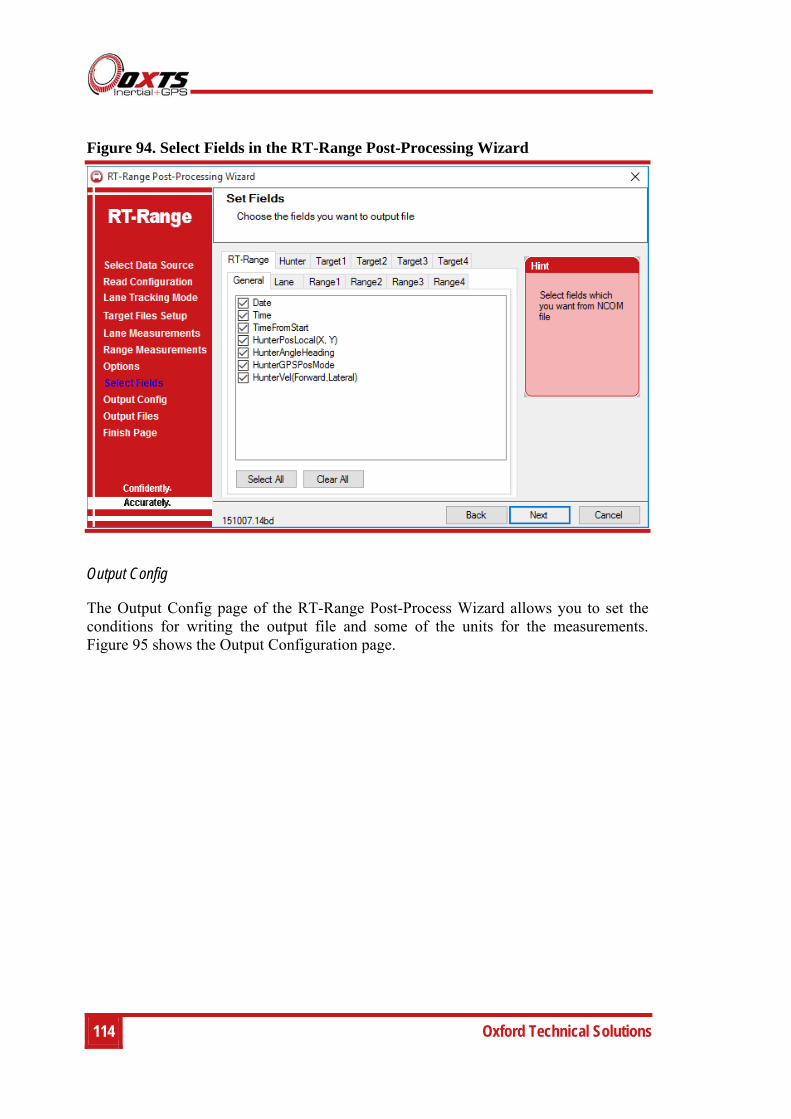
114 Oxford Technical Solutions
Figure 94. Select Fields in the RT-Range Post-Processing Wizard
Output Config
The Output Config page of the RT-Range Post-Process Wizard allows you to set the conditions for writing the output file and some of the units for the measurements. Figure 95 shows the Output Configuration page.
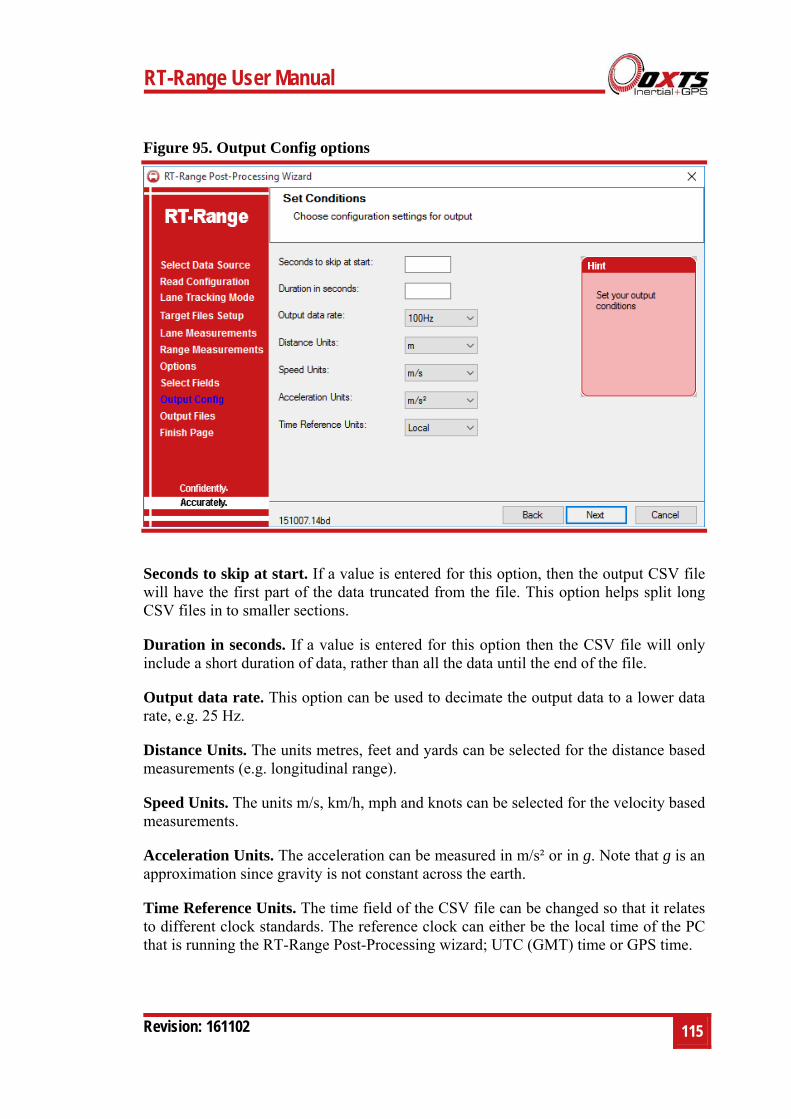
RT-Range User Manual
Revision: 161102
115
Figure 95. Output Config options
Seconds to skip at start. If a value is entered for this option, then the output CSV file will have the first part of the data truncated from the file. This option helps split long CSV files in to smaller sections.
Duration in seconds. If a value is entered for this option then the CSV file will only include a short duration of data, rather than all the data until the end of the file.
Output data rate. This option can be used to decimate the output data to a lower data rate, e.g. 25 Hz.
Distance Units. The units metres, feet and yards can be selected for the distance based measurements (e.g. longitudinal range).
Speed Units. The units m/s, km/h, mph and knots can be selected for the velocity based measurements.
Acceleration Units. The acceleration can be measured in m/s² or in g. Note that g is an approximation since gravity is not constant across the earth.
Time Reference Units. The time field of the CSV file can be changed so that it relates to different clock standards. The reference clock can either be the local time of the PC that is running the RT-Range Post-Processing wizard; UTC (GMT) time or GPS time.
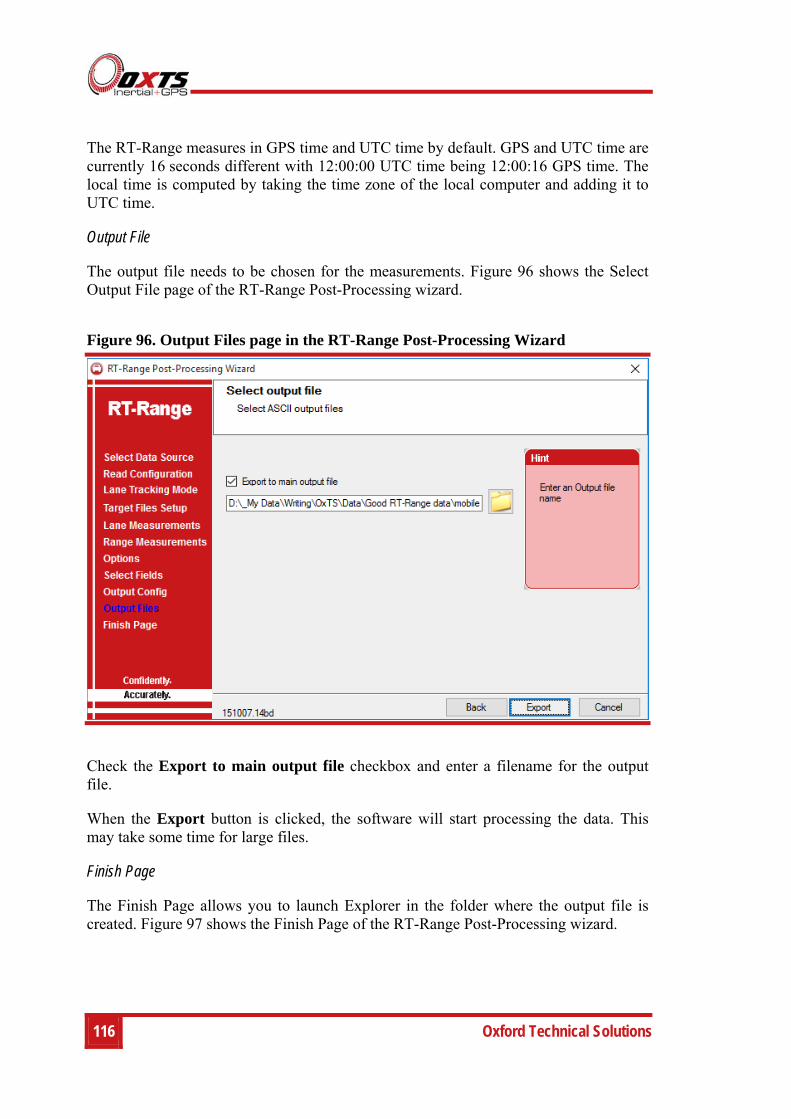
116 Oxford Technical Solutions
The RT-Range measures in GPS time and UTC time by default. GPS and UTC time are currently 16 seconds different with 12:00:00 UTC time being 12:00:16 GPS time. The local time is computed by taking the time zone of the local computer and adding it to UTC time.
Output File
The output file needs to be chosen for the measurements. Figure 96 shows the Select Output File page of the RT-Range Post-Processing wizard.
Figure 96. Output Files page in the RT-Range Post-Processing Wizard
Check the Export to main output file checkbox and enter a filename for the output file.
When the Export button is clicked, the software will start processing the data. This may take some time for large files.
Finish Page
The Finish Page allows you to launch Explorer in the folder where the output file is created. Figure 97 shows the Finish Page of the RT-Range Post-Processing wizard.
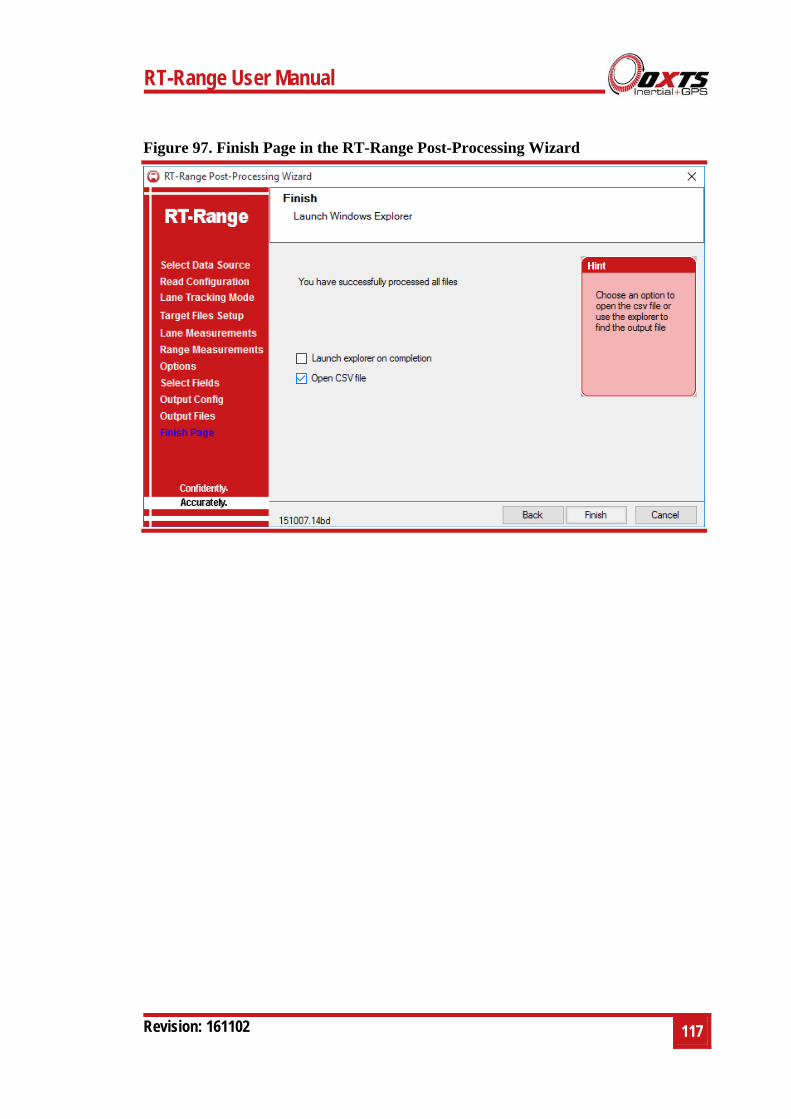
RT-Range User Manual
Revision: 161102
117
Figure 97. Finish Page in the RT-Range Post-Processing Wizard
118 Oxford Technical Solutions
Outputs
The RT-Range outputs its data over Ethernet and over CAN. The Ethernet output is proprietary and is not described here; contact OxTS for more information. The CAN bus output is described in this section of the manual.
A CAN DBC file is generated by the RT-Range Configuration wizard in the CAN page. This DBC file reflects the configuration of the CAN bus that the user chooses.
The CAN bus output does not include a termination resistor. It is essential to include a 120 Ω resistor at each end of your CAN bus between CAN High and CAN Low. You should also connect the ground of your CAN bus.
Table 17 shows the pin connections for the Hunter CAN connector.
Table 17. Hunter CAN connector pin assignments
Signal Pin
CAN - 2
CAN ground 3
CAN ground 6
CAN + 7
Other pins not connected internally.
CAN bus messages
Table 18 and Table 19 list the CAN messages that the RT-Range puts on the CAN bus and the identifiers that are used for these messages. These are the default identifiers, but they can be changed using the configuration software. The signals in each message are listed in the tables that follow.
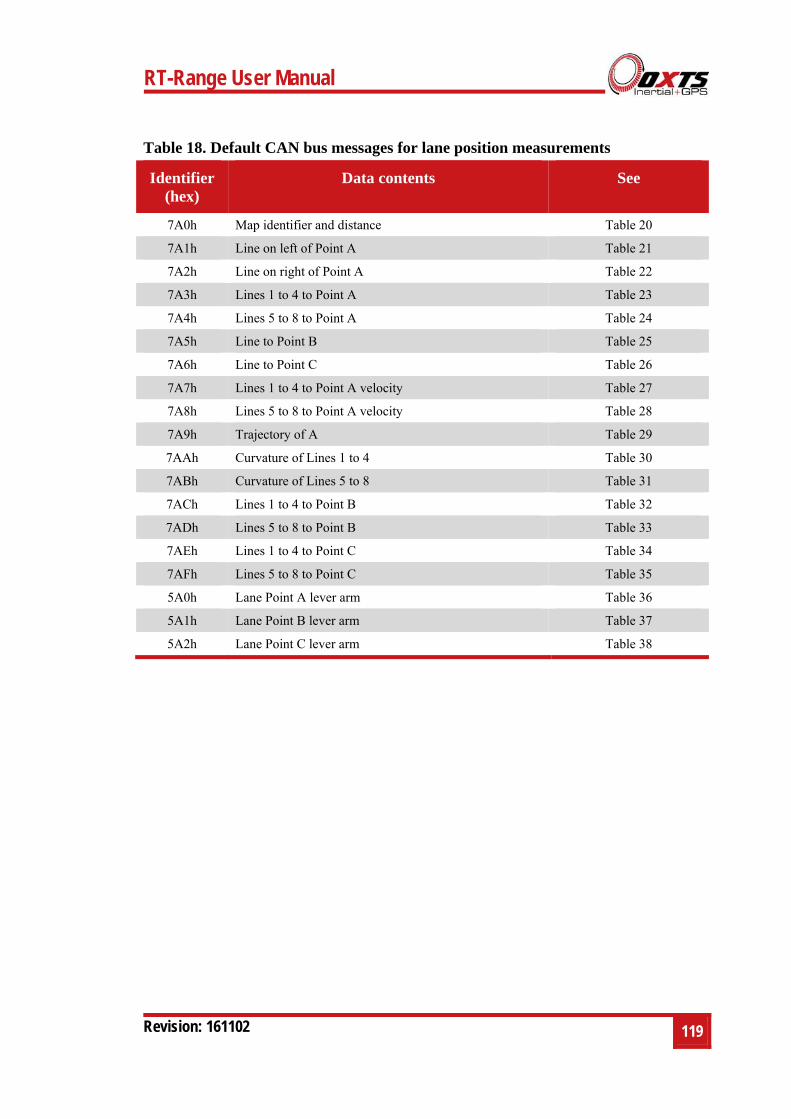
RT-Range User Manual
Revision: 161102
119
Table 18. Default CAN bus messages for lane position measurements
Identifier (hex)
Data contents See
7A0h Map identifier and distance Table 20
7A1h Line on left of Point A Table 21
7A2h Line on right of Point A Table 22
7A3h Lines 1 to 4 to Point A Table 23
7A4h Lines 5 to 8 to Point A Table 24
7A5h Line to Point B Table 25
7A6h Line to Point C Table 26
7A7h Lines 1 to 4 to Point A velocity Table 27
7A8h Lines 5 to 8 to Point A velocity Table 28
7A9h Trajectory of A Table 29
7AAh Curvature of Lines 1 to 4 Table 30
7ABh Curvature of Lines 5 to 8 Table 31
7ACh Lines 1 to 4 to Point B Table 32
7ADh Lines 5 to 8 to Point B Table 33
7AEh Lines 1 to 4 to Point C Table 34
7AFh Lines 5 to 8 to Point C Table 35
5A0h Lane Point A lever arm Table 36
5A1h Lane Point B lever arm Table 37
5A2h Lane Point C lever arm Table 38
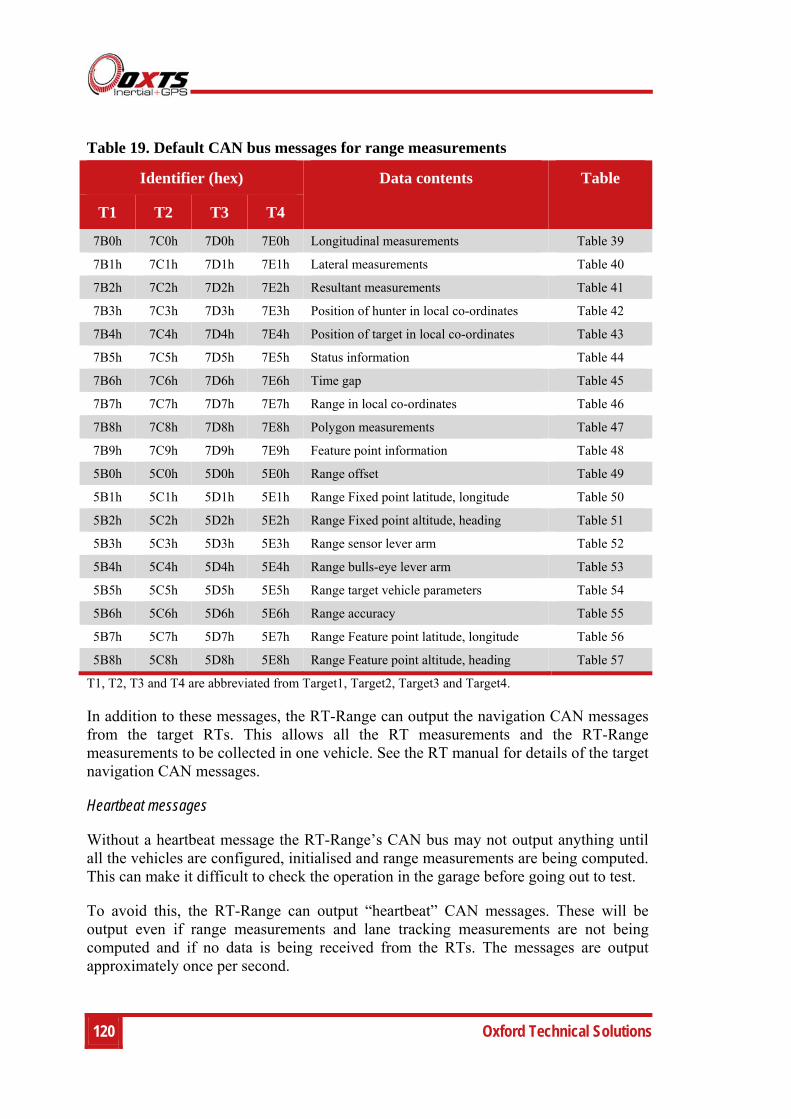
120 Oxford Technical Solutions
Table 19. Default CAN bus messages for range measurements
Identifier (hex) Data contents Table
T1 T2 T3 T4
7B0h 7C0h 7D0h 7E0h Longitudinal measurements Table 39
7B1h 7C1h 7D1h 7E1h Lateral measurements Table 40
7B2h 7C2h 7D2h 7E2h Resultant measurements Table 41
7B3h 7C3h 7D3h 7E3h Position of hunter in local co-ordinates Table 42
7B4h 7C4h 7D4h 7E4h Position of target in local co-ordinates Table 43
7B5h 7C5h 7D5h 7E5h Status information Table 44
7B6h 7C6h 7D6h 7E6h Time gap Table 45
7B7h 7C7h 7D7h 7E7h Range in local co-ordinates Table 46
7B8h 7C8h 7D8h 7E8h Polygon measurements Table 47
7B9h 7C9h 7D9h 7E9h Feature point information Table 48
5B0h 5C0h 5D0h 5E0h Range offset Table 49
5B1h 5C1h 5D1h 5E1h Range Fixed point latitude, longitude Table 50
5B2h 5C2h 5D2h 5E2h Range Fixed point altitude, heading Table 51
5B3h 5C3h 5D3h 5E3h Range sensor lever arm Table 52
5B4h 5C4h 5D4h 5E4h Range bulls-eye lever arm Table 53
5B5h 5C5h 5D5h 5E5h Range target vehicle parameters Table 54
5B6h 5C6h 5D6h 5E6h Range accuracy Table 55
5B7h 5C7h 5D7h 5E7h Range Feature point latitude, longitude Table 56
5B8h 5C8h 5D8h 5E8h Range Feature point altitude, heading Table 57
T1, T2, T3 and T4 are abbreviated from Target1, Target2, Target3 and Target4.
In addition to these messages, the RT-Range can output the navigation CAN messages from the target RTs. This allows all the RT measurements and the RT-Range measurements to be collected in one vehicle. See the RT manual for details of the target navigation CAN messages.
Heartbeat messages
Without a heartbeat message the RT-Range’s CAN bus may not output anything until all the vehicles are configured, initialised and range measurements are being computed. This can make it difficult to check the operation in the garage before going out to test.
To avoid this, the RT-Range can output “heartbeat” CAN messages. These will be output even if range measurements and lane tracking measurements are not being computed and if no data is being received from the RTs. The messages are output approximately once per second.
RT-Range User Manual
Revision: 161102
121
The “heartbeat” messages are the Range Status messages (one for each target) and the Lane Map Status message. The Range Status heartbeat messages will only be output if the associated target is configured; if you have no targets configured then no Range Status heartbeat messages will be output. Similarly, if there is no map in the RT-Range then the Lane Map Status message will not be output. These messages will not be output if they are disabled in the CAN configuration. If no heartbeat messages are received, check that some operation of the RT-Range is configured and that the CAN bus is configured to output the heartbeat messages.
Table heading definitions
The fields in the tables have the following meanings.
Offset (bits). This is the offset into the message where the signal starts. To compute the offset in bytes, divide the value by 8.
Length (bits). This is the length of the signal in bits. To compute the length of the signal in bytes, divide the value by 8.
Type. This specifies either an unsigned value (U) or a signed value (S).
Units. This is the units for the signal.
Factor. This is the factor that the integer unit should be multiplied by to get the signal into the units given in the table.
Offset. This is the value of the signal when the integer value in the CAN message is zero. It is zero for all the RT signals and can usually be discarded.
Signals
The following tables describe the signals in each of the messages.
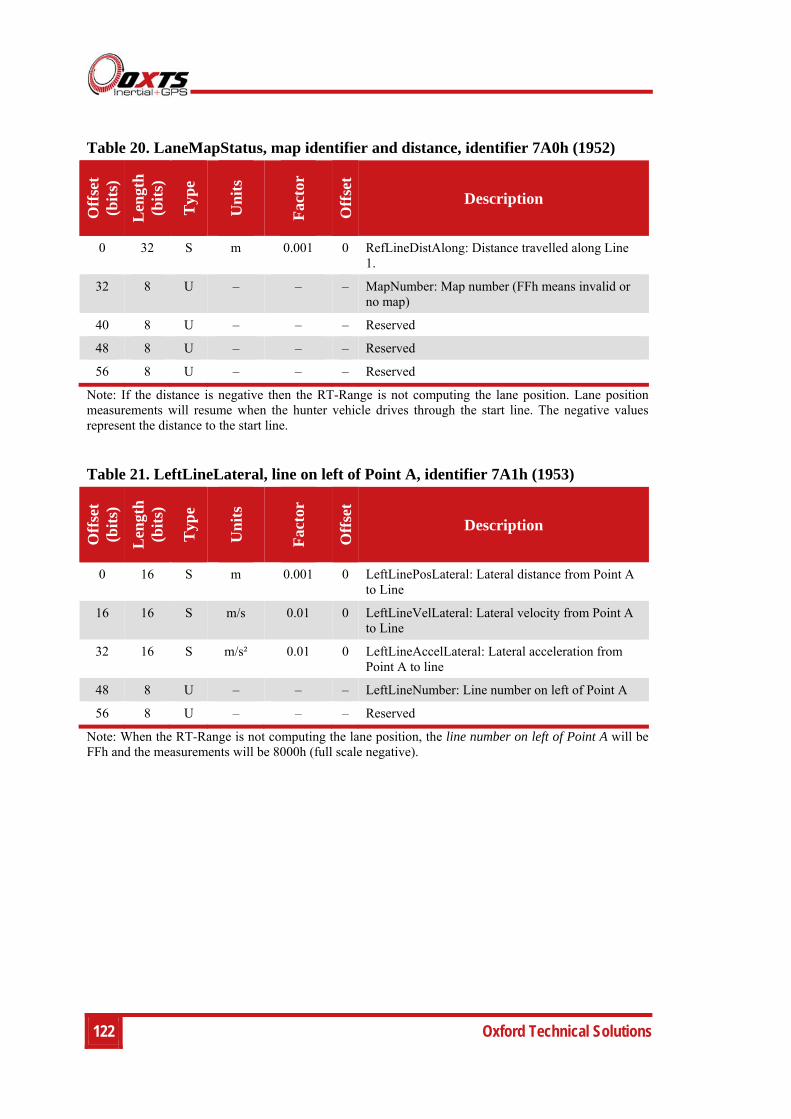
122 Oxford Technical Solutions
Table 20. LaneMapStatus, map identifier and distance, identifier 7A0h (1952)
Off
set
(bit
s)
Len
gth
(b
its)
Typ
e
Un
its
Fac
tor
Off
set
Description
0 32 S m 0.001 0 RefLineDistAlong: Distance travelled along Line 1.
32 8 U – – – MapNumber: Map number (FFh means invalid or no map)
40 8 U – – – Reserved
48 8 U – – – Reserved
56 8 U – – – Reserved
Note: If the distance is negative then the RT-Range is not computing the lane position. Lane position measurements will resume when the hunter vehicle drives through the start line. The negative values represent the distance to the start line.
Table 21. LeftLineLateral, line on left of Point A, identifier 7A1h (1953)
Off
set
(bit
s)
Len
gth
(b
its)
Typ
e
Un
its
Fac
tor
Off
set
Description
0 16 S m 0.001 0 LeftLinePosLateral: Lateral distance from Point A to Line
16 16 S m/s 0.01 0 LeftLineVelLateral: Lateral velocity from Point A to Line
32 16 S m/s² 0.01 0 LeftLineAccelLateral: Lateral acceleration from Point A to line
48 8 U – – – LeftLineNumber: Line number on left of Point A
56 8 U – – – Reserved
Note: When the RT-Range is not computing the lane position, the line number on left of Point A will be FFh and the measurements will be 8000h (full scale negative).
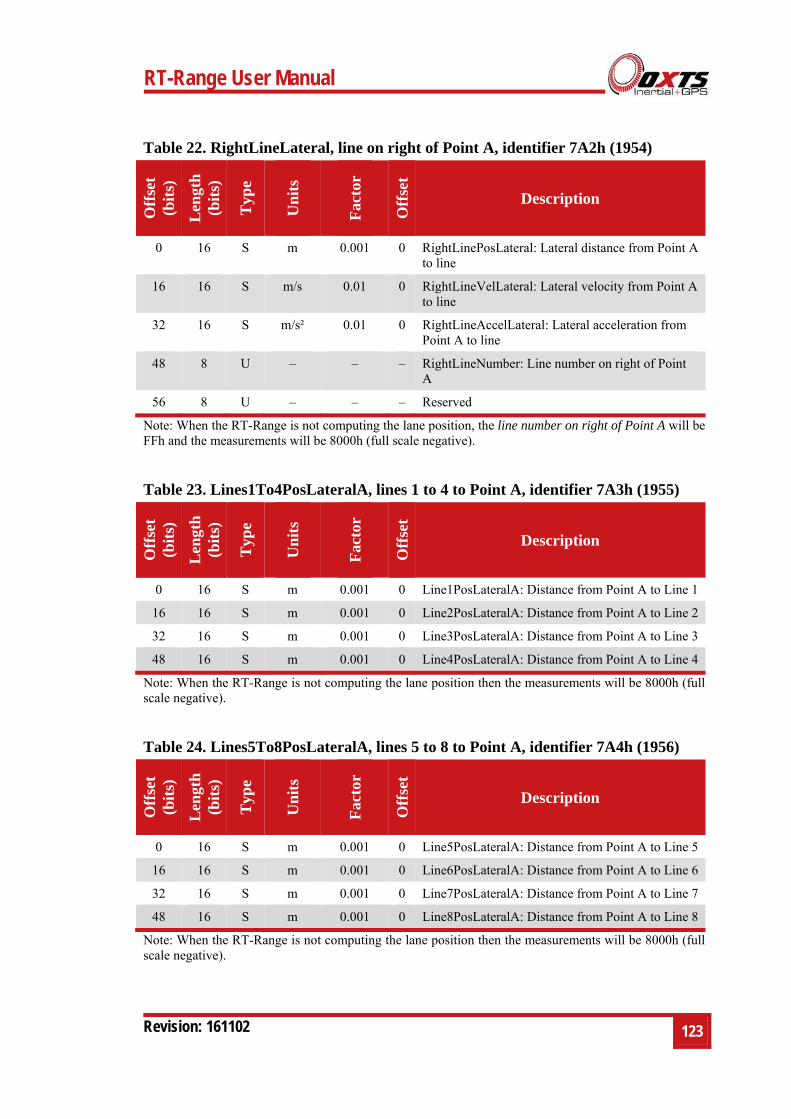
RT-Range User Manual
Revision: 161102
123
Table 22. RightLineLateral, line on right of Point A, identifier 7A2h (1954)
Note: When the RT-Range is not computing the lane position, the line number on right of Point A will be FFh and the measurements will be 8000h (full scale negative).
Table 23. Lines1To4PosLateralA, lines 1 to 4 to Point A, identifier 7A3h (1955)
Off
set
(bit
s)
Len
gth
(b
its)
Typ
e
Un
its
Fac
tor
Off
set
Description
0 16 S m 0.001 0 Line1PosLateralA: Distance from Point A to Line 1
16 16 S m 0.001 0 Line2PosLateralA: Distance from Point A to Line 2
32 16 S m 0.001 0 Line3PosLateralA: Distance from Point A to Line 3
48 16 S m 0.001 0 Line4PosLateralA: Distance from Point A to Line 4
Note: When the RT-Range is not computing the lane position then the measurements will be 8000h (full scale negative).
Table 24. Lines5To8PosLateralA, lines 5 to 8 to Point A, identifier 7A4h (1956)
Off
set
(bit
s)
Len
gth
(b
its)
Typ
e
Un
its
Fac
tor
Off
set
Description
0 16 S m 0.001 0 Line5PosLateralA: Distance from Point A to Line 5
16 16 S m 0.001 0 Line6PosLateralA: Distance from Point A to Line 6
32 16 S m 0.001 0 Line7PosLateralA: Distance from Point A to Line 7
48 16 S m 0.001 0 Line8PosLateralA: Distance from Point A to Line 8
Note: When the RT-Range is not computing the lane position then the measurements will be 8000h (full scale negative).
Off
set
(bit
s)
Len
gth
(b
its)
Typ
e
Un
its
Fac
tor
Off
set
Description
0 16 S m 0.001 0 RightLinePosLateral: Lateral distance from Point A to line
16 16 S m/s 0.01 0 RightLineVelLateral: Lateral velocity from Point A to line
32 16 S m/s² 0.01 0 RightLineAccelLateral: Lateral acceleration from Point A to line
48 8 U – – – RightLineNumber: Line number on right of Point A
56 8 U – – – Reserved
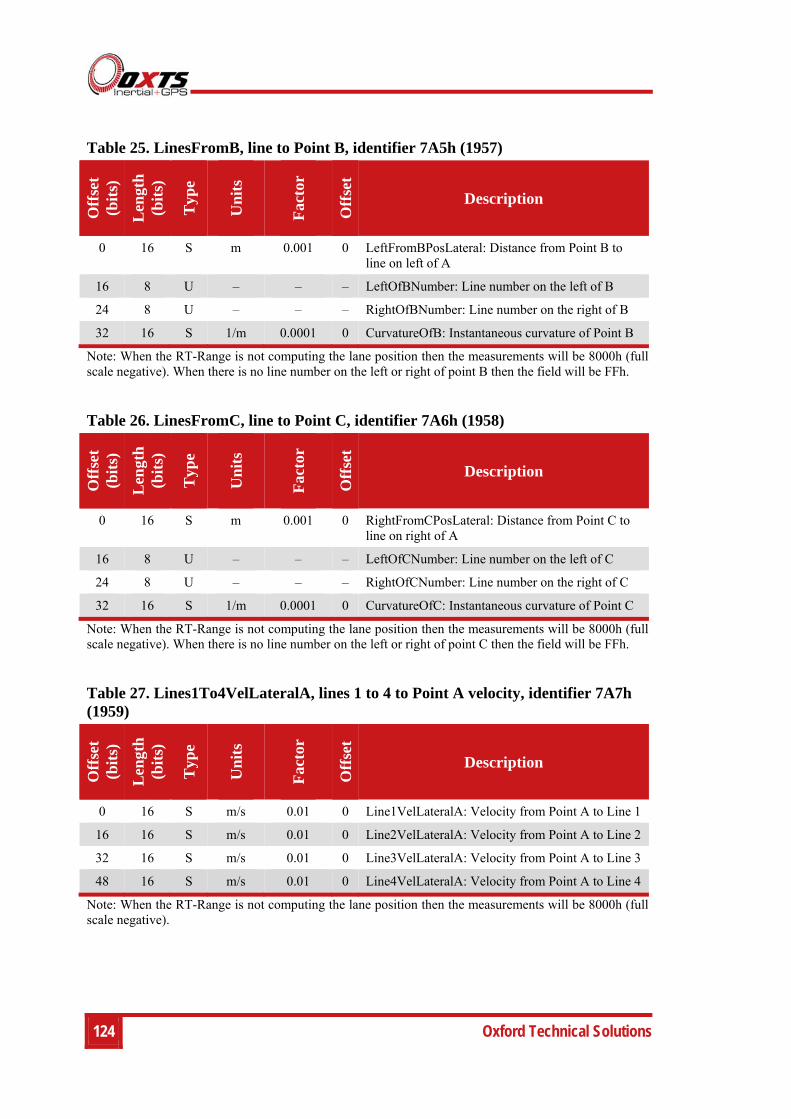
124 Oxford Technical Solutions
Table 25. LinesFromB, line to Point B, identifier 7A5h (1957)
Off
set
(bit
s)
Len
gth
(b
its)
Typ
e
Un
its
Fac
tor
Off
set
Description
0 16 S m 0.001 0 LeftFromBPosLateral: Distance from Point B to line on left of A
16 8 U – – – LeftOfBNumber: Line number on the left of B
24 8 U – – – RightOfBNumber: Line number on the right of B
32 16 S 1/m 0.0001 0 CurvatureOfB: Instantaneous curvature of Point B
Note: When the RT-Range is not computing the lane position then the measurements will be 8000h (full scale negative). When there is no line number on the left or right of point B then the field will be FFh.
Table 26. LinesFromC, line to Point C, identifier 7A6h (1958)
Off
set
(bit
s)
Len
gth
(b
its)
Typ
e
Un
its
Fac
tor
Off
set
Description
0 16 S m 0.001 0 RightFromCPosLateral: Distance from Point C to line on right of A
16 8 U – – – LeftOfCNumber: Line number on the left of C
24 8 U – – – RightOfCNumber: Line number on the right of C
32 16 S 1/m 0.0001 0 CurvatureOfC: Instantaneous curvature of Point C
Note: When the RT-Range is not computing the lane position then the measurements will be 8000h (full scale negative). When there is no line number on the left or right of point C then the field will be FFh.
Table 27. Lines1To4VelLateralA, lines 1 to 4 to Point A velocity, identifier 7A7h (1959)
Off
set
(bit
s)
Len
gth
(b
its)
Typ
e
Un
its
Fac
tor
Off
set
Description
0 16 S m/s 0.01 0 Line1VelLateralA: Velocity from Point A to Line 1
16 16 S m/s 0.01 0 Line2VelLateralA: Velocity from Point A to Line 2
32 16 S m/s 0.01 0 Line3VelLateralA: Velocity from Point A to Line 3
48 16 S m/s 0.01 0 Line4VelLateralA: Velocity from Point A to Line 4
Note: When the RT-Range is not computing the lane position then the measurements will be 8000h (full scale negative).
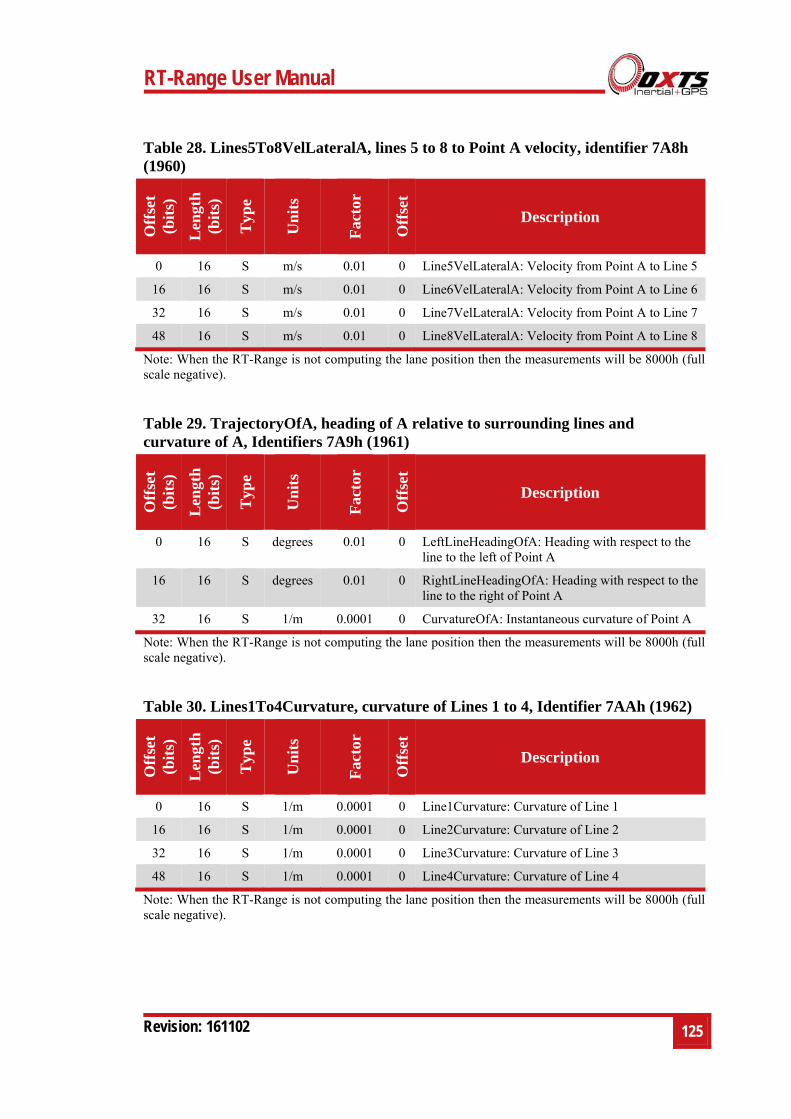
RT-Range User Manual
Revision: 161102
125
Table 28. Lines5To8VelLateralA, lines 5 to 8 to Point A velocity, identifier 7A8h (1960)
Off
set
(bit
s)
Len
gth
(b
its)
Typ
e
Un
its
Fac
tor
Off
set
Description
0 16 S m/s 0.01 0 Line5VelLateralA: Velocity from Point A to Line 5
16 16 S m/s 0.01 0 Line6VelLateralA: Velocity from Point A to Line 6
32 16 S m/s 0.01 0 Line7VelLateralA: Velocity from Point A to Line 7
48 16 S m/s 0.01 0 Line8VelLateralA: Velocity from Point A to Line 8
Note: When the RT-Range is not computing the lane position then the measurements will be 8000h (full scale negative).
Table 29. TrajectoryOfA, heading of A relative to surrounding lines and curvature of A, Identifiers 7A9h (1961)
Off
set
(bit
s)
Len
gth
(b
its)
Typ
e
Un
its
Fac
tor
Off
set
Description
0 16 S degrees 0.01 0 LeftLineHeadingOfA: Heading with respect to the line to the left of Point A
16 16 S degrees 0.01 0 RightLineHeadingOfA: Heading with respect to the line to the right of Point A
32 16 S 1/m 0.0001 0 CurvatureOfA: Instantaneous curvature of Point A
Note: When the RT-Range is not computing the lane position then the measurements will be 8000h (full scale negative).
Table 30. Lines1To4Curvature, curvature of Lines 1 to 4, Identifier 7AAh (1962)
Off
set
(bit
s)
Len
gth
(b
its)
Typ
e
Un
its
Fac
tor
Off
set
Description
0 16 S 1/m 0.0001 0 Line1Curvature: Curvature of Line 1
16 16 S 1/m 0.0001 0 Line2Curvature: Curvature of Line 2
32 16 S 1/m 0.0001 0 Line3Curvature: Curvature of Line 3
48 16 S 1/m 0.0001 0 Line4Curvature: Curvature of Line 4
Note: When the RT-Range is not computing the lane position then the measurements will be 8000h (full scale negative).
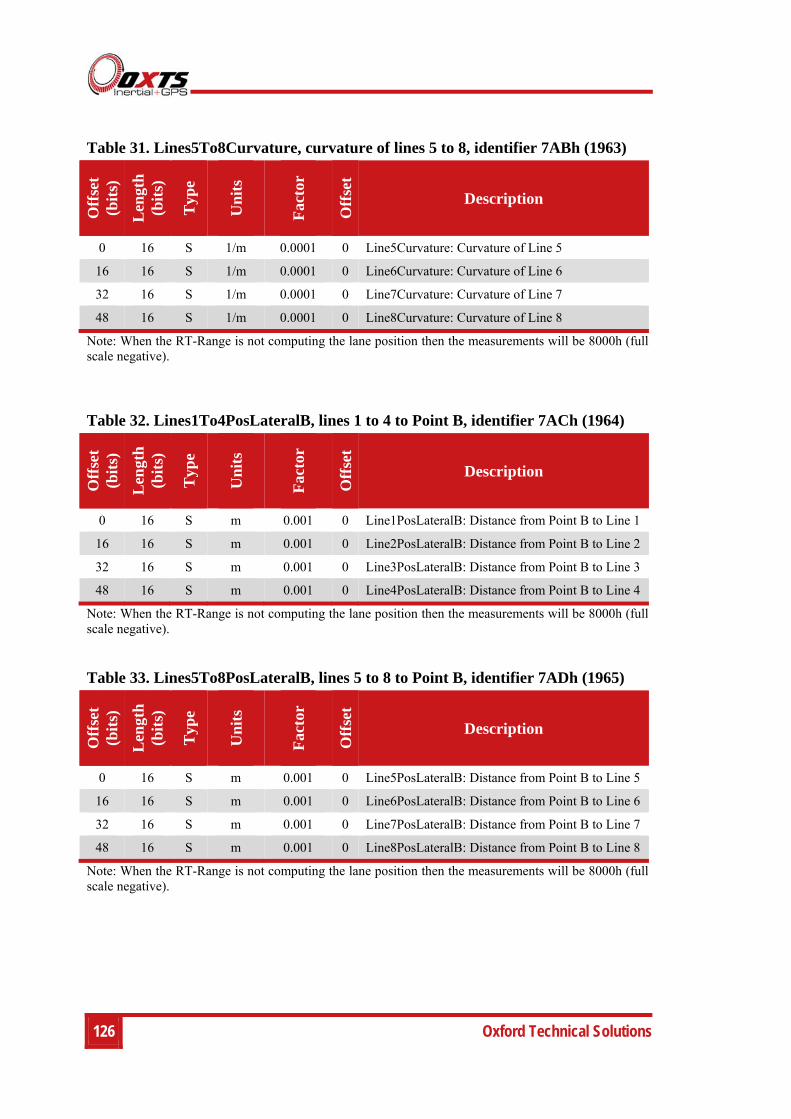
126 Oxford Technical Solutions
Table 31. Lines5To8Curvature, curvature of lines 5 to 8, identifier 7ABh (1963)
Off
set
(bit
s)
Len
gth
(b
its)
Typ
e
Un
its
Fac
tor
Off
set
Description
0 16 S 1/m 0.0001 0 Line5Curvature: Curvature of Line 5
16 16 S 1/m 0.0001 0 Line6Curvature: Curvature of Line 6
32 16 S 1/m 0.0001 0 Line7Curvature: Curvature of Line 7
48 16 S 1/m 0.0001 0 Line8Curvature: Curvature of Line 8
Note: When the RT-Range is not computing the lane position then the measurements will be 8000h (full scale negative).
Table 32. Lines1To4PosLateralB, lines 1 to 4 to Point B, identifier 7ACh (1964)
Off
set
(bit
s)
Len
gth
(b
its)
Typ
e
Un
its
Fac
tor
Off
set
Description
0 16 S m 0.001 0 Line1PosLateralB: Distance from Point B to Line 1
16 16 S m 0.001 0 Line2PosLateralB: Distance from Point B to Line 2
32 16 S m 0.001 0 Line3PosLateralB: Distance from Point B to Line 3
48 16 S m 0.001 0 Line4PosLateralB: Distance from Point B to Line 4
Note: When the RT-Range is not computing the lane position then the measurements will be 8000h (full scale negative).
Table 33. Lines5To8PosLateralB, lines 5 to 8 to Point B, identifier 7ADh (1965)
Off
set
(bit
s)
Len
gth
(b
its)
Typ
e
Un
its
Fac
tor
Off
set
Description
0 16 S m 0.001 0 Line5PosLateralB: Distance from Point B to Line 5
16 16 S m 0.001 0 Line6PosLateralB: Distance from Point B to Line 6
32 16 S m 0.001 0 Line7PosLateralB: Distance from Point B to Line 7
48 16 S m 0.001 0 Line8PosLateralB: Distance from Point B to Line 8
Note: When the RT-Range is not computing the lane position then the measurements will be 8000h (full scale negative).
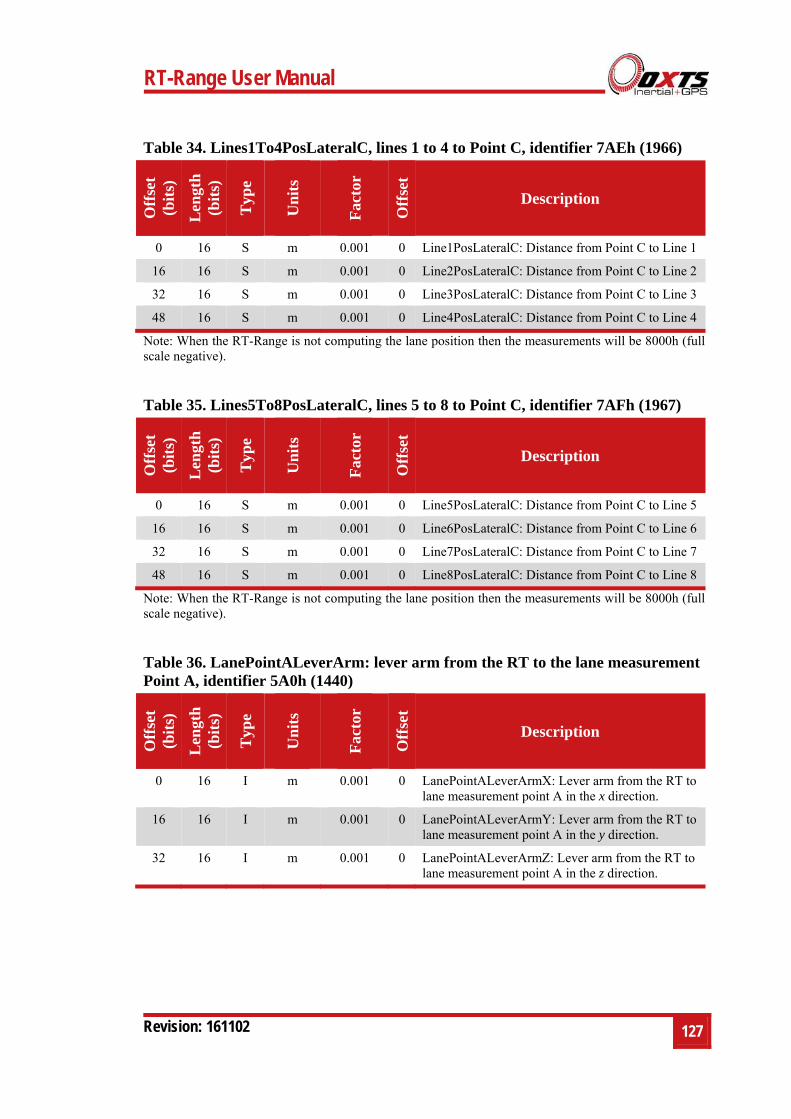
RT-Range User Manual
Revision: 161102
127
Table 34. Lines1To4PosLateralC, lines 1 to 4 to Point C, identifier 7AEh (1966) O
ffse
t (b
its)
Len
gth
(b
its)
Typ
e
Un
its
Fac
tor
Off
set
Description
0 16 S m 0.001 0 Line1PosLateralC: Distance from Point C to Line 1
16 16 S m 0.001 0 Line2PosLateralC: Distance from Point C to Line 2
32 16 S m 0.001 0 Line3PosLateralC: Distance from Point C to Line 3
48 16 S m 0.001 0 Line4PosLateralC: Distance from Point C to Line 4
Note: When the RT-Range is not computing the lane position then the measurements will be 8000h (full scale negative).
Table 35. Lines5To8PosLateralC, lines 5 to 8 to Point C, identifier 7AFh (1967)
Off
set
(bit
s)
Len
gth
(b
its)
Typ
e
Un
its
Fac
tor
Off
set
Description
0 16 S m 0.001 0 Line5PosLateralC: Distance from Point C to Line 5
16 16 S m 0.001 0 Line6PosLateralC: Distance from Point C to Line 6
32 16 S m 0.001 0 Line7PosLateralC: Distance from Point C to Line 7
48 16 S m 0.001 0 Line8PosLateralC: Distance from Point C to Line 8
Note: When the RT-Range is not computing the lane position then the measurements will be 8000h (full scale negative).
Table 36. LanePointALeverArm: lever arm from the RT to the lane measurement Point A, identifier 5A0h (1440)
Off
set
(bit
s)
Len
gth
(b
its)
Typ
e
Un
its
Fac
tor
Off
set
Description
0 16 I m 0.001 0 LanePointALeverArmX: Lever arm from the RT to lane measurement point A in the x direction.
16 16 I m 0.001 0 LanePointALeverArmY: Lever arm from the RT to lane measurement point A in the y direction.
32 16 I m 0.001 0 LanePointALeverArmZ: Lever arm from the RT to lane measurement point A in the z direction.
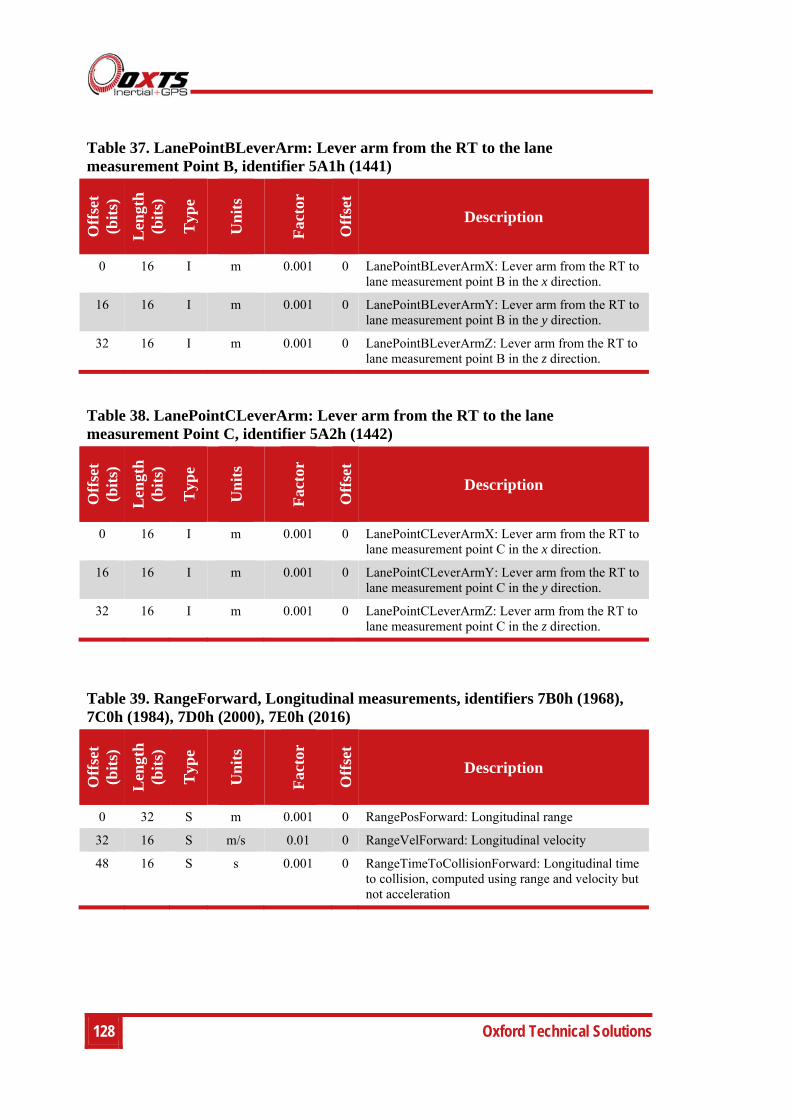
128 Oxford Technical Solutions
Table 37. LanePointBLeverArm: Lever arm from the RT to the lane measurement Point B, identifier 5A1h (1441)
Off
set
(bit
s)
Len
gth
(b
its)
Typ
e
Un
its
Fac
tor
Off
set
Description
0 16 I m 0.001 0 LanePointBLeverArmX: Lever arm from the RT to lane measurement point B in the x direction.
16 16 I m 0.001 0 LanePointBLeverArmY: Lever arm from the RT to lane measurement point B in the y direction.
32 16 I m 0.001 0 LanePointBLeverArmZ: Lever arm from the RT to lane measurement point B in the z direction.
Table 38. LanePointCLeverArm: Lever arm from the RT to the lane measurement Point C, identifier 5A2h (1442)
Off
set
(bit
s)
Len
gth
(b
its)
Typ
e
Un
its
Fac
tor
Off
set
Description
0 16 I m 0.001 0 LanePointCLeverArmX: Lever arm from the RT to lane measurement point C in the x direction.
16 16 I m 0.001 0 LanePointCLeverArmY: Lever arm from the RT to lane measurement point C in the y direction.
32 16 I m 0.001 0 LanePointCLeverArmZ: Lever arm from the RT to lane measurement point C in the z direction.
Table 39. RangeForward, Longitudinal measurements, identifiers 7B0h (1968), 7C0h (1984), 7D0h (2000), 7E0h (2016)
Off
set
(bit
s)
Len
gth
(b
its)
Typ
e
Un
its
Fac
tor
Off
set
Description
0 32 S m 0.001 0 RangePosForward: Longitudinal range
32 16 S m/s 0.01 0 RangeVelForward: Longitudinal velocity
48 16 S s 0.001 0 RangeTimeToCollisionForward: Longitudinal time to collision, computed using range and velocity but not acceleration
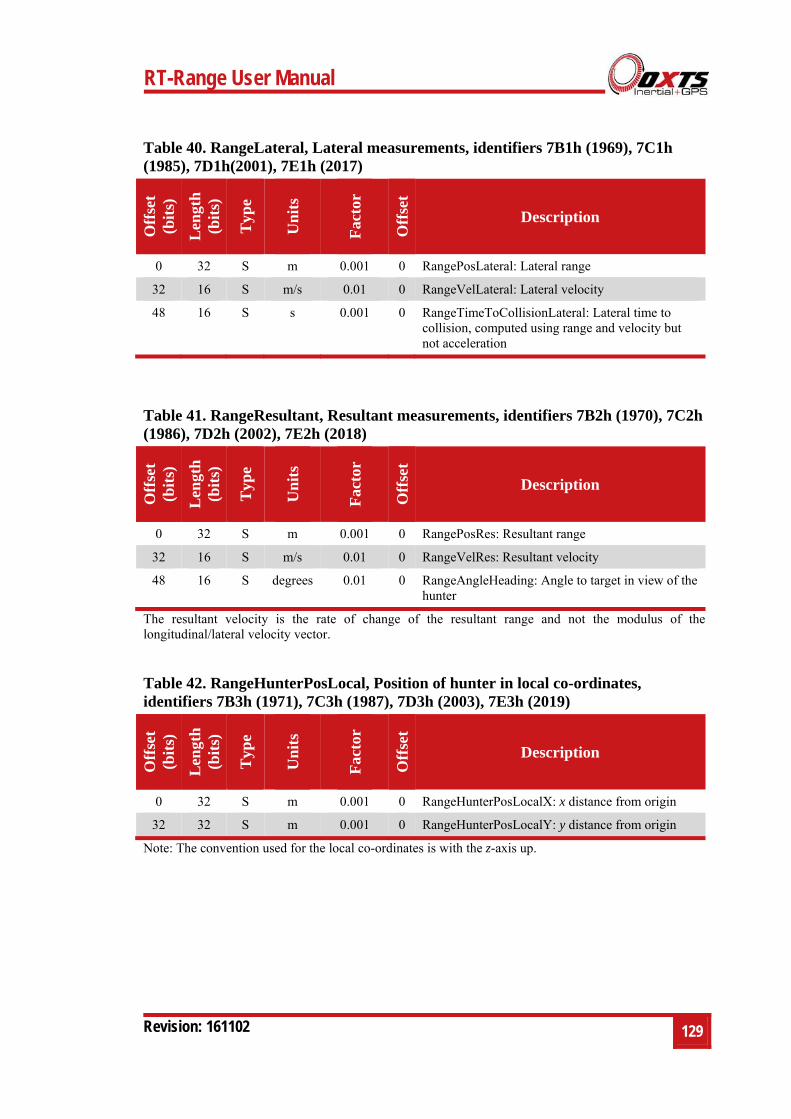
RT-Range User Manual
Revision: 161102
129
Table 40. RangeLateral, Lateral measurements, identifiers 7B1h (1969), 7C1h (1985), 7D1h(2001), 7E1h (2017)
Off
set
(bit
s)
Len
gth
(b
its)
Typ
e
Un
its
Fac
tor
Off
set
Description
0 32 S m 0.001 0 RangePosLateral: Lateral range
32 16 S m/s 0.01 0 RangeVelLateral: Lateral velocity
48 16 S s 0.001 0 RangeTimeToCollisionLateral: Lateral time to collision, computed using range and velocity but not acceleration
Table 41. RangeResultant, Resultant measurements, identifiers 7B2h (1970), 7C2h (1986), 7D2h (2002), 7E2h (2018)
Off
set
(bit
s)
Len
gth
(b
its)
Typ
e
Un
its
Fac
tor
Off
set
Description
0 32 S m 0.001 0 RangePosRes: Resultant range
32 16 S m/s 0.01 0 RangeVelRes: Resultant velocity
48 16 S degrees 0.01 0 RangeAngleHeading: Angle to target in view of the hunter
The resultant velocity is the rate of change of the resultant range and not the modulus of the longitudinal/lateral velocity vector.
Table 42. RangeHunterPosLocal, Position of hunter in local co-ordinates, identifiers 7B3h (1971), 7C3h (1987), 7D3h (2003), 7E3h (2019)
Off
set
(bit
s)
Len
gth
(b
its)
Typ
e
Un
its
Fac
tor
Off
set
Description
0 32 S m 0.001 0 RangeHunterPosLocalX: x distance from origin
32 32 S m 0.001 0 RangeHunterPosLocalY: y distance from origin
Note: The convention used for the local co-ordinates is with the z-axis up.
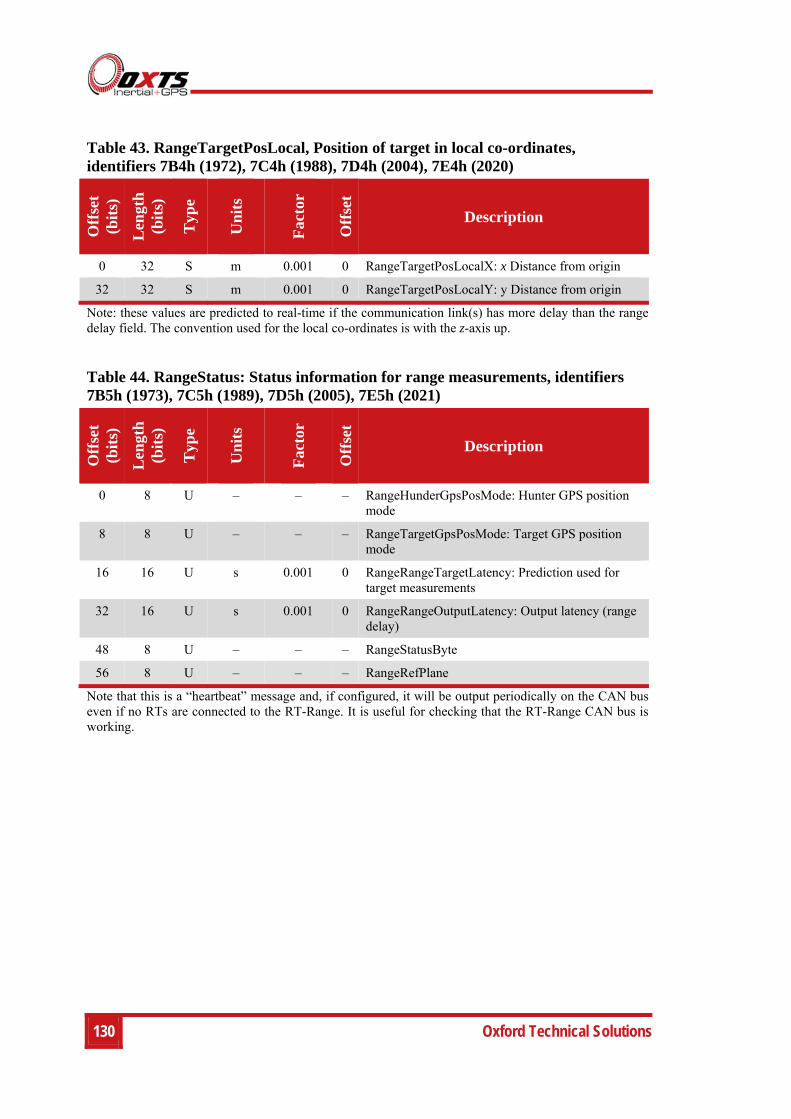
130 Oxford Technical Solutions
Table 43. RangeTargetPosLocal, Position of target in local co-ordinates, identifiers 7B4h (1972), 7C4h (1988), 7D4h (2004), 7E4h (2020)
Off
set
(bit
s)
Len
gth
(b
its)
Typ
e
Un
its
Fac
tor
Off
set
Description
0 32 S m 0.001 0 RangeTargetPosLocalX: x Distance from origin
32 32 S m 0.001 0 RangeTargetPosLocalY: y Distance from origin
Note: these values are predicted to real-time if the communication link(s) has more delay than the range delay field. The convention used for the local co-ordinates is with the z-axis up.
Table 44. RangeStatus: Status information for range measurements, identifiers 7B5h (1973), 7C5h (1989), 7D5h (2005), 7E5h (2021)
Off
set
(bit
s)
Len
gth
(b
its)
Typ
e
Un
its
Fac
tor
Off
set
Description
0 8 U – – – RangeHunderGpsPosMode: Hunter GPS position mode
8 8 U – – – RangeTargetGpsPosMode: Target GPS position mode
16 16 U s 0.001 0 RangeRangeTargetLatency: Prediction used for target measurements
32 16 U s 0.001 0 RangeRangeOutputLatency: Output latency (range delay)
48 8 U – – – RangeStatusByte
56 8 U – – – RangeRefPlane
Note that this is a “heartbeat” message and, if configured, it will be output periodically on the CAN bus even if no RTs are connected to the RT-Range. It is useful for checking that the RT-Range CAN bus is working.
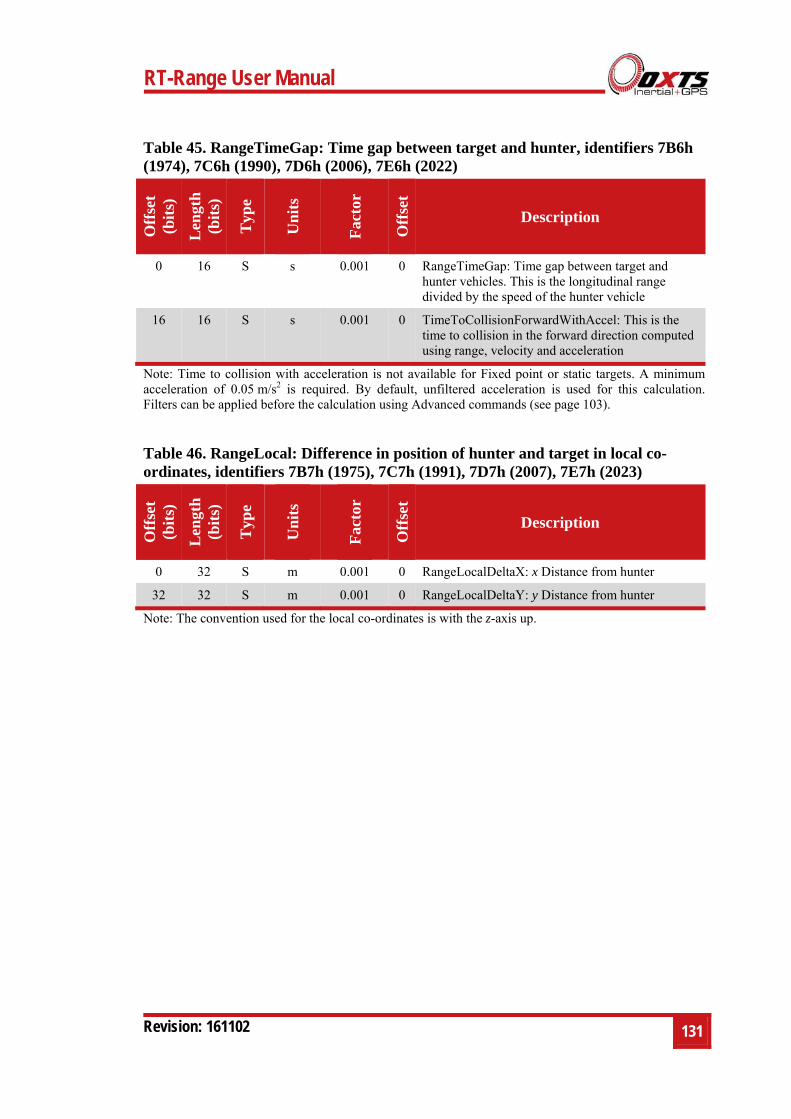
RT-Range User Manual
Revision: 161102
131
Table 45. RangeTimeGap: Time gap between target and hunter, identifiers 7B6h (1974), 7C6h (1990), 7D6h (2006), 7E6h (2022)
Off
set
(bit
s)
Len
gth
(b
its)
Typ
e
Un
its
Fac
tor
Off
set
Description
0 16 S s 0.001 0 RangeTimeGap: Time gap between target and hunter vehicles. This is the longitudinal range divided by the speed of the hunter vehicle
16 16 S s 0.001 0 TimeToCollisionForwardWithAccel: This is the time to collision in the forward direction computed using range, velocity and acceleration
Note: Time to collision with acceleration is not available for Fixed point or static targets. A minimum acceleration of 0.05 m/s2 is required. By default, unfiltered acceleration is used for this calculation. Filters can be applied before the calculation using Advanced commands (see page 103).
Table 46. RangeLocal: Difference in position of hunter and target in local co-ordinates, identifiers 7B7h (1975), 7C7h (1991), 7D7h (2007), 7E7h (2023)
Off
set
(bit
s)
Len
gth
(b
its)
Typ
e
Un
its
Fac
tor
Off
set
Description
0 32 S m 0.001 0 RangeLocalDeltaX: x Distance from hunter
32 32 S m 0.001 0 RangeLocalDeltaY: y Distance from hunter
Note: The convention used for the local co-ordinates is with the z-axis up.
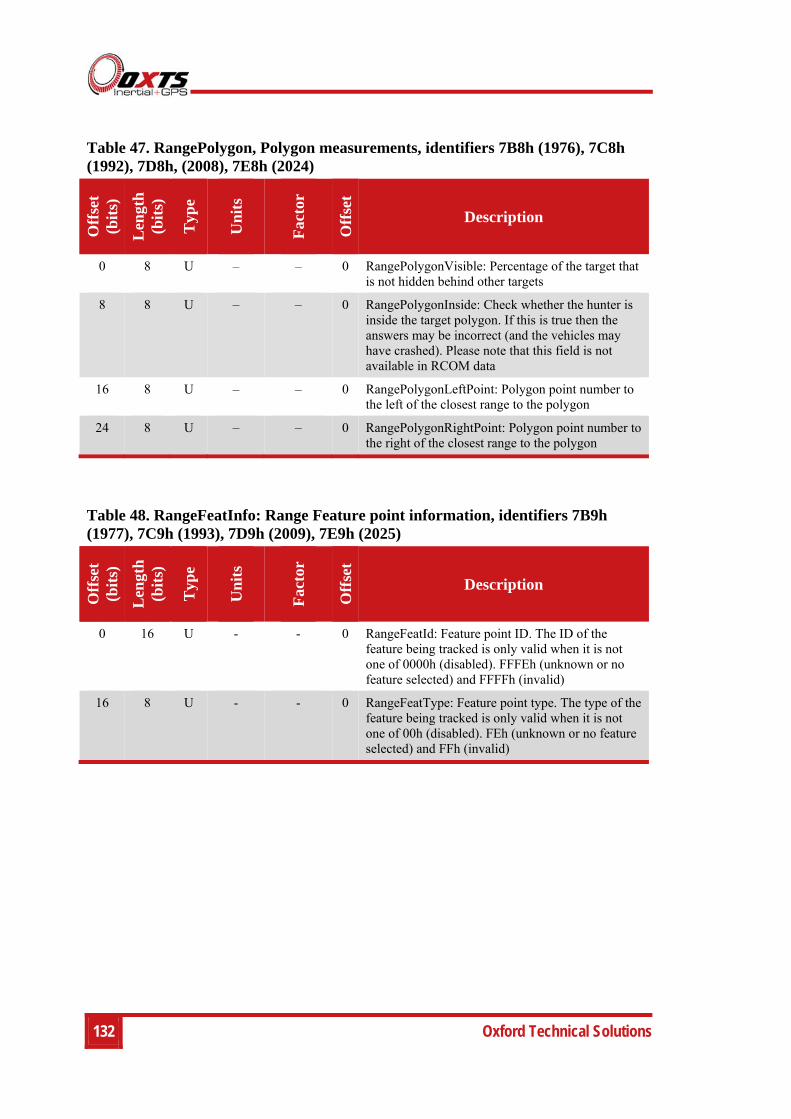
132 Oxford Technical Solutions
Table 47. RangePolygon, Polygon measurements, identifiers 7B8h (1976), 7C8h (1992), 7D8h, (2008), 7E8h (2024)
Off
set
(bit
s)
Len
gth
(b
its)
Typ
e
Un
its
Fac
tor
Off
set
Description
0 8 U – – 0 RangePolygonVisible: Percentage of the target that is not hidden behind other targets
8 8 U – – 0 RangePolygonInside: Check whether the hunter is inside the target polygon. If this is true then the answers may be incorrect (and the vehicles may have crashed). Please note that this field is not available in RCOM data
16 8 U – – 0 RangePolygonLeftPoint: Polygon point number to the left of the closest range to the polygon
24 8 U – – 0 RangePolygonRightPoint: Polygon point number to the right of the closest range to the polygon
Table 48. RangeFeatInfo: Range Feature point information, identifiers 7B9h (1977), 7C9h (1993), 7D9h (2009), 7E9h (2025)
Off
set
(bit
s)
Len
gth
(b
its)
Typ
e
Un
its
Fac
tor
Off
set
Description
0 16 U - - 0 RangeFeatId: Feature point ID. The ID of the feature being tracked is only valid when it is not one of 0000h (disabled). FFFEh (unknown or no feature selected) and FFFFh (invalid)
16 8 U - - 0 RangeFeatType: Feature point type. The type of the feature being tracked is only valid when it is not one of 00h (disabled). FEh (unknown or no feature selected) and FFh (invalid)
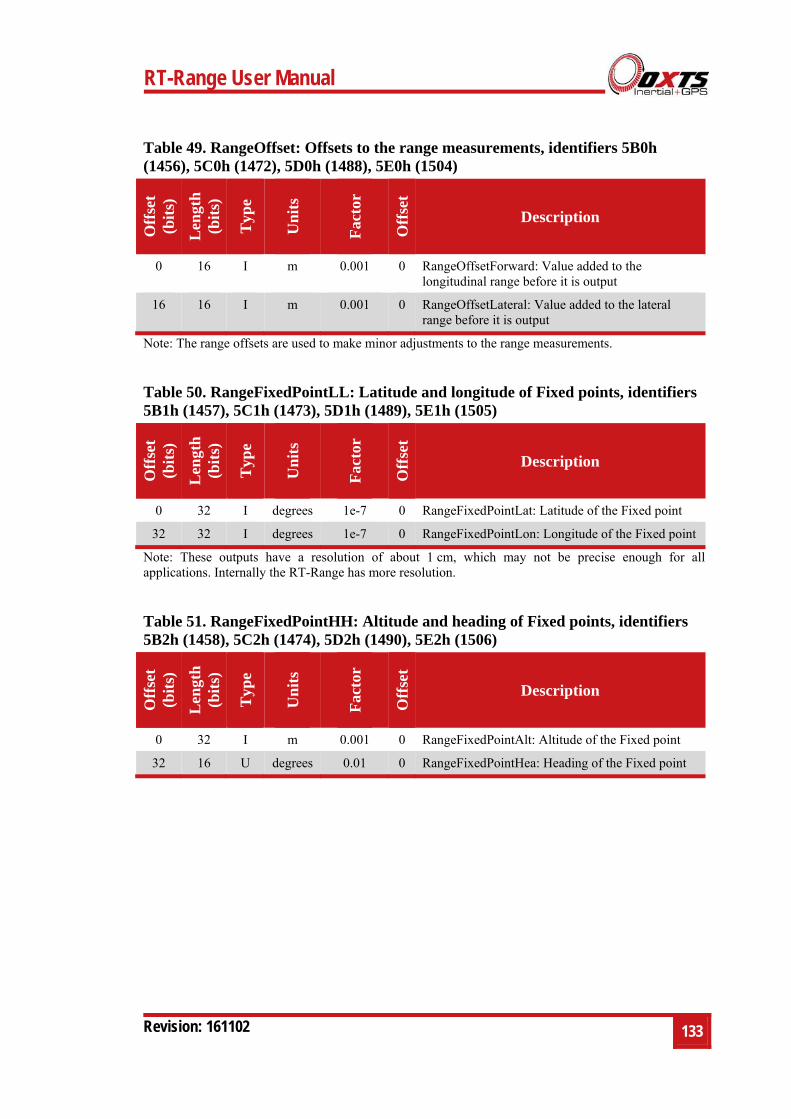
RT-Range User Manual
Revision: 161102
133
Table 49. RangeOffset: Offsets to the range measurements, identifiers 5B0h (1456), 5C0h (1472), 5D0h (1488), 5E0h (1504)
Off
set
(bit
s)
Len
gth
(b
its)
Typ
e
Un
its
Fac
tor
Off
set
Description
0 16 I m 0.001 0 RangeOffsetForward: Value added to the longitudinal range before it is output
16 16 I m 0.001 0 RangeOffsetLateral: Value added to the lateral range before it is output
Note: The range offsets are used to make minor adjustments to the range measurements.
Table 50. RangeFixedPointLL: Latitude and longitude of Fixed points, identifiers 5B1h (1457), 5C1h (1473), 5D1h (1489), 5E1h (1505)
Off
set
(bit
s)
Len
gth
(b
its)
Typ
e
Un
its
Fac
tor
Off
set
Description
0 32 I degrees 1e-7 0 RangeFixedPointLat: Latitude of the Fixed point
32 32 I degrees 1e-7 0 RangeFixedPointLon: Longitude of the Fixed point
Note: These outputs have a resolution of about 1 cm, which may not be precise enough for all applications. Internally the RT-Range has more resolution.
Table 51. RangeFixedPointHH: Altitude and heading of Fixed points, identifiers 5B2h (1458), 5C2h (1474), 5D2h (1490), 5E2h (1506)
Off
set
(bit
s)
Len
gth
(b
its)
Typ
e
Un
its
Fac
tor
Off
set
Description
0 32 I m 0.001 0 RangeFixedPointAlt: Altitude of the Fixed point
32 16 U degrees 0.01 0 RangeFixedPointHea: Heading of the Fixed point
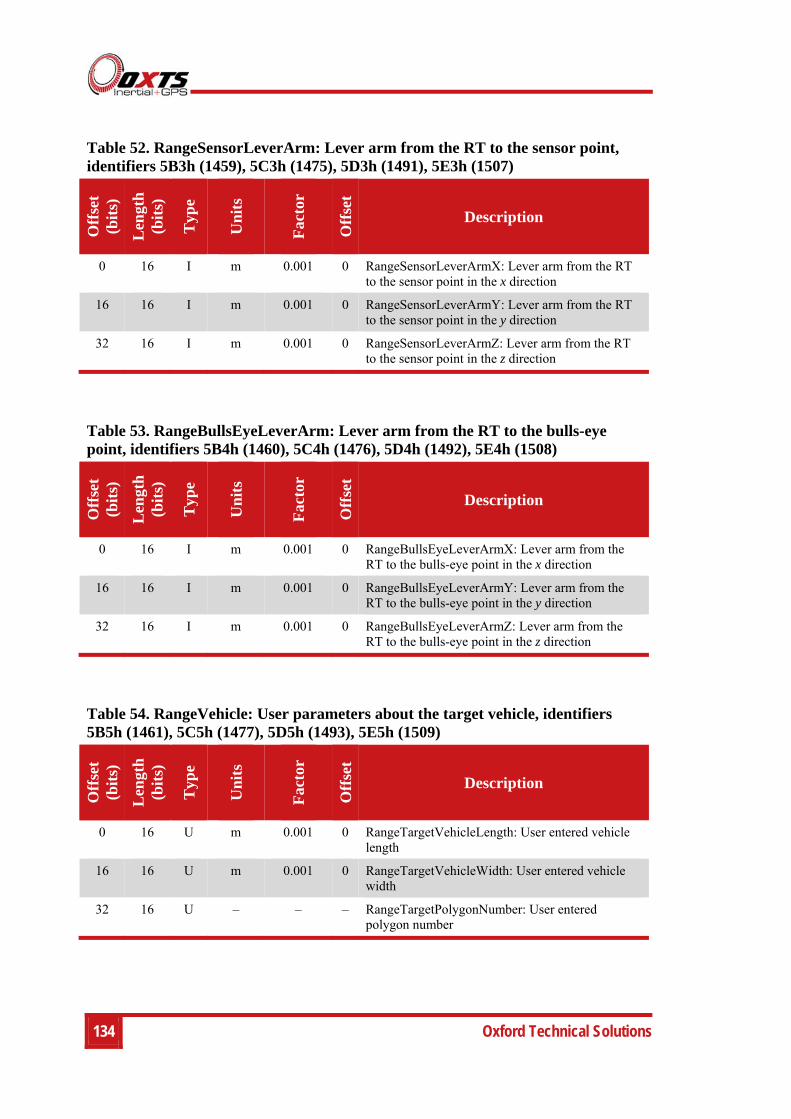
134 Oxford Technical Solutions
Table 52. RangeSensorLeverArm: Lever arm from the RT to the sensor point, identifiers 5B3h (1459), 5C3h (1475), 5D3h (1491), 5E3h (1507)
Off
set
(bit
s)
Len
gth
(b
its)
Typ
e
Un
its
Fac
tor
Off
set
Description
0 16 I m 0.001 0 RangeSensorLeverArmX: Lever arm from the RT to the sensor point in the x direction
16 16 I m 0.001 0 RangeSensorLeverArmY: Lever arm from the RT to the sensor point in the y direction
32 16 I m 0.001 0 RangeSensorLeverArmZ: Lever arm from the RT to the sensor point in the z direction
Table 53. RangeBullsEyeLeverArm: Lever arm from the RT to the bulls-eye point, identifiers 5B4h (1460), 5C4h (1476), 5D4h (1492), 5E4h (1508)
Off
set
(bit
s)
Len
gth
(b
its)
Typ
e
Un
its
Fac
tor
Off
set
Description
0 16 I m 0.001 0 RangeBullsEyeLeverArmX: Lever arm from the RT to the bulls-eye point in the x direction
16 16 I m 0.001 0 RangeBullsEyeLeverArmY: Lever arm from the RT to the bulls-eye point in the y direction
32 16 I m 0.001 0 RangeBullsEyeLeverArmZ: Lever arm from the RT to the bulls-eye point in the z direction
Table 54. RangeVehicle: User parameters about the target vehicle, identifiers 5B5h (1461), 5C5h (1477), 5D5h (1493), 5E5h (1509)
Off
set
(bit
s)
Len
gth
(b
its)
Typ
e
Un
its
Fac
tor
Off
set
Description
0 16 U m 0.001 0 RangeTargetVehicleLength: User entered vehicle length
16 16 U m 0.001 0 RangeTargetVehicleWidth: User entered vehicle width
32 16 U – – – RangeTargetPolygonNumber: User entered polygon number
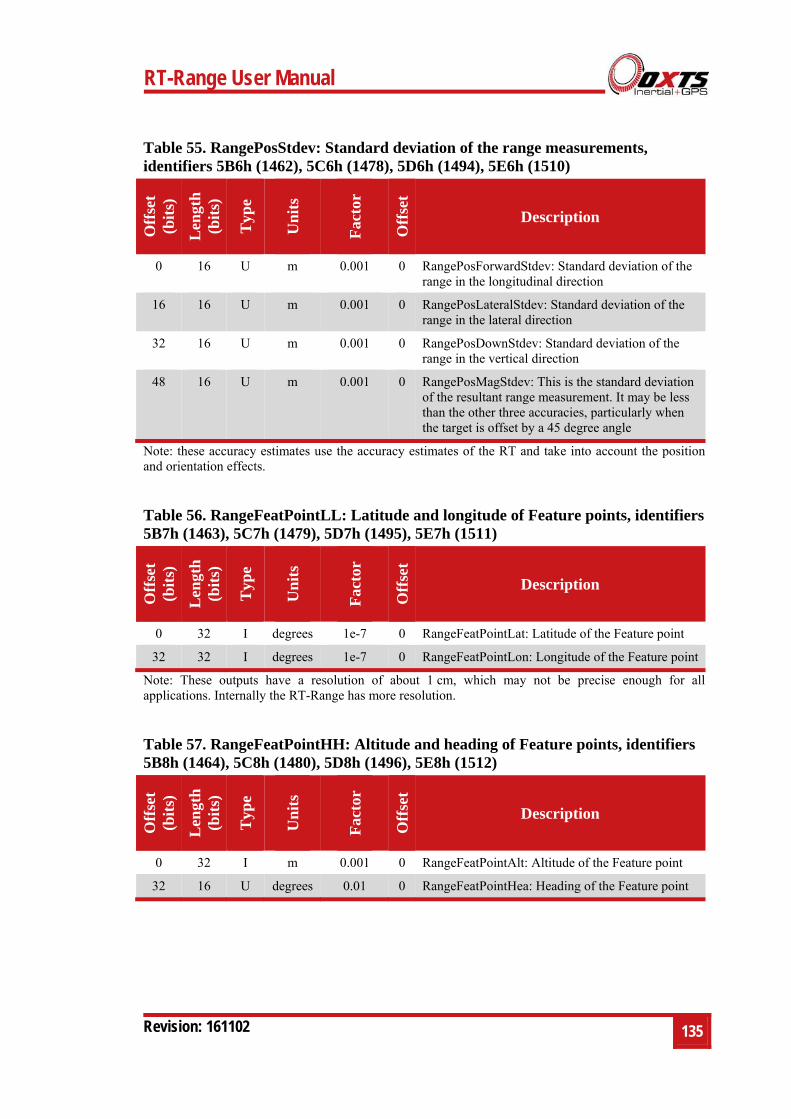
RT-Range User Manual
Revision: 161102
135
Table 55. RangePosStdev: Standard deviation of the range measurements, identifiers 5B6h (1462), 5C6h (1478), 5D6h (1494), 5E6h (1510)
Off
set
(bit
s)
Len
gth
(b
its)
Typ
e
Un
its
Fac
tor
Off
set
Description
0 16 U m 0.001 0 RangePosForwardStdev: Standard deviation of the range in the longitudinal direction
16 16 U m 0.001 0 RangePosLateralStdev: Standard deviation of the range in the lateral direction
32 16 U m 0.001 0 RangePosDownStdev: Standard deviation of the range in the vertical direction
48 16 U m 0.001 0 RangePosMagStdev: This is the standard deviation of the resultant range measurement. It may be less than the other three accuracies, particularly when the target is offset by a 45 degree angle
Note: these accuracy estimates use the accuracy estimates of the RT and take into account the position and orientation effects.
Table 56. RangeFeatPointLL: Latitude and longitude of Feature points, identifiers 5B7h (1463), 5C7h (1479), 5D7h (1495), 5E7h (1511)
Off
set
(bit
s)
Len
gth
(b
its)
Typ
e
Un
its
Fac
tor
Off
set
Description
0 32 I degrees 1e-7 0 RangeFeatPointLat: Latitude of the Feature point
32 32 I degrees 1e-7 0 RangeFeatPointLon: Longitude of the Feature point
Note: These outputs have a resolution of about 1 cm, which may not be precise enough for all applications. Internally the RT-Range has more resolution.
Table 57. RangeFeatPointHH: Altitude and heading of Feature points, identifiers 5B8h (1464), 5C8h (1480), 5D8h (1496), 5E8h (1512)
Off
set
(bit
s)
Len
gth
(b
its)
Typ
e
Un
its
Fac
tor
Off
set
Description
0 32 I m 0.001 0 RangeFeatPointAlt: Altitude of the Feature point
32 16 U degrees 0.01 0 RangeFeatPointHea: Heading of the Feature point
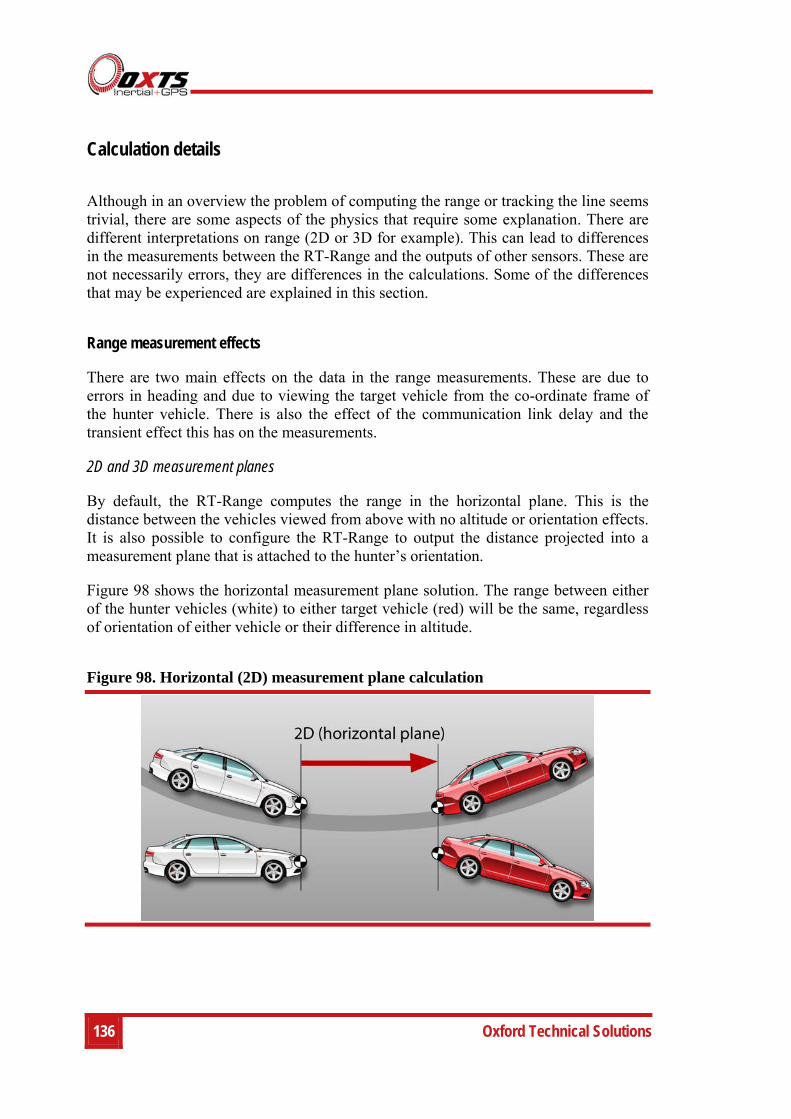
136 Oxford Technical Solutions
Calculation details
Although in an overview the problem of computing the range or tracking the line seems trivial, there are some aspects of the physics that require some explanation. There are different interpretations on range (2D or 3D for example). This can lead to differences in the measurements between the RT-Range and the outputs of other sensors. These are not necessarily errors, they are differences in the calculations. Some of the differences that may be experienced are explained in this section.
Range measurement effects
There are two main effects on the data in the range measurements. These are due to errors in heading and due to viewing the target vehicle from the co-ordinate frame of the hunter vehicle. There is also the effect of the communication link delay and the transient effect this has on the measurements.
2D and 3D measurement planes
By default, the RT-Range computes the range in the horizontal plane. This is the distance between the vehicles viewed from above with no altitude or orientation effects. It is also possible to configure the RT-Range to output the distance projected into a measurement plane that is attached to the hunter’s orientation.
Figure 98 shows the horizontal measurement plane solution. The range between either of the hunter vehicles (white) to either target vehicle (red) will be the same, regardless of orientation of either vehicle or their difference in altitude.
Figure 98. Horizontal (2D) measurement plane calculation
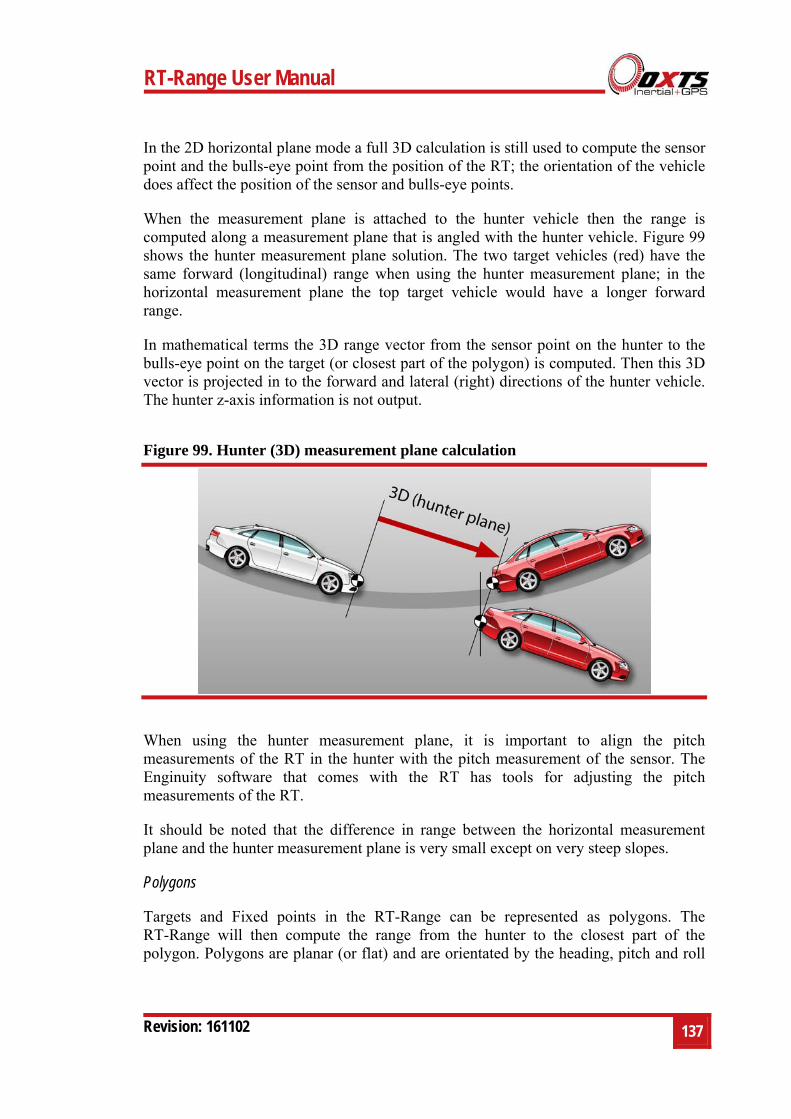
RT-Range User Manual
Revision: 161102
137
In the 2D horizontal plane mode a full 3D calculation is still used to compute the sensor point and the bulls-eye point from the position of the RT; the orientation of the vehicle does affect the position of the sensor and bulls-eye points.
When the measurement plane is attached to the hunter vehicle then the range is computed along a measurement plane that is angled with the hunter vehicle. Figure 99 shows the hunter measurement plane solution. The two target vehicles (red) have the same forward (longitudinal) range when using the hunter measurement plane; in the horizontal measurement plane the top target vehicle would have a longer forward range.
In mathematical terms the 3D range vector from the sensor point on the hunter to the bulls-eye point on the target (or closest part of the polygon) is computed. Then this 3D vector is projected in to the forward and lateral (right) directions of the hunter vehicle. The hunter z-axis information is not output.
Figure 99. Hunter (3D) measurement plane calculation
When using the hunter measurement plane, it is important to align the pitch measurements of the RT in the hunter with the pitch measurement of the sensor. The Enginuity software that comes with the RT has tools for adjusting the pitch measurements of the RT.
It should be noted that the difference in range between the horizontal measurement plane and the hunter measurement plane is very small except on very steep slopes.
Polygons
Targets and Fixed points in the RT-Range can be represented as polygons. The RT-Range will then compute the range from the hunter to the closest part of the polygon. Polygons are planar (or flat) and are orientated by the heading, pitch and roll
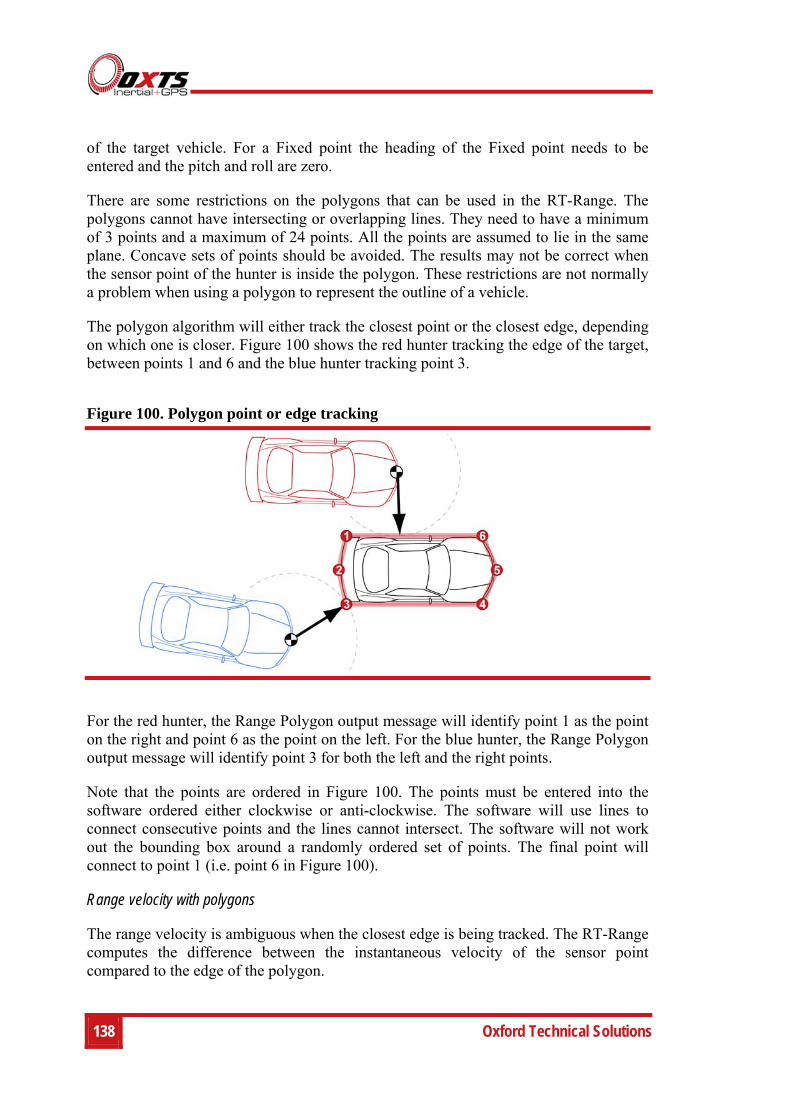
138 Oxford Technical Solutions
of the target vehicle. For a Fixed point the heading of the Fixed point needs to be entered and the pitch and roll are zero.
There are some restrictions on the polygons that can be used in the RT-Range. The polygons cannot have intersecting or overlapping lines. They need to have a minimum of 3 points and a maximum of 24 points. All the points are assumed to lie in the same plane. Concave sets of points should be avoided. The results may not be correct when the sensor point of the hunter is inside the polygon. These restrictions are not normally a problem when using a polygon to represent the outline of a vehicle.
The polygon algorithm will either track the closest point or the closest edge, depending on which one is closer. Figure 100 shows the red hunter tracking the edge of the target, between points 1 and 6 and the blue hunter tracking point 3.
Figure 100. Polygon point or edge tracking
For the red hunter, the Range Polygon output message will identify point 1 as the point on the right and point 6 as the point on the left. For the blue hunter, the Range Polygon output message will identify point 3 for both the left and the right points.
Note that the points are ordered in Figure 100. The points must be entered into the software ordered either clockwise or anti-clockwise. The software will use lines to connect consecutive points and the lines cannot intersect. The software will not work out the bounding box around a randomly ordered set of points. The final point will connect to point 1 (i.e. point 6 in Figure 100).
Range velocity with polygons
The range velocity is ambiguous when the closest edge is being tracked. The RT-Range computes the difference between the instantaneous velocity of the sensor point compared to the edge of the polygon.
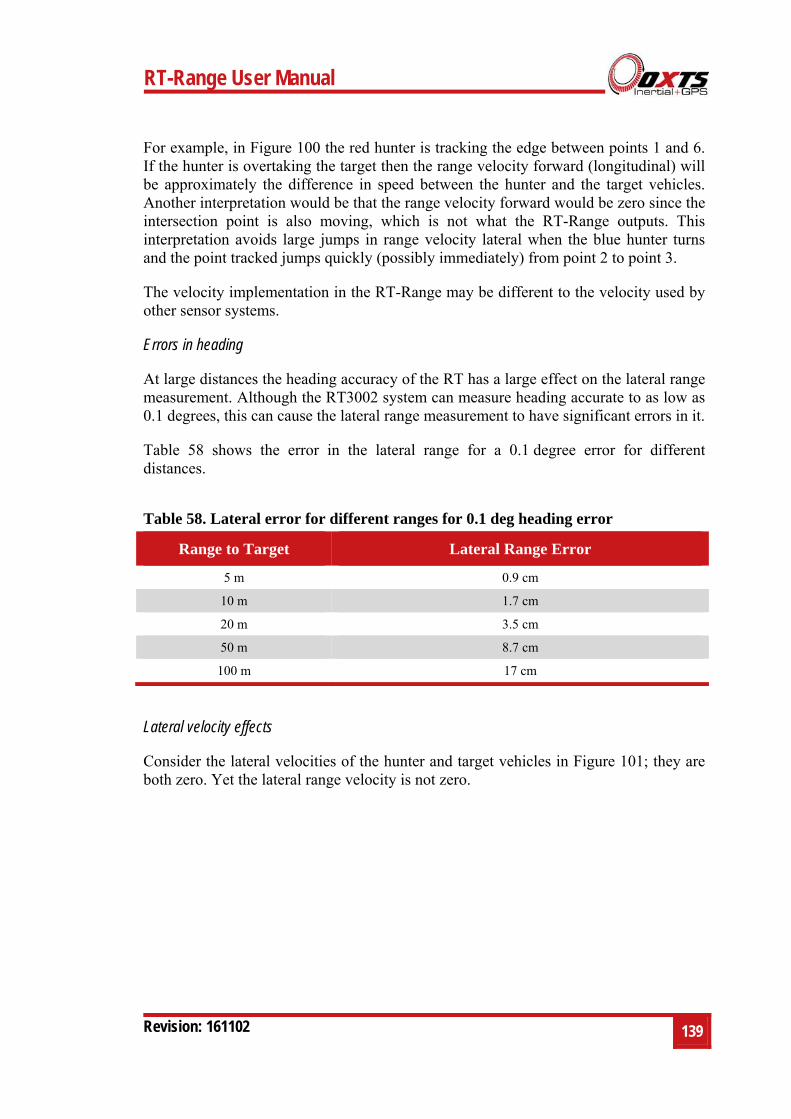
RT-Range User Manual
Revision: 161102
139
For example, in Figure 100 the red hunter is tracking the edge between points 1 and 6. If the hunter is overtaking the target then the range velocity forward (longitudinal) will be approximately the difference in speed between the hunter and the target vehicles. Another interpretation would be that the range velocity forward would be zero since the intersection point is also moving, which is not what the RT-Range outputs. This interpretation avoids large jumps in range velocity lateral when the blue hunter turns and the point tracked jumps quickly (possibly immediately) from point 2 to point 3.
The velocity implementation in the RT-Range may be different to the velocity used by other sensor systems.
Errors in heading
At large distances the heading accuracy of the RT has a large effect on the lateral range measurement. Although the RT3002 system can measure heading accurate to as low as 0.1 degrees, this can cause the lateral range measurement to have significant errors in it.
Table 58 shows the error in the lateral range for a 0.1 degree error for different distances.
Table 58. Lateral error for different ranges for 0.1 deg heading error
Range to Target Lateral Range Error
5 m 0.9 cm
10 m 1.7 cm
20 m 3.5 cm
50 m 8.7 cm
100 m 17 cm
Lateral velocity effects
Consider the lateral velocities of the hunter and target vehicles in Figure 101; they are both zero. Yet the lateral range velocity is not zero.
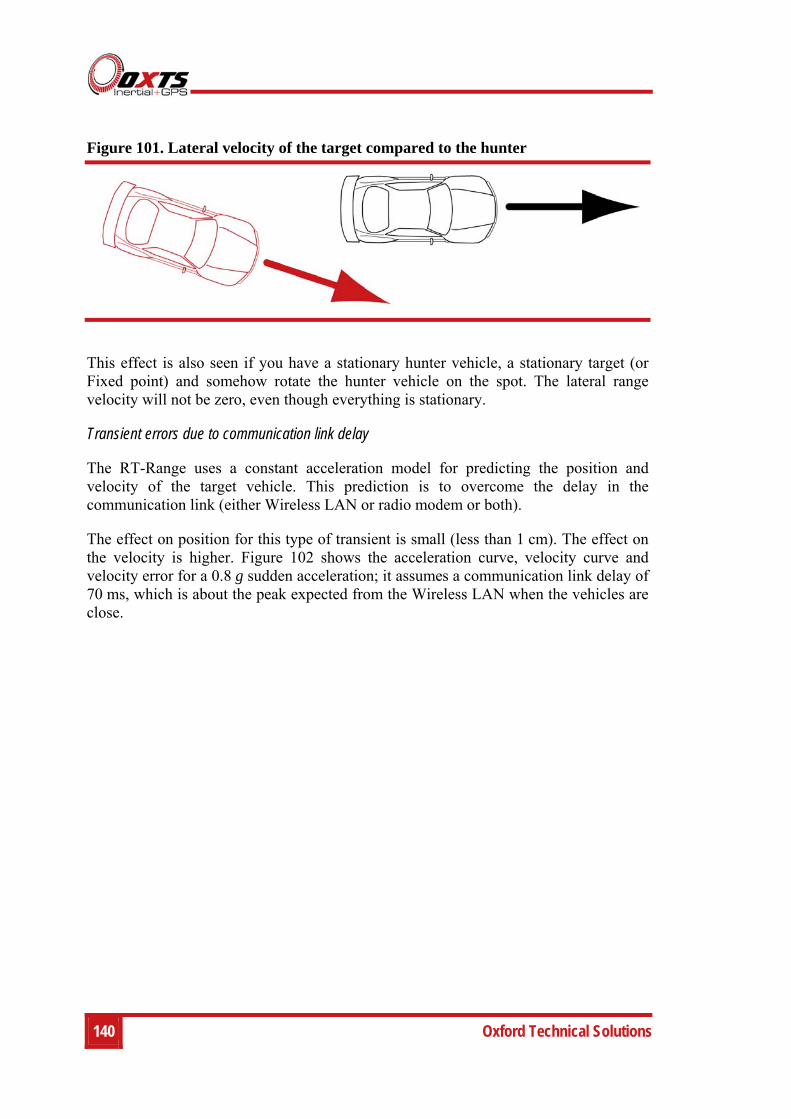
140 Oxford Technical Solutions
Figure 101. Lateral velocity of the target compared to the hunter
This effect is also seen if you have a stationary hunter vehicle, a stationary target (or Fixed point) and somehow rotate the hunter vehicle on the spot. The lateral range velocity will not be zero, even though everything is stationary.
Transient errors due to communication link delay
The RT-Range uses a constant acceleration model for predicting the position and velocity of the target vehicle. This prediction is to overcome the delay in the communication link (either Wireless LAN or radio modem or both).
The effect on position for this type of transient is small (less than 1 cm). The effect on the velocity is higher. Figure 102 shows the acceleration curve, velocity curve and velocity error for a 0.8 g sudden acceleration; it assumes a communication link delay of 70 ms, which is about the peak expected from the Wireless LAN when the vehicles are close.
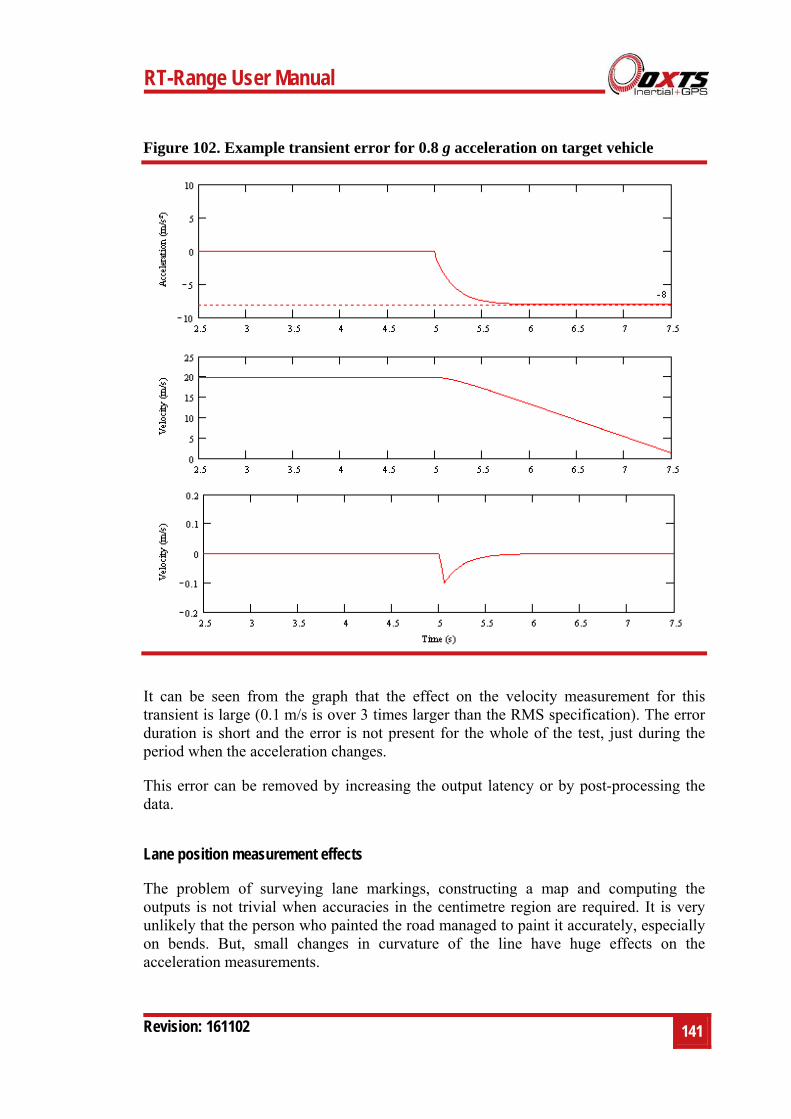
RT-Range User Manual
Revision: 161102
141
Figure 102. Example transient error for 0.8 g acceleration on target vehicle
It can be seen from the graph that the effect on the velocity measurement for this transient is large (0.1 m/s is over 3 times larger than the RMS specification). The error duration is short and the error is not present for the whole of the test, just during the period when the acceleration changes.
This error can be removed by increasing the output latency or by post-processing the data.
Lane position measurement effects
The problem of surveying lane markings, constructing a map and computing the outputs is not trivial when accuracies in the centimetre region are required. It is very unlikely that the person who painted the road managed to paint it accurately, especially on bends. But, small changes in curvature of the line have huge effects on the acceleration measurements.
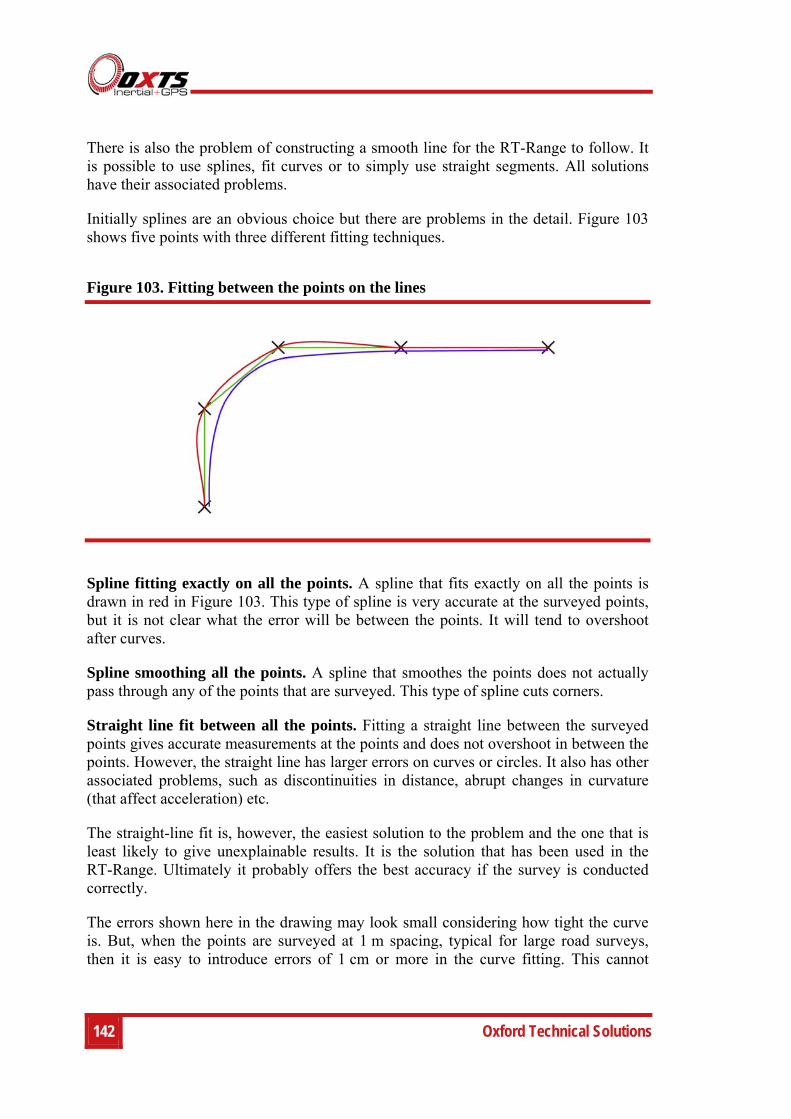
142 Oxford Technical Solutions
There is also the problem of constructing a smooth line for the RT-Range to follow. It is possible to use splines, fit curves or to simply use straight segments. All solutions have their associated problems.
Initially splines are an obvious choice but there are problems in the detail. Figure 103 shows five points with three different fitting techniques.
Figure 103. Fitting between the points on the lines
Spline fitting exactly on all the points. A spline that fits exactly on all the points is drawn in red in Figure 103. This type of spline is very accurate at the surveyed points, but it is not clear what the error will be between the points. It will tend to overshoot after curves.
Spline smoothing all the points. A spline that smoothes the points does not actually pass through any of the points that are surveyed. This type of spline cuts corners.
Straight line fit between all the points. Fitting a straight line between the surveyed points gives accurate measurements at the points and does not overshoot in between the points. However, the straight line has larger errors on curves or circles. It also has other associated problems, such as discontinuities in distance, abrupt changes in curvature (that affect acceleration) etc.
The straight-line fit is, however, the easiest solution to the problem and the one that is least likely to give unexplainable results. It is the solution that has been used in the RT-Range. Ultimately it probably offers the best accuracy if the survey is conducted correctly.
The errors shown here in the drawing may look small considering how tight the curve is. But, when the points are surveyed at 1 m spacing, typical for large road surveys, then it is easy to introduce errors of 1 cm or more in the curve fitting. This cannot
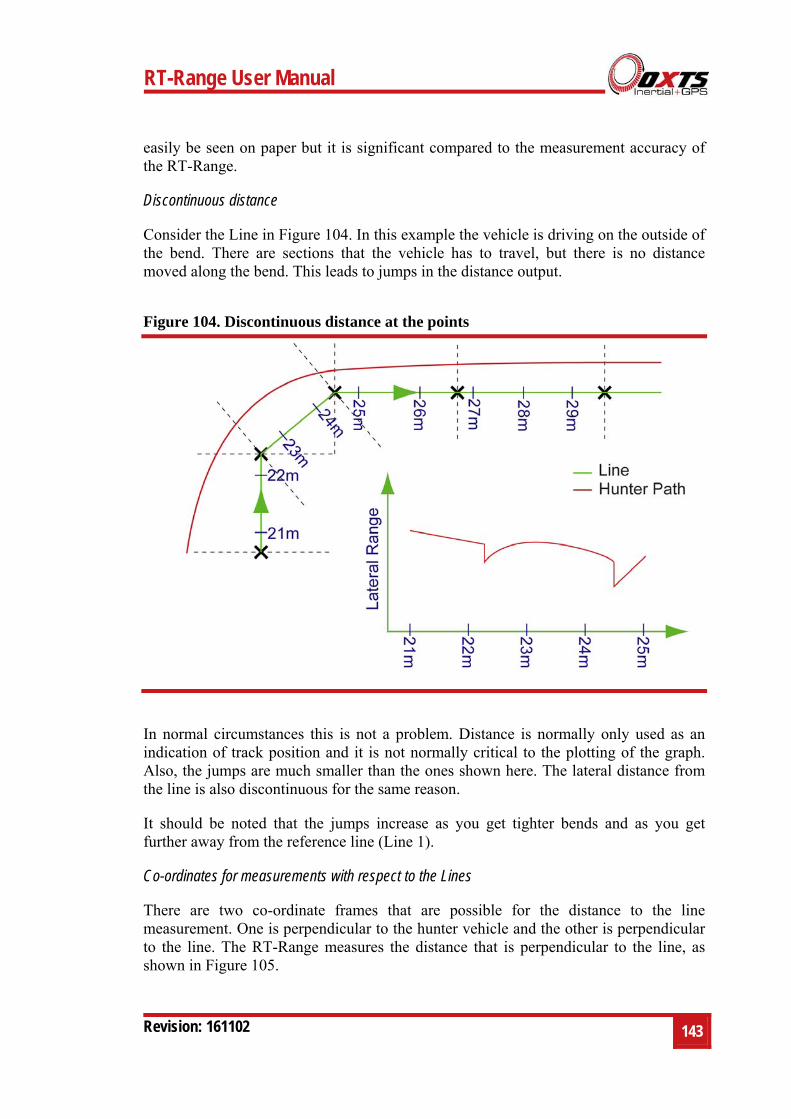
RT-Range User Manual
Revision: 161102
143
easily be seen on paper but it is significant compared to the measurement accuracy of the RT-Range.
Discontinuous distance
Consider the Line in Figure 104. In this example the vehicle is driving on the outside of the bend. There are sections that the vehicle has to travel, but there is no distance moved along the bend. This leads to jumps in the distance output.
Figure 104. Discontinuous distance at the points
In normal circumstances this is not a problem. Distance is normally only used as an indication of track position and it is not normally critical to the plotting of the graph. Also, the jumps are much smaller than the ones shown here. The lateral distance from the line is also discontinuous for the same reason.
It should be noted that the jumps increase as you get tighter bends and as you get further away from the reference line (Line 1).
Co-ordinates for measurements with respect to the Lines
There are two co-ordinate frames that are possible for the distance to the line measurement. One is perpendicular to the hunter vehicle and the other is perpendicular to the line. The RT-Range measures the distance that is perpendicular to the line, as shown in Figure 105.
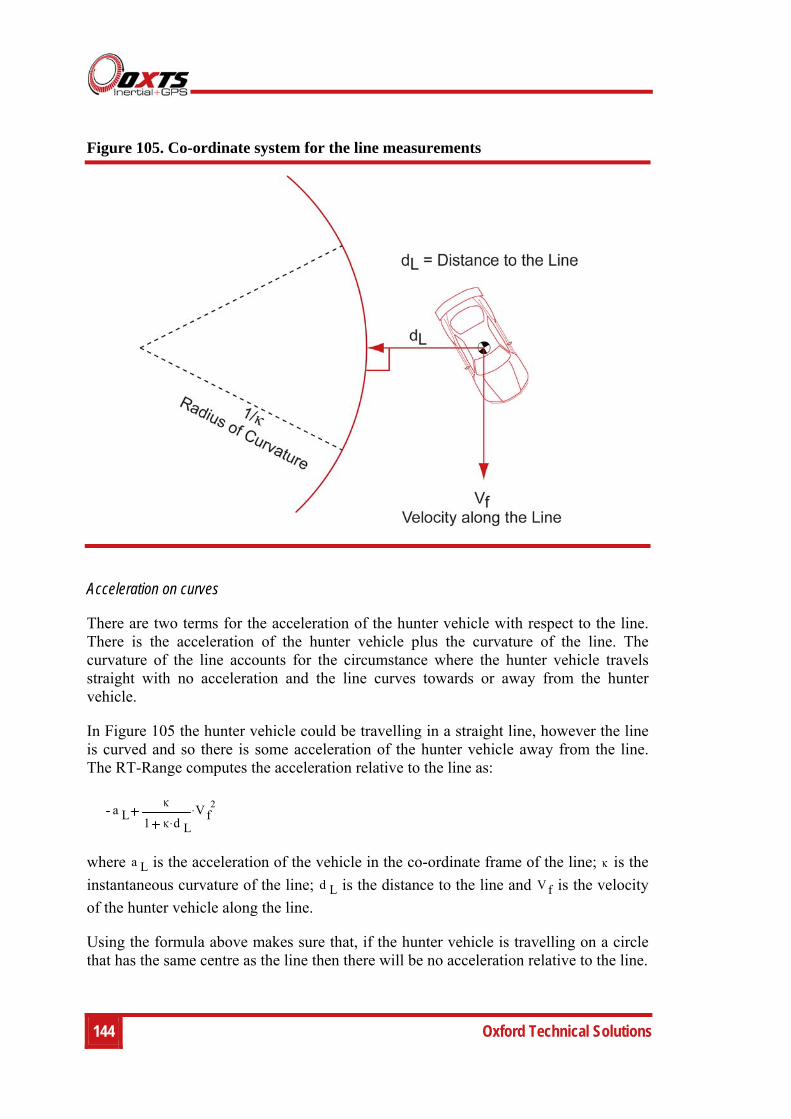
144 Oxford Technical Solutions
Figure 105. Co-ordinate system for the line measurements
Acceleration on curves
There are two terms for the acceleration of the hunter vehicle with respect to the line. There is the acceleration of the hunter vehicle plus the curvature of the line. The curvature of the line accounts for the circumstance where the hunter vehicle travels straight with no acceleration and the line curves towards or away from the hunter vehicle.
In Figure 105 the hunter vehicle could be travelling in a straight line, however the line is curved and so there is some acceleration of the hunter vehicle away from the line. The RT-Range computes the acceleration relative to the line as:
a L
1 d L
V f2
where a L is the acceleration of the vehicle in the co-ordinate frame of the line; is the
instantaneous curvature of the line; d L is the distance to the line and Vf is the velocity
of the hunter vehicle along the line.
Using the formula above makes sure that, if the hunter vehicle is travelling on a circle that has the same centre as the line then there will be no acceleration relative to the line.
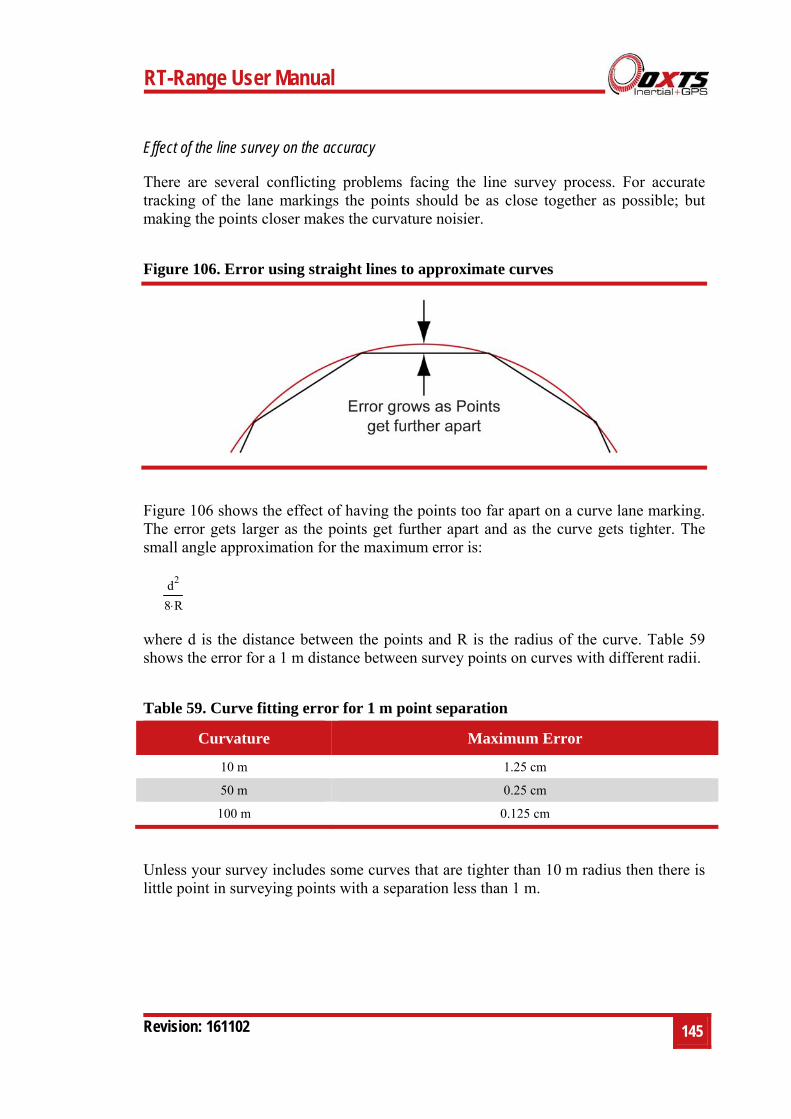
RT-Range User Manual
Revision: 161102
145
Effect of the line survey on the accuracy
There are several conflicting problems facing the line survey process. For accurate tracking of the lane markings the points should be as close together as possible; but making the points closer makes the curvature noisier.
Figure 106. Error using straight lines to approximate curves
Figure 106 shows the effect of having the points too far apart on a curve lane marking. The error gets larger as the points get further apart and as the curve gets tighter. The small angle approximation for the maximum error is:
d2
8 R
where d is the distance between the points and R is the radius of the curve. Table 59 shows the error for a 1 m distance between survey points on curves with different radii.
Table 59. Curve fitting error for 1 m point separation
Curvature Maximum Error
10 m 1.25 cm
50 m 0.25 cm
100 m 0.125 cm
Unless your survey includes some curves that are tighter than 10 m radius then there is little point in surveying points with a separation less than 1 m.
146 Oxford Technical Solutions
The noise on the curvature depends on speed. The faster you travel, the noisier the acceleration becomes. The instantaneous error in acceleration is:
2 e V2
d2
where e is the survey error, V is the velocity of the hunter vehicle and d is the distance between the survey points.
For a 1 cm survey error on a vehicle travelling at 20 m/s (72 km/h) and a distance between survey points of 1 m the instantaneous error in acceleration is 8 m/s ². To make the acceleration acceptable a considerable amount of filtering will be required, the survey will need to be more accurate than 1 cm or the separation will need to be more than 1 m.
Rules for the Clean Up Line tool in the Map Creation Wizard
The points above, relating to the effects of the survey on the accuracy have been used to set some rules of the Clean Up Line tool. We would recommend using a point spacing of 1 m or 2 m, but the Clean Up Line tool will accept points with a separation down to 0.5 m.
For straight lines the acceleration becomes unacceptably noisy when the angle between the points exceeds about 0.5 degrees. However, this is not acceptable as a limit since a 10 m radius bend with a point separation of 1 m has a 5.7 degree angle between the lines. The limit, therefore, for the Clean Up Line tool has been set at 5.7 degrees.
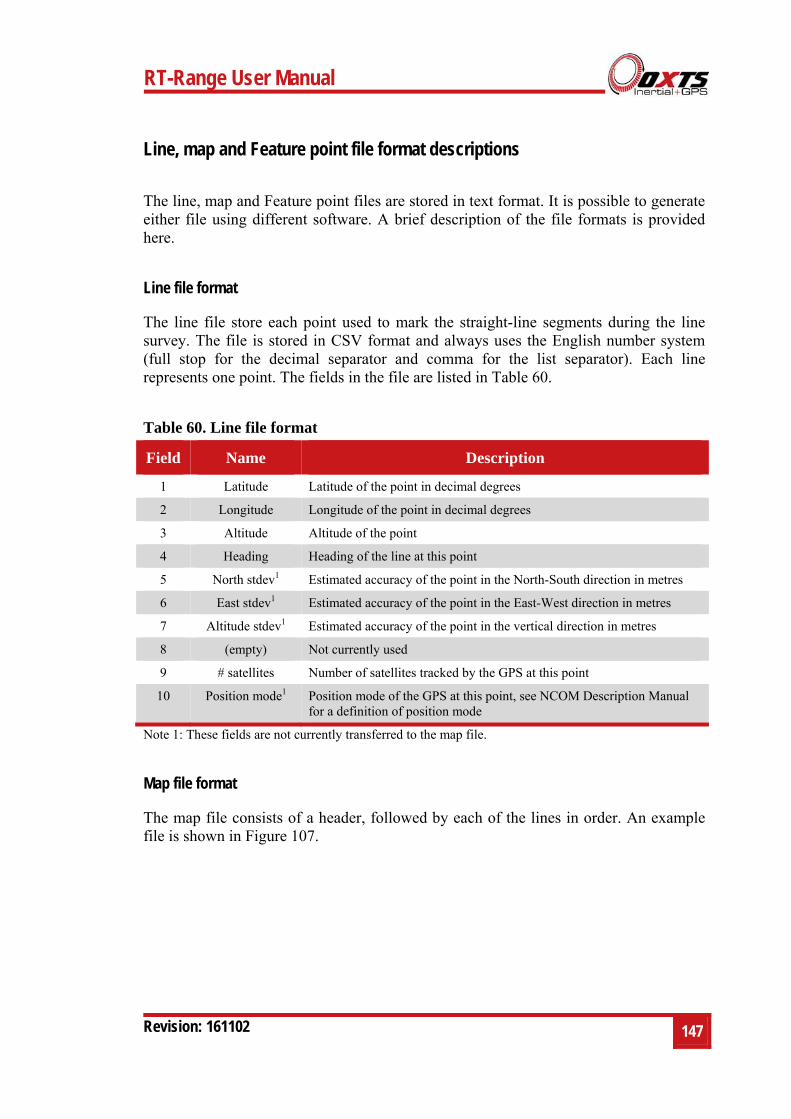
RT-Range User Manual
Revision: 161102
147
Line, map and Feature point file format descriptions
The line, map and Feature point files are stored in text format. It is possible to generate either file using different software. A brief description of the file formats is provided here.
Line file format
The line file store each point used to mark the straight-line segments during the line survey. The file is stored in CSV format and always uses the English number system (full stop for the decimal separator and comma for the list separator). Each line represents one point. The fields in the file are listed in Table 60.
Table 60. Line file format
Field Name Description
1 Latitude Latitude of the point in decimal degrees
2 Longitude Longitude of the point in decimal degrees
3 Altitude Altitude of the point
4 Heading Heading of the line at this point
5 North stdev1 Estimated accuracy of the point in the North-South direction in metres
6 East stdev1 Estimated accuracy of the point in the East-West direction in metres
7 Altitude stdev1 Estimated accuracy of the point in the vertical direction in metres
8 (empty) Not currently used
9 # satellites Number of satellites tracked by the GPS at this point
10 Position mode1 Position mode of the GPS at this point, see NCOM Description Manual for a definition of position mode
Note 1: These fields are not currently transferred to the map file.
Map file format
The map file consists of a header, followed by each of the lines in order. An example file is shown in Figure 107.
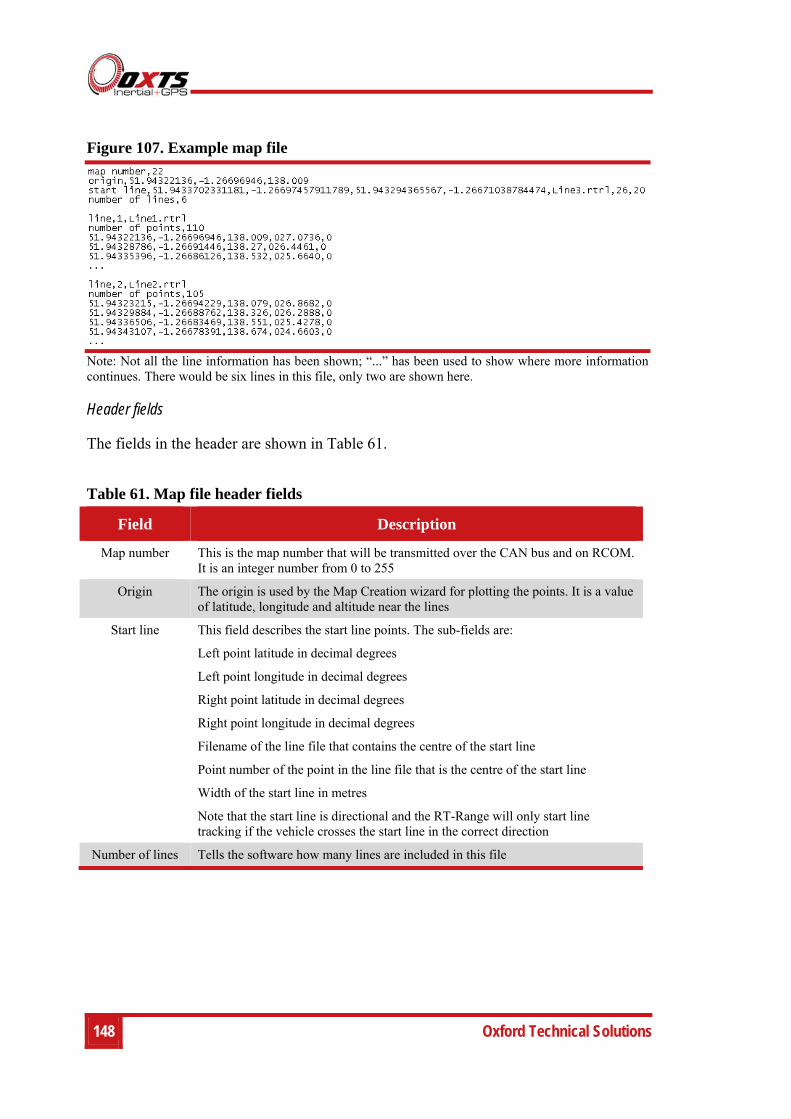
148 Oxford Technical Solutions
Figure 107. Example map file
Note: Not all the line information has been shown; “...” has been used to show where more information continues. There would be six lines in this file, only two are shown here.
Header fields
The fields in the header are shown in Table 61.
Table 61. Map file header fields
Field Description
Map number This is the map number that will be transmitted over the CAN bus and on RCOM. It is an integer number from 0 to 255
Origin The origin is used by the Map Creation wizard for plotting the points. It is a value of latitude, longitude and altitude near the lines
Start line This field describes the start line points. The sub-fields are:
Left point latitude in decimal degrees
Left point longitude in decimal degrees
Right point latitude in decimal degrees
Right point longitude in decimal degrees
Filename of the line file that contains the centre of the start line
Point number of the point in the line file that is the centre of the start line
Width of the start line in metres
Note that the start line is directional and the RT-Range will only start line tracking if the vehicle crosses the start line in the correct direction
Number of lines Tells the software how many lines are included in this file
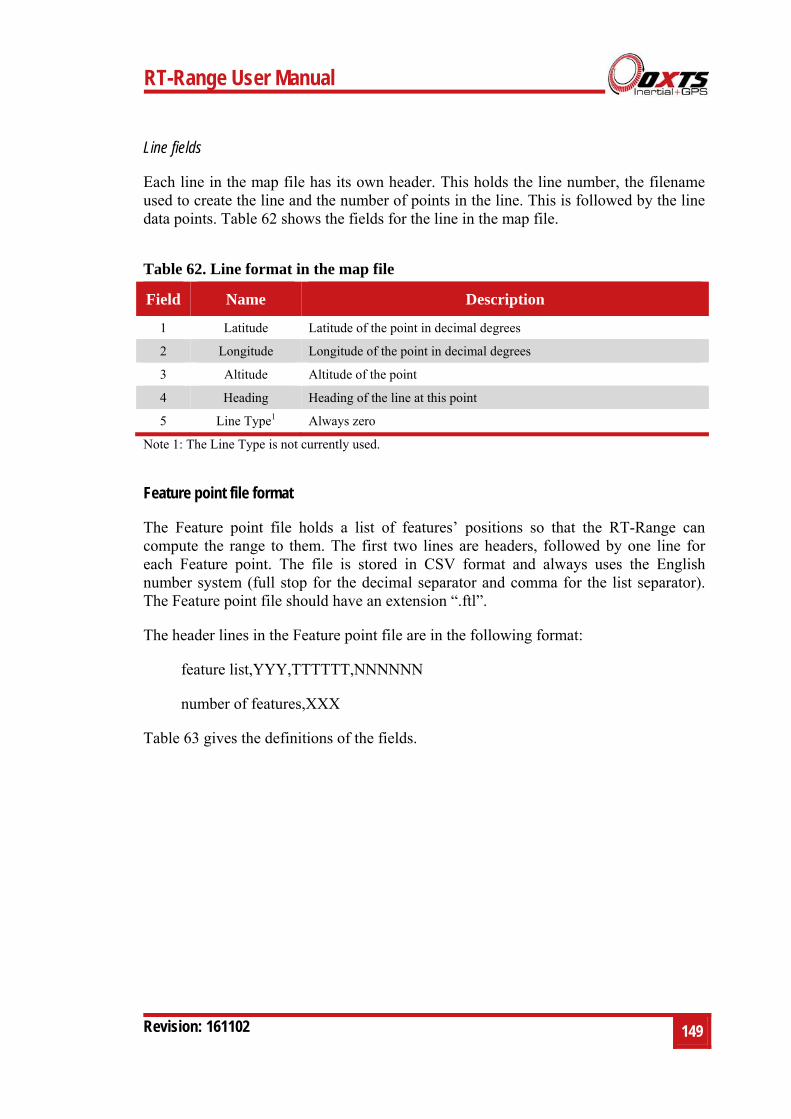
RT-Range User Manual
Revision: 161102
149
Line fields
Each line in the map file has its own header. This holds the line number, the filename used to create the line and the number of points in the line. This is followed by the line data points. Table 62 shows the fields for the line in the map file.
Table 62. Line format in the map file
Field Name Description
1 Latitude Latitude of the point in decimal degrees
2 Longitude Longitude of the point in decimal degrees
3 Altitude Altitude of the point
4 Heading Heading of the line at this point
5 Line Type1 Always zero
Note 1: The Line Type is not currently used.
Feature point file format
The Feature point file holds a list of features’ positions so that the RT-Range can compute the range to them. The first two lines are headers, followed by one line for each Feature point. The file is stored in CSV format and always uses the English number system (full stop for the decimal separator and comma for the list separator). The Feature point file should have an extension “.ftl”.
The header lines in the Feature point file are in the following format:
feature list,YYY,TTTTTT,NNNNNN
number of features,XXX
Table 63 gives the definitions of the fields.
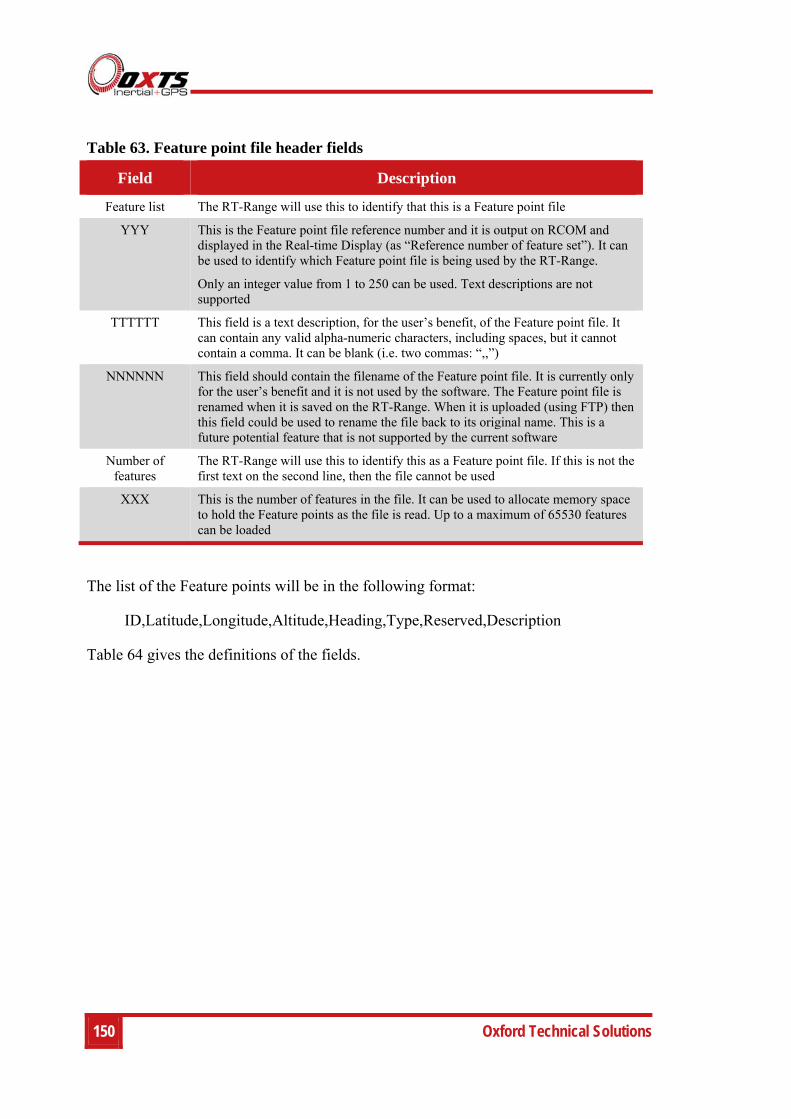
150 Oxford Technical Solutions
Table 63. Feature point file header fields
Field Description
Feature list The RT-Range will use this to identify that this is a Feature point file
YYY This is the Feature point file reference number and it is output on RCOM and displayed in the Real-time Display (as “Reference number of feature set”). It can be used to identify which Feature point file is being used by the RT-Range.
Only an integer value from 1 to 250 can be used. Text descriptions are not supported
TTTTTT This field is a text description, for the user’s benefit, of the Feature point file. It can contain any valid alpha-numeric characters, including spaces, but it cannot contain a comma. It can be blank (i.e. two commas: “,,”)
NNNNNN This field should contain the filename of the Feature point file. It is currently only for the user’s benefit and it is not used by the software. The Feature point file is renamed when it is saved on the RT-Range. When it is uploaded (using FTP) then this field could be used to rename the file back to its original name. This is a future potential feature that is not supported by the current software
Number of features
The RT-Range will use this to identify this as a Feature point file. If this is not the first text on the second line, then the file cannot be used
XXX This is the number of features in the file. It can be used to allocate memory space to hold the Feature points as the file is read. Up to a maximum of 65530 features can be loaded
The list of the Feature points will be in the following format:
ID,Latitude,Longitude,Altitude,Heading,Type,Reserved,Description
Table 64 gives the definitions of the fields.
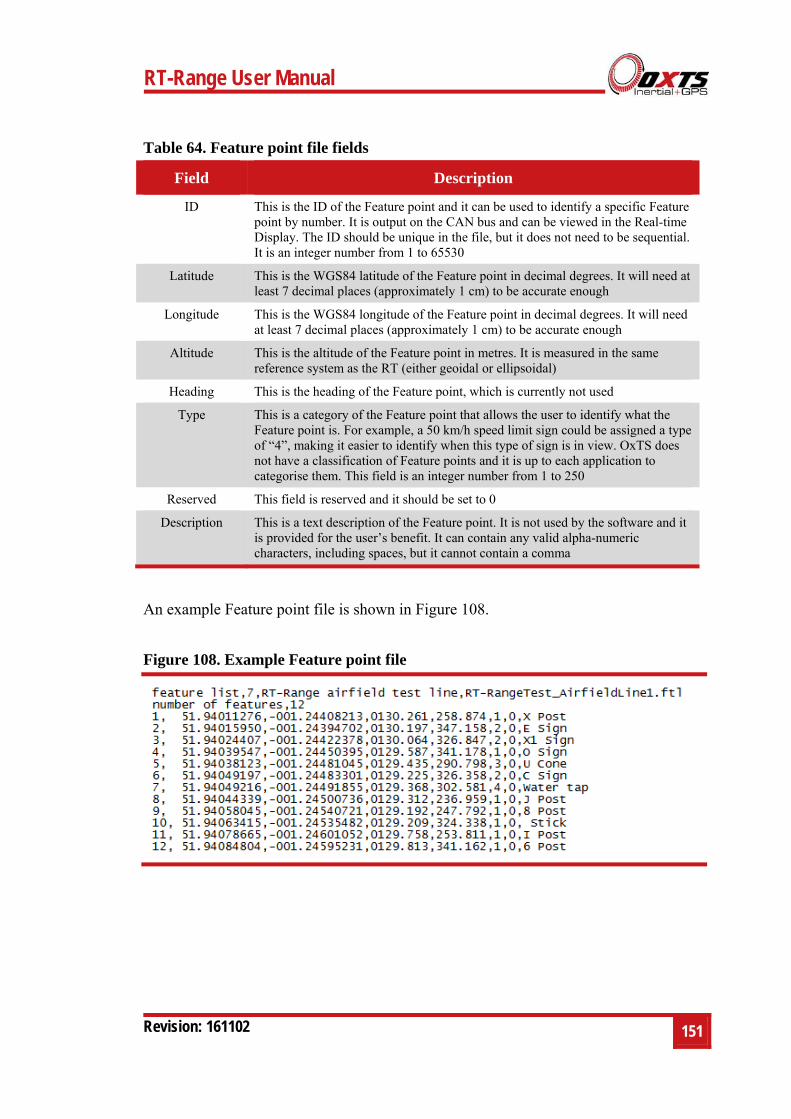
RT-Range User Manual
Revision: 161102
151
Table 64. Feature point file fields
Field Description
ID This is the ID of the Feature point and it can be used to identify a specific Feature point by number. It is output on the CAN bus and can be viewed in the Real-time Display. The ID should be unique in the file, but it does not need to be sequential. It is an integer number from 1 to 65530
Latitude This is the WGS84 latitude of the Feature point in decimal degrees. It will need at least 7 decimal places (approximately 1 cm) to be accurate enough
Longitude This is the WGS84 longitude of the Feature point in decimal degrees. It will need at least 7 decimal places (approximately 1 cm) to be accurate enough
Altitude This is the altitude of the Feature point in metres. It is measured in the same reference system as the RT (either geoidal or ellipsoidal)
Heading This is the heading of the Feature point, which is currently not used
Type This is a category of the Feature point that allows the user to identify what the Feature point is. For example, a 50 km/h speed limit sign could be assigned a type of “4”, making it easier to identify when this type of sign is in view. OxTS does not have a classification of Feature points and it is up to each application to categorise them. This field is an integer number from 1 to 250
Reserved This field is reserved and it should be set to 0
Description This is a text description of the Feature point. It is not used by the software and it is provided for the user’s benefit. It can contain any valid alpha-numeric characters, including spaces, but it cannot contain a comma
An example Feature point file is shown in Figure 108.
Figure 108. Example Feature point file
152 Oxford Technical Solutions
RT-Range and the Ibeo feature fusion ADAS reference-system
The integration of the RT-Range and RT-Range S systems with Ibeo laser scanner environment perception allows test drives in public traffic.
All relevant objects are displayed in every situation. It can be automatically determined if and how well the target vehicle is visible to an on-board sensor-under-test. Incorrect measurements on vehicles other than the target vehicle can be reliably detected. Occlusion of the target vehicle, for example by pedestrians and the like, can be reliably detected and displayed.
Introduction to the Ibeo Feature Fusion System
The Ibeo Feature Fusion is a Lidar based system. It fuses between 2 and 6 sensors mounted on the vehicle. With 6 sensors, a 360° view around the vehicle is possible.
The Feature Fusion System provides data such as:
Raw distance data for each scan point containing:
o position of the scan point
o width (i.e. duration) of the echo pulse
o scan layer and echo number (multi-target capability)
Objects:
o position of the object
o object tracking
o size and orientation
o velocity
o classification (car, bike, truck, pedestrian, unknown big, unknown small)
Benefits of adding the Ibeo Feature Fusion System to the RT-Range system
The key features of adding the Ibeo Feature Fusion System are:
RT-Range User Manual
Revision: 161102
153
1. Ibeo with RT-Range integration permits visualization of RT-Range data with Ibeo Laser View (ILV) – a very sophisticated visualization and playback tool. ILV is described in greater detail in the next section.
2. Providing information about the environment and all other vehicles. This allows data recording on public roads, not only empty test tracks.
3. Automatic calculation of visibility and occlusion of all target vehicles from the point of view of both, the laser scanners and a configurable Device under Test (DuT)
4. Blending of data from both RT-Range and Ibeo laser scanners to achieve better accuracy than is possible with either system, and to provide measurements even when the target(s) are not visible to lasers.
5. Rapid set up of RT-Range Target systems in target vehicles: utilising automatic
parameter calibration and shape recognition.
Ibeo Laser View (ILV) visualization
The Ibeo visualization of a Feature Fusion System fused with an RT-Range system is shown in Figure 109. It shows the scenario from above (bird view).
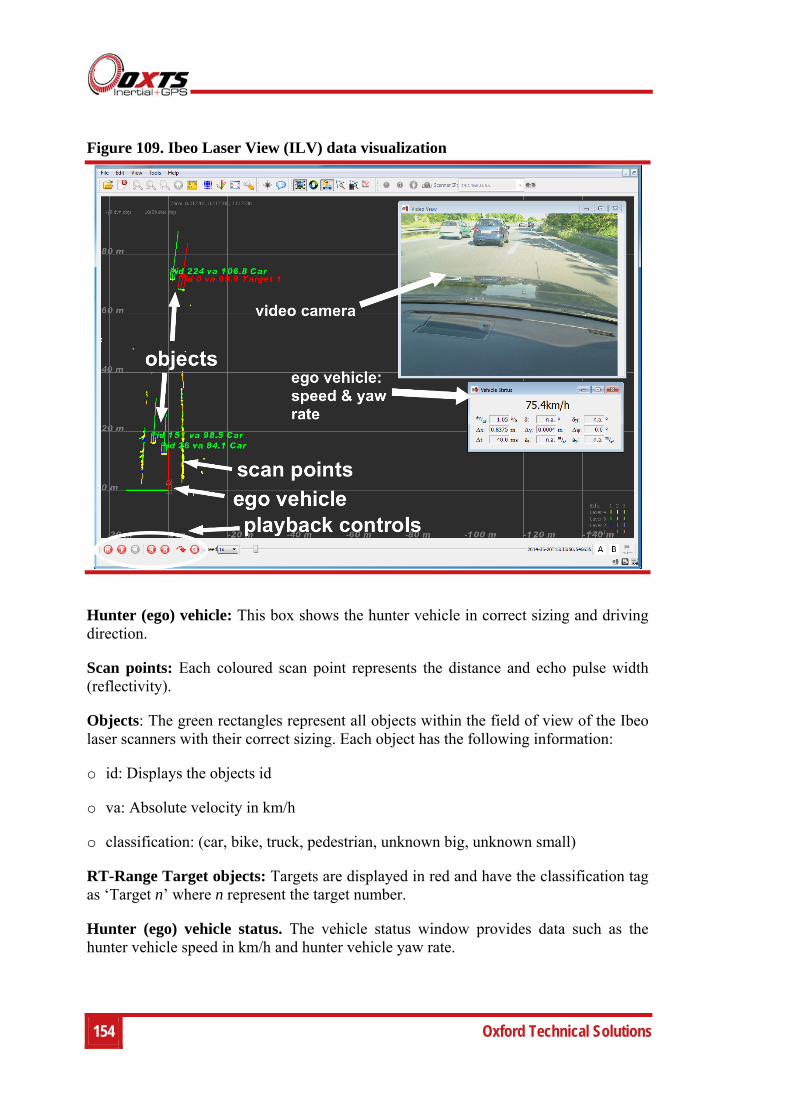
154 Oxford Technical Solutions
Figure 109. Ibeo Laser View (ILV) data visualization
Hunter (ego) vehicle: This box shows the hunter vehicle in correct sizing and driving direction.
Scan points: Each coloured scan point represents the distance and echo pulse width (reflectivity).
Objects: The green rectangles represent all objects within the field of view of the Ibeo laser scanners with their correct sizing. Each object has the following information:
o id: Displays the objects id
o va: Absolute velocity in km/h
o classification: (car, bike, truck, pedestrian, unknown big, unknown small)
RT-Range Target objects: Targets are displayed in red and have the classification tag as ‘Target n’ where n represent the target number.
Hunter (ego) vehicle status. The vehicle status window provides data such as the hunter vehicle speed in km/h and hunter vehicle yaw rate.

RT-Range User Manual
Revision: 161102
155
Video camera window: The video camera window displays the recorded video image of a camera installed in the ego vehicle. This video data is not used by object tracking; its purpose is only the visualization.
For more information about the Ibeo-OxTS integration, please refer to the Ibeo-OxTS Integration Customer Documentation and the Ibeo Feature Fusion Customer Documentation which is available from Ibeo Automotive Systems GmbH http://www.ibeo-as.com/contact.html
156 Oxford Technical Solutions
Revision history
Table 65. Revision history
Revision Comments
051018 Initial Version
051114 Typing Corrections
051118 More Corrections and change of CAN IDs to 7A0h/7B0h range
060803 Updated for new RT-Range box
061211 Software changes
070611 Software changes
071214 Software change. Logging added; Longitudinal Offset added; Wireless LAN SSID and IP Address added
080613 Added multiple Targets
081212 Added Fixed point from RT; Post-processing measurements from Targets. Changed packing lists for new Wireless LAN antenna
090619 Removed optional SATEL radio. Added ABD robot connection. Survey Trolley Installation moved and improved. Clarified workflow for post-processing. Added Line File and Map File formats. Changes for the latest software
090917 Added Survey Trolley Assembly section
100426 Added velocity compared to lines; time gap. Added lateral offsets. Added maps in Bird’s Eye View. Changed RCOM logging. Added RT2000 product references
110228 Added polygons; hidden targets; hunter measurement plane; target status on CAN bus; range accuracy outputs; lane heading and curvature; additional lane measurements from points B/C; lane heartbeat message; start line in logging window
121121 Corrections to CAN messages (default identifiers, offsets and description). Added Fixed point heading and Feature point ID, type, position and heading to CAN outputs. Updated software screenshots and description to include Feature points, Fixed point polygons. Added description about adding multiple line files. Changes to Configure Display
131210 Increased polygon points to 24. Updated ABD robot interface. Increased field of view range to 500 m. Added CAN pin assignments. Other minor updates
140611 Modified to incorporate RT-Range S system. Wiring, configuration drawings, specification changes and conformance notices
140802 Updated with information about the Ibeo fusion system. Added move table scaling
141202 Updated for real-time CAN acquisition. RT-Range front panel connections, new images and other minor revisions
151010 Added Hunter polygon, added new acceleration filters, updated styles, GUI updates
161102 Feature point Survey Wizard added, updated Data Logger section and Bird’s Eye view
Related Documents