Analytical Science A course (in 15 Chapters), developed as an Open Educational Resource, designed for use at 2 nd year England & Wales undergraduate level and as a CPD training resource Author Brian W Woodget Owner Royal Society of Chemistry Title Chapter 2 – „Analytical Process Model‟ unit 3 - Sampling Classification F180, Analytical Chemistry Keywords ukoer, sfsoer, oer, open educational resources, metadata, analytical science, cpd training resource, analytical chemistry, measurement science, analytical process, sampling of solids and liquids and gases, Description A consideration of the important 3 rd unit in the „Analytical Process‟ model – „Sampling‟. The programme considers many real-life sampling situations and describes what needs to be done to obtain a representative sample.‟ Creative Commons licence http://creativecommons.org/licenses/by-nc-nd/2.0/uk/ Language English File size 2.5 Mbytes File format Microsoft PowerPoint (1997 – 2003) https://edocs.hull.ac.uk/muradora/objectView.action?parentId=hull%3A2199&type=1&start=10&pid=hull%3A2351 © Royal Society of Chemistry 2010

Welcome message from author
This document is posted to help you gain knowledge. Please leave a comment to let me know what you think about it! Share it to your friends and learn new things together.
Transcript

Analytical ScienceA course (in 15 Chapters), developed as an Open Educational Resource, designed for use at 2nd year England & Wales undergraduate level and as a CPD training resource
Author Brian W Woodget
Owner Royal Society of Chemistry
Title Chapter 2 – „Analytical Process Model‟ unit 3 - Sampling
Classification F180, Analytical Chemistry
Keywords ukoer, sfsoer, oer, open educational resources, metadata, analytical science, cpd
training resource, analytical chemistry, measurement science, analytical process,
sampling of solids and liquids and gases,
Description A consideration of the important 3rd unit in the „Analytical Process‟ model – „Sampling‟.
The programme considers many real-life sampling situations and describes what
needs to be done to obtain a representative sample.‟
Creative Commons licence http://creativecommons.org/licenses/by-nc-nd/2.0/uk/
Language English
File size 2.5 Mbytes
File format Microsoft PowerPoint (1997 – 2003)
https://edocs.hull.ac.uk/muradora/objectView.action?parentId=hull%3A2199&type=1&start=10&pid=hull%3A2351
© Royal Society of Chemistry 2010

2
Chapter 2: „Analytical Process‟ unit 3 - Sampling
Topic Contents Slide numbers
The analytical process
model
3 - 4
Introduction to
sampling
Generic sampling procedures: Design of a sampling
plan: Sampling methods: Sub-sampling routines:
Sample preservation, storage &transport.
5 - 28
Sampling of solid
materials
Soil sampling: Sampling from large heaps: Dynamic
sampling: Sampling of pharmaceuticals
29 - 44
Sampling of liquids Liquids flowing within defined boundaries: Sampling
from oceans and deep-water lakes: Sampling of water
from open locations: Sampling from closed containers
45 - 54
Sampling of gases,
vapours and aerosols
Atmospheric sampling: Grab sampling: Continuous
sampling: Sampling from particulate matter: Sampling
of inhalers
55 - 77
Questions
Outline answers to
questions
78
78 - 84
Contents

33
The analytical process model – revision slide
Any analysis may be considered as consisting of a maximum of seven unit
processes. These are shown diagrammatically and descriptively below:
1 2 3 4 5 6 7
Unit 1. Consider the problem and decide on the objectives
Unit 2. Select procedure to achieve objectives
Unit 3. Sampling
Unit 4. Sample preparation
Unit 5. Separation and/or concentration
Unit 6. Measurement of target analytes
Unit 7. Evaluation of the data, have the objectives been met?

44
Process unit 3 – sampling
1 2 3 4 5 6 7
Sampling is the most important stage in the analytical process and is the stage
likely to produce the highest proportion of the total error („uncertainty‟) in any
analysis. Great care therefore needs to be exercised when taking samples, in
order to minimise this error component. A sample should be „representative‟ of
the bulk from which it was removed, and once taken, should be stored in
such a way such that it retains it‟s „integrity‟ (not alter it‟s structure or lose
components) prior to the analysis being carried out.
* see ‘Glossary of Terms’

55
Introduction
Because of the ever increasing number of analyses required, combined with the
increasing complexity of the samples to be analysed and the need for rapid
(if not instant) results, new sciences, technologies and methodologies are
continually being developed. Except in a few instances, current instrumentation has
not as yet evolved to the point where it is possible to take an analytical instrument to
an object or material to be analysed and for all of the required information to be
obtained [eg: a tricorder in Star Trek].
Most analytical measurements are thus still made by removing a portion or part of
the material to be analysed [termed the sample] and taking it to a laboratory for
analysis. Analytical measurements are thus being made not on the material itself,
but on the sample portion that has been taken from the material to be analysed
It is essential therefore, that if the results of the analysis are to be meaningful,
the utmost care must be taken when selecting the sample for analysis.

66
The act of sampling would pose very few problems if all materials etc. that were to
be sampled were known to be, or could be considered to be, homogeneous.
Unfortunately in the „real world‟ this is rarely the case. Homogeneous in this
instance refers to both the constitution of the material to be sampled (components
and substances that are present) and the state in which they exist (particle size for
instance). Gases and liquids are often considered to be homogeneous, but this
assumption is only likely to be valid when small fixed quantities of these are to be
sampled.
Example: a 1l bottle of a single-phase liquid may be shaken thoroughly to ensure
homogeneity and from then on, even the smallest sample taken from the bottle will
constitute a representative sample.
Solid matrices (eg: tablets, soils, minerals etc.) should normally be considered as
heterogeneous, although the extent of heterogeneity may vary considerably. The
more heterogeneous the matrix the larger the sample size needed to constitute a
representative sample
Definition of a representative sample
A portion of a material taken from a consignment and selected in such a
way that it possesses the essential characteristics of the bulk

77
As will become evident later, particularly with samples of solid matrices, once the
initial sample has been taken, there are likely to be a number of additional sub-
sampling stages prior to analysis being carried out. It is imperative that at each
of these additional stages, sample representation is maintained such that
the portion of the material eventually analysed still remains representative
of the bulk of the material from which it was originally taken.
It is essential that once the sample has been taken, the integrity of that sample
is then maintained through to analysis
Definition of integrity
Integrity in this context, refers to the structure and composition of the sample
being the same when analysed as when it was taken
Example: losses of volatile components or oxidation of metallic components
to higher valence states would constitute a loss of sample integrity, thereby
invalidating the analysis due to loss of sample representation. It is therefore
Imperative that care is taken with the storage of samples, so that sample
integrity is maintained.

88
Sampling introduction – reflection
Most analysis are carried out on sample portions of the material that
requires analysis
Most matrices should be considered at heterogeneous rather than
homogeneous
The greater the extent of heterogeneity, the larger the sample size
required
Sample must be taken so that they are representative of the material
being sampled
Samples must be stored appropriately so that sample integrity is
maintained

99
Generic sampling procedures
Definition of ‘Sampling procedure‟
The succession of steps set out in a specification, which ensures that the sample
eventually taken for analysis shall possess the essential characteristics of the bulk
A sampling procedure may involve many steps before the analysis for the target
analytes is carried out. It cannot be over-emphasised that as the size of the
analytical sample maybe only a gram or so and that this in turn may relate to many
tonnes of original material, great care must be exercised at all procedural stages
to ensure that representation is maintained
There are many terms that are regularly used in sampling terminology. These are:
The relationship between these terms is shown on the next slide
Consignment Sub-sample
Sampling unit Laboratory sample
Increment Test Sample
Composite/aggregate/gross sample Samples for analysis

101010101010
Figure 2.0 relationship between sampling terms
A consignment may consist of
a number of sampling units.
An increment is that portion
removed from the sampling
unit. The increments may be
analysed separately, but more
likely be combined to produce
a composite sample. This
composite sample will
generally be too large and will
thus need to be sub-sampled
before transfer to the
laboratory for analysis. The
laboratory sample is in turn
sub-sampled to produce a test
sample and samples for
analysis. Where sampling
units are very large, it may be
necessary to take more than
one increment from each unit
Note: definitions of all terms in bold blue may be found in the ‘Glossary of Terms’

1111
Design of a sampling planDefinition of a Sampling Plan
A predetermined procedure for the selection, withdrawal, preservation,
transportation and preparation of samples taken for analysis
The design of a sampling plan, is the logical next step following identification of the
objectives for carrying out the analysis and decision on the analytical procedures to
be adopted. Devising a sampling plan requires five further decisions to be made:
Identify sampling locations
Decide on the number of increments to be taken and the methods by which they
will be taken
Select suitable sub-sampling routines in order to produce the laboratory sample
Select methods for sample preservation, storage and transport
Be prepared to review the plan in the light of experience and experimentation
The sampling plan will need to take into account, the reasons for the analysis and
particularly how accurate the final analytical measurement needs to be. An
analytical measurement with wide specification limits require a less accurate and
careful sampling procedure than one with narrow specification limits.

1212
Identify sampling locationsThis is one of the most difficult decisions to be made when devising a sampling plan
Although relevant literature (Analytical journals for instance) will be able to provide
some guidance, common sense will also prove useful, as will an understanding of
statistics.
Example: Consider a warehouse containing a consignment of separate pallets,
each pallet containing 64 boxes (sampling units) of tinned meat imported from
outside the European Union. The consignment needs to be monitored for particular
bacteria, growth promoters and heavy metals. The decision has to be made as to
which boxes are to sampled and then which tins inside each box are to
be sampled. Common sense denotes that it would be wrong to choose all of the
tins to be analysed from those boxes which were the easiest to reach as this
introduces individual bias into the decision making process. To eliminate possible
bias, all of the boxes must have an equal chance of being sampled. Thus the
boxes should all be mentally or physically numbered and then selected by using a
set of random number tables. Once the boxes have been selected, a similar
process can be used to select individual cans for analysis.

1313
Increments Having identified the sampling location(s) the following decisions need to be made:
How many increments to take from each sampling unit;
How will these be taken.
The number of increments will depend upon:
The overall size of the consignment – the larger the consignment the greater
the number of increments required.
How heterogeneous the consignment is considered to be – the greater the
heterogeneity, the greater the number of increments.
The accuracy required for the final analytical measurement – the larger the
measurement uncertainty to be allowed, the smaller the number of increments
and vice-versa.
Remember that increments can be combined together (to produce a composite
sample) or analysed separately. Separate analysis will produce a more accurate
answer, but can be considerably more expensive.

1414
Sampling methodsThis term refers to both the tools to be used to collect the samples and the sampling
situation – is the system to be sampled static or dynamic (in motion)?
Example of a dynamic sampling situation
Consider for instance a grain silo, where the grain inside the
silo needs to be analysed for traces of pesticides. Figure (2.1)
shows a typical grain silo, effectively a sealed unit, which would
be extremely difficult to sample. The preferred sampling plan
would therefore be to take samples of the grain whilst it is
being transferred to trucks, lorries etc. This would relate to a
product in motion, and samples (increments) would be taken
at fixed time intervals dependent upon the number of
samples considered necessary to produce an outcome
of acceptable accuracy. The number of increments to be
selected would depend upon past experience, or from results
obtained during the development stage of the sampling
programme.
Figure (2.1)

151515151515
Sampling methods for static sampling situations
Sampling methods for static sampling, generally refer to the tools that are used to
collect samples. Specialist tools are available to enable samples to be taken from a
variety of possible matrices. Considering solid matrices for example there are:
Scoops for sampling general heaps;
Devices for cross sectional sampling from drums of powder or tablets;
Grab type sampler for sampling river, lake and sea beds;
Spears for depth sampling from grain stores.
Similarly, there are range of sampling tools designed for liquid matrices, for example
Depth samplers for sampling of liquids in drums;
Weighted bottles for depth sampling of deep water courses.
In highlighting specialist sampling equipment, it is important not to forget the possible
use of simple clean glass apparatus (beakers, bottles etc.), spatulas, spades and
shovels etc. when appropriate. Diagrams and photographs to illustrate some of
these are shown on the next five slides

1616
Figure (2.2) shows a typical sampling scoop with
high sides, to prevent any of the sample taken, from
being lost during transference. The letters [a – e],
refer to dimensions recommended for specific
sampling purposes. In general, the smaller the
average particle size, the smaller the overall
capacity of the scoop.
Fig 2.2 – sampling scoop for
solid materials
Fig 2.3 – cross sectional sampler
for sampling of powders and small
particles
Outer tube Inner tube
Concentric holes
The device shown in Figure (2.3) consists of two
tubes, one sitting tightly inside the other. The
tube is pointed to aid insertion into the unit to be
sampled, and both tubes have holes at
corresponding positions. The device is inserted
with the inner holes closed. When a suitable
sampling position has been reached, the inner
tube [shown in red] is rotated to open the inner set
of holes. The grains, powder etc. then enter the
inner tube. The holes are then closed again and
the sample withdrawn.

1717
Sampling slot
In spear
Outer tube coverFig 2.4 – spear device
for vertical sampling of
grains
In the sampling device shown in
Figure (2.4), the spear is forced
into the mound of grain to be
sampled, with the sampling slot
shown, covered by the outer tube.
On attempting to remove the spear
the cover is displaced and the
grain then enters the hollow sampling
tube. This device thus allows for
samples to be taken from a range
of depths from the grain store.

1818
Figures (2.5) & (2.6) show a device used to take sediment samples from a sea bed.
The device is lowered into the sea using a winch. The semi-circular metal jaws shown
In figure (2.5) are in the open position. They are securely locked together when the
device is lowered into the water. Attached to them is a secure but flexible cord. When
the metal frame has settled on the sea bed, the line is held taut and a lead weight
dropped down on the line. When the lead weight hits the metal frame, it causes the
jaws to snap shut. Given the semi-circular design of these jaws, it is able to capture
a sample of the sediment. The whole is then hauled to the surface, for the sample to
be removed dried and separated.
Fig 2.5 – grab sampler for sampling
ocean beds
Fig 2.6 – sample of ocean bed captured
by the grab sampler
Jaws in closed position Sediment sampleMetal
frame
Jaws in
open position

191919191919
The sampling device shown in Figure (2.7)
consists of a thick walled glass bottle securely
held inside a heavy lead container.
The container is lowered into the water course
to a suitable depth as measured by the
calibrated rope (shown in red). The stopper is
now opened remotely using the blue rope,
allowing water to fill the glass bottle from that
depth The spring loading at the top of the device
allows the stopper to be replaced once sufficient
time has been given for the bottle to fill. The
container is then hauled back to the surface.
The water sample is now available for analysis.
Figure 2.7 – typical bottle used for depth sampling

20
In the sampling device shown schematically in figure (2.9), the device in the open position
is lowered carefully into the tank of liquid to be sampled. The air hole at the top of the
device allows a through ‘cut’ of the liquids inside the tank to be taken as a sample. The
handle at the top of the device is now moved to the closed position which draws up the
stopper to seal the liquid sample inside the tube. This can now be withdrawn. In this
illustration the tank is shown to have two immiscible liquids represented by the two
different colours.
Figure (2.8) shows
some drums containing
a mixture of waste
chemicals. Given that
the cost and nature of
disposal will depend
upon the substances
stored in the drums,
it will be necessary to
take samples from
varying depths in order
to gain an accurate
picture of what is stored.
Fig 2.8 – drums containing waste
chemicals Fig 2.9 – open tube sampler

2121
Figure (1.6), [shown on slide 9], is a schematic representation of a typical sampling
protocol. The composite sample accumulated by combination of a number of
individual sample increments, may well be too large to send to the laboratory for
analysis and thus sub-sampling will need to take place. Further sub-sampling
may also need to be carried out within the laboratory to produce a test portion for
analysis. In both of these situations, similar techniques and procedures are likely
to be used, although the sizes of the individual pieces of equipment chosen to be
used are of course going to be different. It must be recognised that the more
times that sub-sampling occurs, the higher the uncertainty (margin of error)
in the final analysis data.
There are two methods popularly used to sub-sample solid materials:
Coning and quartering;
Riffling.
Definition of sub-sampling
Reduction in the size of samples or composite samples whilst retaining sample
representation
Sub-sampling routines

2222
Samples may require particle size reduction (comminution) prior to sub-sampling. A
range of equipment is available for this purpose. Fig 2.10 shows a laboratory version
of a typical ball mill. Larger versions of this type of equipment are also available to
handle larger quantities of materials.
Definition of ‘Comminution’
The general term used to describe processes for particle size reduction and
includes crushing, grinding, pulverising etc.
Fig 2.10 – planetary ball mill and containers
Sample is placed in the container (A) with suitable sized balls (agate in this example).
The lid is then placed on the container (B) and held tight with the plastic cap (C). The
container is then placed in the ball mill and clamped in place (D). Lid is then closed and
clamped shut. The mill is then subjected to vibration, rotation, shaking etc to facilitate
crushing and grinding of the sample.
A B C
D

2323
Fig 2.11 – schematic representation of coning and quartering
The material to be sub-sampled is placed on a clean flat surface and by using a shovel
or other suitable tool (dependent upon the quantity to be sub-sampled), the material is
formed into the shape of a cone [A]. It is particularly important to use all of the material
and that any fine particles remaining must be spread over the top of the cone. The
cone is then flattened at the top and divided approximately into four equal quarters [B
& C where C is a birds eye view of the flattened cone]. An opposite pair of quarters is
chosen either as the sample, or to form another cone, for the process to be repeated
[D, E & F]. The process is repeated until a sample of suitable size to send to the
laboratory, is obtained. It may be necessary to reduce the average particle size by
crushing, prior to forming cone (A). The size of sample normally sent to the laboratory
for analysis will be between 100 g – 1 kg and this may in turn be sub-sampled within
the laboratory to produce test portions for analysis.
Coning and quartering

2424
Riffling
The letters ‘A’, ‘B’, ‘C’ & ‘D’ refer to
dimensions for particular applications.
Increased accuracy of sub-sampling is
obtained, as the distance between the
plates is decreased
The material to be sub-sampled is crushed
such that the dimensions of all particles in
the sample are considerably less than the
distances between individual plates in the
Riffler. The sample is poured evenly across
the sample inlet and then emerges on
opposite sides in two approximately even
portions. The sample collected in one of
the boxes can then be sub-sampled again
if required.
Sample in
Sample out
Fig 2.13 – laboratory riffler
Fig 2.13 shows
a small riffler
suitable for
laboratory use.
A B
CD
Fig 2.12 – schematic diagram of a
typical riffler

2525
Sub-sampling of liquidsNo special equipment is required to sub-sample liquids, just common sense!
Liquids that appear by sight to be homogeneous, can be shaken and then a
sub-sample transferred to a clean glass or plastic bottle.
Liquid samples that contain an obvious sediment should preferable be filtered and
then treated as separate solid and liquid components. This process, although
simple in a laboratory, could prove difficult in a „field‟ situation. Sample may need
to be homogenised using shaking/stirring etc. and then sub-sampled immediately,
before the sediment is allowed to settle.
Liquid samples showing two distinct immiscible layers, are best treated as two
different samples. Before the sub-samples are removed however, it is important
to measure the relative volumes of the two layers. With this type of sample, it is
preferable for the whole of the sample to be sent to the laboratory, as they are
likely to be a in a better position to carry out representative sub-sampling.

2626
Sample preservation - storage & transport
It is vital to ensure that sample integrity is maintained between the time when the
sample was taken and when it is analysed. Many types of sample can be affected by
storage under inappropriate conditions. This is particularly the case with samples of a
biological nature, where components of the samples (eg enzymes), can cause
sample change almost as soon as the sample has been taken. Other changes that
can occur include:
Loss of volatiles – (eg: from a soil sample contaminated with hydrocarbons);
Change in speciation of the analyte – (eg: oxidation state);
Loss of trace metal ions due to adsorption onto the walls of the sample container;
Condensate from air or gas sample.
To avoid losses/changes, samples must be stored in containers appropriate to the
analyte and held at temperatures sufficient to maintain sample stability.
Use darkened glass or plastic bottles and jars, where exposure to light can affect
changes to the sample;
Store at below ambient temperatures to reduce the rate of chemical reaction
and biological activity. [Refrigeration @ 40C or freezing @ -200C]

2727
Sample containersGlass and plastic containers are both used.
Glass containers
May be clear or opaque with airtight lids – avoid rubber sealing rings or plastic
inserts. Easy to clean and are thus re-usable.
Glass usually considered as inert, however sodium, silicon & boron can all
leach from borosilicate glass
Plastic bottles
Polyethylene or polypropylene (more rigid) are normally used – avoid rubber
sealing rings
Plastic bottles may be more difficult to clean and are thus often discarded after
use.
Polyethylene bottles normally contain plasticisers that can leach into the
sample. They can also contain traces of catalysts which can contaminate acid
solutions stored for trace metal analysis.
Plastic bottles are recommended for samples that are to be frozen

2828
Sampling plans - reflection
A sampling plan is an empirical set of steps to ensure that a representative
sample is presented for analysis
It is important to pick the most appropriate sampling locations so as to avoid
individual bias
The number of increments required will depend upon the size of the
consignment being sampled, the apparent homogeneity of the consignment and
the level of uncertainty allowable for the final result.
Increments may each be analysed separately or composited together. Analysis
using composited samples will generally be less expensive overall but may be
less accurate in identifying variability of the matrix.
Samples can be taken from the consignment using appropriate readily available
tools, or in some cases by using specially designed sampling apparatus
Samples may sometimes best be taken from a dynamic (in motion) rather than a
static situation
Samples may need to be reduced in size before submitting for analysis. This
process of sub-sampling needs to be designed to retain sample representation
Important to retain sample integrity during preservation, storage & transport

2929
Sampling of solid materialsUnfortunately there is no single generic procedure that can describe the sampling
of all solid matrices. Solid matrices that require sampling include:
Sampling from large heaps – consignments transported by ship, railway
wagons, lorries;
Sampling of grains and other free-flowing solids – cereals, powders;
Sampling from bales – cotton fibres, hay, silage etc.;
Sampling of metals and alloys – extruded metals and ingots etc.
Sampling of separately packaged items – boxes, cans, sacks etc.;
Sampling of soils and sediments;
Sampling of pharmaceutical products – tablets, powders, emulsions & liquids;
Sampling of foodstuffs.
Each of these sampling situations poses a unique problem. From research and
experimentation, sampling protocols and specific pieces of equipment have been
designed, that can facilitate the taking of representative samples and thereby
provide reliable analytical data.
The next few slides show examples of sampling procedures for some of these
situations

3030
Sample variabilityThe two diagrams Figures (2.14) & (2.15) show two extremes of sample variability
Figure (2.14) shows a grab sample of sediment
from an area of the North Sea. The variability of
the sample is evident, the sample containing
stones and pieces of shell in addition to the sediment.
Given that the objective of the analysis is the
composition of the sediment, it is necessary to separate
out the unwanted elements of the sample, prior to
drying and sub-sampling of the sediment component.
Figure (2.15) shows a sample of a finely ground soil, sold
commercially as a certified reference material (CRM).
Fig 2.14
Fig 2.15
Although this product will show very little variability, it cannot
strictly be described as „homogeneous‟. When used as a
CRM, the suppliers will recommend the minimum weight to
be taken in order to overcome any heterogeneity and to
guarantee the accuracy of the material as an analytical
standard.

3131
Soil samplingSoils are sampled for agricultural (texture and mineral composition for instance) or
for environmental purposes (presence of pollutants). The tools used for the
sampling of soils are usually very basic – spades and trowels etc., although core
sampling devices are available when depth profiling is required. Samples of soil are
taken at depths appropriate to the information required. For instance, when
sampling a soil to assess nutrients available to a deep-rooted plant or tree, the
sample must be taken from such a depth and position appropriate to the root
growth. Similarly for shallow rooted plants, a depth of sampling not exceeding 200
mm might be appropriate.
Fig 2.16 – soil sampling
Figure (2.16) shows a spade
being used to sample a soil
to a depth of about 200 mm.
The red outline shows the
approximate perimeter from
which the soil sample was
taken.

3232
Fig 2.17 – soil sample
The soil sample taken in Figure
(2.16) is transferred to a clean
contamination free surface and
allowed to air dry [Figure (2.17)
Soil samples where possible are air dried,
provided that the analytes are not volatile.
[Note: Samples taken for the analysis of volatile
constituents such as hydrocarbons and other
volatile organic compounds must be stored wet
in a sealed container, generally at temperatures
below ambient.]
Once the sample has been dried, the twigs and
stones etc. will be removed by hand, prior to
comminution and sub-sampling. Comminution
can be achieved in this instance by grinding in a
mortar followed by sieving.
These processes are shown on the next slide

3333
Fig 2.18 – grinding and sieving a dried sample of soil
Figure (2.18) shows the dried sample being ground in a mortar to produce
a roughly ground material This is then transferred to a 2 mm sieve and
the sample not passing through the sieve is then further ground until all of
the sample is below the 2 mm threshold.
The final ground sample as shown in Figure (2.18) should be acceptably
homogeneous and can now be transferred to a clean and dry storage container to
await analysis. No further sub-sampling should be required, however it is
advisable to mix the dry sample just before the analysis sample is taken as the
very fine particles tend to settle at the bottom of a container during storage

3434
Depth profiling of soils can be achieved by using corers or augers Figure 2.19
shows images to illustrate their usage.
Fig 2.19 – corer sampler being used to sample peat
The tube sampler as shown in
Figure (2.19) is screwed, by
using the handle at the top, into
the ground. It cuts a wedge of
soil that remains within the
hollow tube. On removal, the
device is laid on a flat surface
and the top half tube removed
or opened to reveal the sample.
The sample may then be
divided into a number of
separate individual samples
identified by the depth from
which they were taken.
Fig 2.20 – auger sampler
The auger illustrated in Figure (2.20) is screwed into
the compacted soil to the depth of the blade. On
removing the device, by pulling straight out of the
soil, the compacted soil remains attached to the
blade as shown in red on the diagram and can be
removed for analysis

3535
Sampling from large heapsLarge heaps refers to the situations when lorries, and railway wagons transfer
their consignments to single piles and to the sampling of individual consignments
being transported by boats, lorries and railway wagons. Unfortunately, when
particles differ in size or density, then segregation will occur, resulting in the
smaller particles having a greater abundance at the base of the heap. This poses
a problem for the sampler attempting to take a representative sample, in that the
basic premise in representative sampling, “that all particles must have an equal
chance of being taken”, is difficult to achieve. When using a sampling scoop to
take the sample, the size of the scoop must be such as to accept even the largest
of the particle (lump) sizes.
Fortunately in many instances where sampling and subsequent analysis is
required, the allowable measurement uncertainty will be large so that the process
of sampling can be less accurate. However in the case of natural minerals for
metal extraction, where the price paid for the mineral is dependent on the average
metal content, then an error in the sampling could be costly to the buyer.
A possible way of tackling this problem is by the process of Imaginary
sectioning. [see next slide]
3636
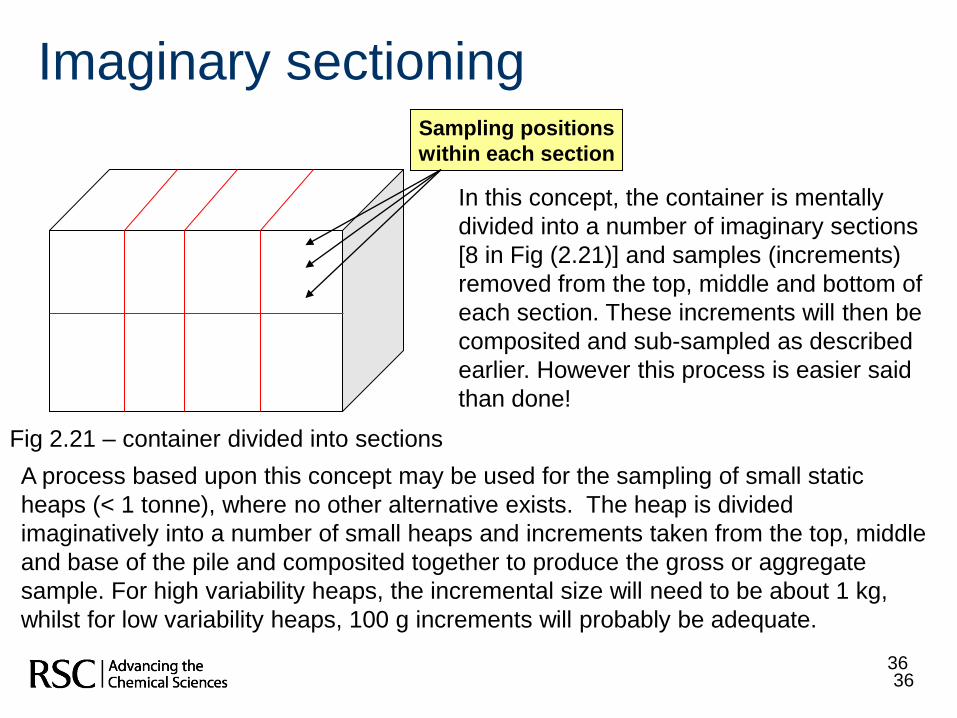
Imaginary sectioningSampling positions
within each section
Fig 2.21 – container divided into sections
In this concept, the container is mentally
divided into a number of imaginary sections
[8 in Fig (2.21)] and samples (increments)
removed from the top, middle and bottom of
each section. These increments will then be
composited and sub-sampled as described
earlier. However this process is easier said
than done!
A process based upon this concept may be used for the sampling of small static
heaps (< 1 tonne), where no other alternative exists. The heap is divided
imaginatively into a number of small heaps and increments taken from the top, middle
and base of the pile and composited together to produce the gross or aggregate
sample. For high variability heaps, the incremental size will need to be about 1 kg,
whilst for low variability heaps, 100 g increments will probably be adequate.

37
Sampling of solid materials in motion
(dynamic sampling)Because of the difficulties with utilising the concept of imaginary sectioning the
sample obtained at the end will never be truly representative. The most satisfactory
manner in which these types of materials can be sampled, is during the loading or
unloading operation, preferably via a conveyor belt. Figure (2.22) shows two
possible scenarios for
sampling directly from
conveyor belts. In ‘A’ the
sample is being cut
automatically from the end
of the belt, however this is
only feasible if the belt is
moving slowly. The
dimensions of the cutter
must be such as to be able
to accept any of the particles
(lumps) travelling along the
belt
Fig 2.22 – sampling from conveyor belts
In ‘B’, the sampling device is also being operated automatically so that the movement
of the belt is not affected. By stopping the belt periodically, it is possible to take a
cross section sample manually but now at 90 0 to the direction of movement of the belt.

3838
Sampling of pharmaceutical tablets & powders
Because of the strict regulation under which the pharmaceutical industry exists, all
routine pharmaceutical analysis has to be performed in accordance with a strict
set of rules. Each analysis, which includes the sampling, has to be carried out
using the SOP (standard operating procedure) for that analysis. This analysis
procedure is established following extensive research and development, such that
the method used for the analysis, is capable of achieving the required objective.
This could be for example, the formal identification of a precursor used in the
manufacture of a drug substance, or the analysis of a final drug product to BP
(British Pharmacopoeia) specification.
Given the nature of the materials to be sampled, great care must be taken both in
the choice of the location where sampling will take place and in the precautions
needed to protect the sampler. The sampler may be required to wear special
protective clothing and where feasible, sampling should be carried out in an area
dedicated to the task. This dedicated area could well be a closed cubical within a
warehouse. It is imperative that contamination both to the sample and to the
bulk material, are avoided during the process of sampling

3939
Sampling within the pharmaceutical sector is carried out for a variety of purposes
including:
Acceptance of consignments;
Batch release testing;
Process control;
Inspection for customs clearance;
Deterioration;
Adulteration.
Materials to be sampled will include:
Starting materials for use in the production of pharmaceuticals;
Intermediates in the manufacturing process;
Pharmaceutical products;
Packaging materials.
Although generic sampling procedures are just as important here as in other areas of
sampling, given the final destination of the products from pharmaceutical
manufacturer, guidelines have been established to aid the sampler. These are
illustrated on the next slide

4040
Sampling guidelines for three sampling situations
For a uniform material obtained from a recognised supplier, and present as a single batch
in „N‟ separate sampling units, it would normally be appropriate to select „n‟ or „p‟ units from
the batch for sampling. The value of „n‟ or „p‟ being obtained from the equations (2.1) or (2.2) :
Equation (2.1) n = N + 1 [where full quantitative analysis is required]
Equation (2.2) p = 0.4N [where only confirmatory identification is required]
The sampling units from which increments would be selected would be chosen randomly.
Those samples taken would then be placed in separate containers for initial visual inspection.
Assuming no apparent difference between the samples, then the samples would be
composited and a single sub-sample then selected for full analysis.
For a suspected non-uniform material obtained from an unrecognised source, a larger
number of samples need to be taken. Increments would initially be taken from all of the „N‟
sampling units, placed in sample containers and tested for identity. Providing the results are
concordant, then „r‟ sampling units are chosen randomly for sampling, where „r‟ is calculated
from equation (2.3):
Equation (2.3) r = 1.5N
All „r‟ samples are then supplied for analysis.

4141
Fig 2.23 - typical drum container
for tablets and powders
Figure (2.23) shows a typical drum used to contain tablets
and powders. It is made from thick cardboard, is lined with
plastic and has metal strengthening rings top and bottom.
Given that most products to be sampled should have
little variability, it should not be necessary in most cases
to use sampling devices designed for cross-sectional
or variable depth sampling. Most sampling is therefore
carried out by using stainless steel scoops of the types
shown in figure (2.24). The size of the scoop will relate
to the specific sampling task.
Fig 2.24 – stainless steel scoops

4242
Example sampling plan for solid pharmaceuticals
The succession of steps shown on this and the next slide are an example of a
sampling plan suitable for the sampling of pharmaceutical tablets and powders
Example (2.i)
1. Read and digest the precautions that need to be observed when handling the
material to be sampled
2. Obtain all of the equipment necessary for the sampling process and check that it is
clean.
3. Locate the consignment to be sampled, count and record the total number of
containers (sampling units).
4. Carefully examine all of the containers and record any obvious differences or
damage. Check that all of the labels are intact and that all of the containers appear
to be correctly labelled. Record any faults.
5. Separate any containers identified as faulty. These can be dealt with separately.
6. Check that all containers have the same batch number. Separate any with different
batch numbers for sampling at a later time.
7. Give each of the remaining containers an individual number.
8. Randomly select the containers to be sampled and record the decision.
9. Carefully open a chosen container and inspect the contents. Record observations.
10. Assuming that cross-sectional or depth sampling is not required, select a sample
from the top of the container using the recommended size sampling scoop.
Continued on the next slide

4343
11. Transfer the sample to a sample container. Divide this sample into two portions –
one to be retained and the other to be sent for analysis. Seal the sample
containers and label.
12. Reseal the sampled container and label to the effect that a sample has been
removed.
13. Clean the sampling equipment as appropriate, observing all necessary safety
precautions before sampling the other chosen containers.
14. Repeat steps 9 – 13 for all of the other containers that need to be sampled.
15. Finally clean all of the sampling equipment and leave dry for the next sampling
exercise.
16. Deliver the samples to the laboratory for analysis and report any significant
observations.
17. Decide or seek advice as to what needs to be done with the containers separated in
steps 4 and 5 of this sampling plan.

4444
Sampling of solid materials - reflection There are a multiplicity of solid matrices that require sampling for analytical
purposes. Each poses a unique problem and there is no single generic sampling
procedure that can be used to sample all of these matrices.
All solid matrices should be considered as heterogeneous although the degree of
variability will depend on the matrix and it‟s situation. Pharmaceutical products
should exhibit very little variability.
Soils for the eventual analysis of non-volatile analytes, should be dried and
ground to a particle size less than 2mm before analysis is attempted. The depth
from which the soil sample is taken will depend on the reason for the analysis.
The sampling of solids transported by lorry, ship, railway wagon etc. poses a
major problem for the sampler. If possible, sampling should be attempted whilst
the material is in motion, for instance being moved on a conveyor belt. Static
heaps of less than 1 tonne can be sampled by the process of imaginary
sectioning however this is an inherently inaccurate process and is unlikely to
produce a truly representative sample.
The tools used for sampling solid materials, particularly scoops, must be capable
to accepting the largest of the particles (lumps) in the consignment.
The sampling of pharmaceutical powders and tablets require the sampler to
follow a strict set of procedures as set out in the prescribed SOP -standard
operating procedure.

4545
Sampling of liquids
In theory, liquids pose less of a problem for the sampler than do solids, because of
the possibility of being able to achieve total homogeneity. In practice however,
liquids for sampling can only be considered homogeneous, when they can be seen
to be single phase and when they can be thoroughly mixed prior to sampling.
Oceans and deep-water lakes for instance will show differences in composition
due to differing in densities, slow flowing rivers will exhibit composition differences
across the width of the river. Tankers, drums etc., where the liquid inside cannot
be seen by the viewer, could contain multiple liquid phases. Some example of
differing sampling situations are shown below:
Sampling of liquids flowing within defined boundaries
Sampling of water from oceans and deep-water lakes
Sampling of water from open locations – small lakes, reservoirs & ponds
Sampling of liquids stored in closed containers
Examples covering these four situations will be covered in the next batch of slides

4646
Sampling of liquids flowing within defined
boundariesSlow moving liquids, flowing within confined boundaries, flow at differing rates
dependent upon their position with respect to the boundary (wall of a pipe or banks
of a river or canal, for instance). The process is termed Laminar Flow, with the
liquid furthest away from the boundary flowing at the fastest rate and with zero flow
being apparent at the boundary edge. It is therefore necessary, in order to take a
representative sample, to induce turbulence into the flow pattern. In pipes, this can
be done in a number of ways, one of which is illustrated in Figure (2.25).
Figure 2.25 – sampling of liquid from a pipe
Restriction
Note: the next slide shows an alternative way of
creating turbulence
RestrictionAs indicated in Figure (2.25), the
liquid flows in a laminar manner
until it meets the restriction in the
pipe, when it will become turbulent.
The sample is taken from within the
turbulent zone. After the turbulence
the liquid returns to laminar flow
conditions.

4747
Sampling of liquids on chemical plantsA chemical plant producing liquid products will have many
places where accurate sampling will benefit the efficiency
of the process. Figure (2.26) shows four fractionating
towers where sampling and analysis will be routinely
carried out. One of the features of a modern chemical plant
is that sampling and subsequent analysis are performed
automatically, thereby removing the time delay associated
with sending samples to a dedicated laboratory for
analysis. Liquids flowing through pipes on the plant will
also need to be sampled and if the flow rate is slow,
turbulence will need to be introduced. An alternative means
of achieving this turbulence is shown Figure (2.27). In this
Figure 2.26 – typical
chemical plant
Figure 2.27 – schematic
diagram of liquid flow
through a pipe
example, the turbulence
has been created by
introducing a right angled
bend into the pipe, just
ahead of the sampling
point. The sample would
be taken directly to the
analyser.

484848484848
Sampling of water flowing within defined boundaries
Figure 2.28 - slow flowing river
Figure 2.29 – fast flowing river
A fast flowing river as illustrated in figure (2.29), will generate its own turbulence and thus
will require no artificial means of mixing the water. A single water sample will therefore
constitute a representative sample. Figure (2.28) on the other hand shows a slow flowing
river where several water samples would need to be taken across the width of the water
course, and these composited and sub-sampled, in order to produce a similarly
representative sample. Samples would generally be taken by utilising a ‘dipping process’,
using a clean open glass container (eg: a beaker or a special sampling bottle) and
transferred immediately to a clean glass or plastic stoppered bottle. It must be recognised
that organic pollutants (eg: volatile organics), due to poor miscibility, will tend to concentrate
at the surface of the water course and thus sampling in this way could produce a sample
rich in organic pollutants.

4949
Figure 1.36 – schematic representation
of water layers in a deep water location
Sample 1m below the surface
Sampling for depth profiling
within the middle layer
Deep water sampling
Figure 2.30 – layer structure of deep waters
Sampling of water from oceans and deep
water lakes
Given that many possible organic contaminants in water are both inherently insoluble
and have a lower density than water, they will tend to concentrate within the surface
layer. Taking samples that include this layer are therefore likely to be unrepresentative
of the bulk. As the depth of the water increases, the density also increases, resulting
in a lower layer that tends not to mix with the water above it. The consistency of this
layer is considered to be reasonably constant. The middle layer is subject to wave and
tidal influences but may show some slight changes in composition with depth

5050
In order to avoid the upper water layer, which could be concentrating insoluble
or partially insoluble organic contaminants, the sampling of ocean or deep lake
water is recommended to take place at about 1m below the surface. Although
a sampling bottle of the type shown in figure (2.7) could be used, it is preferable
to use a remote sampling device as illustrated in figures (2.31 and 2.32).
Figures
(2.31 & 2.32)
show the
sampling tube
and sampling
point below
the buoy
Figure 2.31 – Kevlar sampling tube Figure 2.32 – ocean sampling at a 1m depth
Figures (2.31) & (2.32) show ‘Kevlar’ tubing being used the sample water at a depth
of about 1m below the Ocean’s surface. The sampling point is away from the hull
of the vessel to avoid possible contamination due to corrosion. The sample is
pumped directly into a clean laboratory situated on the deck of the vessel.

5151
Sampling of water from open locations –
small lakes, reservoirs & pondsThe water quality in small lakes and ponds, often used for angling, sometimes need
to be measured when problems manifest themselves (for instance fish dying or not
growing as fast as normal or the presence of excess algae). Some measurement of
water quality (eg: pH or dissolved oxygen) can be made on the water directly without
the need for sampling, however most measurements will require water samples to be
taken and subsequent measurements made in the analytical laboratory.
The pond as shown in figure (2.33) should
preferably be sampled from a central
location rather than from a convenient point
on the edge of the pond. This will thus
require the sampler to have available a
small boat or dingy from which to capture
the sample. Safety precautions would
need to be taken, so as to avoid unforeseen
accidents. Recommended sampling
locations are shown in red.
Figure 2.33 – small pond used by anglers

5252
Sampling of liquids stored in closed containers
This sampling situation relates to liquids
stored or transported in tankers, drums
etc. A tanker (figure 2.34) or a drum of
liquid will each represent a single
„sampling unit‟ as defined earlier in this
element. As it is not possible to view
the inside of the container the person
taking the sample has to assume the
liquid to be multiphase, possibly
containing suspended particulate
matter. Liquids stored in large tanks
(road, rail or ship) should if possible
have an agitator built into the tank to
facilitate mixing of the contents prior to
sampling. Assuming that no such
agitator exists then sampling equipment
must be used that allows for depth
profiling to be achieved.
Figure 2.34 – petrol tanker

535353535353
In the case of petrol tankers and tanks holding petrol/diesel in
garage forecourts, the main problem is likely to be water
accumulating at the base of the tank. Sampling devices need
to be available to take samples from the base of the tank whilst
avoiding too much of the fuel above. A suitable device is
shown in Figure (2.35). The device is inserted into the tank of
liquid with the plunger at the base of the device. The plunger is
then raised by pulling on the handle which draws liquid through
a mesh membrane into the sampling chamber. The sample
can then be removed and additional samples taken at other
depths. The sampling device would need to be calibrated such
that the depth at which the sample was taken could be
recorded
Figure 2.35 – device for sampling
liquids at various depthsNote: a sampling device suitable for depth
profiling within drums was described earlier in
this Chapter and is illustrated in figure (2.9)

5454
Sampling of liquids - reflection In achieving a representative sample, liquids in theory pose less of a
problem than solids. However this is only the case where small amounts of
liquid are being handled in transparent vessels and thus can be easily
shaken to effect homogeneity.
It is frequently necessary to sample large volumes and areas of water and
in these circumstances the sampler must be aware of the principles of
laminar flow, where the water is flowing within confined boundaries.
Slow flowing liquids in pipes, need to be homogenised by creating
turbulence in the flow pattern.
Differing concentrations of analytes can occur at differing depths in deep
ocean situations and special equipment must be used to capture samples at
differing depths.
Liquid tankers and drums may well contain liquids which are immiscible. In
these circumstances it is necessary to utilise sampling equipment that
allows for depth profiling or allows samples to be taken at selected depths.
In some cases, liquid samples can be transferred directly to an analyser to
speed up the generation of analytical information.

5555
Sampling of gases, vapours & aerosols
Within this sampling category we have a number of sub-species. These include:
Gases – classed as molecular in size and which do not condense at room
temperature;
Vapours – produced from volatile liquids and which will begin to condense if
the concentrations are high;
Particulate matter – any material that exists as a solid or liquid in the
atmosphere. This includes solid particles (eg: carbon particles from diesel
engines) generally referred to as „dust‟, or liquid droplets (eg: water, oil) that
are classed as „mists‟ and aerosols. Aerosols are groups of particles in either a
solid or a liquid state that are small enough to remain suspended in the
atmosphere. (eg: inhalers for asthma sufferers)

5656
Much gas sampling is undertaken for environmental purposes to monitor
atmospheric air quality and air quality within confined workspaces. Given that we
are normally unable to see what we have to sample, the assumption is generally
taken that the air to be sampled is homogeneous, at the time and point at which
the sample is taken. The main problem with the sampling of gases is not the
taking of the sample itself, but in its storage prior to analysis.
Gases stored under ambient conditions in suitable containers can take up large
volumes of space and any subsequent changes to temperature and pressure can
alter the integrity of the sample. For instance, a sample taken at above ambient
temperature could lose its less volatile components by condensation, if the
temperature of the sample were to be lowered to ambient. Under these conditions
and in order to maintain the sample‟s integrity, it would be necessary to return the
sample to its original temperature before taking a portion of the sample for analysis.
The other problem with gases is the low molecular concentrations that exist in
gaseous environments when compared to the condensed phases of solids and
liquids. The molar volume of any gas (volume containing 1 molecular mass) under
given temperature and pressure conditions remains constant. At 20oC and 1
atmosphere pressure, for instance, the volume occupied is approximately 24 dm3

5757
Where possible, most atmospheric air sampling and other air and gas sampling
protocols involve a combination of sampling and analysis so as to avoid the necessity
of storing the samples. The sample is thus taken and passed directly to the
analyser. Examples where this occurs includes environmental air quality monitoring
for CO, SO2, and NOX (oxides of nitrogen). This provides ‘real-time’ analysis data as
opposed to a time-weighted average (TWA) for samples collected over a period of
time.
Chimneys Sample inIR gas analyser Sample out Figures (2.36) &
(2.37) show the
chimneys of a
crematorium and
an infra-red gas
analyser which
continuously
monitors the CO
content of the
emitted gases. The
crematorium has
to comply with
regulations on
emissions of CO
laid down by the
local council.Figure 2.36 - crematorium Figure 2.37 – on-line IR gas analyser

5858
Atmospheric sampling
For investigative or non-routine analysis or monitoring, that is to be carried out
within a laboratory, we need to have available, equipment that is suitable for
capturing and storing gas samples. There are two approaches that may be
adopted dependent upon the target gases that are to be measured.
Gases may be collected and stored – generally referred to as „Grab
sampling‟
Gases may be passed through absorbing or adsorbing mediums over a
period of time so that the target analytes are trapped into or onto the
medium. The resultant solution or reagent is then transferred to the
laboratory for measurement of the target analytes. This technique is
sometimes referred to as „continuous sampling‟.
Grab samples give a measure of the analyte concentration at a defined time.
Continuous sample on the other hand produce a „time weighted average‟
concentration, over the period of time that the sample was collected.

595959595959
Grab sampling of gases, vapours & aerosolsDefinition of ‘grab sampling’
Refers to any sampling procedure that collects a single sample at a particular point in time
The sample may be collected in a flask (glass
or stainless steel), plastic bag or any other
suitable container. Two typical flasks are
illustrated in figure (2.38). Taps are made from
metal or ground glass and are not greased
Figure 2.38 – gas sampling
vessels
Thick walled
glass sampling
vesselsThe vessels shown in Figure (2.38) would be typically
250 – 1000 ml in volume. Vessel A is evacuated in the
laboratory and the tap opened to collect the gas
sample. Once atmospheric pressure inside the vessel
has been reached, the tap is then closed to store the
sample. Although vessel B could also be used in the
vacuum collection mode, the sample would generally
be drawn through the vessel by applying slight vacuum
at one end with both taps opened. When a
representative gas sample has been collected, the tap
closest to the pump is then closed, fractionally before
the tap on the other side. This will ensure that the
sample is stored at atmospheric pressure.

60
Taking analysis samples of gases, vapours &
aerosolsThese types of gas sampling vessels are perfectly adequate for qualitative
analysis however care must be taken when attempting to use them for high
accuracy quantitative measurement. The problem lies in the taking of a test
portion of the sample for analysis. Figure (2.39) illustrates the situation whereby
a small sample is being removed for the type A vessel.
A rubber septum can be placed over the end
of the sampling vessel and the tap turned to
the open position. A specialist gas sampling
syringe is then inserted through the septum
and a portion of the gas sample removed for
analysis. The sample in the syringe is then
analysed immediately, probably by a gas
chromatographic method. [see Chapter 7 of
this teaching & learning programme]Figure 2.39 – taking an analysis sample
It must be realised, that having removed a small quantity of the gas from the
sampling vessel, this has now created a slight vacuum within the vessel. So the next
sample to be taken for say replicate analysis, will be slightly less than the previous.
Assuming that the volume of gas taken for analysis is not in excess of 1 cm3
and that
the total volume is in excess of 500 cm3, then the slight error will be acceptable.

6161
Having captured a sample in vessel type „B‟ [Figure (2.38)] it is possible to
dispense this sample for analysis by using a liquid displacement technique as
illustrated in Figure (2.40)
The vessel type ‘B’ is attached as shown in
Figure (2.40) to a reservoir of liquid in
which the gaseous components are known
to be insoluble. Mercury is the best liquid
to use, however due to its potential toxicity
other less toxic substances are generally
employed. By opening gas tap ’B’ at the
base of the vessel and by adjusting the
height of the liquid reservoir, the gas in the
vessel may be pressurised. A small
septum may be placed over the end ‘A’ and
the tap ‘A’ now opened. By using a syringe
as illustrated in Figure (2.39), a test portion
of the gas can now be removed. The
sample in the syringe, initially will be under
slight pressure, however on removal from
the septum, the test portion will rapidly
attain atmospheric pressure. Replicate test
portions can be taken by using a similar
procedure
Figure 2.40 – taking a sample for
analysis

6262
Grab sampling using „Draeger‟ type tubesDreager tubes (from the initial inventor of this sampling and analysis system) are
gas detector tubes for use in workspace monitoring and other industrial applications.
Tubes are available to sample and measure around 160 different analytes, although
analytical sensitivities very considerably from ppm (parts per million) concentrations
for some analytes to % concentrations for others. Typical tubes are shown in
Figure (2.41). The tubes are constructed from glass, are up to 10 cm long and contain
an analyte specific reagent adsorbed onto an inert solid support. The
tubes are calibrated and the reagent changes colour as the contaminated
air is drawn over the adsorbent. The change in colour is an indication
of the concentration of the analyte in the atmosphere provided the
volume of gas drawn through the tube is accurately controlled. These
devices are generally used with hand-held pumps of the types shown in
Figures (2.42) and (2.43)
Figure 2.42 – piston pump
Figure 2.43 – bellows pump
Sampling tube
Inserted here
Figure 2.41 – Draeger tubes

6363
Continuous sampling of gases, vapours &
aerosols
Continuous sampling refers to the situation where the gas sample is captured
over a period of time and thus the final analytical result will be a historic time
weighted Average (TWA) concentration over the period of time that the sample
was captured. There are two forms of continuous sampling – active and
passive.
Both sampling modes allow for very low concentrations of gases or vapours to be
measured, much lower than would be measurable by using a grab sampling
technique.
In the active mode, a pump is used the draw the sample through an absorbing
chemical reagent or over a solid adsorbent such as active charcoal. This form of
sample collection is appropriate for the measurement of reactive chemicals and
particularly volatile organic compounds (VOCs).
In the passive mode, the sample is captured over a long period of time by
natural diffusion of the analyte onto a suitable adsorbent. Sampling times
would not usually be less than 8 hours and could be several days.

64
Active mode sampling
Figure 2.44 – 250 or 500 cm
Dreschel bottle
Figure 2.45 – typical sample impingerA known volume of gas is drawn slowly
through the reagent/absorbing solution.
The gas is dispersed to small bubbles in
order to maximise the surface area contact
with the liquid. When using volatile solvents
It may be necessary to cool the reagent to
reduce evaporation.
With low solubility gases or vapours, it may
be necessary to have more than one
absorption device connected in series in
order to capture all of the target analyte.

6565
Although gas absorption systems as illustrated in figures (2.44 & 2.45) are easy to
set up and to use within a laboratory, they are inconvenient to use outside the
laboratory environment. A more convenient approach is to use solid adsorbents that
are designed to target either single or groups of analytes. Typical sampling devices
are made from glass tubing and contain either generic (eg: active charcoal), or
specific adsorbents. A typical charcoal tube is shown schematically in Figure (2.46).
Figure 2.46 – charcoal adsorption tube
Figure (2.46) shows a schematic diagram of
a typical charcoal tube used for sampling
organic vapours in the atmosphere. The
glass tubes come in a number of sizes with
dimensions of 60mm in length and 5mm
diameter being typical. The tube is initially
sealed as shown in (A) and contains two
portions of activated charcoal. To use the
tube, the end seals are removed and the
tube attached to a small pump with flow
control. The air sample is drawn through
the tube as indicated for a fixed period of
time. After sampling, the tube is capped to
secure the sample and sent to the
laboratory for analysis.
A
B
Continued on the next slide

6666
Figure 2.47 – tube ready for analysis
Figure (2.47) shows a tube capped and waiting to
be sent for analysis. The two parts of the
adsorbent are separated and the analyte(s)
chemically desorbed ready for analysis by gas-
liquid chromatography. [See Chapter 7 of this
teaching and learning programme]. If the
back-up portion of the adsorbent is shown to
contain a substantial quantity of the analyte, then
the analysis has to be repeated as the concentration
of analyte in the atmosphere is too high for the
adsorbent and a representative sample will not have
been captured.

6767
Passive mode samplingThe term „passive sampling‟ refers to a sample being taken over a long period
of time by the process of natural diffusion of the analyte onto a suitable
adsorbent. Figure (2.48) is a typical stainless steel diffusion sampling tube.
Figure (2.49) is a schematic representation of the inside of the tube.
Figure 2.48 – stainless steel
passive sampler Figure 2.49 – schematic diagram
of passive sampling tube
Continued on the next slide

6868
Stainless
Steel mesh
Concn 0
Distance
Concentration
In sampled air
Start of packed adsorbent
Diffusion
layer
Figure 2.50 – illustration of concn. gradient
The tube as illustrated in figures (2.48 & 2.49) is packed with a suitable
adsorbent (Tenax – a porous polymer is often favoured) and held in place with
small pieces of stainless steel mesh. The tube is capped at both ends until
required. For continuous monitoring the top cap is removed, the tube placed in
position and the time recorded. The target analyte(s) diffuse across the
diffusion zone and are captured by the adsorbent. The rate of diffusion is
controlled by Fick‟s first Law of Diffusion, which states that “substances will
diffuse in accordance with the concentration gradient existing at the surface of
the adsorbent”.
The graph shown in figure (2.50)
illustrates what is meant by the term
‘concentration gradient’ in this context.
The concentration at the surface of the
adsorbent is assumed to be zero and that
in the air, is either constant or variable.
Following a fixed time period for sampling,
the tube is again capped and sent for
analysis.
These passive samplers require the
adsorbed analytes to be thermally
desorbed directly onto the front of a
gas-chromatographic column for
separation and analysis.
Concentration gradient

6969
Gas detector tubes (Draeger tubes) as illustrated in figure (2.41) may also be
used in the passive mode as shown in Figure (2.51)
Figure 2.51 –
Photographs of
gas detection
for use in
passive mode
Figure (2.51) shows a typical calibrated gas
detection tube, holder for the tube and operative
having the tube close to his breathing zone. At
the end of the sampling period, the tube will
indicate the average concentration to which the
operative has been exposed over the working
period..

7070
Particles in the „thoracic fraction‟ have been shown to have diameters of
between 1 – 30 m, with a median of around 10 m. Those in the „respirable
fraction‟ are smaller with diameters of around 1 – 10 m and with a median of
around 4 m. Diseases such as pneumoconioses relates to the respirable
fraction of particulate matter entering the lungs whilst incidences such as
bronchitis and asthma may well be due to particulate matter within the thoracic
fraction
Sampling of atmospheres for particulate matter
Particulate matter covers a variety of particle sizes from between below 0.1 to
greater than 100 m diameter. Most sampling and analysis of particulate matter is of
interest in the range below 100 m, as it is particles within this range that can be
inhaled into the body via the nose or mouth. This is sometimes referred to as the
Inhalable fraction of the total particulates in the air. Within this inhalable fraction
there are two more important sub-fractions – the Thoracic fraction and the
Respirable fraction.
Definition of the ‘thoracic fraction’
The mass fraction of inhaled particles penetrating the respiratory system beyond the larynx
Definition of the ‘respirable fraction’
The mass fraction of inhaled particles that penetrates to the unciliated airways of the lung
Introduction

71
Personal samplers for particulate matterSampling equipment has been designed to trap for identification purposes and to
quantify where possible, particulate concentrations within both working and
ambient air environments. Some of this equipment is for personal use and has
been designed to be worn during a normal working day. These utilise small pumpssimilar in size to those used for gas
and vapour sampling but with the air
samples being drawn through glass
fibre or membrane filters. The flow rate
of air drawn through the filter will be
around 2 l.min-1 with the filter choice
being dependent upon the type of
analysis to be carried out. Figure
(2.52) shows a schematic diagram of a
typical filter holder and filter used for
personal sampling.
For quantitative measurement, the filter is accurately weighed on a micro analytical balance and
then transferred to the filter holder. The holder is clipped to the lapel of the industrial clothing and
the pump attached around the waist. Air is drawn through the filter at a known rate for a fixed time.
After sampling, the filter is removed and weighed again. A time weighted average value is obtained.
Figure 2.52 – schematic diagram of a personal sampler

7272
Figure 2.53 – cyclone
personal samplerFigure 2.54 – cyclone
sampler - schematic
GRIT
The simple sampler as illustrated in
figure (2.52) will collect all particulate
matter above the pore size of the
filter membrane. This would not
therefore be able specifically identify
the presence of those size particles
which are most likely to cause health
problems. The cyclone elutriator is
capable of removing the larger
particles, before they reach the filter
membrane. As shown in figures
(2.53 & 2.54) The dusty air is sucked
into the device and spirals around a
conical container such that the larger
particles separate out and fall into the
grit container at the base of the device.
The air is then drawn through the
membrane filter, which traps the
smaller particles for analysis. The
filter will again be weighed before and
after sampling.

7373
Continuous monitoring for particulate matter
For continuous monitoring of ambient air for quality assessment purposes, high
volume samplers are usually employed. The particles of interest are often referred
to as „PM10s‟. These represent particles with diameters of below 10 m and so
relate to the „Thoracic‟ and „Respirable‟
fractions of particulate matter. A schematic
diagram of a typical high volume PM10
sampling device is shown in Figure (2.55).
In figure (2.55) air enters at the top of the
device and undergoes 2 stages of
fractionation to remove the larger particles
of diameters greater than 10 m. The air
containing the smaller PM10 particles is
then drawn through the filter, which is
weighed before and after sampling.
Samplers of this type can draw through the
filter at rates of 1 m3.min-1. Once again, a
time weighted average concentration will
be obtained.Figure 2.55 – high volume sampler
Blower
2 fractionation
stages
Air in
To pump

74
Methods of sample collection so far described, use filters to remove particulate
matter from the air being sampled. Cascade impactors offer a significant
advantages over these simpler methods in that they allow particles to be
fractionated according to their masses within
a wide range of particle sizes (0.5 - 200 m)
and the various fractions measured. A
schematic diagram of a typical cascade
impactor is shown in Figure (2.56). As
the flow holes decrease in size, the
momentum of the particles increase
until even the smallest particles can
impact with the plates.
Sample in Sample in
Plates or
targets
Sample adhered
to surface of
plate
Flow holes
to increase
linear
velocity
Cascade impactors
As indicated in Figure (2.56), air is
drawn at a constant rate, through the
device to impact on the plates (or
targets) which are coated with
petroleum or glycerine jelly. The
smaller particles adhere to the plates
lower down the cascade. After
sampling, the device is de-mountable
so that each plate may be separated for
analysis.Figure 2.56 – cascade impactor
To pump

7575
Sampling of inhalers
The pharmaceutical industry has produced a range of drugs that can relieve
respiratory illnesses such as asthma. Delivery of these drugs is often via „inhalers‟
as shown in Figure (2.57).
Figure 2.57 – typical inhaler
The inhaler as shown in Figure (2.57) is shaken
vigorously for about 5 seconds. The mouthpiece
placed in the mouth of the recipient and a shot of
the canister’s contents is fired directly into the
throat by pushing down on the canister whilst
breathing in at the same time.
The canister as shown in Figure (2.57), contains
the active ingredient in the form of solid
particles suspended in a suitable propellant.
The propellant is a very low boiling point liquid.
In order to control dosage and check long-term
stability of the product, analysis of the canister
must be carried out in such a way as to mimic
as far as possible, the way the inhaler is used in
practice. A modified cascade impactor is
recommended for sampling prior to analysis and
is illustrated on the next slide.
Introduction

76
Sampling of inhalers – use of cascade
impactors
Sample
Figure (2.58) shows a diagrammatic
representation of a cascade impactor
used for sampling of inhalers. The inhaler
is shaken and fired through the
mouthpiece into the top of the impactor.
The sample is drawn down the device
with increasing linear velocity. The
particles impact onto the individual
stages, which in some applications are
coated with silicone oil. Any particles
(generally very few), not trapped by the
plates, are removed by the back-up filter
to protect the pump. After sampling, the
stages are separated and the active
ingredients removed for analysis,
(generally by HPLC [see Chapter7 of this
teaching and learning programme])
following solvent washing.
The typical size of a cascade impactor
is around 30 cm tall with a diameter of
about 10 cm. The number of stages, can
be selected to satisfy the sampling
requirements.
Figure 2.58 – cascade inhaler for the
sampling of inhalers

77
Sampling of gases, vapours and aerosols -
reflection
Much analysis within this category is carried out for environmental purposes both
for atmospheric air quality monitoring and for workspace monitoring;
We have to assume that the matrices being sampled are homogeneous at the
point and time the sample is taken;
Where possible, gases & vapours etc. should be analysed simultaneously with
the taking of the sample so as to avoid problems associated with the storage of
large volumes of gases. This also has the advantage of providing real-time
analytical data;
Many sampling methods for this category of substances involve sampling over
long periods of time, thereby producing time-weighted average analytical data;
Sampling methods can be categorised as either „grab‟ or „continuous‟;
Continuous sampling methods may be carried out using „active‟ or ‟passive‟
modes;
Sampling for particulate matter present in the atmosphere form an important part
of this category of substances;
Many devices are available for the measurement of gases, VOCs and
particulates, in order to measure an individual‟s exposure to toxic substances
during a normal working day or shift.

78
Question 2.1 The terms „Integrity‟ and „Representative Sample‟ occur regularly in sampling terminology. Explain why
they are of fundamental importance in any sampling strategy. What is the relationship between „Sampling Unit‟,
Increment‟ and „Composite Sample‟?
Question 2.2 Distinguish between „Static‟ and „Dynamic‟ sampling situations and describe equipment for the taking of
samples of both solids and liquids, from both types of sampling situation. Give one example of each – four in total.
Question 2.3 Define the term „Comminution‟ and explain how it could apply to samples of metal ore taken from a
large consignment. The sample having been comminuted, is to be sub-sampled, prior to being submitted for analysis.
Describe two popular ways in which this sub-sampling could be achieved.
Question 2.4 Distinguish between analyses giving „Real-time data‟ and „Time-weighted average data‟. Explain how
these analysis systems relate to the sampling and subsequent analysis of gases and vapours of environmental
importance. Discuss specific problems that present themselves when sampling and analysing gaseous substances.
Question 2.5 Samples of gases maybe trapped for analysis at a later date using aDsorption and aBsorption
mechanisms. Distinguish between these two processes in a sampling context. An atmospheric sample containing H2S
is bubbled through a Dreschel bottle containing a solution of a buffered lead salt. Following sampling, the precipitated
lead sulphide is filtered and weighed. Use the following data to calculate the concentration of H2S in the atmosphere
in mg/m3:
Flow rate of sample 250 cm3/min;
Sampling time 45 min;
Weight of PbS 0.0145 g
Question 2.6 Describe how a „Cascade Impactor‟ samples air and aerosols, and explain how they have been adapted
to the sampling of pharmaceutical inhalers.

79
Outline answer to question number 2.1The answer to this question may be found in slides 4 - 10
It must be recognised from the outset that sampling is the most important stage in the
analytical process. Analysis of a sample that is not representative of the bulk from
which it was taken (and which it is meant to represent), not only will the result be
meaningless, but decisions taken at a later stage may also prove very costly to the
manufacturer or any other person who submitted the sample for analysis. For instance,
molten steel should be sampled and preferably analysed while it is still in the furnace,
so that any discrepancies in composition can be rectified before the steel is rolled out
and allowed to cool. If the sample taken does not truly represent the molten steel in the
pot, then the finished steel will not be of the correct composition for the purpose intended
and may have to be recycled, a costly and wasteful process.
In many cases the sample taken has to be stored for several days before analysis
can be carried out. It is important to ensure that the sample remains in the same
state and be of the same composition, as when it was taken. This process is
termed maintaining the sample‟s integrity.
A sampling unit is a separately identified part of an overall consignment. The sample
or samples removed from that sampling unit are termed increments. These increments
may be analysed separately, but with a large consignment are likely to be combined to
produce a composite sample.

80
Outline answer to question number 2.2The answer to this question may be found on slides 14 – 20, 37, 45 - 48
Static sampling refers to a situation where the composition of the sample remains the
same over a small time interval.
Dynamic sampling refers to the sampling of a product in motion (ie flowing). The examples
given in Element 1 relating to solids and liquids are respectively the sampling of grain
contained in a silo and sampling from a conveyor belt, to illustrate solid sampling situations
and the sampling of liquids flowing in defined boundaries to illustrate liquid sampling
situations.
Examples of equipment that can be used to collect samples could include:
For sampling of solids, scoops [figures (1.8) and (1.30)] could be used, or for cross sectional
sampling, devices as typified in figure (1.9) or (1.10) could be used. These devices would
be satisfactory for static sampling situations, but only the scoops could be used for dynamic
sampling.
For the sampling of liquids, a number of devices have been developed to satisfy particular
sampling situations. These have been illustrated as figures (1.13), (1.15). For the sampling
of rivers, open glass vessels, such as beakers or bottles are generally used.
Remember, that to avoid contamination of the sample, all equipment must be clean and once
the sample has been taken, it must be stored in a sealed container.

81
Outline answer to question number 2.3
The answer to this question may be found on slides 21 - 24
The term comminution refers to the general processes used for particle size reduction and
Includes crushing, grinding and pulverising.
A large consignment of a metallic ore would need to be sampled and analysed for target
metal content, as the price paid for the ore may well relate to its metallic content. The
sample taken would inevitably be a mixture of particle sizes from large lumps to dust and
these would need to be comminuted and sub-sampled before a representative portion could
be sent to the laboratory for analysis. This would generally be achieved by the use of a rollermill followed by coning and quartering or
riffling (see slides 44 & 45), dependent
upon the mix and size of the resultant
particles. The resultant sub-sample would
then be comminuted again to reduce the
particle size to that suitable for analysis.
A laboratory ball mill of the type illustrated
on the left could be used for this purpose.
Sample placed in the agate mill together
with agate balls. The lid is then placed
on top of the mill and the whole is
transferred to the shaker

82
Outline answer to question number 2.4The answer to this question may be found on slides 56 - 69
Real-time sampling and analysis refers to any sampling system where the sample is taken
and passed directly to provide immediate analytical results. Spectroscopic instruments
such as the IR gas analyser shown in figure (1.43) and the more simple „Draeger‟ type
sampling and analysis devises all produce real-time measurements. Time-weighted average
data is obtained when the sampling system collects the sample over a long period of time
for analysis at a later date. The analysis result obtained needs to be divided by the quantity
of sample collected to give an average value of concentration. Sampling devices such as
those illustrated in figures (150 – 1.55) will all produce time-weighted average data.
Many environmentally polluting gases and vapours are monitored continuously using both
real-time methods and some passive sampling techniques. Examples of real-time analyses
are CO, SO2 and NOX (mixed oxides of nitrogen). Passive sampling devices are frequently
employed to monitor an individual‟s exposure to VOCs or other noxious substances during
a working day or shift. The sampling tube as illustrated in figures (1.54 & 1.57) can be
attached to a laboratory coat or working overalls and is positioned as close as possible to
the operative‟s breathing zone, so as to capture a sample of the same atmosphere being
breathed by that operative. At the end of the working day or shift the sampling device is
analysed for target analytes.
The main problem associated with the sampling of gases is the storage, hence the importance
of real-time measurement. Changes in temperature, as well as diffusion through container
walls can both affect the sample‟s integrity and thus the reliability of the analysis data.

83
Outline answer to question number 2.5
The answer to this question may be found on slides 63 - 69
Target gaseous analytes, maybe trapped onto solid supports (for instance activated charcoal,
Tenax – a polymeric substrate) by the process of ABSORPTION. They will then be
desorbed for analysis using either solution desorption (from activated charcoal) or thermal
desorption (from Tenax). Using apparatus, such as that illustrated in figures (1.50 & 1.51),
the target analytes are ABSORBED into the solution, generally via a chemical reagent with
which the target analyte reacts.
The equation for the reaction is: Pb2+
+ H2S PbS
Total volume of air sampled was: 250 X 45 cm3
= 11.25 l = 0.01125 m3
The weight of PbS collected was 0.0145 g = 14.5 mg
The molar mass of PbS is 239 and that of H2S is 34
Thus 14.5 mg of PbS is equivalent to 14.5 X (34/239) mg of H2S = 2.06 mg H2S
Thus concentration of H2S in the air sampled was: 2.06/0.01125 mg/m3
= 183 mg/m3

84
Outline answer to question number 2.6The answer to this question may be found on slides 74 - 77
Air at a constant rate, is drawn through the cascade impactor, which is a series of
demountable plates generally coated in an inert viscous oil (eg: petroleum jelly). The
advantage offered by cascade impactors over other methods for the sampling of particulates,
is that it allows the particulate matter to the fractionated in particle size bands. Thus it
becomes possible to identify the quantity of the most dangerous particles that are able to
get deep into the lungs and cause lung damage.
The particles adhere to the plate surfaces when they have sufficient momentum (a
combination of mass and speed of movement). The size of the flow holes diminish from the
top to the bottom of the impactor, causing the smaller particles to increase their momentum,
until even the smallest particles have sufficient momentum to be captured. [see figure (1.62)]
by one of the plates. Following sampling, the plates are separated for measurement of
particle numbers.
The process has been adapted for the analysis of the active ingredient in pharmaceutical
Inhalers. The inhaler is shaken and fired into the impactor and drawn through the device
by a pumped flow of air. The various particle sizes that make up the aerosol are then
separated so that the effectiveness of the product can be accurately measured.
[see figure (1.64)]. Following sampling, the plates are separated and the active ingredient
solvent extracted for analysis by hplc.
Related Documents


