A report by Royal Dutch Shell plc (‘Royal Dutch Shell’). The information in these Royal Dutch Shell 2005 Results Summary results THIRD QUARTER $ million NINE MONTHS 2005 2004 % 2005 2004 % 9,032 5,371 +68 Income attributable to shareholders 1, 2 20,943 13,969 +50 1,663 990 Estimated current cost of supplies (CCS) adjustment for Oil Products segment - see note 2 3,398 1,594 7,369 4,381 +68 CCS earnings 1, 2 17,545 12,375 +42 6,646 6,878 Cash from operating activities 21,648 20,188 10,479 7,849 Cash from operating activities excluding net working capital movements and taxation paid/accrued - see note 7 28,241 21,627 4,105 3,548 Capital investment 11,480 10,090 3,207 3,608 Upstream production (thousand boe/d) 3,523 3,749 1. including discontinued operations – see note 3 2. excluding minority income attributable to Royal Dutch shareholders of $46 million in the third quarter 2005 – see note 1 Good performance across the business Record financial results with basic earnings per share of $1.35 • • • • • • • • $6.6 billion cash from operations Upstream earnings capture oil price increases; Downstream earnings very strong 3,523 thousand barrels of oil equivalent (boe) per day production for 9 months to end September Including hurricane impacts, the production outlook for 2005 is around 3.5 million boe per day and for 2006 is in the lower half of the 3.5 to 3.8 million boe per day range 2004-2006 divestment programme at $13.7 billion, ahead of schedule Third quarterly dividend declared equivalent to some $1.9 billion (subject to exchange rates) 0.9% of Royal Dutch Shell shares bought back for cancellation in the quarter Chief Executive Jeroen van der Veer said, “Our operational performance is paying off with good results. We continue to build our portfolio of integrated gas, unconventional resources and material oil projects and the focused exploration strategy is working. We are attracting the key people to execute our projects and have already recruited around 1,000 technical professionals so far this year. Project management, operations, customers and technology are central to our success and to meet the challenges. We are very grateful to our employees for their great efforts during and after the hurricanes in the USA. Despite the impact of the hurricanes, the production outlook for 2005 is around 3.5 million boe per day. LNG growth continues at pace. Downstream performance, profitability and cash generation remain very satisfactory”. quarterly results reflects the consolidated financial position and results of Royal Dutch Shell. All amounts shown throughout this report are unaudited.

Welcome message from author
This document is posted to help you gain knowledge. Please leave a comment to let me know what you think about it! Share it to your friends and learn new things together.
Transcript

A report by Royal Dutch Shell plc (‘Royal Dutch Shell’). The information in these
Royal Dutch Shell
2005 Results
Summary results
THIRD QUARTER
$ million NINE MONTHS
2005 2004 % 2005 2004 %
9,032 5,371 +68 Income attributable to shareholders 1, 2 20,943 13,969 +50
1,663 990
Estimated current cost of supplies (CCS) adjustment for Oil Products segment - see note 2 3,398 1,594
7,369 4,381 +68 CCS earnings 1, 2 17,545 12,375 +42
6,646 6,878 Cash from operating activities 21,648 20,188
10,479 7,849
Cash from operating activities excluding net working capital movements and taxation paid/accrued - see note 7 28,241 21,627
4,105 3,548 Capital investment 11,480 10,090
3,207 3,608 Upstream production (thousand boe/d) 3,523 3,749
1. including discontinued operations – see note 3 2. excluding minority income attributable to Royal Dutch shareholders of $46 million in the third
quarter 2005 – see note 1
Good performance across the business
Record financial results with basic earnings per share of $1.35 •
•
•
•
•
•
•
•
$6.6 billion cash from operations
Upstream earnings capture oil price increases; Downstream earnings very strong
3,523 thousand barrels of oil equivalent (boe) per day production for 9 months to end September
Including hurricane impacts, the production outlook for 2005 is around 3.5 million boe per day and for 2006 is in the lower half of the 3.5 to 3.8 million boe per day range
2004-2006 divestment programme at $13.7 billion, ahead of schedule
Third quarterly dividend declared equivalent to some $1.9 billion (subject to exchange rates)
0.9% of Royal Dutch Shell shares bought back for cancellation in the quarter
Chief Executive Jeroen van der Veer said, “Our operational performance is paying off with good results. We continue to build our portfolio of integrated gas, unconventional resources and material oil projects and the focused exploration strategy is working. We are attracting the key people to execute our projects and have already recruited around 1,000 technical professionals so far this year. Project management, operations, customers and technology are central to our success and to meet the challenges. We are very grateful to our employees for their great efforts during and after the hurricanes in the USA. Despite the impact of the hurricanes, the production outlook for 2005 is around 3.5 million boe per day. LNG growth continues at pace. Downstream performance, profitability and cash generation remain very satisfactory”.
quarterly results reflects the consolidated financial position and results of Royal Dutch Shell. All amounts shown throughout this report are unaudited.
2
• Basic earnings per share for Royal Dutch Shell (see note 9) in the third quarter 2005 were $1.35, an increase of 69% compared to a year ago. Basic CCS earnings per share for Royal Dutch Shell were $1.10, an increase of 69% compared to a year ago.
• Third quarter 2005 interim dividends have been announced of €0.23 per A and B share for Royal Dutch Shell.
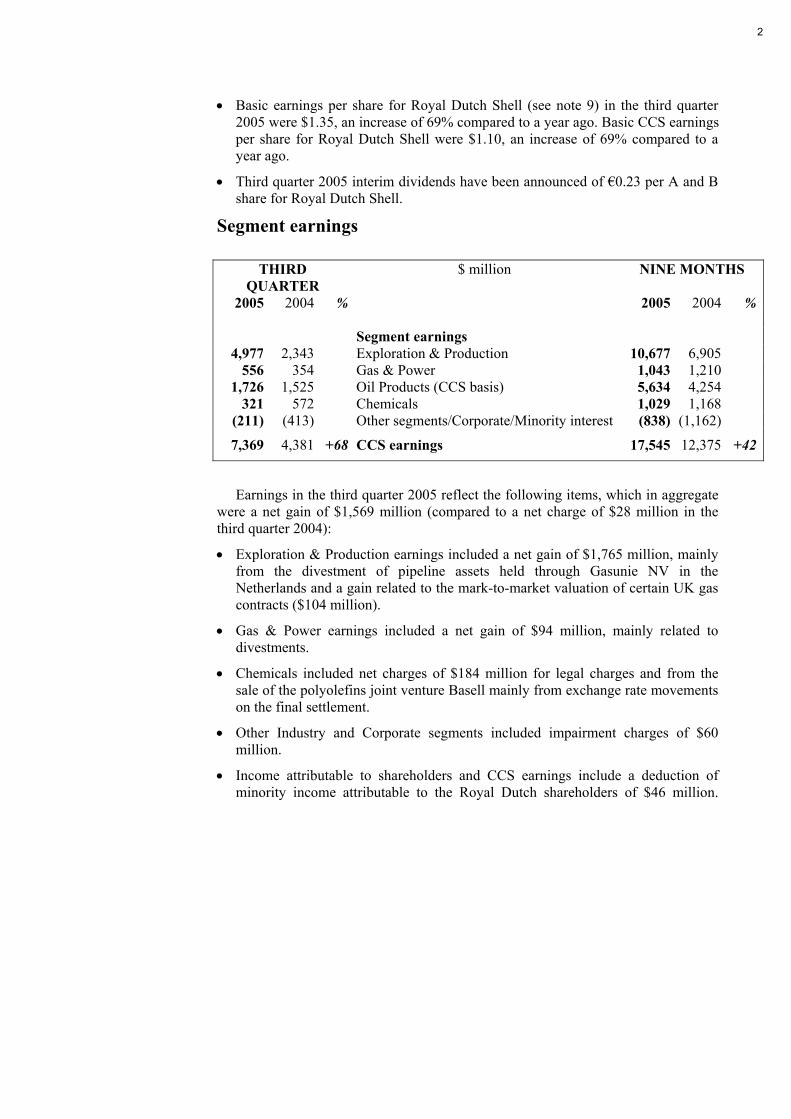
Segment earnings
THIRD QUARTER
$ million NINE MONTHS
2005 2004 % 2005 2004 %
Segment earnings 4,977 2,343 Exploration & Production 10,677 6,905
556 354 Gas & Power 1,043 1,2101,726 1,525 Oil Products (CCS basis) 5,634 4,254
321 572 Chemicals 1,029 1,168(211) (413) Other segments/Corporate/Minority interest (838) (1,162)
7,369 4,381 +68 CCS earnings 17,545 12,375 +42
Earnings in the third quarter 2005 reflect the following items, which in aggregate were a net gain of $1,569 million (compared to a net charge of $28 million in the third quarter 2004):
• Exploration & Production earnings included a net gain of $1,765 million, mainly from the divestment of pipeline assets held through Gasunie NV in the Netherlands and a gain related to the mark-to-market valuation of certain UK gas contracts ($104 million).
• Gas & Power earnings included a net gain of $94 million, mainly related to divestments.
• Chemicals included net charges of $184 million for legal charges and from the sale of the polyolefins joint venture Basell mainly from exchange rate movements on the final settlement.
• Other Industry and Corporate segments included impairment charges of $60 million.
• Income attributable to shareholders and CCS earnings include a deduction of minority income attributable to the Royal Dutch shareholders of $46 million.
3
Key features of the third quarter 2005
• Basic earnings per share for Royal Dutch Shell (see note 9) in the third quarter 2005 were $1.35, an increase of 69% compared to a year ago. Basic CCS earnings per share for Royal Dutch Shell were $1.10, an increase of 69% compared to a year ago.
• Third quarter 2005 interim dividends have been announced of €0.23 per share for Royal Dutch Shell.
• Third quarter 2005 reported income of $9,032 million was 68% higher than a year ago.
• CCS earnings (i.e. on an estimated current cost of supplies basis for the Oil Products segment earnings) were $7,369 million, 68% higher than a year ago. Income in the third quarter 2005 included a net gain of $1,569 million mainly from divestments and mark-to-market valuations in Exploration & Production, versus a net charge of $28 million in the same quarter a year ago.
• Return on average capital employed (ROACE) on a reported income basis (see note 4) was 26.3%.
• Exploration & Production segment earnings of $4,977 million were 112% higher than a year ago ($2,343 million), mainly reflecting strong oil and gas price realisations and divestment gains partly offset by lower volumes and higher costs. The earnings included a net gain of $1,765 million versus a charge of $183 million a year ago. The net gain in the third quarter 2005 is mainly from the divestment of pipeline assets held through Gasunie NV in the Netherlands and a gain related to the mark-to-market valuation of certain UK gas contracts ($104 million). Excluding the effects earnings increased by 27% compared to a year ago.
• Hydrocarbon production was 3,207 thousand boe per day including the loss of some 160 thousand boe per day (averaged over the quarter) due to hurricanes in the Gulf of Mexico. Compared to a year ago, excluding the hurricane effect, the end of a production sharing contract in the Middle East of some 100 thousand boe per day, lower entitlements due to higher hydrocarbon prices and the impact of divestments of 30 thousand boe per day, production was 4% lower. New volumes were more than offset by field declines and production downtime in the North Sea.
• Gas & Power segment earnings were $556 million compared to $354 million a year ago, reflecting strong LNG prices and favourable Marketing and Trading conditions. Earnings included gains of $94 million mainly related to asset divestments versus net gains of $103 million a year ago. Excluding the effects earnings were up 84%. LNG volumes increased by 2%.
• Oil Products CCS earnings were $1,726 million compared to $1,525 million for the third quarter 2004, which included a net gain of $52 million mainly related to divestments. Higher earnings due to strong refining margins and improved trading results were partially offset by lower marketing earnings.
• Chemicals segment earnings of $321 million for the quarter compared to earnings of $572 million in the same quarter last year. The third quarter 2005 included net charges of $184 million for legal charges and from the sale of the polyolefins joint venture Basell mainly from exchange rate movements on the final settlement. Excluding these effects earnings were down 12%.
• Cash flow from operating activities, excluding net working capital movements and taxation paid/accrued, was $10.5 billion, compared to $7.8 billion a year ago.
• Gearing, including other commitments such as operating leases and retirement benefits, and net of cash holdings minus operational cash requirements, was 9.7%
Basic earnings per share – see note 9
Third quarter 2005 interim dividend Reported income
CCS earnings - see note 2
ROACE – see note 4
Upstream EP segment earnings
Production
Upstream GP segment earnings
Downstream OP segment earnings
Downstream Chemicals segment earnings
Cash flow from operations
Gearing and debt
4
versus 13.0% at the end of the second quarter 2005. Cash and cash equivalents increased by $4.5 billion to $16.0 billion and debt increased by $1.1 billion.
• Capital investment for the quarter was $4.1 billion (including the minority share of Sakhalin) of which $3.2 billion was invested in the Upstream segments.
Capital investment Proceeds from divestments Share buy back Share buy back and Royal Dutch shares Divestments Production outlook
Gulf of Mexico
• Gross proceeds from divestments for the third quarter 2005 were $4.3 billion.
• Share purchases for cancellation amounted to $2.4 billion for the year to date including $1.9 billion or 0.9% of Royal Dutch Shell shares in the third quarter.
Royal Dutch Shell outlook
• Royal Dutch Shell expects to return $5 billion to shareholders via buy back of shares for cancellation in 2005, with any incremental purchase of remaining shares in Royal Dutch to be additional to this target.
• The 2004-2006 divestment target of $12 to $15 billion has been achieved early with the Gasunie transportation assets, Basell and InterGen divestments, raising proceeds from the divestments programme to date to $13.7 billion.
• Including the hurricane impact the production outlook for 2005 is around 3.5 million boe per day and for 2006 in the lower half of the range of 3.5 to 3.8 million boe per day. The outlook for 2009 of 3.8 to 4.0 million boe per day is unchanged.
• In the Upstream, Shell has restored Gulf of Mexico production to more than 200 thousand boe per day (Shell share) of the approximately 450 thousand boe per day (Shell share) prior to Hurricane Katrina (operated and non-operated). Good progress continues to be made on key assets including Ursa, Mensa, and the Auger pipeline and an additional 150 thousand boe per day (Shell share) is expected to return to production during the fourth quarter 2005, some 80 thousand boe per day above earlier guidance. Approximately 15 million barrels (Shell share) were deferred in the third quarter 2005 and approximately 18 million is expected to be deferred in the fourth quarter 2005. Production from the Mars platform is expected to resume in the second half of 2006.
• Upstream cost after tax (Shell share) associated with hurricane evacuation, people displacement, and repairs to assets and facilities is expected to be around $300 million, prior to insurance recovery. In the third quarter 2005, costs after tax were $27 million and approximately $100 million (after tax) will be spent in the fourth quarter 2005, with the remainder in 2006.
• In the Downstream, following Hurricane Katrina the Convent and Norco refineries were back on line within two weeks after a full shutdown. Following Hurricane Rita, the Deer Park refinery was out of operation for 10 days and the Port Arthur refinery is expected to be back on line shortly. Overall, lost refinery intake was some 4.9 million barrels (Shell share) in the third quarter 2005 and some 4.5 million barrels (Shell share) is expected to be lost in the fourth quarter 2005. Chemicals overall asset utilisation was impacted by 7% in the third quarter with fourth quarter 2005 impact estimated at some 2% to 3%. Downstream costs after tax and prior to insurance recovery associated with the hurricanes are approximately $20 million (Shell share) for the third quarter 2005 and are expected to be around $30 million (Shell share) in the fourth quarter 2005.
• Total Upstream and Downstream costs after tax for hurricane related items are expected to be around $350 million (Shell share) over the period 2005 to 2006. Insurance recovery from external insurers will be available for a significant portion of these costs. However it is too early in the process to provide an estimate for how much that recovery will be.

5
• The outlook for Shell’s 2005 total capital investment, across all its businesses and activities remains at approximately $15 billion (excluding the minority share of Sakhalin). Guidance for 2006 capital expenditure is expected in December 2005. The capital investment programme will reflect new project opportunities under development as well as an overall update taking into account project progress and market conditions on revenue and cost.
• As stated on 20 September, Royal Dutch Shell’s proposed internal restructuring and merger to achieve governance, management and fiscal efficiencies by unwinding the 60:40 cross holdings below Parent Company level, is expected to be completed during the fourth quarter 2005. As a result of the proposed merger,
Capital investment
Royal Dutch merger
Royal Dutch Shell is expected to own all the interests in the merged company and the holders of the existing 1.5% public minority in Royal Dutch will receive financial consideration.

6
Third quarter 2005 investments and portfolio developments
Upstream portfolio developments during the quarter: Upstream:
Exploration & Production; Gas & Power
Shell in Ireland acquired an exploration licence, located in deepwater of the Irish Rockall Trough, some 150 kilometres off the coast. In the 23rd offshore licensing round in the UK Continental Shelf, Shell was awarded a new exploration licence. In Alaska, Shell acquired 19 leases in the western Beaufort Sea adding to the Beaufort leases acquired earlier in Lease Sale 195.
In Malaysia, Shell logged a significant hydrocarbon column in high quality reservoir rock in the deepwater Ubah 2 big cat exploration prospect (Shell share 35%).
In the third quarter 2005, 15 successful exploration and exploratory appraisal wells were drilled in Australia, Brunei, Malaysia, Netherlands, Nigeria, UK, USA, Kazakhstan and Oman, with a success rate year to date of 72%.
The Train 4 and 5 expansion at Nigeria LNG Ltd (Shell share 26%) is in line with expectation. First production from Train 4 expected in the fourth quarter 2005 and construction of Train 5 is more than 90% complete. These two trains will bring Nigeria LNG’s overall production capacity to over 17 million tonnes per annum (mtpa) of LNG. Train 6 (4 mtpa) is on schedule for start up in late 2007.
In addition, the 3.7 mtpa Qalhat LNG project (Shell indirect share 11%) in Oman is on schedule. Commissioning is in progress with first production expected to commence around year-end 2005.
The divestment of the majority of the assets of the InterGen joint venture contributed proceeds exceeding $1 billion. The divestment of the two remaining InterGen assets (in Turkey and Colombia) is progressing to schedule.
Downstream portfolio developments during the quarter: Downstream:
Oil Products; Chemicals
The sale of Shell’s marketing and distribution businesses in the Republic of Ireland and Northern Ireland was announced. Completion of the sale is expected by the end of the year.
The divestment of Oil Products refining, marketing and distribution businesses in the French Antilles and French Guyana was announced. The sale is to take place by the end of 2005.
Shell and Turcas Petrol A.S. signed an agreement relating to a joint venture to combine their marketing and distribution activities in Turkey. Furthermore Koc and Shell participated in the privatization bid for 51% of Turkiye Petrol Rafinerileri A.S. (“Tupras”) a Turkish refining company; Shell will be a minority shareholder in Tupras. The purchase is subject to approval by the Turkish government.
An agreement was signed for the exchange of Shell’s 20% interest in its Rome refinery for Total’s 18% interest in the Reichstett refinery in France. The transaction is subject to regulatory approval and pre-emptive rights by existing partners. The exchange increases Shell’s ownership interest in the Reichstett refinery to 83%.
Shell and BASF completed the sale of their 50:50 polyolefins joint venture Basell, with net after debt proceeds to Shell of over $1 billion.

7
Earnings by industry segment
THIRD QUARTER
$ million NINE MONTHS
2005 2004 % 2005 2004 %
4,977 2,343 +112 Segment earnings 10,677 6,905 +55
2,077 2,279 -9 Crude oil production (thousand b/d) 2,129 2,283 -76,551 7,706 -15 Natural gas production available for sale
(million scf/d) 8,088 8,505 -5
Exploration & Production
Third quarter segment earnings of $4,977 million were 112% higher than a year
ago ($2,343 million), mainly reflecting strong oil and gas price realisations and divestment gains partly offset by volumes and higher costs.
The earnings included a net gain of $1,765 million versus a charge of $183 million a year ago. The net gain in the third quarter 2005 is mainly from the divestment of pipeline assets held through Gasunie NV in the Netherlands and a gain related to the mark-to-market valuation of certain UK gas contracts ($104 million). Excluding these effects earnings increased by 27% compared to a year ago.
Segment unit earnings, calculated as segment earnings divided by production for the quarter are $16.87 per boe. Excluding the effects described above, unit earnings were $10.89 per boe and increased by 43% compared to a year ago.
Liquids realisations were 49% higher than a year ago exceeding increases in marker crudes Brent of 48% and WTI of 44%. Outside the USA, gas realisations increased by 37% and in the USA, gas realisations increased by 35%.
Hydrocarbon production in the third quarter 2005 was 3,207 thousand boe per day, reflecting the loss of production from hurricanes in the Gulf of Mexico. Excluding the hurricane loss of production of some 100 thousand boe per day higher than the same quarter last year, the end of a production sharing contract in the Middle East of some 100 thousand boe per day, lower entitlements due to higher hydrocarbon prices and the impact of divestments of 30 thousand boe per day, production was 4% lower than a year ago.
New field production, totalling some 90 thousand boe per day versus a year ago, benefited from Goldeneye (Shell share 49%) in the UK and Holstein (Shell share 50%) in the USA. Field declines were 179 thousand boe per day, mainly in the USA, Norway and the UK. Operational downtime, excluding the Gulf of Mexico, exceeded some 100 thousand boe per day, mainly in the North Sea.
Cost increases reflect increased market rates and commodity prices, the build up of new production and the development of future projects.
Capital investment in the third quarter of $2.5 billion, excluding the minority share of Sakhalin and including exploration expense of $0.2 billion, was 21% higher than in the corresponding period last year.
8
THIRD QUARTER
$ million NINE MONTHS Gas & Power
2005 2004 % 2005 2004 %
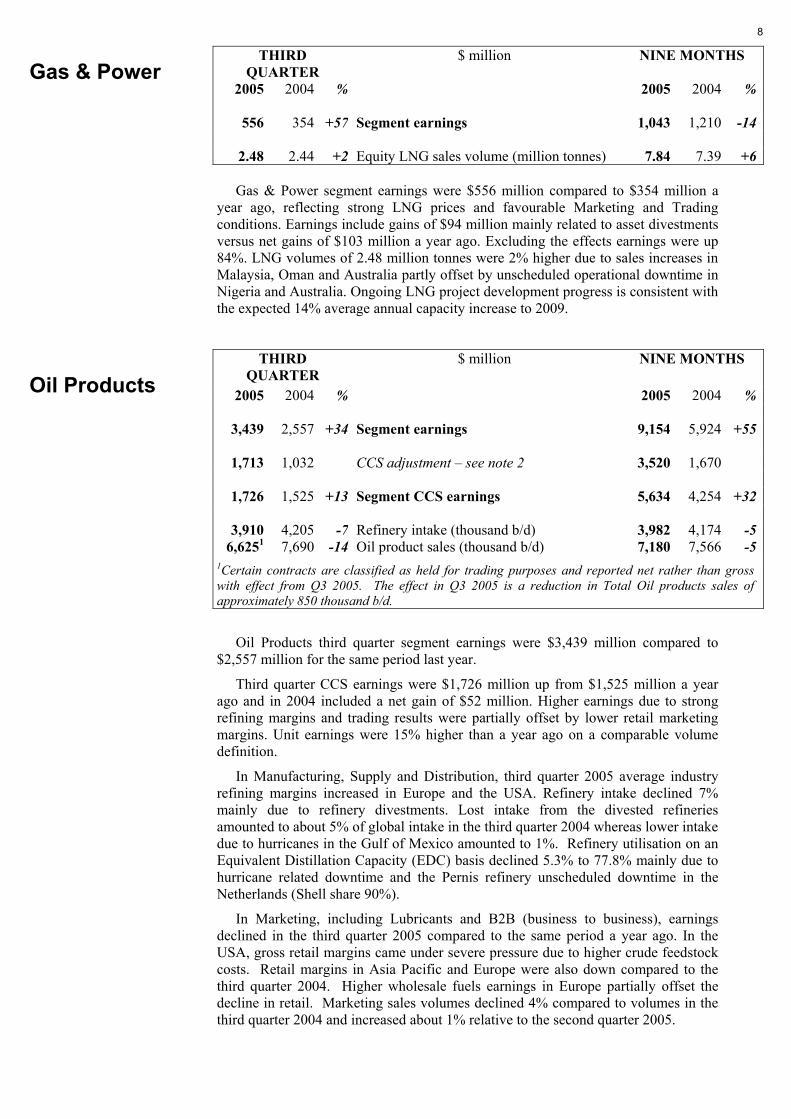
556 354 +57 Segment earnings 1,043 1,210 -14
2.48 2.44 +2 Equity LNG sales volume (million tonnes) 7.84 7.39 +6
Gas & Power segment earnings were $556 million compared to $354 million a year ago, reflecting strong LNG prices and favourable Marketing and Trading conditions. Earnings include gains of $94 million mainly related to asset divestments versus net gains of $103 million a year ago. Excluding the effects earnings were up 84%. LNG volumes of 2.48 million tonnes were 2% higher due to sales increases in Malaysia, Oman and Australia partly offset by unscheduled operational downtime in Nigeria and Australia. Ongoing LNG project development progress is consistent with the expected 14% average annual capacity increase to 2009.
THIRD QUARTER
$ million NINE MONTHS
2005 2004 % 2005 2004 %
3,439 2,557 +34 Segment earnings 9,154 5,924 +55
1,713 1,032 CCS adjustment – see note 2 3,520 1,670
1,726 1,525 +13 Segment CCS earnings 5,634 4,254 +32
3,910 4,205 -7 Refinery intake (thousand b/d) 3,982 4,174 -56,6251 7,690 -14 Oil product sales (thousand b/d) 7,180 7,566 -5
1Certain contracts are classified as held for trading purposes and reported net rather than gross with effect from Q3 2005. The effect in Q3 2005 is a reduction in Total Oil products sales of approximately 850 thousand b/d.
Oil Products
Oil Products third quarter segment earnings were $3,439 million compared to $2,557 million for the same period last year.
Third quarter CCS earnings were $1,726 million up from $1,525 million a year ago and in 2004 included a net gain of $52 million. Higher earnings due to strong refining margins and trading results were partially offset by lower retail marketing margins. Unit earnings were 15% higher than a year ago on a comparable volume definition.
In Manufacturing, Supply and Distribution, third quarter 2005 average industry refining margins increased in Europe and the USA. Refinery intake declined 7% mainly due to refinery divestments. Lost intake from the divested refineries amounted to about 5% of global intake in the third quarter 2004 whereas lower intake due to hurricanes in the Gulf of Mexico amounted to 1%. Refinery utilisation on an Equivalent Distillation Capacity (EDC) basis declined 5.3% to 77.8% mainly due to hurricane related downtime and the Pernis refinery unscheduled downtime in the Netherlands (Shell share 90%).
In Marketing, including Lubricants and B2B (business to business), earnings declined in the third quarter 2005 compared to the same period a year ago. In the USA, gross retail margins came under severe pressure due to higher crude feedstock costs. Retail margins in Asia Pacific and Europe were also down compared to the third quarter 2004. Higher wholesale fuels earnings in Europe partially offset the decline in retail. Marketing sales volumes declined 4% compared to volumes in the third quarter 2004 and increased about 1% relative to the second quarter 2005.
9
THIRD QUARTER
$ million NINE MONTHS
2005 2004 % 2005 2004 %
321 572 -44 Segment earnings 1,029 1,168 -12
5,589 6,080 -8 Sales volumes (thousand tonnes) 17,097 18,196 -6
Chemicals
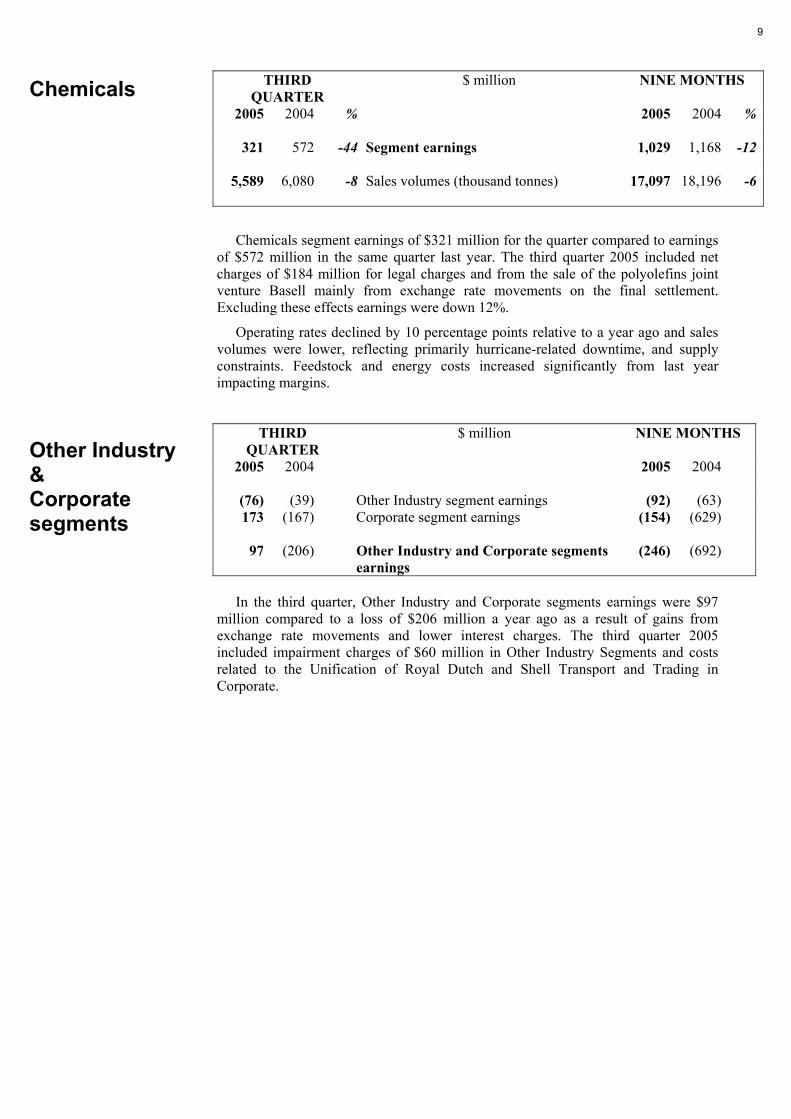
Chemicals segment earnings of $321 million for the quarter compared to earnings of $572 million in the same quarter last year. The third quarter 2005 included net charges of $184 million for legal charges and from the sale of the polyolefins joint venture Basell mainly from exchange rate movements on the final settlement. Excluding these effects earnings were down 12%.
Operating rates declined by 10 percentage points relative to a year ago and sales volumes were lower, reflecting primarily hurricane-related downtime, and supply constraints. Feedstock and energy costs increased significantly from last year impacting margins.
THIRD QUARTER
$ million NINE MONTHS
2005 2004 2005 2004
(76) (39) Other Industry segment earnings (92) (63)173 (167) Corporate segment earnings (154) (629)
97 (206) Other Industry and Corporate segments
earnings (246) (692)
Other Industry & Corporate segments
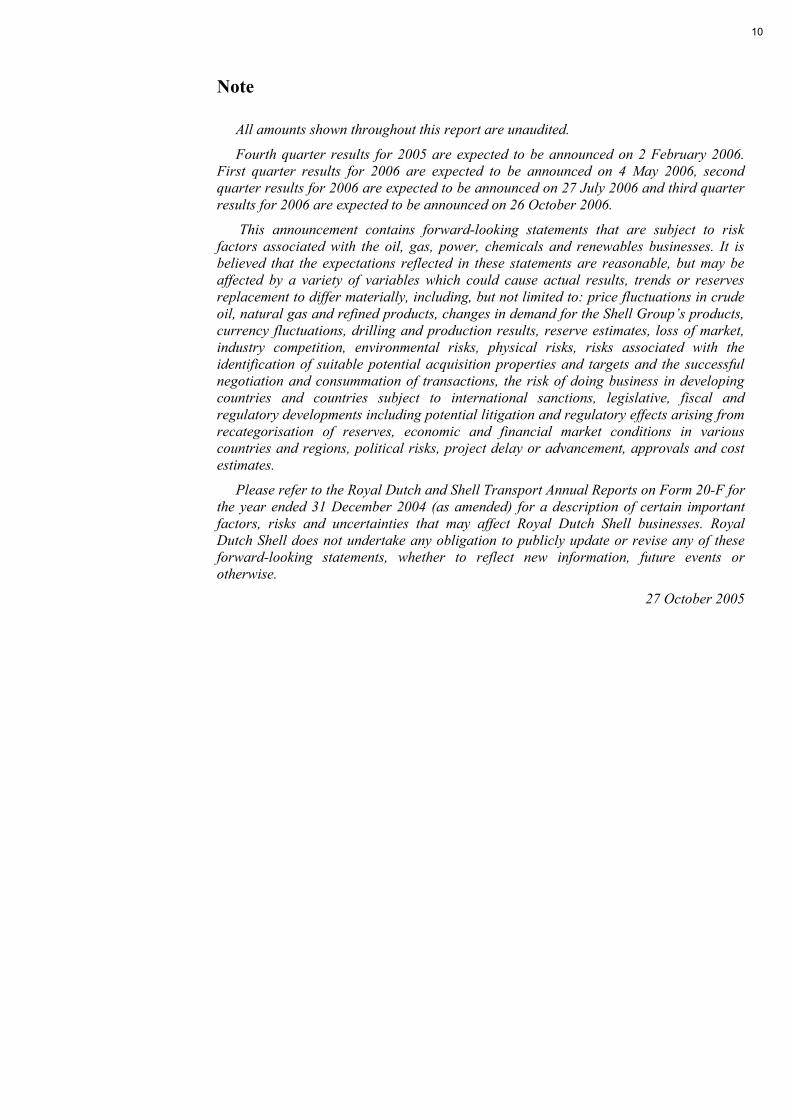
In the third quarter, Other Industry and Corporate segments earnings were $97
million compared to a loss of $206 million a year ago as a result of gains from exchange rate movements and lower interest charges. The third quarter 2005 included impairment charges of $60 million in Other Industry Segments and costs related to the Unification of Royal Dutch and Shell Transport and Trading in Corporate.
10
Note
All amounts shown throughout this report are unaudited.
Fourth quarter results for 2005 are expected to be announced on 2 February 2006. First quarter results for 2006 are expected to be announced on 4 May 2006, second quarter results for 2006 are expected to be announced on 27 July 2006 and third quarter results for 2006 are expected to be announced on 26 October 2006.
This announcement contains forward-looking statements that are subject to risk factors associated with the oil, gas, power, chemicals and renewables businesses. It is believed that the expectations reflected in these statements are reasonable, but may be affected by a variety of variables which could cause actual results, trends or reserves replacement to differ materially, including, but not limited to: price fluctuations in crude oil, natural gas and refined products, changes in demand for the Shell Group’s products, currency fluctuations, drilling and production results, reserve estimates, loss of market, industry competition, environmental risks, physical risks, risks associated with the identification of suitable potential acquisition properties and targets and the successful negotiation and consummation of transactions, the risk of doing business in developing countries and countries subject to international sanctions, legislative, fiscal and regulatory developments including potential litigation and regulatory effects arising from recategorisation of reserves, economic and financial market conditions in various countries and regions, political risks, project delay or advancement, approvals and cost estimates.
Please refer to the Royal Dutch and Shell Transport Annual Reports on Form 20-F for the year ended 31 December 2004 (as amended) for a description of certain important factors, risks and uncertainties that may affect Royal Dutch Shell businesses. Royal Dutch Shell does not undertake any obligation to publicly update or revise any of these forward-looking statements, whether to reflect new information, future events or otherwise.
27 October 2005

-11-
Appendix 1: Royal Dutch Shell financial report and tables
Statement of income (see note 1)
QUARTERS $ million NINE MONTHS Q3 Q2 Q3
2005 2005 2004 % 1 2005 2004 %
94,717 101,383 89,006 +6 Sales proceeds 286,168 243,634 +17
18,282 18,739 18,321Less: Sales taxes, excise duties and similar levies 54,933 53,549
___________ ___________ ___________ ___________ ___________
76,435 82,644 70,685 +8 Revenue 231,235 190,085 +2260,704 69,464 58,604 Cost of sales 188,733 157,901
___________ ___________ ___________ ___________ ___________
15,731 13,180 12,081 +30 Gross profit 42,502 32,184 +32
3,150 3,148 3,110 Selling and distribution expenses 9,462 9,046613 769 533 Administrative expenses 1,757 1,646275 248 294 Exploration 784 1,294
3,081 1,080 1,254 Share of profit of equity accounted investments 5,734 3,496(268) 39 11 Net finance costs and other (income)/expense (159) (32)
___________ ___________ ___________ ___________ ___________
15,042 10,056 9,387 +60 Income before taxation 36,392 23,726 +53
5,558 4,595 3,790 Taxation 14,427 9,276___________ ___________ ___________ ___________ ___________
9,484 5,461 5,597 Income from continuing operations 21,965 14,450
(93) - 23 Income from discontinued operations (307) 65___________ ___________ ___________ ___________ ___________
9,391 5,461 5,620 +67 Income for the period 21,658 14,515 +49========== ========== ========== ========== ==========
359 225 249 Income attributable to minority interests 715 546
___________ ___________ ___________ ___________ ___________
9,032 5,236 5,371 +68 Income attributable to shareholders 20,943 13,969 +50___________ ___________ ___________ ___________ ___________
1 Q3 on Q3 change
Basic earnings per share (see note 1 and 9) QUARTERS NINE MONTHS
Q3 Q2 Q3 2005 2005 2004 2005 2004
1.35 0.78 0.80 Income per share ($) 3.12 2.06
1.10 0.69 0.65 CCS earnings per share ($) 2.61 1.82
Diluted earnings per share (see note 1 and 9) QUARTERS NINE MONTHS
Q3 Q2 Q3 2005 2005 2004 2005 2004
1.35 0.78 0.79 Income per share ($) 3.11 2.06
1.10 0.69 0.65 CCS earnings per share ($) 2.61 1.82
-12-
Earnings by industry segment1
QUARTERS $ million NINE MONTHS Q3 Q2 Q3
2005 2005 2004 % 2 2005 2004 % Exploration & Production:
4,051 1,644 1,556 +160 World outside USA 7,705 4,679 +65926 1,101 787 +18 USA 2,972 2,226 +34
___________ ___________ ___________ ___________ ___________
4,977 2,745 2,343 +112 10,677 6,905 +55___________ ___________ ___________ ___________ ___________
Gas & Power: 469 74 345 +36 World outside USA 1,061 1,164 -9
87 (63) 9 USA (18) 46___________ ___________ ___________ ___________ ___________
556 11 354 +57 1,043 1,210 -14___________ ___________ ___________ ___________ ___________
Oil Products: 1,229 1,500 1,176 +5 World outside USA 4,204 3,243 +30
497 528 349 +42 USA 1,430 1,011 +41___________ ___________ ___________ ___________ ___________
1,726 2,028 1,525 +13 5,634 4,254 +32___________ ___________ ___________ ___________ ___________
Chemicals: 291 221 432 -33 World outside USA 792 973 -19
30 38 140 -79 USA 237 195 +22___________ ___________ ___________ ___________ ___________
321 259 572 -44 1,029 1,168 -12___________ ___________ ___________ ___________ ___________
(76) (8) (39) Other industry segments (92) (63)
___________ ___________ ___________ ___________ ___________
7,504 5,035 4,755 +58 TOTAL OPERATING SEGMENTS 18,291 13,474 +36___________ ___________ ___________ ___________ ___________
Corporate: 71 (74) (143) Interest income/(expense) (73) (513)
126 (6) 35 Currency exchange gains/(losses) 80 26(24) (130) (59) Other - including taxation (161) (142)
___________ ___________ ___________ ___________ ___________
173 (210) (167) (154) (629)___________ ___________ ___________ ___________ ___________
(308) (199) (207) Minority interests (592) (470)
___________ ___________ ___________ ___________ ___________
7,369 4,626 4,381 +68 CCS EARNINGS 17,545 12,375 +42___________ ___________ ___________ ___________ ___________
1,663 610 990 CCS adjustment for Oil Products 3,398 1,594
___________ ___________ ___________ ___________ ___________
9,032 5,236 5,371 +68 Income attributable to shareholders 20,943 13,969 +50___________ ___________ ___________ ___________ ___________
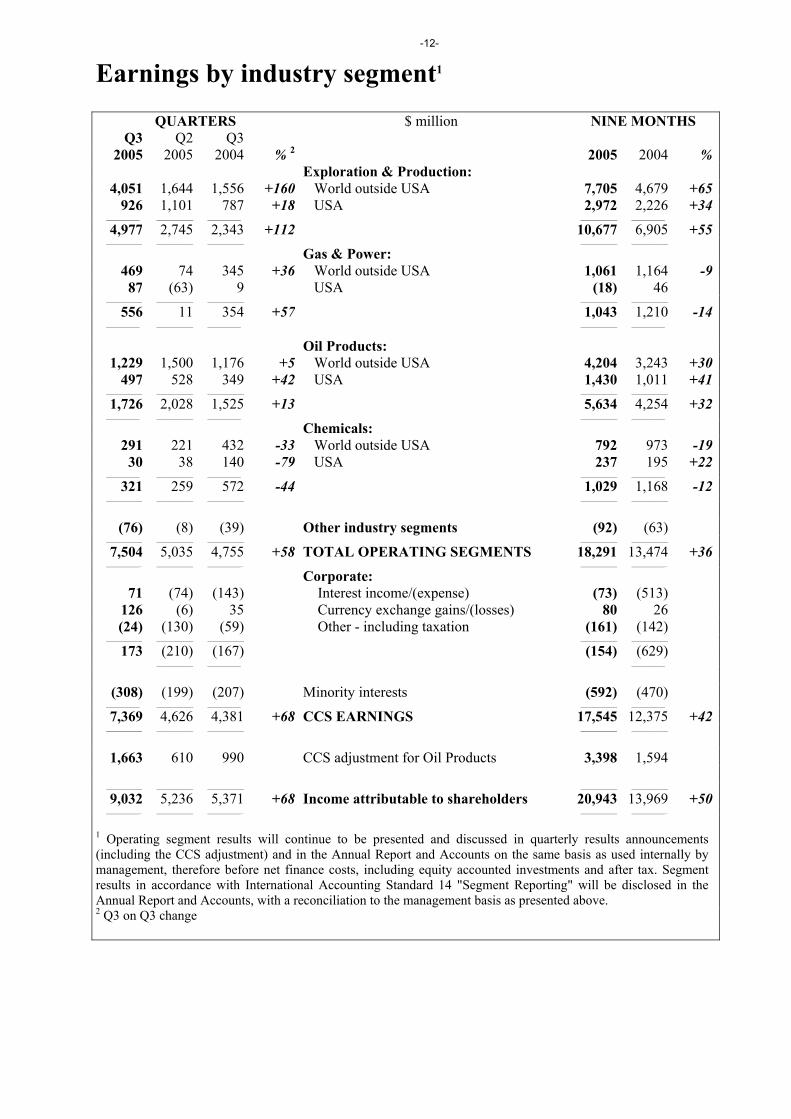
1 Operating segment results will continue to be presented and discussed in quarterly results announcements (including the CCS adjustment) and in the Annual Report and Accounts on the same basis as used internally by management, therefore before net finance costs, including equity accounted investments and after tax. Segment results in accordance with International Accounting Standard 14 "Segment Reporting" will be disclosed in the Annual Report and Accounts, with a reconciliation to the management basis as presented above. 2 Q3 on Q3 change
-13-
Summarised balance sheet (see note 1 and 6)
$ million Sep 30 Jun 30 Sep 30ASSETS 2005 2005 2004
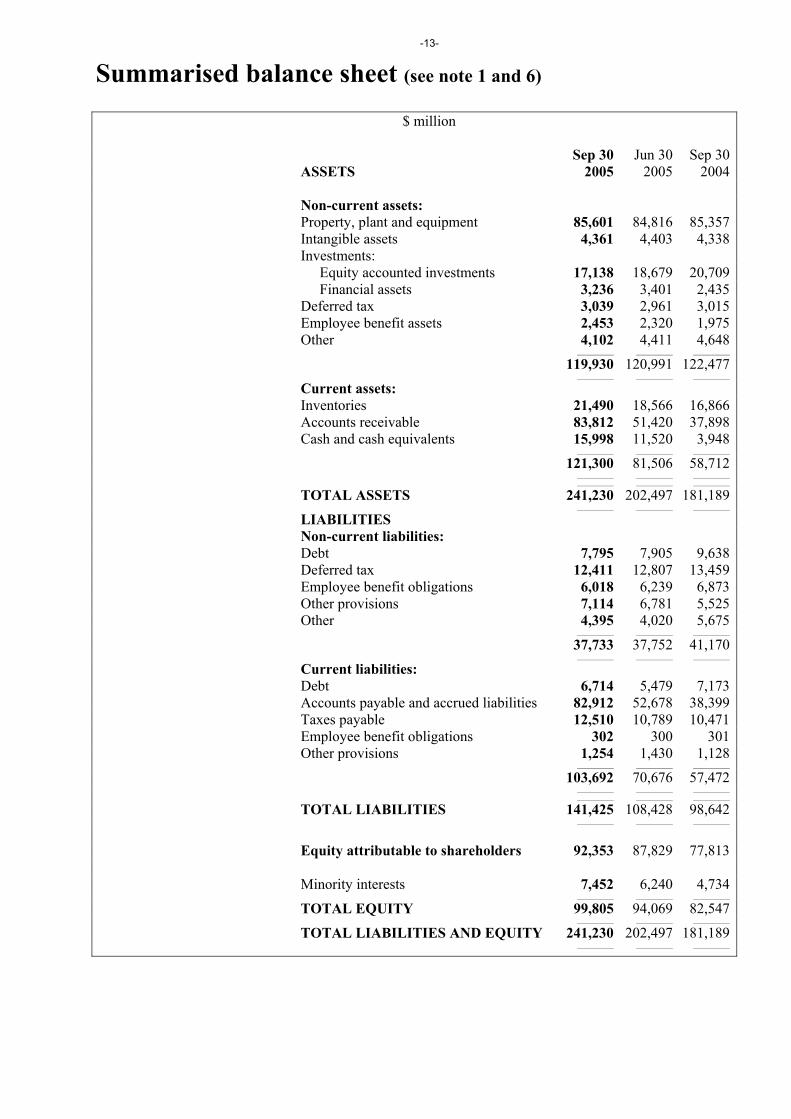
Non-current assets: Property, plant and equipment 85,601 84,816 85,357Intangible assets 4,361 4,403 4,338Investments:
Equity accounted investments 17,138 18,679 20,709Financial assets 3,236 3,401 2,435
Deferred tax 3,039 2,961 3,015Employee benefit assets 2,453 2,320 1,975Other 4,102 4,411 4,648
___________ ___________ ___________
119,930 120,991 122,477___________ ___________ ___________
Current assets: Inventories 21,490 18,566 16,866Accounts receivable 83,812 51,420 37,898Cash and cash equivalents 15,998 11,520 3,948
___________ ___________ ___________
121,300 81,506 58,712___________ ___________ ______________________ ___________ ___________
TOTAL ASSETS 241,230 202,497 181,189___________ ___________ ___________
LIABILITIES Non-current liabilities: Debt 7,795 7,905 9,638Deferred tax 12,411 12,807 13,459Employee benefit obligations 6,018 6,239 6,873Other provisions 7,114 6,781 5,525Other 4,395 4,020 5,675
___________ ___________ ___________
37,733 37,752 41,170___________ ___________ ___________
Current liabilities: Debt 6,714 5,479 7,173Accounts payable and accrued liabilities 82,912 52,678 38,399Taxes payable 12,510 10,789 10,471Employee benefit obligations 302 300 301Other provisions 1,254 1,430 1,128
___________ ___________ ___________
103,692 70,676 57,472___________ ___________ ______________________ ___________ ___________
TOTAL LIABILITIES 141,425 108,428 98,642___________ ___________ ___________
Equity attributable to shareholders 92,353 87,829 77,813 Minority interests 7,452 6,240 4,734
___________ ___________ ___________
TOTAL EQUITY 99,805 94,069 82,547___________ ___________ ___________
TOTAL LIABILITIES AND EQUITY 241,230 202,497 181,189___________ ___________ ___________
-14-
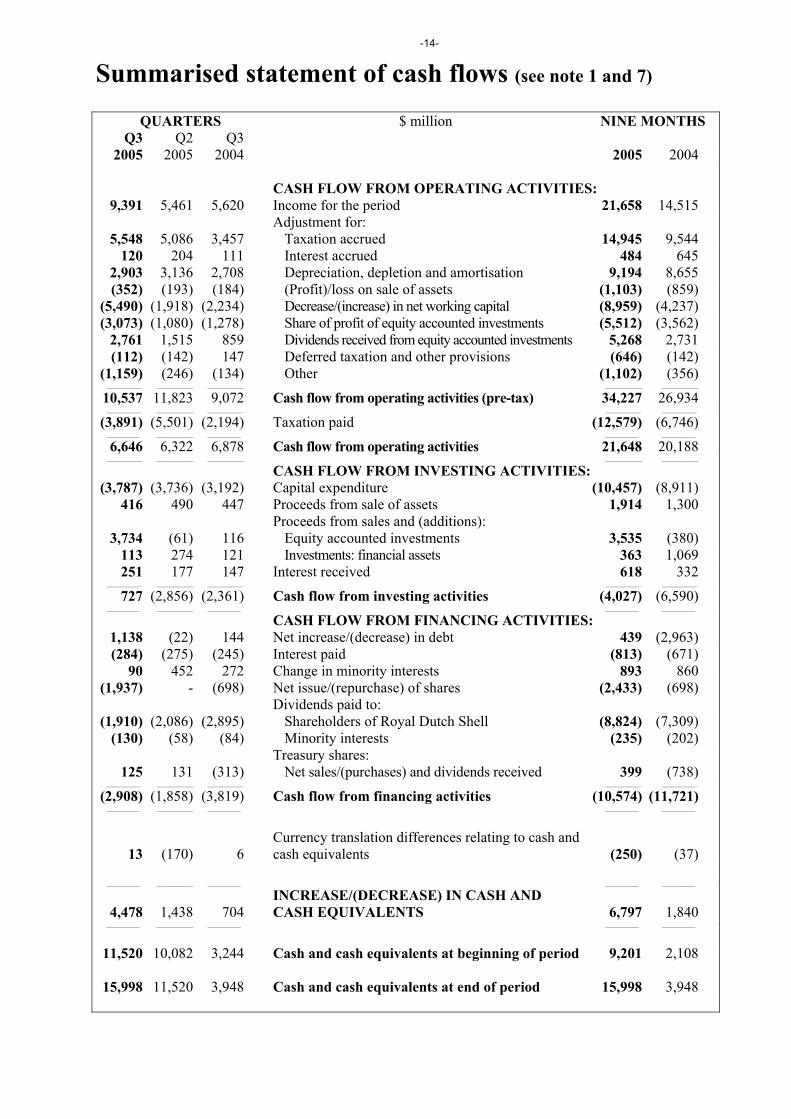
Summarised statement of cash flows (see note 1 and 7)
QUARTERS $ million NINE MONTHS Q3 Q2 Q3
2005 2005 2004 2005 2004 CASH FLOW FROM OPERATING ACTIVITIES:
9,391 5,461 5,620 Income for the period 21,658 14,515 Adjustment for:
5,548 5,086 3,457 Taxation accrued 14,945 9,544120 204 111 Interest accrued 484 645
2,903 3,136 2,708 Depreciation, depletion and amortisation 9,194 8,655(352) (193) (184) (Profit)/loss on sale of assets (1,103) (859)
(5,490) (1,918) (2,234) Decrease/(increase) in net working capital (8,959) (4,237)(3,073) (1,080) (1,278) Share of profit of equity accounted investments (5,512) (3,562)
2,761 1,515 859 Dividends received from equity accounted investments 5,268 2,731(112) (142) 147 Deferred taxation and other provisions (646) (142)
(1,159) (246) (134) Other (1,102) (356)___________ ___________ ___________ ___________ ___________
10,537 11,823 9,072 Cash flow from operating activities (pre-tax) 34,227 26,934___________ ___________ ___________ ___________ ___________
(3,891) (5,501) (2,194) Taxation paid (12,579) (6,746)___________ ___________ ___________ ___________ ___________
6,646 6,322 6,878 Cash flow from operating activities 21,648 20,188___________ ___________ ___________ ___________ ___________
CASH FLOW FROM INVESTING ACTIVITIES: (3,787) (3,736) (3,192) Capital expenditure (10,457) (8,911)
416 490 447 Proceeds from sale of assets 1,914 1,300 Proceeds from sales and (additions):
3,734 (61) 116 Equity accounted investments 3,535 (380)113 274 121 Investments: financial assets 363 1,069251 177 147 Interest received 618 332
___________ ___________ ___________ ___________ ___________
727 (2,856) (2,361) Cash flow from investing activities (4,027) (6,590)___________ ___________ ___________ ___________ ___________
CASH FLOW FROM FINANCING ACTIVITIES: 1,138 (22) 144 Net increase/(decrease) in debt 439 (2,963)(284) (275) (245) Interest paid (813) (671)
90 452 272 Change in minority interests 893 860(1,937) - (698) Net issue/(repurchase) of shares (2,433) (698)
Dividends paid to: (1,910) (2,086) (2,895) Shareholders of Royal Dutch Shell (8,824) (7,309)
(130) (58) (84) Minority interests (235) (202) Treasury shares:
125 131 (313) Net sales/(purchases) and dividends received 399 (738)___________ ___________ ___________ ___________ ___________
(2,908) (1,858) (3,819) Cash flow from financing activities (10,574) (11,721)___________ ___________ ___________ ___________ ___________
13 (170) 6 Currency translation differences relating to cash and cash equivalents (250) (37)
___________ ___________ ___________ ___________ ___________
4,478 1,438 704 INCREASE/(DECREASE) IN CASH AND CASH EQUIVALENTS 6,797 1,840
___________ ___________ ___________ ___________ ___________
11,520 10,082 3,244 Cash and cash equivalents at beginning of period 9,201 2,108
15,998 11,520 3,948 Cash and cash equivalents at end of period 15,998 3,948
-15-
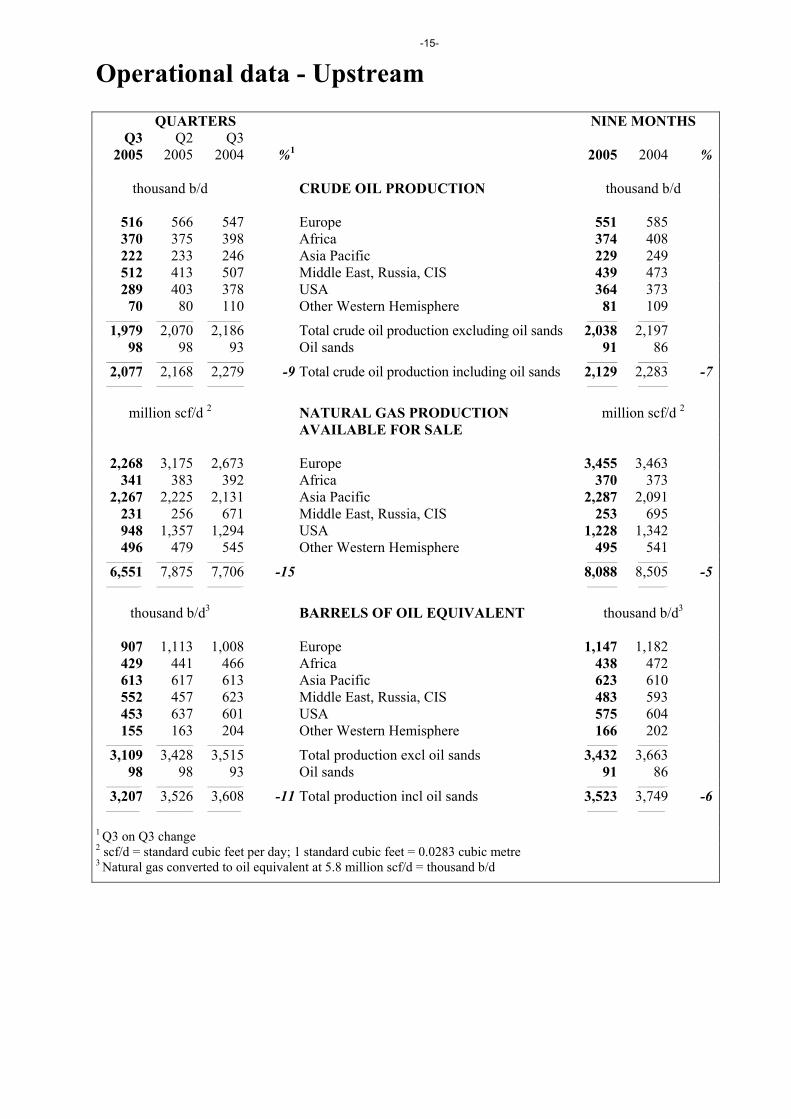
Operational data - Upstream
QUARTERS NINE MONTHS Q3 Q2 Q3
2005 2005 2004 %1 2005 2004 %
thousand b/d CRUDE OIL PRODUCTION thousand b/d
516 566 547 Europe 551 585370 375 398 Africa 374 408222 233 246 Asia Pacific 229 249512 413 507 Middle East, Russia, CIS 439 473289 403 378 USA 364 373
70 80 110 Other Western Hemisphere 81 109___________ ___________ ___________ _________ _________
1,979 2,070 2,186 Total crude oil production excluding oil sands 2,038 2,19798 98 93 Oil sands 91 86
___________ ___________ ___________ _________ _________
2,077 2,168 2,279 -9 Total crude oil production including oil sands 2,129 2,283 -7___________ ___________ ___________ _________ _________
million scf/d 2 NATURAL GAS PRODUCTION million scf/d 2
AVAILABLE FOR SALE
2,268 3,175 2,673 Europe 3,455 3,463341 383 392 Africa 370 373
2,267 2,225 2,131 Asia Pacific 2,287 2,091231 256 671 Middle East, Russia, CIS 253 695948 1,357 1,294 USA 1,228 1,342496 479 545 Other Western Hemisphere 495 541
___________ ___________ ___________ _________ _________
6,551 7,875 7,706 -15 8,088 8,505 -5___________ ___________ ___________ _________ _________
thousand b/d3 BARRELS OF OIL EQUIVALENT thousand b/d3
907 1,113 1,008 Europe 1,147 1,182429 441 466 Africa 438 472613 617 613 Asia Pacific 623 610552 457 623 Middle East, Russia, CIS 483 593453 637 601 USA 575 604155 163 204 Other Western Hemisphere 166 202
___________ ___________ ___________ _________ _________
3,109 3,428 3,515 Total production excl oil sands 3,432 3,66398 98 93 Oil sands 91 86
___________ ___________ ___________ _________ _________
3,207 3,526 3,608 -11 Total production incl oil sands 3,523 3,749 -6___________ ___________ ___________ _________ _________
1 Q3 on Q3 change 2 scf/d = standard cubic feet per day; 1 standard cubic feet = 0.0283 cubic metre 3 Natural gas converted to oil equivalent at 5.8 million scf/d = thousand b/d

-16-
Operational data – Upstream (continued)
QUARTERS NINE MONTHS Q3 Q2 Q3
2005 2005 2004 %1 2005 2004 %
million tonnes LIQUEFIED NATURAL GAS (LNG) million tonnes
2.48 2.48 2.44 +2 Equity LNG sales volume 7.84 7.39 +6
$/bbl Realised Oil Prices $/bbl 56.89 48.22 38.16 WOUSA 49.79 34.0756.24 47.08 38.68 USA 48.15 34.5256.83 48.05 38.23 Global 49.56 34.13
$/thousand scf Realised Gas Prices $/thousand scf
4.24 4.61 3.58 Europe 4.72 3.633.70 3.48 2.70 WOUSA (including Europe) 3.61 2.728.35 7.31 6.18 USA 7.41 6.024.59 4.39 3.50 Global 4.43 3.47
1 Q3 on Q3 change
-17-
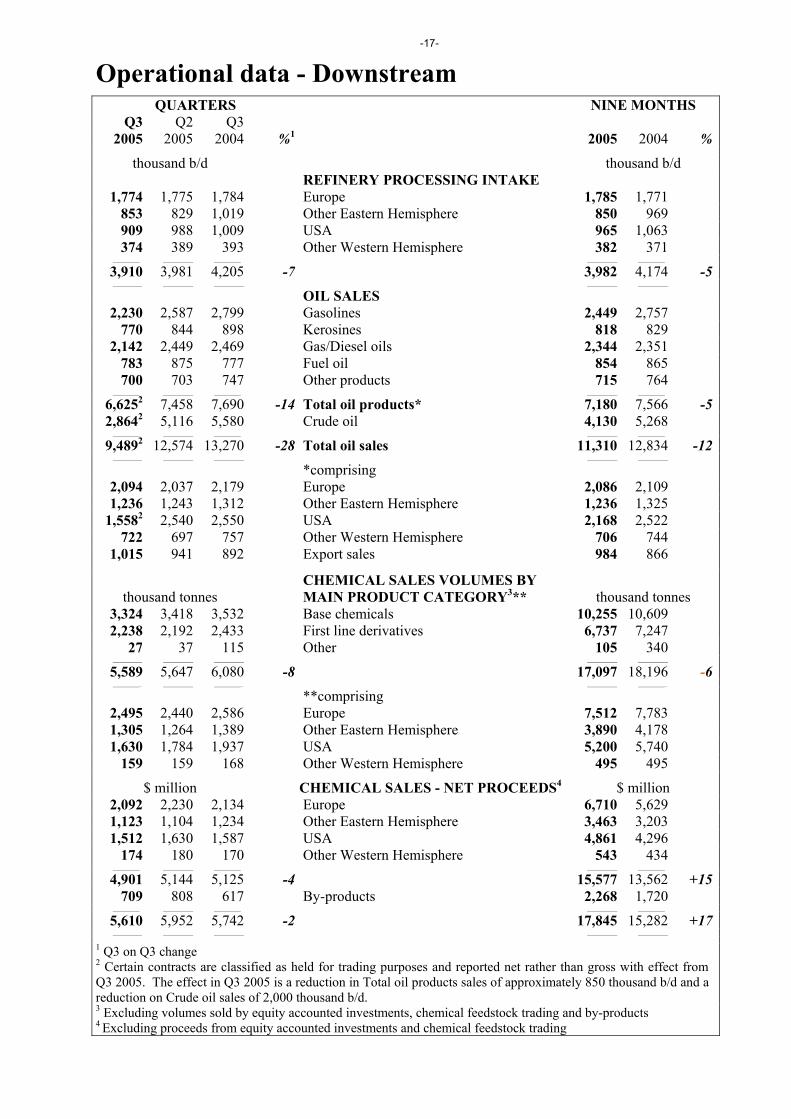
Operational data - Downstream QUARTERS NINE MONTHS
Q3 Q2 Q3 2005 2005 2004 %1 2005 2004 %
thousand b/d thousand b/d REFINERY PROCESSING INTAKE
1,774 1,775 1,784 Europe 1,785 1,771853 829 1,019 Other Eastern Hemisphere 850 969909 988 1,009 USA 965 1,063374 389 393 Other Western Hemisphere 382 371
_________ _________ _________ _________ _________
3,910 3,981 4,205 -7 3,982 4,174 -5_________ _________ _________ _________ _________
OIL SALES 2,230 2,587 2,799 Gasolines 2,449 2,757
770 844 898 Kerosines 818 8292,142 2,449 2,469 Gas/Diesel oils 2,344 2,351
783 875 777 Fuel oil 854 865700 703 747 Other products 715 764
_________ _________ _________ _________ _________
6,6252 7,458 7,690 -14 Total oil products* 7,180 7,566 -52,8642 5,116 5,580 Crude oil 4,130 5,268
_________ _________ _________ _________ _________
9,4892 12,574 13,270 -28 Total oil sales 11,310 12,834 -12_________ _________ _________ _________ _________
*comprising 2,094 2,037 2,179 Europe 2,086 2,1091,236 1,243 1,312 Other Eastern Hemisphere 1,236 1,325
1,5582 2,540 2,550 USA 2,168 2,522722 697 757 Other Western Hemisphere 706 744
1,015 941 892 Export sales 984 866
thousand tonnes CHEMICAL SALES VOLUMES BY MAIN PRODUCT CATEGORY3** thousand tonnes
3,324 3,418 3,532 Base chemicals 10,255 10,6092,238 2,192 2,433 First line derivatives 6,737 7,247
27 37 115 Other 105 340_________ _________ _________ _________ _________
5,589 5,647 6,080 -8 17,097 18,196 -6_________ _________ _________ _________ _________
**comprising 2,495 2,440 2,586 Europe 7,512 7,7831,305 1,264 1,389 Other Eastern Hemisphere 3,890 4,1781,630 1,784 1,937 USA 5,200 5,740
159 159 168 Other Western Hemisphere 495 495
$ million CHEMICAL SALES - NET PROCEEDS4 $ million 2,092 2,230 2,134 Europe 6,710 5,6291,123 1,104 1,234 Other Eastern Hemisphere 3,463 3,2031,512 1,630 1,587 USA 4,861 4,296
174 180 170 Other Western Hemisphere 543 434_________ _________ _________ _________ _________
4,901 5,144 5,125 -4 15,577 13,562 +15709 808 617 By-products 2,268 1,720
_________ _________ _________ _________ _________
5,610 5,952 5,742 -2 17,845 15,282 +17_________ _________ _________ _________ _________
1 Q3 on Q3 change 2 Certain contracts are classified as held for trading purposes and reported net rather than gross with effect from Q3 2005. The effect in Q3 2005 is a reduction in Total oil products sales of approximately 850 thousand b/d and a reduction on Crude oil sales of 2,000 thousand b/d. 3 Excluding volumes sold by equity accounted investments, chemical feedstock trading and by-products 4 Excluding proceeds from equity accounted investments and chemical feedstock trading
-18-
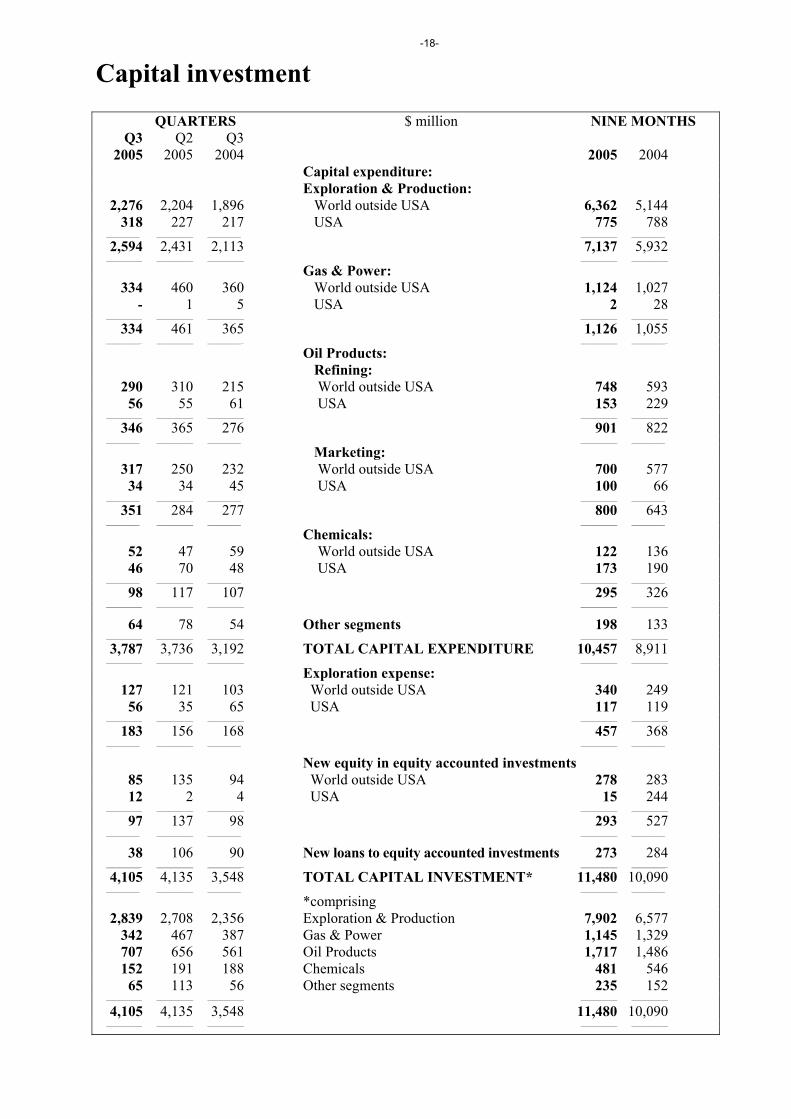
Capital investment
QUARTERS $ million NINE MONTHS Q3 Q2 Q3
2005 2005 2004 2005 2004 Capital expenditure: Exploration & Production:
2,276 2,204 1,896 World outside USA 6,362 5,144318 227 217 USA 775 788
___________ ___________ ___________ ___________ ___________
2,594 2,431 2,113 7,137 5,932___________ ___________ ___________ ___________ ___________
Gas & Power: 334 460 360 World outside USA 1,124 1,027
- 1 5 USA 2 28___________ ___________ ___________ ___________ ___________
334 461 365 1,126 1,055___________ ___________ ___________ ___________ ___________
Oil Products: Refining:
290 310 215 World outside USA 748 59356 55 61 USA 153 229
___________ ___________ ___________ ___________ ___________
346 365 276 901 822___________ ___________ ___________ ___________ ___________
Marketing: 317 250 232 World outside USA 700 577
34 34 45 USA 100 66___________ ___________ ___________ ___________ ___________
351 284 277 800 643___________ ___________ ___________ ___________ ___________
Chemicals: 52 47 59 World outside USA 122 13646 70 48 USA 173 190
___________ ___________ ___________ ___________ ___________
98 117 107 295 326___________ ___________ ___________ ___________ ___________
64 78 54 Other segments 198 133___________ ___________ ___________ ___________ ___________
3,787 3,736 3,192 TOTAL CAPITAL EXPENDITURE 10,457 8,911___________ ___________ ___________ ___________ ___________
Exploration expense: 127 121 103 World outside USA 340 249
56 35 65 USA 117 119___________ ___________ ___________ ___________ ___________
183 156 168 457 368___________ ___________ ___________ ___________ ___________
New equity in equity accounted investments 85 135 94 World outside USA 278 28312 2 4 USA 15 244
___________ ___________ ___________ ___________ ___________
97 137 98 293 527___________ ___________ ___________ ___________ ___________
38 106 90 New loans to equity accounted investments 273 284___________ ___________ ___________ ___________ ___________
4,105 4,135 3,548 TOTAL CAPITAL INVESTMENT* 11,480 10,090___________ ___________ ___________ ___________ ___________
*comprising 2,839 2,708 2,356 Exploration & Production 7,902 6,577
342 467 387 Gas & Power 1,145 1,329707 656 561 Oil Products 1,717 1,486152 191 188 Chemicals 481 546
65 113 56 Other segments 235 152___________ ___________ ___________ ___________ ___________
4,105 4,135 3,548 11,480 10,090___________ ___________ ___________ ___________ ___________
-19-
Notes NOTE 1. Accounting policies and basis of presentation
In the third quarter 2005, under the Unification transaction, Royal Dutch Shell plc became the Parent Company of Royal Dutch Petroleum Company (Royal Dutch) and The ‘‘Shell’’ Transport and Trading Company, plc (Shell Transport) by acquiring all outstanding shares of Shell Transport and approximately 98.5% of the outstanding shares of Royal Dutch.
The comparative periods represent information for Royal Dutch Shell as if it acquired 100% of Royal Dutch and Shell Transport. For financial reporting purposes, the existing 1.5% minority holders in Royal Dutch will be shown in the Royal Dutch Shell consolidated financial statements as a minority interest in Royal Dutch Shell from 10 August 2005, as prior to that time those holders had a right to participate in the Exchange Offer and receive Royal Dutch Shell shares. As a result, the average quarterly net income attributable to the minority will be prorated for the period from 10 August 2005 through 30 September 2005. This presentation for accounting purposes does not affect the entitlement of the Royal Dutch minority to the third quarter dividend declared by Royal Dutch, payable on 15 December 2005, or reflect a change in their underlying economic interest in the Group companies. Included in Income attributable to Minority Interests in the Statement of Income for the third quarter 2005 and in Minority Interests in the Summarised Balance Sheet are $46 million and $842 million attributable to minority holders in Royal Dutch. There are no comparatives for prior quarters.
These Financial Statements are considered historical and give retroactive effect for all periods presented to the Unification Transaction, which has been accounted for using a carry-over basis of the historical costs of the assets and liabilities of Royal Dutch, Shell Transport and other companies comprising the Royal Dutch/Shell Group of Companies. The interest of the minority shareholders in Royal Dutch has also been accounted for using a carry-over basis of the historical costs of its consolidated assets and liabilities.
With effect from 2005, the quarterly financial statements, including comparative data, have been prepared in accordance with International Financial Reporting Standards (IFRS). The full details of the accounting policies under IFRS, are available under www.shell.com/investor.
NOTE 2. Earnings on an estimated current cost of supplies (CCS) basis
To facilitate a better understanding of underlying business performance, the financial results are also analysed on an estimated current cost of supplies (CCS) basis as applied for the Oil Products segment earnings. Earnings on an estimated current cost of supplies basis provide useful information concerning the effect of changes in the cost of supplies on Royal Dutch Shell’s results of operations but are not a measure of financial performance under IFRS.
On this basis, Oil Products segment cost of sales of the volumes sold during the period is based on the cost of supplies during the same period after making allowance for the estimated tax effect, instead of use of the first-in-first-out (FIFO) method of inventory accounting. The adjustment from Income to an estimated current cost of supplies basis has no related balance sheet entry. Earnings calculated on this basis do not represent an application of the last-in, first-out (LIFO) inventory basis and do not reflect any inventory draw down effects.
NOTE 3. Discontinued operations
Income from discontinued operations, comprising gains and losses on disposals and results of operations for the period, is provided in the statement of income in accordance with IFRS for separate major lines of business or geographical areas of operations.
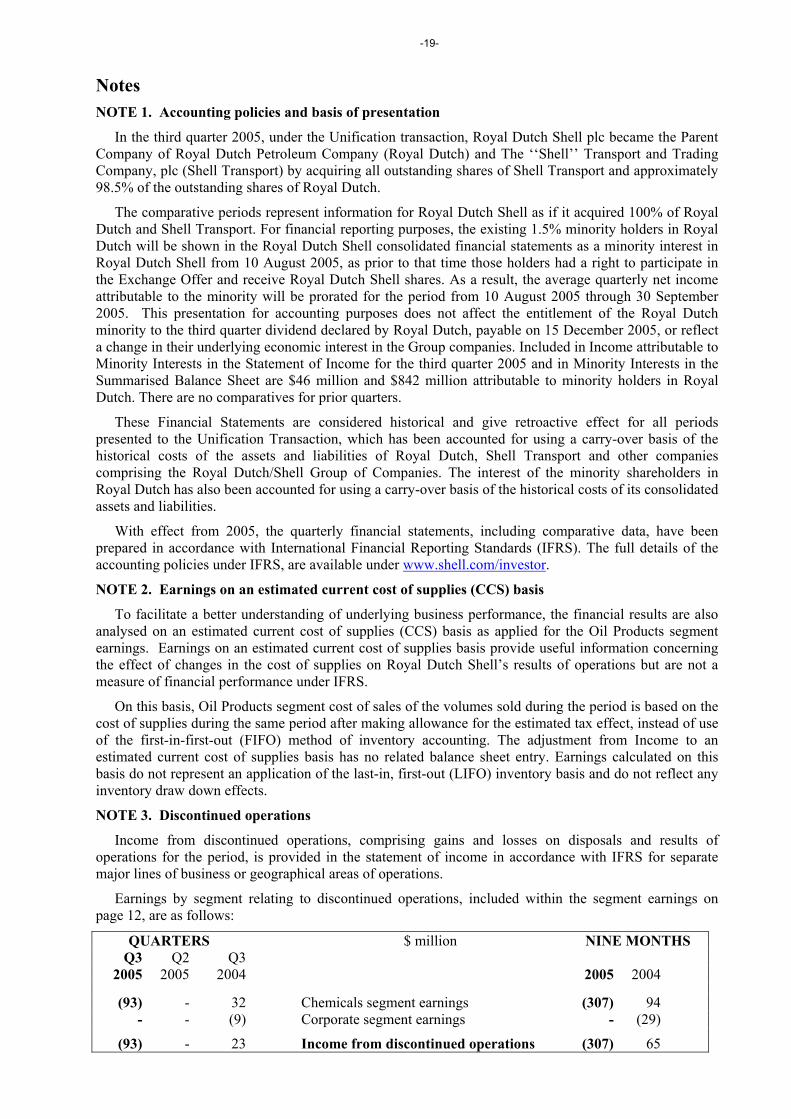
Earnings by segment relating to discontinued operations, included within the segment earnings on page 12, are as follows:
QUARTERS $ million NINE MONTHS Q3 Q2 Q3
2005 2005 2004 2005 2004
(93) - 32 Chemicals segment earnings (307) 94- - (9) Corporate segment earnings - (29)
(93) - 23 Income from discontinued operations (307) 65
-20-
Basic earnings per share for the third quarter 2005 for discontinued operations were $(0.01). Basic earnings per share for the second quarter 2005 for discontinued operations were nil.
NOTE 4. Return on average capital employed (ROACE)
ROACE on an income basis is the sum of the current and previous three quarters’ income attributable to shareholders plus interest, less tax and minority interest as a percentage of the average of Royal Dutch Shell’s share of closing capital employed and the opening capital employed a year earlier. The tax rate and the minority interest components are derived from calculations at the published segment level.
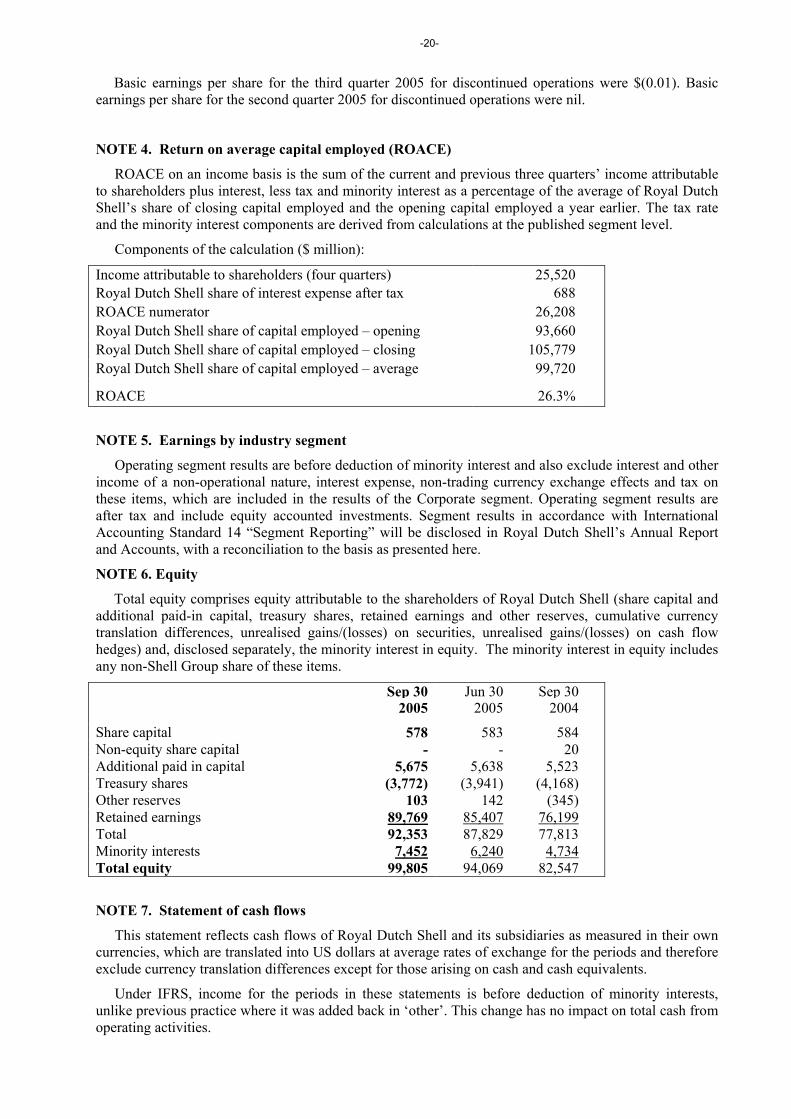
Components of the calculation ($ million):
Income attributable to shareholders (four quarters) 25,520 Royal Dutch Shell share of interest expense after tax 688 ROACE numerator 26,208 Royal Dutch Shell share of capital employed – opening 93,660 Royal Dutch Shell share of capital employed – closing 105,779 Royal Dutch Shell share of capital employed – average 99,720
ROACE 26.3%
NOTE 5. Earnings by industry segment
Operating segment results are before deduction of minority interest and also exclude interest and other income of a non-operational nature, interest expense, non-trading currency exchange effects and tax on these items, which are included in the results of the Corporate segment. Operating segment results are after tax and include equity accounted investments. Segment results in accordance with International Accounting Standard 14 “Segment Reporting” will be disclosed in Royal Dutch Shell’s Annual Report and Accounts, with a reconciliation to the basis as presented here.
NOTE 6. Equity
Total equity comprises equity attributable to the shareholders of Royal Dutch Shell (share capital and additional paid-in capital, treasury shares, retained earnings and other reserves, cumulative currency translation differences, unrealised gains/(losses) on securities, unrealised gains/(losses) on cash flow hedges) and, disclosed separately, the minority interest in equity. The minority interest in equity includes any non-Shell Group share of these items.
Sep 30 Jun 30 Sep 30 2005 2005 2004
Share capital 578 583 584 Non-equity share capital - - 20 Additional paid in capital 5,675 5,638 5,523 Treasury shares (3,772) (3,941) (4,168) Other reserves 103 142 (345) Retained earnings 89,769 85,407 76,199 Total 92,353 87,829 77,813 Minority interests 7,452 6,240 4,734 Total equity 99,805 94,069 82,547
NOTE 7. Statement of cash flows
This statement reflects cash flows of Royal Dutch Shell and its subsidiaries as measured in their own currencies, which are translated into US dollars at average rates of exchange for the periods and therefore exclude currency translation differences except for those arising on cash and cash equivalents.
Under IFRS, income for the periods in these statements is before deduction of minority interests, unlike previous practice where it was added back in ‘other’. This change has no impact on total cash from operating activities.
-21-
Write offs of previously capitalised exploratory well costs are now added back within ‘cash flow from operating activities’ under ‘other’ and are not deducted from capital expenditure. This is also reflected in the capital investment table with no change in total capital investment.
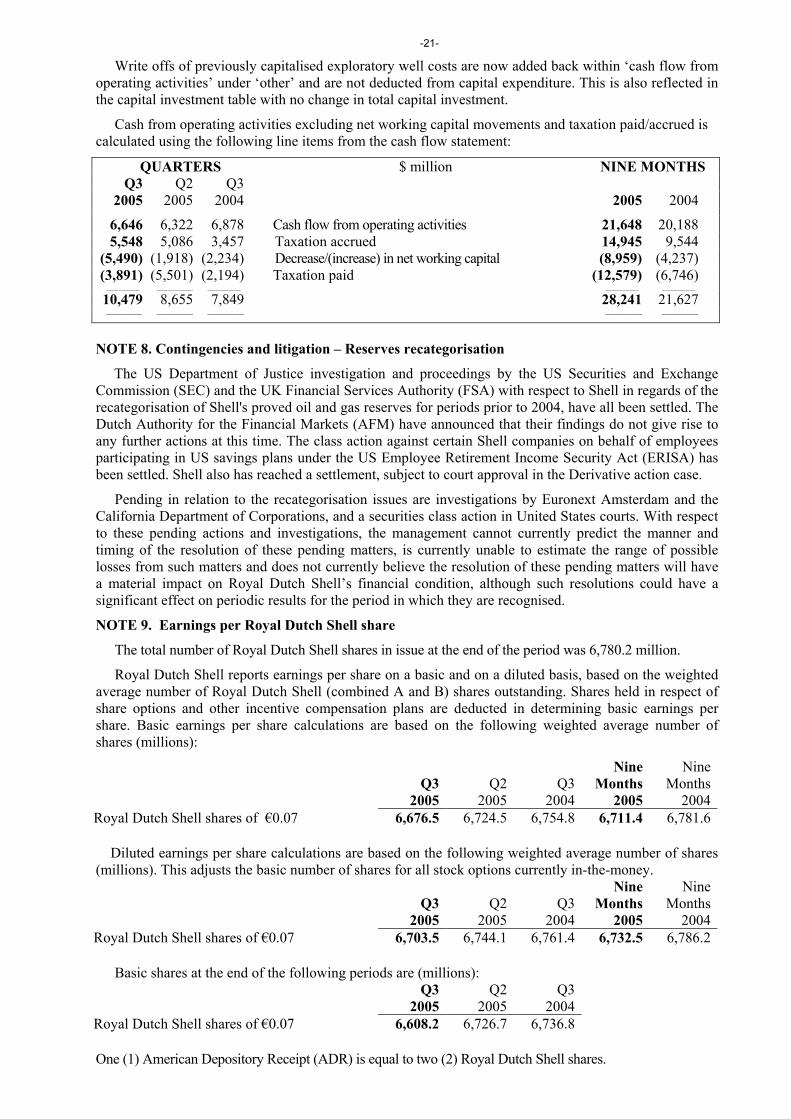
Cash from operating activities excluding net working capital movements and taxation paid/accrued is calculated using the following line items from the cash flow statement:
QUARTERS $ million NINE MONTHS Q3 Q2 Q3
2005 2005 2004 2005 2004
6,646 6,322 6,878 Cash flow from operating activities 21,648 20,1885,548 5,086 3,457 Taxation accrued 14,945 9,544
(5,490) (1,918) (2,234) Decrease/(increase) in net working capital (8,959) (4,237)(3,891) (5,501) (2,194) Taxation paid (12,579) (6,746)
___________ ___________ ___________ ___________ ___________
10,479 8,655 7,849 28,241 21,627___________ ___________ ___________ ___________ ___________
NOTE 8. Contingencies and litigation – Reserves recategorisation
The US Department of Justice investigation and proceedings by the US Securities and Exchange Commission (SEC) and the UK Financial Services Authority (FSA) with respect to Shell in regards of the recategorisation of Shell's proved oil and gas reserves for periods prior to 2004, have all been settled. The Dutch Authority for the Financial Markets (AFM) have announced that their findings do not give rise to any further actions at this time. The class action against certain Shell companies on behalf of employees participating in US savings plans under the US Employee Retirement Income Security Act (ERISA) has been settled. Shell also has reached a settlement, subject to court approval in the Derivative action case.
Pending in relation to the recategorisation issues are investigations by Euronext Amsterdam and the California Department of Corporations, and a securities class action in United States courts. With respect to these pending actions and investigations, the management cannot currently predict the manner and timing of the resolution of these pending matters, is currently unable to estimate the range of possible losses from such matters and does not currently believe the resolution of these pending matters will have a material impact on Royal Dutch Shell’s financial condition, although such resolutions could have a significant effect on periodic results for the period in which they are recognised.
NOTE 9. Earnings per Royal Dutch Shell share
The total number of Royal Dutch Shell shares in issue at the end of the period was 6,780.2 million.
Royal Dutch Shell reports earnings per share on a basic and on a diluted basis, based on the weighted average number of Royal Dutch Shell (combined A and B) shares outstanding. Shares held in respect of share options and other incentive compensation plans are deducted in determining basic earnings per share. Basic earnings per share calculations are based on the following weighted average number of shares (millions):
Q3 Q2 Q3 Nine
Months Nine
Months 2005 2005 2004 2005 2004Royal Dutch Shell shares of €0.07 6,676.5 6,724.5 6,754.8 6,711.4 6,781.6
Diluted earnings per share calculations are based on the following weighted average number of shares (millions). This adjusts the basic number of shares for all stock options currently in-the-money.
Q3 Q2 Q3 Nine
Months Nine
Months 2005 2005 2004 2005 2004Royal Dutch Shell shares of €0.07 6,703.5 6,744.1 6,761.4 6,732.5 6,786.2
Basic shares at the end of the following periods are (millions):
Q3 Q2 Q3 2005 2005 2004 Royal Dutch Shell shares of €0.07 6,608.2 6,726.7 6,736.8 One (1) American Depository Receipt (ADR) is equal to two (2) Royal Dutch Shell shares.
-22-
Appendix 2: Market Commentary
Crude oil prices
35
40
45
50
55
60
65
2004Q3
2004Q4
2005Q1
2005Q2
2005Q3
WTI
Brent
$/bbl Refining margins
0
2
4
6
8
10
12
14
16
18
2004Q3
2004Q4
2005Q1
2005Q2
2005Q3
ANS USWC cokingWTS USGC cokingRotterdamSingapore
$/bbl
Cracker margins
0
100
200
300
400
500
600
2004Q3
2004Q4
2005Q1
2005Q2
2005Q3
US EthaneW Europe Naphtha
$/t
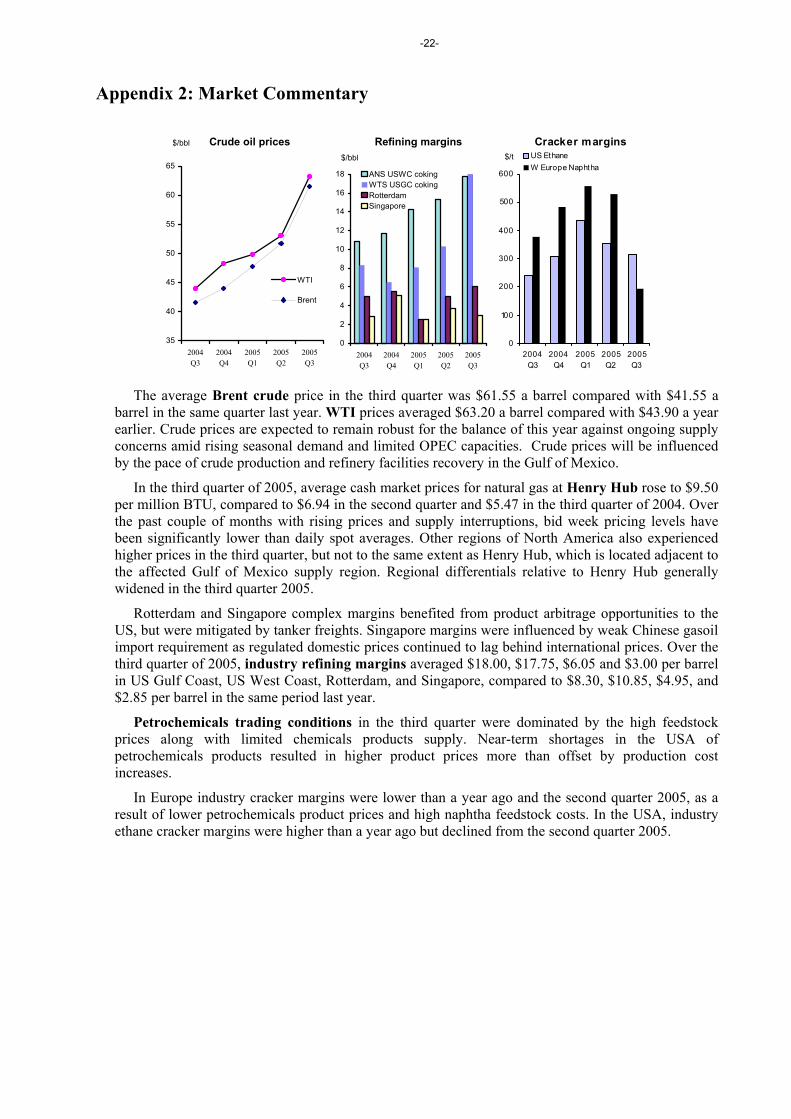
The average Brent crude price in the third quarter was $61.55 a barrel compared with $41.55 a
barrel in the same quarter last year. WTI prices averaged $63.20 a barrel compared with $43.90 a year earlier. Crude prices are expected to remain robust for the balance of this year against ongoing supply concerns amid rising seasonal demand and limited OPEC capacities. Crude prices will be influenced by the pace of crude production and refinery facilities recovery in the Gulf of Mexico.
In the third quarter of 2005, average cash market prices for natural gas at Henry Hub rose to $9.50 per million BTU, compared to $6.94 in the second quarter and $5.47 in the third quarter of 2004. Over the past couple of months with rising prices and supply interruptions, bid week pricing levels have been significantly lower than daily spot averages. Other regions of North America also experienced higher prices in the third quarter, but not to the same extent as Henry Hub, which is located adjacent to the affected Gulf of Mexico supply region. Regional differentials relative to Henry Hub generally widened in the third quarter 2005.
Rotterdam and Singapore complex margins benefited from product arbitrage opportunities to the US, but were mitigated by tanker freights. Singapore margins were influenced by weak Chinese gasoil import requirement as regulated domestic prices continued to lag behind international prices. Over the third quarter of 2005, industry refining margins averaged $18.00, $17.75, $6.05 and $3.00 per barrel in US Gulf Coast, US West Coast, Rotterdam, and Singapore, compared to $8.30, $10.85, $4.95, and $2.85 per barrel in the same period last year.
Petrochemicals trading conditions in the third quarter were dominated by the high feedstock prices along with limited chemicals products supply. Near-term shortages in the USA of petrochemicals products resulted in higher product prices more than offset by production cost increases.
In Europe industry cracker margins were lower than a year ago and the second quarter 2005, as a result of lower petrochemicals product prices and high naphtha feedstock costs. In the USA, industry ethane cracker margins were higher than a year ago but declined from the second quarter 2005.
Related Documents


![Darfur, Divestment, And Dialogue - Penn Law...2009] DARFUR, DIVESTMENT, AND DIALOGUE 825 divestment and other forms of socially-responsible investing (“SRI”).7 Divestment allows](https://static.cupdf.com/doc/110x72/5febd6ae628913409a11023a/darfur-divestment-and-dialogue-penn-law-2009-darfur-divestment-and-dialogue.jpg)