Routing characteristics of ad hoc networks with unidirectional links Jorjeta G. Jetcheva a, * , David B. Johnson b a Computer Science Department, Carnegie Mellon University, Pittsburgh, PA 15213, United States b Computer Science Department, Rice University, Houston, TX 77005, United States Received 11 March 2004; accepted 11 June 2004 Available online 21 October 2004 Abstract Unidirectional links in an ad hoc network can result from factors such as heterogeneity of receiver and transmitter hardware, power control or topology control algorithms, or differing sources of interference or jamming. Previously proposed metrics for evaluating the difficulty of a unidirectional scenario are limited in scope and are frequently mis- leading. To be able to analyze ad hoc network routing protocol behavior in a complex networking environment, it is not sufficient to merely assign a single level of difficulty to a unidirectional network scenario; the many interrelated routing characteristics of these scenarios must be understood. In this paper, we develop a set of metrics for describing these characteristics, for example for characterizing routing scenarios in simulations, analysis, and testbed implementations. Based on these metrics, we perform a detailed simulation analysis of the routing characteristics of the three most com- mon simulation models for generating unidirectional links in ad hoc networks: the random-power model, the two-power model, and the three-power model. Our findings enable protocol designers to better choose a set of network scenarios and parameters that truly explore a wide range of a routing protocolÕs behaviors in the presence of unidirectional links, and to better understand the complex interplay between routing mechanisms and network conditions. Ó 2004 Elsevier B.V. All rights reserved. Keywords: Unidirectional links; Routing; Ad hoc networks; Mesh networks 1. Introduction A group of wireless mobile hosts that wish to communicate may form an ad hoc network, for- warding packets for each other to support hosts beyond the single-hop wireless transmission range. Most routing research in wireless ad hoc networks 1570-8705/$ - see front matter Ó 2004 Elsevier B.V. All rights reserved. doi:10.1016/j.adhoc.2004.09.001 * Corresponding author. Tel.: +1 408 399 7771. E-mail addresses: [email protected] (J.G. Jetcheva), [email protected] (D.B. Johnson). Ad Hoc Networks 4 (2006) 303–325 www.elsevier.com/locate/adhoc

Welcome message from author
This document is posted to help you gain knowledge. Please leave a comment to let me know what you think about it! Share it to your friends and learn new things together.
Transcript

Ad Hoc Networks 4 (2006) 303–325
www.elsevier.com/locate/adhoc
Routing characteristics of ad hoc networks withunidirectional links
Jorjeta G. Jetcheva a,*, David B. Johnson b
a Computer Science Department, Carnegie Mellon University, Pittsburgh, PA 15213, United Statesb Computer Science Department, Rice University, Houston, TX 77005, United States
Received 11 March 2004; accepted 11 June 2004Available online 21 October 2004
Abstract
Unidirectional links in an ad hoc network can result from factors such as heterogeneity of receiver and transmitterhardware, power control or topology control algorithms, or differing sources of interference or jamming. Previouslyproposed metrics for evaluating the difficulty of a unidirectional scenario are limited in scope and are frequently mis-leading. To be able to analyze ad hoc network routing protocol behavior in a complex networking environment, it is notsufficient to merely assign a single level of difficulty to a unidirectional network scenario; the many interrelated routing
characteristics of these scenarios must be understood. In this paper, we develop a set of metrics for describing thesecharacteristics, for example for characterizing routing scenarios in simulations, analysis, and testbed implementations.Based on these metrics, we perform a detailed simulation analysis of the routing characteristics of the three most com-mon simulation models for generating unidirectional links in ad hoc networks: the random-power model, the two-powermodel, and the three-power model. Our findings enable protocol designers to better choose a set of network scenariosand parameters that truly explore a wide range of a routing protocol�s behaviors in the presence of unidirectional links,and to better understand the complex interplay between routing mechanisms and network conditions.� 2004 Elsevier B.V. All rights reserved.
Keywords: Unidirectional links; Routing; Ad hoc networks; Mesh networks
1570-8705/$ - see front matter � 2004 Elsevier B.V. All rights reservdoi:10.1016/j.adhoc.2004.09.001
* Corresponding author. Tel.: +1 408 399 7771.E-mail addresses: [email protected] (J.G. Jetcheva),
[email protected] (D.B. Johnson).
1. Introduction
A group of wireless mobile hosts that wish tocommunicate may form an ad hoc network, for-warding packets for each other to support hostsbeyond the single-hop wireless transmission range.Most routing research in wireless ad hoc networks
ed.

304 J.G. Jetcheva, D.B. Johnson / Ad Hoc Networks 4 (2006) 303–325
has been based on the simplifying assumption thatall wireless links in the network are bidirectionaland would therefore work equally well in bothdirections. However, there exist a variety of cir-cumstances in which this assumption does nothold. Unidirectional links can result from factorssuch as heterogeneity of receiver and transmitterhardware (leading to differing transmissionranges), power control algorithms (in which nodesvary their transmission power based on their cur-rent energy reserves), or topology control algo-rithms (aimed at reducing interference in thenetwork by computing the lowest transmit powerthat each node needs to stay connected to the net-work). Unidirectional links may also result frominterference around a node that prevents it fromreceiving packets even though other nodes are ableto receive its packets. For example, unidirectionallinks may often occur if some nodes in the ad hocnetwork are mounted on vehicles, using powerfultransmitters, and others are carried by pedestrians,using battery-powered transmitters with a shortertransmission range.
Routing protocols for ad hoc networks maydeal with the possibility of unidirectional links ina number of ways:
• Some protocols, such as DSDV [9] or conven-tional distance vector routing protocols, simplydo not consider the problem and thus may cre-ate routes that fail to work, causing packetlosses.
• Other protocols handle the presence of unidi-rectional links by treating all links as if theymight be unidirectional, in order to avoid theproblem above, but this causes extra routingoverhead. For example, DSR [5,6] normallyreturns a ROUTEOUTE REPLYEPLY packet using thereverse of the route recorded in the ROUTEOUTE
REQUESTEQUEST packet, but this only works over bidi-rectional links; DSR alternatively can be config-ured to independently discover the route forreturning the ROUTEOUTE REPLYEPLY, which can signifi-cantly increase routing overhead.
• Still other protocols detect and keep track ofunidirectional links as network conditionschange, and then either use them for routing(e.g., [11]) or simply ignore them as in AODV
[10]. Nodes using AODV attempt to learnwhich links to neighboring nodes are unidirec-tional; such a neighbor is remembered in a‘‘blacklist’’ set, and new routes through suchneighbors are ignored and not used for sometime. This approach limits connectivity in thenetwork, and may lead to increased overheadand failure to setup a route, when the mecha-nism to learn of unidirectional links has notyet detected a new unidirectional link or whenbidirectional communication becomes possibleover a previously unidirectional link.
There is growing interest in routing techniquesthat enable efficient routing over networks withunidirectional links, and in the effects of unidirec-tional links on routing protocol performance (e.g.,[1,7,8,11,14]). However, little work has been doneon evaluating the routing difficulty or routing char-
acteristics of ad hoc networks with unidirectionallinks, for instance for characterizing routing sce-narios in simulations, analysis, and testbed imple-mentations. In general, routing difficulty is higherwhen the likelihood that the routing protocolwould encounter a unidirectional link is higher,since handling each unidirectional link requiresadditional mechanisms and control packet trans-missions to either ignore or be able to use the linkfor routing. For example, if some node A receivesa packet directly from a node B but the link fromB to A is unidirectional, then A would not be ableto return an acknowledgment packet directly to B;rather, node A would need to send the acknowl-edgment to B along a multihop path (a multihopacknowledgment).
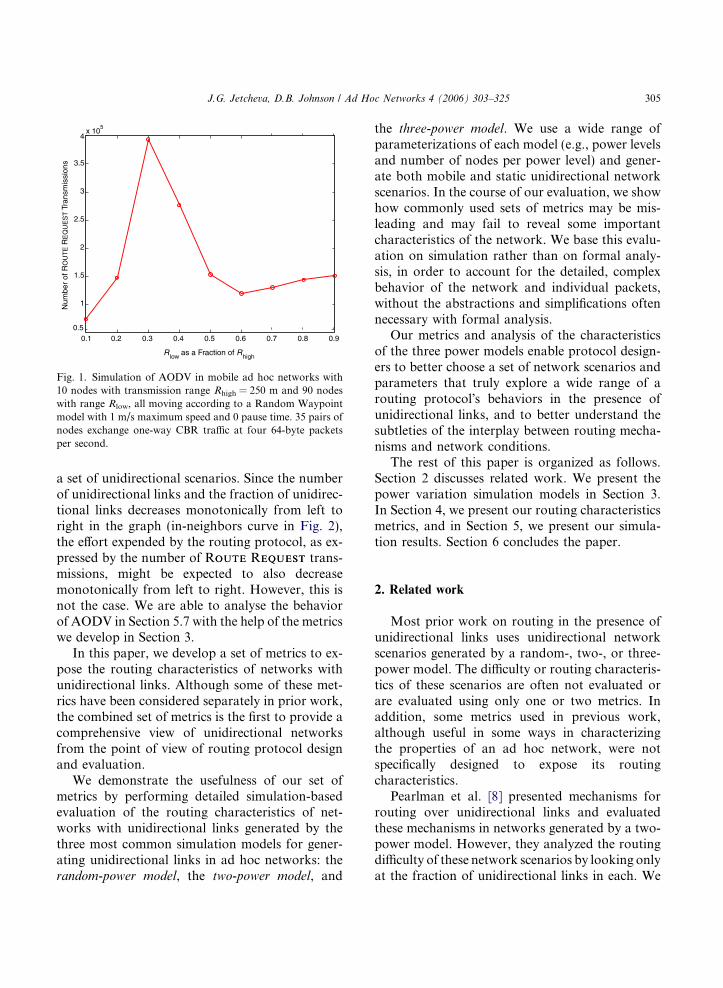
In prior work, the difficulty that a unidirectionalscenario presents to the routing protocol has fre-quently been expressed simply as the number orfraction of unidirectional links in the network.However, these metrics present a very limited viewof the routing characteristics of the network and donot adequately reflect the routing difficulty of a uni-directional network scenario. For example, AODV[10] is an on-demand routing protocol for ad hocnetworks that utilizes ROUTEOUTE REQUESTEQUEST packetfloods to discover routes and to perform route re-pair when routes break. Fig. 1 shows the numberof ROUTEOUTE REQUESTEQUEST transmissions in AODV for
0.1 0.2 0.3
low
0.4 0.5 0.6 0.7 0.8 0.90.5
1
1.5
2
2.5
3
3.5
4x 10
5
R as a Fraction of R
Num
ber
of R
OU
TE
RE
QU
ES
T T
rans
mis
sion
s
high
Fig. 1. Simulation of AODV in mobile ad hoc networks with10 nodes with transmission range Rhigh = 250 m and 90 nodeswith range Rlow, all moving according to a Random Waypointmodel with 1 m/s maximum speed and 0 pause time. 35 pairs ofnodes exchange one-way CBR traffic at four 64-byte packetsper second.
J.G. Jetcheva, D.B. Johnson / Ad Hoc Networks 4 (2006) 303–325 305
a set of unidirectional scenarios. Since the numberof unidirectional links and the fraction of unidirec-tional links decreases monotonically from left toright in the graph (in-neighbors curve in Fig. 2),the effort expended by the routing protocol, as ex-pressed by the number of ROUTEOUTE REQUESTEQUEST trans-missions, might be expected to also decreasemonotonically from left to right. However, this isnot the case. We are able to analyse the behaviorof AODV in Section 5.7 with the help of the metricswe develop in Section 3.
In this paper, we develop a set of metrics to ex-pose the routing characteristics of networks withunidirectional links. Although some of these met-rics have been considered separately in prior work,the combined set of metrics is the first to provide acomprehensive view of unidirectional networksfrom the point of view of routing protocol designand evaluation.
We demonstrate the usefulness of our set ofmetrics by performing detailed simulation-basedevaluation of the routing characteristics of net-works with unidirectional links generated by thethree most common simulation models for gener-ating unidirectional links in ad hoc networks: therandom-power model, the two-power model, and
the three-power model. We use a wide range ofparameterizations of each model (e.g., power levelsand number of nodes per power level) and gener-ate both mobile and static unidirectional networkscenarios. In the course of our evaluation, we showhow commonly used sets of metrics may be mis-leading and may fail to reveal some importantcharacteristics of the network. We base this evalu-ation on simulation rather than on formal analy-sis, in order to account for the detailed, complexbehavior of the network and individual packets,without the abstractions and simplifications oftennecessary with formal analysis.
Our metrics and analysis of the characteristicsof the three power models enable protocol design-ers to better choose a set of network scenarios andparameters that truly explore a wide range of arouting protocol�s behaviors in the presence ofunidirectional links, and to better understand thesubtleties of the interplay between routing mecha-nisms and network conditions.
The rest of this paper is organized as follows.Section 2 discusses related work. We present thepower variation simulation models in Section 3.In Section 4, we present our routing characteristicsmetrics, and in Section 5, we present our simula-tion results. Section 6 concludes the paper.
2. Related work
Most prior work on routing in the presence ofunidirectional links uses unidirectional networkscenarios generated by a random-, two-, or three-power model. The difficulty or routing characteris-tics of these scenarios are often not evaluated orare evaluated using only one or two metrics. Inaddition, some metrics used in previous work,although useful in some ways in characterizingthe properties of an ad hoc network, were notspecifically designed to expose its routingcharacteristics.
Pearlman et al. [8] presented mechanisms forrouting over unidirectional links and evaluatedthese mechanisms in networks generated by a two-power model. However, they analyzed the routingdifficulty of these network scenarios by looking onlyat the fraction of unidirectional links in each. We

306 J.G. Jetcheva, D.B. Johnson / Ad Hoc Networks 4 (2006) 303–325
build on their work by studying a larger set ofparameterizations of the two-power model, andby conducting a comprehensive evaluation of therouting characteristics of the scenarios generated.
Sinha et al. [14] proposed extensions to theZone Routing Protocol (ZRP) [4] for handling uni-directional links and evaluated these extensions innetworks with unidirectional links produced usingthe same two-power approach but with lessparameterizations and with no characterizationof the unidirectional scenarios.
Ramasubramanian et al. [11] presented a proto-col for a bidirectional abstraction of unidirectionallinks that handles them below the routing layer.The authors used five unidirectional network sce-narios to evaluate the proposed protocol, gener-ated using a two-power, a three-power, and afour-power model. The parameters for generatingthese scenarios were hand-picked to provide arange of routing difficulty. The authors use onlythe average number of in-neighbors of a node(neighbors that can reach a node but cannot bereached by it) and average reverse route lengthto characterize these scenarios.
Marina and Das [7] investigated the potentialbenefits of using unidirectional links for routingin ad hoc networks, using a random-power model,a two-power model, and a distributed topologycontrol method. They characterized the scenariosgenerated by each model by analyzing the connec-tivity of the networks in each scenario in terms ofthe size and number of strongly connected compo-nents in networks with different densities. Theyalso measured the difference in path length be-tween a network scenario with unidirectional linksand the same scenario with only bidirectionallinks. With the exception of the path metric, therest of the metrics were not specifically designedto study the routing characteristics of the network.Our analysis is based on a wider range of parame-terizations of the random- and two-power models,uses a set of metrics to expose the routing charac-teristics of the network, and also includes thethree-power model, not discussed by Marina andDas [7]. Unlike their work, we do not discusstopology control algorithms here, as each topol-ogy control algorithm is unique, and it is thus dif-ficult to generalize the results from such analysis.
Ramasubramanian and Mosse [12] also studiedthe connectivity of ad hoc networks with unidirec-tional links. Their analysis focused only on staticnetworks with power variations produced by arandom-power model and by a model that deter-mines the directionality of a link according to auniform random distribution (e.g., each link hasa probability P of being unidirectional). The met-rics they used to characterize network connectivityare reverse route length, the average size and dis-tribution of connected components for reverseroute lengths smaller than 1, 2, 3, or 4 hops, andaverage path length. In this paper, we use a broadrange of metrics to expose the characteristics of adhoc networks with unidirectional links from arouting perspective in the context of three differentpower models.
3. Methodology
In this section, we describe the network param-eters and power models that we use to generate adhoc networks with unidirectional links.
3.1. Network parameters
We simulated networks of 100 mobile nodesusing ns-2 [3]. The nodes were placed on a rectan-gular 1200 m · 800 m area. A rectangular area waschosen in order to allow for the formation of long-er paths (along the longer dimension) than wouldbe possible with a square site having the same totalarea.
The nodes move according to the RandomWaypoint model [2]: each node is initially placedat a uniformly randomly chosen location, staysthere for a period of time called the pause time,and then starts moving toward a new randomlychosen location, at a randomly chosen speed upto some maximum speed; once the node reachesthis new location, it remains stationary again forthe pause time and then repeats the process, mov-ing toward a new location at a new speed.
Each simulation was run for 900 s of simulatedtime. We use two maximum speeds, 1 m/s and 20m/s, and two pause times, 0 s (continuous mobil-ity) and 900 s (a static network).

J.G. Jetcheva, D.B. Johnson / Ad Hoc Networks 4 (2006) 303–325 307
Wireless transmission attenuation follows a free-space model up to a reference distance and then atwo-ray ground reflection model [2]. The nominal(omni-directional) range of each device is 250 m.
These network parameters are representative ofthose widely used in performance analysis of adhoc networks.
The simulation environment makes the simpli-fying assumption that all nodes have a circularwireless transmission pattern. We believe thatour results are also useful in describing the effectof unidirectional links on routing protocol behav-ior with more generalized transmission patternsthat also produce unidirectional links.
3.2. Power variation models
The most commonly used methods for generat-ing unidirectional network scenarios for use in adhoc network simulations are based on varyingthe transmission range of nodes in the network,whereby the transmission range of each node (orset of nodes) is set to a fraction of the nominaltransmission range.
Two characteristics of these models make themattractive for use in simulations of ad hoc net-works. First, the resulting scenarios are realistic,as they correspond to a potentially commonsituation in which the ad hoc network consists ofheterogeneous devices that may have differenttransmitter and/or receiver capabilities. Second,the scenarios are straightforward to generate.
For simplicity, in the rest of this paper, wirelessrange is discussed in terms of distance instead oftransmission power level, because distance is easierto conceptualize.
3.2.1. Random-power model
In the random-power model, each node is as-signed a random transmission power level chosenfrom a range of transmission powers that corre-spond to a (Rmin, Rmax) distance range. In ourwork, we use Rmax of 250 m, the nominal transmis-sion range, and we study values of Rmin rangingfrom 0 m to 225 m at 25 m increments. This modelgenerates networks that are ‘‘completely’’ hetero-geneous, in that each device may have a differenttransmission range.
3.2.2. Two-power model
In the two-power model, the nodes in the net-work are divided into two groups, each of whichis assigned a different power level, correspondingto a different transmission range, Rlow and Rhigh,respectively; Nlow total nodes have range Rlow,and Nhigh total nodes have range Rhigh (set to thenominal transmission range). We vary Rlow from0 m to 225 m at 25 m increments, and vary Nlow
from 10% to 90% of the total number of nodes.
3.2.3. Three-power model
In the three-power model, the nodes in the net-work are divided into three groups, each of whichis assigned a different power level, correspondingto a different transmission range, Rlow, Rmedium,and Rhigh, respectively. Nlow total nodes have rangeRlow, Nmedium total nodes have range Rmedium, andNhigh total nodes have range Rhigh (set to the nom-inal transmission range). In this evaluation, Nlow
and Nmedium were varied between 10% and 90%of the total number of nodes, at 10% increments,thus covering the range of possible combinationsof (Nlow,Nmedium,Nhigh) at a 10% discretization.The simulation computational cost of varying Rlow
and Rmedium to cover all possible combinationseven at a 10% discretization is prohibitive. Instead,two sets of values for Rlow and Rmedium are used inour experiments, and only the fraction of nodes ineach power group was varied. The values for Rlow
and Rmedium are 0.6 and 0.7 of the nominal rangefor the first set of network scenarios (which we callScenario 1), and 0.2 and 0.4 for the second set ofnetwork scenarios (which we call Scenario 2). Thedifferences between the values of any pair in theset Rlow, Rmedium, Rhigh in Scenario 1 are twice aslarge as the corresponding differences in Scenario1. Our experiments do not cover a full set of powerparameterizations of the three-power model, butScenarios 1 and 2 explore two different points inits behavior.
4. Metrics
In this section, we propose a set of metrics toexpose the routing characteristics of unidirectionalnetwork scenarios. These metrics cover a wide

308 J.G. Jetcheva, D.B. Johnson / Ad Hoc Networks 4 (2006) 303–325
range of network events and states as expressed bythe primitives that directly affect routing protocolperformance: links and routes (or paths).
Since most current routing protocols strive toroute along the shortest path between a sourceand a destination, all path-related metrics in theanalysis consider only the shortest paths betweeneach pair of nodes that exist in the network, asthese paths are the most likely to be used by therouting protocol.
All metrics are computed as averages over allnodes in the network and over the lifetime of thesimulation.
4.1. Neighbor-related metrics
The number of bi-neighbors of a node is thenumber of neighboring nodes (i.e., nodes withintransmission range of the node) with which a nodehas bidirectional links. The in-neighbors of a nodeare the neighbors of the node that can reach thenode but cannot be reached by it. The sum ofthe in- and bi-neighbors of a node is the total num-ber of neighbors of the node.
The total number of neighbors metric reflects thelevel of connectivity in the network. For example,the higher the total number of neighbors per node,the higher the number of paths along which nodescan communicate with each other (on average).
The in-neighbors metric reflects the averagenumber of unidirectional links that are present inthe network.
The in-neighbors fraction metric represents thenumber of in-neighbors as a fraction of the totalnumber of neighbors. It indicates the likelihoodthat the routing protocol will encounter a unidirec-tional link rather than a bidirectional link. Eachencountered unidirectional link may cause therouting protocol additional overhead to either usethe link or to avoid it, as described in Section 1.
4.2. Node reachability metrics
The unreachable nodes metric represents theaverage number of nodes to which a node doesnot have a route and which do not have a routeto this node (no routes exist). This metric reflectsthe extent to which the network is partitioned
and can help protocol designers to differentiate be-tween poor routing protocol performance due tothe presence of unidirectional links versus poorrouting protocol performance due to the presenceof partitions.
The bidirectionally reachable nodes metric repre-sents the number of nodes to which the averagenetwork node has a shortest path that is bidirec-tional. This metric reflects the likelihood that therouting protocol would encounter a bidirectionalpath for routing between a pair of nodes.
A unidirectional path is one that contains atleast one unidirectional link. The mutually unidi-rectionally reachable nodes metric represents thenumber of nodes to which a node�s shortest pathsare unidirectional, whose shortest paths to it arealso unidirectional. This metric reflects the likeli-hood that the routing protocol would encountera unidirectional path when trying to route betweena pair of nodes.
The one-way unidirectionally reachable nodesmetric represents the number of nodes to which anode�s shortest path is unidirectional, but whichdo not have a route to this node. Only protocolsthat do not involve two-way per-hop or end-to-end communication can route to destination nodesthat are only reachable in one direction (e.g., aprotocol using network-wide broadcast to deliverdata).
4.3. Path characteristics metrics
The unidirectional links per path fraction metricrepresents the average number of unidirectionallinks as a fraction of all links in a unidirectional path(over all unidirectional shortest paths in the net-work). This metric reflects the ‘‘unidirectionality’’of a unidirectional path, i.e., the level of effort thatthe routing protocol would need to expend on aver-age when it encounters a unidirectional path. Thehigher the value for thismetric, in general the higherthe routing overhead, as each additional unidirec-tional link may incur additional overhead, forexample in terms of multihop acknowledgments.
Path length is an important network routingcharacteristic, because packet latency, as well asthe likelihood of link breaks and packet collisionsalong a path, are in part proportional to the length

J.G. Jetcheva, D.B. Johnson / Ad Hoc Networks 4 (2006) 303–325 309
of the path. In addition, the discovery and mainte-nance (monitoring for link breaks) of a longer pathmay incur higher latency and a higher number ofcontrol packet transmissions.
The average shortest-path length metric repre-sents the average path length computed over allshortest paths in the network. The maximum short-
est-path length metric represents the longest path,among all shortest-paths between pairs of nodes,encountered during the lifetime of the network.
The path length benefit metric represents thenumber of hops on average by which the averageunidirectional shortest path is shorter than theshortest bidirectional path between a pair ofnodes. This metric is computed when the shortestunidirectional path is shorter than any existingbidirectional paths.
4.4. Link and path change metrics
The link changes metric represents the averagenumber of link changes per second in the network;a link can change between being reachable andunreachable, and between being unidirectionaland bidirectional. The number of link changes re-flects the level of mobility in the network, which inturn affects routing protocol performance, as ittakes time, and often additional overhead, to reactto changes in link directionality and reachability,and to avoid or reduce interruptions in the flowof traffic caused by link changes.
The unidirectional to bidirectional link changes
metric represents the number of times per secondthat a unidirectional link becomes bidirectional.Protocols that can detect this condition can auto-matically reduce their control overhead, as theycan stop sending acknowledgment packets acrossmultihop reverse paths but start sending themdirectly.
The bidirectional to unidirectional link changes
metric represents the number of times per secondthat a bidirectional link becomes unidirectional.This metric indicates how many perceived linkbreaks are actually changes to unidirectional links.Protocols that can distinguish between a link thathas become unidirectional and one that has be-come disconnected can continue routing alongthe route containing this link, whereas ones that
cannot make this distinction would initiate routerepair procedures and incur more overhead andpotentially a disruption in packet delivery.
The unidirectional to unreachable link changes
metric represents the number of times per secondthat a unidirectional link becomes unreachable.This metric reflects the frequency of disconnectionin the network, and can also be used in conjunc-tion with the unidirectional to bidirectional linkchanges metric to indicate whether unidirectionallinks in a given scenario are more likely to becomebidirectional or unreachable.
Mobility and the resulting link changes affectthe paths along which packets are forwarded to-wards their destinations, and may cause the rout-ing protocol to discover alternate routes. Thenumber of shortest-path changes per second metricrepresents the average number of times that ashortest route between two nodes breaks or ashorter path becomes available.
5. Results and analysis
In this section, we analyze the routing charac-teristics of unidirectional network scenarios pro-duced by the random-, two-, and three-powermodels with the help of the metrics we defined inSection 4.
5.1. Overview
The mean values for the metrics characterizingthe generated network scenarios prior to introduc-ing variations in power (i.e., all nodes have thenominal transmission range) are shown in Table1. The notable differences in the values of the met-rics between scenarios with different levels ofmobility are in the total number of neighbors,number of link changes per second, and numberof shortest-path changes per second. The totalnumber of neighbors is higher when the networkis mobile, due to the fact that the Random Way-point movement leads to a non-uniform distribu-tion of the nodes, with the density of thenetwork being higher towards the center of thearea [13]. The total number of neighbors is similarat different speeds, because the speed of node
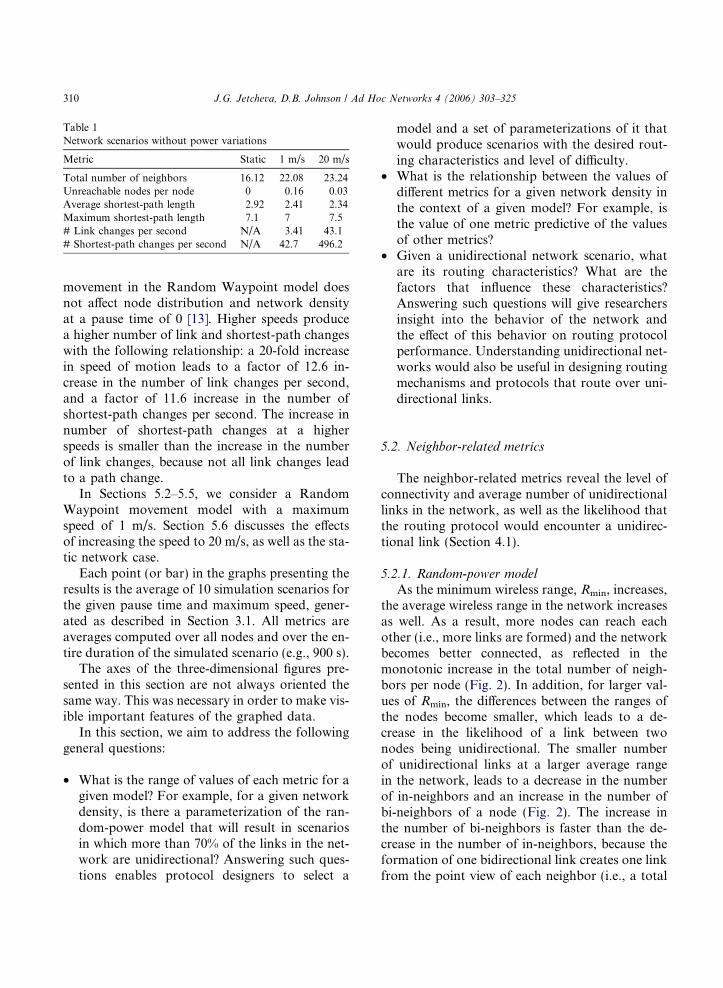
Table 1Network scenarios without power variations
Metric Static 1 m/s 20 m/s
Total number of neighbors 16.12 22.08 23.24Unreachable nodes per node 0 0.16 0.03Average shortest-path length 2.92 2.41 2.34Maximum shortest-path length 7.1 7 7.5# Link changes per second N/A 3.41 43.1# Shortest-path changes per second N/A 42.7 496.2
310 J.G. Jetcheva, D.B. Johnson / Ad Hoc Networks 4 (2006) 303–325
movement in the Random Waypoint model doesnot affect node distribution and network densityat a pause time of 0 [13]. Higher speeds producea higher number of link and shortest-path changeswith the following relationship: a 20-fold increasein speed of motion leads to a factor of 12.6 in-crease in the number of link changes per second,and a factor of 11.6 increase in the number ofshortest-path changes per second. The increase innumber of shortest-path changes at a higherspeeds is smaller than the increase in the numberof link changes, because not all link changes leadto a path change.
In Sections 5.2–5.5, we consider a RandomWaypoint movement model with a maximumspeed of 1 m/s. Section 5.6 discusses the effectsof increasing the speed to 20 m/s, as well as the sta-tic network case.
Each point (or bar) in the graphs presenting theresults is the average of 10 simulation scenarios forthe given pause time and maximum speed, gener-ated as described in Section 3.1. All metrics areaverages computed over all nodes and over the en-tire duration of the simulated scenario (e.g., 900 s).
The axes of the three-dimensional figures pre-sented in this section are not always oriented thesame way. This was necessary in order to make vis-ible important features of the graphed data.
In this section, we aim to address the followinggeneral questions:
• What is the range of values of each metric for agiven model? For example, for a given networkdensity, is there a parameterization of the ran-dom-power model that will result in scenariosin which more than 70% of the links in the net-work are unidirectional? Answering such ques-tions enables protocol designers to select a
model and a set of parameterizations of it thatwould produce scenarios with the desired rout-ing characteristics and level of difficulty.
• What is the relationship between the values ofdifferent metrics for a given network density inthe context of a given model? For example, isthe value of one metric predictive of the valuesof other metrics?
• Given a unidirectional network scenario, whatare its routing characteristics? What are thefactors that influence these characteristics?Answering such questions will give researchersinsight into the behavior of the network andthe effect of this behavior on routing protocolperformance. Understanding unidirectional net-works would also be useful in designing routingmechanisms and protocols that route over uni-directional links.
5.2. Neighbor-related metrics
The neighbor-related metrics reveal the level ofconnectivity and average number of unidirectionallinks in the network, as well as the likelihood thatthe routing protocol would encounter a unidirec-tional link (Section 4.1).
5.2.1. Random-power modelAs the minimum wireless range, Rmin, increases,
the average wireless range in the network increasesas well. As a result, more nodes can reach eachother (i.e., more links are formed) and the networkbecomes better connected, as reflected in themonotonic increase in the total number of neigh-bors per node (Fig. 2). In addition, for larger val-ues of Rmin, the differences between the ranges ofthe nodes become smaller, which leads to a de-crease in the likelihood of a link between twonodes being unidirectional. The smaller numberof unidirectional links at a larger average rangein the network, leads to a decrease in the numberof in-neighbors and an increase in the number ofbi-neighbors of a node (Fig. 2). The increase inthe number of bi-neighbors is faster than the de-crease in the number of in-neighbors, because theformation of one bidirectional link creates one linkfrom the point view of each neighbor (i.e., a total

0.10.2
0.30.4
0.50.6
0.70.8
0.9
1020
3040
5060
7080
90
0
5
10
15
20
25
Rlow
as a Fraction of Rhigh
Nlow
Tota
l Num
ber
of N
eigh
bors
Fig. 3. Two-power model: total number of neighbors per node(1 m/s).
0 0.1 0.2 0.3 0.4 0.5 0.6 0.7 0.8 0.90
5
10
15
20
25
Rmin
as a Fraction of Rmax
Num
ber
of N
eigh
bors
in neighborsbi neighborstotal number of neighbors
Fig. 2. Random-power model: total number of neighbors pernode (1 m/s).
J.G. Jetcheva, D.B. Johnson / Ad Hoc Networks 4 (2006) 303–325 311
of two one-way links), while the creation or loss ofone unidirectional link represents only one one-way link.
In the random-power model, the likelihood of aneighbor being unidirectional reaches a maximumof 50% for Rmin of 0 m, and decreases monotoni-cally by about 2–5%, down to 3%, as Rmin in-creases. An approximation of these results can beobtained analytically: in the random-power model,at Rmin of 0 m and a maximum range of 250 m,half of the nodes have a range smaller than themean range (i.e., a range less than 125 m) and halfhave a range larger than the mean range; thus, onaverage, half of the links in the network should beunidirectional, as a node is equally likely to have alink with a unidirectional neighbor as it is to havea link with a bidirectional neighbor.
5.2.2. Two-power model
Unlike the random-power model, in which oneparameter (the minimum range) changed betweenscenarios, in the two-power model, two parametersand their interaction determine the routing charac-teristics of the network; these parameters are thenumber of low power nodes, or Nlow, and the wire-less range of the low power nodes, Rlow (Section3.2). Similarly to the random-power model, thetotal number of neighbors in the two-powermodel increases monotonically with the increase
in average range (i.e., with the decrease in Nlow
and the increase in Rlow), and also with the de-crease in the differences between the high andlow power ranges, Rhigh and Rlow (Fig. 3). The in-crease in the total number of neighbors is largerfor higher average ranges, because the number oflinks grows faster when the connectivity in the net-work is higher and the average range is higher.
The total number of neighbors increases fasterwith the decrease in Nlow than with the increasein Rlow, indicating that the effect of the numberof low power nodes is stronger than the effect ofthe magnitude of their range, even though theaverage range in the network is equally affectedby both parameters. The reason for this is thatNlow has a stronger effect than Rlow on the in-neighbors component of the total number ofneighbors (Fig. 4): unlike the number of in-neigh-bors in the random-power model scenarios, whichdepends on the average range in the network, inthe two-power model, the number of in-neighborsis more dependent on the number of nodes withdifferent ranges (i.e., the pairs of nodes whichcan form unidirectional links) and to a lesser ex-tent on the magnitude of the differences betweenthese ranges. As a result, the number of in-neigh-bors increases with an increase in Nlow up toNlow = Nhigh, which is the point at which the num-ber of pairs of nodes with different ranges is high-est, and when Nlow becomes larger than Nhigh, the

1020
3040
5060
7080
90
0.10.2
0.30.4
0.50.6
0.70.8
0.9
0
2
4
6
Nlow
Rlow
as a Fraction of Rhigh
In-N
eigh
bors
Fig. 4. Two-power model: number of in-neighbors per node(1 m/s).
1020
3040
5060
7080
90
0.10.2
0.30.4
0.50.6
0.70.8
0.9
0
0.2
0.4
0.6
0.8
1
Nlow
Rlow
as a Fraction of Rhigh
In-N
eigh
bors
Fra
ctio
nFig. 5. Two-power model: in-neighbors as a fraction of thetotal number of neighbors (1 m/s).
312 J.G. Jetcheva, D.B. Johnson / Ad Hoc Networks 4 (2006) 303–325
number of pairs of nodes with different ranges be-gins to decrease, which leads to a decrease in thenumber of in-neighbors as well.
The values for maximum number of total, in-,and bi-neighbors are similar to the correspondingmaximum values in the random-power model,whereas the minimum values in the two-powermodel reach values that are about four times smal-ler; the two-power model produces scenarios witha wider range of these particular routing character-istics than the random-power model.
Unlike the random-power model, the numberof in-neighbors and the fraction of in-neighborsmetrics in the two-power model follow differenttrends: the number of in-neighbors metric achievesits maximum at Nlow = 50 and Rlow = 0.1 · Rhigh,whereas the in-neighbors fraction metric achievesits maximum at Nlow = 90 and Rlow = 0.1 · Rmax
(Fig. 5). The in-neighbors fraction increases mono-tonically as Rlow decreases, and for values of Rlow
of 0.1 and 0.2, it increases monotonically with anincrease in Nlow as well. For values of Rlow higherthan 0.2, however, the behavior becomes morecomplex, as the increase in the in-neighbors frac-tion stops and turns into a decrease as Nlow
increases. The point at which this switch occursis different for different Rlow values, and as Rlow in-creases, the switch happens for increasingly lowervalues of Nlow. This is due to the fact that for lower
values of Rlow, the effect of the magnitude of thedifferences in range overwhelms the effect of thenumber of nodes with different ranges, whereasfor higher values of Rlow, the magnitude of the dif-ferences in range decreases, and thus the dominanteffect is that of the number of low power nodes,which results in the maximum in-neighbors frac-tion for each value of Rlow occurring at an increas-ingly smaller value of Nlow.
5.2.3. Three-power model
Similarly to the random- and two-power mod-els, network connectivity in the three-powermodel, as expressed by the total number of neigh-bors, increases with the increase in average range,i.e., with the decrease in the number of low andmedium power nodes, Nlow and Nmedium, respec-tively. The total number of neighbors is generallyhigher for Scenario 1, because the average rangein this scenario is higher and therefore reachabilityis higher.
The number of in-neighbors in both Scenarios 1and 2 increases with the increase in Nlow andNmedium up to a point and then decreases (Scenario1 is shown in Fig. 6; the Scenario 2 graph, notshown, is similar). The number of in-neighborsmetric is more dependent on the value of Nlow thanon the value of Nmedium, indicated by a higherslope of the graph as Nlow increases than when

1020
3040
5060
7080
1020
3040
5060
7080
0
1
2
3
4
Nlow
Nmedium
In-N
eigh
bors
Fig. 6. Three-power model (Scenario 1): number of in-neigh-bors per node (1 m/s).
1020
3040
5060
7080
1020
3040
5060
7080
0
0.2
0.4
0.6
0.8
1
Nlow
Nmedium
In-N
eigh
bors
Fra
ctio
n
Fig. 7. Three-power model (Scenario 2): in-neighbors as afraction of the total number of neighbors (1 m/s).
J.G. Jetcheva, D.B. Johnson / Ad Hoc Networks 4 (2006) 303–325 313
Nmedium increases. This is due to the fact that thelow power nodes have larger differences in rangewith the high power nodes on average, and arethus more likely than the medium power nodesto be involved in unidirectional links with the highpower nodes. The values for the number of in-neighbors metric in Scenario 2 are higher by 1.55on average, whereas the values for the number ofbi-neighbors metric are lower by 6.86 on average,as the network is much less connected than in Sce-nario 2 and the average range is lower.
The maximum value for the number of in-neigh-bors in both Scenarios 1 and 2 occurs at (Nlow,Nmedium,Nhigh) = (40,10,50). For each successivevalue of Nlow, the highest value of the in-neighborsmetric occurs at a smaller value of Nmedium. Inaddition, up to the maximum value of the numberof in-neighbors for each value of Nlow, Nhigh is 50.This indicates that the effect of the magnitude ofthe differences between the ranges of differentnodes has a higher impact on the number of unidi-rectional links in these parameterizations of thethree-power model than does the number of suchdifferences (in contrast to the two-power model).Since the highest magnitude of the differences inrange occurs when a low power node forms a linkwith a high power node, the highest value for thenumber of in-neighbors is achieved when the num-ber of low power nodes and high power nodes are
as similar as possible, which happens at point(40,10,50). The reason why Nhigh has a highervalue than Nlow at the maximum point is that thisis the case in which the highest average magnitudeof differences in ranges is created, as the differencebetween Rhigh and Rmedium is larger than the differ-ence between Rmedium and Rlow (Section 3.2.3).
The values of the in-neighbors fraction metric inScenario 1 follow the trend of the values of the in-neighbors metric except that the in-neighbors frac-tion metric reaches its maximum of 0.23 at(Nlow,Nmedium,Nhigh) = (50,10,40) rather than at(40,10,50), the point at which the number of in-neighbors is highest. The maximum is not atNhigh = 50, since at this value, the number of bidi-rectional links is high as well (these are bidirec-tional links between the high power nodes) andcompensates for the higher number of unidirec-tional links. As in the two-power model, a highernumber of unidirectional links does not necessarilyresult in a higher fraction of unidirectional links.
Unlike Scenario 1 but similarly to the two-power model, the in-neighbors fraction metric inScenario 2 exhibits a different behavior from thein-neighbors metric (Fig. 7). It achieves values ofup to 0.8, which is about 3.4 times higher than inScenario 1, and increases monotonically with suc-cessively higher values of Nlow, reaching its maxi-mum value at (80, 10, 10). Since the ranges in

1020
3040
5060
7080
1020
3040
5060
7080
0
20
40
60
80
100
Nlow
Nmedium
Unr
each
able
Nod
es (
per
Nod
e)
Fig. 8. Three-power model (Scenario 2): number of nodesunreachable from a node (1 m/s).
314 J.G. Jetcheva, D.B. Johnson / Ad Hoc Networks 4 (2006) 303–325
Scenario 2 are lower and the differences betweenthem higher than in Scenario 1 (Section 3.2.3),the level of unreachability is high (Fig. 8), and asa result the in-neighbors fraction is also high: whenthe number of low power nodes is high in Scenario2, pairs of nodes that are reachable usually includea low power node and a medium or high powernode (pairs of low power nodes are likely to beunreachable) and such pairs are likely to be con-nected via a unidirectional link due to the differ-ences in range.
5.2.4. Summary
The two- and three-power models can produceunidirectional network scenarios with a largerrange of values for the neighbor-related metricsthan the random-power model. In general, modelsthat have a larger number of configurable param-eters can achieve a larger set of routing character-istics, but are also more complex to analyze. Forexample, in the random-power model, the numberof in-neighbors and the fraction of in-neighborsfollow the same trend, as average range increasesacross the set of unidirectional scenarios (Section5.2.1), whereas in the two- and three-power mod-els, the number of in-neighbors and the in-neigh-bors fraction may exhibit different behaviorsfrom each other (Section 5.2.2). In addition, somemetrics do not exhibit a uniform behavior in
scenarios produced by successive parameter valuesof a given model; for example, the in-neighborsfraction in the two-power model exhibits a non-uniform behavior for different Rlow values, achiev-ing its maximum values for different values ofNlow. These findings indicate that choosing a rangeof values for parameterizing a model for generat-ing unidirectional links and expecting that the like-lihood that a routing protocol would encounterunidirectional links increases monotonically witheach successive parameterization is not necessarilya good strategy. The routing characteristics of thescenarios produced by each parameterization needto be analyzed in detail.
5.3. Node reachability metrics
The node reachability metrics (Section 4.2) re-flect the likelihood that a node can reach an arbi-trary node in the network (i.e., the likelihood ofpartitions), and the type of reachability it wouldhave with that arbitrary node (i.e., via a bidirec-tional, mutually unidirectional, or one-way unidi-rectional path). The higher the likelihood ofencountering a unidirectional path, the higher theoverhead the routing protocol would have to ex-pend due to having to route over unidirectionallinks, or due to trying to find alternate bidirec-tional paths (Section 4.2).
5.3.1. Random-power model
The number of unreachable nodes per nodestarts out high (30% of all nodes) at Rmin of 0 m(Fig. 9). As the average range in the networkincreases, previously unreachable nodes becomeunidirectional or bidirectional neighbors, and asa result, the number of unreachable nodes dropssharply and becomes negligible at Rmin of 0.3–0.4. A significant number of nodes are reachableonly one-way at Rmin of 0 m as well. The similaritybetween the values of the unreachable nodes andone-way unidirectionally reachable nodes metricsis due to the fact that poorly connected nodes(e.g., ones close to the edges of the site (Section5)), flap between being barely connected and beingpartitioned as they move about. In addition, thesmaller the average range, the more likely it isfor a node to be partitioned (rather than unidirec-

0 0.1 0.2 0.3 0.4 0.5 0.6 0.7 0.8 0.90
10
20
30
40
50
60
70
80
90
100
Rmin
as a Fraction of Rmax
Per
Nod
e C
onne
ctiv
ity to
Oth
er N
odes
Unreachable NodesOne Way UnidirectionalMutually UnidirectionalBidirectionalTotal Reachable Nodes
Fig. 9. Random-power model: per node connectivity to othernodes (1 m/s).
1020
3040
5060
7080
90
0.10.2
0.30.4
0.50.6
0.70.8
0.9
0
20
40
60
80
100
Nlow
Rlow
as a Fraction of Rhigh
Unr
each
able
Nod
es (
per
Nod
e)
Fig. 10. Two-power model: number of nodes unreachable froma node (1 m/s).
J.G. Jetcheva, D.B. Johnson / Ad Hoc Networks 4 (2006) 303–325 315
tionally connected to the network). As a result theunreachable nodes graph has higher values thanthe one-way unidirectionally reachable nodesgraph, and the differences are more pronouncedfor lower values of Rmin.
The number of bidirectionally reachable nodesper node rises monotonically as the average rangein the network increases (similarly to the numberof bi-neighbors metric, Fig. 2). The number of uni-directionally reachable nodes per node, on theother hand, does not follow the monotonic de-crease in the number of in-neighbors but insteadrises up to Rmin of 0.3 and only then begins to de-crease. This initial increase is due to the initial in-crease in connectivity and average wireless rangewhich conceptually draws nodes closer togetheras a result of which unidirectional links becomebidirectional and unreachable links become unidi-rectional. The number of unidirectionally reacha-ble nodes per node starts to fall when Rmin
becomes larger than 0.3 of Rmax, since nodeunreachability becomes negligible and the domi-nant effect of an increase in average range is thatof unidirectional links becoming bidirectional.
The number of unidirectionally reachable nodesis higher than what the average in-neighbors frac-tion would suggest (Section 5.2.1) because theaddition of unidirectional links has a stronger im-pact on the unidirectional paths metric than on thein-neighbors fraction metric; the addition of one
unidirectional link can make multiple paths unidi-rectional and vice versa, the removal of one unidi-rectional link may make multiple pathsbidirectional.
5.3.2. Two-power model
Unreachability increases with a decrease inaverage range, and at Nlow = 90 and Rlow =0.1 · Rhigh, it reaches a value of 98% (Fig. 10),which is over three times the maximum numberof unreachable nodes per node in the random-power model. Unlike the random-power model,the one-way unidirectionally reachable nodes met-ric (Fig. 11) does not follow the same trend as theunreachable nodes metric because in addition toaverage range, it is also influenced by the numberof pairs of nodes with differing ranges; in the ran-dom-power model both of these parameterschange together as only one parameter (the mini-mum range) is varied. As a result, the maximumvalue for the one-way unidirectionally reachablenodes metric occurs at the same values of Rlow
and Nlow as the highest value of the in-neighborsmetric (Rlow = 0.1 and Nlow = 50).
The number of bidirectionally reachable nodesper node increases monotonically with Nlow, forvalues of Rlow of 0.1 and 0.2 (Fig. 12). For largervalues of Rlow it decreases with an increase in Nlow

0.10.2
0.30.4
0.50.6
0.70.8
0.9
1020
3040
5060
7080
90
0
20
40
60
80
100
Rlow
as a Fraction of Rhigh
Nlow
Bid
irect
iona
lly R
each
able
Nod
es
Fig. 12. Two-power model: number of bidirectionally reacha-ble nodes per node (1 m/s).
1020
3040
5060
7080
90
0.10.2
0.30.4
0.50.6
0.70.8
0.9
0
5
10
15
20
25
Nlow
Rlow
as a Fraction of Rhigh
One
-Way
Uni
d. R
each
able
Nod
es
Fig. 11. Two-power model: number of one-way unidirection-ally reachable nodes per node (1 m/s).
1020
3040
5060
7080
90
0.10.2
0.30.4
0.50.6
0.70.8
0.9
0
20
40
60
80
Nlow
Rlow
as a Fraction of Rhigh
Mut
ually
Uni
d. R
each
able
Nod
es
Fig. 13. Two-power model: number of mutually unidirection-ally reachable nodes per node (1 m/s).
316 J.G. Jetcheva, D.B. Johnson / Ad Hoc Networks 4 (2006) 303–325
up to a point, and then starts to increase since Nlow
becomes higher than Nhigh after which point themajority of bidirectional paths are between lowpower nodes (since Rlow is high) and these pathsdominate the overall shortest-path reachability.As Rlow increases, the number of bidirectionalpaths increases as well, except that for values ofNlow smaller than 40, there is a temporary decreasein the number of bidirectional paths around Rlow
of 0.6 and 0.7. This decrease is due to the fact thatat some point, nodes that were previously unreach-
able are now reachable due to the higher averagerange, but they are reachable only unidirectionally,as the higher range is not high enough to makethem bidirectional neighbors.
The number of mutually unidirectionally reach-able nodes metric behaves differently from thenumber of in-neighbors metric. It increases withincreasing values of Nlow and Rlow (for low Nlow
and Rlow values), and then begins to decrease(Fig. 13). The initial increase is due to increasedconnectivity in a poorly connected network inthe case of Nlow, and an increased number of pairsof nodes with differing ranges in the case of Rlow.The subsequent decrease is due to a decrease inthe number of unidirectional links.
5.3.3. Three-power model
There is very little unreachability in Scenario 1(a maximum of 2.7 unreachable nodes per node;figure not shown). The number of unreachablenodes per node rises with a decrease in averagerange, i.e., as Nlow and Nmedium increase. Similarlyto the random-power model, the number of one-way unidirectionally reachable nodes graph tracksthe unreachable nodes graph very closely and hasslightly lower values.
In Scenario 2, unreachability also increases withboth an increase in Nlow and Nmedium, except, dueto the smaller values of Rlow and Rmedium, the

1020
3040
5060
7080
1020
3040
5060
7080
0
20
40
60
80
Nlow
Nmedium
Mut
ually
Uni
d. R
each
able
Nod
esFig. 15. Three-power model (Scenario 1): number of mutuallyunidirectionally reachable nodes per node (1 m/s).
1020
3040
5060
7080
1020
3040
5060
7080
0
5
10
15
20
25
Nlow
Nmedium
One
-Way
Uni
d. R
each
able
Nod
es
Fig. 14. Three-power model (Scenario 2): number of one-wayunidirectionally reachable nodes per node (1 m/s).
1020
3040
5060
7080
1020
3040
5060
7080
0
20
40
60
80
NlowNmedium
Bid
irect
iona
lly R
each
able
Nod
es
Fig. 16. Three-power model (Scenario 1): number of bidirec-tionally reachable nodes per node (1 m/s).
J.G. Jetcheva, D.B. Johnson / Ad Hoc Networks 4 (2006) 303–325 317
unreachability is much higher than in Scenario 1,reaching up to 90 unreachable nodes per node(i.e., 91% of the nodes) (Fig. 8). Unlike Scenario1, in Scenario 2 the number of one-way unidirec-tionally reachable nodes initially increases withthe increase in average range, and then starts todecrease along with the number of unreachablenodes due to the increasing connectivity in the net-work which leads to the formation of a highernumber of mutually unidirectionally reachableand bidirectionally reachable nodes (Figs. 14 and8).
The mutually unidirectionally reachable nodesand the bidirectionally reachable nodes� graphs inScenario 1 follow complementary trends (Figs.15 and 16) as virtually all paths are either bidirec-tional or mutually unidirectional due to the highlevel of connectivity. In Scenario 2, the bidirection-ally reachable nodes graph follows a complemen-tary trend to the unreachable nodes graph (Fig.8) as nodes are more likely to be unreachable orbidirectionally connected to the network than tobe unidirectionally connected to the network, dueto the large differences between the ranges of dif-ferent nodes. The number of mutually unidirec-tionally reachable nodes in Scenario 2, increaseswith an increase in Nmedium as the medium powernodes have a stronger impact on the growth ofthe number of unidirectional paths in the network
than do the low power nodes, since the mediumpower nodes are more likely to participate in uni-directional links than the low power nodes whichare more likely to be unreachable (due to theirsmall ranges). Unlike in the other power modelsand Scenario 1, the connectivity of the network re-mains low even in the most connected configura-tion of Scenario 2 and as a result, the number ofmutually unidirectionally reachable paths doesnot reach a peak value and then top off but only

318 J.G. Jetcheva, D.B. Johnson / Ad Hoc Networks 4 (2006) 303–325
increases in our experiments. The in-neighborsfraction actually does top off (Fig. 7) but the num-ber of unidirectional links in the network has aweaker effect on the composition of paths thanon the fraction of unidirectional links, as one uni-directional link can cause multiple paths to beunidirectional.
5.3.4. Summary
The analysis of the node reachability metricsshows that attempting to predict the routing char-acteristics of the network based on knowledge ofonly the number or fraction of unidirectional linksin the network can be misleading as the values ofthese metrics are not indicative of the types ofpaths that the routing protocol is likely to encoun-ter. In addition, picking seemingly similar param-eterizations can lead to network scenarios withvery different characteristics, and vice versa, pick-ing seemingly different parameterizations can leadto network scenarios with similar routing charac-teristics. Understanding the reachability character-istics of the network would enable protocoldesigners to better analyze routing protocol behav-ior, as different routing mechanisms are sensitiveto the presence of different kinds of paths. Simi-larly to the neighbor-related metrics (Section5.2), the two- and three-power models provide awider range of values for the reachability metricsbut are more complex to analyze than the ran-dom-power model.
5.4. Path characteristics metrics
The path characteristics metrics (Section 4.3)characterize a scenario in terms of the averageand maximum shortest-path length in the network,the path length benefit of using a shorter unidirec-tional path instead of a longer bidirectional path,and the level of unidirectionality of a unidirectionalpath, i.e., the fraction of links on each unidirec-tional path that are unidirectional. Only shortestpaths are discussed in this section as these are thepaths the routing protocol is most likely to use.
5.4.1. Random-power model
As the average range in the network increases,so does the number of bidirectional paths. As a
result, the likelihood of encountering a bidirec-tional path that is as short as the correspondingunidirectional path between a pair of nodes in-creases also. This trend is reflected in the pathlength benefit of using unidirectional links whichdecreases from 1.4 to 1 and remains equal to 1for values of Rmin greater than 0.6, which is thepoint at which the dominant reachability betweennodes in the network starts to be via bidirectionalpaths (Fig. 9). The path length benefit is largelyinsignificant in the random-power model.
The average and maximum shortest-pathlengths in the network decrease as connectivity in-creases and more paths become available. Themaximum shortest-path length varies between14.8 and 7.3 for Rmin = 0 and Rmin = 0.9 · Rmax,respectively, whereas the average shortest-pathlength varies between 3.6 and 2.3 for the same Rmin
values. The decrease in average shortest-pathlength is small due to the dominant contributionof 1- and 2-hop paths, whose number increasesthe fastest with increased connectivity.
The unidirectional links per path fraction isabout 45% at Rmin of 0 m and decreases monoton-ically to about 38%. There are several competingfactors that influence this metric. First, as Rmin in-creases, there are less unidirectional links andsince links are shared between paths, the conver-sion of a unidirectional link to a bidirectional link(as a result of the higher average range) may affectmore than one path (leading to a lower unidirec-tional links per path fraction). Another factor thatinfluences this metric is that path length decreaseswith an increase in Rmin and shorter paths do notshare as many unidirectional links because thereare less nodes at which they can intersect (leadingto a lower unidirectional links per path fraction).Finally, shorter paths can have a higher fractionof unidirectional links with a smaller number ofunidirectional links on them (which leads to ahigher unidirectional links per path fraction).The combination of these factors leads to a slowdecrease in the unidirectional links per pathfraction.
5.4.2. Two-power model
The average path length benefit of using unidi-rectional paths reaches a maximum of 2.16 hops,

J.G. Jetcheva, D.B. Johnson / Ad Hoc Networks 4 (2006) 303–325 319
which is higher than in the random-power model.This is due to the wider range of values for thenumber of unreachable and unidirectionally reach-able nodes in the two-power scenarios (Section5.3.2). As a result, at low values of Nlow and Rlow,where the number of unidirectional links is high,longer bidirectional paths are less likely to existthan shorter ones; a single unidirectional link canmake the path unidirectional, and the more linksin a path, the more likely it is that one of themmay be unidirectional. As in the random-powermodel, the path-length benefit declines with the in-crease in the number of bidirectional paths.
The wider range of values for the unreachableand unidirectionally reachable nodes (relative tothe random-power model), leads to a wider rangefor the shortest and maximum shortest-path met-rics as well, which vary between 1.87 and 4.57,and 7 and 21.3, respectively. The range of valuesfor the unidirectional links per path metric is alsowider in the two-power model (0.12–0.59). Simi-larly to the random-power model, this metric ishighest for scenarios with the highest in-neighborsfraction and lowest for scenarios with the lowestin-neighbors fraction, (Nlow,Rlow) = (90,0.1) and(10,0.9), respectively.
5.4.3. Three-power model
The path length benefit in both Scenarios 1 and2 decreases with the increase in the number of bidi-rectional paths, just as in the random- and two-power models. In Scenario 1, the maximum pathlength benefit is only 1.22, because the number ofunreachable nodes is very low (Section 5.3.3).The fraction of nodes that a node cannot reachon average reaches 91% in Scenario 2 (Section5.3.3) leading to a higher path length benefit ofusing unidirectional links (up to 2.9 hops).
Similarly to the random- and two-power mod-els, path length increases with an increase inunreachability, for both Scenarios 1 and 2. Theaverage shortest-path length and maximum short-est-path length reach values of 3.57 and 12.7 inScenario 1, and 4.45 and 20.8 in Scenario 2,respectively.
The unidirectional links per path fraction met-ric achieves ranges of 0.34–0.42 for Scenario 1and 0.33–0.57 for Scenario 2, which are wider than
the ones in the random-power model but narrowerthan the ones in the two-power model.
5.4.4. Summary
The analysis of the path characteristics metricsreveals that unidirectional links can have a signif-icant impact on the length of network routes,and that unidirectional paths in the three-powermodels generally contain a significant fraction ofunidirectional links. The path length benefit ofusing unidirectional paths is fairly small thoughof course, in some cases bidirectional paths areactually not available, so protocols that attemptto find a bidirectional path and are not able toroute over unidirectional paths, are not going tobe able to deliver their data and may incur unnec-essary overhead.
As in the case of the neighbor-related andreachability metrics, the two- and three-powermodels provide a larger set of values for each met-ric than the random-power model and thus pro-vide protocol designers with more choices forexperimenting with routing protocols in unidirec-tional networks with different characteristics.
5.5. Link and path changes metrics
The link and shortest-path changes metrics re-flect the level of mobility in the network and thechallenge to the routing protocol in terms of dis-tinguishing between changes in the directionalityof a link versus a link break, which affects protocolefficiency (Section 4).
5.5.1. Random-power model
The number of links in the network increaseswith an increase in average range and as a result,the number of link changes increases as well(Fig. 17); node movement in the presence of ahigher number of links causes a higher numberof link changes. However, the fraction of all linksthat experience a change actually decreases from0.009 at Rmin of 0 to 0.0065 at Rmin of 0.9 of Rmax.This decrease is due to the fact that the rise in thenumber of links outpaces the increase in the num-ber of link changes, since at a higher averagerange, the distance traversed and thus the timerequired to cause a link change is longer.

0 0.1 0.2 0.3 0.4 0.5 0.6 0.7 0.8 0.90
0.5
1
1.5
2
2.5
3
3.5
4
Rmin
as a Fraction of Rmax
Type
of L
ink
Cha
nges
per
Sec
ond
Unidirectional to BidirectionalBidirectional to UnidirectionalUnidirectional to UnreachableUnreachable to Unidirectional
Fig. 17. Random-power model: link changes (1 m/s).
0 0.1 0.2 0.3 0.4 0.5 0.6 0.7 0.8 0.90
50
100
150
200
250
300
Rmin
as a Fraction of Rmax
Sho
rtes
t-P
ath
Cha
nges
per
Sec
ond
Fig. 18. Random-power model: shortest-path changes (1 m/s).
0.10.2
0.30.4
0.50.6
0.70.8
0.9
1020
3040
5060
7080
90
0
2
4
6
8
Rlow
as a Fraction of Rhigh
Nlow
Link
Cha
nges
per
Sec
ond
Fig. 19. Two-power model: link changes (1 m/s).
320 J.G. Jetcheva, D.B. Johnson / Ad Hoc Networks 4 (2006) 303–325
The number of shortest-path changes and thefraction of shortest paths that change decreasewith an increase in average range (Fig. 18), withthe fraction of shortest-path changes decreasingfrom 0.035 to 0.01 at Rmin = 0 and Rmin = 0.9 ·Rmax, respectively. This is due to the fact that asaverage range increases, connectivity increasesleading to the presence of redundant links (i.e.,links that do not improve reachability or pathlength) and when a node encounters such a linkor when such a link breaks, the shortest pathsbetween it and other nodes are unaffected. Thiseffect is reflected in the ratio of the fraction of
shortest-path changes to the fraction of linkchanges which starts out at 3.9 and decreasesmonotonically, reaching a value of 1.51 at Rmin
of 0.9 of Rmax.We have divided link changes into several
groups to highlight several different types of link-related events that may affect the routing protocol(Section 4). The only statistically significant differ-ences between the four types of link changes arefor the smallest and largest values of Rmin (Fig.17). For small values of Rmin, the likelihood of uni-directional links becoming unreachable andunreachable links becoming unidirectional is high-er than the likelihood of unidirectional linksbecoming bidirectional and bidirectional linksbecoming unidirectional. For the highest severalvalues of Rmin, this trend is reversed. These effectsare due to the fact that at low values of averagerange, movement is more likely to cause two nodesto go from being unidirectional neighbors to beingdisconnected and vice versa, whereas for high val-ues of the average range in the network, movementis more likely to cause them to become bidirec-tional neighbors.
5.5.2. Two-power model
The number of link changes per second is influ-enced by the number of links in the network andalso by the number of unidirectional links in thenetwork (Fig. 19). The highest number of linkchanges occurs at the point of highest value for
J.G. Jetcheva, D.B. Johnson / Ad Hoc Networks 4 (2006) 303–325 321
the number of in-neighbors (Nlow = 50) and high-est number of links (Rlow = 0.9). The maximumnumber of link changes per second in the two-power model is 8.16, and the maximum numberof link changes per second in the random-powermodel is 14.17, but the maximum fraction of linkchanges approaches 0.01 in both models.
The fraction of shortest-path changes reaches amaximum of 0.12 which is 3.43 times higher thanthe maximum value of the fraction of shortest-path changes in the random-power model. Thefact that a similar fraction of link breaks in thetwo models causes a different fraction of routebreaks is due to the differences in path lengthbetween the models (Sections 5.4.1 and 5.4.2);longer paths are more affected by link changesthan shorter ones.
Similarly to the random-power model, the num-ber of changes between unreachable and unidirec-tional links is higher than the number of changesbetween unidirectional and bidirectional linkswhen average range is low and the reverse is truefor high average range.
5.5.3. Three-power model
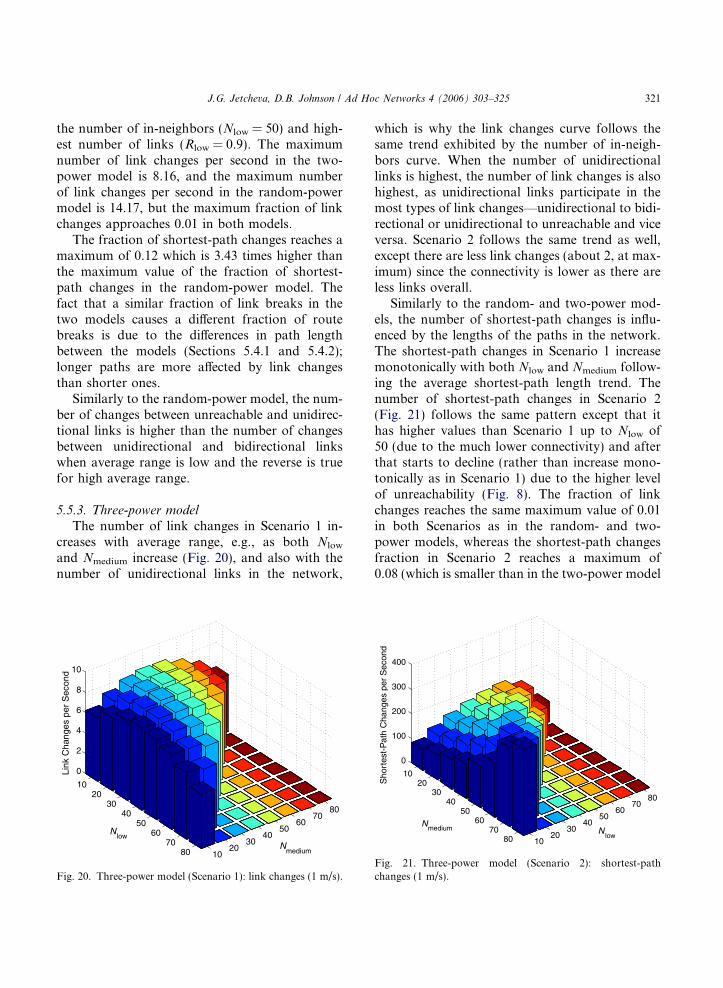
The number of link changes in Scenario 1 in-creases with average range, e.g., as both Nlow
and Nmedium increase (Fig. 20), and also with thenumber of unidirectional links in the network,
1020
3040
5060
7080
1020
3040
5060
7080
0
2
4
6
8
10
Nmedium
Nlow
Link
Cha
nges
per
Sec
ond
Fig. 20. Three-power model (Scenario 1): link changes (1 m/s).
which is why the link changes curve follows thesame trend exhibited by the number of in-neigh-bors curve. When the number of unidirectionallinks is highest, the number of link changes is alsohighest, as unidirectional links participate in themost types of link changes—unidirectional to bidi-rectional or unidirectional to unreachable and viceversa. Scenario 2 follows the same trend as well,except there are less link changes (about 2, at max-imum) since the connectivity is lower as there areless links overall.
Similarly to the random- and two-power mod-els, the number of shortest-path changes is influ-enced by the lengths of the paths in the network.The shortest-path changes in Scenario 1 increasemonotonically with both Nlow and Nmedium follow-ing the average shortest-path length trend. Thenumber of shortest-path changes in Scenario 2(Fig. 21) follows the same pattern except that ithas higher values than Scenario 1 up to Nlow of50 (due to the much lower connectivity) and afterthat starts to decline (rather than increase mono-tonically as in Scenario 1) due to the higher levelof unreachability (Fig. 8). The fraction of linkchanges reaches the same maximum value of 0.01in both Scenarios as in the random- and two-power models, whereas the shortest-path changesfraction in Scenario 2 reaches a maximum of0.08 (which is smaller than in the two-power model
1020
3040
5060
7080
1020
3040
5060
7080
0
100
200
300
400
Nlow
Nmedium
Sho
rtes
t-P
ath
Cha
nges
per
Sec
ond
Fig. 21. Three-power model (Scenario 2): shortest-pathchanges (1 m/s).

322 J.G. Jetcheva, D.B. Johnson / Ad Hoc Networks 4 (2006) 303–325
and larger than in the random-power model) andis about 4 times higher than the maximum valuein Scenario 1 (which itself is higher than the max-imum value of the metric in the random-powermodel). As mentioned in Section 5.5.2, a similarfraction of link breaks in all of the models causesa different fraction of shortest-path changes ineach model due to the differences in path lengthbetween scenarios generated by each model (Sec-tions 5.4.1, 5.4.2, and 5.4.3); longer paths are moreaffected by link changes than shorter ones.
The different types of link changes in Scenario 1have similar values to each other and follow thesame trend as the link changes metric.
In Scenario 2, due to the higher level ofunreachability, the unidirectional to unreachablelink changes have higher values than the unidirec-tional to bidirectional changes and vice versa.
5.5.4. Summary
The analysis of the link and path change metricsshows that knowing the number or fraction of linkchanges, does not always help in predicting thenumber and fraction of shortest-path changes, asthese are also dependent on path length and thetypes of paths that exist in the network. Our find-ings reinforce once again, that it is important toanalyze the routing characteristics of the networkusing a rich set of metrics, as different metrics ex-pose different aspects of the routing environmentthat often cannot be predicted based on the valuesof other metrics.
5.6. Effects of mobility and speed of movement
To explore the effects of mobility, we performedthe same set of experiments described in Section 5but with a maximum speed of movement of 20m/s, instead of 1 m/s. In addition, we repeatedthe experiments for a static network.
5.6.1. High mobility
The values of most of the metrics for the ran-dom-power model at 20 m/s are nearly identicalto the values of the metrics in the 1 m/s scenariosbecause they are influenced by node density ratherthan mobility, and the Random Waypoint modelmaintains a similar density between scenarios with
different maximum speeds at a pause time of 0(Section 5). The metrics that are influenced bythe level of mobility in the network are the linkand shortest-path changes metrics for which theshapes of the graphs are the same but the absolutevalues are higher at 20 m/s due to the higher speedof movement. The number of link changes is about12.7 times higher, and the number of shortest-path changes is about 11.5 times higher at 20 m/s, which match the differences in the ratios of linkand shortest-path change metrics between 1 and 20m/s in the scenarios without power variations(Table 1).
The metrics for the two- and three-power mod-els at 20 m/s exhibit the same behavior as in therandom-power model.
5.6.2. Static networks
In a static network with random-power modelgenerated power levels, the total number of neigh-bors is 74% of the total number of neighbors in amobile scenario, and the total number of paths is95% that of the mobile scenarios. This lower con-nectivity is present in scenarios without power var-iation as well (Table 1) and is due to the differencein the distribution of nodes on the site between astatic network and a network in which the nodesmove according to a Random Waypoint model(Section 5). The difference in the distribution ofnodes on the site, and the consequent differencein connectivity between the static and mobile sce-narios is the cause of differences in their routingcharacteristics. The general trend in the values ofthe metrics in the static network is the same as inthe mobile ones, except that the number of neigh-bors is lower, the number of unreachable nodes ishigher, and the path lengths are higher. These dif-ferences are generally in the range of 5–15%.
5.7. Routing example analysis
In this section, we briefly revisit the AODVexample introduced in Section 1, which we arenow able to analyze using the metrics studied inthe preceding sections.
As mentioned in Section 1, the number andfraction of in-neighbors decrease monotonicallyin the parameterizations of the two-power model,

0.1 0.2 0.3 0.4 0.5 0.6 0.7 0.8 0.90
10
20
30
40
50
60
70
80
90
100
Rlow
as a Fraction of Rhigh
Num
ber
of N
odes
Rea
chab
le A
long
a G
iven
Pat
h
UniUni OnlyBiNo Paths
Fig. 22. Two-power model: node reachability metrics forNlow = 90 (1 m/s).
J.G. Jetcheva, D.B. Johnson / Ad Hoc Networks 4 (2006) 303–325 323
moving from left to right in Fig. 1. These simplemetrics, however, do not explain the non-mono-tonic behavior of the routing protocol, which cannow be interpreted with the help of the metricswe developed. In particular, Fig. 22 shows thereachability metrics for the unidirectional scenar-ios used in the simulation of AODV.
AODV generates ROUTEOUTE REQUESTEQUESTs when itencounters a unidirectional or broken link, andwhen a destination node is unreachable. The peakof the ROUTEOUTE REQUESTEQUEST graph is at Rlow of 0.3;this is the scenario with the highest number ofunreachable and one-way unidirectionally reacha-ble paths, and these cause the largest number ofroute discoveries. For values of Rlow of 0.1 and0.2, connectivity is lower than at 0.3, but it is solow that ROUTEOUTE REQUESTEQUEST packets are not ableto propagate to many nodes. At Rlow of 0.4, thenumber of unreachable nodes is much lower thanat 0.3, and even though the number of mutuallyunidirectional paths is higher (triggering protocolreaction), the number of bidirectional paths is alsohigher, causing the ROUTEOUTE REQUESTEQUEST curve to be-gin to decline. This decline turns into a slow in-crease at Rlow of 0.6, which is the point at whichthe number of bidirectional paths in the networkbegins to exceed the number of unidirectionalpaths. At first glance, it seems that the numberof ROUTEOUTE REQUESTEQUESTs should begin to decline as
the protocol is more likely to find bidirectionalpaths. However, as the number of bidirectionalpaths grows, so does the number of link breaksas well as the number of bidirectional to unidirec-tional link changes (Fig. 19). As a result, the pro-tocol is forced to perform more local repairs, bothin response to link breaks and also in response tolinks changing from bidirectional to unidirec-tional, which are perceived by the protocol as linkbreaks.
6. Conclusion
In this paper, we have studied the impact of uni-directional links on the routing characteristics ofmultihop wireless ad hoc networks. Our analysisfocuses on mobile networks composed of heteroge-neous devices with different transmission capabili-ties. To generate such networks, we used the threemost commonly used power variation models forsimulations of ad hoc networks with unidirectionallinks: the random-, two-, and three-power models,each parameterized with a wide range of parame-ter values. We presented a set of metrics that ex-pose the routing characteristics of the resultantnetwork scenarios, indicating the routing difficultythat each poses to the routing protocol. Our anal-ysis shows that it is important to examine thebehavior of the network from multiple viewpoints,as the difficulty and effects of a unidirectional sce-nario on routing protocol performance can beinterpreted only with knowledge of the routingcharacteristics of the network and insight intotheir interactions. Our findings enable protocoldesigners to better choose a set of network scenar-ios that truly explore a wide range of a routingprotocol�s behaviors in the presence of unidirec-tional links, and to better understand the subtletiesof the interplay between routing mechanisms andnetwork states.
Acknowledgement
This work was supported in part by NSF undergrants CCR-0209204, CNS-0325971, and CNS-0338856, by NASA under grant NAG3-2534,

324 J.G. Jetcheva, D.B. Johnson / Ad Hoc Networks 4 (2006) 303–325
and by a gift from Schlumberger. The views andconclusions contained here are those of theauthors and should not be interpreted as necessar-ily representing the official policies or endorse-ments, either express or implied, of NSF, NASA,Schlumberger, Carnegie Mellon University, RiceUniversity, or the US Government or any of itsagencies.
References
[1] L. Bao, J.J. Garcia-Luna-Aceves, Link-state routing innetworks with unidirectional links, in: Proceedings of theIEEE International Conference on Computer Communi-cations and Networks (ICCCN), October 1999, pp. 358–363.
[2] J. Broch, D.A. Maltz, D.B. Johnson, Y.-C. Hu, J.G.Jetcheva, A performance comparison of multi-hop wirelessad hoc network routing protocols, in: Proceedings of theFourth Annual ACM/IEEE International Conference onMobile Computing and Networking, October 1998, pp.85–97.
[3] K. Fall, K. Varadhan (Eds.), The ns manual (formerly ns
notes and documentation). The VINT Project, December2003. Available from: <http://www.isi.edu/nsnam/ns/>.
[4] Z.J. Haas, A Routing Protocol for the reconfigurablewireless network, in: 1997 IEEE 6th International Confer-ence on Universal Personal Communications Record.Bridging the Way to the 21st Century, (ICUPC �97), vol.2, October 1997, pp. 562–566.
[5] D.B. Johnson, D.A. Maltz, Dynamic source routing in adhoc wireless networks, in: T. Imielinski, H. Korth (Eds.),Mobile Computing, Kluwer Academic Publishers, Boston,1996, pp. 153–181 (Chapter 5).
[6] D.B. Johnson, D.A. Maltz, Y.-C. Hu, The DynamicSource Routing Protocol for Mobile Ad Hoc Networks,Internet-Draft, draft-ietf-manet-dsr-10.txt, July 2004,Work in progress.
[7] M.K. Marina, S.R. Das, Routing performance in thepresence of unidirectional links in multihop wirelessnetworks, in: Proceedings of the 2002 ACM InternationalSymposium on Mobile Ad Hoc Networking and Comput-ing (MobiHoc 2002), June 2002, pp. 12–23.
[8] M.R. Pearlman, Z.J. Haas, B.P. Manvell, Using multi-hopacknowledgements to discover and reliably communicateover unidirectional links in ad hoc networks, in: Proceed-ings of the IEEE Wireless Communications and Network-ing Conference 2000 (WCNC), September 2000, pp. 532–537.
[9] C.E. Perkins, P. Bhagwat, Highly dynamic destination-sequenced distance-vector routing (DSDV) for mobilecomputers, in: Proceedings of the SIGCOMM �94 Confer-ence on Communications Architectures, Protocols andApplications, August 1994, pp. 234–244.
[10] C.E. Perkins, E.M. Royer, S.R. Das, Ad Hoc On-DemandDistance Vector (AODV) Routing, RFC 3561, July 2003.
[11] V. Ramasubramanian, R. Chandra, D. Mosse, Providing abidirectional abstraction for unidirectional ad hoc net-works, in: Proceedings of IEEE Infocom, June 2002.
[12] V. Ramasubramanian, D. Mosse, Statistical analysis ofconnectivity in unidirectional ad hoc networks, in: Pro-ceedings of the International Conference on ParallelProcessing Workshops (ICPPW), August 2002, pp. 109–116.
[13] G. Resta, P. Santi, An analysis of the node spatialdistribution of the random waypoint mobility model forad hoc networks, in: Principles of Mobile Computing(POMC) Workshop, October 2002.
[14] P. Sinha, S. Krishnamurthy, S. Dao, Scalable unidirec-tional routing with Zone Routing Protocol (ZRP) exten-sions for mobile ad-hoc networks, in: Proceedings of theIEEE Wireless Communications and Networking Confer-ence 2000 (WCNC), September 2000, pp. 1329–1339.
Jorjeta G. Jetcheva is currently a Sys-tems Architect at Firetide, Inc., whereshe is responsible for driving the evo-lution of the core mesh routingtechnology of the company. She hasbeen involved in ad hoc networkingresearch for the past seven years,including the design, analysis, simula-tion and measurement evaluation ofrouting protocols and mechanisms.She received her Ph.D. in ComputerScience from Carnegie Mellon Uni-versity�s School of Computer Sciencein May 2004, defending a dissertation
on ‘‘Adaptive Demand-Driven Multicast Routing in Multi-HopMobile Ad Hoc Networks’’. She has also been involved inInternet traffic measurement and engineering during aninternship at Sprint Advanced Technology Laboratories inBurlingame, CA in 2000. Prior to obtaining her Master�s andPh.D. degrees from Carnegie Mellon, she received a B.A. degreein Computer Science and Mathematics, with a summa cumlaude in Computer Science, from Mount Holyoke College.While there she was also involved in research on networkedworkstations, computer vision and computational geometry,and did an internship at the DataViews Corporation, North-ampton, MA, where she worked on dynamic data visualization.She has served as a reviewer for numerous networking confer-ences and journals. She is a member of ACM SIGMOBILE,Sigma Xi and Phi Beta Kappa.
David B. Johnson is an Associate Pro-fessor of Computer Science and Elec-trical and Computer Engineering atRice University. Prior to joining thefaculty at Rice in 2000, he was anAssociate Professor of Computer Sci-ence at Carnegie Mellon University,where he had been on the faculty foreight years. He is leading the MonarchProject, developing adaptive network-ing protocols and architectures toallow truly seamless wireless andmobile networking. He has also been

J.G. Jetcheva, D.B. Johnson / Ad Hoc Networks 4 (2006) 303–325 325
very active in the Internet Engineering Task Force (IETF), theprincipal protocol standards development body for the Inter-net, in the Mobile IP and MANET (Mobile Ad Hoc Networks)working groups. He was one of the main designers of the IETFMobile IP protocol for IPv4 and is the primary designer ofMobile IP for IPv6, and his group�s Dynamic Source Routingprotocol (DSR) for ad hoc networks has been approved to bepublished as an Experimental protocol for the Internet. He hasserved as the General Chair for MobiCom 2003 and the
Technical Program Chair for MobiHoc 2002 and MobiCom1997, has been a member of the Technical Program Committeefor over 30 international conferences and workshops, and hasbeen an editor for several journals. He is an Executive Com-mittee member and the Treasurer for ACM SIGMOBILE, theSpecial Interest Group on Mobility of Systems, Users, Data,and Computing, and is a member of the ACM, IEEE, IEEEComputer Society, IEEE Communications Society, USENIX,and Sigma Xi.
Related Documents


