Roula Hourani, MD American University of Beirut Department of Radiology NEUROIMAGING IN PSYCHIATRY

Roula Hourani, MD American University of Beirut Department of Radiology.
Dec 29, 2015
Welcome message from author
This document is posted to help you gain knowledge. Please leave a comment to let me know what you think about it! Share it to your friends and learn new things together.
Transcript

Roula Hourani, MDAmerican University of Beirut Department of Radiology
NEUROIMAGING IN PSYCHIATRY

Introduction
Using neuroimaging in psychiatry, identify if psychiatric disorder is due to a lesion or brain anomaly. Especially in cases with sudden extreme behavioral changes.
Can be used to follow up patient during the course of the neurological disease

Advanced neuroimaging techniques are rapidly emerging, the accessibility and use of these technologies will increase in coming years.
Neuroimaging advances useful clinical tools for the structural and functional assessment of psychiatric disorders such as dementia

PLAN

PLAN
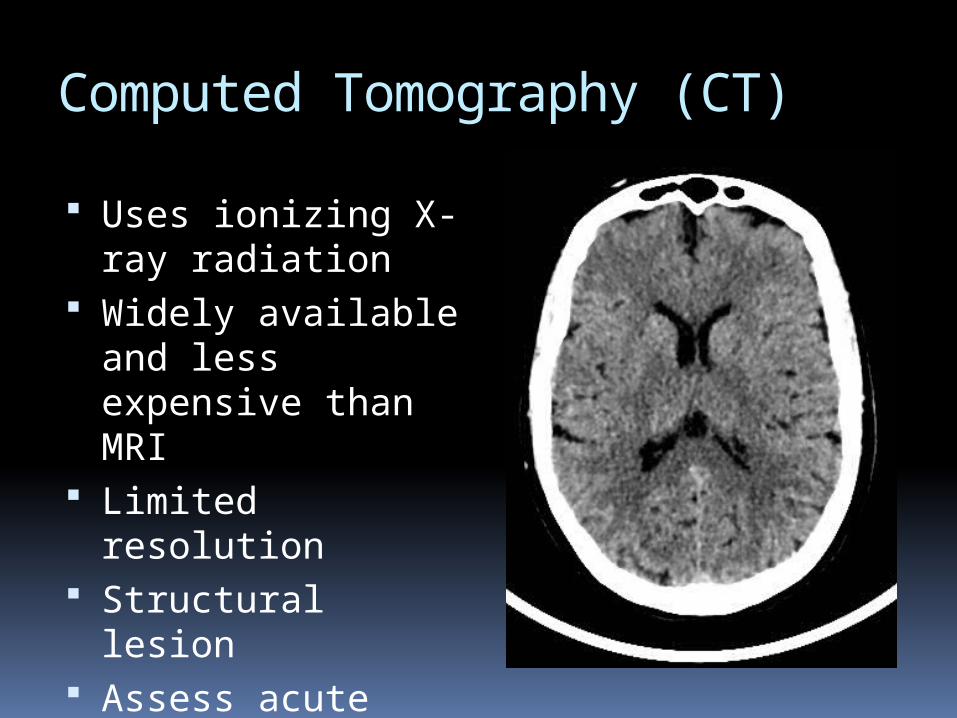
Computed Tomography (CT)
Uses ionizing X-ray radiation
Widely available and less expensive than MRI
Limited resolution Structural lesion Assess acute trauma
and hemorrhage

42 y.o. behavioral, personality changes
MRI
Good spatial and temporal resolution Functional vs Structural MRI No radiation Sensitive to movement Confining space, noisy
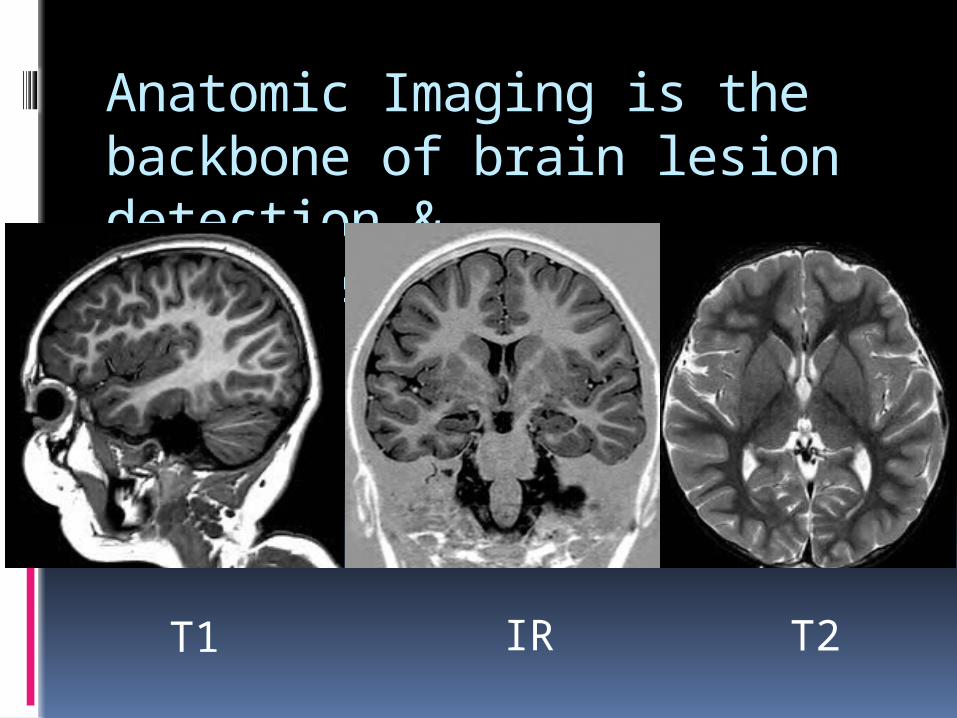
Anatomic Imaging is the backbone of brain lesion detection & characterization
T1 IR T2

Advances in MR Imaging: 4 functional MR imaging techniques Functional MRI (f MRI) Diffusion Tensor imaging (DTI) Proton MR spectroscopy (1H-MR spectroscopy) Perfusion-weighted imaging
Transition fromAnatomy Physiology Biology

1. Functional MRI
Advances in MR Imaging
BOLD Technique (Blood-Oxygen Level Dependent)
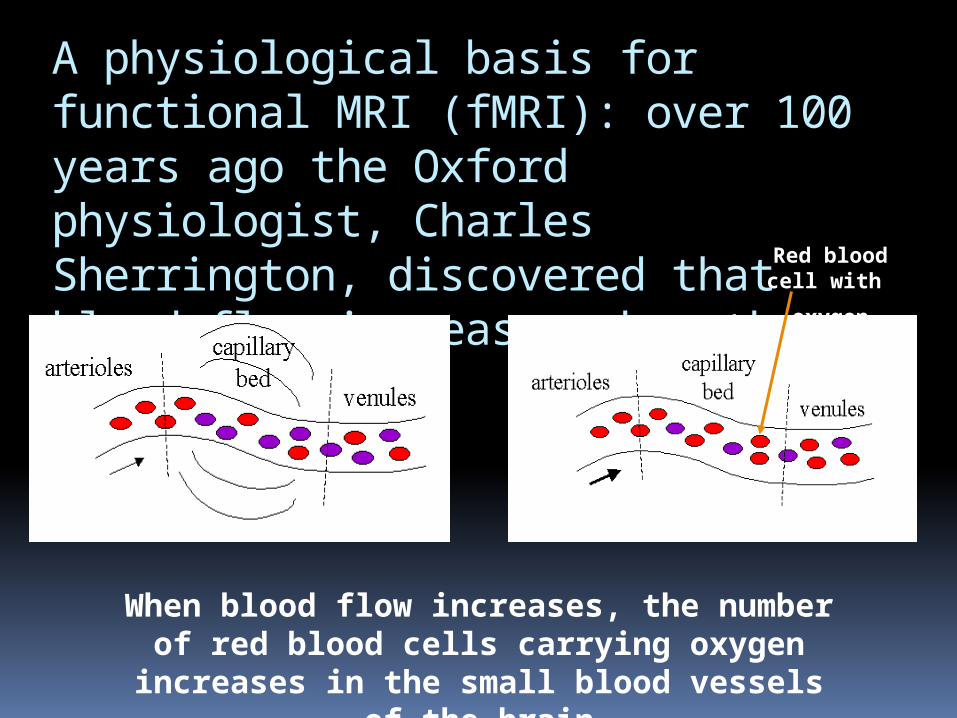
A physiological basis for functional MRI (fMRI): over 100 years ago the Oxford physiologist, Charles Sherrington, discovered that blood flow increases when the brain works
When blood flow increases, the number of red blood cells carrying oxygen increases in the small blood
vessels of the brain
Red blood cell with
oxygen

Small signal changes with altering blood oxygenation allow mapping of brain activation with functional
MRISignal change over time
Localising activation onto a high-resolution image

What are the applications
Pre-operative brain mapping, planning delineation of eloquent brain areas in relation to pathology: Motor cortex Speech areas: Broca’s and Wernicke’s area Visual cortex
Understanding of psychiatric and neurologic disorders
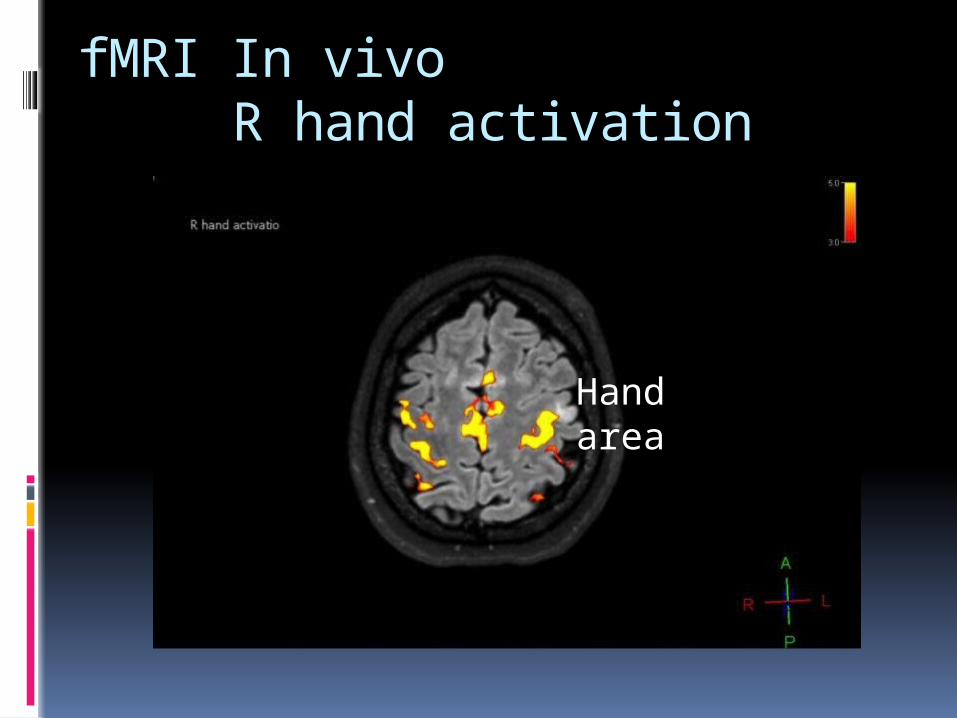
fMRI In vivo R hand activation
Hand area

Receptive language (Triview)

2. Diffusion Tensor Imaging
Advances in MR Imaging

Diffusion Tensor Imaging
Evaluate microstructure of white matter Presurgical evaluation of patients: tractography is
helpful in evaluating the white matter tracts DTI can be used to localize white matter lesions,
that don’t appear on structural clinical MRI
Gross et al., 2006; Widjaja et al., 2009.

What are the applications
Visualization of white matter tracts and evaluate brain connectivity.
Pre-operative evaluation of the relationship between brain tumors and major white matter tracts

DTI: tractography
Right frontal lobe seizure
Decrease fibers ILF: inferior longitudinal fasciculus on the right

DTIFractional anisotropy (FA) map
Decrease FA= marker WM degeneration
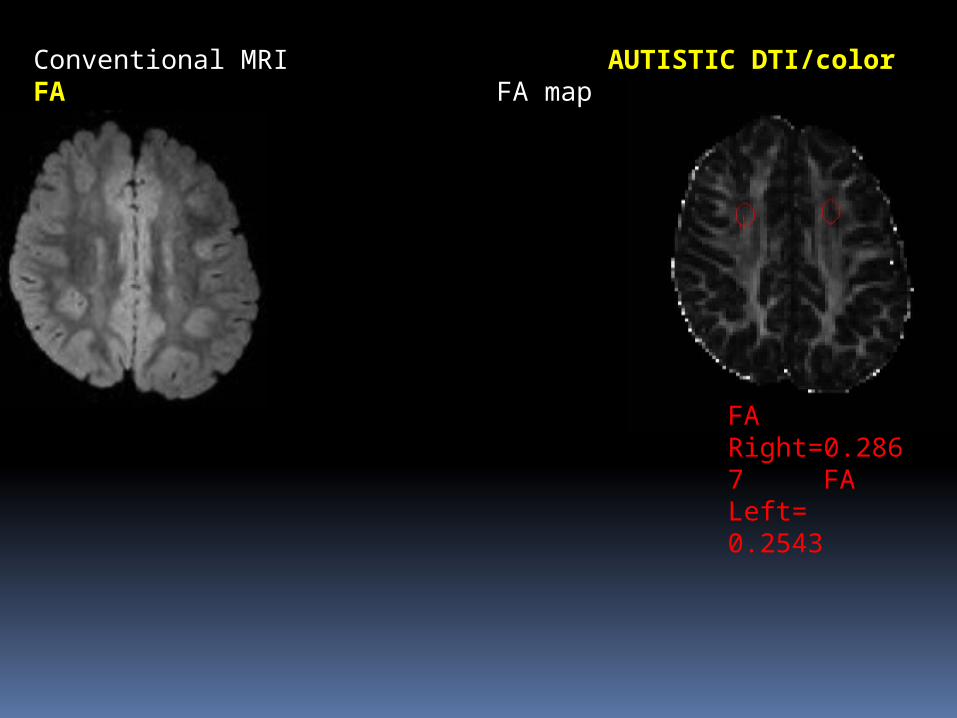
Conventional MRI AUTISTIC DTI/color FA FA map
FA Right=0.2867 FA Left= 0.2543

Current Study Autism
We are conducting a study using DTI to examine white matter tract changes between autistic patients and controls
Patients will be examined in a year to determined effects of ABA therapy
Recruitment at Present: 9 patients, 5 controls Differences between the right and left superior
corona radiata can be seen already.
3. MR Spectroscopy
Advances in MR Imaging
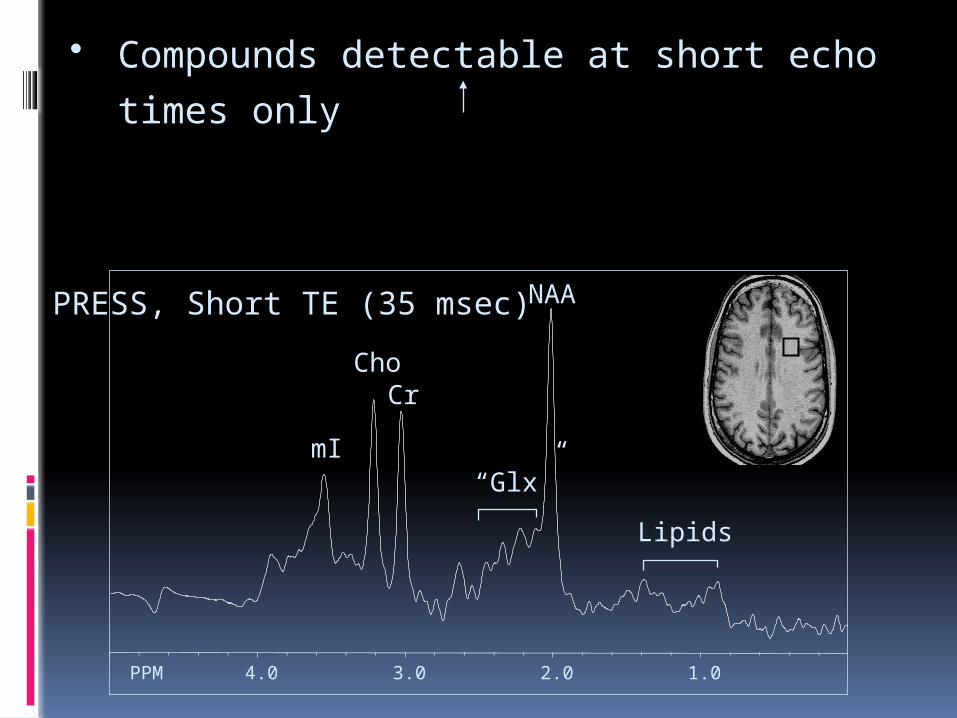
• Compounds detectable at short echo times only
PPM 4.0 3.0 2.0 1.0
mI“Glx”
Lipids
PRESS, Short TE (35 msec)
Cho
NAA
Cr

GABA: interesting metabolite in psychiatry
GABA serves as a major neurotransmitter of the brain and functions mainly to inhibit neural excitatory activity.
Disruption of GABAergic processes occur in various neurologic and psychiatric conditions, including epilepsy, mood disorders, motor disorders, neuroplasticity, and drug and alcohol dependence.
These concentration differences may be ascertained by using MR spectroscopy

GABA-Evaluation of psychiatric Conditions: MR Spectroscopy
Patients with unmedicated major depressive disorder: lower GABA levels in dorsomedial/ anterolateral prefrontal and occipital cortex
Recent MR spectroscopy study: GABA decreased within the visual cortex in patients with schizophrenia, reinforcing the idea of GABA disruption as the mechanism of loss of cognitive inhibition.
Levy LM, Degnan AJ. GABA-based evaluation of neurologic conditions: MR spectroscopy. AJNR Am J Neuroradiol. 2013 Feb;34(2):259-65.
Advances in MR Imaging
4. Perfusion-weighted imaging


Arterial Spin Labeling
ASL is a noninvasive MRI technique to evaluate cerebral blood flow similar to single photon emission computed tomography (SPECT)
ASL has low signal to noise ratio and quantification of these parameters is complex
Advantages compared with SPECT: ease of coregistration to MRI , noninvasive nature of the examination, reasonable time of acquisition (typically <6 min)
Wolf et al., 2001

5. VOXEL BASED MORPHOMETRY

Voxel based morphometry
it is a post-processing method of morphological images
segmentation of tissue classes into grey matter, white matter and cerebrospinal fluid

PLAN
1. Post Traumatic Stress disorder
Characterized by fear response, failure of fear extinction, behavioral sensitization and memory problems.
The structures involved in these processes include the sensory cortex, the dorsal thalamus, the lateral and central nucleus of the amygdala, the medial prefrontal cortex and hippocampus

Post Traumatic Stress disorder
Structural neuroimaging: Structural changes involve the anterior cingulate cortex (component of the medial prefrontal cortex), and the hippocampus
Reductions in hippocampal volume Functional neuroimaging: most consistent
findings increased amygdala and decreased medial prefrontal cortex activation
Britton JC, PhanKL, Taylor SF, FigLM, Liberzon I. Corticolimbic blood flow in posttraumatic stress disorder during script drivenimagery.BiolPsychiatry2005;57:832–840.

Post Traumatic Stress disorder
Increased amygdala and decreased medial prefrontal cortex activation
Overall the findings support the hypothesis: two acute trauma response subtypes, one that is mainly dissociative(decr hippo) and the other is characterised by hyperarousal and intrusions

2. Mood Disorders
Mainly depression and bipolar (problems with classification)

Mood Disorders: Structural Imaging
Increased white matter hyperintensities (WMH) in unipolar patients
Prefrontal cortical volume reduction unipolar depressed patients, and reduced Temporal GM density
In Bipolar, amygdala enlargment is a more consistent finding.

White matter hyperintensities

Mood Disorders: Functional Imaging
Decreased anterior paralimbic and cortical activity (CBF). Imaging shows reversal in symptoms after therapy, thus supporting limbic-cortical dysregulation.
Proton MR Spectroscopy: Show depressed patients: increased concentration
of basal ganglia and anterior cingulate Cho. Diminished NAA and Cr: dlPFC in Bipolar Reduction of orbito-frontal gray matter NAA in
Bipolar
Mood Disorders: Functional Imaging
mPFC also linked to depression, and plays a role in emotion and emotive decisions.
Resting State fMRI links anterior and subgenual cingulate to clinical depression to autobiographical and script induced sadness

Am J Psychiatry. 1995 Mar;152(3):341-51. Brain activity during transient sadness and happiness in healthy women.. George MS(1), Ketter TA
2
FIG. 1
FIG. 1 . Positron emission tomography/magnetic resonance imaging superimposition, sagittal view. z-score maps demonstrating differences in direction, magnitude and extent of changes seen in rostral cingulate glucose metabolism (BA 24a/b) in the three groups of depressed patients compared with healthy controls. Cingulate hypometabolism (negative z-values, shown in green) characterized the non-responder group in contrast to hypermetabolism (positive z-values, shown in yellow) seen in the eventual treatment responders. Table 2 lists the coordinates of local cingulate maxima and minima.
Positron emission tomography/magnetic resonance imaging superimposition, sagittal view. z-score maps demonstrating differences in direction, magnitude and extent of changes seen in rostral cingulate glucose metabolism (BA 24a/b) in the three groups of depressed patients compared with healthy controls. Cingulate hypometabolism (negative z-values, shown in green) characterized the non-responder group in contrast to hypermetabolism (positive z-values, shown in yellow) seen in the eventual treatment responders.
Mood Disorders: Functional Imaging
Lithium and fluorinate MRS non-invasive means of measuring brain lithium and fluorinated drugs
provides insight into effectiveness of treatment in Bipolar. Limited to research, but has some clinical application.

3. Schizophrenia
Structural neuroimaging: white matter hyperintensities common, in late life
schizophrenia. Reductions in prefrontal cortical white matter
volume associated with negative symptoms Volumetric MRI: decreases in size putamen,
thalamus and superior temporal gyrus

Statistical parametric maps showing regions of greater ADC value in the patients with schizophrenia compared to the control subjects. Z scores are shown by the color map.
Yong-Wook Shin et al , Increased water diffusivity in the frontal and temporal cortices of schizophrenic patients. NeuroImage, Volume 30, Issue 4, 2006, 1285 - 1291
Schizophrenia, Diffusion WI
Increased water diffusivity in the fronto-temporal regions

Schizophrenia MRS
Functional neuroimaging: Spectroscopy:
consistently reported reduction in frontal and temporal cortex NAA concentrations suggesting neuronal loss localised reduction of grey matter
Thordur Sigmundsson et al. Frontal lobe N correlates with psychopathology in schizophrenia: a proton magnetic resonance spectroscopy study. Schizophrenia Research, Volume 64, Issue 1, 2003, 63 - 71

Schizophrenia/ fMRI
fMRI has also been useful in examining frontal lobe dysfunction that is thought to be at the core of schizophrenia.
Consistent finding: hypofrontality, namely an inability to generate a frontal cerebral response to a specific task.
Reduced activation in the left temporal lobe, right frontal lobe and left cerebellum

4. Mild cognitive impairment and Alzheimer disease Most common cause of dementia in elderly population
50-80% of cases of dementia
Definite diagnosis requires histopathological proof (biopsy or autopsy) identify: Senile plaques (amyloid- extraneuronal) Neurofibrillary tangles (tau-intraneuronal) Amyloid angiopathy Neuronal loss Gliosis
Mott R.T., Hulette C.M. Neuropathology of alzheimer’s disease. Neuroimag Clin N Am 2005;15:755-765.

MCI and Alzheimer disease
With recent advances in imaging, the radiological diagnosis of AD is becoming a diagnosis of inclusion
Structural neuroimaging: exclude other cause of treatable dementia
Best diagnostic clue: atrophy of temporal, parietal cortex, entorhinal cortex (parahippocampal gyrus) and disproportionate hippocampal volume loss.

66 yo man with Alzheimer’s Dementia
Atrophy of bilateral hippocampi, parahippocampal gyri and temporal lobes
FLAIR Axial T2
MR volumetric analysis
MR volumetric analysis of the hippocampus, entorhinal cortex, distinguish patients with mild cognitive impairment from normal subject by sensitive depiction of hippocampal volume loss
MRI-based morphometry studies of patients with MCI show accelerated atrophy
Hippocampal atrophy in pts with mild cognitive impairment is predictive of subsequent conversion to AD
Norfray J.F., Provenzale J.M. Alzheimer’s disease: neuropathologic findings and recent advances in imaging. AJR 2004;182:3-13.

Date of download: 7/2/2015Copyright © 2015 American Medical Association.
All rights reserved.
From: Three-dimensional Patterns of Hippocampal Atrophy in Mild Cognitive Impairment
Arch Neurol. 2006;63(1):97-101. doi:10.1001/archneur.63.1.97
The boundary of the hippocampus traced in consecutive coronal magnetic resonance imaging sections (A); 3-dimensional parametric surface created using anatomical surface modeling software (B); the surface of the hippocampus, which is composed of discrete triangular tiles that are spatially uniform and can be averaged across subjects (C); and an average anatomical model for a group, produced from the triangular tiles (D). A 3-dimensional medial curve is derived from each individual hippocampus (arrows in part B), and the distance from this axis to the surface is the dependent variable in a regression analysis. See the “Methods” section of the text for details.
Figure Legend:

MCI and Alzheimer’s disease, fmri
Study that investigated entorhinal and hippocampal function greater: hippocampal activation in the MCI group as compared with controls
AD patients had entorhinal and hippocampal atrophy and reduced activation
Proton MRS: Low NAA (correlates positively with neuropathologic findings) -
Decreased 10% High Myoinositol in most studies - Increased 20% Variable elevation of Cho Metabolic changes: mesial temporal, posterior cingulate, mesial
parieto-occipital lobes, frontal and hippocampi Myo/NAA ratio:
Sensitivity of 83% Specificity of 98%
Soher B.J. et al. A review of 1H spectroscopy findings in alzheimer’s disease. Neuroimag Clin N Am 2005;15:847-852.
MCI and Alzheimer’s disease /MRS
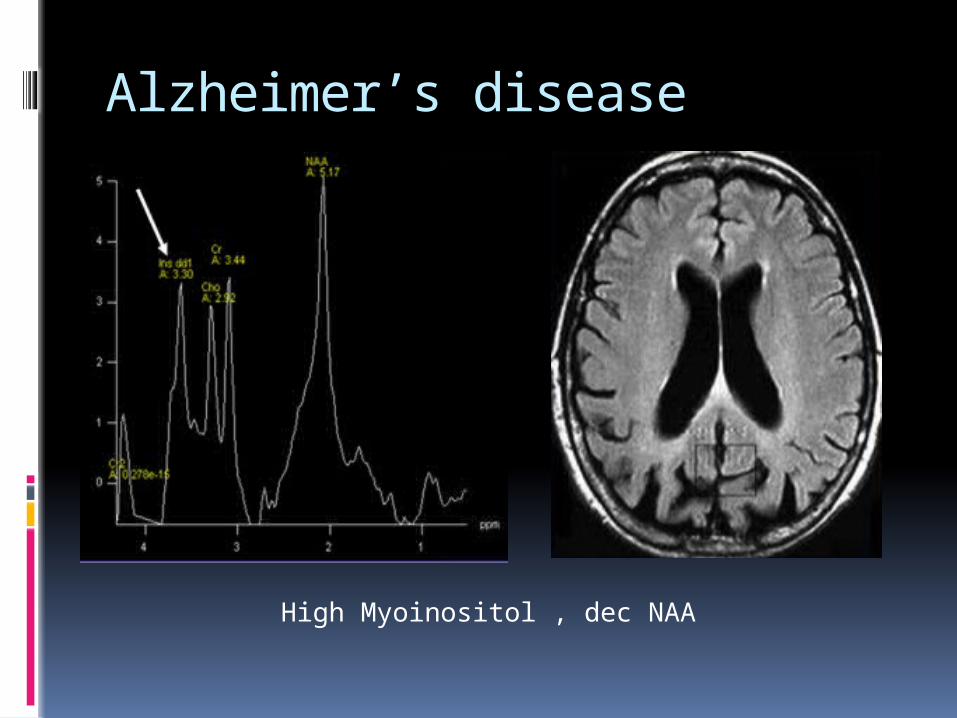
High Myoinositol , dec NAA
Alzheimer’s disease

Alzheimer’s disease: Diffusion-tensor imaging
AD: increased ADC in temporal Damage to myelin sheath or axonal membranes
cause alterations in these parameters The most common measures are ADC
(magnitude) and anisotropy index AI (directionality)
Krishnan S. et al. Current status of functional MR imaging, perfusion-weighted imaging, and diffusion-tensor imaging in alzheimer’s disease diagnosis and research. Neuroimag Clin N Am 2005;15:853-868.

53 y.o. memory loss
PET imaging
Conclusion
Traditional ImagingConsidered important means to exclude treatable causes of psychiatric disorder (hydrocephalus, tumors, hematomas): small proportion
Advance imaging technique: anatomy, functional

Conclusion
Clinicians understand the benefits and limitations of modern neuroimaging techniques
Coupling neuroimaging with genetics and pharmacotherapeutic studies will assist in understanding the pathophysiology of neuropsychiatric disorders

THANK YOU
Related Documents