Roughness and intermittent dynamics of imbibition fronts due to capillary and permeability disorder Ramon Planet a,b , Stéphane Santucci b,c, ⁎, Jordi Ortín a a Departament d'Estructura i Constituents de la Matèria, Facultat de Física, Universitat de Barcelona, Martí i Franqués 1, E-08028 Barcelona, Catalonia, Spain b Laboratoire de physique, CNRS UMR 5672, Ecole Normale Supérieure de Lyon, 46 Allée d'Italie, 69364 Lyon Cedex 07, France c Department of Physics, and Physics of Geological Processes, Oslo University, PB 1048 Blindern, 0316 Oslo, Norway article info abstract Article history: Received 30 November 2009 Received in revised form 11 October 2010 Accepted 15 October 2010 Available online 23 October 2010 We follow the propagation of an air–liquid interface during forced-flow imbibition of a viscous wetting liquid by a random medium, using a high resolution fast camera. Our model disordered medium mimics an open fracture by a Hele-Shaw cell with a two-valued gap spacing randomly distributed in the fracture (or Hele-Shaw) plane. By systematically varying the imposed flow rate we achieve average imbibition front velocities in the range 0.057 b v b 0.648 mm/s, allowing the investigation of two different regimes. Up to v ≃ 0.2 mm/s the front roughening is dominated by capillary pressure fluctuations (capillary regime). Above this value it is influenced also by fluctuations of the permeability of the medium (mixed capillary and permeability regime). We analyze the scaling properties of the front morphology in these two regimes, and find that the local roughness exponent changes from α loc ≃ 0.8 in the capillary regime to 0.5 in the mixed capillary–permeability regime. In contrast, the statistics of the spatially-averaged (global) velocity of the front V l (t) does not seem to be influenced by the randomness in the permeability. The fluctuations of V l (t) follow a non-Gaussian distribution, whose skewness γ ~1= ffiffiffi v p in both regimes. Similarly, sizes and durations of the avalanches of the global velocity present the same statistical distributions in both regimes. In the mixed capillary–permeability regime, the power-law exponents that characterize these distributions take the values α = 0.97 ± 0.05 for the sizes, τ = 1.16 ± 0.10 for the durations, and x = 1.3 ± 0.1 for the joint distribution of sizes vs. durations. These values are in excellent agreement with the ones measured previously in the capillary regime (Planet et al., 2009). The dynamics therefore appear to be equivalent in both regimes, a result that we relate to the fact that the correlation length of the local velocities along the front is observed to follow the same dependence l c ~1= ffiffiffi v p in both regimes. © 2010 Elsevier B.V. All rights reserved. Keywords: Flow in porous media Imbibition Capillarity Permeability Avalanche dynamics 1. Introduction The dynamics of immiscible fluid–fluid displacements in disordered media has been a subject of intense study for many years (see Adler and Brenner, 1988; Bear, 1972; Sahimi, 1993, 1995 and references therein). On one hand, this interest is clearly motivated by a technological point of view, since a better understanding of such processes can bring many benefits to various industrial applications such as oil recovery (Zhou et al., 2002), irrigation of soils (Blunt et al., 2002), or printing processes (Ahmed et al., 1997), to cite a few. On the other hand, it brings forward challenging questions from a fundamental point of view, in particular in statistical physics as a dynamical non-equilibrium process (Halpin-Healy and Zhang, 1995; Alava et al., 2004). Imbibition is a process of fluid transport in a disordered medium, in which a fluid that wets the medium displaces a Journal of Contaminant Hydrology 120–121 (2011) 157–169 ⁎ Corresponding author. Laboratoire de physique, CNRS UMR 5672, Ecole Normale Supérieure de Lyon, 46 Allée d'Italie, 69364 Lyon Cedex 07, France. E-mail addresses: [email protected] (R. Planet), [email protected] (S. Santucci), [email protected] (J. Ortín). 0169-7722/$ – see front matter © 2010 Elsevier B.V. All rights reserved. doi:10.1016/j.jconhyd.2010.10.005 Contents lists available at ScienceDirect Journal of Contaminant Hydrology journal homepage: www.elsevier.com/locate/jconhyd

Welcome message from author
This document is posted to help you gain knowledge. Please leave a comment to let me know what you think about it! Share it to your friends and learn new things together.
Transcript

Journal of Contaminant Hydrology 120–121 (2011) 157–169
Contents lists available at ScienceDirect
Journal of Contaminant Hydrology
j ourna l homepage: www.e lsev ie r.com/ locate / jconhyd
Roughness and intermittent dynamics of imbibition fronts due to capillaryand permeability disorder
Ramon Planet a,b, Stéphane Santucci b,c,⁎, Jordi Ortín a
a Departament d'Estructura i Constituents de la Matèria, Facultat de Física, Universitat de Barcelona, Martí i Franqués 1, E-08028 Barcelona, Catalonia, Spainb Laboratoire de physique, CNRS UMR 5672, Ecole Normale Supérieure de Lyon, 46 Allée d'Italie, 69364 Lyon Cedex 07, Francec Department of Physics, and Physics of Geological Processes, Oslo University, PB 1048 Blindern, 0316 Oslo, Norway
a r t i c l e i n f o
⁎ Corresponding author. Laboratoire de physique, CNormale Supérieure de Lyon, 46 Allée d'Italie, 69364 L
E-mail addresses: [email protected] (R. [email protected] (S. Santucci), jordi.ortin
0169-7722/$ – see front matter © 2010 Elsevier B.V.doi:10.1016/j.jconhyd.2010.10.005
a b s t r a c t
Article history:Received 30 November 2009Received in revised form 11 October 2010Accepted 15 October 2010Available online 23 October 2010
We follow the propagation of an air–liquid interface during forced-flow imbibition of a viscouswetting liquid by a randommedium, using a high resolution fast camera. Our model disorderedmediummimics an open fracture by a Hele-Shaw cell with a two-valued gap spacing randomlydistributed in the fracture (or Hele-Shaw) plane. By systematically varying the imposed flowrate we achieve average imbibition front velocities in the range 0.057bvb0.648 mm/s,allowing the investigation of two different regimes. Up to v≃0.2 mm/s the front roughening isdominated by capillary pressure fluctuations (capillary regime). Above this value it isinfluenced also by fluctuations of the permeability of the medium (mixed capillary andpermeability regime). We analyze the scaling properties of the front morphology in these tworegimes, and find that the local roughness exponent changes from αloc≃0.8 in the capillaryregime to 0.5 in the mixed capillary–permeability regime. In contrast, the statistics of thespatially-averaged (global) velocity of the front Vl(t) does not seem to be influenced by therandomness in the permeability. The fluctuations of Vl(t) follow a non-Gaussian distribution,whose skewness γ~1=
ffiffiffiv
pin both regimes. Similarly, sizes and durations of the avalanches of
the global velocity present the same statistical distributions in both regimes. In the mixedcapillary–permeability regime, the power-law exponents that characterize these distributionstake the valuesα=0.97±0.05 for the sizes, τ=1.16±0.10 for the durations, and x=1.3±0.1for the joint distribution of sizes vs. durations. These values are in excellent agreement with theones measured previously in the capillary regime (Planet et al., 2009). The dynamics thereforeappear to be equivalent in both regimes, a result that we relate to the fact that the correlationlength of the local velocities along the front is observed to follow the same dependencelc~1=
ffiffiffiv
pin both regimes.
© 2010 Elsevier B.V. All rights reserved.
Keywords:Flow in porous mediaImbibitionCapillarityPermeabilityAvalanche dynamics
1. Introduction
The dynamics of immiscible fluid–fluid displacements indisordered media has been a subject of intense study formany years (see Adler and Brenner, 1988; Bear, 1972; Sahimi,1993, 1995 and references therein). On one hand, this interest
NRS UMR 5672, Ecoleyon Cedex 07, France.net),@ub.edu (J. Ortín).
All rights reserved.
is clearly motivated by a technological point of view, since abetter understanding of such processes can bring manybenefits to various industrial applications such as oil recovery(Zhou et al., 2002), irrigation of soils (Blunt et al., 2002), orprinting processes (Ahmed et al., 1997), to cite a few. On theother hand, it brings forward challenging questions from afundamental point of view, in particular in statistical physicsas a dynamical non-equilibrium process (Halpin-Healy andZhang, 1995; Alava et al., 2004).
Imbibition is a process of fluid transport in a disorderedmedium, in which a fluid that wets the medium displaces a

158 R. Planet et al. / Journal of Contaminant Hydrology 120–121 (2011) 157–169
resident fluid. The process is called spontaneous imbibitionwhen the invading fluid displaces a resident fluid underconstant external pressure. In contrast, forced-flow imbibitiontakes place when the invading fluid gets into the porousmedium at a constant injection rate. During the imbibitionprocess, the liquid–air interface is affected by severalcompeting forces acting on different length scales: whilethe fluctuations in capillary forces and the heterogeneouspermeability tend to destabilize the fluid interface, theviscous pressure drop and the surface tension tend to flattenit (Ganesan and Brenner, 1998; Dubé et al., 1999; Hernández-Machado et al., 2001; Pauné and Casademunt, 2003). Theresult is that the system develops long range correlationsalong the front; the correlation length ‘c measures the extentof the lateral correlations. As a consequence, imbibition frontsare driven towards a statistically stationary state with criticalinterface fluctuations (Alava et al., 2004) which lead to anintermittent dynamics observed both experimentally (Planetet al., 2009; Santucci et al., 2009) and numerically (Pradas,2009).
Indeed, such a complex dynamics generically calledcrackling noise (Sethna et al., 2001) is characterized bysudden avalanches distributed over a wide range of sizesand durations, and separated by periods of rest spanning alarge range of waiting times. Those magnitudes are usuallypower-law distributed, without any characteristic scales. Thisrich spatio-temporal dynamics is commonly observed in themotion of interfaces driven in disordered media of verydifferent microscopic nature. There are numerous examplesranging from the dynamics of magnetic domain walls indisordered ferromagnets (Durin and Zapperi, 2006) and ofwetting contact lines on rough substrates (Rolley et al., 1998),the propagation of a crack front in a heterogeneous medium(Bonamy et al., 2008; Måløy et al., 2006), up to the largerscales of fault dynamics and earthquakes (Sornette andSornette, 1989). Since in most of those systems one cannothave access to a local information, this crackling noise(Sethna et al., 2001) is usually characterized only at a globalscale by measuring a global (i.e. spatially-averaged) magni-tude, such as for example the “Barkhausen noise” (Durinand Zapperi, 2006). Moreover, numerous recent studies(Bertin, 2005; Bramwell et al., 1998, 2000; Joubaud et al.,2008; Portelli et al., 2001; Tóth-Katona and Gleeson, 2003)have shown that the statistical distribution of the fluctuationsof the average (global magnitude) in systems where the localmagnitude is correlated is well approximated by a general-ized Gumbel distribution, which is an asymmetric non-Gaussian distribution with a large exponential tail, whenthe correlation length is of the order of the system size. Eventhough this behavior has been extensively studied, there isnot yet a clear understanding of why such a particular kind ofdistribution emerges in many different correlated systems todescribe the distribution of the fluctuations of globalobservables.
It is exactly in that context that we performed ourexperimental study, focusing on the intermittent dynamicsof an air–liquid interface during forced-flow imbibition of aviscous wetting liquid by a random medium. Indeed, whilethe spatio-temporal scaling properties of kinetic rougheningin imbibition have been studied extensively in the pastexperimentally, theoretically and numerically (as reviewed in
(Alava et al., 2004)), the spatio-temporal intermittentdynamics of imbibition fronts has not received up to nowthe same attention in particular experimentally. Doughertyand Carle (1998) performed a study of the imbibition frontdynamics in a model porous medium consisting on a Hele-Shaw cell filled with glass beads. In those experiments anexponential distribution seems to characterize the size of thelocal avalanches. Those results however are in contrast withthe expectations for a system approaching a critical pinning–depinning transition, and in particular with our observations:computing the local activity during forced-flow imbibitionexperiments, we observed that local avalanches, defined asspatial clusters of large local velocity, are power-lawdistributed both in sizes and durations, with exponentialcut-offs that diverge as the externally imposed mean frontvelocity decreases (Santucci et al., 2009).
In the present work, we go further on in the investigationof the global dynamics of imbibition fronts. This study is thefollow-up of the experimental work reported in (Planet et al.,2009), where the global velocity fluctuations were studiedonly in the capillary regime. Specifically, we study thepropagation of an air–liquid interface in forced-flow imbibi-tion experiments of a viscous fluid by a model disorderedmedium, using a high resolution fast camera and recentstatistical tools developed for crack-front propagation studies(Måløy et al., 2006). Our high resolution setup (0.098 mm/pixel in space, 5 ms/frame in time) allows us to observe thatthe global (i.e. spatially-averaged) velocity of the imbibitionfront displays an intermittent behavior signature of a burst-like dynamics. We characterize the statistical properties ofthe avalanches of global velocity and its fluctuations for morethan a decade of imposed flow rates (0.027 mm/sbvb0.648 mm/s), exploring regimes in which differentroughening mechanisms are operative. Capillary pressurefluctuations are dominant at the lowest injection velocities(capillary regime), while fluctuations of the permeability playalso a relevant role at higher velocities (mixed capillary andpermeability regime).
Compared to multi-phase flow in geological fractures orother real disordered materials, laboratory realizations ofimbibition flows in quasi two-dimensional models of disor-dered media, such as ours and those by Dougherty and Carle(1998) cited earlier, present a large number of simplifications.The question then arises as to why and to what extent is thisresearch relevant to real transport processes in the subsurface,and to the field of contaminant hydrology in general. Weknow that flow and transport in disordered media areintimately coupled processes (Berkowitz, 2002). In physicalstudies of the dynamics of imbibition flows in simplifiedmodel systems, an effort is made to preserve the essentialphysics governing the flow (viscous and capillary forces,capillary pressure and permeability fluctuations), while manyparticularities and complications are eliminated in order toreduce the number of relevant parameters in the experimentsand to gain visual access to the frontmotion. In this context, letus mention that Dougherty's observation of a characteristicsize of imbibition avalanches (Dougherty and Carle, 1998) incontrast to our observation of a very broad, scale-freedistribution of sizes can be traced down to the geometricalproperties of the underlying disordered medium. The bead-packed Hele-Shaw cell used in Dougherty and Carle (1998)

159R. Planet et al. / Journal of Contaminant Hydrology 120–121 (2011) 157–169
mimics a compact porous medium with a characteristic poresize. In contrast, ourmodel disorderedmediummimics a two-dimensional open fracture. Even though its structural disorderis much simpler than the morphology observed on naturalfractures (Brown and Scholz, 1985; Mandelbrot et al., 1984;Santucci et al., 2007), it leads to an intermittent dynamicsallowing front displacements of very different sizes (Planetet al., 2009; Santucci et al., 2009). Pursuing this kind of studiesin a systematic way, we expect to gain a basic understandingof the imbibition front dynamics that should be useful tobetter understand some features of transport in the subsur-face. Moreover, work on our experimental setup is actually inprogress in order to include and change the spatial correla-tions along the fracture plane that will increase the level ofcomplexity of our model disordered medium.
The paper is organized in the following way. Details of theexperimental setup and analysis methodology are given inSection 2. The forces competing in the kinetic rougheningprocess during imbibition, and the resulting crossover lengthscales, are discussed in Section 3. The experimental results arepresented in Section 4. Finally, a discussion of the results andthe conclusions of our work are given in Section 5.
2. Material and methods
2.1. Disordered medium
The model disordered medium used in the experimentsreported here consists in a horizontal Hele-Shaw cell of size190×500 mm2, made of two parallel glass plates separatedby a short distance much smaller than the lateral dimensionsof the plates. The gap spacing between the plates takes twodifferent values: b=0.46 mm and b−d=0.40 mm (see Fig. 1(top)). The difference in gap thickness is provided by arandom distribution on the bottom plate (Hele-Shaw plane)
Fig. 1. Top: Sketch of the lateral view of the model disordered medium,showing the two-level gap spacing. b is the largest gap spacing, and d is theheight of the copper obstacles. Bottom: Three-dimensional view of themodeldisordered medium with the coordinate system.
of square patches of lateral size ‘2d = 0:40 × 0:40mm2, thatcover 35% of the total area. Fig. 1 (bottom) shows a sketch ofthe disordered medium. A more detailed description can befound in (Soriano et al., 2002).
Our disordered medium mimics an open fracture thatfeatures a two-dimensional non-zero aperture field, distrib-uted along a plane (Adler and Thovert, 1999; Committe onFracture Characterization and Fluid Flow and NationalResearch Council, 1996). The randomness along the fractureplane makes it more complex than the simple parallel platemodel of an open fracture. However, the two-level structuresimplifies the geometrymeasured on natural fractures, whichcombines a continuous varying aperture with self-affinescaling properties that cover a wide range of length scales(Brown and Scholz, 1985; Mandelbrot et al., 1984; Santucciet al., 2007). Such a complex morphology has been shown toinfluence the transport properties of fractures, creatingheterogeneous flows and strong channelization along pref-erential paths of low hydraulic resistance (Auradou, 2009;Brown, 1987, 1995). Nevertheless, our simplified disorderedmedium provides fluctuations in capillary forces and aheterogeneous permeability which are enough to give riseto a complex intermittent dynamics with a broad range ofavalanche sizes (Planet et al., 2009; Santucci et al., 2009).Moreover, its simplicity facilitates theoretical analyses, andthus permits a direct comparison to theoretical and numericalstudies (Pauné and Casademunt, 2003; Pradas, 2009). Paunéand Casademunt (Pauné and Casademunt, 2003), in partic-ular, were able to derive an exact analytical description of thestochastic contributions to the linearized interfacial growthequation that arise from gap randomness along the fractureplane. Their results will be discussed in Section 3.
The velocity field of the fluid in a horizontal Hele-Shawcell, averaged over the vertical coordinate z, is a two-component local Darcy velocity →v x; yð Þ which obeys Darcy'slaw (Darcy, 1856) originally obtained for real porousmaterials (Guyon et al., 2001):
→v x; yð Þ = − κμ→∇P; with κ =
b2
12; ð1Þ
where μ is the dynamic viscosity of the fluid, κ thepermeability of the cell and P the fluid pressure. Theintroduction of a variable gap spacing in the Hele-Shaw cellmodifies the permeability of the cell, which in our case obeysthe empirical relation (Soriano et al., 2002):
κ =b2
121−0:55
db
� �2; ð2Þ
giving in the present setup κ≃0.015 mm2. Planet et al. (2007)have shown that the model disordered medium employed inthe present investigation behaves macroscopically as a realporous medium, in the sense that the spatially-averagedposition of the fronts in spontaneous imbibition follows veryaccurately Washburn's law (Washburn, 1921).
2.2. Experimental setup
In order to perform the imbibition experimentswe inject aviscous liquid into the model disordered medium from one

Fig. 3. Representation of the region of interest recorded in the present set oexperiments,within thetotal disorderedmedium.Thepositionof the fronth(x,t)is also represented.
160 R. Planet et al. / Journal of Contaminant Hydrology 120–121 (2011) 157–169
of its short sides (oil inlet) at a constant flow rate. The oilinjected displaces the resident air, that leaves the cell at theopposite side (air outlet). To achieve the constant-flow-rateboundary condition we use a syringe pump that makes theimbibition front advance on average at a constant velocity v inthe range 0.027–0.645 mm/s. The viscous liquid used in theexperiments is silicone oil (Rhodorsil 47 V) of kinematicviscosity ν=50 mm2/s, density ρ=998 kg/m3, and oil–airsurface tension σ=20.7 mN/m at room temperature. Thedisordered medium is placed horizontally to avoid gravityeffects. Fig. 2 represents the experimental setup.
The front ismonitored onlywithin a ROI (region of interest)of lateral size L=125.44 mm, centeredwith the cell (see Fig. 3)in order to avoid possible distortions of the imbibition frontsthat could arise from the contact with the side walls. We use aMotion Pro X3 plus video camera with a lateral resolution of1280 pixels in the x direction to track the interfacemotion. Thespatial resolution is thus r=0.098 mm/pixel, so that eachsquare patch of the disorder takes more than four pixels ineither x or y directions. The resolution of the camera in the ydirection is set to 276 pixels (27.05 mm).
Once the appropriate spatial resolution is chosen, theminimal temporal resolution is determined by the conditionthat the front advances locally by one pixel at most in onetime step, so that the waiting-time matrix (see below) doesnot contain any zeroes. For the range of v explored in thepresent experiments we have found that image acquisitionrates of 100 fps (frames per second) for the lower velocities(0.02–0.3 mm/s), corresponding typically to the capillaryregime, and 200 fps for larger velocities (0.3–0.7 mm/s),corresponding to the mixed capillary–permeability regime,meet this criterion.
Fig. 2. Sketch of the experimental setup. 1: High resolution fast camera. 2: Tripod. 3: Hele-Shaw cell. 4: Steel support. 5: Disorder plate. 6: Oil reservoir at the inlet7: Syringe pump. 8: Syringe. 9: Oil inlet. 10: Anti-vibration table. 11: Granite table. 12: Illumination support. 13: Indirect illumination. 14: White plates to reflecthe light over the disordered medium.
f
The experimental protocol is the following: first an initiallyflat front, close to the oil inlet, travels forward in the ydirection for about 150 mm before it enters the ROI. In this
.t

161R. Planet et al. / Journal of Contaminant Hydrology 120–121 (2011) 157–169
period the rms width of h(x, t) (Fig. 3) reaches saturation,ensuring that the front in the ROI is already in a statisticallystationary state (as checked on the recorded images). In thenext 50 or 100 s (depending on frame rate) we record 10,000images of the ROI with a resolution of 1280×276 pixels(x×y).
2.3. Analysis technique
Thanks to the large spatial and temporal resolution of ourmeasurements we can resolve the interface motion with highaccuracy at the level of single local avalanches. To thispurpose, first of all, we locate the position of the front h(x, t)on each image using a method of edge detection. In Fig. 4 weshow an example of an extracted front plotted over therecorded image. Then we measure the local velocity of thefront on each point of the ROI, v(x,y), using the waiting-timematrix algorithm recently developed by Måløy et al. (2006).This technique consists in measuring the time spent by thefront in each point of the ROI, wt(x,y), and take r/wt(x,y)(where r is the pixel size) as a measure of v(x,y). Theinstantaneous local velocities of the front are then obtained asv(x,h(x, t)). This criterium implicitly assumes that the velocityis constant during the time lapse in which the interfaceadvances through one pixel. Finally the global velocity of thefront in a measuring window of size ‘c≤L, V‘ tð Þ, is obtainedfrom the spatial average
V‘ tð Þ≡⟨v x; tð Þ⟩‘ = ⟨1‘∫x+‘x v x′; t
� �dx′⟩x: ð3Þ
In what follows we drop the subindex ‘ to make thenotation simpler.
3. Kinetic roughening in imbibition processes
Before going into our experimental observations, it isworthwhile to review recent theoretical results on the kinetic
Fig. 4. Bottom: typical recorded image of an imbibition front and the extracted interfasee the disorder patches.
roughening process undergone by the air/oil front inimbibition.
Even though the dynamics of imbibition fronts has beensubject of numerous studies, it is just recently that a satisfactorytheoretical description of the kinetic roughening transitionfrom a flat interface to a statistically stationary state withcritical fluctuations has been obtained (Alava et al., 2004). Inparticular, different theoretical approaches (Dubé et al., 1999;Ganesan and Brenner, 1998; Hernández-Machado et al., 2001)have led to the following equation for the growth in time of h̃q(the Fouriermodeof the interface height h(x, t) ofwavenumberq) in the linear approximation, i.e. for small deviations aroundthe mean interface position:
∂h̃q∂t = −σκ
μjq jq2h̃q−V tð Þ jq jh̃q + quenched noise: ð4Þ
q is the Fourier-conjugate of the variable x. This is a non-localequation (because of the |q| terms), and linear in h̃q. The firsttwo terms on the RHS, with a minus sign, act as dampingmechanisms of possible unstable modes. The first term on theRHS account for the stabilizing force of surface tension betweenthe invadingfluid and the resident one. The second term on theRHS represents the stabilizing force of the viscous pressuredrop in the liquid phase. In contrast to these dampingmechanisms, the third term on the RHS of Eq. (4) carries aplus sign. This term represents the destabilization of the frontdue to the forces resulting from the internal structure of thedisordered medium, so that it is represented by a quenchednoise term (time dependence only enters through the interfaceposition h(x, t)).
The form of the quenched noise term in Eq. (4), forimbibition by a model disordered medium consisting in aHele-Shaw cell with a variable gap thickness randomlydistributed in the Hele-Shaw plane, such as the oneimplemented in the present research, was derived by Paunéand Casademunt (2003). In Pauné and Casademunt (2003),
ce. Top: zoom of imbibition front images. In the zoomed figure it is possible to

Fig. 5. Evaluation of the crossover length scales ξc (●) and ξκ (□) for the set ofexperiments studied in the present work using Eqs. (8) and (9). The shadedarea is the crossover regime where ξκ is smaller than the system size butlarger than the observation window, and separates the pure capillary regimefrom amixed regime where capillarity and permeability may be both relevant.
162 R. Planet et al. / Journal of Contaminant Hydrology 120–121 (2011) 157–169
the variable gap thickness is assumed to vary smoothly inspace, |∇b|≪1, and takes the form
b2 x; yð Þ = b20 1 + ζ x; yð Þ½ �; ð5Þ
where ζ(x,y) is a random variable with ⟨ζ(x,y)⟩=0 and b0themean gap thickness. This variable gap spacing gives rise todifferent disorder terms in Eq. (4). First, a non-local andconserved noise term of the form:
σb012μ
jqj ζ̃ qð Þ; ð6Þ
where ζ̃ qð Þ is the Fourier transform of ζ(x,h). This noise termis a consequence of the capillary pressure variations due tothe fluctuating gap spacing, and for this reason it is calledcapillary disorder. There exists a second noise term that islocal and non-conserved:
V tð Þζ̃ qð Þ= 2: ð7Þ
This term results from the effect of the variable thickness ofthe disordered medium on the permeability and from fluidvolume conservation. This second noise term is calledpermeability disorder.
The interface Eq. (4) gives rise to two different character-istic lengths. First, the two stabilizing terms in Eq. (4) actat different length scales since the surface tension depends on|q|q2 and the viscous pressure drop on |q|. This tells us that atshort length scales the main mechanism responsible fordamping of the front fluctuations is surface tension, while forlonger length scales the main damping mechanism is theviscous pressure drop. If we equate the two terms in Eq. (4)we obtain the crossover length between these two regimes:
ξc =ffiffiffiffiffiffiκCa
r; ð8Þ
where κ is the (average) permeability of the porous mediumand Ca=μv/σ is the capillary number. This terms divergeswith the mean front velocity as ξc∼v−1/2. This dependencyin v can play an important role. It has been observednumerically (Laurila et al., 2005) and experimentally (Planetet al., 2007) that, depending on experimental conditions,
Table 1Mean front velocities, v, corresponding capillary numbers Ca, and crossovelengths ξc, ξκ. L is the lateral size of the measuring window (L=125.44 mm)See text for details.
v (mm/s) Ca ξc (mm) ξκ (mm) ξc/L (%) ξκ/L (%)
0.027 0.7×10⁻⁴ 15.2 1126 12.1 898 Capillaryregime0.057 1.4×10⁻⁴ 10.4 523 8.3 417
0.094 2.3×10⁻⁴ 8.1 318 6.5 2540.134 3.2×10⁻⁴ 6.8 229 5.4 1820.185 4.5×10⁻⁴ 5.8 163 4.6 1300.225 5.4×10⁻⁴ 5.3 135 4.2 108
0.267 6.4×10⁻⁴ 4.8 114 3.8 91 Mixedcapillary andpermeabilityregime
0.345 8.3×10⁻⁴ 4.2 88 3.4 700.442 1.06×10⁻³ 3.7 69 3.0 550.542 1.31×10⁻³ 3.4 56 2.7 440.645 1.55×10⁻³ 3.1 47 2.5 38
r.
length scales larger than ξc are uncorrelated when thecapillary disorder is the only relevant destabilizing mecha-nism. In these cases the lateral correlation length ‘c is limitedby the crossover length scale ξc.
There exists a second crossover length in imbibition thatgives an estimation of the length scale above which thefluctuations in the medium permeability become the domi-nant mechanism for the destabilization of the imbibitionfronts, together with the capillary pressure fluctuations. Thislength scale can be estimated by equating the two disorderterms (Eqs. (6) and (7)), and has the form:
ξκ =b06Ca
: ð9Þ
In our case b0=0.65b+0.35(b−d)=0.439 mm. The impor-tance of permeability disorder has been reported by Pauné andCasademunt (2003) and observed experimentally by Planet etal. (2007) in spontaneous imbibition experiments.
The range of v explored in the experiments correspondsto capillary numbers in the range 0.7×10⁻⁴ – 1.55×10⁻³.In Table 1 we show the values of ξc and ξκ in the range ofvelocities explored, and their comparison with the totallateral size of the measuring window L. It is clear that therelative importance of the forces acting on the interface ismodified by the changes in the injection velocity.
It is worth noting that when v≥0.267 mm/s, ξκ becomessmaller than the lateral system size L. The role of thepermeability disorder becomes then more important thanin the capillary regime v≤0.225 mm/s. However, ξκ is stilllarger than ξc, suggesting that the kinetic roughening processfalls in a mixed regime where permeability disorder begins tobe relevant but still not strong enough to correlate theinterface motion. The behavior of the two crossover lengthscales is summarized in Fig. 5.
It would be desirable to extend the velocity range to evenlarger velocities, in order to explore the regime ξκbξc wherethe randomness in the permeability is expected to dominateover the randomness in capillarity in roughening theinterface. Unfortunately this is out of reach of our experi-mental setup. Higher injection rates lead to zeros in the

163R. Planet et al. / Journal of Contaminant Hydrology 120–121 (2011) 157–169
waiting-time matrix at the current frame rate, and higherframe rates would require a much stronger illumination. Inaddition, higher injection rates produce nearly flat fronts —
taking into account that front roughness in the range of vstudied is already very mild, as shown in Figs. 4 and 6.
4. Experimental results
In Planet et al. (2009) we studied the global (spatially-averaged) dynamics of forced-flow imbibition fronts in thecapillary regime. Here we consider larger injection rates, andstudy the increasing influence of the fluctuations of the cellpermeability on the front dynamics. We focus first on thestatistical properties of the morphology of the imbibitionfront, and second on the statistical properties of its averagevelocity. For this purpose we present results for the experi-ments carried out at the 11 imposed velocities v recorded inTable 1. Examples of the imbibition fronts measured at twodifferent flow rates, that reveal their intermittent dynamics,are shown in Fig. 6.
4.1. Roughness of the imbibition fronts
First of all we characterize themorphological properties ofthe imbibition fronts. In Fig. 6 we show the evolution ofimbibition fronts for two different experiments. The usualtool to describe the scaling properties of the interfacefluctuations is the rms width Wh, defined as Wh ‘; tð Þ =⟨⟨ h x; tð Þ−⟨h⟩‘½ �2⟩‘⟩1=2. This quantity scales with the measuringwindow ‘ as Wh∼‘αloc for ‘b‘c and becomes constant when‘ N ‘c, where ‘c is the lateral correlation length of the front(Barabási and Stanley, 1995).
Since the present experiments are performed in thestatistically stationary regime, where ‘c has reached aconstant value in time and therefore Wh does not grow anylonger in time, in computing Wh as a function of ‘ we willimprove the statistics by averaging the results obtained for allthe fronts recorded in one experiment.
When investigating the morphology of the imbibitionfronts we have to take into account a number of factors that
Fig. 6. Imbibition fronts propagating at average velocities v=0.134 mm/s (top) av=0.134 mm/s and 0.25 s for v=0.442 mm/s. Solid and dotted lines alternate for
can mask the scaling of the fluctuations (Schmittbuhl andVilotte, 1995). In the present set of experiments the interfacesshow a slight bend in the plane of the cell, induced by thepreferential advancement of the front at the lateral bound-aries where the two ends of the interface meet the gapspacers. The rms width may be dominated by this globalbending of the interface. In order to eliminate this artifact wehave processed the interfaces in the following way: we havefitted to each interface a second-order polynomial represent-ing the interface background, and the difference between themeasured interface and the calculated background has beenused for data analysis. Because of this correction the results atlarge length scales are not reliable: the plateau observed atlarge ‘ in Fig. 7 can be due to having removed the boundaryeffects or to having removed the fluctuations of the interfaceat large scales.
The curves of the interfacial width Wh vs. ‘ are shown inFig. 7. In a wide range of ‘ they display the expected power-law behavior characterized by an exponent αloc. In the bottompanel of Fig. 7 we have represented the extracted localroughness exponents for the different imposed velocities. Forthe range of velocities that fall in the purely capillary regime avalue αloc≃0.8 is measured, while in the mixed capillary–permeability regime (on the right side of the shaded area) avalue αloc≃0.5 is obtained. It is interesting to point out thatthese results are in good quantitative agreement within errorbars with the results obtained for spontaneous imbibition byPlanet et al. (2007).
4.2. Global intermittent dynamics
The intermittent dynamics of the fronts is visible in Fig. 6,where we observe that fronts propagate by localized ava-lanches: the regions where a front gets pinned for longer timesappear darker (high density of lines), and are separated bylighter regions which the interface sweeps in fast localizedbursts (low density of lines).
In order to characterize the complex dynamics observed,we analyze in detail the spatially-averaged (global) velocity
nd v=0.442 mm/s (bottom), represented at equal time intervals of 2 s fora better visualization of the advancing interface.

Fig. 7. Top: Statistical width Wh of the interface computed over windows osize ‘ for all the experiments investigated. Straight lines are guides to the eyerepresenting the extracted scaling for the largest and smallest v. Discontin-uous lines bound the data range used to fit a power law and extract αloc
Bottom: Local roughness exponent as a function of the imposed v, extractedfrom the top figure. The shaded area is the crossover regime defined in Fig. 5
Fig. 8. Global velocity signal, V‘ , for an experiment performed with aninjection velocity v=0.442 mm/s. We plot the global velocity that resultsfrom averaging the local velocity over windows of lateral size ‘ = L (top) and‘ = L= 40 (bottom).
164 R. Planet et al. / Journal of Contaminant Hydrology 120–121 (2011) 157–169
f
.
.
Fig. 9. Global velocity signals measured over a window of size ‘ = L= 40(where L=125.44 mm is the total lateral size of the ROI) for forced-flowdisplacements with an injection velocity v=0.134 mm/s. The signal of largeramplitude corresponds to a displacement in a cell of fluctuating gapthickness (disordered cell). The one with lower amplitude, in contrast,corresponds to a displacement in a smooth cell.
of the front for the various experiments performed, inparticular in the mixed capillary–permeability regime.
In Fig. 8we show the global velocity signal for an experimentperformed with an injection velocity v=0.442 mm/s, when thespatial average of the local velocity is carried out over windowsof lateral size ‘ = L (top) and ‘ = L = 40 (bottom). While theinjection rate is constant, the global velocity V‘ is a jerky signalwith a complex intermittent behavior characterized by verylarge positive fluctuations.
First of all, we have checked that those fluctuations are nota trivial consequence of the injection system. Indeed, weverified that the syringe pump does not introduce significantfluctuations in the global velocity by performing experimentswith a smooth cell without disorder (constant gap thickness).In Fig. 9 we compare the global velocities measured inidentical conditions in a cell with and without disorder. Thelarge fluctuations of the global velocity must be undoubtedlyattributed to the gap thickness fluctuations of the cell withdisorder.
Moreover, we can observe in Fig. 8 that the smaller thesize ‘ of the window over which the global velocity isintegrated, the larger the fluctuations it displays due to thefinite system size.
4.3. Fluctuations of V(t)
Let us now examine the temporal fluctuations of theglobal velocity V(t).
4.3.1. Spatial correlation along the frontAs discussed in Section 4.1, boundary effects distort the
fronts at large length scales (particularly at the lowest v).Because of this, rather than extracting the correlation length ‘cfrom the interfacial widthWh(‘) it is preferable to use the rmswidth of the local velocity v(x,h(x, t)), that remains nearlyunaffected by the boundaries. In the top panel of Fig. 10 werepresent the rms width Wv of the local velocities measuredover windows of size ‘ at one given time, averaged over time,for all the injection velocities investigated. We observe thatWv increases with ‘ (correlated region) up to a size ‘c, andremains nearly constant for larger ‘ (uncorrelated region).

ig. 10. Top: Statistical width Wv of the local velocity signal v(x,h(x, t))mputed over windows of size ‘ at one given time and further averagedver time, for all the experiments. Middle: Slope of log Wv vs. log ‘. Theorizontal dashed line represents the threshold value that defines the onsetf saturation of Wv. Bottom: Correlation length ‘c extracted from the localelocity, as explained in the text, vs. injection rate v for all the valuesvestigated. The dashed line is a guide to the eye showing that ‘c∼1=
ffiffiffiv
p.
he shaded area represents the crossover between the capillary and mixedpillary–permeability regimes.
165R. Planet et al. / Journal of Contaminant Hydrology 120–121 (2011) 157–169
In order to extract ‘c from these curves we assume thatthe uncorrelated region begins around the length ‘ for whichthe slope of log Wv vs. log ‘ takes the threshold value s=0.1(see the middle panel of Fig. 10). We have carried out thisanalysis for all the injection rates investigated (v=0.027 to0.645 mm/s), and plotted the extracted correlation length asa function of v in the bottom panel of Fig. 10. We observe thatthe correlation length consistently decreases with thevelocity as ‘c∼1 =
ffiffiffiv
p. We have checked that this scaling is
consistent for different threshold values s.Interestingly, in contrast with the result for αloc, the
correlation length ‘c does not seem to be affected by theincreasing influence of permeability disorder at large injectionrates. It goes consistently as 1=
ffiffiffiv
pin the whole range of
imposed velocities studied, mimicking the behavior of thecharacteristic length scale ξc that separates surface tensiondamping of the interfacial fluctuations from viscous pressuredamping. Another interesting feature to point out is that, asshown in themiddle panel of Fig. 10, the slopeof logWv vs. log ‘changes with v, showing again two different regimes and acrossover in between. This last observation indicates that thevelocity field is sensitive to the presence of permeabilitydisorder even though the correlation length does not seem tobe affected by it.
4.3.2. Non-Gaussian fluctuations of the global velocity VSince we have shown that the local velocities of the
imbibition fronts are correlated over a macroscopic lengthscale ‘c, we expect to observe non trivial (i.e. non-Gaussian)fluctuations of the global velocity signal (Bertin, 2005).Therefore, we investigate the statistical properties of theglobal velocity fluctuations by means of the normalizedvariable Y≡(V− ⟨V⟩)/σ. In Fig. 11 we show the probabilitydensity functions of Y for the experiments at v=0.645 mm/sand for V computed over windows of size ‘c = L and‘c = L = 40 respectively. The first case, that corresponds to‘ = L, displays an asymmetric distribution of the fluctuationsof V(t) that nevertheless is still quite close to a Gaussiandistribution. This is related to the fact that the window ofobservation is clearly larger than the correlation length ‘c≪L.In the second case, when V is computed over a smallerwindow ‘ = L = 40, the asymmetry is much more importantand the distribution is clearly non-Gaussian. Notice that inthis case ‘c N L = 40. The observed non-Gaussian behavior isrelated to the fact that the central limit theorem (CLT) doesnot apply for averages of correlated observables.
We want to compare those distributions to a generalizedGumbel distribution (GG) (Bertin, 2005; Gumbel, 1958):
Pa Yð Þ = aabaΓ að Þ exp −afba Y + sað Þ + exp −ba Y + sað Þ½ �gÞ;ð ð10Þ
where
ba =ffiffiffiffiffiffiffiffiffiffiffiffiffiffiffiffiffiffiffiffiffiffiffiffiffiffiffiffiffiffid2lnΓ að Þ= da2
q= σY ; ð11Þ
sa = ⟨Y⟩ + lna− dlnΓ að Þ= dað Þ�= ba;½ ð12Þ
and Γ(a) is the Gamma function. ba and sa are fixed by the factthat the mean is ⟨Y⟩=0 and the variance is σ Y
2=1. This
FcoohovinTca
means that a is the only free parameter of Pa(Y). The value of ais given by the skewness of the PDF as (Portelli et al., 2001;Bertin, 2005)
γ≡⟨Y3⟩≃1=
ffiffiffia
p: ð13Þ

Fig. 11. Probability density functions of (V− ⟨V ⟩)/σ for experiments at v=0.645 mm/s and two different observation windows ‘ = L (left panel) and ‘ = L= 40(right panel). Discontinuous lines are Gaussian distributions, and solid lines are generalized Gumbel distributions of the same skewness γ as the experimentaldistributions (solid triangles, obtained by averaging over four different experiments).
166 R. Planet et al. / Journal of Contaminant Hydrology 120–121 (2011) 157–169
Then, using the skewness extracted from the experimen-tal results we can estimate the a parameter and obtain thegeneralized Gumbel distribution of same skewness. Theresulting GG distributions are shown in Fig. 11 as continuouslines. We find very good agreement between these GGdistributions and the distributions obtained from the exper-imental data.
As observed in Planet et al. (2009) the dependence on vobserved for the skewness γ of the fluctuations of V(t) in thedifferent regimes explored can be well approximated by afunction γ∼v−1/2 as shown in Fig. 12 for two differentwindow sizes.
4.4. Avalanche dynamics
The sudden and large positive fluctuations of the globalvelocity can be identified as global avalanches of theimbibition fronts. We define avalanches as occurrences ofthe global velocity signal V(t) over an arbitrary threshold Vc,
Fig. 12. Skewness of the probability density function of the fluctuations oV(t) as a function of v (injection velocity) for two different window sizes‘ = L (filled symbols), and ‘ = L= 40 (open symbols). The dashed linesare guides to the eye of the form 1/γ=av1/2+b. The size of the error barsis given by the standard deviation of the skewness values measured indifferent runs of the same experiment.
Fig. 13. Definition of size S (dark region) and duration T of an avalanche foran experiment at v=0.442 mm/s. The horizontal baseline represents thethreshold level. In this case Vc= ⟨V⟩.
f:
as shown in Fig.13, and call S and T the size and duration of anavalanche respectively. The size of an avalanche S corre-sponds to the extra displacement of the fluid (in the maindirection of propagation, y), with respect to the averagedisplacement given by an arbitrary threshold Vc, during theavalanche. This definition depends on the arbitrary threshold:
Vc = ⟨V⟩ + cσV ; ð14Þ
where ⟨V⟩ and σ V2 are respectively the temporal average and
the variance of V‘ tð Þ over the whole duration of oneexperiment, and c is an arbitrary clip level.
The minimum size of the disorder patches of the modeldisordered medium introduces a natural lower cut-off for thesize of the global avalanches Sd, given by
Sd =‘dLr = 3 × 10⁻⁴ mm; ð15Þ
where ‘d is the minimum lateral size of the disorder obstaclesand r is the spatial resolution. Therefore, a lower cut-off must be

167R. Planet et al. / Journal of Contaminant Hydrology 120–121 (2011) 157–169
considered also for the duration of the avalanches. Indeed, inorder to avoid a windowing effect (Ràfols and Vives, 1995) dueto the cut-off size Sd and the consequent bias in the distributionof durations at short time scales we consider only avalancheslasting longer than the longest avalanches of size Sd.
Let us pursue the statistical analysis of the globalavalanches by investigating first the marginal distributions,PS(S) and PT(T), of the sizes and durations of the globalavalanches. We present those distributions for experimentsperformed in the mixed capillary–permeability regime(injection velocities 0.267-0.645 mm/s). Because of the longrange correlations, sizes and durations of avalanches areexpected to be power-law distributed, with a cut-offdependent on injection velocity and on the arbitrarythreshold Vc:
Px xð Þ = axx−mxe−x=bx : ð16Þ
In order to extract reliable values of the exponent mx from theexperimentaldata, the rightprocedure(asdiscussed inPruessner
Fig. 14. Top: Data collapse of the burst size distributions corresponding to athreshold Vc= ⟨V ⟩ (clip level c=0) and various injection velocities in therange 0.267–0.645 mm/s. The dashed line is a power-law fit with anexponential cut-off. The best collapse is achieved for a power-law exponentα=0.97±0.05, as shown in the inset. Bottom: Data collapse of thecorresponding burst duration distributions. Again the dashed line is apower-law fit with an exponential cut-off. In this case the best collapse isachieved for an exponent τ=1.16±0.10, as shown in the inset.
(2010) and Planet et al. (2010)) is to look for the exponent mx*
that provides the best collapse of Y=Px(x)⟨x⟩mx/(2−mx) as afunction of X=x/⟨x⟩1/(2−mx). To quantify the quality of thecollapse, we have fitted Yfit=axx
−mxexp(−x/bx) to the set of ourexperimental data, varying systematically the exponent mx andleaving ax and bx as free parameters. Next, we have computedthe error �=∑ i[log(Yi)− log(Yfit)]2 as a function of mx. Theresults are shown in Fig. 14. The best collapses are obtainedfor α=0.97±0.05 (avalanche sizes) and for τ=1.16±0.10(avalanche durations).
The exponential cut-off of the avalanche distributions iscontrolled by the lateral correlation length. Since theexponent α is very close to 1, the exponential cut-off of thesize distributions shown in Fig. 14 is proportional to themeansize ⟨S⟩ of the avalanches. Fig. 15 shows the dependence of⟨S ⟩ on injection velocity in the whole range of injectionvelocities explored in the present experiments, and twodifferent observationwindows. Similar to the skewness of theglobal velocity fluctuations (Fig. 12), the average size ⟨S ⟩ isshown to scale indeed like the correlation length ‘c∼1 =
ffiffiffiv
p,
and not to be affected significantly by the presence ofpermeability disorder in the mixed capillary–permeabilityregime.
We consider next the joint probability P(S,T) of havingavalanches of the global velocity of size S and duration T. Thecorresponding histogram is properly analyzed using therescaled variables u≡S/⟨S⟩1/(2−α) and w≡T/⟨T⟩1/(2− τ) withthe values of the exponents previously found (Planet et al.,2010). Fig. 16 shows this joint histogram for the 5 experi-ments in the mixed capillary–permeability regime. The figureshows that u∝wx, with x≃1.3.
We would like to emphasize that the scaling behaviorof the global velocity observed in the mixed capillary–permeability regime, and in particular the values of thescaling exponents α, τ, and x, are in excellent agreement withour previous results obtained in the capillary regime andreported in Planet et al. (2009, 2010). Moreover, we mustnotice that the scaling behavior S∼Tx, which is as well in goodagreement with the numerical results of Rost et al. (2007),
Fig. 15. Mean size of avalanches ⟨S ⟩ vs. injection velocity v, in the wholerange of injection velocities explored in the present experiments and twodifferent observation windows. The dashed line is a guide to the eye of thefunctional form 1 =
ffiffiffiv
p.
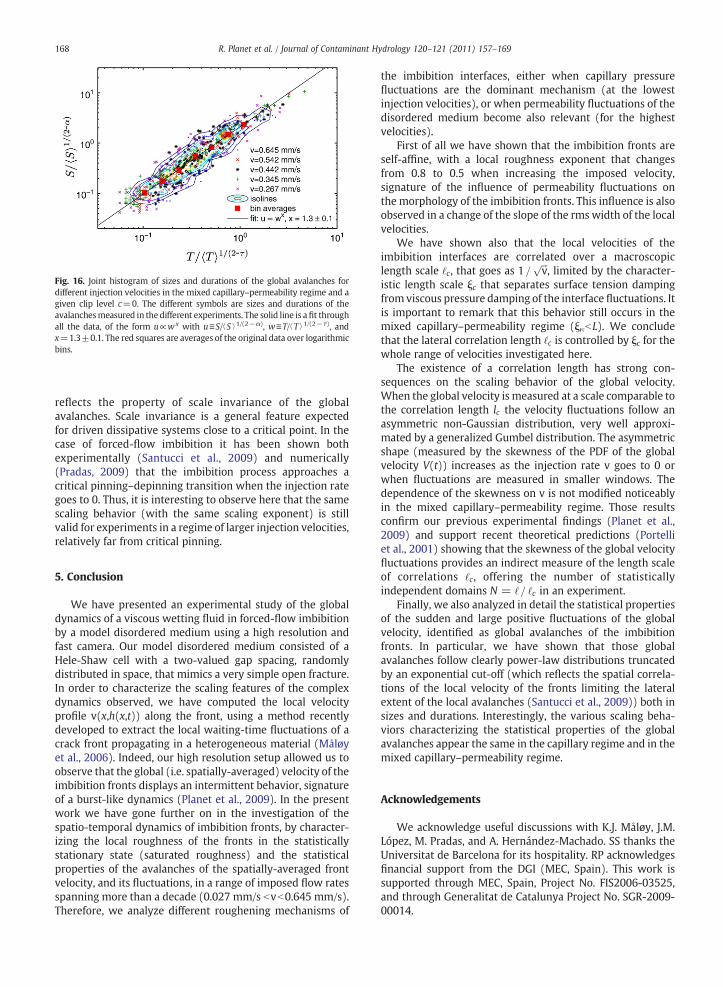
Fig. 16. Joint histogram of sizes and durations of the global avalanches fordifferent injection velocities in the mixed capillary–permeability regime and agiven clip level c=0. The different symbols are sizes and durations of theavalanchesmeasured in the different experiments. The solid line is afit throughall the data, of the form u∝wx with u≡S/⟨S⟩1/(2−α), w≡T/⟨T⟩1/(2−τ), andx=1.3±0.1. The red squares are averages of the original data over logarithmicbins.
168 R. Planet et al. / Journal of Contaminant Hydrology 120–121 (2011) 157–169
reflects the property of scale invariance of the globalavalanches. Scale invariance is a general feature expectedfor driven dissipative systems close to a critical point. In thecase of forced-flow imbibition it has been shown bothexperimentally (Santucci et al., 2009) and numerically(Pradas, 2009) that the imbibition process approaches acritical pinning–depinning transition when the injection rategoes to 0. Thus, it is interesting to observe here that the samescaling behavior (with the same scaling exponent) is stillvalid for experiments in a regime of larger injection velocities,relatively far from critical pinning.
5. Conclusion
We have presented an experimental study of the globaldynamics of a viscous wetting fluid in forced-flow imbibitionby a model disordered medium using a high resolution andfast camera. Our model disordered medium consisted of aHele-Shaw cell with a two-valued gap spacing, randomlydistributed in space, that mimics a very simple open fracture.In order to characterize the scaling features of the complexdynamics observed, we have computed the local velocityprofile v(x,h(x,t)) along the front, using a method recentlydeveloped to extract the local waiting-time fluctuations of acrack front propagating in a heterogeneous material (Måløyet al., 2006). Indeed, our high resolution setup allowed us toobserve that the global (i.e. spatially-averaged) velocity of theimbibition fronts displays an intermittent behavior, signatureof a burst-like dynamics (Planet et al., 2009). In the presentwork we have gone further on in the investigation of thespatio-temporal dynamics of imbibition fronts, by character-izing the local roughness of the fronts in the statisticallystationary state (saturated roughness) and the statisticalproperties of the avalanches of the spatially-averaged frontvelocity, and its fluctuations, in a range of imposed flow ratesspanning more than a decade (0.027 mm/s bvb0.645 mm/s).Therefore, we analyze different roughening mechanisms of
the imbibition interfaces, either when capillary pressurefluctuations are the dominant mechanism (at the lowestinjection velocities), or when permeability fluctuations of thedisordered medium become also relevant (for the highestvelocities).
First of all we have shown that the imbibition fronts areself-affine, with a local roughness exponent that changesfrom 0.8 to 0.5 when increasing the imposed velocity,signature of the influence of permeability fluctuations onthe morphology of the imbibition fronts. This influence is alsoobserved in a change of the slope of the rms width of the localvelocities.
We have shown also that the local velocities of theimbibition interfaces are correlated over a macroscopiclength scale ‘c, that goes as 1 =
ffiffiffiv
p, limited by the character-
istic length scale ξc that separates surface tension dampingfrom viscous pressure damping of the interface fluctuations. Itis important to remark that this behavior still occurs in themixed capillary–permeability regime (ξκbL). We concludethat the lateral correlation length ‘c is controlled by ξc for thewhole range of velocities investigated here.
The existence of a correlation length has strong con-sequences on the scaling behavior of the global velocity.When the global velocity is measured at a scale comparable tothe correlation length lc the velocity fluctuations follow anasymmetric non-Gaussian distribution, very well approxi-mated by a generalized Gumbel distribution. The asymmetricshape (measured by the skewness of the PDF of the globalvelocity V(t)) increases as the injection rate v goes to 0 orwhen fluctuations are measured in smaller windows. Thedependence of the skewness on v is not modified noticeablyin the mixed capillary–permeability regime. Those resultsconfirm our previous experimental findings (Planet et al.,2009) and support recent theoretical predictions (Portelliet al., 2001) showing that the skewness of the global velocityfluctuations provides an indirect measure of the length scaleof correlations ‘c, offering the number of statisticallyindependent domains N = ‘ = ‘c in an experiment.
Finally, we also analyzed in detail the statistical propertiesof the sudden and large positive fluctuations of the globalvelocity, identified as global avalanches of the imbibitionfronts. In particular, we have shown that those globalavalanches follow clearly power-law distributions truncatedby an exponential cut-off (which reflects the spatial correla-tions of the local velocity of the fronts limiting the lateralextent of the local avalanches (Santucci et al., 2009)) both insizes and durations. Interestingly, the various scaling beha-viors characterizing the statistical properties of the globalavalanches appear the same in the capillary regime and in themixed capillary–permeability regime.
Acknowledgements
We acknowledge useful discussions with K.J. Måløy, J.M.López, M. Pradas, and A. Hernández-Machado. SS thanks theUniversitat de Barcelona for its hospitality. RP acknowledgesfinancial support from the DGI (MEC, Spain). This work issupported through MEC, Spain, Project No. FIS2006-03525,and through Generalitat de Catalunya Project No. SGR-2009-00014.

169R. Planet et al. / Journal of Contaminant Hydrology 120–121 (2011) 157–169
References
Adler, P., Brenner, H., 1988. Multiphase flow in porous media. Annu. Rev.Fluid Mech 20, 35–59.
Adler, P., Thovert, J., 1999. Fractures and Fracture Networks. Springer, Dordrecht.Ahmed, M.M.H.M., Gethin, D.T., Claypole, T.C., Roylance, B.J., 1997. A model for
ink impression into a porous substrate. J. Phys. D Appl. Phys. 30 (16), 2276.Alava, M., Dubé, M., Rost, M., 2004. Imbibition in disordered media. Adv.
Phys. 53 (2), 83–175.Auradou, H., 2009. Influence of wall roughness on the geometrical,
mechanical and transport properties of single fractures. J. Phys. D Appl.Phys. 42 (21), 214015.
Barabási, A.-L., Stanley, H., 1995. Fractal Concepts in Surface Growth.Cambridge University Press, Cambridge.
Bear, J., 1972. Dynamics of Fluids in Porous Media. Elsevier, New York.Berkowitz, B., 2002. Characterizing flow and transport in fractured geological
media: a review. Adv. Water Resour. 25, 861–884.Bertin, E., 2005. Global fluctuations and Gumbel statistics. Phys. Rev. Lett. 95
(17), 170601.Blunt, M.J., Jackson, M.D., Piri, M., Valvatne, P.H., 2002. Detailed physics,
predictive capabilities and macroscopic consequences for pore-networkmodels of multiphase flow. Adv. Water Resour. 25 (8–12), 1069–1089.
Bonamy, D., Santucci, S., Ponson, L., 2008. Crackling dynamics in materialfailure as the signature of a self-organized dynamic phase transition.Phys. Rev. Lett. 101 (4), 045501.
Bramwell, S.T., Holdsworth, P.C.W., Pinton, J.-F., 1998. Universality of rarefluctuations in turbulence and critical phenomena. Nature 396 (6711),552–554.
Bramwell, S.T., Christensen, K., Fortin, J.-Y., Holdsworth, P.C.W., Jensen, H.J.,Lise, S., López, J.M., Nicodemi, M., Pinton, J.-F., Sellitto, M., 2000. Universalfluctuations in correlated systems. Phys. Rev. Lett. 84 (17), 3744–3747.
Brown, S.R., 1987. Fluid flow through rock joints: the effect of surfaceroughness. J. Geophys. Res. 92, 1337–1347.
Brown, S.R., 1995. Simple mathematical model of a rough fracture. J.Geophys. Res. 100, 5941–5952.
Brown, S.R., Scholz, C.H., 1985. Broad bandwidth study of the topography ofnatural rock surfaces. J. Geophys. Res. 90, 12575–12582.
Committee on Fracture Characterization and Fluid Flow, NationalResearch Council, 1996. Rock Fractures and Fluid Flows: Contempo-rary Understanding and Applications. National Academies Press,Washington DC.
Darcy, H., 1856. Les fontaines publiques de la ville de Dijon. Libraire des CorpsImperiaux des Ponts et Chaussees et des Mines, Paris.
Dougherty, A., Carle, N., 1998. Distribution of avalanches in interfacial motionin a porous medium. Phys. Rev. E 58 (3), 2889–2893.
Dubé, M., Rost, M., Elder, K.R., Alava, M., Majaniemi, S., Ala-Nissila, T., 1999.Liquid conservation and nonlocal interface dynamics in imbibition. Phys.Rev. Lett. 83 (8), 1628–1631.
Durin, G., Zapperi, S., 2006. The Barkhausen effect. In: Bertotti, G., Mayergoyz,I. (Eds.), The Science of Hysteresis, Vol. II. Elsevier Academic Press,Oxford, pp. 181–267.
Ganesan, V., Brenner, H., 1998. Dynamics of two-phase fluid interfaces inrandom porous media. Phys. Rev. Lett. 81 (3), 578–581.
Gumbel, E.J., 1958. Statistics of Extremes. Columbia University Press, New York.Guyon, E., Hulin, J.P., Petit, L., Mitescu, C.D., 2001. Physical Hydrodynamics.
Oxford University Press, Oxford.Halpin-Healy, T., Zhang, Y.-C., 1995. Kinetic roughening phenomena,
stochastic growth, directed polymers and all that. Aspects of multidis-ciplinary statistical mechanics. Phys. Rep. 254, 215–414.
Hernández-Machado, A., Soriano, J., Lacasta, A.M., Rodríguez, M.A., Ramírez-Piscina, L., Ortín, J., 2001. Interface roughening in Hele-Shaw flows withquenched disorder: experimental and theoretical results. Europhys. Lett.55 (2), 194.
Joubaud, S., Petrosyan, A., Ciliberto, S., Garnier, N.B., 2008. Experimentalevidence of non-Gaussian fluctuations near a critical point. Phys. Rev.Lett. 100 (18), 180601.
Laurila, T., Tong, C., Huopaniemi, I., Majaniemi, S., Ala-Nissila, T., 2005.Dynamics and kinetic roughening of interfaces in two-dimensionalforced wetting. Eur. Phys. J. B 46 (4), 553–561.
Måløy, K.J., Santucci, S., Schmittbuhl, J., Toussaint, R., 2006. Local waiting timefluctuations along a randomly pinned crack front. Phys. Rev. Lett. 96 (4),045501.
Mandelbrot, B.B., Passoja, D.E., Paullay, A.J., 1984. Fractal character of fracturesurfaces of metals. Nature 308, 721.
Pauné, E., Casademunt, J., 2003. Kinetic roughening in two-phase fluid flowthrough a random Hele-Shaw cell. Phys. Rev. Lett. 90 (14), 144504.
Planet, R., Pradas, M., Hernández-Machado, A., Ortín, J., 2007. Pressure-dependent scaling scenarios in experiments of spontaneous imbibition.Phys. Rev. E 76 (5), 056312.
Planet, R., Santucci, S., Ortín, J., 2009. Avalanches and non-Gaussianfluctuations of the global velocity of imbibition fronts. Phys. Rev. Lett.102 (9), 094502.
Planet, R., Santucci, S., Ortín, J., 2010. Planet, Santucci, and Ortín Reply. Phys.Rev. Lett. 105, 029402.
Portelli, B., Holdsworth, P.C.W., Sellitto, M., Bramwell, S.T., 2001. Universalmagnetic fluctuationswith a field-induced length scale. Phys. Rev. E 64 (3),036111.
Pradas, M., 2009. Interfaces in disordered media. Scaling growth, avalanchedynamics, and microfluidic fronts. Ph.D. thesis, Facultat de Física(Universitat de Barcelona).
Pruessner, G., 2010. Comment on “avalanches and non-Gaussian fluctua-tions of the global velocity of imbibition fronts”. Phys. Rev. Lett. 105,029401.
Ràfols, I., Vives, E., 1995. Statistics of avalanches in martensitic transforma-tions. ii. modeling. Phys. Rev. B 52 (17), 12651–12656.
Rolley, E., Guthmann, C., Gombrowicz, R., Repain, V., 1998. Roughness ofthe contact line on a disordered substrate. Phys. Rev. Lett. 80 (13),2865–2868.
Rost, M., Laurson, L., Dubé, M., Alava, M., 2007. Fluctuations in fluid invasioninto disordered media. Phys. Rev. Lett. 98 (5), 054502.
Sahimi, M., 1993. Flow phenomena in rocks: from continuum models tofractals, percolation, cellular automata and simulated annealing. Rev.Mod. Phys. 65, 1393–1534.
Sahimi, M., 1995. Flow and transport in porous media and fractured rock:from classical methods to modern approaches. Wiley-VCH.
Santucci, S., Måløy, K.J., Delaplace, A., Mathiesen, J., Hansen, A., Haavig Bakke,J.Ø., Schmittbuhl, J., Vanel, L., Ray, P., 2007. Statistics of fracture surfaces.Phys. Rev. E 75 (1), 016104.
Santucci S., Planet R., Ortín J., 2009. Avalanches of imbibition fronts: towardscritical pinning, preprint.
Schmittbuhl, J., Vilotte, J., 1995. Reliability of self-affine measurements. Phys.Rev. E 51, 131.
Sethna, J.P., Dahmen, K.A., Myers, C.R., 2001. Crackling noise. Nature 410(6825), 242–250.
Soriano, J., Ortín, J., Hernández-Machado, A., 2002. Experiments of interfacialroughening in Hele-Shaw flowswith weak quenched disorder. Phys. Rev.E 66 (3), 031603.
Sornette, A., Sornette, D., 1989. Self-organized criticality and earthquakes.Europhys. Lett. 9 (3), 197.
Tóth-Katona, T., Gleeson, J.T., 2003. Distribution of injected power fluctua-tions in electroconvection. Phys. Rev. Lett. 91 (26), 264501.
Washburn, E.W., 1921. The dynamics of capillary flow. Phys. Rev. 17 (3),273–283.
Zhou, D., Jia, L., Kamath, J., Kovscek, A.R., 2002. Scaling of counter-currentimbibition processes in low-permeability porous media. J. Petrol. Sci.Eng. 33 (1–3), 61–74.
Related Documents