Europe: Vers une transition socio-écologique ? Académie royale des Sciences, des Lettres et des Beaux-Arts Bruxelles, 19 novembre 2013 Domenico ROSSETTI Commission européenne, DG RTD* [email protected] * S’exprimant à titre personnel

Welcome message from author
This document is posted to help you gain knowledge. Please leave a comment to let me know what you think about it! Share it to your friends and learn new things together.
Transcript

Europe:Vers une transition socio-écologique ?
Académie royale des Sciences, des Lettres et des Beaux-Arts
Bruxelles, 19 novembre 2013
Domenico ROSSETTICommission européenne, DG RTD*
* S’exprimant à titre personnel

L'avenir ne se prévoit pas, il se prépare
Maurice Blondel
2

Table of contents
A rapidly changing, troubling & unsustainable worldWorld grand challenges Europe's problems Creativity, research and innovation(s)Intangible assets and green economyNew values and strengths of Europeans
3

A rapidly changing, troubling and
unsustainable world
4

Economics and GeopoliticsNorth-South? East-West? Developed-developing, emerging-emerged countries?Emerging economies as rich countries with many poor people, or poor countries with many rich people?Multipolar world, G2 or even "The end of the West"?Neo-Keynesian and neo-liberal or State capitalism?Markets, regulation, deregulation?Mega-regional agreements as a basis for world governance or as a tool fragmenting the world economy?
Source: D. Rossetti5

Population (Million)
Source: UN, World Population Prospects
1950 2011 2050 Factor
India 372 1 241 1 692 ~X 4 / 5
Brazil 54 197 223 ~X 4
USA 158 313 403 ~X 2 / 3
China 551 1 347 1 296 ~X 2 /3
EU 28 381 510 520 ~X 1 / 1.56

The EU GDP in % of global output
37% in 197028% in 201020% in 203017% in 2050
Source: UNCTAD, EC – Global Europe 20507

The fast changes in Energy
The need for electricity in emerging economies drives a 70% increase in worldwide demand
The surge of unconventional oil and gas (cf. shale gas), especially in North America that emerge as a net exporter by 2035
By 2035, ~ 90% of Middle Eastern oil exports go to Asia
1400 coal power plants are running in China
Source: IEA, WEO 20128

CO2 emissions – Old and new actors
2000 2050USA & Canada 23% 12%Enlarged EU 14% 8%Russia & CIS 8% 5%Japan 4% 2%
S-E Asia - China 20% 27%South Asia - India 7% 13%Africa 7% 15%Latin America 7% 9%Others 10% 9%
49%
51%
27%
73%
Source: EC, DG ENV/CLIMA
9

Unsustainable trendsObesity is a leading cause of premature deathWorld transport will be multiplied by three between 2000 and 2050 (passenger/km and ton/km)Car ownership in the EU increased by ~40% between 1990 and 2010 – A car is parked 92% of its life cycleThe average speed of an international freight train in the EU is 18km/h40,000 people die each year in road traffic in the EUMore than 40% of the world electricity is generated from coal with its CC impacts (1400 coal power plants in China)
Source: D. Rossetti selection from European Commission Communications10

Les grandes batailles de l'énergie Jean-Marie Chevalier
Source: IEA, 201111
Russian natural gas prices

World grand challenges
12

Global resource extraction
Source: OECD; Behrens; WMM, Global Insight, Ellen Mac Arthur Foundation – Circular economy team
Today: almost 70 billion tonnes extracted
13

Availability of natural resources
Source: European Commission, DG RTD, The World in 2025 and Global Europe 2050
Water (4 billion people missing water by 2050)
Food (70% increase by 2050)
Land (war on lands)
Materials (lithium, gallium, scandium,…)
Energy (availability, prices, conflicts,…)
14

Wealth and poverty27,000 people world-wide with more than $ 500 M
5 billion people with less than 10$ a day
Source: WSJ report on Crédit Suisse statisticsUN 2011 Report and UN-Habitat
~80 M€
~ 60% of urban population in Africa and ~ 40% Southern Asia
15

Close but… different neighbourhood
Source: São Paulo, picture from D. Bounds blog
16

Potential "future global shocks"
Social unrest
Pandemics
Systemic financial risk
Cybersecurity risk
Source: OECD, Future Global Shocks, 201117

High prices cause food riots
Source: New England Complex Systems institute, USA18
N° of food riot deaths in parenthesis

Climate Change Adaptation
Source: Hertzberger19

Global flowsGlobal trade multiplied by more than 10 between 1960 and 2010Maritime container trade expanded at an average 8.2% between 1990 and 2010Air traffics have doubled approximately every 15 years, and are expected to keep growing an average 4.7% yearly up to 2030Tourism went from 700 million tourist arrivals worldwide in 2004 to 1 billion in 2011 and is expected to grow 75% up to 2030
Source: EC, RTD, FLAGSHIP (WB, UNCTAD, Airbus, UNWTO)20

Concentration in Megacities
Source: UN-Habitat
Tokyo 34 M inh.
Seoul 25 M inh.
New Delhi 23 M inh.
Sao Paolo 21 M inh.
21

Environmental crisis is more than Climate Change
Source: EC, WWWforEurope (C.L. Spash)
Biodiversity
Soil erosion and Deforestation
Water acidification and salinisation
Insecticides and pesticides
Particulates in the air
Toxic chemical waste, Heavy metals,…22

Europe's problems
23

Youth unemployment in the EU (in %)
Source: Eurostat, Statista, 2013
24

Ageing EU population (000 people)
Source: EC, DG ECFIN, Ageing Report (Bogaert)
The number of people over 65 will double in 50 years (up to 150 M in 2060)
The "oldest old" (85 and over) will almost triple
The share of health expenditures in the EU is expected to increase from 8% of GDP today to 13% in 2060
25

Poverty in the EU (~ 20% at risk)
Source: EU-SILC
26

Public but also firm and private debts
Source: La Libre Belgique, 7/3/13
27

The EU labour market dificulties
In 2011, Europeans worked on average 1,746 hours per year (2,000 hours in 1980) and the average retirement age is 61.2 years
The average duration of unemployment is 11 years in the EU (against 6 years in the US)
Between 1998-2011, productivity per capita grew by:0.5% in the euro zone2.5% in USA
Source:OECD and EC, RTD, FLAGSHIP (Ricci and Sessa)28

Education & qualification challengesLabour force (15+) for EU-27
Source: CEDEFOP, 2010 29

Competitiveness – Energy price
Source: IEA, WEO 2012
Average household electricity prices by 2035 ($ cents/kWh)
China 7USA 12EU 20
Divergence in natural gas prices by 2035 Europe: prices 5 times US levels
Asia: prices 8 times US levels30

Source: EC, JRC-IPTS, Transtools,
RURAL63% RURAL
53%
European road & congested links (2030)
Morning peak hours: 7-9
31

Creativity, Research and Innovation(ss)
32

Right policy messages but wrong anticipation of technological progress
Malthus "Essay on the principle of population"Meadows Report "The Limits to Growth"Association for the Study of Peak Oil and Gas
33Source: D. Rossetti
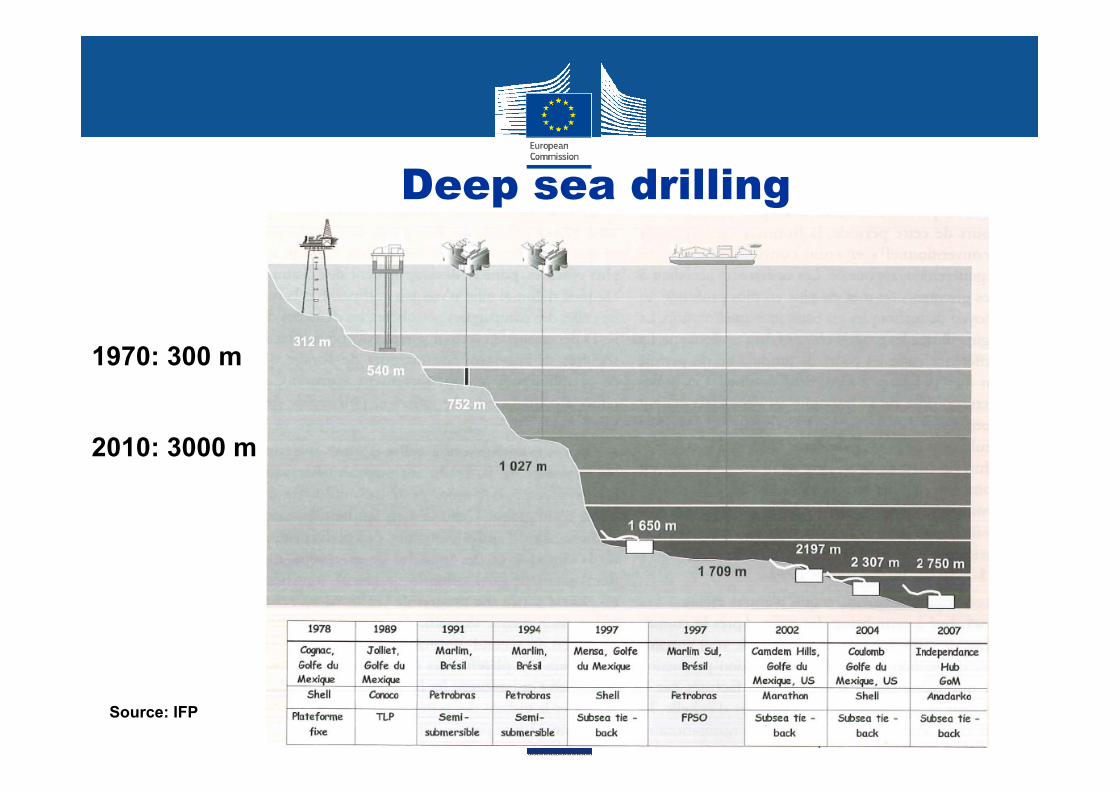
1970: 300 m
2010: 3000 m
Deep sea drilling
Source: IFP

EU R&D since its origin
European Coal and Steel Community (1951) covered the coal researchEuropean Atomic Energy Community (EURATOM) in 1957 covered the nuclear research and created the European Joint Research CentreInitial non sectorial research were launched in 1974 (Council resolutions)RTD « Framework Programmes » (since 1984 to 2013) and HORIZON 2020 (2014-2020)
Source: D. Rossetti35

Turning the eyes
Most of the efforts these last 50 years in R&D were directly linked to industrial policies. In Europe:
In the eighties, the eyes were turned towards Japanand “technology push”
In 2000 (Lisbon), the eyes were turned towards USA: Competitiveness, innovation and flexibility
Today: Europe 2020 strategy – Smart, sustainable and inclusive growth
Source: D. Rossetti36

Role of research and innovation(“3% GDP target”)
Source: P. Zagamé
Evolution of GDP (Billion € 2000)
9000
10000
11000
12000
13000
14000
15000
16000
17000
2005
2006
2007
2008
2009
2010
2011
2012
2013
2014
2015
2016
2017
2018
2019
2020
2021
2022
2023
2024
2025
Forecast before Crise New forecast Counter-cyclical scenario
(1)
(2)
(3)
37

Product innovation
“A product innovation is the introduction of a good or service that is new or significantly improved with respect to its characteristics or intended uses”
Ex: iPad
Source: OECD, Oslo manual Source: Apple
38

Process innovation
Source: OECD, Oslo manual
• “ A process innovation is the implementation of a new or significantly improved production or delivery method. This includes changes in techniques, equipment and/or software”
Ex: Bar code
39

Marketing innovation
Source: OECD, Oslo manual
• “A marketing innovation is the implementation of a new marketing method involving significant changes in product design or packaging, product placement, product promotion or pricing”
Ex: Packaging
Source: Ferrero40

Organisational innovation
Source: OECD, Oslo manual
• “An organisational innovation is the implementation of a new organisational method in the firm’s business practices, workplace organisation or external relations”
Ex: Assembly line
Source: Volkswagen 41

Social innovation
Source: European Commission
• Social innovation can be defined as a new product, service or model that simultaneously meets social and environmental needs (more effectively than alternatives) and / or creates new social collaborations
Ex: Transport, ethical banking, social networks,…
Source: Villo 42

C'est le dynamisme – le désir et la capacité d'innover – qui est la source de l'innovation
Edmund PhelpsNobel Price 2006
43

Innovation and (exit of) the crisis
Source: EC, State of the Innovation Union, 2011
44

Intangible assets and green economy
45

Using the time – Towards "intangible"Food and information (2000-2100)
Source: EC, DG RTD, WETO-T (Chateau and Rossetti)
Hours/day/pers
Information index46

Breakdown of intangible assets
Source: EC, DG RTD, COINVEST and WIOD(Corrado, Hulten, Sichel)
47

Tangible & Intangible % of GDP (2008)
Source: EC, DG RTD, COINVEST and WIOD(Corrado, Hulten, Sichel)
48

Economics tries to incorporate environmental issues
External costs that should be internalizedGNP as indicator is corrected for environmental damages or substituted indicator(s) for wellbeingTaxes or ETS should reduce emissions
ButTotal world energy consumption is still increasing-nearly parallel to production (energy elasticity near 1) Better for industrialized countries (elasticity: 0.5-1) as higher energy efficiency, higher share of services in GDP and some relocation of production less DC
Source: EC, WWWforEurope (K. Aiginger)49

Low-carbon innovation
Source: EC, DG RTD, SIMPATIC (A. Dechezleprêtre)
50

From theory to practice
Source: V. Druzhinin
51

Acting on lifestyles
Source: Google images 52

Right pricing
Source: Google images
53

Valuing the time
2 hours
Source: Google image
54

Source: Newman and Kenworthy
Building sustainable citiesEloge de la densité
55

Incentivizing cultural and creative industries
• The cultural and creative sectors need multi-disciplinary environments where they can meet with businesses from other industries. Any public intervention aiming to further develop them calls for cross-sectoral fertilisation
• European Commission, COM(2012)537, Promoting cultural and creative sectors for growth and jobs in the EU
56

New values and strengths of Europeans
57

From Proprietas to Usus
New economy and younger generation:
Less ownership (purchasing)More access (renting & sharing)
58

A 21st century pact between Science & Society
Man – NatureRespect – Exploitation
Humanities – EngineeringDesign of a car - Efficiency of the combustion engine
Social habits - Technological developmentsAirplane service on board - Online reservation
Precaution - InnovationDNA, GMO, nuclear Source: D. Rossetti
59

The potential of EU cultural heritage
Source: Google images

Tradition is not leaving ashes, its is passing the flame
Thomas More
61

Reason and openness on migrations
Per year, 1 million of third countries people are entering the EU20% of the EU population will be Muslim by 2050
Source: European Commission, Global Europe 2050 62

Sobriety vs. ExcessLagom
Frugalité
NegawattGenuine Progress Indicator (GPI)Against planned or wished obsolescence
European way of life 63

SSS – Smart, Small and Sustainable
High level of R&I, good commercial practices, attractive design – beyond technological innovation
Big is powerful but small is beautiful and flexible (quality, customer-oriented, …)
Modern infrastructures and new approaches to sustainable living and mobility options (eco-towns, public transport, shared consumption)
Democratic systems, rule of law, gender balance64
Source: D. Rossetti

Source: Letter Duo Sunt
RURAL63%
RBAN37%
RURAL53%
State and ReligionPope St Gelasius (492-496) - from Berber origin - wrote
on Church-State relations: Distinction between two powers:
The holy authority of bishops (auctoritas sacrata pontificum)The royal power (regalis potestas)
"En politique les Prêtres doivent se plier aux lois de l’Empereur, et en matière de religion l’Empereur doit écouter le Prêtre"
65

Conclusions
Change of paradigm:From a consumption-waste society to a circular economy (cf. sobriety and preservation of resources)From consumers to "innosumers"Beyond tangibles & Beyond GDP (society & economy)
The socio-ecological transition is a great opportunity (cf. globalisation and decreasing inequality across the world population, healthy ageing, territorial dynamics, new energy)
Source: D. Rossetti
66

Conclusions
Ever-expanding human activity and a finite world (Limits to growth - 1972; SD-1986; Rio-1992; Rio+20)
New economic and social development: increasing growth while reducing both unemployment and GHG emissions; decoupling economic growth and environmental impact; reducing externalities
Health, safety and security risk (cf. food, energy) as well as CC, world finance and international trade require new forms of global governance and representation
Source: D. Rossetti67

Representation – G8
G8, Northern Ireland, 17 June 2013
68

Veut-on les Nations Unies de l'Europe ou les Etats-Unis d'Europe
Guy Verhofstadt
69

70
Related Documents
![INDEX [link.springer.com]3A978-94-010...INDEX Academy of Exact Sciences (Cordoba, Argentina), 5, 15; elects Darwin, 13 Academy of Sciences (Havana), 54, 62, 154 Academy of Sciences](https://static.cupdf.com/doc/110x72/61129e3a3c5a451a40196d27/index-link-3a978-94-010-index-academy-of-exact-sciences-cordoba-argentina.jpg)