ΕΘΝΙΚΟ ΜΔΣΟΒΙΟ ΠΟΛΤΣΔΥΝΔΙΟ ΣΥΟΛΗ ΗΛΔΚΣΡΟΛΟΓΩΝ ΜΗΥΑΝΙΚΩΝ ΚΑΙ ΜΗΥΑΝΙΚΩΝ ΥΠΟΛΟΓΙΣΩΝ ΤΟΜΔΑ ΗΛΔΚΣΡΙΚΗ ΙΥΤΟ Ανάπηςξη ηοπολογίαρ πποζαπμοζηικού ελέγσος διεπγαζιών πλοίων με πςθμιζηέρ ζηποθών για εξοικονόμηζη ιζσύορ και καςζίμος γεννηηπιών ΓΙΓΑΚΣΟΡΙΚΗ ΓΙΑΣΡΙΒΗ πσρίδων Β. Γιαννούτσος Επιβλέπων: τέυανος Ν. Μανιάς Ομότιμος Καθηγητής Δ.Μ.Π. Αθήνα, 2018

Welcome message from author
This document is posted to help you gain knowledge. Please leave a comment to let me know what you think about it! Share it to your friends and learn new things together.
Transcript
ΕΘΝΙΚΟ ΜΔΣΟΒΙΟ ΠΟΛΤΣΔΥΝΔΙΟ
ΣΥΟΛΗ ΗΛΔΚΣΡΟΛΟΓΩΝ ΜΗΥΑΝΙΚΩΝ ΚΑΙ
ΜΗΥΑΝΙΚΩΝ ΥΠΟΛΟΓΙΣΩΝ
ΤΟΜΔΑ ΗΛΔΚΣΡΙΚΗ ΙΥΤΟ
Ανάπηςξη ηοπολογίαρ πποζαπμοζηικού ελέγσος διεπγαζιών πλοίων με
πςθμιζηέρ ζηποθών για εξοικονόμηζη ιζσύορ και καςζίμος γεννηηπιών
ΓΙΓΑΚΣΟΡΙΚΗ ΓΙΑΣΡΙΒΗ
πσρίδων Β. Γιαννούτσος
Επιβλέπων: τέυανος Ν. Μανιάς
Ομότιμος Καθηγητής Δ.Μ.Π.
Αθήνα, 2018

Π Δ Ρ Ι Λ Η Φ Η
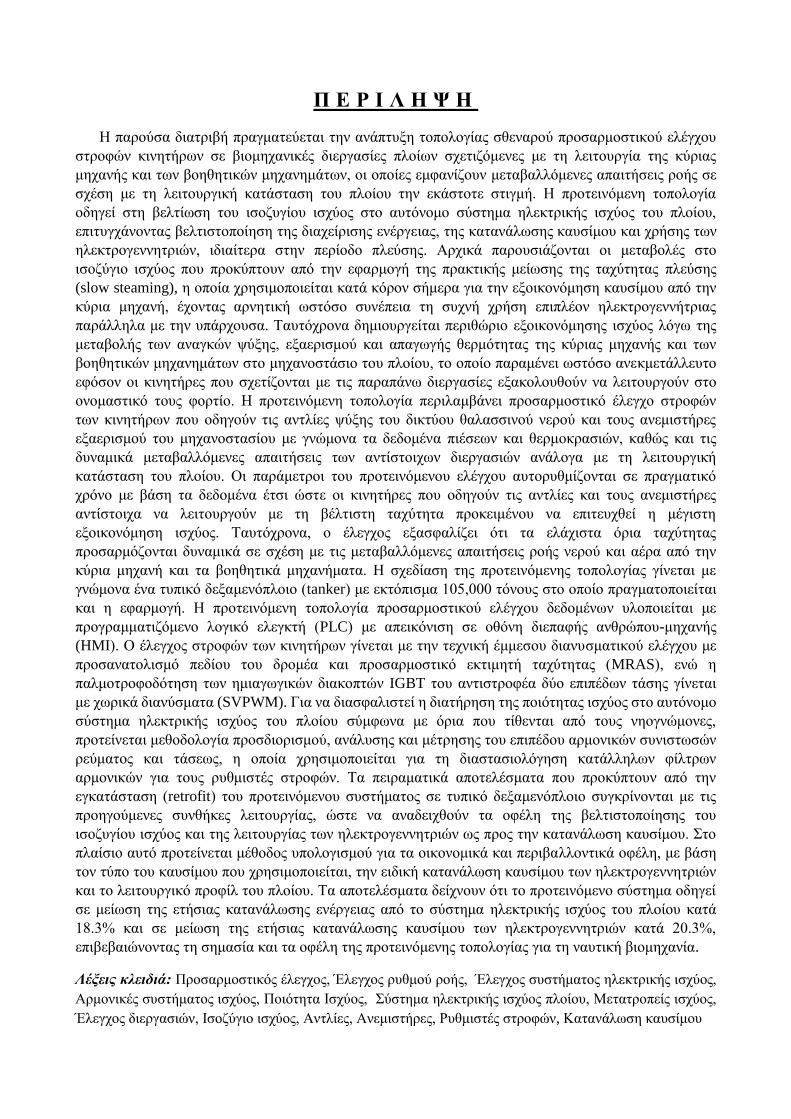
Ζ παξνύζα δηαηξηβή πξαγκαηεύεηαη ηελ αλάπηπμε ηνπνινγίαο ζζελαξνύ πξνζαξκνζηηθνύ ειέγρνπ
ζηξνθώλ θηλεηήξσλ ζε βηνκεραληθέο δηεξγαζίεο πινίσλ ζρεηηδόκελεο κε ηε ιεηηνπξγία ηεο θύξηαο
κεραλήο θαη ησλ βνεζεηηθώλ κεραλεκάησλ, νη νπνίεο εκθαλίδνπλ κεηαβαιιόκελεο απαηηήζεηο ξνήο ζε
ζρέζε κε ηε ιεηηνπξγηθή θαηάζηαζε ηνπ πινίνπ ηελ εθάζηνηε ζηηγκή. Ζ πξνηεηλόκελε ηνπνινγία
νδεγεί ζηε βειηίσζε ηνπ ηζνδπγίνπ ηζρύνο ζην απηόλνκν ζύζηεκα ειεθηξηθήο ηζρύνο ηνπ πινίνπ,
επηηπγράλνληαο βειηηζηνπνίεζε ηεο δηαρείξηζεο ελέξγεηαο, ηεο θαηαλάισζεο θαπζίκνπ θαη ρξήζεο ησλ
ειεθηξνγελλεηξηώλ, ηδηαίηεξα ζηελ πεξίνδν πιεύζεο. Αξρηθά παξνπζηάδνληαη νη κεηαβνιέο ζην
ηζνδύγην ηζρύνο πνπ πξνθύπηνπλ από ηελ εθαξκνγή ηεο πξαθηηθήο κείσζεο ηεο ηαρύηεηαο πιεύζεο
(slow steaming), ε νπνία ρξεζηκνπνηείηαη θαηά θόξνλ ζήκεξα γηα ηελ εμνηθνλόκεζε θαπζίκνπ από ηελ
θύξηα κεραλή, έρνληαο αξλεηηθή σζηόζν ζπλέπεηα ηε ζπρλή ρξήζε επηπιένλ ειεθηξνγελλήηξηαο
παξάιιεια κε ηελ ππάξρνπζα. Σαπηόρξνλα δεκηνπξγείηαη πεξηζώξην εμνηθνλόκεζεο ηζρύνο ιόγσ ηεο
κεηαβνιήο ησλ αλαγθώλ ςύμεο, εμαεξηζκνύ θαη απαγσγήο ζεξκόηεηαο ηεο θύξηαο κεραλήο θαη ησλ
βνεζεηηθώλ κεραλεκάησλ ζην κεραλνζηάζην ηνπ πινίνπ, ην νπνίν παξακέλεη σζηόζν αλεθκεηάιιεπην
εθόζνλ νη θηλεηήξεο πνπ ζρεηίδνληαη κε ηηο παξαπάλσ δηεξγαζίεο εμαθνινπζνύλ λα ιεηηνπξγνύλ ζην
νλνκαζηηθό ηνπο θνξηίν. Ζ πξνηεηλόκελε ηνπνινγία πεξηιακβάλεη πξνζαξκνζηηθό έιεγρν ζηξνθώλ
ησλ θηλεηήξσλ πνπ νδεγνύλ ηηο αληιίεο ςύμεο ηνπ δηθηύνπ ζαιαζζηλνύ λεξνύ θαη ηνπο αλεκηζηήξεο
εμαεξηζκνύ ηνπ κεραλνζηαζίνπ κε γλώκνλα ηα δεδνκέλα πηέζεσλ θαη ζεξκνθξαζηώλ, θαζώο θαη ηηο
δπλακηθά κεηαβαιιόκελεο απαηηήζεηο ησλ αληίζηνηρσλ δηεξγαζηώλ αλάινγα κε ηε ιεηηνπξγηθή
θαηάζηαζε ηνπ πινίνπ. Οη παξάκεηξνη ηνπ πξνηεηλόκελνπ ειέγρνπ απηνξπζκίδνληαη ζε πξαγκαηηθό
ρξόλν κε βάζε ηα δεδνκέλα έηζη ώζηε νη θηλεηήξεο πνπ νδεγνύλ ηηο αληιίεο θαη ηνπο αλεκηζηήξεο
αληίζηνηρα λα ιεηηνπξγνύλ κε ηε βέιηηζηε ηαρύηεηα πξνθεηκέλνπ λα επηηεπρζεί ε κέγηζηε
εμνηθνλόκεζε ηζρύνο. Σαπηόρξνλα, ν έιεγρνο εμαζθαιίδεη όηη ηα ειάρηζηα όξηα ηαρύηεηαο
πξνζαξκόδνληαη δπλακηθά ζε ζρέζε κε ηηο κεηαβαιιόκελεο απαηηήζεηο ξνήο λεξνύ θαη αέξα από ηελ
θύξηα κεραλή θαη ηα βνεζεηηθά κεραλήκαηα. Ζ ζρεδίαζε ηεο πξνηεηλόκελεο ηνπνινγίαο γίλεηαη κε
γλώκνλα έλα ηππηθό δεμακελόπινην (tanker) κε εθηόπηζκα 105,000 ηόλνπο ζην νπνίν πξαγκαηνπνηείηαη
θαη ε εθαξκνγή. Ζ πξνηεηλόκελε ηνπνινγία πξνζαξκνζηηθνύ ειέγρνπ δεδνκέλσλ πινπνηείηαη κε
πξνγξακκαηηδόκελν ινγηθό ειεγθηή (PLC) κε απεηθόληζε ζε νζόλε δηεπαθήο αλζξώπνπ-κεραλήο
(HMI). Ο έιεγρνο ζηξνθώλ ησλ θηλεηήξσλ γίλεηαη κε ηελ ηερληθή έκκεζνπ δηαλπζκαηηθνύ ειέγρνπ κε
πξνζαλαηνιηζκό πεδίνπ ηνπ δξνκέα θαη πξνζαξκνζηηθό εθηηκεηή ηαρύηεηαο (MRAS), ελώ ε
παικνηξνθνδόηεζε ησλ εκηαγσγηθώλ δηαθνπηώλ IGBT ηνπ αληηζηξνθέα δύν επηπέδσλ ηάζεο γίλεηαη
κε ρσξηθά δηαλύζκαηα (SVPWM). Γηα λα δηαζθαιηζηεί ε δηαηήξεζε ηεο πνηόηεηαο ηζρύνο ζην απηόλνκν
ζύζηεκα ειεθηξηθήο ηζρύνο ηνπ πινίνπ ζύκθσλα κε όξηα πνπ ηίζεληαη από ηνπο λενγλώκνλεο,
πξνηείλεηαη κεζνδνινγία πξνζδηνξηζκνύ, αλάιπζεο θαη κέηξεζεο ηνπ επηπέδνπ αξκνληθώλ ζπληζησζώλ
ξεύκαηνο θαη ηάζεσο, ε νπνία ρξεζηκνπνηείηαη γηα ηε δηαζηαζηνιόγεζε θαηάιιεισλ θίιηξσλ
αξκνληθώλ γηα ηνπο ξπζκηζηέο ζηξνθώλ. Σα πεηξακαηηθά απνηειέζκαηα πνπ πξνθύπηνπλ από ηελ
εγθαηάζηαζε (retrofit) ηνπ πξνηεηλόκελνπ ζπζηήκαηνο ζε ηππηθό δεμακελόπινην ζπγθξίλνληαη κε ηηο
πξνεγνύκελεο ζπλζήθεο ιεηηνπξγίαο, ώζηε λα αλαδεηρζνύλ ηα νθέιε ηεο βειηηζηνπνίεζεο ηνπ
ηζνδπγίνπ ηζρύνο θαη ηεο ιεηηνπξγίαο ησλ ειεθηξνγελλεηξηώλ σο πξνο ηελ θαηαλάισζε θαπζίκνπ. ην
πιαίζην απηό πξνηείλεηαη κέζνδνο ππνινγηζκνύ γηα ηα νηθνλνκηθά θαη πεξηβαιινληηθά νθέιε, κε βάζε
ηνλ ηύπν ηνπ θαπζίκνπ πνπ ρξεζηκνπνηείηαη, ηελ εηδηθή θαηαλάισζε θαπζίκνπ ησλ ειεθηξνγελλεηξηώλ
θαη ην ιεηηνπξγηθό πξνθίι ηνπ πινίνπ. Σα απνηειέζκαηα δείρλνπλ όηη ην πξνηεηλόκελν ζύζηεκα νδεγεί
ζε κείσζε ηεο εηήζηαο θαηαλάισζεο ελέξγεηαο από ην ζύζηεκα ειεθηξηθήο ηζρύνο ηνπ πινίνπ θαηά
18.3% θαη ζε κείσζε ηεο εηήζηαο θαηαλάισζεο θαπζίκνπ ησλ ειεθηξνγελλεηξηώλ θαηά 20.3%,
επηβεβαηώλνληαο ηε ζεκαζία θαη ηα νθέιε ηεο πξνηεηλόκελεο ηνπνινγίαο γηα ηε λαπηηθή βηνκεραλία.
Λέμεηο θιεηδηά: Πξνζαξκνζηηθόο έιεγρνο, Έιεγρνο ξπζκνύ ξνήο, Έιεγρνο ζπζηήκαηνο ειεθηξηθήο ηζρύνο,
Αξκνληθέο ζπζηήκαηνο ηζρύνο, Πνηόηεηα Ηζρύνο, ύζηεκα ειεθηξηθήο ηζρύνο πινίνπ, Μεηαηξνπείο ηζρύνο,
Έιεγρνο δηεξγαζηώλ, Ηζνδύγην ηζρύνο, Αληιίεο, Αλεκηζηήξεο, Ρπζκηζηέο ζηξνθώλ, Καηαλάισζε θαπζίκνπ
A B S T R A C T
In this thesis, a robust data-driven control topology is developed, involving the optimal speed
control of motors associated with processes related to ship‟s main engine (Μ/Δ) and auxiliary machinery
operation. The flow requirements of these processes are dynamically changing according to the vessel‟s
operational profile. The proposed topology leads to improvement of power balance in the autonomous
power system of marine vessels, optimizing energy management as well as diesel generator (D/G) fuel
consumption and operating profile, especially during sea-going period. The initial point of study is the
variation in vessel‟s power balance due to application of slow steaming practice, involving the operation
of ship‟s main engine at low speed. Although this practice is commonly used nowadays to reduce M/E
fuel consumption, it often leads to the use of an additional diesel generator engine in parallel to the
operating one at low load resulting in higher specific fuel oil consumption. At the same time, an energy
saving margin is created in the power system by the derated flow rate requirements in processes related
to M/E and auxiliary machinery operation due to their variable cooling combustion air and heat
dissipation needs. However, there is currently no advantage taken of this margin, since the motors
associated with these processes operate constantly at their nominal power. The proposed topology
involves adaptive speed adjustment of motors driving the cooling sea water pumps and the engine room
fans in the vessel‟s central cooling water system and engine room ventilation system respectively based
on pressure and temperature feedback signals from the processes. This is performed according to process
requirements, which dynamically change according to the vessel‟s operating profile. The parameters of
the proposed control system are self-tuned in real time based on data received from the processes, so
that the motors driving the pumps and the fans respectively operate with optimal speed, allowing
maximum power saving potential. Towards this goal, the controller ensures that the minimum allowable
speed limits are dynamically adapted in relation to the changing cooling water and combustion air flow
requirements of vessel‟s M/E and auxiliary machinery. The design of the proposed topology is
performed based on the parameters of typical tanker vessel with size of 105,000tons DWT, where the
system is also implemented. The proposed adaptive data-driven control topology is realized through a
commercial programmable logic controller (PLC), while a human-machine interface (HMI) is developed
for plant parameter monitoring. The variable frequency control of motors is performed using indirect
field oriented control with speed estimation based on model reference adaptive system technique, while
pulse generation for the IGBTs of the 2-level inverter is performed using space vector PWM (SVPWM).
To ensure that, after the application of the variable frequency drive (VFD) topology, the level of power
quality at the point of common coupling (PCC) is maintained according to marine classification society
regulations in the vessel‟s autonomous power system, a systematic power quality assessment and
monitoring methodology is proposed to dimension appropriate harmonic filters, considering the source
short circuit capacity and the existing vessel‟s power system harmonics. The proposed system is
retrofitted in a typical tanker vessel and the obtained experimental results are compared to previous
operating conditions in order to show how the achieved optimization of power balance and D/G
operating profile affects the D/G fuel consumption. In this view, a method is proposed to calculate the
economic and environmental benefits, based on the used fuel type, the specific D/G fuel consumption
and the ship‟s operating profile. The results show that the proposed system leads to reduction of annual
energy consumption in the power system by 18.3% and to reduction of annual D/G fuel consumption by
20.3%, verifying the importance of the proposed energy efficiency upgrade for the maritime industry.
Key words: Data-driven control, Flow control, Industrial power system control, Industrial Power System
harmonics, Power quality, Marine vessel power systems, Power conversion, Process control, Power balance,
Pumps, Fans, Variable Frequency Drives, Fuel consumption, Diesel Generators
ηνπο γνλείο κνπ,
πνπ πξνζπάζεζαλ ην θαιύηεξν γηα ηελ πξόνδν ησλ παηδηώλ ηνπο
& κεηέδσζαλ αμίεο πνπ ζα ηηο αθνινπζνύλ γηα πάληα ζηε δσή ηνπο
ην πνίεκα ηνπ Κ.Π. Καβάθε, «ΗΘΑΚΖ» ,
πνπ απνηέιεζε ζηήξηγκα ησλ πξνζπαζεηώλ κνπ θαη ζηάζε δσήο:
Σα βγεισ ςτον πηγαιμό για την Ιθϊκη, να εύχεςαι νϊναι μακρύσ ο δρόμοσ,
γεμϊτοσ περιπϋτειεσ, γεμϊτοσ γνώςεισ. Τουσ Λαιςτρυγόνασ και τουσ Κύκλωπασ, τον θυμωμϋνο Ποςειδώνα μη φοβϊςαι,
τϋτοια ςτον δρόμο ςου ποτϋ ςου δεν θα βρεισ, αν μϋν’ η ςκϋψισ ςου υψηλό, αν εκλεκτό
ςυγκύνηςισ το πνεύμα και το ςώμα ςου αγγύζει. Τουσ Λαιςτρυγόνασ και τουσ Κύκλωπασ,
τον ϊγριο Ποςειδώνα δεν θα ςυναντόςεισ, αν δεν τουσ κουβανεύσ μεσ ςτην ψυχό ςου,
αν η ψυχό ςου δεν τουσ ςτόνει εμπρόσ ςου.
Να εύχεςαι νϊναι μακρύσ ο δρόμοσ. Πολλϊ τα καλοκαιρινϊ πρωιϊ να εύναι
που με τι ευχαρύςτηςι, με τι χαρϊ θα μπαύνεισ ςε λιμϋνασ πρωτοειδωμϋνουσ·
να ςταματόςεισ ς’ εμπορεύα Φοινικικϊ, και τεσ καλϋσ πραγμϊτειεσ ν’ αποκτόςεισ,
ςεντϋφια και κορϊλλια, κεχριμπϊρια κ’ ϋβενουσ, και ηδονικϊ μυρωδικϊ κϊθε λογόσ,
όςο μπορεύσ πιο ϊφθονα ηδονικϊ μυρωδικϊ· ςε πόλεισ Aιγυπτιακϋσ πολλϋσ να πασ,
να μϊθεισ και να μϊθεισ απ’ τουσ ςπουδαςμϋνουσ.
Πϊντα ςτον νου ςου νϊχεισ την Ιθϊκη. Το φθϊςιμον εκεύ εύν’ ο προοριςμόσ ςου.
Aλλϊ μη βιϊζεισ το ταξεύδι διόλου. Καλλύτερα χρόνια πολλϊ να διαρκϋςει·
και γϋροσ πια ν’ αρϊξεισ ςτο νηςύ, πλούςιοσ με όςα κϋρδιςεσ ςτον δρόμο,
μη προςδοκώντασ πλούτη να ςε δώςει η Ιθϊκη.
Η Ιθϊκη ς’ ϋδωςε τ’ ωραύο ταξεύδι. Χωρύσ αυτόν δεν θϊβγαινεσ ςτον δρόμο.
Άλλα δεν ϋχει να ςε δώςει πια.
Κι αν πτωχικό την βρεισ, η Ιθϊκη δεν ςε γϋλαςε. Έτςι ςοφόσ που ϋγινεσ, με τόςη πεύρα,
όδη θα το κατϊλαβεσ η Ιθϊκεσ τι ςημαύνουν.
ΔΤΥΑΡΗΣΗΔ
ην ζεκείν απηό ζα ήζεια λα επραξηζηήζσ όζνπο ζπλέβαιαλ ζηελ νινθιήξσζε
ηεο Γηαηξηβήο, ε νπνία ήηαλ απνηέιεζκα καθξόρξνλεο θαη επίπνλεο πξνζπάζεηαο,
ραξαθηεξηζηηθό ελόο ηαμηδηνύ πνπ κε δηακόξθσζε σο ραξαθηήξα θαη θαζόξηζε ηελ
πνξεία κνπ σο Ζιεθηξνιόγνπ Μεραληθνύ, θαη πιένλ σο Γηδάθηνξα Μεραληθνύ ΔΜΠ.
Αξρηθά ζα ήζεια λα επραξηζηήζσ ηνλ επηβιέπνληα θαζεγεηή κνπ, θ. ηέθαλν Ν.
Μαληά, νκόηηκν Καζεγεηή ΔΜΠ, γηα ηελ εκπηζηνζύλε πνπ έδεημε ζην πξόζσπό κνπ, ηε
ζπκπαξάζηαζε θαη ηελ θαζνδήγεζή ηνπ γηα ηελ νινθιήξσζε απηήο ηεο πξνζπάζεηαο.
Έρνληαο σο βάζε ηηο ζπκβνπιέο ηνπ, γηα ηνλ ηξόπν αληηκεηώπηζεο ησλ πξνβιεκάησλ
θαη ηελ αμία θαηαβνιήο νπζηώδνπο πξνζπάζεηαο κέζσ ηεο πξνηεξαηνπνίεζεο ησλ
δεηεκάησλ, έγηλα θαιύηεξνο Μεραληθόο. Παξάιιεια, επραξηζηώ ηα κέιε ηεο
επηακεινύο επηηξνπήο γηα ηηο παξαηεξήζεηο ηνπο, νη νπνίεο βνήζεζαλ ζηελ βειηίσζε
ηεο Γηαηξηβήο. εκαληηθόο αξσγόο ζε απηήλ ηελ πξνζπάζεηα, ππήξμε ε λαπηηιηαθή
εηαηξεία «Thenamaris Ships Management Inc», πνπ ππνζηήξημε νηθνλνκηθά ηελ
πινπνίεζε ηνπ πξνηεηλόκελνπ ζπζηήκαηνο ηεο Γηαηξηβήο ζε ηππηθό δεμακελόπινην ηνπ
ζηόινπ ηεο κε ζθνπό ηελ επίηεπμε ελεξγεηαθήο εμνηθνλόκεζεο, ζπκβάιινληαο έηζη ζηελ
νινθιήξσζε ηεο πξσηόηππεο απηήο Γηαηξηβήο κε κεγάιν αληίθηππν ζηε λαπηηθή
βηνκεραλία. Δπηπιένλ, επραξηζηώ ην Κνηλσθειέο Ίδξπκα «Αιέμαλδξνο Ωλάζεο», ην
νπνίν κνπ πξνζέθεξε ππνηξνθία κε νηθνλνκηθή ελίζρπζε θαηά ηε δηάξθεηα ησλ
πξνπηπρηαθώλ θαη δηδαθηνξηθώλ κνπ ζπνπδώλ. Γηα ην ηέινο, αθήλσ ηνπο αλζξώπνπο
νη νπνίνη, θαηά ηε δηάξθεηα θαη απηήο ηεο πξνζπάζεηαο ζηάζεθαλ δίπια κνπ ζε
επράξηζηεο αιιά θαη δύζθνιεο ζηηγκέο, πξνζθέξνληάο κνπ ηα απαξαίηεηα εθόδηα,
ςπρηθά θαη πιηθά γηα λα πεηύρσ ηνπο ζηόρνπο κνπ. Πάληα ζα ελεξγώ ώζηε λα
αληαπεμέξρνκαη ζηηο πξνθιήζεηο κε βάζε ηηο αμίεο θαη ζηα ηδαληθά κε ηα νπνία
κεγάισζα. Γηα ην ιόγν απηό, επραξηζηώ ηελ νηθνγέλεηά κνπ, ηε κεηέξα κνπ Λίλα, ηνλ
παηέξα κνπ Βαζίιε, θαη εύρνκαη θαιή πξόνδν ζηνλ αδεξθό κνπ Μηράιε.

ΠΔΡΙEXOMENA
Π Δ Ρ Ι Λ Η Φ Η ........................................................................................................................................................ 5
A B S T R A C T ........................................................................................................................................................ 6
ΠΔΡΙEXOMENA ............................................................................................................................................................ 10
ΚΔΦΑΛΑΗΟ 1 .................................................................................................................................................................. 14
ΔΗΑΓΧΓΖ – ΚΗΝΖΣΡΑ ΚΑΗ ΣΟΥΟΗ ΓΗΑΣΡΗΒΖ .................................................................................................. 14
1.1 ΖΜΑΗΑ ΔΞΟΗΚΟΝΟΜΖΖ ΚΑΤΗΜΟΤ ΣΑ ΠΛΟΗΑ – ΤΓΥΡΟΝΑ ΠΡΟΣΤΠΑ .......................................................... 14
1.2 ΔΠΗΚΟΠΖΖ ΚΤΡΗΧΝ ΜΔΘΟΓΧΝ ΔΞΟΗΚΟΝΟΜΖΖ ΚΑΤΗΜΟΤ ΣΑ ΠΛΟΗΑ ........................................................... 17
1.3 ΖΛΔΚΣΡΗΚΟ ΓΗΚΣΤΟ ΗΥΤΟ ΠΛΟΗΟΤ (ΔΦΑΡΜΟΓΖ Δ AFRAMAX 105,000DWT) ................................................... 22
1.3.1 Γεληθή πεξηγξαθή ειεθηξηθνύ δηθηύνπ ηζρύνο ηππηθνύ πινίνπ ................................................................... 22 1.3.2 Πεξηγξαθή ηνπνινγίαο Ζ/Γ πινίνπ θαη δηαζύλδεζε κε ξπζκηζηή ηάζεο ..................................................... 25 1.3.3 Γηαζηαζηνιόγεζε θαη ιεηηνπξγία Ζ/Γ ζην πινίν ........................................................................................ 28
1.4 ΟΦΔΛΖ ΚΑΗ ΗΓΗΑΗΣΔΡΟΣΖΣΔ ΠΡΑΚΣΗΚΖ ΜΔΗΧΖ ΣΖ ΣΑΥΤΣΖΣΑ ΠΛΔΤΖ ..................................................... 32 1.4.1 Δηζαγσγή θαη δεδνκέλα γηα ηππηθό δεμακελόπινην Αframax 105,000DWT ............................................... 32
1.4.2 Μαζεκαηηθή ηεθκεξίσζε γηα νθέιε θαύζηκσλ θαη εθπνκπή θαπζαεξίσλ .................................................. 32
1.4.3 Δθαξκνγή πξαθηηθήο κείσζεο ηαρύηεηαο πιεύζεο ζε πινίν 105,000DWT................................................. 34 1.5 ΑΡΥΖ ΛΔΗΣΟΤΡΓΗΑ ΓΗΔΡΓΑΗΧΝ Κ/Μ ΚΑΗ ΒΟΖΘΖΣΗΚΧΝ ΜΖΥΑΝΖΜΑΣΧΝ ............................................................ 36
1.5.1 ύζηεκα ηξνθνδνζίαο θαη αλαθπθινθνξίαο θαπζίκνπ γηα Κ/Μ θαη Ζ/Γ .................................................... 36
1.5.2 Γίθηπν ιίπαλζεο ζαιάκνπ ζπζηήκαηνο κεηάδνζεο θίλεζεο Κ/Μ ................................................................ 36 1.5.3 ύζηεκα θεληξηθήο ςύμεο λεξνύ γηα Κ/Μ, Ζ/Γ θαη βνεζεηηθά κεραλήκαηα .............................................. 38
1.5.4 ύζηεκα ζπκπηεζκέλνπ αέξα γηα ηελ έλαπζε θαη έιεγρν Κ/Μ θαη Ζ/Γ ....................................................... 40 1.5.5 ύζηεκα παξαγσγήο γιπθνύ λεξνύ θαη δηαζύλδεζε κε ζύζηεκα ςύμεο ...................................................... 40
1.5.6 ύζηεκα εμαεξηζκνύ ηνπ κεραλνζηαζίνπ ................................................................................................... 41 1.5.7 ύζηεκα παξαγσγήο αηκνύ κέζσ ιέβεηα θαπζίκνπ θαη θαπζαεξίσλ ......................................................... 42 1.5.8 ύζηεκα παξαγσγήο αδξαλνύο αεξίνπ (κόλν γηα δεμακελόπινηα) ............................................................. 44
1.6 ΈΛΔΓΥΟ ΓΗΔΡΓΑΗΧΝ ΜΔ ΠΡΟΑΡΜΟΣΗΚΟ ΔΛΔΓΥΟ ΓΔΓΟΜΔΝΧΝ ........................................................................ 45 1.6.1 Πνιπκεηαβιεηή ζηαηηζηηθή αλάιπζε δεδνκέλσλ ........................................................................................ 46
1.6.2 Δπαλαιεπηηθόο πξνζαξκνζηηθόο έιεγρνο ................................................................................................... 47 1.6.3 ζελαξόο πξνζαξκνζηηθόο έιεγρνο κε βάζε ηα δεδνκέλα .......................................................................... 48
1.7 ΚΗΝΖΣΡΑ, ΠΡΟΣΔΗΝΟΜΔΝΟ ΤΣΖΜΑ ΚΑΗ ΣΟΥΟ ΓΗΑΣΡΗΒΖ ................................................................................ 51 1.8 ΤΝΔΗΦΟΡΑ ΓΗΑΣΡΗΒΖ ΚΑΗ ΛΗΣΑ ΓΖΜΟΗΔΤΔΧΝ .............................................................................................. 54
1.9 ΓΗΑΡΘΡΧΖ ΚΔΦΑΛΑΗΧΝ ΓΗΑΣΡΗΒΖ ....................................................................................................................... 56 1.10 ΑΝΑΦΟΡΔ ΠΡΧΣΟΤ ΚΔΦΑΛΑΗΟΤ .......................................................................................................................... 59
ΚΔΦΑΛΑΗΟ 2 .................................................................................................................................................................. 62
ΔΝΔΡΓΔΗΑΚΖ ΓΗΑΥΔΗΡΗΖ ΗΟΕΤΓΗΟΤ ΗΥΤΟ ΠΛΟΗΟΤ ................................................................................... 62
2.1 ΗΓΗΑΗΣΔΡΟΣΖΣΔ ΑΤΣΟΝΟΜΟΤ ΤΣΖΜΑΣΟ ΖΛΔΚΣΡΗΚΖ ΗΥΤΟ ΠΛΟΗΟΤ ........................................................... 62 2.2 ΒΡΟΥΟΗ ΔΛΔΓΥΟΤ ΤΥΝΟΣΖΣΑ ΚΑΗ ΣΑΖ Ζ/Γ ΑΤΣΟΝΟΜΟΤ ΖΔ ΠΛΟΗΟΤ ........................................................ 62
2.2.1 Μνληέιν ειεθηξνγελλήηξηαο κε θνξηίν ...................................................................................................... 63 2.2.2 Μνληέιν εκβνινθόξαο κεραλήο εζσηεξηθήο θαύζεο Diesel ...................................................................... 64
2.2.3 Μνληέιν ξπζκηζηή ζηξνθώλ Ζ/Γ νδεγνύκελεο από κεραλή Diesel ........................................................... 65 2.2.4 Βειηηζηνπνίεζε ξπζκηζηή ζηξνθώλ κε αλαηξνθνδόηεζε θαηάζηαζεο ........................................................ 69 2.2.5 Έιεγρνο ηάζεσο - αέξγνπ ηζρύνο Ζ/Γ απηόλνκνπ ΖΔ πινίνπ κε AVR ..................................................... 71
2.3 ΌΡΗΑ ΛΔΗΣΟΤΡΓΗΑ ΑΤΣΟΜΑΣΟΤ ΤΣΖΜΑΣΟ ΓΗΑΥΔΗΡΗΖ ΗΥΤΟ ΠΛΟΗΟΤ ....................................................... 75 2.3.1 Μέγηζην κεηαβαηηθό θνξηίν Ζ/Γ ζε πεξίπησζε αζηνρίαο κνλάδαο............................................................. 76 2.3.2 Πεξηζώξην κέγηζηνπ ζπλερνύο θνξηίνπ θαη απηόκαηε εθθίλεζε Ζ/Γ .......................................................... 77
2.3.3 Ηζνκνηξαζκόο θνξηίνπ Ζ/Γ θαη πεξηζώξην κεηαβαηηθήο θόξηηζεο Ζ/Γ ...................................................... 79
2.3.4 Γηαζέζηκν πεξηζώξην ηζρύνο γηα απνθπγή απώιεηαο ηξνθνδνζίαο ............................................................ 81 2.3.5 Γπλακηθή απώιεηαο ηξνθνδνζίαο θαη επηιεθηηθή απνθνπή θνξηίνπ Ζ/Γ ................................................... 82
2.4 ΜΔΣΑΒΟΛΖ ΦΟΡΣΗΖ Ζ/Γ ΜΔ ΔΦΑΡΜΟΓΖ ΜΔΗΧΜΔΝΖ ΣΑΥΤΣΖΣΑ ΠΛΔΤΖ .................................................... 86
2.4.1 Παξάκεηξνη ιεηηνπξγίαο Κ/Μ πινίνπ ζε ζρέζε κε ηε κεηαβνιή θνξηίνπ .................................................... 87 2.4.2 Παξάκεηξνη ιεηηνπξγίαο Κ/Μ πινίνπ ππό κειέηε γηα δηάθνξεο ηαρύηεηεο .................................................. 93 2.4.3 Μεηαβνιή ηζνδπγίνπ ηζρύνο κε εθαξκνγή ζην ππό κέιεηε πινίν ................................................................ 96
2.5 ΠΔΡΗΘΧΡΗΟ ΔΞΟΗΚΟΝΟΜΖΖ ΗΥΤΟ ΣΟ ΚΔΝΣΡΗΚΟ ΤΣΖΜΑ ΦΤΞΖ Κ/Μ ......................................................... 99 2.5.1 Πεξηζώξην κείσζεο ξνήο αληιίαο παξνρήο ζαιαζζηλνύ λεξνύ αλάινγα κε ηε ιεηηνπξγηθή θαηάζηαζε ........... 99
2.5.2 Τπνινγηζκόο πεξηζσξίνπ κείσζεο παξνρήο ηππηθνύ πινίνπ ππό κειέηε ........................................................ 107 2.5.3 Μείσζε ξνήο κε πεξηνξηζκό επηζηνκίνπ ή κε ρξήζε ξπζκηζηή ζηξνθώλ ....................................................... 114
2.6 ΠΔΡΗΘΧΡΗΟ ΔΞΟΗΚΟΝΟΜΖΖ ΗΥΤΟ ΣΟ ΚΔΝΣΡΗΚΟ ΤΣΖΜΑ ΔΞΑΔΡΗΜΟΤ ...................................................... 116 2.6.1 Πεξηζώξην κείσζεο ξνήο αλεκηζηήξσλ εμαεξηζκνύ αλάινγα κε ηε ιεηηνπξγηθή θαηάζηαζε .......................... 117
2.6.2 Τπνινγηζκόο πεξηζσξίνπ κείσζεο ξνήο ζην ηππηθό πινίν ππό κειέηε ........................................................... 120 2.6.3 Δπίηεπμε κείσζεο ξνήο παξερόκελνπ αέξα κε ρξήζε ξπζκηζηή ζηξνθώλ ...................................................... 123
2.7 ΑΝΑΦΟΡΔ ΓΔΤΣΔΡΟΤ ΚΔΦΑΛΑΗΟΤ ...................................................................................................................... 125
ΚΔΦΑΛΑΗΟ 3 ................................................................................................................................................................ 128
ΔΠΗΛΟΓΖ ΚΑΗ ΔΛΔΓΥΟ ΣΟΠΟΛΟΓΗΑ ΡΤΘΜΗΣΖ ΣΡΟΦΧΝ ...................................................................... 128
3.1 ΠΑΡΑΜΔΣΡΟΗ ΔΠΗΛΟΓΖ ΠΡΟΣΔΗΝΟΜΔΝΖ ΣΟΠΟΛΟΓΗΑ ΡΤΘΜΗΣΖ ΣΡΟΦΧΝ ..................................................... 128 3.1.1 Γνκή ηνπνινγίαο ξπζκηζηή ζηξνθώλ θαη δπλαηόηεηεο δηαζύλδεζεο .............................................................. 128
3.1.2 Παξάκεηξνη ιεηηνπξγίαο θαη πξνζηαζία ξπζκηζηή ζηξνθώλ-θηλεηήξα ........................................................... 131 3.1.3 Μείσζε ζνξύβνπ θαη ελίζρπζε ειεθηξνκαγλεηηθήο ζπκβαηόηεηαο (EMC) .................................................... 137
3.1.4 Βαζκσηόο V/f θαη δηαλπζκαηηθόο ειέγρνο θηλεηήξα κε ξπζκηζηή ζηξνθώλ .................................................... 147
3.2 ΑΝΑΛΤΖ ΤΓΥΡΟΝΧΝ ΣΔΥΝΗΚΧΝ PWM ΑΝΣΗΣΡΟΦΔΑ ΡΤΘΜΗΣΖ ΣΡΟΦΧΝ ...................................................... 151
3.2.1 Σερληθή SPWM (Sinusoidal PWM) γηα ηξηθαζηθό αληηζηξνθέα VSI ............................................................. 151 3.2.2 Σερληθή SV-PWM ειέγρνπ ηξηθαζηθνύ αληηζηξνθέα κε ρσξηθά δηαλύζκαηα.................................................. 154
3.3 ΣΔΥΝΗΚΖ ΓΗΑΝΤΜΑΣΗΚΟΤ ΔΛΔΓΥΟΤ ΚΗΝΖΣΖΡΑ ΜΔ ΠΡΟΑΝΑΣΟΛΗΜΟ ΠΔΓΗΟΤ .................................................. 161 3.3.1 Ηζνδύλακν θύθισκα θηλεηήξα επαγσγήο ζε θηλνύκελν πιαίζην αλαθνξάο ................................................... 161 3.3.2 Έκκεζνο δηαλπζκαηηθόο έιεγρνο κε πξνζαλαηνιηζκό πεδίνπ ηνπ δξνκέα ...................................................... 166
3.3.3 Πξνζαξκνζηηθόο δηαλπζκαηηθόο έιεγρνο κε εθηηκεηή ηαρύηεηαο (MRAS) ..................................................... 173 3.4 ΔΠΗΛΟΓΖ ΣΟΠΟΛΟΓΗΑ ΡΤΘΜΗΣΖ ΣΡΟΦΧΝ ΠΡΟΣΔΗΝΟΜΔΝΟΤ ΤΣΖΜΑΣΟ ...................................................... 179
3.4.1 Γνκή, ραξαθηεξηζηηθά θαη δηαζύλδεζε κνληέινπ ξπζκηζηή ζηξνθώλ............................................................. 179 3.4.2 Γνκή θαη ραξαθηεξηζηηθά πξνγξακκαηηδόκελνπ ινγηθνύ ειεγθηή (PLC) ....................................................... 185 3.4.3 Υαξαθηεξηζηηθά ζπζηήκαηνο δηεπαθήο αλζξώπνπ-κεραλήο (ΖΜΗ) ............................................................... 188
3.5 ΑΝΑΦΟΡΔ ΣΡΗΣΟΤ ΚΔΦΑΛΑΗΟΤ ............................................................................................................................ 190
ΚΔΦΑΛΑΗΟ 4 ................................................................................................................................................................ 194
ΠΡΟΣΔΗΝΟΜΔΝΟ ΠΡΟΑΡΜΟΣΗΚΟ ΔΛΔΓΚΣΖ ΓΗΑ ΒΔΛΣΗΣΟΠΟΗΖΖ ΣΟΤ ΤΣΖΜΑΣΟ
ΚΔΝΣΡΗΚΖ ΦΤΞΖ ................................................................................................................................................... 194
4.1 ΔΗΑΓΧΓΖ ............................................................................................................................................................. 194 4.2 ΥΔΓΗΑΖ, ΑΡΥΖ ΛΔΗΣΟΤΡΓΗΑ ΚΑΗ ΡΤΘΜΗΖ ΣΟΤ ΠΡΟΣΔΗΝΟΜΔΝΟΤ ΔΛΔΓΚΣΖ ..................................................... 195
4.2.1 Γηαζύλδεζε πξνηεηλόκελνπ ειεγθηή κε ην ζύζηεκα θεληξηθήο ςύμεο ............................................................. 195 4.2.2 Πξνζαξκνζηηθόο έιεγρνο κεηαβιεηήο ξνήο κε βάζε ηα δεδνκέλα ................................................................. 197
4.3 ΔΦΑΡΜΟΓΖ ΠΡΟΣΔΗΝΟΜΔΝΟΤ ΤΣΖΜΑΣΟ ΔΛΔΓΥΟΤ ΣΟ ΠΛΟΗΟ ΤΠΟ ΜΔΛΔΣΖ .................................................. 204 4.4 ΠΔΗΡΑΜΑΣΗΚΑ ΑΠΟΣΔΛΔΜΑΣΑ ΠΡΟΣΔΗΝΟΜΔΝΟΤ ΔΛΔΓΚΣΖ ΣΟ ΣΤΠΗΚΟ ΠΛΟΗΟ ................................................. 212
4.4.1 Γπλακηθή απόθξηζε ειεγθηή ζε δηαθνξεηηθέο ιεηηνπξγηθέο θαηαζηάζεηο ........................................................ 212
4.4.2 Βειηηζηνπνίεζε ηζνδπγίνπ ηζρύνο ζην θεληξηθό ζύζηεκα ςύμεο .................................................................... 214
4.4.3 Δμνηθνλόκεζε ελέξγεηαο θαη θαπζίκνπ κε ηνλ πξνηεηλόκελν ειεγθηή ............................................................ 218
4.5 ΑΝΑΦΟΡΔ ΣΔΣΑΡΣΟΤ ΚΔΦΑΛΑΗΟΤ ....................................................................................................................... 220
ΚΔΦΑΛΑΗΟ 5 ................................................................................................................................................................ 222
ΠΡΟΣΔΗΝΟΜΔΝΟ ΠΡΟΑΡΜΟΣΗΚΟ ΔΛΔΓΚΣΖ ΓΗΑ ΒΔΛΣΗΣΟΠΟΗΖΖ ΣΟΤ ΤΣΖΜΑΣΟ
ΔΞΑΔΡΗΜΟΤ .............................................................................................................................................................. 222
5.1 ΔΗΑΓΧΓΖ ............................................................................................................................................................. 222 5.2 ΥΔΓΗΑΖ, ΑΡΥΖ ΛΔΗΣΟΤΡΓΗΑ ΚΑΗ ΡΤΘΜΗΖ ΣΟΤ ΠΡΟΣΔΗΝΟΜΔΝΟΤ ΔΛΔΓΚΣΖ ..................................................... 223
5.2.1 Γηαζύλδεζε πξνηεηλόκελνπ ειεγθηή κε ην ζύζηεκα εμαεξηζκνύ ..................................................................... 223 5.2.2 Σνπνινγία πξνζαξκνζηηθνύ ειέγρνπ κε βάζε ηα δεδνκέλα ........................................................................... 224
5.2.3 Ρύζκηζε παξακέηξσλ θαη δηάγξακκα ξνήο πξνζαξκνζηηθνύ ειεγθηή ............................................................ 225 5.3 ΔΦΑΡΜΟΓΖ ΠΡΟΣΔΗΝΟΜΔΝΟΤ ΤΣΖΜΑΣΟ ΔΛΔΓΥΟΤ ΣΟ ΠΛΟΗΟ ΤΠΟ ΜΔΛΔΣΖ .................................................. 230 5.4 ΠΔΗΡΑΜΑΣΗΚΑ ΑΠΟΣΔΛΔΜΑΣΑ ΠΡΟΣΔΗΝΟΜΔΝΟΤ ΔΛΔΓΚΣΖ ΣΟ ΣΤΠΗΚΟ ΠΛΟΗΟ ................................................. 237
5.4.1 Γπλακηθή απόθξηζε ειεγθηή ζε δηαθνξεηηθέο ιεηηνπξγηθέο θαηαζηάζεηο ........................................................ 237 5.4.2 Βειηηζηνπνίεζε ηζνδπγίνπ ηζρύνο γηα ην θεληξηθό ζύζηεκα εμαεξηζκνύ ........................................................ 241
5.4.3 Δμνηθνλόκεζε ελέξγεηαο θαη θαπζίκνπ κε ηνλ πξνηεηλόκελν ειεγθηή ............................................................ 242 5.5 ΑΝΑΦΟΡΔ ΠΔΜΠΣΟΤ ΚΔΦΑΛΑΗΟΤ ....................................................................................................................... 245
ΚΔΦΑΛΑΗΟ 6 ................................................................................................................................................................ 248
ΤΣΖΜΑΣΗΚΖ ΜΔΛΔΣΖ ΠΟΗΟΣΖΣΑ ΗΥΤΟ ΓΗΚΣΤΟΤ ΠΛΟΗΧΝ ΓΗΑ ΣΖΝ ΔΦΑΡΜΟΓΖ ΡΤΘΜΗΣΧΝ
ΣΡΟΦΧΝ ..................................................................................................................................................................... 248
6.1 ΔΗΑΓΧΓΖ ............................................................................................................................................................. 248 6.2 ΚΤΡΗΑΡΥΔ ΠΖΓΔ ΑΡΜΟΝΗΚΖ ΠΑΡΑΜΟΡΦΧΖ ΣΟ ΓΗΚΣΤΟ ΠΛΟΗΧΝ ................................................................. 249
6.3 ΣΔΥΝΗΚΔ ΜΔΗΧΖ ΑΡΜΟΝΗΚΖ ΠΑΡΑΜΟΡΦΧΖ ΓΗΑ ΡΤΘΜΗΣΔ ΣΡΟΦΧΝ ....................................................... 251 6.3.1 Τπνινγηζκόο θαη εγθαηάζηαζε απηεπαγσγήο ζηελ πιεπξά ηνπ δηθηύνπ .......................................................... 251
6.3.2 Τπνινγηζκόο θαη εγθαηάζηαζε απηεπαγσγήο ζην dc-link ηνπ ξπζκηζηή ......................................................... 252 6.3.3 Τπνινγηζκόο θαη εγθαηάζηαζε παζεηηθνύ θίιηξνπ ζηελ πιεπξά δηθηύνπ ....................................................... 253
6.3.4 ύγθξηζε κεζόδσλ απνθνπήο αξκνληθώλ γηα ξπζκηζηέο ζηξνθώλ ................................................................ 255 6.4 ΠΡΟΣΔΗΝΟΜΔΝΖ ΜΔΘΟΓΟΛΟΓΗΑ ΠΡΟΓΗΟΡΗΜΟΤ ΠΟΗΟΣΖΣΑ ΗΥΤΟ ΠΛΟΗΟΤ .................................................... 256
6.5 ΔΦΑΡΜΟΓΖ ΠΡΟΣΔΗΝΟΜΔΝΖ ΜΔΘΟΓΟΛΟΓΗΑ ΣΟ ΠΛΟΗΟ ΤΠΟ ΜΔΛΔΣΖ .............................................................. 258 6.6 ΑΞΗΟΛΟΓΖΖ ΑΠΟΣΔΛΔΜΑΣΧΝ ΠΡΟΣΔΗΝΟΜΔΝΖ ΜΔΘΟΓΟΛΟΓΗΑ ΣΟ ΠΛΟΗΟ ................................................... 261
6.6.1 Μεηξήζεηο πνηόηεηαο ηζρύνο κεηά ηελ εθαξκνγή ξπζκηζηώλ ζηξνθώλ .......................................................... 262
6.6.2 Μεηξήζεηο επηπέδνπ πνηόηεηαο ηζρύνο ζην ζεκείν θνηλήο ζύλδεζεο .............................................................. 265 6.7 ΑΝΑΦΟΡΔ ΔΚΣΟΤ ΚΔΦΑΛΑΗΟΤ ............................................................................................................................ 270
ΚΔΦΑΛΑΗΟ 7 ................................................................................................................................................................ 272
ΒΔΛΣΗΣΟΠΟΗΖΖ ΗΟΕΤΓΗΟΤ ΗΥΤΟ ΠΛΟΗΟΤ ΚΑΗ ΚΑΣΑΝΑΛΧΖ ΚΑΤΗΜΟΤ Ζ/Γ –
ΤΜΠΔΡΑΜΑΣΑ ....................................................................................................................................................... 272
7.1 ΔΗΑΓΧΓΖ ............................................................................................................................................................. 272
7.2 ΔΠΗΚΟΠΖΖ ΠΡΟΣΔΗΝΟΜΔΝΖ ΣΟΠΟΛΟΓΗΑ ΚΑΗ ΣΡΑΣΖΓΗΚΖ ΔΛΔΓΥΟΤ ........................................................... 273 7.3 ΤΝΟΦΖ ΑΠΟΣΔΛΔΜΑΣΧΝ Χ ΠΡΟ ΣΖΝ ΔΝΔΡΓΔΗΑΚΖ ΒΔΛΣΗΣΟΠΟΗΖΖ ............................................................ 275
7.3.1 Βειηηζηνπνίεζε θαηαλάισζεο ηζρύνο ζηα θνξηία κε ξπζκηζηή ζηξνθώλ ....................................................... 276 7.3.2 Βειηηζηνπνίεζε θαηαλάισζεο ηζρύνο θαη θαπζίκνπ Ζ/Γ ηππηθνύ πινίνπ ...................................................... 277 7.3.3 πζηεκαηηθή ηερλννηθνλνκηθή κέζνδνο ππνινγηζκνύ εμνηθνλόκεζεο ........................................................... 280
7.3.4 ύλνςε σο πξνο ηα νηθνλνκηθά νθέιε ηεο πξνηεηλόκελεο ηνπνινγίαο .......................................................... 282 7.4 ΤΝΟΦΖ ΤΜΠΔΡΑΜΑΣΧΝ ΓΗΑΣΡΗΒΖ ................................................................................................................ 286 7.5 ΠΡΟΣΑΔΗ ΓΗΑ ΠΔΡΑΗΣΔΡΧ ΜΔΛΔΣΖ ..................................................................................................................... 287 7.6 ΑΝΑΦΟΡΔ ΔΒΓΟΜΟΤ ΚΔΦΑΛΑΗΟΤ ....................................................................................................................... 288
ΠΑΡΑΡΣΖΜΑ ............................................................................................................................................................... 291
ΛΗΣΑ ΚΤΡΗΧΝ ΓΖΜΟΗΔΤΔΧΝ ΓΗΑΣΡΗΒΖ ..................................................................................................... 291

14 Κεθάιαην 1 Δηζαγσγή – Κίλεηξα θαη ζηόρνη Γηαηξηβήο
ΔΙΔΑΚΣΟΡΙΚΗ ΔΙΑΣΡΙΒΗ
ΠΤΡΙΔΩΝ Β. ΓΙΑΝΝΟΤΣΟ
Κεθάιαην 1
Δηζαγσγή – Κίλεηξα θαη ηόρνη Γηαηξηβήο
1.1 Σημαζία εξοικονόμηζηρ καςζίμος ζηα πλοία – Σύγσπονα ππόηςπα
ηελ ζεκεξηλή επνρή, ε πνληνπόξνο λαπηηιία δέρεηαη αζθπθηηθέο πηέζεηο ώζηε λα πξνζθέξεη βηώζηκεο
ιύζεηο κεηαθνξάο αγαζώλ, θπξίσο πεηξειαίνπ θαη παξαγώγσλ ηνπ, μεξνύ θνξηίνπ θαη εκπνξεπκάησλ.
Παξόιν πνπ νη ζαιάζζηεο κεηαθνξέο παξακέλνπλ ην πνην νηθνλνκηθό κέζν κεηαθνξάο, ε λαπηηθή
βηνκεραλία αληηκεησπίδεη ζεκαληηθέο πξνθιήζεηο, πνπ πεξηιακβάλνπλ ην απμεκέλν θόζηνο θαπζίκνπ
(bunker cost), απζηεξόηεξνπο θαλνληζκνύο θαη ειέγρνπο πνηόηεηαο, θαζώο θαη κεγαιύηεξεο πεξηβαιινληηθέο
αλεζπρίεο ζρεηηθά κε ηελ εθπνκπή βιαβεξώλ ξύπσλ.
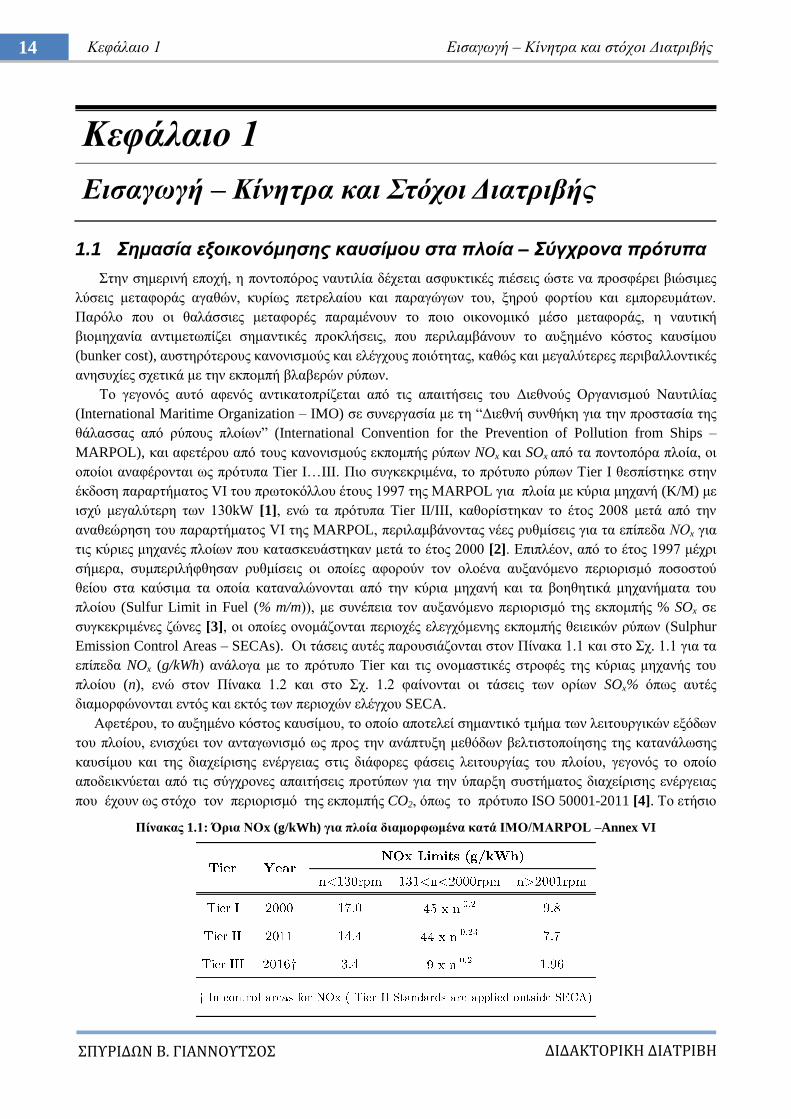
Σν γεγνλόο απηό αθελόο αληηθαηνπξίδεηαη από ηηο απαηηήζεηο ηνπ Γηεζλνύο Οξγαληζκνύ Ναπηηιίαο
(International Maritime Organization – IMO) ζε ζπλεξγαζία κε ηε “Γηεζλή ζπλζήθε γηα ηελ πξνζηαζία ηεο
ζάιαζζαο από ξύπνπο πινίσλ” (International Convention for the Prevention of Pollution from Ships –
MARPOL), θαη αθεηέξνπ από ηνπο θαλνληζκνύο εθπνκπήο ξύπσλ NOx θαη SOx από ηα πνληνπόξα πινία, νη
νπνίνη αλαθέξνληαη σο πξόηππα Tier I…III. Πην ζπγθεθξηκέλα, ην πξόηππν ξύπσλ Σier I ζεζπίζηεθε ζηελ
έθδνζε παξαξηήκαηνο VI ηνπ πξσηνθόιινπ έηνπο 1997 ηεο ΜARPOL γηα πινία κε θύξηα κεραλή (K/M) κε
ηζρύ κεγαιύηεξε ησλ 130kW [1], ελώ ηα πξόηππα Tier II/III, θαζνξίζηεθαλ ην έηνο 2008 κεηά από ηελ
αλαζεώξεζε ηνπ παξαξηήκαηνο VI ηεο MARPOL, πεξηιακβάλνληαο λέεο ξπζκίζεηο γηα ηα επίπεδα ΝΟx γηα
ηηο θύξηεο κεραλέο πινίσλ πνπ θαηαζθεπάζηεθαλ κεηά ην έηνο 2000 [2]. Δπηπιένλ, από ην έηνο 1997 κέρξη
ζήκεξα, ζπκπεξηιήθζεζαλ ξπζκίζεηο νη νπνίεο αθνξνύλ ηνλ νινέλα απμαλόκελν πεξηνξηζκό πνζνζηνύ
ζείνπ ζηα θαύζηκα ηα νπνία θαηαλαιώλνληαη από ηελ θύξηα κεραλή θαη ηα βνεζεηηθά κεραλήκαηα ηνπ
πινίνπ (Sulfur Limit in Fuel (% m/m)), κε ζπλέπεηα ηνλ απμαλόκελν πεξηνξηζκό ηεο εθπνκπήο % SOx ζε
ζπγθεθξηκέλεο δώλεο [3], νη νπνίεο νλνκάδνληαη πεξηνρέο ειεγρόκελεο εθπνκπήο ζεηεηθώλ ξύπσλ (Sulphur
Emission Control Areas – SECAs). Οη ηάζεηο απηέο παξνπζηάδνληαη ζηνλ Πίλαθα 1.1 θαη ζην ρ. 1.1 γηα ηα
επίπεδα NOx (g/kWh) αλάινγα κε ην πξόηππν Tier θαη ηηο νλνκαζηηθέο ζηξνθέο ηεο θύξηαο κεραλήο ηνπ
πινίνπ (n), ελώ ζηνλ Πίλαθα 1.2 θαη ζην ρ. 1.2 θαίλνληαη νη ηάζεηο ησλ νξίσλ SOx% όπσο απηέο
δηακνξθώλνληαη εληόο θαη εθηόο ησλ πεξηνρώλ ειέγρνπ SECA.
Αθεηέξνπ, ην απμεκέλν θόζηνο θαπζίκνπ, ην νπνίν απνηειεί ζεκαληηθό ηκήκα ησλ ιεηηνπξγηθώλ εμόδσλ
ηνπ πινίνπ, εληζρύεη ηνλ αληαγσληζκό σο πξνο ηελ αλάπηπμε κεζόδσλ βειηηζηνπνίεζεο ηεο θαηαλάισζεο
θαπζίκνπ θαη ηεο δηαρείξηζεο ελέξγεηαο ζηηο δηάθνξεο θάζεηο ιεηηνπξγίαο ηνπ πινίνπ, γεγνλόο ην νπνίν
απνδεηθλύεηαη από ηηο ζύγρξνλεο απαηηήζεηο πξνηύπσλ γηα ηελ ύπαξμε ζπζηήκαηνο δηαρείξηζεο ελέξγεηαο
πνπ έρνπλ σο ζηόρν ηνλ πεξηνξηζκό ηεο εθπνκπήο CO2, όπσο ην πξόηππν ISO 50001-2011 [4]. Σν εηήζην
Πίλαθαο 1.1: Όξηα ΝΟx (g/kWh) γηα πινία δηακνξθσκέλα θαηά IMO/MARPOL –Annex VI
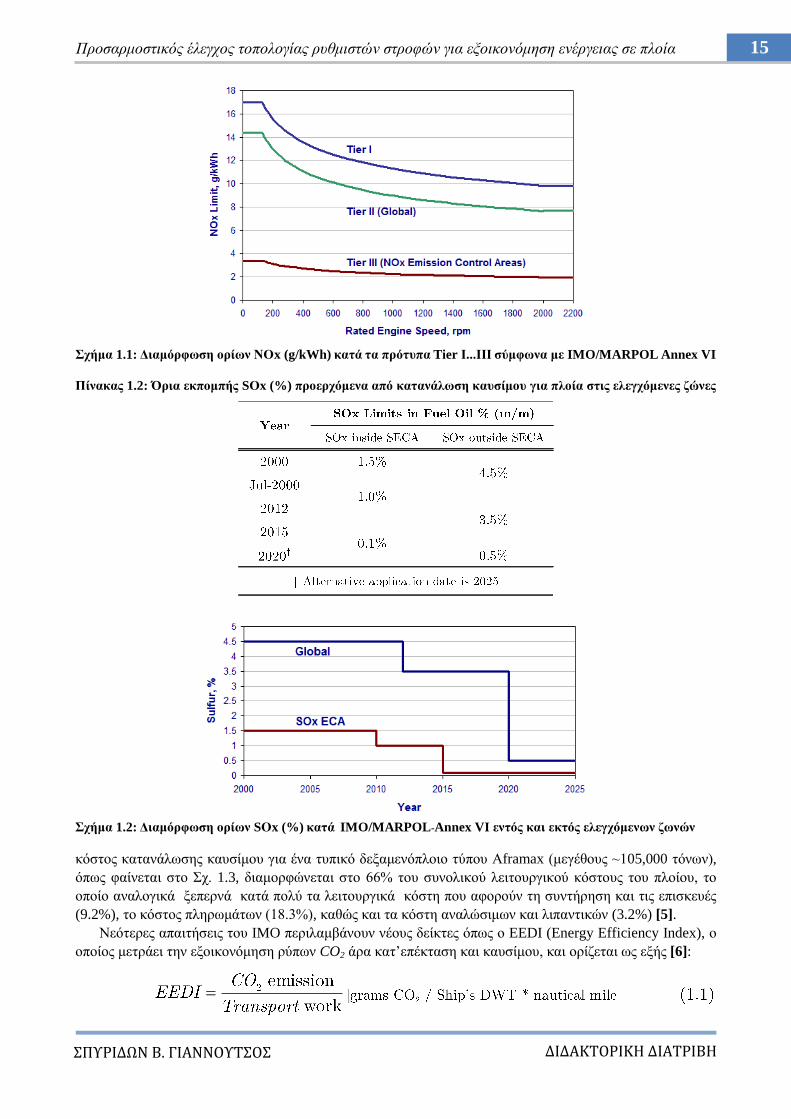
15 Πξνζαξκνζηηθόο έιεγρνο ηνπνινγίαο ξπζκηζηώλ ζηξνθώλ γηα εμνηθνλόκεζε ελέξγεηαο ζε πινία
ΔΙΔΑΚΣΟΡΙΚΗ ΔΙΑΣΡΙΒΗ
ΠΤΡΙΔΩΝ Β. ΓΙΑΝΝΟΤΣΟ
ρήκα 1.1: Γηακόξθσζε νξίσλ ΝΟx (g/kWh) θαηά ηα πξόηππα Tier Ι...ΙΙΙ ζύκθσλα κε IMO/MARPOL Annex VI
Πίλαθαο 1.2: Όξηα εθπνκπήο SΟx (%) πξνεξρόκελα από θαηαλάισζε θαπζίκνπ γηα πινία ζηηο ειεγρόκελεο δώλεο
ρήκα 1.2: Γηακόξθσζε νξίσλ SΟx (%) θαηά IMO/MARPOL-Annex VI εληόο θαη εθηόο ειεγρόκελσλ δσλώλ
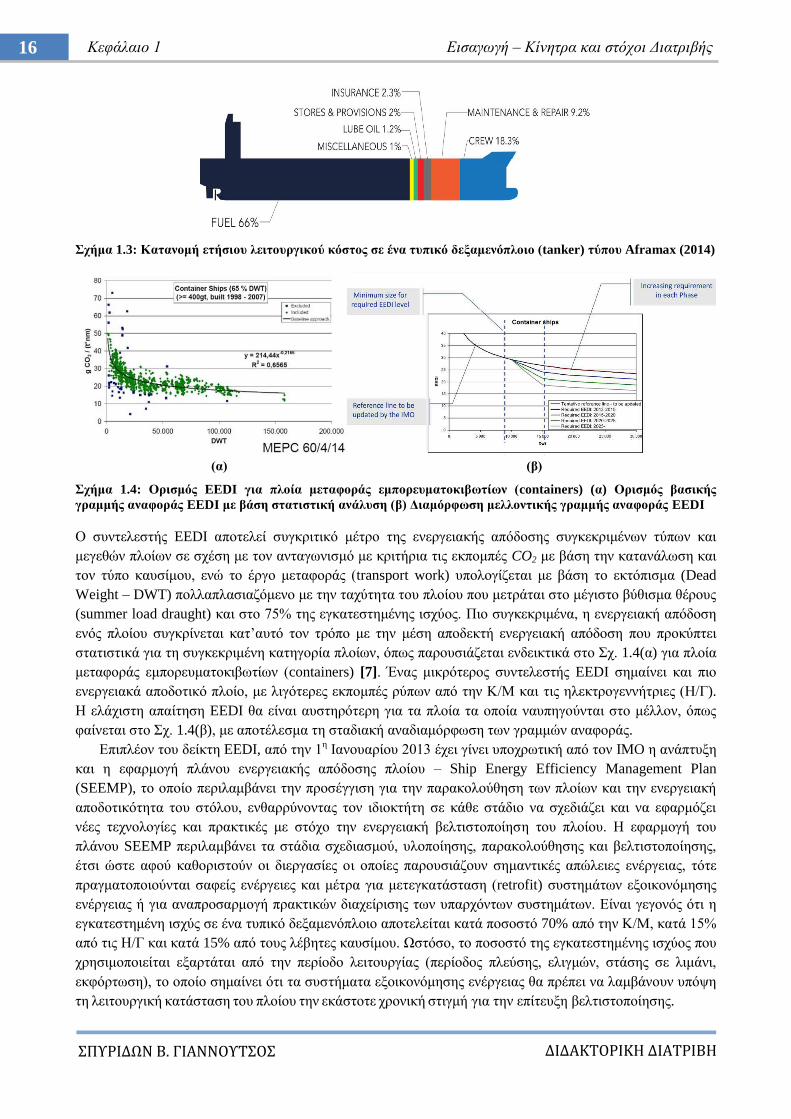
θόζηνο θαηαλάισζεο θαπζίκνπ γηα έλα ηππηθό δεμακελόπινην ηύπνπ Αframax (κεγέζνπο ~105,000 ηόλσλ),
όπσο θαίλεηαη ζην ρ. 1.3, δηακνξθώλεηαη ζην 66% ηνπ ζπλνιηθνύ ιεηηνπξγηθνύ θόζηνπο ηνπ πινίνπ, ην
νπνίν αλαινγηθά μεπεξλά θαηά πνιύ ηα ιεηηνπξγηθά θόζηε πνπ αθνξνύλ ηε ζπληήξεζε θαη ηηο επηζθεπέο
(9.2%), ην θόζηνο πιεξσκάησλ (18.3%), θαζώο θαη ηα θόζηε αλαιώζηκσλ θαη ιηπαληηθώλ (3.2%) [5].
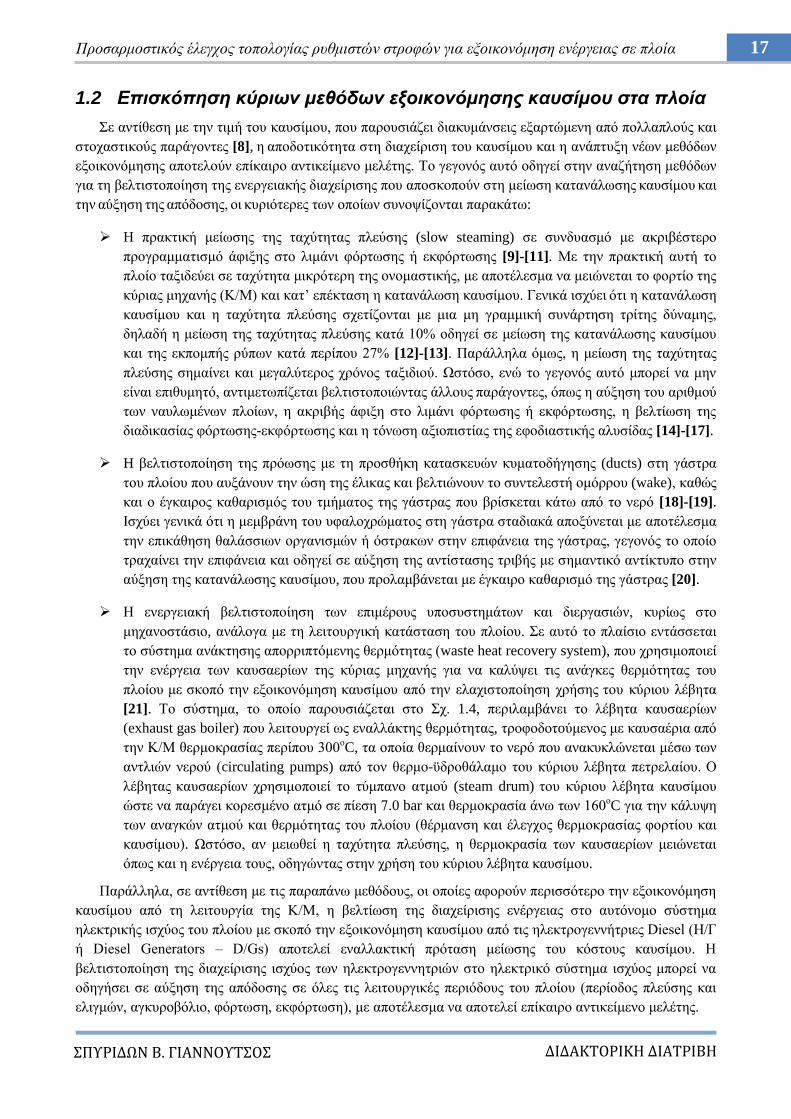
Νεόηεξεο απαηηήζεηο ηνπ IMO πεξηιακβάλνπλ λένπο δείθηεο όπσο ν EEDI (Energy Efficiency Index), ν
νπνίνο κεηξάεη ηελ εμνηθνλόκεζε ξύπσλ CO2 άξα θαη‟επέθηαζε θαη θαπζίκνπ, θαη νξίδεηαη σο εμήο [6]:
16 Κεθάιαην 1 Δηζαγσγή – Κίλεηξα θαη ζηόρνη Γηαηξηβήο
ΔΙΔΑΚΣΟΡΙΚΗ ΔΙΑΣΡΙΒΗ
ΠΤΡΙΔΩΝ Β. ΓΙΑΝΝΟΤΣΟ
ρήκα 1.3: Καηαλνκή εηήζηνπ ιεηηνπξγηθνύ θόζηνο ζε έλα ηππηθό δεμακελόπινην (tanker) ηύπνπ Aframax (2014)
(α) (β)
ρήκα 1.4: Οξηζκόο EEDI γηα πινία κεηαθνξάο εκπνξεπκαηνθηβσηίσλ (containers) (α) Οξηζκόο βαζηθήο
γξακκήο αλαθνξάο EEDI κε βάζε ζηαηηζηηθή αλάιπζε (β) Γηακόξθσζε κειινληηθήο γξακκήο αλαθνξάο EEDI
Ο ζπληειεζηήο EEDI απνηειεί ζπγθξηηηθό κέηξν ηεο ελεξγεηαθήο απόδνζεο ζπγθεθξηκέλσλ ηύπσλ θαη
κεγεζώλ πινίσλ ζε ζρέζε κε ηνλ αληαγσληζκό κε θξηηήξηα ηηο εθπνκπέο CO2 κε βάζε ηελ θαηαλάισζε θαη
ηνλ ηύπν θαπζίκνπ, ελώ ην έξγν κεηαθνξάο (transport work) ππνινγίδεηαη κε βάζε ην εθηόπηζκα (Dead
Weight – DWT) πνιιαπιαζηαδόκελν κε ηελ ηαρύηεηα ηνπ πινίνπ πνπ κεηξάηαη ζην κέγηζην βύζηζκα ζέξνπο
(summer load draught) θαη ζην 75% ηεο εγθαηεζηεκέλεο ηζρύνο. Πην ζπγθεθξηκέλα, ε ελεξγεηαθή απόδνζε
ελόο πινίνπ ζπγθξίλεηαη θαη‟απηό ηνλ ηξόπν κε ηελ κέζε απνδεθηή ελεξγεηαθή απόδνζε πνπ πξνθύπηεη
ζηαηηζηηθά γηα ηε ζπγθεθξηκέλε θαηεγνξία πινίσλ, όπσο παξνπζηάδεηαη ελδεηθηηθά ζην ρ. 1.4(α) γηα πινία
κεηαθνξάο εκπνξεπκαηνθηβσηίσλ (containers) [7]. Έλαο κηθξόηεξνο ζπληειεζηήο EEDI ζεκαίλεη θαη πην
ελεξγεηαθά απνδνηηθό πινίν, κε ιηγόηεξεο εθπνκπέο ξύπσλ από ηελ Κ/Μ θαη ηηο ειεθηξνγελλήηξηεο (Ζ/Γ).
Ζ ειάρηζηε απαίηεζε EEDI ζα είλαη απζηεξόηεξε γηα ηα πινία ηα νπνία λαππεγνύληαη ζην κέιινλ, όπσο
θαίλεηαη ζην ρ. 1.4(β), κε απνηέιεζκα ηε ζηαδηαθή αλαδηακόξθσζε ησλ γξακκώλ αλαθνξάο.
Δπηπιένλ ηνπ δείθηε EEDI, από ηελ 1ε Ηαλνπαξίνπ 2013 έρεη γίλεη ππνρξσηηθή από ηνλ IMO ε αλάπηπμε
θαη ε εθαξκνγή πιάλνπ ελεξγεηαθήο απόδνζεο πινίνπ – Ship Energy Efficiency Management Plan
(SEEMP), ην νπνίν πεξηιακβάλεη ηελ πξνζέγγηζε γηα ηελ παξαθνινύζεζε ησλ πινίσλ θαη ηελ ελεξγεηαθή
απνδνηηθόηεηα ηνπ ζηόινπ, ελζαξξύλνληαο ηνλ ηδηνθηήηε ζε θάζε ζηάδην λα ζρεδηάδεη θαη λα εθαξκόδεη
λέεο ηερλνινγίεο θαη πξαθηηθέο κε ζηόρν ηελ ελεξγεηαθή βειηηζηνπνίεζε ηνπ πινίνπ. Ζ εθαξκνγή ηνπ
πιάλνπ SEEMP πεξηιακβάλεη ηα ζηάδηα ζρεδηαζκνύ, πινπνίεζεο, παξαθνινύζεζεο θαη βειηηζηνπνίεζεο,
έηζη ώζηε αθνύ θαζνξηζηνύλ νη δηεξγαζίεο νη νπνίεο παξνπζηάδνπλ ζεκαληηθέο απώιεηεο ελέξγεηαο, ηόηε
πξαγκαηνπνηνύληαη ζαθείο ελέξγεηεο θαη κέηξα γηα κεηεγθαηάζηαζε (retrofit) ζπζηεκάησλ εμνηθνλόκεζεο
ελέξγεηαο ή γηα αλαπξνζαξκνγή πξαθηηθώλ δηαρείξηζεο ησλ ππαξρόλησλ ζπζηεκάησλ. Δίλαη γεγνλόο όηη ε
εγθαηεζηεκέλε ηζρύο ζε έλα ηππηθό δεμακελόπινην απνηειείηαη θαηά πνζνζηό 70% από ηελ Κ/Μ, θαηά 15%
από ηηο Ζ/Γ θαη θαηά 15% από ηνπο ιέβεηεο θαπζίκνπ. Χζηόζν, ην πνζνζηό ηεο εγθαηεζηεκέλεο ηζρύνο πνπ
ρξεζηκνπνηείηαη εμαξηάηαη από ηελ πεξίνδν ιεηηνπξγίαο (πεξίνδνο πιεύζεο, ειηγκώλ, ζηάζεο ζε ιηκάλη,
εθθόξησζε), ην νπνίν ζεκαίλεη όηη ηα ζπζηήκαηα εμνηθνλόκεζεο ελέξγεηαο ζα πξέπεη λα ιακβάλνπλ ππόςε
ηε ιεηηνπξγηθή θαηάζηαζε ηνπ πινίνπ ηελ εθάζηνηε ρξνληθή ζηηγκή γηα ηελ επίηεπμε βειηηζηνπνίεζεο.
17 Πξνζαξκνζηηθόο έιεγρνο ηνπνινγίαο ξπζκηζηώλ ζηξνθώλ γηα εμνηθνλόκεζε ελέξγεηαο ζε πινία
ΔΙΔΑΚΣΟΡΙΚΗ ΔΙΑΣΡΙΒΗ
ΠΤΡΙΔΩΝ Β. ΓΙΑΝΝΟΤΣΟ
1.2 Δπιζκόπηζη κύπιυν μεθόδυν εξοικονόμηζηρ καςζίμος ζηα πλοία
ε αληίζεζε κε ηελ ηηκή ηνπ θαπζίκνπ, πνπ παξνπζηάδεη δηαθπκάλζεηο εμαξηώκελε από πνιιαπινύο θαη
ζηνραζηηθνύο παξάγνληεο [8], ε απνδνηηθόηεηα ζηε δηαρείξηζε ηνπ θαπζίκνπ θαη ε αλάπηπμε λέσλ κεζόδσλ
εμνηθνλόκεζεο απνηεινύλ επίθαηξν αληηθείκελν κειέηεο. To γεγνλόο απηό νδεγεί ζηελ αλαδήηεζε κεζόδσλ
γηα ηε βειηηζηνπνίεζε ηεο ελεξγεηαθήο δηαρείξηζεο πνπ απνζθνπνύλ ζηε κείσζε θαηαλάισζεο θαπζίκνπ θαη
ηελ αύμεζε ηεο απόδνζεο, νη θπξηόηεξεο ησλ νπνίσλ ζπλνςίδνληαη παξαθάησ:
Ζ πξαθηηθή κείσζεο ηεο ηαρύηεηαο πιεύζεο (slow steaming) ζε ζπλδπαζκό κε αθξηβέζηεξν
πξνγξακκαηηζκό άθημεο ζην ιηκάλη θόξησζεο ή εθθόξησζεο [9]-[11]. Με ηελ πξαθηηθή απηή ην
πινίν ηαμηδεύεη ζε ηαρύηεηα κηθξόηεξε ηεο νλνκαζηηθήο, κε απνηέιεζκα λα κεηώλεηαη ην θνξηίν ηεο
θύξηαο κεραλήο (Κ/Μ) θαη θαη‟ επέθηαζε ε θαηαλάισζε θαπζίκνπ. Γεληθά ηζρύεη όηη ε θαηαλάισζε
θαπζίκνπ θαη ε ηαρύηεηα πιεύζεο ζρεηίδνληαη κε κηα κε γξακκηθή ζπλάξηεζε ηξίηεο δύλακεο,
δειαδή ε κείσζε ηεο ηαρύηεηαο πιεύζεο θαηά 10% νδεγεί ζε κείσζε ηεο θαηαλάισζεο θαπζίκνπ
θαη ηεο εθπνκπήο ξύπσλ θαηά πεξίπνπ 27% [12]-[13]. Παξάιιεια όκσο, ε κείσζε ηεο ηαρύηεηαο
πιεύζεο ζεκαίλεη θαη κεγαιύηεξνο ρξόλνο ηαμηδηνύ. Χζηόζν, ελώ ην γεγνλόο απηό κπνξεί λα κελ
είλαη επηζπκεηό, αληηκεησπίδεηαη βειηηζηνπνηώληαο άιινπο παξάγνληεο, όπσο ε αύμεζε ηνπ αξηζκνύ
ησλ λαπισκέλσλ πινίσλ, ε αθξηβήο άθημε ζην ιηκάλη θόξησζεο ή εθθόξησζεο, ε βειηίσζε ηεο
δηαδηθαζίαο θόξησζεο-εθθόξησζεο θαη ε ηόλσζε αμηνπηζηίαο ηεο εθνδηαζηηθήο αιπζίδαο [14]-[17].
H βειηηζηνπνίεζε ηεο πξόσζεο κε ηε πξνζζήθε θαηαζθεπώλ θπκαηνδήγεζεο (ducts) ζηε γάζηξα
ηνπ πινίνπ πνπ απμάλνπλ ηελ ώζε ηεο έιηθαο θαη βειηηώλνπλ ην ζπληειεζηή νκόξξνπ (wake), θαζώο
θαη ν έγθαηξνο θαζαξηζκόο ηνπ ηκήκαηνο ηεο γάζηξαο πνπ βξίζθεηαη θάησ από ην λεξό [18]-[19].
Ηζρύεη γεληθά όηη ε κεκβξάλε ηνπ πθαινρξώκαηνο ζηε γάζηξα ζηαδηαθά απνμύλεηαη κε απνηέιεζκα
ηελ επηθάζεζε ζαιάζζησλ νξγαληζκώλ ή όζηξαθσλ ζηελ επηθάλεηα ηεο γάζηξαο, γεγνλόο ην νπνίν
ηξαραίλεη ηελ επηθάλεηα θαη νδεγεί ζε αύμεζε ηεο αληίζηαζεο ηξηβήο κε ζεκαληηθό αληίθηππν ζηελ
αύμεζε ηεο θαηαλάισζεο θαπζίκνπ, πνπ πξνιακβάλεηαη κε έγθαηξν θαζαξηζκό ηεο γάζηξαο [20].
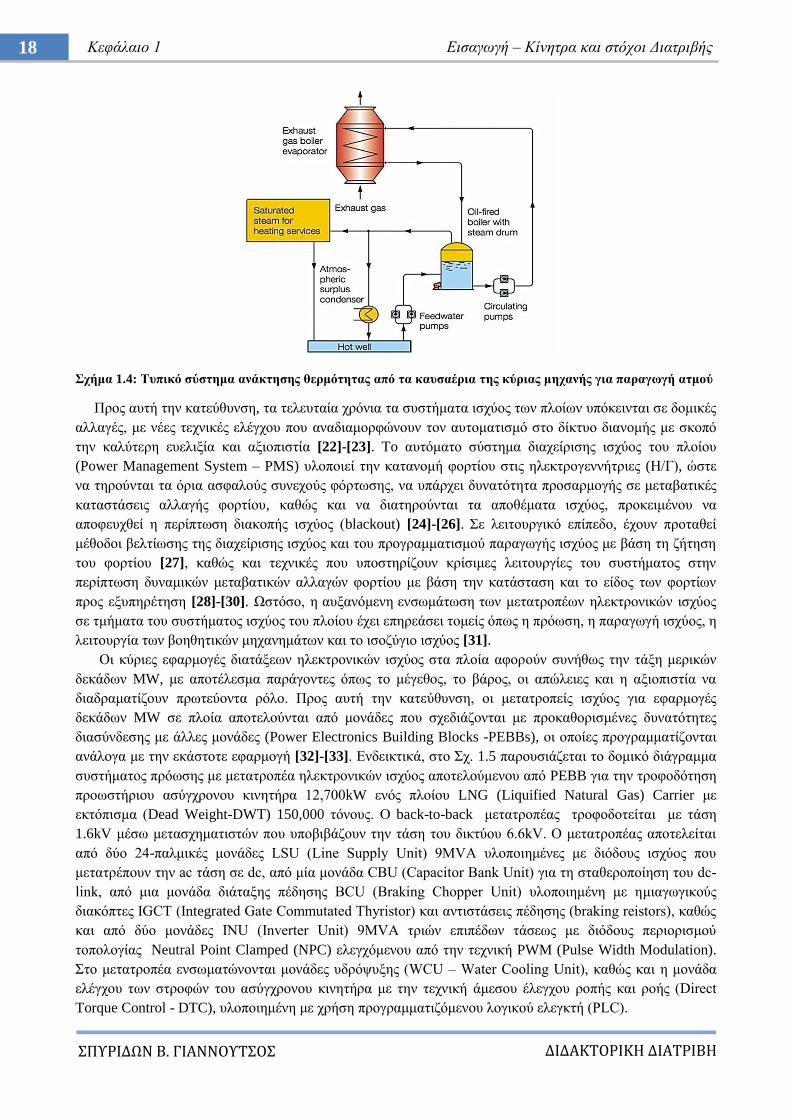
Ζ ελεξγεηαθή βειηηζηνπνίεζε ησλ επηκέξνπο ππνζπζηεκάησλ θαη δηεξγαζηώλ, θπξίσο ζην
κεραλνζηάζην, αλάινγα κε ηε ιεηηνπξγηθή θαηάζηαζε ηνπ πινίνπ. ε απηό ην πιαίζην εληάζζεηαη
ην ζύζηεκα αλάθηεζεο απνξξηπηόκελεο ζεξκόηεηαο (waste heat recovery system), πνπ ρξεζηκνπνηεί
ηελ ελέξγεηα ησλ θαπζαεξίσλ ηεο θύξηαο κεραλήο γηα λα θαιύςεη ηηο αλάγθεο ζεξκόηεηαο ηνπ
πινίνπ κε ζθνπό ηελ εμνηθνλόκεζε θαπζίκνπ από ηελ ειαρηζηνπνίεζε ρξήζεο ηνπ θύξηνπ ιέβεηα
[21]. Σν ζύζηεκα, ην νπνίν παξνπζηάδεηαη ζην ρ. 1.4, πεξηιακβάλεη ην ιέβεηα θαπζαεξίσλ
(exhaust gas boiler) πνπ ιεηηνπξγεί σο ελαιιάθηεο ζεξκόηεηαο, ηξνθνδνηoύκελνο κε θαπζαέξηα από
ηελ Κ/Μ ζεξκνθξαζίαο πεξίπνπ 300νC, ηα νπνία ζεξκαίλνπλ ην λεξό πνπ αλαθπθιώλεηαη κέζσ ησλ
αληιηώλ λεξνύ (circulating pumps) από ηνλ ζεξκν-ϋδξνζάιακν ηνπ θύξηνπ ιέβεηα πεηξειαίνπ. Ο
ιέβεηαο θαπζαεξίσλ ρξεζηκνπνηεί ην ηύκπαλν αηκνύ (steam drum) ηνπ θύξηνπ ιέβεηα θαπζίκνπ
ώζηε λα παξάγεη θνξεζκέλν αηκό ζε πίεζε 7.0 bar θαη ζεξκνθξαζία άλσ ησλ 160νC γηα ηελ θάιπςε
ησλ αλαγθώλ αηκνύ θαη ζεξκόηεηαο ηνπ πινίνπ (ζέξκαλζε θαη έιεγρνο ζεξκνθξαζίαο θνξηίνπ θαη
θαπζίκνπ). Χζηόζν, αλ κεησζεί ε ηαρύηεηα πιεύζεο, ε ζεξκνθξαζία ησλ θαπζαεξίσλ κεηώλεηαη
όπσο θαη ε ελέξγεηα ηνπο, νδεγώληαο ζηελ ρξήζε ηνπ θύξηνπ ιέβεηα θαπζίκνπ.
Παξάιιεια, ζε αληίζεζε κε ηηο παξαπάλσ κεζόδνπο, νη νπνίεο αθνξνύλ πεξηζζόηεξν ηελ εμνηθνλόκεζε
θαπζίκνπ από ηε ιεηηνπξγία ηεο Κ/Μ, ε βειηίσζε ηεο δηαρείξηζεο ελέξγεηαο ζην απηόλνκν ζύζηεκα
ειεθηξηθήο ηζρύνο ηνπ πινίνπ κε ζθνπό ηελ εμνηθνλόκεζε θαπζίκνπ από ηηο ειεθηξνγελλήηξηεο Diesel (Ζ/Γ
ή Diesel Generators – D/Gs) απνηειεί ελαιιαθηηθή πξόηαζε κείσζεο ηνπ θόζηνπο θαπζίκνπ. Ζ
βειηηζηνπνίεζε ηεο δηαρείξηζεο ηζρύνο ησλ ειεθηξνγελλεηξηώλ ζην ειεθηξηθό ζύζηεκα ηζρύνο κπνξεί λα
νδεγήζεη ζε αύμεζε ηεο απόδνζεο ζε όιεο ηηο ιεηηνπξγηθέο πεξηόδνπο ηνπ πινίνπ (πεξίνδνο πιεύζεο θαη
ειηγκώλ, αγθπξνβόιην, θόξησζε, εθθόξησζε), κε απνηέιεζκα λα απνηειεί επίθαηξν αληηθείκελν κειέηεο.
18 Κεθάιαην 1 Δηζαγσγή – Κίλεηξα θαη ζηόρνη Γηαηξηβήο
ΔΙΔΑΚΣΟΡΙΚΗ ΔΙΑΣΡΙΒΗ
ΠΤΡΙΔΩΝ Β. ΓΙΑΝΝΟΤΣΟ
ρήκα 1.4: Σππηθό ζύζηεκα αλάθηεζεο ζεξκόηεηαο από ηα θαπζαέξηα ηεο θύξηαο κεραλήο γηα παξαγσγή αηκνύ
Πξνο απηή ηελ θαηεύζπλζε, ηα ηειεπηαία ρξόληα ηα ζπζηήκαηα ηζρύνο ησλ πινίσλ ππόθεηληαη ζε δνκηθέο
αιιαγέο, κε λέεο ηερληθέο ειέγρνπ πνπ αλαδηακνξθώλνπλ ηνλ απηνκαηηζκό ζην δίθηπν δηαλνκήο κε ζθνπό
ηελ θαιύηεξε επειημία θαη αμηνπηζηία [22]-[23]. To απηόκαην ζύζηεκα δηαρείξηζεο ηζρύνο ηνπ πινίνπ
(Power Management System – PMS) πινπνηεί ηελ θαηαλνκή θνξηίνπ ζηηο ειεθηξνγελλήηξηεο (Ζ/Γ), ώζηε
λα ηεξνύληαη ηα όξηα αζθαινύο ζπλερνύο θόξησζεο, λα ππάξρεη δπλαηόηεηα πξνζαξκνγήο ζε κεηαβαηηθέο
θαηαζηάζεηο αιιαγήο θνξηίνπ, θαζώο θαη λα δηαηεξνύληαη ηα απνζέκαηα ηζρύνο, πξνθεηκέλνπ λα
απνθεπρζεί ε πεξίπησζε δηαθνπήο ηζρύνο (blackout) [24]-[26]. ε ιεηηνπξγηθό επίπεδν, έρνπλ πξνηαζεί
κέζνδνη βειηίσζεο ηεο δηαρείξηζεο ηζρύνο θαη ηνπ πξνγξακκαηηζκνύ παξαγσγήο ηζρύνο κε βάζε ηε δήηεζε
ηνπ θνξηίνπ [27], θαζώο θαη ηερληθέο πνπ ππνζηεξίδνπλ θξίζηκεο ιεηηνπξγίεο ηνπ ζπζηήκαηνο ζηελ
πεξίπησζε δπλακηθώλ κεηαβαηηθώλ αιιαγώλ θνξηίνπ κε βάζε ηελ θαηάζηαζε θαη ην είδνο ησλ θνξηίσλ
πξνο εμππεξέηεζε [28]-[30]. Χζηόζν, ε απμαλόκελε ελζσκάησζε ησλ κεηαηξνπέσλ ειεθηξνληθώλ ηζρύνο
ζε ηκήκαηα ηνπ ζπζηήκαηνο ηζρύνο ηνπ πινίνπ έρεη επεξεάζεη ηνκείο όπσο ε πξόσζε, ε παξαγσγή ηζρύνο, ε
ιεηηνπξγία ησλ βνεζεηηθώλ κεραλεκάησλ θαη ην ηζνδύγην ηζρύνο [31].
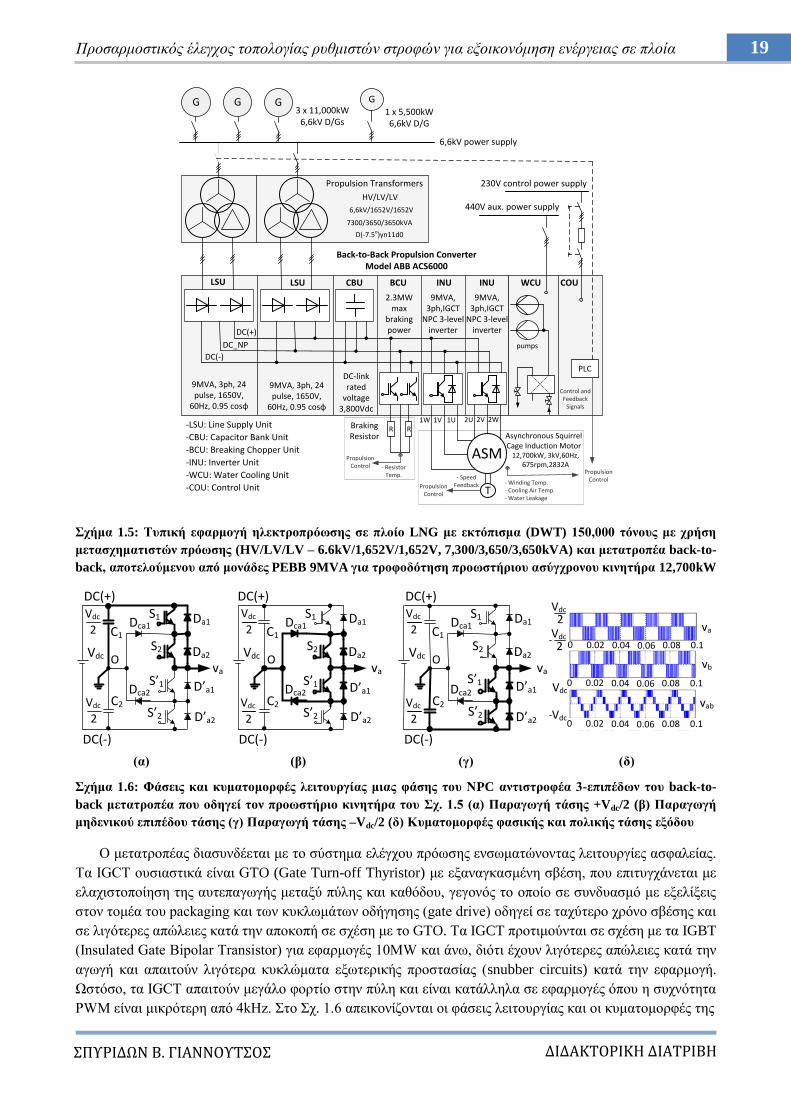
Οη θύξηεο εθαξκνγέο δηαηάμεσλ ειεθηξνληθώλ ηζρύνο ζηα πινία αθνξνύλ ζπλήζσο ηελ ηάμε κεξηθώλ
δεθάδσλ MW, κε απνηέιεζκα παξάγνληεο όπσο ην κέγεζνο, ην βάξνο, νη απώιεηεο θαη ε αμηνπηζηία λα
δηαδξακαηίδνπλ πξσηεύνληα ξόιν. Πξνο απηή ηελ θαηεύζπλζε, νη κεηαηξνπείο ηζρύνο γηα εθαξκνγέο
δεθάδσλ MW ζε πινία απνηεινύληαη από κνλάδεο πνπ ζρεδηάδνληαη κε πξνθαζνξηζκέλεο δπλαηόηεηεο
δηαζύλδεζεο κε άιιεο κνλάδεο (Power Electronics Building Blocks -PEBBs), νη νπνίεο πξνγξακκαηίδνληαη
αλάινγα κε ηελ εθάζηνηε εθαξκνγή [32]-[33]. Δλδεηθηηθά, ζην ρ. 1.5 παξνπζηάδεηαη ην δνκηθό δηάγξακκα
ζπζηήκαηνο πξόσζεο κε κεηαηξνπέα ειεθηξνληθώλ ηζρύνο απνηεινύκελνπ από PEBB γηα ηελ ηξνθνδόηεζε
πξνσζηήξηνπ αζύγρξνλνπ θηλεηήξα 12,700kW ελόο πινίνπ LNG (Liquified Natural Gas) Carrier κε
εθηόπηζκα (Dead Weight-DWT) 150,000 ηόλνπο. Ο back-to-back κεηαηξνπέαο ηξνθνδνηείηαη κε ηάζε
1.6kV κέζσ κεηαζρεκαηηζηώλ πνπ ππνβηβάδνπλ ηελ ηάζε ηνπ δηθηύνπ 6.6kV. Ο κεηαηξνπέαο απνηειείηαη
από δύν 24-παικηθέο κνλάδεο LSU (Line Supply Unit) 9MVA πινπνηεκέλεο κε δηόδνπο ηζρύνο πνπ
κεηαηξέπνπλ ηελ ac ηάζε ζε dc, από κία κνλάδα CBU (Capacitor Bank Unit) γηα ηε ζηαζεξνπνίεζε ηνπ dc-
link, από κηα κνλάδα δηάηαμεο πέδεζεο ΒCU (Braking Chopper Unit) πινπνηεκέλε κε εκηαγσγηθνύο
δηαθόπηεο IGCT (Integrated Gate Commutated Thyristor) θαη αληηζηάζεηο πέδεζεο (braking reistors), θαζώο
θαη από δύν κνλάδεο INU (Inverter Unit) 9MVA ηξηώλ επηπέδσλ ηάζεσο κε δηόδνπο πεξηνξηζκνύ
ηνπνινγίαο Neutral Point Clamped (NPC) ειεγρόκελνπ από ηελ ηερληθή PWM (Pulse Width Modulation).
ην κεηαηξνπέα ελζσκαηώλνληαη κνλάδεο πδξόςπμεο (WCU – Water Cooling Unit), θαζώο θαη ε κνλάδα
ειέγρνπ ησλ ζηξνθώλ ηνπ αζύγρξνλνπ θηλεηήξα κε ηελ ηερληθή άκεζνπ έιεγρνπ ξνπήο θαη ξνήο (Direct
Torque Control - DTC), πινπνηεκέλε κε ρξήζε πξνγξακκαηηδόκελνπ ινγηθνύ ειεγθηή (PLC).
19 Πξνζαξκνζηηθόο έιεγρνο ηνπνινγίαο ξπζκηζηώλ ζηξνθώλ γηα εμνηθνλόκεζε ελέξγεηαο ζε πινία
ΔΙΔΑΚΣΟΡΙΚΗ ΔΙΑΣΡΙΒΗ
ΠΤΡΙΔΩΝ Β. ΓΙΑΝΝΟΤΣΟ
ρήκα 1.5: Σππηθή εθαξκνγή ειεθηξνπξόσζεο ζε πινίν LNG κε εθηόπηζκα (DWT) 150,000 ηόλνπο κε ρξήζε
κεηαζρεκαηηζηώλ πξόσζεο (HV/LV/LV – 6.6kV/1,652V/1,652V, 7,300/3,650/3,650kVA) θαη κεηαηξνπέα back-to-
back, απνηεινύκελνπ από κνλάδεο PEBB 9MVA γηα ηξνθνδόηεζε πξνσζηήξηνπ αζύγρξνλνπ θηλεηήξα 12,700kW
(α) (β) (γ) (δ)
ρήκα 1.6: Φάζεηο θαη θπκαηνκνξθέο ιεηηνπξγίαο κηαο θάζεο ηνπ ΝPC αληηζηξνθέα 3-επηπέδσλ ηνπ back-to-
back κεηαηξνπέα πνπ νδεγεί ηνλ πξνσζηήξην θηλεηήξα ηνπ ρ. 1.5 (α) Παξαγσγή ηάζεο +Vdc/2 (β) Παξαγσγή
κεδεληθνύ επηπέδνπ ηάζεο (γ) Παξαγσγή ηάζεο –Vdc/2 (δ) Κπκαηνκνξθέο θαζηθήο θαη πνιηθήο ηάζεο εμόδνπ
Ο κεηαηξνπέαο δηαζπλδέεηαη κε ην ζύζηεκα ειέγρνπ πξόσζεο ελζσκαηώλνληαο ιεηηνπξγίεο αζθαιείαο.
Σα IGCT νπζηαζηηθά είλαη GTO (Gate Turn-off Thyristor) κε εμαλαγθαζκέλε ζβέζε, πνπ επηηπγράλεηαη κε
ειαρηζηνπνίεζε ηεο απηεπαγσγήο κεηαμύ πύιεο θαη θαζόδνπ, γεγνλόο ην νπνίν ζε ζπλδπαζκό κε εμειίμεηο
ζηνλ ηνκέα ηνπ packaging θαη ησλ θπθισκάησλ νδήγεζεο (gate drive) νδεγεί ζε ηαρύηεξν ρξόλν ζβέζεο θαη
ζε ιηγόηεξεο απώιεηεο θαηά ηελ απνθνπή ζε ζρέζε κε ην GTO. Σα IGCT πξνηηκνύληαη ζε ζρέζε κε ηα IGBT
(Insulated Gate Bipolar Transistor) γηα εθαξκνγέο 10MW θαη άλσ, δηόηη έρνπλ ιηγόηεξεο απώιεηεο θαηά ηελ
αγσγή θαη απαηηνύλ ιηγόηεξα θπθιώκαηα εμσηεξηθήο πξνζηαζίαο (snubber circuits) θαηά ηελ εθαξκνγή.
Χζηόζν, ηα IGCT απαηηνύλ κεγάιν θνξηίν ζηελ πύιε θαη είλαη θαηάιιεια ζε εθαξκνγέο όπνπ ε ζπρλόηεηα
PWM είλαη κηθξόηεξε από 4kHz. ην ρ. 1.6 απεηθνλίδνληαη νη θάζεηο ιεηηνπξγίαο θαη νη θπκαηνκνξθέο ηεο
G G
Propulsion Transformers
6,6kV/1652V/1652V
HV/LV/LV
7300/3650/3650kVA
D(-7.5o)yn11d0
G G
DC(+)
DC(-)
R R
DC_NP
ASM
1U1V1W 2U 2V 2W
12,700kW, 3kV,60Hz, 675rpm,2832A
Asynchronous Squirrel Cage Induction Motor
9MVA, 3ph, 24 pulse, 1650V,
60Hz, 0.95 cosφ
LSU LSU
9MVA, 3ph,IGCT
NPC 3-level inverter
INU INU
9MVA, 3ph, 24 pulse, 1650V,
60Hz, 0.95 cosφ
9MVA, 3ph,IGCT
NPC 3-level inverter
CBU
DC-link rated
voltage 3,800Vdc
BCU
2.3MW max
braking power
Braking Resistor
- Resistor Temp.
- Winding Temp.- Cooling Air Temp.- Water Leakage
PropulsionControl
PropulsionControl
TPropulsion
Control
- Speed Feedback
Back-to-Back Propulsion Converter Model ABB ACS6000
-LSU: Line Supply Unit
-CBU: Capacitor Bank Unit
-BCU: Breaking Chopper Unit
-INU: Inverter Unit
-WCU: Water Cooling Unit
-COU: Control Unit
WCU COU
pumps
6,6kV power supply
440V aux. power supply
230V control power supply
PLC
Control and Feedback
Signals
3 x 11,000kW6,6kV D/Gs
1 x 5,500kW6,6kV D/G
DC(+)
DC(-)
O
C1
C2
Vdc
Dca1
Dca2
S1
S2
S’1
S’2
va
Da1
Da2
D’a1
D’a2
DC(+)
DC(-)
O
C1
C2
Vdc
Dca1
Dca2
S1
S2
S’1
S’2
va
Da1
Da2
D’a1
D’a2
DC(+)
DC(-)
O
C1
C2
Vdc
Dca1
Dca2
S1
S2
S’1
S’2
va
Da1
Da2
D’a1
D’a2
Vdc
2
Vdc
2
Vdc
2
Vdc
2
Vdc
2
Vdc
2
va
vb
vab
Vdc
2
0.02 0.04 0.06 0.08 0.10
0.02 0.04 0.06 0.08 0.10
0.02 0.04 0.06 0.08 0.10
Vdc
2
Vdc
Vdc
20 Κεθάιαην 1 Δηζαγσγή – Κίλεηξα θαη ζηόρνη Γηαηξηβήο
ΔΙΔΑΚΣΟΡΙΚΗ ΔΙΑΣΡΙΒΗ
ΠΤΡΙΔΩΝ Β. ΓΙΑΝΝΟΤΣΟ
(δ)
ρήκα 1.7: Σππηθή δηάηαμε ειεθηξνληθώλ ηζρύνο γηα δηαζύλδεζε γελλήηξηαο άμνλα κε ην ειεθηξηθό δίθηπν ηνπ
πινίνπ (α) Σνπνινγία δηαζύλδεζεο γελλήηξηαο (β) Έιεγρνο ελεξγνύ ηζρύνο ζηνλ dc/dc κεηαηξνπέα κέζσ ηεο
ηερληθήο PWM (γ) Έιεγρνο άεξγνπ ηζρύνο θαη ηάζεσο ζην dc-link ηνπ αληηζηξνθέα κέζσ ηεο ηερληθήο SV-PWM
ηάζεο εμόδνπ γηα κηα θάζε ηνπ NPC αληηζηξνθέα ηξηώλ επηπέδσλ ηεο κνλάδαο INU ηνπ πξνσζηήξηνπ
κεηαηξνπέα. Όπσο θαίλεηαη θαη ζην ρ. 1.6, γηα λα παξάγεη ν αληηζηξνθέαο ζηελ έμνδό ηνπ ηάζε +Vdc/2
πξέπεη λα άγνπλ είηε νη δηαθόπηεο S1, S2 είηε νη δίνδνη Da1, Da2. Γηα λα παξάγεη ζηελ έμνδν κεδεληθό επίπεδν
ηάζεο, πξέπεη λα άγνπλ ηαπηόρξνλα ηα εκηαγσγηθά ζηνηρεία Dca1, S2, S1’ θαη Dca2. Σέινο, γηα λα παξάγεη
ζηελ έμνδν ηάζε -Vdc/2 πξέπεη λα άγνπλ είηε νη δηαθόπηεο S1’, S2‟ είηε νη αληίζηνηρεο δίνδνη Da1’, Da2’.
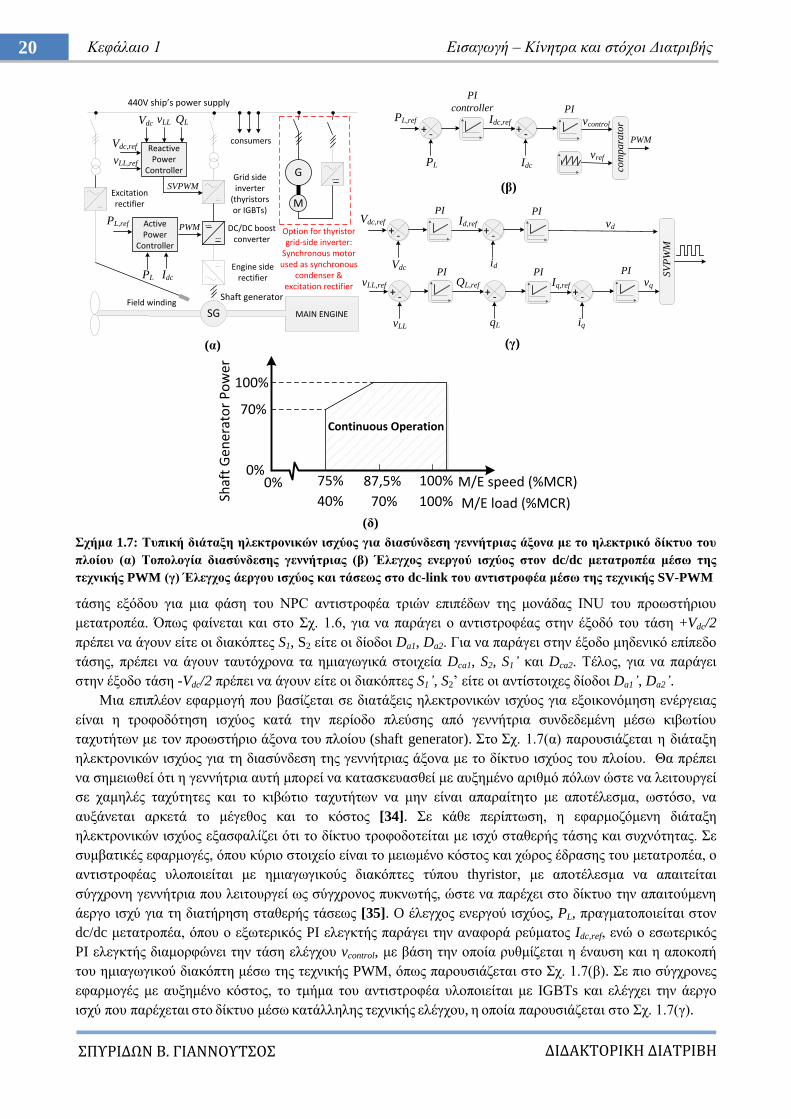
Μηα επηπιένλ εθαξκνγή πνπ βαζίδεηαη ζε δηαηάμεηο ειεθηξνληθώλ ηζρύνο γηα εμνηθνλόκεζε ελέξγεηαο
είλαη ε ηξνθνδόηεζε ηζρύνο θαηά ηελ πεξίνδν πιεύζεο από γελλήηξηα ζπλδεδεκέλε κέζσ θηβσηίνπ
ηαρπηήησλ κε ηνλ πξνσζηήξην άμνλα ηνπ πινίνπ (shaft generator). ην ρ. 1.7(α) παξνπζηάδεηαη ε δηάηαμε
ειεθηξνληθώλ ηζρύνο γηα ηε δηαζύλδεζε ηεο γελλήηξηαο άμνλα κε ην δίθηπo ηζρύνο ηνπ πινίνπ. Θα πξέπεη
λα ζεκεησζεί όηη ε γελλήηξηα απηή κπνξεί λα θαηαζθεπαζζεί κε απμεκέλν αξηζκό πόισλ ώζηε λα ιεηηνπξγεί
ζε ρακειέο ηαρύηεηεο θαη ην θηβώηην ηαρπηήησλ λα κελ είλαη απαξαίηεην κε απνηέιεζκα, σζηόζν, λα
απμάλεηαη αξθεηά ην κέγεζνο θαη ην θόζηνο [34]. ε θάζε πεξίπησζε, ε εθαξκνδόκελε δηάηαμε
ειεθηξνληθώλ ηζρύνο εμαζθαιίδεη όηη ην δίθηπν ηξνθνδνηείηαη κε ηζρύ ζηαζεξήο ηάζεο θαη ζπρλόηεηαο. ε
ζπκβαηηθέο εθαξκνγέο, όπνπ θύξην ζηνηρείν είλαη ην κεησκέλν θόζηνο θαη ρώξνο έδξαζεο ηνπ κεηαηξνπέα, ν
αληηζηξνθέαο πινπνηείηαη κε εκηαγσγηθνύο δηαθόπηεο ηύπνπ thyristor, κε απνηέιεζκα λα απαηηείηαη
ζύγρξνλε γελλήηξηα πνπ ιεηηνπξγεί σο ζύγρξνλνο ππθλσηήο, ώζηε λα παξέρεη ζην δίθηπν ηελ απαηηνύκελε
άεξγν ηζρύ γηα ηε δηαηήξεζε ζηαζεξήο ηάζεσο [35]. O έιεγρνο ελεξγνύ ηζρύνο, PL, πξαγκαηνπνηείηαη ζηνλ
dc/dc κεηαηξνπέα, όπνπ ν εμσηεξηθόο PI ειεγθηήο παξάγεη ηελ αλαθνξά ξεύκαηνο Idc,ref, ελώ ν εζσηεξηθόο
PI ειεγθηήο δηακνξθώλεη ηελ ηάζε ειέγρνπ vcontrol, κε βάζε ηελ νπνία ξπζκίδεηαη ε έλαπζε θαη ε απνθνπή
ηνπ εκηαγσγηθνύ δηαθόπηε κέζσ ηεο ηερληθήο PWM, όπσο παξνπζηάδεηαη ζην ρ. 1.7(β). ε πην ζύγρξνλεο
εθαξκνγέο κε απμεκέλν θόζηνο, ην ηκήκα ηνπ αληηζηξνθέα πινπνηείηαη κε IGBTs θαη ειέγρεη ηελ άεξγν
ηζρύ πνπ παξέρεηαη ζην δίθηπν κέζσ θαηάιιειεο ηερληθήο ειέγρνπ, ε νπνία παξνπζηάδεηαη ζην ρ. 1.7(γ).
MAIN ENGINESG
G
M
440V ship’s power supply
consumers
Shaft generator
Engine side rectifier
Option for thyristor grid-side inverter:
Synchronous motor used as synchronous
condenser & excitation rectifier
Field winding
Excitation rectifier
DC/DC boost converter
Grid side inverter
(thyristors or IGBTs)
Reactive Power
Controller
SVPWM
Vdc,ref
vLL,ref
Vdc vLL QL
Active Power
Controller
PWMPL,ref
PL Idc
-+PL,ref
PL
Idc,ref
-+
Idc
vcontrol
vref
com
para
tor
PWM
-+Id,ref
-+vd
SV
PW
M
Vdc,ref
Vdcid
-+QL,ref
-+
qLvLL
vLL,ref Iq,ref
-+
iq
vq
PI
controller PI
PI PI
PIPI PI
(α)
(β)
(γ)
Continuous Operation
100%
70%
75% 87,5% 100%
40% 70% 100%
0%0% M/E speed (%MCR)
M/E load (%MCR)Shaf
t G
ener
ato
r P
ow
er
21 Πξνζαξκνζηηθόο έιεγρνο ηνπνινγίαο ξπζκηζηώλ ζηξνθώλ γηα εμνηθνλόκεζε ελέξγεηαο ζε πινία
ΔΙΔΑΚΣΟΡΙΚΗ ΔΙΑΣΡΙΒΗ
ΠΤΡΙΔΩΝ Β. ΓΙΑΝΝΟΤΣΟ
(α)
(β)
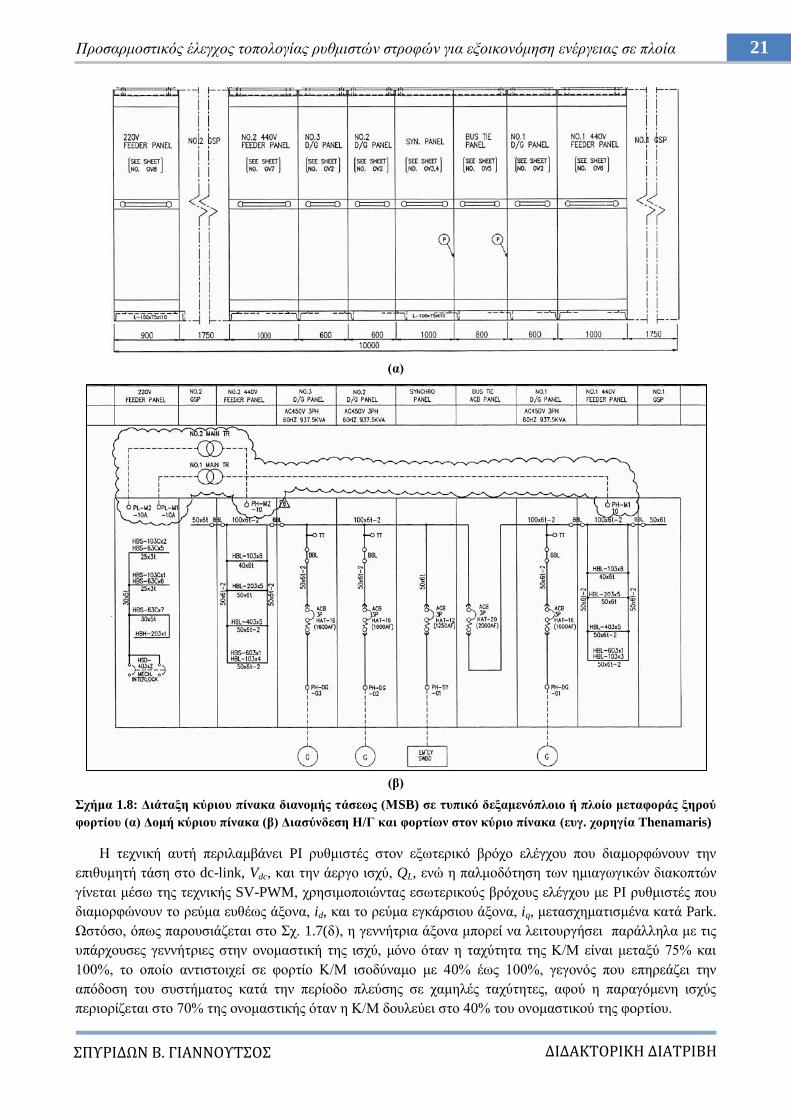
ρήκα 1.8: Γηάηαμε θύξηνπ πίλαθα δηαλνκήο ηάζεσο (ΜSB) ζε ηππηθό δεμακελόπινην ή πινίν κεηαθνξάο μεξνύ
θνξηίνπ (α) Γνκή θύξηνπ πίλαθα (β) Γηαζύλδεζε Η/Γ θαη θνξηίσλ ζηνλ θύξην πίλαθα (επγ. ρνξεγία Thenamaris)
Ζ ηερληθή απηή πεξηιακβάλεη PI ξπζκηζηέο ζηνλ εμσηεξηθό βξόρν ειέγρνπ πνπ δηακνξθώλνπλ ηελ
επηζπκεηή ηάζε ζην dc-link, Vdc, θαη ηελ άεξγν ηζρύ, QL, ελώ ε παικνδόηεζε ησλ εκηαγσγηθώλ δηαθνπηώλ
γίλεηαη κέζσ ηεο ηερληθήο SV-PWM, ρξεζηκνπνηώληαο εζσηεξηθνύο βξόρνπο ειέγρνπ κε PI ξπζκηζηέο πνπ
δηακνξθώλνπλ ην ξεύκα επζέσο άμνλα, id, θαη ην ξεύκα εγθάξζηνπ άμνλα, iq, κεηαζρεκαηηζκέλα θαηά Park.
Χζηόζν, όπσο παξνπζηάδεηαη ζην ρ. 1.7(δ), ε γελλήηξηα άμνλα κπνξεί λα ιεηηνπξγήζεη παξάιιεια κε ηηο
ππάξρνπζεο γελλήηξηεο ζηελ νλνκαζηηθή ηεο ηζρύ, κόλν όηαλ ε ηαρύηεηα ηεο Κ/Μ είλαη κεηαμύ 75% θαη
100%, ην νπνίν αληηζηνηρεί ζε θνξηίν Κ/Μ ηζνδύλακν κε 40% έσο 100%, γεγνλόο πνπ επεξεάδεη ηελ
απόδνζε ηνπ ζπζηήκαηνο θαηά ηελ πεξίνδν πιεύζεο ζε ρακειέο ηαρύηεηεο, αθνύ ε παξαγόκελε ηζρύο
πεξηνξίδεηαη ζην 70% ηεο νλνκαζηηθήο όηαλ ε Κ/Μ δνπιεύεη ζην 40% ηνπ νλνκαζηηθνύ ηεο θνξηίνπ.
22 Κεθάιαην 1 Δηζαγσγή – Κίλεηξα θαη ζηόρνη Γηαηξηβήο
ΔΙΔΑΚΣΟΡΙΚΗ ΔΙΑΣΡΙΒΗ
ΠΤΡΙΔΩΝ Β. ΓΙΑΝΝΟΤΣΟ
1.3 Ηλεκηπικό δίκηςο ιζσύορ πλοίος (εθαπμογή ζε Aframax 105,000DWT)
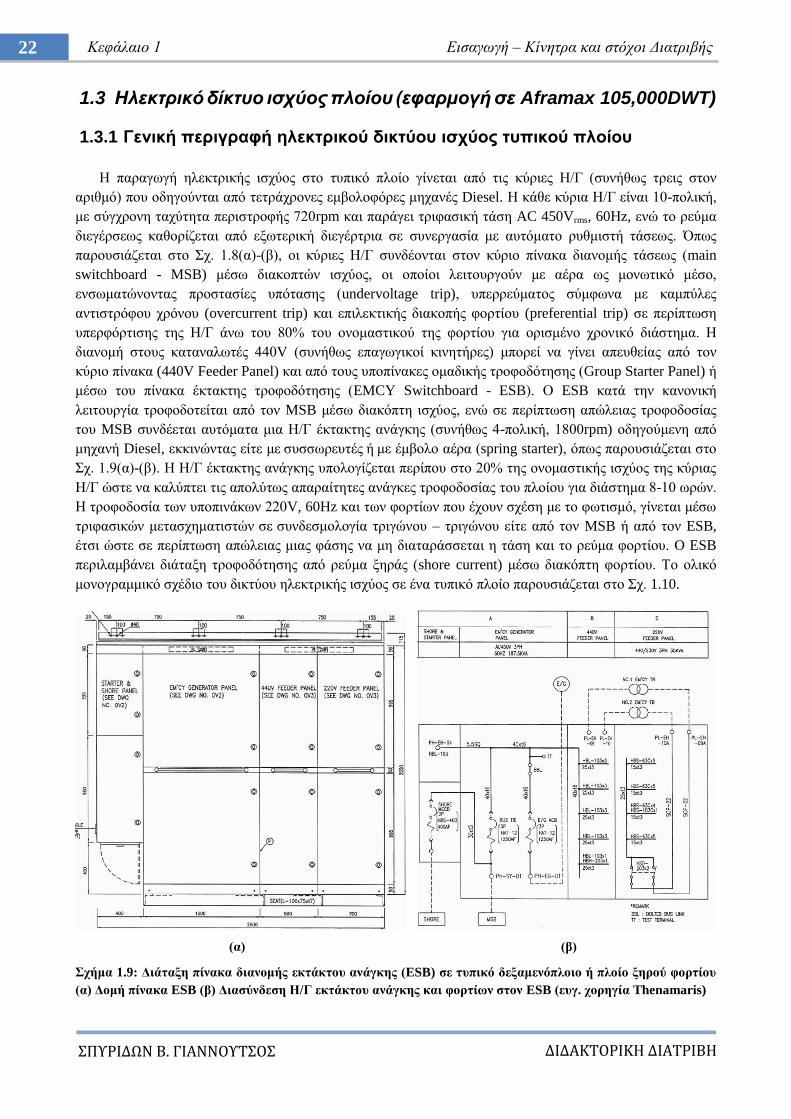
1.3.1 Γεληθή πεξηγξαθή ειεθηξηθνύ δηθηύνπ ηζρύνο ηππηθνύ πινίνπ
Ζ παξαγσγή ειεθηξηθήο ηζρύνο ζην ηππηθό πινίν γίλεηαη από ηηο θύξηεο Ζ/Γ (ζπλήζσο ηξεηο ζηνλ
αξηζκό) πνπ νδεγνύληαη από ηεηξάρξνλεο εκβνινθόξεο κεραλέο Diesel. Ζ θάζε θύξηα Ζ/Γ είλαη 10-πνιηθή,
κε ζύγρξνλε ηαρύηεηα πεξηζηξνθήο 720rpm θαη παξάγεη ηξηθαζηθή ηάζε AC 450Vrms, 60Hz, ελώ ην ξεύκα
δηεγέξζεσο θαζνξίδεηαη από εμσηεξηθή δηεγέξηξηα ζε ζπλεξγαζία κε απηόκαην ξπζκηζηή ηάζεσο. Όπσο
παξνπζηάδεηαη ζην ρ. 1.8(α)-(β), νη θύξηεο Ζ/Γ ζπλδένληαη ζηνλ θύξην πίλαθα δηαλνκήο ηάζεσο (main
switchboard - MSB) κέζσ δηαθνπηώλ ηζρύνο, νη νπνίνη ιεηηνπξγνύλ κε αέξα σο κνλσηηθό κέζν,
ελζσκαηώλνληαο πξνζηαζίεο ππόηαζεο (undervoltage trip), ππεξξεύκαηνο ζύκθσλα κε θακπύιεο
αληηζηξόθνπ ρξόλνπ (overcurrent trip) θαη επηιεθηηθήο δηαθνπήο θνξηίνπ (preferential trip) ζε πεξίπησζε
ππεξθόξηηζεο ηεο Ζ/Γ άλσ ηνπ 80% ηνπ νλνκαζηηθνύ ηεο θνξηίνπ γηα νξηζκέλν ρξνληθό δηάζηεκα. Ζ
δηαλνκή ζηνπο θαηαλαισηέο 440V (ζπλήζσο επαγσγηθνί θηλεηήξεο) κπνξεί λα γίλεη απεπζείαο από ηνλ
θύξην πίλαθα (440V Feeder Panel) θαη από ηνπο ππνπίλαθεο νκαδηθήο ηξνθνδόηεζεο (Group Starter Panel) ή
κέζσ ηνπ πίλαθα έθηαθηεο ηξνθνδόηεζεο (EMCY Switchboard - ESB). Ο ESB θαηά ηελ θαλνληθή
ιεηηνπξγία ηξνθνδνηείηαη από ηνλ MSB κέζσ δηαθόπηε ηζρύνο, ελώ ζε πεξίπησζε απώιεηαο ηξνθνδνζίαο
ηνπ MSB ζπλδέεηαη απηόκαηα κηα Ζ/Γ έθηαθηεο αλάγθεο (ζπλήζσο 4-πνιηθή, 1800rpm) νδεγνύκελε από
κεραλή Diesel, εθθηλώληαο είηε κε ζπζζσξεπηέο ή κε έκβνιν αέξα (spring starter), όπσο παξνπζηάδεηαη ζην
ρ. 1.9(α)-(β). Ζ Ζ/Γ έθηαθηεο αλάγθεο ππνινγίδεηαη πεξίπνπ ζην 20% ηεο νλνκαζηηθήο ηζρύνο ηεο θύξηαο
Ζ/Γ ώζηε λα θαιύπηεη ηηο απνιύησο απαξαίηεηεο αλάγθεο ηξνθνδνζίαο ηνπ πινίνπ γηα δηάζηεκα 8-10 σξώλ.
Ζ ηξνθνδνζία ησλ ππνπηλάθσλ 220V, 60Hz θαη ησλ θνξηίσλ πνπ έρνπλ ζρέζε κε ην θσηηζκό, γίλεηαη κέζσ
ηξηθαζηθώλ κεηαζρεκαηηζηώλ ζε ζπλδεζκνινγία ηξηγώλνπ – ηξηγώλνπ είηε από ηνλ MSB ή από ηνλ ESB,
έηζη ώζηε ζε πεξίπησζε απώιεηαο κηαο θάζεο λα κε δηαηαξάζζεηαη ε ηάζε θαη ην ξεύκα θνξηίνπ. Ο ESB
πεξηιακβάλεη δηάηαμε ηξνθνδόηεζεο από ξεύκα μεξάο (shore current) κέζσ δηαθόπηε θνξηίνπ. Σν νιηθό
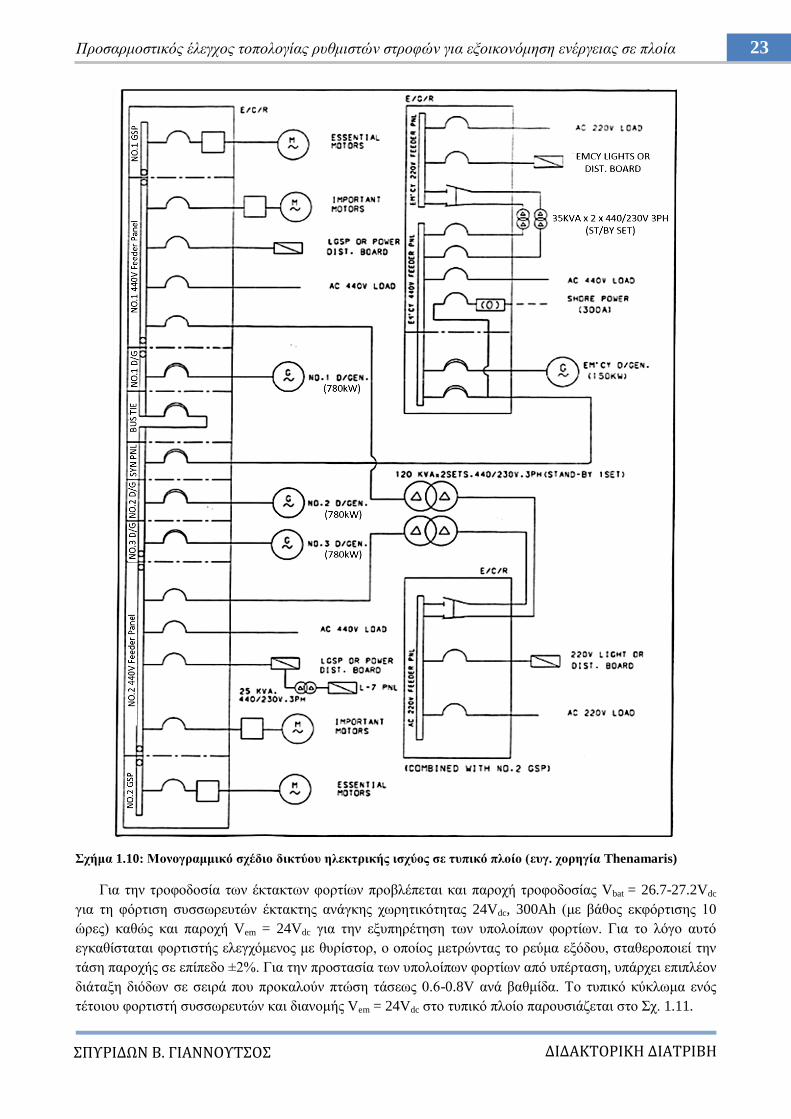
κνλνγξακκηθό ζρέδην ηνπ δηθηύνπ ειεθηξηθήο ηζρύνο ζε έλα ηππηθό πινίν παξνπζηάδεηαη ζην ρ. 1.10.
(α) (β)
ρήκα 1.9: Γηάηαμε πίλαθα δηαλνκήο εθηάθηνπ αλάγθεο (ESB) ζε ηππηθό δεμακελόπινην ή πινίν μεξνύ θνξηίνπ
(α) Γνκή πίλαθα ESB (β) Γηαζύλδεζε Η/Γ εθηάθηνπ αλάγθεο θαη θνξηίσλ ζηνλ ESB (επγ. ρνξεγία Thenamaris)
23 Πξνζαξκνζηηθόο έιεγρνο ηνπνινγίαο ξπζκηζηώλ ζηξνθώλ γηα εμνηθνλόκεζε ελέξγεηαο ζε πινία
ΔΙΔΑΚΣΟΡΙΚΗ ΔΙΑΣΡΙΒΗ
ΠΤΡΙΔΩΝ Β. ΓΙΑΝΝΟΤΣΟ
ρήκα 1.10: Μνλνγξακκηθό ζρέδην δηθηύνπ ειεθηξηθήο ηζρύνο ζε ηππηθό πινίν (επγ. ρνξεγία Thenamaris)
Γηα ηελ ηξνθνδνζία ησλ έθηαθησλ θνξηίσλ πξνβιέπεηαη θαη παξνρή ηξνθνδνζίαο Vbat = 26.7-27.2Vdc
γηα ηε θόξηηζε ζπζζσξεπηώλ έθηαθηεο αλάγθεο ρσξεηηθόηεηαο 24Vdc, 300Ah (κε βάζνο εθθόξηηζεο 10
ώξεο) θαζώο θαη παξνρή Vem = 24Vdc γηα ηελ εμππεξέηεζε ησλ ππνινίπσλ θνξηίσλ. Γηα ην ιόγν απηό
εγθαζίζηαηαη θνξηηζηήο ειεγρόκελνο κε ζπξίζηνξ, ν νπνίνο κεηξώληαο ην ξεύκα εμόδνπ, ζηαζεξνπνηεί ηελ
ηάζε παξνρήο ζε επίπεδν ±2%. Γηα ηελ πξνζηαζία ησλ ππνινίπσλ θνξηίσλ από ππέξηαζε, ππάξρεη επηπιένλ
δηάηαμε δηόδσλ ζε ζεηξά πνπ πξνθαινύλ πηώζε ηάζεσο 0.6-0.8V αλά βαζκίδα. Σν ηππηθό θύθισκα ελόο
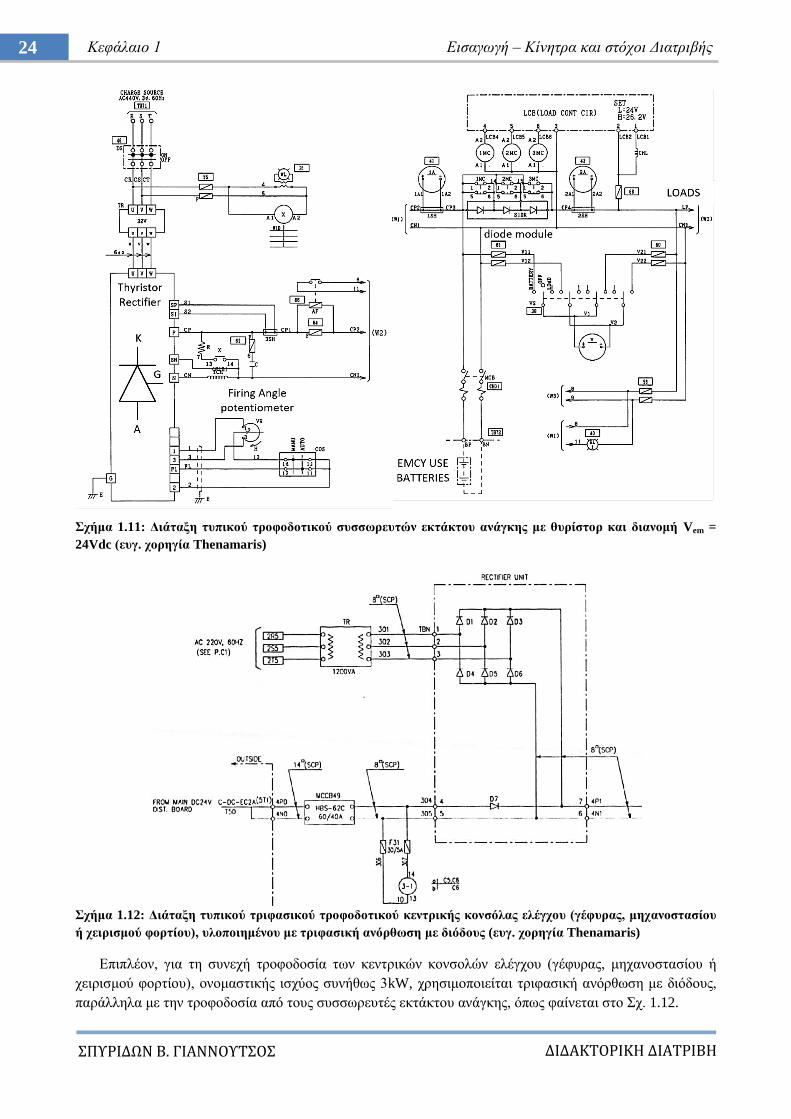
ηέηνηνπ θνξηηζηή ζπζζσξεπηώλ θαη δηαλνκήο Vem = 24Vdc ζην ηππηθό πινίν παξνπζηάδεηαη ζην ρ. 1.11.
24 Κεθάιαην 1 Δηζαγσγή – Κίλεηξα θαη ζηόρνη Γηαηξηβήο
ΔΙΔΑΚΣΟΡΙΚΗ ΔΙΑΣΡΙΒΗ
ΠΤΡΙΔΩΝ Β. ΓΙΑΝΝΟΤΣΟ
ρήκα 1.11: Γηάηαμε ηππηθνύ ηξνθνδνηηθνύ ζπζζσξεπηώλ εθηάθηνπ αλάγθεο κε ζπξίζηνξ θαη δηαλνκή Vem =
24Vdc (επγ. ρνξεγία Thenamaris)
ρήκα 1.12: Γηάηαμε ηππηθνύ ηξηθαζηθνύ ηξνθνδνηηθνύ θεληξηθήο θνλζόιαο ειέγρνπ (γέθπξαο, κεραλνζηαζίνπ
ή ρεηξηζκνύ θνξηίνπ), πινπνηεκέλνπ κε ηξηθαζηθή αλόξζσζε κε δηόδνπο (επγ. ρνξεγία Thenamaris)
Δπηπιένλ, γηα ηε ζπλερή ηξνθνδνζία ησλ θεληξηθώλ θνλζνιώλ ειέγρνπ (γέθπξαο, κεραλνζηαζίνπ ή
ρεηξηζκνύ θνξηίνπ), νλνκαζηηθήο ηζρύνο ζπλήζσο 3kW, ρξεζηκνπνηείηαη ηξηθαζηθή αλόξζσζε κε δηόδνπο,
παξάιιεια κε ηελ ηξνθνδνζία από ηνπο ζπζζσξεπηέο εθηάθηνπ αλάγθεο, όπσο θαίλεηαη ζην ρ. 1.12.
25 Πξνζαξκνζηηθόο έιεγρνο ηνπνινγίαο ξπζκηζηώλ ζηξνθώλ γηα εμνηθνλόκεζε ελέξγεηαο ζε πινία
ΔΙΔΑΚΣΟΡΙΚΗ ΔΙΑΣΡΙΒΗ
ΠΤΡΙΔΩΝ Β. ΓΙΑΝΝΟΤΣΟ
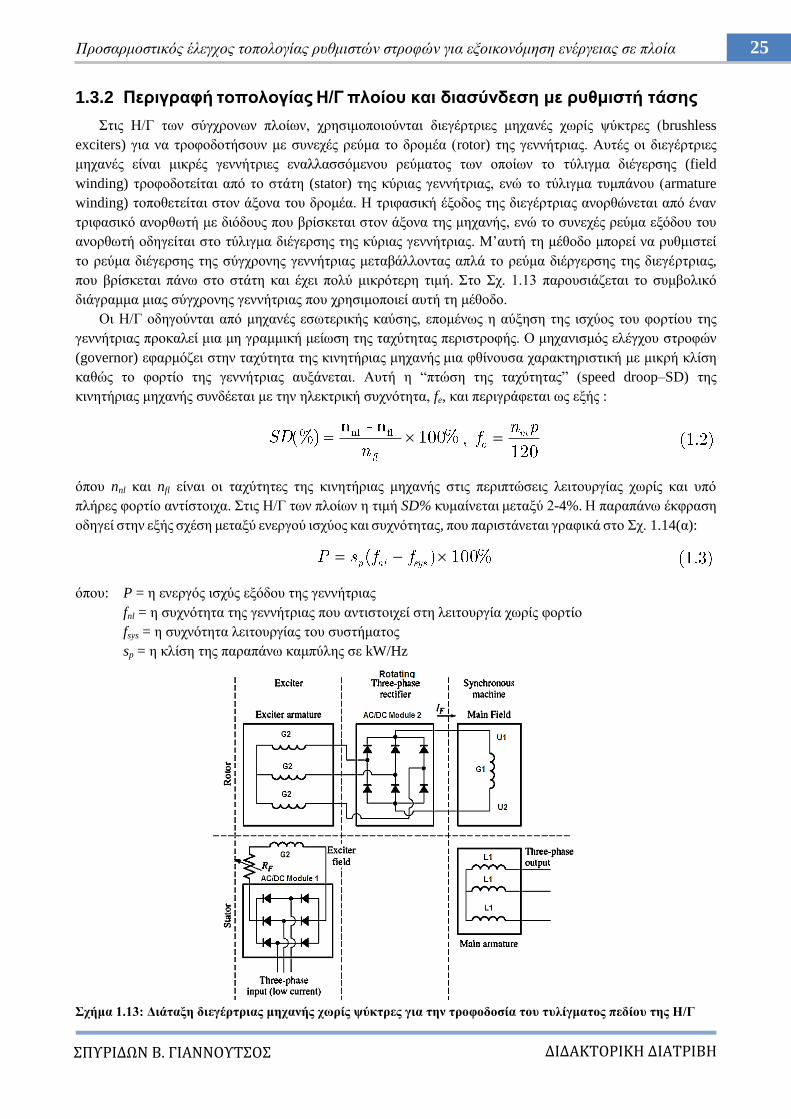
1.3.2 Πεξηγξαθή ηνπνινγίαο Η/Γ πινίνπ θαη δηαζύλδεζε κε ξπζκηζηή ηάζεο
ηηο Ζ/Γ ησλ ζύγρξνλσλ πινίσλ, ρξεζηκνπνηνύληαη δηεγέξηξηεο κεραλέο ρσξίο ςύθηξεο (brushless
exciters) γηα λα ηξνθνδνηήζνπλ κε ζπλερέο ξεύκα ην δξνκέα (rotor) ηεο γελλήηξηαο. Απηέο νη δηεγέξηξηεο
κεραλέο είλαη κηθξέο γελλήηξηεο ελαιιαζζόκελνπ ξεύκαηνο ησλ νπνίσλ ην ηύιηγκα δηέγεξζεο (field
winding) ηξνθνδνηείηαη από ην ζηάηε (stator) ηεο θύξηαο γελλήηξηαο, ελώ ην ηύιηγκα ηπκπάλνπ (armature
winding) ηνπνζεηείηαη ζηνλ άμνλα ηνπ δξνκέα. Ζ ηξηθαζηθή έμνδνο ηεο δηεγέξηξηαο αλνξζώλεηαη από έλαλ
ηξηθαζηθό αλνξζσηή κε δηόδνπο πνπ βξίζθεηαη ζηνλ άμνλα ηεο κεραλήο, ελώ ην ζπλερέο ξεύκα εμόδνπ ηνπ
αλνξζσηή νδεγείηαη ζην ηύιηγκα δηέγεξζεο ηεο θύξηαο γελλήηξηαο. Μ‟απηή ηε κέζνδν κπνξεί λα ξπζκηζηεί
ην ξεύκα δηέγεξζεο ηεο ζύγρξνλεο γελλήηξηαο κεηαβάιινληαο απιά ην ξεύκα δηέξγεξζεο ηεο δηεγέξηξηαο,
πνπ βξίζθεηαη πάλσ ζην ζηάηε θαη έρεη πνιύ κηθξόηεξε ηηκή. ην ρ. 1.13 παξνπζηάδεηαη ην ζπκβνιηθό
δηάγξακκα κηαο ζύγρξνλεο γελλήηξηαο πνπ ρξεζηκνπνηεί απηή ηε κέζνδν.
Οη Ζ/Γ νδεγνύληαη από κεραλέο εζσηεξηθήο θαύζεο, επνκέλσο ε αύμεζε ηεο ηζρύνο ηνπ θνξηίνπ ηεο
γελλήηξηαο πξνθαιεί κηα κε γξακκηθή κείσζε ηεο ηαρύηεηαο πεξηζηξνθήο. Ο κεραληζκόο ειέγρνπ ζηξνθώλ
(governor) εθαξκόδεη ζηελ ηαρύηεηα ηεο θηλεηήξηαο κεραλήο κηα θζίλνπζα ραξαθηεξηζηηθή κε κηθξή θιίζε
θαζώο ην θνξηίν ηεο γελλήηξηαο απμάλεηαη. Απηή ε “πηώζε ηεο ηαρύηεηαο” (speed droop–SD) ηεο
θηλεηήξηαο κεραλήο ζπλδέεηαη κε ηελ ειεθηξηθή ζπρλόηεηα, fe, θαη πεξηγξάθεηαη σο εμήο :
όπνπ nnl θαη nfl είλαη νη ηαρύηεηεο ηεο θηλεηήξηαο κεραλήο ζηηο πεξηπηώζεηο ιεηηνπξγίαο ρσξίο θαη ππό
πιήξεο θνξηίν αληίζηνηρα. ηηο Ζ/Γ ησλ πινίσλ ε ηηκή SD% θπκαίλεηαη κεηαμύ 2-4%. Ζ παξαπάλσ έθθξαζε
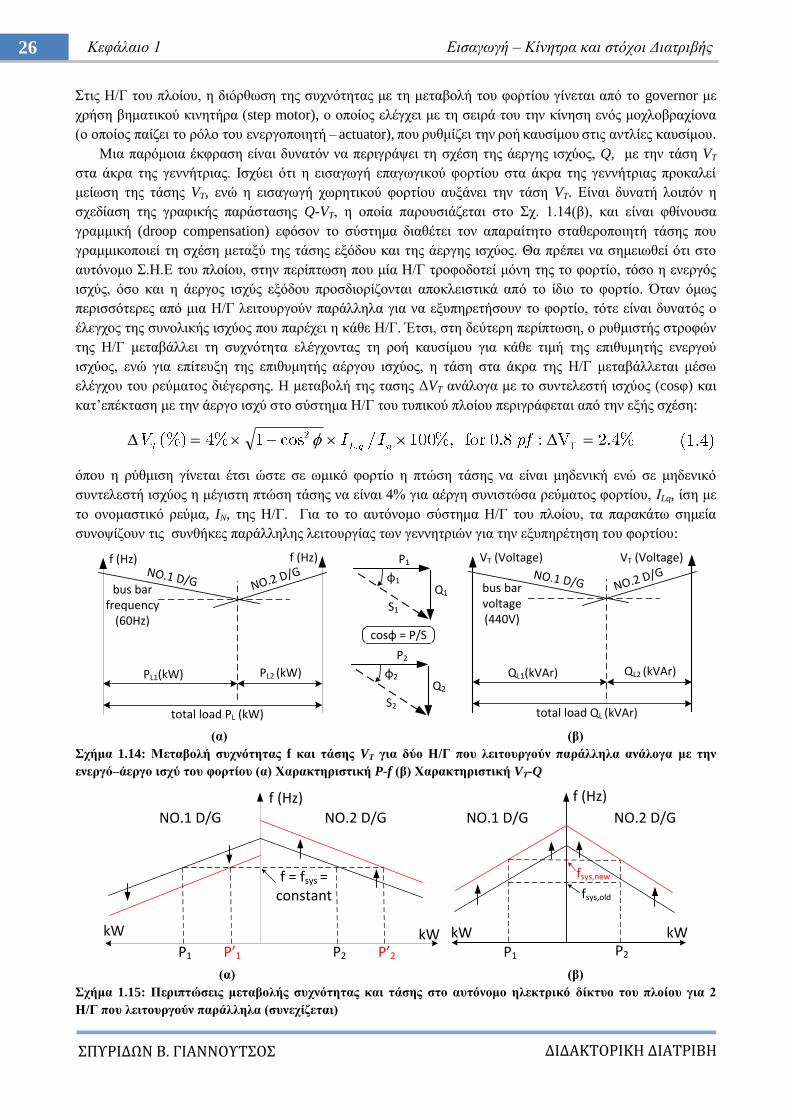
νδεγεί ζηελ εμήο ζρέζε κεηαμύ ελεξγνύ ηζρύνο θαη ζπρλόηεηαο, πνπ παξηζηάλεηαη γξαθηθά ζην ρ. 1.14(α):
όπνπ: P = ε ελεξγόο ηζρύο εμόδνπ ηεο γελλήηξηαο
fnl = ε ζπρλόηεηα ηεο γελλήηξηαο πνπ αληηζηνηρεί ζηε ιεηηνπξγία ρσξίο θνξηίν
fsys = ε ζπρλόηεηα ιεηηνπξγίαο ηνπ ζπζηήκαηνο
sp = ε θιίζε ηεο παξαπάλσ θακπύιεο ζε kW/Hz
ρήκα 1.13: Γηάηαμε δηεγέξηξηαο κεραλήο ρσξίο ςύθηξεο γηα ηελ ηξνθνδνζία ηνπ ηπιίγκαηνο πεδίνπ ηεο Η/Γ
26 Κεθάιαην 1 Δηζαγσγή – Κίλεηξα θαη ζηόρνη Γηαηξηβήο
ΔΙΔΑΚΣΟΡΙΚΗ ΔΙΑΣΡΙΒΗ
ΠΤΡΙΔΩΝ Β. ΓΙΑΝΝΟΤΣΟ
ηηο Ζ/Γ ηνπ πινίνπ, ε δηόξζσζε ηεο ζπρλόηεηαο κε ηε κεηαβνιή ηνπ θνξηίνπ γίλεηαη από ην governor κε
ρξήζε βεκαηηθνύ θηλεηήξα (step motor), ν νπνίνο ειέγρεη κε ηε ζεηξά ηνπ ηελ θίλεζε ελόο κνρινβξαρίνλα
(ν νπνίνο παίδεη ην ξόιν ηνπ ελεξγνπνηεηή – actuator), πνπ ξπζκίδεη ηελ ξνή θαπζίκνπ ζηηο αληιίεο θαπζίκνπ.
Μηα παξόκνηα έθθξαζε είλαη δπλαηόλ λα πεξηγξάςεη ηε ζρέζε ηεο άεξγεο ηζρύνο, Q, κε ηελ ηάζε VT
ζηα άθξα ηεο γελλήηξηαο. Ηζρύεη όηη ε εηζαγσγή επαγσγηθνύ θνξηίνπ ζηα άθξα ηεο γελλήηξηαο πξνθαιεί
κείσζε ηεο ηάζεο VT, ελώ ε εηζαγσγή ρσξεηηθνύ θνξηίνπ απμάλεη ηελ ηάζε VT. Δίλαη δπλαηή ινηπόλ ε
ζρεδίαζε ηεο γξαθηθήο παξάζηαζεο Q-VT, ε νπνία παξνπζηάδεηαη ζην ρ. 1.14(β), θαη είλαη θζίλνπζα
γξακκηθή (droop compensation) εθόζνλ ην ζύζηεκα δηαζέηεη ηνλ απαξαίηεην ζηαζεξνπνηεηή ηάζεο πνπ
γξακκηθνπνηεί ηε ζρέζε κεηαμύ ηεο ηάζεο εμόδνπ θαη ηεο άεξγεο ηζρύνο. Θα πξέπεη λα ζεκεησζεί όηη ζην
απηόλνκν .Ζ.Δ ηνπ πινίνπ, ζηελ πεξίπησζε πνπ κία Ζ/Γ ηξνθνδνηεί κόλε ηεο ην θνξηίν, ηόζν ε ελεξγόο
ηζρύο, όζν θαη ε άεξγνο ηζρύο εμόδνπ πξνζδηνξίδνληαη απνθιεηζηηθά από ην ίδην ην θνξηίν. Όηαλ όκσο
πεξηζζόηεξεο από κηα Ζ/Γ ιεηηνπξγνύλ παξάιιεια γηα λα εμππεξεηήζνπλ ην θνξηίν, ηόηε είλαη δπλαηόο ν
έιεγρνο ηεο ζπλνιηθήο ηζρύνο πνπ παξέρεη ε θάζε Ζ/Γ. Έηζη, ζηε δεύηεξε πεξίπησζε, ν ξπζκηζηήο ζηξνθώλ
ηεο Ζ/Γ κεηαβάιιεη ηε ζπρλόηεηα ειέγρνληαο ηε ξνή θαπζίκνπ γηα θάζε ηηκή ηεο επηζπκεηήο ελεξγνύ
ηζρύνο, ελώ γηα επίηεπμε ηεο επηζπκεηήο αέξγνπ ηζρύνο, ε ηάζε ζηα άθξα ηεο Ζ/Γ κεηαβάιιεηαη κέζσ
ειέγρνπ ηνπ ξεύκαηνο δηέγεξζεο. Ζ κεηαβνιή ηεο ηαζεο ΓVT αλάινγα κε ην ζπληειεζηή ηζρύνο (cosθ) θαη
θαη‟επέθηαζε κε ηελ άεξγν ηζρύ ζην ζύζηεκα Ζ/Γ ηνπ ηππηθνύ πινίνπ πεξηγξάθεηαη από ηελ εμήο ζρέζε:
όπνπ ε ξύζκηζε γίλεηαη έηζη ώζηε ζε σκηθό θνξηίν ε πηώζε ηάζεο λα είλαη κεδεληθή ελώ ζε κεδεληθό
ζπληειεζηή ηζρύνο ε κέγηζηε πηώζε ηάζεο λα είλαη 4% γηα αέξγε ζπληζηώζα ξεύκαηνο θνξηίνπ, ΗLq, ίζε κε
ην νλνκαζηηθό ξεύκα, IN, ηεο Ζ/Γ. Γηα ην ην απηόλνκν ζύζηεκα Ζ/Γ ηνπ πινίνπ, ηα παξαθάησ ζεκεία
ζπλνςίδνπλ ηηο ζπλζήθεο παξάιιειεο ιεηηνπξγίαο ησλ γελλεηξηώλ γηα ηελ εμππεξέηεζε ηνπ θνξηίνπ:
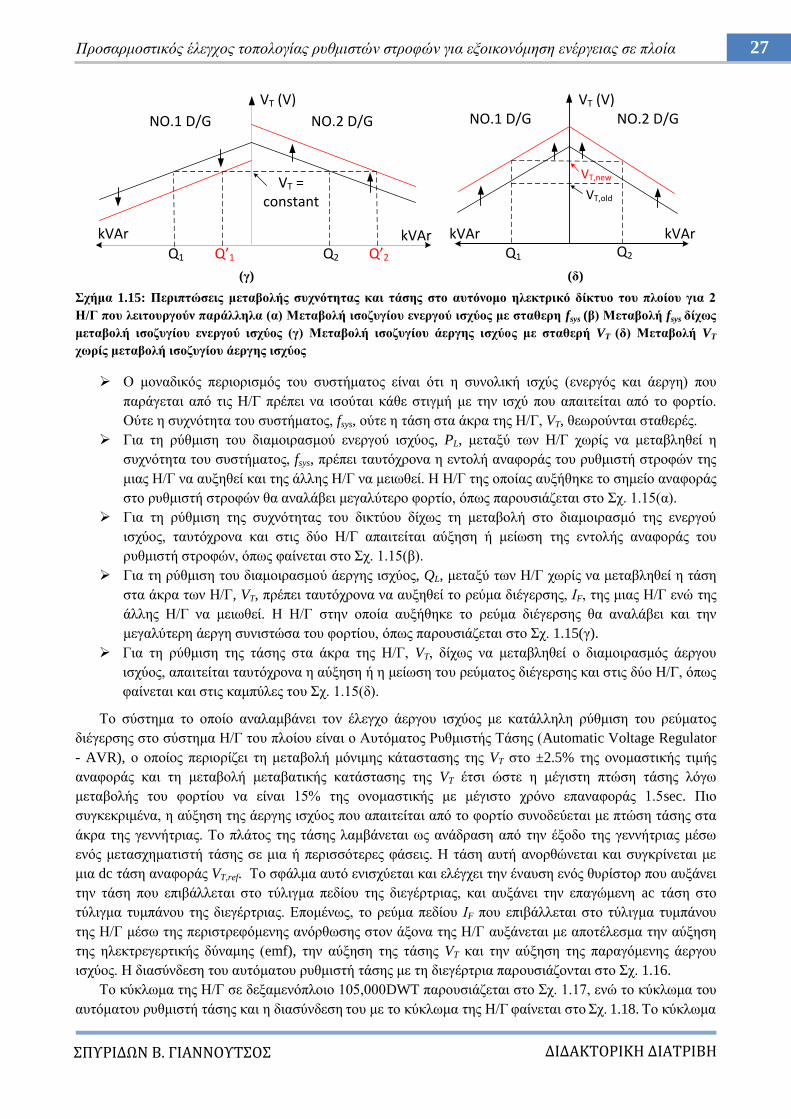
(α) (β)
ρήκα 1.14: Μεηαβνιή ζπρλόηεηαο f θαη ηάζεο VT γηα δύν Η/Γ πνπ ιεηηνπξγνύλ παξάιιεια αλάινγα κε ηελ
ελεξγό–άεξγν ηζρύ ηνπ θνξηίνπ (α) Υαξαθηεξηζηηθή P-f (β) Υαξαθηεξηζηηθή VΣ-Q
(α) (β)
ρήκα 1.15: Πεξηπηώζεηο κεηαβνιήο ζπρλόηεηαο θαη ηάζεο ζην απηόλνκν ειεθηξηθό δίθηπν ηνπ πινίνπ γηα 2
Η/Γ πνπ ιεηηνπξγνύλ παξάιιεια (ζπλερίδεηαη)
S1
φ1
P1
Q1
f (Hz)
PL1(kW)
bus bar frequency
(60Hz)
f (Hz)
PL2 (kW)
total load PL (kW)S2
φ2
P2
Q2
cosφ = P/S
QL1(kVAr)
bus bar voltage(440V)
VT (Voltage)
QL2 (kVAr)
total load QL (kVAr)
VT (Voltage)NO.1 D/G NO.2 D/G NO.1 D/G NO.2 D/G
f (Hz)
NO.1 D/G NO.2 D/G
f = fsys = constant
kWkW
P1 P’1 P2 P’2
f (Hz)
NO.1 D/G NO.2 D/G
fsys,old
kWkWP1 P2
fsys,new
27 Πξνζαξκνζηηθόο έιεγρνο ηνπνινγίαο ξπζκηζηώλ ζηξνθώλ γηα εμνηθνλόκεζε ελέξγεηαο ζε πινία
ΔΙΔΑΚΣΟΡΙΚΗ ΔΙΑΣΡΙΒΗ
ΠΤΡΙΔΩΝ Β. ΓΙΑΝΝΟΤΣΟ
(γ) (δ)
ρήκα 1.15: Πεξηπηώζεηο κεηαβνιήο ζπρλόηεηαο θαη ηάζεο ζην απηόλνκν ειεθηξηθό δίθηπν ηνπ πινίνπ γηα 2
Η/Γ πνπ ιεηηνπξγνύλ παξάιιεια (α) Μεηαβνιή ηζνδπγίνπ ελεξγνύ ηζρύνο κε ζηαζεξε fsys (β) Μεηαβνιή fsys δίρσο
κεηαβνιή ηζνδπγίνπ ελεξγνύ ηζρύνο (γ) Μεηαβνιή ηζνδπγίνπ άεξγεο ηζρύνο κε ζηαζεξή VT (δ) Μεηαβνιή VT
ρσξίο κεηαβνιή ηζνδπγίνπ άεξγεο ηζρύνο
Ο κνλαδηθόο πεξηνξηζκόο ηνπ ζπζηήκαηνο είλαη όηη ε ζπλνιηθή ηζρύο (ελεξγόο θαη άεξγε) πνπ
παξάγεηαη από ηηο Ζ/Γ πξέπεη λα ηζνύηαη θάζε ζηηγκή κε ηελ ηζρύ πνπ απαηηείηαη από ην θνξηίν.
Ούηε ε ζπρλόηεηα ηνπ ζπζηήκαηνο, fsys, νύηε ε ηάζε ζηα άθξα ηεο Ζ/Γ, VT, ζεσξνύληαη ζηαζεξέο.
Γηα ηε ξύζκηζε ηνπ δηακνηξαζκνύ ελεξγνύ ηζρύνο, PL, κεηαμύ ησλ Ζ/Γ ρσξίο λα κεηαβιεζεί ε
ζπρλόηεηα ηνπ ζπζηήκαηνο, fsys, πξέπεη ηαπηόρξνλα ε εληνιή αλαθνξάο ηνπ ξπζκηζηή ζηξνθώλ ηεο
κηαο Ζ/Γ λα απμεζεί θαη ηεο άιιεο Ζ/Γ λα κεησζεί. Ζ Ζ/Γ ηεο νπνίαο απμήζεθε ην ζεκείν αλαθνξάο
ζην ξπζκηζηή ζηξνθώλ ζα αλαιάβεη κεγαιύηεξν θνξηίν, όπσο παξνπζηάδεηαη ζην ρ. 1.15(α).
Γηα ηε ξύζκηζε ηεο ζπρλόηεηαο ηνπ δηθηύνπ δίρσο ηε κεηαβνιή ζην δηακνηξαζκό ηεο ελεξγνύ
ηζρύνο, ηαπηόρξνλα θαη ζηηο δύν Ζ/Γ απαηηείηαη αύμεζε ή κείσζε ηεο εληνιήο αλαθνξάο ηνπ
ξπζκηζηή ζηξνθώλ, όπσο θαίλεηαη ζην ρ. 1.15(β).
Γηα ηε ξύζκηζε ηνπ δηακνηξαζκνύ άεξγεο ηζρύνο, QL, κεηαμύ ησλ Ζ/Γ ρσξίο λα κεηαβιεζεί ε ηάζε
ζηα άθξα ησλ Ζ/Γ, VT, πξέπεη ηαπηόρξνλα λα απμεζεί ην ξεύκα δηέγεξζεο, ΗF, ηεο κηαο Ζ/Γ ελώ ηεο
άιιεο Ζ/Γ λα κεησζεί. Ζ Ζ/Γ ζηελ νπνία απμήζεθε ην ξεύκα δηέγεξζεο ζα αλαιάβεη θαη ηελ
κεγαιύηεξε άεξγε ζπληζηώζα ηνπ θνξηίνπ, όπσο παξνπζηάδεηαη ζην ρ. 1.15(γ).
Γηα ηε ξύζκηζε ηεο ηάζεο ζηα άθξα ηεο Ζ/Γ, VT, δίρσο λα κεηαβιεζεί ν δηακνηξαζκόο άεξγνπ
ηζρύνο, απαηηείηαη ηαπηόρξνλα ε αύμεζε ή ε κείσζε ηνπ ξεύκαηνο δηέγεξζεο θαη ζηηο δύν Ζ/Γ, όπσο
θαίλεηαη θαη ζηηο θακπύιεο ηνπ ρ. 1.15(δ).
Σν ζύζηεκα ην νπνίν αλαιακβάλεη ηνλ έιεγρν άεξγνπ ηζρύνο κε θαηάιιειε ξύζκηζε ηνπ ξεύκαηνο
δηέγεξζεο ζην ζύζηεκα Ζ/Γ ηνπ πινίνπ είλαη ν Απηόκαηνο Ρπζκηζηήο Σάζεο (Automatic Voltage Regulator
- AVR), ν νπνίνο πεξηνξίδεη ηε κεηαβνιή κόληκεο θάηαζηαζεο ηεο VT ζην ±2.5% ηεο νλνκαζηηθήο ηηκήο
αλαθνξάο θαη ηε κεηαβνιή κεηαβαηηθήο θαηάζηαζεο ηεο VT έηζη ώζηε ε κέγηζηε πηώζε ηάζεο ιόγσ
κεηαβνιήο ηνπ θνξηίνπ λα είλαη 15% ηεο νλνκαζηηθήο κε κέγηζην ρξόλν επαλαθνξάο 1.5sec. Πην
ζπγθεθξηκέλα, ε αύμεζε ηεο άεξγεο ηζρύνο πνπ απαηηείηαη από ην θνξηίν ζπλνδεύεηαη κε πηώζε ηάζεο ζηα
άθξα ηεο γελλήηξηαο. Σν πιάηνο ηεο ηάζεο ιακβάλεηαη σο αλάδξαζε από ηελ έμνδν ηεο γελλήηξηαο κέζσ
ελόο κεηαζρεκαηηζηή ηάζεο ζε κηα ή πεξηζζόηεξεο θάζεηο. Ζ ηάζε απηή αλνξζώλεηαη θαη ζπγθξίλεηαη κε
κηα dc ηάζε αλαθνξάο VT,ref. Σν ζθάικα απηό εληζρύεηαη θαη ειέγρεη ηελ έλαπζε ελόο ζπξίζηνξ πνπ απμάλεη
ηελ ηάζε πνπ επηβάιιεηαη ζην ηύιηγκα πεδίνπ ηεο δηεγέξηξηαο, θαη απμάλεη ηελ επαγώκελε ac ηάζε ζην
ηύιηγκα ηπκπάλνπ ηεο δηεγέξηξηαο. Δπνκέλσο, ην ξεύκα πεδίνπ ΗF πνπ επηβάιιεηαη ζην ηύιηγκα ηπκπάλνπ
ηεο Ζ/Γ κέζσ ηεο πεξηζηξεθόκελεο αλόξζσζεο ζηνλ άμνλα ηεο Ζ/Γ απμάλεηαη κε απνηέιεζκα ηελ αύμεζε
ηεο ειεθηξεγεξηηθήο δύλακεο (emf), ηελ αύμεζε ηεο ηάζεο VT θαη ηελ αύμεζε ηεο παξαγόκελεο άεξγνπ
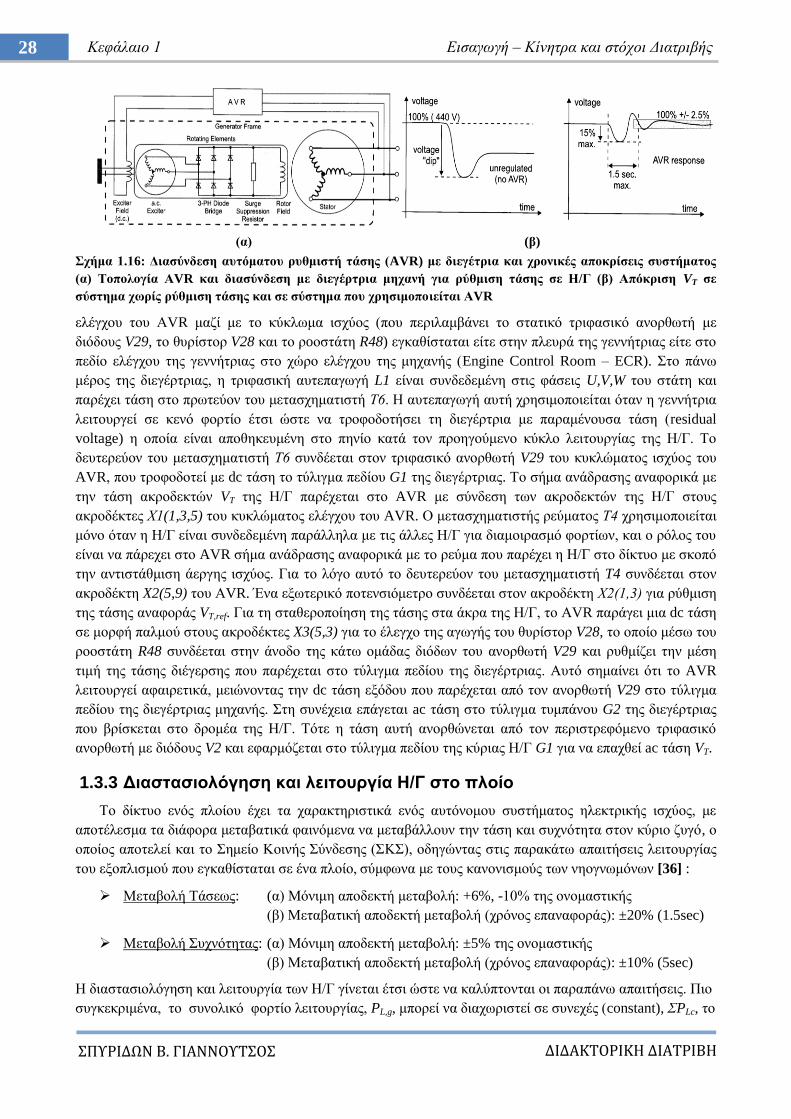
ηζρύνο. Ζ δηαζύλδεζε ηνπ απηόκαηνπ ξπζκηζηή ηάζεο κε ηε δηεγέξηξηα παξνπζηάδνληαη ζην ρ. 1.16.
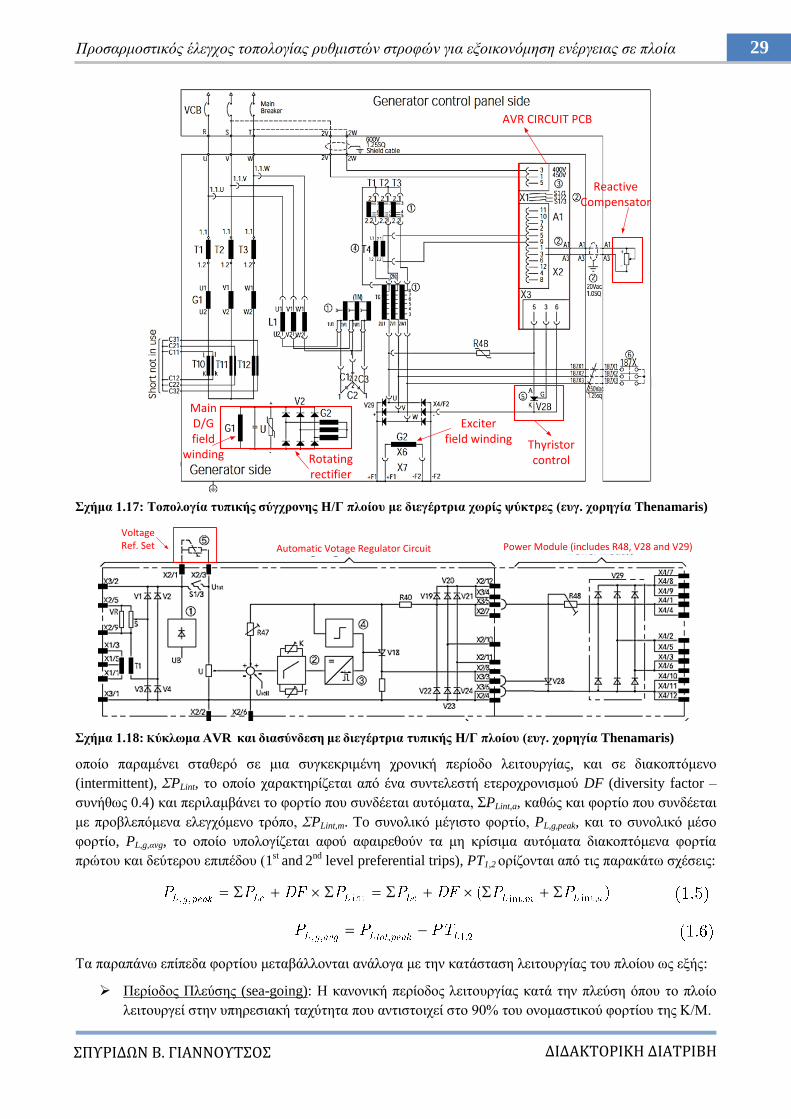
Σν θύθισκα ηεο Ζ/Γ ζε δεμακελόπινην 105,000DWT παξνπζηάδεηαη ζην ρ. 1.17, ελώ ην θύθισκα ηνπ
απηόκαηνπ ξπζκηζηή ηάζεο θαη ε δηαζύλδεζε ηνπ κε ην θύθισκα ηεο Ζ/Γ θαίλεηαη ζην ρ. 1.18. Σν θύθισκα
VT (V)
NO.1 D/G NO.2 D/G
VT = constant
kVArkVAr
Q1 Q’1 Q2 Q’2
NO.1 D/G NO.2 D/G
VT,old
kVArkVArQ1 Q2
VT,new
VT (V)
28 Κεθάιαην 1 Δηζαγσγή – Κίλεηξα θαη ζηόρνη Γηαηξηβήο
ΔΙΔΑΚΣΟΡΙΚΗ ΔΙΑΣΡΙΒΗ
ΠΤΡΙΔΩΝ Β. ΓΙΑΝΝΟΤΣΟ
(α) (β)
ρήκα 1.16: Γηαζύλδεζε απηόκαηνπ ξπζκηζηή ηάζεο (AVR) κε δηεγέηξηα θαη ρξνληθέο απνθξίζεηο ζπζηήκαηνο
(α) Σνπνινγία ΑVR θαη δηαζύλδεζε κε δηεγέξηξηα κεραλή γηα ξύζκηζε ηάζεο ζε Η/Γ (β) Απόθξηζε VT ζε
ζύζηεκα ρσξίο ξύζκηζε ηάζεο θαη ζε ζύζηεκα πνπ ρξεζηκνπνηείηαη ΑVR
ειέγρνπ ηνπ ΑVR καδί κε ην θύθισκα ηζρύνο (πνπ πεξηιακβάλεη ην ζηαηηθό ηξηθαζηθό αλνξζσηή κε
δηόδνπο V29, ην ζπξίζηνξ V28 θαη ην ξoνζηάηε R48) εγθαζίζηαηαη είηε ζηελ πιεπξά ηεο γελλήηξηαο είηε ζην
πεδίν ειέγρνπ ηεο γελλήηξηαο ζην ρώξν ειέγρνπ ηεο κεραλήο (Engine Control Room – ECR). ην πάλσ
κέξνο ηεο δηεγέξηξηαο, ε ηξηθαζηθή απηεπαγσγή L1 είλαη ζπλδεδεκέλε ζηηο θάζεηο U,V,W ηνπ ζηάηε θαη
παξέρεη ηάζε ζην πξσηεύνλ ηνπ κεηαζρεκαηηζηή Σ6. Ζ απηεπαγσγή απηή ρξεζηκνπνηείηαη όηαλ ε γελλήηξηα
ιεηηνπξγεί ζε θελό θνξηίν έηζη ώζηε λα ηξνθνδνηήζεη ηε δηεγέξηξηα κε παξακέλνπζα ηάζε (residual
voltage) ε νπνία είλαη απνζεθεπκέλε ζην πελίν θαηά ηνλ πξνεγνύκελν θύθιν ιεηηνπξγίαο ηεο Ζ/Γ. Σν
δεπηεξεύνλ ηνπ κεηαζρεκαηηζηή Σ6 ζπλδέεηαη ζηνλ ηξηθαζηθό αλνξζσηή V29 ηνπ θπθιώκαηνο ηζρύνο ηνπ
AVR, πνπ ηξνθνδνηεί κε dc ηάζε ην ηύιηγκα πεδίνπ G1 ηεο δηεγέξηξηαο. Σν ζήκα αλάδξαζεο αλαθνξηθά κε
ηελ ηάζε αθξνδεθηώλ VT ηεο Ζ/Γ παξέρεηαη ζην AVR κε ζύλδεζε ησλ αθξνδεθηώλ ηεο Ζ/Γ ζηνπο
αθξνδέθηεο Υ1(1,3,5) ηνπ θπθιώκαηνο ειέγρνπ ηνπ AVR. Ο κεηαζρεκαηηζηήο ξεύκαηνο Σ4 ρξεζηκνπνηείηαη
κόλν όηαλ ε Ζ/Γ είλαη ζπλδεδεκέλε παξάιιεια κε ηηο άιιεο Ζ/Γ γηα δηακνηξαζκό θνξηίσλ, θαη ν ξόινο ηνπ
είλαη λα πάξερεη ζην AVR ζήκα αλάδξαζεο αλαθνξηθά κε ην ξεύκα πνπ παξέρεη ε Ζ/Γ ζην δίθηπν κε ζθνπό
ηελ αληηζηάζκηζε άεξγεο ηζρύνο. Γηα ην ιόγν απηό ην δεπηεξεύνλ ηνπ κεηαζρεκαηηζηή T4 ζπλδέεηαη ζηνλ
αθξνδέθηε X2(5,9) ηνπ ΑVR. Έλα εμσηεξηθό πνηελζηόκεηξν ζπλδέεηαη ζηνλ αθξνδέθηε Υ2(1,3) γηα ξύζκηζε
ηεο ηάζεο αλαθνξάο VT,ref. Γηα ηε ζηαζεξνπνίεζε ηεο ηάζεο ζηα άθξα ηεο Ζ/Γ, ην ΑVR παξάγεη κηα dc ηάζε
ζε κνξθή παικνύ ζηνπο αθξνδέθηεο X3(5,3) γηα ην έιεγρν ηεο αγσγήο ηνπ ζπξίζηνξ V28, ην νπνίν κέζσ ηνπ
ξννζηάηε R48 ζπλδέεηαη ζηελ άλνδν ηεο θάησ νκάδαο δηόδσλ ηνπ αλνξζσηή V29 θαη ξπζκίδεη ηελ κέζε
ηηκή ηεο ηάζεο δηέγεξζεο πνπ παξέρεηαη ζην ηύιηγκα πεδίνπ ηεο δηεγέξηξηαο. Απηό ζεκαίλεη όηη ην AVR
ιεηηνπξγεί αθαηξεηηθά, κεηώλνληαο ηελ dc ηάζε εμόδνπ πνπ παξέρεηαη από ηνλ αλνξζσηή V29 ζην ηύιηγκα
πεδίνπ ηεο δηεγέξηξηαο κεραλήο. ηε ζπλέρεηα επάγεηαη ac ηάζε ζην ηύιηγκα ηπκπάλνπ G2 ηεο δηεγέξηξηαο
πνπ βξίζθεηαη ζην δξνκέα ηεο Ζ/Γ. Σόηε ε ηάζε απηή αλνξζώλεηαη από ηνλ πεξηζηξεθόκελν ηξηθαζηθό
αλνξζσηή κε δηόδνπο V2 θαη εθαξκόδεηαη ζην ηύιηγκα πεδίνπ ηεο θύξηαο Ζ/Γ G1 γηα λα επαρζεί ac ηάζε VT.
1.3.3 Γηαζηαζηνιόγεζε θαη ιεηηνπξγία Η/Γ ζην πινίν
Σν δίθηπν ελόο πινίνπ έρεη ηα ραξαθηεξηζηηθά ελόο απηόλνκνπ ζπζηήκαηνο ειεθηξηθήο ηζρύνο, κε
απνηέιεζκα ηα δηάθνξα κεηαβαηηθά θαηλόκελα λα κεηαβάιινπλ ηελ ηάζε θαη ζπρλόηεηα ζηνλ θύξην δπγό, ν
νπνίνο απνηειεί θαη ην εκείν Κνηλήο ύλδεζεο (Κ), νδεγώληαο ζηηο παξαθάησ απαηηήζεηο ιεηηνπξγίαο
ηνπ εμνπιηζκνύ πνπ εγθαζίζηαηαη ζε έλα πινίν, ζύκθσλα κε ηνπο θαλνληζκνύο ησλ λενγλσκόλσλ [36] :
Μεηαβνιή Σάζεσο: (α) Μόληκε απνδεθηή κεηαβνιή: +6%, -10% ηεο νλνκαζηηθήο
(β) Μεηαβαηηθή απνδεθηή κεηαβνιή (ρξόλνο επαλαθνξάο): ±20% (1.5sec)
Μεηαβνιή πρλόηεηαο: (α) Μόληκε απνδεθηή κεηαβνιή: ±5% ηεο νλνκαζηηθήο
(β) Μεηαβαηηθή απνδεθηή κεηαβνιή (ρξόλνο επαλαθνξάο): ±10% (5sec)
Ζ δηαζηαζηνιόγεζε θαη ιεηηνπξγία ησλ Ζ/Γ γίλεηαη έηζη ώζηε λα θαιύπηνληαη νη παξαπάλσ απαηηήζεηο. Πην
ζπγθεθξηκέλα, ην ζπλνιηθό θνξηίν ιεηηνπξγίαο, PL,g, κπνξεί λα δηαρσξηζηεί ζε ζπλερέο (constant), PLc, ην
29 Πξνζαξκνζηηθόο έιεγρνο ηνπνινγίαο ξπζκηζηώλ ζηξνθώλ γηα εμνηθνλόκεζε ελέξγεηαο ζε πινία
ΔΙΔΑΚΣΟΡΙΚΗ ΔΙΑΣΡΙΒΗ
ΠΤΡΙΔΩΝ Β. ΓΙΑΝΝΟΤΣΟ
AVR CIRCUIT PCB
Rotating rectifier
Exciter field winding
Main D/G field
windingThyristorcontrol
ReactiveCompensator
ρήκα 1.17: Σνπνινγία ηππηθήο ζύγρξνλεο Η/Γ πινίνπ κε δηεγέξηξηα ρσξίο ςύθηξεο (επγ. ρνξεγία Thenamaris)
ρήκα 1.18: Κύθισκα ΑVR θαη δηαζύλδεζε κε δηεγέξηξηα ηππηθήο Η/Γ πινίνπ (επγ. ρνξεγία Thenamaris)
νπνίν παξακέλεη ζηαζεξό ζε κηα ζπγθεθξηκέλε ρξνληθή πεξίνδν ιεηηνπξγίαο, θαη ζε δηαθνπηόκελν
(intermittent), PLint, ην νπνίν ραξαθηεξίδεηαη από έλα ζπληειεζηή εηεξνρξνληζκνύ DF (diversity factor –
ζπλήζσο 0.4) θαη πεξηιακβάλεη ην θνξηίν πνπ ζπλδέεηαη απηόκαηα, PLint,a, θαζώο θαη θνξηίν πνπ ζπλδέεηαη
κε πξνβιεπόκελα ειεγρόκελν ηξόπν, PLint,m. To ζπλνιηθό κέγηζην θνξηίν, PL,g,peak, θαη ην ζπλνιηθό κέζν
θνξηίν, PL,g,αvg, ην νπνίν ππνινγίδεηαη αθνύ αθαηξεζνύλ ηα κε θξίζηκα απηόκαηα δηαθνπηόκελα θνξηία
πξώηνπ θαη δεύηεξνπ επηπέδνπ (1st
and 2nd
level preferential trips), PT1,2 νξίδνληαη από ηηο παξαθάησ ζρέζεηο:
Σα παξαπάλσ επίπεδα θνξηίνπ κεηαβάιινληαη αλάινγα κε ηελ θαηάζηαζε ιεηηνπξγίαο ηνπ πινίνπ σο εμήο:
Πεξίνδνο Πιεύζεο (sea-going): Ζ θαλνληθή πεξίνδνο ιεηηνπξγίαο θαηά ηελ πιεύζε όπνπ ην πινίν
ιεηηνπξγεί ζηελ ππεξεζηαθή ηαρύηεηα πνπ αληηζηνηρεί ζην 90% ηνπ νλνκαζηηθνύ θνξηίνπ ηεο Κ/Μ.
Automatic Votage Regulator Circuit Power Module (includes R48, V28 and V29)
Voltage Ref. Set
30 Κεθάιαην 1 Δηζαγσγή – Κίλεηξα θαη ζηόρνη Γηαηξηβήο
ΔΙΔΑΚΣΟΡΙΚΗ ΔΙΑΣΡΙΒΗ
ΠΤΡΙΔΩΝ Β. ΓΙΑΝΝΟΤΣΟ
Πεξίνδνο Διηγκώλ (maneuvering): H πεξίνδνο όπνπ ην πινίν εηζέξρεηαη/εμέξρεηαη από ην ιηκάλη ή
όηαλ πιέεη κε ρακειή ηαρύηεηα θαη ρξεζηκνπνηεί ην εμνπιηζκό γηα πξόζδεζε (mooring/windlass).
Πεξίνδνο ρεηξηζκνύ θνξηίνπ (cargo handling): Ζ πεξίνδνο θόξησζεο/εθθόξησζεο.
Πεξίνδνο αλακνλήο ζε ιηκάλη (anchorage/port): Ζ πεξίνδνο όπνπ ην πινίν είλαη αγθπξνβνιεκέλν.
Ζ θαηλόκελε νλνκαζηηθή ηζρύ ηεο Ζ/Γ επηιέγεηαη έηζη ώζηε λα κπνξεί κόλε ηεο λα θαιύπηεη ην
νλνκαζηηθό κέζν θνξηίν PLtot,αvg, ζε νπνηαδήπνηε πεξίνδν ιεηηνπξγίαο αθνύ επηδξάζεη ε απηόκαηε δηαθνπή
κε θξίζηκσλ θνξηίσλ έπεηηα από ππεξθόξηηζε, ζεσξώληαο ζπληειεζηή ηζρύνο ίζν κε 0.8. O ζπληειεζηήο
θόξηηζεο (Load Factor) ηεο Ζ/Γ, LFg,i, ππνινγίδεηαη σο εμήο:
όπνπ PLg,i είλαη ην θνξηίν ηεο Ζ/Γ κηα δεδνκέλε ρξνληθή ζηηγκή, Pr,g είλαη ε νλνκαζηηθή ηζρύο ηεο Ζ/Γ θαη
Nf,i είλαη ν αξηζκόο ησλ Ζ/Γ ζπλδεδεκέλσλ ζην δίθηπν ηε δεδνκέλε ρξνληθή ζηηγκή. ηα απηόλνκα
ζπζηήκαηα, ην θνξηίν θαη ν αξηζκόο ησλ ζπλδεδεκέλσλ Ζ/Γ αλά πάζα ζηηγκή θαζνξίδνληαη από ην
απηόκαην ζύζηεκα δηαρείξηζεο ηζρύνο (Power Management System – PMS), κε βάζε πξνθαζνξηζκέλνπο
πίλαθεο εθθίλεζεο Ζ/Γ εμαξηώκελνπο από ην θνξηίν, θαζώο θαη από πεξηνξηζκνύο αλαθνξηθά κε ηελ
απνθπγή κνλαδηθνύ ζεκείνπ αζηνρίαο (single point of failure), πεξηνξηζκνύο ζρεηηθά κε ηε κέγηζηε
επηηξεπηή κεηαβαηηθή θόξηηζε ηεο Ζ/Γ (maximum transient load) γηα ηελ ηθαλνπνίεζε ησλ θαλνληζκώλ, θαη
ηήξεζε ζπλζεθώλ ζρεηηθά κε ηε δηαζεζηκόηεηα πιενλάδνπζαο ηζρύνο ζην δίθηπν (available power reserve).
ύκθσλα κε ηα παξαπάλσ, ζηνλ Πίλαθα 1.3 παξνπζηάδεηαη ε κειέηε θνξηίνπ γηα έλα ηππηθό δεμακελόπινην
κεγέζνπο 105,000DWT, ελώ ζηνλ Πίλαθα 1.4 γηα ην ίδην πινίν παξνπζηάδεηαη ε ιίζηα ησλ θνξηίσλ πνπ
απνηεινύλ ηνπο ηππηθνύο θύξηνπο θαηαλαισηέο πνπ ζπκκεηέρνπλ ζηηο βηνκεραληθέο δηεξγαζίεο ησλ πινίσλ,
ε ελεξγεηαθή βειηηζηνπνίεζε ησλ νπνίσλ κπνξεί λα νδεγήζεη ζε εμνηθνλόκεζε θαπζίκνπ από ηηο Ζ/Γ. To
ηππηθό απηό πινίν απνηειεί θαη ην ζεκείν αλαθνξάο ζηηο θαηά πεξίπησζε κειέηεο θαζόιε ηε Γηαηξηβή.
Πίλαθαο 1.3: Μειέηε θνξηίνπ αλά ιεηηνπξγηθή θαηάζηαζε & δηαζηαζηνιόγεζε Η/Γ δεμακελόπινηνπ 105,000DWT
31 Πξνζαξκνζηηθόο έιεγρνο ηνπνινγίαο ξπζκηζηώλ ζηξνθώλ γηα εμνηθνλόκεζε ελέξγεηαο ζε πινία
ΔΙΔΑΚΣΟΡΙΚΗ ΔΙΑΣΡΙΒΗ
ΠΤΡΙΔΩΝ Β. ΓΙΑΝΝΟΤΣΟ
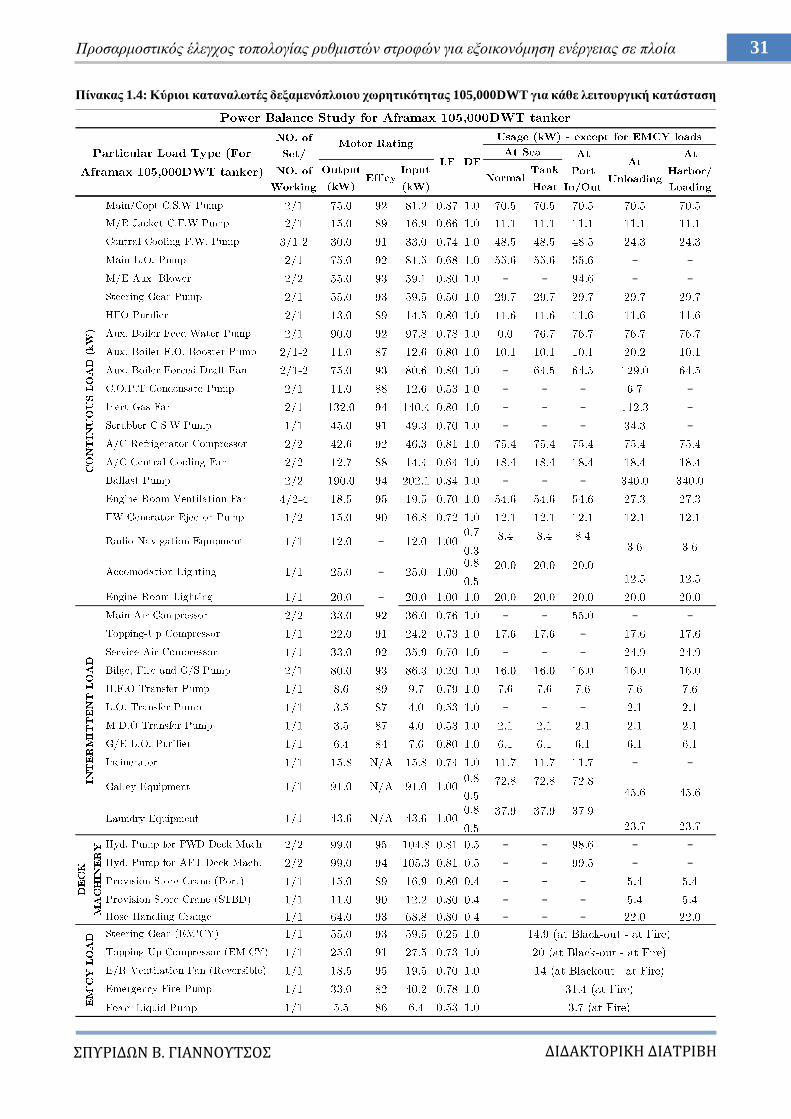
Πίλαθαο 1.4: Κύξηνη θαηαλαισηέο δεμακελόπινηνπ ρσξεηηθόηεηαο 105,000DWT γηα θάζε ιεηηνπξγηθή θαηάζηαζε
− −
− − − −
−
− − − −
− − − −
− − − −
− − −
−
−
−
− − − −
−
− − −
− − −
− −
− − − −
− − − −
− − −
− − −
− − −
32 Κεθάιαην 1 Δηζαγσγή – Κίλεηξα θαη ζηόρνη Γηαηξηβήο
ΔΙΔΑΚΣΟΡΙΚΗ ΔΙΑΣΡΙΒΗ
ΠΤΡΙΔΩΝ Β. ΓΙΑΝΝΟΤΣΟ
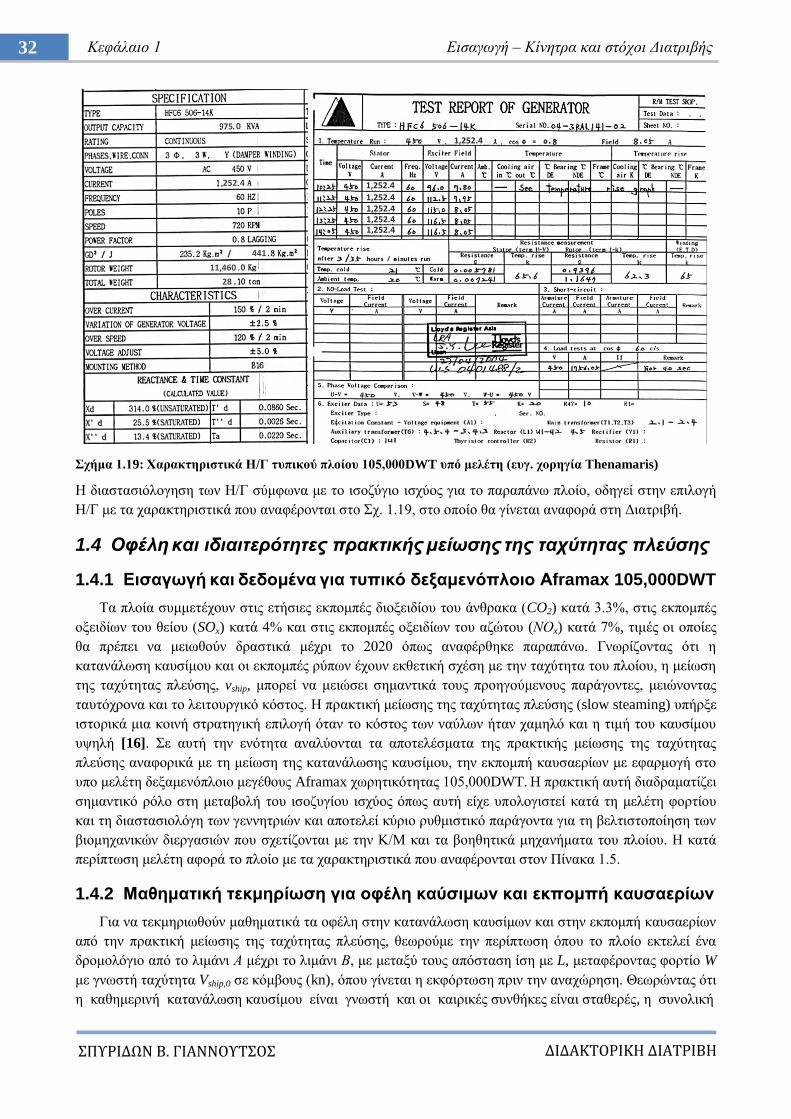
ρήκα 1.19: Υαξαθηεξηζηηθά Η/Γ ηππηθνύ πινίνπ 105,000DWT ππό κειέηε (επγ. ρνξεγία Σhenamaris)
Ζ δηαζηαζηόινγεζε ησλ Ζ/Γ ζύκθσλα κε ην ηζνδύγην ηζρύνο γηα ην παξαπάλσ πινίν, νδεγεί ζηελ επηινγή
Ζ/Γ κε ηα ραξαθηεξηζηηθά πνπ αλαθέξνληαη ζην ρ. 1.19, ζην νπνίν ζα γίλεηαη αλαθνξά ζηε Γηαηξηβή.
1.4 Οθέλη και ιδιαιηεπόηηηερ ππακηικήρ μείυζηρ ηηρ ηασύηηηαρ πλεύζηρ
1.4.1 Δηζαγσγή θαη δεδνκέλα γηα ηππηθό δεμακελόπινην Αframax 105,000DWT
Σα πινία ζπκκεηέρνπλ ζηηο εηήζηεο εθπνκπέο δηνμεηδίνπ ηνπ άλζξαθα (CO2) θαηά 3.3%, ζηηο εθπνκπέο
νμεηδίσλ ηνπ ζείνπ (SOx) θαηά 4% θαη ζηηο εθπνκπέο νμεηδίσλ ηνπ αδώηνπ (ΝΟx) θαηά 7%, ηηκέο νη νπνίεο
ζα πξέπεη λα κεησζνύλ δξαζηηθά κέρξη ην 2020 όπσο αλαθέξζεθε παξαπάλσ. Γλσξίδνληαο όηη ε
θαηαλάισζε θαπζίκνπ θαη νη εθπνκπέο ξύπσλ έρνπλ εθζεηηθή ζρέζε κε ηελ ηαρύηεηα ηνπ πινίνπ, ε κείσζε
ηεο ηαρύηεηαο πιεύζεο, vship, κπνξεί λα κεηώζεη ζεκαληηθά ηνπο πξνεγνύκελνπο παξάγνληεο, κεηώλνληαο
ηαπηόρξνλα θαη ην ιεηηνπξγηθό θόζηνο. Ζ πξαθηηθή κείσζεο ηεο ηαρύηεηαο πιεύζεο (slow steaming) ππήξμε
ηζηνξηθά κηα θνηλή ζηξαηεγηθή επηινγή όηαλ ην θόζηνο ησλ λαύισλ ήηαλ ρακειό θαη ε ηηκή ηνπ θαπζίκνπ
πςειή [16]. ε απηή ηελ ελόηεηα αλαιύνληαη ηα απνηειέζκαηα ηεο πξαθηηθήο κείσζεο ηεο ηαρύηεηαο
πιεύζεο αλαθνξηθά κε ηε κείσζε ηεο θαηαλάισζεο θαπζίκνπ, ηελ εθπνκπή θαπζαεξίσλ κε εθαξκνγή ζην
ππν κειέηε δεμακελόπινην κεγέζνπο Aframax ρσξεηηθόηεηαο 105,000DWT. Ζ πξαθηηθή απηή δηαδξακαηίδεη
ζεκαληηθό ξόιν ζηε κεηαβνιή ηνπ ηζνδπγίνπ ηζρύνο όπσο απηή είρε ππνινγηζηεί θαηά ηε κειέηε θνξηίνπ
θαη ηε δηαζηαζηνιόγε ησλ γελλεηξηώλ θαη απνηειεί θύξην ξπζκηζηηθό παξάγνληα γηα ηε βειηηζηνπνίεζε ησλ
βηνκεραληθώλ δηεξγαζηώλ πνπ ζρεηίδνληαη κε ηελ Κ/Μ θαη ηα βνεζεηηθά κεραλήκαηα ηνπ πινίνπ. Ζ θαηά
πεξίπησζε κειέηε αθνξά ην πινίν κε ηα ραξαθηεξηζηηθά πνπ αλαθέξνληαη ζηνλ Πίλαθα 1.5.
1.4.2 Μαζεκαηηθή ηεθκεξίσζε γηα νθέιε θαύζηκσλ θαη εθπνκπή θαπζαεξίσλ
Γηα λα ηεθκεξησζνύλ καζεκαηηθά ηα νθέιε ζηελ θαηαλάισζε θαπζίκσλ θαη ζηελ εθπνκπή θαπζαεξίσλ
από ηελ πξαθηηθή κείσζεο ηεο ηαρύηεηαο πιεύζεο, ζεσξνύκε ηελ πεξίπησζε όπνπ ην πινίν εθηειεί έλα
δξνκνιόγην από ην ιηκάλη Α κέρξη ην ιηκάλη Β, κε κεηαμύ ηνπο απόζηαζε ίζε κε L, κεηαθέξνληαο θνξηίν W
κε γλσζηή ηαρύηεηα Vship,0 ζε θόκβνπο (kn), όπνπ γίλεηαη ε εθθόξησζε πξηλ ηελ αλαρώξεζε. Θεσξώληαο όηη
ε θαζεκεξηλή θαηαλάισζε θαπζίκνπ είλαη γλσζηή θαη νη θαηξηθέο ζπλζήθεο είλαη ζηαζεξέο, ε ζπλνιηθή
f (Hz)
75 0
252 4
1,252.4
1,252.4
1,252.41,252.41,252.4
1,252.4
441
11,460
28
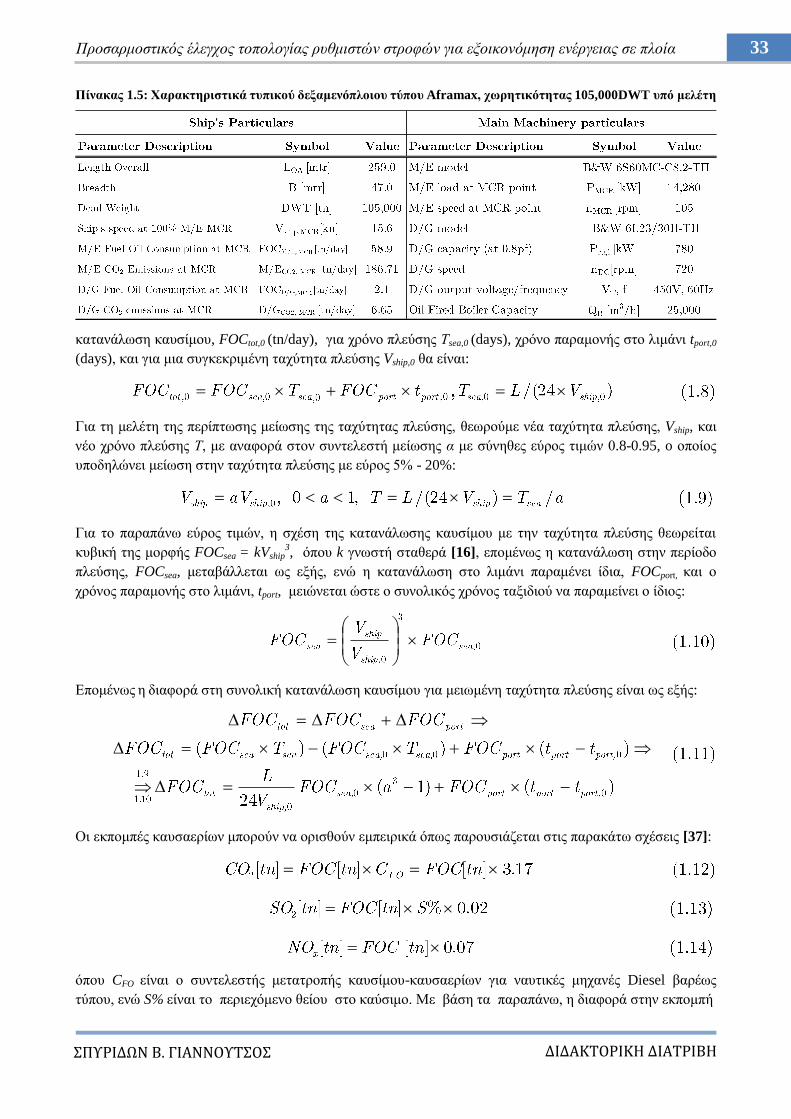
33 Πξνζαξκνζηηθόο έιεγρνο ηνπνινγίαο ξπζκηζηώλ ζηξνθώλ γηα εμνηθνλόκεζε ελέξγεηαο ζε πινία
ΔΙΔΑΚΣΟΡΙΚΗ ΔΙΑΣΡΙΒΗ
ΠΤΡΙΔΩΝ Β. ΓΙΑΝΝΟΤΣΟ
Πίλαθαο 1.5: Υαξαθηεξηζηηθά ηππηθνύ δεμακελόπινηνπ ηύπνπ Aframax, ρσξεηηθόηεηαο 105,000DWT ππό κειέηε
θαηαλάισζε θαπζίκνπ, FOCtot,0 (tn/day), γηα ρξόλν πιεύζεο Σsea,0 (days), ρξόλν παξακνλήο ζην ιηκάλη tport,0
(days), θαη γηα κηα ζπγθεθξηκέλε ηαρύηεηα πιεύζεο Vship,0 ζα είλαη:
Γηα ηε κειέηε ηεο πεξίπησζεο κείσζεο ηεο ηαρύηεηαο πιεύζεο, ζεσξνύκε λέα ηαρύηεηα πιεύζεο, Vship, θαη
λέν ρξόλν πιεύζεο Σ, κε αλαθνξά ζηνλ ζπληειεζηή κείσζεο α κε ζύλεζεο εύξνο ηηκώλ 0.8-0.95, o νπνίνο
ππνδειώλεη κείσζε ζηελ ηαρύηεηα πιεύζεο κε εύξνο 5% - 20%:
Γηα ην παξαπάλσ εύξνο ηηκώλ, ε ζρέζε ηεο θαηαλάισζεο θαπζίκνπ κε ηελ ηαρύηεηα πιεύζεο ζεσξείηαη
θπβηθή ηεο κνξθήο FOCsea = kVship3, όπνπ k γλσζηή ζηαζεξά [16], επνκέλσο ε θαηαλάισζε ζηελ πεξίνδν
πιεύζεο, FOCsea, κεηαβάιιεηαη σο εμήο, ελώ ε θαηαλάισζε ζην ιηκάλη παξακέλεη ίδηα, FOCport, θαη ν
ρξόλνο παξακνλήο ζην ιηκάλη, tport, κεηώλεηαη ώζηε ν ζπλνιηθόο ρξόλνο ηαμηδηνύ λα παξακείλεη ν ίδηνο:
Δπνκέλσο ε δηαθνξά ζηε ζπλνιηθή θαηαλάισζε θαπζίκνπ γηα κεησκέλε ηαρύηεηα πιεύζεο είλαη σο εμήο:
Οη εθπνκπέο θαπζαεξίσλ κπνξνύλ λα νξηζζνύλ εκπεηξηθά όπσο παξνπζηάδεηαη ζηηο παξαθάησ ζρέζεηο [37]:
όπνπ CFO είλαη ν ζπληειεζηήο κεηαηξνπήο θαπζίκνπ-θαπζαεξίσλ γηα λαπηηθέο κεραλέο Diesel βαξέσο
ηύπνπ, ελώ S% είλαη ην πεξηερόκελν ζείνπ ζην θαύζηκν. Με βάζε ηα παξαπάλσ, ε δηαθνξά ζηελ εθπνκπή
,
,
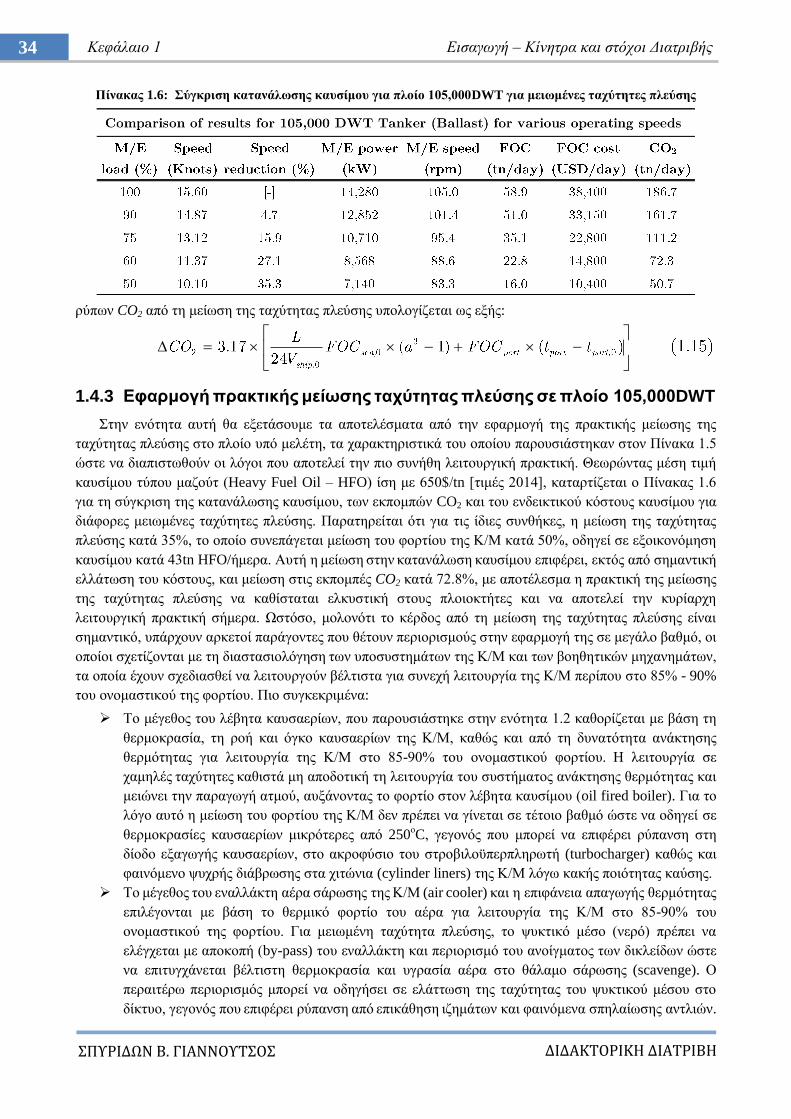
34 Κεθάιαην 1 Δηζαγσγή – Κίλεηξα θαη ζηόρνη Γηαηξηβήο
ΔΙΔΑΚΣΟΡΙΚΗ ΔΙΑΣΡΙΒΗ
ΠΤΡΙΔΩΝ Β. ΓΙΑΝΝΟΤΣΟ
Πίλαθαο 1.6: ύγθξηζε θαηαλάισζεο θαπζίκνπ γηα πινίν 105,000DWT γηα κεησκέλεο ηαρύηεηεο πιεύζεο
ξύπσλ CO2 από ηε κείσζε ηεο ηαρύηεηαο πιεύζεο ππνινγίδεηαη σο εμήο:
1.4.3 Δθαξκνγή πξαθηηθήο κείσζεο ηαρύηεηαο πιεύζεο ζε πινίν 105,000DWT
ηελ ελόηεηα απηή ζα εμεηάζνπκε ηα απνηειέζκαηα από ηελ εθαξκνγή ηεο πξαθηηθήο κείσζεο ηεο
ηαρύηεηαο πιεύζεο ζην πινίν ππό κειέηε, ηα ραξαθηεξηζηηθά ηνπ νπνίνπ παξνπζηάζηεθαλ ζηνλ Πίλαθα 1.5
ώζηε λα δηαπηζησζνύλ νη ιόγνη πνπ απνηειεί ηελ πην ζπλήζε ιεηηνπξγηθή πξαθηηθή. Θεσξώληαο κέζε ηηκή
θαπζίκνπ ηύπνπ καδνύη (Heavy Fuel Oil – HFO) ίζε κε 650$/tn [ηηκέο 2014], θαηαξηίδεηαη ν Πίλαθαο 1.6
γηα ηε ζύγθξηζε ηεο θαηαλάισζεο θαπζίκνπ, ησλ εθπνκπώλ CO2 θαη ηνπ ελδεηθηηθνύ θόζηνπο θαπζίκνπ γηα
δηάθνξεο κεησκέλεο ηαρύηεηεο πιεύζεο. Παξαηεξείηαη όηη γηα ηηο ίδηεο ζπλζήθεο, ε κείσζε ηεο ηαρύηεηαο
πιεύζεο θαηά 35%, ην νπνίν ζπλεπάγεηαη κείσζε ηνπ θνξηίνπ ηεο Κ/Μ θαηά 50%, νδεγεί ζε εμνηθνλόκεζε
θαπζίκνπ θαηά 43tn HFO/ήκεξα. Απηή ε κείσζε ζηελ θαηαλάισζε θαπζίκνπ επηθέξεη, εθηόο από ζεκαληηθή
ειιάησζε ηνπ θόζηνπο, θαη κείσζε ζηηο εθπνκπέο CO2 θαηά 72.8%, κε απνηέιεζκα ε πξαθηηθή ηεο κείσζεο
ηεο ηαρύηεηαο πιεύζεο λα θαζίζηαηαη ειθπζηηθή ζηνπο πινηνθηήηεο θαη λα απνηειεί ηελ θπξίαξρε
ιεηηνπξγηθή πξαθηηθή ζήκεξα. Χζηόζν, κνινλόηη ην θέξδνο από ηε κείσζε ηεο ηαρύηεηαο πιεύζεο είλαη
ζεκαληηθό, ππάξρνπλ αξθεηνί παξάγνληεο πνπ ζέηνπλ πεξηνξηζκνύο ζηελ εθαξκνγή ηεο ζε κεγάιν βαζκό, νη
νπνίνη ζρεηίδνληαη κε ηε δηαζηαζηνιόγεζε ησλ ππνζπζηεκάησλ ηεο Κ/Μ θαη ησλ βνεζεηηθώλ κεραλεκάησλ,
ηα νπνία έρνπλ ζρεδηαζζεί λα ιεηηνπξγνύλ βέιηηζηα γηα ζπλερή ιεηηνπξγία ηεο Κ/Μ πεξίπνπ ζην 85% - 90%
ηνπ νλνκαζηηθνύ ηεο θνξηίνπ. Πην ζπγθεθξηκέλα:
Σν κέγεζνο ηνπ ιέβεηα θαπζαεξίσλ, πνπ παξνπζηάζηεθε ζηελ ελόηεηα 1.2 θαζνξίδεηαη κε βάζε ηε
ζεξκνθξαζία, ηε ξνή θαη όγθν θαπζαεξίσλ ηεο Κ/Μ, θαζώο θαη από ηε δπλαηόηεηα αλάθηεζεο
ζεξκόηεηαο γηα ιεηηνπξγία ηεο Κ/Μ ζην 85-90% ηνπ νλνκαζηηθνύ θνξηίνπ. Ζ ιεηηνπξγία ζε
ρακειέο ηαρύηεηεο θαζηζηά κε απνδνηηθή ηε ιεηηνπξγία ηνπ ζπζηήκαηνο αλάθηεζεο ζεξκόηεηαο θαη
κεηώλεη ηελ παξαγσγή αηκνύ, απμάλνληαο ην θνξηίν ζηνλ ιέβεηα θαπζίκνπ (oil fired boiler). Γηα ην
ιόγν απηό ε κείσζε ηνπ θνξηίνπ ηεο Κ/Μ δελ πξέπεη λα γίλεηαη ζε ηέηνην βαζκό ώζηε λα νδεγεί ζε
ζεξκνθξαζίεο θαπζαεξίσλ κηθξόηεξεο από 250νC, γεγνλόο πνπ κπνξεί λα επηθέξεη ξύπαλζε ζηε
δίνδν εμαγσγήο θαπζαεξίσλ, ζην αθξνθύζην ηνπ ζηξνβηινϋπεξπιεξσηή (turbocharger) θαζώο θαη
θαηλόκελν ςπρξήο δηάβξσζεο ζηα ρηηώληα (cylinder liners) ηεο Κ/Μ ιόγσ θαθήο πνηόηεηαο θαύζεο.
Σν κέγεζνο ηνπ ελαιιάθηε αέξα ζάξσζεο ηεο Κ/Μ (air cooler) θαη ε επηθάλεηα απαγσγήο ζεξκόηεηαο
επηιέγνληαη κε βάζε ην ζεξκηθό θνξηίν ηνπ αέξα γηα ιεηηνπξγία ηεο Κ/Μ ζην 85-90% ηνπ
νλνκαζηηθνύ ηεο θνξηίνπ. Γηα κεησκέλε ηαρύηεηα πιεύζεο, ην ςπθηηθό κέζν (λεξό) πξέπεη λα
ειέγρεηαη κε απνθνπή (by-pass) ηνπ ελαιιάθηε θαη πεξηνξηζκό ηνπ αλνίγκαηνο ησλ δηθιείδσλ ώζηε
λα επηηπγράλεηαη βέιηηζηε ζεξκνθξαζία θαη πγξαζία αέξα ζην ζάιακν ζάξσζεο (scavenge). Ο
πεξαηηέξσ πεξηνξηζκόο κπνξεί λα νδεγήζεη ζε ειάηησζε ηεο ηαρύηεηαο ηνπ ςπθηηθνύ κέζνπ ζην
δίθηπν, γεγνλόο πνπ επηθέξεη ξύπαλζε από επηθάζεζε ηδεκάησλ θαη θαηλόκελα ζπειαίσζεο αληιηώλ.
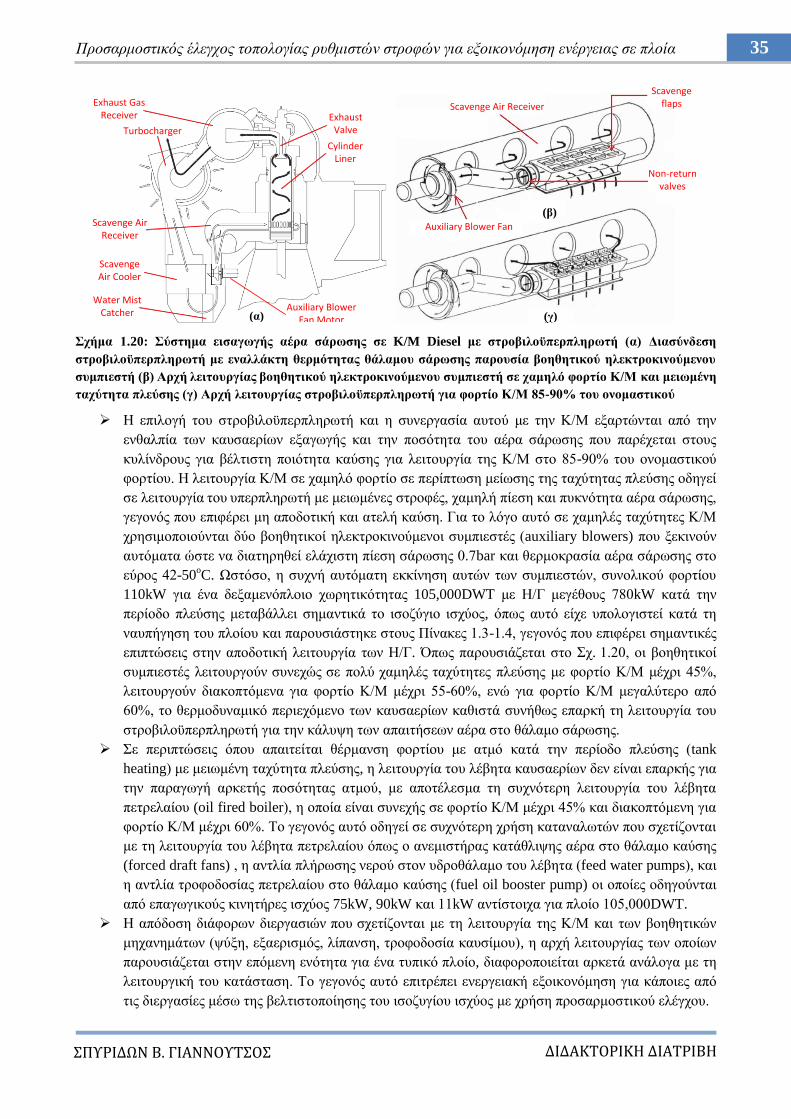
35 Πξνζαξκνζηηθόο έιεγρνο ηνπνινγίαο ξπζκηζηώλ ζηξνθώλ γηα εμνηθνλόκεζε ελέξγεηαο ζε πινία
ΔΙΔΑΚΣΟΡΙΚΗ ΔΙΑΣΡΙΒΗ
ΠΤΡΙΔΩΝ Β. ΓΙΑΝΝΟΤΣΟ
ρήκα 1.20: ύζηεκα εηζαγσγήο αέξα ζάξσζεο ζε K/M Diesel κε ζηξνβηινϋπεξπιεξσηή (α) Γηαζύλδεζε
ζηξνβηινϋπεξπιεξσηή κε ελαιιάθηε ζεξκόηεηαο ζάιακνπ ζάξσζεο παξνπζία βνεζεηηθνύ ειεθηξνθηλνύκελνπ
ζπκπηεζηή (β) Αξρή ιεηηνπξγίαο βνεζεηηθνύ ειεθηξνθηλνύκελνπ ζπκπηεζηή ζε ρακειό θνξηίν Κ/Μ θαη κεησκέλε
ηαρύηεηα πιεύζεο (γ) Αξρή ιεηηνπξγίαο ζηξνβηινϋπεξπιεξσηή γηα θνξηίν Κ/Μ 85-90% ηνπ νλνκαζηηθνύ
Ζ επηινγή ηνπ ζηξνβηινϋπεξπιεξσηή θαη ε ζπλεξγαζία απηνύ κε ηελ Κ/Μ εμαξηώληαη από ηελ
ελζαιπία ησλ θαπζαεξίσλ εμαγσγήο θαη ηελ πνζόηεηα ηνπ αέξα ζάξσζεο πνπ παξέρεηαη ζηνπο
θπιίλδξνπο γηα βέιηηζηε πνηόηεηα θαύζεο γηα ιεηηνπξγία ηεο Κ/Μ ζην 85-90% ηνπ νλνκαζηηθνύ
θνξηίνπ. Ζ ιεηηνπξγία Κ/Μ ζε ρακειό θνξηίν ζε πεξίπησζε κείσζεο ηεο ηαρύηεηαο πιεύζεο νδεγεί
ζε ιεηηνπξγία ηνπ ππεξπιεξσηή κε κεησκέλεο ζηξνθέο, ρακειή πίεζε θαη ππθλόηεηα αέξα ζάξσζεο,
γεγνλόο πνπ επηθέξεη κε απνδνηηθή θαη αηειή θαύζε. Γηα ην ιόγν απηό ζε ρακειέο ηαρύηεηεο Κ/Μ
ρξεζηκνπνηνύληαη δύν βνεζεηηθνί ειεθηξνθηλνύκελνη ζπκπηεζηέο (auxiliary blowers) πνπ μεθηλνύλ
απηόκαηα ώζηε λα δηαηεξεζεί ειάρηζηε πίεζε ζάξσζεο 0.7bar θαη ζεξκνθξαζία αέξα ζάξσζεο ζην
εύξνο 42-50oC. Χζηόζν, ε ζπρλή απηόκαηε εθθίλεζε απηώλ ησλ ζπκπηεζηώλ, ζπλνιηθνύ θνξηίνπ
110kW γηα έλα δεμακελόπινην ρσξεηηθόηεηαο 105,000DWT κε Ζ/Γ κεγέζνπο 780kW θαηά ηελ
πεξίνδν πιεύζεο κεηαβάιιεη ζεκαληηθά ην ηζνδύγην ηζρύνο, όπσο απηό είρε ππνινγηζηεί θαηά ηε
λαππήγεζε ηνπ πινίνπ θαη παξνπζηάζηεθε ζηνπο Πίλαθεο 1.3-1.4, γεγνλόο πνπ επηθέξεη ζεκαληηθέο
επηπηώζεηο ζηελ απνδνηηθή ιεηηνπξγία ησλ Ζ/Γ. Όπσο παξνπζηάδεηαη ζην ρ. 1.20, νη βνεζεηηθνί
ζπκπηεζηέο ιεηηνπξγνύλ ζπλερώο ζε πνιύ ρακειέο ηαρύηεηεο πιεύζεο κε θνξηίν Κ/Μ κέρξη 45%,
ιεηηνπξγνύλ δηαθνπηόκελα γηα θνξηίν Κ/Μ κέρξη 55-60%, ελώ γηα θνξηίν Κ/Μ κεγαιύηεξν από
60%, ην ζεξκνδπλακηθό πεξηερόκελν ησλ θαπζαεξίσλ θαζηζηά ζπλήζσο επαξθή ηε ιεηηνπξγία ηνπ
ζηξνβηινϋπεξπιεξσηή γηα ηελ θάιπςε ησλ απαηηήζεσλ αέξα ζην ζάιακν ζάξσζεο.
ε πεξηπηώζεηο όπνπ απαηηείηαη ζέξκαλζε θνξηίνπ κε αηκό θαηά ηελ πεξίνδν πιεύζεο (tank
heating) κε κεησκέλε ηαρύηεηα πιεύζεο, ε ιεηηνπξγία ηνπ ιέβεηα θαπζαεξίσλ δελ είλαη επαξθήο γηα
ηελ παξαγσγή αξθεηήο πνζόηεηαο αηκνύ, κε απνηέιεζκα ηε ζπρλόηεξε ιεηηνπξγία ηνπ ιέβεηα
πεηξειαίνπ (oil fired boiler), ε νπνία είλαη ζπλερήο ζε θνξηίν Κ/Μ κέρξη 45% θαη δηαθνπηόκελε γηα
θνξηίν Κ/Μ κέρξη 60%. Σν γεγνλόο απηό νδεγεί ζε ζπρλόηεξε ρξήζε θαηαλαισηώλ πνπ ζρεηίδνληαη
κε ηε ιεηηνπξγία ηνπ ιέβεηα πεηξειαίνπ όπσο ν αλεκηζηήξαο θαηάζιηςεο αέξα ζην ζάιακν θαύζεο
(forced draft fans) , ε αληιία πιήξσζεο λεξνύ ζηνλ πδξνζάιακν ηνπ ιέβεηα (feed water pumps), θαη
ε αληιία ηξνθνδνζίαο πεηξειαίνπ ζην ζάιακν θαύζεο (fuel oil booster pump) νη νπνίεο νδεγνύληαη
από επαγσγηθνύο θηλεηήξεο ηζρύνο 75kW, 90kW θαη 11kW αληίζηνηρα γηα πινίν 105,000DWT.
Ζ απόδνζε δηάθνξσλ δηεξγαζηώλ πνπ ζρεηίδνληαη κε ηε ιεηηνπξγία ηεο Κ/Μ θαη ησλ βνεζεηηθώλ
κεραλεκάησλ (ςύμε, εμαεξηζκόο, ιίπαλζε, ηξνθνδνζία θαπζίκνπ), ε αξρή ιεηηνπξγίαο ησλ νπνίσλ
παξνπζηάδεηαη ζηελ επόκελε ελόηεηα γηα έλα ηππηθό πινίν, δηαθνξνπνηείηαη αξθεηά αλάινγα κε ηε
ιεηηνπξγηθή ηνπ θαηάζηαζε. Σν γεγνλόο απηό επηηξέπεη ελεξγεηαθή εμνηθνλόκεζε γηα θάπνηεο από
ηηο δηεξγαζίεο κέζσ ηεο βειηηζηνπνίεζεο ηνπ ηζνδπγίνπ ηζρύνο κε ρξήζε πξνζαξκνζηηθνύ ειέγρνπ.
Exhaust Gas Receiver
Turbocharger
Scavenge Air Receiver
Scavenge Air Cooler
Water Mist Catcher
Exhaust Valve
Cylinder Liner
Auxiliary Blower Fan Motor(α)
Scavenge Air Receiver
Scavenge flaps
Non-return valves
Auxiliary Blower Fan
(β)
(γ)
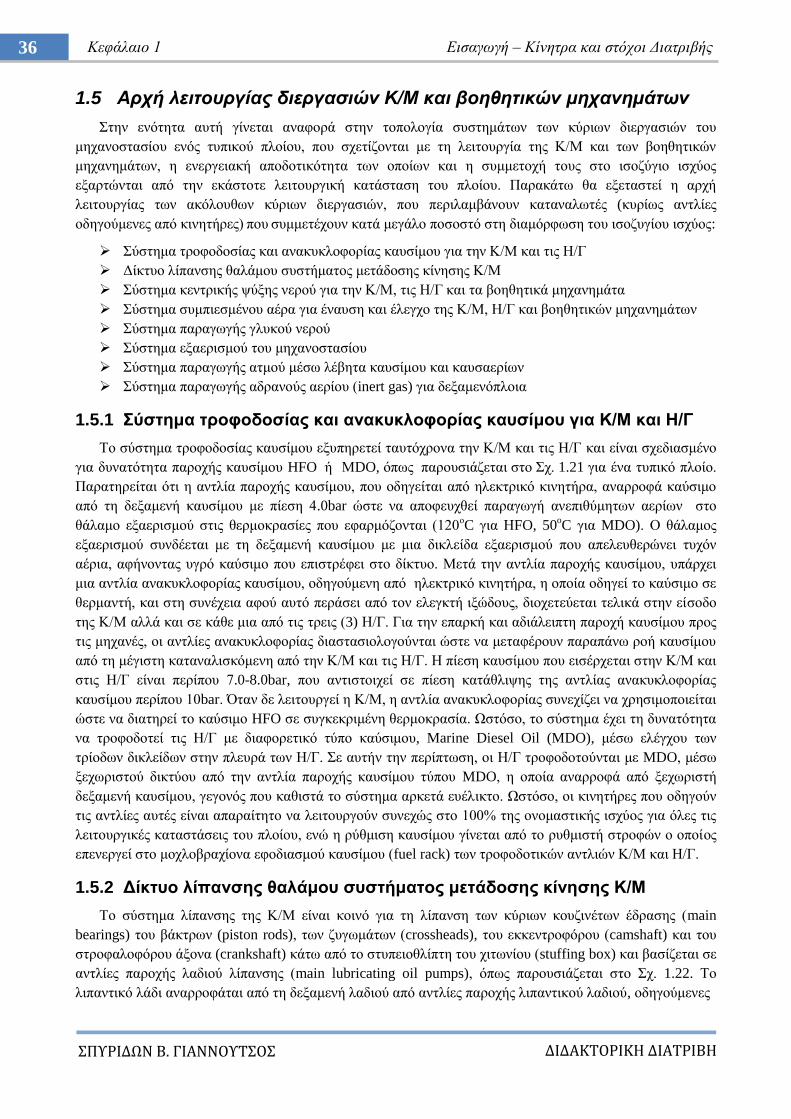
36 Κεθάιαην 1 Δηζαγσγή – Κίλεηξα θαη ζηόρνη Γηαηξηβήο
ΔΙΔΑΚΣΟΡΙΚΗ ΔΙΑΣΡΙΒΗ
ΠΤΡΙΔΩΝ Β. ΓΙΑΝΝΟΤΣΟ
1.5 Απσή λειηοςπγίαρ διεπγαζιών Κ/Μ και βοηθηηικών μησανημάηυν
ηελ ελόηεηα απηή γίλεηαη αλαθνξά ζηελ ηνπνινγία ζπζηεκάησλ ησλ θύξησλ δηεξγαζηώλ ηνπ
κεραλνζηαζίνπ ελόο ηππηθνύ πινίνπ, πνπ ζρεηίδνληαη κε ηε ιεηηνπξγία ηεο Κ/Μ θαη ησλ βνεζεηηθώλ
κεραλεκάησλ, ε ελεξγεηαθή απνδνηηθόηεηα ησλ νπνίσλ θαη ε ζπκκεηνρή ηνπο ζην ηζνδύγην ηζρύνο
εμαξηώληαη από ηελ εθάζηνηε ιεηηνπξγηθή θαηάζηαζε ηνπ πινίνπ. Παξαθάησ ζα εμεηαζηεί ε αξρή
ιεηηνπξγίαο ησλ αθόινπζσλ θύξησλ δηεξγαζηώλ, πνπ πεξηιακβάλνπλ θαηαλαισηέο (θπξίσο αληιίεο
νδεγνύκελεο από θηλεηήξεο) πνπ ζπκκεηέρνπλ θαηά κεγάιν πνζνζηό ζηε δηακόξθσζε ηνπ ηζνδπγίνπ ηζρύνο:
ύζηεκα ηξνθνδνζίαο θαη αλαθπθινθνξίαο θαπζίκνπ γηα ηελ Κ/Μ θαη ηηο Ζ/Γ
Γίθηπν ιίπαλζεο ζαιάκνπ ζπζηήκαηνο κεηάδνζεο θίλεζεο Κ/Μ
ύζηεκα θεληξηθήο ςύμεο λεξνύ γηα ηελ Κ/Μ, ηηο Ζ/Γ θαη ηα βνεζεηηθά κεραλεκάηα
ύζηεκα ζπκπηεζκέλνπ αέξα γηα έλαπζε θαη έιεγρν ηεο Κ/Μ, Ζ/Γ θαη βνεζεηηθώλ κεραλεκάησλ
ύζηεκα παξαγσγήο γιπθνύ λεξνύ
ύζηεκα εμαεξηζκνύ ηνπ κεραλνζηαζίνπ
ύζηεκα παξαγσγήο αηκνύ κέζσ ιέβεηα θαπζίκνπ θαη θαπζαεξίσλ
ύζηεκα παξαγσγήο αδξαλνύο αεξίνπ (inert gas) γηα δεμακελόπινηα
1.5.1 ύζηεκα ηξνθνδνζίαο θαη αλαθπθινθνξίαο θαπζίκνπ γηα Κ/Μ θαη Η/Γ
Σν ζύζηεκα ηξνθνδνζίαο θαπζίκνπ εμππεξεηεί ηαπηόρξνλα ηελ Κ/Μ θαη ηηο Ζ/Γ θαη είλαη ζρεδηαζκέλν
γηα δπλαηόηεηα παξνρήο θαπζίκνπ HFO ή ΜDO, όπσο παξνπζηάδεηαη ζην ρ. 1.21 γηα έλα ηππηθό πινίν.
Παξαηεξείηαη όηη ε αληιία παξνρήο θαπζίκνπ, πνπ νδεγείηαη από ειεθηξηθό θηλεηήξα, αλαξξνθά θαύζηκν
από ηε δεμακελή θαπζίκνπ κε πίεζε 4.0bar ώζηε λα απνθεπρζεί παξαγσγή αλεπηζύκεησλ αεξίσλ ζην
ζάιακν εμαεξηζκνύ ζηηο ζεξκνθξαζίεο πνπ εθαξκόδνληαη (120νC γηα ΖFO, 50
oC γηα MDO). Ο ζάιακνο
εμαεξηζκνύ ζπλδέεηαη κε ηε δεμακελή θαπζίκνπ κε κηα δηθιείδα εμαεξηζκνύ πνπ απειεπζεξώλεη ηπρόλ
αέξηα, αθήλνληαο πγξό θαύζηκν πνπ επηζηξέθεη ζην δίθηπν. Μεηά ηελ αληιία παξνρήο θαπζίκνπ, ππάξρεη
κηα αληιία αλαθπθινθνξίαο θαπζίκνπ, νδεγνύκελε από ειεθηξηθό θηλεηήξα, ε νπνία νδεγεί ην θαύζηκν ζε
ζεξκαληή, θαη ζηε ζπλέρεηα αθνύ απηό πεξάζεη από ηνλ ειεγθηή ημώδνπο, δηνρεηεύεηαη ηειηθά ζηελ είζνδν
ηεο Κ/Μ αιιά θαη ζε θάζε κηα από ηηο ηξεηο (3) Ζ/Γ. Γηα ηελ επαξθή θαη αδηάιεηπηε παξνρή θαπζίκνπ πξνο
ηηο κεραλέο, νη αληιίεο αλαθπθινθνξίαο δηαζηαζηνινγνύληαη ώζηε λα κεηαθέξνπλ παξαπάλσ ξνή θαπζίκνπ
από ηε κέγηζηε θαηαλαιηζθόκελε από ηελ Κ/Μ θαη ηηο Ζ/Γ. Ζ πίεζε θαπζίκνπ πνπ εηζέξρεηαη ζηελ Κ/Μ θαη
ζηηο Ζ/Γ είλαη πεξίπνπ 7.0-8.0bar, πνπ αληηζηνηρεί ζε πίεζε θαηάζιηςεο ηεο αληιίαο αλαθπθινθνξίαο
θαπζίκνπ πεξίπνπ 10bar. Όηαλ δε ιεηηνπξγεί ε Κ/Μ, ε αληιία αλαθπθινθνξίαο ζπλερίδεη λα ρξεζηκνπνηείηαη
ώζηε λα δηαηεξεί ην θαύζηκν HFO ζε ζπγθεθξηκέλε ζεξκνθξαζία. Χζηόζν, ην ζύζηεκα έρεη ηε δπλαηόηεηα
λα ηξνθνδνηεί ηηο Ζ/Γ κε δηαθνξεηηθό ηύπν θαύζηκνπ, Marine Diesel Oil (MDO), κέζσ ειέγρνπ ησλ
ηξίνδσλ δηθιείδσλ ζηελ πιεπξά ησλ Ζ/Γ. ε απηήλ ηελ πεξίπησζε, νη Ζ/Γ ηξνθνδνηνύληαη κε MDO, κέζσ
μερσξηζηνύ δηθηύνπ από ηελ αληιία παξνρήο θαπζίκνπ ηύπνπ MDO, ε νπνία αλαξξνθά από μερσξηζηή
δεμακελή θαπζίκνπ, γεγνλόο πνπ θαζηζηά ην ζύζηεκα αξθεηά επέιηθην. Χζηόζν, νη θηλεηήξεο πνπ νδεγνύλ
ηηο αληιίεο απηέο είλαη απαξαίηεην λα ιεηηνπξγνύλ ζπλερώο ζην 100% ηεο νλνκαζηηθήο ηζρύνο γηα όιεο ηηο
ιεηηνπξγηθέο θαηαζηάζεηο ηνπ πινίνπ, ελώ ε ξύζκηζε θαπζίκνπ γίλεηαη από ην ξπζκηζηή ζηξνθώλ ν νπνίνο
επελεξγεί ζην κνρινβξαρίνλα εθνδηαζκνύ θαπζίκνπ (fuel rack) ησλ ηξνθνδνηηθώλ αληιηώλ Κ/Μ θαη Ζ/Γ.
1.5.2 Γίθηπν ιίπαλζεο ζαιάκνπ ζπζηήκαηνο κεηάδνζεο θίλεζεο Κ/Μ
Σν ζύζηεκα ιίπαλζεο ηεο Κ/Μ είλαη θνηλό γηα ηε ιίπαλζε ησλ θύξησλ θνπδηλέησλ έδξαζεο (main
bearings) ηνπ βάθηξσλ (piston rods), ησλ δπγσκάησλ (crossheads), ηνπ εθθεληξνθόξνπ (camshaft) θαη ηνπ
ζηξνθαινθόξνπ άμνλα (crankshaft) θάησ από ην ζηππεηνζιίπηε ηνπ ρηησλίνπ (stuffing box) θαη βαζίδεηαη ζε
αληιίεο παξνρήο ιαδηνύ ιίπαλζεο (main lubricating oil pumps), όπσο παξνπζηάδεηαη ζην ρ. 1.22. Σν
ιηπαληηθό ιάδη αλαξξνθάηαη από ηε δεμακελή ιαδηνύ από αληιίεο παξνρήο ιηπαληηθνύ ιαδηνύ, νδεγνύκελεο
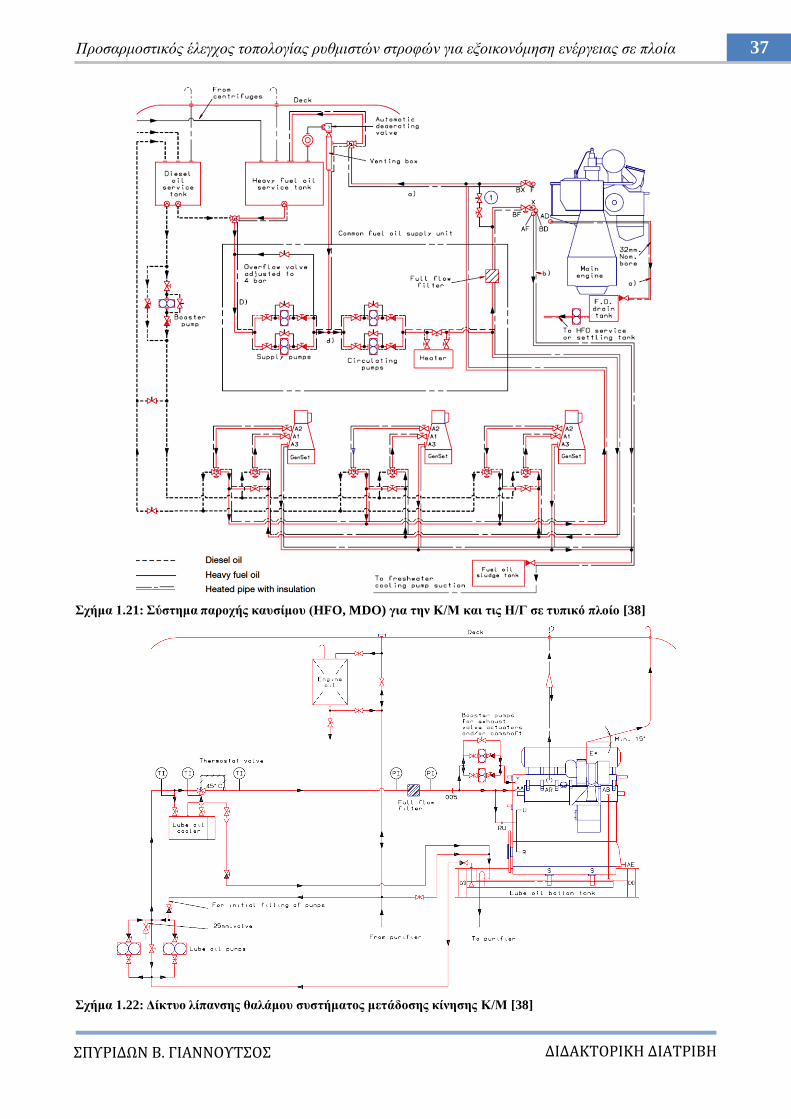
37 Πξνζαξκνζηηθόο έιεγρνο ηνπνινγίαο ξπζκηζηώλ ζηξνθώλ γηα εμνηθνλόκεζε ελέξγεηαο ζε πινία
ΔΙΔΑΚΣΟΡΙΚΗ ΔΙΑΣΡΙΒΗ
ΠΤΡΙΔΩΝ Β. ΓΙΑΝΝΟΤΣΟ
ρήκα 1.21: ύζηεκα παξνρήο θαπζίκνπ (HFO, MDO) γηα ηελ Κ/Μ θαη ηηο Η/Γ ζε ηππηθό πινίν [38]
ρήκα 1.22: Γίθηπν ιίπαλζεο ζαιάκνπ ζπζηήκαηνο κεηάδνζεο θίλεζεο Κ/Μ [38]
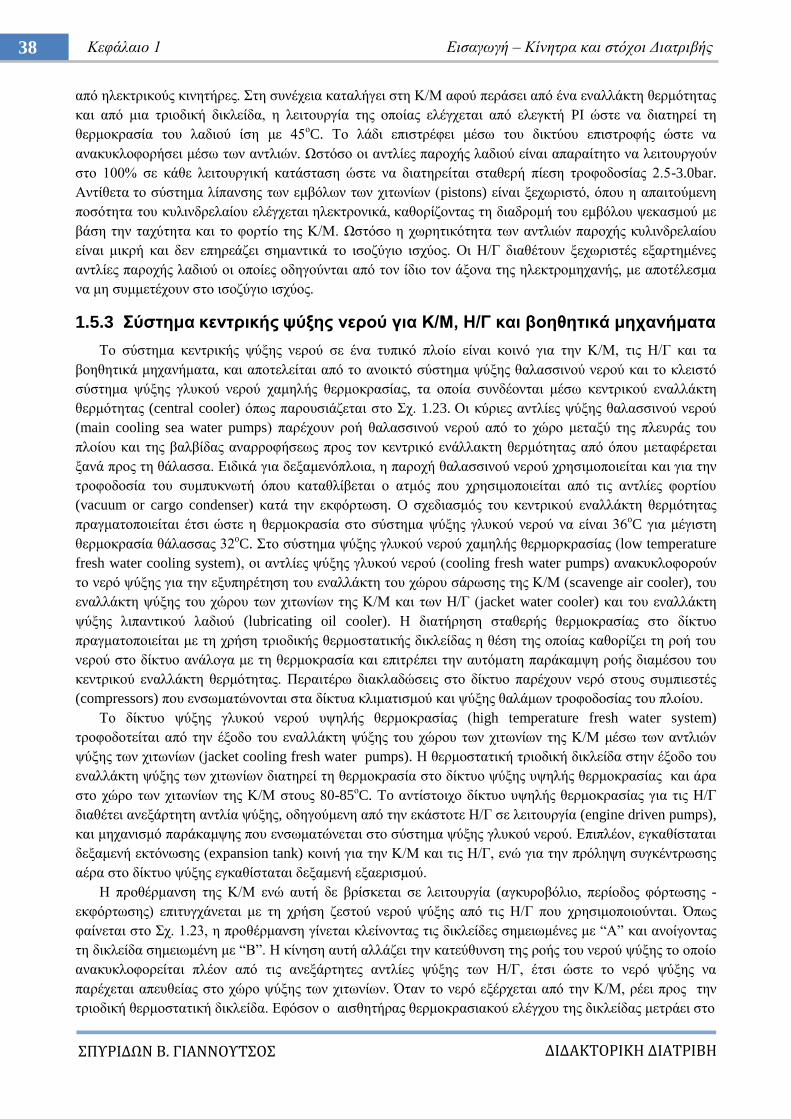
38 Κεθάιαην 1 Δηζαγσγή – Κίλεηξα θαη ζηόρνη Γηαηξηβήο
ΔΙΔΑΚΣΟΡΙΚΗ ΔΙΑΣΡΙΒΗ
ΠΤΡΙΔΩΝ Β. ΓΙΑΝΝΟΤΣΟ
από ειεθηξηθνύο θηλεηήξεο. ηε ζπλέρεηα θαηαιήγεη ζηε Κ/Μ αθνύ πεξάζεη από έλα ελαιιάθηε ζεξκόηεηαο
θαη από κηα ηξηνδηθή δηθιείδα, ε ιεηηνπξγία ηεο νπνίαο ειέγρεηαη από ειεγθηή PI ώζηε λα δηαηεξεί ηε
ζεξκνθξαζία ηνπ ιαδηνύ ίζε κε 45νC. Σν ιάδη επηζηξέθεη κέζσ ηνπ δηθηύνπ επηζηξνθήο ώζηε λα
αλαθπθινθνξήζεη κέζσ ησλ αληιηώλ. Χζηόζν νη αληιίεο παξνρήο ιαδηνύ είλαη απαξαίηεην λα ιεηηνπξγνύλ
ζην 100% ζε θάζε ιεηηνπξγηθή θαηάζηαζε ώζηε λα δηαηεξείηαη ζηαζεξή πίεζε ηξνθνδνζίαο 2.5-3.0bar.
Αληίζεηα ην ζύζηεκα ιίπαλζεο ησλ εκβόισλ ησλ ρηησλίσλ (pistons) είλαη μερσξηζηό, όπνπ ε απαηηνύκελε
πνζόηεηα ηνπ θπιηλδξειαίνπ ειέγρεηαη ειεθηξνληθά, θαζνξίδνληαο ηε δηαδξνκή ηνπ εκβόινπ ςεθαζκνύ κε
βάζε ηελ ηαρύηεηα θαη ην θνξηίν ηεο Κ/Μ. Χζηόζν ε ρσξεηηθόηεηα ησλ αληιηώλ παξνρήο θπιηλδξειαίνπ
είλαη κηθξή θαη δελ επεξεάδεη ζεκαληηθά ην ηζνδύγην ηζρύνο. Οη Ζ/Γ δηαζέηνπλ μερσξηζηέο εμαξηεκέλεο
αληιίεο παξνρήο ιαδηνύ νη νπνίεο νδεγνύληαη από ηνλ ίδην ηνλ άμνλα ηεο ειεθηξνκεραλήο, κε απνηέιεζκα
λα κε ζπκκεηέρνπλ ζην ηζνδύγην ηζρύνο.
1.5.3 ύζηεκα θεληξηθήο ςύμεο λεξνύ γηα Κ/Μ, Η/Γ θαη βνεζεηηθά κεραλήκαηα
Σν ζύζηεκα θεληξηθήο ςύμεο λεξνύ ζε έλα ηππηθό πινίν είλαη θνηλό γηα ηελ Κ/Μ, ηηο Ζ/Γ θαη ηα
βνεζεηηθά κεραλήκαηα, θαη απνηειείηαη από ην αλνηθηό ζύζηεκα ςύμεο ζαιαζζηλνύ λεξνύ θαη ην θιεηζηό
ζύζηεκα ςύμεο γιπθνύ λεξνύ ρακειήο ζεξκνθξαζίαο, ηα νπνία ζπλδένληαη κέζσ θεληξηθνύ ελαιιάθηε
ζεξκόηεηαο (central cooler) όπσο παξνπζηάδεηαη ζην ρ. 1.23. Οη θύξηεο αληιίεο ςύμεο ζαιαζζηλνύ λεξνύ
(main cooling sea water pumps) παξέρνπλ ξνή ζαιαζζηλνύ λεξνύ από ην ρώξν κεηαμύ ηεο πιεπξάο ηνπ
πινίνπ θαη ηεο βαιβίδαο αλαξξνθήζεσο πξνο ηνλ θεληξηθό ελάιιαθηε ζεξκόηεηαο από όπνπ κεηαθέξεηαη
μαλά πξνο ηε ζάιαζζα. Δηδηθά γηα δεμακελόπινηα, ε παξνρή ζαιαζζηλνύ λεξνύ ρξεζηκνπνηείηαη θαη γηα ηελ
ηξνθνδνζία ηνπ ζπκππθλσηή όπνπ θαηαζιίβεηαη ν αηκόο πνπ ρξεζηκνπνηείηαη από ηηο αληιίεο θνξηίνπ
(vacuum or cargo condenser) θαηά ηελ εθθόξησζε. O ζρεδηαζκόο ηνπ θεληξηθνύ ελαιιάθηε ζεξκόηεηαο
πξαγκαηνπνηείηαη έηζη ώζηε ε ζεξκνθξαζία ζην ζύζηεκα ςύμεο γιπθνύ λεξνύ λα είλαη 36oC γηα κέγηζηε
ζεξκνθξαζία ζάιαζζαο 32oC. ην ζύζηεκα ςύμεο γιπθνύ λεξνύ ρακειήο ζεξκνξθξαζίαο (low temperature
fresh water cooling system), νη αληιίεο ςύμεο γιπθνύ λεξνύ (cooling fresh water pumps) αλαθπθινθνξνύλ
ην λεξό ςύμεο γηα ηελ εμππεξέηεζε ηνπ ελαιιάθηε ηνπ ρώξνπ ζάξσζεο ηεο Κ/Μ (scavenge air cooler), ηνπ
ελαιιάθηε ςύμεο ηνπ ρώξνπ ησλ ρηησλίσλ ηεο Κ/Μ θαη ησλ Ζ/Γ (jacket water cooler) θαη ηνπ ελαιιάθηε
ςύμεο ιηπαληηθνύ ιαδηνύ (lubricating oil cooler). Ζ δηαηήξεζε ζηαζεξήο ζεξκνθξαζίαο ζην δίθηπν
πξαγκαηνπνηείηαη κε ηε ρξήζε ηξηνδηθήο ζεξκνζηαηηθήο δηθιείδαο ε ζέζε ηεο νπνίαο θαζνξίδεη ηε ξνή ηνπ
λεξνύ ζην δίθηπν αλάινγα κε ηε ζεξκνθξαζία θαη επηηξέπεη ηελ απηόκαηε παξάθακςε ξνήο δηακέζνπ ηνπ
θεληξηθνύ ελαιιάθηε ζεξκόηεηαο. Πεξαηηέξσ δηαθιαδώζεηο ζην δίθηπν παξέρνπλ λεξό ζηνπο ζπκπηεζηέο
(compressors) πνπ ελζσκαηώλνληαη ζηα δίθηπα θιηκαηηζκνύ θαη ςύμεο ζαιάκσλ ηξνθνδνζίαο ηνπ πινίνπ.
Σν δίθηπν ςύμεο γιπθνύ λεξνύ πςειήο ζεξκνθξαζίαο (high temperature fresh water system)
ηξνθνδνηείηαη από ηελ έμνδν ηνπ ελαιιάθηε ςύμεο ηνπ ρώξνπ ησλ ρηησλίσλ ηεο Κ/Μ κέζσ ησλ αληιηώλ
ςύμεο ησλ ρηησλίσλ (jacket cooling fresh water pumps). Ζ ζεξκνζηαηηθή ηξηνδηθή δηθιείδα ζηελ έμνδν ηνπ
ελαιιάθηε ςύμεο ησλ ρηησλίσλ δηαηεξεί ηε ζεξκνθξαζία ζην δίθηπν ςύμεο πςειήο ζεξκνθξαζίαο θαη άξα
ζην ρώξν ησλ ρηησλίσλ ηεο Κ/Μ ζηνπο 80-85νC. To αληίζηνηρν δίθηπν πςειήο ζεξκνθξαζίαο γηα ηηο Ζ/Γ
δηαζέηεη αλεμάξηεηε αληιία ςύμεο, νδεγνύκελε από ηελ εθάζηνηε Ζ/Γ ζε ιεηηνπξγία (engine driven pumps),
θαη κεραληζκό παξάθακςεο πνπ ελζσκαηώλεηαη ζην ζύζηεκα ςύμεο γιπθνύ λεξνύ. Δπηπιένλ, εγθαζίζηαηαη
δεμακελή εθηόλσζεο (expansion tank) θνηλή γηα ηελ Κ/Μ θαη ηηο Ζ/Γ, ελώ γηα ηελ πξόιεςε ζπγθέληξσζεο
αέξα ζην δίθηπν ςύμεο εγθαζίζηαηαη δεμακελή εμαεξηζκνύ.
Ζ πξνζέξκαλζε ηεο Κ/Μ ελώ απηή δε βξίζθεηαη ζε ιεηηνπξγία (αγθπξνβόιην, πεξίνδνο θόξησζεο -
εθθόξησζεο) επηηπγράλεηαη κε ηε ρξήζε δεζηνύ λεξνύ ςύμεο από ηηο Ζ/Γ πνπ ρξεζηκνπνηνύληαη. Όπσο
θαίλεηαη ζην ρ. 1.23, ε πξνζέξκαλζε γίλεηαη θιείλνληαο ηηο δηθιείδεο ζεκεησκέλεο κε “Α” θαη αλνίγνληαο
ηε δηθιείδα ζεκεησκέλε κε “Β”. Ζ θίλεζε απηή αιιάδεη ηελ θαηεύζπλζε ηεο ξνήο ηνπ λεξνύ ςύμεο ην νπνίν
αλαθπθινθνξείηαη πιένλ από ηηο αλεμάξηεηεο αληιίεο ςύμεο ησλ Ζ/Γ, έηζη ώζηε ην λεξό ςύμεο λα
παξέρεηαη απεπζείαο ζην ρώξν ςύμεο ησλ ρηησλίσλ. Όηαλ ην λεξό εμέξρεηαη από ηελ Κ/Μ, ξέεη πξνο ηελ
ηξηνδηθή ζεξκνζηαηηθή δηθιείδα. Δθόζνλ ν αηζζεηήξαο ζεξκνθξαζηαθνύ ειέγρνπ ηεο δηθιείδαο κεηξάεη ζην
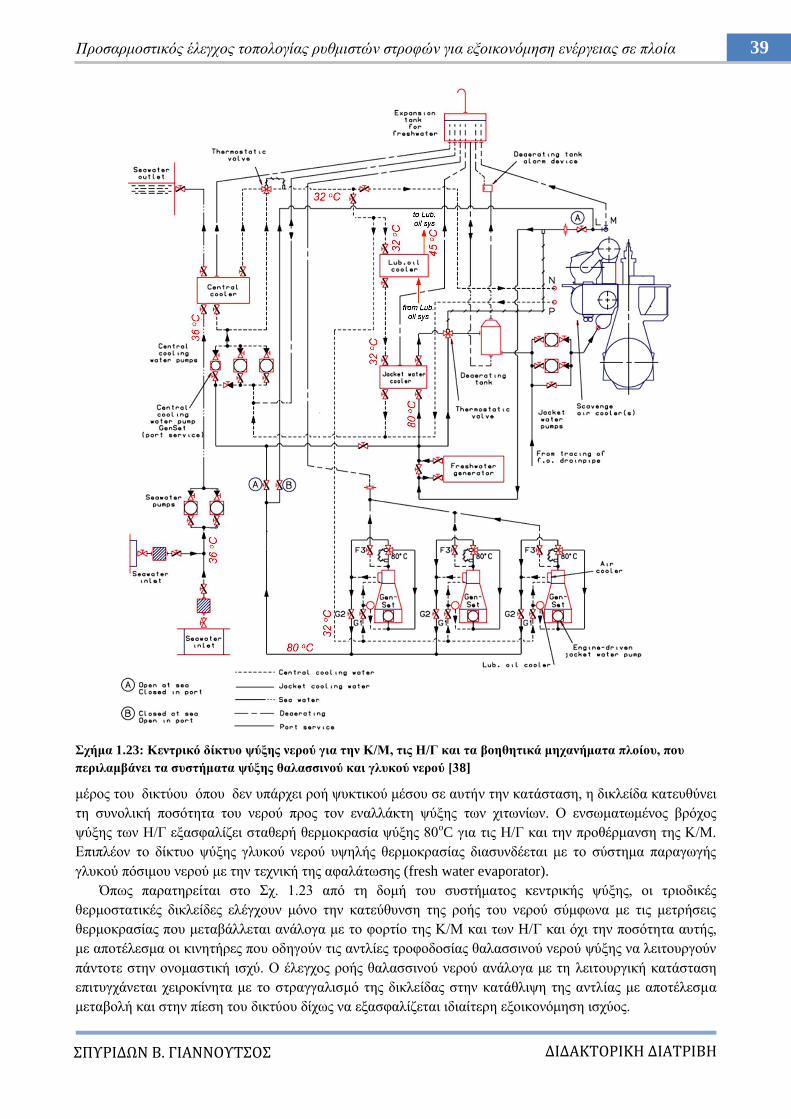
39 Πξνζαξκνζηηθόο έιεγρνο ηνπνινγίαο ξπζκηζηώλ ζηξνθώλ γηα εμνηθνλόκεζε ελέξγεηαο ζε πινία
ΔΙΔΑΚΣΟΡΙΚΗ ΔΙΑΣΡΙΒΗ
ΠΤΡΙΔΩΝ Β. ΓΙΑΝΝΟΤΣΟ
ρήκα 1.23: Κεληξηθό δίθηπν ςύμεο λεξνύ γηα ηελ Κ/Μ, ηηο Η/Γ θαη ηα βνεζεηηθά κεραλήκαηα πινίνπ, πνπ
πεξηιακβάλεη ηα ζπζηήκαηα ςύμεο ζαιαζζηλνύ θαη γιπθνύ λεξνύ [38]
κέξνο ηνπ δηθηύνπ όπνπ δελ ππάξρεη ξνή ςπθηηθνύ κέζνπ ζε απηήλ ηελ θαηάζηαζε, ε δηθιείδα θαηεπζύλεη
ηε ζπλνιηθή πνζόηεηα ηνπ λεξνύ πξνο ηνλ ελαιιάθηε ςύμεο ησλ ρηησλίσλ. Ο ελζσκαησκέλνο βξόρνο
ςύμεο ησλ Ζ/Γ εμαζθαιίδεη ζηαζεξή ζεξκνθξαζία ςύμεο 80oC γηα ηηο Ζ/Γ θαη ηελ πξνζέξκαλζε ηεο Κ/Μ.
Δπηπιένλ ην δίθηπν ςύμεο γιπθνύ λεξνύ πςειήο ζεξκνθξαζίαο δηαζπλδέεηαη κε ην ζύζηεκα παξαγσγήο
γιπθνύ πόζηκνπ λεξνύ κε ηελ ηερληθή ηεο αθαιάησζεο (fresh water evaporator).
Όπσο παξαηεξείηαη ζην ρ. 1.23 από ηε δνκή ηνπ ζπζηήκαηνο θεληξηθήο ςύμεο, νη ηξηνδηθέο
ζεξκνζηαηηθέο δηθιείδεο ειέγρνπλ κόλν ηελ θαηεύζπλζε ηεο ξνήο ηνπ λεξνύ ζύκθσλα κε ηηο κεηξήζεηο
ζεξκνθξαζίαο πνπ κεηαβάιιεηαη αλάινγα κε ην θνξηίν ηεο Κ/Μ θαη ησλ Ζ/Γ θαη όρη ηελ πνζόηεηα απηήο,
κε απνηέιεζκα νη θηλεηήξεο πνπ νδεγνύλ ηηο αληιίεο ηξνθνδνζίαο ζαιαζζηλνύ λεξνύ ςύμεο λα ιεηηνπξγνύλ
πάληνηε ζηελ νλνκαζηηθή ηζρύ. Ο έιεγρνο ξνήο ζαιαζζηλνύ λεξνύ αλάινγα κε ηε ιεηηνπξγηθή θαηάζηαζε
επηηπγράλεηαη ρεηξνθίλεηα κε ην ζηξαγγαιηζκό ηεο δηθιείδαο ζηελ θαηάζιηςε ηεο αληιίαο κε απνηέιεζκα
κεηαβνιή θαη ζηελ πίεζε ηνπ δηθηύνπ δίρσο λα εμαζθαιίδεηαη ηδηαίηεξε εμνηθνλόκεζε ηζρύνο.
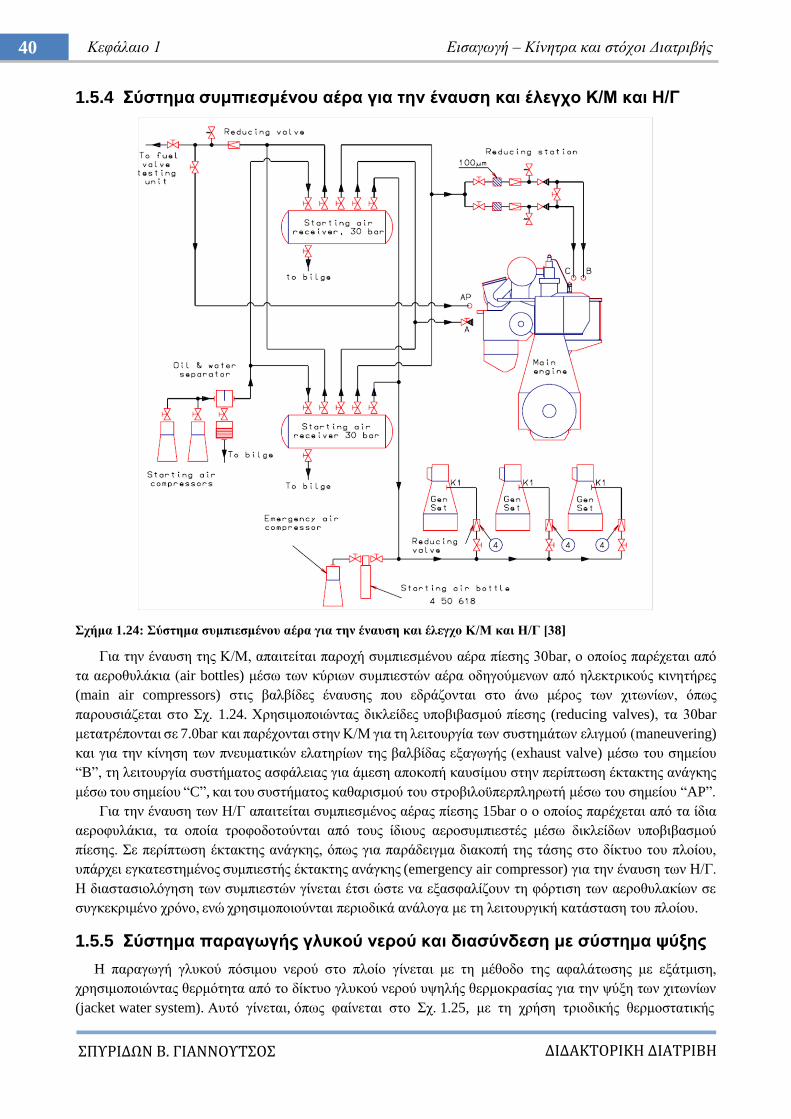
40 Κεθάιαην 1 Δηζαγσγή – Κίλεηξα θαη ζηόρνη Γηαηξηβήο
ΔΙΔΑΚΣΟΡΙΚΗ ΔΙΑΣΡΙΒΗ
ΠΤΡΙΔΩΝ Β. ΓΙΑΝΝΟΤΣΟ
1.5.4 ύζηεκα ζπκπηεζκέλνπ αέξα γηα ηελ έλαπζε θαη έιεγρν Κ/Μ θαη Η/Γ
ρήκα 1.24: ύζηεκα ζπκπηεζκέλνπ αέξα γηα ηελ έλαπζε θαη έιεγρν Κ/Μ θαη Η/Γ [38]
Γηα ηελ έλαπζε ηεο Κ/Μ, απαηηείηαη παξνρή ζπκπηεζκέλνπ αέξα πίεζεο 30bar, ν νπνίνο παξέρεηαη από
ηα αεξνζπιάθηα (air bottles) κέζσ ησλ θύξησλ ζπκπηεζηώλ αέξα νδεγνύκελσλ από ειεθηξηθνύο θηλεηήξεο
(main air compressors) ζηηο βαιβίδεο έλαπζεο πνπ εδξάδνληαη ζην άλσ κέξνο ησλ ρηησλίσλ, όπσο
παξνπζηάδεηαη ζην ρ. 1.24. Υξεζηκνπνηώληαο δηθιείδεο ππνβηβαζκνύ πίεζεο (reducing valves), ηα 30bar
κεηαηξέπνληαη ζε 7.0bar θαη παξέρνληαη ζηελ Κ/Μ γηα ηε ιεηηνπξγία ησλ ζπζηεκάησλ ειηγκνύ (maneuvering)
θαη γηα ηελ θίλεζε ησλ πλεπκαηηθώλ ειαηεξίσλ ηεο βαιβίδαο εμαγσγήο (exhaust valve) κέζσ ηνπ ζεκείνπ
“B”, ηε ιεηηνπξγία ζπζηήκαηνο αζθάιεηαο γηα άκεζε απνθνπή θαπζίκνπ ζηελ πεξίπησζε έθηαθηεο αλάγθεο
κέζσ ηνπ ζεκείνπ “C”, θαη ηνπ ζπζηήκαηνο θαζαξηζκνύ ηνπ ζηξνβηινϋπεξπιεξσηή κέζσ ηνπ ζεκείνπ “AP”.
Γηα ηελ έλαπζε ησλ Ζ/Γ απαηηείηαη ζπκπηεζκέλνο αέξαο πίεζεο 15bar o ν νπνίνο παξέρεηαη από ηα ίδηα
αεξνθπιάθηα, ηα νπνία ηξνθνδνηνύληαη από ηνπο ίδηνπο αεξνζπκπηεζηέο κέζσ δηθιείδσλ ππνβηβαζκνύ
πίεζεο. ε πεξίπησζε έθηαθηεο αλάγθεο, όπσο γηα παξάδεηγκα δηαθνπή ηεο ηάζεο ζην δίθηπν ηνπ πινίνπ,
ππάξρεη εγθαηεζηεκέλνο ζπκπηεζηήο έθηαθηεο αλάγθεο (emergency air compressor) γηα ηελ έλαπζε ησλ Ζ/Γ.
Ζ δηαζηαζηνιόγεζε ησλ ζπκπηεζηώλ γίλεηαη έηζη ώζηε λα εμαζθαιίδνπλ ηε θόξηηζε ησλ αεξνζπιαθίσλ ζε
ζπγθεθξηκέλν ρξόλν, ελώ ρξεζηκνπνηνύληαη πεξηνδηθά αλάινγα κε ηε ιεηηνπξγηθή θαηάζηαζε ηνπ πινίνπ.
1.5.5 ύζηεκα παξαγσγήο γιπθνύ λεξνύ θαη δηαζύλδεζε κε ζύζηεκα ςύμεο
H παξαγσγή γιπθνύ πόζηκνπ λεξνύ ζην πινίν γίλεηαη κε ηε κέζνδν ηεο αθαιάησζεο κε εμάηκηζε,
ρξεζηκνπνηώληαο ζεξκόηεηα από ην δίθηπν γιπθνύ λεξνύ πςειήο ζεξκνθξαζίαο γηα ηελ ςύμε ησλ ρηησλίσλ
(jacket water system). Απηό γίλεηαη, όπσο θαίλεηαη ζην ρ. 1.25, κε ηε ρξήζε ηξηνδηθήο ζεξκνζηαηηθήο
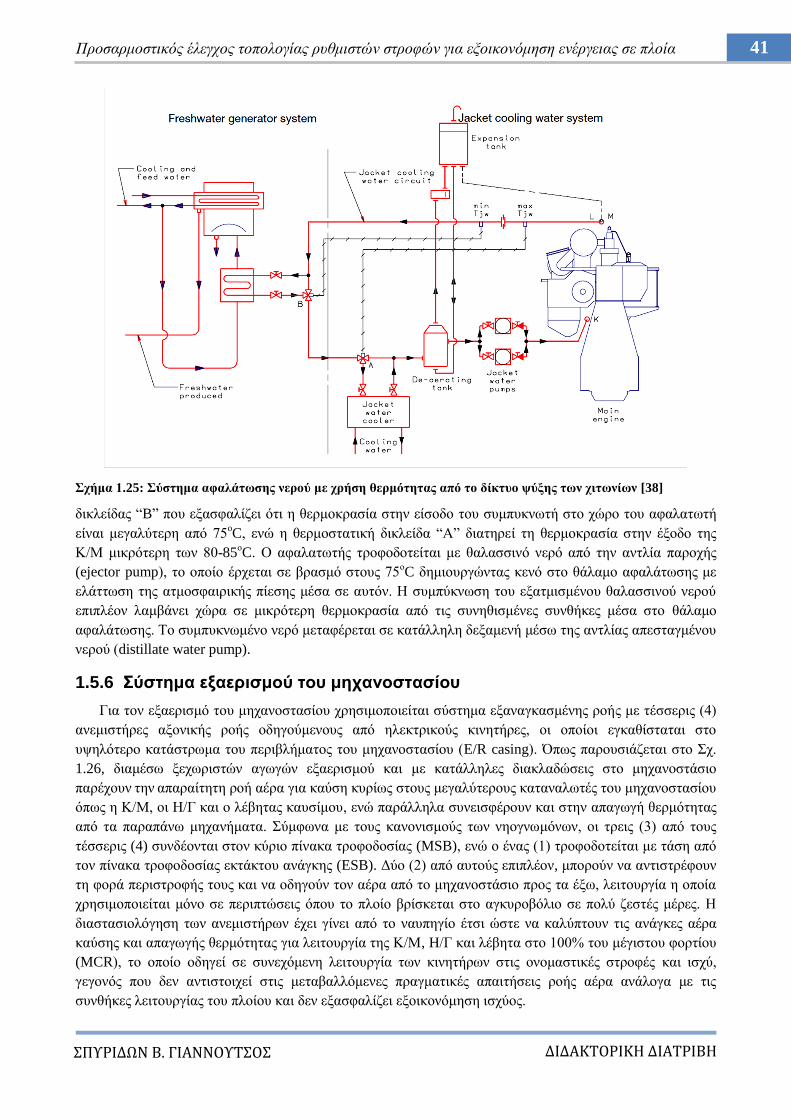
41 Πξνζαξκνζηηθόο έιεγρνο ηνπνινγίαο ξπζκηζηώλ ζηξνθώλ γηα εμνηθνλόκεζε ελέξγεηαο ζε πινία
ΔΙΔΑΚΣΟΡΙΚΗ ΔΙΑΣΡΙΒΗ
ΠΤΡΙΔΩΝ Β. ΓΙΑΝΝΟΤΣΟ
ρήκα 1.25: ύζηεκα αθαιάησζεο λεξνύ κε ρξήζε ζεξκόηεηαο από ην δίθηπν ςύμεο ησλ ρηησλίσλ [38]
δηθιείδαο “B” πνπ εμαζθαιίδεη όηη ε ζεξκνθξαζία ζηελ είζνδν ηνπ ζπκππθλσηή ζην ρώξν ηνπ αθαιαησηή
είλαη κεγαιύηεξε από 75oC, ελώ ε ζεξκνζηαηηθή δηθιείδα “Α” δηαηεξεί ηε ζεξκνθξαζία ζηελ έμνδν ηεο
Κ/Μ κηθξόηεξε ησλ 80-85νC. Ο αθαιαησηήο ηξνθνδνηείηαη κε ζαιαζζηλό λεξό από ηελ αληιία παξνρήο
(ejector pump), ην νπνίν έξρεηαη ζε βξαζκό ζηνπο 75νC δεκηνπξγώληαο θελό ζην ζάιακν αθαιάησζεο κε
ειάηησζε ηεο αηκνζθαηξηθήο πίεζεο κέζα ζε απηόλ. Ζ ζπκπύθλσζε ηνπ εμαηκηζκέλνπ ζαιαζζηλνύ λεξνύ
επηπιένλ ιακβάλεη ρώξα ζε κηθξόηεξε ζεξκνθξαζία από ηηο ζπλεζηζκέλεο ζπλζήθεο κέζα ζην ζάιακν
αθαιάησζεο. Σν ζπκππθλσκέλν λεξό κεηαθέξεηαη ζε θαηάιιειε δεμακελή κέζσ ηεο αληιίαο απεζηαγκέλνπ
λεξνύ (distillate water pump).
1.5.6 ύζηεκα εμαεξηζκνύ ηνπ κεραλνζηαζίνπ
Γηα ηνλ εμαεξηζκό ηνπ κεραλνζηαζίνπ ρξεζηκνπνηείηαη ζύζηεκα εμαλαγθαζκέλεο ξνήο κε ηέζζεξηο (4)
αλεκηζηήξεο αμνληθήο ξνήο νδεγνύκελνπο από ειεθηξηθνύο θηλεηήξεο, νη νπνίνη εγθαζίζηαηαη ζην
πςειόηεξν θαηάζηξσκα ηνπ πεξηβιήκαηνο ηνπ κεραλνζηαζίνπ (E/R casing). Όπσο παξνπζηάδεηαη ζην ρ.
1.26, δηακέζσ μερσξηζηώλ αγσγώλ εμαεξηζκνύ θαη κε θαηάιιειεο δηαθιαδώζεηο ζην κεραλνζηάζην
παξέρνπλ ηελ απαξαίηεηε ξνή αέξα γηα θαύζε θπξίσο ζηνπο κεγαιύηεξνπο θαηαλαισηέο ηνπ κεραλνζηαζίνπ
όπσο ε Κ/Μ, νη Ζ/Γ θαη ν ιέβεηαο θαπζίκνπ, ελώ παξάιιεια ζπλεηζθέξνπλ θαη ζηελ απαγσγή ζεξκόηεηαο
από ηα παξαπάλσ κεραλήκαηα. ύκθσλα κε ηνπο θαλνληζκνύο ησλ λενγλσκόλσλ, νη ηξεηο (3) από ηνπο
ηέζζεξηο (4) ζπλδένληαη ζηνλ θύξην πίλαθα ηξνθνδνζίαο (MSB), ελώ ν έλαο (1) ηξνθνδνηείηαη κε ηάζε από
ηνλ πίλαθα ηξνθνδνζίαο εθηάθηνπ αλάγθεο (ESB). Γύν (2) από απηνύο επηπιένλ, κπνξνύλ λα αληηζηξέθνπλ
ηε θνξά πεξηζηξνθήο ηνπο θαη λα νδεγνύλ ηνλ αέξα από ην κεραλνζηάζην πξνο ηα έμσ, ιεηηνπξγία ε νπνία
ρξεζηκνπνηείηαη κόλν ζε πεξηπηώζεηο όπνπ ην πινίν βξίζθεηαη ζην αγθπξνβόιην ζε πνιύ δεζηέο κέξεο. Ζ
δηαζηαζηνιόγεζε ησλ αλεκηζηήξσλ έρεη γίλεη από ην λαππεγίν έηζη ώζηε λα θαιύπηνπλ ηηο αλάγθεο αέξα
θαύζεο θαη απαγσγήο ζεξκόηεηαο γηα ιεηηνπξγία ηεο Κ/Μ, H/Γ θαη ιέβεηα ζην 100% ηνπ κέγηζηνπ θνξηίνπ
(MCR), ην νπνίν νδεγεί ζε ζπλερόκελε ιεηηνπξγία ησλ θηλεηήξσλ ζηηο νλνκαζηηθέο ζηξνθέο θαη ηζρύ,
γεγνλόο πνπ δελ αληηζηνηρεί ζηηο κεηαβαιιόκελεο πξαγκαηηθέο απαηηήζεηο ξνήο αέξα αλάινγα κε ηηο
ζπλζήθεο ιεηηνπξγίαο ηνπ πινίνπ θαη δελ εμαζθαιίδεη εμνηθνλόκεζε ηζρύνο.
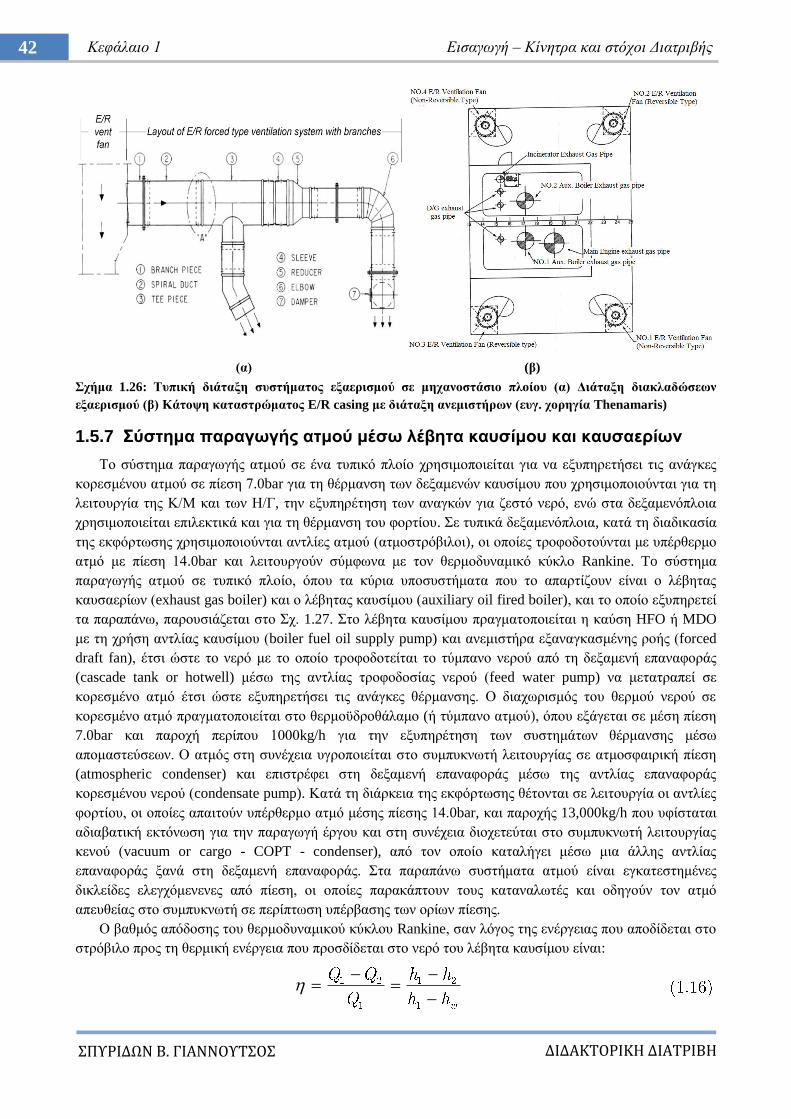
42 Κεθάιαην 1 Δηζαγσγή – Κίλεηξα θαη ζηόρνη Γηαηξηβήο
ΔΙΔΑΚΣΟΡΙΚΗ ΔΙΑΣΡΙΒΗ
ΠΤΡΙΔΩΝ Β. ΓΙΑΝΝΟΤΣΟ
(α) (β)
ρήκα 1.26: Σππηθή δηάηαμε ζπζηήκαηνο εμαεξηζκνύ ζε κεραλνζηάζην πινίνπ (α) Γηάηαμε δηαθιαδώζεσλ
εμαεξηζκνύ (β) Κάηνςε θαηαζηξώκαηνο E/R casing κε δηάηαμε αλεκηζηήξσλ (επγ. ρνξεγία Thenamaris)
1.5.7 ύζηεκα παξαγσγήο αηκνύ κέζσ ιέβεηα θαπζίκνπ θαη θαπζαεξίσλ
Σν ζύζηεκα παξαγσγήο αηκνύ ζε έλα ηππηθό πινίν ρξεζηκνπνηείηαη γηα λα εμππεξεηήζεη ηηο αλάγθεο
θνξεζκέλνπ αηκνύ ζε πίεζε 7.0bar γηα ηε ζέξκαλζε ησλ δεμακελώλ θαπζίκνπ πνπ ρξεζηκνπνηνύληαη γηα ηε
ιεηηνπξγία ηεο Κ/Μ θαη ησλ Ζ/Γ, ηελ εμππεξέηεζε ησλ αλαγθώλ γηα δεζηό λεξό, ελώ ζηα δεμακελόπινηα
ρξεζηκνπνηείηαη επηιεθηηθά θαη γηα ηε ζέξκαλζε ηνπ θνξηίνπ. ε ηππηθά δεμακελόπινηα, θαηά ηε δηαδηθαζία
ηεο εθθόξησζεο ρξεζηκνπνηνύληαη αληιίεο αηκνύ (αηκνζηξόβηινη), νη νπνίεο ηξνθνδνηνύληαη κε ππέξζεξκν
αηκό κε πίεζε 14.0bar θαη ιεηηνπξγνύλ ζύκθσλα κε ηνλ ζεξκνδπλακηθό θύθιν Rankine. To ζύζηεκα
παξαγσγήο αηκνύ ζε ηππηθό πινίν, όπνπ ηα θύξηα ππνζπζηήκαηα πνπ ην απαξηίδνπλ είλαη ν ιέβεηαο
θαπζαεξίσλ (exhaust gas boiler) θαη ν ιέβεηαο θαπζίκνπ (auxiliary oil fired boiler), θαη ην νπνίν εμππεξεηεί
ηα παξαπάλσ, παξνπζηάδεηαη ζην ρ. 1.27. ην ιέβεηα θαπζίκνπ πξαγκαηνπνηείηαη ε θαύζε HFO ή MDO
κε ηε ρξήζε αληιίαο θαπζίκνπ (boiler fuel oil supply pump) θαη αλεκηζηήξα εμαλαγθαζκέλεο ξνήο (forced
draft fan), έηζη ώζηε ην λεξό κε ην νπνίν ηξνθνδνηείηαη ην ηύκπαλν λεξνύ από ηε δεμακελή επαλαθνξάο
(cascade tank or hotwell) κέζσ ηεο αληιίαο ηξνθνδνζίαο λεξνύ (feed water pump) λα κεηαηξαπεί ζε
θνξεζκέλν αηκό έηζη ώζηε εμππεξεηήζεη ηηο αλάγθεο ζέξκαλζεο. Ο δηαρσξηζκόο ηνπ ζεξκνύ λεξνύ ζε
θνξεζκέλν αηκό πξαγκαηνπνηείηαη ζην ζεξκνϋδξνζάιακν (ή ηύκπαλν αηκνύ), όπνπ εμάγεηαη ζε κέζε πίεζε
7.0bar θαη παξνρή πεξίπνπ 1000kg/h γηα ηελ εμππεξέηεζε ησλ ζπζηεκάησλ ζέξκαλζεο κέζσ
απνκαζηεύζεσλ. Ο αηκόο ζηε ζπλέρεηα πγξνπνηείηαη ζην ζπκππθλσηή ιεηηνπξγίαο ζε αηκνζθαηξηθή πίεζε
(atmospheric condenser) θαη επηζηξέθεη ζηε δεμακελή επαλαθνξάο κέζσ ηεο αληιίαο επαλαθνξάο
θνξεζκέλνπ λεξνύ (condensate pump). Καηά ηε δηάξθεηα ηεο εθθόξησζεο ζέηνληαη ζε ιεηηνπξγία νη αληιίεο
θνξηίνπ, νη νπνίεο απαηηνύλ ππέξζεξκν αηκό κέζεο πίεζεο 14.0bar, θαη παξνρήο 13,000kg/h πνπ πθίζηαηαη
αδηαβαηηθή εθηόλσζε γηα ηελ παξαγσγή έξγνπ θαη ζηε ζπλέρεηα δηνρεηεύηαη ζην ζπκππθλσηή ιεηηνπξγίαο
θελνύ (vacuum or cargo - COPT - condenser), από ηνλ νπνίν θαηαιήγεη κέζσ κηα άιιεο αληιίαο
επαλαθνξάο μαλά ζηε δεμακελή επαλαθνξάο. ηα παξαπάλσ ζπζηήκαηα αηκνύ είλαη εγθαηεζηεκέλεο
δηθιείδεο ειεγρόκελελεο από πίεζε, νη νπνίεο παξαθάπηνπλ ηνπο θαηαλαισηέο θαη νδεγνύλ ηνλ αηκό
απεπζείαο ζην ζπκππθλσηή ζε πεξίπησζε ππέξβαζεο ησλ νξίσλ πίεζεο.
Ο βαζκόο απόδνζεο ηνπ ζεξκνδπλακηθνύ θύθινπ Rankine, ζαλ ιόγνο ηεο ελέξγεηαο πνπ απνδίδεηαη ζην
ζηξόβηιν πξνο ηε ζεξκηθή ελέξγεηα πνπ πξνζδίδεηαη ζην λεξό ηνπ ιέβεηα θαπζίκνπ είλαη:
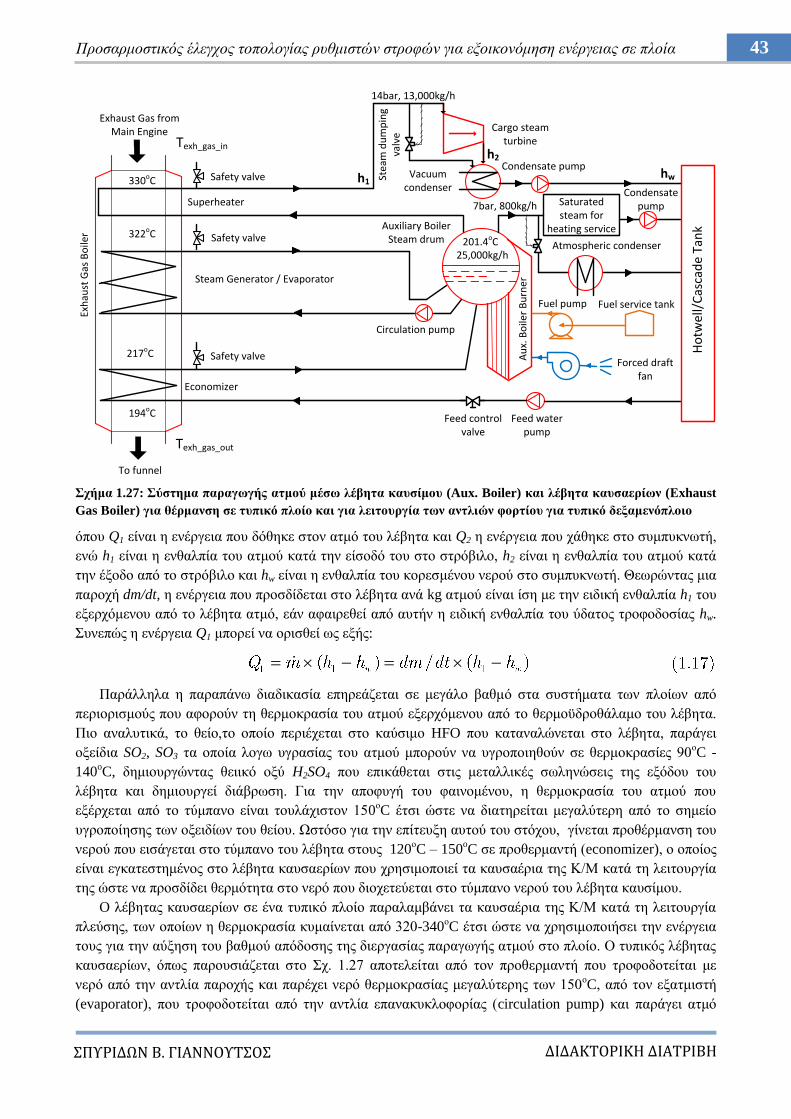
43 Πξνζαξκνζηηθόο έιεγρνο ηνπνινγίαο ξπζκηζηώλ ζηξνθώλ γηα εμνηθνλόκεζε ελέξγεηαο ζε πινία
ΔΙΔΑΚΣΟΡΙΚΗ ΔΙΑΣΡΙΒΗ
ΠΤΡΙΔΩΝ Β. ΓΙΑΝΝΟΤΣΟ
ρήκα 1.27: ύζηεκα παξαγσγήο αηκνύ κέζσ ιέβεηα θαπζίκνπ (Aux. Boiler) θαη ιέβεηα θαπζαεξίσλ (Δxhaust
Gas Boiler) γηα ζέξκαλζε ζε ηππηθό πινίν θαη γηα ιεηηνπξγία ησλ αληιηώλ θνξηίνπ γηα ηππηθό δεμακελόπινην
όπνπ Q1 είλαη ε ελέξγεηα πνπ δόζεθε ζηνλ αηκό ηνπ ιέβεηα θαη Q2 ε ελέξγεηα πνπ ράζεθε ζην ζπκππθλσηή,
ελώ h1 είλαη ε ελζαιπία ηνπ αηκνύ θαηά ηελ είζνδό ηνπ ζην ζηξόβηιν, h2 είλαη ε ελζαιπία ηνπ αηκνύ θαηά
ηελ έμνδν από ην ζηξόβηιν θαη hw είλαη ε ελζαιπία ηνπ θνξεζκέλνπ λεξνύ ζην ζπκππθλσηή. Θεσξώληαο κηα
παξνρή dm/dt, ε ελέξγεηα πνπ πξνζδίδεηαη ζην ιέβεηα αλά kg αηκνύ είλαη ίζε κε ηελ εηδηθή ελζαιπία h1 ηνπ
εμεξρόκελνπ από ην ιέβεηα αηκό, εάλ αθαηξεζεί από απηήλ ε εηδηθή ελζαιπία ηνπ ύδαηνο ηξνθνδνζίαο hw.
πλεπώο ε ελέξγεηα Q1 κπνξεί λα νξηζζεί σο εμήο:
Παξάιιεια ε παξαπάλσ δηαδηθαζία επεξεάδεηαη ζε κεγάιν βαζκό ζηα ζπζηήκαηα ησλ πινίσλ από
πεξηνξηζκνύο πνπ αθνξνύλ ηε ζεξκνθξαζία ηνπ αηκνύ εμεξρόκελνπ από ην ζεξκνϋδξνζάιακν ηνπ ιέβεηα.
Πην αλαιπηηθά, ην ζείν,ην νπνίν πεξηέρεηαη ζην θαύζηκν HFO πνπ θαηαλαιώλεηαη ζην ιέβεηα, παξάγεη
νμείδηα SO2, SO3 ηα νπνία ινγσ πγξαζίαο ηνπ αηκνύ κπνξνύλ λα πγξνπνηεζνύλ ζε ζεξκνθξαζίεο 90νC -
140oC, δεκηνπξγώληαο ζεηηθό νμύ H2SO4 πνπ επηθάζεηαη ζηηο κεηαιιηθέο ζσιελώζεηο ηεο εμόδνπ ηνπ
ιέβεηα θαη δεκηνπξγεί δηάβξσζε. Γηα ηελ απνθπγή ηνπ θαηλνκέλνπ, ε ζεξκνθξαζία ηνπ αηκνύ πνπ
εμέξρεηαη από ην ηύκπαλν είλαη ηνπιάρηζηνλ 150νC έηζη ώζηε λα δηαηεξείηαη κεγαιύηεξε από ην ζεκείν
πγξνπνίεζεο ησλ νμεηδίσλ ηνπ ζείνπ. Χζηόζν γηα ηελ επίηεπμε απηνύ ηνπ ζηόρνπ, γίλεηαη πξνζέξκαλζε ηνπ
λεξνύ πνπ εηζάγεηαη ζην ηύκπαλν ηνπ ιέβεηα ζηνπο 120νC – 150
oC ζε πξνζεξκαληή (economizer), ν νπνίνο
είλαη εγθαηεζηεκέλνο ζην ιέβεηα θαπζαεξίσλ πνπ ρξεζηκνπνηεί ηα θαπζαέξηα ηεο Κ/Μ θαηά ηε ιεηηνπξγία
ηεο ώζηε λα πξνζδίδεη ζεξκόηεηα ζην λεξό πνπ δηνρεηεύεηαη ζην ηύκπαλν λεξνύ ηνπ ιέβεηα θαπζίκνπ.
O ιέβεηαο θαπζαεξίσλ ζε έλα ηππηθό πινίν παξαιακβάλεη ηα θαπζαέξηα ηεο Κ/Μ θαηά ηε ιεηηνπξγία
πιεύζεο, ησλ νπνίσλ ε ζεξκνθξαζία θπκαίλεηαη από 320-340νC έηζη ώζηε λα ρξεζηκνπνηήζεη ηελ ελέξγεηα
ηνπο γηα ηελ αύμεζε ηνπ βαζκνύ απόδνζεο ηεο δηεξγαζίαο παξαγσγήο αηκνύ ζην πινίν. Ο ηππηθόο ιέβεηαο
θαπζαεξίσλ, όπσο παξνπζηάδεηαη ζην ρ. 1.27 απνηειείηαη από ηνλ πξνζεξκαληή πνπ ηξνθνδνηείηαη κε
λεξό από ηελ αληιία παξνρήο θαη παξέρεη λεξό ζεξκνθξαζίαο κεγαιύηεξεο ησλ 150νC, από ηνλ εμαηκηζηή
(evaporator), πνπ ηξνθνδνηείηαη από ηελ αληιία επαλαθπθινθνξίαο (circulation pump) θαη παξάγεη αηκό
Exhaust Gas from Main Engine
201.4oC
Superheater
Steam Generator / Evaporator
Economizer
Saturated steam for
heating service
Ho
twel
l/C
asca
de
Tan
k
Cargo steam turbine
Vacuum condenser
Stea
m d
um
pin
g va
lve
Condensate pump
Condensate pump
Fuel pump Fuel service tank
Forced draft fan
Safety valve
Safety valve
Safety valve
Feed water pump
Feed control valve
Auxiliary Boiler Steam drum
Circulation pump
330oC
322oC
217oC
194oC
14bar, 13,000kg/h
25,000kg/h
To funnel
Exh
aust
Gas
Bo
iler
Atmospheric condenser
Au
x. B
oile
r B
urn
er
7bar, 800kg/h
Texh_gas_in
Texh_gas_out
h1
h2
hw
44 Κεθάιαην 1 Δηζαγσγή – Κίλεηξα θαη ζηόρνη Γηαηξηβήο
ΔΙΔΑΚΣΟΡΙΚΗ ΔΙΑΣΡΙΒΗ
ΠΤΡΙΔΩΝ Β. ΓΙΑΝΝΟΤΣΟ
ζεξκνθξαζίαο 200νC, θαζώο θαη από ηνλ ππεξζεξκαληή (superheater) πνπ εμππεξεηεί ηηο αλάγθεο αηκνύ ησλ
αληιηώλ θνξηίνπ. Ζ ζεξκηθή ρσξεηηθόηεηα ηνπ ιέβεηα θαπζαεξίσλ ππνινγίδεηαη ρξεζηκνπνηώληαο ηε ξνή
θαη ηε ζεξκνθξαζηαθή δηαθνξά κεηαμύ ησλ θαπζαεξίσλ ζηελ είζνδν θαη ζηελ έμνδν ηνπ ιέβεηα, ελώ
εμαξηάηαη θαη από ηελ ηηκή Cp (ζεξκόηεηα ζε joule πνπ απαηηείηαη γηα ηελ αύμεζε ηεο ζεξκνθξαζίαο ελόο kg
νπζίαο θαηά 1oC) ηνπ θαπζαεξίνπ πνπ θαζνξίδεηαη από ηελ πνζόηεηα ζείνπ ζην θαύζηκν από ην νπνίν
πξνήιζε. Γηα ηππηθά θαπζέξηα από θαύζηκν HFO, ε ξνή ζεξκόηεηαο ησλ θαπζαεξίσλ, QEGB [kW], πνπ
πξνζδίδνληαη ζην ζύζηεκα αηκνπαξαγσγήο κέζσ ηνπ ιέβεηα θαπζαεξίσλ κπνξεί λα ππνινγηζηεί σο εμήο:
όπνπ dm/dt είλαη ε παξνρή ησλ θαπζαεξίσλ ζε kg/s, ΓΣ ε ζεξκνθξαζηαθή δηαθνξά ησλ θαπζαεξίσλ ζηελ
είζνδν θαη ζηελ έμνδν ηνπ ιέβεηα ζε K, ελώ ν ζπληειεζηήο Cp γηα θαύζηκν ΖFO ζεσξείηαη 1.08kJ/kgK.
Από πιεπξάο ηζνδπγίνπ ηζρύνο, νη κεγαιύηεξνη θαηαλαισηέο είλαη νη αληιίεο ηξνθνδνζίαο λεξνύ, νη
αληιίεο επαλαθπθινθνξίαο λεξνύ, ν αλεκηζηήξαο εμαλαγθαζκέλεο ξνήο γηα ηελ παξνρή αέξα γηα ηελ θαύζε,
θαζώο θαη ε αληιία παξνρήο θαπζίκνπ. Ζ δηάξθεηα ρξήζεο ησλ παξαπάλσ θαηαλαισηώλ εμαξηάηαη από ηε
ιεηηνπξγηθή θαηάζηαζε ηνπ πινίνπ θαη από ην απηόκαην ζύζηεκα ιεηηνπξγίαο ηνπ ιέβεηα θαπζίκνπ, θαζώο:
Ζ επάξθεηα ηεο ζεξκηθήο ελέξγεηαο ησλ θαπζαεξίσλ ηεο Κ/Μ πνπ κπνξνύλ λα ρξεζηκνπνηεζνύλ ζην
ιέβεηα θαπζαεξίσλ εμαξηάηαη από ην θνξηίν ηεο Κ/Μ ηελ εθάζηνηε ζηηγκή θαη ηε δεδνκέλε
ηαρύηεηα πιεύζεο ζε ζπλδπαζκό κε ηελ θαηάζηαζε θόξησζεο ηνπ πινίνπ, θαζώο ε κεγάιε κείσζε
ηεο ηαρύηεηαο πιεύζεο πνπ νδεγεί ζε θνξηίν ηεο K/M θάησ από 35-40% νδεγεί ζε ρακειή
ζεξκνθξαζία θαπζαεξίσλ Σexh_gas_in, κε απνηέιεζκα ηελ αλάγθε ρξήζεο ηνπ ιέβεηα θαπζίκνπ θαη
θαηά ηελ πεξίνδν πιεύζεο, εθηόο από ηελ πεξίνδν εθθόξησζεο (ζηα δεμακελόπινηα).
Ο ιέβεηαο θαπζίκνπ ιεηηνπξγεί κε ζπγθεθξηκέλν πξνγξακκαηηζκέλν ηξόπν κε πεξηνδηθόηεηα
έλαπζεο/απνθνπήο γηα ηε δηαηήξεζε ζπγθεθξηκέλεο πίεζεο αηκνύ ζηελ έμνδν ηνπ. πγθεθξηκέλα,
αλάινγα κε ηελ αλαινγία θαπζίκνπ-αέξα, θαηά ηηο δηάθνξεο θάζεηο ιεηηνπξγίαο ηνπ (εθθαζάξηζε,
έλαπζε θαύζεο, πηινηηθή θαύζε, θύξηα θαύζε), ην θνξηίν ηνπ θηλεηήξα πνπ νδεγεί ηνλ αλεκηζηήξα
εμαλαγθαζκέλεο ξνήο αέξα θαύζεο δηαθέξεη αλάινγα κε ηε ζέζε ησλ πηεξπγίσλ, ελώ ε ρξήζε ησλ
αληιηώλ παξνρήο θαη αλαθπθινθνξίαο λεξνύ, εμαξηώληαη από ην επίπεδν λεξνύ ζην ηύκπαλν λεξνύ.
1.5.8 ύζηεκα παξαγσγήο αδξαλνύο αεξίνπ (κόλν γηα δεμακελόπινηα)
ηα δεμακελόπινηα, ην θνξηίν πνπ βξίζθεηαη ζηηο δεμακελέο παξάγεη εύθιεθηεο αλαζπκηάζεηο, νη νπνίεο
απμνκεηώλνληαη πεξηζζόηεξν θαηά ηε δηαδηθαζία θόξησζεο/εθθόξησζεο. Όηαλ νη αλαζπκηάζεηο ηνπ
πεηξειαίνπ αλακεηρζνύλ κε ηνλ αηκνζθαηξηθό αέξα ν νπνίνο πεξηέρεη θαηά 20.8% Ο2, κπνξεί λα νδεγήζεη
ζε αλάθιεμε ηνπ θνξηίνπ. Γηα ηελ απνθπγή απηήο ηεο πεξίπησζεο θαη γηα ηελ ελίζρπζε ηεο αζθάιεηαο,
ιεηηνπξγεί ζύζηεκα παξαγσγήο θαη δηαλνκήο αδξαλνύο αεξίνπ (inert gas system), ην νπνίν δηνρεηεύεηαη ζηηο
ζηηο δεμακελέο, έηζη ώζηε λα επηθξαηεί πάληνηε ζεηηθή πίεζε θαη ην πνζνζηό ηνπ νμπγόλνπ λα βξίζθεηαη
θάησ από 5%. Γηα ηελ παξαγσγή ηνπ αδξαλνύο αεξίνπ είλαη απαξαίηεηε ε ιεηηνπξγία ηνπ ιέβεηα θαπζίκνπ.
Πην ζπγθεθξηκέλα, ην δνκηθό δηάγξακκα ηνπ ζπζηήκαηνο αδξαλνύο αεξίνπ παξνπζηάδεηαη ζην ρ. 1.28.
Καηά ηε δηαδηθαζία θόξησζεο/εθθόξησζεο, ρξεζηκνπνηείηαη ν έλαο από ηνπο δύν ιέβεηεο θαπζίκνπ κε
ζηαζεξό ιόγν θαπζίκνπ/αέξα θαύζεο γηα ηελ παξαγσγή αηκνύ, ν νπνίνο κεηαθέξεηαη κέζσ ησλ δηθιείδσλ
παξαιαβήο ζηε κνλάδα θαζαξηζκνύ (scrubber unit). ηε κνλάδα απηή, ε νπνία ηξνθνδνηείηαη κε ζαιαζζηλό
λεξό κέζσ ηεο αληιίαο κνλάδαο θαζαξηζκνύ (scrubber pump), ην αέξην ςύρεηαη, θαζαξίδεηαη, θαη
απνμεξαίλεηαη πξηλ κεηαηξαπεί ζε αδξαλέο αέξην πνπ κεηαθέξεηαη ζηηο δεμακελέο θαπζίκνπ. Σν αδξαλέο
αέξην ζηε ζπλέρεηα παξαιακβάλεηαη από ηνπο αλεκηζηήξεο παξνρήο αδξαλνύο αεξίνπ (inert gas blower fans),
επηηαρύλεηαη θαη παξέρεηαη ζηηο δεμακελέο θαηαζηξώκαηνο. Σν ζύζηεκα ειέγρνπ ξπζκίδεη ηελ πνζόηεηα
ηνπ αδξαλνύο αεξίνπ πνπ δηαλέκεηαη ζηηο δεμακελέο πεξηνξίδνληαο ην άλνηγκα ηεο δηθιείδαο έηζη ώζηε λα
δηαηεξείηαη ζηαζεξή πίεζε ζηε γξακκή ηξνθνδνζίαο, ελώ αηζζεηήξαο νμπγόλνπ δίλεη εληνιή γηα λα ηεζεί ην
ζύζηεκα εθηόο ιεηηνπξγίαο, εάλ δηαπηζησζεί όηη ην πνζνζηό νμπγόλνπ ζην παξαγόκελν αδξαλέο αέξην είλαη
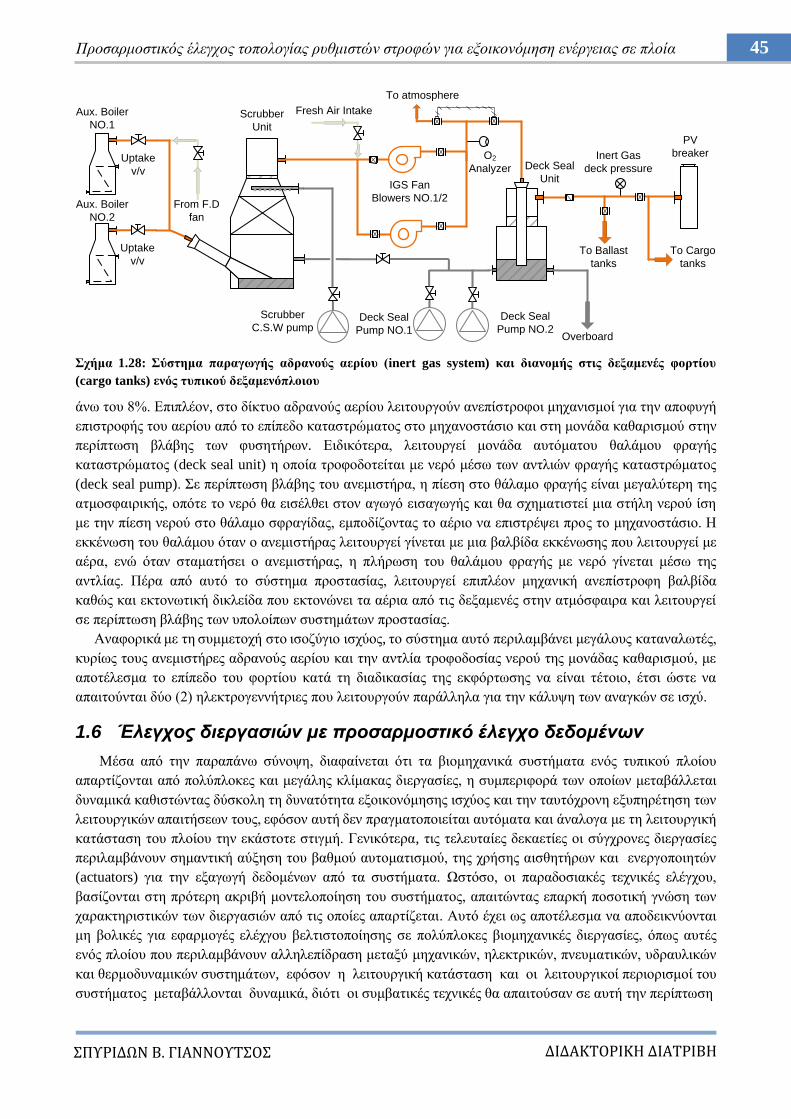
45 Πξνζαξκνζηηθόο έιεγρνο ηνπνινγίαο ξπζκηζηώλ ζηξνθώλ γηα εμνηθνλόκεζε ελέξγεηαο ζε πινία
ΔΙΔΑΚΣΟΡΙΚΗ ΔΙΑΣΡΙΒΗ
ΠΤΡΙΔΩΝ Β. ΓΙΑΝΝΟΤΣΟ
ρήκα 1.28: ύζηεκα παξαγσγήο αδξαλνύο αεξίνπ (inert gas system) θαη δηαλνκήο ζηηο δεμακελέο θνξηίνπ
(cargo tanks) ελόο ηππηθνύ δεμακελόπινηνπ
άλσ ηνπ 8%. Δπηπιένλ, ζην δίθηπν αδξαλνύο αεξίνπ ιεηηνπξγνύλ αλεπίζηξoθνη κεραληζκνί γηα ηελ απνθπγή
επηζηξνθήο ηνπ αεξίνπ από ην επίπεδν θαηαζηξώκαηνο ζην κεραλνζηάζην θαη ζηε κνλάδα θαζαξηζκνύ ζηελ
πεξίπησζε βιάβεο ησλ θπζεηήξσλ. Δηδηθόηεξα, ιεηηνπξγεί κνλάδα απηόκαηνπ ζαιάκνπ θξαγήο
θαηαζηξώκαηνο (deck seal unit) ε νπνία ηξνθνδνηείηαη κε λεξό κέζσ ησλ αληιηώλ θξαγήο θαηαζηξώκαηνο
(deck seal pump). ε πεξίπησζε βιάβεο ηνπ αλεκηζηήξα, ε πίεζε ζην ζάιακν θξαγήο είλαη κεγαιύηεξε ηεο
αηκνζθαηξηθήο, νπόηε ην λεξό ζα εηζέιζεη ζηνλ αγσγό εηζαγσγήο θαη ζα ζρεκαηηζηεί κηα ζηήιε λεξνύ ίζε
κε ηελ πίεζε λεξνύ ζην ζάιακν ζθξαγίδαο, εκπνδίδνληαο ην αέξην λα επηζηξέςεη πξνο ην κεραλνζηάζην. Ζ
εθθέλσζε ηνπ ζαιάκνπ όηαλ ν αλεκηζηήξαο ιεηηνπξγεί γίλεηαη κε κηα βαιβίδα εθθέλσζεο πνπ ιεηηνπξγεί κε
αέξα, ελώ όηαλ ζηακαηήζεη ν αλεκηζηήξαο, ε πιήξσζε ηνπ ζαιάκνπ θξαγήο κε λεξό γίλεηαη κέζσ ηεο
αληιίαο. Πέξα από απηό ην ζύζηεκα πξνζηαζίαο, ιεηηνπξγεί επηπιένλ κεραληθή αλεπίζηξνθε βαιβίδα
θαζώο θαη εθηνλσηηθή δηθιείδα πνπ εθηνλώλεη ηα αέξηα από ηηο δεμακελέο ζηελ αηκόζθαηξα θαη ιεηηνπξγεί
ζε πεξίπησζε βιάβεο ησλ ππνινίπσλ ζπζηεκάησλ πξνζηαζίαο.
Αλαθνξηθά κε ηε ζπκκεηνρή ζην ηζνδύγην ηζρύνο, ην ζύζηεκα απηό πεξηιακβάλεη κεγάινπο θαηαλαισηέο,
θπξίσο ηνπο αλεκηζηήξεο αδξαλνύο αεξίνπ θαη ηελ αληιία ηξνθνδνζίαο λεξνύ ηεο κνλάδαο θαζαξηζκνύ, κε
απνηέιεζκα ην επίπεδν ηνπ θνξηίνπ θαηά ηε δηαδηθαζίαο ηεο εθθόξησζεο λα είλαη ηέηνην, έηζη ώζηε λα
απαηηνύληαη δύν (2) ειεθηξνγελλήηξηεο πνπ ιεηηνπξγνύλ παξάιιεια γηα ηελ θάιπςε ησλ αλαγθώλ ζε ηζρύ.
1.6 Έλεγσορ διεπγαζιών με πποζαπμοζηικό έλεγσο δεδομένυν
Μέζα από ηελ παξαπάλσ ζύλνςε, δηαθαίλεηαη όηη ηα βηνκεραληθά ζπζηήκαηα ελόο ηππηθνύ πινίνπ
απαξηίδνληαη από πνιύπινθεο θαη κεγάιεο θιίκαθαο δηεξγαζίεο, ε ζπκπεξηθνξά ησλ νπνίσλ κεηαβάιιεηαη
δπλακηθά θαζηζηώληαο δύζθνιε ηε δπλαηόηεηα εμνηθνλόκεζεο ηζρύνο θαη ηελ ηαπηόρξνλε εμππεξέηεζε ησλ
ιεηηνπξγηθώλ απαηηήζεσλ ηνπο, εθόζνλ απηή δελ πξαγκαηνπνηείηαη απηόκαηα θαη άλαινγα κε ηε ιεηηνπξγηθή
θαηάζηαζε ηνπ πινίνπ ηελ εθάζηνηε ζηηγκή. Γεληθόηεξα, ηηο ηειεπηαίεο δεθαεηίεο νη ζύγρξνλεο δηεξγαζίεο
πεξηιακβάλνπλ ζεκαληηθή αύμεζε ηνπ βαζκνύ απηνκαηηζκνύ, ηεο ρξήζεο αηζζεηήξσλ θαη ελεξγνπνηεηώλ
(actuators) γηα ηελ εμαγσγή δεδνκέλσλ από ηα ζπζηήκαηα. Χζηόζν, νη παξαδνζηαθέο ηερληθέο ειέγρνπ,
βαζίδνληαη ζηε πξόηεξε αθξηβή κνληεινπνίεζε ηνπ ζπζηήκαηνο, απαηηώληαο επαξθή πνζνηηθή γλώζε ησλ
ραξαθηεξηζηηθώλ ησλ δηεξγαζηώλ από ηηο νπνίεο απαξηίδεηαη. Απηό έρεη σο απνηέιεζκα λα απνδεηθλύνληαη
κε βνιηθέο γηα εθαξκνγέο ειέργνπ βειηηζηνπνίεζεο ζε πνιύπινθεο βηνκεραληθέο δηεξγαζίεο, όπσο απηέο
ελόο πινίνπ πνπ πεξηιακβάλνπλ αιιειεπίδξαζε κεηαμύ κεραληθώλ, ειεθηξηθώλ, πλεπκαηηθώλ, πδξαπιηθώλ
θαη ζεξκνδπλακηθώλ ζπζηεκάησλ, εθόζνλ ε ιεηηνπξγηθή θαηάζηαζε θαη νη ιεηηνπξγηθνί πεξηνξηζκνί ηνπ
ζπζηήκαηνο κεηαβάιινληαη δπλακηθά, δηόηη νη ζπκβαηηθέο ηερληθέο ζα απαηηνύζαλ ζε απηή ηελ πεξίπησζε
Aux. Boiler
NO.1
Aux. Boiler
NO.2
Uptake
v/v
Uptake
v/v
From F.D
fan
Scrubber
Unit
Fresh Air Intake
Scrubber
C.S.W pumpDeck Seal
Pump NO.1
Deck Seal
Pump NO.2
IGS Fan
Blowers NO.1/2
O2
Analyzer
To atmosphere
Deck Seal
Unit
Inert Gas
deck pressure
To Ballast
tanks
Overboard
To Cargo
tanks
PV
breaker
46 Κεθάιαην 1 Δηζαγσγή – Κίλεηξα θαη ζηόρνη Γηαηξηβήο
ΔΙΔΑΚΣΟΡΙΚΗ ΔΙΑΣΡΙΒΗ
ΠΤΡΙΔΩΝ Β. ΓΙΑΝΝΟΤΣΟ
ρήκα 1.29: Καηεγνξνπνίεζε κεζόδσλ πξνζαξκνζηηθνύ ειέγρνπ δεδνκέλσλ [42]
ζεκαληηθή ππνινγηζηηθή πνιππινθόηεηα. Μηα απνδνηηθή ιύζε ζην παξαπάλσ πξόβιεκα είλαη ν έιεγρνο
δηεξγαζηώλ κέζσ πξνζαξκνζηηθνύ έιεγρνπ δεδνκέλσλ, αλεμάξηεηα από ηελ κνληεινπνίεζε ηνπ ζπζηήκαηνο
ηελ εθάζηνηε ζηηγκή, αλαηξνθνδνηώληαο ην ζύζηεκα ειέγρνπ κε κεηξήζεηο έηζη ώζηε απηό λα ξπζκίδεηαη
θαη λα πξνζαξκόδεηαη απηόκαηα πξνθεηκέλνπ λα επηηπγράλεηαη ε βειηηζηνπνίεζε θαη επζηάζεηα ηεο
δηεξγαζίαο [39]-[41]. Πξνο απηήλ ηελ θαηεύζπλζε, νη πξνζεγγίζεηο πξνζαξκνζηηθνύ ειέγρνπ δεδνκέλσλ γηα
βηνκεραληθέο δηεξγαζίεο κπνξνύλ λα θαηεγνξηνπνηεζνύλ ζε: (i) κεζνδνινγίεο απόιπηα βαζηζκέλεο ζε
δεδνκέλα θαη (ii) κεζνδνινγίεο πνπ ελζσκαηώλνπλ δεδνκέλα γηα ηελ αλάπηπμε κνληέισλ κε επίθεληξν ηελ
παξαθνινύζεζε θαη ηε βειηηζηνπνίεζε ησλ δηεξγαζηώλ, όπσο παξνπζηάδεηαη ζην ρ. 1.29 [42].
1.6.1 Πνιπκεηαβιεηή ζηαηηζηηθή αλάιπζε δεδνκέλσλ
Δζηηάδνληαο ζηελ πξώηε θαηεγνξία ε νπνία δελ απαηηεί γλώζε γηα ηελ κνληεινπνίεζε ηνπ ζπζηήκαηνο,
απηή πεξηιακβάλεη κεζόδνπο πνιπκεηαβιεηήο αλαδξνκηθήο ζηαηηζηηθήο αλάιπζεο δεδνκέλσλ (multivariable
recursive statistical analysis), νη νπνίεο ρξεζηκνπνηνύλ πξνζεγγίζεηο αλάιπζεο θύξησλ ζπληζησζώλ
(principal component analysis – PCA) θαη ειαρίζησλ ηεηξαγώλσλ (partial least squares – PLS), πνπ έρνπλ
ζθνπό ην δηαρσξηζκό ησλ ζεκαληηθώλ δεδνκέλσλ κεηξήζεσλ από ηα δεδνκέλα ζνξύβνπ. Πξνβάιινληαο ην
ζύλνιν ησλ δεδνκέλσλ ζε δηαλπζκαηηθνύο ππνρώξνπο κηθξόηεξσλ δηαζηάζεσλ, ε κέζνδνο PCA, ε νπνία
απνηειεί κηα από ηηο πεξηζζόηεξν ρξεζηκνπνηνύκελεο ηερληθέο γηα ηελ αμηνπνίεζε ησλ δεδνκέλσλ,
ειαρηζηνπνηεί ηελ ειάρηζηε ηεηξαγσληθή απόζηαζε κεηαμύ ησλ ζεκείσλ κέηξεζεο θαη ησλ πξνβνιώλ ηνπο
έηζη ώζηε λα γίλεη αληηιεπηή ε κεηαβιεηόηεηα ησλ δεδνκέλσλ κε απνδνηηθό ηξόπν [43]-[45].
ην πιαίζην απηό, ζεσξώληαο έλα ζύλνιν κεηξήζεσλ από κηα βηνκεραληθή δηεξγαζία κε N δείγκαηα,
όπνπ ην θαζέλα απνηειείηαη από m κεηαβιεηέο, επείηα από εθθαζάξηζε ησλ δεηγκάησλ κε κεδεληθή κέζε
ηηκή θαη κνλαδηαία κεηαβιεηόηεηα, ν πίλαθαο δεδνκέλσλ νξίδεηαη σο εμήο:
Ζ ρξήζηκε πιεξνθνξία ζρεηηθά κε ηε κεηαβιεηόηεηα ησλ κεηξήζεσλ εμάγεηαη από ηελ αλάιπζε ηνπ πίλαθα
ζπκκεηαβιεηόηεηαο ηνπ Υ ζε ηδηάδνπζεο ηηκέο, όπσο παξνπζηάδεηαη παξαθάησ:
47 Πξνζαξκνζηηθόο έιεγρνο ηνπνινγίαο ξπζκηζηώλ ζηξνθώλ γηα εμνηθνλόκεζε ελέξγεηαο ζε πινία
ΔΙΔΑΚΣΟΡΙΚΗ ΔΙΑΣΡΙΒΗ
ΠΤΡΙΔΩΝ Β. ΓΙΑΝΝΟΤΣΟ
όπνπ ι1≥....≥ιm≥0 είλαη νη ηδηνηηκέο ηνπ Φ, ελώ ν πίλαθαο ηδηνηηκώλ Λ θαη ν νξζνθαλνληθόο πίλαθαο P είλαη:
όπνπ εάλ ζεσξήζνπκε α ηνλ αξηζκό ησλ θύξησλ ζπληζησζώλ, ηόηε νη ππνπίλαθεο Ppc θαη Pres ζρεηίδνληαη κε
ηηο α κέγηζηεο ηηκέο ηνπ ππνπίλαθα Λpc, θαη κε ηηο m-α ειάρηζηεο ηηκέο ηνπ ππνπίλαθα Λres αληίζηνηρα. Σόηε
θάζε έλα από ηα δηαλύζκαηα ησλ δεηγκάησλ κεηξήζεσλ x є Rm κπνξεί λα πξνβιεζεί ζε δύν νξζνγσληθνύο
ππόρσξνπο πνπ κπνξνύλ λα νξηζζνύλ σο εμήο:
όπνπ θαη αληίζηνηρα δειώλνπλ ηελ πξνβνιή ησλ δεηγκάησλ κεηξήζεσλ ζε έλα θύξην ππόρσξν (πνπ
πεξηιακβάλεη ηελ θύξηα πιεξνθνξία ηνπ ζήκαηνο) θαη ζε έλα ππνινηπόκελν ππόρσξν (πνπ πεξηιακβάλεη ην
ζόξπβν). Ηζρύεη όηη νη δύν απηνί νξζνγσληθνί ππόρσξνη είλαη ζηαηηζηηθά αλεμάξηεηνη, δηεπθνιύλνληαο ηελ
αλάιπζε. Χζηόζν, ε πξνζέγγηζε απηή θαζίζηαηαη κε επαξθήο ιόγσ πεξηνξηζκώλ πνπ παξνπζηάδνληαη ζηελ
πεξίπησζε κε γξακκηθώλ δπλακηθά θαη ρξνληθά κεηαβαιιόκελσλ δηεξγαζηώλ ζε βηνκεραληθά ζπζηήκαηα.
1.6.2 Δπαλαιεπηηθόο πξνζαξκνζηηθόο έιεγρνο
Ο επαλαιεπηηθόο πξνζαξκνζηηθόο έιεγρνο (iterative learning control – ILC) απνηειεί κεζνδνινγία πνπ
βαζίδεηαη ζηελ αλάδξαζε από ηηο κεηξήζεηο πνπ εθηεινύληαη ζε δηάθνξα ζεκεία ηεο δηεξγαζίαο, θαη είλαη
ηδηαίηεξα ρξήζηκνο ζε πεξηπηώζεηο όπνπ ε βηνκεραληθή δηεξγαζία επαλαιακβάλεηαη ζε ηαθηά ρξνληθά
δηαζηήκαηα [46]. H πιεξνθνξία ηνπ κεηξνύκελνπ ζθάικαηνο θαη ηνπ ζήκαηνο αλαθνξάο εηζόδνπ ειέγρνπ
πνπ απνθηάηαη από ηελ επαλαιεπηηθή δπλακηθή θύζε ηεο δηεξγαζίαο ρξεζηκνπνηείηαη ζε απηήλ ηελ
πξνζέγγηζε γηα ηελ επίηεπμε ηνπ κηθξόηεξνπ ζθάικαηνο ζέζεο ζηε κόληκε θαηάζηαζε. Πην ζπγθεθξηκέλα,
ζεσξώληαο έλα δπλακηθό ζύζηεκα:
όπνπ f θαη g είλαη θαζνιηθά ζπλερείο Lipschitz ζπλαξηήζεηο ησλ ,
πνπ δειώλνπλ ηε κεηαβιεηή θαηάζηαζεο, ηελ έμνδν θαη ηελ είζνδν ηνπ ζπζηήκαηνο αληίζηνηρα ηελ ρξνληθή
ζηηγκή { } { } είλαη ν αξηζκόο επαλάιεςεο. Αλ ζεσξήζνπκε σο yd(k) ηελ
επηζπκεηή έμνδν, ηόηε ην ζθάικα ζέζεο νξίδεηαη σο εμήο:
Ο ζηόρνο ειέγρνπ ηεο κεζόδνπ ILC είλαη λα επξεζεί θαηάιιειε είζνδνο ui(k) έηζη ώζηε όηαλ , ην
ζθάικα ζέζεο λα ζπγθιίλεη ζην 0. Γηα ηε ζρεδίαζε ηνπ ειεγθηή, ε έμνδνο yi(k) κπνξεί λα
ρξεζηκνπνηεζεί έηζη ώζηε λα επηηεπρζεί ε θαηάιιειε είζνδνο ui(k) από ηα ππνινγηδόκελα ζθάικαηα ζέζεο
ei(k) ζε πξαγκαηηθό ρξόλν. Ζ επόκελε έθθξαζε πεξηγξάθεη ηε γεληθή επαλαιεπηηθή πξνζαξκνζηηθή κέζνδν:
όπνπ h απνηειεί ηε ζπλάξηεζε κεηαμύ ηεο εηζόδνπ ειέγρνπ θαη ηνπ ζθάικαηνο ζέζεο. Με βάζε ηε ζρ.
(1.25), δηάθνξνη λόκνη ειέγρνπ κπνξνύλ λα εθαξκνζηνύλ, πεξηιακβάλνληαο ηνλ ζζελαξό αλαινγηθό-
νινθιεξσηηθό- παξαγσγηθό έιεγρν (PI - PID), έιεγρν ηύπνπ feed-forward θ.α [47]-[48]. Δθόζνλ ε κέζνδνο
απηή δελ απαηηεί γλώζε ηνπ κνληέινπ ηεο δηεξγαζίαο αιιά ρξεζηκνπνηεί κόλν κεηξήζεηο, ζεσξείηαη
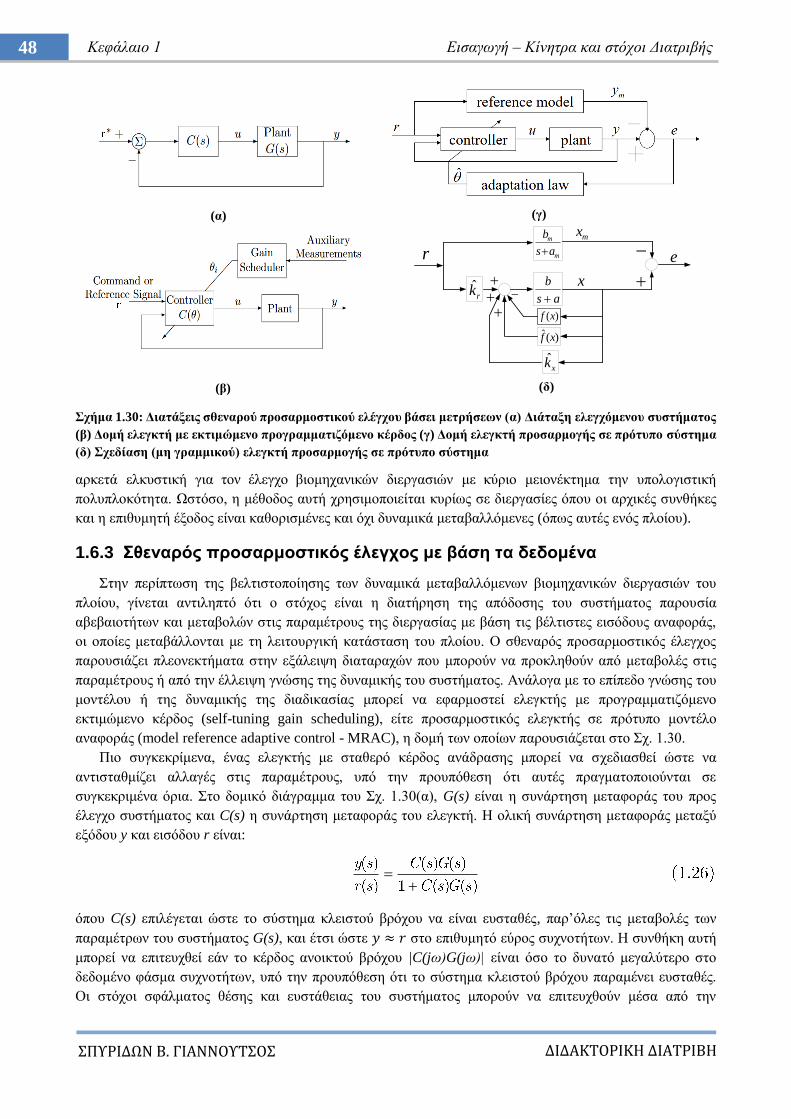
48 Κεθάιαην 1 Δηζαγσγή – Κίλεηξα θαη ζηόρνη Γηαηξηβήο
ΔΙΔΑΚΣΟΡΙΚΗ ΔΙΑΣΡΙΒΗ
ΠΤΡΙΔΩΝ Β. ΓΙΑΝΝΟΤΣΟ
ρήκα 1.30: Γηαηάμεηο ζζελαξνύ πξνζαξκνζηηθνύ ειέγρνπ βάζεη κεηξήζεσλ (α) Γηάηαμε ειεγρόκελνπ ζπζηήκαηνο
(β) Γνκή ειεγθηή κε εθηηκώκελν πξνγξακκαηηδόκελν θέξδνο (γ) Γνκή ειεγθηή πξνζαξκνγήο ζε πξόηππν ζύζηεκα
(δ) ρεδίαζε (κε γξακκηθνύ) ειεγθηή πξνζαξκνγήο ζε πξόηππν ζύζηεκα
αξθεηά ειθπζηηθή γηα ηνλ έιεγρν βηνκεραληθώλ δηεξγαζηώλ κε θύξην κεηνλέθηεκα ηελ ππνινγηζηηθή
πνιππινθόηεηα. Χζηόζν, ε κέζνδνο απηή ρξεζηκνπνηείηαη θπξίσο ζε δηεξγαζίεο όπνπ νη αξρηθέο ζπλζήθεο
θαη ε επηζπκεηή έμνδνο είλαη θαζνξηζκέλεο θαη όρη δπλακηθά κεηαβαιιόκελεο (όπσο απηέο ελόο πινίνπ).
1.6.3 ζελαξόο πξνζαξκνζηηθόο έιεγρνο κε βάζε ηα δεδνκέλα
ηελ πεξίπησζε ηεο βειηηζηνπνίεζεο ησλ δπλακηθά κεηαβαιιόκελσλ βηνκεραληθώλ δηεξγαζηώλ ηνπ
πινίνπ, γίλεηαη αληηιεπηό όηη ν ζηόρνο είλαη ε δηαηήξεζε ηεο απόδνζεο ηνπ ζπζηήκαηνο παξνπζία
αβεβαηνηήησλ θαη κεηαβνιώλ ζηηο παξακέηξνπο ηεο δηεξγαζίαο κε βάζε ηηο βέιηηζηεο εηζόδνπο αλαθνξάο,
νη νπνίεο κεηαβάιινληαη κε ηε ιεηηνπξγηθή θαηάζηαζε ηνπ πινίνπ. Ο ζζελαξόο πξνζαξκνζηηθόο έιεγρνο
παξνπζηάδεη πιενλεθηήκαηα ζηελ εμάιεηςε δηαηαξαρώλ πνπ κπνξνύλ λα πξνθιεζνύλ από κεηαβνιέο ζηηο
παξακέηξνπο ή από ηελ έιιεηςε γλώζεο ηεο δπλακηθήο ηνπ ζπζηήκαηνο. Αλάινγα κε ην επίπεδν γλώζεο ηνπ
κνληέινπ ή ηεο δπλακηθήο ηεο δηαδηθαζίαο κπνξεί λα εθαξκνζηεί ειεγθηήο κε πξνγξακκαηηδόκελν
εθηηκώκελν θέξδνο (self-tuning gain scheduling), είηε πξνζαξκνζηηθόο ειεγθηήο ζε πξόηππν κνληέιν
αλαθνξάο (model reference adaptive control - MRAC), ε δνκή ησλ νπνίσλ παξνπζηάδεηαη ζην ρ. 1.30.
Πην ζπγθεθξίκελα, έλαο ειεγθηήο κε ζηαζεξό θέξδνο αλάδξαζεο κπνξεί λα ζρεδηαζζεί ώζηε λα
αληηζηαζκίδεη αιιαγέο ζηηο παξακέηξνπο, ππό ηελ πξνππόζεζε όηη απηέο πξαγκαηνπνηνύληαη ζε
ζπγθεθξηκέλα όξηα. ην δνκηθό δηάγξακκα ηνπ ρ. 1.30(α), G(s) είλαη ε ζπλάξηεζε κεηαθνξάο ηνπ πξνο
έιεγρν ζπζηήκαηνο θαη C(s) ε ζπλάξηεζε κεηαθνξάο ηνπ ειεγθηή. Ζ νιηθή ζπλάξηεζε κεηαθνξάο κεηαμύ
εμόδνπ y θαη εηζόδνπ r είλαη:
όπνπ C(s) επηιέγεηαη ώζηε ην ζύζηεκα θιεηζηνύ βξόρνπ λα είλαη επζηαζέο, παξ‟όιεο ηηο κεηαβνιέο ησλ
παξακέηξσλ ηνπ ζπζηήκαηνο G(s), θαη έηζη ώζηε ζην επηζπκεηό εύξνο ζπρλνηήησλ. Ζ ζπλζήθε απηή
κπνξεί λα επηηεπρζεί εάλ ην θέξδνο αλνηθηνύ βξόρνπ |C(jσ)G(jσ)| είλαη όζν ην δπλαηό κεγαιύηεξν ζην
δεδνκέλν θάζκα ζπρλνηήησλ, ππό ηελ πξνππόζεζε όηη ην ζύζηεκα θιεηζηνύ βξόρνπ παξακέλεη επζηαζέο.
Οη ζηόρνη ζθάικαηνο ζέζεο θαη επζηάζεηαο ηνπ ζπζηήκαηνο κπνξνύλ λα επηηεπρζνύλ κέζα από ηελ
(α)
(β)
(γ)
rk
)(ˆ xf
xk
m
m
as
b
as
b
mx
x
er
)(xf
(δ)
49 Πξνζαξκνζηηθόο έιεγρνο ηνπνινγίαο ξπζκηζηώλ ζηξνθώλ γηα εμνηθνλόκεζε ελέξγεηαο ζε πινία
ΔΙΔΑΚΣΟΡΙΚΗ ΔΙΑΣΡΙΒΗ
ΠΤΡΙΔΩΝ Β. ΓΙΑΝΝΟΤΣΟ
θαηάιιειε ζρεδίαζε ηνπ C(s), ζεσξώληαο όηη νη κεηαβνιέο ηνπ ζπζηήκαηνο G(s) παξακέλνπλ εληόο νξίσλ.
Πξνο απηήλ ηελ θαηεύζπλζε, γηα έλα ζπγθεθξηκέλν ζεκείν ιεηηνπξγίαο i ( , κπνξεί λα
ζρεδηαζζεί ειεγθηήο αλάδξαζεο κε ζηαζεξά θέξδε ζi, πνπ λα επηηπγράλεη ηα θξηηήξηα απόθξηζεο γηα ην
αληίζηνηρν γξακκηθνπνηεκέλν ζύζηεκα. Απηό νδεγεί ζηε ζρεδίαζε ελόο ειεγθηή C(ζ) κε έλα ζύλνιν από
θέξδε { } γηα N ζεκεία ιεηηνπξγίαο, όπσο παξνπζηάδεηαη ζην ρ. 1.30(β). Με απηόλ ηνλ
ηξόπν, εθόζνλ κέζα από κεηξήζεηο επηβεβαησζεί ην ζπγθεθξηκέλν ζεκείν ιεηηνπξγίαο i, ην θέξδνο ηνπ
ειεγθηή απηνξπζκίδεηαη ζηελ θαηάιιειε ηηκή πνπ ιακβάλεηαη από ην πξνγξακκαηηζκέλν ζύλνιν ηηκώλ.
Μεηαβνιέο κεηαμύ δηαθνξεηηθώλ πνιιαπιώλ ζεκείσλ ιεηηνπξγίαο εμππεξεηνύληαη κέζσ παξεκβνιήο ζην
ππάξρνλ ζύλνιν θεξδώλ ή κέζσ επέθηαζεο ησλ ζεκείσλ ιεηηνπξγίαο. Σα δύν ζηνηρεία πνπ είλαη απαξαίηεηα
γηα ηελ εθαξκνγή ηεο πξνζέγγηζεο είλαη έλαο πίλαθαο ηηκώλ (look-up table) όπνπ ζα απνζεθεύνληαη νη ηηκέο
ζi, θαη νη βνεζεηηθέο κεηξήζεηο ηεο δηεξγαζίαο πνπ ζπζρεηίδνληαη ζε πξαγκαηηθό ρξόλν κε ηηο κεηαβνιέο
ζην ζεκείν ιεηηνπξγίαο [49]-[52]. Σν πιενλέθηεκα απηήο ηεο κεζόδνπ ειέγρνπ είλαη όηη ε ξύζκηζε ηνπ
θέξδνπο ηνπ ειεγθηή κπνξεί λα γίλεηαη ζε πξαγκαηηθό ρξόλν αλάινγα κε ηηο κεηξήζεηο πνπ αληηζηνηρνύλ
ζηηο κεηαβαιιόκελεο απαηηήζεηο θαη ηνπο πεξηνξηζκνύο ηεο δηεξγαζίαο δίρσο λα είλαη απαξαίηεηε ε πξόηεξε
γλώζε ηνπ κνληέινπ ηεο δηεξγαζίαο κε απνηέιεζκα λα ππάξρεη επειημία ζηελ εθαξκνγή. Σν κεηνλέθηεκα
ηεο κεζόδνπ είλαη όηη νη θαηαζηάζεηο ιεηηνπξγίαο είλαη απαξαίηεην λα νξηζζνύλ εθ ησλ πξνηέξσλ κε
απνηέιεζκα λα ηίζεηαη ζέκα επζηάζεηαο ζηελ απόθξηζε ηνπ ζπζηήκαηνο εάλ ε ιεηηνπξγηθή ηνπ θαηάζηαζε
παξεθιίλεη από ηα ζεκεία πνπ έρνπλ ππνινγηζηεί θαηά ηε ζρεδίαζε ηνπ ειεγθηή.
ηελ πεξίπησζε πνπ ε δνκή ηεο ζπλάξηεζεο κεηαθνξάο ηνπ πξνο έιεγρνπ ζπζηήκαηνο είλαη γλσζηή
αιιά νη παξάκεηξνη ιεηηνπξγίαο είλαη άγλσζηνη, ηόηε ε παξαπάλσ κέζνδνο κπνξεί λα επεθηαζεί κε ηε ρξήζε
ελόο πξόηππνπ ζπζηήκαηνο αλαθνξάο πνπ νξίδεη ηελ επηζπκεηή απόθξηζε ym ζηελ εμσηεξηθή εληνιή r, ελώ
ν ειεγθηήο παξακεηξνπνηείηαη ρξεζηκνπνηώληαο παξακεηξηθή αλάδξαζε [53], όπσο θαίλεηαη ζην ρ.
1.30(γ). Θεσξώληαο έλα κε γξακκηθό ζύζηεκα πξώηεο ηάμεο κε εμίζσζε θαηάζηαζεο:
όπνπ α, b είλαη γλσζηέο ζηαζεξέο, ζ = (ζ1,...ζΝ)Σ είλαη δηάλπζκα ζηαζεξώλ άγλσζησλ παξακέηξσλ, ελώ
Φ(x) = (θ1(x),...θΝ(x))Σ
είλαη δηάλπζκα γλσζηώλ ζπλαξηήζεσλ. Σν πξόηππν ζύζηεκα αλαθνξάο δηαζέηεη ηελ
επηζπκεηή δπλακηθή , όπνπ ν ζηόρνο ηνπ ειέγρνπ είλαη λα επξεζεί ηέηνηα
είζνδνο u ώζηε . Θεσξώληαο λόκν ειέγρνπ ηεο κνξθήο:
όπνπ Ν+2 παξάκεηξνη ρξεηάδεηαη λα εθηηκεζνύλ ζε πξαγκαηηθό ρξόλν: , κε απνηέιεζκα ε ζύγθξηζε
ηνπ θιεηζηνύ ζπζηήκαηνο κε ην πξόηππν δπλακηθό ζύζηεκα λα θαηαιήγεη ζηηο εμήο ζρέζεηο:
Γηα ηε ζύγθιηζε ησλ δύν ζπζηεκάησλ, ζεσξείηαη όηη ππάξρνπλ ηδαληθά θέξδε kx,ky έηζη ώζηε α + bkx = αm,
bkr = bm, κε ζπλέπεηα λα ηζρύεη:
ρεηηθά κε ην ζθάικα ζύγθιηζεο ηζρύεη όηη e(t) = x(t) – xm(t), ελώ ε δπλακηθή ηνπ ζθάικαηνο ζα είλαη:
50 Κεθάιαην 1 Δηζαγσγή – Κίλεηξα θαη ζηόρνη Γηαηξηβήο
ΔΙΔΑΚΣΟΡΙΚΗ ΔΙΑΣΡΙΒΗ
ΠΤΡΙΔΩΝ Β. ΓΙΑΝΝΟΤΣΟ
Με βάζε ηα παξαπάλσ θαη ζεσξώληαο ππνςήθηα ζπλάξηεζε Lyapunov ηελ αθόινπζε:
όπνπ γx>0, γr>0, θαη Γ=ΓΣ>0 είλαη ζπκκεηξηθόο ζεηηθά νξηζκέλνο πίλαθαο. Γηα ηελ εμέηαζε ηεο
αζπκπησηηθήο επζηάζεηαο ηνπ θιεηζηνύ ζπζηήκαηνο, ζεσξνύκε ηελ παξάγσγν ηεο ζπλάξηεζεο Lyapunov:
πλερίδνληαο, ζεσξνύκε πξνζαξκνζηηθνύο λόκνπο (κε αλαλέσζε παξακέηξσλ ζε πξαγκαηηθό ρξόλν) έηζη
ώζηε ε ρξνληθή παξάγσγνο ηεο ζπλάξηεζεο Lyapunov λα κεηώλεηαη θαηά κήθνο ηεο ηξνρηάο ηνπ ζθάικαηνο:
Δπνκέλσο κε ηνπο παξαπάλσ λόκνπο ειέγρνπ, ε ρξνληθή παξάγσγνο ηεο ζπλάξηεζεο Lyapunov γίλεηαη
αξλεηηθά εκη-νξηζκέλε σο εμήο:
Γηα ηελ επζηάζεηα ηνπ θιεηζηνύ ζπζηήκαηνο ηόηε, εθόζνλ ,όια ηα ζθάικαηα εθηίκεζεο
ησλ παξακέηξσλ ζπγθιίλνπλ όκνηα κε ηηο εθηηκώκελεο παξακέηξνπο. Θεσξώληαο επίζεο όηη ε είζνδνο
αλαθνξάο r(t) είλαη νξηνζεηεκέλε, ηόηε θαη ηα δηαλύζκαηα είλαη νξηνζεηεκέλα, όπσο θαη ην
δηάλπζκα θαηάζηαζεο . Δπόκέλσο θαη ν πξνζαξκνζηηθόο λόκνο ειέγρνπ u είλαη νξηνζεηεκέλνο
καδί κε ην δηάλπζκα . Από ηα παξαπάλσ ζπλεπάγεηαη όηη ε δεύηεξε παξάγσγνο ηεο ζπλάξηεζεο
Lyapunov είλαη νξηνζεηεκέλε, νπόηε ζύκθσλα κε ην ιήκκα Βarbalat ε πξώηε παξάγσγνο
είλαη ζπλερήο ζπλάξηεζε ηνπ ρξόλνπ [54], άξα . Δθόζνλ , ηόηε γηα ην
ζθάικα ζα ηζρύεη , νδεγώληαο ζε αζπκπησηηθή ζύγθιηζε . ε απηήλ
ηελ πεξίπησζε, ην ζύζηεκα ειέγρνπ θιεηζηνύ βξόρνπ ζα έρεη ηε κνξθή ηνπ ζρήκαηνο 1.30(δ), όπνπ ηα
πξνζαξκνζηηθά θέξδε ζα είλαη ηα , ελώ ε ζπλάξηεζε εθηίκεζεο ησλ παξακέηξσλ ηνπ κε γξακκηθνύ
κέξνπο ηνπ ειεγθηή ζα είλαη ηεο κνξθήο ∑ . ην ρ. 1.31 παξνπζηάδεηαη
ε δπλακηθή απόθξηζεο ζζελαξνύ πξνζαξκνζηηθνύ ειεγθηή ζε πξόηππν αλαθνξάο γηα γξακκηθό ζύζηεκα.
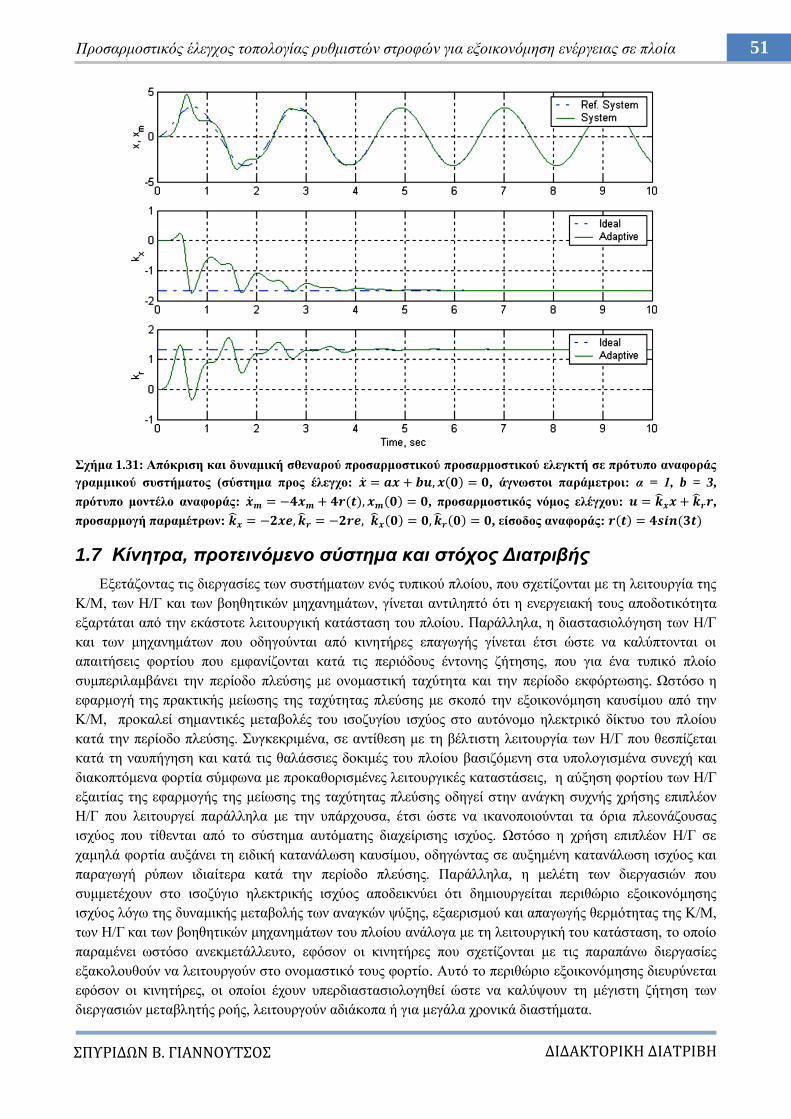
51 Πξνζαξκνζηηθόο έιεγρνο ηνπνινγίαο ξπζκηζηώλ ζηξνθώλ γηα εμνηθνλόκεζε ελέξγεηαο ζε πινία
ΔΙΔΑΚΣΟΡΙΚΗ ΔΙΑΣΡΙΒΗ
ΠΤΡΙΔΩΝ Β. ΓΙΑΝΝΟΤΣΟ
ρήκα 1.31: Απόθξηζε θαη δπλακηθή ζζελαξνύ πξνζαξκνζηηθνύ πξνζαξκνζηηθνύ ειεγθηή ζε πξόηππν αλαθνξάο
γξακκηθνύ ζπζηήκαηνο (ζύζηεκα πξνο έιεγρν: , άγλσζηνη παξάκεηξνη: α = 1, b = 3,
πξόηππν κνληέιν αλαθνξάο: , πξνζαξκνζηηθόο λόκνο ειέγρνπ: ,
πξνζαξκνγή παξακέηξσλ: , είζνδνο αλαθνξάο:
1.7 Κίνηηπα, πποηεινόμενο ζύζηημα και ζηόσορ Γιαηπιβήρ
Δμεηάδνληαο ηηο δηεξγαζίεο ησλ ζπζηήκαησλ ελόο ηππηθνύ πινίνπ, πνπ ζρεηίδνληαη κε ηε ιεηηνπξγία ηεο
Κ/Μ, ησλ H/Γ θαη ησλ βνεζεηηθώλ κεραλεκάησλ, γίλεηαη αληηιεπηό όηη ε ελεξγεηαθή ηνπο απνδνηηθόηεηα
εμαξηάηαη από ηελ εθάζηνηε ιεηηνπξγηθή θαηάζηαζε ηνπ πινίνπ. Παξάιιεια, ε δηαζηαζηνιόγεζε ησλ Ζ/Γ
θαη ησλ κεραλεκάησλ πνπ νδεγνύληαη από θηλεηήξεο επαγσγήο γίλεηαη έηζη ώζηε λα θαιύπηνληαη νη
απαηηήζεηο θνξηίνπ πνπ εκθαλίδνληαη θαηά ηηο πεξηόδνπο έληνλεο δήηεζεο, πνπ γηα έλα ηππηθό πινίν
ζπκπεξηιακβάλεη ηελ πεξίνδν πιεύζεο κε νλνκαζηηθή ηαρύηεηα θαη ηελ πεξίνδν εθθόξησζεο. Χζηόζν ε
εθαξκνγή ηεο πξαθηηθήο κείσζεο ηεο ηαρύηεηαο πιεύζεο κε ζθνπό ηελ εμνηθνλόκεζε θαπζίκνπ από ηελ
Κ/Μ, πξνθαιεί ζεκαληηθέο κεηαβνιέο ηνπ ηζνδπγίνπ ηζρύνο ζην απηόλνκν ειεθηξηθό δίθηπν ηνπ πινίνπ
θαηά ηελ πεξίνδν πιεύζεο. πγθεθξηκέλα, ζε αληίζεζε κε ηε βέιηηζηε ιεηηνπξγία ησλ Ζ/Γ πνπ ζεζπίδεηαη
θαηά ηε λαππήγεζε θαη θαηά ηηο ζαιάζζηεο δνθηκέο ηνπ πινίνπ βαζηδόκελε ζηα ππνινγηζκέλα ζπλερή θαη
δηαθνπηόκελα θνξηία ζύκθσλα κε πξνθαζνξηζκέλεο ιεηηνπξγηθέο θαηαζηάζεηο, ε αύμεζε θνξηίνπ ησλ Ζ/Γ
εμαηηίαο ηεο εθαξκνγήο ηεο κείσζεο ηεο ηαρύηεηαο πιεύζεο νδεγεί ζηελ αλάγθε ζπρλήο ρξήζεο επηπιένλ
Ζ/Γ πνπ ιεηηνπξγεί παξάιιεια κε ηελ ππάξρνπζα, έηζη ώζηε λα ηθαλνπνηνύληαη ηα όξηα πιενλάδνπζαο
ηζρύνο πνπ ηίζεληαη από ην ζύζηεκα απηόκαηεο δηαρείξηζεο ηζρύνο. Χζηόζν ε ρξήζε επηπιένλ Ζ/Γ ζε
ρακειά θνξηία απμάλεη ηε εηδηθή θαηαλάισζε θαπζίκνπ, νδεγώληαο ζε απμεκέλε θαηαλάισζε ηζρύνο θαη
παξαγσγή ξύπσλ ηδηαίηεξα θαηά ηελ πεξίνδν πιεύζεο. Παξάιιεια, ε κειέηε ησλ δηεξγαζηώλ πνπ
ζπκκεηέρνπλ ζην ηζνδύγην ειεθηξηθήο ηζρύνο απνδεηθλύεη όηη δεκηνπξγείηαη πεξηζώξην εμνηθνλόκεζεο
ηζρύνο ιόγσ ηεο δπλακηθήο κεηαβνιήο ησλ αλαγθώλ ςύμεο, εμαεξηζκνύ θαη απαγσγήο ζεξκόηεηαο ηεο Κ/Μ,
ησλ Ζ/Γ θαη ησλ βνεζεηηθώλ κεραλεκάησλ ηνπ πινίνπ αλάινγα κε ηε ιεηηνπξγηθή ηνπ θαηάζηαζε, ην νπνίν
παξακέλεη σζηόζν αλεθκεηάιιεπην, εθόζνλ νη θηλεηήξεο πνπ ζρεηίδνληαη κε ηηο παξαπάλσ δηεξγαζίεο
εμαθνινπζνύλ λα ιεηηνπξγνύλ ζην νλνκαζηηθό ηνπο θνξηίν. Απηό ην πεξηζώξην εμνηθνλόκεζεο δηεπξύλεηαη
εθόζνλ νη θηλεηήξεο, νη νπνίνη έρνπλ ππεξδηαζηαζηνινγεζεί ώζηε λα θαιύςνπλ ηε κέγηζηε δήηεζε ησλ
δηεξγαζηώλ κεηαβιεηήο ξνήο, ιεηηνπξγνύλ αδηάθνπα ή γηα κεγάια ρξνληθά δηαζηήκαηα.
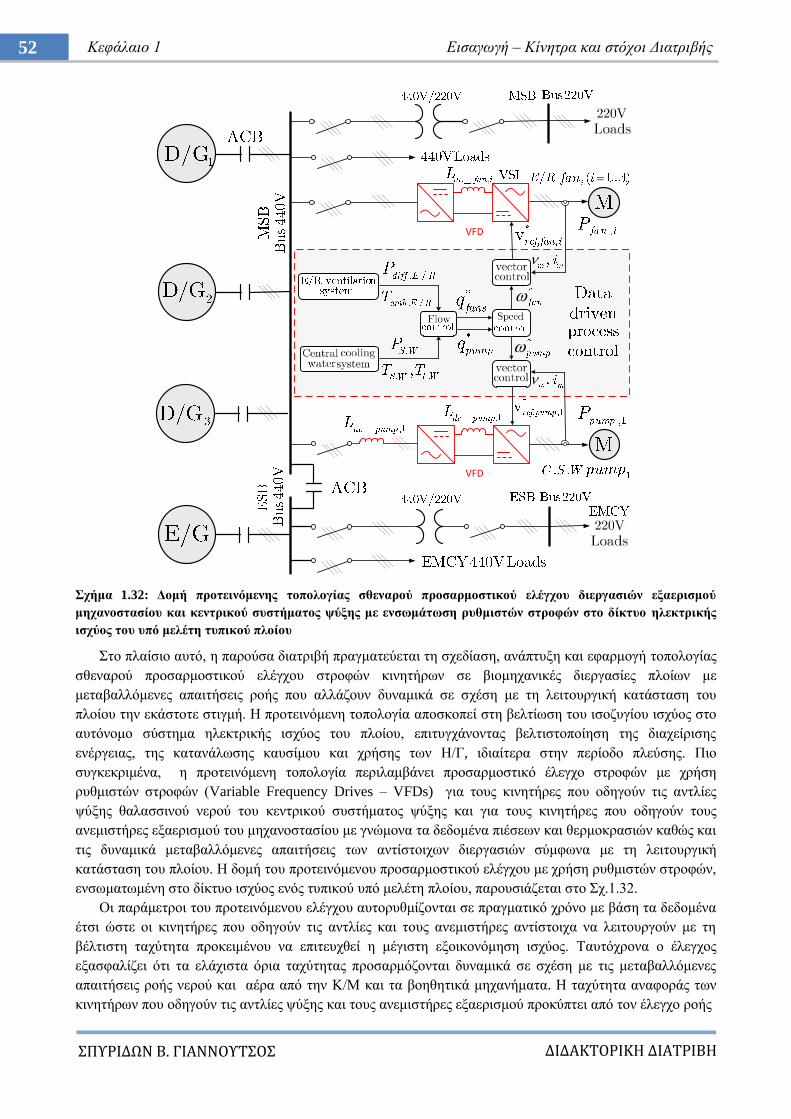
52 Κεθάιαην 1 Δηζαγσγή – Κίλεηξα θαη ζηόρνη Γηαηξηβήο
ΔΙΔΑΚΣΟΡΙΚΗ ΔΙΑΣΡΙΒΗ
ΠΤΡΙΔΩΝ Β. ΓΙΑΝΝΟΤΣΟ
ρήκα 1.32: Γνκή πξνηεηλόκελεο ηνπνινγίαο ζζελαξνύ πξνζαξκνζηηθνύ ειέγρνπ δηεξγαζηώλ εμαεξηζκνύ
κεραλνζηαζίνπ θαη θεληξηθνύ ζπζηήκαηνο ςύμεο κε ελζσκάησζε ξπζκηζηώλ ζηξνθώλ ζην δίθηπν ειεθηξηθήο
ηζρύνο ηνπ ππό κειέηε ηππηθνύ πινίνπ
ην πιαίζην απηό, ε παξνύζα δηαηξηβή πξαγκαηεύεηαη ηε ζρεδίαζε, αλάπηπμε θαη εθαξκνγή ηνπνινγίαο
ζζελαξνύ πξνζαξκνζηηθνύ ειέγρνπ ζηξνθώλ θηλεηήξσλ ζε βηνκεραληθέο δηεξγαζίεο πινίσλ κε
κεηαβαιιόκελεο απαηηήζεηο ξνήο πνπ αιιάδνπλ δπλακηθά ζε ζρέζε κε ηε ιεηηνπξγηθή θαηάζηαζε ηνπ
πινίνπ ηελ εθάζηνηε ζηηγκή. Ζ πξνηεηλόκελε ηνπνινγία απνζθνπεί ζηε βειηίσζε ηνπ ηζνδπγίνπ ηζρύνο ζην
απηόλνκν ζύζηεκα ειεθηξηθήο ηζρύνο ηνπ πινίνπ, επηηπγράλνληαο βειηηζηνπνίεζε ηεο δηαρείξηζεο
ελέξγεηαο, ηεο θαηαλάισζεο θαπζίκνπ θαη ρξήζεο ησλ Ζ/Γ, ηδηαίηεξα ζηελ πεξίνδν πιεύζεο. Πην
ζπγθεθξηκέλα, ε πξνηεηλόκελε ηνπνινγία πεξηιακβάλεη πξνζαξκνζηηθό έιεγρν ζηξνθώλ κε ρξήζε
ξπζκηζηώλ ζηξνθώλ (Variable Frequency Drives – VFDs) γηα ηνπο θηλεηήξεο πνπ νδεγνύλ ηηο αληιίεο
ςύμεο ζαιαζζηλνύ λεξνύ ηνπ θεληξηθνύ ζπζηήκαηνο ςύμεο θαη γηα ηνπο θηλεηήξεο πνπ νδεγνύλ ηνπο
αλεκηζηήξεο εμαεξηζκνύ ηνπ κεραλνζηαζίνπ κε γλώκνλα ηα δεδνκέλα πηέζεσλ θαη ζεξκνθξαζηώλ θαζώο θαη
ηηο δπλακηθά κεηαβαιιόκελεο απαηηήζεηο ησλ αληίζηνηρσλ δηεξγαζηώλ ζύκθσλα κε ηε ιεηηνπξγηθή
θαηάζηαζε ηνπ πινίνπ. Ζ δνκή ηνπ πξνηεηλόκελνπ πξνζαξκνζηηθνύ ειέγρνπ κε ρξήζε ξπζκηζηώλ ζηξνθώλ,
ελζσκαησκέλε ζην δίθηπν ηζρύνο ελόο ηππηθνύ ππό κειέηε πινίνπ, παξνπζηάδεηαη ζην ρ.1.32.
Οη παξάκεηξνη ηνπ πξνηεηλόκελνπ ειέγρνπ απηνξπζκίδνληαη ζε πξαγκαηηθό ρξόλν κε βάζε ηα δεδνκέλα
έηζη ώζηε νη θηλεηήξεο πνπ νδεγνύλ ηηο αληιίεο θαη ηνπο αλεκηζηήξεο αληίζηνηρα λα ιεηηνπξγνύλ κε ηε
βέιηηζηε ηαρύηεηα πξνθεηκέλνπ λα επηηεπρζεί ε κέγηζηε εμνηθνλόκεζε ηζρύνο. Σαπηόρξνλα ν έιεγρνο
εμαζθαιίδεη όηη ηα ειάρηζηα όξηα ηαρύηεηαο πξνζαξκόδνληαη δπλακηθά ζε ζρέζε κε ηηο κεηαβαιιόκελεο
απαηηήζεηο ξνήο λεξνύ θαη αέξα από ηελ Κ/Μ θαη ηα βνεζεηηθά κεραλήκαηα. Ζ ηαρύηεηα αλαθνξάο ησλ
θηλεηήξσλ πνπ νδεγνύλ ηηο αληιίεο ςύμεο θαη ηνπο αλεκηζηήξεο εμαεξηζκνύ πξνθύπηεη από ηνλ έιεγρν ξνήο
VFD
VFD
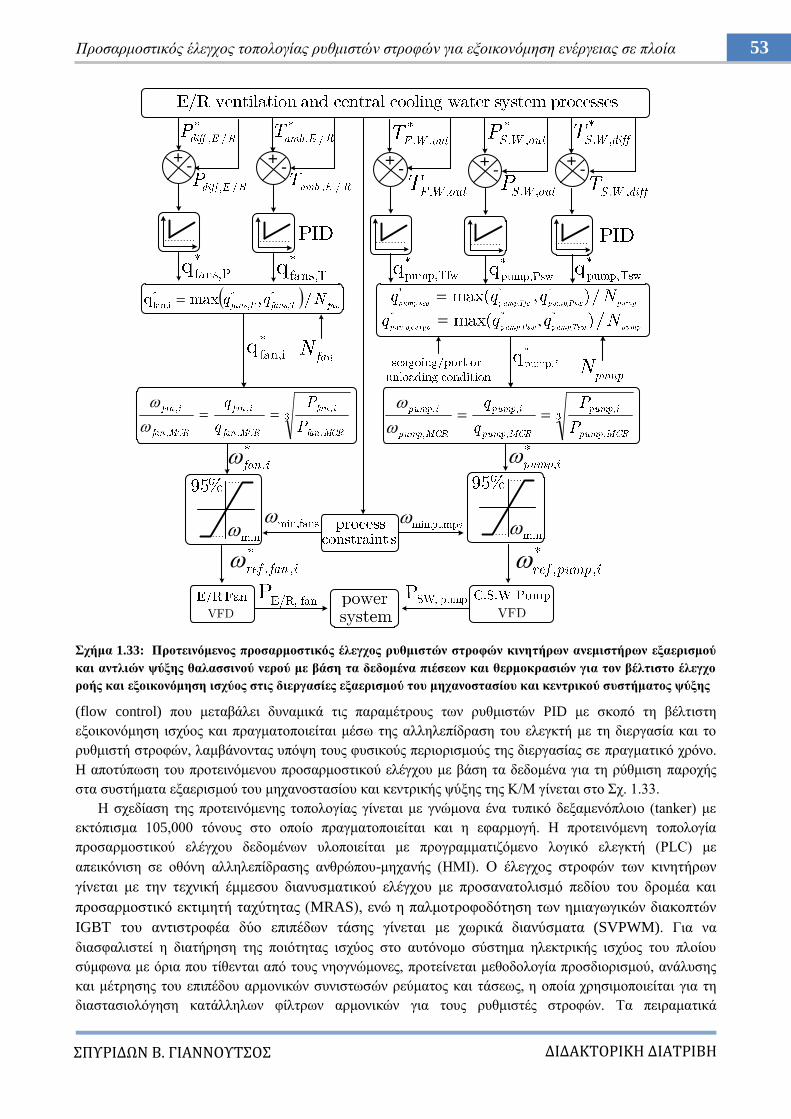
53 Πξνζαξκνζηηθόο έιεγρνο ηνπνινγίαο ξπζκηζηώλ ζηξνθώλ γηα εμνηθνλόκεζε ελέξγεηαο ζε πινία
ΔΙΔΑΚΣΟΡΙΚΗ ΔΙΑΣΡΙΒΗ
ΠΤΡΙΔΩΝ Β. ΓΙΑΝΝΟΤΣΟ
ρήκα 1.33: Πξνηεηλόκελνο πξνζαξκνζηηθόο έιεγρνο ξπζκηζηώλ ζηξνθώλ θηλεηήξσλ αλεκηζηήξσλ εμαεξηζκνύ
θαη αληιηώλ ςύμεο ζαιαζζηλνύ λεξνύ κε βάζε ηα δεδνκέλα πηέζεσλ θαη ζεξκνθξαζηώλ γηα ηνλ βέιηηζην έιεγρν
ξνήο θαη εμνηθνλόκεζε ηζρύνο ζηηο δηεξγαζίεο εμαεξηζκνύ ηνπ κεραλνζηαζίνπ θαη θεληξηθνύ ζπζηήκαηνο ςύμεο
(flow control) πνπ κεηαβάιεη δπλακηθά ηηο παξακέηξνπο ησλ ξπζκηζηώλ PID κε ζθνπό ηε βέιηηζηε
εμνηθνλόκεζε ηζρύνο θαη πξαγκαηνπνηείηαη κέζσ ηεο αιιειεπίδξαζε ηνπ ειεγθηή κε ηε δηεξγαζία θαη ην
ξπζκηζηή ζηξνθώλ, ιακβάλνληαο ππόςε ηνπο θπζηθνύο πεξηνξηζκνύο ηεο δηεξγαζίαο ζε πξαγκαηηθό ρξόλν.
H απνηύπσζε ηνπ πξνηεηλόκελνπ πξνζαξκνζηηθνύ ειέγρνπ κε βάζε ηα δεδνκέλα γηα ηε ξύζκηζε παξνρήο
ζηα ζπζηήκαηα εμαεξηζκνύ ηνπ κεραλνζηαζίνπ θαη θεληξηθήο ςύμεο ηεο Κ/Μ γίλεηαη ζην ρ. 1.33.
Ζ ζρεδίαζε ηεο πξνηεηλόκελεο ηνπνινγίαο γίλεηαη κε γλώκνλα έλα ηππηθό δεμακελόπινην (tanker) κε
εθηόπηζκα 105,000 ηόλνπο ζην νπνίν πξαγκαηνπνηείηαη θαη ε εθαξκνγή. Ζ πξνηεηλόκελε ηνπνινγία
πξνζαξκνζηηθνύ ειέγρνπ δεδνκέλσλ πινπνηείηαη κε πξνγξακκαηηδόκελν ινγηθό ειεγθηή (PLC) κε
απεηθόληζε ζε νζόλε αιιειεπίδξαζεο αλζξώπνπ-κεραλήο (HMI). Ο έιεγρνο ζηξνθώλ ησλ θηλεηήξσλ
γίλεηαη κε ηελ ηερληθή έκκεζνπ δηαλπζκαηηθνύ ειέγρνπ κε πξνζαλαηνιηζκό πεδίνπ ηνπ δξνκέα θαη
πξνζαξκνζηηθό εθηηκεηή ηαρύηεηαο (MRAS), ελώ ε παικνηξνθνδόηεζε ησλ εκηαγσγηθώλ δηαθνπηώλ
IGBT ηνπ αληηζηξνθέα δύν επηπέδσλ ηάζεο γίλεηαη κε ρσξηθά δηαλύζκαηα (SVPWM). Γηα λα
δηαζθαιηζηεί ε δηαηήξεζε ηεο πνηόηεηαο ηζρύνο ζην απηόλνκν ζύζηεκα ειεθηξηθήο ηζρύνο ηνπ πινίνπ
ζύκθσλα κε όξηα πνπ ηίζεληαη από ηνπο λενγλώκνλεο, πξνηείλεηαη κεζνδνινγία πξνζδηνξηζκνύ, αλάιπζεο
θαη κέηξεζεο ηνπ επηπέδνπ αξκνληθώλ ζπληζησζώλ ξεύκαηνο θαη ηάζεσο, ε νπνία ρξεζηκνπνηείηαη γηα ηε
δηαζηαζηνιόγεζε θαηάιιεισλ θίιηξσλ αξκνληθώλ γηα ηνπο ξπζκηζηέο ζηξνθώλ. Σα πεηξακαηηθά
-+
-+
-+
-+ -
+
54 Κεθάιαην 1 Δηζαγσγή – Κίλεηξα θαη ζηόρνη Γηαηξηβήο
ΔΙΔΑΚΣΟΡΙΚΗ ΔΙΑΣΡΙΒΗ
ΠΤΡΙΔΩΝ Β. ΓΙΑΝΝΟΤΣΟ
απνηειέζκαηα πνπ πξνθύπηνπλ από ηε κεηαζθεπή (retrofit) ηνπ πξνηεηλόκελνπ ζπζηήκαηνο ζε ηππηθό
δεμακελόπινην ζπγθξίλνληαη κε ηηο πξνεγνύκελεο ζπλζήθεο ιεηηνπξγίαο, ώζηε λα αλαδεηρζνύλ ηα νθέιε ηεο
βειηηζηνπνίεζεο ηνπ ηζνδπγίνπ ηζρύνο θαη ηεο ιεηηνπξγίαο ησλ Ζ/Γ ζηελ θαηαλάισζε θαπζίκνπ. ην
πιαίζην απηό πξνηείλεηαη κέζνδνο ππνινγηζκνύ γηα ηα νηθνλνκηθά θαη πεξηβαληνιινγηθά νθέιε, κε βάζε
ηνλ ηύπν ηνπ θαπζίκνπ πνπ ρξεζηκνπνηείηαη, ηελ εηδηθή θαηαλάισζε θαπζίκνπ ησλ Ζ/Γ θαη ην ιεηηνπξγηθό
πξνθίι ηνπ πινίνπ γηα ηελ πιήξε αμηνιόγεζε ηεο απόδνζεο ηνπ ζπζηήκαηνο.
Απνδεηθλύεηαη όηη αληηζηαζκίδνληαο ηε κεηαβνιή ηνπ ηζνδπγίνπ ηζρύνο πνπ πξνθαιείηαη από ηελ
εθαξκνγή ηεο πξαθηηθήο κείσζεο ηεο ηαρύηεηαο πιεύζεο κε ηελ εμνηθνλόκεζε ηζρύνο πνπ εμαζθαιίδεηαη
από ηε ειεγρόκελε ξύζκηζε ζηξνθώλ ησλ αλεκηζηήξσλ εμαεξηζκνύ θαη αληιηώλ ςύμεο κε βάζε ην
πξνηεηλόκελν ζύζηεκα, επηηπγράλεηαη ζπλερήο ρξήζε κηαο κόλν Ζ/Γ ζρεδόλ θαζόιε ηελ πεξίνδν πιεύζεο.
Σν γεγνλόο απηό εληζρύεη αθόκε πεξηζζόηεξν ηε κείσζε ηεο θαηαλάισζεο θαπζίκνπ ησλ Ζ/Γ ζε ζρέζε κε
ην παξειζόλ θαη ζε ζπλδπαζκό κε ηε βειηηζηνπνίεζε ηεο θαηαλάισζεο ηζρύνο πνπ επηηπγράλεηαη,
επηβεβαηώλεη ηε ζεκαζία θαη ηα νθέιε ηεο πξνηεηλόκελεο ηνπνινγίαο γηα ηε λαπηηθή βηνκεραλία.
1.8 Σςνειζθοπά Γιαηπιβήρ και λίζηα δημοζιεύζευν
Με βάζε ηα παξαπάλσ, ε παξνύζα Γηαηξηβή ζπλεηζθέξεη κε πξσηόηππν έξγν ζηα αθόινπζα ζεκεία:
Μειέηε επίδξαζεο ηεο πξαθηηθήο κείσζεο ηεο ηαρύηεηαο πιεύζεο ζηελ ελεξγεηαθή ζπκκεηνρή ησλ
θύξησλ δηεξγαζηώλ ζην ηζνδύγην ηζρύνο ηνπ πινίνπ θαη ζηε ιεηηνπξγία ησλ Ζ/Γ ζην απηόλνκν
ζύζηεκα ειεθηξηθήο ηζρύνο ηνπ πινίνπ κε έκθαζε ζηελ επίδξαζε ησλ κεηαβνιώλ ηνπ θνξηίνπ ζηε
ιεηηνπξγία θαη ηελ απόθξηζε ησλ βξόρσλ ζπρλόηεηαο θαη ηάζεο [C5, C8].
Μειέηε ησλ παξαγόλησλ πνπ επεξεάδνπλ ηα όξηα ιεηηνπξγίαο ηνπ απηόλνκνπ ζπζηήκαηνο
ειεθηξηθήο ηζρύνο ηνπ πινίνπ ζε πεξηπηώζεηο δπλακηθώλ κεηαβνιώλ ηνπ θνξηίνπ, πεξηιακβάλνληαο
ηελ εμέηαζε ησλ νξίσλ κεηαβαηηθήο θόξηηζεο ησλ ππόινηπσλ Ζ/Γ ζε πεξίπησζε αζηνρίαο κηαο Ζ/Γ
δηαζπλδεδεκέλεο ζην δίθηπν, ην πεξηζώξην κέγηζηνπ ζπλερνύο θνξηίνπ θαη ηνλ απηόκαην
παξαιιειηζκό ησλ Ζ/Γ, ηνλ ηζνκνηξαζκό θνξηίνπ κεηαμύ Ζ/Γ θαη ην πεξηζώξην κεηαβαηηθήο
θόξηηζεο, ην δηαζέζηκν πεξηζώξην ηζρύνο γηα απνθπγή απώιεηαο ηξνθνδνζίαο θαη ηε δπλακηθή ηνπ
κεραληζκνύ επηιεθηηθήο απνθνπήο θνξηίνπ [C1].
Δμαθξίβσζε ηνπ πεξηζσξίνπ εμνηθνλόκεζεο ηζρύνο πνπ δεκηνπξγείηαη από ηε κείσζε ησλ
απαηηήζεσλ ξνήο ςύμεο λεξνύ, εμαεξηζκνύ θαη απαγσγήο ζεξκόηεηαο ηεο Κ/Μ, ησλ Ζ/Γ θαη ησλ
βνεζεηηθώλ κεραλεκάησλ ηνπ πινίνπ αλάινγα κε ηε ιεηηνπξγηθή ηνπ θαηάζηαζε, εθαξκόδνληαο
ξπζκηζηέο ζηξνθώλ ζηνπο θηλεηήξεο πνπ νδεγνύλ ηηο αληιίεο ςύμεο ζαιαζζηλνύ λεξνύ θαη ζηνπο
αλεκηζηήξεο εμαεξηζκνύ ηνπ κεραλνζηαζίνπ [C1, C5].
ρεδίαζε, αλάπηπμε θαη εθαξκνγή ηνπνινγίαο ζζελαξνύ πξνζαξκνζηηθνύ ειεγθηή γηα ηελ
ελεξγεηαθή βειηηζηνπνίεζε ηεο θαηαλαιηζθόκελεο ηζρύνο αληιηώλ παξνρήο ζαιαζζηλνύ λεξνύ πξνο
ηνλ θεληξηθό ελαιιάθηε ηνπ ζπζηήκαηνο θεληξηθήο ςύμεο, νδεγνύκελσλ από θηλεηήξεο επαγσγήο
κε ειεγρόκελε ξύζκηζε ζηξνθώλ, αλάινγα κε ηηο κεηαβαιιόκελεο απαηηήζεηο ξνήο γηα ςύμε ηεο
Κ/Μ, ησλ Ζ/Γ θαη ησλ βνεζεηηθώλ κεραλεκάησλ. Ζ ξύζκηζε ησλ παξακέηξσλ βαζίδεηαη ζε
κεηξήζεηο ζεξκνθξαζηώλ θαη πηέζεσλ ηεο δηεξγαζίαο ζε πξαγκαηηθό ρξόλν πνπ ρξεζηκνπνηνύληαη
σο αλάδξαζε γηα ηελ απηόκαηε ξύζκηζε ησλ θεξδώλ ησλ ειεγθηώλ PID, ελώ ε αλαθνξά εμόδνπ
ηαρύηεηαο νξηνζεηείηαη δπλακηθά ώζηε λα ζπκκνξθώλεηαη κε ηνπο κεηαβαιιόκελνπο θπζηθνύο
πεξηνξηζκνύο ηεο δηεξγαζίαο, κε ζθνπό ηε βειηηζηνπνίεζε ηεο απόθξηζεο ηνπ ζπζηήκαηνο [J3].
ρεδίαζε, αλάπηπμε θαη εθαξκνγή ηνπνινγίαο ζζελαξνύ πξνζαξκνζηηθνύ ειεγθηή γηα ελεξγεηαθή
βειηηζηνπνίεζε ηεο θαηαλαιηζθόκελεο ηζρύνο αλεκηζηήξσλ εμαεξηζκνύ αμνληθήο ξνήο ζην ζύζηεκα
εμαεξηζκνύ ηνπ κεραλνζηαζίνπ, νδεγνύκελσλ από θηλεηήξεο επαγσγήο κε ειεγρόκελε ξύζκηζε
ζηξνθώλ, αλάινγα κε ηηο κεηαβαιιόκελεο απαηηήζεηο ξνήο αέξα γηα θαύζε θαη απαγσγή ηεο
ζεξκόηεηαο από ηελ Κ/Μ, ηηο Ζ/Γ, ην ιέβεηα θαπζίκνπ θαη ηα βνεζεηηθά κεραλήκαηα. Ζ ξύζκηζε
ησλ παξακέηξσλ ηνπ ειεγθηή γίλεηαη βάζεη κεηξήζεσλ ζεξκνθξαζίαο θαη δηαθνξηθήο πίεζεο ζε
55 Πξνζαξκνζηηθόο έιεγρνο ηνπνινγίαο ξπζκηζηώλ ζηξνθώλ γηα εμνηθνλόκεζε ελέξγεηαο ζε πινία
ΔΙΔΑΚΣΟΡΙΚΗ ΔΙΑΣΡΙΒΗ
ΠΤΡΙΔΩΝ Β. ΓΙΑΝΝΟΤΣΟ
δηάθνξα ζεκεία ηεο δηεξγαζίαο, πνπ ρξεζηκνπνηνύληαη σο αλάδξαζε γηα ηελ πξνζαξκνγή ζηνπο
πεξηνξηζκνύο ηεο δηεξγαζίαο αλεμάξηεηα από ην κνληέιν ηνπ πξνο έιεγρν ζπζηήκαηνο [J1, C3].
Αλάπηπμε ζπζηεκαηηθήο κεζνδνινγίαο πξνζδηνξηζκνύ θαη επνπηείαο πνηόηεηαο ηζρύνο ζην
απηόλνκν δίθηπν ειεθηξηθήο ηζρύνο ηνπ πινίνπ γηα ην ζρεδηαζκό θίιηξσλ εμάιεηςεο αξκνληθώλ
θαηά ηελ εθαξκνγή ξπζκηζηώλ ζηξνθώλ ζηελ νδήγεζε επαγσγηθώλ θηλεηήξσλ ζην πινίν, έηζη ώζηε
λα ηθαλνπνηνύληαη νη πεξηνξηζκνί αξκνληθήο παξακόξθσζεο ηεο ηάζεο ηνπ δηθηύνπ ζύκθσλα κε ηα
πξόηππα ησλ λενγλσκόλσλ. Ζ πξνηεηλόκελε κεζνδνινγία είλαη επαξθώο παξακεηξνπνηήζηκε γηα
ηελ εθαξκνγή ζε θάζε απηόλνκν δίθηπν ηζρύνο πινίνπ πνπ αληηκεησπίδεη δνκηθέο αιιαγέο κε ηελ
εθαξκνγή ξπζκηζηώλ ζηξνθώλ θαη ιακβάλεη ππόςε ηεο ην ξόιν ηεο ηζρύνο βξαρπθύθισζεο θαη ησλ
ζύλζεησλ αληηζηάζεσλ ηνπ ζπζηήκαηνο ηζρύνο γηα ηελ απνθπγή ζπληνληζκώλ, θαζώο θαη ησλ
πεξηπηώζεσλ αζηάζεηαο ζηνπο βξόρνπο ξύζκηζεο ηάζεο θαη ζπρλόηεηαο ησλ Ζ/Γ. Ζ κεζνδνινγία
ρξεζηκνπνηείηαη γηα ηε ζρεδίαζε θαηάιιεισλ θίιηξσλ εμάιεηςεο αξκνληθώλ θαηά ηελ εθαξκνγή ηεο
ηνπνινγίαο ειέγρνπ ξπζκηζηώλ ζηξνθώλ ησλ αλεκηζηήξσλ εμαεξηζκνύ θαη αληιηώλ ςύμεο [J2, C4].
Αλάπηπμε πιαηθόξκαο κέηξεζεο αξκνληθώλ ζπληζησζώλ ζην ζεκείν θνηλήο ζύλδεζεο (PCC) ζε
ζπλδπαζκό κε ηε ζρεδίαζε θαη ηελ εθαξκνγή θίιηξσλ κείσζεο ειεθηξνκαγλεηηθήο παξεκβνιήο
θαηά ηε εθαξκνγή ξπζκηζηώλ ζηξνθώλ ζηνπο θηλεηήξεο πνπ νδεγνύλ ηνπο αλεκηζηήξεο εμαεξηζκνύ
θαη ηηο αληιίεο ςύμεο ζην ηππηθό πινίν ππό κειέηε [J2].
Δπίηεπμε βειηηζηνπνίεζεο ηεο ιεηηνπξγίαο ησλ Ζ/Γ θαηά ηελ πεξίνδν πιεύζεο κε αληηζηάζκηζε ηεο
κεηαβνιήο ηνπ ηζνδπγίνπ ηζρύνο πνπ πξνθαιείηαη από ηελ εθαξκνγή ηεο πξαθηηθήο κείσζεο ηεο
ηαρύηεηαο πιεύζεο κε ηελ εμνηθνλόκεζε ηζρύνο πνπ εμαζθαιίδεηαη από ηε ειεγρόκελε ξύζκηζε
ζηξνθώλ ησλ αλεκηζηήξσλ εμαεξηζκνύ θαη αληιηώλ ςύμεο κε ην πξνηεηλόκελν ζύζηεκα [C1].
Πξόηαζε κεζόδνπ ππνινγηζκνύ γηα ηα νηθνλνκηθά θαη πεξηβαιινληηθά νθέιε πνπ δεκηνπξγνύληαη
από ηε βειηίσζε ηεο ρξήζεο ησλ Ζ/Γ, βάζεη ηνπ ηύπνπ ηνπ θαπζίκνπ πνπ ρξεζηκνπνηείηαη, ηελ
εηδηθή θαηαλάισζε θαπζίκνπ ησλ Ζ/Γ, θαη ηε ιεηηνπξγηθή θαηάζηαζε ηνπ πινίνπ [C1].
ην πιαίζην ηεο Γηαηξηβήο, πξαγκαηνπνηήζεθαλ νη παξαθάησ δεκνζηεύζεηο ζε δηεζλή πεξηνδηθά θαη
ζπλέδξηα κε θξηηέο, πνπ απνδεηθλύνπλ ηε ζπλεηζθνξά ηεο ζηελ επηζηήκε σο πξνο ηα παξαπάλσ ζεκεία:
Γεκνζηεύζεηο ζε δηεζλή πεξηνδηθά κε θξηηέο (ζε ρξνλνινγηθή ζεηξά)
[J1] S. V. Giannoutsos and S. N. Manias, "Improving Engine Room Ventilation Systems: A Data-Driven
Process Controller for Energy-Efficient, Variable-Speed Fan Operation in Marine Vessels", in IEEE
Industry Applications Magazine, vol. 22, no. 6, pp. 66-81, Nov.-Dec. 2016
(Impact factor 1.169)
[J2] S. V. Giannoutsos and S. N. Manias, "A Systematic Power-Quality Assessment and Harmonic Filter
Design Methodology for Variable-Frequency Drive Application in Marine Vessels", in IEEE
Transactions on Industry Applications, vol. 51, no. 2, pp. 1909-1919, March-April 2015
(Impact factor: 2.937, IEEE Citations: 19 – December 2017)
[J3] S. V. Giannoutsos and S. N. Manias, "A Data-Driven Process Controller for Energy-Efficient
Variable-Speed Pump Operation in the Central Cooling Water System of Marine Vessels", in IEEE
Transactions on Industrial Electronics, vol. 62, no. 1, pp. 587-598, Jan. 2015
(Impact factor: 7.168, IEEE Citations: 16 – December 2017)
Γεκνζηεύζεηο ζε δηεζλή ζπλέδξηα κε θξηηέο (ζε ρξνλνινγηθή ζεηξά)
[C1] S. V. Giannoutsos and S. N. Manias, "Energy management and D/G fuel consumption optimization
in the power system of marine vessels through VFD-based process flow control," 2015 IEEE 15th
Int. Conference on Environment and Electrical Engineering (EEEIC), Rome, 2015, pp. 842-850.
(Google Scholar Citations: 6 – December 2017)
56 Κεθάιαην 1 Δηζαγσγή – Κίλεηξα θαη ζηόρνη Γηαηξηβήο
ΔΙΔΑΚΣΟΡΙΚΗ ΔΙΑΣΡΙΒΗ
ΠΤΡΙΔΩΝ Β. ΓΙΑΝΝΟΤΣΟ
[C2] S. V. Giannoutsos, S. Kokosis and S. N. Manias, "A gate drive circuit for Normally-On SiC JFETs
with self-protection functions against overcurrent and shoot-through fault conditions," 2015 IEEE
15th Int. Conference on Environment and Electrical Engineering (EEEIC), Rome, 2015, pp. 851-859.
(IEEE Citations: 3 – December 2017)
[C3] S. V. Giannoutsos and S. N. Manias, "A data-driven process control topology for energy efficiency
optimization of fan operation in E/R ventilation system of marine vessels", 2014 IEEE Industry
Application Society Annual Meeting, Vancouver, BC, 2014, pp. 1-10.
(IEEE Citations: 1 – December 2017)
[C4] S. V. Giannoutsos and S. N. Manias, "Harmonic filter design for Variable Frequency Drives in
marine vessels based on a systematic power quality assessment and monitoring methodology", 2014
IEEE/IAS 50th Industrial & Commercial Power Systems Technical Conference, Fort Worth, TX,
2014, pp. 1-9
(Google Scholar Citations: 2 – December 2017)
[C5] S. V. Giannoutsos and S. N. Manias, "Development of an integrated energy efficiency control
system for ship power balance and diesel generator fuel consumption optimization," 2013 IEEE
Industry Applications Society Annual Meeting, Lake Buena Vista, FL, 2013, pp. 1-11
(IEEE Citations: 9 – December 2017)
[C6] S. V. Giannoutsos and S. N. Manias, "A cascade control scheme for a grid connected Battery Energy
Storage System (BESS)," 2012 IEEE International Energy Conference and Exhibition
(ENERGYCON), Florence, 2012, pp. 469-474.
(IEEE Citations: 5 – December 2017)
[C7] S. V. Giannoutsos, P. Pachos and S. N. Manias, "Performance evaluation of a proposed gate drive
circuit for normally-ON SiC JFETs used in PV inverter applications," 2012 IEEE International
Energy Conference and Exhibition (ENERGYCON), Florence, 2012, pp. 26-31
(IEEE Citations: 3 – December 2017)
[C8] S. V. Giannoutsos, "Evaluation of energy savings from the application of variable frequency drives
to E/R ventilation fans and cooling sea water pumps onboard tanker vessels." Proceedings of the 5th
MARINELIVE International Workshop on Prime Movers, Athens, pp. 1-8, 2012
(Google Scholar Citations: 1 – June 2017)
1.9 Γιάπθπυζη κεθαλαίυν Γιαηπιβήρ
Σν θείκελν ηεο Γηαηξηβήο πεξηιακβάλεη ζπλνιηθά επηά θεθάιαηα ζηα νπνία δηεπζεηνύληαη θαη
πξνζεγγίδνληαη νη ζηόρνη πνπ ηέζεθαλ. Αξρηθά ζην πξώην εηζαγσγηθό θεθάιαην ηίζεηαη ην δήηεκα
εμνηθνλόκεζεο θαπζίκνπ ζηα πινία ζύκθσλα κε ηα ζύγρξνλα πξόηππα, γίλεηαη επηζθόπεζε ησλ θύξησλ
κεζόδσλ εμνηθνλόκεζεο θαπζίκνπ ελώ αλαιύεηαη ην ηζνδύγην ηζρύνο θαη ε δηαζηαζηνιόγεζε ησλ Ζ/Γ κε
βάζε ηε ιεηηνπξγία ησλ θαηαλαισηώλ ζην ειεθηξηθό δίθηπν ηζρύνο ελόο ηππηθνύ πινίνπ, ελώ παξνπζηάδεηαη
θαη ε κειέηε θνξηίνπ αλά ιεηηνπξγηθή θαηάζηαζε γηα ην ηππηθό δεμακελόπινην ππό κειέηε. Παξάιιεια,
αλαιύνληαη θαη ηεθκεξηώλνληαη ηα νθέιε θαη νη ηδηαηηεξόηεηεο ηεο πξαθηηθήο κείσζεο ηεο ηαρύηεηαο
πιεύζεο κε εθαξκνγή ζην πινίν ππό κειέηε. ηε ζπλέρεηα εμεηάδεηαη ε ηνπνινγία ζπζηεκάησλ ησλ θύξησλ
δηεξγαζηώλ ηνπ κεραλνζηαζίνπ ελόο ηππηθνύ πινίνπ, πνπ ζρεηίδνληαη κε ηε ιεηηνπξγία ηεο Κ/Μ θαη ησλ
βνεζεηηθώλ κεραλεκάησλ, ε ελεξγεηαθή απνδνηηθόηεηα ησλ νπνίσλ θαη ε ζπκκεηνρή ηνπο ζην ηζνδύγην
ηζρύνο εμαξηώληαη από ηελ εθάζηνηε ιεηηνπξγηθή θαηάζηαζε ηνπ πινίνπ. Έκθαζε δίλεηαη ζηελ αξρή
ιεηηνπξγίαο ησλ δηεξγαζηώλ κεηαβιεηήο ξνήο, πνπ πεξηιακβάλνπλ θαηαλαισηέο (θπξίσο αληιίεο
νδεγνύκελεο από θηλεηήξεο) πνπ ζπκκεηέρνπλ θαηά κεγάιν πνζνζηό ζηε δηακόξθσζε ηνπ ηζνδπγίνπ ηζρύνο
57 Πξνζαξκνζηηθόο έιεγρνο ηνπνινγίαο ξπζκηζηώλ ζηξνθώλ γηα εμνηθνλόκεζε ελέξγεηαο ζε πινία
ΔΙΔΑΚΣΟΡΙΚΗ ΔΙΑΣΡΙΒΗ
ΠΤΡΙΔΩΝ Β. ΓΙΑΝΝΟΤΣΟ
θαη επεξεάδνληαη ζε κεγάιν βαζκό από ηελ εθαξκνγή ηεο πξαθηηθήο κείσζεο ηεο ηαρύεηαο πιεύζεο. ηα
πιαίζηα απηά παξνπζηάδνληαη ηα δεδνκέλα ηνπ ηππηθνύ πινίνπ ππό κειέηε, ην νπνίν απνηειεί αλαθνξά γηα
ηηο θαηά πεξίπησζε κειέηεο πνπ αθνινπζνύλ θαζόιε ηε Γηαηξηβή. Γεδνκέλνπ ηνπ ζηόρνπ κέγηζηεο
εμνηθνλόκεζεο ηζρύνο θαη ηεο ηαπηόρξνλεο εμππεξέηεζεο ησλ δπλακηθά κεηαβαιιόκελσλ ιεηηνπξγηθώλ
απαηηήζεσλ ησλ δηεξγαζηώλ, αλάινγα κε ηε ιεηηνπξγηθή θαηάζηαζε ηνπ πινίνπ, δηεπξεπλώληαη κέζνδνη
πξνζαξκνζηηθνύ έιεγρνπ δεδνκέλσλ αλεμάξηεηα από ηελ κνληεινπνίεζε ηνπ ζπζηήκαηνο πξνθεηκέλνπ λα
επηηπγράλεηαη ε βειηηζηνπνίεζε θαη επζηάζεηα ησλ δηεξγαζηώλ. ην πιαίζην απηό, αθνύ ηεζνύλ ηα θίλεηξα
θαη νη ζηόρνη ηεο Γηαηξηβήο, παξνπζηάδεηαη ζπλνπηηθά ν πξνηεηλόκελνο πξνζαξκνζηηθόο έιεγρνο ξπζκηζηώλ
ζηξνθώλ θηλεηήξσλ αλεκηζηήξσλ εμαεξηζκνύ θαη αληιηώλ ςύμεο ζαιαζζηλνύ λεξνύ κε βάζε ηα δεδνκέλα
πηέζεσλ θαη ζεξκνθξαζηώλ γηα ηνλ βέιηηζην έιεγρν ξνήο θαη εμνηθνλόκεζε ηζρύνο ζηηο δηεξγαζίεο
εμαεξηζκνύ ηνπ κεραλνζηαζίνπ θαη ηνπ θεληξηθνύ ζπζηήκαηνο λεξνύ ςύμεο ηεο Κ/Μ.
Σν δεύηεξν θεθάιαην αλαθέξεηαη ζηε κειέηε ελεξγεηαθήο δηαρείξηζεο ηνπ ηζνδπγίνπ ηζρύνο ηνπ
απηόλνκνπ ζπζηήκαηνο ειεθηξηθήο ελέξγεηαο ηνπ πινίνπ ζε θάζε ιεηηνπξγηθή θαηάζηαζε. Αξρηθά
κειεηάηαη ε δνκή θαη ε απόθξηζε ησλ βξόρσλ ζπρλόηεηαο θαη ηάζεο, ελώ θαζνξίδνληαη νη παξάγνληεο πνπ
δηαζθαιίδνπλ ηελ επζηάζεηα ηνπο θαηά ηηο κεηαβνιέο ηνπ θνξηίνπ, ελώ πξαγκαηνπνηνύληαη θαη
πξνζνκνηώζεηο ζην ηππηθό πινίν ππό κειέηε. ηε ζπλέρεηα εμεηάδνληαη ηα όξηα κεηαβαηηθήο θόξηηζεο ησλ
ππόινηπσλ Ζ/Γ ζε πεξίπησζε αζηνρίαο κηαο Ζ/Γ δηαζπλδεδεκέλεο ζην δίθηπν, ην πεξηζώξην κέγηζηνπ
ζπλερνύο θνξηίνπ θαη ην πεξηζώξην κεηαβαηηθήο θόξηηζεο, ην δηαζέζηκν πεξηζώξην ηζρύνο γηα απνθπγή
απώιεηαο ηξνθνδνζίαο θαη ε δπλακηθή ηνπ κεραληζκνύ επηιεθηηθήο δηαθνπήο θνξηίνπ, νη νπνίνη απνηεινύλ
πεξηνξηζκνύο πνπ ζέηνληαη από ην απηόκαην ζύζηεκα δηαρείξηζεο ειεθηξηθήο ελέξγεηαο ηνπ πινίνπ. Με
έκθαζε ζην πινίν ππό κειέηε παξνπζηάδνληαη νη κεηαβνιέο ζην ηζνδύγην ηζρύνο θαηά ηελ εθαξκνγή
κείσζεο ηεο ηαρύηεηαο πιεύζεο ζε ζπλάξηεζε κε ηε ιεηηνπξγία ηεο K/M ζε κεησκέλν θνξηίν, θαζώο ε
παξακεηξνπνίεζε ηεο ιεηηνπξγίαο ηεο Κ/Μ θαη ησλ βνεζεηηθώλ κεραλεκάησλ σο πξνο ηηο αλάγθεο
απαγσγήο ζεξκόηεηαο ζε δηαθνξεηηθέο θαηαζηάζεηο ιεηηνπξγίαο. ηε ζπλέρεηα εμεηάδεηαη ην ζεσξεηηθό
πεξηζώξην εμνηθνλόκεζεο ηζρύνο από ηε κείσζε ηεο παξερόκελεο ξνήο ηεο αληιίαο ηξνθνδνζίαο
ζαιαζζηλνύ λεξνύ ζην θεληξηθό ζύζηεκα ςύμεο Κ/Μ θαη βνεζεηηθώλ κεραλεκάησλ ηνπ πινίνπ γηα
κεησκέλν θνξηίν Κ/Μ, ελώ ππνινγίδεηαη ην πεξηζσξην κείσζεο παξνρήο ηππηθνύ πινίνπ ππό κειέηε. Γηα
ηελ επίηεπμε ηεο κέγηζηεο εμνηθνλόκεζεο, ζπγθξίλνληαη νη κέζνδνη κείσζεο ξνήο κε πεξηνξηζκό επηζηνκίνπ
ή κε ρξήζε ξπζκηζηή ζηξνθώλ. Αληίζηνηρα, ζηε ζπλέρεηα κειεηάηαη ην πεξηζώξην επίηεπμεο εμνηθνλόκεζεο
ηζρύνο από ηε κείσζε ηεο παξερόκελεο ξνήο αέξα από ηνπο αλεκηζηήξεο ηνπ ζπζηήκαηνο εμαεξηζκνύ ηνπ
κεραλνζηαζίνπ. ην πιάηζην απηό, ππνινγίδεηαη ην πεξηζσξίνπ κείσζεο ξνήο ζην ηππηθό πινίν ππό κειέηε,
ελώ δηαπηζηώλεηαη ε δπλαηόηεηα επίηεπμεο κέγηζηεο ζεσξεηηθήο εμνηθνλόκεζεο κε ρξήζε ξπζκηζηή ζηξνθώλ.
Σν ηξίην θεθάιαην, παξνπζηάδνληαη ηα ραξαθηεξηζηηθά ηνπ θπθισκαηνο ηζρύνο θαη ηνπ θπθιώκαηνο
ειέγρνπ ηεο ηνπνινγίαο ξπζκηζηώλ ζηξνθώλ πνπ ρξεζηκνπνηείηαη από ην πξνηεηλόκελν ζύζηεκα. Αλαιύεηαη
ε δνκή ηνπ ηξηθαζηθνύ αληηζηξνθέα ηάζεο δύν επηπέδσλ ν νπνίνο ειέγρεηαη κε ηελ ηερληθή δηακόξθσζεο
παικώλ κε ρσξηθά δηαλύζκαηα (space vector PWM), ελώ εμεηάδνληαη ζέκαηα ειέγρνπ θαη πεξηνξηζκνύ ηεο
ειεθηξνκαγλεηηθήο παξεκβνιήο (ΔΜΗ). Γηα ηνλ έιεγρν ηνπ επαγσγηθνύ θηλεηήξα κέζσ ηνπ αληηζηξνθέα,
αξρηθά εμεηάδεηαη ε ηερληθή έκκεζνπ δηαλπζκαηηθνύ ειέγρνπ κε πξνζαλαηνιηζκό πεδίνπ ηνπ δξνκέα
(indirect field oriented vector control), ελώ ζηε ζπλέρεηα παξνπζηάδεηαη ε ηερληθή πξνζαξκνζηηθνύ ειέγρνπ
βαζηδόκελνπ ζην ηζνδύλακν κνληέιν ηνπ επαγσγηθνύ θηλεηήξα (Μνdel Reference Adaptive System) πνπ
ηειηθά ρξεζηκνπνηείηαη γηα ηελ εθηίκεζε ηεο ηαρύηεηαο, δίρσο ηελ αλάγθε ρξήζεο ηαρνγελλήηξηαο
(encoder). Παξάιιεια, παξνπζηάδνληαη ηα ραξαθηεξηζηηθά ηνπ κνληέινπ ηνπ ξπζκηζηή ζηξνθώλ πνπ
ρξεζηκνπνηείηαη γηα ηελ πινπνίεζε ηεο πξνηεηλόκελεο ηνπνινγίαο ζην ζην ηππηθό πινίν ππό κειέηε, ελώ
αλαθέξνληαη ιεπηνκέξεηεο εγθαηάζηαζεο θίιηξσλ γηα ηελ ελίζρπζε ηεο ειεθηξνκαγλεηηθήο ζπκβαηόηεηαο.
ην ηέηαξην θεθάιαην, κε βάζε ηα απνηειέζκαηα ηεο κειέηεο ηνπ δεύηεξνπ θεθαιαίνπ ζρεηηθά κε ην
ζεσξεηηθό πεξηζώξην κείσζεο ηεο παξνρήο λεξνύ ςύμεο, ζρεδηάδεηαη θαη αλαπηύζζεηαη πξνηεηλόκελνο
πξνζαξκνζηηθόο ειεγθηήο γηα ην δπλακηθό έιεγρν παξνρήο ηεο αληιίαο ζαιαζζηλνύ λεξνύ ζην θεληξηθό
ζύζηεκα ςύμεο ηεο Κ/Μ κέζσ ειέγρνπ ηεο ηαρύηεηαο αλαθνξάο ηνπ επαγσγηθνύ θηλεηήξα πνπ ηελ νδεγεί.
58 Κεθάιαην 1 Δηζαγσγή – Κίλεηξα θαη ζηόρνη Γηαηξηβήο
ΔΙΔΑΚΣΟΡΙΚΗ ΔΙΑΣΡΙΒΗ
ΠΤΡΙΔΩΝ Β. ΓΙΑΝΝΟΤΣΟ
Ζ ξύζκηζε ησλ παξακέηξσλ ησλ βξόρσλ ειέγρνπ PID ηνπ ειεγθηή γίλεηαη απηόκαηα κε βάζε κεηξήζεηο
πηέζεσλ θαη ζεξκνθξαζηώλ πνπ πξαγκαηνπνηνύληαη ζε πξαγκαηηθό ρξόλν ζε δηάθνξα ζεκεία ηεο
δηεξγαζίαο, ελώ νη πεξηνξηζκνί ζηελ ηαρύηεηα αλαθνξάο ηνπ ειεγθηή κεηαβάιινληαη δπλακηθά ζύκθσλα κε
ηηο απαηηήζεηο ηεο δηεξγαζίαο. Σν πξνηεηλόκελν ζύζηεκα πινπνηείηαη σο κεηαζθεπή (retrofit) ζην ηππηθό
ππό κειέηε δεμακελόπινην (tanker) κε εθηόπηζκα 105,000 ηόλνπο θαη πεξηιακβάλεη πξνγξακκαηηδόκελν
ινγηθό ειεγθηή (PLC) γηα ηνλ έιεγρν ηνπ ξπζκηζηή ζηξνθώλ κε ρξήζε νζόλεο αιιειεπίδξαζεο αλζξώπνπ-
κεραλήο (HMI). Με ηελ πξνηεηλόκελε ηνπνινγία κεηαβάιιεηαη δπλακηθά ε ηαρύηεηα ηνπ θηλεηήξα ηεο
αληιίαο παξνρήο ζαιαζζηλνύ λεξνύ ζε ζρέζε κε ην ιεηηνπξγηθό πξνθίι ηνπ πινίνπ πνπ αληηζηνηρεί ζηηο
ιεηηνπξγηθέο θαηαζηάζεηο πιεύζεο θαη ρεηξηζκνύ θνξηίνπ, πξνθεηκέλνπ λα επηηεπρζεί κέγηζηε εμνηθνλόκεζε
ηζρύνο. Σα πεηξακαηηθά απνηειέζκαηα πνπ παξαηίζεληαη από ηελ πινπνίεζε ηνπ ζπζηήκαηνο ζην ηππηθό
ππό κειέηε πινίν απνδεηθλύνπλ όηη ε απόθξηζε ηνπ ειεγθηή ζε δπλακηθέο κεηαβνιέο είλαη εμαηξεηηθή θαη,
ζε ζρέζε κε ηελ πξόηεξε κέζνδν κείσζεο ηεο ξνήο κέζσ ηνπ επηζηνκίνπ ζηελ θαηάζιηςε ηεο αληιίαο, νδεγεί
ζε ζεκαληηθά ελεξγεηαθά νθέιε, βειηίσζε ηνπ ηζνδπγίνπ ηζρύνο θαζώο θαη ζηε κείσζε θαηαλάισζεο
θαπζίκνπ θαη εθπνκπήο ξύπσλ ησλ Ζ/Γ.
ην πέκπην θεθάιαην, κε βάζε ηα απνηειέζκαηα ηνπ δεύηεξνπ θεθαιαίνπ ζρεηηθά κε ην πεξηζώξην
κείσζεο ηεο ξνήο ηεο παξνρήο αέξα πνπ ρξεζηκνπνηείηαη γηα απαγσγή ζεξκόηεηαο από ηα κεραλήκαηα θαη
ην ρώξν ηνπ κεραλνζηαζίνπ θαη γηα θαύζε από ηελ Κ/Μ, ηηο Ζ/Γ θαη ην ιέβεηα θαπζίκνπ, ζρεδηάδεηαη θαη
αλαπηύζζεηαη πξνηεηλόκελνο πξνζαξκνζηηθόο ειεγθηήο γηα ην δπλακηθό έιεγρν ξνήο αλαθνξάο κέζσ
ειέγρνπ ηεο ηαρύηεηαο αλαθνξάο ησλ θηλεηήξσλ πνπ νδεγνύλ ηνπο αλεκηζηήξεο αμνληθήο ξνήο. Ζ ξύζκηζε
ηνπ PID ειεγθηή γίλεηαη απηόκαηα κε βάζε κεηξήζεηο πηέζεσλ θαη ζεξκνθξαζηώλ πνπ πξαγκαηνπνηνύληαη
ζε πξαγκαηηθό ρξόλν ζε δηάθνξα ζεκεία ηεο δηεξγαζίαο, ελώ νη πεξηνξηζκνί ζηελ έμνδν αλαθνξάο ηνπ
ειεγθηή κεηαβάιινληαη δπλακηθά ζύκθσλα κε ηηο απαηηήζεηο ηεο δηεξγαζίαο. Σν πξνηεηλόκελν ζύζηεκα
πινπνηείηαη σο κεηαζθεπή (retrofit) ζην ηππηθό ππό κειέηε δεμακελόπινην (tanker) κε εθηόπηζκα 105,000
ηόλνπο θαη πεξηιακβάλεη πξνγξακκαηηδόκελν ινγηθό ειεγθηή (PLC) γηα ηνλ έιεγρν ηνπ ξπζκηζηή ζηξνθώλ
κε ρξήζε νζόλεο αιιειεπίδξαζεο αλζξώπνπ-κεραλήο (HMI). Με ηελ πξνηεηλόκελε ηνπνινγία
κεηαβάιιεηαη δπλακηθά ε ηαρύηεηα ησλ θηλεηήξσλ ησλ αλεκηζηήξσλ εμαεξηζκνύ ηνπ κεραλνζηαζίνπ ζε
ζρέζε κε ην ιεηηνπξγηθό πξνθίι ηνπ πινίνπ πνπ αληηζηνηρεί ζηηο ιεηηνπξγηθέο θαηαζηάζεηο πιεύζεο θαη
ρεηξηζκνύ θνξηίνπ, πξνθεηκέλνπ λα επηηεπρζεί κέγηζηε εμνηθνλόκεζε ηζρύνο. Σα πεηξακαηηθά απνηειέζκαηα
πνπ παξαηίζεληαη από ηελ πινπνίεζε ηνπ ζπζηήκαηνο ζην ηππηθό πινίν απνδεηθλύνπλ όηη ε απόθξηζε ηνπ
ειεγθηή ζε δπλακηθέο κεηαβνιέο είλαη εμαηξεηηθή θαη, ζε ζρέζε κε ηελ πξόηεξε κέζνδν κείσζεο ηεο ξνήο κε
κεηαβνιή ηνπ αξηζκνύ ησλ αλεκηζηήξσλ ζε ιεηηνπξγία, νδεγεί ζε ζεκαληηθά ελεξγεηαθά νθέιε, βειηίσζε
ηνπ ηζνδπγίνπ ηζρύνο θαζώο θαη ζε κείσζε ηεο θαηαλάισζεο θαπζίκνπ θαη εθπνκπήο ξύπσλ ησλ Ζ/Γ.
ην έθην θεθάιαην, αλαιύνληαη αξρηθά νη επηπηώζεηο ηεο αύμεζεο ηνπ πνζνζηνύ ησλ αξκνληθώλ
ζπληζηώζσλ ζην απηόλνκν δίθηπν ειεθηξηθήο ηζρύνο ηνπ πινίνπ θαη ηδηαίηεξα ζηνπο βξόρνπο ειέγρνπ
ηάζεσο θαη ζπρλόηεηαο από ηελ εηζαγσγή κε γξακκηθώλ θνξηίσλ όπσο νη ξπζκηζηέο ζηξνθώλ. ηε ζπλέρεηα
πξνηείλεηαη ζπζηεκαηηθή κεζνδνινγία πξνζδηνξηζκνύ θαη επνπηείαο αξκνληθώλ γηα ηνλ ππνινγηζκό ηεο
ζπλεηζθνξάο ησλ ξπζκηζηώλ ζηξνθώλ ζην πνζνζηό αξκνληθήο παξακόξθσζεο ηεο ηάζεο ζην ζεκείν θνηλήο
ζύλδεζεο (PCC), ιακβάλνληαο ππόςε ηελ ηζρύ βξαρπθύθισζεο ηεο πεγήο, ηα ραξαθηεξηζηηθά ηνπ δηθηύνπ
θαη ηηο ππάξρνπζεο αξκνληθέο ζπληζηώζεο ζην δίθηπν. ύκθσλα κε όξηα αξκνληθήο παξακόξθσζεο ηεο
ηάζεο πνπ ζέηνληαη από ηνπο λενγλώκνλεο, ε πξνηεηλόκελε κεζνδνινγία ρξεζηκνπνηείηαη γηα ηε
δηαζηαζηνιόγεζε θαηάιιεισλ θίιηξσλ αξκνληθώλ γηα εθαξκνγή ξπζκηζηώλ ζηξνθώλ ζην πινίν,
εμεηάδνληαο πεξηπηώζεηο εθαξκνγήο πελίσλ ζηελ πιεπξά ηνπ δηθηύνπ ηξνθνδνζίαο (AC chokes), πελίσλ
αλάκεζα ζηνλ αλνξζσηή θαη ηνλ αληηζηξνθέα ηνπ ξπζκηζηή ζηξνθώλ (DC chokes), θαζώο θαη παζεηηθώλ
θίιηξσλ LC ζπληνληζκέλσλ ζε ζπγθεθξηκέλε ζπρλόηεηα (frequency tuned passive filters). Ζ απνδνηηθόηεηα
ηεο πξνηεηλόκελεο κεζνδνινγίαο αμηνινγείηαη κε ηελ εθαξκνγή ηεο ζην ζρεδηαζκό θίιηξσλ θαηά ηελ
εγθαηάζηαζε ηεο ηνπνινγίαο ειέγρνπ πνπ πεξηιακβάλεη ξπζκηζηέο ζηξνθώλ ζηνπο θηλεηήξεο πνπ νδεγνύλ
ηνπο αλεκηζηήξεο εμαεξηζκνύ θαη ηηο αληιίεο παξνρήο ζαιαζζηλνύ λεξνύ, πνπ ιεηηνπξγνύλ ζπλερώο ζην
απηόλνκν ζύζηεκα ειεθηξηθήο ηζρύνο ηνπ πινίνπ. Γηα ην ζθνπό απηό, πξαγκαηνπνηνύληαη κεηξήζεηο
59 Πξνζαξκνζηηθόο έιεγρνο ηνπνινγίαο ξπζκηζηώλ ζηξνθώλ γηα εμνηθνλόκεζε ελέξγεηαο ζε πινία
ΔΙΔΑΚΣΟΡΙΚΗ ΔΙΑΣΡΙΒΗ
ΠΤΡΙΔΩΝ Β. ΓΙΑΝΝΟΤΣΟ
πνηόηεηαο ηζρύνο κε ηελ εθαξκνγή πιαηθόξκαο κέηξεζεο αξκνληθώλ πξηλ θαη κεηά ηελ εθαξκνγή ηνπ
πξνηεηλόκελνπ ζπζηήκαηνο. Οη κεηξήζεηο αξκνληθώλ επηβεβαηώλνπλ όηη ν ζπληειεζηήο ζπλνιηθήο αξκνληθήο
παξακόξθσζεο ηεο ηάζεο ζην ζεκείν θνηλήο ζύλδεζεο θαζώο θαη ην πνζνζηό ηεο θάζε αξκνληθήο
ζπληζηώζαο ηεο ηάζεο δηαηεξείηαη ιηγόηεξν από 5% θαη 3% αληίζηνηρα, γεγνλόο πνπ απνδεηθλύεη όηη ν
ζρεδηαζκόο ζπκκνξθώλεηαη κε ηηο ζρεηηθέο απαηηήζεηο πνηόηεηαο ηζρύνο πνπ ηίζεληαη από ηνπο λενγλώκνλεο.
ην έβδνκν θαη ηειεπηαίν θεθάιαην αμηνινγνύληαη ζπλδπαζηηθά ηα απνηέιεζκαηα ηεο ελεξγεηαθήο
βειηηζηνπνίεζεο ηεο δηεξγαζίαο εμαεξηζκνύ ηνπ κεραλνζηαζίνπ θαη ηνπ ζπζηήκαηνο θεληξηθήο ςύμεο ηεο
Κ/Μ θαη ησλ βνεζεηηθώλ κεραλεκάησλ αλαθνξηθά κε ην ηζνδύγην ηζρύνο. Απνδεηθλύεηαη όηη ην πεξηζώξην
εμνηθνλόκεζεο ηζρύνο πνπ δεκηνπξγείηαη από ηε ζπλδπαζηηθή εθαξκνγή ησλ πξνηεηλόκελσλ ηνπνινγηώλ
θαηά ηελ πεξίνδν πιεύζεο ζε ρακειέο ηαρύηεηεο, νδεγεί ζε ρξήζε κηαο κόλν Ζ/Γ, βειηηώλνληαο όρη κόλν
ηελ θαηαλάισζε θαπζίκνπ αιιά θαη ηελ εθπνκπή ξύπσλ. Υξεζηκνπνηώληαο κηα πξνηεηλόκελε κεζόδν
ππνινγηζκνύ γηα ηα νηθνλνκηθά θαη πεξηβαιινληηθά νθέιε πνπ δεκηνπξγνύληαη από ηε βειηίσζε ηεο ρξήζεο
ησλ Ζ/Γ, βάζεη ηνπ ηύπνπ ηνπ θαπζίκνπ πνπ ρξεζηκνπνηείηαη, ηεο εηδηθήο θαηαλάισζεο θαπζίκνπ (SFOC)
ησλ Ζ/Γ, θαη ηεο ιεηηνπξγηθήο θαηάζηαζεο ηνπ πινίνπ, απνδεηθλύεηαη όηη ε βειηίσζε ηνπ ηζνδπγίνπ ηζρύνο
κεηώλεη ζεκαληηθά ηελ θαηαλάισζε θαπζίκνπ ησλ Ζ/Γ ζε ζρέζε κε ηελ πξνεγνύκελε πεξίνδν ιεηηνπξγίαο,
επηβεβαηώλνληαο όηη ε λαπηηθή βηνκεραλία κπνξεί λα επσθειεζεί ζε κεγάιν βαζκό κε ηελ εθαξκνγή ηεο
πξνηεηλόκελεο ηνπνινγίαο.
1.10 Αναθοπέρ ππώηος κεθαλαίος
[1] Ηnternational Maritime Organization–IMO,“1997 Protocol to amend 1973 International Convention for Prevention
of Pollution from Ships, as modified by the 1978 Protocol (Including Annex VI Revised Version as of 2011)”,
[Online]: http://cil.nus.edu.sg/rp/il/pdf/1997%20Protocol%20to%20the%20197378%20MARPOL-pdf.pdf
[2] Ηnternational Maritime Organization – IMO, “2008 Revised Marpol Annex VI- Regulations for the Prevention of
Air Pollution from Ships – (1) new fuel quality requirements beginning from July 2010, (2) Tier II and III NOx
emission standards for new engines, and (3) Tier I NOx requirements for existing pre-2000 engines, [Online].
Available: http://www.epa.gov/nonroad/marine/ci/mepc58-23-annexes13-14.pdf
[3] Ηnternational Maritime Organization – IMO, “Sulphur oxides (SOx) Control inside Emission Control Areas–
Regulation 14 - 2015 Amendment to MARPOL Annex VI Fuel Sulfur Limits”, [Online]. Available:
http://www.imo.org/en/OurWork/Environment/PollutionPrevention/AirPollution/Pages/Sulphur-oxides-
%28SOx%29-%E2%80%93-Regulation-14.aspx
[4] International Organization of Standardization – ISO, “ISO 50001-2011 – Energy Management Systems -
Requirements for guidance for use”, [Online]. Available: https://www.iso.org/obp/ui/#iso:std:iso:50001:ed-
1:v1:en
[5] D. Ronen, “The effect of oil price on the optimal speed of ships”, J. of Operat. Research Soc., vol. 33, no.11, pp.
1035–1040, May 1982
[6] Ηnternational Maritime Organization – IMO, “MARPOL Annex VI energy efficiency ammendments –
Resolution MEPC. 203(62) - Ammendments to the annex of the protocol of 1997 to ammend the Intermational
convention for prevention of pollution from ships, 1973, as modified by 1978 protocol”
[Online].Available:http://www.imo.org/en/MediaCentre/HotTopics/GHG/Documents/eedi%20amendments%20
RESOLUTION%20MEPC203%2062.pdf
[7] Ηnternational Maritime Organization – IMO, “Maritime Environment Protection Committee, 60th
Session –
MEPC 60/4/15 – Prevention of Air Pollution from Ships – Comments on the EEDI Formula” [Online].
Available:http://www.nee.gr/downloads/62MEPC%2060-4-15%20copy.pdf
[8] T.E. Notteboom, and B. Vernimmen, “The effect of high fuel costs on liner service configuration in container
shipping”, J. of Transp. Geography, vol. 17, no.5, pp. 325–337, 2009
[9] D. Ronen, “The effect of oil price on containership speed and fleet size”, J. of Operat. Research Soc., vol. 62,
no.1, pp. 211–216, Jan. 2010
[10] J. Meyer, R. Stalbock, and S.Voss, “Slow Steaming in Container Shipping”, in Proc. IEEE Int. Conf. Syst. Sci.,
Maui, Hawaii, Jan. 2012, pp. 1306-1314
60 Κεθάιαην 1 Δηζαγσγή – Κίλεηξα θαη ζηόρνη Γηαηξηβήο
ΔΙΔΑΚΣΟΡΙΚΗ ΔΙΑΣΡΙΒΗ
ΠΤΡΙΔΩΝ Β. ΓΙΑΝΝΟΤΣΟ
[11] P. Cariou, “Is Slow Steaming a Sustainable Means of Reducing CO2 Emissions from Container Shipping?”,
Transp. Research Part D: Transp. and Environ., vol. 16, no.3, pp. 260 – 264, May 2011
[12] L. Haakon, B.E. Asbjørnslett, and A.H. Strømman, “Reduction in greenhouse gas emissions and cost by shipping
at lower speeds. Energy Policy, vol. 39, no. 6, pp. 3456–3464, Jun. 2011
[13] K. Fagerholt, G. Laporte, and I. Norstad, “Reducing fuel emissions by optimizing speed on shipping routes”, J.
of Operat.Research Soc., vol. 61, no.3, pp.523-529, Aug. 2009
[14] J. Zelasneya, D. Hupperta, and T. Leschine, “The influence of oil price on maritime routing of containerized
imports from China”, Marit. Econ. & Logistics, vol. 13, no.3, pp. 298–318, Sept. 2011
[15] H. N. Psaraftis and C. A. Kontovas, “Balancing the economic and environmental performance of maritime
transportation”, Transp. Research Part D: Transp. and Environ., vol. 15, no. 8, pp. 458–462 Dec. 2010
[16] H. N. Psaraftis, C. A. Kontovas, and M. P. Kakalis, “Speed reduction as an emissions reduction measure for fast
ships”, in Proc. 10th
Int. Conf. Fast Sea Trasp., Athens, Greece, Oct. 2009, pp.1-12
[17] H. N. Psaraftis, and C. A. Kontovas, “CO2 emission statistics for the world commercial fleet”, WMU J. of Marit.
Affairs, vol. 8, no. 1, pp. 1–25, Apr. 2009
[18] J.S. Carlton, “Marine Propellers and Propulsion”, 3rd
Edition, Oxford, UK, Butterworth-Heinemann Press., 2012
[19] L. Yu, M. Greve, M. Druckenbrod, and M. Abdel-Masoud, “Numerical analysis of ducted propeller performance
under open water test condition”, J. of Mar. Science and Techn., vol. 18, no. 3, pp. 381-394, Feb. 2013
[20] R. L. Townsin, “The Ship Hull Fouling Penalty”, J. of Bioadhesion and Biofilm Research, vol. 19, no.3, pp. 9-
15, Sep. 2010
[21] G. Shu, Y. Liang, H. Wei, H. Tian, J. Zhiao, and L. Liu, “A review of waste heat recovery on two-stroke IC
engine aboard ships”, Ren. Sustain. Energy Reviews, vol. 19, no. 3, pp. 385-401, Mar. 2013
[22] T.L. Baldwin, and S.A. Lewis, “Distribution load flow methods for shipboard power systems”, IEEE Trans. Ind.
Appl., vol. 40, no.5, pp. 1183-1190, Sept.-Oct. 2004
[23] B. Stevens, A. Dubey, and S. Santoso, “On Improving Reliability of Shipboard Power System”, IEEE Trans.
Power Sys., vol. 30, no. 4, pp. 1905-1912, Jul. 2015
[24] C.-L. Su, C.-J. Chen, and C.C. Lee, “Fast Evaluation Methods for Voltage Sags in Ship Electrical Power
Systems”, IEEE Trans. Ind. Appl., vol. 49, no.1, pp. 233-241, Jan.-Feb. 2013
[25] P. Mitra, and G. Venayagamoorthy, “Implementation of an Intelligent Reconfiguration Algorithm for an Electric
Ship‟s Power System”, IEEE Trans. Ind. Appl., vol.47, no.5, pp.2292-2300, Sept.-Oct 2011
[26] K.L. Butler-Purry, and N.D.R. Sarma, “Self-healing reconfiguration for restoration of naval shipboard power
systems”, IEEE Trans. Power Sys., vol. 19, no.2, pp. 754-762, May. 2004
[27] G. Seenumani, L. Sun, and H. Peng, “Real-Time Power Management of Integrated Power Systems in All
Electric Ships Leveraging Multi Time Scale Property”, IEEE Trans. Control. Sys. Techn., vol. 20, no.1, pp. 232-
240, Nov.-Dec. 2013
[28] F.D. Kanellos, G.J. Tsekouras, and N.D. Hatziargyriou, “Optimal Demand-Side Management and Power
Generation Scheduling in an All-Electric Ship”, IEEE Trans. Sustain. Energy., vol. 59, no.8, pp. 3102-3112,
Aug. 2012
[29] F. Xianyong, K.L. Butler-Purry, and T. Zourntos, “Multi-Agent System-Based Real-Time Load Management for
All-Electric Ship Power Systems in DC Zone Level”, IEEE Trans. Power Sys., vol. 27, no.4, pp. 1719-1728,
Nov. 2012
[30] C. Yan, G.K. Venayagamoorthy, and K. Corzine, “AIS-Based Coordinated and Adaptive Control of Generator
Excitation Systems for an Electric Ship”, IEEE Trans. Ind. Electron., vol. 59, no.8, pp. 3102-3112, Aug. 2012
[31] T. Ericsen, N. Hingorani, and Y. Khersonsky, “Power electronics and future marine electrical systems”, IEEE
Trans. Ind. Appl., vol. 42, no.1, pp. 115-163, Jan.-Feb. 2006
[32] C.-L. Su, C.-K. Lan, T.-C. Chou, and C.-J. Chen, “Design of a multi-agent system for shipboard power systems
restoration”, in Proc. IEEE Ind. Comm. Power Sys Conf., Fort Worth, Texas, May. 2014, pp. 1-12
[33] R. W. G. Bucknall, and K. M. Ciaramella, “On the Conceptual Design and Performance of a Matrix Converter
for Marine Electric Propulsion”, IEEE Trans. Power Electr., vol. 25, no.6, pp. 1497 - 1508, Jun. 2010
61 Πξνζαξκνζηηθόο έιεγρνο ηνπνινγίαο ξπζκηζηώλ ζηξνθώλ γηα εμνηθνλόκεζε ελέξγεηαο ζε πινία
ΔΙΔΑΚΣΟΡΙΚΗ ΔΙΑΣΡΙΒΗ
ΠΤΡΙΔΩΝ Β. ΓΙΑΝΝΟΤΣΟ
[34] J. C. Dermentzoglou, “Investigating the incorporation of a doubly fed induction machine as a shaft generator into
a ship's system: Application of a vector control scheme for controlling the doubly fed induction machine”, in
Proc. IEEE Int. Conf. on Electr. Machines, Berlin, Germany, Sept. 2014, pp. 2319-2324
[35] A. Sarigiannidis, A. Kladas, E. Chatzinikolaou and C. Patsios, “High efficiency Shaft Generator drive system
design for Ro-Ro trailer-passenger ship application”, in Proc. IEEE Electr. Sys Aircraft, Railway, Ship
Propulsion and Road Vehicles, Aachen, Germany, Mar. 2015, pp. 1-6
[36] International Association of Classification Societies – IACS, “Requirements Concerning Machinery
Installations - IACS Requirement 2004”, [Online]. Available:
http://www.iacs.org.uk/document/public/Publications/Unified_requirements/PDF/UR_M_pdf2793.pdf
[37] A. Sarvi, C.J. Fogelholm and R. Zevenhoven: “Emissions from largescale medium-speed diesel engines: 2.
Influence of fuel type and operating mode”, J. of Fuel Process. Techn., Vol. 89, No. 5, pp. 520-527 , 2008
[38] MAN B&W Diesel and Turbo, “S60MC-C8 Project Guide Camshaft Controlled Two-Stroke Engines”, 1st ed.,
2009,Man B&W, [Online].Available:
http://www.mandieselturbo.com/download/project_guides_tier1/printed/s60mcc8.pdf
[39] Z. Hou and Z. Wang, “From model-based control to data-driven control: Survey, classification and perspective”,
Inf. Sci., vol. 235, pp. 3–35, Jun. 2013
[40] M. Kano and Y. Nakagawa, “Data-based process monitoring, process control, quality improvement: Recent
developments and applications in steel industry”, Comput. Chem. Eng., vol. 32, no. 1, pp. 12–24, Jan. 2008
[41] S. Formentin, A. Karimi, and S. M. Savaresi, “Optimal input design for“Optimal input design for direct data-
driven tuning of model-reference controllers”, Automatica, vol. 49, no. 6, pp. 1874–1882, Jun. 2013
[42] S. Yin, X. Li, H. Gao, and O. Kaynak, “Data-Based Techniques Focused Modern Industry: An Overview”, IEEE
Trans. Ind. Electron., vol. 62, no. 1, pp. 657–666, Jan. 2015
[43] V. H. Nguyen and J.-C. Golinval, “Fault detection based on kernel principal component analysis”, Eng. Struct.,
vol. 32, no. 11, pp. 3683–3691, Nov. 2010
[44] Y. Zhang, H. Zhou, S. J. Qin, and T. Chai, “Decentralized fault diagnosis of large-scale processes using
multiblock kernel partial least squares”, IEEE Trans. Ind. Informat., vol. 6, no. 1, pp. 3–10, Feb. 2010
[45] Y. Zhang, Y. Teng, and Y. Zhang, “Complex process quality prediction using modified kernel partial least
squares”, Chem. Eng. Sci., vol. 65, no. 6, pp. 2153–2158, Mar. 2010
[46] J.-X. Xu, “A survey on iterative learning control for nonlinear systems”, Int. J. Control, vol. 84, no. 7, pp. 1275–
1294, 2011
[47] Z. Hou and Z. Wang, “From model-based control to data-driven co trol: Survey, classification and perspective”,
Inf. Sci vol. 235, pp. 3–35, Jun. 2013
[48] A. Luo, X. Xu, L. Fang, H. Fang, J. Wu and C. Wu, "Feedback-Feedforward PI-Type Iterative Learning Control
Strategy for Hybrid Active Power Filter With Injection Circuit," IEEE Trans. on Ind. Electron., vol. 57, no. 11,
pp. 3767-3779, Nov. 2010.
[49] H. Li, Z. Sun, M. Y. Chow and F. Sun, "Gain-Scheduling-Based State Feedback Integral Control for Networked
Control Systems", IEEE Trans. Ind. Electron., vol. 58, no. 6, pp. 2465-2472, June 2011.
[50] Bao-Gang Hu, G. K. I. Mann and R. G. Gosine, "A systematic study of fuzzy PID controllers-function-based
evaluation approach", IEEE Trans. Fuzzy Sys., vol. 9, no. 5, pp. 699-712, Oct 2001.
[51] Y. Yin, P. Shi and F. Liu, "Gain-Scheduled Robust Fault Detection on Time-Delay Stochastic Nonlinear
Systems”, IEEE Trans. Ind. Electron., vol. 58, no. 10, pp. 4908-4916, Oct. 2011.
[52] C. Mademlis and I. Kioskeridis, "Gain-Scheduling Regulator for High-Performance Position Control of Switched
Reluctance Motor Drives", IEEE Trans. Ind. Electron., vol. 57, no. 9, pp. 2922-2931, Sept. 2010.
[53] T. Yucelen and W. M. Haddad, "Low-Frequency Learning and Fast Adaptation in Model Reference Adaptive
Control", IEEE Trans. Automatic Control, vol. 58, no. 4, pp. 1080-1085, April 2013.
[54] Z. Wu, Y. Xia and X. Xie, "Stochastic Barbalat's Lemma and Its Applications", IEEE Trans. Automatic Control,
vol. 57, no. 6, pp. 1537-1543, June 2012.
ΔΙΔΑΚΣΟΡΙΚΗ ΔΙΑΣΡΙΒΗ
ΠΤΡΙΔΩΝ Β. ΓΙΑΝΝΟΤΣΟ
62 Κεθάιαην 2 Δλεξγεηαθή δηαρείξηζε ηζνδπγίνπ ηζρύνο πινίνπ
Κεθάιαην 2
Δλεξγεηαθή Γηαρείξηζε Ηζνδπγίνπ Ηζρύνο Πινίνπ
2.1 Ιδιαιηεπόηηηερ αςηόνομος ζςζηήμαηορ ηλεκηπικήρ ιζσύορ πλοίος
πγθξηηηθά κε ην δηαζπλδεδεκέλν ζύζηεκα ειεθηξηθήο ελέξγεηαο (ΖΔ) πνπ ζπλαληάηαη ζηε ζηεξηά, ην
απηόλνκν ΖΔ πινίνπ παξνπζηάδεη δνκηθέο δηαθνξέο σο πξνο ηε ιεηηνπξγία θαη ηνπο παξάγνληεο πνπ ην
επεξεάδνπλ, νη νπνίνη θαζνξίδνπλ ζε κεγάιν βαζκό ηελ αλαδήηεζε ηξόπσλ βειηηζηνπνίεζεο ηνπ ηζνδπγίνπ
ηζρύνο θαη ζέηνπλ ζεκαληηθνύο ιεηηνπξγηθνύο πεξηνξηζκνύο. Όπσο παξνπζηάδεηαη ζηνλ Πίλαθα 2.1, νη
ζεκαληηθόηεξεο δηαθνξέο είλαη ε ρξνληθή θαη πνζνηηθή κεηαβνιή ζην θνξηίν, πνπ δύλαηαη λα
πξαγκαηνπνηεζεί είηε πεξηνδηθά είηε ηπραία αλάινγα κε ηε ιεηηνπξγηθή θαηάζηαζε ηνπ πινίνπ, θαζώο θαη ε
αλάγθε απνθπγήο απώιεηαο ηξνθνδνζίαο ζε ζεκαληηθά κεραλήκαηα ηδηαίηεξα θαηά ηελ πεξίνδν ειηγκώλ θαη
εθθόξησζεο. Γηα απηό ην ιόγν, ην απηόλνκν ζύζηεκα δηαρείξηζεο ηζρύνο (Power Management System –
PMS), πνπ νη παξάκεηξνη ιεηηνπξγίαο ηνπ ζα κειεηεζνύλ ζε απηήλ ηελ ελόηεηα αλάινγα κε ηε ιεηηνπξγηθή
θαηάζηαζε ηνπ πινίνπ, είλαη ππεύζπλν γηα ηελ ειεγρόκελε έλαπζε, ηνλ ζπγρξνληζκό θαη ηνλ παξαιιειηζκό
ησλ Ζ/Γ ζύκθσλα κε πξνθαζνξηζκέλνπο πίλαθεο ξύζκηζεο αλάινγα κε ην θνξηίν (load dependent start-stop
tables). Δπηπιένλ ζέηεη πεξηνξηζκνύο αλαθνξηθά κε ηελ απνθπγή κνλαδηθνύ ζεκείνπ αζηνρίαο (single point
of failure), πεξηνξηζκνύο ζρεηηθά κε ηε κέγηζηε επηηξεπηή κεηαβαηηθή θόξηηζε ηεο Ζ/Γ (maximum transient
load) γηα ηελ ηθαλνπνίεζε ησλ νξίσλ κεηαβνιήο ζπρλόηεηαο θαη ηάζεο ηνπ δηθηύνπ, θαη γηα ηελ ηήξεζε
ζπλζεθώλ ζρεηηθά κε ηε δηαζεζηκόηεηα πιενλάδνπζαο ηζρύνο ζην δίθηπν (available power reserve).
Πίλαθαο 2.1: ύγθξηζε θεληξηθνύ δηαζπλδεδεκέλνπ ΗΔ κε απηόλνκν ΗΔ ηππηθνύ πινίνπ
2.2 Βπόσοι ελέγσος ζςσνόηηηαρ και ηάζηρ Η/Γ αςηόνομος ΣΗΔ πλοίος
Ζ ζπλερήο δηαθύκαλζε ηνπ θνξηίνπ ην πινίνπ αιιά θαη ε ηθαλνπνίεζε ησλ ιεηηνπξγηθώλ πεξηνξηζκώλ
ηνπ PMS νδεγνύλ ζηελ αλάγθε ζζελαξνύ ειέγρνπ ηεο ζπρλόηεηαο θαη ηεο ηάζεσο ησλ Ζ/Γ. Οη αιιαγέο ζηε
ελεξγό ηζρύ ηνπ θνξηίνπ επεξεάδνπλ ηε ζπρλόηεηα, ελώ νη αιιαγέο ζηελ άεξγν ηζρύ ηνπ θνξηίνπ
επεξεάδνπλ ηελ ηάζε. Δπνκέλσο ν έιεγρνο ελεξγνύ ηζρύνο θαη ν έιεγρνο άεξγνπ ηζρύνο γίλεηαη μερσξηζηά.
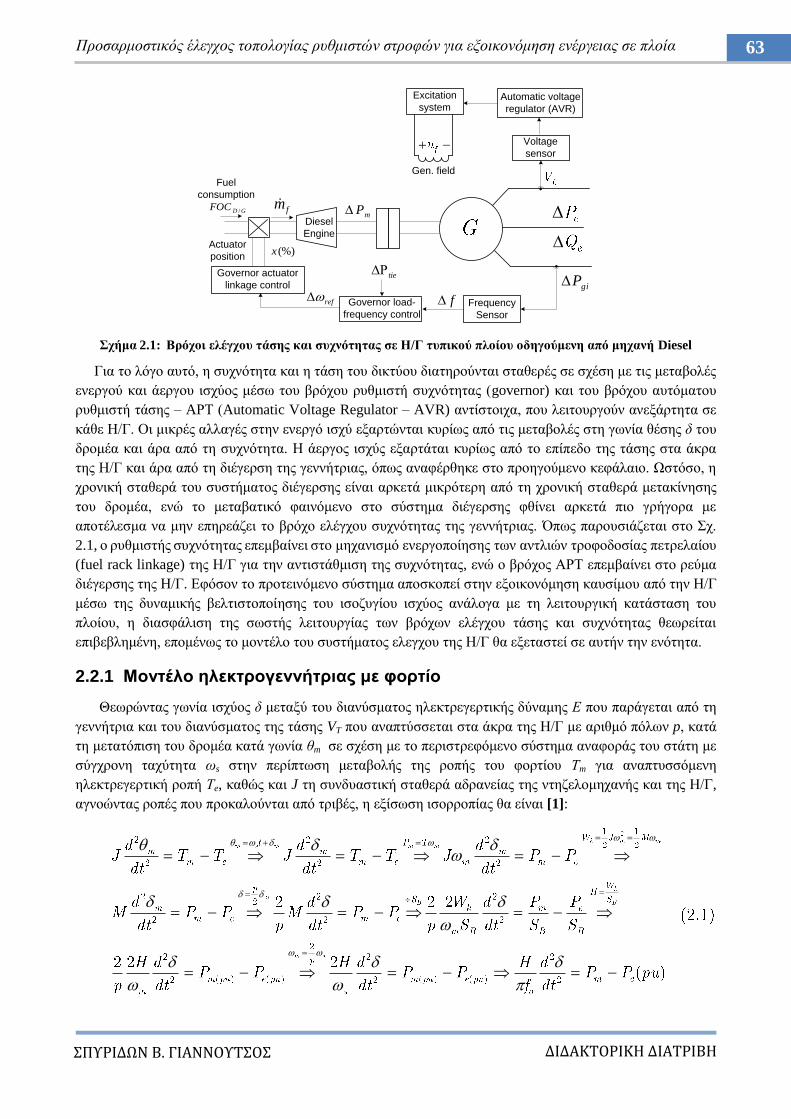
ΔΙΔΑΚΣΟΡΙΚΗ ΔΙΑΣΡΙΒΗ
ΠΤΡΙΔΩΝ Β. ΓΙΑΝΝΟΤΣΟ
63 Πξνζαξκνζηηθόο έιεγρνο ηνπνινγίαο ξπζκηζηώλ ζηξνθώλ γηα εμνηθνλόκεζε ελέξγεηαο ζε πινία
ρήκα 2.1: Βξόρνη ειέγρνπ ηάζεο θαη ζπρλόηεηαο ζε Η/Γ ηππηθνύ πινίνπ νδεγνύκελε από κεραλή Diesel
Γηα ην ιόγν απηό, ε ζπρλόηεηα θαη ε ηάζε ηνπ δηθηύνπ δηαηεξνύληαη ζηαζεξέο ζε ζρέζε κε ηηο κεηαβνιέο
ελεξγνύ θαη άεξγνπ ηζρύνο κέζσ ηνπ βξόρνπ ξπζκηζηή ζπρλόηεηαο (governor) θαη ηνπ βξόρνπ απηόκαηνπ
ξπζκηζηή ηάζεο – AΡΣ (Automatic Voltage Regulator – AVR) αληίζηνηρα, πνπ ιεηηνπξγνύλ αλεμάξηεηα ζε
θάζε Ζ/Γ. Οη κηθξέο αιιαγέο ζηελ ελεξγό ηζρύ εμαξηώληαη θπξίσο από ηηο κεηαβνιέο ζηε γσλία ζέζεο δ ηνπ
δξνκέα θαη άξα από ηε ζπρλόηεηα. Ζ άεξγνο ηζρύο εμαξηάηαη θπξίσο από ην επίπεδν ηεο ηάζεο ζηα άθξα
ηεο Ζ/Γ θαη άξα από ηε δηέγεξζε ηεο γελλήηξηαο, όπσο αλαθέξζεθε ζην πξνεγνύκελν θεθάιαην. Χζηόζν, ε
ρξνληθή ζηαζεξά ηνπ ζπζηήκαηνο δηέγεξζεο είλαη αξθεηά κηθξόηεξε από ηε ρξνληθή ζηαζεξά κεηαθίλεζεο
ηνπ δξνκέα, ελώ ην κεηαβαηηθό θαηλόκελν ζην ζύζηεκα δηέγεξζεο θζίλεη αξθεηά πην γξήγνξα κε
απνηέιεζκα λα κελ επεξεάδεη ην βξόρν ειέγρνπ ζπρλόηεηαο ηεο γελλήηξηαο. Όπσο παξνπζηάδεηαη ζην ρ.
2.1, ν ξπζκηζηήο ζπρλόηεηαο επεκβαίλεη ζην κεραληζκό ελεξγνπνίεζεο ησλ αληιηώλ ηξνθνδνζίαο πεηξειαίνπ
(fuel rack linkage) ηεο Ζ/Γ γηα ηελ αληηζηάζκηζε ηεο ζπρλόηεηαο, ελώ ν βξόρνο ΑΡΣ επεκβαίλεη ζην ξεύκα
δηέγεξζεο ηεο Ζ/Γ. Δθόζνλ ην πξνηεηλόκελν ζύζηεκα απνζθνπεί ζηελ εμνηθνλόκεζε θαπζίκνπ από ηελ Ζ/Γ
κέζσ ηεο δπλακηθήο βειηηζηνπνίεζεο ηνπ ηζνδπγίνπ ηζρύνο αλάινγα κε ηε ιεηηνπξγηθή θαηάζηαζε ηνπ
πινίνπ, ε δηαζθάιηζε ηεο ζσζηήο ιεηηνπξγίαο ησλ βξόρσλ ειέγρνπ ηάζεο θαη ζπρλόηεηαο ζεσξείηαη
επηβεβιεκέλε, επνκέλσο ην κνληέιν ηνπ ζπζηήκαηνο ειεγρνπ ηεο Ζ/Γ ζα εμεηαζηεί ζε απηήλ ηελ ελόηεηα.
2.2.1 Μνληέιν ειεθηξνγελλήηξηαο κε θνξηίν
Θεσξώληαο γσλία ηζρύνο δ κεηαμύ ηνπ δηαλύζκαηνο ειεθηξεγεξηηθήο δύλακεο Δ πνπ παξάγεηαη από ηε
γελλήηξηα θαη ηνπ δηαλύζκαηνο ηεο ηάζεο VT πνπ αλαπηύζζεηαη ζηα άθξα ηεο Ζ/Γ κε αξηζκό πόισλ p, θαηά
ηε κεηαηόπηζε ηνπ δξνκέα θαηά γσλία ζm ζε ζρέζε κε ην πεξηζηξεθόκελν ζύζηεκα αλαθνξάο ηνπ ζηάηε κε
ζύγρξνλε ηαρύηεηα σs ζηελ πεξίπησζε κεηαβνιήο ηεο ξνπήο ηνπ θνξηίνπ Σm γηα αλαπηπζζόκελε
ειεθηξεγεξηηθή ξνπή Σe, θαζώο θαη J ηε ζπλδπαζηηθή ζηαζεξά αδξαλείαο ηεο ληεδεινκεραλήο θαη ηεο Ζ/Γ,
αγλνώληαο ξνπέο πνπ πξνθαινύληαη από ηξηβέο, ε εμίζσζε ηζνξξνπίαο ζα είλαη [1]:
Diesel
Engine
Fuel
consumption
fm
Actuator
position
Governor actuator
linkage control
Governor load-
frequency control
mPGDFOC /
(%)x
tie
ref f Frequency
Sensor
giP
Voltage
sensor
Automatic voltage
regulator (AVR)
Excitation
system
Gen. field
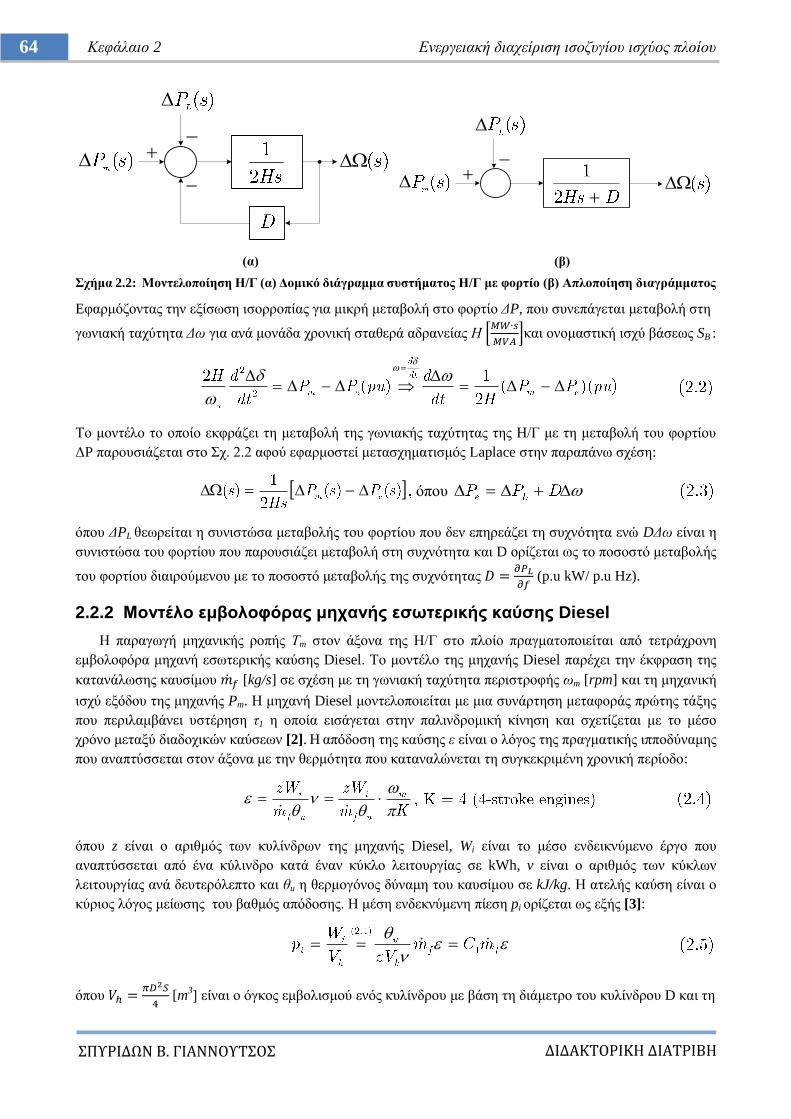
ΔΙΔΑΚΣΟΡΙΚΗ ΔΙΑΣΡΙΒΗ
ΠΤΡΙΔΩΝ Β. ΓΙΑΝΝΟΤΣΟ
64 Κεθάιαην 2 Δλεξγεηαθή δηαρείξηζε ηζνδπγίνπ ηζρύνο πινίνπ
(α) (β)
ρήκα 2.2: Μνληεινπνίεζε Η/Γ (α) Γνκηθό δηάγξακκα ζπζηήκαηνο Η/Γ κε θνξηίν (β) Απινπνίεζε δηαγξάκκαηνο
Eθαξκόδνληαο ηελ εμίζσζε ηζνξξνπίαο γηα κηθξή κεηαβνιή ζην θνξηίν ΓP, πνπ ζπλεπάγεηαη κεηαβνιή ζηε
γσληαθή ηαρύηεηα Γσ γηα αλά κνλάδα ρξνληθή ζηαζεξά αδξαλείαο Ζ [
]θαη νλνκαζηηθή ηζρύ βάζεσο SB :
Σν κνληέιν ην νπνίν εθθξάδεη ηε κεηαβνιή ηεο γσληαθήο ηαρύηεηαο ηεο Ζ/Γ κε ηε κεηαβνιή ηνπ θνξηίνπ
ΓP παξνπζηάδεηαη ζην ρ. 2.2 αθνύ εθαξκνζηεί κεηαζρεκαηηζκόο Laplace ζηελ παξαπάλσ ζρέζε:
όπνπ
όπνπ ΓPL ζεσξείηαη ε ζπληζηώζα κεηαβνιήο ηνπ θνξηίνπ πνπ δελ επεξεάδεη ηε ζπρλόηεηα ελώ DΓσ είλαη ε
ζπληζηώζα ηνπ θνξηίνπ πνπ παξνπζηάδεη κεηαβνιή ζηε ζπρλόηεηα θαη D νξίδεηαη σο ην πνζνζηό κεηαβνιήο
ηνπ θνξηίνπ δηαηξνύκελνπ κε ην πνζνζηό κεηαβνιήο ηεο ζπρλόηεηαο
(p.u kW/ p.u Hz).
2.2.2 Μνληέιν εκβνινθόξαο κεραλήο εζσηεξηθήο θαύζεο Diesel
Ζ παξαγσγή κεραληθήο ξνπήο Σm ζηνλ άμνλα ηεο Ζ/Γ ζην πινίν πξαγκαηνπνηείηαη από ηεηξάρξνλε
εκβνινθόξα κεραλή εζσηεξηθήο θαύζεο Diesel. Σν κνληέιν ηεο κεραλήο Diesel παξέρεη ηελ έθθξαζε ηεο
θαηαλάισζεο θαπζίκνπ [kg/s] ζε ζρέζε κε ηε γσληαθή ηαρύηεηα πεξηζηξνθήο σm [rpm] θαη ηε κεραληθή
ηζρύ εμόδνπ ηεο κεραλήο Pm. Ζ κεραλή Diesel κνληεινπνηείηαη κε κηα ζπλάξηεζε κεηαθνξάο πξώηεο ηάμεο
πνπ πεξηιακβάλεη πζηέξεζε η1 ε νπνία εηζάγεηαη ζηελ παιηλδξνκηθή θίλεζε θαη ζρεηίδεηαη κε ην κέζν
ρξόλν κεηαμύ δηαδνρηθώλ θαύζεσλ [2]. H απόδνζε ηεο θαύζεο ε είλαη ν ιόγνο ηεο πξαγκαηηθήο ηππνδύλακεο
πνπ αλαπηύζζεηαη ζηνλ άμνλα κε ηελ ζεξκόηεηα πνπ θαηαλαιώλεηαη ηε ζπγθεθξηκέλε ρξνληθή πεξίνδν:
όπνπ z είλαη ν αξηζκόο ησλ θπιίλδξσλ ηεο κεραλήο Diesel, Wi είλαη ην κέζν ελδεηθλύκελν έξγν πνπ
αλαπηύζζεηαη από έλα θύιηλδξν θαηά έλαλ θύθιν ιεηηνπξγίαο ζε kWh, v είλαη ν αξηζκόο ησλ θύθισλ
ιεηηνπξγίαο αλά δεπηεξόιεπην θαη ζu ε ζεξκνγόλνο δύλακε ηνπ θαπζίκνπ ζε kJ/kg. Ζ αηειήο θαύζε είλαη ν
θύξηνο ιόγνο κείσζεο ηνπ βαζκόο απόδνζεο. Ζ κέζε ελδεθλύκελε πίεζε pi νξίδεηαη σο εμήο [3]:
όπνπ
[m
3] είλαη ν όγθνο εκβνιηζκνύ ελόο θπιίλδξνπ κε βάζε ηε δηάκεηξν ηνπ θπιίλδξνπ D θαη ηε
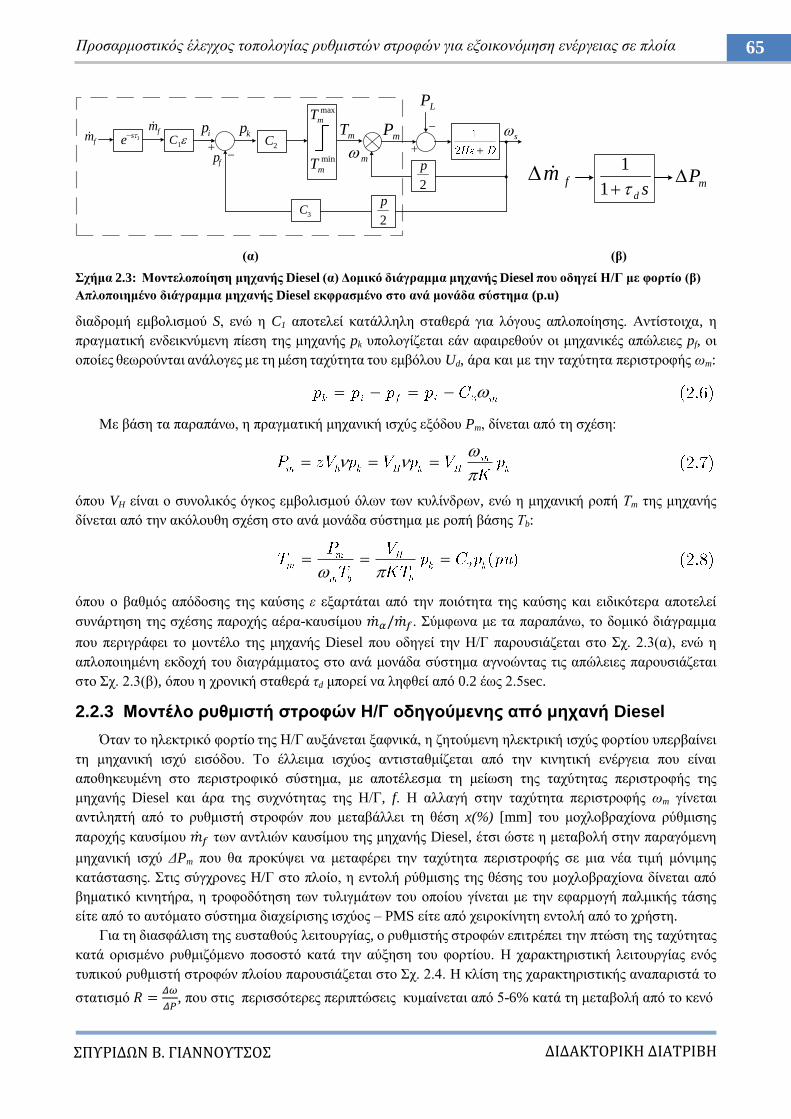
ΔΙΔΑΚΣΟΡΙΚΗ ΔΙΑΣΡΙΒΗ
ΠΤΡΙΔΩΝ Β. ΓΙΑΝΝΟΤΣΟ
65 Πξνζαξκνζηηθόο έιεγρνο ηνπνινγίαο ξπζκηζηώλ ζηξνθώλ γηα εμνηθνλόκεζε ελέξγεηαο ζε πινία
(α) (β)
ρήκα 2.3: Μνληεινπνίεζε κεραλήο Diesel (α) Γνκηθό δηάγξακκα κεραλήο Diesel πνπ νδεγεί Η/Γ κε θνξηίν (β)
Απινπνηεκέλν δηάγξακκα κεραλήο Diesel εθθξαζκέλν ζην αλά κνλάδα ζύζηεκα (p.u)
δηαδξνκή εκβνιηζκνύ S, ελώ ε C1 απνηειεί θαηάιιειε ζηαζεξά γηα ιόγνπο απινπνίεζεο. Αληίζηνηρα, ε
πξαγκαηηθή ελδεηθλύκελε πίεζε ηεο κεραλήο pk ππνινγίδεηαη εάλ αθαηξεζνύλ νη κεραληθέο απώιεηεο pf, νη
νπνίεο ζεσξνύληαη αλάινγεο κε ηε κέζε ηαρύηεηα ηνπ εκβόινπ Ud, άξα θαη κε ηελ ηαρύηεηα πεξηζηξνθήο σm:
Με βάζε ηα παξαπάλσ, ε πξαγκαηηθή κεραληθή ηζρύο εμόδνπ Pm, δίλεηαη από ηε ζρέζε:
όπνπ VH είλαη ν ζπλνιηθόο όγθνο εκβνιηζκνύ όισλ ησλ θπιίλδξσλ, ελώ ε κεραληθή ξνπή Σm ηεο κεραλήο
δίλεηαη από ηελ αθόινπζε ζρέζε ζην αλά κνλάδα ζύζηεκα κε ξνπή βάζεο Σb:
όπνπ ν βαζκόο απόδνζεο ηεο θαύζεο ε εμαξηάηαη από ηελ πνηόηεηα ηεο θαύζεο θαη εηδηθόηεξα απνηειεί
ζπλάξηεζε ηεο ζρέζεο παξνρήο αέξα-θαπζίκνπ . ύκθσλα κε ηα παξαπάλσ, ην δνκηθό δηάγξακκα
πνπ πεξηγξάθεη ην κνληέιν ηεο κεραλήο Diesel πνπ νδεγεί ηελ Ζ/Γ παξνπζηάδεηαη ζην ρ. 2.3(α), ελώ ε
απινπνηεκέλε εθδνρή ηνπ δηαγξάκκαηνο ζην αλά κνλάδα ζύζηεκα αγλνώληαο ηηο απώιεηεο παξνπζηάδεηαη
ζην ρ. 2.3(β), όπνπ ε ρξνληθή ζηαζεξά ηd κπνξεί λα ιεθζεί από 0.2 έσο 2.5sec.
2.2.3 Μνληέιν ξπζκηζηή ζηξνθώλ Η/Γ νδεγνύκελεο από κεραλή Diesel
Όηαλ ην ειεθηξηθό θνξηίν ηεο Ζ/Γ απμάλεηαη μαθληθά, ε δεηνύκελε ειεθηξηθή ηζρύο θνξηίνπ ππεξβαίλεη
ηε κεραληθή ηζρύ εηζόδνπ. Σν έιιεηκα ηζρύνο αληηζηαζκίδεηαη από ηελ θηλεηηθή ελέξγεηα πνπ είλαη
απνζεθεπκέλε ζην πεξηζηξνθηθό ζύζηεκα, κε απνηέιεζκα ηε κείσζε ηεο ηαρύηεηαο πεξηζηξνθήο ηεο
κεραλήο Diesel θαη άξα ηεο ζπρλόηεηαο ηεο Ζ/Γ, f. Ζ αιιαγή ζηελ ηαρύηεηα πεξηζηξνθήο σm γίλεηαη
αληηιεπηή από ην ξπζκηζηή ζηξνθώλ πνπ κεηαβάιιεη ηε ζέζε x(%) [mm] ηνπ κνρινβξαρίνλα ξύζκηζεο
παξνρήο θαπζίκνπ ησλ αληιηώλ θαπζίκνπ ηεο κεραλήο Diesel, έηζη ώζηε ε κεηαβνιή ζηελ παξαγόκελε
κεραληθή ηζρύ ΓPm πνπ ζα πξνθύςεη λα κεηαθέξεη ηελ ηαρύηεηα πεξηζηξνθήο ζε κηα λέα ηηκή κόληκεο
θαηάζηαζεο. ηηο ζύγρξνλεο H/Γ ζην πινίν, ε εληνιή ξύζκηζεο ηεο ζέζεο ηνπ κνρινβξαρίνλα δίλεηαη από
βεκαηηθό θηλεηήξα, ε ηξνθνδόηεζε ησλ ηπιηγκάησλ ηνπ νπνίνπ γίλεηαη κε ηελ εθαξκνγή παικηθήο ηάζεο
είηε από ην απηόκαην ζύζηεκα δηαρείξηζεο ηζρύνο – PMS είηε από ρεηξνθίλεηε εληνιή από ην ρξήζηε.
Γηα ηε δηαζθάιηζε ηεο επζηαζνύο ιεηηνπξγίαο, ν ξπζκηζηήο ζηξνθώλ επηηξέπεη ηελ πηώζε ηεο ηαρύηεηαο
θαηά νξηζκέλν ξπζκηδόκελν πνζνζηό θαηά ηελ αύμεζε ηνπ θνξηίνπ. Ζ ραξαθηεξηζηηθή ιεηηνπξγίαο ελόο
ηππηθνύ ξπζκηζηή ζηξνθώλ πινίνπ παξνπζηάδεηαη ζην ρ. 2.4. Ζ θιίζε ηεο ραξαθηεξηζηηθήο αλαπαξηζηά ην
ζηαηηζκό
, πνπ ζηηο πεξηζζόηεξεο πεξηπηώζεηο θπκαίλεηαη από 5-6% θαηά ηε κεηαβνιή από ην θελό
fm 1se
fm1C
ip
kp
fp2C
mT
mmP
LP
2
p
s
2
p3C
max
mT
min
mTfm
mPsd1
1
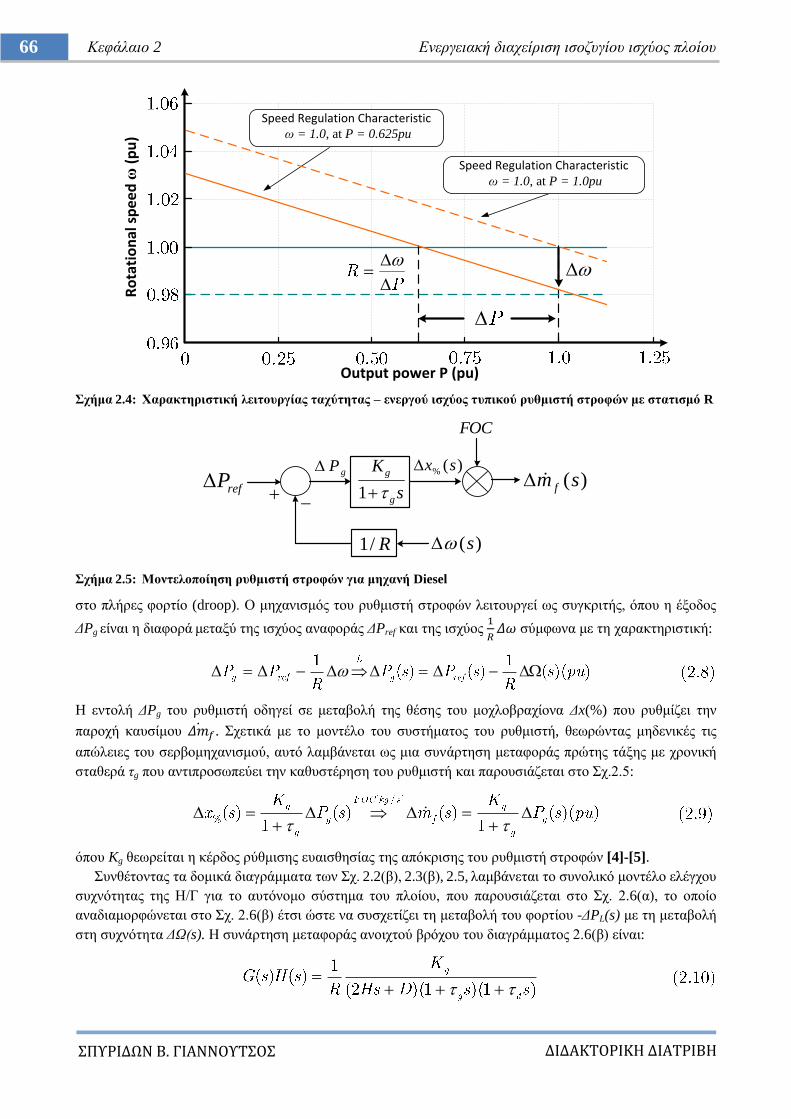
ΔΙΔΑΚΣΟΡΙΚΗ ΔΙΑΣΡΙΒΗ
ΠΤΡΙΔΩΝ Β. ΓΙΑΝΝΟΤΣΟ
66 Κεθάιαην 2 Δλεξγεηαθή δηαρείξηζε ηζνδπγίνπ ηζρύνο πινίνπ
ρήκα 2.4: Υαξαθηεξηζηηθή ιεηηνπξγίαο ηαρύηεηαο – ελεξγνύ ηζρύνο ηππηθνύ ξπζκηζηή ζηξνθώλ κε ζηαηηζκό R
ρήκα 2.5: Μνληεινπνίεζε ξπζκηζηή ζηξνθώλ γηα κεραλή Diesel
ζην πιήξεο θνξηίν (droop). Ο κεραληζκόο ηνπ ξπζκηζηή ζηξνθώλ ιεηηνπξγεί σο ζπγθξηηήο, όπνπ ε έμνδνο
ΓPg είλαη ε δηαθνξά κεηαμύ ηεο ηζρύνο αλαθνξάο ΓPref θαη ηεο ηζρύνο
ζύκθσλα κε ηε ραξαθηεξηζηηθή:
Ζ εληνιή ΓPg ηνπ ξπζκηζηή νδεγεί ζε κεηαβνιή ηεο ζέζεο ηνπ κνρινβξαρίνλα Γx(%) πνπ ξπζκίδεη ηελ
παξνρή θαπζίκνπ . ρεηηθά κε ην κνληέιν ηνπ ζπζηήκαηνο ηνπ ξπζκηζηή, ζεσξώληαο κεδεληθέο ηηο
απώιεηεο ηνπ ζεξβνκεραληζκνύ, απηό ιακβάλεηαη σο κηα ζπλάξηεζε κεηαθνξάο πξώηεο ηάμεο κε ρξνληθή
ζηαζεξά ηg πνπ αληηπξνζσπεύεη ηελ θαζπζηέξεζε ηνπ ξπζκηζηή θαη παξνπζηάδεηαη ζην ρ.2.5:
όπνπ Kg ζεσξείηαη ε θέξδνο ξύζκηζεο επαηζζεζίαο ηεο απόθξηζεο ηνπ ξπζκηζηή ζηξνθώλ [4]-[5].
πλζέηνληαο ηα δνκηθά δηαγξάκκαηα ησλ ρ. 2.2(β), 2.3(β), 2.5, ιακβάλεηαη ην ζπλνιηθό κνληέιν ειέγρνπ
ζπρλόηεηαο ηεο Ζ/Γ γηα ην απηόλνκν ζύζηεκα ηνπ πινίνπ, πνπ παξνπζηάδεηαη ζην ρ. 2.6(α), ην νπνίν
αλαδηακνξθώλεηαη ζην ρ. 2.6(β) έηζη ώζηε λα ζπζρεηίδεη ηε κεηαβνιή ηνπ θνξηίνπ -ΓPL(s) κε ηε κεηαβνιή
ζηε ζπρλόηεηα ΓΩ(s). Ζ ζπλάξηεζε κεηαθνξάο αλνηρηνύ βξόρνπ ηνπ δηαγξάκκαηνο 2.6(β) είλαη:
Speed Regulation Characteristic σ = 1.0, at P = 0.625pu
Speed Regulation Characteristic σ = 1.0, at P = 1.0pu
Ro
tati
on
al s
pe
ed
σ (
pu
)
Output power P (pu)
refPs
K
g
g
1
R/1 )(s
gP )(% sx
FOC
)(sm f
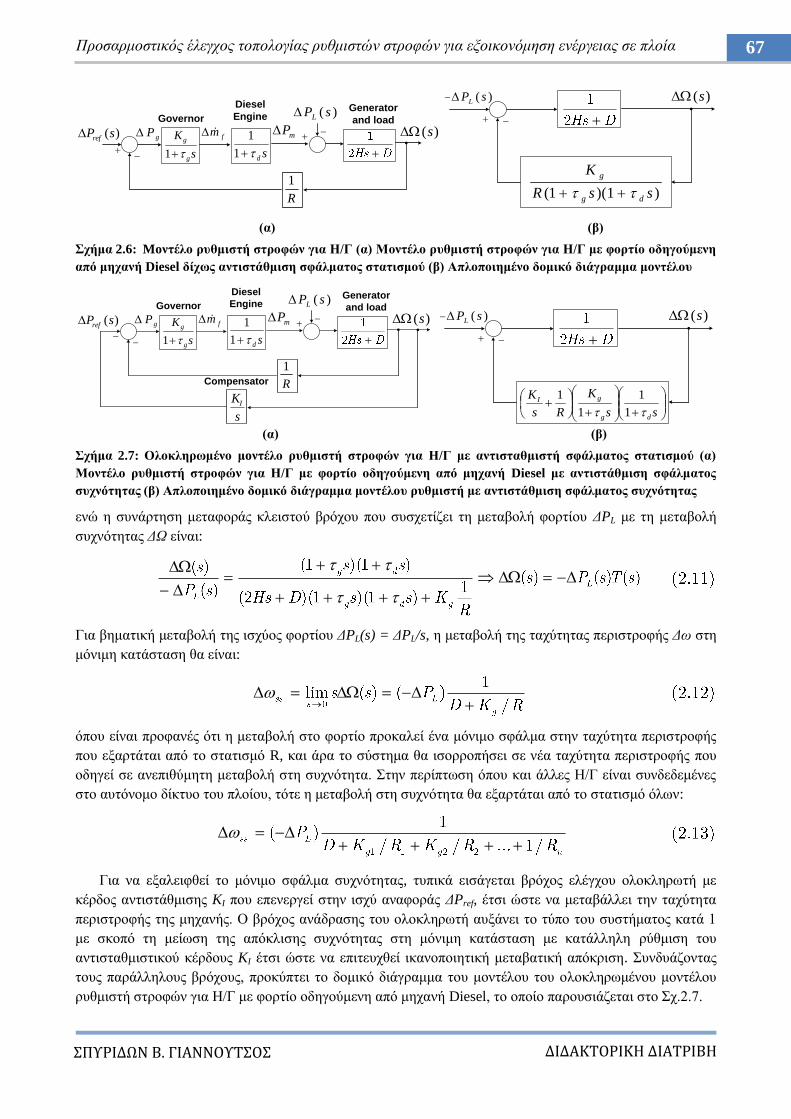
ΔΙΔΑΚΣΟΡΙΚΗ ΔΙΑΣΡΙΒΗ
ΠΤΡΙΔΩΝ Β. ΓΙΑΝΝΟΤΣΟ
67 Πξνζαξκνζηηθόο έιεγρνο ηνπνινγίαο ξπζκηζηώλ ζηξνθώλ γηα εμνηθνλόκεζε ελέξγεηαο ζε πινία
(α) (β)
ρήκα 2.6: Moληέιν ξπζκηζηή ζηξνθώλ γηα Η/Γ (α) Μνληέιν ξπζκηζηή ζηξνθώλ γηα Η/Γ κε θνξηίν νδεγνύκελε
από κεραλή Diesel δίρσο αληηζηάζκηζε ζθάικαηνο ζηαηηζκνύ (β) Απινπνηεκέλν δνκηθό δηάγξακκα κνληέινπ
(α) (β)
ρήκα 2.7: Οινθιεξσκέλν κoληέιν ξπζκηζηή ζηξνθώλ γηα Η/Γ κε αληηζηαζκηζηή ζθάικαηνο ζηαηηζκνύ (α)
Μνληέιν ξπζκηζηή ζηξνθώλ γηα Η/Γ κε θνξηίν νδεγνύκελε από κεραλή Diesel κε αληηζηάζκηζε ζθάικαηνο
ζπρλόηεηαο (β) Απινπνηεκέλν δνκηθό δηάγξακκα κνληέινπ ξπζκηζηή κε αληηζηάζκηζε ζθάικαηνο ζπρλόηεηαο
ελώ ε ζπλάξηεζε κεηαθνξάο θιεηζηνύ βξόρνπ πνπ ζπζρεηίδεη ηε κεηαβνιή θνξηίνπ ΓPL κε ηε κεηαβνιή
ζπρλόηεηαο ΓΩ είλαη:
Γηα βεκαηηθή κεηαβνιή ηεο ηζρύνο θνξηίνπ ΓPL(s) = ΓPL/s, ε κεηαβνιή ηεο ηαρύηεηαο πεξηζηξνθήο Γσ ζηε
κόληκε θαηάζηαζε ζα είλαη:
όπνπ είλαη πξνθαλέο όηη ε κεηαβνιή ζην θνξηίν πξνθαιεί έλα κόληκν ζθάικα ζηελ ηαρύηεηα πεξηζηξνθήο
πνπ εμαξηάηαη από ην ζηαηηζκό R, θαη άξα ην ζύζηεκα ζα ηζνξξνπήζεη ζε λέα ηαρύηεηα πεξηζηξνθήο πνπ
νδεγεί ζε αλεπηζύκεηε κεηαβνιή ζηε ζπρλόηεηα. ηελ πεξίπησζε όπνπ θαη άιιεο Ζ/Γ είλαη ζπλδεδεκέλεο
ζην απηόλνκν δίθηπν ηνπ πινίνπ, ηόηε ε κεηαβνιή ζηε ζπρλόηεηα ζα εμαξηάηαη από ην ζηαηηζκό όισλ:
Γηα λα εμαιεηθζεί ην κόληκν ζθάικα ζπρλόηεηαο, ηππηθά εηζάγεηαη βξόρνο ειέγρνπ νινθιεξσηή κε
θέξδνο αληηζηάζκηζεο KI πνπ επελεξγεί ζηελ ηζρύ αλαθνξάο ΓPref, έηζη ώζηε λα κεηαβάιιεη ηελ ηαρύηεηα
πεξηζηξνθήο ηεο κεραλήο. Ο βξόρνο αλάδξαζεο ηνπ νινθιεξσηή απμάλεη ην ηύπν ηνπ ζπζηήκαηνο θαηά 1
κε ζθνπό ηε κείσζε ηεο απόθιηζεο ζπρλόηεηαο ζηε κόληκε θαηάζηαζε κε θαηάιιειε ξύζκηζε ηνπ
αληηζηαζκηζηηθνύ θέξδνπο KI έηζη ώζηε λα επηηεπρζεί ηθαλνπνηεηηθή κεηαβαηηθή απόθξηζε. πλδπάδνληαο
ηνπο παξάιιεινπο βξόρνπο, πξνθύπηεη ην δνκηθό δηάγξακκα ηνπ κνληέινπ ηνπ νινθιεξσκέλνπ κνληέινπ
ξπζκηζηή ζηξνθώλ γηα Ζ/Γ κε θνξηίν νδεγνύκελε από κεραλή Diesel, ην νπνίν παξνπζηάδεηαη ζην ρ.2.7.
sd1
1
s
K
g
g
1
R
1
gP fm)(sPref
)( sPL
)(s
Governor
Diesel
Engine
mP
Generator
and load
)1)(1( ssR
K
dg
g
)(s )( sPL
sd1
1
s
K
g
g
1
R
1
gP fm)(sPref
)( sPL
)(s
Governor
Diesel
Engine
mP
Generator
and load
s
KI
Compensator
)(s )( sPL
ss
K
Rs
K
dg
gI
1
1
1
1
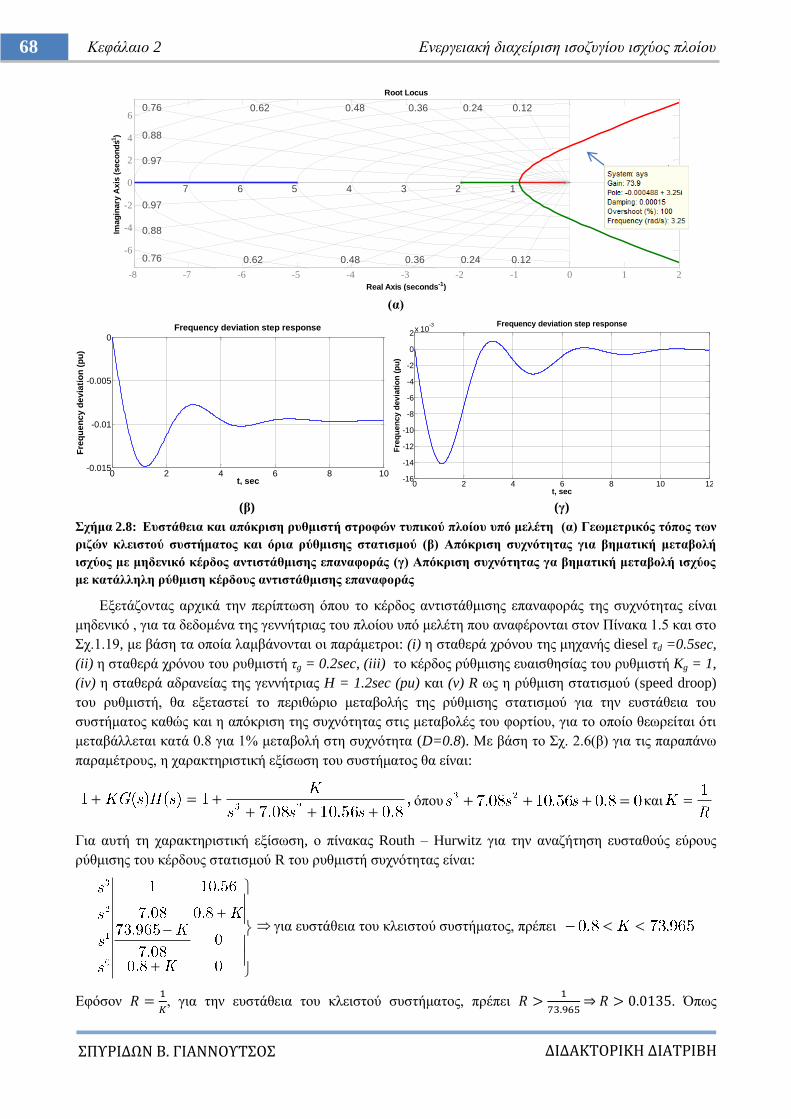
ΔΙΔΑΚΣΟΡΙΚΗ ΔΙΑΣΡΙΒΗ
ΠΤΡΙΔΩΝ Β. ΓΙΑΝΝΟΤΣΟ
68 Κεθάιαην 2 Δλεξγεηαθή δηαρείξηζε ηζνδπγίνπ ηζρύνο πινίνπ
(α)
(β) (γ)
ρήκα 2.8: Δπζηάζεηα θαη απόθξηζε ξπζκηζηή ζηξνθώλ ηππηθνύ πινίνπ ππό κειέηε (α) Γεσκεηξηθόο ηόπνο ησλ
ξηδώλ θιεηζηνύ ζπζηήκαηνο θαη όξηα ξύζκηζεο ζηαηηζκνύ (β) Απόθξηζε ζπρλόηεηαο γηα βεκαηηθή κεηαβνιή
ηζρύνο κε κεδεληθό θέξδνο αληηζηάζκηζεο επαλαθνξάο (γ) Απόθξηζε ζπρλόηεηαο γα βεκαηηθή κεηαβνιή ηζρύνο
κε θαηάιιειε ξύζκηζε θέξδνπο αληηζηάζκηζεο επαλαθνξάο
Δμεηάδνληαο αξρηθά ηελ πεξίπησζε όπνπ ην θέξδνο αληηζηάζκηζεο επαλαθνξάο ηεο ζπρλόηεηαο είλαη
κεδεληθό , γηα ηα δεδνκέλα ηεο γελλήηξηαο ηνπ πινίνπ ππό κειέηε πνπ αλαθέξνληαη ζηνλ Πίλαθα 1.5 θαη ζην
ρ.1.19, κε βάζε ηα νπνία ιακβάλνληαη νη παξάκεηξνη: (i) ε ζηαζεξά ρξόλνπ ηεο κεραλήο diesel ηd =0.5sec,
(ii) ε ζηαζεξά ρξόλνπ ηνπ ξπζκηζηή ηg = 0.2sec, (iii) ην θέξδνο ξύζκηζεο επαηζζεζίαο ηνπ ξπζκηζηή Kg = 1,
(iv) ε ζηαζεξά αδξαλείαο ηεο γελλήηξηαο H = 1.2sec (pu) θαη (v) R σο ε ξύζκηζε ζηαηηζκνύ (speed droop)
ηνπ ξπζκηζηή, ζα εμεηαζηεί ην πεξηζώξην κεηαβνιήο ηεο ξύζκηζεο ζηαηηζκνύ γηα ηελ επζηάζεηα ηνπ
ζπζηήκαηνο θαζώο θαη ε απόθξηζε ηεο ζπρλόηεηαο ζηηο κεηαβνιέο ηνπ θνξηίνπ, γηα ην νπνίν ζεσξείηαη όηη
κεηαβάιιεηαη θαηά 0.8 γηα 1% κεηαβνιή ζηε ζπρλόηεηα (D=0.8). Με βάζε ην ρ. 2.6(β) γηα ηηο παξαπάλσ
παξακέηξνπο, ε ραξαθηεξηζηηθή εμίζσζε ηνπ ζπζηήκαηνο ζα είλαη:
όπνπ θαη
Γηα απηή ηε ραξαθηεξηζηηθή εμίζσζε, ν πίλαθαο Routh – Hurwitz γηα ηελ αλαδήηεζε επζηαζνύο εύξνπο
ξύζκηζεο ηνπ θέξδνπο ζηαηηζκνύ R ηνπ ξπζκηζηή ζπρλόηεηαο είλαη:
γηα επζηάζεηα ηνπ θιεηζηνύ ζπζηήκαηνο, πξέπεη
Δθόζνλ
, γηα ηελ επζηάζεηα ηνπ θιεηζηνύ ζπζηήκαηνο, πξέπεη
⇒ . Όπσο
-8 -7 -6 -5 -4 -3 -2 -1 0 1 2
-6
-4
-2
0
2
4
60.120.240.360.480.620.76
0.88
0.97
0.120.240.360.480.620.76
0.88
0.97
12345678
Root Locus
Real Axis (seconds-1)
Imag
inary
Axis
(seco
nd
s-1)
0 2 4 6 8 10-0.015
-0.01
-0.005
0
t, sec
Fre
qu
en
cy
de
via
tio
n (
pu
)
Frequency deviation step response
0 2 4 6 8 10 12-16
-14
-12
-10
-8
-6
-4
-2
0
2x 10
-3
t, sec
Fre
qu
en
cy d
evia
tio
n (
pu
)
Frequency deviation step response
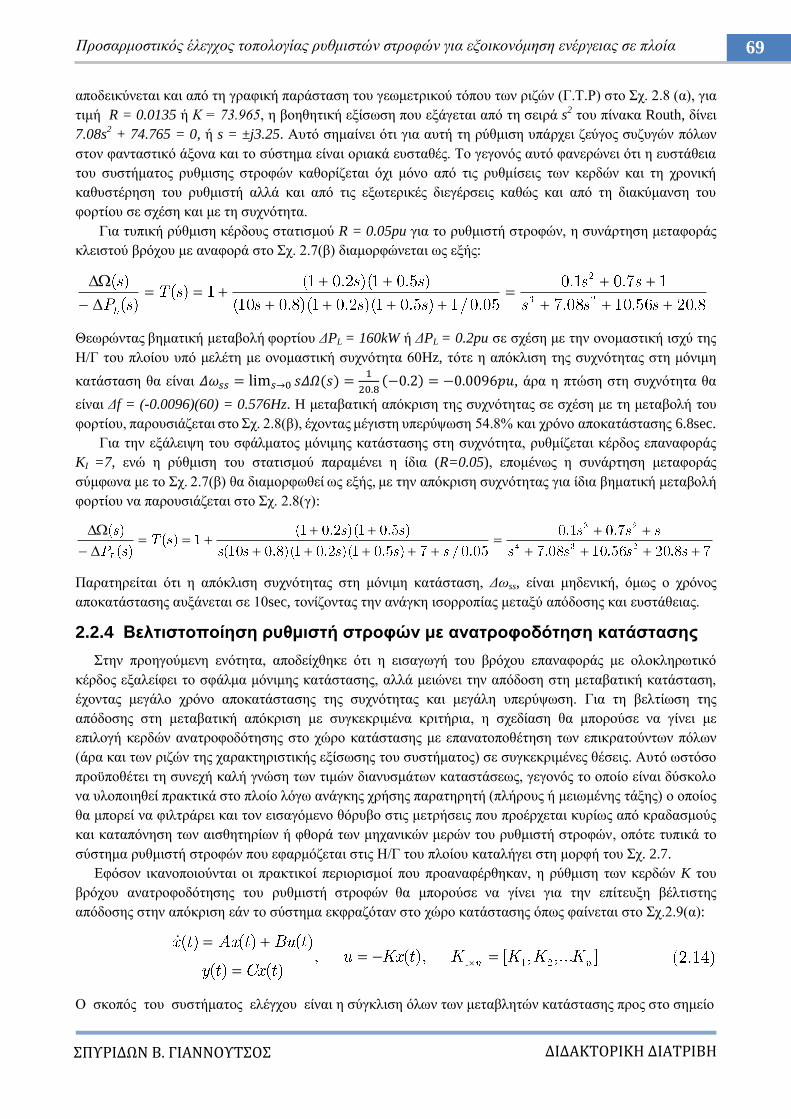
ΔΙΔΑΚΣΟΡΙΚΗ ΔΙΑΣΡΙΒΗ
ΠΤΡΙΔΩΝ Β. ΓΙΑΝΝΟΤΣΟ
69 Πξνζαξκνζηηθόο έιεγρνο ηνπνινγίαο ξπζκηζηώλ ζηξνθώλ γηα εμνηθνλόκεζε ελέξγεηαο ζε πινία
απνδεηθύλεηαη θαη από ηε γξαθηθή παξάζηαζε ηνπ γεσκεηξηθνύ ηόπνπ ησλ ξηδώλ (Γ.Σ.Ρ) ζην ρ. 2.8 (α), γηα
ηηκή R = 0.0135 ή Κ = 73.965, ε βνεζεηηθή εμίζσζε πνπ εμάγεηαη από ηε ζεηξά s2 ηνπ πίλαθα Routh, δίλεη
7.08s2 + 74.765 = 0, ή s = ±j3.25. Απηό ζεκαίλεη όηη γηα απηή ηε ξύζκηζε ππάξρεη δεύγνο ζπδπγώλ πόισλ
ζηνλ θαληαζηηθό άμνλα θαη ην ζύζηεκα είλαη νξηαθά επζηαζέο. Σν γεγνλόο απηό θαλεξώλεη όηη ε επζηάζεηα
ηνπ ζπζηήκαηνο ξπζκηζεο ζηξνθώλ θαζνξίδεηαη όρη κόλν από ηηο ξπζκίζεηο ησλ θεξδώλ θαη ηε ρξνληθή
θαζπζηέξεζε ηνπ ξπζκηζηή αιιά θαη από ηηο εμσηεξηθέο δηεγέξζεηο θαζώο θαη από ηε δηαθύκαλζε ηνπ
θνξηίνπ ζε ζρέζε θαη κε ηε ζπρλόηεηα.
Γηα ηππηθή ξύζκηζε θέξδνπο ζηαηηζκνύ R = 0.05pu γηα ην ξπζκηζηή ζηξνθώλ, ε ζπλάξηεζε κεηαθνξάο
θιεηζηνύ βξόρνπ κε αλαθνξά ζην ρ. 2.7(β) δηακνξθώλεηαη σο εμήο:
Θεσξώληαο βεκαηηθή κεηαβνιή θνξηίνπ ΓPL = 160kW ή ΓPL = 0.2pu ζε ζρέζε κε ηελ νλνκαζηηθή ηζρύ ηεο
Ζ/Γ ηνπ πινίνπ ππό κειέηε κε νλνκαζηηθή ζπρλόηεηα 60Hz, ηόηε ε απόθιηζε ηεο ζπρλόηεηαο ζηε κόληκε
θαηάζηαζε ζα είλαη
, άξα ε πηώζε ζηε ζπρλόηεηα ζα
είλαη Γf = (-0.0096)(60) = 0.576Hz. H κεηαβαηηθή απόθξηζε ηεο ζπρλόηεηαο ζε ζρέζε κε ηε κεηαβνιή ηνπ
θνξηίνπ, παξνπζηάδεηαη ζην ρ. 2.8(β), έρνληαο κέγηζηε ππεξύςσζε 54.8% θαη ρξόλν απνθαηάζηαζεο 6.8sec.
Γηα ηελ εμάιεηςε ηνπ ζθάικαηνο κόληκεο θαηάζηαζεο ζηε ζπρλόηεηα, ξπζκίδεηαη θέξδνο επαλαθνξάο
KI =7, ελώ ε ξύζκηζε ηνπ ζηαηηζκνύ παξακέλεη ε ίδηα (R=0.05), επνκέλσο ε ζπλάξηεζε κεηαθνξάο
ζύκθσλα κε ην ρ. 2.7(β) ζα δηακνξθσζεί σο εμήο, κε ηελ απόθξηζε ζπρλόηεηαο γηα ίδηα βεκαηηθή κεηαβνιή
θνξηίνπ λα παξνπζηάδεηαη ζην ρ. 2.8(γ):
Παξαηεξείηαη όηη ε απόθιηζε ζπρλόηεηαο ζηε κόληκε θαηάζηαζε, Γσss, είλαη κεδεληθή, όκσο ν ρξόλνο
απνθαηάζηαζεο απμάλεηαη ζε 10sec, ηνλίδνληαο ηελ αλάγθε ηζνξξνπίαο κεηαμύ απόδνζεο θαη επζηάζεηαο.
2.2.4 Βειηηζηνπνίεζε ξπζκηζηή ζηξνθώλ κε αλαηξνθνδόηεζε θαηάζηαζεο
ηελ πξνεγνύκελε ελόηεηα, απνδείρζεθε όηη ε εηζαγσγή ηνπ βξόρνπ επαλαθνξάο κε νινθιεξσηηθό
θέξδνο εμαιείθεη ην ζθάικα κόληκεο θαηάζηαζεο, αιιά κεηώλεη ηελ απόδνζε ζηε κεηαβαηηθή θαηάζηαζε,
έρνληαο κεγάιν ρξόλν απνθαηάζηαζεο ηεο ζπρλόηεηαο θαη κεγάιε ππεξύςσζε. Γηα ηε βειηίσζε ηεο
απόδνζεο ζηε κεηαβαηηθή απόθξηζε κε ζπγθεθξηκέλα θξηηήξηα, ε ζρεδίαζε ζα κπνξνύζε λα γίλεη κε
επηινγή θεξδώλ αλαηξνθνδόηεζεο ζην ρώξν θαηάζηαζεο κε επαλαηνπνζέηεζε ησλ επηθξαηνύλησλ πόισλ
(άξα θαη ησλ ξηδώλ ηεο ραξαθηεξηζηηθήο εμίζσζεο ηνπ ζπζηήκαηνο) ζε ζπγθεθξηκέλεο ζέζεηο. Απηό σζηόζν
πξνϋπνζέηεη ηε ζπλερή θαιή γλώζε ησλ ηηκώλ δηαλπζκάησλ θαηαζηάζεσο, γεγνλόο ην νπνίν είλαη δύζθνιν
λα πινπνηεζεί πξαθηηθά ζην πινίν ιόγσ αλάγθεο ρξήζεο παξαηεξεηή (πιήξνπο ή κεησκέλεο ηάμεο) ν νπνίνο
ζα κπνξεί λα θηιηξάξεη θαη ηνλ εηζαγόκελν ζόξπβν ζηηο κεηξήζεηο πνπ πξνέξρεηαη θπξίσο από θξαδαζκνύο
θαη θαηαπόλεζε ησλ αηζζεηεξίσλ ή θζνξά ησλ κεραληθώλ κεξώλ ηνπ ξπζκηζηή ζηξνθώλ, νπόηε ηππηθά ην
ζύζηεκα ξπζκηζηή ζηξνθώλ πνπ εθαξκόδεηαη ζηηο Ζ/Γ ηνπ πινίνπ θαηαιήγεη ζηε κνξθή ηνπ ρ. 2.7.
Δθόζνλ ηθαλνπνηνύληαη νη πξαθηηθνί πεξηνξηζκνί πνπ πξναλαθέξζεθαλ, ε ξύζκηζε ησλ θεξδώλ K ηνπ
βξόρνπ αλαηξνθνδόηεζεο ηνπ ξπζκηζηή ζηξνθώλ ζα κπνξνύζε λα γίλεη γηα ηελ επίηεπμε βέιηηζηεο
απόδνζεο ζηελ απόθξηζε εάλ ην ζύζηεκα εθθξαδόηαλ ζην ρώξν θαηάζηαζεο όπσο θαίλεηαη ζην ρ.2.9(α):
Ο ζθνπόο ηνπ ζπζηήκαηνο ειέγρνπ είλαη ε ζύγθιηζε όισλ ησλ κεηαβιεηώλ θαηάζηαζεο πξνο ζην ζεκείν
ΔΙΔΑΚΣΟΡΙΚΗ ΔΙΑΣΡΙΒΗ
ΠΤΡΙΔΩΝ Β. ΓΙΑΝΝΟΤΣΟ
70 Κεθάιαην 2 Δλεξγεηαθή δηαρείξηζε ηζνδπγίνπ ηζρύνο πινίνπ
(α) (β)
ρήκα 2.9: Βειηηζηνπνίεζε απόθξηζεο ξπζκηζηή ζηξνθώλ κε αλαηξνθνδόηεζε θαηάζηαζεο (α) Γνκηθό
δηάγξακκα ειέγρνπ ζπζηήκαηνο ξπζκηζηή ζηξνθώλ-κεραλήο Diesel-Η/Γ κε θνξηίν κε ρξήζε αλαηξνθνδόηεζεο
θαηάζηαζεο (β) Απόθξηζε ζπρλόηεηαο αληηζηαζκηζκέλνπ ζπζηήκαηνο γηα βεκαηηθή κεηαβνιή ηζρύνο ΓPL
ηζνξξνπίαο όηαλ εθαξκνζηεί κηα εμσηεξηθή δηαηαξαρή. Σν αληηζηαζκηζκέλν ζύζηεκα κε αλαηξνθνδόηεζε
θαηάζηαζεο ζα εθθξάδεηαη από ηελ παξαθάησ αλαπαξάζηαζε ζην ρώξν θαηάζηαζεο:
Δάλ νη επηζπκεηνί επηθξαηνύληεο πόινη είλαη –ι1,…,–ιn, ε επηζπκεηή ραξαθηεξηζηηθή εμίζσζε ηνπ θιεηζηνύ
ζπζηήκαηνο από ηελ νπνία πξνθύπηεη ν πίλαθαο ησλ θεξδώλ K κε εμίζσζε όκνησλ ζπληειεζηώλ ζα είλαη:
Δθθξάδνληαο ην ζύζηεκα ξπζκηζηή ζηξνθώλ ηνπ ρ. 2.6 ζην ρώξν θαηάζηαζεο, κε κεηαβιεηέο
θαηάζηαζεο ηελ παξνρή θαπζίκνπ , ηε κεραληθή ηζρύ εηζόδνπ ζηελ Ζ/Γ, ΓPm, θαη ηε ζπρλόηεηα Γσ:
Μεηαζρεκαηίδνληαο ηα παξαπάλσ ζε κνξθή πίλαθα ζην πεδίν ηνπ ρξόλνπ, όπσο παξνπζηάδεηαη ζηε ζρ.2.14:
Γηα ηηο ίδηεο παξακέηξνπο ζπζηήκαηνο ηνπ ξπζκηζηή ζηξνθώλ πνπ ρξεζηκνπνηήζεθαλ παξαπάλσ ζηελ
παξάγξαθν 2.2.3, θαη γηα ΓPref = 0, ζα ηζρύεη ην αθόινπζν ζύζηεκα εμηζώζεσλ θαηάζηαζεο:
)(tPL )( tu
)()()(
)()()(
tDutCxty
tButAxtx
1K
2K
3K
)(t
)(tm f )(tPm
0 0.5 1 1.5 2 2.5 3-4
-3
-2
-1
0x 10
-3 Frequency deviation step response
t,sec
Fre
qu
en
cy
de
via
tio
n (
pu
)
ΔΙΔΑΚΣΟΡΙΚΗ ΔΙΑΣΡΙΒΗ
ΠΤΡΙΔΩΝ Β. ΓΙΑΝΝΟΤΣΟ
71 Πξνζαξκνζηηθόο έιεγρνο ηνπνινγίαο ξπζκηζηώλ ζηξνθώλ γηα εμνηθνλόκεζε ελέξγεηαο ζε πινία
όπνπ θαη
Γηα βεκαηηθή κεηαβνιή θνξηίνπ ΓPL = 0.2pu, ην παξαπάλσ ζύζηεκα δίλεη όκνηα απόθξηζε κε απηή πνπ
ιακβάλεηαη από ηε ρξήζε ζπλάξηεζεο κεηαθνξάο ηνπ θιεηζηνύ ζπζηήκαηνο όπσο θαίλεηαη ζην ρ. 2.8(β), ε
νπνία παξνπζηάδεη κεγάιν ρξόλν απνθαηάζηαζεο ίζν κε 10sec. Οη επηθξαηνύληεο πόινη ηεο ραξαθηεξηζηηθήο
εμίζσζεο είλαη s1,2 = -0.5968±j1.7825 ελώ ε ηξίηε ξίδα είλαη ε s3 = -5.8863.
Ο ζηόρνο γηα ηελ βειηίσζε ηεο απόδνζεο, είλαη ε απόθξηζε ηνπ ζπζηήκαηνο θιεηζηνύ βξόρνπ ηνπ
ξπζκηζηή ζπρλόηεηαο λα έρεη ρξόλν απνθαηάζηαζεο ts = 2sec θαη κέγηζην πνζηνζηό ππεξύςσζεο Mp=30%.
Με βάζε ηα θξηηήξηα απηά, ππνινγίδνπκε ηε ζηαζεξά απόζβεζεο J θαη ηελ ηδηνζπρλόηεηα σn ησλ
επηζπκεηώλ επηθξαηνύλησλ πόισλ ηνπ θιεηζηνύ ζπζηήκαηνο:
Δπνκέλσο, νη επηζπκεηνί επηθξαηνύληεο πόινη από ηνπο νπνίνπο ζα δηέξρεηαη ν λένο Γ.Σ.Ρ ζα είλαη:
έηζη ώζηε λα επηηεπρζεί ε επηζπκεηή απόδνζε, ελώ ε ηξίηε ξίδα
επηιέγεηαη . Ο ζηόρνο είλαη λα επξεζεί πίλαθαο θεξδώλ Κ γηα ηελ ηνπνζέηεζε ησλ ξηδώλ ηνπ
θιεηζηνύ ζπζηήκαηνο ζηηο ηηκέο . Με ρξήζε ησλ (2.14)-(2.16), ηζρύεη όηη ν πίλαθαο θεξδώλ K, ν πίλαθαο
Αf ηνπ αληηζηαζκηζκέλνπ ζπζηήκαηνο θαη ε ζπλάξηεζε κεηαθνξάο T*(s) ηνπ θιεηζηνύ ζπζηήκαηνο είλαη:
ελώ ε απόθξηζε ηνπ αληηζηαζκηζκέλνπ ζπζηήκαηνο γηα βεκαηηθή κεηαβνιή ΓPL = 0.2pu παξνπζηάδεηαη ζην
ρ. 2.9(β). Παξαηεξείηαη όηη ε κεηαβαηηθή απόθξηζε έρεη βειηησζεί θαηά κεγάιν βαζκό, κε ην ρξόλν
απνθαηάζηαζεο λα θπκαίλεηαη κόιηο ζε ts = 2sec, ελώ ζηε κόληκε απόθξηζε παξνπζηάδεηαη ειάρηζην ζθάικα
ηεο ηάμεσο ηνπ Γσss=-0.0017pu, γεγνλόο πνπ αλαδεηθλύεη ηα πιενλεθηήκαηα ηεο πξνηεηλόκελεο ζρεδίαζεο.
2.2.5 Έιεγρνο ηάζεσο - αέξγνπ ηζρύνο Η/Γ απηόλνκνπ ΗΔ πινίνπ κε AVR
Ζ αύμεζε ζηε δεηνύκελε άεξγν ηζρύ από ην θνξηίν, νδεγεί ζε πηώζε ηάζεο ζηα άθξα ηεο Ζ/Γ. Ζ ηάζε
ιακβάλεηαη από ην κεηαζρεκαηηζηή ηάζεο πνπ είλαη ζπλδεδεκέλνο ζε κία θάζε ηεο Ζ/Γ, αλνξζώλεηαη θαη
ζπγθξίλεηαη κε κηα dc ηηκή αλαθνξάο. Σν εληζρπκέλν ζθάικα ειέγρεη ηελ ηάζε πνπ εθαξκόδεηαη ζην
ηύιηγκα πεδίνπ ηεο δηεγέξηξηαο πνπ βξίζθεηαη ζην ζηάηε ηεο Ζ/Γ θαη άξα ηελ ελαιιαζζόκελε ηάζε πνπ
επάγεηαη ζην ηύιηγκα ηπκπάλνπ ηεο δηεγέξηξηαο πνπ είλαη ηνπνζεηεκέλν ζην δξνκέα ηεο Ζ/Γ. Ζ επαγόκελε
ηάζε αλνξζώλεηαη θαη απμάλεη ην dc ξεύκα πνπ εθαξκόδεηαη ζην ηύιηγκα πεδίνπ ηεο Ζ/Γ, ην νπνίν νδεγεί
ζε αύμεζε ζηελ παξαγόκελε ειεθηξεγεξηηθή δύλακε κε απνηέιεζκα ηελ αύμεζε ηεο ηάζεο ζηα άθξα ηεο Ζ/Γ.
Ζ δηάηαμε πνπ δηαηεξεί ζηαζεξή ηελ ηάζε ζηα άθξα ηεο Ζ/Γ είλαη ν απηόκαηνο ξπζκηζηήο ηάζεο (AVR), ηνπ
νπνίνπ ην απινπνηεκέλν δνκηθό δηάγξακκα παξνπζηάδεηαη ζην ρ. 2.10, ελώ ε ηππηθή πινπνίεζε ηνπ ΑVR
ζην πινίν ππό κειέηε αλαθέξζεθε ζην ρ. 1.18. ηελ ελόηεηα απηή ζα εμεηαζηεί ε απόθξηζε ηνπ ηππηθνύ
ζπζηήκαηνο ΑVR-δηεγέξηξηαο, έηζη ώζηε λα γίλνπλ αληηιεπηνί νη παξάγνληεο πνπ επεξεάδνπλ ηελ απόδνζε
ηνπ θαη λα ιεθζνύλ ππόςε θαηά ην ζρεδηαζκό ηνπ πξνηεηλόκελνπ ζπζηήκαηνο [6]-[8].
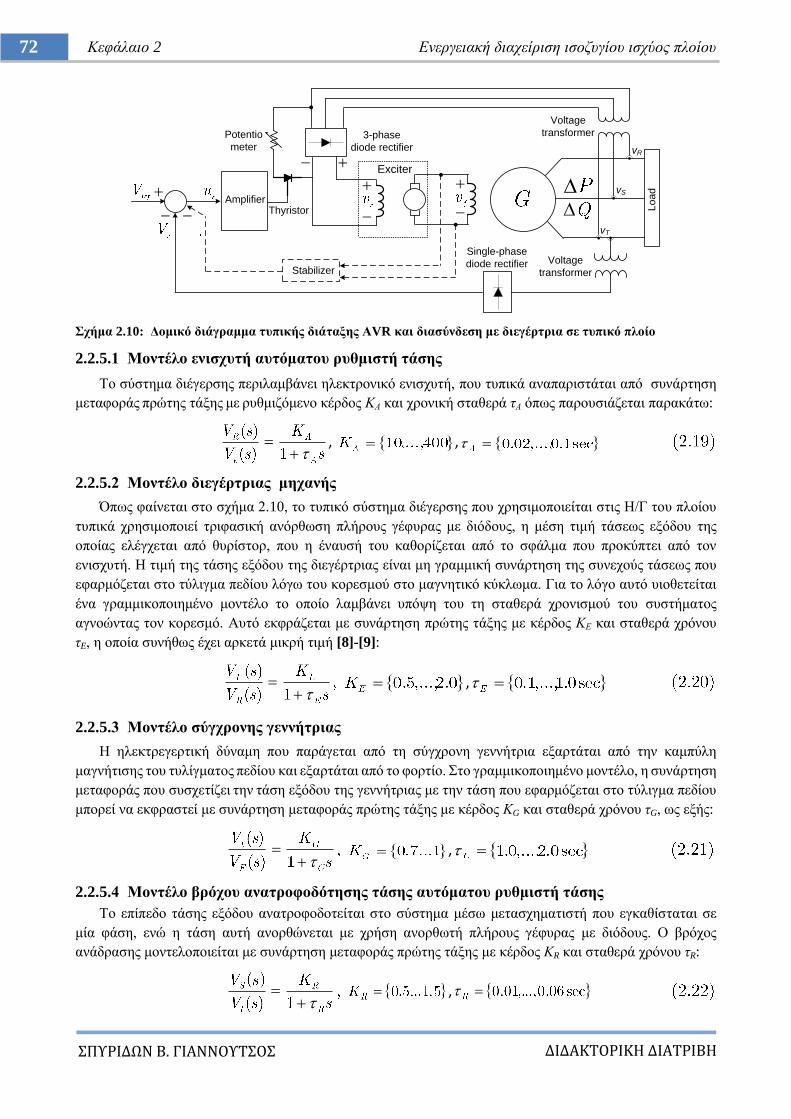
ΔΙΔΑΚΣΟΡΙΚΗ ΔΙΑΣΡΙΒΗ
ΠΤΡΙΔΩΝ Β. ΓΙΑΝΝΟΤΣΟ
72 Κεθάιαην 2 Δλεξγεηαθή δηαρείξηζε ηζνδπγίνπ ηζρύνο πινίνπ
ρήκα 2.10: Γνκηθό δηάγξακκα ηππηθήο δηάηαμεο ΑVR θαη δηαζύλδεζε κε δηεγέξηξηα ζε ηππηθό πινίν
2.2.5.1 Μνληέιν εληζρπηή απηόκαηνπ ξπζκηζηή ηάζεο
Σν ζύζηεκα δηέγεξζεο πεξηιακβάλεη ειεθηξνληθό εληζρπηή, πνπ ηππηθά αλαπαξηζηάηαη από ζπλάξηεζε
κεηαθνξάο πξώηεο ηάμεο κε ξπζκηδόκελν θέξδνο ΚΑ θαη ρξνληθή ζηαζεξά ηΑ όπσο παξνπζηάδεηαη παξαθάησ:
, ,
2.2.5.2 Μνληέιν δηεγέξηξηαο κεραλήο
Όπσο θαίλεηαη ζην ζρήκα 2.10, ην ηππηθό ζύζηεκα δηέγεξζεο πνπ ρξεζηκνπνηείηαη ζηηο Ζ/Γ ηνπ πινίνπ
ηππηθά ρξεζηκνπνηεί ηξηθαζηθή αλόξζσζε πιήξνπο γέθπξαο κε δηόδνπο, ε κέζε ηηκή ηάζεσο εμόδνπ ηεο
νπνίαο ειέγρεηαη από ζπξίζηνξ, πνπ ε έλαπζή ηνπ θαζνξίδεηαη από ην ζθάικα πνπ πξνθύπηεη από ηνλ
εληζρπηή. Ζ ηηκή ηεο ηάζεο εμόδνπ ηεο δηεγέξηξηαο είλαη κε γξακκηθή ζπλάξηεζε ηεο ζπλερνύο ηάζεσο πνπ
εθαξκόδεηαη ζην ηύιηγκα πεδίνπ ιόγσ ηνπ θνξεζκνύ ζην καγλεηηθό θύθισκα. Γηα ην ιόγν απηό πηνζεηείηαη
έλα γξακκηθνπνηεκέλν κνληέιν ην νπνίν ιακβάλεη ππόςε ηνπ ηε ζηαζεξά ρξνληζκνύ ηνπ ζπζηήκαηνο
αγλνώληαο ηνλ θνξεζκό. Απηό εθθξάδεηαη κε ζπλάξηεζε πξώηεο ηάμεο κε θέξδνο ΚΔ θαη ζηαζεξά ρξόλνπ
ηE, ε νπνία ζπλήζσο έρεη αξθεηά κηθξή ηηκή [8]-[9]:
,
2.2.5.3 Μνληέιν ζύγρξνλεο γελλήηξηαο
Ζ ειεθηξεγεξηηθή δύλακε πνπ παξάγεηαη από ηε ζύγρξνλε γελλήηξηα εμαξηάηαη από ηελ θακπύιε
καγλήηηζεο ηνπ ηπιίγκαηνο πεδίνπ θαη εμαξηάηαη από ην θνξηίν. ην γξακκηθνπνηεκέλν κνληέιν, ε ζπλάξηεζε
κεηαθνξάο πνπ ζπζρεηίδεη ηελ ηάζε εμόδνπ ηεο γελλήηξηαο κε ηελ ηάζε πνπ εθαξκόδεηαη ζην ηύιηγκα πεδίνπ
κπνξεί λα εθθξαζηεί κε ζπλάξηεζε κεηαθνξάο πξώηεο ηάμεο κε θέξδνο ΚG θαη ζηαζεξά ρξόλνπ ηG, σο εμήο:
,
2.2.5.4 Μνληέιν βξόρνπ αλαηξνθνδόηεζεο ηάζεο απηόκαηνπ ξπζκηζηή ηάζεο
Σν επίπεδν ηάζεο εμόδνπ αλαηξνθνδνηείηαη ζην ζύζηεκα κέζσ κεηαζρεκαηηζηή πνπ εγθαζίζηαηαη ζε
κία θάζε, ελώ ε ηάζε απηή αλνξζώλεηαη κε ρξήζε αλνξζσηή πιήξνπο γέθπξαο κε δηόδνπο. Ο βξόρνο
αλάδξαζεο κνληεινπνηείηαη κε ζπλάξηεζε κεηαθνξάο πξώηεο ηάμεο κε θέξδνο ΚR θαη ζηαζεξά ρξόλνπ ηR:
,
Stabilizer
Amplifier
Exciter
Single-phase
diode rectifier Voltage
transformer
Lo
ad
Potentio
meter3-phase
diode rectifier
Thyristor
Voltage
transformer
vR
vS
vT
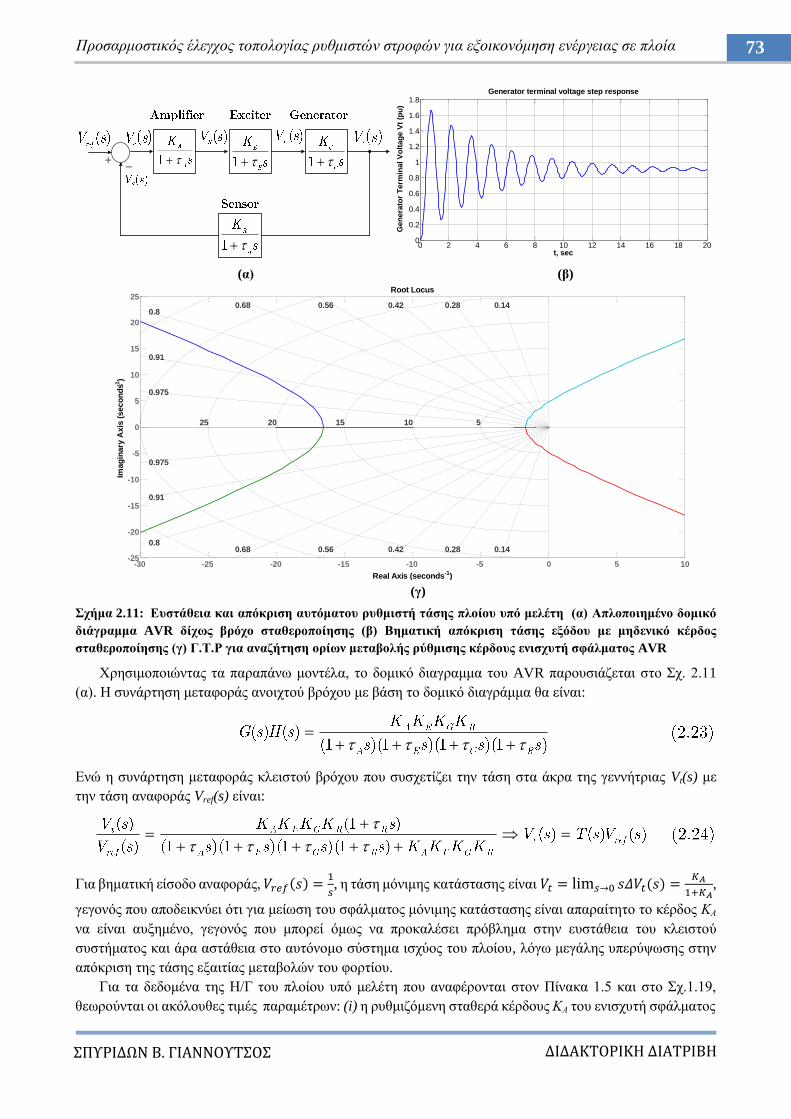
ΔΙΔΑΚΣΟΡΙΚΗ ΔΙΑΣΡΙΒΗ
ΠΤΡΙΔΩΝ Β. ΓΙΑΝΝΟΤΣΟ
73 Πξνζαξκνζηηθόο έιεγρνο ηνπνινγίαο ξπζκηζηώλ ζηξνθώλ γηα εμνηθνλόκεζε ελέξγεηαο ζε πινία
(α) (β)
(γ)
ρήκα 2.11: Δπζηάζεηα θαη απόθξηζε απηόκαηνπ ξπζκηζηή ηάζεο πινίνπ ππό κειέηε (α) Απινπνηεκέλν δνκηθό
δηάγξακκα AVR δίρσο βξόρν ζηαζεξνπνίεζεο (β) Βεκαηηθή απόθξηζε ηάζεο εμόδνπ κε κεδεληθό θέξδνο
ζηαζεξνπνίεζεο (γ) Γ.Σ.Ρ γηα αλαδήηεζε νξίσλ κεηαβνιήο ξύζκηζεο θέξδνπο εληζρπηή ζθάικαηνο AVR
Υξεζηκνπνηώληαο ηα παξαπάλσ κνληέια, ην δνκηθό δηαγξακκα ηνπ AVR παξνπζηάδεηαη ζην ρ. 2.11
(α). Ζ ζπλάξηεζε κεηαθνξάο αλνηρηνύ βξόρνπ κε βάζε ην δνκηθό δηαγξάκκα ζα είλαη:
Δλώ ε ζπλάξηεζε κεηαθνξάο θιεηζηνύ βξόρνπ πνπ ζπζρεηίδεη ηελ ηάζε ζηα άθξα ηεο γελλήηξηαο Vt(s) κε
ηελ ηάζε αλαθνξάο Vref(s) είλαη:
Γηα βεκαηηθή είζνδν αλαθνξάο,
, ε ηάζε κόληκεο θαηάζηαζεο είλαη
,
γεγνλόο πνπ απνδεηθλύεη όηη γηα κείσζε ηνπ ζθάικαηνο κόληκεο θαηάζηαζεο είλαη απαξαίηεην ην θέξδνο ΚΑ
λα είλαη απμεκέλν, γεγνλόο πνπ κπνξεί όκσο λα πξνθαιέζεη πξόβιεκα ζηελ επζηάζεηα ηνπ θιεηζηνύ
ζπζηήκαηνο θαη άξα αζηάζεηα ζην απηόλνκν ζύζηεκα ηζρύνο ηνπ πινίνπ, ιόγσ κεγάιεο ππεξύςσζεο ζηελ
απόθξηζε ηεο ηάζεο εμαηηίαο κεηαβνιώλ ηνπ θνξηίνπ.
Γηα ηα δεδνκέλα ηεο Ζ/Γ ηνπ πινίνπ ππό κειέηε πνπ αλαθέξνληαη ζηνλ Πίλαθα 1.5 θαη ζην ρ.1.19,
ζεσξνύληαη νη αθόινπζεο ηηκέο παξακέηξσλ: (i) ε ξπζκηδόκελε ζηαζεξά θέξδνπο ΚΑ ηνπ εληζρπηή ζθάικαηνο
0 2 4 6 8 10 12 14 16 18 200
0.2
0.4
0.6
0.8
1
1.2
1.4
1.6
1.8
t, sec
Generator terminal voltage step response
Gen
era
tor
Term
inal V
olt
ag
e V
t (p
u)
-30 -25 -20 -15 -10 -5 0 5 10-25
-20
-15
-10
-5
0
5
10
15
20
25
0.8
0.91
0.975
0.140.280.420.560.680.8
0.91
0.975
51015202530
0.140.280.420.560.68
Root Locus
Real Axis (seconds-1)
Imag
inary
Axis
(seco
nd
s-1)
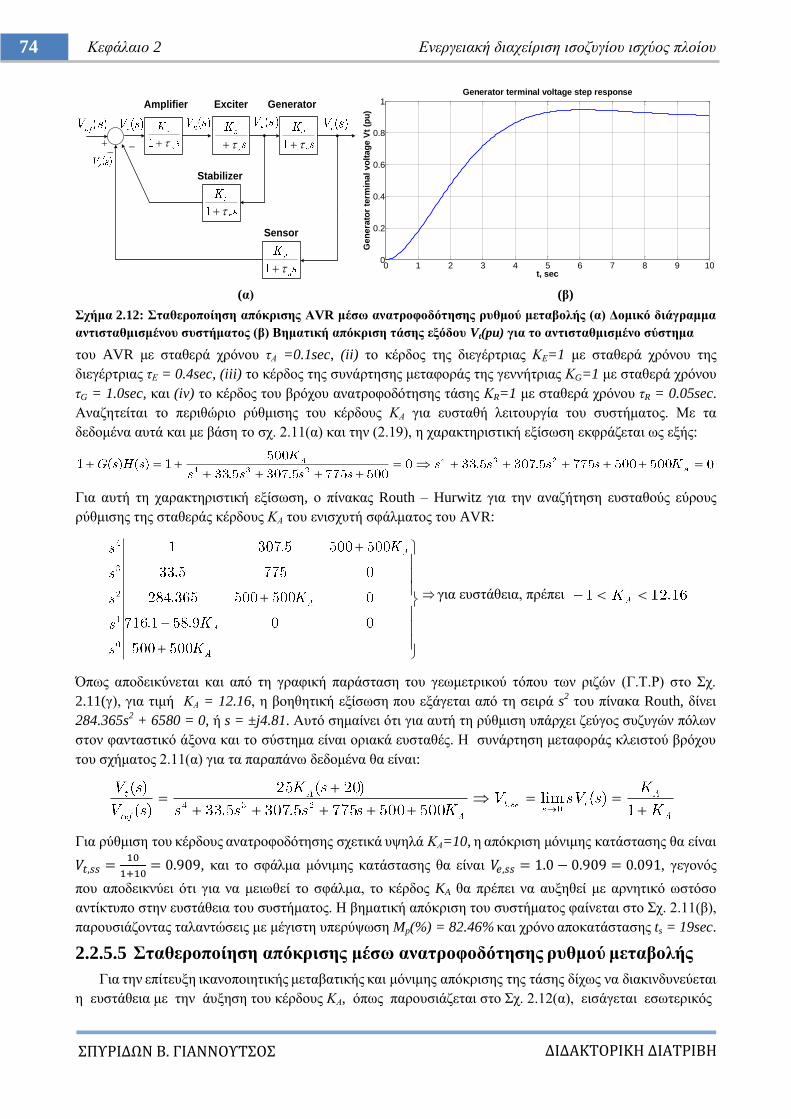
ΔΙΔΑΚΣΟΡΙΚΗ ΔΙΑΣΡΙΒΗ
ΠΤΡΙΔΩΝ Β. ΓΙΑΝΝΟΤΣΟ
74 Κεθάιαην 2 Δλεξγεηαθή δηαρείξηζε ηζνδπγίνπ ηζρύνο πινίνπ
(α) (β)
ρήκα 2.12: ηαζεξνπνίεζε απόθξηζεο ΑVR κέζσ αλαηξνθνδόηεζεο ξπζκνύ κεηαβνιήο (α) Γνκηθό δηάγξακκα
αληηζηαζκηζκέλνπ ζπζηήκαηνο (β) Βεκαηηθή απόθξηζε ηάζεο εμόδνπ Vt(pu) γηα ην αληηζηαζκηζκέλν ζύζηεκα
ηνπ AVR κε ζηαζεξά ρξόλνπ ηΑ =0.1sec, (ii) ην θέξδνο ηεο δηεγέξηξηαο ΚΔ=1 κε ζηαζεξά ρξόλνπ ηεο
δηεγέξηξηαο ηΔ = 0.4sec, (iii) ην θέξδνο ηεο ζπλάξηεζεο κεηαθνξάο ηεο γελλήηξηαο ΚG=1 κε ζηαζεξά ρξόλνπ
ηG = 1.0sec, θαη (iv) ην θέξδνο ηνπ βξόρνπ αλαηξνθνδόηεζεο ηάζεο ΚR=1 κε ζηαζεξά ρξόλνπ ηR = 0.05sec.
Αλαδεηείηαη ην πεξηζώξην ξύζκηζεο ηνπ θέξδνπο ΚΑ γηα επζηαζή ιεηηνπξγία ηνπ ζπζηήκαηνο. Με ηα
δεδνκέλα απηά θαη κε βάζε ην ζρ. 2.11(α) θαη ηελ (2.19), ε ραξαθηεξηζηηθή εμίζσζε εθθξάδεηαη σο εμήο:
Γηα απηή ηε ραξαθηεξηζηηθή εμίζσζε, ν πίλαθαο Routh – Hurwitz γηα ηελ αλαδήηεζε επζηαζνύο εύξνπο
ξύζκηζεο ηεο ζηαζεξάο θέξδνπο ΚΑ ηνπ εληζρπηή ζθάικαηνο ηνπ AVR:
γηα επζηάζεηα, πξέπεη
Όπσο απνδεηθύλεηαη θαη από ηε γξαθηθή παξάζηαζε ηνπ γεσκεηξηθνύ ηόπνπ ησλ ξηδώλ (Γ.Σ.Ρ) ζην ρ.
2.11(γ), γηα ηηκή ΚΑ = 12.16, ε βνεζεηηθή εμίζσζε πνπ εμάγεηαη από ηε ζεηξά s2 ηνπ πίλαθα Routh, δίλεη
284.365s2 + 6580 = 0, ή s = ±j4.81. Απηό ζεκαίλεη όηη γηα απηή ηε ξύζκηζε ππάξρεη δεύγνο ζπδπγώλ πόισλ
ζηνλ θαληαζηηθό άμνλα θαη ην ζύζηεκα είλαη νξηαθά επζηαζέο. Ζ ζπλάξηεζε κεηαθνξάο θιεηζηνύ βξόρνπ
ηνπ ζρήκαηνο 2.11(α) γηα ηα παξαπάλσ δεδνκέλα ζα είλαη:
Γηα ξύζκηζε ηνπ θέξδνπο αλαηξνθνδόηεζεο ζρεηηθά πςειά ΚΑ=10, ε απόθξηζε κόληκεο θαηάζηαζεο ζα είλαη
, θαη ην ζθάικα κόληκεο θαηάζηαζεο ζα είλαη , γεγνλόο
πνπ απνδεηθλύεη όηη γηα λα κεησζεί ην ζθάικα, ην θέξδνο KA ζα πξέπεη λα απμεζεί κε αξλεηηθό σζηόζν
αληίθηππν ζηελ επζηάζεηα ηνπ ζπζηήκαηνο. Ζ βεκαηηθή απόθξηζε ηνπ ζπζηήκαηνο θαίλεηαη ζην ρ. 2.11(β),
παξνπζηάδνληαο ηαιαληώζεηο κε κέγηζηε ππεξύςσζε Mp(%) = 82.46% θαη ρξόλν απνθαηάζηαζεο ts = 19sec.
2.2.5.5 ηαζεξνπνίεζε απόθξηζεο κέζσ αλαηξνθνδόηεζεο ξπζκνύ κεηαβνιήο
Γηα ηελ επίηεπμε ηθαλνπνηεηηθήο κεηαβαηηθήο θαη κόληκεο απόθξηζεο ηεο ηάζεο δίρσο λα δηαθηλδπλεύεηαη
ε επζηάζεηα κε ηελ άπμεζε ηνπ θέξδνπο ΚΑ, όπσο παξνπζηάδεηαη ζην ρ. 2.12(α), εηζάγεηαη εζσηεξηθόο
Amplifier Exciter Generator
Sensor
Stabilizer
0 1 2 3 4 5 6 7 8 9 100
0.2
0.4
0.6
0.8
1
t, sec
Generator terminal voltage step response
Gen
era
tor
term
inal vo
ltag
e V
t (p
u)
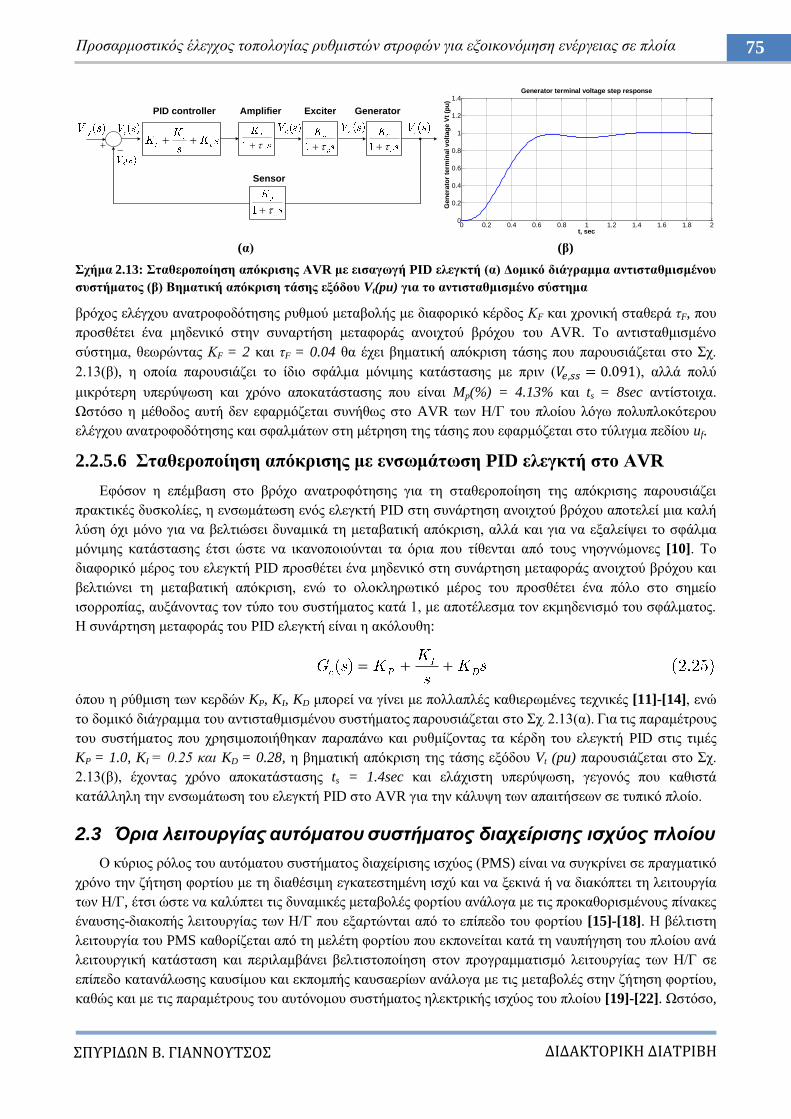
ΔΙΔΑΚΣΟΡΙΚΗ ΔΙΑΣΡΙΒΗ
ΠΤΡΙΔΩΝ Β. ΓΙΑΝΝΟΤΣΟ
75 Πξνζαξκνζηηθόο έιεγρνο ηνπνινγίαο ξπζκηζηώλ ζηξνθώλ γηα εμνηθνλόκεζε ελέξγεηαο ζε πινία
(α) (β)
ρήκα 2.13: ηαζεξνπνίεζε απόθξηζεο ΑVR κε εηζαγσγή PID ειεγθηή (α) Γνκηθό δηάγξακκα αληηζηαζκηζκέλνπ
ζπζηήκαηνο (β) Βεκαηηθή απόθξηζε ηάζεο εμόδνπ Vt(pu) γηα ην αληηζηαζκηζκέλν ζύζηεκα
βξόρνο ειέγρνπ αλαηξνθνδόηεζεο ξπζκνύ κεηαβνιήο κε δηαθνξηθό θέξδνο ΚF θαη ρξνληθή ζηαζεξά ηF, πνπ
πξνζζέηεη έλα κεδεληθό ζηελ ζπλαξηήζε κεηαθνξάο αλνηρηνύ βξόρνπ ηνπ AVR. Σν αληηζηαζκηζκέλν
ζύζηεκα, ζεσξώληαο ΚF = 2 θαη ηF = 0.04 ζα έρεη βεκαηηθή απόθξηζε ηάζεο πνπ παξνπζηάδεηαη ζην ρ.
2.13(β), ε νπνία παξνπζηάδεη ην ίδην ζθάικα κόληκεο θαηάζηαζεο κε πξηλ ( ), αιιά πνιύ
κηθξόηεξε ππεξύςσζε θαη ρξόλν απνθαηάζηαζεο πνπ είλαη Mp(%) = 4.13% θαη ts = 8sec αληίζηνηρα.
Χζηόζν ε κέζνδνο απηή δελ εθαξκόδεηαη ζπλήζσο ζην AVR ησλ Ζ/Γ ηνπ πινίνπ ιόγσ πνιππινθόηεξνπ
ειέγρνπ αλαηξνθνδόηεζεο θαη ζθαικάησλ ζηε κέηξεζε ηεο ηάζεο πνπ εθαξκόδεηαη ζην ηύιηγκα πεδίνπ uf.
2.2.5.6 ηαζεξνπνίεζε απόθξηζεο κε ελζσκάησζε PID ειεγθηή ζην ΑVR
Δθόζνλ ε επέκβαζε ζην βξόρν αλαηξνθόηεζεο γηα ηε ζηαζεξνπνίεζε ηεο απόθξηζεο παξνπζηάδεη
πξαθηηθέο δπζθνιίεο, ε ελζσκάησζε ελόο ειεγθηή PID ζηε ζπλάξηεζε αλνηρηνύ βξόρνπ απνηειεί κηα θαιή
ιύζε όρη κόλν γηα λα βειηηώζεη δπλακηθά ηε κεηαβαηηθή απόθξηζε, αιιά θαη γηα λα εμαιείςεη ην ζθάικα
κόληκεο θαηάζηαζεο έηζη ώζηε λα ηθαλνπνηνύληαη ηα όξηα πνπ ηίζεληαη από ηνπο λενγλώκνλεο [10]. Σν
δηαθνξηθό κέξνο ηνπ ειεγθηή PID πξνζζέηεη έλα κεδεληθό ζηε ζπλάξηεζε κεηαθνξάο αλνηρηνύ βξόρνπ θαη
βειηηώλεη ηε κεηαβαηηθή απόθξηζε, ελώ ην νινθιεξσηηθό κέξνο ηνπ πξνζζέηεη έλα πόιν ζην ζεκείν
ηζνξξνπίαο, απμάλνληαο ηνλ ηύπν ηνπ ζπζηήκαηνο θαηά 1, κε απνηέιεζκα ηνλ εθκεδεληζκό ηνπ ζθάικαηνο.
Ζ ζπλάξηεζε κεηαθνξάο ηνπ PID ειεγθηή είλαη ε αθόινπζε:
όπνπ ε ξύζκηζε ησλ θεξδώλ KP, KI, KD κπνξεί λα γίλεη κε πνιιαπιέο θαζηεξσκέλεο ηερληθέο [11]-[14], ελώ
ην δνκηθό δηάγξακκα ηνπ αληηζηαζκηζκέλνπ ζπζηήκαηνο παξνπζηάδεηαη ζην ρ. 2.13(α). Γηα ηηο παξακέηξνπο
ηνπ ζπζηήκαηνο πνπ ρξεζηκνπνηήζεθαλ παξαπάλσ θαη ξπζκίδνληαο ηα θέξδε ηνπ ειεγθηή PID ζηηο ηηκέο
KP = 1.0, KI = 0.25 θαη KD = 0.28, ε βεκαηηθή απόθξηζε ηεο ηάζεο εμόδνπ Vt (pu) παξνπζηάδεηαη ζην ρ.
2.13(β), έρνληαο ρξόλν απνθαηάζηαζεο ts = 1.4sec θαη ειάρηζηε ππεξύςσζε, γεγνλόο πνπ θαζηζηά
θαηάιιειε ηελ ελζσκάησζε ηνπ ειεγθηή PID ζην AVR γηα ηελ θάιπςε ησλ απαηηήζεσλ ζε ηππηθό πινίν.
2.3 Όπια λειηοςπγίαρ αςηόμαηος ζςζηήμαηορ διασείπιζηρ ιζσύορ πλοίος
Ο θύξηνο ξόινο ηνπ απηόκαηνπ ζπζηήκαηνο δηαρείξηζεο ηζρύνο (PMS) είλαη λα ζπγθξίλεη ζε πξαγκαηηθό
ρξόλν ηελ δήηεζε θνξηίνπ κε ηε δηαζέζηκε εγθαηεζηεκέλε ηζρύ θαη λα μεθηλά ή λα δηαθόπηεη ηε ιεηηνπξγία
ησλ Ζ/Γ, έηζη ώζηε λα θαιύπηεη ηηο δπλακηθέο κεηαβνιέο θνξηίνπ αλάινγα κε ηηο πξνθαζνξηζκέλνπο πίλαθεο
έλαπζεο-δηαθνπήο ιεηηνπξγίαο ησλ Ζ/Γ πνπ εμαξηώληαη από ην επίπεδν ηνπ θνξηίνπ [15]-[18]. Ζ βέιηηζηε
ιεηηνπξγία ηνπ PMS θαζνξίδεηαη από ηε κειέηε θνξηίνπ πνπ εθπνλείηαη θαηά ηε λαππήγεζε ηνπ πινίνπ αλά
ιεηηνπξγηθή θαηάζηαζε θαη πεξηιακβάλεη βειηηζηνπνίεζε ζηνλ πξνγξακκαηηζκό ιεηηνπξγίαο ησλ Ζ/Γ ζε
επίπεδν θαηαλάισζεο θαπζίκνπ θαη εθπνκπήο θαπζαεξίσλ αλάινγα κε ηηο κεηαβνιέο ζηελ δήηεζε θνξηίνπ,
θαζώο θαη κε ηηο παξακέηξνπο ηνπ απηόλνκνπ ζπζηήκαηνο ειεθηξηθήο ηζρύνο ηνπ πινίνπ [19]-[22]. Χζηόζν,
Amplifier Exciter Generator
Sensor
PID controller
0 0.2 0.4 0.6 0.8 1 1.2 1.4 1.6 1.8 20
0.2
0.4
0.6
0.8
1
1.2
1.4Generator terminal voltage step response
t, sec
Gen
era
tor
term
inal vo
ltag
e V
t (p
u)
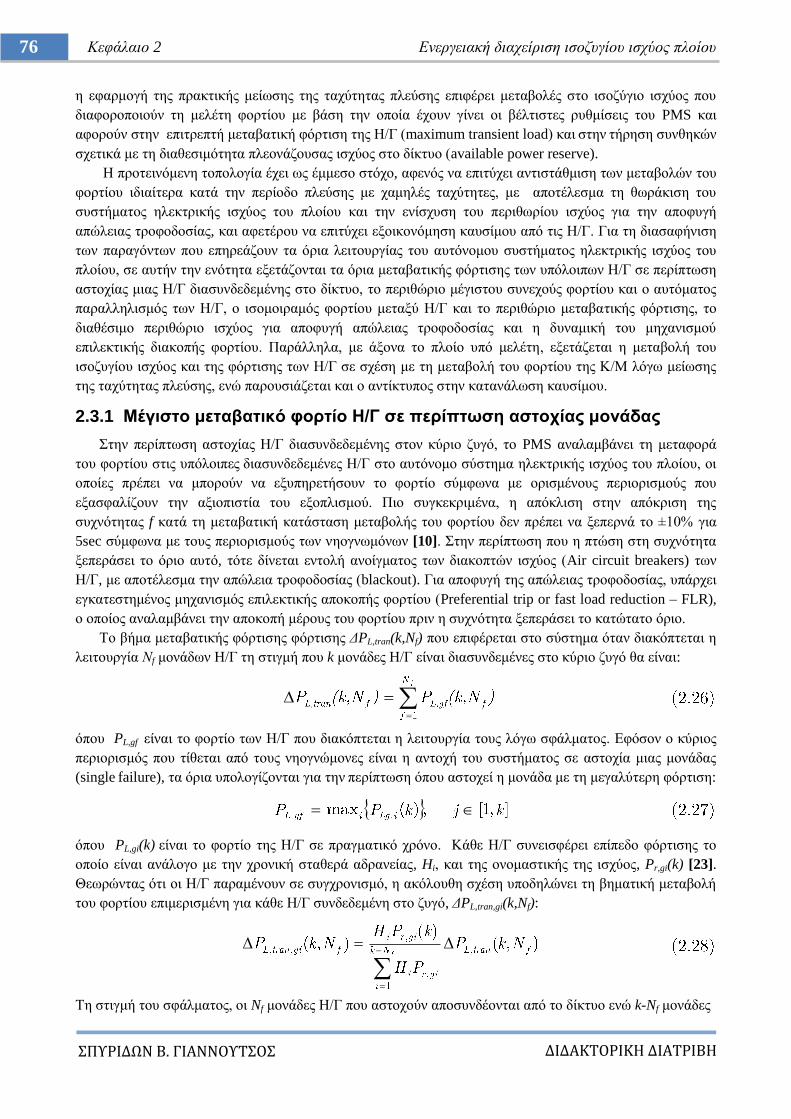
ΔΙΔΑΚΣΟΡΙΚΗ ΔΙΑΣΡΙΒΗ
ΠΤΡΙΔΩΝ Β. ΓΙΑΝΝΟΤΣΟ
76 Κεθάιαην 2 Δλεξγεηαθή δηαρείξηζε ηζνδπγίνπ ηζρύνο πινίνπ
ε εθαξκνγή ηεο πξαθηηθήο κείσζεο ηεο ηαρύηεηαο πιεύζεο επηθέξεη κεηαβνιέο ζην ηζνδύγην ηζρύνο πνπ
δηαθνξνπνηνύλ ηε κειέηε θνξηίνπ κε βάζε ηελ νπνία έρνπλ γίλεη νη βέιηηζηεο ξπζκίζεηο ηνπ PMS θαη
αθνξνύλ ζηελ επηηξεπηή κεηαβαηηθή θόξηηζε ηεο Ζ/Γ (maximum transient load) θαη ζηελ ηήξεζε ζπλζεθώλ
ζρεηηθά κε ηε δηαζεζηκόηεηα πιενλάδνπζαο ηζρύνο ζην δίθηπν (available power reserve).
Ζ πξνηεηλόκελε ηνπνινγία έρεη σο έκκεζν ζηόρν, αθελόο λα επηηύρεη αληηζηάζκηζε ησλ κεηαβνιώλ ηνπ
θνξηίνπ ηδηαίηεξα θαηά ηελ πεξίνδν πιεύζεο κε ρακειέο ηαρύηεηεο, κε απνηέιεζκα ηε ζσξάθηζε ηνπ
ζπζηήκαηνο ειεθηξηθήο ηζρύνο ηνπ πινίνπ θαη ηελ ελίζρπζε ηνπ πεξηζσξίνπ ηζρύνο γηα ηελ απνθπγή
απώιεηαο ηξνθνδνζίαο, θαη αθεηέξνπ λα επηηύρεη εμνηθνλόκεζε θαπζίκνπ από ηηο Ζ/Γ. Γηα ηε δηαζαθήληζε
ησλ παξαγόλησλ πνπ επεξεάδνπλ ηα όξηα ιεηηνπξγίαο ηνπ απηόλνκνπ ζπζηήκαηνο ειεθηξηθήο ηζρύνο ηνπ
πινίνπ, ζε απηήλ ηελ ελόηεηα εμεηάδνληαη ηα όξηα κεηαβαηηθήο θόξηηζεο ησλ ππόινηπσλ Ζ/Γ ζε πεξίπησζε
αζηνρίαο κηαο Ζ/Γ δηαζπλδεδεκέλεο ζην δίθηπν, ην πεξηζώξην κέγηζηνπ ζπλερνύο θνξηίνπ θαη ν απηόκαηνο
παξαιιειηζκόο ησλ Ζ/Γ, ν ηζνκνηξακόο θνξηίνπ κεηαμύ Ζ/Γ θαη ην πεξηζώξην κεηαβαηηθήο θόξηηζεο, ην
δηαζέζηκν πεξηζώξην ηζρύνο γηα απνθπγή απώιεηαο ηξνθνδνζίαο θαη ε δπλακηθή ηνπ κεραληζκνύ
επηιεθηηθήο δηαθνπήο θνξηίνπ. Παξάιιεια, κε άμνλα ην πινίν ππό κειέηε, εμεηάδεηαη ε κεηαβνιή ηνπ
ηζνδπγίνπ ηζρύνο θαη ηεο θόξηηζεο ησλ Ζ/Γ ζε ζρέζε κε ηε κεηαβνιή ηνπ θνξηίνπ ηεο Κ/Μ ιόγσ κείσζεο
ηεο ηαρύηεηαο πιεύζεο, ελώ παξνπζηάδεηαη θαη ν αληίθηππνο ζηελ θαηαλάισζε θαπζίκνπ.
2.3.1 Μέγηζην κεηαβαηηθό θνξηίν Η/Γ ζε πεξίπησζε αζηνρίαο κνλάδαο
ηελ πεξίπησζε αζηνρίαο Ζ/Γ δηαζπλδεδεκέλεο ζηνλ θύξην δπγό, ην PMS αλαιακβάλεη ηε κεηαθνξά
ηνπ θνξηίνπ ζηηο ππόινηπεο δηαζπλδεδεκέλεο Ζ/Γ ζην απηόλνκν ζύζηεκα ειεθηξηθήο ηζρύνο ηνπ πινίνπ, νη
νπνίεο πξέπεη λα κπνξνύλ λα εμππεξεηήζνπλ ην θνξηίν ζύκθσλα κε νξηζκέλνπο πεξηνξηζκνύο πνπ
εμαζθαιίδνπλ ηελ αμηνπηζηία ηνπ εμνπιηζκνύ. Πην ζπγθεθξηκέλα, ε απόθιηζε ζηελ απόθξηζε ηεο
ζπρλόηεηαο f θαηά ηε κεηαβαηηθή θαηάζηαζε κεηαβνιήο ηνπ θνξηίνπ δελ πξέπεη λα μεπεξλά ην ±10% γηα
5sec ζύκθσλα κε ηνπο πεξηνξηζκνύο ησλ λενγλσκόλσλ [10]. ηελ πεξίπησζε πνπ ε πηώζε ζηε ζπρλόηεηα
μεπεξάζεη ην όξην απηό, ηόηε δίλεηαη εληνιή αλνίγκαηνο ησλ δηαθνπηώλ ηζρύνο (Air circuit breakers) ησλ
Ζ/Γ, κε απνηέιεζκα ηελ απώιεηα ηξνθνδνζίαο (blackout). Γηα απνθπγή ηεο απώιεηαο ηξνθνδνζίαο, ππάξρεη
εγθαηεζηεκέλνο κεραληζκόο επηιεθηηθήο απνθνπήο θνξηίνπ (Preferential trip or fast load reduction – FLR),
ν νπνίνο αλαιακβάλεη ηελ απνθνπή κέξνπο ηνπ θνξηίνπ πξηλ ε ζπρλόηεηα μεπεξάζεη ην θαηώηαην όξην.
Σν βήκα κεηαβαηηθήο θόξηηζεο θόξηηζεο ΓPL,tran(k,Nf) πνπ επηθέξεηαη ζην ζύζηεκα όηαλ δηαθόπηεηαη ε
ιεηηνπξγία Νf κνλάδσλ Ζ/Γ ηε ζηηγκή πνπ k κνλάδεο Ζ/Γ είλαη δηαζπλδεκέλεο ζην θύξην δπγό ζα είλαη:
όπνπ PL,gf είλαη ην θνξηίν ησλ Ζ/Γ πνπ δηαθόπηεηαη ε ιεηηνπξγία ηνπο ιόγσ ζθάικαηνο. Δθόζνλ ν θύξηνο
πεξηνξηζκόο πνπ ηίζεηαη από ηνπο λενγλώκνλεο είλαη ε αληνρή ηνπ ζπζηήκαηνο ζε αζηνρία κηαο κνλάδαο
(single failure), ηα όξηα ππνινγίδνληαη γηα ηελ πεξίπησζε όπνπ αζηνρεί ε κνλάδα κε ηε κεγαιύηεξε θόξηηζε:
όπνπ PL,gi(k) είλαη ην θνξηίν ηεο Ζ/Γ ζε πξαγκαηηθό ρξόλν. Κάζε Ζ/Γ ζπλεηζθέξεη επίπεδν θόξηηζεο ην
νπνίν είλαη αλάινγν κε ηελ ρξνληθή ζηαζεξά αδξαλείαο, Hi, θαη ηεο νλνκαζηηθήο ηεο ηζρύνο, Pr,gi(k) [23].
Θεσξώληαο όηη νη Ζ/Γ παξακέλνπλ ζε ζπγρξνληζκό, ε αθόινπζε ζρέζε ππνδειώλεη ηε βεκαηηθή κεηαβνιή
ηνπ θνξηίνπ επηκεξηζκέλε γηα θάζε Ζ/Γ ζπλδεδεκέλε ζην δπγό, ΓPL,tran,gi(k,Nf):
Σε ζηηγκή ηνπ ζθάικαηνο, νη Nf κνλάδεο Ζ/Γ πνπ αζηνρνύλ απνζπλδένληαη από ην δίθηπν ελώ k-Nf κνλάδεο
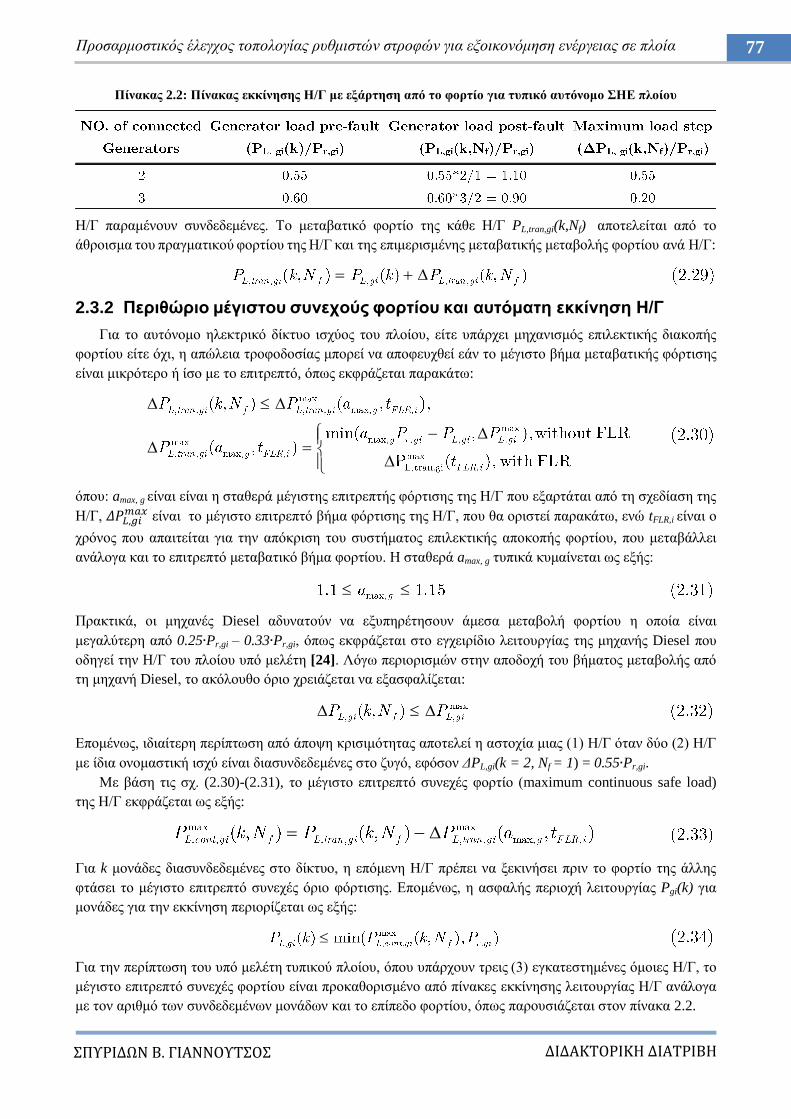
ΔΙΔΑΚΣΟΡΙΚΗ ΔΙΑΣΡΙΒΗ
ΠΤΡΙΔΩΝ Β. ΓΙΑΝΝΟΤΣΟ
77 Πξνζαξκνζηηθόο έιεγρνο ηνπνινγίαο ξπζκηζηώλ ζηξνθώλ γηα εμνηθνλόκεζε ελέξγεηαο ζε πινία
Πίλαθαο 2.2: Πίλαθαο εθθίλεζεο Η/Γ κε εμάξηεζε από ην θνξηίν γηα ηππηθό απηόλνκν ΗΔ πινίνπ
Ζ/Γ παξακέλνπλ ζπλδεδεκέλεο. Σν κεηαβαηηθό θνξηίν ηεο θάζε Ζ/Γ PL,tran,gi(k,Nf) απνηειείηαη από ην
άζξνηζκα ηνπ πξαγκαηηθνύ θνξηίνπ ηεο Ζ/Γ θαη ηεο επηκεξηζκέλεο κεηαβαηηθήο κεηαβνιήο θνξηίνπ αλά Ζ/Γ:
2.3.2 Πεξηζώξην κέγηζηνπ ζπλερνύο θνξηίνπ θαη απηόκαηε εθθίλεζε Η/Γ
Γηα ην απηόλνκν ειεθηξηθό δίθηπν ηζρύνο ηνπ πινίνπ, είηε ππάξρεη κεραληζκόο επηιεθηηθήο δηαθνπήο
θνξηίνπ είηε όρη, ε απώιεηα ηξνθνδνζίαο κπνξεί λα απνθεπρζεί εάλ ην κέγηζην βήκα κεηαβαηηθήο θόξηηζεο
είλαη κηθξόηεξν ή ίζν κε ην επηηξεπηό, όπσο εθθξάδεηαη παξαθάησ:
όπνπ: amax, g είλαη είλαη ε ζηαζεξά κέγηζηεο επηηξεπηήο θόξηηζεο ηεο Ζ/Γ πνπ εμαξηάηαη από ηε ζρεδίαζε ηεο
Ζ/Γ, είλαη ην κέγηζην επηηξεπηό βήκα θόξηηζεο ηεο Ζ/Γ, πνπ ζα νξηζηεί παξαθάησ, ελώ tFLR,i είλαη ν
ρξόλνο πνπ απαηηείηαη γηα ηελ απόθξηζε ηνπ ζπζηήκαηνο επηιεθηηθήο απνθνπήο θνξηίνπ, πνπ κεηαβάιιεη
αλάινγα θαη ην επηηξεπηό κεηαβαηηθό βήκα θνξηίνπ. Ζ ζηαζεξά amax, g ηππηθά θπκαίλεηαη σο εμήο:
Πξαθηηθά, νη κεραλέο Diesel αδπλαηνύλ λα εμππεξέηεζνπλ άκεζα κεηαβνιή θνξηίνπ ε νπνία είλαη
κεγαιύηεξε από 0.25 Pr,gi – 0.33 Pr,gi, όπσο εθθξάδεηαη ζην εγρεηξίδην ιεηηνπξγίαο ηεο κεραλήο Diesel πνπ
νδεγεί ηελ Ζ/Γ ηνπ πινίνπ ππό κειέηε [24]. Λόγσ πεξηνξηζκώλ ζηελ απνδνρή ηνπ βήκαηνο κεηαβνιήο από
ηε κεραλή Diesel, ην αθόινπζν όξην ρξεηάδεηαη λα εμαζθαιίδεηαη:
Δπνκέλσο, ηδηαίηεξε πεξίπησζε από άπνςε θξηζηκόηεηαο απνηειεί ε αζηνρία κηαο (1) Ζ/Γ όηαλ δύν (2) Ζ/Γ
κε ίδηα νλνκαζηηθή ηζρύ είλαη δηαζπλδεδεκέλεο ζην δπγό, εθόζνλ ΓPL,gi(k = 2, Nf = 1) = 0.55 Pr,gi.
Με βάζε ηηο ζρ. (2.30)-(2.31), ην κέγηζην επηηξεπηό ζπλερέο θνξηίν (maximum continuous safe load)
ηεο Ζ/Γ εθθξάδεηαη σο εμήο:
Γηα k κνλάδεο δηαζπλδεδεκέλεο ζην δίθηπν, ε επόκελε Ζ/Γ πξέπεη λα μεθηλήζεη πξηλ ην θνξηίν ηεο άιιεο
θηάζεη ην κέγηζην επηηξεπηό ζπλερέο όξην θόξηηζεο. Δπνκέλσο, ε αζθαιήο πεξηνρή ιεηηνπξγίαο Pgi(k) γηα
κνλάδεο γηα ηελ εθθίλεζε πεξηνξίδεηαη σο εμήο:
Γηα ηελ πεξίπησζε ηνπ ππό κειέηε ηππηθνύ πινίνπ, όπνπ ππάξρνπλ ηξεηο (3) εγθαηεζηεκέλεο όκνηεο Ζ/Γ, ην
κέγηζην επηηξεπηό ζπλερέο θνξηίνπ είλαη πξνθαζνξηζκέλν από πίλαθεο εθθίλεζεο ιεηηνπξγίαο Ζ/Γ αλάινγα
κε ηνλ αξηζκό ησλ ζπλδεδεκέλσλ κνλάδσλ θαη ην επίπεδν θνξηίνπ, όπσο παξνπζηάδεηαη ζηνλ πίλαθα 2.2.
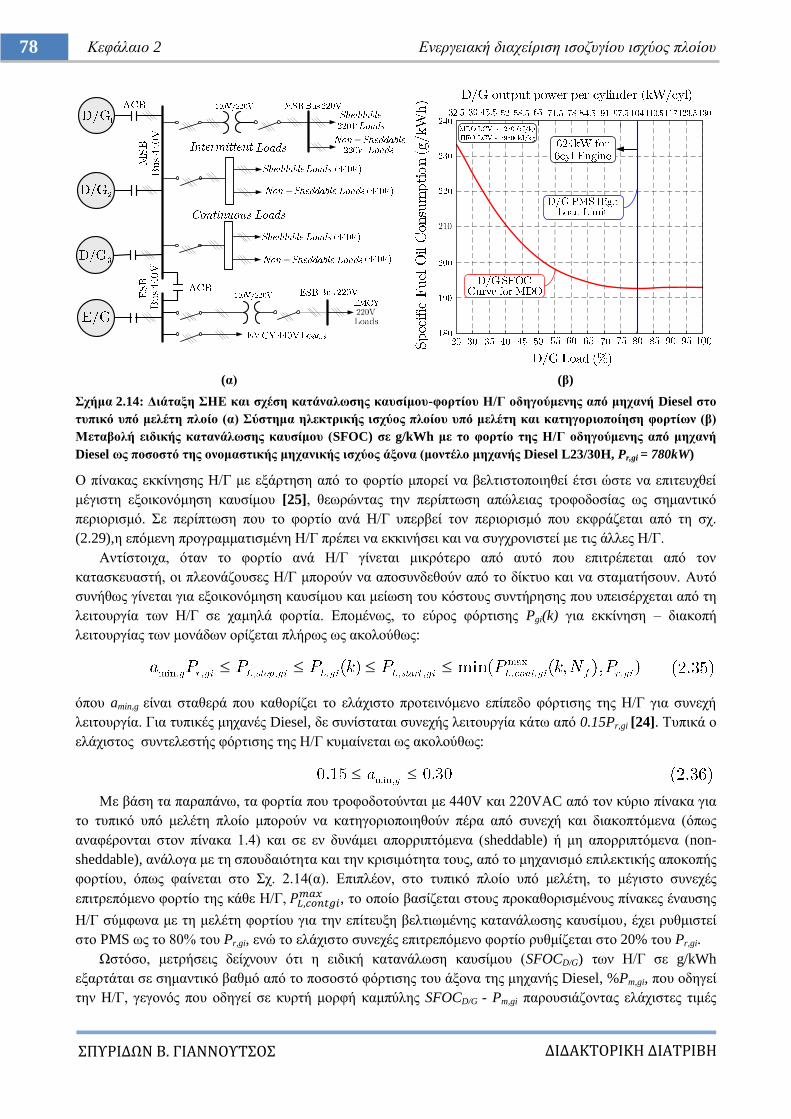
ΔΙΔΑΚΣΟΡΙΚΗ ΔΙΑΣΡΙΒΗ
ΠΤΡΙΔΩΝ Β. ΓΙΑΝΝΟΤΣΟ
78 Κεθάιαην 2 Δλεξγεηαθή δηαρείξηζε ηζνδπγίνπ ηζρύνο πινίνπ
(α) (β)
ρήκα 2.14: Γηάηαμε ΗΔ θαη ζρέζε θαηάλαισζεο θαπζίκνπ-θνξηίνπ Η/Γ νδεγνύκελεο από κεραλή Diesel ζην
ηππηθό ππό κειέηε πινίν (α) ύζηεκα ειεθηξηθήο ηζρύνο πινίνπ ππό κειέηε θαη θαηεγνξηνπνίεζε θνξηίσλ (β)
Μεηαβνιή εηδηθήο θαηαλάισζεο θαπζίκνπ (SFOC) ζε g/kWh κε ην θνξηίν ηεο Η/Γ νδεγνύκελεο από κεραλή
Diesel σο πνζνζηό ηεο νλνκαζηηθήο κεραληθήο ηζρύνο άμνλα (κνληέιν κεραλήο Diesel L23/30H, Pr,gi = 780kW)
Ο πίλαθαο εθθίλεζεο Ζ/Γ κε εμάξηεζε από ην θνξηίν κπνξεί λα βειηηζηνπνηεζεί έηζη ώζηε λα επηηεπρζεί
κέγηζηε εμνηθνλόκεζε θαπζίκνπ [25], ζεσξώληαο ηελ πεξίπησζε απώιεηαο ηξνθνδνζίαο σο ζεκαληηθό
πεξηνξηζκό. ε πεξίπησζε πνπ ην θνξηίν αλά Ζ/Γ ππεξβεί ηνλ πεξηνξηζκό πνπ εθθξάδεηαη από ηε ζρ.
(2.29),ε επόκελε πξνγξακκαηηζκέλε Ζ/Γ πξέπεη λα εθθηλήζεη θαη λα ζπγρξνληζηεί κε ηηο άιιεο Ζ/Γ.
Αληίζηνηρα, όηαλ ην θνξηίν αλά Ζ/Γ γίλεηαη κηθξόηεξν από απηό πνπ επηηξέπεηαη από ηνλ
θαηαζθεπαζηή, νη πιενλάδνπζεο Ζ/Γ κπνξνύλ λα απνζπλδεζνύλ από ην δίθηπν θαη λα ζηακαηήζνπλ. Απηό
ζπλήζσο γίλεηαη γηα εμνηθνλόκεζε θαπζίκνπ θαη κείσζε ηνπ θόζηνπο ζπληήξεζεο πνπ ππεηζέξρεηαη από ηε
ιεηηνπξγία ησλ Ζ/Γ ζε ρακειά θνξηία. Δπνκέλσο, ην εύξνο θόξηηζεο Pgi(k) γηα εθθίλεζε – δηαθνπή
ιεηηνπξγίαο ησλ κνλάδσλ νξίδεηαη πιήξσο σο αθνινύζσο:
όπνπ amin,g είλαη ζηαζεξά πνπ θαζνξίδεη ην ειάρηζην πξνηεηλόκελν επίπεδν θόξηηζεο ηεο Ζ/Γ γηα ζπλερή
ιεηηνπξγία. Γηα ηππηθέο κεραλέο Diesel, δε ζπλίζηαηαη ζπλερήο ιεηηνπξγία θάησ από 0.15Pr,gi [24]. Σππηθά ν
ειάρηζηνο ζπληειεζηήο θόξηηζεο ηεο Ζ/Γ θπκαίλεηαη σο αθνινύζσο:
Με βάζε ηα παξαπάλσ, ηα θνξηία πνπ ηξνθνδνηνύληαη κε 440V θαη 220VAC από ηνλ θύξην πίλαθα γηα
ην ηππηθό ππό κειέηε πινίν κπνξνύλ λα θαηεγνξηνπνηεζνύλ πέξα από ζπλερή θαη δηαθνπηόκελα (όπσο
αλαθέξνληαη ζηνλ πίλαθα 1.4) θαη ζε ελ δπλάκεη απνξξηπηόκελα (sheddable) ή κε απνξξηπηόκελα (non-
sheddable), αλάινγα κε ηε ζπνπδαηόηεηα θαη ηελ θξηζηκόηεηα ηνπο, από ην κεραληζκό επηιεθηηθήο απνθνπήο
θνξηίνπ, όπσο θαίλεηαη ζην ρ. 2.14(α). Δπηπιένλ, ζην ηππηθό πινίν ππό κειέηε, ην κέγηζην ζπλερέο
επηηξεπόκελν θνξηίν ηεο θάζε Ζ/Γ, , ην νπνίν βαζίδεηαη ζηνπο πξνθαζνξηζκέλνπο πίλαθεο έλαπζεο
Ζ/Γ ζύκθσλα κε ηε κειέηε θνξηίνπ γηα ηελ επίηεπμε βειηησκέλεο θαηαλάισζεο θαπζίκνπ, έρεη ξπζκηζηεί
ζην PMS σο ην 80% ηνπ Pr,gi, ελώ ην ειάρηζην ζπλερέο επηηξεπόκελν θνξηίν ξπζκίδεηαη ζην 20% ηνπ Pr,gi.
Χζηόζν, κεηξήζεηο δείρλνπλ όηη ε εηδηθή θαηαλάισζε θαπζίκνπ (SFOCD/G) ησλ Ζ/Γ ζε g/kWh
εμαξηάηαη ζε ζεκαληηθό βαζκό από ην πνζνζηό θόξηηζεο ηνπ άμνλα ηεο κεραλήο Diesel, %Pm,gi, πνπ νδεγεί
ηελ Ζ/Γ, γεγνλόο πνπ νδεγεί ζε θπξηή κνξθή θακπύιεο SFOCD/G - Pm,gi παξνπζηάδνληαο ειάρηζηεο ηηκέο
ΔΙΔΑΚΣΟΡΙΚΗ ΔΙΑΣΡΙΒΗ
ΠΤΡΙΔΩΝ Β. ΓΙΑΝΝΟΤΣΟ
79 Πξνζαξκνζηηθόο έιεγρνο ηνπνινγίαο ξπζκηζηώλ ζηξνθώλ γηα εμνηθνλόκεζε ελέξγεηαο ζε πινία
θνληά ζην 70% ηνπ Pr,gi. Γηα ην πινίν ππό κειέηε, όπνπ βξίζθνληαη εγθαηεζηεκέλεο ηξεηο (3) Ζ/Γ
νλνκαζηηθήο ηζρύνο Pr,gi = 780kW, πνπ νδεγνύληαη από κεραλέο Diesel κνληέινπ ΜΑΝ Β&W 6L23/30, ε
θακπύιε εηδηθήο θαηαλάισζεο θνξηίνπ γηα ηύπν θαπζίκνπ MDO – Marine Diesel Oil κε ζεξκνγόλν δύλακε
LCV = 42700kJ/kg παξνπζηάδεηαη ζην ρ. 2.14(β). Ζ θακπύιε απηή δείρλεη όηη νη ηηκέο SFOC απμάλνληαη
δξακαηηθά εάλ ην θνξηίν ηεο Ζ/Γ κεησζεί θάησ από 55% ηνπ Pr,gi. Δπνκέλσο εάλ νη Ζ/Γ ρξεηάδεηαη λα
ιεηηνπξγήζνπλ παξάιιεια ζε ρακειό επίπεδν θόξηηζεο πξνθεηκέλνπ λα εμππεξεηήζνπλ ην θνξηίν, απηό ζα
έρεη ζεκαληηθό αληίθηππν ζηελ θαηαλάισζε θαπζίκνπ ηεο Ζ/Γ, FOCD/G [tn], σο εμήο:
όπνπ Pm,gi είλαη ε κεραληθή ηζρύο εμόδνπ ηεο κεραλήο Diesel πνπ νδεγεί ηελ Ζ/Γ, θαη ε νπνία κπνξεί λα
ππνινγηζηεί κεηξώληαο ηελ ηζρύ εμόδνπ ηεο Ζ/Γ, PL,gi, θαη ιακβάλνληαο ππόςε ηηο απώιεηεο, Ploss, νη νπνίεο
πεξηιακβάλνπλ ηηο απώιεηεο ραιθνύ, Pcop, θαη ηηο απώιεηεο ππξήλα, Pcore, πνπ εμαξηώληαη από ην εθάζηνηε
θνξηίν ηεο Ζ/Γ, θαζώο θαη ηηο κεραληθέο απώιεηεο, Pmech, θαη ηηο απώιεηεο ηξηβώλ θαη αλεκηζκνύ, Pstray, πνπ
εμαξηώληαη από ηελ νλνκαζηηθή ηζρύ ηεο Ζ/Γ ζύκθσλα κε ηελ παξαθάησ ζρέζε:
όπνπ IL είλαη ην ξεύκα πνπ δηαξξέεη ην ηύιηγκα ηπκπάλνπ ηεο θάζε θάζεο ηεο Ζ/Γ θαη Rs είλαη ε αληίζηαζε
ηνπ ηπιίγκαηνο ηπκπάλνπ ηεο Ζ/Γ, παξάκεηξνη πνπ γηα ην πινίν ππό κειέηε ιακβάλνληαη από ηελ αλαθνξά
αμηνιόγεζεο ηεο Ζ/Γ ηνπ ρ. 1.19. Με βάζε ηνλ ππνινγηζκό ηνπ FOCD/G, νη εθπνκπέο ξύπσλ CO2, SO2 θαη
NOx κπνξνύλ λα εθηηκεζνύλ από ηηο ζρ. (1.12)-(1.14).
2.3.3 Ιζνκνηξαζκόο θνξηίνπ Η/Γ θαη πεξηζώξην κεηαβαηηθήο θόξηηζεο Η/Γ
Αθνύ νινθιεξσζεί ν ζπγρξνληζκόο ηεο λέαο Ζ/Γ ζην δίθηπν από ην PMS, ζηε ζπλέρεηα ην θνξηίν
εμππεξεηείηαη κνηξαδόκελν ζηηο δηαζπλδεδεκέλεο Ζ/Γ ζύκθσλα κε ηε ζηαζεξά δηαλνκή θνξηίνπ Sgi(k) πνπ
εμαξηάηαη από ηνλ αξηζκό ησλ Ζ/Γ ζπλδεδεκέλσλ ζην δίθηπν k, όπσο παξνπζηάδεηαη ζηελ επόκελε ζρέζε :
ε νπνία δείρλεη όηη ε ζπλεηζθνξά από όιεο ηηο Ζ/Γ πνπ κνηξάδνληαη ην ζπλνιηθό θνξηίν PL,g, πξέπεη λα είλαη
ίζε κε ην θνξηίν απηό, ηθαλνπνηώληαο ηνλ πεξηνξηζκό γηα ηελ ζηαζεξά δηαλνκήο θνξηίνπ. ύκθσλα κε ηνπο
θαλνληζκνύο ησλ λενγλσκόλσλ, απαηηείηαη ηζνκνηξαζκόο θνξηίνπ κεηαμύ ησλ Ζ/Γ:
όπνπ Νg είλαη ν ζπλνιηθόο αξηζκόο εγθαηεζηεκέλσλ κνλάδσλ Ζ/Γ ζην ζύζηεκα ηζρύνο ηνπ πινίνπ. Δθόζνλ
ζην ηππηθό απηόλνκν ΖΔ ηνπ πινίνπ νη Ζ/Γ έρνπλ όκνηα νλνκαζηηθή ηζρύ Pr,gi(k) = Pr,g,i+1(k), ηόηε θαη ν
ζπληειεζηήο δηαλνκήο Sg,i(k)=Sg,i+1(k). Δπνκέλσο, ζύκθσλα κε ηε ζρ. (2.39) ζα ηζρύεη:
Δθόζνλ ν θαηαζθεπαζηήο ησλ Ζ/Γ ζην πινίν είλαη ν ίδηνο γηα όιεο ηηο κνλάδεο, ζα ηζρύεη Hi=Hi+1. Δπνκέλσο
ην κεηαβαηηθό βήκα θόξηηζεο, ΓPL,tran,gi(k,Nf) γηα όκνηεο Ζ/Γ πνπ ηζνκνηξάδνληαη ην θνξηίν, πξνθύπηεη από
ηε ζρ. (2.28) σο εμήο:
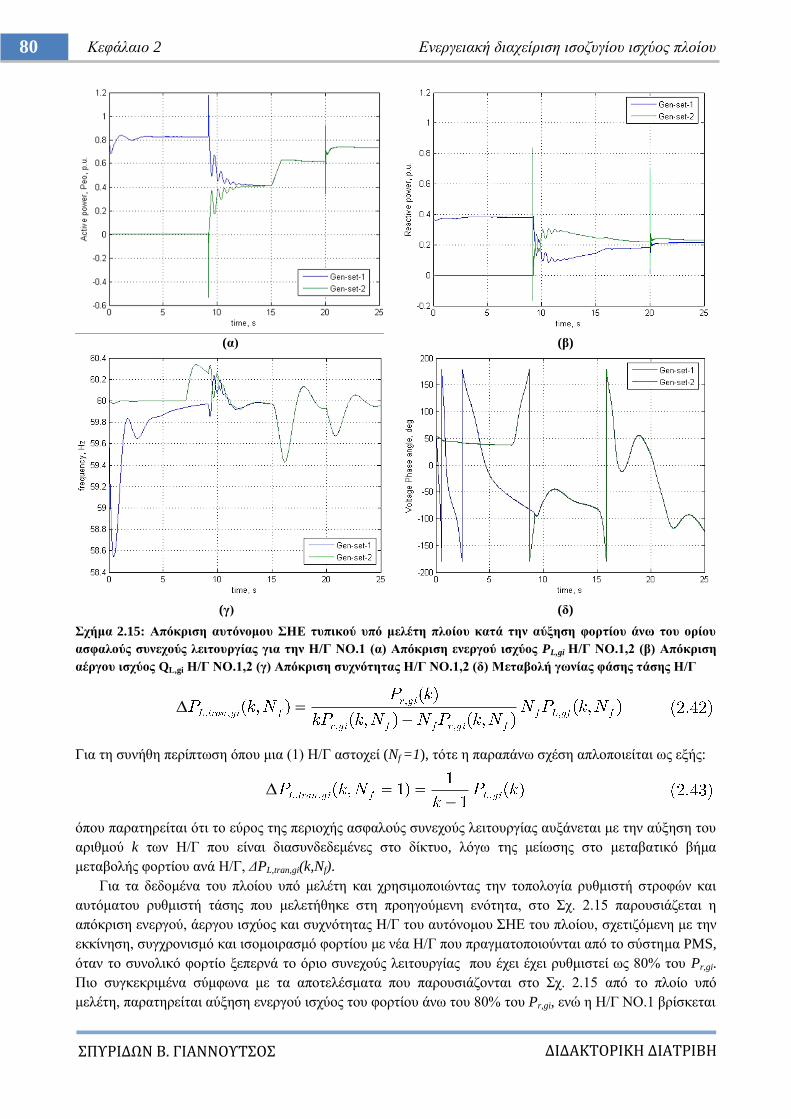
ΔΙΔΑΚΣΟΡΙΚΗ ΔΙΑΣΡΙΒΗ
ΠΤΡΙΔΩΝ Β. ΓΙΑΝΝΟΤΣΟ
80 Κεθάιαην 2 Δλεξγεηαθή δηαρείξηζε ηζνδπγίνπ ηζρύνο πινίνπ
(α) (β)
(γ) (δ)
ρήκα 2.15: Απόθξηζε απηόλνκνπ ΗΔ ηππηθνύ ππό κειέηε πινίνπ θαηά ηελ αύμεζε θνξηίνπ άλσ ηνπ νξίνπ
αζθαινύο ζπλερνύο ιεηηνπξγίαο γηα ηελ Η/Γ ΝΟ.1 (α) Απόθξηζε ελεξγνύ ηζρύνο PL,gi Η/Γ ΝΟ.1,2 (β) Απόθξηζε
αέξγνπ ηζρύνο QL,gi Η/Γ ΝΟ.1,2 (γ) Απόθξηζε ζπρλόηεηαο Η/Γ ΝΟ.1,2 (δ) Μεηαβνιή γσλίαο θάζεο ηάζεο Η/Γ
Γηα ηε ζπλήζε πεξίπησζε όπνπ κηα (1) Ζ/Γ αζηνρεί (Nf =1), ηόηε ε παξαπάλσ ζρέζε απινπνηείηαη σο εμήο:
όπνπ παξαηεξείηαη όηη ην εύξνο ηεο πεξηνρήο αζθαινύο ζπλερνύο ιεηηνπξγίαο απμάλεηαη κε ηελ αύμεζε ηνπ
αξηζκνύ k ησλ Ζ/Γ πνπ είλαη δηαζπλδεδεκέλεο ζην δίθηπν, ιόγσ ηεο κείσζεο ζην κεηαβαηηθό βήκα
κεηαβνιήο θνξηίνπ αλά Ζ/Γ, ΓPL,tran,gi(k,Nf).
Γηα ηα δεδνκέλα ηνπ πινίνπ ππό κειέηε θαη ρξεζηκνπνηώληαο ηελ ηνπνινγία ξπζκηζηή ζηξνθώλ θαη
απηόκαηνπ ξπζκηζηή ηάζεο πνπ κειεηήζεθε ζηε πξνεγνύκελε ελόηεηα, ζην ρ. 2.15 παξνπζηάδεηαη ε
απόθξηζε ελεξγνύ, άεξγνπ ηζρύνο θαη ζπρλόηεηαο Ζ/Γ ηνπ απηόλνκνπ ΖΔ ηνπ πινίνπ, ζρεηηδόκελε κε ηελ
εθθίλεζε, ζπγρξνληζκό θαη ηζνκνηξαζκό θνξηίνπ κε λέα Ζ/Γ πνπ πξαγκαηνπνηνύληαη από ην ζύζηεκα PMS,
όηαλ ην ζπλνιηθό θνξηίν μεπεξλά ην όξην ζπλερνύο ιεηηνπξγίαο πνπ έρεη έρεη ξπζκηζηεί σο 80% ηνπ Pr,gi.
Πην ζπγθεθξηκέλα ζύκθσλα κε ηα απνηειέζκαηα πνπ παξνπζηάδνληαη ζην ρ. 2.15 από ην πινίν ππό
κειέηε, παξαηεξείηαη αύμεζε ελεξγνύ ηζρύνο ηνπ θνξηίνπ άλσ ηνπ 80% ηνπ Pr,gi, ελώ ε Ζ/Γ ΝΟ.1 βξίζθεηαη
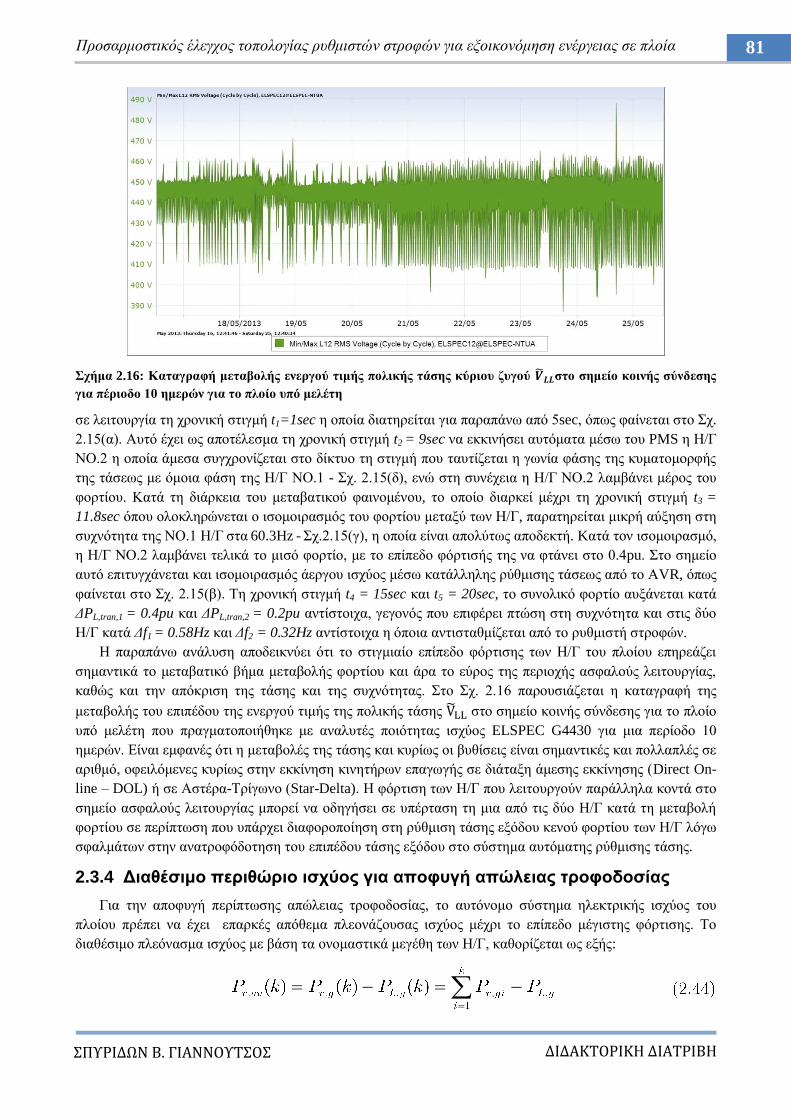
ΔΙΔΑΚΣΟΡΙΚΗ ΔΙΑΣΡΙΒΗ
ΠΤΡΙΔΩΝ Β. ΓΙΑΝΝΟΤΣΟ
81 Πξνζαξκνζηηθόο έιεγρνο ηνπνινγίαο ξπζκηζηώλ ζηξνθώλ γηα εμνηθνλόκεζε ελέξγεηαο ζε πινία
ρήκα 2.16: Καηαγξαθή κεηαβνιήο ελεξγνύ ηηκήο πνιηθήο ηάζεο θύξηνπ δπγνύ ζην ζεκείν θνηλήο ζύλδεζεο
γηα πέξηνδν 10 εκεξώλ γηα ην πινίν ππό κειέηε
ζε ιεηηνπξγία ηε ρξνληθή ζηηγκή t1=1sec ε νπνία δηαηεξείηαη γηα παξαπάλσ από 5sec, όπσο θαίλεηαη ζην ρ.
2.15(α). Απηό έρεη σο απνηέιεζκα ηε ρξνληθή ζηηγκή t2 = 9sec λα εθθηλήζεη απηόκαηα κέζσ ηνπ PMS ε Ζ/Γ
ΝΟ.2 ε νπνία άκεζα ζπγρξνλίδεηαη ζην δίθηπν ηε ζηηγκή πνπ ηαπηίδεηαη ε γσλία θάζεο ηεο θπκαηνκνξθήο
ηεο ηάζεσο κε όκνηα θάζε ηεο Ζ/Γ ΝΟ.1 - ρ. 2.15(δ), ελώ ζηε ζπλέρεηα ε Ζ/Γ ΝΟ.2 ιακβάλεη κέξνο ηνπ
θνξηίνπ. Καηά ηε δηάξθεηα ηνπ κεηαβαηηθνύ θαηλνκέλνπ, ην νπνίν δηαξθεί κέρξη ηε ρξνληθή ζηηγκή t3 =
11.8sec όπνπ νινθιεξώλεηαη ν ηζνκνηξαζκόο ηνπ θνξηίνπ κεηαμύ ησλ Ζ/Γ, παξαηεξείηαη κηθξή αύμεζε ζηε
ζπρλόηεηα ηεο ΝΟ.1 Ζ/Γ ζηα 60.3Hz - ρ.2.15(γ), ε νπνία είλαη απνιύησο απνδεθηή. Kαηά ηνλ ηζνκνηξαζκό,
ε Ζ/Γ ΝΟ.2 ιακβάλεη ηειηθά ην κηζό θνξηίν, κε ην επίπεδν θόξηηζήο ηεο λα θηάλεη ζην 0.4pu. ην ζεκείν
απηό επηηπγράλεηαη θαη ηζνκνηξαζκόο άεξγνπ ηζρύνο κέζσ θαηάιιειεο ξύζκηζεο ηάζεσο από ην ΑVR, όπσο
θαίλεηαη ζην ρ. 2.15(β). Σε ρξνληθή ζηηγκή t4 = 15sec θαη t5 = 20sec, ην ζπλνιηθό θνξηίν απμάλεηαη θαηά
ΓPL,tran,1 = 0.4pu θαη ΓPL,tran,2 = 0.2pu αληίζηνηρα, γεγνλόο πνπ επηθέξεη πηώζε ζηε ζπρλόηεηα θαη ζηηο δύν
Ζ/Γ θαηά Γf1 = 0.58Hz θαη Γf2 = 0.32Hz αληίζηνηρα ε όπνηα αληηζηαζκίδεηαη από ην ξπζκηζηή ζηξνθώλ.
Ζ παξαπάλσ αλάιπζε απνδεηθλύεη όηη ην ζηηγκηαίν επίπεδν θόξηηζεο ησλ Ζ/Γ ηνπ πινίνπ επεξεάδεη
ζεκαληηθά ην κεηαβαηηθό βήκα κεηαβνιήο θνξηίνπ θαη άξα ην εύξνο ηεο πεξηνρήο αζθαινύο ιεηηνπξγίαο,
θαζώο θαη ηελ απόθξηζε ηεο ηάζεο θαη ηεο ζπρλόηεηαο. ην ρ. 2.16 παξνπζηάδεηαη ε θαηαγξαθή ηεο
κεηαβνιήο ηνπ επηπέδνπ ηεο ελεξγνύ ηηκήο ηεο πνιηθήο ηάζεο ζην ζεκείν θνηλήο ζύλδεζεο γηα ην πινίν
ππό κειέηε πνπ πξαγκαηνπνηήζεθε κε αλαιπηέο πνηόηεηαο ηζρύνο ELSPEC G4430 γηα κηα πεξίνδν 10
εκεξώλ. Δίλαη εκθαλέο όηη ε κεηαβνιέο ηεο ηάζεο θαη θπξίσο νη βπζίζεηο είλαη ζεκαληηθέο θαη πνιιαπιέο ζε
αξηζκό, νθεηιόκελεο θπξίσο ζηελ εθθίλεζε θηλεηήξσλ επαγσγήο ζε δηάηαμε άκεζεο εθθίλεζεο (Direct On-
line – DOL) ή ζε Αζηέξα-Σξίγσλν (Star-Delta). Ζ θόξηηζε ησλ Ζ/Γ πνπ ιεηηνπξγνύλ παξάιιεια θνληά ζην
ζεκείν αζθαινύο ιεηηνπξγίαο κπνξεί λα νδεγήζεη ζε ππέξηαζε ηε κηα από ηηο δύν Ζ/Γ θαηά ηε κεηαβνιή
θνξηίνπ ζε πεξίπησζε πνπ ππάξρεη δηαθνξνπνίεζε ζηε ξύζκηζε ηάζεο εμόδνπ θελνύ θνξηίνπ ησλ Ζ/Γ ιόγσ
ζθαικάησλ ζηελ αλαηξνθόδνηεζε ηνπ επηπέδνπ ηάζεο εμόδνπ ζην ζύζηεκα απηόκαηεο ξύζκηζεο ηάζεο.
2.3.4 Γηαζέζηκν πεξηζώξην ηζρύνο γηα απνθπγή απώιεηαο ηξνθνδνζίαο
Γηα ηελ απνθπγή πεξίπησζεο απώιεηαο ηξνθνδνζίαο, ην απηόλνκν ζύζηεκα ειεθηξηθήο ηζρύνο ηνπ
πινίνπ πξέπεη λα έρεη επαξθέο απόζεκα πιενλάδνπζαο ηζρύνο κέρξη ην επίπεδν κέγηζηεο θόξηηζεο. Σν
δηαζέζηκν πιεόλαζκα ηζρύνο κε βάζε ηα νλνκαζηηθά κεγέζε ησλ Ζ/Γ, θαζνξίδεηαη σο εμήο:
ΔΙΔΑΚΣΟΡΙΚΗ ΔΙΑΣΡΙΒΗ
ΠΤΡΙΔΩΝ Β. ΓΙΑΝΝΟΤΣΟ
82 Κεθάιαην 2 Δλεξγεηαθή δηαρείξηζε ηζνδπγίνπ ηζρύνο πινίνπ
όπνπ Pr,g είλαη ην ζύλνιν ηεο εγθαηεζηεκέλεο ηζρύνο γηα ηηο Ζ/Γ πνπ είλαη ζπλδεδεκέλεο ζην δίθηπν κε
νλνκαζηηθή ηζρύ Pr,gi, ελώ PL,g είλαη ην ζπλνιηθό θαηαλαιηζθόκελν θνξηίν ην νπνίν ην νπνίν κνηξάδεηαη
κεηαμύ ησλ Ζ/Γ, πνπ ε θαζεκηά αλαιακβάλεη θνξηίν PL,gi. Ζ εγθαηεζηεκέλε ηζρύο ππνινγίδεηαη ζε
πξαγκαηηθό ρξόλν από ην ζύζηεκα PMS από ηελ θαηάζηαζε ησλ δηαθνπηώλ ηζρύνο ησλ Ζ/Γ θαη ηελ
νλνκαζηηθή ηζρύ ησλ Ζ/Γ σο εμήο:
όπνπ Bgi είλαη ε θαηάζηαζε ιεηηνπξγίαο ηνπ δηαθόπηε ηζρύνο ηεο Ζ/Γ, πνπ απνηειεί ηε ζπλζήθε
ηζνκνηξαζκνύ θνξηίνπ. Δάλ ε Ζ/Γ είλαη ζπλδεδεκέλε ζην δίθηπν, αιιά δελ έρεη γίλεη ηζνκνηξαζκόο θνξηίνπ,
ε εγθαηεζηεκέλε ηεο ηζρύο δε ζπκπεξηιακβάλεηαη ζην ππνινγηζκό ηεο ζπλνιηθήο εγθαηεζηεκέλεο ηζρύνο. Ζ
απαίηεζε απηή ηζρύεη γηα λα δηαζθαιίζεη όηη ε Ζ/Γ πνπ ζπγρξνλίζηεθε πξόζθαηα δε ζπκκεηέρεη ζηνλ
ππνινγηζκό δηαζέζηκεο πιενλάδνπζαο ηζρύνο από ην απηόκαην ζύζηεκα δηαρείξηζεο ηζρύνο.
Ζ ειάρηζηε δηαζέζηκε πιενλάδνπζα ηζρύ πνπ είλαη απαξαίηεηε λα ππάξρεη γηα ηελ απνθπγή πεξίπησζεο
απώιεηαο ηξνθνδνζίαο θαζνξίδεηαη κε βάζε ηηο πεξηπηώζεηο ζθάικαηνο ησλ Ζ/Γ σο εμήο:
όπνπ ν αξηζκόο k ησλ Ζ/Γ πνπ είλαη ζπλδεδεκέλεο ζην δίθηπν θαζνξίδεηαη κε βάζε ηε ζρ. (2.45). Όκνηα, ε
δηαζέζηκε ηζρύο γηα ηελ εθθίλεζε θαη ην ζπγρξνληζκό λέαο Ζ/Γ νξίδεηαη σο εμήο:
Γηα Ζ/Γ κε ίδηα νλνκαζηηθή ηζρύ, όπσο ζην ηππηθό πινίν ππό κειέηε, ην κέγηζην κεηαβαηηθό βήκα
κεηαβνιήο θνξηίνπ δίλεηαη από ηε ζρ. (2.43). Υξεζηκνπνηώληαο ηε ζρ. (2.33) κε ,
θαη ζεσξώληαο ηζνκνηξαζκό θνξηίνπ κεηαμύ ησλ Ζ/Γ, ζα ηζρύεη γηα ηελ κέγηζηε ζπλερή αζθαιή θόξηηζε:
2.3.5 Γπλακηθή απώιεηαο ηξνθνδνζίαο θαη επηιεθηηθή απνθνπή θνξηίνπ Η/Γ
Απώιεηα ηξνθνδνζίαο ζην απηόλνκν ΖΔ ηνπ πινίνπ κπνξεί λα πξνθιεζεί από βξαρπθύισκα (σο πξνο
γε ή ζθάικα θάζεο-θάζεο), ππεξθόξηηζε ησλ Ζ/Γ ηνπ ζπζηήκαηνο, ππέξβαζε νξίσλ ζπρλόηεηαο θαη ηάζεο
ζην δπγό, θαζώο θαη από δηαθνπή ιεηηνπξγίαο ηεο κεραλήο Diesel πνπ νδεγεί ηελ Ζ/Γ. Πην ζπγθεθξηκέλα:
Ο δηαθόπηεο ηζρύνο ηεο Ζ/Γ πεξηιακβάλεη πξνζηαζία από ππεξέληαζε ελζσκαηώλνληαο θακπύιε
πξνζηαζίαο Ηr-tr αληηζηξόθνπ ρξόλνπ, κε ραξαθηεξηζηηθή θαζπζηέξεζε ρξόλνπ Long time delay – LTD
ζύκθσλα κε ηελ νπνία γηα ην ηππηθό πινίν ππό κειέηε, ν δηαθόπηεο ηζρύνο αλνίγεη ζε tr,LTD = 20sec, όηαλ ην
επίπεδν ηνπ ξεύκαηνο ζθάικαηνο , θαζώο θαη θαζπζηέξεζε ρξόλνπ Short time delay – STD,
όπνπ ν δηαθόπηεο ηζρύνο αλνίγεη ζε tr,STD = 300msec εάλ ην επίπεδν ηνπ ξεύκαηνο ζθάικαηνο . Ο
δηαθόπηεο επίζεο αλνίγεη άκεζα (ζε ρξόλν tr < 1ms) αλ . Δπηπιένλ, ν ίδηνο ν δηαθόπηεο ηζρύνο
ελζσκαηώλεη πξνζηαζία από ππόηαζε κε ρξνλνθαζπζηέξεζε, έηζη ώζηε κε αλαθνξά ζην ηππηθό πινίν ππό
κειέηε λα αλνίγεη ζε ρξόλν t =10sec αλ ε ηάζε ζηελ έμνδν ηεο Ζ/Γ είλαη κεηαμύ 30%-70% ηεο νλνκαζηηθήο.
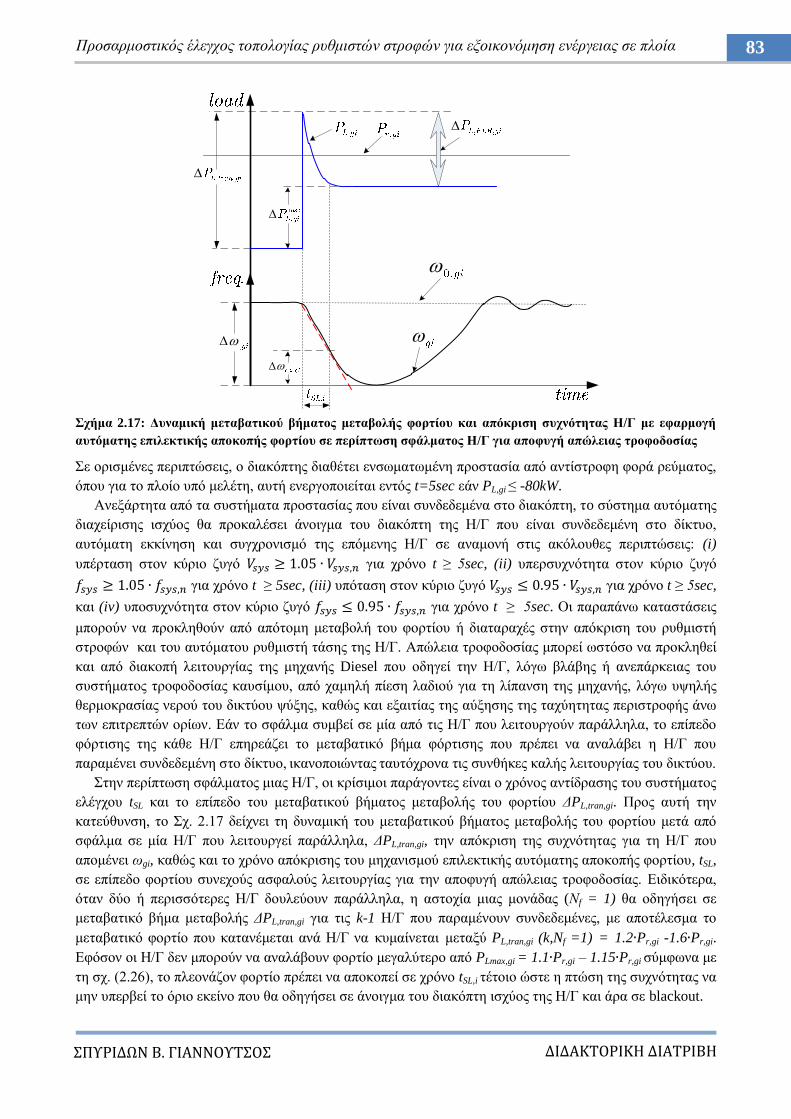
ΔΙΔΑΚΣΟΡΙΚΗ ΔΙΑΣΡΙΒΗ
ΠΤΡΙΔΩΝ Β. ΓΙΑΝΝΟΤΣΟ
83 Πξνζαξκνζηηθόο έιεγρνο ηνπνινγίαο ξπζκηζηώλ ζηξνθώλ γηα εμνηθνλόκεζε ελέξγεηαο ζε πινία
ρήκα 2.17: Γπλακηθή κεηαβαηηθνύ βήκαηνο κεηαβνιήο θνξηίνπ θαη απόθξηζε ζπρλόηεηαο Η/Γ κε εθαξκνγή
απηόκαηεο επηιεθηηθήο απνθνπήο θνξηίνπ ζε πεξίπησζε ζθάικαηνο Η/Γ γηα απνθπγή απώιεηαο ηξνθνδνζίαο
ε νξηζκέλεο πεξηπηώζεηο, ν δηαθόπηεο δηαζέηεη ελζσκαησκέλε πξνζηαζία από αληίζηξνθε θνξά ξεύκαηνο,
όπνπ γηα ην πινίν ππό κειέηε, απηή ελεξγνπνηείηαη εληόο t=5sec εάλ PL,gi ≤ -80kW.
Αλεμάξηεηα από ηα ζπζηήκαηα πξνζηαζίαο πνπ είλαη ζπλδεδεκέλα ζην δηαθόπηε, ηo ζύζηεκα απηόκαηεο
δηαρείξηζεο ηζρύνο ζα πξνθαιέζεη άλνηγκα ηνπ δηαθόπηε ηεο Ζ/Γ πνπ είλαη ζπλδεδεκέλε ζην δίθηπν,
απηόκαηε εθθίλεζε θαη ζπγρξνληζκό ηεο επόκελεο Ζ/Γ ζε αλακνλή ζηηο αθόινπζεο πεξηπηώζεηο: (i)
ππέξηαζε ζηνλ θύξην δπγό γηα ρξόλν t ≥ 5sec, (ii) ππεξζπρλόηεηα ζηνλ θύξην δπγό
γηα ρξόλν t ≥ 5sec, (iii) ππόηαζε ζηνλ θύξην δπγό γηα ρξόλν t ≥ 5sec,
θαη (iv) ππνζπρλόηεηα ζηνλ θύξην δπγό γηα ρξόλν t ≥ 5sec. Οη παξαπάλσ θαηαζηάζεηο
κπνξνύλ λα πξνθιεζνύλ από απόηνκε κεηαβνιή ηνπ θνξηίνπ ή δηαηαξαρέο ζηελ απόθξηζε ηνπ ξπζκηζηή
ζηξνθώλ θαη ηνπ απηόκαηνπ ξπζκηζηή ηάζεο ηεο Ζ/Γ. Απώιεηα ηξνθνδνζίαο κπνξεί σζηόζν λα πξνθιεζεί
θαη από δηαθνπή ιεηηνπξγίαο ηεο κεραλήο Diesel πνπ νδεγεί ηελ Ζ/Γ, ιόγσ βιάβεο ή αλεπάξθεηαο ηνπ
ζπζηήκαηνο ηξνθνδνζίαο θαπζίκνπ, από ρακειή πίεζε ιαδηνύ γηα ηε ιίπαλζε ηεο κεραλήο, ιόγσ πςειήο
ζεξκνθξαζίαο λεξνύ ηνπ δηθηύνπ ςύμεο, θαζώο θαη εμαηηίαο ηεο αύμεζεο ηεο ηαρύεηεηαο πεξηζηξνθήο άλσ
ησλ επηηξεπηώλ νξίσλ. Δάλ ην ζθάικα ζπκβεί ζε κία από ηηο Ζ/Γ πνπ ιεηηνπξγνύλ παξάιιεια, ην επίπεδν
θόξηηζεο ηεο θάζε Ζ/Γ επεξεάδεη ην κεηαβαηηθό βήκα θόξηηζεο πνπ πξέπεη λα αλαιάβεη ε Ζ/Γ πνπ
παξακέλεη ζπλδεδεκέλε ζην δίθηπν, ηθαλνπνηώληαο ηαπηόρξνλα ηηο ζπλζήθεο θαιήο ιεηηνπξγίαο ηνπ δηθηύνπ.
ηελ πεξίπησζε ζθάικαηνο κηαο Ζ/Γ, νη θξίζηκνη παξάγνληεο είλαη ν ρξόλνο αληίδξαζεο ηνπ ζπζηήκαηνο
ειέγρνπ tSL θαη ην επίπεδν ηνπ κεηαβαηηθνύ βήκαηνο κεηαβνιήο ηνπ θνξηίνπ ΓPL,tran,gi. Πξνο απηή ηελ
θαηεύζπλζε, ην ρ. 2.17 δείρλεη ηε δπλακηθή ηνπ κεηαβαηηθνύ βήκαηνο κεηαβνιήο ηνπ θνξηίνπ κεηά από
ζθάικα ζε κία Ζ/Γ πνπ ιεηηνπξγεί παξάιιεια, ΓPL,tran,gi, ηελ απόθξηζε ηεο ζπρλόηεηαο γηα ηε Ζ/Γ πνπ
απνκέλεη σgi, θαζώο θαη ην ρξόλν απόθξηζεο ηνπ κεραληζκνύ επηιεθηηθήο απηόκαηεο απνθνπήο θνξηίνπ, tSL,
ζε επίπεδν θνξηίνπ ζπλερνύο αζθαινύο ιεηηνπξγίαο γηα ηελ απνθπγή απώιεηαο ηξνθνδνζίαο. Δηδηθόηεξα,
όηαλ δύν ή πεξηζζόηεξεο Ζ/Γ δνπιεύνπλ παξάιιεια, ε αζηνρία κηαο κνλάδαο (Νf = 1) ζα νδεγήζεη ζε
κεηαβαηηθό βήκα κεηαβνιήο ΓPL,tran,gi γηα ηηο k-1 Ζ/Γ πνπ παξακέλνπλ ζπλδεδεκέλεο, κε απνηέιεζκα ην
κεηαβαηηθό θνξηίν πνπ θαηαλέκεηαη αλά Ζ/Γ λα θπκαίλεηαη κεηαμύ PL,tran,gi (k,Nf =1) = 1.2 Pr,gi -1.6 Pr,gi.
Δθόζνλ νη Ζ/Γ δελ κπνξνύλ λα αλαιάβνπλ θνξηίν κεγαιύηεξν από PLmax,gi = 1.1 Pr,gi – 1.15 Pr,gi ζύκθσλα κε
ηε ζρ. (2.26), ην πιενλάδνλ θνξηίν πξέπεη λα απνθνπεί ζε ρξόλν tSL,i ηέηνην ώζηε ε πηώζε ηεο ζπρλόηεηαο λα
κελ ππεξβεί ην όξην εθείλν πνπ ζα νδεγήζεη ζε άλνηγκα ηνπ δηαθόπηε ηζρύνο ηεο Ζ/Γ θαη άξα ζε blackout.
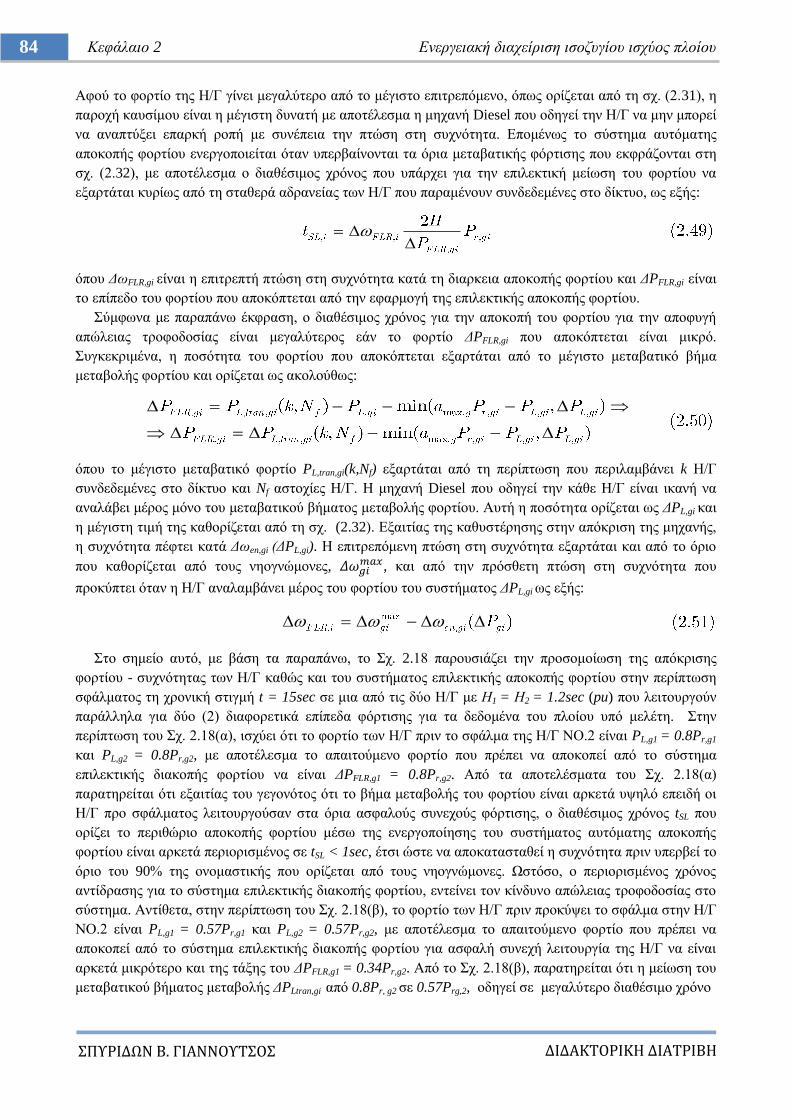
ΔΙΔΑΚΣΟΡΙΚΗ ΔΙΑΣΡΙΒΗ
ΠΤΡΙΔΩΝ Β. ΓΙΑΝΝΟΤΣΟ
84 Κεθάιαην 2 Δλεξγεηαθή δηαρείξηζε ηζνδπγίνπ ηζρύνο πινίνπ
Αθνύ ην θνξηίν ηεο Ζ/Γ γίλεη κεγαιύηεξν από ην κέγηζην επηηξεπόκελν, όπσο νξίδεηαη από ηε ζρ. (2.31), ε
παξνρή θαπζίκνπ είλαη ε κέγηζηε δπλαηή κε απνηέιεζκα ε κεραλή Diesel πνπ νδεγεί ηελ Ζ/Γ λα κελ κπνξεί
λα αλαπηύμεη επαξθή ξνπή κε ζπλέπεηα ηελ πηώζε ζηε ζπρλόηεηα. Δπνκέλσο ην ζύζηεκα απηόκαηεο
απνθνπήο θνξηίνπ ελεξγνπνηείηαη όηαλ ππεξβαίλνληαη ηα όξηα κεηαβαηηθήο θόξηηζεο πνπ εθθξάδνληαη ζηε
ζρ. (2.32), κε απνηέιεζκα ν δηαζέζηκνο ρξόλνο πνπ ππάξρεη γηα ηελ επηιεθηηθή κείσζε ηνπ θνξηίνπ λα
εμαξηάηαη θπξίσο από ηε ζηαζεξά αδξαλείαο ησλ Ζ/Γ πνπ παξακέλνπλ ζπλδεδεκέλεο ζην δίθηπν, σο εμήο:
όπνπ ΓσFLR,gi είλαη ε επηηξεπηή πηώζε ζηε ζπρλόηεηα θαηά ηε δηαξθεηα απνθνπήο θνξηίνπ θαη ΓPFLR,gi είλαη
ην επίπεδν ηνπ θνξηίνπ πνπ απνθόπηεηαη από ηελ εθαξκνγή ηεο επηιεθηηθήο απνθνπήο θνξηίνπ.
ύκθσλα κε παξαπάλσ έθθξαζε, ν δηαζέζηκνο ρξόλνο γηα ηελ απνθνπή ηνπ θνξηίνπ γηα ηελ απνθπγή
απώιεηαο ηξνθνδνζίαο είλαη κεγαιύηεξνο εάλ ην θνξηίν ΓPFLR,gi πνπ απνθόπηεηαη είλαη κηθξό.
πγθεθξηκέλα, ε πνζόηεηα ηνπ θνξηίνπ πνπ απνθόπηεηαη εμαξηάηαη από ην κέγηζην κεηαβαηηθό βήκα
κεηαβνιήο θνξηίνπ θαη νξίδεηαη σο αθνινύζσο:
όπνπ ην κέγηζην κεηαβαηηθό θνξηίν PL,tran,gi(k,Nf) εμαξηάηαη από ηε πεξίπησζε πνπ πεξηιακβάλεη k Ζ/Γ
ζπλδεδεκέλεο ζην δίθηπν θαη Nf αζηνρίεο Ζ/Γ. Ζ κεραλή Diesel πνπ νδεγεί ηελ θάζε Ζ/Γ είλαη ηθαλή λα
αλαιάβεη κέξνο κόλν ηνπ κεηαβαηηθνύ βήκαηνο κεηαβνιήο θνξηίνπ. Απηή ε πνζόηεηα νξίδεηαη σο ΓPL,gi θαη
ε κέγηζηε ηηκή ηεο θαζνξίδεηαη από ηε ζρ. (2.32). Δμαηηίαο ηεο θαζπζηέξεζεο ζηελ απόθξηζε ηεο κεραλήο,
ε ζπρλόηεηα πέθηεη θαηά Γσen,gi (ΓPL,gi). Ζ επηηξεπόκελε πηώζε ζηε ζπρλόηεηα εμαξηάηαη θαη από ην όξην
πνπ θαζνξίδεηαη από ηνπο λενγλώκνλεο, , θαη από ηελ πξόζζεηε πηώζε ζηε ζπρλόηεηα πνπ
πξνθύπηεη όηαλ ε Ζ/Γ αλαιακβάλεη κέξνο ηνπ θνξηίνπ ηνπ ζπζηήκαηνο ΓPL,gi σο εμήο:
ην ζεκείν απηό, κε βάζε ηα παξαπάλσ, ην ρ. 2.18 παξνπζηάδεη ηελ πξνζνκνίσζε ηεο απόθξηζεο
θνξηίνπ - ζπρλόηεηαο ησλ Ζ/Γ θαζώο θαη ηνπ ζπζηήκαηνο επηιεθηηθήο απνθνπήο θνξηίνπ ζηελ πεξίπησζε
ζθάικαηνο ηε ρξνληθή ζηηγκή t = 15sec ζε κηα από ηηο δύν Ζ/Γ κε Ζ1 = Ζ2 = 1.2sec (pu) πνπ ιεηηνπξγνύλ
παξάιιεια γηα δύν (2) δηαθνξεηηθά επίπεδα θόξηηζεο γηα ηα δεδνκέλα ηνπ πινίνπ ππό κειέηε. ηελ
πεξίπησζε ηνπ ρ. 2.18(α), ηζρύεη όηη ην θνξηίν ησλ Ζ/Γ πξηλ ην ζθάικα ηεο Ζ/Γ ΝΟ.2 είλαη PL,g1 = 0.8Pr,g1
θαη PL,g2 = 0.8Pr,g2, κε απνηέιεζκα ην απαηηνύκελν θνξηίν πνπ πξέπεη λα απνθνπεί από ην ζύζηεκα
επηιεθηηθήο δηαθνπήο θνξηίνπ λα είλαη ΓPFLR,g1 = 0.8Pr,g2. Από ηα απνηειέζκαηα ηνπ ρ. 2.18(α)
παξαηεξείηαη όηη εμαηηίαο ηνπ γεγνλόηνο όηη ην βήκα κεηαβνιήο ηνπ θνξηίνπ είλαη αξθεηά πςειό επεηδή νη
Ζ/Γ πξν ζθάικαηνο ιεηηνπξγνύζαλ ζηα όξηα αζθαινύο ζπλερνύο θόξηηζεο, ν δηαζέζηκνο ρξόλνο tSL πνπ
νξίδεη ην πεξηζώξην απνθνπήο θνξηίνπ κέζσ ηεο ελεξγνπνίεζεο ηνπ ζπζηήκαηνο απηόκαηεο απνθνπήο
θνξηίνπ είλαη αξθεηά πεξηνξηζκέλνο ζε tSL < 1sec, έηζη ώζηε λα απνθαηαζηαζεί ε ζπρλόηεηα πξηλ ππεξβεί ην
όξην ηνπ 90% ηεο νλνκαζηηθήο πνπ νξίδεηαη από ηνπο λενγλώκνλεο. Χζηόζν, ν πεξηνξηζκέλνο ρξόλνο
αληίδξαζεο γηα ην ζύζηεκα επηιεθηηθήο δηαθνπήο θνξηίνπ, εληείλεη ηνλ θίλδπλν απώιεηαο ηξνθνδνζίαο ζην
ζύζηεκα. Αληίζεηα, ζηελ πεξίπησζε ηνπ ρ. 2.18(β), ην θνξηίν ησλ Ζ/Γ πξηλ πξνθύςεη ην ζθάικα ζηελ Ζ/Γ
ΝΟ.2 είλαη PL,g1 = 0.57Pr,g1 θαη PL,g2 = 0.57Pr,g2, κε απνηέιεζκα ην απαηηνύκελν θνξηίν πνπ πξέπεη λα
απνθνπεί από ην ζύζηεκα επηιεθηηθήο δηαθνπήο θνξηίνπ γηα αζθαιή ζπλερή ιεηηνπξγία ηεο Ζ/Γ λα είλαη
αξθεηά κηθξόηεξν θαη ηεο ηάμεο ηνπ ΓPFLR,g1 = 0.34Pr,g2. Από ην ρ. 2.18(β), παξαηεξείηαη όηη ε κείσζε ηνπ
κεηαβαηηθνύ βήκαηνο κεηαβνιήο ΓPLtran,gi από 0.8Pr, g2 ζε 0.57Prg,2, νδεγεί ζε κεγαιύηεξν δηαζέζηκν ρξόλν
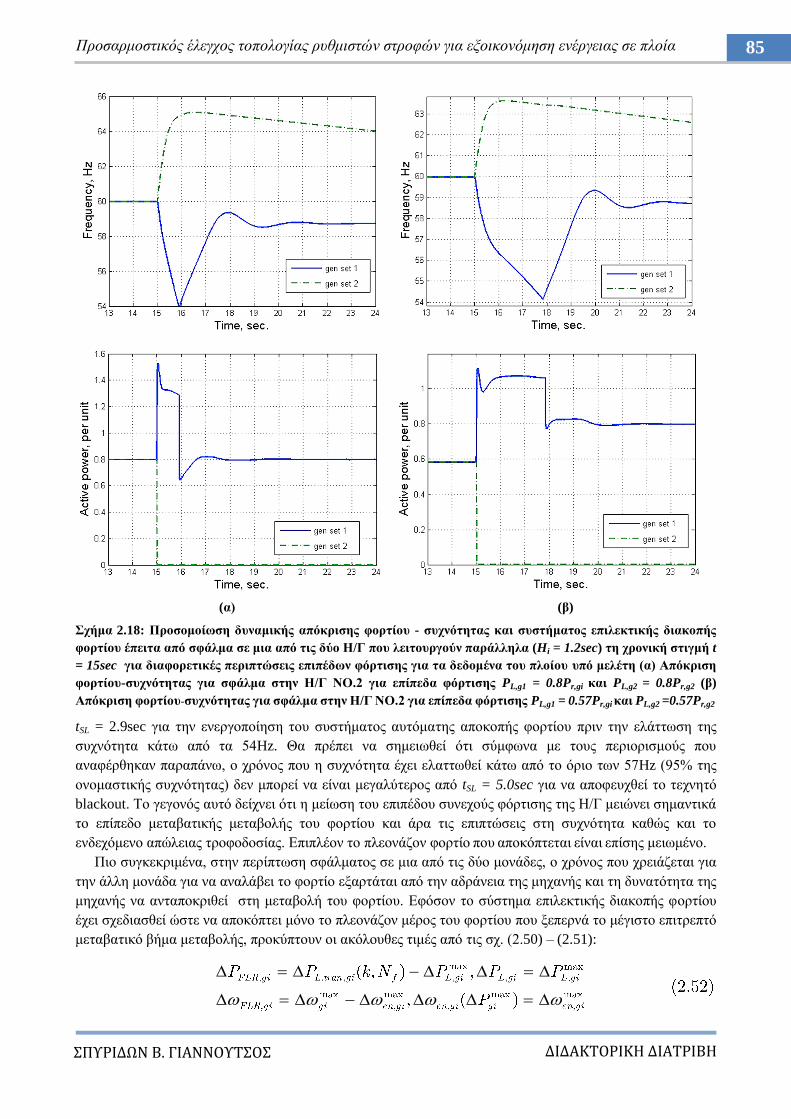
ΔΙΔΑΚΣΟΡΙΚΗ ΔΙΑΣΡΙΒΗ
ΠΤΡΙΔΩΝ Β. ΓΙΑΝΝΟΤΣΟ
85 Πξνζαξκνζηηθόο έιεγρνο ηνπνινγίαο ξπζκηζηώλ ζηξνθώλ γηα εμνηθνλόκεζε ελέξγεηαο ζε πινία
(α) (β)
ρήκα 2.18: Πξνζνκνίσζε δπλακηθήο απόθξηζεο θνξηίνπ - ζπρλόηεηαο θαη ζπζηήκαηνο επηιεθηηθήο δηαθνπήο
θνξηίνπ έπεηηα από ζθάικα ζε κηα από ηηο δύν Η/Γ πνπ ιεηηνπξγνύλ παξάιιεια (Hi = 1.2sec) ηε ρξνληθή ζηηγκή t
= 15sec γηα δηαθνξεηηθέο πεξηπηώζεηο επηπέδσλ θόξηηζεο γηα ηα δεδνκέλα ηνπ πινίνπ ππό κειέηε (α) Απόθξηζε
θνξηίνπ-ζπρλόηεηαο γηα ζθάικα ζηελ Η/Γ ΝΟ.2 γηα επίπεδα θόξηηζεο PL,g1 = 0.8Pr,gi θαη PL,g2 = 0.8Pr,g2 (β)
Απόθξηζε θνξηίνπ-ζπρλόηεηαο γηα ζθάικα ζηελ Η/Γ ΝΟ.2 γηα επίπεδα θόξηηζεο PL,g1 = 0.57Pr,gi θαη PL,g2 =0.57Pr,g2
tSL = 2.9sec γηα ηελ ελεξγνπνίεζε ηνπ ζπζηήκαηνο απηόκαηεο απνθνπήο θνξηίνπ πξηλ ηελ ειάηησζε ηεο
ζπρλόηεηα θάησ από ηα 54Hz. Θα πξέπεη λα ζεκεησζεί όηη ζύκθσλα κε ηνπο πεξηνξηζκνύο πνπ
αλαθέξζεθαλ παξαπάλσ, ν ρξόλνο πνπ ε ζπρλόηεηα έρεη ειαηησζεί θάησ από ην όξην ησλ 57Hz (95% ηεο
νλνκαζηηθήο ζπρλόηεηαο) δελ κπνξεί λα είλαη κεγαιύηεξνο από tSL = 5.0sec γηα λα απνθεπρζεί ην ηερλεηό
blackout. Σν γεγνλόο απηό δείρλεη όηη ε κείσζε ηνπ επηπέδνπ ζπλερνύο θόξηηζεο ηεο Ζ/Γ κεηώλεη ζεκαληηθά
ην επίπεδν κεηαβαηηθήο κεηαβνιήο ηνπ θνξηίνπ θαη άξα ηηο επηπηώζεηο ζηε ζπρλόηεηα θαζώο θαη ην
ελδερόκελν απώιεηαο ηξνθνδνζίαο. Δπηπιένλ ην πιενλάδνλ θνξηίν πνπ απνθόπηεηαη είλαη επίζεο κεησκέλν.
Πην ζπγθεθξηκέλα, ζηελ πεξίπησζε ζθάικαηνο ζε κηα από ηηο δύν κνλάδεο, ν ρξόλνο πνπ ρξεηάδεηαη γηα
ηελ άιιε κνλάδα γηα λα αλαιάβεη ην θνξηίν εμαξηάηαη από ηελ αδξάλεηα ηεο κεραλήο θαη ηε δπλαηόηεηα ηεο
κεραλήο λα αληαπνθξηζεί ζηε κεηαβνιή ηνπ θνξηίνπ. Δθόζνλ ην ζύζηεκα επηιεθηηθήο δηαθνπήο θνξηίνπ
έρεη ζρεδηαζζεί ώζηε λα απνθόπηεη κόλν ην πιενλάδνλ κέξνο ηνπ θνξηίνπ πνπ μεπεξλά ην κέγηζην επηηξεπηό
κεηαβαηηθό βήκα κεηαβνιήο, πξνθύπηνπλ νη αθόινπζεο ηηκέο από ηηο ζρ. (2.50) – (2.51):
ΔΙΔΑΚΣΟΡΙΚΗ ΔΙΑΣΡΙΒΗ
ΠΤΡΙΔΩΝ Β. ΓΙΑΝΝΟΤΣΟ
86 Κεθάιαην 2 Δλεξγεηαθή δηαρείξηζε ηζνδπγίνπ ηζρύνο πινίνπ
Tππηθά όξηα γηα ηα παξαπάλσ, όπσο αλαθέξνληαη ζηε βηβιηνγξαθία [10], [24], [27] είλαη:
όπνπ σ0,gi είλαη ε νλνκαζηηθή ηαρύηεηα πεξηζηξνθήο ηνπ άμνλα ηεο κεραλήο Diesel. Δπνκέλσο, ν ρξόλνο πνπ
είλαη δηαζέζηκνο γηα ηελ επηιεθηηθή κείσζε ηνπ θνξηίνπ ζηελ πεξίπησζε ζθάικαηνο κε ζπγθεθξηκέλν
κεηαβαηηθό βήκα θόξηηζεο, ΓPL,tran,gi (k,Nf), ππνινγίδεηαη σο εμήο:
Ο δηαζέζηκνο ρξόλνο, tSL, πξηλ ε ζπρλόηεηα ειαηησζεί θάησ από ην ειάρηζην όξην, fmin, πξέπεη λα είλαη ίζνο ή
κεγαιύηεξνο από ην ρξόλν πνπ ελεξγνπνηείηαη ην ζύζηεκα επηιεθηηθήο απνθνπήο θνξηίνπ (tSL ≥ tFLR) γηα ηελ
απνθπγή απώιεηαο ηξνθνδνζίαο. Ο ρξόλνο ελεξγνπνίεζεο ηνπ ζπζηήκαηνο FLR γηα ην πινίν ππό κειέηε
είλαη ζπλήζσο ζην εύξνο 0.25 ≤ tFLR ≤ 0.75 sec. Eμηζώλνληαο tSL = tFLR θαη πξνζζέηνληαο PL,gi θαη ζηα δύν
κέιε ηεο ζρ. (2.54), θαζνξίδεηαη ην κέγηζην επηηξεπόκελν κεηαβαηηθό επίπεδν θνξηίνπ:
Όπσο παξαηεξείηαη από ηελ παξαπάλσ ζρέζε, ην κέγηζην κεηαβαηηθό θνξηίν εμαξηάηαη από ηελ αξρηθή
θόξηηζε ηεο Ζ/Γ PL,gi, ηελ ηθαλόηεηα ηεο κεραλήο λα αλαιάβεη ην κεηαβαηηθό θνξηίν ΓPL,gi θαη ην ρξόλν tSL,i.
Γηα ηελ ελίζρπζε ηνπ ελδερνκέλνπ απνθπγήο ηεο πεξίπησζεο απώιεηαο ηξνθνδνζίαο θαη ηελ εμαζθάιηζε
ιεηηνπξγίαο ησλ Ζ/Γ ζην εύξνο αζθαινύο ζπλερνύο θνξηίνπ, ην πξνηεηλόκελν ζύζηεκα απνζθνπεί ζηε
κείσζε ηνπ επηπέδνπ αξρηθήο θόξηηζεο ηεο Ζ/Γ θαη άξα ζηε κείσζε ηνπ επηπέδνπ κεηαβαηηθήο θόξηηζεο ηεο
Ζ/Γ πνπ παξακέλεη ζπλδεδεκέλε ζην δίθηπν ζε πεξίπησζε ζθάικαηνο ζε κηα Ζ/Γ. Δηδηθόηεξα, ηα νθέιε ηνπ
πξνηεηλόκελνπ ζπζηήκαηνο σο πξνο ηε βειηίσζε ηεο επζηάζεηαο ηνπ απηόλνκνπ ΖΔ ηνπ πινίνπ γίλνληαη
πεξηζζόηεξν εκθαλή θαηά ηελ πεξηόδν πιεύζεο κε εθαξκνγή ηεο κεησκέλεο ηαρύηεηαο πιεύζεο, όπνπ
παξαηεξείηαη ζεκαληηθή κεηαβνιή ζην ηζνδύγην ηζρύνο ζε ζρέζε κε απηό πνπ είρε πξόηεξα ππνινγηζηεί,
αιιά θαη θαηά ηελ πεξίνδν εθθόξησζεο όπνπ ην επίπεδν θόξηηζεο είλαη κέγηζην. Γηα ην ιόγν απηό, ζηελ
επόκελε ελόηεηα ζα εμεηαζηνύλ νη παξάκεηξνη ιεηηνπξγίαο ηεο Κ/Μ ηνπ πινίνπ γηα ιεηηνπξγία ζε κεησκέλε
ηαρύηεηα πιεύζεο θαζώο θαη ε κεηαβνιή ζην επίπεδν θόξηηζεο ησλ Ζ/Γ πνπ ζπλεπάγεηαη ε εθαξκνγή απηήο
ηεο πξαθηηθήο κε αλαθνξά ζην ηππηθό πινίν ππό κειέηε.
2.4 Μεηαβολή θόπηιζηρ Η/Γ με εθαπμογή μειυμένηρ ηασύηηηαρ πλεύζηρ
Δμεηάδνληαο ηα όξηα ιεηηνπξγίαο ηνπ ζπζηήκαηνο απηόκαηεο δηαρείξηζεο θνξηίνπ, έγηλε γλσζηό όηη ην
επίπεδν θόξηηζεο ησλ Ζ/Γ, θαζώο θαη ε κεηαβαηηθή κεηαβνιή ηνπ θνξηίνπ απνηεινύλ θύξηνπο παξάγνληεο
νη νπνίνη επεξεάδνπλ ηηο απνθξίζεηο ζπρλόηεηαο θαη ηάζεο ηνπ ζπζηήκαηνο, θαζώο θαη ηελ επζηάζεηα σο
πξνο ηελ απνθπγή απώιεηαο ηξνθνδνζίαο. Ζ βειηηζηνπνίεζε ησλ πηλάθσλ έλαπζεο θαη δηαθνπήο
ιεηηνπξγίαο ησλ Ζ/Γ από ην ζύζηεκα δηαρείξηζεο θνξηίνπ σο πξνο ην επίπεδν αζθαινύο ζπλερνύο θνξηίνπ
θαη ηελ εμνηθνλόκεζε θαπζίκνπ έρεη γίλεη βάζεη ηεο κειέηεο θνξηίνπ αλάινγα κε ηε ιεηηνπξγηθή θαηάζηαζε
ηνπ πινίνπ. Χζηόζν, κε ηελ εθαξκνγή ηεο πξαθηηθήο κείσζεο ηεο ηαρύηεηαο πιεύζεο, ην επίπεδν θόξηηζεο
ησλ Ζ/Γ κεηαβάιιεηαη ζεκαληηθά κε ην θνξηίν ηεο Κ/Μ, γεγνλόο πνπ επεξεάδεη ζεκαληηθά ην ηζνδύγην
ηζρύνο ζην απηόλνκν ΖΔ ηνπ πινίνπ. ηελ ελόηεηα απηή, εμεηάδνληαη νη παξάκεηξνη ιεηηνπξγίαο ηεο Κ/Μ
ζε κεησκέλν θνξηίν θαη κεησκέλε ηαρύηεηα πιεύζεο, ελώ ζπζρεηίδεηαη ε κεηαβνιή ηνπ ηζνδπγίνπ ηζρύνο θαη
ην επίπεδν θόξηηζεο ησλ Ζ/Γ κε ην θνξηίν ηεο Κ/Μ, έρνληαο σο αλαθνξά ην πινίν ππό κειέηε.
ΔΙΔΑΚΣΟΡΙΚΗ ΔΙΑΣΡΙΒΗ
ΠΤΡΙΔΩΝ Β. ΓΙΑΝΝΟΤΣΟ
87 Πξνζαξκνζηηθόο έιεγρνο ηνπνινγίαο ξπζκηζηώλ ζηξνθώλ γηα εμνηθνλόκεζε ελέξγεηαο ζε πινία
2.4.1 Παξάκεηξνη ιεηηνπξγίαο Κ/Μ πινίνπ ζε ζρέζε κε ηε κεηαβνιή θνξηίνπ
ηελ ελόηεηα απηή εμεηάδνληαη νη παξάκεηξνη θαη νη πεξηνξηζκνί ιεηηνπξγίαο ηεο Κ/Μ, γηα κεηαβνιή ησλ
ηαρύηεηαο πιεύζεο κε εθαξκνγή ζην ππό κειέηε ηππηθό πινίν, νη νπνίνη επεξέαδνπλ ηε δηαζηαζηνιόγεζε
ησλ ππνζπζηεκάησλ ησλ δηεξγαζηώλ πνπ ππνζηεξίδνπλ ηελ Κ/Μ θαη ηα βνεζεηηθά κεραλήκαηα.
ε έλα ηππηθό πινίν, ε ηζρύο πνπ απαηηείηαη γηα ηελ πξόσζε κέζσ ηεο έιηθαο, PE, εθθξάδεηαη σο θπβηθή
ζπλάξηεζε ηεο ηαρύηεηαο ηνπ πινίνπ, Vship, εμαξηώκελε από ηελ αληίζηαζε πξόσζεο, R [28]:
όπνπ ξ [kg/m3] είλαη είλαη ε ππθλόηεηα ηνπ λεξνύ, Γ [kg] είλαη ην βάξνο εθηνπίζκαηνο ηνπ πινίνπ, ην νπνίν
νξίδεηαη σο , όπνπ [m3] είλαη ν όγθνο εθηνπίζκαηνο ηνπ πινίνπ, ελώ ν αδηάζηαηνο ζπληειεζηήο
αληίζηαζεο πξόσζεο, cE, εμαξηάηαη από ηελ ηαρύηεηα ηνπ πινίνπ θαη ηελ ηπξβώδε ξνή πνπ εθθξάδεηαη από
ηνλ αξηζκό Reynolds (Re) , ηε δπλακηθή ηνπ θπκάησλ σο πξνο ην κέγεζνο ηνπ πινίνπ πνπ εθθξάδεηαη από
ηνλ αξηζκό Froude (Fr), ηελ ηξαρύηεηα ηνπ πινίνπ, Ro, ηε γεσκεηξία ηεο γάζηξαο, θαζώο θαη από
εμσηεξηθνύο παξάγνληεο όπσο ε θαηάζηαζε θπκαηηζκνύ θαη ην βάζνο, όπσο εθθξάδεηαη παξαθάησ:
όπνπ κ είλαη ην δπλακηθό ημώδεο ηνπ πγξνύ, V [m/s] ε ηαρύηεηα ηνπ πγξνύ, L [m] ην
ραξαθηεξηζηηθό κήθνο ηνπ πινίνπ θαη g [m/s2] ε επηηάρπλζε ηεο βαξύηεηαο, ελώ ν ζπληειεζηήο Ro=k/L,
όπνπ k είλαη ν ζπληειεζηήο κέζεο ηξαρύηεηαο ηεο γάζηξαο. Θεσξώληαο έλα ηππηθό πινίν κε έιηθα ζηαζεξνύ
βήκαηνο (pitch) p [m], θαη ηαρύηεηα πεξηζηξνθήο ηεο έιηθαο nprop [rot/sec], ε ζεσξεηηθή ηαρύηεηα ηεο έιηθαο
Vth,prop [m/s] αλ απηή θηλνύηαλ δίρσο λα είλαη εγθαηεζηεκέλε ζηε γάζηξα ζα ήηαλ
. Χζηόζν, θαζώο ην πινίν θηλείηαη ζην λεξό, ε θαηλόκελε ηαρύηεηα ηεο έιηθαο πξνο ηα εκπξόο κεηώλεηαη
κε ηελ νιίζζεζή ηεο, νξίδνληαο έηζη ην ζπληειεζηή θαηλόκελεο νιίζζεζεο SA όπσο ζην ρ. 2.19(α):
O ζπληειεζηήο θαηλόκελεο νιίζζεζεο ππνινγίδεηαη από ην πιήξσκα πξηλ ηνλ απόπινπ ηνπ πινίνπ, θαη
απνδίδεη ην θνξηίν ηεο έιηθαο ζε δηαθνξεηηθέο ζπλζήθεο ιεηηνπξγίαο, θαζώο απμάλεηαη όηαλ ην πινίν έρεη
θαηεύζπλζε αληίζεηε από απηή ησλ θπκάησλ, όηαλ ε γάζηξα είλαη πεξηζζόηεξν ηξαρηά ή βξώκηθε ή όηαλ ην
πινίν επηηαρύλεηαη. Ζ απμεκέλε αληίζηαζε πξόσζεο, νδεγεί ζε αύμεζε ηεο απαηηνύκελεο ηαρύηεηαο
πεξηζηξνθήο ηεο έιηθαο γηα ηε δηαηήξεζε ζπγθεθξηκέλεο ηαρύηεηαο πιεύζεο. Χζηόζν, ιόγσ ηεο
θπγνθεληξηθήο θίλεζεο ηεο έιηθαο θαη ηεο δηαθνξάο πίεζεο ηνπ λεξνύ θαηά ην κήθνο απηήο (κηθξόηεξε πίεζε
ζηελ είζνδν), ε ηαρύηεηα κε ηελ νπνία θηάλεη ην λεξό ζηελ έιηθα VΑ, όπσο θαίλεηαη ζην ρ. 2.19(β), ζα
είλαη κηθξόηεξε από ηελ ηαρύηεηα ηνπ πινίνπ Vship θαηά ηελ ηαρύηεηα νκόξξνπ (wake speed) Vw, πνπ έρεη ηε
θνξά ηεο ηαρύηεηαο ηνπ πινίνπ θαη δεκηνπξγείηαη από ηελ ηπξβώδε ξνή ηνπ λεξνύ ιόγσ ηελ ηξηβήο ηνπ ζηε
γάζηξα ηνπ πινίνπ, όπσο απεηθνλίδεηαη ζην ρ. 2.19(β), νξίδνληαο έηζη ην ζπληειεζηή νκόξξνπ w:
όπνπ ν ζπληειεζηήο νκόξξνπ w επεξεάδεηαη από ηε γεσκεηξία ηεο έιηθαο θαη ζπγθεθξηκέλα από ηε
δηάκεηξν d θαη ην κήθνο ηνπ πινίνπ L, ελώ απμάλεηαη κε ηε ξύπαλζε ηεο γάζηξαο. Καηά απηόλ ηνλ ηξόπν
ιακβάλεηαη ππόςε ν ζπληειεζηήο πξαγκαηηθήο νιίζζεζεο ηεο έιηθαο SR, εθόζνλ ε πξαγκαηηθή ηαρύηεηα κε
ηελ νπνία πξνσζείηαη ε έιηθα VΑ είλαη κηθξόηεξε από ηελ ηαρύηεηα ηνπ πινίνπ, σο εμήο:
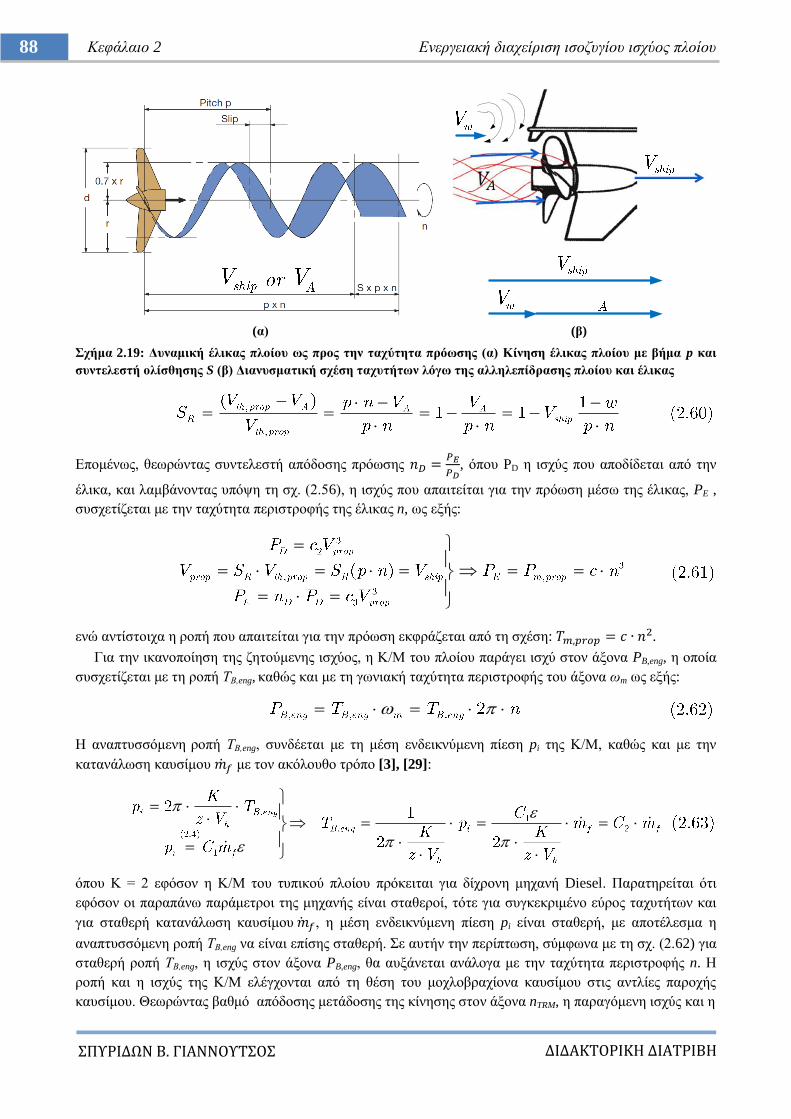
ΔΙΔΑΚΣΟΡΙΚΗ ΔΙΑΣΡΙΒΗ
ΠΤΡΙΔΩΝ Β. ΓΙΑΝΝΟΤΣΟ
88 Κεθάιαην 2 Δλεξγεηαθή δηαρείξηζε ηζνδπγίνπ ηζρύνο πινίνπ
(α) (β)
ρήκα 2.19: Γπλακηθή έιηθαο πινίνπ σο πξνο ηελ ηαρύηεηα πξόσζεο (α) Κίλεζε έιηθαο πινίνπ κε βήκα p θαη
ζπληειεζηή νιίζζεζεο S (β) Γηαλπζκαηηθή ζρέζε ηαρπηήησλ ιόγσ ηεο αιιειεπίδξαζεο πινίνπ θαη έιηθαο
Δπνκέλσο, ζεσξώληαο ζπληειεζηή απόδνζεο πξόσζεο
, όπνπ PD ε ηζρύο πνπ απνδίδεηαη από ηελ
έιηθα, θαη ιακβάλνληαο ππόςε ηε ζρ. (2.56), ε ηζρύο πνπ απαηηείηαη γηα ηελ πξόσζε κέζσ ηεο έιηθαο, PE ,
ζπζρεηίδεηαη κε ηελ ηαρύηεηα πεξηζηξνθήο ηεο έιηθαο n, σο εμήο:
ελώ αληίζηνηρα ε ξνπή πνπ απαηηείηαη γηα ηελ πξόσζε εθθξάδεηαη από ηε ζρέζε: .
Γηα ηελ ηθαλνπνίεζε ηεο δεηνύκελεο ηζρύνο, ε Κ/Μ ηνπ πινίνπ παξάγεη ηζρύ ζηνλ άμνλα PB,eng, ε νπνία
ζπζρεηίδεηαη κε ηε ξνπή ΣΒ,eng, θαζώο θαη κε ηε γσληαθή ηαρύηεηα πεξηζηξνθήο ηνπ άμνλα σm σο εμήο:
Ζ αλαπηπζζόκελε ξνπή ΣΒ,eng, ζπλδέεηαη κε ηε κέζε ελδεηθλύκελε πίεζε pi ηεο Κ/Μ, θαζώο θαη κε ηελ
θαηαλάισζε θαπζίκνπ κε ηνλ αθόινπζν ηξόπν [3], [29]:
όπνπ Κ = 2 εθόζνλ ε Κ/Μ ηνπ ηππηθνύ πινίνπ πξόθεηηαη γηα δίρξνλε κεραλή Diesel. Παξαηεξείηαη όηη
εθόζνλ νη παξαπάλσ παξάκεηξνη ηεο κεραλήο είλαη ζηαζεξνί, ηόηε γηα ζπγθεθξηκέλν εύξνο ηαρπηήησλ θαη
γηα ζηαζεξή θαηαλάισζε θαπζίκνπ , ε κέζε ελδεηθλύκελε πίεζε pi είλαη ζηαζεξή, κε απνηέιεζκα ε
αλαπηπζζόκελε ξνπή ΣΒ,eng λα είλαη επίζεο ζηαζεξή. ε απηήλ ηελ πεξίπησζε, ζύκθσλα κε ηε ζρ. (2.62) γηα
ζηαζεξή ξνπή ΣΒ,eng, ε ηζρύο ζηνλ άμνλα PB,eng, ζα απμάλεηαη αλάινγα κε ηελ ηαρύηεηα πεξηζηξνθήο n. Ζ
ξνπή θαη ε ηζρύο ηεο Κ/Μ ειέγρνληαη από ηε ζέζε ηνπ κνρινβξαρίνλα θαπζίκνπ ζηηο αληιίεο παξνρήο
θαπζίκνπ. Θεσξώληαο βαζκό απόδνζεο κεηάδνζεο ηεο θίλεζεο ζηνλ άμνλα nTRM, ε παξαγόκελε ηζρύο θαη ε
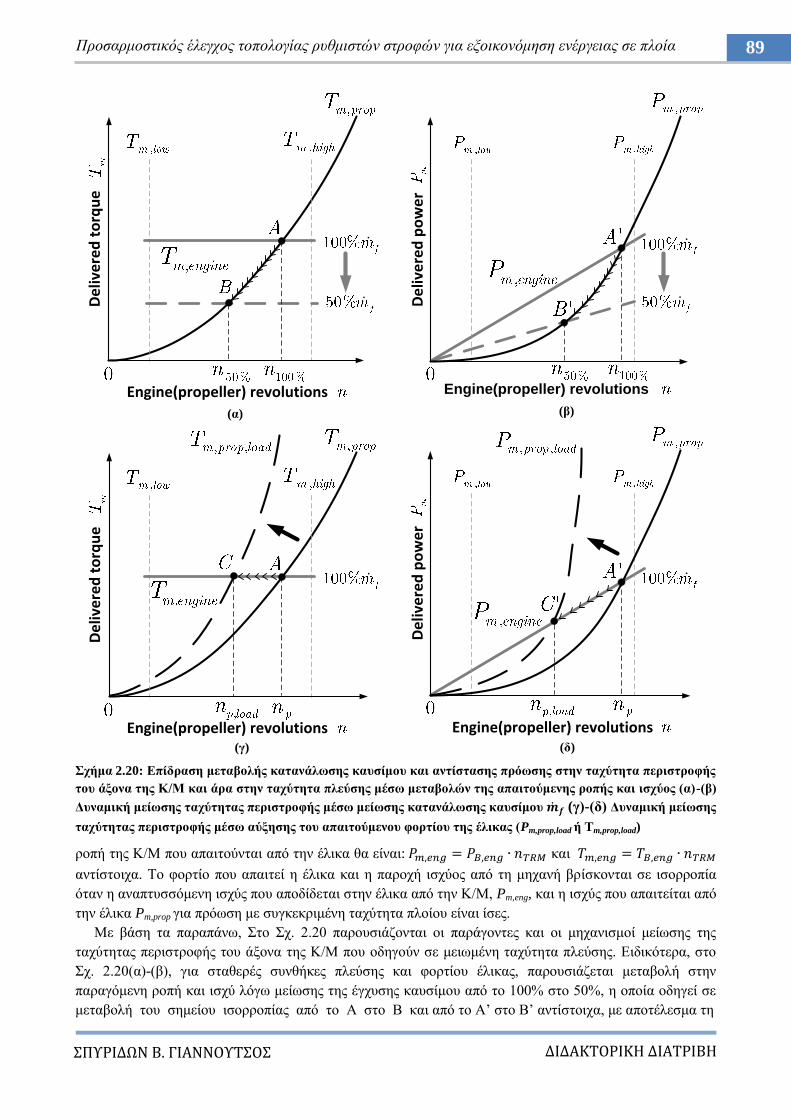
ΔΙΔΑΚΣΟΡΙΚΗ ΔΙΑΣΡΙΒΗ
ΠΤΡΙΔΩΝ Β. ΓΙΑΝΝΟΤΣΟ
89 Πξνζαξκνζηηθόο έιεγρνο ηνπνινγίαο ξπζκηζηώλ ζηξνθώλ γηα εμνηθνλόκεζε ελέξγεηαο ζε πινία
ρήκα 2.20: Δπίδξαζε κεηαβνιήο θαηαλάισζεο θαπζίκνπ θαη αληίζηαζεο πξόσζεο ζηελ ηαρύηεηα πεξηζηξνθήο
ηνπ άμνλα ηεο Κ/Μ θαη άξα ζηελ ηαρύηεηα πιεύζεο κέζσ κεηαβνιώλ ηεο απαηηνύκελεο ξνπήο θαη ηζρύνο (α)-(β)
Γπλακηθή κείσζεο ηαρύηεηαο πεξηζηξνθήο κέζσ κείσζεο θαηαλάισζεο θαπζίκνπ (γ)-(δ) Γπλακηθή κείσζεο
ηαρύηεηαο πεξηζηξνθήο κέζσ αύμεζεο ηνπ απαηηνύκελνπ θνξηίνπ ηεο έιηθαο (Pm,prop,load ή Tm,prop,load)
ξνπή ηεο Κ/Μ πνπ απαηηνύληαη από ηελ έιηθα ζα είλαη: θαη
αληίζηνηρα. Σν θνξηίν πνπ απαηηεί ε έιηθα θαη ε παξνρή ηζρύνο από ηε κεραλή βξίζθνληαη ζε ηζνξξνπία
όηαλ ε αλαπηπζζόκελε ηζρύο πνπ απνδίδεηαη ζηελ έιηθα από ηελ Κ/Μ, Pm,eng, θαη ε ηζρύο πνπ απαηηείηαη από
ηελ έιηθα Pm,prop γηα πξόσζε κε ζπγθεθξηκέλε ηαρύηεηα πινίνπ είλαη ίζεο.
Με βάζε ηα παξαπάλσ, ην ρ. 2.20 παξνπζηάδνληαη νη παξάγνληεο θαη νη κεραληζκνί κείσζεο ηεο
ηαρύηεηαο πεξηζηξνθήο ηνπ άμνλα ηεο Κ/Μ πνπ νδεγνύλ ζε κεησκέλε ηαρύηεηα πιεύζεο. Δηδηθόηεξα, ζην
ρ. 2.20(α)-(β), γηα ζηαζεξέο ζπλζήθεο πιεύζεο θαη θνξηίνπ έιηθαο, παξνπζηάδεηαη κεηαβνιή ζηελ
παξαγόκελε ξνπή θαη ηζρύ ιόγσ κείσζεο ηεο έγρπζεο θαπζίκνπ από ην 100% ζην 50%, ε νπνία νδεγεί ζε
κεηαβνιή ηνπ ζεκείνπ ηζνξξνπίαο από ην Α ζην Β θαη από ην Α‟ ζην Β‟ αληίζηνηρα, κε απνηέιεζκα ηε
De
live
red
to
rqu
e
Engine(propeller) revolutions
De
live
red
po
we
r
Engine(propeller) revolutions
De
live
red
to
rqu
e
Engine(propeller) revolutions
De
live
red
po
we
r
Engine(propeller) revolutions
(α) (β)
(γ) (δ)
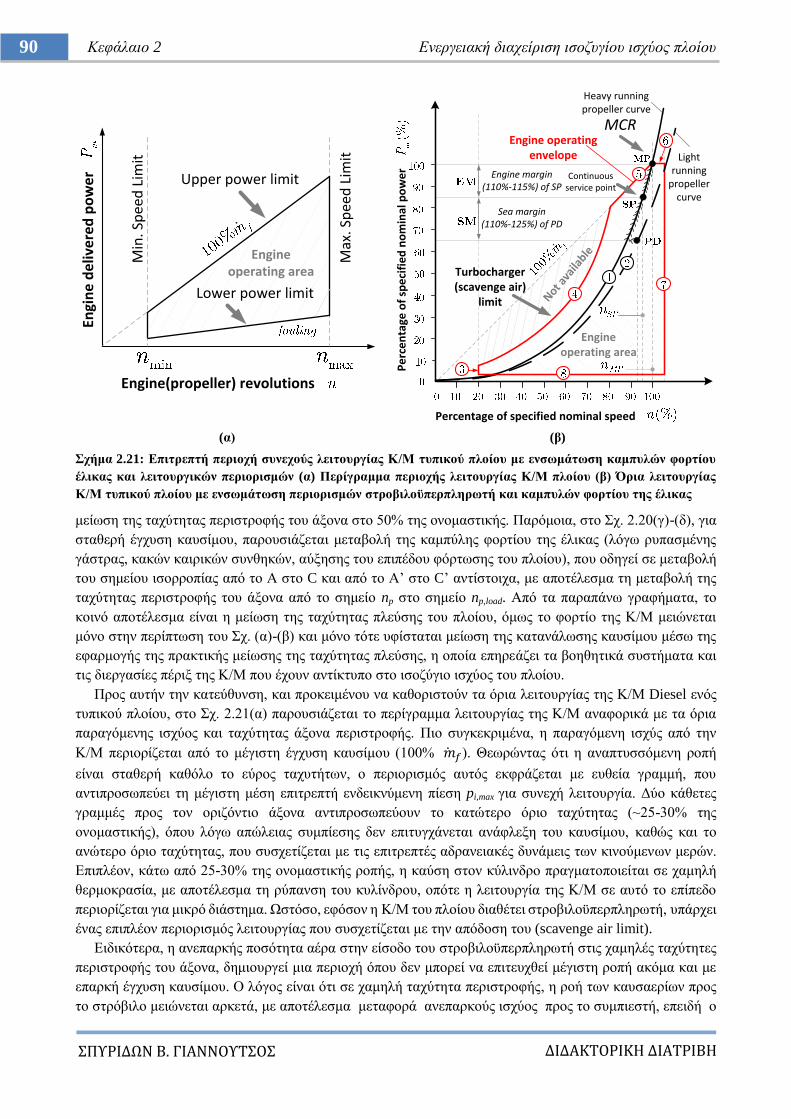
ΔΙΔΑΚΣΟΡΙΚΗ ΔΙΑΣΡΙΒΗ
ΠΤΡΙΔΩΝ Β. ΓΙΑΝΝΟΤΣΟ
90 Κεθάιαην 2 Δλεξγεηαθή δηαρείξηζε ηζνδπγίνπ ηζρύνο πινίνπ
(α) (β)
ρήκα 2.21: Δπηηξεπηή πεξηνρή ζπλερνύο ιεηηνπξγίαο Κ/Μ ηππηθνύ πινίνπ κε ελζσκάησζε θακππιώλ θνξηίνπ
έιηθαο θαη ιεηηνπξγηθώλ πεξηνξηζκώλ (α) Πεξίγξακκα πεξηνρήο ιεηηνπξγίαο Κ/Μ πινίνπ (β) Όξηα ιεηηνπξγίαο
Κ/Μ ηππηθνύ πινίνπ κε ελζσκάησζε πεξηνξηζκώλ ζηξνβηινϋπεξπιεξσηή θαη θακππιώλ θνξηίνπ ηεο έιηθαο
κείσζε ηεο ηαρύηεηαο πεξηζηξνθήο ηνπ άμνλα ζην 50% ηεο νλνκαζηηθήο. Παξόκνηα, ζην ρ. 2.20(γ)-(δ), γηα
ζηαζεξή έγρπζε θαπζίκνπ, παξνπζηάδεηαη κεηαβνιή ηεο θακπύιεο θνξηίνπ ηεο έιηθαο (ιόγσ ξππαζκέλεο
γάζηξαο, θαθώλ θαηξηθώλ ζπλζεθώλ, αύμεζεο ηνπ επηπέδνπ θόξησζεο ηνπ πινίνπ), πνπ νδεγεί ζε κεηαβνιή
ηνπ ζεκείνπ ηζνξξνπίαο από ην Α ζην C θαη από ην Α‟ ζην C‟ αληίζηνηρα, κε απνηέιεζκα ηε κεηαβνιή ηεο
ηαρύηεηαο πεξηζηξνθήο ηνπ άμνλα από ην ζεκείν np ζην ζεκείν np,load. Από ηα παξαπάλσ γξαθήκαηα, ην
θνηλό απνηέιεζκα είλαη ε κείσζε ηεο ηαρύηεηαο πιεύζεο ηνπ πινίνπ, όκσο ην θνξηίν ηεο Κ/Μ κεηώλεηαη
κόλν ζηελ πεξίπησζε ηνπ ρ. (α)-(β) θαη κόλν ηόηε πθίζηαηαη κείσζε ηεο θαηαλάισζεο θαπζίκνπ κέζσ ηεο
εθαξκνγήο ηεο πξαθηηθήο κείσζεο ηεο ηαρύηεηαο πιεύζεο, ε νπνία επεξεάδεη ηα βνεζεηηθά ζπζηήκαηα θαη
ηηο δηεξγαζίεο πέξημ ηεο Κ/Μ πνπ έρνπλ αληίθηππν ζην ηζνδύγην ηζρύνο ηνπ πινίνπ.
Πξνο απηήλ ηελ θαηεύζπλζε, θαη πξνθεηκέλνπ λα θαζνξηζηνύλ ηα όξηα ιεηηνπξγίαο ηεο Κ/Μ Diesel ελόο
ηππηθνύ πινίνπ, ζην ρ. 2.21(α) παξνπζηάδεηαη ην πεξίγξακκα ιεηηνπξγίαο ηεο Κ/Μ αλαθνξηθά κε ηα όξηα
παξαγόκελεο ηζρύνο θαη ηαρύηεηαο άμνλα πεξηζηξνθήο. Πην ζπγθεθξηκέλα, ε παξαγόκελε ηζρύο από ηελ
Κ/Μ πεξηνξίδεηαη από ην κέγηζηε έγρπζε θαπζίκνπ (100% ). Θεσξώληαο όηη ε αλαπηπζζόκελε ξνπή
είλαη ζηαζεξή θαζόιν ην εύξνο ηαρπηήησλ, ν πεξηνξηζκόο απηόο εθθξάδεηαη κε επζεία γξακκή, πνπ
αληηπξνζσπεύεη ηε κέγηζηε κέζε επηηξεπηή ελδεηθλύκελε πίεζε pi,max γηα ζπλερή ιεηηνπξγία. Γύν θάζεηεο
γξακκέο πξνο ηνλ νξηδόληην άμνλα αληηπξνζσπεύνπλ ην θαηώηεξν όξην ηαρύηεηαο (~25-30% ηεο
νλνκαζηηθήο), όπνπ ιόγσ απώιεηαο ζπκπίεζεο δελ επηηπγράλεηαη αλάθιεμε ηνπ θαπζίκνπ, θαζώο θαη ην
αλώηεξν όξην ηαρύηεηαο, πνπ ζπζρεηίδεηαη κε ηηο επηηξεπηέο αδξαλεηαθέο δπλάκεηο ησλ θηλνύκελσλ κεξώλ.
Δπηπιένλ, θάησ από 25-30% ηεο νλνκαζηηθήο ξνπήο, ε θαύζε ζηνλ θύιηλδξν πξαγκαηνπνηείηαη ζε ρακειή
ζεξκνθξαζία, κε απνηέιεζκα ηε ξύπαλζε ηνπ θπιίλδξνπ, νπόηε ε ιεηηνπξγία ηεο Κ/Μ ζε απηό ην επίπεδν
πεξηνξίδεηαη γηα κηθξό δηάζηεκα. Χζηόζν, εθόζνλ ε Κ/Μ ηνπ πινίνπ δηαζέηεη ζηξνβηινϋπεξπιεξσηή, ππάξρεη
έλαο επηπιένλ πεξηνξηζκόο ιεηηνπξγίαο πνπ ζπζρεηίδεηαη κε ηελ απόδνζε ηνπ (scavenge air limit).
Δηδηθόηεξα, ε αλεπαξθήο πνζόηεηα αέξα ζηελ είζνδν ηνπ ζηξνβηινϋπεξπιεξσηή ζηηο ρακειέο ηαρύηεηεο
πεξηζηξνθήο ηνπ άμνλα, δεκηνπξγεί κηα πεξηνρή όπνπ δελ κπνξεί λα επηηεπρζεί κέγηζηε ξνπή αθόκα θαη κε
επαξθή έγρπζε θαπζίκνπ. Ο ιόγνο είλαη όηη ζε ρακειή ηαρύηεηα πεξηζηξνθήο, ε ξνή ησλ θαπζαεξίσλ πξνο
ην ζηξόβηιν κεηώλεηαη αξθεηά, κε απνηέιεζκα κεηαθνξά αλεπαξθνύο ηζρύνο πξνο ην ζπκπηεζηή, επεηδή ν
Εngi
ne
de
live
red
po
we
r
Engine(propeller) revolutions
Min
. Sp
eed
Lim
it
Max
. Sp
eed
Lim
it
Upper power limit
Lower power limit
Engine operating area
Turbocharger(scavenge air)
limit Not ava
ilable
Engine operating envelope
Percentage of specified nominal speed
Pe
rce
nta
ge o
f sp
eci
fie
d n
om
inal
po
we
r
Engine operating area
Heavy runningpropeller curve
Light running
propellercurve
Engine margin(110%-115%) of SP
Sea margin(110%-125%) of PD
Continuous service point
MCR
ΔΙΔΑΚΣΟΡΙΚΗ ΔΙΑΣΡΙΒΗ
ΠΤΡΙΔΩΝ Β. ΓΙΑΝΝΟΤΣΟ
91 Πξνζαξκνζηηθόο έιεγρνο ηνπνινγίαο ξπζκηζηώλ ζηξνθώλ γηα εμνηθνλόκεζε ελέξγεηαο ζε πινία
ιόγνο πίεζεο ηνπ ζηξνβίινπ κεηώλεηαη κε ηε κείσζε ηεο ξνήο γηα ζηαζεξή δηαηνκή. Απηό έρεη σο
απνηέιεζκα ν ζπκπηεζηήο λα κελ κπνξεί λα δηαηεξήζεη ηελ αξρηθή ηαρύηεηα πεξηζηξνθήο, νδεγώληαο ζε
πηώζε ηεο πίεζεο εμόδνπ. Ζ πνζόηεηα αέξα ζην ζάιακν ζάξσζεο ινηπόλ κεηώλεηαη, κε απνηέιεζκα ν ιόγνο
αέξα-θαπζίκνπ λα κεηώλεηαη γηα ζηαζεξή έγρπζε θαπζίκνπ. πλεπώο, απηό νδεγεί ηειηθά ζε εκηηειή θαύζε
θαη ζε πςειή ζεξκνθξαζία θαπζαεξίσλ πνπ κπνξεί λα πξνθαιέζεη ζεξκηθή ππεξθόξηηζε ηεο Κ/Μ.
Δπηπιένλ, ε ρακειή ηαρύηεηα πεξηζηξνθήο ηνπ ζπκπηεζηή κπνξεί λα πξνθαιέζεη θαηλόκελν θπκαηηζκνύ
ζην ζπκπηεζηή, εθόζνλ ε δηαθνξά ηεο ρακειήο παξνρήο αέξα ζην ζπκπηεζηή ζε ζρέζε κε ηελ πςειή
αληίζιηςε ζην ζάιακν ζάξσζεο κπνξεί λα θέξεη αζηάζεηα ζην ζπκπηεζηή. Γηα ηνλ πεξηνξηζκό ησλ
θαηλνκέλσλ εκηηεινύο θαύζεο θαη θπκάησζεο ζην ζπκπηεζηή, εηζάγεηαη ζην δηάγξακκα ην όξην ιεηηνπξγίαο
ηνπ ζηξνβηινϋπεξπιεξσηή, πνπ πεξηνξίδεη ηελ πεξηνρή ιεηηνπξγίαο ηεο Κ/Μ, κε απνηειέζκα ε κέγηζηε
ξνπή λα αλαπηύζζεηαη κόλν ζηελ πεξηνρή πςειώλ ηαρπηήησλ. Παξάιιεια, ιόγσ ηεο παιηλδξνκηθήο
θίλεζεο ησλ εκβόισλ ηεο Κ/Μ, ππάξρεη κηα πεξηνρή ηαρπηήησλ θνληά ζην 40% ηεο νλνκαζηηθήο πνπ
δεκηνπξγνύληαη ηαιαληώζεηο θνληά ζηε ζπρλόηεηα ζπληνληζκνύ (barred speed range) θαη ε κόληκε
ιεηηνπξγία ηεο Κ/Μ ζε απηήλ ηελ πεξηνρή απνθεύγεηαη. Πξνο απηή ηελ θαηεύζπλζε, ν ζρεδηαζκόο ηεο
πεξηνρήο ιεηηνπξγίαο ηεο Κ/Μ πξνζαξκόδεηαη ελζσκαηώλνληαο ηνπο πεξηνξηζκνύο πνπ αλαθέξζεθαλ, έηζη
ώζηε λα θαιύπηεη ηελ θακπύιε θνξηίνπ πνπ απαηηεί ε έιηθα γηα ηηο δηάθνξεο ιεηηνπξγηθέο θαηαζηάζεηο ηνπ
πινίνπ, ελώ ιακβάλεηαη ππόςε θαη ε πεξηνρή βέιηηζηεο ιεηηνπξγίαο. Σα παξαπάλσ απνηππώλνληαη ζην
δηάγξακκα ηνπ ρ. 2.21(β), όπνπ παξνπζηάδεηαη ε πεξηνρή ιεηηνπξγίαο ηεο Κ/Μ ελόο ηππηθνύ πινίνπ,
ελζσκαηώλνληαο ηε θακπύιε θόξηηζεο ηεο έιηθαο ζε δηάθνξεο ιεηηνπξγηθέο θαηαζηάζεηο.
ηηο ζπλζήθεο ζρεδηαζκνύ, ε θακπύιε θνξηίνπ ηεο έιηθαο (heavy running propeller curve – θακπύιε 1)
ζρεδηάδεηαη πάλσ ζην ιεηηνπξγηθό δηάγξακκα ηεο Κ/Μ ηνπ ρ. 2.21(β) κε θξηηήξηα ηε κέζε ξύπαλζε ηεο
γάζηξαο, ην κέγηζην βύζηζκα θαη ηηο θαιέο θαηξηθέο ζπλζήθεο. Ζ επηινγή ηεο Κ/Μ γίλεηαη ώζηε ζε απηέο ηηο
ζπλζήθεο ε Κ/Μ λα κπνξεί λα αλαπηύμεη κέγηζηε ηζρύ ζηε κέγηζηε ηαρύηεηα πεξηζηξνθήο. Χζηόζν ππάξρεη
πεξίπησζε ε γάζηξα λα ξππαλζεί αθόκε πεξηζζόηεξν, νη θαηξηθέο ζπλζήθεο λα ρεηξνηεξέςνπλ ή ην πινίν λα
θηλείηαη ζε ξερά λεξά, όπνπ ε θακπύιε θνξηίνπ ηεο έιηθαο κεηαθηλείηαη πξνο ηα αξηζηεξά, κε απνηέιεζκα ε
Κ/Μ λα κελ κπνξεί λα απνδώζεη ηελ πιήξε ηζρύ ιόγσ ησλ νξίσλ ηνπ ζηξνβηινϋπεξπιεξσηή (θακπύιε 4)
θαη ην πινίν λα αδπλαηεί λα πιεύζεη ζηελ ηαρύηεηα ζρεδηαζκνύ. Παξόκνηα, ζε πεξίπησζε θαζαξήο γάζηξαο
ή βνεζεηηθώλ ξεπκάησλ, ε θακπύιε θνξηίνπ ηεο έιηθαο κεηαθηλείηαη πξνο ηα δεμηά (light running propeller
curve – θακπύιε 2), κε απνηέιεζκα πάιη ε Κ/Μ λα αδπλαηεί λα απνδώζεη ηελ πιήξε ηζρύ ιόγσ πεξηνξηζκνύ
κέγηζηεο δπλαηήο ηαρύηεηαο πεξηζηξνθήο (θακπύιε 7). H θακπύιε 2 απνηειεί ηελ αλαθνξά θακπύιεο
θνξηίνπ ηεο έιηθαο όπνπ γίλνληαη νη ζαιάζζηεο δνθηκέο θαηά ηελ παξάδνζε ηνπ πινίνπ. ε απηήλ ηελ
θακπύιε νξίδεηαη ην ζεκείν ζρεδηαζκνύ ηεο έιηθαο (propeller design point – PD), πνπ απνηειεί ζεκείν
αλαθνξάο ιεηηνπγίαο γηα βέιηηζηεο θαηαζηάζεηο ιεηηνπξγίαο (θαζαξή γάζηξα, θαιόο θαηξόο). Πάλσ ζηελ
θακπύιε θνξηίνπ ηεο έιηθαο ζηηο ζπλζήθεο ζρεδηαζκνύ, νξίδεηαη ην ζεκείν κέγηζηεο ζπλερνύο παξαγόκελεο
ηζρύνο (maximum continuous rating – MCR), πνπ είλαη ην ζεκείν ηνπ δηαγξάκκαηνο ιεηηνπξγίαο ηεο Κ/Μ
όπνπ παξάγεηαη ζην κέγηζην ηζρύνο (100% ηνπ Pm,MCR) ζηε κέγηζηε ηαρύηεηα πεξηζηξνθήο (100% ηνπ nMP).
Σν ζεκείν εηδηθήο κέγηζηεο ηζρύνο ηεο Κ/Μ (engine specified MCR point – MP) είλαη ε κέγηζηε ηζρύο πνπ
απαηηείηαη από ηελ έιηθα γηα ηε ζπλερή ιεηηνπξγία ηεο Κ/Μ. Δθόζνλ ην ηππηθό πινίν ππό κειέηε δε δηαζέηεη
Ζ/Γ άμνλα (shaft generator) θαη δελ απαηηείηαη πεξαηηέξσ πεξηζώξην ηζρύνο, ην ζεκείν MP ηαπηίδεηαη κε ην
MCR. Δθηόο ηνπ ζεκείνπ MP, ζηελ θακπύιε 1 νξίδεηαη ην ζεκείν ζπλερνύο ππεξεζηαθήο ιεηηνπξγίαο SP
(continuous service rating – CSR), πνπ αληηπξνζσπεύεη ηελ κέγηζηε απαηηνύκελε ηζρύ από ηελ Κ/Μ ηελ
πιεηνςεθία ηνπ ρξόλνπ, Pm,CSR, γηα ηελ επίηεπμε ηεο ηαρύηεηαο ζρεδηαζκνύ nSP. Σν ζεκείν SP ελζσκαηώλεη
ην πεξηζώξην ηζρύνο γηα ππεξεζηαθέο ζπλζήθεο ζαιάζζαο (sea margin – SM), πνπ έρεη ηππηθή ηηκή 10%-25%
ζε ζρέζε κε ην ζεκείν PD, πξνθεηκέλνπ λα ιεθζνύλ ππόςε νη δηαθνξέο ζηηο θαηξηθέο ζπλζήθεο θαη ζηε
ξύπαλζε ηεο γάζηξαο ζε ζρέζε κε ηηο ζπλζήθεο πνπ επηθξαηνύλ θαηά ηηο ζαιάζζηεο δνθηκέο. ην πεξηζώξην
απηό πξνζηίζεηαη θαη ην πεξηζώξην ιεηηνπξγίαο ηεο Κ/Μ (engine margin – ΔΜ), ην νπνίν έρεη ηππηθή ηηκή
10%-15% θαη πεξηιακβάλεη ην πεξηζώξην αληίδξαζεο ηεο Κ/Μ ζηελ επηηάρπλζε ηνπ πινίνπ. Σν ζεκείν
κέγηζηεο ζπλερνύο παξαγόκελεο ηζρύνο, MCR, επηιέγεηαη πεξηιακβάλνληαο ηα πεξηζώξηα SM θαη EM.
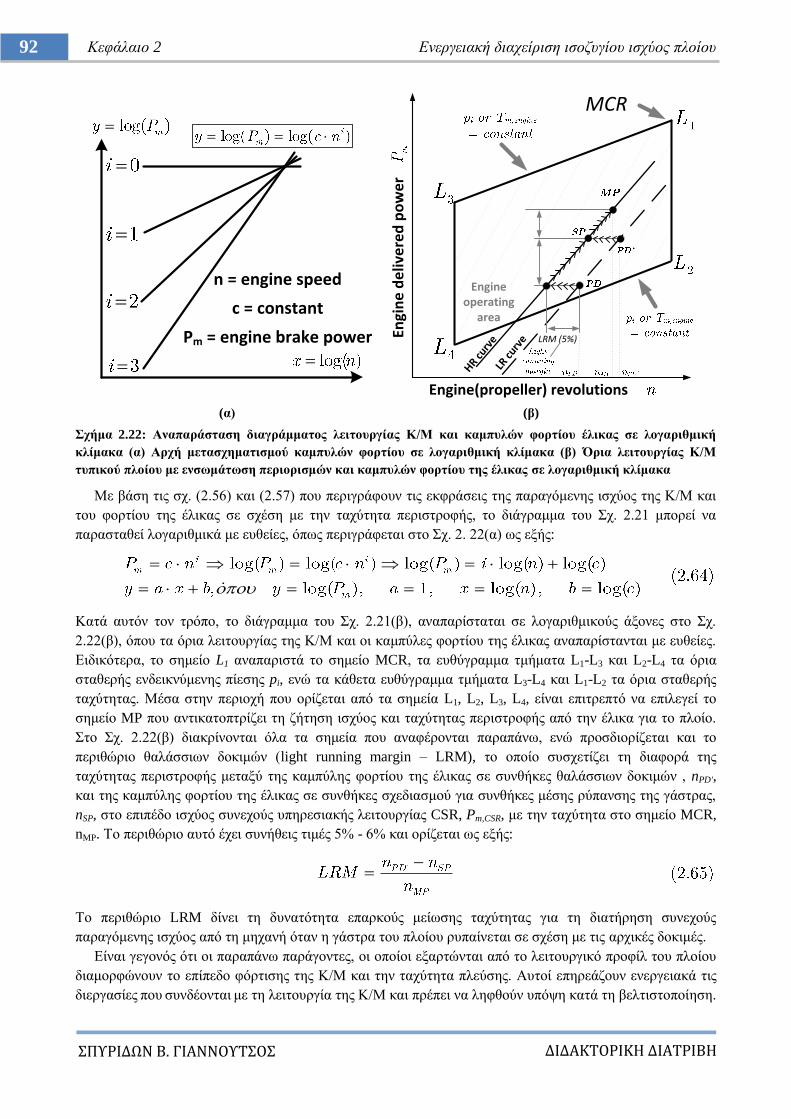
ΔΙΔΑΚΣΟΡΙΚΗ ΔΙΑΣΡΙΒΗ
ΠΤΡΙΔΩΝ Β. ΓΙΑΝΝΟΤΣΟ
92 Κεθάιαην 2 Δλεξγεηαθή δηαρείξηζε ηζνδπγίνπ ηζρύνο πινίνπ
(α) (β)
ρήκα 2.22: Αλαπαξάζηαζε δηαγξάκκαηνο ιεηηνπξγίαο Κ/Μ θαη θακππιώλ θνξηίνπ έιηθαο ζε ινγαξηζκηθή
θιίκαθα (α) Αξρή κεηαζρεκαηηζκνύ θακππιώλ θνξηίνπ ζε ινγαξηζκηθή θιίκαθα (β) Όξηα ιεηηνπξγίαο Κ/Μ
ηππηθνύ πινίνπ κε ελζσκάησζε πεξηνξηζκώλ θαη θακππιώλ θνξηίνπ ηεο έιηθαο ζε ινγαξηζκηθή θιίκαθα
Με βάζε ηηο ζρ. (2.56) θαη (2.57) πνπ πεξηγξάθνπλ ηηο εθθξάζεηο ηεο παξαγόκελεο ηζρύνο ηεο Κ/Μ θαη
ηνπ θνξηίνπ ηεο έιηθαο ζε ζρέζε κε ηελ ηαρύηεηα πεξηζηξνθήο, ην δηάγξακκα ηνπ ρ. 2.21 κπνξεί λα
παξαζηαζεί ινγαξηζκηθά κε επζείεο, όπσο πεξηγξάθεηαη ζην ρ. 2. 22(α) σο εμήο:
Καηά απηόλ ηνλ ηξόπν, ην δηάγξακκα ηνπ ρ. 2.21(β), αλαπαξίζηαηαη ζε ινγαξηζκηθνύο άμνλεο ζην ρ.
2.22(β), όπνπ ηα όξηα ιεηηνπξγίαο ηεο Κ/Μ θαη νη θακπύιεο θνξηίνπ ηεο έιηθαο αλαπαξίζηαληαη κε επζείεο.
Δηδηθόηεξα, ην ζεκείν L1 αλαπαξηζηά ην ζεκείν MCR, ηα επζύγξακκα ηκήκαηα L1-L3 θαη L2-L4 ηα όξηα
ζηαζεξήο ελδεηθλύκελεο πίεζεο pi, ελώ ηα θάζεηα επζύγξακκα ηκήκαηα L3-L4 θαη L1-L2 ηα όξηα ζηαζεξήο
ηαρύηεηαο. Μέζα ζηελ πεξηνρή πνπ νξίδεηαη από ηα ζεκεία L1, L2, L3, L4, είλαη επηηξεπηό λα επηιεγεί ην
ζεκείν MP πνπ αληηθαηνπηξίδεη ηε δήηεζε ηζρύνο θαη ηαρύηεηαο πεξηζηξνθήο από ηελ έιηθα γηα ην πινίν.
ην ρ. 2.22(β) δηαθξίλνληαη όια ηα ζεκεία πνπ αλαθέξνληαη παξαπάλσ, ελώ πξνζδηνξίδεηαη θαη ην
πεξηζώξην ζαιάζζησλ δνθηκώλ (light running margin – LRM), ην νπνίν ζπζρεηίδεη ηε δηαθνξά ηεο
ηαρύηεηαο πεξηζηξνθήο κεηαμύ ηεο θακπύιεο θνξηίνπ ηεο έιηθαο ζε ζπλζήθεο ζαιάζζησλ δνθηκώλ , nPD',
θαη ηεο θακπύιεο θνξηίνπ ηεο έιηθαο ζε ζπλζήθεο ζρεδηαζκνύ γηα ζπλζήθεο κέζεο ξύπαλζεο ηεο γάζηξαο,
nSP, ζην επηπέδν ηζρύνο ζπλερνύο ππεξεζηαθήο ιεηηνπξγίαο CSR, Pm,CSR, κε ηελ ηαρύηεηα ζην ζεκείν MCR,
nMP. Σν πεξηζώξην απηό έρεη ζπλήζεηο ηηκέο 5% - 6% θαη νξίδεηαη σο εμήο:
Σν πεξηζώξην LRM δίλεη ηε δπλαηόηεηα επαξθνύο κείσζεο ηαρύηεηαο γηα ηε δηαηήξεζε ζπλερνύο
παξαγόκελεο ηζρύνο από ηε κεραλή όηαλ ε γάζηξα ηνπ πινίνπ ξππαίλεηαη ζε ζρέζε κε ηηο αξρηθέο δνθηκέο.
Δίλαη γεγνλόο όηη νη παξαπάλσ παξάγνληεο, νη νπνίνη εμαξηώληαη από ην ιεηηνπξγηθό πξνθίι ηνπ πινίνπ
δηακνξθώλνπλ ην επίπεδν θόξηηζεο ηεο Κ/Μ θαη ηελ ηαρύηεηα πιεύζεο. Απηνί επεξεάδνπλ ελεξγεηαθά ηηο
δηεξγαζίεο πνπ ζπλδένληαη κε ηε ιεηηνπξγία ηεο Κ/Μ θαη πξέπεη λα ιεθζνύλ ππόςε θαηά ηε βειηηζηνπνίεζε.
n = engine speed
c = constant
Pm = engine brake power Εngi
ne
de
live
red
po
we
r Engine(propeller) revolutions
LR cu
rve
HR curv
e
Engine operating
area
LRM (5%)
MCR
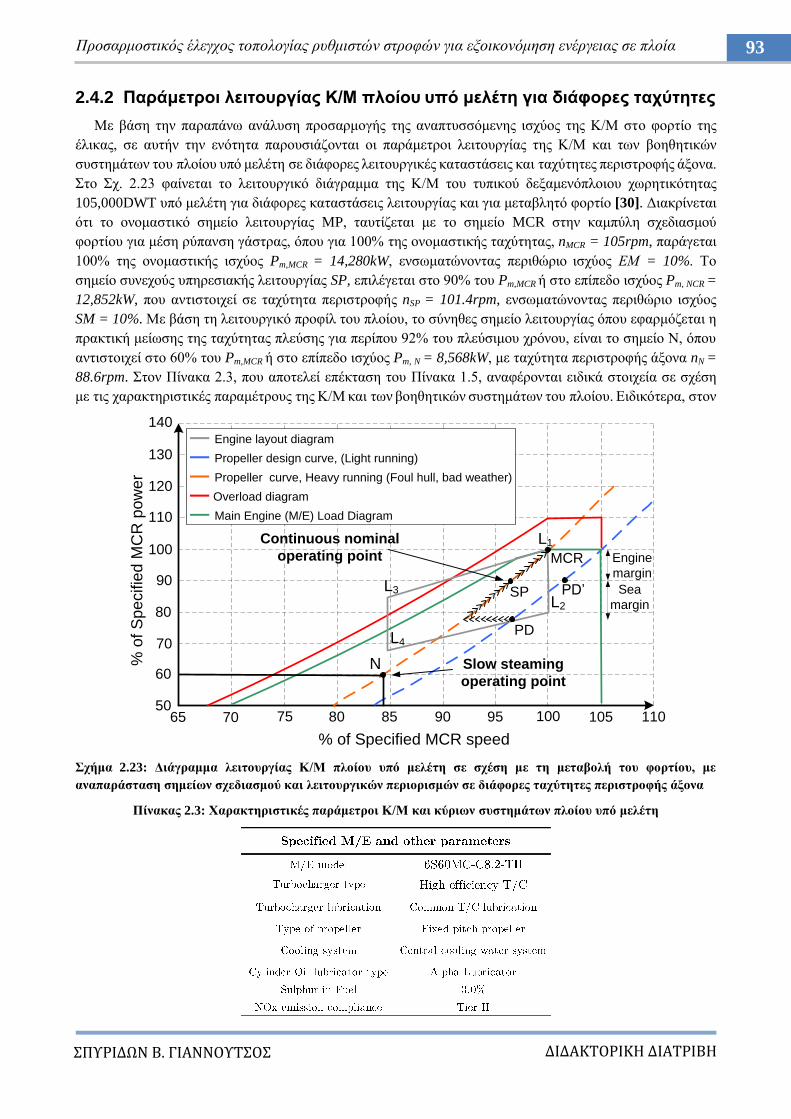
ΔΙΔΑΚΣΟΡΙΚΗ ΔΙΑΣΡΙΒΗ
ΠΤΡΙΔΩΝ Β. ΓΙΑΝΝΟΤΣΟ
93 Πξνζαξκνζηηθόο έιεγρνο ηνπνινγίαο ξπζκηζηώλ ζηξνθώλ γηα εμνηθνλόκεζε ελέξγεηαο ζε πινία
2.4.2 Παξάκεηξνη ιεηηνπξγίαο Κ/Μ πινίνπ ππό κειέηε γηα δηάθνξεο ηαρύηεηεο
Με βάζε ηελ παξαπάλσ αλάιπζε πξνζαξκνγήο ηεο αλαπηπζζόκελεο ηζρύνο ηεο Κ/Μ ζην θνξηίν ηεο
έιηθαο, ζε απηήλ ηελ ελόηεηα παξνπζηάδνληαη νη παξάκεηξνη ιεηηνπξγίαο ηεο Κ/Μ θαη ησλ βνεζεηηθώλ
ζπζηεκάησλ ηνπ πινίνπ ππό κειέηε ζε δηάθνξεο ιεηηνπξγηθέο θαηαζηάζεηο θαη ηαρύηεηεο πεξηζηξνθήο άμνλα.
ην ρ. 2.23 θαίλεηαη ην ιεηηνπξγηθό δηάγξακκα ηεο Κ/Μ ηνπ ηππηθνύ δεμακελόπινηνπ ρσξεηηθόηεηαο
105,000DWT ππό κειέηε γηα δηάθνξεο θαηαζηάζεηο ιεηηνπξγίαο θαη γηα κεηαβιεηό θνξηίν [30]. Γηαθξίλεηαη
όηη ην νλνκαζηηθό ζεκείν ιεηηνπξγίαο MP, ηαπηίδεηαη κε ην ζεκείν MCR ζηελ θακπύιε ζρεδηαζκνύ
θνξηίνπ γηα κέζε ξύπαλζε γάζηξαο, όπνπ γηα 100% ηεο νλνκαζηηθήο ηαρύηεηαο, nMCR = 105rpm, παξάγεηαη
100% ηεο νλνκαζηηθήο ηζρύνο Pm,MCR = 14,280kW, ελζσκαηώλνληαο πεξηζώξην ηζρύνο ΔΜ = 10%. Σν
ζεκείν ζπλερνύο ππεξεζηαθήο ιεηηνπξγίαο SP, επηιέγεηαη ζην 90% ηνπ Pm,MCR ή ζην επίπεδν ηζρύνο Pm, NCR =
12,852kW, πνπ αληηζηνηρεί ζε ηαρύηεηα πεξηζηξνθήο nSP = 101.4rpm, ελζσκαηώλνληαο πεξηζώξην ηζρύνο
SM = 10%. Με βάζε ηε ιεηηνπξγηθό πξνθίι ηνπ πινίνπ, ην ζύλεζεο ζεκείν ιεηηνπξγίαο όπνπ εθαξκόδεηαη ε
πξαθηηθή κείσζεο ηεο ηαρύηεηαο πιεύζεο γηα πεξίπνπ 92% ηνπ πιεύζηκνπ ρξόλνπ, είλαη ην ζεκείν Ν, όπνπ
αληηζηνηρεί ζην 60% ηνπ Pm,MCR ή ζην επίπεδν ηζρύνο Pm, N = 8,568kW, κε ηαρύηεηα πεξηζηξνθήο άμνλα nN =
88.6rpm. ηνλ Πίλαθα 2.3, πνπ απνηειεί επέθηαζε ηνπ Πίλαθα 1.5, αλαθέξνληαη εηδηθά ζηνηρεία ζε ζρέζε
κε ηηο ραξαθηεξηζηηθέο παξακέηξνπο ηεο Κ/Μ θαη ησλ βνεζεηηθώλ ζπζηεκάησλ ηνπ πινίνπ. Δηδηθόηεξα, ζηνλ
ρήκα 2.23: Γηάγξακκα ιεηηνπξγίαο Κ/Μ πινίνπ ππό κειέηε ζε ζρέζε κε ηε κεηαβνιή ηνπ θνξηίνπ, κε
αλαπαξάζηαζε ζεκείσλ ζρεδηαζκνύ θαη ιεηηνπξγηθώλ πεξηνξηζκώλ ζε δηάθνξεο ηαρύηεηεο πεξηζηξνθήο άμνλα
Πίλαθαο 2.3: Υαξαθηεξηζηηθέο παξάκεηξνη Κ/Μ θαη θύξησλ ζπζηεκάησλ πινίνπ ππό κειέηε
65 70 75 80 85 90 95 100 105 11050
60
70
80
90
100
110
120
130
140
% o
f S
pe
cifie
d M
CR
po
we
r
% of Specified MCR speed
— Engine layout diagram
— Propeller design curve, (Light running)
— Propeller curve, Heavy running (Foul hull, bad weather)
— Overload diagram
— Main Engine (M/E) Load Diagram
L1
L3
L2
L4
MCR
N
SP
Engine
margin
Sea
margin
PD
PD’
Slow steaming
operating point
Continuous nominal
operating point
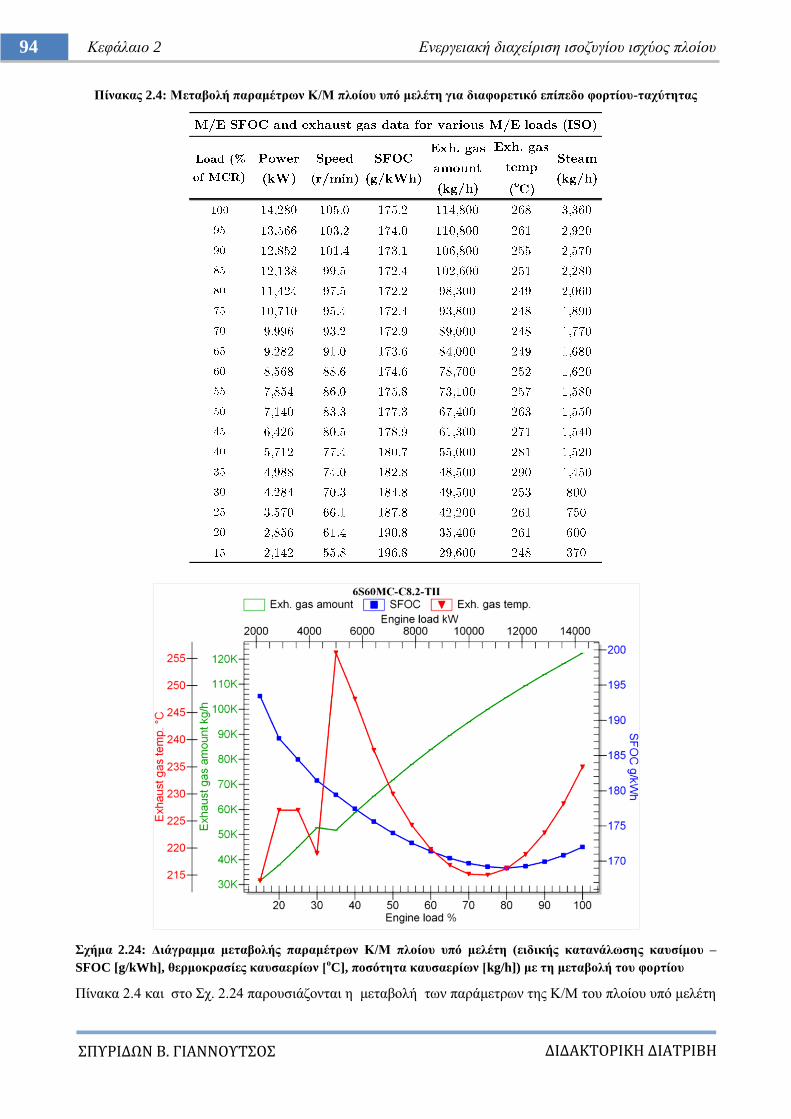
ΔΙΔΑΚΣΟΡΙΚΗ ΔΙΑΣΡΙΒΗ
ΠΤΡΙΔΩΝ Β. ΓΙΑΝΝΟΤΣΟ
94 Κεθάιαην 2 Δλεξγεηαθή δηαρείξηζε ηζνδπγίνπ ηζρύνο πινίνπ
Πίλαθαο 2.4: Μεηαβνιή παξακέηξσλ Κ/Μ πινίνπ ππό κειέηε γηα δηαθνξεηηθό επίπεδν θνξηίνπ-ηαρύηεηαο
ρήκα 2.24: Γηάγξακκα κεηαβνιήο παξακέηξσλ Κ/Μ πινίνπ ππό κειέηε (εηδηθήο θαηαλάισζεο θαπζίκνπ –
SFOC [g/kWh], ζεξκνθξαζίεο θαπζαεξίσλ [νC], πνζόηεηα θαπζαεξίσλ [kg/h]) κε ηε κεηαβνιή ηνπ θνξηίνπ
Πίλαθα 2.4 θαη ζην ρ. 2.24 παξνπζηάδνληαη ε κεηαβνιή ησλ παξάκεηξσλ ηεο Κ/Μ ηνπ πινίνπ ππό κειέηε
ΔΙΔΑΚΣΟΡΙΚΗ ΔΙΑΣΡΙΒΗ
ΠΤΡΙΔΩΝ Β. ΓΙΑΝΝΟΤΣΟ
95 Πξνζαξκνζηηθόο έιεγρνο ηνπνινγίαο ξπζκηζηώλ ζηξνθώλ γηα εμνηθνλόκεζε ελέξγεηαο ζε πινία
Πίλαθαο 2.5: Γηαζηαζηνιόγεζε αληιηώλ θύξησλ ππνζπζηεκάησλ πινίνπ ππό κειέηε
Πίλαθαο 2.6: Γηαζηαζηνιόγεζε ελαιιαθηώλ ζεξκόηεηαο θύξησλ ππνζπζηεκάησλ πινίνπ ππό κειέηε
γηα δηαθνξεηηθό επίπεδν θνξηίνπ-ηαρύηεηαο ζε ζπλζήθεο αλαθνξάο ISO (ζεξκνθξαζία αηκνζθαηξηθνύ αέξα
25oC θαη ζεξκνθξαζία ςπθηηθνύ κέζνπ αέξα ζάξσζεο 25
νC), πνπ πεξηιακβάλνπλ ηηο ηηκέο SFOC (g/kWh),
ηε ζεξκνθξαζία ησλ θαπζαεξίσλ (oC), θαζώο θαη ηε ξνή ησλ θαπζαεξίσλ (kg/h).
Γηα ηελ θάιπςε ησλ αλαγθώλ ησλ ζπζηεκάησλ ππνζηήξημεο ηεο Κ/Μ θαη ησλ βνεζεηηθώλ κεραλεκάησλ
γηα ην 100% ηνπ MCR, δηαζηαζηνινγνύληαη θαηάιιεια αληιίεο νδεγνύκελεο από ειεθηξηθνύο θηλεηήξεο,
ησλ νπνίσλ ε νλνκαζηηθή παξνρή όγθνπ (ζε m3/h) θαη ην σθέιηκν καλνκεηξηθό ύςνο (ζε bar)
παξνπζηάδνληαη ζηνλ Πίλαθα 2.5 γηα ην πινίν ππό κειέηε. Παξάιιεια, ζηνλ Πίλαθα 2.6, αλαθέξνληαη ηα
δεδνκέλα νλνκαζηηθήο παξνρήο λεξνύ (m3/h) θαη ξνήο ζεξκόηεηαο (kW) γηα ηνπο θύξηνπο ελαιιάθηεο ζην
δίθηπν θεληξηθήο ςύμεο λεξνύ ηεο Κ/Μ θαη ησλ βνεζεηηθώλ κεραλεκάησλ. Απηνί πεξηιακβάλνπλ ηνπο
ελαιιάθηεο γηα ηελ ςύμε ηεο ζάξσζεο (scavenge air cooler), ηελ ςύμε ηνπ ιαδηνύ ιίπαλζεο (lubricating oil
cooler), θαζώο θαη ηελ ςύμε λεξνύ γηα ηνλ ρώξν ησλ ρηησλίσλ ηεο Κ/Μ (jacket water cooler) πνπ νδεγνύλ
ζηε δηαζηαζηνιόγεζε ηνπ θεληξηθνύ ελαιιάθηε ςύμεο λεξνύ (central water cooler). Ζ δηαζηαζηνιόγεζε γηα
ηνπο παξαπάλσ ελαιιάθηεο γίλεηαη γηα ζεξκνθξαζία ζάιαζζαο 32νC θαη γηα ιεηηνπξγία ηεο Κ/Μ ζην 100%
ηνπ MCR. Παξαηεξείηαη όηη ε ρσξεηηθόηεηα ζε kW ηνπ θεληξηθνύ ελάιιαθηε θαιύπηεη ηνπο ππόινηπνπο.
Γηα ην ίδην πινίν θαηαξηίδεηαη ν Πίλαθαο 2.7, πνπ πεξηγξάθεη ηελ δηαθύκαλζε ησλ παξακέηξσλ ηεο πίεζεο
ζην ρώξν ζάξσζεο, θαζώο θαη ηελ απαίηεζε απαγσγήο ζεξκόηεηαο από ηνπο ελαιιάθηεο ζεξκόηεηαο θαηά
ηελ εθαξκνγή ηεο πξαθηηθήο κείσζεο ηεο ηαρύηεηαο πιεύζεο. Παξαηεξείηαη όηη ζε κεησκέλν θνξηίν ηεο
Κ/Μ, νη απαηηήζεηο απαγσγήο ζεξκόηεηαο από ηνπο αληίζηνηρνπο ελαιιάθηεο κεηώλνληαη αηζζεηά, γεγνλόο
πνπ δείρλεη όηη νη αληιίεο πνπ παξέρνπλ λεξό ςύμεο πξνο ηνπο ελαιιάθηεο δελ είλαη απαξαίηεην λα
ιεηηνπξγνύλ ζηελ νλνκαζηηθή παξνρή. Ζ ηθαλόηεηα αληηζηάζκηζεο, πνπ πεξηιακβάλεη ηε κείσζε ηεο
παξνρήο ζαιαζζηλνύ λεξνύ πξνο ηνλ θεληξηθό ελαιιάθηε, ιόγσ ηεο κείσζεο ηεο απαηηνύκελεο απαγσγήο
ζεξκόηεηαο εμαηηίαο ηεο κεηαβνιήο ηνπ θνξηίνπ, νδεγεί ζε ζεκαληηθό πεξηζώξην εμνηθνλόκεζεο ελέξγεηαο,
πνπ απνηειεί θαη ην εθαιηήξην γηα ηε δηαδηθαζία βειηηζηνπνίεζεο ηνπ ηζνδπγίνπ ηζρύνο ηνπ πινίνπ κέζσ
ηνπ πξνηεηλόκελνπ ζπζηήκαηνο, όπσο ζα αλαθεξζεί ζηε ζπλέρεηα ζε απηή ηε Γηαηξηβή.
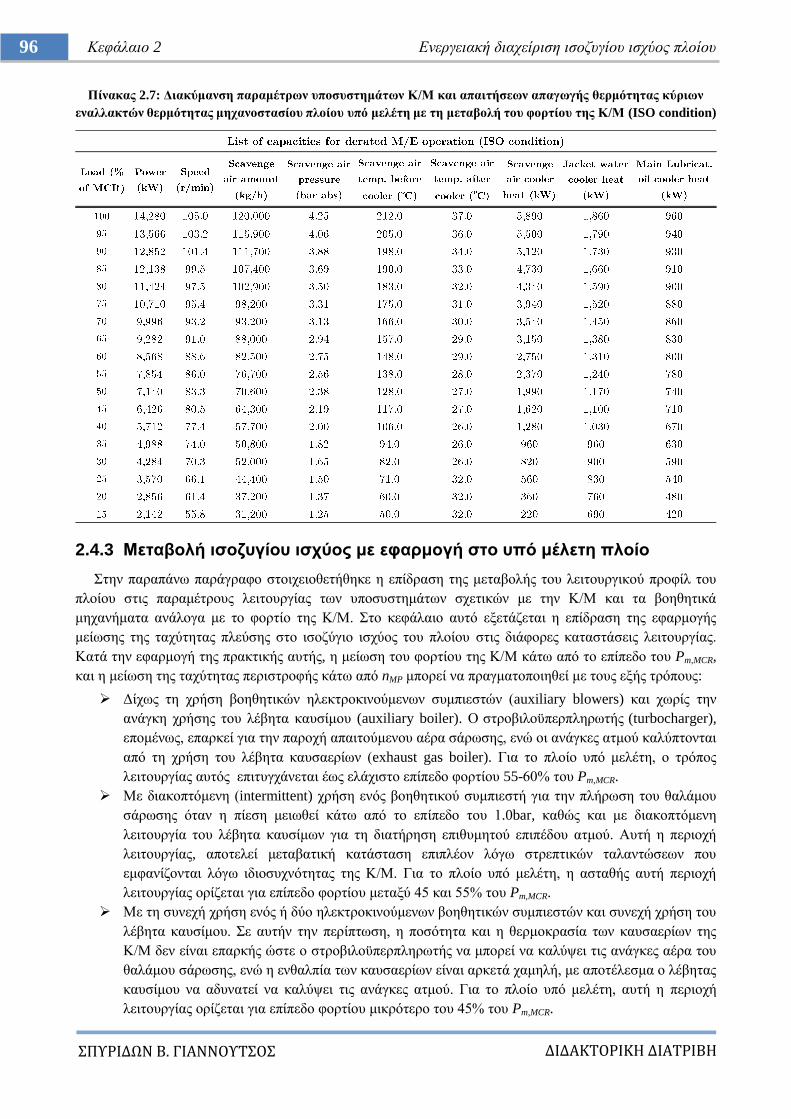
ΔΙΔΑΚΣΟΡΙΚΗ ΔΙΑΣΡΙΒΗ
ΠΤΡΙΔΩΝ Β. ΓΙΑΝΝΟΤΣΟ
96 Κεθάιαην 2 Δλεξγεηαθή δηαρείξηζε ηζνδπγίνπ ηζρύνο πινίνπ
Πίλαθαο 2.7: Γηαθύκαλζε παξακέηξσλ ππνζπζηεκάησλ Κ/Μ θαη απαηηήζεσλ απαγσγήο ζεξκόηεηαο θύξησλ
ελαιιαθηώλ ζεξκόηεηαο κεραλνζηαζίνπ πινίνπ ππό κειέηε κε ηε κεηαβνιή ηνπ θνξηίνπ ηεο Κ/Μ (ISO condition)
2.4.3 Μεηαβνιή ηζνδπγίνπ ηζρύνο κε εθαξκνγή ζην ππό κέιεηε πινίν
ηελ παξαπάλσ παξάγξαθν ζηνηρεηνζεηήζεθε ε επίδξαζε ηεο κεηαβνιήο ηνπ ιεηηνπξγηθνύ πξνθίι ηνπ
πινίνπ ζηηο παξακέηξνπο ιεηηνπξγίαο ησλ ππνζπζηεκάησλ ζρεηηθώλ κε ηελ Κ/Μ θαη ηα βνεζεηηθά
κεραλήκαηα αλάινγα κε ην θνξηίν ηεο Κ/Μ. ην θεθάιαην απηό εμεηάδεηαη ε επίδξαζε ηεο εθαξκνγήο
κείσζεο ηεο ηαρύηεηαο πιεύζεο ζην ηζνδύγην ηζρύνο ηνπ πινίνπ ζηηο δηάθνξεο θαηαζηάζεηο ιεηηνπξγίαο.
Καηά ηελ εθαξκνγή ηεο πξαθηηθήο απηήο, ε κείσζε ηνπ θνξηίνπ ηεο Κ/Μ θάησ από ην επίπεδν ηνπ Pm,MCR,
θαη ε κείσζε ηεο ηαρύηεηαο πεξηζηξνθήο θάησ από nMP κπνξεί λα πξαγκαηνπνηεζεί κε ηνπο εμήο ηξόπνπο:
Γίρσο ηε ρξήζε βνεζεηηθώλ ειεθηξνθηλνύκελσλ ζπκπηεζηώλ (auxiliary blowers) θαη ρσξίο ηελ
αλάγθε ρξήζεο ηνπ ιέβεηα θαπζίκνπ (auxiliary boiler). Ο ζηξνβηινϋπεξπιεξσηήο (turbocharger),
επνκέλσο, επαξθεί γηα ηελ παξνρή απαηηνύκελνπ αέξα ζάξσζεο, ελώ νη αλάγθεο αηκνύ θαιύπηνληαη
από ηε ρξήζε ηνπ ιέβεηα θαπζαεξίσλ (exhaust gas boiler). Γηα ην πινίν ππό κειέηε, ν ηξόπνο
ιεηηνπξγίαο απηόο επηηπγράλεηαη έσο ειάρηζην επίπεδν θνξηίνπ 55-60% ηνπ Pm,MCR.
Με δηαθνπηόκελε (intermittent) ρξήζε ελόο βνεζεηηθνύ ζπκπηεζηή γηα ηελ πιήξσζε ηνπ ζαιάκνπ
ζάξσζεο όηαλ ε πίεζε κεησζεί θάησ από ην επίπεδν ηνπ 1.0bar, θαζώο θαη κε δηαθνπηόκελε
ιεηηνπξγία ηνπ ιέβεηα θαπζίκσλ γηα ηε δηαηήξεζε επηζπκεηνύ επηπέδνπ αηκνύ. Απηή ε πεξηνρή
ιεηηνπξγίαο, απνηειεί κεηαβαηηθή θαηάζηαζε επηπιένλ ιόγσ ζηξεπηηθώλ ηαιαληώζεσλ πνπ
εκθαλίδνληαη ιόγσ ηδηνζπρλόηεηαο ηεο Κ/Μ. Γηα ην πινίν ππό κειέηε, ε αζηαζήο απηή πεξηνρή
ιεηηνπξγίαο νξίδεηαη γηα επίπεδν θνξηίνπ κεηαμύ 45 θαη 55% ηνπ Pm,MCR.
Με ηε ζπλερή ρξήζε ελόο ή δύν ειεθηξνθηλνύκελσλ βνεζεηηθώλ ζπκπηεζηώλ θαη ζπλερή ρξήζε ηνπ
ιέβεηα θαπζίκνπ. ε απηήλ ηελ πεξίπησζε, ε πνζόηεηα θαη ε ζεξκνθξαζία ησλ θαπζαεξίσλ ηεο
Κ/Μ δελ είλαη επαξθήο ώζηε ν ζηξνβηινϋπεξπιεξσηήο λα κπνξεί λα θαιύςεη ηηο αλάγθεο αέξα ηνπ
ζαιάκνπ ζάξσζεο, ελώ ε ελζαιπία ησλ θαπζαεξίσλ είλαη αξθεηά ρακειή, κε απνηέιεζκα ν ιέβεηαο
θαπζίκνπ λα αδπλαηεί λα θαιύςεη ηηο αλάγθεο αηκνύ. Γηα ην πινίν ππό κειέηε, απηή ε πεξηνρή
ιεηηνπξγίαο νξίδεηαη γηα επίπεδν θνξηίνπ κηθξόηεξν ηνπ 45% ηνπ Pm,MCR.
ΔΙΔΑΚΣΟΡΙΚΗ ΔΙΑΣΡΙΒΗ
ΠΤΡΙΔΩΝ Β. ΓΙΑΝΝΟΤΣΟ
97 Πξνζαξκνζηηθόο έιεγρνο ηνπνινγίαο ξπζκηζηώλ ζηξνθώλ γηα εμνηθνλόκεζε ελέξγεηαο ζε πινία
ρήκα 2.25: Γηάγξακκα κεηαβνιήο ηζνδπγίνπ ηζρύνο θαηά ηελ πεξίνδν πιεύζεο, παξνπζηάδνληαο ηε ζρέζε ηνπ
πνζνζηνύ θόξηηζεο κηαο Η/Γ σο πξνο ην νλνκαζηηθό ηεο θνξηίν, Pr,gi, κε ην πνζνζηό θόξηηζεο ηεο Κ/Μ σο πξνο
ην νλνκαζηηθό ηεο θνξηίν, Pm,MCR, γηα ην πινίν ππό κειέηε
Σν παξαπάλσ πξνθίι ιεηηνπξγίαο, πεξηιακβάλεη κεηαβνιή ζην ηζνδύγην ηζρύνο γηα έλα κεγάιν εύξνο
ηαρπηήησλ ζε ζρέζε κε ηελ αξρηθή κειέηε θνξηίνπ θαηά ηελ πιεύζηκε πεξίνδν, πνπ παξνπζηάζηεθε ζηνπο
Πίλαθεο 1.3 θαη 1.4 γηα ην ηππηθό πινίν ππό κειέηε. Ζ αλάγθε ρξήζεο επηπιένλ θαηαλαισηώλ πνπ
νδεγνύληαη από ειεθηξηθνύο θηλεηήξεο, θαη ζρεηίδνληαη κε ηε ιεηηνπξγία ηνπ ιέβεηα θαπζίκνπ όπσο νη
αληιίεο ηξνθνδνζίαο λεξνύ (boiler feed water pump) θαη θαπζίκνπ (fuel oil supply pump) θαη ν αλεκηζηήξαο
εμαλαγθαζκέλεο ξνήο (forced draft fan), αιιά θαη έλαο ή πεξηζζόηεξνη ειεθηξνθηλνύκελνη βνεζεηηθνί
ζπκπηεζηέο ηεο Κ/Μ (auxiliary blowers), εηζάγεη επηπιένλ θνξηίν ζην απηόλνκν ΖΔ ηνπ πινίνπ, ην νπνίν
αξθεηέο θνξέο είλαη απαξαίηεην λα εμππεξεηεζεί κε ηε ρξήζε επηπιένλ Ζ/Γ. Δηδηθόηεξα, νη δπλακηθέο
κεηαβνιέο ζηηο δηεξγαζίεο πνπ ζρεηίδνληαη κε ηε ιεηηνπξγία ηεο Κ/Μ θαη ησλ βνεζεηηθώλ κεραλεκάησλ
δηαθνξνπνηνύλ ην επίπεδν ηνπ ζπλνιηθνύ θνξηίνπ PL,g ζην απηόλνκν ζύζηεκα ηνπ πινίνπ, ην νπνίν
εμαξηάηαη ζε κεγάιν βαζκό από ην πνζνζηό θνξηίνπ ηνπ ΜCR ηεο Κ/Μ, Pm,MCR. Γηα ην πινίν ππό κειέηε. ε
δηαθύκαλζε ηνπ ζπλνιηθνύ θνξηίνπ ηνπ ζπζηήκαηνο PL,g παξνπζηάδεηαη ζην ρ. 2.25 σο πνζνζηό ηεο
νλνκαζηηθήο ηζρύνο κηαο Ζ/Γ, Pr,gi ζε ζρέζε κε ηε κεηαβνιή ηνπ θνξηίνπ ηεο Κ/Μ, Pm,N. Παξαηεξείηαη όηη:
Γηα ηελ πεξηνρή πςειώλ ηαρπηήησλ θαη θνξηίνπ γηα ηελ K/M (63%-80% ηνπ Pm,MCR), ηζρύεη όηη ην
ζπλνιηθό θνξηίν ζην ζύζηεκα , κε απνηέιεζκα λα απαηηείηαη ε ρξήζε κηαο κόλν
Ζ/Γ ζε πνζνζηό ιεηηνπξγίαο θνληά ζην 70%, όπσο αθξηβώο πξνβιέπεηαη από ηελ αξρηθή κειέηε
θνξηίνπ, γεγνλόο πνπ νδεγεί ζε SFOCMDO = 192.4g/kWh ζύκθσλα κε ηελ θακπύιε ηνπ ζρήκαηνο
2.14(β). Μόλν ζηελ πεξηνρή όπνπ ην θνξηίν ηεο Κ/Μ μεπεξάζεη ην 80%, ππάξρεη πεξίπησζε αλάγθεο
γηα πεξηζηαζηαθή ρξήζε δεύηεξεο Ζ/Γ ιόγσ ηεο απμεκέλεο ρξήζεο ησλ ζπκπηεζηώλ αέξα, αιιά
απηό ζπκβαίλεη γηα κηθξό κόλν ρξνληθό δηάζηεκα.
Γηα ηελ πεξηνρή ιεηηνπξγίαο ρακειώλ ηαρπηήησλ θαη θνξηίνπ γηα ηελ Κ/Μ (30%-45% ηνπ Pm,MCR), ε
ζπλερήο ρξήζε δεύηεξεο Ζ/Γ επηβάιιεηαη εθόζνλ ην ζπλνιηθό θνξηίν ζην ζύζηεκα
,αξθεηά παξαπάλσ από ην όξην ηνπ 80% πνπ εθαξκόδεηαη από ην ζύζηεκα δηαρείξηζεο θνξηίνπ.
ε απηήλ ηελ πεξίπησζε, ν ιέβεηαο θαπζαεξίσλ δελ επαξθεί γηα ηελ θάιπςε ησλ αλαγθώλ αηκνύ
πίεζεο 7.0bar γηα ην κεραλνζηάζην θαη ηε ζέξκαλζε ηνπ θνξηίνπ, κε ζπλέπεηα ηε ρξήζε ηνπ θύξηνπ
ΔΙΔΑΚΣΟΡΙΚΗ ΔΙΑΣΡΙΒΗ
ΠΤΡΙΔΩΝ Β. ΓΙΑΝΝΟΤΣΟ
98 Κεθάιαην 2 Δλεξγεηαθή δηαρείξηζε ηζνδπγίνπ ηζρύνο πινίνπ
Πίλαθαο 2.8: Γηαθύκαλζε ζπλνιηθνύ θνξηίνπ ζην ΗΔ ηνπ πινίνπ ππό κειέηε γηα θάζε ιεηηνπξγηθή θαηάζηαζε
ιέβεηα θαπζίκνπ, θαη επαθόινπζν ηε ιεηηνπξγία αληιηώλ ηξνθνδνζίαο λεξνύ (boiler feed water
pumps) θαη θαπζίκνπ (fuel oil supply pumps) θαζώο θαη ηνπ αλεκηζηήξα εμαλαγθαζκέλεο ξνήο
(forced draft fan) γηα ηελ ηξνθνδνζία ηνπ ζαιάκνπ θαύζεσο ηνπ ιέβεηα θαπζίκνπ κε αέξα.
Δπηπιένλ, ν ζηξνβηινϋπεξπιεξσηήο (turbocharger) ηεο Κ/Μ δελ επαξθεί γηα πιήξσζε ηνπ ζαιάκνπ
ζάξσζεο κε αέξα πίεζεο 1.0bar, κε απνηέιεζκα ηε ζπλερή ρξήζε ησλ βνεζεηηθώλ ζπκπηεζηώλ αέξα
auxiliary blowers). Δπνκέλσο ζε ζρέζε κε ηελ πιεύζηκε πεξίνδν πςειήο ηαρύηεηαο, ππάξρεη κηα
κέζε αύμεζε θνξηίνπ γύξσ ζην 40%, ην νπνίν ηθαλνπνηείηαη κε ηε δηαξθή ρξήζε δύν Ζ/Γ κε
SFOCMDO = 196.2g/kWh. Χζηόζν, ε θαηάζηαζε ιεηηνπξγίαο απηή ζπλήζσο ζπλαληάηαη γηα κηθξό
ρξνληθό δηάζηεκα, ιόγσ ηεο ζπλερνύο ρξήζεο απμεκέλνπ αξηζκνύ βνεζεηηθώλ κεραλεκάησλ αιιά
θαη ηνπ γεγνλόηνο όηη ε εμνηθνλόκεζε θαπζίκνπ από ηελ Κ/Μ, αληηζηαζκίδεηαη από ηελ απμεκέλε
θαηαλάισζε θαπζίκνπ από ηηο Ζ/Γ θαη ην ιέβεηα θαπζίκνπ.
Γηα ηελ πεξηνρή ιεηηνπξγίαο ηεο Κ/Μ από 45%-55% ηνπ Pm,MCR, ε ρξήζε ηνπ ιέβεηα θαπζίκνπ θαη
ησλ βνεζεηηθώλ ζπκπηεζηώλ γίλεηαη ζηαδηαθά δηαθνπηόκελε κε ζπλερείο εθθηλήζεηο ησλ θηλεηήξσλ
πνπ νδεγνύλ ηα αληίζηνηρα θνξηία, επνκέλσο δελ είλαη θαηάιιειε γηα ζπλερή ιεηηνπξγία.
Ζ πεξηνρή ιεηηνπξγίαο θαηά ηελ πιεύζηκε πεξίνδν, πνπ εμππεξεηεί βέιηηζηα ηελ εμνηθνλόκεζε
θαπζίκνπ από ηελ Κ/Μ κε ηελ εθαξκνγή ηεο πξαθηηθήο κείσζεο ηεο ηαρύηεηαο πιεύζεο, απνηειεί
ην εύξνο 55%-65% ηνπ Pm,MCR. Σν ζπλνιηθό θνξηίν ζην ΖΔ ηνπ ηππηθνύ πινίνπ ππό κειέηε, όπσο
παξνπζηάδεηαη ζην ρ. 2.25 είλαη θνληά ζην επίπεδν , ιόγσ ηεο πεξηζηαζηαθήο
ρξήζεο ηνπ ιέβεηα θαπζίκνπ, απαηηώληαο ζπλήζσο ηελ παξάιιειε ιεηηνπξγίαο δεύηεξεο Ζ/Γ.
Όκσο ζε απηήλ ηελ πεξίπησζε, νη δύν Ζ/Γ ζα ιεηηνπξγνύλ ηζνκνηξάδνληαο ην θνξηίν ζε ρακειό
επίπεδν θνληά ζην 40% ηνπ Pr,gi, κε SFOCMDO = 210.0g/kWh νδεγώληαο ζε αύμεζε SFOC θαηά
10%, ζύκθσλα κε ηελ θακπύιε ηνπ ρ. 2.14(β). Απηό ζεκαίλεη όηη ε εμππεξέηεζε ηνπ θνξηίνπ ζε
απηήλ ηελ πεξηνρή ιεηηνπξγίαο, πνπ θαηαιακβάλεη ηε κεγαιύηεξε ρξνληθή πεξίνδν ηνπ έηνπο,
γίλεηαη κε απμεκέλε εηδηθή θαηαλάισζε θαπζίκνπ εμαηηίαο ηεο παξάιιειεο ρξήζεο δύν Ζ/Γ γηα ηελ
ηθαλνπνίεζε ησλ πεξηνξηζκώλ κέγηζηεο επηηξεπηήο κεηαβαηηθήο θόξηηζεο ησλ Ζ/Γ θαζώο θαη ηεο
δηαζεζηκόηεηαο πιενλάδνπζαο ηζρύνο.
Ο πίλαθαο 2.8 πεξηγξάθεη ηε δηαθύκαλζε ηνπ θνξηίνπ ζην ΖΔ ηνπ πινίνπ ππό κειέηε γηα θάζε
ιεηηνπξγηθή θαηάζηαζε. Παξαηεξείηαη όηη ζε ζρέζε κε ηελ αξρηθή κειέηε ηζνδπγίνπ ηζρύνο ηνπ ρ. 1.3,
όπνπ ε κέζε νιηθή θαηαλάισζε θνξηίνπ θαηά ηελ πιεύζηκε πεξίνδν είλαη PL,g = 545kW, ε νπνία
εμππεξεηείηαη από κηα Ζ/Γ κε , ζηελ ίδηα πεξίνδν ιεηηνπξγίαο κε ρακειό θνξηίν Κ/Μ
(55%-65% ηνπ Pm,MCR) ην κέζν νιηθό θνξηίν απμάλεηαη ζε PL,g = 624kW, ή , ην νπνίν ηειηθά
ΔΙΔΑΚΣΟΡΙΚΗ ΔΙΑΣΡΙΒΗ
ΠΤΡΙΔΩΝ Β. ΓΙΑΝΝΟΤΣΟ
99 Πξνζαξκνζηηθόο έιεγρνο ηνπνινγίαο ξπζκηζηώλ ζηξνθώλ γηα εμνηθνλόκεζε ελέξγεηαο ζε πινία
εμππεξεηείηαη από δύν Ζ/Γ, πνπ ιεηηνπξγνύλ ηειηθά ζην κε απμεκέλν SFOC. Καζώο ε
πιεύζηκε πεξίνδνο κε ρακειή ηαρύηεηα απνηειεί ην 45% ηεο εηήζηαο ιεηηνπξγηθήο πεξηόδνπ ηνπ πινίνπ, ε
πξνηεηλόκελε ηνπνινγία ζε απηή ηε Γηαηξηβή απνζθνπεί ζην λα ζπλεηζθέξεη ζηελ δπλακηθή εμνηθνλόκεζε
ηζρύνο θαηά ηελ πιεύζηκε πεξίνδν κέζσ βειηηζηνπνίεζεο ηνπ ηζνδπγίνπ ηζρύνο, έηζη ώζηε λα γίλεηαη
ζπρλόηεξε ρξήζε κηαο κόλν Ζ/Γ κε απνηέιεζκα ηελ εμνηθνλόκεζε θαπζίκνπ. ηελ επόκελε παξάγξαθν
θαζνξίδεηαη ην πεξηζώξην εμνηθνλόκεζεο ηζρύνο πνπ κπνξεί λα επηηεπρζεί κε ην πξνηεηλόκελν ζύζηεκα από
ηελ ελεξγεηαθή βειηηζηνπνίεζε ησλ δηεξγαζηώλ ηνπ θεληξηθνύ ζπζηήκαηνο ςύμεο λεξνύ θαη ηνπ
ζπζηήκαηνο εμαεξηζκνύ ηνπ κεραλνζηαζίνπ, ζρεηηθώλ κε ηε ιεηηνπξγία ηεο Κ/Μ θαη ησλ βνεζεηηθώλ
κεραλεκάησλ, κε εθαξκνγή ζην πινίν ππό κειέηε.
2.5 Πεπιθώπιο εξοικονόμηζηρ ιζσύορ ζηο κενηπικό ζύζηημα τύξηρ Κ/Μ
Από ηελ παξαπάλσ κειέηε κεηαβνιήο ηνπ ηζνδπγίνπ ηζρύνο ζε ζρέζε κε ηε ιεηηνπξγηθή θαηάζηαζε ηνπ
πινίνπ θαη ηδηαίηεξα θαηά ηελ πεξίνδν πιεύζεο, δηαπηζηώζεθε όηη νη κνλάδεο ησλ Ζ/Γ πνπ βξίζθνληαη ζε
ιεηηνπξγία ηελ εθάζηνηε ζηηγκή εμαξηώληαη από ην επίπεδν ηνπ θνξηίνπ, ην νπνίν επίζεο κεηαβάιιεηαη
δπλακηθά, θαη ζπγθεθξηκέλα ππεξβαίλεη ζπρλά ηα όξηα αζθαινύο θόξηηζεο κηαο Ζ/Γ θαηά ηελ πεξίνδν
πιεύζεο κε ρακειή ηαρύηεηα κε απνηέιεζκα ηελ απμεκέλε θαηαλάισζε θαπζίκνπ θαη παξαγσγή ξύπσλ.
Γηα ηελ αληηζηάζκηζε ηεο αύμεζεο ηνπ θνξηίνπ ησλ Ζ/Γ ιόγσ ηεο κεηαβνιήο ηεο ιεηηνπξγηθήο θαηάζηαζεο
ηνπ πινίνπ, ζε απηήλ ηελ παξάγξαθν κειεηάηαη ην πεξηζώξην επίηεπμεο εμνηθνλόκεζεο ηζρύνο από ηε
κείσζε ηεο παξερόκελεο ξνήο ηεο αληιίαο ηξνθνδνζίαο ζαιαζζηλνύ λεξνύ ςύμεο γηα κεησκέλν θνξηίν Κ/Μ.
ύκθσλα κε ην ρ. 1.23, όπνπ παξνπζηάδεηαη ε δνκή ηνπ ζπζηήκαηνο θεληξηθήο ςύμεο ηεο Κ/Μ θαη ησλ
βνεζεηηθώλ κεραλεκάησλ γηα έλα ηππηθό πινίν, θαίλεηαη όηη απηό απνηειείηαη από ην αλνηθηό ζύζηεκα
ςύμεο ζαιαζζηλνύ λεξνύ θαη ην θιεηζηό ζύζηεκα ςύμεο γιπθνύ λεξνύ ρακειήο ζεξκνθξαζίαο, ηα νπνία
ζπλδένληαη κέζσ θεληξηθνύ ελαιιάθηε ζεξκόηεηαο (central cooler). Ο ζηόρνο δηαηήξεζεο ζηαζεξήο
ζεξκνθξαζίαο ζην δίθηπν πξαγκαηνπνηείηαη κε ηε ρξήζε ηξηνδηθήο ζεξκνζηαηηθήο δηθιείδαο ζην δίθηπν
ςύμεο γιπθνύ λεξνύ κεηά ηνλ θεληξηθό ελαιιάθηε ζεξκόηεηαο, ε ζέζε ηεο νπνίαο θαζνξίδεη ηε ξνή ηνπ
λεξνύ ζην δίθηπν αλάινγα κε ηε ζεξκνθξαζία θαη επηηξέπεη ηελ απηόκαηε παξάθακςε ξνήο δηακέζνπ ηνπ
θεληξηθνύ ελαιιάθηε ζεξκόηεηαο. Δθόζνλ ην δίθηπν ςύμεο ζαιαζζηλνύ λεξνύ είλαη έλα αλνηθηό ζύζηεκα,
επηηξέπεη επθνιόηεξα ηε ξύζκηζε ηεο ξνήο από ηελ πιεπξά ησλ αληιηώλ δίρσο λα επεξεάδεη δπζκελώο ηε
ιεηηνπξγηθόηεηα ηνπ ππόινηπνπ ζπζηήκαηνο ςύμεο. ρεδηαζηηθά, ν έιεγρνο ξνήο ζαιαζζηλνύ λεξνύ
αλάινγα κε ηελ θαηάζηαζε ιεηηνπξγίαο επηηπγράλεηαη ρεηξνθίλεηα κε ην ζηξαγγαιηζκό ηεο δηθιείδαο ζηελ
θαηάζιηςε ηεο αληιίαο κε απνηέιεζκα όκσο θαη ηελ ηαπηόρξνλε κεηαβνιή ζηελ πίεζε ηνπ δηθηύνπ, δίρσο
όκσο λα επηηπγράλεηαη εμνηθνλόκεζε ηζρύνο. ηελ παξάγξαθν απηή εμεηάδεηαη ε δπλαηόηεηα ειέγρνπ ξνήο
κε ηαπηόρξνλε εμνηθνλόκεζε ηζρύνο, ηθαλνπνηώληαο παξάιιεια ηνπο ιεηηνπξγηθνύο πεξηνξηζκνύο ηνπ
ζπζηήκαηνο ςύμεο, κε ηελ εθαξκνγή ξπζκηζηή ζηξνθώλ ζηνπο θηλεηήξεο πνπ νδεγνύλ ηηο αληιίεο ςύμεο. Γηα
ην ζθνπό απηό γίλεηαη κνληεινπνίεζε ηνπ θεληξηθνύ ζπζηήκαηνο ςύμεο, ελώ ην πεξηζώξην ειάηησζεο ξνήο
ζαιαζζηλνύ λεξνύ πνπ παξέρεηαη από ηελ αληιία ςύμεο ππνινγίδεηαη γηα ηνπ ηππηθό πινίν ππό κειέηε. Ζ
κειέηε απηή απνηειεί βάζε γηα ηελ πξνηεηλόκελε ηνπνινγία ειέγρνπ ηνπ ξπζκηζηή ζηξνθώλ ηνπ θηλεηήξα
πνπ νδεγεί ηελ αληιία παξνρήο ζαιαζζηλνύ λεξνύ κε ζηόρν ηε βειηηζηνπνίεζε ηνπ ηζνδπγίνπ ηζρύνο.
2.5.1 Πεξηζώξην κείσζεο ξνήο αληιίαο παξνρήο ζαιαζζηλνύ λεξνύ αλάινγα κε ηε ιεηηνπξγηθή θαηάζηαζε
Γηα λα ππνινγηζηεί ην πεξηζώξην κείσζεο ηεο ξνήο ηεο αληιίαο παξνρήο ζαιαζζηλνύ λεξνύ αλάινγα κε
ηε ιεηηνπξγηθή θαηάζηαζε ηνπ πινίνπ, αιιά θαη γηα λα θαζνξηζηεί ν βέιηηζηνο ηξόπνο κεηαβνιήο ηεο ξνήο,
αξρηθά γίλεηαη κνληεινπνίεζε ηνπ απινπνηεκέλνπ ζπζηήκαηνο θεληξηθήο ςύμεο λεξνύ ηεο Κ/Μ θαη ησλ
βνεζεηηθώλ κεραλεκάησλ ηεο δηάηαμεο ηνπ ρ.1.23, ην νπνίν παξνπζηάδεηαη ζην ρ. 2.26. Ο θεληξηθόο
ελαιιάθηεο ζεξκόηεηαο πνπ ζπλδέεη ην αλνηθηό ζύζηεκα ςύμεο ζαιαζζηλνύ λεξνύ κε ην θιεηζηό ζύζηεκα
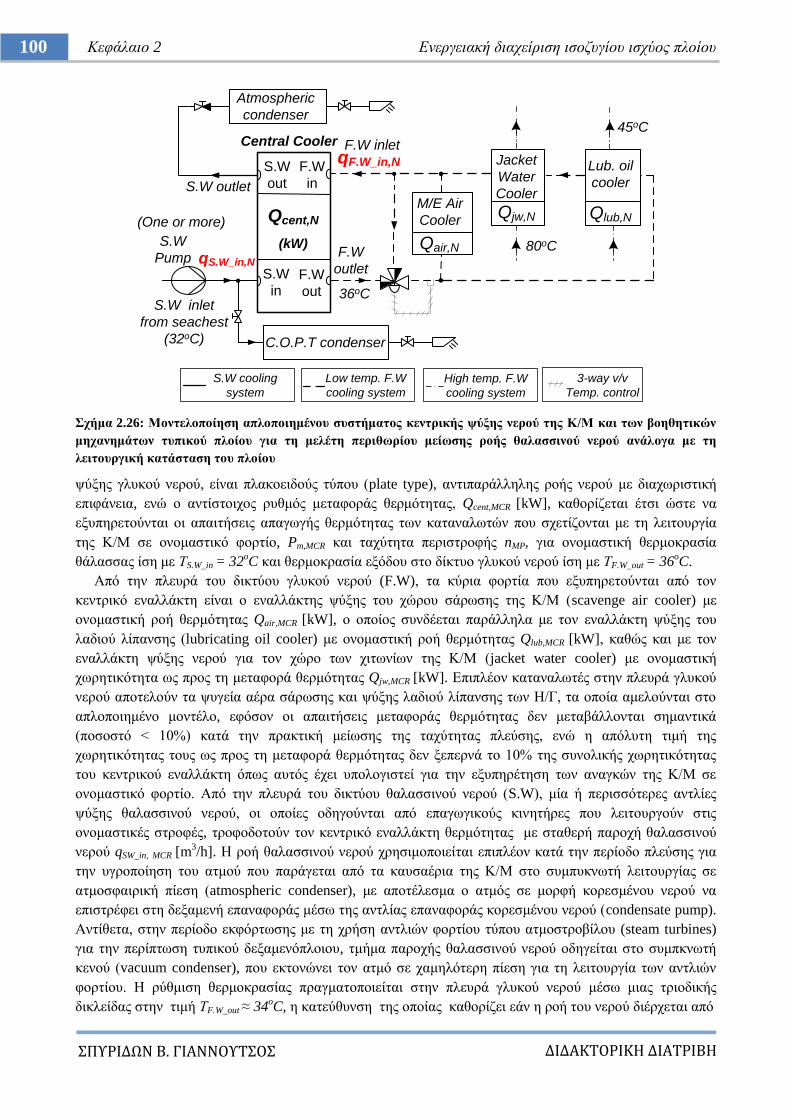
ΔΙΔΑΚΣΟΡΙΚΗ ΔΙΑΣΡΙΒΗ
ΠΤΡΙΔΩΝ Β. ΓΙΑΝΝΟΤΣΟ
100 Κεθάιαην 2 Δλεξγεηαθή δηαρείξηζε ηζνδπγίνπ ηζρύνο πινίνπ
ρήκα 2.26: Μνληεινπνίεζε απινπνηεκέλνπ ζπζηήκαηνο θεληξηθήο ςύμεο λεξνύ ηεο Κ/Μ θαη ησλ βνεζεηηθώλ
κεραλεκάησλ ηππηθνύ πινίνπ γηα ηε κειέηε πεξηζσξίνπ κείσζεο ξνήο ζαιαζζηλνύ λεξνύ αλάινγα κε ηε
ιεηηνπξγηθή θαηάζηαζε ηνπ πινίνπ
ςύμεο γιπθνύ λεξνύ, είλαη πιαθνεηδνύο ηύπνπ (plate type), αληηπαξάιιειεο ξνήο λεξνύ κε δηαρσξηζηηθή
επηθάλεηα, ελώ ν αληίζηνηρνο ξπζκόο κεηαθνξάο ζεξκόηεηαο, Qcent,MCR [kW], θαζνξίδεηαη έηζη ώζηε λα
εμππεξεηνύληαη νη απαηηήζεηο απαγσγήο ζεξκόηεηαο ησλ θαηαλαισηώλ πνπ ζρεηίδνληαη κε ηε ιεηηνπξγία
ηεο Κ/Μ ζε νλνκαζηηθό θνξηίν, Pm,MCR θαη ηαρύηεηα πεξηζηξνθήο nMP, γηα νλνκαζηηθή ζεξκνθξαζία
ζάιαζζαο ίζε κε ΣS.W_in = 32oC θαη ζεξκνθξαζία εμόδνπ ζην δίθηπν γιπθνύ λεξνύ ίζε κε ΣF.W_out = 36
oC.
Από ηελ πιεπξά ηνπ δηθηύνπ γιπθνύ λεξνύ (F.W), ηα θύξηα θνξηία πνπ εμππεξεηνύληαη από ηνλ
θεληξηθό ελαιιάθηε είλαη ν ελαιιάθηεο ςύμεο ηνπ ρώξνπ ζάξσζεο ηεο Κ/Μ (scavenge air cooler) κε
νλνκαζηηθή ξνή ζεξκόηεηαο Qair,MCR [kW], ν νπνίνο ζπλδέεηαη παξάιιεια κε ηνλ ελαιιάθηε ςύμεο ηνπ
ιαδηνύ ιίπαλζεο (lubricating oil cooler) κε νλνκαζηηθή ξνή ζεξκόηεηαο Qlub,MCR [kW], θαζώο θαη κε ηνλ
ελαιιάθηε ςύμεο λεξνύ γηα ηνλ ρώξν ησλ ρηησλίσλ ηεο Κ/Μ (jacket water cooler) κε νλνκαζηηθή
ρσξεηηθόηεηα σο πξνο ηε κεηαθνξά ζεξκόηεηαο Qjw,MCR [kW]. Δπηπιένλ θαηαλαισηέο ζηελ πιεπξά γιπθνύ
λεξνύ απνηεινύλ ηα ςπγεία αέξα ζάξσζεο θαη ςύμεο ιαδηνύ ιίπαλζεο ησλ Ζ/Γ, ηα νπνία ακεινύληαη ζην
απινπνηεκέλν κνληέιν, εθόζνλ νη απαηηήζεηο κεηαθνξάο ζεξκόηεηαο δελ κεηαβάιινληαη ζεκαληηθά
(πνζνζηό < 10%) θαηά ηελ πξαθηηθή κείσζεο ηεο ηαρύηεηαο πιεύζεο, ελώ ε απόιπηε ηηκή ηεο
ρσξεηηθόηεηαο ηνπο σο πξνο ηε κεηαθνξά ζεξκόηεηαο δελ μεπεξλά ην 10% ηεο ζπλνιηθήο ρσξεηηθόηεηαο
ηνπ θεληξηθνύ ελαιιάθηε όπσο απηόο έρεη ππνινγηζηεί γηα ηελ εμππεξέηεζε ησλ αλαγθώλ ηεο Κ/Μ ζε
νλνκαζηηθό θνξηίν. Από ηελ πιεπξά ηνπ δηθηύνπ ζαιαζζηλνύ λεξνύ (S.W), κία ή πεξηζζόηεξεο αληιίεο
ςύμεο ζαιαζζηλνύ λεξνύ, νη νπνίεο νδεγνύληαη από επαγσγηθνύο θηλεηήξεο πνπ ιεηηνπξγνύλ ζηηο
νλνκαζηηθέο ζηξνθέο, ηξνθνδνηνύλ ηνλ θεληξηθό ελαιιάθηε ζεξκόηεηαο κε ζηαζεξή παξνρή ζαιαζζηλνύ
λεξνύ qSW_in, MCR [m3/h]. Ζ ξνή ζαιαζζηλνύ λεξνύ ρξεζηκνπνηείηαη επηπιένλ θαηά ηελ πεξίνδν πιεύζεο γηα
ηελ πγξνπνίεζε ηνπ αηκνύ πνπ παξάγεηαη από ηα θαπζαέξηα ηεο Κ/Μ ζην ζπκππθλσηή ιεηηνπξγίαο ζε
αηκνζθαηξηθή πίεζε (atmospheric condenser), κε απνηέιεζκα ν αηκόο ζε κνξθή θνξεζκέλνπ λεξνύ λα
επηζηξέθεη ζηε δεμακελή επαλαθνξάο κέζσ ηεο αληιίαο επαλαθνξάο θνξεζκέλνπ λεξνύ (condensate pump).
Αληίζεηα, ζηελ πεξίνδν εθθόξησζεο κε ηε ρξήζε αληιηώλ θνξηίνπ ηύπνπ αηκνζηξνβίινπ (steam turbines)
γηα ηελ πεξίπησζε ηππηθνύ δεμακελόπινηνπ, ηκήκα παξνρήο ζαιαζζηλνύ λεξνύ νδεγείηαη ζην ζπκπθλσηή
θελνύ (vacuum condenser), πνπ εθηνλώλεη ηνλ αηκό ζε ρακειόηεξε πίεζε γηα ηε ιεηηνπξγία ησλ αληιηώλ
θνξηίνπ. Ζ ξύζκηζε ζεξκνθξαζίαο πξαγκαηνπνηείηαη ζηελ πιεπξά γιπθνύ λεξνύ κέζσ κηαο ηξηνδηθήο
δηθιείδαο ζηελ ηηκή ΣF.W_out ≈ 34oC, ε θαηεύζπλζε ηεο νπνίαο θαζνξίδεη εάλ ε ξνή ηνπ λεξνύ δηέξρεηαη από
S.W
in
S.W
out
F.W
in
F.W
out
S.W outlet
S.W inlet
from seachest
(32oC)
qS.W_in,N
Central Cooler
M/E Air
Cooler
Qair,N
Jacket
Water
Cooler
Qjw,N
Lub. oil
cooler
Qlub,N
F.W inlet
F.W
outlet
Qcent,N
(kW)
S.W cooling
system
Low temp. F.W
cooling system
36oC
qF.W_in,N
80oC
High temp. F.W
cooling system
45oC
3-way v/v
Temp. control
S.W
Pump
C.O.P.T condenser
Atmospheric
condenser
(One or more)
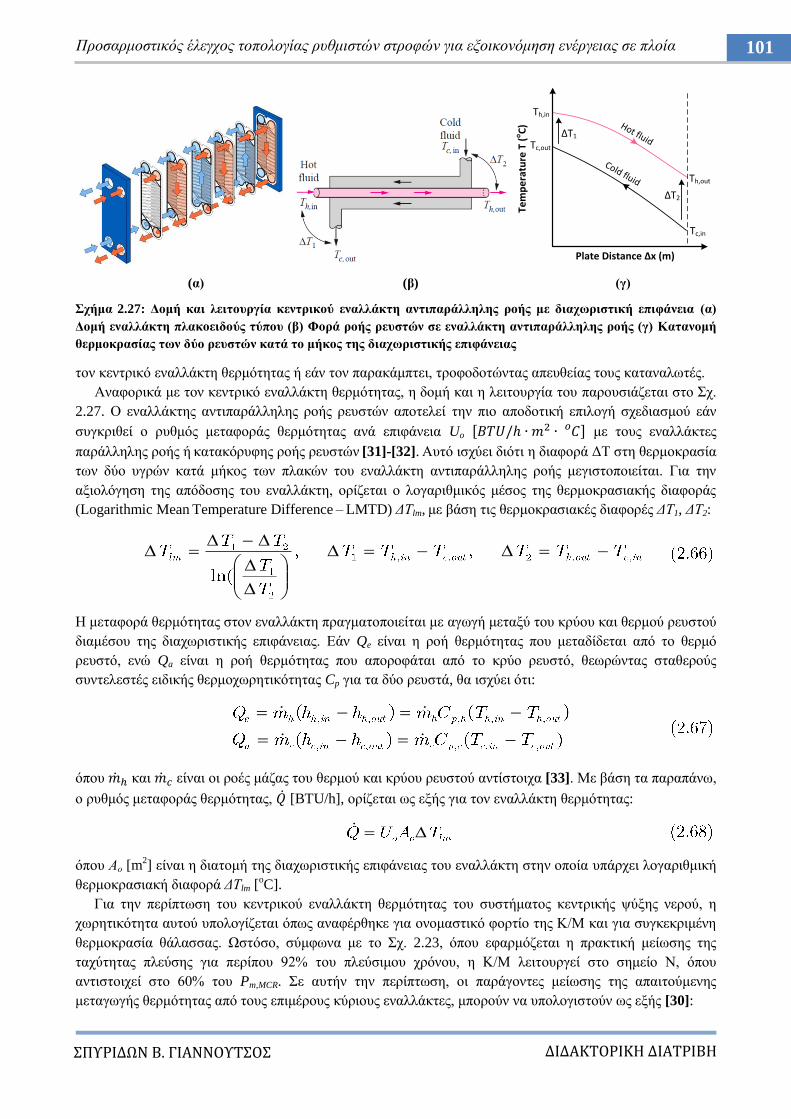
ΔΙΔΑΚΣΟΡΙΚΗ ΔΙΑΣΡΙΒΗ
ΠΤΡΙΔΩΝ Β. ΓΙΑΝΝΟΤΣΟ
101 Πξνζαξκνζηηθόο έιεγρνο ηνπνινγίαο ξπζκηζηώλ ζηξνθώλ γηα εμνηθνλόκεζε ελέξγεηαο ζε πινία
(α) (β) (γ)
ρήκα 2.27: Γνκή θαη ιεηηνπξγία θεληξηθνύ ελαιιάθηε αληηπαξάιιειεο ξνήο κε δηαρσξηζηηθή επηθάλεηα (α)
Γνκή ελαιιάθηε πιαθνεηδνύο ηύπνπ (β) Φνξά ξνήο ξεπζηώλ ζε ελαιιάθηε αληηπαξάιιειεο ξνήο (γ) Καηαλνκή
ζεξκνθξαζίαο ησλ δύν ξεπζηώλ θαηά ην κήθνο ηεο δηαρσξηζηηθήο επηθάλεηαο
ηνλ θεληξηθό ελαιιάθηε ζεξκόηεηαο ή εάλ ηνλ παξαθάκπηεη, ηξνθνδνηώληαο απεπζείαο ηνπο θαηαλαισηέο.
Αλαθνξηθά κε ηνλ θεληξηθό ελαιιάθηε ζεξκόηεηαο, ε δνκή θαη ε ιεηηνπξγία ηνπ παξνπζηάδεηαη ζην ρ.
2.27. Ο ελαιιάθηεο αληηπαξάιιειεο ξνήο ξεπζηώλ απνηειεί ηελ πην απνδνηηθή επηινγή ζρεδηαζκνύ εάλ
ζπγθξηζεί ν ξπζκόο κεηαθνξάο ζεξκόηεηαο αλά επηθάλεηα Uo κε ηνπο ελαιιάθηεο
παξάιιειεο ξνήο ή θαηαθόξπθεο ξνήο ξεπζηώλ [31]-[32]. Απηό ηζρύεη δηόηη ε δηαθνξά ΓΣ ζηε ζεξκνθξαζία
ησλ δύν πγξώλ θαηά κήθνο ησλ πιαθώλ ηνπ ελαιιάθηε αληηπαξάιιειεο ξνήο κεγηζηνπνηείηαη. Γηα ηελ
αμηνιόγεζε ηεο απόδνζεο ηνπ ελαιιάθηε, νξίδεηαη ν ινγαξηζκηθόο κέζνο ηεο ζεξκνθξαζηαθήο δηαθνξάο
(Logarithmic Mean Temperature Difference – LMTD) ΓΣlm, κε βάζε ηηο ζεξκνθξαζηαθέο δηαθνξέο ΓΣ1, ΓΣ2:
Ζ κεηαθνξά ζεξκόηεηαο ζηνλ ελαιιάθηε πξαγκαηνπνηείηαη κε αγσγή κεηαμύ ηνπ θξύνπ θαη ζεξκνύ ξεπζηνύ
δηακέζνπ ηεο δηαρσξηζηηθήο επηθάλεηαο. Δάλ Qe είλαη ε ξνή ζεξκόηεηαο πνπ κεηαδίδεηαη από ην ζεξκό
ξεπζηό, ελώ Qa είλαη ε ξνή ζεξκόηεηαο πνπ απνξνθάηαη από ην θξύν ξεπζηό, ζεσξώληαο ζηαζεξνύο
ζπληειεζηέο εηδηθήο ζεξκνρσξεηηθόηεηαο Cp γηα ηα δύν ξεπζηά, ζα ηζρύεη όηη:
όπνπ θαη είλαη νη ξνέο κάδαο ηνπ ζεξκνύ θαη θξύνπ ξεπζηνύ αληίζηνηρα [33]. Με βάζε ηα παξαπάλσ,
ν ξπζκόο κεηαθνξάο ζεξκόηεηαο, [BTU/h], νξίδεηαη σο εμήο γηα ηνλ ελαιιάθηε ζεξκόηεηαο:
όπνπ Αν [m2] είλαη ε δηαηνκή ηεο δηαρσξηζηηθήο επηθάλεηαο ηνπ ελαιιάθηε ζηελ νπνία ππάξρεη ινγαξηζκηθή
ζεξκνθξαζηαθή δηαθνξά ΓΣlm [oC].
Γηα ηελ πεξίπησζε ηνπ θεληξηθνύ ελαιιάθηε ζεξκόηεηαο ηνπ ζπζηήκαηνο θεληξηθήο ςύμεο λεξνύ, ε
ρσξεηηθόηεηα απηνύ ππνινγίδεηαη όπσο αλαθέξζεθε γηα νλνκαζηηθό θνξηίν ηεο Κ/Μ θαη γηα ζπγθεθξηκέλε
ζεξκνθξαζία ζάιαζζαο. Χζηόζν, ζύκθσλα κε ην ρ. 2.23, όπνπ εθαξκόδεηαη ε πξαθηηθή κείσζεο ηεο
ηαρύηεηαο πιεύζεο γηα πεξίπνπ 92% ηνπ πιεύζηκνπ ρξόλνπ, ε Κ/Μ ιεηηνπξγεί ζην ζεκείν Ν, όπνπ
αληηζηνηρεί ζην 60% ηνπ Pm,MCR. ε απηήλ ηελ πεξίπησζε, νη παξάγνληεο κείσζεο ηεο απαηηνύκελεο
κεηαγσγήο ζεξκόηεηαο από ηνπο επηκέξνπο θύξηνπο ελαιιάθηεο, κπνξνύλ λα ππνινγηζηνύλ σο εμήο [30]:
Th,in
Tem
pe
ratu
re T
(oC
) Hot fluid
Cold fluid
Plate Distance Δx (m)
Tc,out
Th,out
Tc,in
ΔΤ1
ΔΤ2
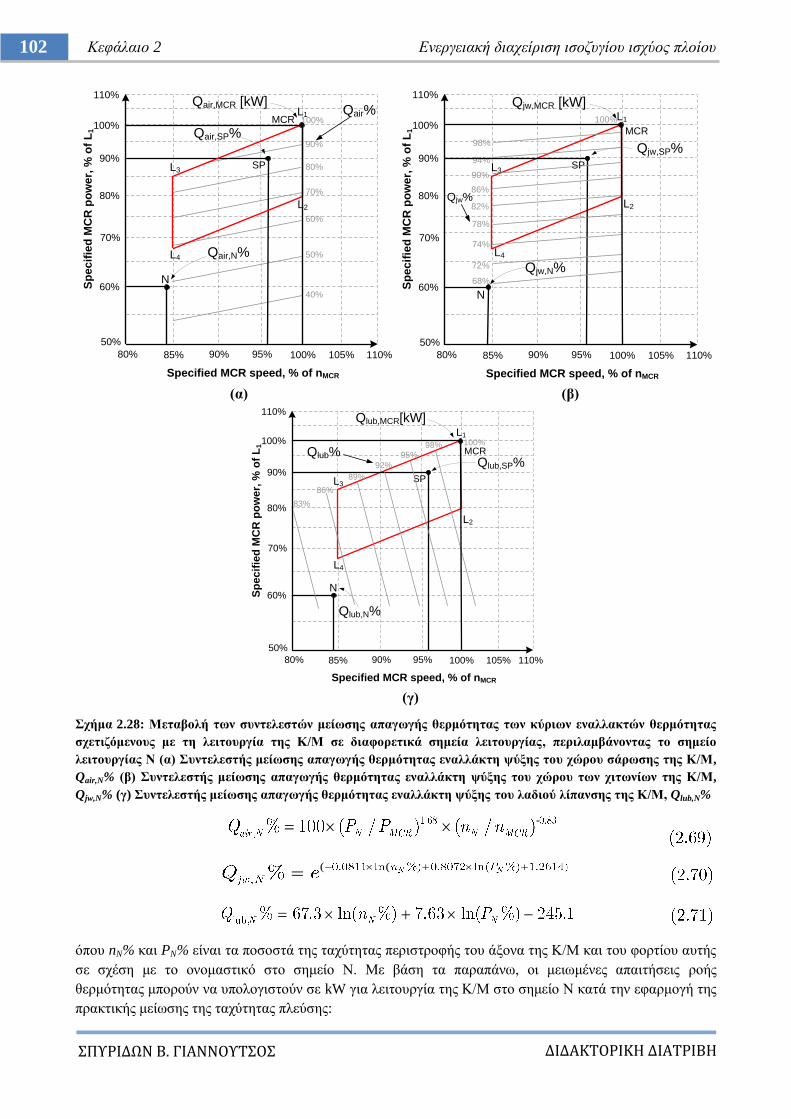
ΔΙΔΑΚΣΟΡΙΚΗ ΔΙΑΣΡΙΒΗ
ΠΤΡΙΔΩΝ Β. ΓΙΑΝΝΟΤΣΟ
102 Κεθάιαην 2 Δλεξγεηαθή δηαρείξηζε ηζνδπγίνπ ηζρύνο πινίνπ
(α) (β)
(γ)
ρήκα 2.28: Μεηαβνιή ησλ ζπληειεζηώλ κείσζεο απαγσγήο ζεξκόηεηαο ησλ θύξησλ ελαιιαθηώλ ζεξκόηεηαο
ζρεηηδόκελνπο κε ηε ιεηηνπξγία ηεο Κ/Μ ζε δηαθνξεηηθά ζεκεία ιεηηνπξγίαο, πεξηιακβάλνληαο ην ζεκείν
ιεηηνπξγίαο Ν (α) πληειεζηήο κείσζεο απαγσγήο ζεξκόηεηαο ελαιιάθηε ςύμεο ηνπ ρώξνπ ζάξσζεο ηεο Κ/Μ,
Qair,N% (β) πληειεζηήο κείσζεο απαγσγήο ζεξκόηεηαο ελαιιάθηε ςύμεο ηνπ ρώξνπ ησλ ρηησλίσλ ηεο Κ/Μ,
Qjw,N% (γ) πληειεζηήο κείσζεο απαγσγήο ζεξκόηεηαο ελαιιάθηε ςύμεο ηνπ ιαδηνύ ιίπαλζεο ηεο Κ/Μ, Qlub,N%
-
((
όπνπ nN% θαη PN% είλαη ηα πνζνζηά ηεο ηαρύηεηαο πεξηζηξνθήο ηνπ άμνλα ηεο Κ/Μ θαη ηνπ θνξηίνπ απηήο
ζε ζρέζε κε ην νλνκαζηηθό ζην ζεκείν Ν. Με βάζε ηα παξαπάλσ, νη κεησκέλεο απαηηήζεηο ξνήο
ζεξκόηεηαο κπνξνύλ λα ππνινγηζηνύλ ζε kW γηα ιεηηνπξγία ηεο Κ/Μ ζην ζεκείν Ν θαηά ηελ εθαξκνγή ηεο
πξαθηηθήο κείσζεο ηεο ηαρύηεηαο πιεύζεο:
50%
60%
70%
80%
100%
110%S
pe
cif
ied
MC
R p
ow
er,
% o
f L
1
80% 85% 90% 95% 100% 105%
Specified MCR speed, % of nMCR
110%
90%
90%
80%
70%
60%
50%
40%
N
SP
Qair,N%
Qair,SP%
Qair%L1
L3
L2
L4
100%MCR
Qair,MCR [kW]
50%
60%
70%
80%
100%
110%
Sp
ec
ifie
d M
CR
po
we
r, %
of
L1
80% 85% 90% 95% 100% 105%
Specified MCR speed, % of nMCR
90%
98%
94%
N
SP
Qjw,N%
Qjw,SP%
Qjw%
L1
L3
L2
L4
100%
90%
86%
82%
78%
74%
72%
68%
110%
MCR
Qjw,MCR [kW]
50%
60%
70%
80%
100%
110%
Sp
ec
ifie
d M
CR
po
we
r, %
of
L1
80% 85% 90% 95% 100% 105%
Specified MCR speed, % of nMCR
90%
98%95%
N
SP
Qlub,N%
Qlub,SP%Qlub%
L1
L3
L2
L4
100%
92%
89%
86%
110%
MCR
Qlub,MCR[kW]
83%
ΔΙΔΑΚΣΟΡΙΚΗ ΔΙΑΣΡΙΒΗ
ΠΤΡΙΔΩΝ Β. ΓΙΑΝΝΟΤΣΟ
103 Πξνζαξκνζηηθόο έιεγρνο ηνπνινγίαο ξπζκηζηώλ ζηξνθώλ γηα εμνηθνλόκεζε ελέξγεηαο ζε πινία
Ζ κεηαβνιή ησλ ζπληειεζηώλ κείσζεο ηεο απαηηνύκελεο ξνήο ζεξκόηεηαο από ηνπο επηκέξνπο
ελαιιάθηεο ζε ζρέζε κε ηα δηάθνξα ζεκεία ιεηηνπξγίαο ηεο Κ/Μ, παξνπζηάδεηαη ζην ρ. 2.28. Βάζεη απηώλ,
ε απαηηνύκελε ρσξεηηθόηεηα ηνπ θεληξηθνύ ελαιιάθηε ζεξκόηεηαο ζην ζεκείν ιεηηνπξγίαο Ν ηεο Κ/Μ,
Qcent,N, εθθξάδεηαη ζεσξώληαο ζηαζεξέο ηηο απαηηήζεηο ξνήο ζεξκόηεηαο από ηα βνεζεηηθά κεραλήκαηα, Qaux:
Δπνκέλσο, ε αληίζηνηρε απαηηνύκελε παξνρήο ζαιαζζηλνύ λεξνύ από ηελ αληιία ςύμεο πξνο ηνλ θεληξηθό
ελαιιάθηε γηα ην ζεκείν ιεηηνπξγίαο Ν, qSW_in,N [m3/h], είλαη αλάινγε ηεο απαηηνύκελεο απαγσγήο
ζεξκόηεηαο ηνπ θεληξηθνύ ελαιιάθηε γηα ην ζπγθεθξηκέλν ζεκείν ιεηηνπξγίαο:
όπνπ qSW_in,MCR θαη Qcent,MCR είλαη ηα νλνκαζηηθά κεγέζε παξνρήο ζαιαζζηλνύ λεξνύ θαη νλνκαζηηθήο ξνήο
ζεξκόηεηαο ηνπ θεληξηθνύ ελαιιάθηε ζεξκόηεηαο θαηά ην ζρεδηαζκό ηνπ πινίνπ αληίζηνηρα. Από ηε ζρ.
(2.76), παξαηεξείηαη όηη ε απαηηνύκελε παξνρή ζαιαζζηλνύ λεξνύ από ηελ αληιία ςύμεο γηα ηελ ηθαλνπνίεζε
ησλ αλαγθώλ ςύμεο κεηαβάιιεηαη ζεκαληηθά κε ην θνξηίν θαη ηελ ηαρύηεηα πεξηζηξνθήο ηεο Κ/Μ.
Χζηόζν ε εθηηκώκελε κεηαβνιή ηεο ξνήο πνπ παξέρεηαη από ηελ αληιία επεξεάδεη ζεκαληηθά ηηο
πηέζεηο θαη ηα ραξαθηεξηζηηθά κεγέζε ζε ζεκαληηθά ζεκεία ηνπ δηθηύνπ ζαιαζζηλνύ λεξνύ, ηππηθό ηκήκα
ηνπ νπνίνπ παξηζηάλεηαη απινπνηεκέλα ζην ρ. 2.29. Οη κεηαβνιέο ηεο πίεζεο θαηά κήθνο ησλ γξακκώλ θαη
ησλ εμαξηεκάησλ ηνπ δηθηύνπ ιόγσ ηεο κεηαβνιήο ηεο ξνήο πνπ παξέρεηαη από ηελ αληιία ζαιαζζηλνύ
λεξνύ απνηεινύλ ζεκαληηθό παξάγνληα κειέηεο γηα ηελ ηθαλνπνίεζε ησλ πεξηνξηζκώλ ιεηηνπξγίαο ησλ
βνεζεηηθώλ κεραλεκάησλ ηνπ δηθηύνπ. ηελ παξαθάησ παξάγξαθν παξνπζηάδνληαη νη βαζηθνί κέζνδνη
ππνινγηζκνύ ησλ κεγεζώλ πίεζεο θαη αληιεηηθνύ ύςνπο πνπ απνηεινύλ αλαπόζπαζην ηκήκα ηεο κειέηεο.
Γεληθά γηα έλα αλνηρηό αδηαβαηηθό ζύζηεκα ρσξίο ηξηβέο, ρσξίο λα παξάγεηαη ή λα απνξξνθάηαη έξγν θαη
ζεσξώληαο ακειεηέα ηε κεηαβνιή ηεο εζσηεξηθήο ελέξγεηαο ηνπ ξεπζηνύ, ε εμίζσζε δηαηήξεζεο ηεο
ελέξγεηαο, γλσζηή θαη σο εμίζσζε Bernoulli [34], είλαη:
ή
όπνπ: p = ε πίεζε ηνπ ξεπζηνύ (N/m2)
ξ = ε ππθλόηεηα ηνπ ξεπζηνύ (kg/m3)
v = ε ηαρύηεηα ηνπ ξεπζηνύ (m/s) θαη q = ε ξνή ηνπ ξεπζηνύ (m3/s)
h = ην γεσδαηηηθό ύςνο (m)
g = ε επηηάρπλζε ηεο βαξύηεηαο (9.81m/s2)
H = ην ζηαηηθό ύςνο (m)
Θεσξώληαο ζσιήλα θπθιηθήο εζσηεξηθήο δηαηνκήο Α(m2), δηακέηξνπ d(m), κήθνπο l(m) κε δηαηκεηηθή
ηάζε ηw (N/m2), νξίδεηαη ν ζπληειεζηήο ηξηβήο Κ = Κ(Re, ε/d), όπνπ ε ε ηξαρύηεηα ησλ ηνηρσκάησλ:
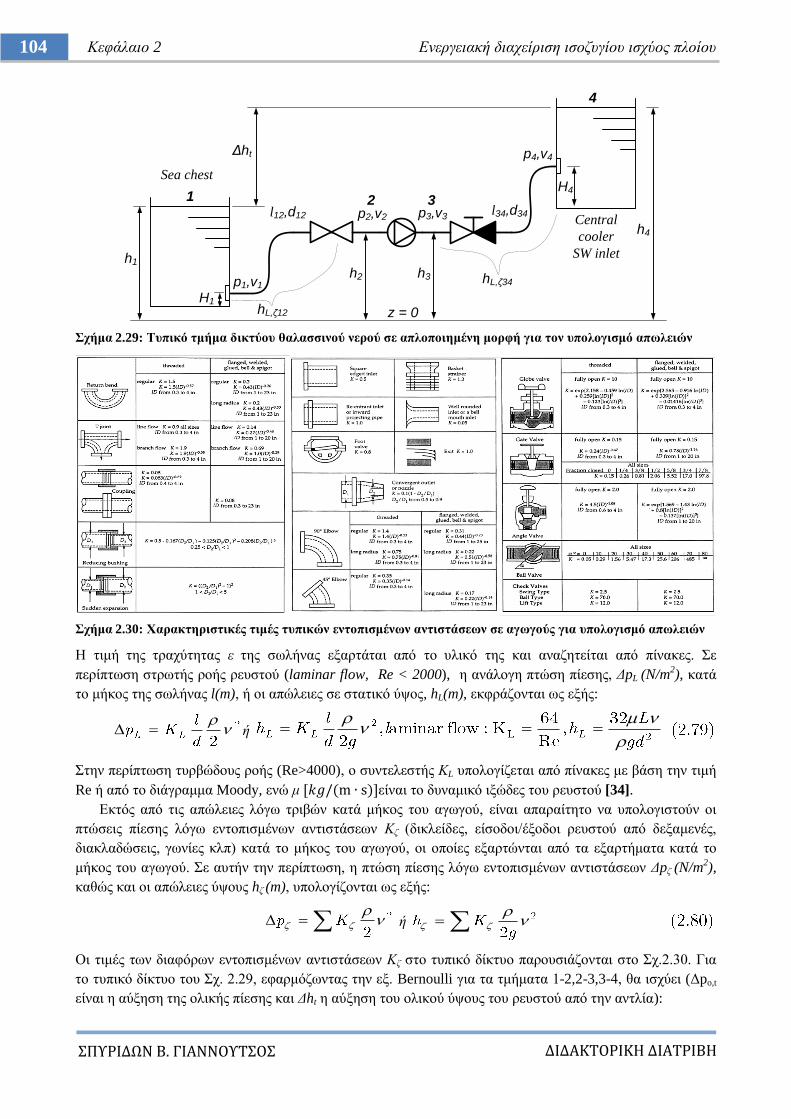
ΔΙΔΑΚΣΟΡΙΚΗ ΔΙΑΣΡΙΒΗ
ΠΤΡΙΔΩΝ Β. ΓΙΑΝΝΟΤΣΟ
104 Κεθάιαην 2 Δλεξγεηαθή δηαρείξηζε ηζνδπγίνπ ηζρύνο πινίνπ
ρήκα 2.29: Σππηθό ηκήκα δηθηύνπ ζαιαζζηλνύ λεξνύ ζε απινπνηεκέλε κνξθή γηα ηνλ ππνινγηζκό απσιεηώλ
ρήκα 2.30: Υαξαθηεξηζηηθέο ηηκέο ηππηθώλ εληνπηζκέλσλ αληηζηάζεσλ ζε αγσγνύο γηα ππνινγηζκό απσιεηώλ
Ζ ηηκή ηεο ηξαρύηεηαο ε ηεο ζσιήλαο εμαξηάηαη από ην πιηθό ηεο θαη αλαδεηείηαη από πίλαθεο. ε
πεξίπησζε ζηξσηήο ξνήο ξεπζηνύ (laminar flow, Re < 2000), ε αλάινγε πηώζε πίεζεο, ΓpL (N/m2), θαηά
ην κήθνο ηεο ζσιήλαο l(m), ή νη απώιεηεο ζε ζηαηηθό ύςνο, hL(m), εθθξάδνληαη σο εμήο:
ή
ηελ πεξίπησζε ηπξβώδνπο ξνήο (Re>4000), ν ζπληειεζηήο ΚL ππνινγίδεηαη από πίλαθεο κε βάζε ηελ ηηκή
Re ή από ην δηάγξακκα Moody, ελώ κ είλαη ην δπλακηθό ημώδεο ηνπ ξεπζηνύ [34].
Δθηόο από ηηο απώιεηεο ιόγσ ηξηβώλ θαηά κήθνο ηνπ αγσγνύ, είλαη απαξαίηεην λα ππνινγηζηνύλ νη
πηώζεηο πίεζεο ιόγσ εληνπηζκέλσλ αληηζηάζεσλ Κδ (δηθιείδεο, είζνδνη/έμνδνη ξεπζηνύ από δεμακελέο,
δηαθιαδώζεηο, γσλίεο θιπ) θαηά ην κήθνο ηνπ αγσγνύ, νη νπνίεο εμαξηώληαη από ηα εμαξηήκαηα θαηά ην
κήθνο ηνπ αγσγνύ. ε απηήλ ηελ πεξίπησζε, ε πηώζε πίεζεο ιόγσ εληνπηζκέλσλ αληηζηάζεσλ Γpδ (N/m2),
θαζώο θαη νη απώιεηεο ύςνπο hδ (m), ππνινγίδνληαη σο εμήο:
ή
Οη ηηκέο ησλ δηαθόξσλ εληνπηζκέλσλ αληηζηάζεσλ Κδ ζην ηππηθό δίθηπν παξνπζηάδνληαη ζην ρ.2.30. Γηα
ην ηππηθό δίθηπν ηνπ ρ. 2.29, εθαξκόδσληαο ηελ εμ. Bernoulli γηα ηα ηκήκαηα 1-2,2-3,3-4, ζα ηζρύεη (Γpo,t
είλαη ε αύμεζε ηεο νιηθήο πίεζεο θαη Γht ε αύμεζε ηνπ νιηθνύ ύςνπο ηνπ ξεπζηνύ από ηελ αληιία):
h1
z = 0
h4
h2 h3
1 2 3
4
Δht
p1,v1
p2,v2 p3,v3
p4,v4
hL,ζ12
hL,ζ34
l12,d12 l34,d34
H4
H1
Sea chest
Central
cooler
SW inlet
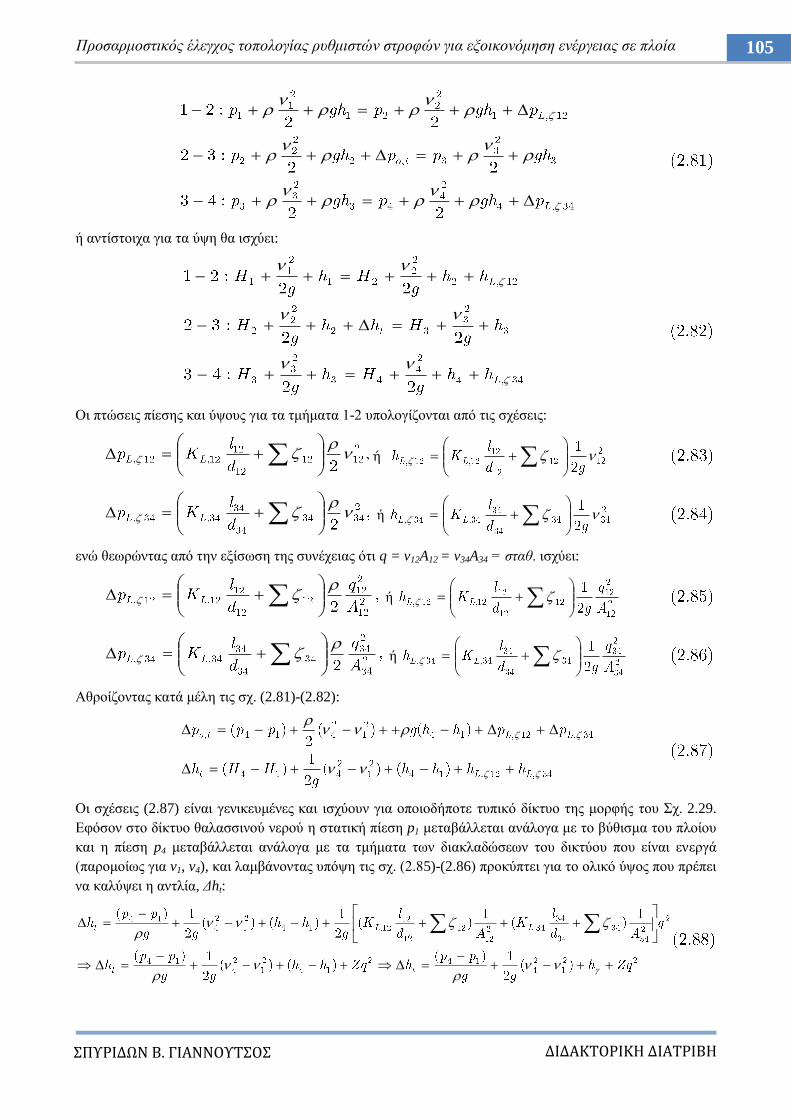
ΔΙΔΑΚΣΟΡΙΚΗ ΔΙΑΣΡΙΒΗ
ΠΤΡΙΔΩΝ Β. ΓΙΑΝΝΟΤΣΟ
105 Πξνζαξκνζηηθόο έιεγρνο ηνπνινγίαο ξπζκηζηώλ ζηξνθώλ γηα εμνηθνλόκεζε ελέξγεηαο ζε πινία
ή αληίζηνηρα γηα ηα ύςε ζα ηζρύεη:
Οη πηώζεηο πίεζεο θαη ύςνπο γηα ηα ηκήκαηα 1-2 ππνινγίδνληαη από ηηο ζρέζεηο:
ή
ή
ελώ ζεσξώληαο από ηελ εμίζσζε ηεο ζπλέρεηαο όηη q = v12A12 = v34A34 = ζηαζ. ηζρύεη:
ή
ή
Αζξνίδνληαο θαηά κέιε ηηο ζρ. (2.81)-(2.82):
Οη ζρέζεηο (2.87) είλαη γεληθεπκέλεο θαη ηζρύνπλ γηα νπνηνδήπνηε ηππηθό δίθηπν ηεο κνξθήο ηνπ ρ. 2.29.
Δθόζνλ ζην δίθηπν ζαιαζζηλνύ λεξνύ ε ζηαηηθή πίεζε p1 κεηαβάιιεηαη αλάινγα κε ην βύζηζκα ηνπ πινίνπ
θαη ε πίεζε p4 κεηαβάιιεηαη αλάινγα κε ηα ηκήκαηα ησλ δηαθιαδώζεσλ ηνπ δηθηύνπ πνπ είλαη ελεξγά
(παξνκνίσο γηα v1, v4), θαη ιακβάλνληαο ππόςε ηηο ζρ. (2.85)-(2.86) πξνθύπηεη γηα ην νιηθό ύςνο πνπ πξέπεη
λα θαιύςεη ε αληιία, Γht:
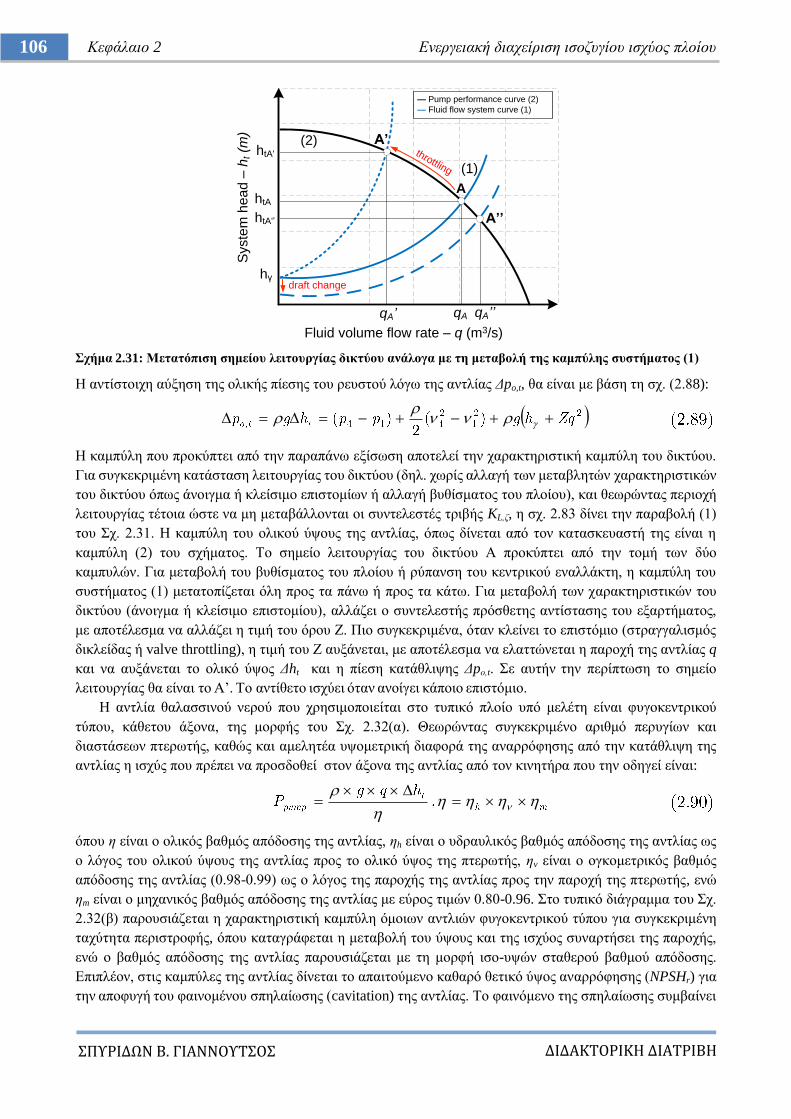
ΔΙΔΑΚΣΟΡΙΚΗ ΔΙΑΣΡΙΒΗ
ΠΤΡΙΔΩΝ Β. ΓΙΑΝΝΟΤΣΟ
106 Κεθάιαην 2 Δλεξγεηαθή δηαρείξηζε ηζνδπγίνπ ηζρύνο πινίνπ
ρήκα 2.31: Μεηαηόπηζε ζεκείνπ ιεηηνπξγίαο δηθηύνπ αλάινγα κε ηε κεηαβνιή ηεο θακπύιεο ζπζηήκαηνο (1)
Ζ αληίζηνηρε αύμεζε ηεο νιηθήο πίεζεο ηνπ ξεπζηνύ ιόγσ ηεο αληιίαο Γpo,t, ζα είλαη κε βάζε ηε ζρ. (2.88):
Ζ θακπύιε πνπ πξνθύπηεη από ηελ παξαπάλσ εμίζσζε απνηειεί ηελ ραξαθηεξηζηηθή θακπύιε ηνπ δηθηύνπ.
Γηα ζπγθεθξηκέλε θαηάζηαζε ιεηηνπξγίαο ηνπ δηθηύνπ (δει. ρσξίο αιιαγή ησλ κεηαβιεηώλ ραξαθηεξηζηηθώλ
ηνπ δηθηύνπ όπσο άλνηγκα ή θιείζηκν επηζηνκίσλ ή αιιαγή βπζίζκαηνο ηνπ πινίνπ), θαη ζεσξώληαο πεξηνρή
ιεηηνπξγίαο ηέηνηα ώζηε λα κε κεηαβάιινληαη νη ζπληειεζηέο ηξηβήο KL,δ, ε ζρ. 2.83 δίλεη ηελ παξαβνιή (1)
ηνπ ρ. 2.31. Ζ θακπύιε ηνπ νιηθνύ ύςνπο ηεο αληιίαο, όπσο δίλεηαη από ηνλ θαηαζθεπαζηή ηεο είλαη ε
θακπύιε (2) ηνπ ζρήκαηνο. Σν ζεκείν ιεηηνπξγίαο ηνπ δηθηύνπ Α πξνθύπηεη από ηελ ηνκή ησλ δύν
θακππιώλ. Γηα κεηαβνιή ηνπ βπζίζκαηνο ηνπ πινίνπ ή ξύπαλζε ηνπ θεληξηθνύ ελαιιάθηε, ε θακπύιε ηνπ
ζπζηήκαηνο (1) κεηαηνπίδεηαη όιε πξνο ηα πάλσ ή πξνο ηα θάησ. Γηα κεηαβνιή ησλ ραξαθηεξηζηηθώλ ηνπ
δηθηύνπ (άλνηγκα ή θιείζηκν επηζηνκίνπ), αιιάδεη ν ζπληειεζηήο πξόζζεηεο αληίζηαζεο ηνπ εμαξηήκαηνο,
κε απνηέιεζκα λα αιιάδεη ε ηηκή ηνπ όξνπ Ε. Πην ζπγθεθξηκέλα, όηαλ θιείλεη ην επηζηόκην (ζηξαγγαιηζκόο
δηθιείδαο ή valve throttling), ε ηηκή ηνπ Ε απμάλεηαη, κε απνηέιεζκα λα ειαηηώλεηαη ε παξνρή ηεο αληιίαο q
θαη λα απμάλεηαη ην νιηθό ύςνο Γht θαη ε πίεζε θαηάζιηςεο Γpν,t. ε απηήλ ηελ πεξίπησζε ην ζεκείν
ιεηηνπξγίαο ζα είλαη ην Α‟. Σν αληίζεην ηζρύεη όηαλ αλνίγεη θάπνην επηζηόκην.
Ζ αληιία ζαιαζζηλνύ λεξνύ πνπ ρξεζηκνπνηείηαη ζην ηππηθό πινίν ππό κειέηε είλαη θπγνθεληξηθνύ
ηύπνπ, θάζεηνπ άμνλα, ηεο κνξθήο ηνπ ρ. 2.32(α). Θεσξώληαο ζπγθεθξηκέλν αξηζκό πεξπγίσλ θαη
δηαζηάζεσλ πηεξσηήο, θαζώο θαη ακειεηέα πςνκεηξηθή δηαθνξά ηεο αλαξξόθεζεο από ηελ θαηάζιηςε ηεο
αληιίαο ε ηζρύο πνπ πξέπεη λα πξνζδνζεί ζηνλ άμνλα ηεο αληιίαο από ηνλ θηλεηήξα πνπ ηελ νδεγεί είλαη:
όπνπ ε είλαη ν νιηθόο βαζκόο απόδνζεο ηεο αληιίαο, εh είλαη ν πδξαπιηθόο βαζκόο απόδνζεο ηεο αληιίαο σο
ν ιόγνο ηνπ νιηθνύ ύςνπο ηεο αληιίαο πξνο ην νιηθό ύςνο ηεο πηεξσηήο, εv είλαη ν νγθνκεηξηθόο βαζκόο
απόδνζεο ηεο αληιίαο (0.98-0.99) σο ν ιόγνο ηεο παξνρήο ηεο αληιίαο πξνο ηελ παξνρή ηεο πηεξσηήο, ελώ
εm είλαη ν κεραληθόο βαζκόο απόδνζεο ηεο αληιίαο κε εύξνο ηηκώλ 0.80-0.96. ην ηππηθό δηάγξακκα ηνπ ρ.
2.32(β) παξνπζηάδεηαη ε ραξαθηεξηζηηθή θακπύιε όκνησλ αληιηώλ θπγνθεληξηθνύ ηύπνπ γηα ζπγθεθξηκέλε
ηαρύηεηα πεξηζηξνθήο, όπνπ θαηαγξάθεηαη ε κεηαβνιή ηνπ ύςνπο θαη ηεο ηζρύνο ζπλαξηήζεη ηεο παξνρήο,
ελώ ν βαζκόο απόδνζεο ηεο αληιίαο παξνπζηάδεηαη κε ηε κνξθή ηζν-πςώλ ζηαζεξνύ βαζκνύ απόδνζεο.
Δπηπιένλ, ζηηο θακπύιεο ηεο αληιίαο δίλεηαη ην απαηηνύκελν θαζαξό ζεηηθό ύςνο αλαξξόθεζεο (NPSHr) γηα
ηελ απνθπγή ηνπ θαηλνκέλνπ ζπειαίσζεο (cavitation) ηεο αληιίαο. Σν θαηλόκελν ηεο ζπειαίσζεο ζπκβαίλεη
Syste
m h
ea
d –
ht (
m)
— Pump performance curve (2)
— Fluid flow system curve (1)
qA
htA
A
A’htA'
Fluid volume flow rate – q (m3/s)
hγ
(1)
throttling
(2)
draft change
A’’
qA’’qA’
htA'’
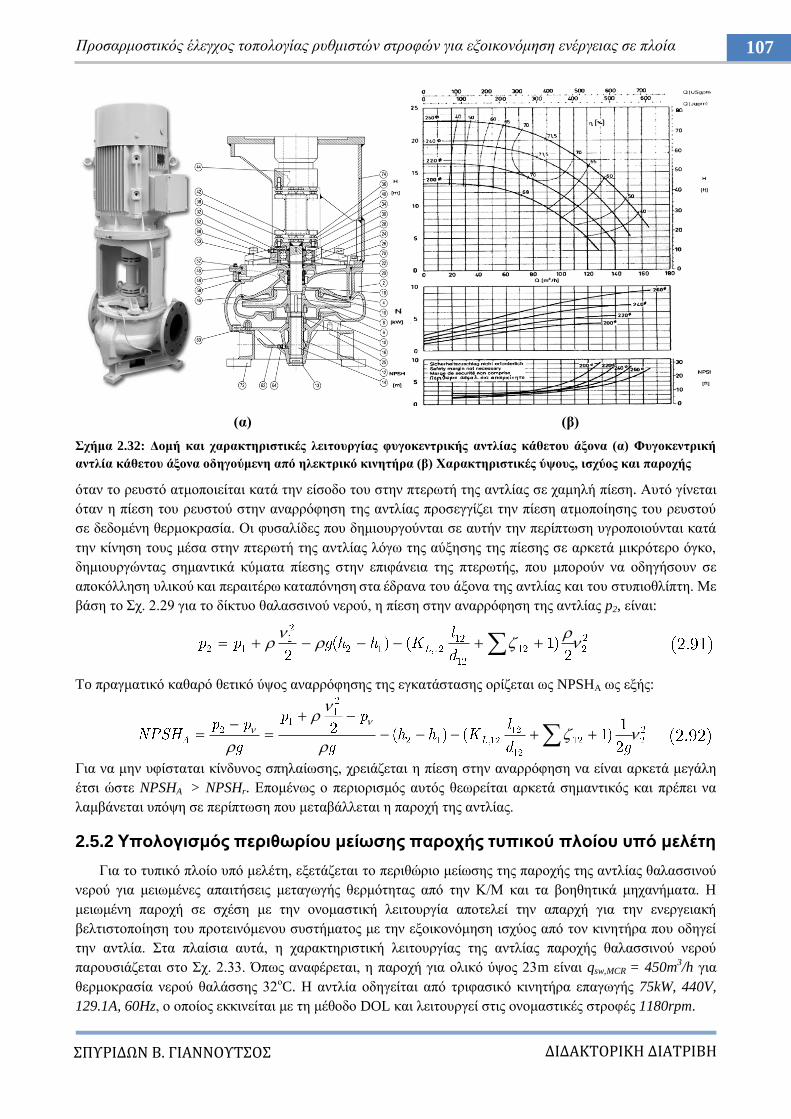
ΔΙΔΑΚΣΟΡΙΚΗ ΔΙΑΣΡΙΒΗ
ΠΤΡΙΔΩΝ Β. ΓΙΑΝΝΟΤΣΟ
107 Πξνζαξκνζηηθόο έιεγρνο ηνπνινγίαο ξπζκηζηώλ ζηξνθώλ γηα εμνηθνλόκεζε ελέξγεηαο ζε πινία
(α) (β)
ρήκα 2.32: Γνκή θαη ραξαθηεξηζηηθέο ιεηηνπξγίαο θπγνθεληξηθήο αληιίαο θάζεηνπ άμνλα (α) Φπγνθεληξηθή
αληιία θάζεηνπ άμνλα νδεγνύκελε από ειεθηξηθό θηλεηήξα (β) Υαξαθηεξηζηηθέο ύςνπο, ηζρύνο θαη παξνρήο
όηαλ ην ξεπζηό αηκνπνηείηαη θαηά ηελ είζνδν ηνπ ζηελ πηεξσηή ηεο αληιίαο ζε ρακειή πίεζε. Απηό γίλεηαη
όηαλ ε πίεζε ηνπ ξεπζηνύ ζηελ αλαξξόθεζε ηεο αληιίαο πξνζεγγίδεη ηελ πίεζε αηκνπνίεζεο ηνπ ξεπζηνύ
ζε δεδνκέλε ζεξκνθξαζία. Οη θπζαιίδεο πνπ δεκηνπξγνύληαη ζε απηήλ ηελ πεξίπησζε πγξνπνηνύληαη θαηά
ηελ θίλεζε ηνπο κέζα ζηελ πηεξσηή ηεο αληιίαο ιόγσ ηεο αύμεζεο ηεο πίεζεο ζε αξθεηά κηθξόηεξν όγθν,
δεκηνπξγώληαο ζεκαληηθά θύκαηα πίεζεο ζηελ επηθάλεηα ηεο πηεξσηήο, πνπ κπνξνύλ λα νδεγήζνπλ ζε
απνθόιιεζε πιηθνύ θαη πεξαηηέξσ θαηαπόλεζε ζηα έδξαλα ηνπ άμνλα ηεο αληιίαο θαη ηνπ ζηππηνζιίπηε. Με
βάζε ην ρ. 2.29 γηα ην δίθηπν ζαιαζζηλνύ λεξνύ, ε πίεζε ζηελ αλαξξόθεζε ηεο αληιίαο p2, είλαη:
To πξαγκαηηθό θαζαξό ζεηηθό ύςνο αλαξξόθεζεο ηεο εγθαηάζηαζεο νξίδεηαη σο NPSHA σο εμήο:
Γηα λα κελ πθίζηαηαη θίλδπλνο ζπειαίσζεο, ρξεηάδεηαη ε πίεζε ζηελ αλαξξόθεζε λα είλαη αξθεηά κεγάιε
έηζη ώζηε NPSHA > NPSHr. Δπνκέλσο ν πεξηνξηζκόο απηόο ζεσξείηαη αξθεηά ζεκαληηθόο θαη πξέπεη λα
ιακβάλεηαη ππόςε ζε πεξίπησζε πνπ κεηαβάιιεηαη ε παξνρή ηεο αληιίαο.
2.5.2 Τπνινγηζκόο πεξηζσξίνπ κείσζεο παξνρήο ηππηθνύ πινίνπ ππό κειέηε
Γηα ην ηππηθό πινίν ππό κειέηε, εμεηάδεηαη ην πεξηζώξην κείσζεο ηεο παξνρήο ηεο αληιίαο ζαιαζζηλνύ
λεξνύ γηα κεησκέλεο απαηηήζεηο κεηαγσγήο ζεξκόηεηαο από ηελ Κ/Μ θαη ηα βνεζεηηθά κεραλήκαηα. Ζ
κεησκέλε παξνρή ζε ζρέζε κε ηελ νλνκαζηηθή ιεηηνπξγία απνηειεί ηελ απαξρή γηα ηελ ελεξγεηαθή
βειηηζηνπνίεζε ηνπ πξνηεηλόκελνπ ζπζηήκαηνο κε ηελ εμνηθνλόκεζε ηζρύνο από ηνλ θηλεηήξα πνπ νδεγεί
ηελ αληιία. ηα πιαίζηα απηά, ε ραξαθηεξηζηηθή ιεηηνπξγίαο ηεο αληιίαο παξνρήο ζαιαζζηλνύ λεξνύ
παξνπζηάδεηαη ζην ρ. 2.33. Όπσο αλαθέξεηαη, ε παξνρή γηα νιηθό ύςνο 23m είλαη qsw,MCR = 450m3/h γηα
ζεξκνθξαζία λεξνύ ζαιάζζεο 32νC. H αληιία νδεγείηαη από ηξηθαζηθό θηλεηήξα επαγσγήο 75kW, 440V,
129.1A, 60Hz, ν νπνίνο εθθηλείηαη κε ηε κέζνδν DOL θαη ιεηηνπξγεί ζηηο νλνκαζηηθέο ζηξνθέο 1180rpm.
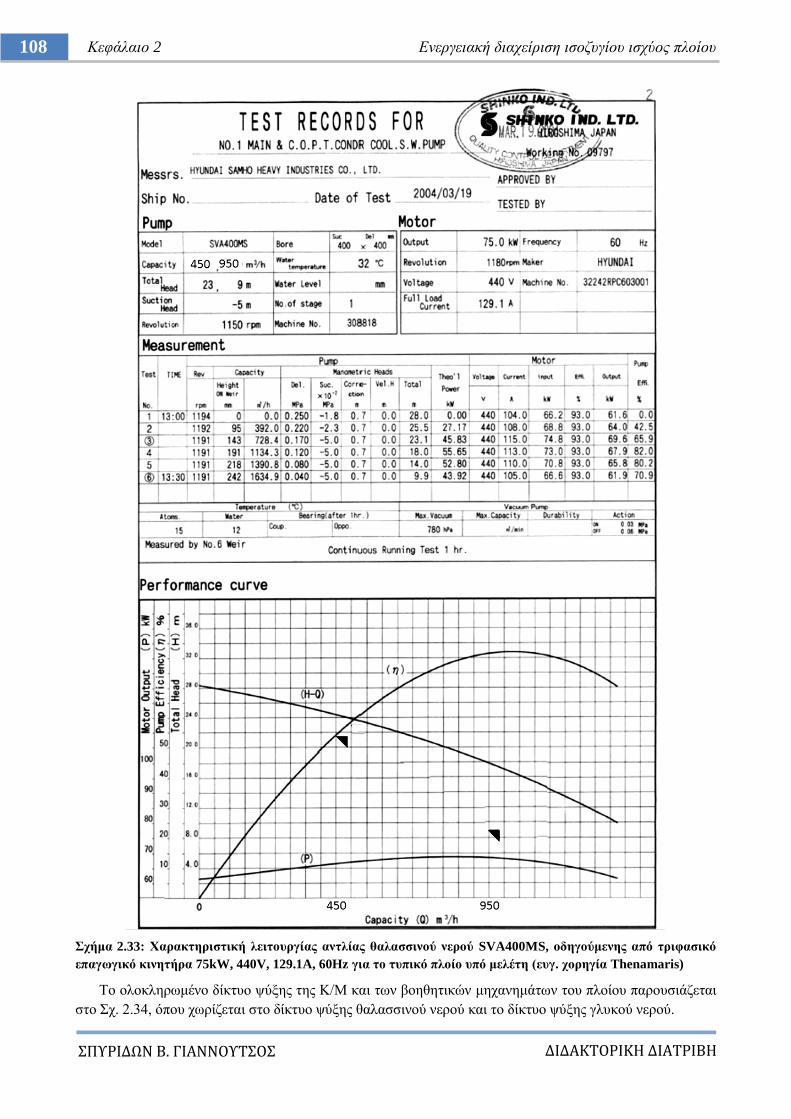
ΔΙΔΑΚΣΟΡΙΚΗ ΔΙΑΣΡΙΒΗ
ΠΤΡΙΔΩΝ Β. ΓΙΑΝΝΟΤΣΟ
108 Κεθάιαην 2 Δλεξγεηαθή δηαρείξηζε ηζνδπγίνπ ηζρύνο πινίνπ
ρήκα 2.33: Υαξαθηεξηζηηθή ιεηηνπξγίαο αληιίαο ζαιαζζηλνύ λεξνύ SVA400MS, νδεγνύκελεο από ηξηθαζηθό
επαγσγηθό θηλεηήξα 75kW, 440V, 129.1A, 60Hz γηα ην ηππηθό πινίν ππό κειέηε (επγ. ρνξεγία Thenamaris)
Σν νινθιεξσκέλν δίθηπν ςύμεο ηεο Κ/Μ θαη ησλ βνεζεηηθώλ κεραλεκάησλ ηνπ πινίνπ παξνπζηάδεηαη
ζην ρ. 2.34, όπνπ ρσξίδεηαη ζην δίθηπν ςύμεο ζαιαζζηλνύ λεξνύ θαη ην δίθηπν ςύμεο γιπθνύ λεξνύ.
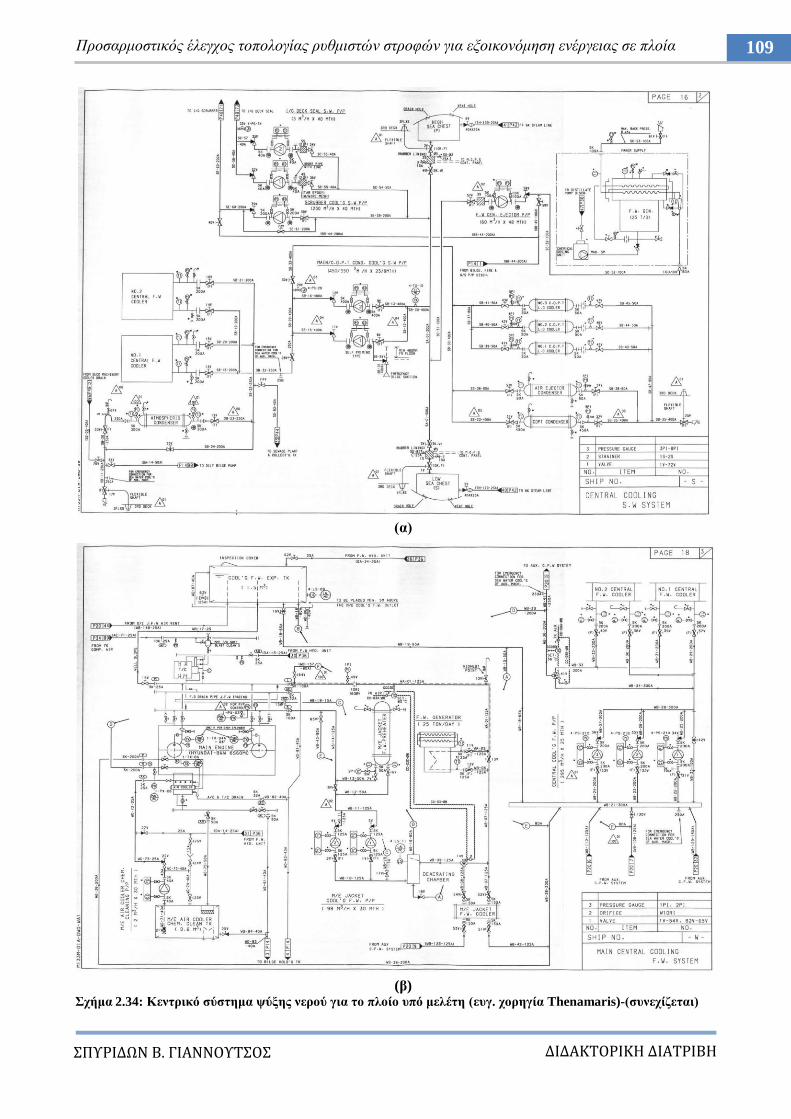
ΔΙΔΑΚΣΟΡΙΚΗ ΔΙΑΣΡΙΒΗ
ΠΤΡΙΔΩΝ Β. ΓΙΑΝΝΟΤΣΟ
109 Πξνζαξκνζηηθόο έιεγρνο ηνπνινγίαο ξπζκηζηώλ ζηξνθώλ γηα εμνηθνλόκεζε ελέξγεηαο ζε πινία
(α)
(β) ρήκα 2.34: Κεληξηθό ζύζηεκα ςύμεο λεξνύ γηα ην πινίν ππό κειέηε (επγ. ρνξεγία Thenamaris)-(ζπλερίδεηαη)
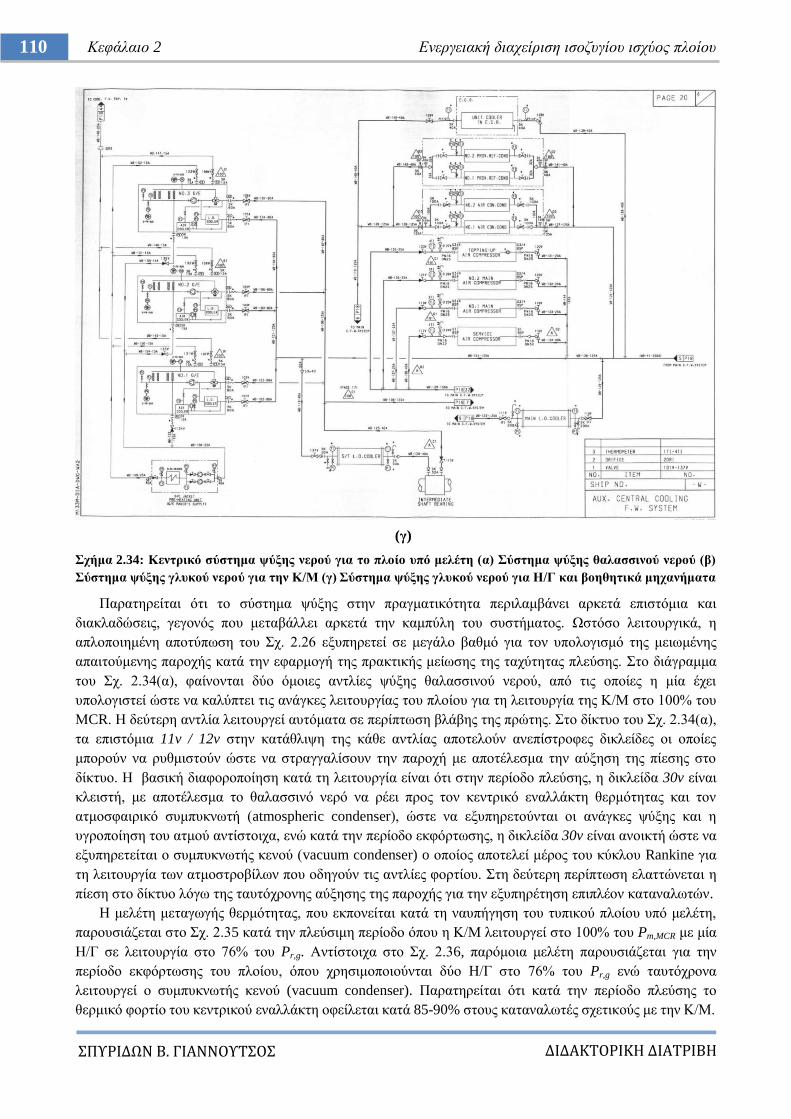
ΔΙΔΑΚΣΟΡΙΚΗ ΔΙΑΣΡΙΒΗ
ΠΤΡΙΔΩΝ Β. ΓΙΑΝΝΟΤΣΟ
110 Κεθάιαην 2 Δλεξγεηαθή δηαρείξηζε ηζνδπγίνπ ηζρύνο πινίνπ
(γ)
ρήκα 2.34: Κεληξηθό ζύζηεκα ςύμεο λεξνύ γηα ην πινίν ππό κειέηε (α) ύζηεκα ςύμεο ζαιαζζηλνύ λεξνύ (β)
ύζηεκα ςύμεο γιπθνύ λεξνύ γηα ηελ Κ/Μ (γ) ύζηεκα ςύμεο γιπθνύ λεξνύ γηα Η/Γ θαη βνεζεηηθά κεραλήκαηα
Παξαηεξείηαη όηη ην ζύζηεκα ςύμεο ζηελ πξαγκαηηθόηεηα πεξηιακβάλεη αξθεηά επηζηόκηα θαη
δηαθιαδώζεηο, γεγνλόο πνπ κεηαβάιιεη αξθεηά ηελ θακπύιε ηνπ ζπζηήκαηνο. Χζηόζν ιεηηνπξγηθά, ε
απινπνηεκέλε απνηύπσζε ηνπ ρ. 2.26 εμππεξεηεί ζε κεγάιν βαζκό γηα ηνλ ππνινγηζκό ηεο κεησκέλεο
απαηηνύκελεο παξνρήο θαηά ηελ εθαξκνγή ηεο πξαθηηθήο κείσζεο ηεο ηαρύηεηαο πιεύζεο. ην δηάγξακκα
ηνπ ρ. 2.34(α), θαίλνληαη δύν όκνηεο αληιίεο ςύμεο ζαιαζζηλνύ λεξνύ, από ηηο νπνίεο ε κία έρεη
ππνινγηζηεί ώζηε λα θαιύπηεη ηηο αλάγθεο ιεηηνπξγίαο ηνπ πινίνπ γηα ηε ιεηηνπξγία ηεο Κ/Μ ζην 100% ηνπ
ΜCR. Ζ δεύηεξε αληιία ιεηηνπξγεί απηόκαηα ζε πεξίπησζε βιάβεο ηεο πξώηεο. ην δίθηπν ηνπ ρ. 2.34(α),
ηα επηζηόκηα 11v / 12v ζηελ θαηάζιηςε ηεο θάζε αληιίαο απνηεινύλ αλεπίζηξνθεο δηθιείδεο νη νπνίεο
κπνξνύλ λα ξπζκηζηνύλ ώζηε λα ζηξαγγαιίζνπλ ηελ παξνρή κε απνηέιεζκα ηελ αύμεζε ηεο πίεζεο ζην
δίθηπν. Ζ βαζηθή δηαθνξνπνίεζε θαηά ηε ιεηηνπξγία είλαη όηη ζηελ πεξίνδν πιεύζεο, ε δηθιείδα 30v είλαη
θιεηζηή, κε απνηέιεζκα ην ζαιαζζηλό λεξό λα ξέεη πξνο ηνλ θεληξηθό ελαιιάθηε ζεξκόηεηαο θαη ηνλ
αηκνζθαηξηθό ζπκππθλσηή (atmospheric condenser), ώζηε λα εμππεξεηνύληαη νη αλάγθεο ςύμεο θαη ε
πγξνπνίεζε ηνπ αηκνύ αληίζηνηρα, ελώ θαηά ηελ πεξίνδν εθθόξησζεο, ε δηθιείδα 30v είλαη αλνηθηή ώζηε λα
εμππεξεηείηαη ν ζπκππθλσηήο θελνύ (vacuum condenser) o νπνίνο απνηειεί κέξνο ηνπ θύθινπ Rankine γηα
ηε ιεηηνπξγία ησλ αηκνζηξνβίισλ πνπ νδεγνύλ ηηο αληιίεο θνξηίνπ. ηε δεύηεξε πεξίπησζε ειαηηώλεηαη ε
πίεζε ζην δίθηπν ιόγσ ηεο ηαπηόρξνλεο αύμεζεο ηεο παξνρήο γηα ηελ εμππεξέηεζε επηπιένλ θαηαλαισηώλ.
Ζ κειέηε κεηαγσγήο ζεξκόηεηαο, πνπ εθπνλείηαη θαηά ηε λαππήγεζε ηνπ ηππηθνύ πινίνπ ππό κειέηε,
παξνπζηάδεηαη ζην ρ. 2.35 θαηά ηελ πιεύζηκε πεξίνδν όπνπ ε Κ/Μ ιεηηνπξγεί ζην 100% ηνπ Pm,MCR κε κία
Ζ/Γ ζε ιεηηνπξγία ζην 76% ηνπ Pr,g. Αληίζηνηρα ζην ρ. 2.36, παξόκνηα κειέηε παξνπζηάδεηαη γηα ηελ
πεξίνδν εθθόξησζεο ηνπ πινίνπ, όπνπ ρξεζηκνπνηνύληαη δύν Ζ/Γ ζην 76% ηνπ Pr,g ελώ ηαπηόρξνλα
ιεηηνπξγεί ν ζπκππθλσηήο θελνύ (vacuum condenser). Παξαηεξείηαη όηη θαηά ηελ πεξίνδν πιεύζεο ην
ζεξκηθό θνξηίν ηνπ θεληξηθνύ ελαιιάθηε νθείιεηαη θαηά 85-90% ζηνπο θαηαλαισηέο ζρεηηθνύο κε ηελ Κ/Μ.
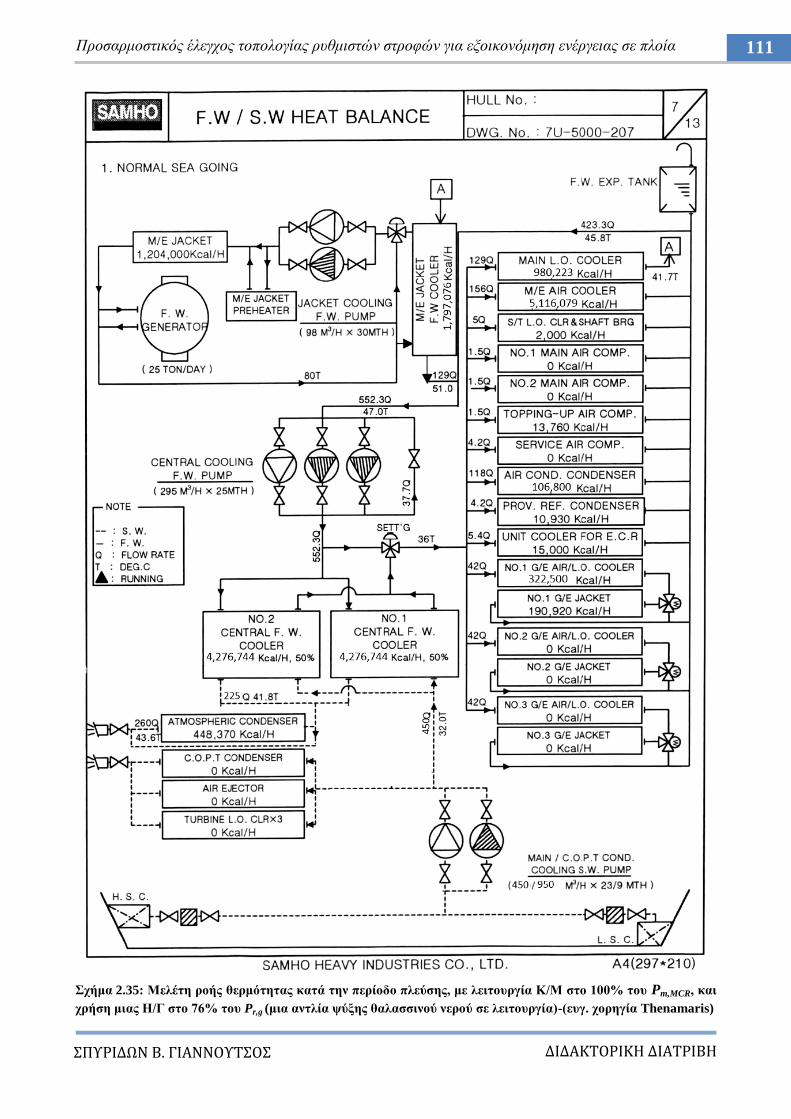
ΔΙΔΑΚΣΟΡΙΚΗ ΔΙΑΣΡΙΒΗ
ΠΤΡΙΔΩΝ Β. ΓΙΑΝΝΟΤΣΟ
111 Πξνζαξκνζηηθόο έιεγρνο ηνπνινγίαο ξπζκηζηώλ ζηξνθώλ γηα εμνηθνλόκεζε ελέξγεηαο ζε πινία
ρήκα 2.35: Μειέηε ξνήο ζεξκόηεηαο θαηά ηελ πεξίνδν πιεύζεο, κε ιεηηνπξγία Κ/Μ ζην 100% ηνπ Pm,MCR, θαη
ρξήζε κηαο Η/Γ ζην 76% ηνπ Pr,g (κηα αληιία ςύμεο ζαιαζζηλνύ λεξνύ ζε ιεηηνπξγία)-(επγ. ρνξεγία Thenamaris)
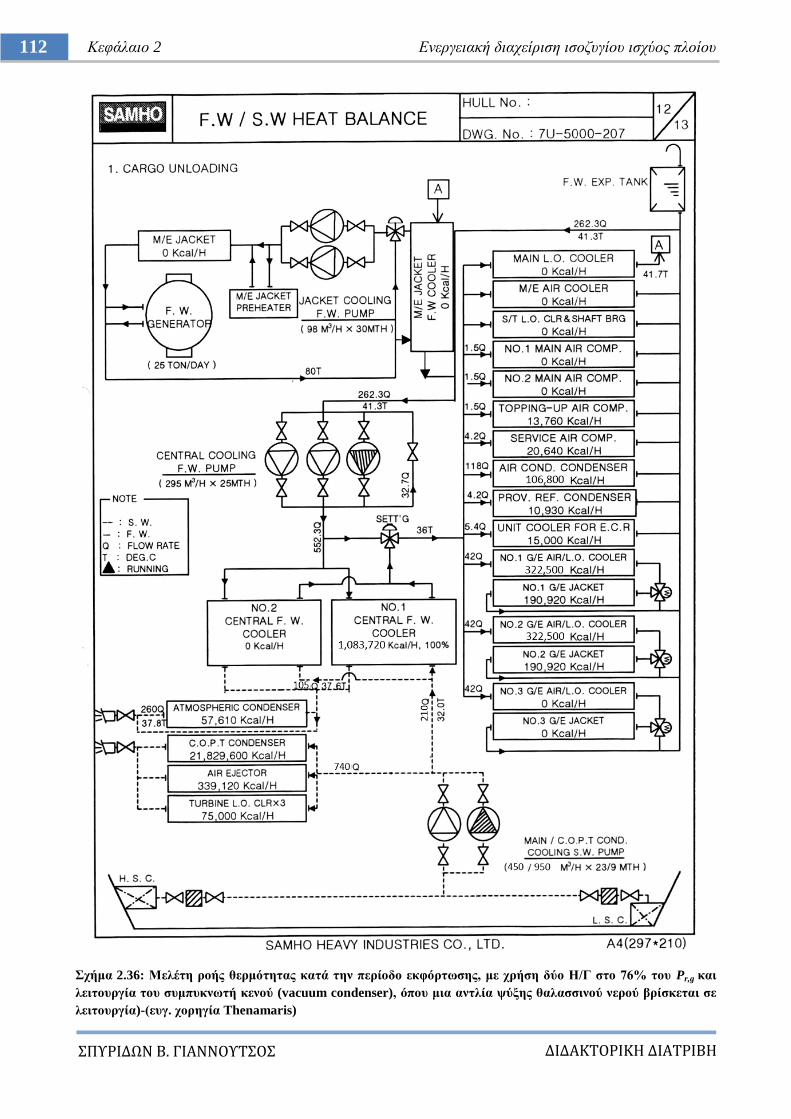
ΔΙΔΑΚΣΟΡΙΚΗ ΔΙΑΣΡΙΒΗ
ΠΤΡΙΔΩΝ Β. ΓΙΑΝΝΟΤΣΟ
112 Κεθάιαην 2 Δλεξγεηαθή δηαρείξηζε ηζνδπγίνπ ηζρύνο πινίνπ
ρήκα 2.36: Μειέηε ξνήο ζεξκόηεηαο θαηά ηελ πεξίνδν εθθόξησζεο, κε ρξήζε δύν Η/Γ ζην 76% ηνπ Pr,g θαη
ιεηηνπξγία ηνπ ζπκππθλσηή θελνύ (vacuum condenser), όπνπ κηα αληιία ςύμεο ζαιαζζηλνύ λεξνύ βξίζθεηαη ζε
ιεηηνπξγία)-(επγ. ρνξεγία Thenamaris)
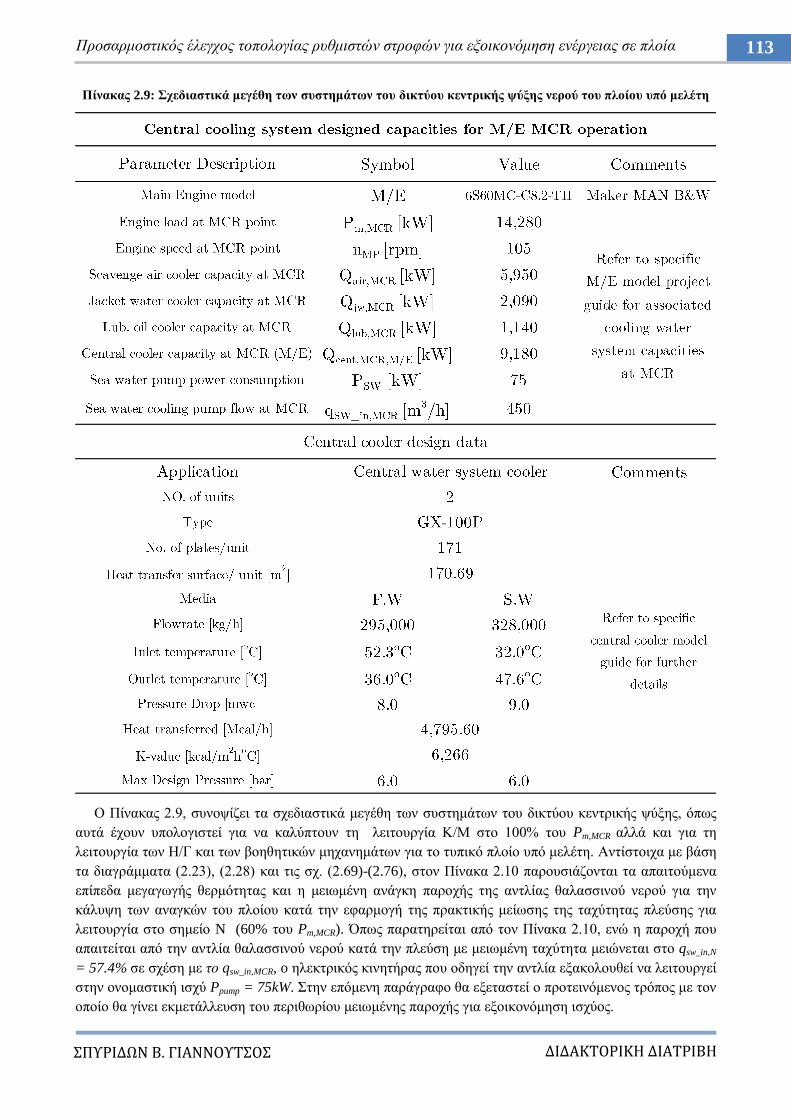
ΔΙΔΑΚΣΟΡΙΚΗ ΔΙΑΣΡΙΒΗ
ΠΤΡΙΔΩΝ Β. ΓΙΑΝΝΟΤΣΟ
113 Πξνζαξκνζηηθόο έιεγρνο ηνπνινγίαο ξπζκηζηώλ ζηξνθώλ γηα εμνηθνλόκεζε ελέξγεηαο ζε πινία
Πίλαθαο 2.9: ρεδηαζηηθά κεγέζε ησλ ζπζηεκάησλ ηνπ δηθηύνπ θεληξηθήο ςύμεο λεξνύ ηνπ πινίνπ ππό κειέηε
Ο Πίλαθαο 2.9, ζπλνςίδεη ηα ζρεδηαζηηθά κεγέζε ησλ ζπζηεκάησλ ηνπ δηθηύνπ θεληξηθήο ςύμεο, όπσο
απηά έρνπλ ππνινγηζηεί γηα λα θαιύπηνπλ ηε ιεηηνπξγία Κ/Μ ζην 100% ηνπ Pm,MCR αιιά θαη γηα ηε
ιεηηνπξγία ησλ Ζ/Γ θαη ησλ βνεζεηηθώλ κεραλεκάησλ γηα ην ηππηθό πινίν ππό κειέηε. Αληίζηνηρα κε βάζε
ηα δηαγξάκκαηα (2.23), (2.28) θαη ηηο ζρ. (2.69)-(2.76), ζηνλ Πίλαθα 2.10 παξνπζηάδνληαη ηα απαηηνύκελα
επίπεδα κεγαγσγήο ζεξκόηεηαο θαη ε κεησκέλε αλάγθε παξνρήο ηεο αληιίαο ζαιαζζηλνύ λεξνύ γηα ηελ
θάιπςε ησλ αλαγθώλ ηνπ πινίνπ θαηά ηελ εθαξκνγή ηεο πξαθηηθήο κείσζεο ηεο ηαρύηεηαο πιεύζεο γηα
ιεηηνπξγία ζην ζεκείν N (60% ηνπ Pm,MCR). Όπσο παξαηεξείηαη από ηνλ Πίλαθα 2.10, ελώ ε παξνρή πνπ
απαηηείηαη από ηελ αληιία ζαιαζζηλνύ λεξνύ θαηά ηελ πιεύζε κε κεησκέλε ηαρύηεηα κεηώλεηαη ζην qsw_in,N
= 57.4% ζε ζρέζε κε ην qsw_in,MCR, o ειεθηξηθόο θηλεηήξαο πνπ νδεγεί ηελ αληιία εμαθνινπζεί λα ιεηηνπξγεί
ζηελ νλνκαζηηθή ηζρύ Ppump = 75kW. ηελ επόκελε παξάγξαθν ζα εμεηαζηεί ν πξνηεηλόκελνο ηξόπνο κε ηνλ
νπνίν ζα γίλεη εθκεηάιιεπζε ηνπ πεξηζσξίνπ κεησκέλεο παξνρήο γηα εμνηθνλόκεζε ηζρύνο.
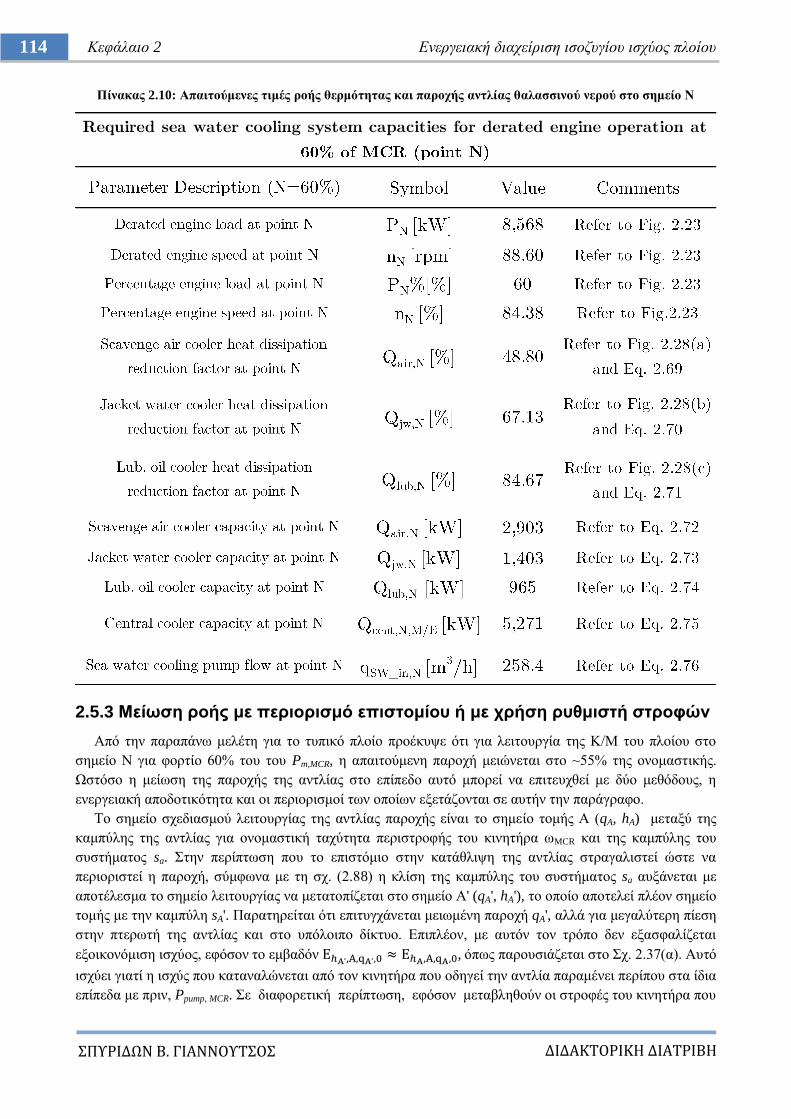
ΔΙΔΑΚΣΟΡΙΚΗ ΔΙΑΣΡΙΒΗ
ΠΤΡΙΔΩΝ Β. ΓΙΑΝΝΟΤΣΟ
114 Κεθάιαην 2 Δλεξγεηαθή δηαρείξηζε ηζνδπγίνπ ηζρύνο πινίνπ
Πίλαθαο 2.10: Απαηηνύκελεο ηηκέο ξνήο ζεξκόηεηαο θαη παξνρήο αληιίαο ζαιαζζηλνύ λεξνύ ζην ζεκείν Ν
2.5.3 Μείσζε ξνήο κε πεξηνξηζκό επηζηνκίνπ ή κε ρξήζε ξπζκηζηή ζηξνθώλ
Από ηελ παξαπάλσ κειέηε γηα ην ηππηθό πινίν πξνέθπςε όηη γηα ιεηηνπξγία ηεο Κ/Μ ηνπ πινίνπ ζην
ζεκείν Ν γηα θνξηίν 60% ηνπ ηνπ Pm,MCR, ε απαηηνύκελε παξνρή κεηώλεηαη ζην ~55% ηεο νλνκαζηηθήο.
Χζηόζν ε κείσζε ηεο παξνρήο ηεο αληιίαο ζην επίπεδν απηό κπνξεί λα επηηεπρζεί κε δύν κεζόδνπο, ε
ελεξγεηαθή απνδνηηθόηεηα θαη νη πεξηνξηζκνί ησλ νπνίσλ εμεηάδνληαη ζε απηήλ ηελ παξάγξαθν.
Σν ζεκείν ζρεδηαζκνύ ιεηηνπξγίαο ηεο αληιίαο παξνρήο είλαη ην ζεκείν ηνκήο Α (qA, hA) κεηαμύ ηεο
θακπύιεο ηεο αληιίαο γηα νλνκαζηηθή ηαρύηεηα πεξηζηξνθήο ηνπ θηλεηήξα σMCR θαη ηεο θακπύιεο ηνπ
ζπζηήκαηνο sa. ηελ πεξίπησζε πνπ ην επηζηόκην ζηελ θαηάζιηςε ηεο αληιίαο ζηξαγαιηζηεί ώζηε λα
πεξηνξηζηεί ε παξνρή, ζύκθσλα κε ηε ζρ. (2.88) ε θιίζε ηεο θακπύιεο ηνπ ζπζηήκαηνο sa απμάλεηαη κε
απνηέιεζκα ην ζεκείν ιεηηνπξγίαο λα κεηαηνπίδεηαη ζην ζεκείν Α' (qA', hA'), ην νπνίν απνηειεί πιένλ ζεκείν
ηνκήο κε ηελ θακπύιε sA'. Παξαηεξείηαη όηη επηηπγράλεηαη κεησκέλε παξνρή qA', αιιά γηα κεγαιύηεξε πίεζε
ζηελ πηεξσηή ηεο αληιίαο θαη ζην ππόινηπν δίθηπν. Δπηπιένλ, κε απηόλ ηνλ ηξόπν δελ εμαζθαιίδεηαη
εμνηθνλόκηζε ηζρύνο, εθόζνλ ην εκβαδόλ , όπσο παξνπζηάδεηαη ζην ρ. 2.37(α). Απηό
ηζρύεη γηαηί ε ηζρύο πνπ θαηαλαιώλεηαη από ηνλ θηλεηήξα πνπ νδεγεί ηελ αληιία παξακέλεη πεξίπνπ ζηα ίδηα
επίπεδα κε πξηλ, Ppump, MCR. ε δηαθνξεηηθή πεξίπησζε, εθόζνλ κεηαβιεζνύλ νη ζηξνθέο ηνπ θηλεηήξα πνπ
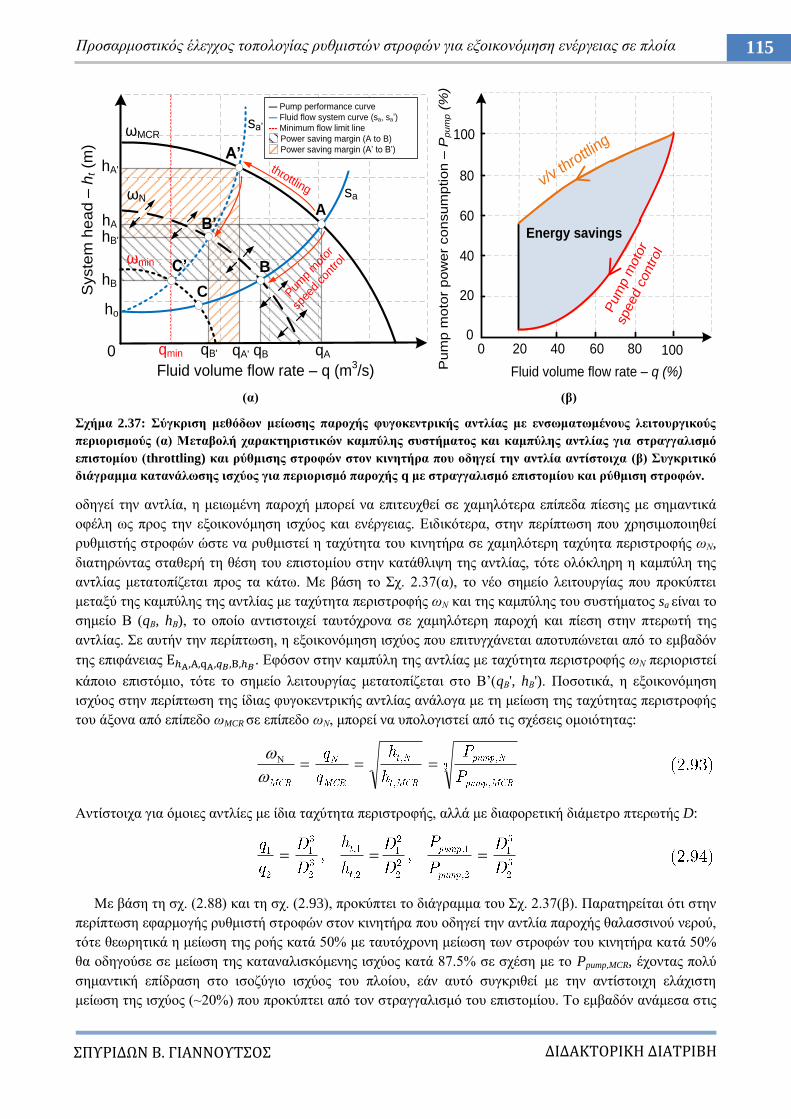
ΔΙΔΑΚΣΟΡΙΚΗ ΔΙΑΣΡΙΒΗ
ΠΤΡΙΔΩΝ Β. ΓΙΑΝΝΟΤΣΟ
115 Πξνζαξκνζηηθόο έιεγρνο ηνπνινγίαο ξπζκηζηώλ ζηξνθώλ γηα εμνηθνλόκεζε ελέξγεηαο ζε πινία
(α) (β)
ρήκα 2.37: ύγθξηζε κεζόδσλ κείσζεο παξνρήο θπγνθεληξηθήο αληιίαο κε ελζσκαησκέλνπο ιεηηνπξγηθνύο
πεξηνξηζκνύο (α) Μεηαβνιή ραξαθηεξηζηηθώλ θακπύιεο ζπζηήκαηνο θαη θακπύιεο αληιίαο γηα ζηξαγγαιηζκό
επηζηνκίνπ (throttling) θαη ξύζκηζεο ζηξνθώλ ζηνλ θηλεηήξα πνπ νδεγεί ηελ αληιία αληίζηνηρα (β) πγθξηηηθό
δηάγξακκα θαηαλάισζεο ηζρύνο γηα πεξηνξηζκό παξνρήο q κε ζηξαγγαιηζκό επηζηνκίνπ θαη ξύζκηζε ζηξνθώλ.
νδεγεί ηελ αληιία, ε κεησκέλε παξνρή κπνξεί λα επηηεπρζεί ζε ρακειόηεξα επίπεδα πίεζεο κε ζεκαληηθά
νθέιε σο πξνο ηελ εμνηθνλόκεζε ηζρύνο θαη ελέξγεηαο. Δηδηθόηεξα, ζηελ πεξίπησζε πνπ ρξεζηκνπνηεζεί
ξπζκηζηήο ζηξνθώλ ώζηε λα ξπζκηζηεί ε ηαρύηεηα ηνπ θηλεηήξα ζε ρακειόηεξε ηαρύεηα πεξηζηξνθήο σΝ,
δηαηεξώληαο ζηαζεξή ηε ζέζε ηνπ επηζηνκίνπ ζηελ θαηάζιηςε ηεο αληιίαο, ηόηε νιόθιεξε ε θακπύιε ηεο
αληιίαο κεηαηνπίδεηαη πξνο ηα θάησ. Με βάζε ην ρ. 2.37(α), ην λέν ζεκείν ιεηηνπξγίαο πνπ πξνθύπηεη
κεηαμύ ηεο θακπύιεο ηεο αληιίαο κε ηαρύηεηα πεξηζηξνθήο σΝ θαη ηεο θακπύιεο ηνπ ζπζηήκαηνο sa είλαη ην
ζεκείν Β (qΒ, hΒ), ην νπνίν αληηζηνηρεί ηαπηόρξνλα ζε ρακειόηεξε παξνρή θαη πίεζε ζηελ πηεξσηή ηεο
αληιίαο. ε απηήλ ηελ πεξίπησζε, ε εμνηθνλόκεζε ηζρύνο πνπ επηηπγράλεηαη απνηππώλεηαη από ην εκβαδόλ
ηεο επηθάλεηαο . Δθόζνλ ζηελ θακπύιε ηεο αληιίαο κε ηαρύηεηα πεξηζηξνθήο σΝ πεξηνξηζηεί
θάπνην επηζηόκην, ηόηε ην ζεκείν ιεηηνπξγίαο κεηαηνπίδεηαη ζην Β‟(qΒ', hΒ'). Πνζνηηθά, ε εμνηθνλόκεζε
ηζρύνο ζηελ πεξίπησζε ηεο ίδηαο θπγνθεληξηθήο αληιίαο αλάινγα κε ηε κείσζε ηεο ηαρύηεηαο πεξηζηξνθήο
ηνπ άμνλα από επίπεδν σMCR ζε επίπεδν σΝ, κπνξεί λα ππνινγηζηεί από ηηο ζρέζεηο νκνηόηεηαο:
Αληίζηνηρα γηα όκνηεο αληιίεο κε ίδηα ηαρύηεηα πεξηζηξνθήο, αιιά κε δηαθνξεηηθή δηάκεηξν πηεξσηήο D:
Με βάζε ηε ζρ. (2.88) θαη ηε ζρ. (2.93), πξνθύπηεη ην δηάγξακκα ηνπ ρ. 2.37(β). Παξαηεξείηαη όηη ζηελ
πεξίπησζε εθαξκνγήο ξπζκηζηή ζηξνθώλ ζηνλ θηλεηήξα πνπ νδεγεί ηελ αληιία παξνρήο ζαιαζζηλνύ λεξνύ,
ηόηε ζεσξεηηθά ε κείσζε ηεο ξνήο θαηά 50% κε ηαπηόρξνλε κείσζε ησλ ζηξνθώλ ηνπ θηλεηήξα θαηά 50%
ζα νδεγνύζε ζε κείσζε ηεο θαηαλαιηζθόκελεο ηζρύνο θαηά 87.5% ζε ζρέζε κε ην Ppump,MCR, έρνληαο πνιύ
ζεκαληηθή επίδξαζε ζην ηζνδύγην ηζρύνο ηνπ πινίνπ, εάλ απηό ζπγθξηζεί κε ηελ αληίζηνηρε ειάρηζηε
κείσζε ηεο ηζρύνο (~20%) πνπ πξνθύπηεη από ηνλ ζηξαγγαιηζκό ηνπ επηζηνκίνπ. Σν εκβαδόλ αλάκεζα ζηηο
Syste
m h
ea
d –
ht (m
)
— Pump performance curve
— Fluid flow system curve (sa, sa’)
--- Minimum flow limit line
Power saving margin (A to B)
Power saving margin (A’ to B’)
qA
hA
qBqmin
A
A’
B
B’
qA'
hB
hA'
Fluid volume flow rate – q (m3/s)
C
C’
ωMCR
ωN
ωmin
qB'
ho
sa
sa’
hB'
Pum
p m
otor
spee
d co
ntro
l
throttling
0
Pu
mp
mo
tor
po
we
r co
nsu
mp
tio
n –
Pp
um
p (
%)
0
20
40
60
80
100
0 20 40 60 80
Fluid volume flow rate – q (%)
100
Energy savings
v/v throttli
ng
Pum
p m
oto
r
speed c
ontrol
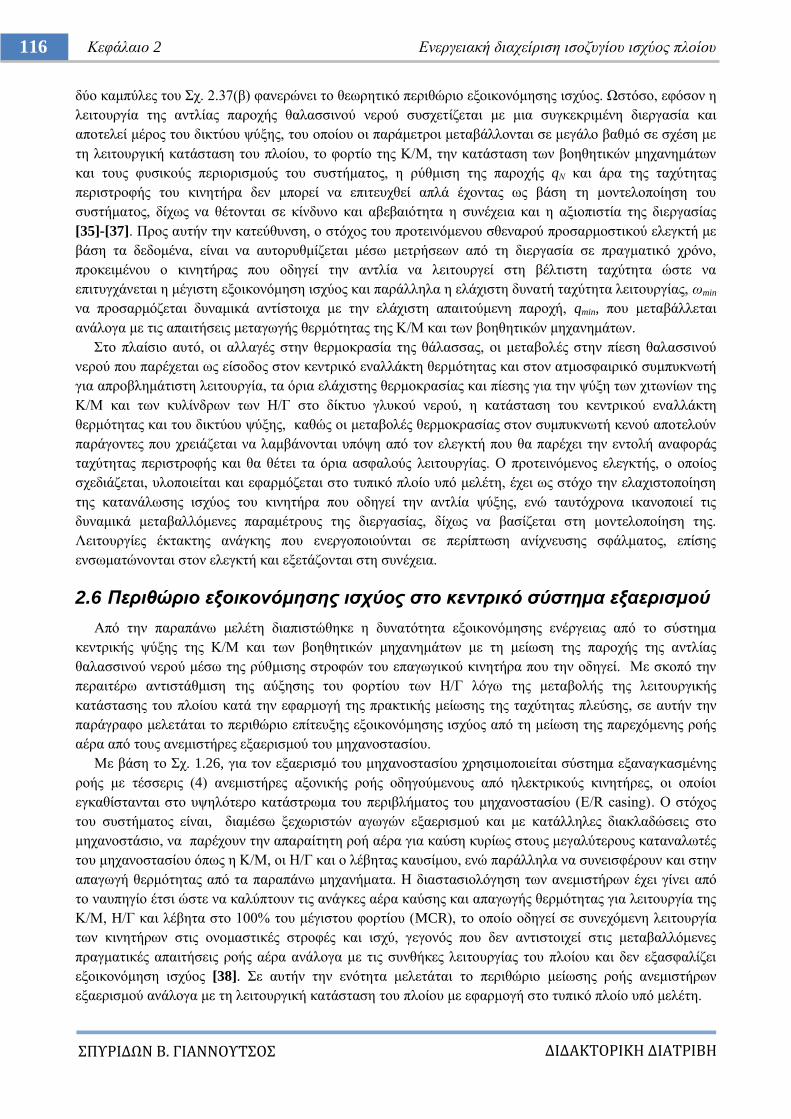
ΔΙΔΑΚΣΟΡΙΚΗ ΔΙΑΣΡΙΒΗ
ΠΤΡΙΔΩΝ Β. ΓΙΑΝΝΟΤΣΟ
116 Κεθάιαην 2 Δλεξγεηαθή δηαρείξηζε ηζνδπγίνπ ηζρύνο πινίνπ
δύν θακπύιεο ηνπ ρ. 2.37(β) θαλεξώλεη ην ζεσξεηηθό πεξηζώξην εμνηθνλόκεζεο ηζρύνο. Χζηόζν, εθόζνλ ε
ιεηηνπξγία ηεο αληιίαο παξνρήο ζαιαζζηλνύ λεξνύ ζπζρεηίδεηαη κε κηα ζπγθεθξηκέλε δηεξγαζία θαη
απνηειεί κέξνο ηνπ δηθηύνπ ςύμεο, ηνπ νπνίνπ νη παξάκεηξνη κεηαβάιινληαη ζε κεγάιν βαζκό ζε ζρέζε κε
ηε ιεηηνπξγηθή θαηάζηαζε ηνπ πινίνπ, ην θνξηίν ηεο Κ/Μ, ηελ θαηάζηαζε ησλ βνεζεηηθώλ κεραλεκάησλ
θαη ηνπο θπζηθνύο πεξηνξηζκνύο ηνπ ζπζηήκαηνο, ε ξύζκηζε ηεο παξνρήο qΝ θαη άξα ηεο ηαρύηεηαο
πεξηζηξνθήο ηνπ θηλεηήξα δελ κπνξεί λα επηηεπρζεί απιά έρνληαο σο βάζε ηε κνληεινπνίεζε ηνπ
ζπζηήκαηνο, δίρσο λα ζέηνληαη ζε θίλδπλν θαη αβεβαηόηεηα ε ζπλέρεηα θαη ε αμηνπηζηία ηεο δηεξγαζίαο
[35]-[37]. Πξνο απηήλ ηελ θαηεύζπλζε, ν ζηόρνο ηνπ πξνηεηλόκελνπ ζζελαξνύ πξνζαξκνζηηθνύ ειεγθηή κε
βάζε ηα δεδνκέλα, είλαη λα απηνξπζκίδεηαη κέζσ κεηξήζεσλ από ηε δηεξγαζία ζε πξαγκαηηθό ρξόλν,
πξνθεηκέλνπ ν θηλεηήξαο πνπ νδεγεί ηελ αληιία λα ιεηηνπξγεί ζηε βέιηηζηε ηαρύηεηα ώζηε λα
επηηπγράλεηαη ε κέγηζηε εμνηθνλόκεζε ηζρύνο θαη παξάιιεια ε ειάρηζηε δπλαηή ηαρύηεηα ιεηηνπξγίαο, σmin
λα πξνζαξκόδεηαη δπλακηθά αληίζηνηρα κε ηελ ειάρηζηε απαηηνύκελε παξνρή, qmin, πνπ κεηαβάιιεηαη
αλάινγα κε ηηο απαηηήζεηο κεηαγσγήο ζεξκόηεηαο ηεο Κ/Μ θαη ησλ βνεζεηηθώλ κεραλεκάησλ.
ην πιαίζην απηό, νη αιιαγέο ζηελ ζεξκνθξαζία ηεο ζάιαζζαο, νη κεηαβνιέο ζηελ πίεζε ζαιαζζηλνύ
λεξνύ πνπ παξέρεηαη σο είζνδνο ζηνλ θεληξηθό ελαιιάθηε ζεξκόηεηαο θαη ζηνλ αηκνζθαηξηθό ζπκππθλσηή
γηα απξνβιεκάηηζηε ιεηηνπξγία, ηα όξηα ειάρηζηεο ζεξκνθξαζίαο θαη πίεζεο γηα ηελ ςύμε ησλ ρηησλίσλ ηεο
Κ/Μ θαη ησλ θπιίλδξσλ ησλ Ζ/Γ ζην δίθηπν γιπθνύ λεξνύ, ε θαηάζηαζε ηνπ θεληξηθνύ ελαιιάθηε
ζεξκόηεηαο θαη ηνπ δηθηύνπ ςύμεο, θαζώο νη κεηαβνιέο ζεξκνθξαζίαο ζηνλ ζπκππθλσηή θελνύ απνηεινύλ
παξάγνληεο πνπ ρξεηάδεηαη λα ιακβάλνληαη ππόςε από ηνλ ειεγθηή πνπ ζα παξέρεη ηελ εληνιή αλαθνξάο
ηαρύηεηαο πεξηζηξνθήο θαη ζα ζέηεη ηα όξηα αζθαινύο ιεηηνπξγίαο. Ο πξνηεηλόκελνο ειεγθηήο, ν νπνίνο
ζρεδηάδεηαη, πινπνηείηαη θαη εθαξκόδεηαη ζην ηππηθό πινίν ππό κειέηε, έρεη σο ζηόρν ηελ ειαρηζηνπνίεζε
ηεο θαηαλάισζεο ηζρύνο ηνπ θηλεηήξα πνπ νδεγεί ηελ αληιία ςύμεο, ελώ ηαπηόρξνλα ηθαλνπνηεί ηηο
δπλακηθά κεηαβαιιόκελεο παξακέηξνπο ηεο δηεξγαζίαο, δίρσο λα βαζίδεηαη ζηε κνληεινπνίεζε ηεο.
Λεηηνπξγίεο έθηαθηεο αλάγθεο πνπ ελεξγνπνηνύληαη ζε πεξίπησζε αλίρλεπζεο ζθάικαηνο, επίζεο
ελζσκαηώλνληαη ζηνλ ειεγθηή θαη εμεηάδνληαη ζηε ζπλέρεηα.
2.6 Πεπιθώπιο εξοικονόμηζηρ ιζσύορ ζηο κενηπικό ζύζηημα εξαεπιζμού
Από ηελ παξαπάλσ κειέηε δηαπηζηώζεθε ε δπλαηόηεηα εμνηθνλόκεζεο ελέξγεηαο από ην ζύζηεκα
θεληξηθήο ςύμεο ηεο Κ/Μ θαη ησλ βνεζεηηθώλ κεραλεκάησλ κε ηε κείσζε ηεο παξνρήο ηεο αληιίαο
ζαιαζζηλνύ λεξνύ κέζσ ηεο ξύζκηζεο ζηξνθώλ ηνπ επαγσγηθνύ θηλεηήξα πνπ ηελ νδεγεί. Με ζθνπό ηελ
πεξαηηέξσ αληηζηάζκηζε ηεο αύμεζεο ηνπ θνξηίνπ ησλ Ζ/Γ ιόγσ ηεο κεηαβνιήο ηεο ιεηηνπξγηθήο
θαηάζηαζεο ηνπ πινίνπ θαηά ηελ εθαξκνγή ηεο πξαθηηθήο κείσζεο ηεο ηαρύηεηαο πιεύζεο, ζε απηήλ ηελ
παξάγξαθν κειεηάηαη ην πεξηζώξην επίηεπμεο εμνηθνλόκεζεο ηζρύνο από ηε κείσζε ηεο παξερόκελεο ξνήο
αέξα από ηνπο αλεκηζηήξεο εμαεξηζκνύ ηνπ κεραλνζηαζίνπ.
Με βάζε ην ρ. 1.26, γηα ηνλ εμαεξηζκό ηνπ κεραλνζηαζίνπ ρξεζηκνπνηείηαη ζύζηεκα εμαλαγθαζκέλεο
ξνήο κε ηέζζεξηο (4) αλεκηζηήξεο αμνληθήο ξνήο νδεγνύκελνπο από ειεθηξηθνύο θηλεηήξεο, νη νπνίνη
εγθαζίζηαληαη ζην πςειόηεξν θαηάζηξσκα ηνπ πεξηβιήκαηνο ηνπ κεραλνζηαζίνπ (E/R casing). Ο ζηόρνο
ηνπ ζπζηήκαηνο είλαη, δηακέζσ μερσξηζηώλ αγσγώλ εμαεξηζκνύ θαη κε θαηάιιειεο δηαθιαδώζεηο ζην
κεραλνζηάζην, λα παξέρνπλ ηελ απαξαίηεηε ξνή αέξα γηα θαύζε θπξίσο ζηνπο κεγαιύηεξνπο θαηαλαισηέο
ηνπ κεραλνζηαζίνπ όπσο ε Κ/Μ, νη Ζ/Γ θαη ν ιέβεηαο θαπζίκνπ, ελώ παξάιιεια λα ζπλεηζθέξνπλ θαη ζηελ
απαγσγή ζεξκόηεηαο από ηα παξαπάλσ κεραλήκαηα. Ζ δηαζηαζηνιόγεζε ησλ αλεκηζηήξσλ έρεη γίλεη από
ην λαππεγίν έηζη ώζηε λα θαιύπηνπλ ηηο αλάγθεο αέξα θαύζεο θαη απαγσγήο ζεξκόηεηαο γηα ιεηηνπξγία ηεο
Κ/Μ, H/Γ θαη ιέβεηα ζην 100% ηνπ κέγηζηνπ θνξηίνπ (MCR), ην νπνίν νδεγεί ζε ζπλερόκελε ιεηηνπξγία
ησλ θηλεηήξσλ ζηηο νλνκαζηηθέο ζηξνθέο θαη ηζρύ, γεγνλόο πνπ δελ αληηζηνηρεί ζηηο κεηαβαιιόκελεο
πξαγκαηηθέο απαηηήζεηο ξνήο αέξα αλάινγα κε ηηο ζπλζήθεο ιεηηνπξγίαο ηνπ πινίνπ θαη δελ εμαζθαιίδεη
εμνηθνλόκεζε ηζρύνο [38]. ε απηήλ ηελ ελόηεηα κειεηάηαη ην πεξηζώξην κείσζεο ξνήο αλεκηζηήξσλ
εμαεξηζκνύ αλάινγα κε ηε ιεηηνπξγηθή θαηάζηαζε ηνπ πινίνπ κε εθαξκνγή ζην ηππηθό πινίν ππό κειέηε.
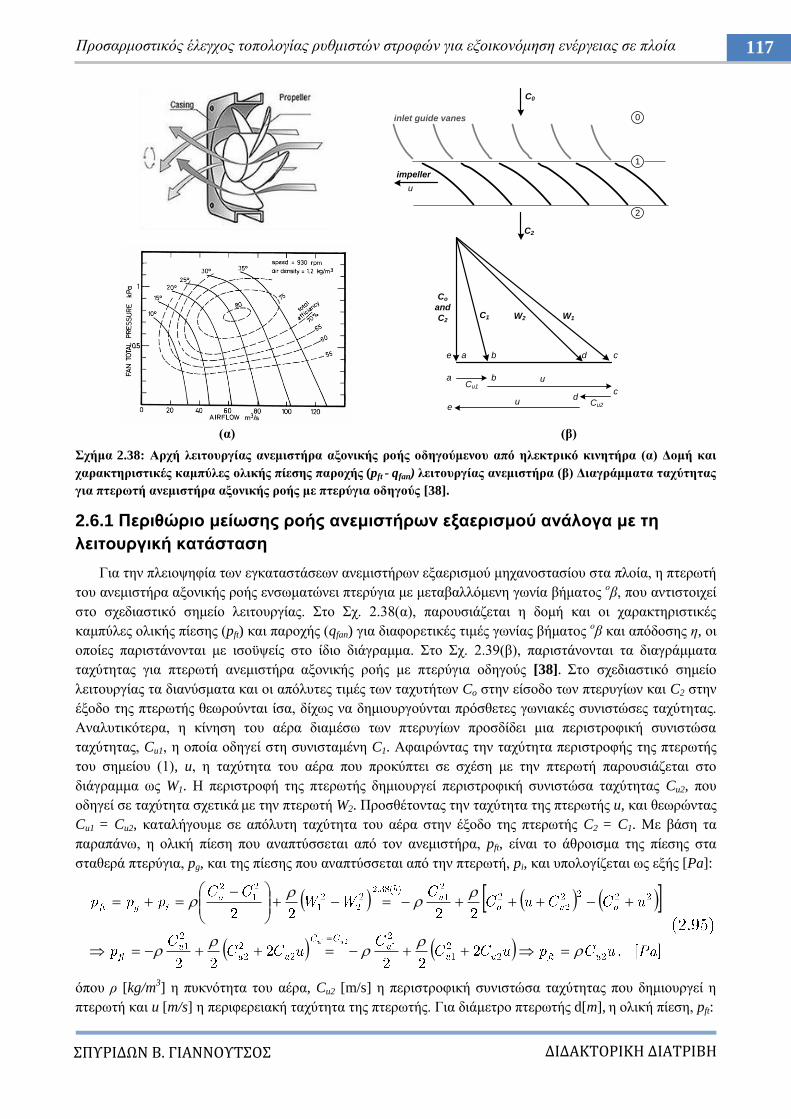
ΔΙΔΑΚΣΟΡΙΚΗ ΔΙΑΣΡΙΒΗ
ΠΤΡΙΔΩΝ Β. ΓΙΑΝΝΟΤΣΟ
117 Πξνζαξκνζηηθόο έιεγρνο ηνπνινγίαο ξπζκηζηώλ ζηξνθώλ γηα εμνηθνλόκεζε ελέξγεηαο ζε πινία
(α) (β)
ρήκα 2.38: Αξρή ιεηηνπξγίαο αλεκηζηήξα αμνληθήο ξνήο νδεγνύκελνπ από ειεθηξηθό θηλεηήξα (α) Γνκή θαη
ραξαθηεξηζηηθέο θακπύιεο νιηθήο πίεζεο παξνρήο (pft - qfan) ιεηηνπξγίαο αλεκηζηήξα (β) Γηαγξάκκαηα ηαρύηεηαο
γηα πηεξσηή αλεκηζηήξα αμνληθήο ξνήο κε πηεξύγηα νδεγνύο [38].
2.6.1 Πεξηζώξην κείσζεο ξνήο αλεκηζηήξσλ εμαεξηζκνύ αλάινγα κε ηε
ιεηηνπξγηθή θαηάζηαζε
Γηα ηελ πιεηνςεθία ησλ εγθαηαζηάζεσλ αλεκηζηήξσλ εμαεξηζκνύ κεραλνζηαζίνπ ζηα πινία, ε πηεξσηή
ηνπ αλεκηζηήξα αμνληθήο ξνήο ελζσκαηώλεη πηεξύγηα κε κεηαβαιιόκελε γσλία βήκαηνο νβ, πνπ αληηζηνηρεί
ζην ζρεδηαζηηθό ζεκείν ιεηηνπξγίαο. ην ρ. 2.38(α), παξνπζηάδεηαη ε δνκή θαη νη ραξαθηεξηζηηθέο
θακπύιεο νιηθήο πίεζεο (pft) θαη παξνρήο (qfan) γηα δηαθνξεηηθέο ηηκέο γσλίαο βήκαηνο νβ θαη απόδνζεο ε, νη
νπνίεο παξηζηάλνληαη κε ηζνϋςείο ζην ίδην δηάγξακκα. ην ρ. 2.39(β), παξηζηάλνληαη ηα δηαγξάκκαηα
ηαρύηεηαο γηα πηεξσηή αλεκηζηήξα αμνληθήο ξνήο κε πηεξύγηα νδεγνύο [38]. ην ζρεδηαζηηθό ζεκείν
ιεηηνπξγίαο ηα δηαλύζκαηα θαη νη απόιπηεο ηηκέο ησλ ηαρπηήησλ Co ζηελ είζνδν ησλ πηεξπγίσλ θαη C2 ζηελ
έμνδν ηεο πηεξσηήο ζεσξνύληαη ίζα, δίρσο λα δεκηνπξγνύληαη πξόζζεηεο γσληαθέο ζπληζηώζεο ηαρύηεηαο.
Αλαιπηηθόηεξα, ε θίλεζε ηνπ αέξα δηακέζσ ησλ πηεξπγίσλ πξνζδίδεη κηα πεξηζηξνθηθή ζπληζηώζα
ηαρύηεηαο, Cu1, ε νπνία νδεγεί ζηε ζπληζηακέλε C1. Αθαηξώληαο ηελ ηαρύηεηα πεξηζηξνθήο ηεο πηεξσηήο
ηνπ ζεκείνπ (1), u, ε ηαρύηεηα ηνπ αέξα πνπ πξνθύπηεη ζε ζρέζε κε ηελ πηεξσηή παξνπζηάδεηαη ζην
δηάγξακκα σο W1. Ζ πεξηζηξνθή ηεο πηεξσηήο δεκηνπξγεί πεξηζηξνθηθή ζπληζηώζα ηαρύηεηαο Cu2, πνπ
νδεγεί ζε ηαρύηεηα ζρεηηθά κε ηελ πηεξσηή W2. Πξνζζέηνληαο ηελ ηαρύηεηα ηεο πηεξσηήο u, θαη ζεσξώληαο
Cu1 = Cu2, θαηαιήγνπκε ζε απόιπηε ηαρύηεηα ηνπ αέξα ζηελ έμνδν ηεο πηεξσηήο C2 = C1. Με βάζε ηα
παξαπάλσ, ε νιηθή πίεζε πνπ αλαπηύζζεηαη από ηνλ αλεκηζηήξα, pft, είλαη ην άζξνηζκα ηεο πίεζεο ζηα
ζηαζεξά πηεξύγηα, pg, θαη ηεο πίεζεο πνπ αλαπηύζζεηαη από ηελ πηεξσηή, pi, θαη ππνινγίδεηαη σο εμήο [Pa]:
όπνπ ξ [kg/m3] ε ππθλόηεηα ηνπ αέξα, Cu2 [m/s] ε πεξηζηξνθηθή ζπληζηώζα ηαρύηεηαο πνπ δεκηνπξγεί ε
πηεξσηή θαη u [m/s] ε πεξηθεξεηαθή ηαρύηεηα ηεο πηεξσηήο. Γηα δηάκεηξν πηεξσηήο d[m], ε νιηθή πίεζε, pft:
Co
and
C2C1 W2 W1
e a b d c
ba
cd
Cu2
u
ue
impeller
u
inlet guide vanes
C2
C0
0
1
2
Cu1
ΔΙΔΑΚΣΟΡΙΚΗ ΔΙΑΣΡΙΒΗ
ΠΤΡΙΔΩΝ Β. ΓΙΑΝΝΟΤΣΟ
118 Κεθάιαην 2 Δλεξγεηαθή δηαρείξηζε ηζνδπγίνπ ηζρύνο πινίνπ
ρήκα 2.39: Γνκηθό δηάγξακκα ηππηθήο εγθαηάζηαζεο αλεκηζηήξα εμαεξηζκνύ πινίνπ κε θύξηνπο θαηαλαισηέο
Παξόκνηα, ε παξνρή qfan [m3/s] αέξα από ηνλ αλεκηζηήξα εμαεξηζκνύ ζηελ έμνδν ηεο πηεξσηήο είλαη:
Με βάζε ηηο ζρ. (2.91) - (2.92), ε ηζρύο πνπ αλαπηύζζεη ν αλεκηζηήξαο αμνληθήο ξνήο, Pfan [W], γηα νιηθή
πίεζε pft, παξνρή qfan θαη ζπληειεζηή νιηθήο απόδνζεο ε, εθθξάδεηαη σο εμήο:
Οη κεησκέλεο απαηηήζεηο παξνρήο αέξα ζηνλ κεραλνζηάζην κε ζθνπό ηελ θαύζε θαη ηελ απαγσγή
ζεξκόηεηαο θαηά ηελ εθαξκνγή ηεο κεζόδνπ πξαθηηθήο κείσζεο ηεο ηαρύηεηαο πιεύζεο, κπνξνύλ λα
ππνινγηζηνύλ κέζσ ηεο κνληεινπνίεζεο ηνπ ζπζηήκαηνο εμαεξηζκνύ ηνπ κεραλνζηαζίνπ, ε νπνία θαζνξίδεη
ην κέγηζην δπλαηό πεξηζώξην εμνηθνλόκεζεο ηζρύνο, πνπ απνηειεί ζηόρν ηεο εθαξκνγήο ηνπ πξνηεηλόκελνπ
ζπζηήκαηνο. Ζ κειέηε ππνινγηζκνύ ηνπ πεξηζσξίνπ κείσζεο ξνήο εθαξκόδεηαη ζην πινίν ππό κειέηε,
απνηειώληαο ηε βάζε γηα ηελ εθαξκνγή ηνπ πξνηεηλόκελνπ ζπζηήκαηνο.
Σν δνκηθό δηάγξακκα ηεο ηππηθήο εγθαηάζηαζεο αλεκηζηήξα εμαεξηζκνύ πινίνπ παξνπζηάδεηαη ζην ρ.
2.39. Σέζζεξηο αλεκηζηήξεο αμνληθήο ξνήο εγθαζίζηαληαη ζην πςειόηεξν θαηάζηξσκα ηνπ πεξηβιήκαηνο ηεο
Κ/Μ (E/R casing) θαη κέζσ μερσξηζηώλ αγσγώλ παξέρνπλ αέξα κε ζθνπό ηελ θαύζε ζηνπο θύξηνπο
θαηαλαισηέο ηνπ κεραλνζηαζίνπ, πνπ πεξηιακβάλνπλ ηελ Κ/Μ, ηηο Ζ/Γ θαη ην ιέβεηα θαπζίκνπ, θαη
παξάιιεια ηελ απαγσγή ζεξκόηεηαο από ηα θύξηα κεραλήκαηα. Γύν από ηνπο αλεκηζηήξεο έρνπλ ηε
δπλαηόηεηα λα εξγαζηνύλ σο αλεκηζηήξεο εμαγσγήο αέξα από ην κεραλνζηάζην, ιεηηνπξγία πνπ
ρξεζηκνπνηείηαη κόλν ηηο πνιύ δεζηέο κέξεο όηαλ ην πινίν είλαη ζηάζηκν ή όηαλ εθηεινύληαη εξγαζίεο
ζπγθόιιεζεο. Ηζρύεη επίζεο όηη νη αγσγνί εμαεξηζκνύ ηνπνζεηνύληαη δίπια ζηνπο ζηξνβηινϋπεξπιεξσηέο
ηεο Κ/Μ θαη ησλ Ζ/Γ ώζηε λα ζπλεηζθέξνπλ ζηελ ελίζρπζε ηεο πίεζεο αέξα θαηά ηηο δηαδηθαζίεο θαύζεο.
ύκθσλα κε ην ISO8861:1998 [39], ε ζπλνιηθή παξνρή αέξα από ηνπο αλεκηζηήξεο θαηά ην ζρεδηαζκό,
qtot,MCR [m3/s], εμαξηάηαη από ηελ απαηηνύκελε ξνή αέξα κε ζθνπό ηελ θαύζε, qc [m
3/s], θαη ηελ απαηηνύκελε
ξνή αέξα κε ζθνπό ηελ απαγσγή ζεξκόηεηαο, qh[m3/s], ε νπνία νξίδεηαη σο εμήο:
Ζ απαηηνύκελε ξνή αέξα γηα θαύζε, qc, ππνινγίδεηαη ζύκθσλα κε ηελ παξαθάησ ζρέζε γηα ιεηηνπξγία ηεο
Κ/Μ θαη ησλ Ζ/Γ ζε ζπγθεθξηκέλν ζεκείν Ν πνπ ζρεηίδεηαη κε ην MCR σο εμήο:
όπνπ: qM/E,N : παξνρή αέξα κε ζθνπό ηελ θαύζε γηα ηελ Κ/Μ ζε [m3/s], γηα Ν = 100% ηνπ MCR
qD/G,N : παξνρή αέξα κε ζθνπό ηελ θαύζε γηα ηηο Ζ/Γ ζε [m3/s], γηα Ν = 76% ηνπ MCR
qb : παξνρή αέξα κε ζθνπό ηελ θαύζε από ην ιέβεηα θαπζίκνπ ζε [m3/s] γηα κέγηζην θνξηίν
Main
Engine
Diesel
Generator
Oil Fired
Boiler
AIR
DUCT MOTORFAN
Outside
Area
Engine
Room
(E/R)
Area
E/R VENTILATION SYSTEM
(NO.1 of 4 vent. ducts)
bq
ΔΙΔΑΚΣΟΡΙΚΗ ΔΙΑΣΡΙΒΗ
ΠΤΡΙΔΩΝ Β. ΓΙΑΝΝΟΤΣΟ
119 Πξνζαξκνζηηθόο έιεγρνο ηνπνινγίαο ξπζκηζηώλ ζηξνθώλ γηα εμνηθνλόκεζε ελέξγεηαο ζε πινία
ελώ ε απαηηνύκελε ξνή αέξα γηα απαγσγή ζεξκόηεηαο, qh[m3/s] βαζίδεηαη ζηε δηαηήξεζε κέγηζηεο αύμεζεο
ηεο ζεξκνθξαζίαο ηνπ αέξα ζην κεραλνζηάζην θαηά ΓΣ = 12.5νC, θαη ππνινγίδεηαη σο εμήο:
όπνπ ε ζπλνιηθή ζεξκόηεηα πνπ απάγεηαη πεξηιακβάλεη ηηο εθπνκπέο ζεξκόηεηαο από ηελ Κ/Μ, ΦΜ/Δ,Ν [kW],
ηηο Ζ/M Diesel, ΦD/G,Ν [kW], από ην ιέβεηα θαπζίκνπ, Φb [kW], από ην δίθηπν αηκνύ, Φp [kW], από ηηο Ζ/Γ,
ΦΖ/Γ [kW], από ηνλ ειεθηξνινγηθό εμνπιηζκό, Φel[kW], θαη από ηνπο ινηπνύο θαηαισηέο, Φoth[kW], σο εμήο:
Οη απαηηνύκελεο ξνέο αέξα κε ζθνπό ηελ θαύζε γηα ηελ Κ/Μ, qM/E,N, ηηο Ζ/Γ, qD/G,N, θαη ην ιέβεηα
θαπζίκνπ, qb, σο ζπλάξηεζε ηεο ιεηηνπξγηθήο ηνπο θαηάζηαζεο κπνξνύλ λα ππνινγηζηνύλ σο εμήο γηα
νλνκαζηηθέο ζπλζήθεο ιεηηνπξγίαο (ΝΜ/Δ = 100% θαη ΝD/G = 76% αληίζηνηρα):
όπνπ: PM/E,N : θνξηίν ηεο Κ/Μ ζην ζεκείν ιεηηνπξγίαο Ν ζε [kW]
PD/G,N : θνξηίν ησλ Ζ/Γ ζην ζεκείν ιεηηνπξγίαο Ν ζε [kW]
mad : απαηηνύκελε πνζόηεηα αέξα κε ζθνπό ηελ θαύζε γηα κεραλέο ληίδει
(0.0023 γηα δίρξνλεο κεραλέο)
(0.0020 γηα ηεηξάρξνλεο κεραλέο)
ξ : ππθλόηεηα αέξα (1.13kg/m3, γηα ζπλζήθεο 35
oC θαη 101.3kPa)
QB : ζπλνιηθή παξνρή αηκνύ γηα ιέβεηα θαπζίκνπ ζε [kg/h]
mfs : πνζόηεηα θαηαλάισζεο θαπζίκνπ ζε kg θαπζίκνπ γηα θάζε kg αηκνύ
(ηππηθά 0.077kg/kg)
maf : πνζόηεηα θαηαλάισζε αέξα ζε kg αέξα γηα θάζε kg θαπζίκνπ
(ηππηθά 0.077kg/kg)
fs : ζπληειεζηήο θνξηίνπ ζε ζπλζήθε θαζαξηζκνύ δεμακελώλ
(ηππηθά 0.911, κε βάζε ηελ θαηαλάισζε αηκνύ)
Δηδηθόηεξα, ε εθπνκπή ζεξκόηεηαο από ηελ Κ/Μ γηα ιεηηνπξγία ζην ζεκείν Ν, ΦΜ/Δ,Ν [kW], νξίδεηαη σο εμήο:
Όκνηα, ε εθπνκπή ζεξκόηεηαο από ηηο Ζ/Γ Diesel γηα ιεηηνπξγία ζην ζεκείν Ν, ΦD/G,Ν [kW], νξίδεηαη:
Αληίζηνηρα, ε εθπνκπή ζεξκόηεηαο γηα ην ιέβεηα θαπζίκνπ, Φb [kW], εθθξάδεηαη σο εμήο:
ρεηηθά κε ηελ εθπνκπή ζεξκόηεηαο από ην δίθηπν αηκνύ ηζρύεη:
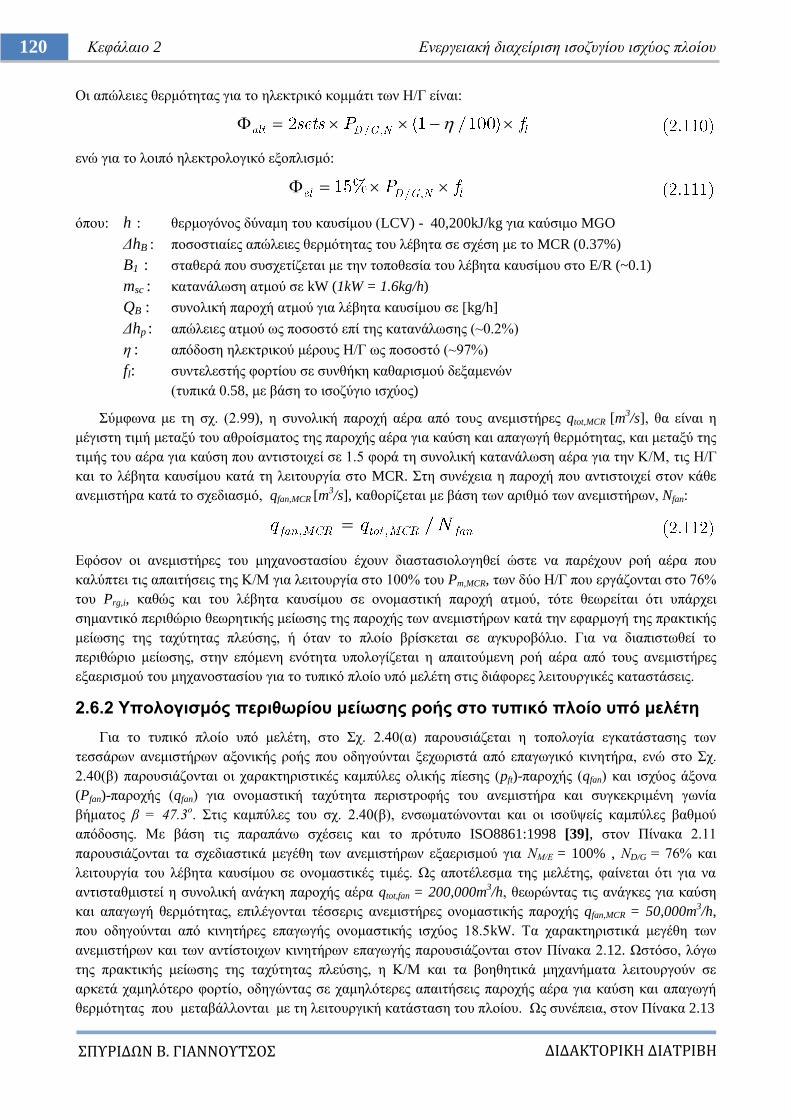
ΔΙΔΑΚΣΟΡΙΚΗ ΔΙΑΣΡΙΒΗ
ΠΤΡΙΔΩΝ Β. ΓΙΑΝΝΟΤΣΟ
120 Κεθάιαην 2 Δλεξγεηαθή δηαρείξηζε ηζνδπγίνπ ηζρύνο πινίνπ
Οη απώιεηεο ζεξκόηεηαο γηα ην ειεθηξηθό θνκκάηη ησλ Ζ/Γ είλαη:
ελώ γηα ην ινηπό ειεθηξνινγηθό εμνπιηζκό:
όπνπ: h : ζεξκνγόλνο δύλακε ηνπ θαπζίκνπ (LCV) - 40,200kJ/kg γηα θαύζηκν MGO
ΓhB : πνζνζηηαίεο απώιεηεο ζεξκόηεηαο ηνπ ιέβεηα ζε ζρέζε κε ην MCR (0.37%)
B1 : ζηαζεξά πνπ ζπζρεηίδεηαη κε ηελ ηνπνζεζία ηνπ ιέβεηα θαπζίκνπ ζην E/R (~0.1)
msc : θαηαλάισζε αηκνύ ζε kW (1kW = 1.6kg/h)
QB : ζπλνιηθή παξνρή αηκνύ γηα ιέβεηα θαπζίκνπ ζε [kg/h]
Γhp : απώιεηεο αηκνύ σο πνζνζηό επί ηεο θαηαλάισζεο (~0.2%)
ε : απόδνζε ειεθηξηθνύ κέξνπο Ζ/Γ σο πνζνζηό (~97%)
fl: ζπληειεζηήο θνξηίνπ ζε ζπλζήθε θαζαξηζκνύ δεμακελώλ
(ηππηθά 0.58, κε βάζε ην ηζνδύγην ηζρύνο)
ύκθσλα κε ηε ζρ. (2.99), ε ζπλνιηθή παξνρή αέξα από ηνπο αλεκηζηήξεο qtot,MCR [m3/s], ζα είλαη ε
κέγηζηε ηηκή κεηαμύ ηνπ αζξνίζκαηνο ηεο παξνρήο αέξα γηα θαύζε θαη απαγσγή ζεξκόηεηαο, θαη κεηαμύ ηεο
ηηκήο ηνπ αέξα γηα θαύζε πνπ αληηζηνηρεί ζε 1.5 θνξά ηε ζπλνιηθή θαηαλάισζε αέξα γηα ηελ Κ/Μ, ηηο Ζ/Γ
θαη ην ιέβεηα θαπζίκνπ θαηά ηε ιεηηνπξγία ζην MCR. ηε ζπλέρεηα ε παξνρή πνπ αληηζηνηρεί ζηνλ θάζε
αλεκηζηήξα θαηά ην ζρεδηαζκό, qfan,MCR [m3/s], θαζνξίδεηαη κε βάζε ησλ αξηζκό ησλ αλεκηζηήξσλ, Nfan:
Δθόζνλ νη αλεκηζηήξεο ηνπ κεραλνζηαζίνπ έρνπλ δηαζηαζηνινγεζεί ώζηε λα παξέρνπλ ξνή αέξα πνπ
θαιύπηεη ηηο απαηηήζεηο ηεο Κ/Μ γηα ιεηηνπξγία ζην 100% ηνπ Pm,MCR, ησλ δύν Ζ/Γ πνπ εξγάδνληαη ζην 76%
ηνπ Prg,i, θαζώο θαη ηνπ ιέβεηα θαπζίκνπ ζε νλνκαζηηθή παξνρή αηκνύ, ηόηε ζεσξείηαη όηη ππάξρεη
ζεκαληηθό πεξηζώξην ζεσξεηηθήο κείσζεο ηεο παξνρήο ησλ αλεκηζηήξσλ θαηά ηελ εθαξκνγή ηεο πξαθηηθήο
κείσζεο ηεο ηαρύηεηαο πιεύζεο, ή όηαλ ην πινίν βξίζθεηαη ζε αγθπξνβόιην. Γηα λα δηαπηζησζεί ην
πεξηζώξην κείσζεο, ζηελ επόκελε ελόηεηα ππνινγίδεηαη ε απαηηνύκελε ξνή αέξα από ηνπο αλεκηζηήξεο
εμαεξηζκνύ ηνπ κεραλνζηαζίνπ γηα ην ηππηθό πινίν ππό κειέηε ζηηο δηάθνξεο ιεηηνπξγηθέο θαηαζηάζεηο.
2.6.2 Τπνινγηζκόο πεξηζσξίνπ κείσζεο ξνήο ζην ηππηθό πινίν ππό κειέηε
Γηα ην ηππηθό πινίν ππό κειέηε, ζην ρ. 2.40(α) παξνπζηάδεηαη ε ηνπνινγία εγθαηάζηαζεο ησλ
ηεζζάξσλ αλεκηζηήξσλ αμνληθήο ξνήο πνπ νδεγνύληαη μερσξηζηά από επαγσγηθό θηλεηήξα, ελώ ζην ρ.
2.40(β) παξνπζηάδνληαη νη ραξαθηεξηζηηθέο θακπύιεο νιηθήο πίεζεο (pft)-παξνρήο (qfan) θαη ηζρύνο άμνλα
(Pfan)-παξνρήο (qfan) γηα νλνκαζηηθή ηαρύηεηα πεξηζηξνθήο ηνπ αλεκηζηήξα θαη ζπγθεθξηκέλε γσλία
βήκαηνο β = 47.3ν. ηηο θακπύιεο ηνπ ζρ. 2.40(β), ελζσκαηώλνληαη θαη νη ηζνϋςείο θακπύιεο βαζκνύ
απόδνζεο. Με βάζε ηηο παξαπάλσ ζρέζεηο θαη ην πξόηππν ISO8861:1998 [39], ζηνλ Πίλαθα 2.11
παξνπζηάδνληαη ηα ζρεδηαζηηθά κεγέζε ησλ αλεκηζηήξσλ εμαεξηζκνύ γηα ΝΜ/Δ = 100% , ΝD/G = 76% θαη
ιεηηνπξγία ηνπ ιέβεηα θαπζίκνπ ζε νλνκαζηηθέο ηηκέο. Χο απνηέιεζκα ηεο κειέηεο, θαίλεηαη όηη γηα λα
αληηζηαζκηζηεί ε ζπλνιηθή αλάγθε παξνρήο αέξα qtot,fan = 200,000m3/h, ζεσξώληαο ηηο αλάγθεο γηα θαύζε
θαη απαγσγή ζεξκόηεηαο, επηιέγνληαη ηέζζεξηο αλεκηζηήξεο νλνκαζηηθήο παξνρήο qfan,MCR = 50,000m3/h,
πνπ νδεγνύληαη από θηλεηήξεο επαγσγήο νλνκαζηηθήο ηζρύνο 18.5kW. Σα ραξαθηεξηζηηθά κεγέζε ησλ
αλεκηζηήξσλ θαη ησλ αληίζηνηρσλ θηλεηήξσλ επαγσγήο παξνπζηάδνληαη ζηνλ Πίλαθα 2.12. Χζηόζν, ιόγσ
ηεο πξαθηηθήο κείσζεο ηεο ηαρύηεηαο πιεύζεο, ε Κ/Μ θαη ηα βνεζεηηθά κεραλήκαηα ιεηηνπξγνύλ ζε
αξθεηά ρακειόηεξν θνξηίν, νδεγώληαο ζε ρακειόηεξεο απαηηήζεηο παξνρήο αέξα γηα θαύζε θαη απαγσγή
ζεξκόηεηαο πνπ κεηαβάιινληαη κε ηε ιεηηνπξγηθή θαηάζηαζε ηνπ πινίνπ. Χο ζπλέπεηα, ζηνλ Πίλαθα 2.13
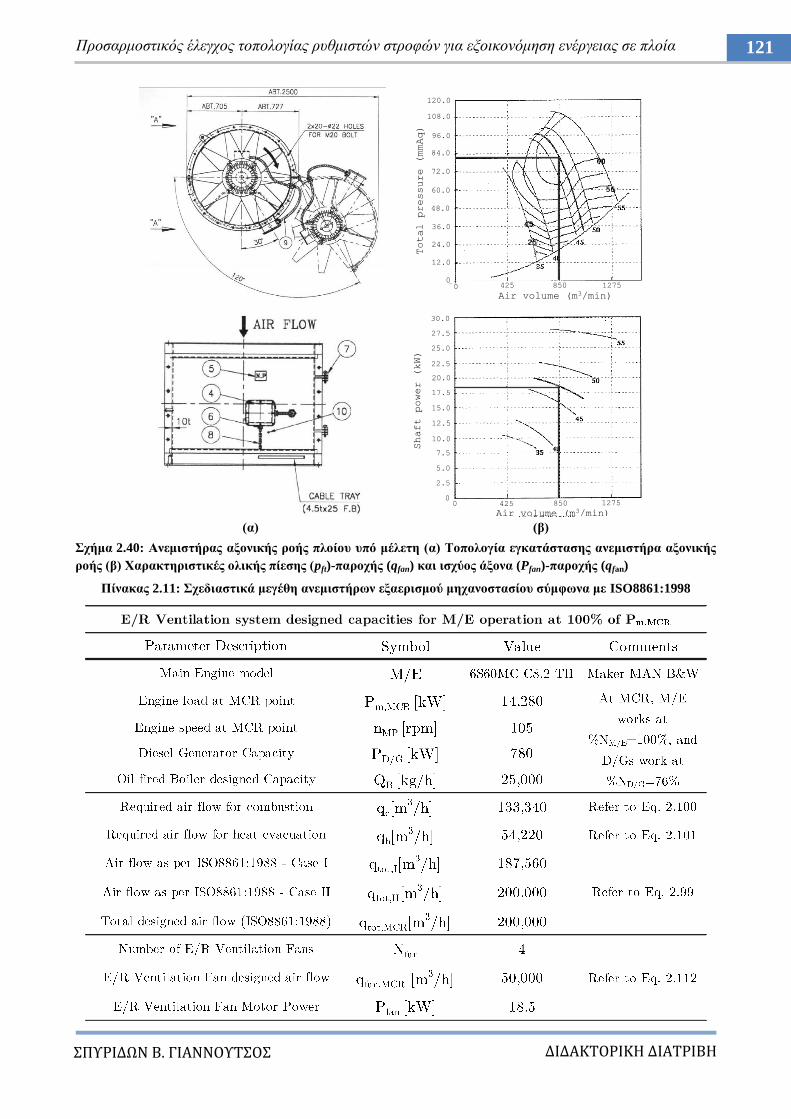
ΔΙΔΑΚΣΟΡΙΚΗ ΔΙΑΣΡΙΒΗ
ΠΤΡΙΔΩΝ Β. ΓΙΑΝΝΟΤΣΟ
121 Πξνζαξκνζηηθόο έιεγρνο ηνπνινγίαο ξπζκηζηώλ ζηξνθώλ γηα εμνηθνλόκεζε ελέξγεηαο ζε πινία
(α) (β)
ρήκα 2.40: Αλεκηζηήξαο αμνληθήο ξνήο πινίνπ ππό κέιεηε (α) Σνπνινγία εγθαηάζηαζεο αλεκηζηήξα αμνληθήο
ξνήο (β) Υαξαθηεξηζηηθέο νιηθήο πίεζεο (pft)-παξνρήο (qfan) θαη ηζρύνο άμνλα (Pfan)-παξνρήο (qfan)
Πίλαθαο 2.11: ρεδηαζηηθά κεγέζε αλεκηζηήξσλ εμαεξηζκνύ κεραλνζηαζίνπ ζύκθσλα κε ISO8861:1998
12.0
0
24.0
36.0
48.0
60.0
72.0
84.0
96.0
108.0
120.0
425 850 12750
0
2.5
5.0
7.5
425 850
10.0
17.5
20.0
22.5
25.0
27.5
30.0
12.5
15.0
0 1275
Air volume (m3/min)
Total pressure (mmAq)
Air volume (m3/min)
Shaft power (kW)
60
55
45
25
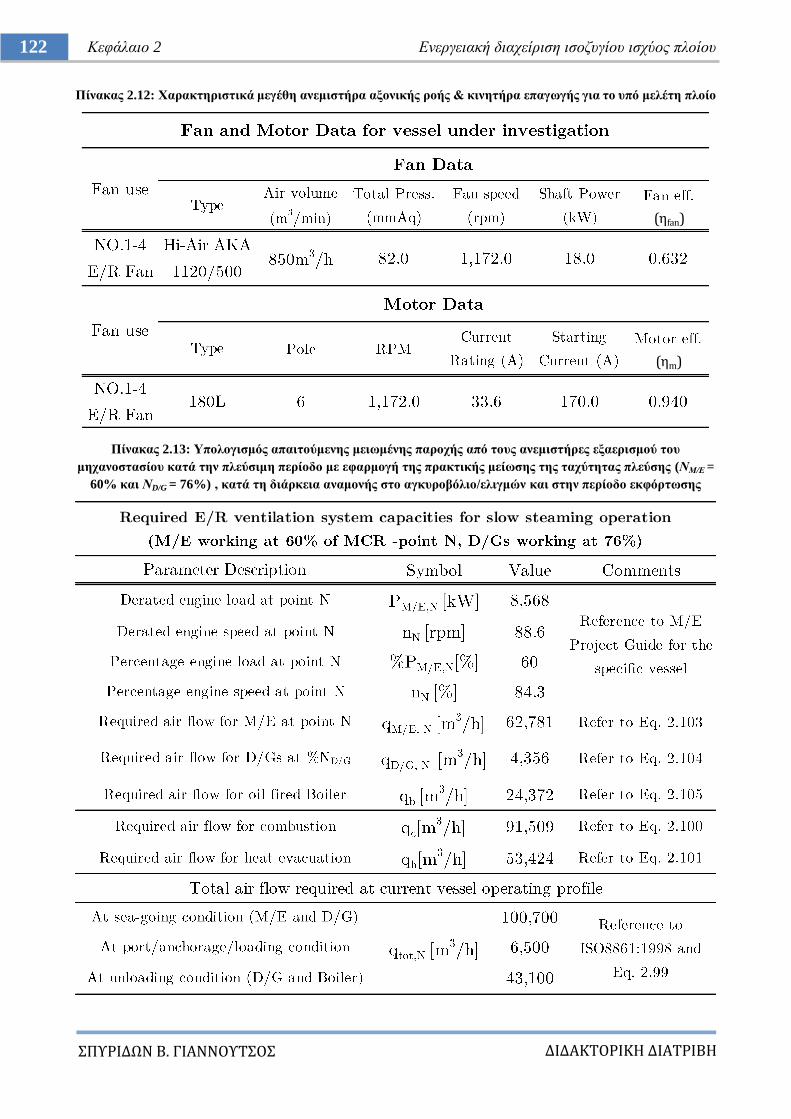
ΔΙΔΑΚΣΟΡΙΚΗ ΔΙΑΣΡΙΒΗ
ΠΤΡΙΔΩΝ Β. ΓΙΑΝΝΟΤΣΟ
122 Κεθάιαην 2 Δλεξγεηαθή δηαρείξηζε ηζνδπγίνπ ηζρύνο πινίνπ
Πίλαθαο 2.12: Υαξαθηεξηζηηθά κεγέζε αλεκηζηήξα αμνληθήο ξνήο & θηλεηήξα επαγσγήο γηα ην ππό κειέηε πινίν
Πίλαθαο 2.13: Τπνινγηζκόο απαηηνύκελεο κεησκέλεο παξνρήο από ηνπο αλεκηζηήξεο εμαεξηζκνύ ηνπ
κεραλνζηαζίνπ θαηά ηελ πιεύζηκε πεξίνδν κε εθαξκνγή ηεο πξαθηηθήο κείσζεο ηεο ηαρύηεηαο πιεύζεο (ΝΜ/Δ =
60% θαη ΝD/G = 76%) , θαηά ηε δηάξθεηα αλακνλήο ζην αγθπξνβόιην/ειηγκώλ θαη ζηελ πεξίνδν εθθόξησζεο
(ηfan)
(ηm)
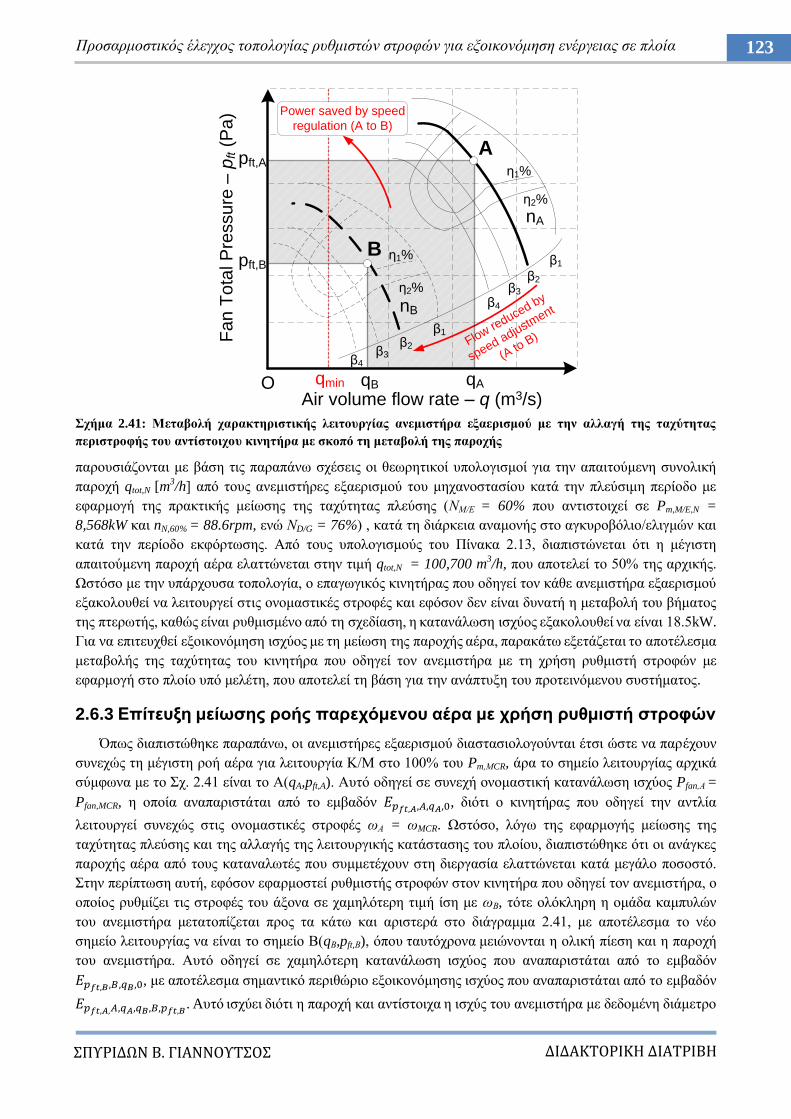
ΔΙΔΑΚΣΟΡΙΚΗ ΔΙΑΣΡΙΒΗ
ΠΤΡΙΔΩΝ Β. ΓΙΑΝΝΟΤΣΟ
123 Πξνζαξκνζηηθόο έιεγρνο ηνπνινγίαο ξπζκηζηώλ ζηξνθώλ γηα εμνηθνλόκεζε ελέξγεηαο ζε πινία
ρήκα 2.41: Μεηαβνιή ραξαθηεξηζηηθήο ιεηηνπξγίαο αλεκηζηήξα εμαεξηζκνύ κε ηελ αιιαγή ηεο ηαρύηεηαο
πεξηζηξνθήο ηνπ αληίζηνηρνπ θηλεηήξα κε ζθνπό ηε κεηαβνιή ηεο παξνρήο
παξνπζηάδνληαη κε βάζε ηηο παξαπάλσ ζρέζεηο νη ζεσξεηηθνί ππνινγηζκνί γηα ηελ απαηηνύκελε ζπλνιηθή
παξνρή qtot,N [m3/h] από ηνπο αλεκηζηήξεο εμαεξηζκνύ ηνπ κεραλνζηαζίνπ θαηά ηελ πιεύζηκε πεξίνδν κε
εθαξκνγή ηεο πξαθηηθήο κείσζεο ηεο ηαρύηεηαο πιεύζεο (ΝΜ/Δ = 60% πνπ αληηζηνηρεί ζε Pm,M/E,N =
8,568kW θαη nN,60% = 88.6rpm, ελώ ΝD/G = 76%) , θαηά ηε δηάξθεηα αλακνλήο ζην αγθπξνβόιην/ειηγκώλ θαη
θαηά ηελ πεξίνδν εθθόξησζεο. Από ηνπο ππνινγηζκνύο ηνπ Πίλαθα 2.13, δηαπηζηώλεηαη όηη ε κέγηζηε
απαηηνύκελε παξνρή αέξα ειαηηώλεηαη ζηελ ηηκή qtot,N = 100,700 m3/h, πνπ απνηειεί ην 50% ηεο αξρηθήο.
Χζηόζν κε ηελ ππάξρνπζα ηνπνινγία, ν επαγσγηθόο θηλεηήξαο πνπ νδεγεί ηνλ θάζε αλεκηζηήξα εμαεξηζκνύ
εμαθνινπζεί λα ιεηηνπξγεί ζηηο νλνκαζηηθέο ζηξνθέο θαη εθόζνλ δελ είλαη δπλαηή ε κεηαβνιή ηνπ βήκαηνο
ηεο πηεξσηήο, θαζώο είλαη ξπζκηζκέλν από ηε ζρεδίαζε, ε θαηαλάισζε ηζρύνο εμαθνινπζεί λα είλαη 18.5kW.
Γηα λα επηηεπρζεί εμνηθνλόκεζε ηζρύνο κε ηε κείσζε ηεο παξνρήο αέξα, παξαθάησ εμεηάδεηαη ην απνηέιεζκα
κεηαβνιήο ηεο ηαρύηεηαο ηνπ θηλεηήξα πνπ νδεγεί ηνλ αλεκηζηήξα κε ηε ρξήζε ξπζκηζηή ζηξνθώλ κε
εθαξκνγή ζην πινίν ππό κειέηε, πνπ απνηειεί ηε βάζε γηα ηελ αλάπηπμε ηνπ πξνηεηλόκελνπ ζπζηήκαηνο.
2.6.3 Δπίηεπμε κείσζεο ξνήο παξερόκελνπ αέξα κε ρξήζε ξπζκηζηή ζηξνθώλ
Όπσο δηαπηζηώζεθε παξαπάλσ, νη αλεκηζηήξεο εμαεξηζκνύ δηαζηαζηνινγνύληαη έηζη ώζηε λα παξέρνπλ
ζπλερώο ηε κέγηζηε ξνή αέξα γηα ιεηηνπξγία Κ/Μ ζην 100% ηνπ Pm,ΜCR, άξα ην ζεκείν ιεηηνπξγίαο αξρηθά
ζύκθσλα κε ην ρ. 2.41 είλαη ην Α(qA,pft,A). Απηό νδεγεί ζε ζπλερή νλνκαζηηθή θαηαλάισζε ηζρύνο Pfan,Α =
Pfan,MCR, ε νπνία αλαπαξηζηάηαη από ην εκβαδόλ , δηόηη ν θηλεηήξαο πνπ νδεγεί ηελ αληιία
ιεηηνπξγεί ζπλερώο ζηηο νλνκαζηηθέο ζηξνθέο σΑ = σMCR. Χζηόζν, ιόγσ ηεο εθαξκνγήο κείσζεο ηεο
ηαρύηεηαο πιεύζεο θαη ηεο αιιαγήο ηεο ιεηηνπξγηθήο θαηάζηαζεο ηνπ πινίνπ, δηαπηζηώζεθε όηη νη αλάγθεο
παξνρήο αέξα από ηνπο θαηαλαισηέο πνπ ζπκκεηέρνπλ ζηε δηεξγαζία ειαηηώλεηαη θαηά κεγάιν πνζνζηό.
ηελ πεξίπησζε απηή, εθόζνλ εθαξκνζηεί ξπζκηζηήο ζηξνθώλ ζηνλ θηλεηήξα πνπ νδεγεί ηνλ αλεκηζηήξα, ν
νπνίνο ξπζκίδεη ηηο ζηξνθέο ηνπ άμνλα ζε ρακειόηεξε ηηκή ίζε κε σΒ, ηόηε νιόθιεξε ε νκάδα θακππιώλ
ηνπ αλεκηζηήξα κεηαηνπίδεηαη πξνο ηα θάησ θαη αξηζηεξά ζην δηάγξακκα 2.41, κε απνηέιεζκα ην λέν
ζεκείν ιεηηνπξγίαο λα είλαη ην ζεκείν Β(qΒ,pft,Β), όπνπ ηαπηόρξνλα κεηώλνληαη ε νιηθή πίεζε θαη ε παξνρή
ηνπ αλεκηζηήξα. Απηό νδεγεί ζε ρακειόηεξε θαηαλάισζε ηζρύνο πνπ αλαπαξηζηάηαη από ην εκβαδόλ
, κε απνηέιεζκα ζεκαληηθό πεξηζώξην εμνηθνλόκεζεο ηζρύνο πνπ αλαπαξηζηάηαη από ην εκβαδόλ
. Aπηό ηζρύεη δηόηη ε παξνρή θαη αληίζηνηρα ε ηζρύο ηνπ αλεκηζηήξα κε δεδνκέλε δηάκεηξν
O
pft,A
pft,B
qA
β1
β2β3
β4
β1
β2β3
β4
A
B
η1%
η2%
η1%
η2%
qB
Air volume flow rate – q (m3/s)qmin
nA
nB
Fa
n T
ota
l P
ressu
re –
pft (
Pa
) Power saved by speed
regulation (A to B)
Flow reduced by
speed adjustment
(A to
B)
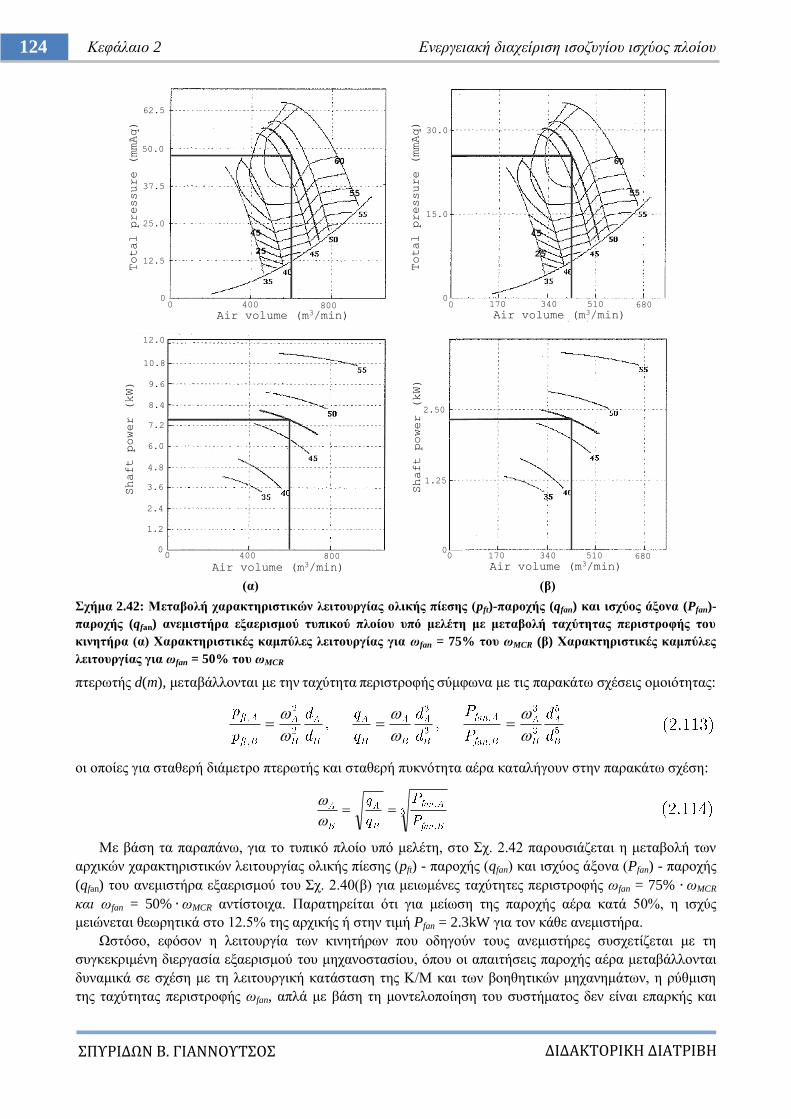
ΔΙΔΑΚΣΟΡΙΚΗ ΔΙΑΣΡΙΒΗ
ΠΤΡΙΔΩΝ Β. ΓΙΑΝΝΟΤΣΟ
124 Κεθάιαην 2 Δλεξγεηαθή δηαρείξηζε ηζνδπγίνπ ηζρύνο πινίνπ
(α) (β)
ρήκα 2.42: Μεηαβνιή ραξαθηεξηζηηθώλ ιεηηνπξγίαο νιηθήο πίεζεο (pft)-παξνρήο (qfan) θαη ηζρύνο άμνλα (Pfan)-
παξνρήο (qfan) αλεκηζηήξα εμαεξηζκνύ ηππηθνύ πινίνπ ππό κειέηε κε κεηαβνιή ηαρύηεηαο πεξηζηξνθήο ηνπ
θηλεηήξα (α) Υαξαθηεξηζηηθέο θακπύιεο ιεηηνπξγίαο γηα σfan = 75% ηνπ σMCR (β) Υαξαθηεξηζηηθέο θακπύιεο
ιεηηνπξγίαο γηα σfan = 50% ηνπ σMCR
πηεξσηήο d(m), κεηαβάιινληαη κε ηελ ηαρύηεηα πεξηζηξνθήο ζύκθσλα κε ηηο παξαθάησ ζρέζεηο νκνηόηεηαο:
νη νπνίεο γηα ζηαζεξή δηάκεηξν πηεξσηήο θαη ζηαζεξή ππθλόηεηα αέξα θαηαιήγνπλ ζηελ παξαθάησ ζρέζε:
Με βάζε ηα παξαπάλσ, γηα ην ηππηθό πινίν ππό κειέηε, ζην ρ. 2.42 παξνπζηάδεηαη ε κεηαβνιή ησλ
αξρηθώλ ραξαθηεξηζηηθώλ ιεηηνπξγίαο νιηθήο πίεζεο (pft) - παξνρήο (qfan) θαη ηζρύνο άμνλα (Pfan) - παξνρήο
(qfan) ηνπ αλεκηζηήξα εμαεξηζκνύ ηνπ ρ. 2.40(β) γηα κεησκέλεο ηαρύηεηεο πεξηζηξνθήο σfan = 75% σMCR
θαη σfan = 50% σMCR αληίζηνηρα. Παξαηεξείηαη όηη γηα κείσζε ηεο παξνρήο αέξα θαηά 50%, ε ηζρύο
κεηώλεηαη ζεσξεηηθά ζην 12.5% ηεο αξρηθήο ή ζηελ ηηκή Pfan = 2.3kW γηα ηνλ θάζε αλεκηζηήξα.
Χζηόζν, εθόζνλ ε ιεηηνπξγία ησλ θηλεηήξσλ πνπ νδεγνύλ ηνπο αλεκηζηήξεο ζπζρεηίδεηαη κε ηε
ζπγθεθξηκέλε δηεξγαζία εμαεξηζκνύ ηνπ κεραλνζηαζίνπ, όπνπ νη απαηηήζεηο παξνρήο αέξα κεηαβάιινληαη
δπλακηθά ζε ζρέζε κε ηε ιεηηνπξγηθή θαηάζηαζε ηεο Κ/Μ θαη ησλ βνεζεηηθώλ κεραλεκάησλ, ε ξύζκηζε
ηεο ηαρύηεηαο πεξηζηξνθήο σfan, απιά κε βάζε ηε κνληεινπνίεζε ηνπ ζπζηήκαηνο δελ είλαη επαξθήο θαη
400 8000
12.5
25.0
37.5
50.0
62.5
0
1.2
2.4
3.6
4.8
6.0
7.2
8.4
9.6
10.8
12.0
400 8000
Air volume (m3/min)
Total pressure (mmAq)
Shaft power (kW)
Air volume (m3/min)
0
15.0
30.0
170 340 510 680
Air volume (m3/min)
Total pressure (mmAq)
Air volume (m3/min)
00
1.25
2.50Shaft power (kW)
170 340 510 68000
60
55
45
25
60
55
45
25
ΔΙΔΑΚΣΟΡΙΚΗ ΔΙΑΣΡΙΒΗ
ΠΤΡΙΔΩΝ Β. ΓΙΑΝΝΟΤΣΟ
125 Πξνζαξκνζηηθόο έιεγρνο ηνπνινγίαο ξπζκηζηώλ ζηξνθώλ γηα εμνηθνλόκεζε ελέξγεηαο ζε πινία
κπνξεί λα ζέζεη ζε θίλδπλν ηελ αζθάιεηα θαη ηελ αμηνπηζηία ηνπ εμνπιηζκνύ. Ο ζηόρνο ηνπ πξνηεηλόκελνπ
ζπζηήκαηνο ειέγρνπ ζε απηήλ ηελ πεξίπησζε, είλαη ε ιεηηνπξγία ησλ θηλεηήξσλ πνπ νδεγνύλ ηνπο
αλεκηζηήξεο εμαεξηζκνύ ηνπ κεραλνζηαζίνπ ζηε βέιηηζηε ηαρύηεηα κε βάζε ηα δεδνκέλα ηεο δηεξγαζίαο,
πνπ αλαηξνθνδνηνύληαη ζε πξαγκαηηθό ρξόλν, αιιά θαη κε βάζε ηνπο πεξηνξηζκνύο ζηε ιεηηνπξγία ησλ
κεραλεκάησλ έηζη ώζηε λα επηηεπρζεί κέγηζηε εμνηθνλόκεζε ηζρύνο. Ζ ειάρηζηε ηαρύηεηα πεξηζηξνθήο,
σmin, θαζνξίδεηαη δπλακηθά ζύκθσλα κε ηελ ειάρηζηε απαηηνύκελε παξνρή qmin αιιά θαη ηνπο πεξηνξηζκνύο
ιεηηνπξγίαο ησλ κεραλεκάησλ ηελ εθάζηνηε πεξίνδν.
2.7 Αναθοπέρ δεύηεπος κεθαλαίος
[1] G. S. Stavrakakis, and G. N. Kariniotakis, "A general simulation algorithm for the accurate assessment of isolated
diesel-wind turbines systems interaction. I. A general multimachine power system model", in IEEE Trans.
Energy Conv., vol. 10, no. 3, pp. 577-583, Sep 1995.
[2] S. Roy, O. P. Malik, and G. S. Hope, "An adaptive control scheme for speed control of diesel driven power-
plants", in IEEE Trans. Energy Conv., vol. 6, no. 4, pp. 605-611, Dec 1991.
[3] V.L. Maleev, “Internal Combustion Engines”, McGraw Hill (19th ed.), 1985
[4] P. B. Malatestas, M. P. Papadopoulos, and G. S. Stavrakakis, "Modeling and identification of diesel-wind turbines
systems for wind penetration assessment", in IEEE Trans. Power Sys., vol. 8, no. 3, pp. 1091-1097, Aug 1993.
[5] C. D. Vournas, "Second order hydraulic turbine models for multimachine stability studies", in IEEE Trans.
Energy Conv., vol. 5, no. 2, pp. 239-244, Jun 1990
[6] G. Fusco, and M. Russo, "Adaptive Voltage Regulator Design for Synchronous Generator", in IEEE Trans.
Energy Conversion, vol. 23, no. 3, pp. 946-956, Sept. 2008
[7] A. Darabi, C. Tindall, and S. Ferguson, "Finite-element time-step coupled Generator,Load, AVR, and brushless
exciter modeling", in IEEE Trans. Energy Conv., vol. 19, no. 2, pp. 258-264, June 2004
[8] J. Faiz, G. Shahgholian, and M. Arezoomand, "Analysis and Simulation of the AVR System and Parameters
Variation Effects", Int. Conf. on Power Eng., Energy and Electr. Drives, Setubal, Portugal, 2007, pp. 450-453.
[9] C. Yan, G.K. Venayagamoorthy, and K. Corzine, “AIS-Based Coordinated and Adaptive Control of Generator
Excitation Systems for an Electric Ship”, IEEE Trans. Ind. Electron., vol. 59, no.8, pp. 3102-3112, Aug. 2012
[10] International Association of Classification Societies – IACS, “Requirements Concerning Machinery
Installations - IACS Requirement 2004”, [Online].
Available:http://www.iacs.org.uk/document/public/Publications/Unified_requirements/PDF/UR_M_pdf2793.pdf
[11] W. K. Ho, O. P. Gan, E. B. Tay, and E. L. Ang, "Performance and gain and phase margins of well-known PID
tuning formulas", in IEEE Trans. on Control Sys. Techn., vol. 4, no. 4, pp. 473-477, Jul 1996.
[12] S. W. Sung, J. Lee, and I-B. Lee, "Proportional-Integral-Derivative Controller Tuning", Process Identification
and PID Control , 1, Wiley-IEEE Press, 2009, pp.151-199
[13] C. C. Hang, K. J. Astrom, and W. K. Ho, "Refinements of the Ziegler-Nichols tuning formula", in IEE
Proceedings D - Control Theory and Appl., vol. 138, no. 2, pp. 111-118, March 1991
[14] S. Tzafestas and N. P. Papanikolopoulos, "Incremental fuzzy expert PID control," in IEEE Trans. on Ind.
Electron, vol. 37, no. 5, pp. 365-371, Oct 1990
[15] H. M. Chin, C. L. Su, and C. H. Liao, "Estimating Power Pump Loads and Sizing Generators for Ship Electrical
Load Analysis", IEEE Trans. Ind. Appl., vol. 52, no. 6, pp. 4619-4627, Nov.-Dec. 2016.
[16] C. L. Su, "Load Estimation in Industrial Power Systems for Expansion Planning", IEEE Trans Ind. Appl., vol.
47, no. 6, pp. 2311-2323, Nov.-Dec. 2011.
[17] J. Wu, Y. Cheng, N. N. Schulz, and H. L. Ginn, "The Impact of Standardized Models, Programming Interfaces,
and Protocols on a Shipboard Power System", IEEE Trans. Ind. Appl., vol. 44, no. 2, pp. 455-462, Mar-Apr 2008
ΔΙΔΑΚΣΟΡΙΚΗ ΔΙΑΣΡΙΒΗ
ΠΤΡΙΔΩΝ Β. ΓΙΑΝΝΟΤΣΟ
126 Κεθάιαην 2 Δλεξγεηαθή δηαρείξηζε ηζνδπγίνπ ηζρύνο πινίνπ
[18] K. P. Logan, "Intelligent Diagnostic Requirements of Future All-Electric Ship Integrated Power System", IEEE
Trans. Ind. Appl., vol. 43, no. 1, pp. 139-149, Jan.-Feb. 2007
[19] F. D. Kanellos, G. J. Tsekouras, and N. D. Hatziargyriou, "Optimal Demand-Side Management and Power
Generation Scheduling in an All-Electric Ship", IEEE Trans. Sust Energy, vol. 5, no. 4, pp. 1166-1175, Oct. 2014.
[20] F. D. Kanellos, "Optimal Power Management With GHG Emissions Limitation in All-Electric Ship Power
Systems Comprising Energy Storage Systems", IEEE Trans. Power Sys., vol. 29, no. 1, pp. 330-339, Jan. 2014.
[21] M. Falahi, K. L. Butler-Purry, and M. Ehsani, "Reactive Power Coordination of Shipboard Power Systems in
Presence of Pulsed Loads", IEEE Trans. Power Sys., vol. 28, no. 4, pp. 3675-3682, Nov. 2013.
[22] S. Mashayekh, and K. L. Butler-Purry, "An Integrated Security-Constrained Model-Based Dynamic Power
Management Approach for Isolated Microgrids in All-Electric Ships", IEEE Trans. on Power Sys., vol. 30, no. 6,
pp. 2934-2945, Nov. 2015.
[23] J. Machowski, J. Bialek, and J. Bumby “Power Systems Dynamics: Stability and Control”, Wiley (2nd ed.), 2009
[24] MAN B&W Diesel and Turbo, “L23/30H Project Guide-Marine four-stroke GenSet compliant with IMO Tier II”,
2014 ed., Man B&W, [Online]. Available:
http://www.mandieselturbo.com/download/documents/ProjectGuides4Stroke/L23-30H_GenSet_TierII.pdf
[25] C. Shang, D. Srinivasan, and T. Reindl, "Economic and Environmental Generation and Voyage Scheduling of
All-Electric Ships", IEEE Trans. Power Sys., vol. 31, no. 5, pp. 4087-4096, Sept. 2016.
[27] D. Radan, A. Sørensen, A.K. Ådnanes, and T.A. Johansen, "Reducing Power Load Fluctuations on Ships Using
Power Redistribution Control", J. of Marine Techn., vol. 45, no. 3, pp. 162-174, Jul. 2008.
[28] J. Carlton, “Marine Propellers and Propulsion”, Butterworth-Heinemann (3rd
ed.), 2012
[29] H.K. Woud, and D. Stapersma, “Design of Propulsion and Electric Power Generation Systems”, IMAREST (1st
ed.), 2002
[30] MAN B&W Diesel and Turbo, “S60MC-C8 Project Guide Camshaft Controlled Two-Stroke Engines”, 1st ed.,
2009,Man B&W, [Online].Available:
http://www.mandieselturbo.com/download/project_guides_tier1/printed/s60mcc8.pdf
[31] F. P. Incropera, D. P. DeWitt, T. L. Bergman, and D. Stape, “Fundamentals of Heat and Mass Transfer”, 6th
Edition, John Wiley and Sons, 2007
[32] F. P. Incropera, “Introduction to Heat Transfer”, 5th
edition, Wiley, 2007
[33] L. Theodore, “Heat transfer applications for the practicing engineer”, 5th
edition, John Wiley and Sons, 2011
[34] R. L. Mott, and J. A. Untener, “Applied Fluid Mechanics”, 7th
edition, Pearson, 2015
[35] D. Gritter, S.S. Kalsi, and N. Henderson, “Variable speed electric drive options for electric ships”, in Proc. IEEE
Elect. Ship Techn. Symp., Philadelphia, Pennsylvania, pp. 347-354, Jul. 2005
[36] R. Cuzner, D. Drews, W. Kranz, A. Bendre, and G. Venkataramanan, “Power-Dense Shipboard-Compatible
Low-Horsepower Variable-Frequency Drives”, IEEE Trans. Ind. Appl., vol. 48, no. 6, pp. 2121-2128, Nov.-Dec.
2012
[37] C.-L. Su, W.-L. Chung, and K.-T. Yu, “An Energy-Savings Evaluation Method for Variable-Frequency-Drive
Applications on Ship Central Cooling Systems, IEEE Trans. Ind. Appl., vol. 50, no.2, pp. 1286-1294, Mar.-Apr.
2014
[38] C. J. Taylor, P. A. Leigh, A. Chotai, P. C. Young, E. Vranken and D. Berckmans, "Cost effective combined axial
fan and throttling valve control of ventilation rate",IEE Proceedings - Control Theory and Applications, vol. 151,
no. 5, pp. 577-584, 23 Sept. 2004
[39] Shipbuilding-Engine room ventilation in diesel-engined ships- Design requirements and basis of calculations,
Int. Std. ISO 8861:1998
ΔΙΔΑΚΣΟΡΙΚΗ ΔΙΑΣΡΙΒΗ
ΠΤΡΙΔΩΝ Β. ΓΙΑΝΝΟΤΣΟ
127 Πξνζαξκνζηηθόο έιεγρνο ηνπνινγίαο ξπζκηζηώλ ζηξνθώλ γηα εμνηθνλόκεζε ελέξγεηαο ζε πινία
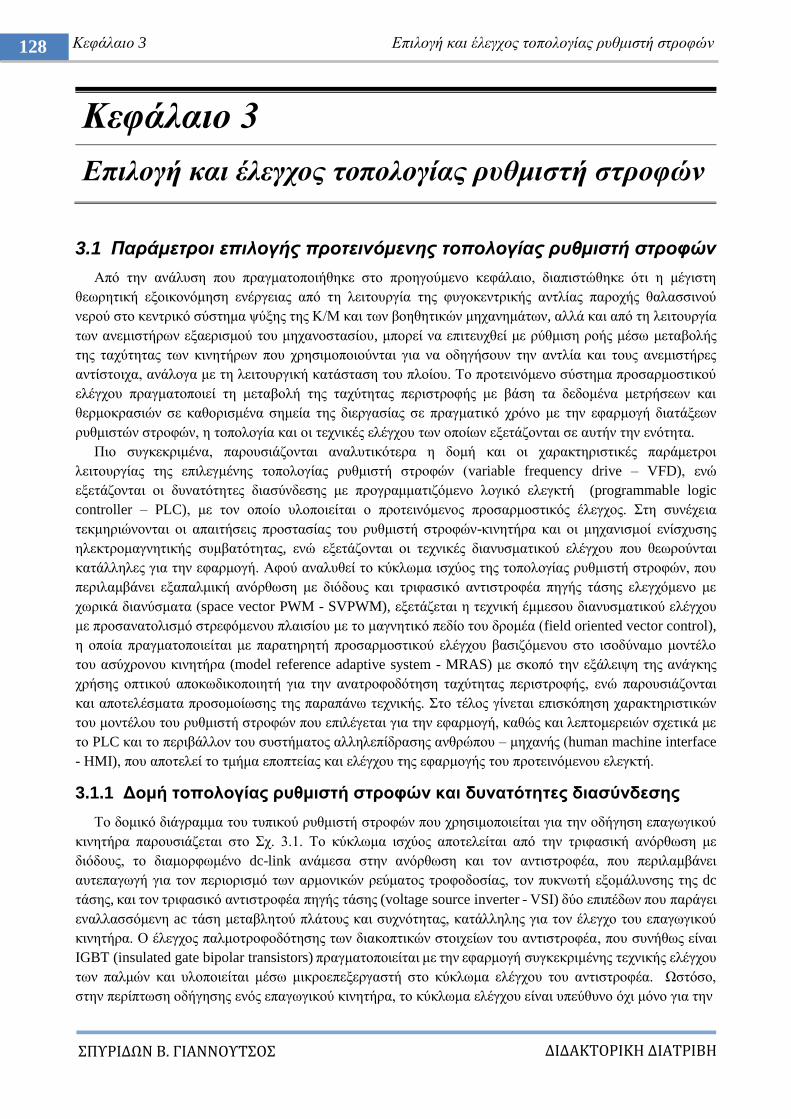
ΔΙΔΑΚΣΟΡΙΚΗ ΔΙΑΣΡΙΒΗ
ΠΤΡΙΔΩΝ Β. ΓΙΑΝΝΟΤΣΟ
128 Κεθάιαην 3 Δπηινγή θαη έιεγρνο ηνπνινγίαο ξπζκηζηή ζηξνθώλ
Κεθάιαην 3
Δπηινγή θαη έιεγρνο ηνπνινγίαο ξπζκηζηή ζηξνθώλ
3.1 Παπάμεηποι επιλογήρ πποηεινόμενηρ ηοπολογίαρ πςθμιζηή ζηποθών
Από ηελ αλάιπζε πνπ πξαγκαηνπνηήζεθε ζην πξνεγνύκελν θεθάιαην, δηαπηζηώζεθε όηη ε κέγηζηε
ζεσξεηηθή εμνηθνλόκεζε ελέξγεηαο από ηε ιεηηνπξγία ηεο θπγνθεληξηθήο αληιίαο παξνρήο ζαιαζζηλνύ
λεξνύ ζην θεληξηθό ζύζηεκα ςύμεο ηεο Κ/Μ θαη ησλ βνεζεηηθώλ κεραλεκάησλ, αιιά θαη από ηε ιεηηνπξγία
ησλ αλεκηζηήξσλ εμαεξηζκνύ ηνπ κεραλνζηαζίνπ, κπνξεί λα επηηεπρζεί κε ξύζκηζε ξνήο κέζσ κεηαβνιήο
ηεο ηαρύηεηαο ησλ θηλεηήξσλ πνπ ρξεζηκνπνηνύληαη γηα λα νδεγήζνπλ ηελ αληιία θαη ηνπο αλεκηζηήξεο
αληίζηνηρα, αλάινγα κε ηε ιεηηνπξγηθή θαηάζηαζε ηνπ πινίνπ. Σν πξνηεηλόκελν ζύζηεκα πξνζαξκνζηηθνύ
ειέγρνπ πξαγκαηνπνηεί ηε κεηαβνιή ηεο ηαρύηεηαο πεξηζηξνθήο κε βάζε ηα δεδνκέλα κεηξήζεσλ θαη
ζεξκνθξαζηώλ ζε θαζνξηζκέλα ζεκεία ηεο δηεξγαζίαο ζε πξαγκαηηθό ρξόλν κε ηελ εθαξκνγή δηαηάμεσλ
ξπζκηζηώλ ζηξνθώλ, ε ηνπνινγία θαη νη ηερληθέο ειέγρνπ ησλ νπνίσλ εμεηάδνληαη ζε απηήλ ηελ ελόηεηα.
Πην ζπγθεθξηκέλα, παξνπζηάδνληαη αλαιπηηθόηεξα ε δνκή θαη νη ραξαθηεξηζηηθέο παξάκεηξνη
ιεηηνπξγίαο ηεο επηιεγκέλεο ηνπνινγίαο ξπζκηζηή ζηξνθώλ (variable frequency drive – VFD), ελώ
εμεηάδνληαη νη δπλαηόηεηεο δηαζύλδεζεο κε πξνγξακκαηηδόκελν ινγηθό ειεγθηή (programmable logic
controller – PLC), κε ηνλ νπνίν πινπνηείηαη ν πξνηεηλόκελνο πξνζαξκνζηηθόο έιεγρνο. ηε ζπλέρεηα
ηεθκεξηώλνληαη νη απαηηήζεηο πξνζηαζίαο ηνπ ξπζκηζηή ζηξνθώλ-θηλεηήξα θαη νη κεραληζκνί ελίζρπζεο
ειεθηξνκαγλεηηθήο ζπκβαηόηεηαο, ελώ εμεηάδνληαη νη ηερληθέο δηαλπζκαηηθνύ ειέγρνπ πνπ ζεσξνύληαη
θαηάιιειεο γηα ηελ εθαξκνγή. Αθνύ αλαιπζεί ην θύθισκα ηζρύνο ηεο ηνπνινγίαο ξπζκηζηή ζηξνθώλ, πνπ
πεξηιακβάλεη εμαπαικηθή αλόξζσζε κε δηόδνπο θαη ηξηθαζηθό αληηζηξνθέα πεγήο ηάζεο ειεγρόκελν κε
ρσξηθά δηαλύζκαηα (space vector PWM - SVPWM), εμεηάδεηαη ε ηερληθή έκκεζνπ δηαλπζκαηηθνύ ειέγρνπ
κε πξνζαλαηνιηζκό ζηξεθόκελνπ πιαηζίνπ κε ην καγλεηηθό πεδίν ηνπ δξνκέα (field oriented vector control),
ε νπνία πξαγκαηνπνηείηαη κε παξαηεξεηή πξνζαξκνζηηθνύ ειέγρνπ βαζηδόκελνπ ζην ηζνδύλακν κνληέιν
ηνπ αζύρξνλνπ θηλεηήξα (mνdel reference adaptive system - MRAS) κε ζθνπό ηελ εμάιεηςε ηεο αλάγθεο
ρξήζεο νπηηθνύ απνθσδηθνπνηεηή γηα ηελ αλαηξνθνδόηεζε ηαρύηεηαο πεξηζηξνθήο, ελώ παξνπζηάδνληαη
θαη απνηειέζκαηα πξνζνκνίσζεο ηεο παξαπάλσ ηερληθήο. ην ηέινο γίλεηαη επηζθόπεζε ραξαθηεξηζηηθώλ
ηνπ κνληέινπ ηνπ ξπζκηζηή ζηξνθώλ πνπ επηιέγεηαη γηα ηελ εθαξκνγή, θαζώο θαη ιεπηνκεξεηώλ ζρεηηθά κε
ην PLC θαη ην πεξηβάιινλ ηνπ ζπζηήκαηνο αιιειεπίδξαζεο αλζξώπνπ – κεραλήο (human machine interface
- HMI), πνπ απνηειεί ην ηκήκα επνπηείαο θαη ειέγρνπ ηεο εθαξκνγήο ηνπ πξνηεηλόκελνπ ειεγθηή.
3.1.1 Γνκή ηνπνινγίαο ξπζκηζηή ζηξνθώλ θαη δπλαηόηεηεο δηαζύλδεζεο
Σν δνκηθό δηάγξακκα ηνπ ηππηθνύ ξπζκηζηή ζηξνθώλ πνπ ρξεζηκνπνηείηαη γηα ηελ νδήγεζε επαγσγηθνύ
θηλεηήξα παξνπζηάδεηαη ζην ρ. 3.1. Σν θύθισκα ηζρύνο απνηειείηαη από ηελ ηξηθαζηθή αλόξζσζε κε
δηόδνπο, ην δηακνξθσκέλν dc-link αλάκεζα ζηελ αλόξζσζε θαη ηνλ αληηζηξνθέα, πνπ πεξηιακβάλεη
απηεπαγσγή γηα ηνλ πεξηνξηζκό ησλ αξκνληθώλ ξεύκαηνο ηξνθνδνζίαο, ηνλ ππθλσηή εμνκάιπλζεο ηεο dc
ηάζεο, θαη ηνλ ηξηθαζηθό αληηζηξνθέα πεγήο ηάζεο (voltage source inverter - VSI) δύν επηπέδσλ πνπ παξάγεη
ελαιιαζζόκελε ac ηάζε κεηαβιεηνύ πιάηνπο θαη ζπρλόηεηαο, θαηάιιειεο γηα ηνλ έιεγρν ηνπ επαγσγηθνύ
θηλεηήξα. Ο έιεγρνο παικνηξνθνδόηεζεο ησλ δηαθνπηηθώλ ζηνηρείσλ ηνπ αληηζηξνθέα, πνπ ζπλήζσο είλαη
ΗGBT (insulated gate bipolar transistors) πξαγκαηνπνηείηαη κε ηελ εθαξκνγή ζπγθεθξηκέλεο ηερληθήο ειέγρνπ
ησλ παικώλ θαη πινπνηείηαη κέζσ κηθξνεπεμεξγαζηή ζην θύθισκα ειέγρνπ ηνπ αληηζηξνθέα. Χζηόζν,
ζηελ πεξίπησζε νδήγεζεο ελόο επαγσγηθνύ θηλεηήξα, ην θύθισκα ειέγρνπ είλαη ππεύζπλν όρη κόλν γηα ηελ
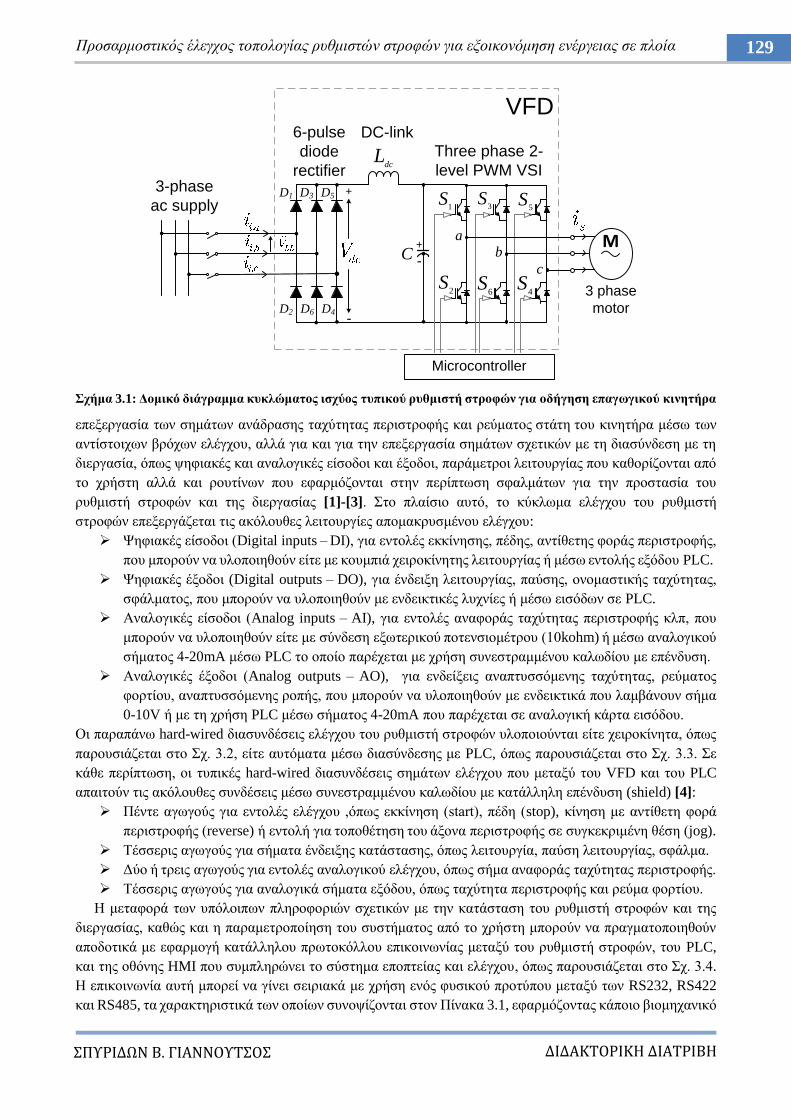
ΔΙΔΑΚΣΟΡΙΚΗ ΔΙΑΣΡΙΒΗ
ΠΤΡΙΔΩΝ Β. ΓΙΑΝΝΟΤΣΟ
129 Πξνζαξκνζηηθόο έιεγρνο ηνπνινγίαο ξπζκηζηώλ ζηξνθώλ γηα εμνηθνλόκεζε ελέξγεηαο ζε πινία
ρήκα 3.1: Γνκηθό δηάγξακκα θπθιώκαηνο ηζρύνο ηππηθνύ ξπζκηζηή ζηξνθώλ γηα νδήγεζε επαγσγηθνύ θηλεηήξα
επεμεξγαζία ησλ ζεκάησλ αλάδξαζεο ηαρύηεηαο πεξηζηξνθήο θαη ξεύκαηνο ζηάηε ηνπ θηλεηήξα κέζσ ησλ
αληίζηνηρσλ βξόρσλ ειέγρνπ, αιιά γηα θαη γηα ηελ επεμεξγαζία ζεκάησλ ζρεηηθώλ κε ηε δηαζύλδεζε κε ηε
δηεξγαζία, όπσο ςεθηαθέο θαη αλαινγηθέο είζνδνη θαη έμνδνη, παξάκεηξνη ιεηηνπξγίαο πνπ θαζνξίδνληαη από
ην ρξήζηε αιιά θαη ξνπηίλσλ πνπ εθαξκόδνληαη ζηελ πεξίπησζε ζθαικάησλ γηα ηελ πξνζηαζία ηνπ
ξπζκηζηή ζηξνθώλ θαη ηεο δηεξγαζίαο [1]-[3]. ην πιαίζην απηό, ην θύθισκα ειέγρνπ ηνπ ξπζκηζηή
ζηξνθώλ επεμεξγάδεηαη ηηο αθόινπζεο ιεηηνπξγίεο απνκαθξπζκέλνπ ειέγρνπ:
Φεθηαθέο είζνδνη (Digital inputs – DI), γηα εληνιέο εθθίλεζεο, πέδεο, αληίζεηεο θνξάο πεξηζηξνθήο,
πνπ κπνξνύλ λα πινπνηεζνύλ είηε κε θνπκπηά ρεηξνθίλεηεο ιεηηνπξγίαο ή κέζσ εληνιήο εμόδνπ PLC.
Φεθηαθέο έμνδνη (Digital outputs – DO), γηα έλδεημε ιεηηνπξγίαο, παύζεο, νλνκαζηηθήο ηαρύηεηαο,
ζθάικαηνο, πνπ κπνξνύλ λα πινπνηεζνύλ κε ελδεηθηηθέο ιπρλίεο ή κέζσ εηζόδσλ ζε PLC.
Αλαινγηθέο είζνδνη (Analog inputs – AI), γηα εληνιέο αλαθνξάο ηαρύηεηαο πεξηζηξνθήο θιπ, πνπ
κπνξνύλ λα πινπνηεζνύλ είηε κε ζύλδεζε εμσηεξηθνύ πνηελζηνκέηξνπ (10kohm) ή κέζσ αλαινγηθνύ
ζήκαηνο 4-20mA κέζσ PLC ην νπνίν παξέρεηαη κε ρξήζε ζπλεζηξακκέλνπ θαισδίνπ κε επέλδπζε.
Αλαινγηθέο έμνδνη (Analog outputs – AO), γηα ελδείμεηο αλαπηπζζόκελεο ηαρύηεηαο, ξεύκαηνο
θνξηίνπ, αλαπηπζζόκελεο ξνπήο, πνπ κπνξνύλ λα πινπνηεζνύλ κε ελδεηθηηθά πνπ ιακβάλνπλ ζήκα
0-10V ή κε ηε ρξήζε PLC κέζσ ζήκαηνο 4-20mA πνπ παξέρεηαη ζε αλαινγηθή θάξηα εηζόδνπ.
Οη παξαπάλσ hard-wired δηαζπλδέζεηο ειέγρνπ ηνπ ξπζκηζηή ζηξνθώλ πινπνηνύληαη είηε ρεηξνθίλεηα, όπσο
παξνπζηάδεηαη ζην ρ. 3.2, είηε απηόκαηα κέζσ δηαζύλδεζεο κε PLC, όπσο παξνπζηάδεηαη ζην ρ. 3.3. ε
θάζε πεξίπησζε, νη ηππηθέο hard-wired δηαζπλδέζεηο ζεκάησλ ειέγρνπ πνπ κεηαμύ ηνπ VFD θαη ηνπ PLC
απαηηνύλ ηηο αθόινπζεο ζπλδέζεηο κέζσ ζπλεζηξακκέλνπ θαισδίνπ κε θαηάιιειε επέλδπζε (shield) [4]:
Πέληε αγσγνύο γηα εληνιέο ειέγρνπ ,όπσο εθθίλεζε (start), πέδε (stop), θίλεζε κε αληίζεηε θνξά
πεξηζηξνθήο (reverse) ή εληνιή γηα ηνπνζέηεζε ηνπ άμνλα πεξηζηξνθήο ζε ζπγθεθξηκέλε ζέζε (jog).
Σέζζεξηο αγσγνύο γηα ζήκαηα έλδεημεο θαηάζηαζεο, όπσο ιεηηνπξγία, παύζε ιεηηνπξγίαο, ζθάικα.
Γύν ή ηξεηο αγσγνύο γηα εληνιέο αλαινγηθνύ ειέγρνπ, όπσο ζήκα αλαθνξάο ηαρύηεηαο πεξηζηξνθήο.
Σέζζεξηο αγσγνύο γηα αλαινγηθά ζήκαηα εμόδνπ, όπσο ηαρύηεηα πεξηζηξνθήο θαη ξεύκα θνξηίνπ.
Ζ κεηαθνξά ησλ ππόινηπσλ πιεξνθνξηώλ ζρεηηθώλ κε ηελ θαηάζηαζε ηνπ ξπζκηζηή ζηξνθώλ θαη ηεο
δηεξγαζίαο, θαζώο θαη ε παξακεηξνπνίεζε ηνπ ζπζηήκαηνο από ην ρξήζηε κπνξνύλ λα πξαγκαηνπνηεζνύλ
απνδνηηθά κε εθαξκνγή θαηάιιεινπ πξσηνθόιινπ επηθνηλσλίαο κεηαμύ ηνπ ξπζκηζηή ζηξνθώλ, ηνπ PLC,
θαη ηεο νζόλεο HMI πνπ ζπκπιεξώλεη ην ζύζηεκα επνπηείαο θαη ειέγρνπ, όπσο παξνπζηάδεηαη ζην ρ. 3.4.
Ζ επηθνηλσλία απηή κπνξεί λα γίλεη ζεηξηαθά κε ρξήζε ελόο θπζηθνύ πξνηύπνπ κεηαμύ ησλ RS232, RS422
θαη RS485, ηα ραξαθηεξηζηηθά ησλ νπνίσλ ζπλνςίδνληαη ζηνλ Πίλαθα 3.1, εθαξκόδνληαο θάπνην βηνκεραληθό
+
-
Three phase 2-
level PWM VSI
3 phase
motor
6-pulse
diode
rectifier
VFD
+
-
Microcontroller
DC-link
3-phase
ac supply
dcL
1S
3S
5S
2S
6S
4S
Ca
b
c
D1 D3 D5
D2 D6 D4
M
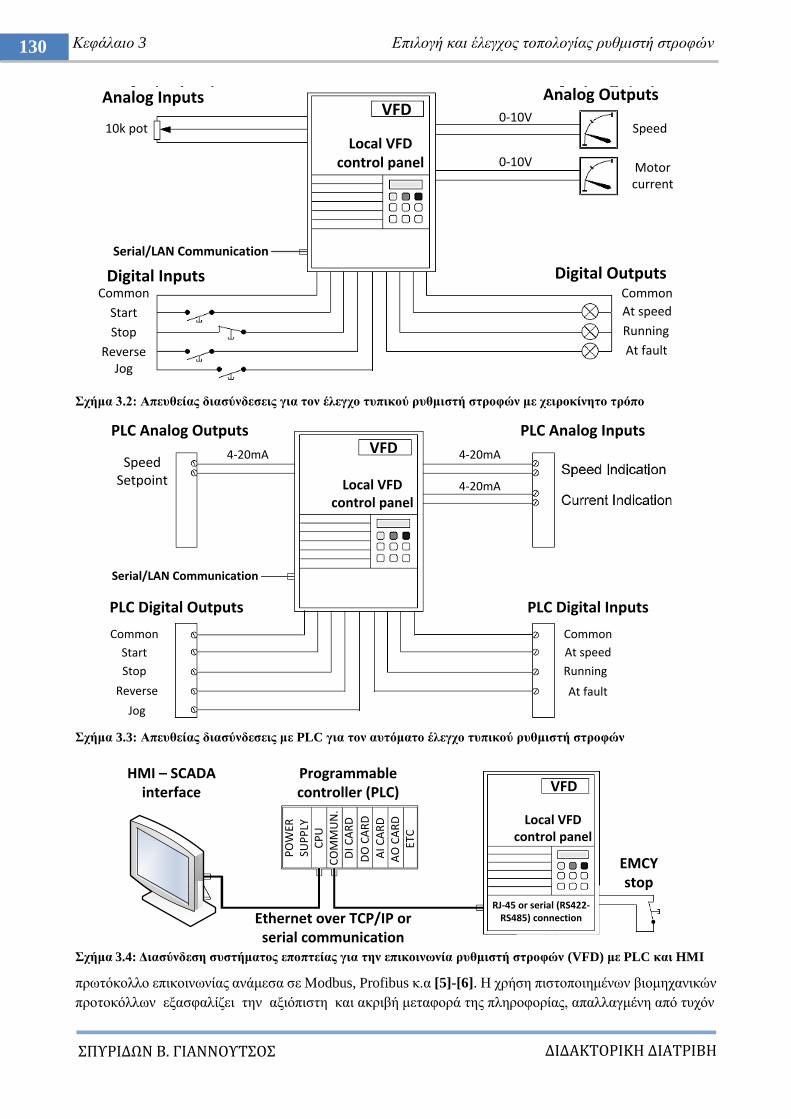
ΔΙΔΑΚΣΟΡΙΚΗ ΔΙΑΣΡΙΒΗ
ΠΤΡΙΔΩΝ Β. ΓΙΑΝΝΟΤΣΟ
130 Κεθάιαην 3 Δπηινγή θαη έιεγρνο ηνπνινγίαο ξπζκηζηή ζηξνθώλ
ρήκα 3.2: Απεπζείαο δηαζύλδεζεηο γηα ηνλ έιεγρν ηππηθνύ ξπζκηζηή ζηξνθώλ κε ρεηξνθίλεην ηξόπν
ρήκα 3.3: Απεπζείαο δηαζύλδεζεηο κε PLC γηα ηνλ απηόκαην έιεγρν ηππηθνύ ξπζκηζηή ζηξνθώλ
ρήκα 3.4: Γηαζύλδεζε ζπζηήκαηνο επνπηείαο γηα ηελ επηθνηλσλία ξπζκηζηή ζηξνθώλ (VFD) κε PLC θαη HMI
πξσηόθνιιν επηθνηλσλίαο αλάκεζα ζε Μodbus, Profibus θ.α [5]-[6]. Ζ ρξήζε πηζηνπνηεκέλσλ βηνκεραληθώλ
πξνηνθόιισλ εμαζθαιίδεη ηελ αμηόπηζηε θαη αθξηβή κεηαθνξά ηεο πιεξνθνξίαο, απαιιαγκέλε από ηπρόλ
VFD10k pot
Analog Inputs
Digital Inputs
Start
Stop
ReverseJog
Common
Local VFD control panel
Serial/LAN Communication
Digital Outputs
Analog Outputs
Speed
Motor current
At speed
Running
At fault
Common
0-10V
0-10V
Speed Setpoint
VFD
Local VFD control panel
PLC Analog Outputs
Serial/LAN Communication
PLC Digital Outputs
Start
Stop
Reverse
Jog
Common
4-20mA
4-20mA
PLC Analog Inputs
PLC Digital Inputs
Common
At speed
Running
At fault
4-20mA
PO
WER
SUP
PLY
CP
UC
OM
MU
N.
DI C
AR
D
DO
CA
RD
AI C
AR
DA
O C
AR
DET
C
Programmable controller (PLC)
HMI – SCADA interface
Ethernet over TCP/IP or serial communication
VFD
Local VFD control panel
RJ-45 or serial (RS422-RS485) connection
EMCY stop
ΔΙΔΑΚΣΟΡΙΚΗ ΔΙΑΣΡΙΒΗ
ΠΤΡΙΔΩΝ Β. ΓΙΑΝΝΟΤΣΟ
131 Πξνζαξκνζηηθόο έιεγρνο ηνπνινγίαο ξπζκηζηώλ ζηξνθώλ γηα εμνηθνλόκεζε ελέξγεηαο ζε πινία
Πίλαθαο 3.1: ύθξηζε ραξαθηεξηζηηθώλ ηππηθώλ ζεηξηαθώλ πξνηύπσλ επηθνηλσλίαο
ρήκα 3.5: Σνπνινγία ζύλδεζεο κεηαηξνπέα γηα ηε κεηαηξνπή πξνηύπνπ επηθνηλσλίαο RS232 ζε RS485
ζνξύβνπο. Δηδηθόηεξα, ζηελ πεξίπησζε ζεηξηαθήο επηθνηλσλίαο, είλαη ζύλεζεο ην PLC ή ην HMI λα δηαζέηεη
ζεηξηαθή έμνδν πνπ ρξεζηκνπνηεί ην πξόηππν RS232, πνπ όπσο θαίλεηαη ζηνλ Πίλαθα 3.1 έρεη πεξηνξηζκέλε
εκβέιεηα. Γηα λα είλαη δπλαηή ε επηθνηλσλία κε ην ξπζκηζηή ζηξνθώλ ζε κεγαιύηεξε απόζηαζε αιιά θαη
γηα λα ππάξρεη νπηηθή απνκόλσζε κεηαμύ ηνπ PLC θαη ηνπ VFD, ρξεζηκνπνηείηαη κεηαηξνπέαο ζε RS422 ή
RS485, όπσο παξνπζηάδεηαη ζην ρ. 3.5. ηελ αξρή θαη ζην ηέινο ηνπ δηθηύνπ ηνπνζεηείηαη αληίζηαζε
120ohm γηα ηελ ειάηησζε ηνπ ζνξύβνπ. Δλαιιαθηηθά, ε επηθνηλσλία κπνξεί λα επηηεπρζεί δηθηπαθά κέζσ
TCP/IP εθαξκόδνληαο ην πξσηόθνιιν Ethernet ή Modbus εάλ ην PLC δηαζέηεη θάξηα κε δηθηπαθή έμνδν
RJ-45 [7]. Με απηόλ ηνλ ηξόπν, ε θάζε ζπζθεπή ζην δίθηπν ζεσξείηαη σο θόκβνο κε μερσξηζηή δηεύζπλζε
IP, ελώ θαζίζηαηαη δπλαηό λα ιακβάλεη όια ηα κελύκαηα πιεξνθνξίαο πνπ κεηαδίδνληαη ζην δίθηπν αιιά λα
ζηέιλεη απαληήζεηο ζε κελύκαηα πνπ αθνξνύλ κόλν ηε δηθή ηεο δηεύζπλζε IP, ελώ ε επηθνηλσλία
πξαγκαηνπνηείηαη ηαπηόρξνλα ζε πςειή ηαρύηεηα (~50kbps) απαιιαγκέλε από ζνξύβνπο.
3.1.2 Παξάκεηξνη ιεηηνπξγίαο θαη πξνζηαζία ξπζκηζηή ζηξνθώλ-θηλεηήξα
Ζ απνδνηηθή ιεηηνπξγία ηνπ ξπζκηζηή ζηξνθώλ εμαξηάηαη από ηελ παξακεηξνπνίεζε ηνπ ώζηε λα
ηθαλνπνηεί ηηο απαηηήζεηο ηεο εθάζηνηε εθαξκνγήο. Δθηόο από ηε ζσζηή ξύζκηζε ηνπ επηπέδνπ ηεο
νλνκαζηηθήο ηάζεο θαη ζπρλόηεηαο βάζεο (450V/60Hz γηα ην δίθηπν ηνπ πινίνπ), πνπ εμαζθαιίδεη ην
ζσζηό ιόγν V/f, νη ππόινηπεο παξάκεηξνη πνπ ρξεηάδεηαη λα ιεθζνύλ ππόςε είλαη ην νλνκαζηηθό ξεύκα
ιεηηνπξγίαο ηνπ θηλεηήξα θαη ην αληίζηνηρν κέγηζην όξην ξεύκαηνο θνξηίνπ Imax, ην νπνίν θαζνξίδεη θαη ηε
Shield Grounding
RS-485 DEVICERS-232 TO RS-485 CONVERTERRS-232 DEVICE
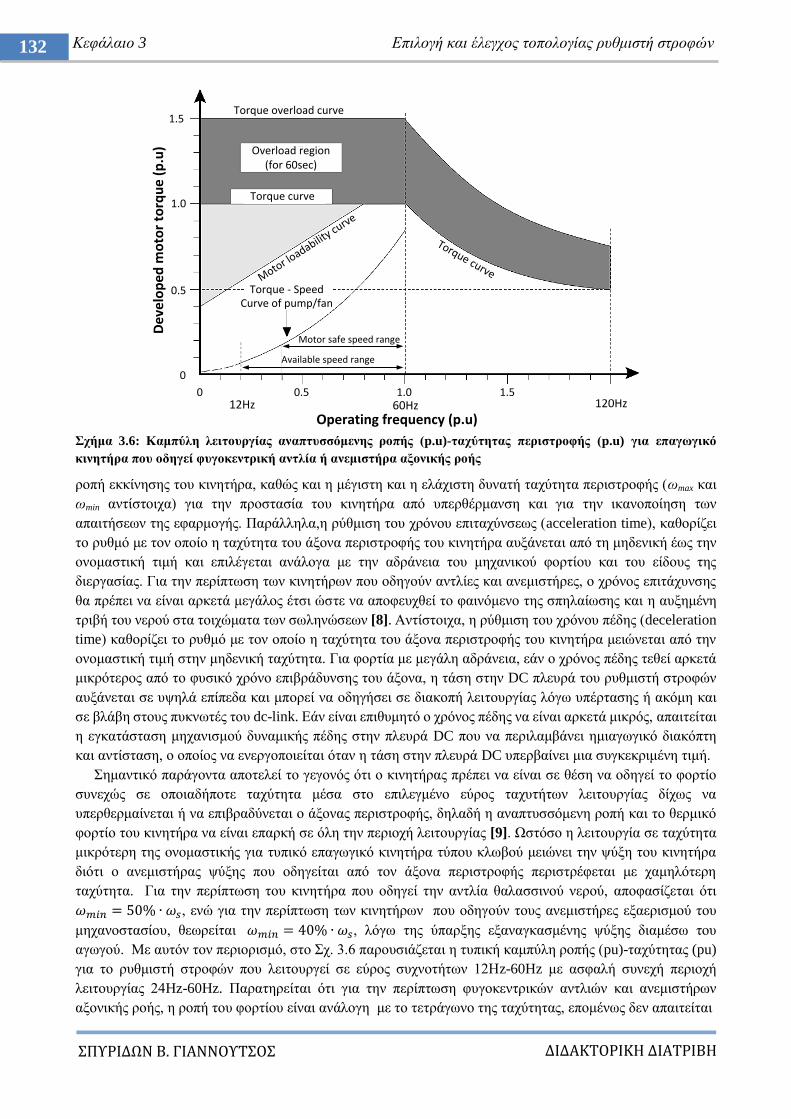
ΔΙΔΑΚΣΟΡΙΚΗ ΔΙΑΣΡΙΒΗ
ΠΤΡΙΔΩΝ Β. ΓΙΑΝΝΟΤΣΟ
132 Κεθάιαην 3 Δπηινγή θαη έιεγρνο ηνπνινγίαο ξπζκηζηή ζηξνθώλ
ρήκα 3.6: Κακπύιε ιεηηνπξγίαο αλαπηπζζόκελεο ξνπήο (p.u)-ηαρύηεηαο πεξηζηξνθήο (p.u) γηα επαγσγηθό
θηλεηήξα πνπ νδεγεί θπγνθεληξηθή αληιία ή αλεκηζηήξα αμνληθήο ξνήο
ξνπή εθθίλεζεο ηνπ θηλεηήξα, θαζώο θαη ε κέγηζηε θαη ε ειάρηζηε δπλαηή ηαρύηεηα πεξηζηξνθήο (σmax θαη
σmin αληίζηνηρα) γηα ηελ πξνζηαζία ηνπ θηλεηήξα από ππεξζέξκαλζε θαη γηα ηελ ηθαλνπνίεζε ησλ
απαηηήζεσλ ηεο εθαξκνγήο. Παξάιιεια,ε ξύζκηζε ηνπ ρξόλνπ επηηαρύλζεσο (acceleration time), θαζνξίδεη
ην ξπζκό κε ηνλ νπνίν ε ηαρύηεηα ηνπ άμνλα πεξηζηξνθήο ηνπ θηλεηήξα απμάλεηαη από ηε κεδεληθή έσο ηελ
νλνκαζηηθή ηηκή θαη επηιέγεηαη αλάινγα κε ηελ αδξάλεηα ηνπ κεραληθνύ θνξηίνπ θαη ηνπ είδνπο ηεο
δηεξγαζίαο. Γηα ηελ πεξίπησζε ησλ θηλεηήξσλ πνπ νδεγνύλ αληιίεο θαη αλεκηζηήξεο, ν ρξόλνο επηηάρπλζεο
ζα πξέπεη λα είλαη αξθεηά κεγάινο έηζη ώζηε λα απνθεπρζεί ην θαηλόκελν ηεο ζπειαίσζεο θαη ε απμεκέλε
ηξηβή ηνπ λεξνύ ζηα ηνηρώκαηα ησλ ζσιελώζεσλ [8]. Αληίζηνηρα, ε ξύζκηζε ηνπ ρξόλνπ πέδεο (deceleration
time) θαζνξίδεη ην ξπζκό κε ηνλ νπνίν ε ηαρύηεηα ηνπ άμνλα πεξηζηξνθήο ηνπ θηλεηήξα κεηώλεηαη από ηελ
νλνκαζηηθή ηηκή ζηελ κεδεληθή ηαρύηεηα. Γηα θνξηία κε κεγάιε αδξάλεηα, εάλ ν ρξόλνο πέδεο ηεζεί αξθεηά
κηθξόηεξνο από ην θπζηθό ρξόλν επηβξάδπλζεο ηνπ άμνλα, ε ηάζε ζηελ DC πιεπξά ηνπ ξπζκηζηή ζηξνθώλ
απμάλεηαη ζε πςειά επίπεδα θαη κπνξεί λα νδεγήζεη ζε δηαθνπή ιεηηνπξγίαο ιόγσ ππέξηαζεο ή αθόκε θαη
ζε βιάβε ζηνπο ππθλσηέο ηνπ dc-link. Δάλ είλαη επηζπκεηό ν ρξόλνο πέδεο λα είλαη αξθεηά κηθξόο, απαηηείηαη
ε εγθαηάζηαζε κεραληζκνύ δπλακηθήο πέδεο ζηελ πιεπξά DC πνπ λα πεξηιακβάλεη εκηαγσγηθό δηαθόπηε
θαη αληίζηαζε, ν νπνίνο λα ελεξγνπνηείηαη όηαλ ε ηάζε ζηελ πιεπξά DC ππεξβαίλεη κηα ζπγθεθξηκέλε ηηκή.
εκαληηθό παξάγνληα απνηειεί ην γεγνλόο όηη ν θηλεηήξαο πξέπεη λα είλαη ζε ζέζε λα νδεγεί ην θνξηίν
ζπλερώο ζε νπνηαδήπνηε ηαρύηεηα κέζα ζην επηιεγκέλν εύξνο ηαρπηήησλ ιεηηνπξγίαο δίρσο λα
ππεξζεξκαίλεηαη ή λα επηβξαδύλεηαη ν άμνλαο πεξηζηξνθήο, δειαδή ε αλαπηπζζόκελε ξνπή θαη ην ζεξκηθό
θνξηίν ηνπ θηλεηήξα λα είλαη επαξθή ζε όιε ηελ πεξηνρή ιεηηνπξγίαο [9]. Χζηόζν ε ιεηηνπξγία ζε ηαρύηεηα
κηθξόηεξε ηεο νλνκαζηηθήο γηα ηππηθό επαγσγηθό θηλεηήξα ηύπνπ θισβνύ κεηώλεη ηελ ςύμε ηνπ θηλεηήξα
δηόηη ν αλεκηζηήξαο ςύμεο πνπ νδεγείηαη από ηνλ άμνλα πεξηζηξνθήο πεξηζηξέθεηαη κε ρακειόηεξε
ηαρύηεηα. Γηα ηελ πεξίπησζε ηνπ θηλεηήξα πνπ νδεγεί ηελ αληιία ζαιαζζηλνύ λεξνύ, απνθαζίδεηαη όηη
, ελώ γηα ηελ πεξίπησζε ησλ θηλεηήξσλ πνπ νδεγνύλ ηνπο αλεκηζηήξεο εμαεξηζκνύ ηνπ
κεραλνζηαζίνπ, ζεσξείηαη , ιόγσ ηεο ύπαξμεο εμαλαγθαζκέλεο ςύμεο δηακέζσ ηνπ
αγσγνύ. Με απηόλ ηνλ πεξηνξηζκό, ζην ρ. 3.6 παξνπζηάδεηαη ε ηππηθή θακπύιε ξνπήο (pu)-ηαρύηεηαο (pu)
γηα ην ξπζκηζηή ζηξνθώλ πνπ ιεηηνπξγεί ζε εύξνο ζπρλνηήησλ 12Ζz-60Hz κε αζθαιή ζπλερή πεξηνρή
ιεηηνπξγίαο 24Hz-60Hz. Παξαηεξείηαη όηη γηα ηελ πεξίπησζε θπγνθεληξηθώλ αληιηώλ θαη αλεκηζηήξσλ
αμνληθήο ξνήο, ε ξνπή ηνπ θνξηίνπ είλαη αλάινγε κε ην ηεηξάγσλν ηεο ηαρύηεηαο, επνκέλσο δελ απαηηείηαη
12Hz 60Hz 120Hz
De
velo
pe
d m
oto
r to
rqu
e (
p.u
)
Operating frequency (p.u)
Available speed range
Motor safe speed range
Curve of pump/fanTorque - Speed
Torque curve
Overload region(for 60sec)
Torque overload curve
Motor loadabilit
y curve
Torque curve
1.5
1.0
0.5
0
0 0.5 1.0 1.5
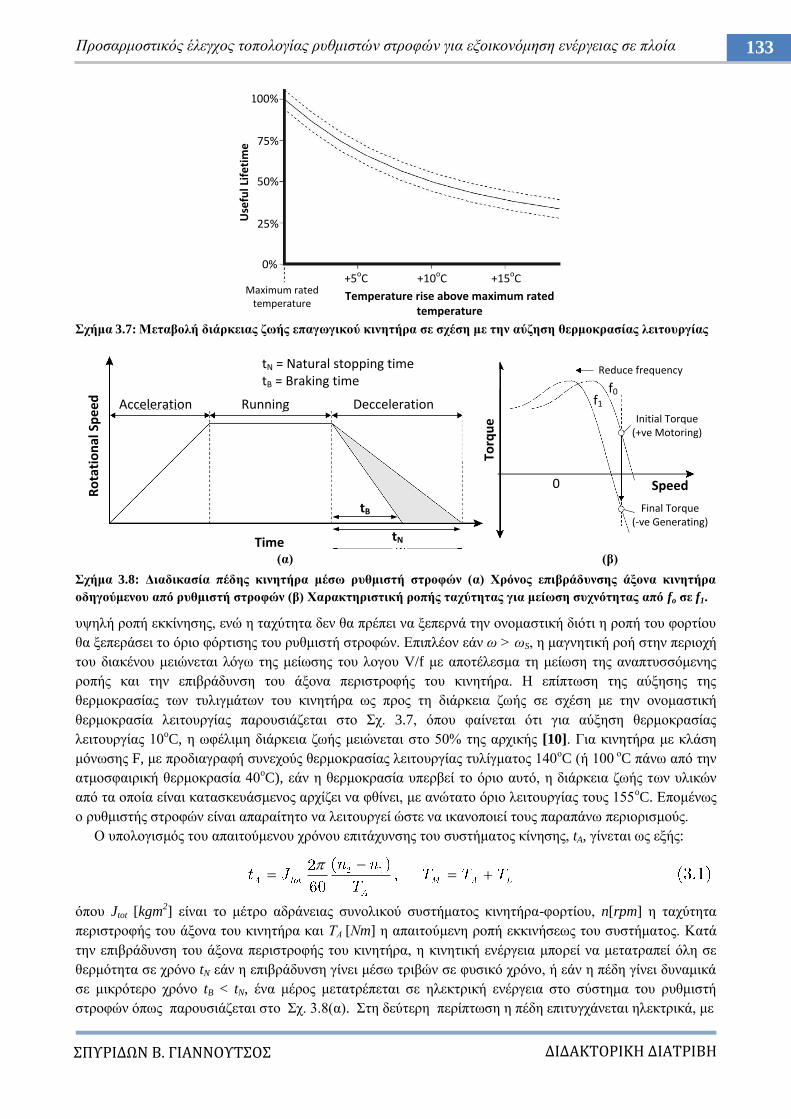
ΔΙΔΑΚΣΟΡΙΚΗ ΔΙΑΣΡΙΒΗ
ΠΤΡΙΔΩΝ Β. ΓΙΑΝΝΟΤΣΟ
133 Πξνζαξκνζηηθόο έιεγρνο ηνπνινγίαο ξπζκηζηώλ ζηξνθώλ γηα εμνηθνλόκεζε ελέξγεηαο ζε πινία
ρήκα 3.7: Μεηαβνιή δηάξθεηαο δσήο επαγσγηθνύ θηλεηήξα ζε ζρέζε κε ηελ αύδεζε ζεξκνθξαζίαο ιεηηνπξγίαο
(α) (β)
ρήκα 3.8: Γηαδηθαζία πέδεο θηλεηήξα κέζσ ξπζκηζηή ζηξνθώλ (α) Υξόλνο επηβξάδπλζεο άμνλα θηλεηήξα
νδεγνύκελνπ από ξπζκηζηή ζηξνθώλ (β) Υαξαθηεξηζηηθή ξνπήο ηαρύηεηαο γηα κείσζε ζπρλόηεηαο από fo ζε f1.
πςειή ξνπή εθθίλεζεο, ελώ ε ηαρύηεηα δελ ζα πξέπεη λα μεπεξλά ηελ νλνκαζηηθή δηόηη ε ξνπή ηνπ θνξηίνπ
ζα μεπεξάζεη ην όξην θόξηηζεο ηνπ ξπζκηζηή ζηξνθώλ. Δπηπιένλ εάλ σ > σS, ε καγλεηηθή ξνή ζηελ πεξηνρή
ηνπ δηαθέλνπ κεηώλεηαη ιόγσ ηεο κείσζεο ηνπ ινγνπ V/f κε απνηέιεζκα ηε κείσζε ηεο αλαπηπζζόκελεο
ξνπήο θαη ηελ επηβξάδπλζε ηνπ άμνλα πεξηζηξνθήο ηνπ θηλεηήξα. Ζ επίπησζε ηεο αύμεζεο ηεο
ζεξκνθξαζίαο ησλ ηπιηγκάησλ ηνπ θηλεηήξα σο πξνο ηε δηάξθεηα δσήο ζε ζρέζε κε ηελ νλνκαζηηθή
ζεξκνθξαζία ιεηηνπξγίαο παξνπζηάδεηαη ζην ρ. 3.7, όπνπ θαίλεηαη όηη γηα αύμεζε ζεξκνθξαζίαο
ιεηηνπξγίαο 10oC, ε σθέιηκε δηάξθεηα δσήο κεηώλεηαη ζην 50% ηεο αξρηθήο [10]. Γηα θηλεηήξα κε θιάζε
κόλσζεο F, κε πξνδηαγξαθή ζπλερνύο ζεξκνθξαζίαο ιεηηνπξγίαο ηπιίγκαηνο 140νC (ή 100
νC πάλσ από ηελ
αηκνζθαηξηθή ζεξκνθξαζία 40oC), εάλ ε ζεξκνθξαζία ππεξβεί ην όξην απηό, ε δηάξθεηα δσήο ησλ πιηθώλ
από ηα νπνία είλαη θαηαζθεπάζκελνο αξρίδεη λα θζίλεη, κε αλώηαην όξην ιεηηνπξγίαο ηνπο 155oC. Δπνκέλσο
ν ξπζκηζηήο ζηξνθώλ είλαη απαξαίηεην λα ιεηηνπξγεί ώζηε λα ηθαλνπνηεί ηνπο παξαπάλσ πεξηνξηζκνύο.
Ο ππνινγηζκόο ηνπ απαηηνύκελνπ ρξόλνπ επηηάρπλζεο ηνπ ζπζηήκαηνο θίλεζεο, tA, γίλεηαη σο εμήο:
όπνπ Jtot [kgm2] είλαη ην κέηξν αδξάλεηαο ζπλνιηθνύ ζπζηήκαηνο θηλεηήξα-θνξηίνπ, n[rpm] ε ηαρύηεηα
πεξηζηξνθήο ηνπ άμνλα ηνπ θηλεηήξα θαη ΣΑ [Νm] ε απαηηνύκελε ξνπή εθθηλήζεσο ηνπ ζπζηήκαηνο. Καηά
ηελ επηβξάδπλζε ηνπ άμνλα πεξηζηξνθήο ηνπ θηλεηήξα, ε θηλεηηθή ελέξγεηα κπνξεί λα κεηαηξαπεί όιε ζε
ζεξκόηεηα ζε ρξόλν tN εάλ ε επηβξάδπλζε γίλεη κέζσ ηξηβώλ ζε θπζηθό ρξόλν, ή εάλ ε πέδε γίλεη δπλακηθά
ζε κηθξόηεξν ρξόλν tB < tN, έλα κέξνο κεηαηξέπεηαη ζε ειεθηξηθή ελέξγεηα ζην ζύζηεκα ηνπ ξπζκηζηή
ζηξνθώλ όπσο παξνπζηάδεηαη ζην ρ. 3.8(α). ηε δεύηεξε πεξίπησζε ε πέδε επηηπγράλεηαη ειεθηξηθά, κε
0%
25%
50%
75%
100%
+5oC +10oC +15oCMaximum rated
temperatureTemperature rise above maximum rated
temperature
Use
ful L
ife
tim
e
Ro
tati
on
al S
pe
ed
tB
tN
Acceleration Running Decceleration
Time
tN = Natural stopping timetB = Braking time
Torq
ue
0
Reduce frequency
Initial Torque(+ve Motoring)
Final Torque(-ve Generating)
Speed
f1
f0
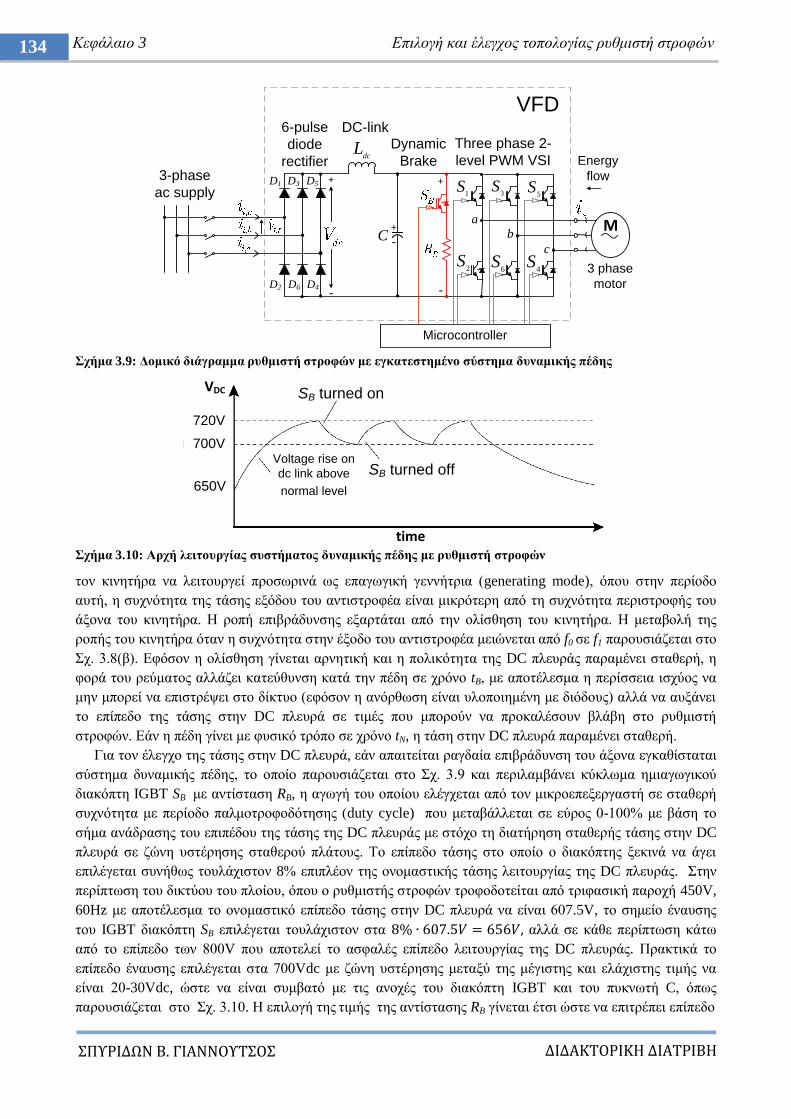
ΔΙΔΑΚΣΟΡΙΚΗ ΔΙΑΣΡΙΒΗ
ΠΤΡΙΔΩΝ Β. ΓΙΑΝΝΟΤΣΟ
134 Κεθάιαην 3 Δπηινγή θαη έιεγρνο ηνπνινγίαο ξπζκηζηή ζηξνθώλ
ρήκα 3.9: Γνκηθό δηάγξακκα ξπζκηζηή ζηξνθώλ κε εγθαηεζηεκέλν ζύζηεκα δπλακηθήο πέδεο
ρήκα 3.10: Αξρή ιεηηνπξγίαο ζπζηήκαηνο δπλακηθήο πέδεο κε ξπζκηζηή ζηξνθώλ
ηνλ θηλεηήξα λα ιεηηνπξγεί πξνζσξηλά σο επαγσγηθή γελλήηξηα (generating mode), όπνπ ζηελ πεξίνδν
απηή, ε ζπρλόηεηα ηεο ηάζεο εμόδνπ ηνπ αληηζηξνθέα είλαη κηθξόηεξε από ηε ζπρλόηεηα πεξηζηξνθήο ηνπ
άμνλα ηνπ θηλεηήξα. Ζ ξνπή επηβξάδπλζεο εμαξηάηαη από ηελ νιίζζεζε ηνπ θηλεηήξα. Ζ κεηαβνιή ηεο
ξνπήο ηνπ θηλεηήξα όηαλ ε ζπρλόηεηα ζηελ έμνδν ηνπ αληηζηξνθέα κεηώλεηαη από f0 ζε f1 παξνπζηάδεηαη ζην
ρ. 3.8(β). Δθόζνλ ε νιίζζεζε γίλεηαη αξλεηηθή θαη ε πνιηθόηεηα ηεο DC πιεπξάο παξακέλεη ζηαζεξή, ε
θνξά ηνπ ξεύκαηνο αιιάδεη θαηεύζπλζε θαηά ηελ πέδε ζε ρξόλν tB, κε απνηέιεζκα ε πεξίζζεηα ηζρύνο λα
κελ κπνξεί λα επηζηξέςεη ζην δίθηπν (εθόζνλ ε αλόξζσζε είλαη πινπνηεκέλε κε δηόδνπο) αιιά λα απμάλεη
ην επίπεδν ηεο ηάζεο ζηελ DC πιεπξά ζε ηηκέο πνπ κπνξνύλ λα πξνθαιέζνπλ βιάβε ζην ξπζκηζηή
ζηξνθώλ. Δάλ ε πέδε γίλεη κε θπζηθό ηξόπν ζε ρξόλν tN, ε ηάζε ζηελ DC πιεπξά παξακέλεη ζηαζεξή.
Γηα ηνλ έιεγρν ηεο ηάζεο ζηελ DC πιεπξά, εάλ απαηηείηαη ξαγδαία επηβξάδπλζε ηνπ άμνλα εγθαζίζηαηαη
ζύζηεκα δπλακηθήο πέδεο, ην νπνίν παξνπζηάδεηαη ζην ρ. 3.9 θαη πεξηιακβάλεη θύθισκα εκηαγσγηθνύ
δηαθόπηε IGBT SB κε αληίζηαζε RB, ε αγσγή ηνπ νπνίνπ ειέγρεηαη από ηνλ κηθξνεπεμεξγαζηή ζε ζηαζεξή
ζπρλόηεηα κε πεξίνδν παικνηξνθνδόηεζεο (duty cycle) πνπ κεηαβάιιεηαη ζε εύξνο 0-100% κε βάζε ην
ζήκα αλάδξαζεο ηνπ επηπέδνπ ηεο ηάζεο ηεο DC πιεπξάο κε ζηόρν ηε δηαηήξεζε ζηαζεξήο ηάζεο ζηελ DC
πιεπξά ζε δώλε πζηέξεζεο ζηαζεξνύ πιάηνπο. Σν επίπεδν ηάζεο ζην νπνίν ν δηαθόπηεο μεθηλά λα άγεη
επηιέγεηαη ζπλήζσο ηνπιάρηζηνλ 8% επηπιένλ ηεο νλνκαζηηθήο ηάζεο ιεηηνπξγίαο ηεο DC πιεπξάο. ηελ
πεξίπησζε ηνπ δηθηύνπ ηνπ πινίνπ, όπνπ ν ξπζκηζηήο ζηξνθώλ ηξνθνδνηείηαη από ηξηθαζηθή παξνρή 450V,
60Hz κε απνηέιεζκα ην νλνκαζηηθό επίπεδν ηάζεο ζηελ DC πιεπξά λα είλαη 607.5V, ην ζεκείν έλαπζεο
ηνπ IGBT δηαθόπηε SB επηιέγεηαη ηνπιάρηζηνλ ζηα αιιά ζε θάζε πεξίπησζε θάησ
από ην επίπεδν ησλ 800V πνπ απνηειεί ην αζθαιέο επίπεδν ιεηηνπξγίαο ηεο DC πιεπξάο. Πξαθηηθά ην
επίπεδν έλαπζεο επηιέγεηαη ζηα 700Vdc κε δώλε πζηέξεζεο κεηαμύ ηεο κέγηζηεο θαη ειάρηζηεο ηηκήο λα
είλαη 20-30Vdc, ώζηε λα είλαη ζπκβαηό κε ηηο αλνρέο ηνπ δηαθόπηε IGBT θαη ηνπ ππθλσηή C, όπσο
παξνπζηάδεηαη ζην ρ. 3.10. Ζ επηινγή ηεο ηηκήο ηεο αληίζηαζεο RB γίλεηαη έηζη ώζηε λα επηηξέπεη επίπεδν
+
-
Three phase 2-
level PWM VSI
3 phase
motor
6-pulse
diode
rectifier
VFD
+
-
Microcontroller
DC-link
3-phase
ac supply
dcL
1S
3S
5S
2S
6S
4S
Ca
b
c
D1 D3 D5
D2 D6 D4
Dynamic
Brake Energy
flow+
-
M
VDC
720V
700V
SB turned on
SB turned off 650V
Voltage rise on
dc link above
normal level
time
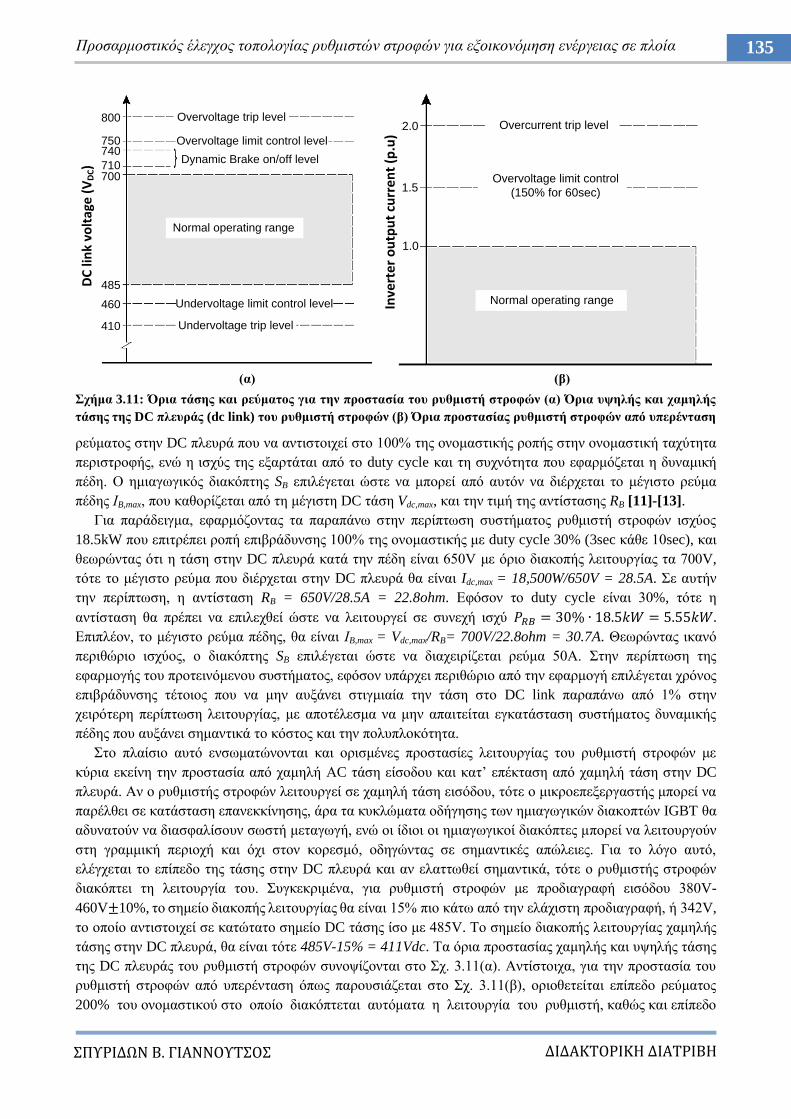
ΔΙΔΑΚΣΟΡΙΚΗ ΔΙΑΣΡΙΒΗ
ΠΤΡΙΔΩΝ Β. ΓΙΑΝΝΟΤΣΟ
135 Πξνζαξκνζηηθόο έιεγρνο ηνπνινγίαο ξπζκηζηώλ ζηξνθώλ γηα εμνηθνλόκεζε ελέξγεηαο ζε πινία
(α) (β)
ρήκα 3.11: Όξηα ηάζεο θαη ξεύκαηνο γηα ηελ πξνζηαζία ηνπ ξπζκηζηή ζηξνθώλ (α) Όξηα πςειήο θαη ρακειήο
ηάζεο ηεο DC πιεπξάο (dc link) ηνπ ξπζκηζηή ζηξνθώλ (β) Όξηα πξνζηαζίαο ξπζκηζηή ζηξνθώλ από ππεξέληαζε
ξεύκαηνο ζηελ DC πιεπξά πνπ λα αληηζηνηρεί ζην 100% ηεο νλνκαζηηθήο ξνπήο ζηελ νλνκαζηηθή ηαρύηεηα
πεξηζηξνθήο, ελώ ε ηζρύο ηεο εμαξηάηαη από ην duty cycle θαη ηε ζπρλόηεηα πνπ εθαξκόδεηαη ε δπλακηθή
πέδε. Ο εκηαγσγηθόο δηαθόπηεο SB επηιέγεηαη ώζηε λα κπνξεί από απηόλ λα δηέξρεηαη ην κέγηζην ξεύκα
πέδεο ΗB,max, πνπ θαζνξίδεηαη από ηε κέγηζηε DC ηάζε Vdc,max, θαη ηελ ηηκή ηεο αληίζηαζεο RB [11]-[13].
Γηα παξάδεηγκα, εθαξκόδνληαο ηα παξαπάλσ ζηελ πεξίπησζε ζπζηήκαηνο ξπζκηζηή ζηξνθώλ ηζρύνο
18.5kW πνπ επηηξέπεη ξνπή επηβξάδπλζεο 100% ηεο νλνκαζηηθήο κε duty cycle 30% (3sec θάζε 10sec), θαη
ζεσξώληαο όηη ε ηάζε ζηελ DC πιεπξά θαηά ηελ πέδε είλαη 650V κε όξην δηαθνπήο ιεηηνπξγίαο ηα 700V,
ηόηε ην κέγηζην ξεύκα πνπ δηέξρεηαη ζηελ DC πιεπξά ζα είλαη Idc,max = 18,500W/650V = 28.5A. ε απηήλ
ηελ πεξίπησζε, ε αληίζηαζε RB = 650V/28.5A = 22.8ohm. Δθόζνλ ην duty cycle είλαη 30%, ηόηε ε
αληίζηαζε ζα πξέπεη λα επηιερζεί ώζηε λα ιεηηνπξγεί ζε ζπλερή ηζρύ
Δπηπιένλ, ην κέγηζην ξεύκα πέδεο, ζα είλαη ΗB,max = Vdc,max/RB= 700V/22.8ohm = 30.7A. Θεσξώληαο ηθαλό
πεξηζώξην ηζρύνο, ν δηαθόπηεο SB επηιέγεηαη ώζηε λα δηαρεηξίδεηαη ξεύκα 50Α. ηελ πεξίπησζε ηεο
εθαξκνγήο ηνπ πξνηεηλόκελνπ ζπζηήκαηνο, εθόζνλ ππάξρεη πεξηζώξην από ηελ εθαξκνγή επηιέγεηαη ρξόλνο
επηβξάδπλζεο ηέηνηνο πνπ λα κελ απμάλεη ζηηγκηαία ηελ ηάζε ζην DC link παξαπάλσ από 1% ζηελ
ρεηξόηεξε πεξίπησζε ιεηηνπξγίαο, κε απνηέιεζκα λα κελ απαηηείηαη εγθαηάζηαζε ζπζηήκαηνο δπλακηθήο
πέδεο πνπ απμάλεη ζεκαληηθά ην θόζηνο θαη ηελ πνιππινθόηεηα.
ην πιαίζην απηό ελζσκαηώλνληαη θαη νξηζκέλεο πξνζηαζίεο ιεηηνπξγίαο ηνπ ξπζκηζηή ζηξνθώλ κε
θύξηα εθείλε ηελ πξνζηαζία από ρακειή ΑC ηάζε είζνδνπ θαη θαη‟ επέθηαζε από ρακειή ηάζε ζηελ DC
πιεπξά. Αλ ν ξπζκηζηήο ζηξνθώλ ιεηηνπξγεί ζε ρακειή ηάζε εηζόδνπ, ηόηε ν κηθξνεπεμεξγαζηήο κπνξεί λα
παξέιζεη ζε θαηάζηαζε επαλεθθίλεζεο, άξα ηα θπθιώκαηα νδήγεζεο ησλ εκηαγσγηθώλ δηαθνπηώλ IGBT ζα
αδπλαηνύλ λα δηαζθαιίζνπλ ζσζηή κεηαγσγή, ελώ νη ίδηνη νη εκηαγσγηθνί δηαθόπηεο κπνξεί λα ιεηηνπξγνύλ
ζηε γξακκηθή πεξηνρή θαη όρη ζηνλ θνξεζκό, νδεγώληαο ζε ζεκαληηθέο απώιεηεο. Γηα ην ιόγν απηό,
ειέγρεηαη ην επίπεδν ηεο ηάζεο ζηελ DC πιεπξά θαη αλ ειαηησζεί ζεκαληηθά, ηόηε ν ξπζκηζηήο ζηξνθώλ
δηαθόπηεη ηε ιεηηνπξγία ηνπ. πγθεθξηκέλα, γηα ξπζκηζηή ζηξνθώλ κε πξνδηαγξαθή εηζόδνπ 380V-
460V 10%, ην ζεκείν δηαθνπήο ιεηηνπξγίαο ζα είλαη 15% πην θάησ από ηελ ειάρηζηε πξνδηαγξαθή, ή 342V,
ην νπνίν αληηζηνηρεί ζε θαηώηαην ζεκείν DC ηάζεο ίζν κε 485V. Σν ζεκείν δηαθνπήο ιεηηνπξγίαο ρακειήο
ηάζεο ζηελ DC πιεπξά, ζα είλαη ηόηε 485V-15% = 411Vdc. Σα όξηα πξνζηαζίαο ρακειήο θαη πςειήο ηάζεο
ηεο DC πιεπξάο ηνπ ξπζκηζηή ζηξνθώλ ζπλνςίδνληαη ζην ρ. 3.11(α). Αληίζηνηρα, γηα ηελ πξνζηαζία ηνπ
ξπζκηζηή ζηξνθώλ από ππεξέληαζε όπσο παξνπζηάδεηαη ζην ρ. 3.11(β), νξηνζεηείηαη επίπεδν ξεύκαηνο
200% ηνπ νλνκαζηηθνύ ζην νπνίν δηαθόπηεηαη απηόκαηα ε ιεηηνπξγία ηνπ ξπζκηζηή, θαζώο θαη επίπεδν
DC
lin
k vo
ltag
e (
VD
C)
800
750740
710700
485
460
410
Overvoltage trip level
Overvoltage limit control level
Dynamic Brake on/off level
Normal operating range
Undervoltage limit control level
Undervoltage trip level
Inve
rte
r o
utp
ut
curr
en
t (p
.u)
2.0
1.5
1.0
Overcurrent trip level
Overvoltage limit control
(150% for 60sec)
Normal operating range
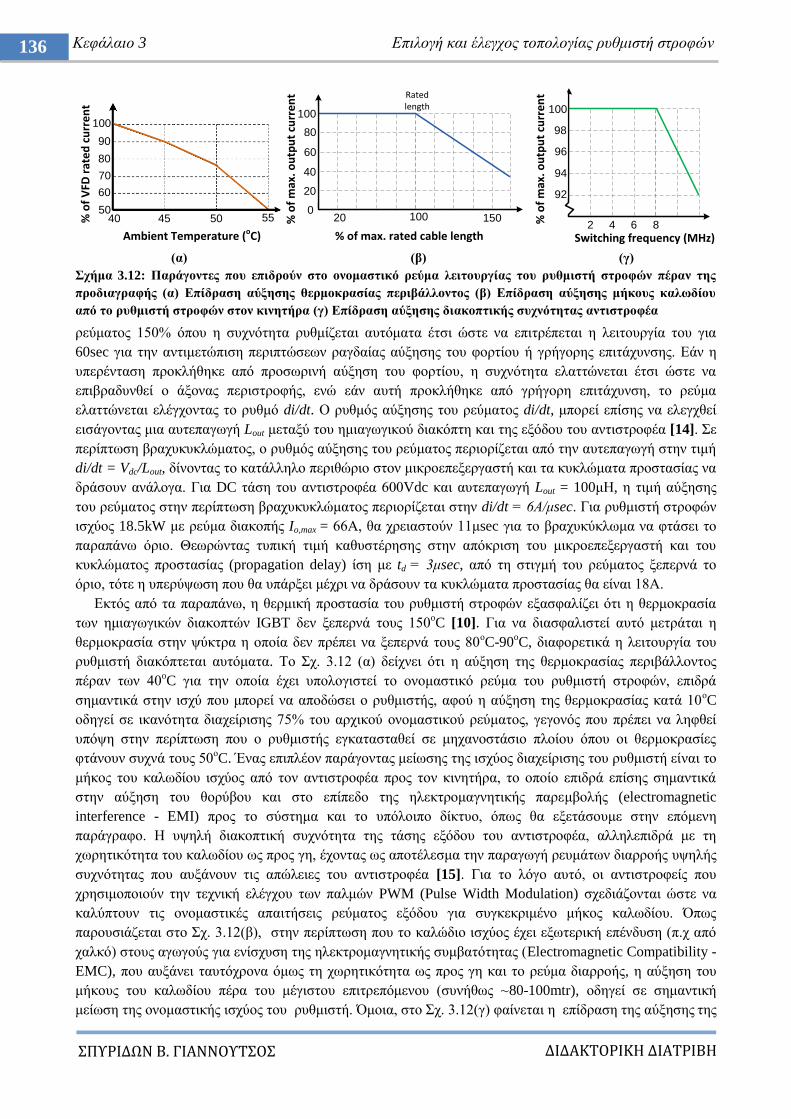
ΔΙΔΑΚΣΟΡΙΚΗ ΔΙΑΣΡΙΒΗ
ΠΤΡΙΔΩΝ Β. ΓΙΑΝΝΟΤΣΟ
136 Κεθάιαην 3 Δπηινγή θαη έιεγρνο ηνπνινγίαο ξπζκηζηή ζηξνθώλ
(α) (β) (γ)
ρήκα 3.12: Παξάγνληεο πνπ επηδξνύλ ζην νλνκαζηηθό ξεύκα ιεηηνπξγίαο ηνπ ξπζκηζηή ζηξνθώλ πέξαλ ηεο
πξνδηαγξαθήο (α) Δπίδξαζε αύμεζεο ζεξκνθξαζίαο πεξηβάιινληνο (β) Δπίδξαζε αύμεζεο κήθνπο θαισδίνπ
από ην ξπζκηζηή ζηξνθώλ ζηνλ θηλεηήξα (γ) Δπίδξαζε αύμεζεο δηαθνπηηθήο ζπρλόηεηαο αληηζηξνθέα
ξεύκαηνο 150% όπνπ ε ζπρλόηεηα ξπζκίδεηαη απηόκαηα έηζη ώζηε λα επηηξέπεηαη ε ιεηηνπξγία ηνπ γηα
60sec γηα ηελ αληηκεηώπηζε πεξηπηώζεσλ ξαγδαίαο αύμεζεο ηνπ θνξηίνπ ή γξήγνξεο επηηάρπλζεο. Δάλ ε
ππεξέληαζε πξνθιήζεθε από πξνζσξηλή αύμεζε ηνπ θνξηίνπ, ε ζπρλόηεηα ειαηηώλεηαη έηζη ώζηε λα
επηβξαδπλζεί ν άμνλαο πεξηζηξνθήο, ελώ εάλ απηή πξνθιήζεθε από γξήγνξε επηηάρπλζε, ην ξεύκα
ειαηηώλεηαη ειέγρνληαο ην ξπζκό di/dt. Ο ξπζκόο αύμεζεο ηνπ ξεύκαηνο di/dt, κπνξεί επίζεο λα ειεγρζεί
εηζάγνληαο κηα απηεπαγσγή Lout κεηαμύ ηνπ εκηαγσγηθνύ δηαθόπηε θαη ηεο εμόδνπ ηνπ αληηζηξνθέα [14]. ε
πεξίπησζε βξαρπθπθιώκαηνο, ν ξπζκόο αύμεζεο ηνπ ξεύκαηνο πεξηνξίδεηαη από ηελ απηεπαγσγή ζηελ ηηκή
di/dt = Vdc/Lout, δίλνληαο ην θαηάιιειν πεξηζώξην ζηνλ κηθξνεπεμεξγαζηή θαη ηα θπθιώκαηα πξνζηαζίαο λα
δξάζνπλ αλάινγα. Γηα DC ηάζε ηνπ αληηζηξνθέα 600Vdc θαη απηεπαγσγή Lout = 100κΖ, ε ηηκή αύμεζεο
ηνπ ξεύκαηνο ζηελ πεξίπησζε βξαρπθπθιώκαηνο πεξηνξίδεηαη ζηελ di/dt = 6Α/κsec. Γηα ξπζκηζηή ζηξνθώλ
ηζρύνο 18.5kW κε ξεύκα δηαθνπήο Io,max = 66Α, ζα ρξεηαζηνύλ 11κsec γηα ην βξαρπθύθισκα λα θηάζεη ην
παξαπάλσ όξην. Θεσξώληαο ηππηθή ηηκή θαζπζηέξεζεο ζηελ απόθξηζε ηνπ κηθξνεπεμεξγαζηή θαη ηνπ
θπθιώκαηνο πξνζηαζίαο (propagation delay) ίζε κε td = 3κsec, από ηε ζηηγκή ηνπ ξεύκαηνο μεπεξλά ην
όξην, ηόηε ε ππεξύςσζε πνπ ζα ππάξμεη κέρξη λα δξάζνπλ ηα θπθιώκαηα πξνζηαζίαο ζα είλαη 18Α.
Δθηόο από ηα παξαπάλσ, ε ζεξκηθή πξνζηαζία ηνπ ξπζκηζηή ζηξνθώλ εμαζθαιίδεη όηη ε ζεξκνθξαζία
ησλ εκηαγσγηθώλ δηαθνπηώλ IGBT δελ μεπεξλά ηνπο 150oC [10]. Γηα λα δηαζθαιηζηεί απηό κεηξάηαη ε
ζεξκνθξαζία ζηελ ςύθηξα ε νπνία δελ πξέπεη λα μεπεξλά ηνπο 80νC-90
oC, δηαθνξεηηθά ε ιεηηνπξγία ηνπ
ξπζκηζηή δηαθόπηεηαη απηόκαηα. Σν ρ. 3.12 (α) δείρλεη όηη ε αύμεζε ηεο ζεξκνθξαζίαο πεξηβάιινληνο
πέξαλ ησλ 40oC γηα ηελ νπνία έρεη ππνινγηζηεί ην νλνκαζηηθό ξεύκα ηνπ ξπζκηζηή ζηξνθώλ, επηδξά
ζεκαληηθά ζηελ ηζρύ πνπ κπνξεί λα απνδώζεη ν ξπζκηζηήο, αθνύ ε αύμεζε ηεο ζεξκνθξαζίαο θαηά 10νC
νδεγεί ζε ηθαλόηεηα δηαρείξηζεο 75% ηνπ αξρηθνύ νλνκαζηηθνύ ξεύκαηνο, γεγνλόο πνπ πξέπεη λα ιεθζεί
ππόςε ζηελ πεξίπησζε πνπ ν ξπζκηζηήο εγθαηαζηαζεί ζε κεραλνζηάζην πινίνπ όπνπ νη ζεξκνθξαζίεο
θηάλνπλ ζπρλά ηνπο 50νC. Έλαο επηπιένλ παξάγνληαο κείσζεο ηεο ηζρύνο δηαρείξηζεο ηνπ ξπζκηζηή είλαη ην
κήθνο ηνπ θαισδίνπ ηζρύνο από ηνλ αληηζηξνθέα πξνο ηνλ θηλεηήξα, ην νπνίν επηδξά επίζεο ζεκαληηθά
ζηελ αύμεζε ηνπ ζνξύβνπ θαη ζην επίπεδν ηεο ειεθηξνκαγλεηηθήο παξεκβνιήο (electromagnetic
interference - EMI) πξνο ην ζύζηεκα θαη ην ππόινηπν δίθηπν, όπσο ζα εμεηάζνπκε ζηελ επόκελε
παξάγξαθν. Ζ πςειή δηαθνπηηθή ζπρλόηεηα ηεο ηάζεο εμόδνπ ηνπ αληηζηξνθέα, αιιειεπηδξά κε ηε
ρσξεηηθόηεηα ηνπ θαισδίνπ σο πξνο γε, έρνληαο σο απνηέιεζκα ηελ παξαγσγή ξεπκάησλ δηαξξνήο πςειήο
ζπρλόηεηαο πνπ απμάλνπλ ηηο απώιεηεο ηνπ αληηζηξνθέα [15]. Γηα ην ιόγν απηό, νη αληηζηξνθείο πνπ
ρξεζηκνπνηνύλ ηελ ηερληθή ειέγρνπ ησλ παικώλ PWM (Pulse Width Modulation) ζρεδηάδνληαη ώζηε λα
θαιύπηνπλ ηηο νλνκαζηηθέο απαηηήζεηο ξεύκαηνο εμόδνπ γηα ζπγθεθξηκέλν κήθνο θαισδίνπ. Όπσο
παξνπζηάδεηαη ζην ρ. 3.12(β), ζηελ πεξίπησζε πνπ ην θαιώδην ηζρύνο έρεη εμσηεξηθή επέλδπζε (π.ρ από
ραιθό) ζηνπο αγσγνύο γηα ελίζρπζε ηεο ειεθηξνκαγλεηηθήο ζπκβαηόηεηαο (Electromagnetic Compatibility -
EMC), πνπ απμάλεη ηαπηόρξνλα όκσο ηε ρσξεηηθόηεηα σο πξνο γε θαη ην ξεύκα δηαξξνήο, ε αύμεζε ηνπ
κήθνπο ηνπ θαισδίνπ πέξα ηνπ κέγηζηνπ επηηξεπόκελνπ (ζπλήζσο ~80-100mtr), νδεγεί ζε ζεκαληηθή
κείσζε ηεο νλνκαζηηθήο ηζρύνο ηνπ ξπζκηζηή. Όκνηα, ζην ρ. 3.12(γ) θαίλεηαη ε επίδξαζε ηεο αύμεζεο ηεο
% o
f V
FD r
ate
d c
urr
en
t
100
Ambient Temperature (oC)
90
80
70
60
5040 45 50 55 20 100 150%
of
max
. ou
tpu
t cu
rre
nt
100
80
60
40
20
0
% of max. rated cable length
Rated length 100
98
96
94
92
2 4 6 8% o
f m
ax. o
utp
ut
curr
en
t
Switching frequency (MHz)
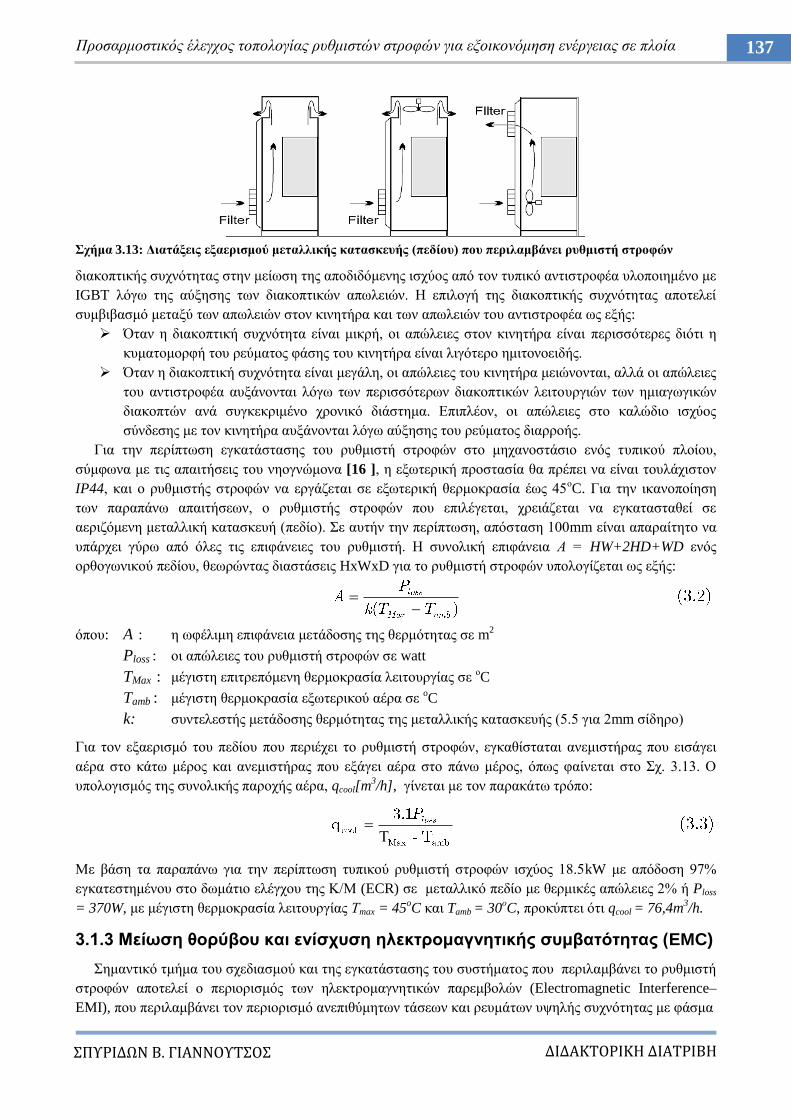
ΔΙΔΑΚΣΟΡΙΚΗ ΔΙΑΣΡΙΒΗ
ΠΤΡΙΔΩΝ Β. ΓΙΑΝΝΟΤΣΟ
137 Πξνζαξκνζηηθόο έιεγρνο ηνπνινγίαο ξπζκηζηώλ ζηξνθώλ γηα εμνηθνλόκεζε ελέξγεηαο ζε πινία
ρήκα 3.13: Γηαηάμεηο εμαεξηζκνύ κεηαιιηθήο θαηαζθεπήο (πεδίνπ) πνπ πεξηιακβάλεη ξπζκηζηή ζηξνθώλ
δηαθνπηηθήο ζπρλόηεηαο ζηελ κείσζε ηεο απνδηδόκελεο ηζρύνο από ηνλ ηππηθό αληηζηξνθέα πινπνηεκέλν κε
IGBT ιόγσ ηεο αύμεζεο ησλ δηαθνπηηθώλ απσιεηώλ. Ζ επηινγή ηεο δηαθνπηηθήο ζπρλόηεηαο απνηειεί
ζπκβηβαζκό κεηαμύ ησλ απσιεηώλ ζηνλ θηλεηήξα θαη ησλ απσιεηώλ ηνπ αληηζηξνθέα σο εμήο:
Όηαλ ε δηαθνπηηθή ζπρλόηεηα είλαη κηθξή, νη απώιεηεο ζηνλ θηλεηήξα είλαη πεξηζζόηεξεο δηόηη ε
θπκαηνκνξθή ηνπ ξεύκαηνο θάζεο ηνπ θηλεηήξα είλαη ιηγόηεξν εκηηνλνεηδήο.
Όηαλ ε δηαθνπηηθή ζπρλόηεηα είλαη κεγάιε, νη απώιεηεο ηνπ θηλεηήξα κεηώλνληαη, αιιά νη απώιεηεο
ηνπ αληηζηξνθέα απμάλνληαη ιόγσ ησλ πεξηζζόηεξσλ δηαθνπηηθώλ ιεηηνπξγηώλ ησλ εκηαγσγηθώλ
δηαθνπηώλ αλά ζπγθεθξηκέλν ρξνληθό δηάζηεκα. Δπηπιένλ, νη απώιεηεο ζην θαιώδην ηζρύνο
ζύλδεζεο κε ηνλ θηλεηήξα απμάλνληαη ιόγσ αύμεζεο ηνπ ξεύκαηνο δηαξξνήο.
Γηα ηελ πεξίπησζε εγθαηάζηαζεο ηνπ ξπζκηζηή ζηξνθώλ ζην κεραλνζηάζην ελόο ηππηθνύ πινίνπ,
ζύκθσλα κε ηηο απαηηήζεηο ηνπ λενγλώκνλα [16 ], ε εμσηεξηθή πξνζηαζία ζα πξέπεη λα είλαη ηνπιάρηζηνλ
IP44, θαη ν ξπζκηζηήο ζηξνθώλ λα εξγάδεηαη ζε εμσηεξηθή ζεξκνθξαζία έσο 45νC. Γηα ηελ ηθαλνπνίεζε
ησλ παξαπάλσ απαηηήζεσλ, ν ξπζκηζηήο ζηξνθώλ πνπ επηιέγεηαη, ρξεηάδεηαη λα εγθαηαζηαζεί ζε
αεξηδόκελε κεηαιιηθή θαηαζθεπή (πεδίν). ε απηήλ ηελ πεξίπησζε, απόζηαζε 100mm είλαη απαξαίηεην λα
ππάξρεη γύξσ από όιεο ηηο επηθάλεηεο ηνπ ξπζκηζηή. Ζ ζπλνιηθή επηθάλεηα Α = HW+2HD+WD ελόο
νξζνγσληθνύ πεδίνπ, ζεσξώληαο δηαζηάζεηο HxWxD γηα ην ξπζκηζηή ζηξνθώλ ππνινγίδεηαη σο εμήο:
όπνπ: A : ε σθέιηκε επηθάλεηα κεηάδνζεο ηεο ζεξκόηεηαο ζε m2
Ploss : νη απώιεηεο ηνπ ξπζκηζηή ζηξνθώλ ζε watt
TMax : κέγηζηε επηηξεπόκελε ζεξκνθξαζία ιεηηνπξγίαο ζε νC
Tamb : κέγηζηε ζεξκνθξαζία εμσηεξηθνύ αέξα ζε oC
k: ζπληειεζηήο κεηάδνζεο ζεξκόηεηαο ηεο κεηαιιηθήο θαηαζθεπήο (5.5 γηα 2mm ζίδεξν)
Γηα ηνλ εμαεξηζκό ηνπ πεδίνπ πνπ πεξηέρεη ην ξπζκηζηή ζηξνθώλ, εγθαζίζηαηαη αλεκηζηήξαο πνπ εηζάγεη
αέξα ζην θάησ κέξνο θαη αλεκηζηήξαο πνπ εμάγεη αέξα ζην πάλσ κέξνο, όπσο θαίλεηαη ζην ρ. 3.13. Ο
ππνινγηζκόο ηεο ζπλνιηθήο παξνρήο αέξα, qcool[m3/h], γίλεηαη κε ηνλ παξαθάησ ηξόπν:
Με βάζε ηα παξαπάλσ γηα ηελ πεξίπησζε ηππηθνύ ξπζκηζηή ζηξνθώλ ηζρύνο 18.5kW κε απόδνζε 97%
εγθαηεζηεκέλνπ ζην δσκάηην ειέγρνπ ηεο Κ/Μ (ECR) ζε κεηαιιηθό πεδίν κε ζεξκηθέο απώιεηεο 2% ή Ploss
= 370W, κε κέγηζηε ζεξκνθξαζία ιεηηνπξγίαο Σmax = 45oC θαη Tamb = 30
νC, πξνθύπηεη όηη qcool = 76,4m
3/h.
3.1.3 Μείσζε ζνξύβνπ θαη ελίζρπζε ειεθηξνκαγλεηηθήο ζπκβαηόηεηαο (EMC)
εκαληηθό ηκήκα ηνπ ζρεδηαζκνύ θαη ηεο εγθαηάζηαζεο ηνπ ζπζηήκαηνο πνπ πεξηιακβάλεη ην ξπζκηζηή
ζηξνθώλ απνηειεί ν πεξηνξηζκόο ησλ ειεθηξνκαγλεηηθώλ παξεκβνιώλ (Electromagnetic Interference–
EMI), πνπ πεξηιακβάλεη ηνλ πεξηνξηζκό αλεπηζύκεησλ ηάζεσλ θαη ξεπκάησλ πςειήο ζπρλόηεηαο κε θάζκα
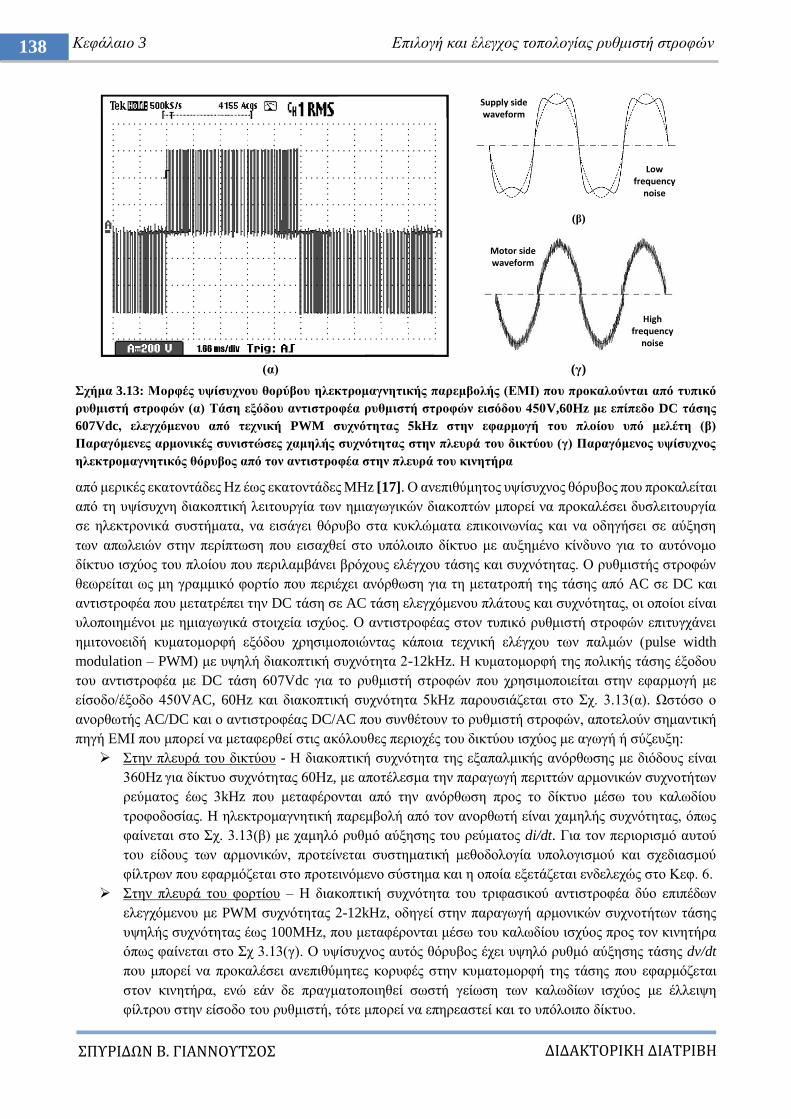
ΔΙΔΑΚΣΟΡΙΚΗ ΔΙΑΣΡΙΒΗ
ΠΤΡΙΔΩΝ Β. ΓΙΑΝΝΟΤΣΟ
138 Κεθάιαην 3 Δπηινγή θαη έιεγρνο ηνπνινγίαο ξπζκηζηή ζηξνθώλ
(α) (γ)
ρήκα 3.13: Μνξθέο πςίζπρλνπ ζνξύβνπ ειεθηξνκαγλεηηθήο παξεκβνιήο (ΔΜΙ) πνπ πξνθαινύληαη από ηππηθό
ξπζκηζηή ζηξνθώλ (α) Σάζε εμόδνπ αληηζηξνθέα ξπζκηζηή ζηξνθώλ εηζόδνπ 450V,60Hz κε επίπεδν DC ηάζεο
607Vdc, ειεγρόκελνπ από ηερληθή PWM ζπρλόηεηαο 5kHz ζηελ εθαξκνγή ηνπ πινίνπ ππό κειέηε (β)
Παξαγόκελεο αξκνληθέο ζπληζηώζεο ρακειήο ζπρλόηεηαο ζηελ πιεπξά ηνπ δηθηύνπ (γ) Παξαγόκελνο πςίζπρλνο
ειεθηξνκαγλεηηθόο ζόξπβνο από ηνλ αληηζηξνθέα ζηελ πιεπξά ηνπ θηλεηήξα
από κεξηθέο εθαηνληάδεο Ζz έσο εθαηνληάδεο MHz [17]. Ο αλεπηζύκεηνο πςίζπρλνο ζόξπβνο πνπ πξνθαιείηαη
από ηε πςίζπρλε δηαθνπηηθή ιεηηνπξγία ησλ εκηαγσγηθώλ δηαθνπηώλ κπνξεί λα πξνθαιέζεη δπζιεηηνπξγία
ζε ειεθηξνληθά ζπζηήκαηα, λα εηζάγεη ζόξπβν ζηα θπθιώκαηα επηθνηλσλίαο θαη λα νδεγήζεη ζε αύμεζε
ησλ απσιεηώλ ζηελ πεξίπησζε πνπ εηζαρζεί ζην ππόινηπν δίθηπν κε απμεκέλν θίλδπλν γηα ην απηόλνκν
δίθηπν ηζρύνο ηνπ πινίνπ πνπ πεξηιακβάλεη βξόρνπο ειέγρνπ ηάζεο θαη ζπρλόηεηαο. Ο ξπζκηζηήο ζηξνθώλ
ζεσξείηαη σο κε γξακκηθό θνξηίν πνπ πεξηέρεη αλόξζσζε γηα ηε κεηαηξνπή ηεο ηάζεο από AC ζε DC θαη
αληηζηξνθέα πνπ κεηαηξέπεη ηελ DC ηάζε ζε AC ηάζε ειεγρόκελνπ πιάηνπο θαη ζπρλόηεηαο, νη νπνίνη είλαη
πινπνηεκέλνη κε εκηαγσγηθά ζηνηρεία ηζρύνο. Ο αληηζηξνθέαο ζηνλ ηππηθό ξπζκηζηή ζηξνθώλ επηηπγράλεη
εκηηνλνεηδή θπκαηνκνξθή εμόδνπ ρξεζηκνπνηώληαο θάπνηα ηερληθή ειέγρνπ ησλ παικώλ (pulse width
modulation – PWM) κε πςειή δηαθνπηηθή ζπρλόηεηα 2-12kHz. Ζ θπκαηνκνξθή ηεο πνιηθήο ηάζεο έμνδνπ
ηνπ αληηζηξνθέα κε DC ηάζε 607Vdc γηα ην ξπζκηζηή ζηξνθώλ πνπ ρξεζηκνπνηείηαη ζηελ εθαξκνγή κε
είζνδν/έμνδν 450VAC, 60Hz θαη δηαθνπηηθή ζπρλόηεηα 5kHz παξνπζηάδεηαη ζην ρ. 3.13(α). Χζηόζν ν
αλνξζσηήο AC/DC θαη ν αληηζηξνθέαο DC/ΑC πνπ ζπλζέηνπλ ην ξπζκηζηή ζηξνθώλ, απνηεινύλ ζεκαληηθή
πεγή ΔΜΗ πνπ κπνξεί λα κεηαθεξζεί ζηηο αθόινπζεο πεξηνρέο ηνπ δηθηύνπ ηζρύνο κε αγσγή ή ζύδεπμε:
ηελ πιεπξά ηνπ δηθηύνπ - Ζ δηαθνπηηθή ζπρλόηεηα ηεο εμαπαικηθήο αλόξζσζεο κε δηόδνπο είλαη
360Ζz γηα δίθηπν ζπρλόηεηαο 60Ζz, κε απνηέιεζκα ηελ παξαγσγή πεξηηηώλ αξκνληθώλ ζπρλνηήησλ
ξεύκαηνο έσο 3kHz πνπ κεηαθέξνληαη από ηελ αλόξζσζε πξνο ην δίθηπν κέζσ ηνπ θαισδίνπ
ηξνθνδνζίαο. Ζ ειεθηξνκαγλεηηθή παξεκβνιή από ηνλ αλνξζσηή είλαη ρακειήο ζπρλόηεηαο, όπσο
θαίλεηαη ζην ρ. 3.13(β) κε ρακειό ξπζκό αύμεζεο ηνπ ξεύκαηνο di/dt. Γηα ηνλ πεξηνξηζκό απηνύ
ηνπ είδνπο ησλ αξκνληθώλ, πξνηείλεηαη ζπζηεκαηηθή κεζνδνινγία ππνινγηζκνύ θαη ζρεδηαζκνύ
θίιηξσλ πνπ εθαξκόδεηαη ζην πξνηεηλόκελν ζύζηεκα θαη ε νπνία εμεηάδεηαη ελδειερώο ζην Κεθ. 6.
ηελ πιεπξά ηνπ θνξηίνπ – Ζ δηαθνπηηθή ζπρλόηεηα ηνπ ηξηθαζηθνύ αληηζηξνθέα δύν επηπέδσλ
ειεγρόκελνπ κε PWM ζπρλόηεηαο 2-12kHz, νδεγεί ζηελ παξαγσγή αξκνληθώλ ζπρλνηήησλ ηάζεο
πςειήο ζπρλόηεηαο έσο 100ΜHz, πνπ κεηαθέξνληαη κέζσ ηνπ θαισδίνπ ηζρύνο πξνο ηνλ θηλεηήξα
όπσο θαίλεηαη ζην ρ 3.13(γ). Ο πςίζπρλνο απηόο ζόξπβνο έρεη πςειό ξπζκό αύμεζεο ηάζεο dv/dt
πνπ κπνξεί λα πξνθαιέζεη αλεπηζύκεηεο θνξπθέο ζηελ θπκαηνκνξθή ηεο ηάζεο πνπ εθαξκόδεηαη
ζηνλ θηλεηήξα, ελώ εάλ δε πξαγκαηνπνηεζεί ζσζηή γείσζε ησλ θαισδίσλ ηζρύνο κε έιιεηςε
θίιηξνπ ζηελ είζνδν ηνπ ξπζκηζηή, ηόηε κπνξεί λα επεξεαζηεί θαη ην ππόινηπν δίθηπν.
Supply side waveform
Low frequency
noise
Highfrequency
noise
Motor side waveform
(β)
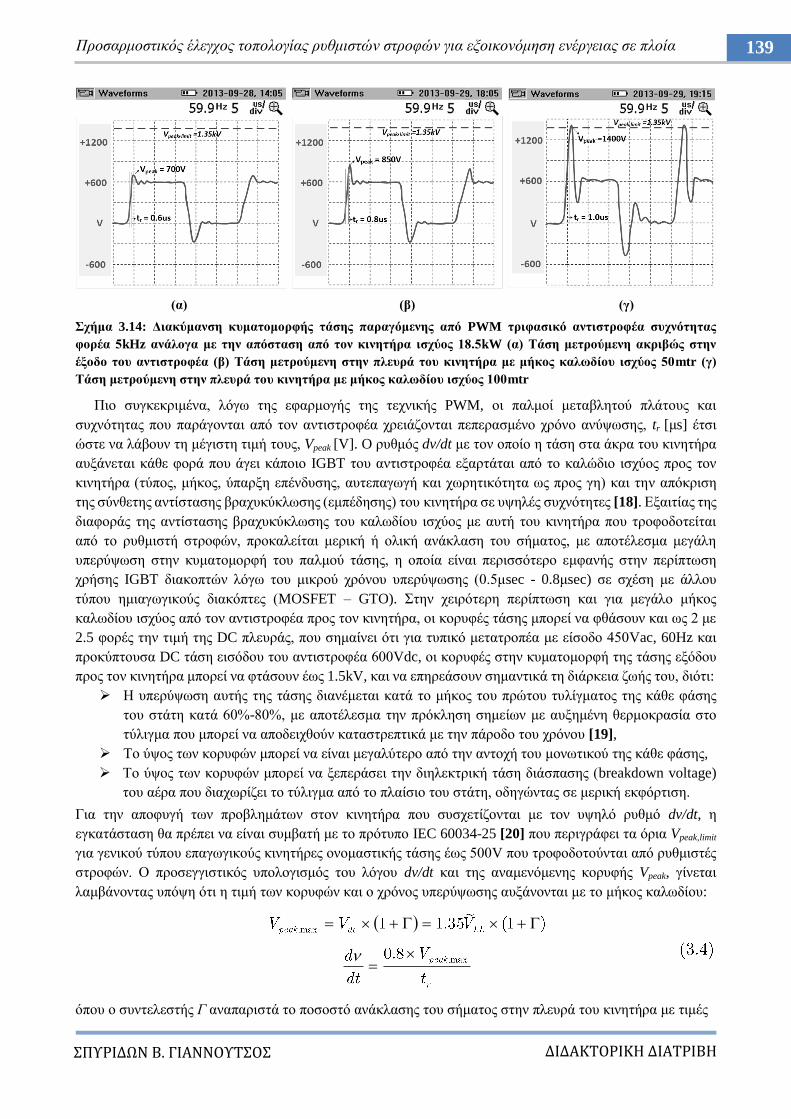
ΔΙΔΑΚΣΟΡΙΚΗ ΔΙΑΣΡΙΒΗ
ΠΤΡΙΔΩΝ Β. ΓΙΑΝΝΟΤΣΟ
139 Πξνζαξκνζηηθόο έιεγρνο ηνπνινγίαο ξπζκηζηώλ ζηξνθώλ γηα εμνηθνλόκεζε ελέξγεηαο ζε πινία
(α) (β) (γ)
ρήκα 3.14: Γηαθύκαλζε θπκαηνκνξθήο ηάζεο παξαγόκελεο από PWM ηξηθαζηθό αληηζηξνθέα ζπρλόηεηαο
θνξέα 5kHz αλάινγα κε ηελ απόζηαζε από ηνλ θηλεηήξα ηζρύνο 18.5kW (α) Σάζε κεηξνύκελε αθξηβώο ζηελ
έμνδν ηνπ αληηζηξνθέα (β) Σάζε κεηξνύκελε ζηελ πιεπξά ηνπ θηλεηήξα κε κήθνο θαισδίνπ ηζρύνο 50mtr (γ)
Σάζε κεηξνύκελε ζηελ πιεπξά ηνπ θηλεηήξα κε κήθνο θαισδίνπ ηζρύνο 100mtr
Πην ζπγθεθξηκέλα, ιόγσ ηεο εθαξκνγήο ηεο ηερληθήο PWM, νη παικνί κεηαβιεηνύ πιάηνπο θαη
ζπρλόηεηαο πνπ παξάγνληαη από ηνλ αληηζηξνθέα ρξεηάδνληαη πεπεξαζκέλν ρξόλν αλύςσζεο, tr [κs] έηζη
ώζηε λα ιάβνπλ ηε κέγηζηε ηηκή ηνπο, Vpeak [V]. O ξπζκόο dv/dt κε ηνλ νπνίν ε ηάζε ζηα άθξα ηνπ θηλεηήξα
απμάλεηαη θάζε θνξά πνπ άγεη θάπνην IGBT ηνπ αληηζηξνθέα εμαξηάηαη από ην θαιώδην ηζρύνο πξνο ηνλ
θηλεηήξα (ηύπνο, κήθνο, ύπαξμε επέλδπζεο, απηεπαγσγή θαη ρσξεηηθόηεηα σο πξνο γε) θαη ηελ απόθξηζε
ηεο ζύλζεηεο αληίζηαζεο βξαρπθύθισζεο (εκπέδεζεο) ηνπ θηλεηήξα ζε πςειέο ζπρλόηεηεο [18]. Δμαηηίαο ηεο
δηαθνξάο ηεο αληίζηαζεο βξαρπθύθισζεο ηνπ θαισδίνπ ηζρύνο κε απηή ηνπ θηλεηήξα πνπ ηξνθνδνηείηαη
από ην ξπζκηζηή ζηξνθώλ, πξνθαιείηαη κεξηθή ή νιηθή αλάθιαζε ηνπ ζήκαηνο, κε απνηέιεζκα κεγάιε
ππεξύςσζε ζηελ θπκαηνκνξθή ηνπ παικνύ ηάζεο, ε νπνία είλαη πεξηζζόηεξν εκθαλήο ζηελ πεξίπησζε
ρξήζεο IGBT δηαθνπηώλ ιόγσ ηνπ κηθξνύ ρξόλνπ ππεξύςσζεο (0.5κsec - 0.8κsec) ζε ζρέζε κε άιινπ
ηύπνπ εκηαγσγηθνύο δηαθόπηεο (MOSFET – GTO). ηελ ρεηξόηεξε πεξίπησζε θαη γηα κεγάιν κήθνο
θαισδίνπ ηζρύνο από ηνλ αληηζηξνθέα πξνο ηνλ θηλεηήξα, νη θνξπθέο ηάζεο κπνξεί λα θζάζνπλ θαη σο 2 κε
2.5 θνξέο ηελ ηηκή ηεο DC πιεπξάο, πνπ ζεκαίλεη όηη γηα ηππηθό κεηαηξνπέα κε είζνδν 450Vac, 60Hz θαη
πξνθύπηνπζα DC ηάζε εηζόδνπ ηνπ αληηζηξνθέα 600Vdc, νη θνξπθέο ζηελ θπκαηνκνξθή ηεο ηάζεο εμόδνπ
πξνο ηνλ θηλεηήξα κπνξεί λα θηάζνπλ έσο 1.5kV, θαη λα επεξεάζνπλ ζεκαληηθά ηε δηάξθεηα δσήο ηνπ, δηόηη:
Ζ ππεξύςσζε απηήο ηεο ηάζεο δηαλέκεηαη θαηά ην κήθνο ηνπ πξώηνπ ηπιίγκαηνο ηεο θάζε θάζεο
ηνπ ζηάηε θαηά 60%-80%, κε απνηέιεζκα ηελ πξόθιεζε ζεκείσλ κε απμεκέλε ζεξκνθξαζία ζην
ηύιηγκα πνπ κπνξεί λα απνδεηρζνύλ θαηαζηξεπηηθά κε ηελ πάξνδν ηνπ ρξόλνπ [19],
Σν ύςνο ησλ θνξπθώλ κπνξεί λα είλαη κεγαιύηεξν από ηελ αληνρή ηνπ κνλσηηθνύ ηεο θάζε θάζεο,
Σν ύςνο ησλ θνξπθώλ κπνξεί λα μεπεξάζεη ηελ δηειεθηξηθή ηάζε δηάζπαζεο (breakdown voltage)
ηνπ αέξα πνπ δηαρσξίδεη ην ηύιηγκα από ην πιαίζην ηνπ ζηάηε, νδεγώληαο ζε κεξηθή εθθόξηηζε.
Γηα ηελ απνθπγή ησλ πξνβιεκάησλ ζηνλ θηλεηήξα πνπ ζπζρεηίδνληαη κε ηνλ πςειό ξπζκό dv/dt, ε
εγθαηάζηαζε ζα πξέπεη λα είλαη ζπκβαηή κε ην πξόηππν IEC 60034-25 [20] πνπ πεξηγξάθεη ηα όξηα Vpeak,limit
γηα γεληθνύ ηύπνπ επαγσγηθνύο θηλεηήξεο νλνκαζηηθήο ηάζεο έσο 500V πνπ ηξνθνδνηνύληαη από ξπζκηζηέο
ζηξνθώλ. Ο πξνζεγγηζηηθόο ππνινγηζκόο ηνπ ιόγνπ dv/dt θαη ηεο αλακελόκελεο θνξπθήο Vpeak, γίλεηαη
ιακβάλνληαο ππόςε όηη ε ηηκή ησλ θνξπθώλ θαη ν ρξόλνο ππεξύςσζεο απμάλνληαη κε ην κήθνο θαισδίνπ:
όπνπ ν ζπληειεζηήο Γ αλαπαξηζηά ην πνζνζηό αλάθιαζεο ηνπ ζήκαηνο ζηελ πιεπξά ηνπ θηλεηήξα κε ηηκέο
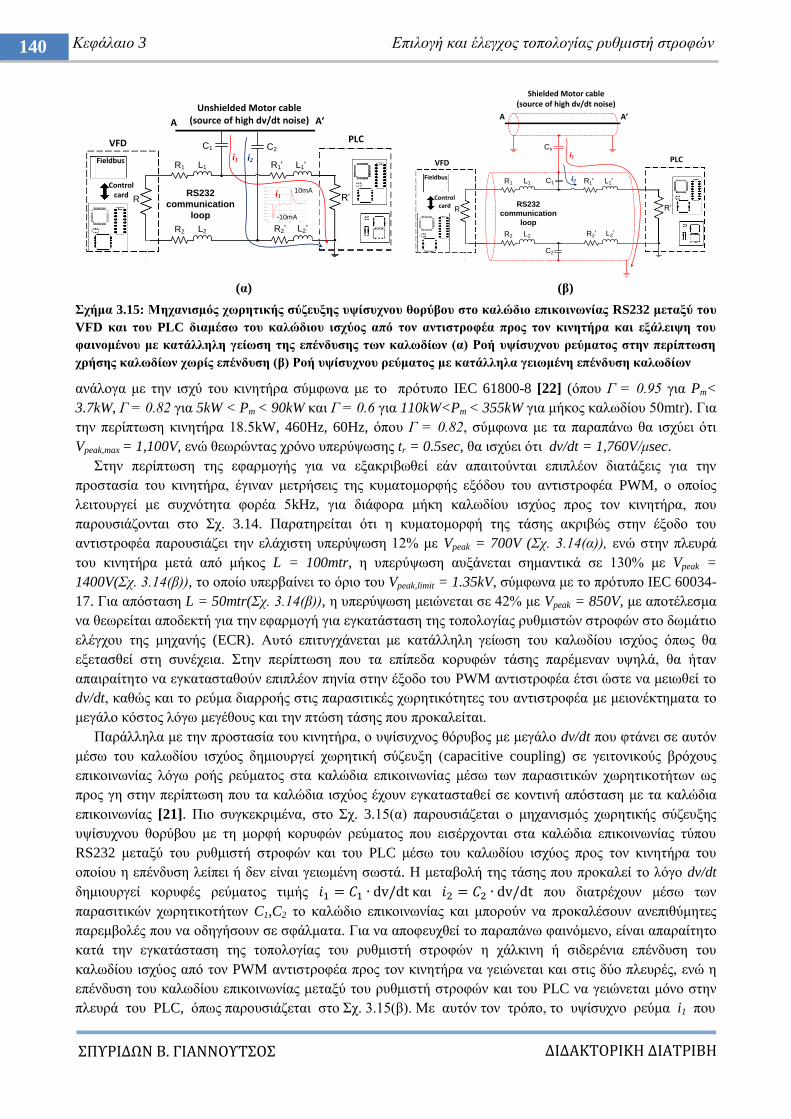
ΔΙΔΑΚΣΟΡΙΚΗ ΔΙΑΣΡΙΒΗ
ΠΤΡΙΔΩΝ Β. ΓΙΑΝΝΟΤΣΟ
140 Κεθάιαην 3 Δπηινγή θαη έιεγρνο ηνπνινγίαο ξπζκηζηή ζηξνθώλ
(α) (β)
ρήκα 3.15: Μεραληζκόο ρσξεηηθήο ζύδεπμεο πςίζπρλνπ ζνξύβνπ ζην θαιώδην επηθνηλσλίαο RS232 κεηαμύ ηνπ
VFD θαη ηνπ PLC δηακέζσ ηνπ θαιώδηνπ ηζρύνο από ηνλ αληηζηξνθέα πξνο ηνλ θηλεηήξα θαη εμάιεηςε ηνπ
θαηλνκέλνπ κε θαηάιιειε γείσζε ηεο επέλδπζεο ησλ θαισδίσλ (α) Ρνή πςίζπρλνπ ξεύκαηνο ζηελ πεξίπησζε
ρξήζεο θαισδίσλ ρσξίο επέλδπζε (β) Ρνή πςίζπρλνπ ξεύκαηνο κε θαηάιιεια γεησκέλε επέλδπζε θαισδίσλ
αλάινγα κε ηελ ηζρύ ηνπ θηλεηήξα ζύκθσλα κε ην πξόηππν IEC 61800-8 [22] (όπνπ Γ = 0.95 γηα Pm<
3.7kW, Γ = 0.82 γηα 5kW < Pm < 90kW θαη Γ = 0.6 γηα 110kW<Pm < 355kW γηα κήθνο θαισδίνπ 50mtr). Γηα
ηελ πεξίπησζε θηλεηήξα 18.5kW, 460Hz, 60Hz, όπνπ Γ = 0.82, ζύκθσλα κε ηα παξαπάλσ ζα ηζρύεη όηη
Vpeak,max = 1,100V, ελώ ζεσξώληαο ρξόλν ππεξύςσζεο tr = 0.5sec, ζα ηζρύεη όηη dv/dt = 1,760V/κsec.
ηελ πεξίπησζε ηεο εθαξκνγήο γηα λα εμαθξηβσζεί εάλ απαηηνύληαη επηπιένλ δηαηάμεηο γηα ηελ
πξνζηαζία ηνπ θηλεηήξα, έγηλαλ κεηξήζεηο ηεο θπκαηνκνξθήο εμόδνπ ηνπ αληηζηξνθέα PWM, ν νπνίνο
ιεηηνπξγεί κε ζπρλόηεηα θνξέα 5kHz, γηα δηάθνξα κήθε θαισδίνπ ηζρύνο πξνο ηνλ θηλεηήξα, πνπ
παξνπζηάδνληαη ζην ρ. 3.14. Παξαηεξείηαη όηη ε θπκαηνκνξθή ηεο ηάζεο αθξηβώο ζηελ έμνδν ηνπ
αληηζηξνθέα παξνπζηάδεη ηελ ειάρηζηε ππεξύςσζε 12% κε Vpeak = 700V (ρ. 3.14(α)), ελώ ζηελ πιεπξά
ηνπ θηλεηήξα κεηά από κήθνο L = 100mtr, ε ππεξύςσζε απμάλεηαη ζεκαληηθά ζε 130% κε Vpeak =
1400V(ρ. 3.14(β)), ην νπνίν ππεξβαίλεη ην όξην ηνπ Vpeak,limit = 1.35kV, ζύκθσλα κε ην πξόηππν IEC 60034-
17. Γηα απόζηαζε L = 50mtr(ρ. 3.14(β)), ε ππεξύςσζε κεηώλεηαη ζε 42% κε Vpeak = 850V, κε απνηέιεζκα
λα ζεσξείηαη απνδεθηή γηα ηελ εθαξκνγή γηα εγθαηάζηαζε ηεο ηνπνινγίαο ξπζκηζηώλ ζηξνθώλ ζην δσκάηην
ειέγρνπ ηεο κεραλήο (ECR). Απηό επηηπγράλεηαη κε θαηάιιειε γείσζε ηνπ θαισδίνπ ηζρύνο όπσο ζα
εμεηαζζεί ζηε ζπλέρεηα. ηελ πεξίπησζε πνπ ηα επίπεδα θνξπθώλ ηάζεο παξέκελαλ πςειά, ζα ήηαλ
απαηξαίηεην λα εγθαηαζηαζνύλ επηπιένλ πελία ζηελ έμνδν ηνπ PWM αληηζηξνθέα έηζη ώζηε λα κεησζεί ην
dv/dt, θαζώο θαη ην ξεύκα δηαξξνήο ζηηο παξαζηηηθέο ρσξεηηθόηεηεο ηνπ αληηζηξνθέα κε κεηνλέθηεκαηα ην
κεγάιν θόζηνο ιόγσ κεγέζνπο θαη ηελ πηώζε ηάζεο πνπ πξνθαιείηαη.
Παξάιιεια κε ηελ πξνζηαζία ηνπ θηλεηήξα, ν πςίζπρλνο ζόξπβνο κε κεγάιν dv/dt πνπ θηάλεη ζε απηόλ
κέζσ ηνπ θαισδίνπ ηζρύνο δεκηνπξγεί ρσξεηηθή ζύδεπμε (capacitive coupling) ζε γεηηνληθνύο βξόρνπο
επηθνηλσλίαο ιόγσ ξνήο ξεύκαηνο ζηα θαιώδηα επηθνηλσλίαο κέζσ ησλ παξαζηηηθώλ ρσξεηηθνηήησλ σο
πξνο γε ζηελ πεξίπησζε πνπ ηα θαιώδηα ηζρύνο έρνπλ εγθαηαζηαζεί ζε θνληηλή απόζηαζε κε ηα θαιώδηα
επηθνηλσλίαο [21]. Πην ζπγθεθξηκέλα, ζην ρ. 3.15(α) παξνπζηάδεηαη ν κεραληζκόο ρσξεηηθήο ζύδεπμεο
πςίζπρλνπ ζνξύβνπ κε ηε κνξθή θνξπθώλ ξεύκαηνο πνπ εηζέξρνληαη ζηα θαιώδηα επηθνηλσλίαο ηύπνπ
RS232 κεηαμύ ηνπ ξπζκηζηή ζηξνθώλ θαη ηνπ PLC κέζσ ηνπ θαισδίνπ ηζρύνο πξνο ηνλ θηλεηήξα ηνπ
νπνίνπ ε επέλδπζε ιείπεη ή δελ είλαη γεησκέλε ζσζηά. Ζ κεηαβνιή ηεο ηάζεο πνπ πξνθαιεί ην ιόγν dv/dt
δεκηνπξγεί θνξπθέο ξεύκαηνο ηηκήο θαη πνπ δηαηξέρνπλ κέζσ ησλ
παξαζηηηθώλ ρσξεηηθνηήησλ C1,C2 ην θαιώδην επηθνηλσλίαο θαη κπνξνύλ λα πξνθαιέζνπλ αλεπηζύκεηεο
παξεκβνιέο πνπ λα νδεγήζνπλ ζε ζθάικαηα. Γηα λα απνθεπρζεί ην παξαπάλσ θαηλόκελν, είλαη απαξαίηεην
θαηά ηελ εγθαηάζηαζε ηεο ηνπνινγίαο ηνπ ξπζκηζηή ζηξνθώλ ε ράιθηλε ή ζηδεξέληα επέλδπζε ηνπ
θαισδίνπ ηζρύνο από ηνλ PWM αληηζηξνθέα πξνο ηνλ θηλεηήξα λα γεηώλεηαη θαη ζηηο δύν πιεπξέο, ελώ ε
επέλδπζε ηνπ θαισδίνπ επηθνηλσλίαο κεηαμύ ηνπ ξπζκηζηή ζηξνθώλ θαη ηνπ PLC λα γεηώλεηαη κόλν ζηελ
πιεπξά ηνπ PLC, όπσο παξνπζηάδεηαη ζην ρ. 3.15(β). Με απηόλ ηνλ ηξόπν, ην πςίζπρλν ξεύκα i1 πνπ
R1
Unshielded Μοtor cable (source of high dv/dt noise)A A’
L1 R1' L1'
R2 L2 R2’ L2’
R
C1
R’
VFD
Fieldbus
Control card
C2
i1 i2
RS232
communication
loop
i1
PLC
10mA
-10mA
R1
Shielded Μοtor cable (source of high dv/dt noise)
A A’
L1 R1' L1'
R2 L2 R2’ L2’
R
Cs
R’
VFD
Fieldbus
Control card
C1
RS232
communication
loop
PLC
C2
i1
i2
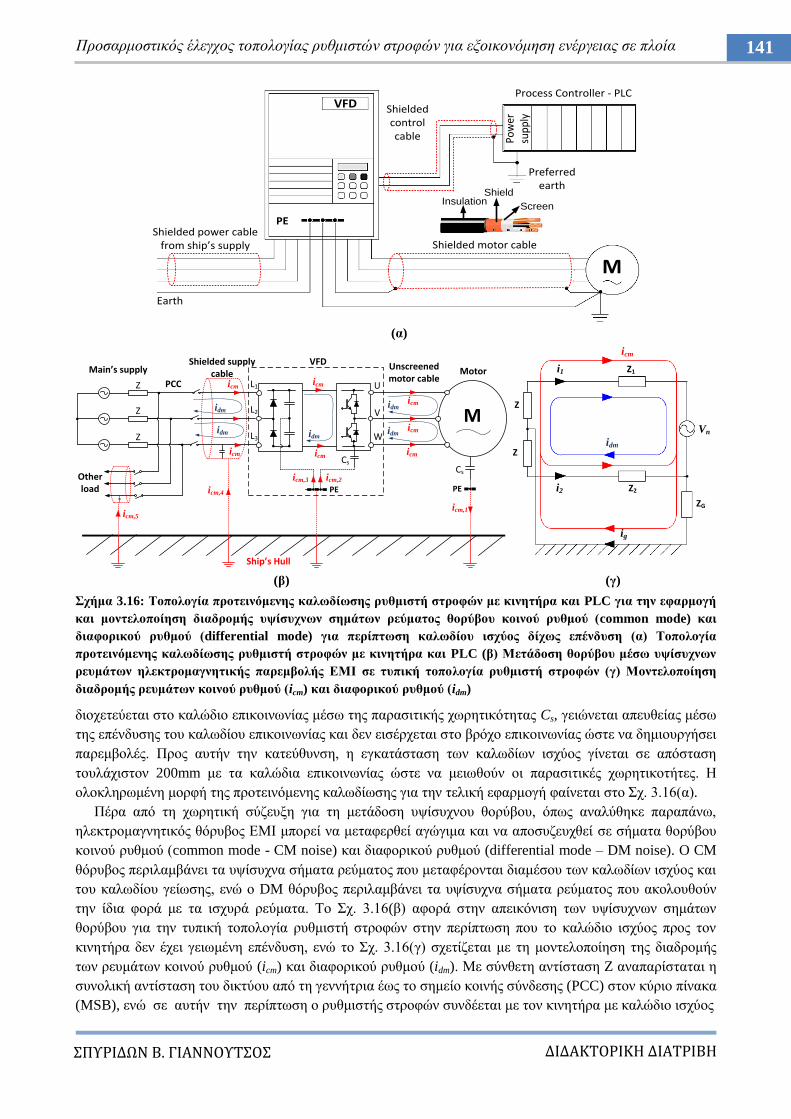
ΔΙΔΑΚΣΟΡΙΚΗ ΔΙΑΣΡΙΒΗ
ΠΤΡΙΔΩΝ Β. ΓΙΑΝΝΟΤΣΟ
141 Πξνζαξκνζηηθόο έιεγρνο ηνπνινγίαο ξπζκηζηώλ ζηξνθώλ γηα εμνηθνλόκεζε ελέξγεηαο ζε πινία
(α)
(β) (γ)
ρήκα 3.16: Σνπνινγία πξνηεηλόκελεο θαισδίσζεο ξπζκηζηή ζηξνθώλ κε θηλεηήξα θαη PLC γηα ηελ εθαξκνγή
θαη κνληεινπνίεζε δηαδξνκήο πςίζπρλσλ ζεκάησλ ξεύκαηνο ζνξύβνπ θνηλνύ ξπζκνύ (common mode) θαη
δηαθνξηθνύ ξπζκνύ (differential mode) γηα πεξίπησζε θαισδίνπ ηζρύνο δίρσο επέλδπζε (α) Σνπνινγία
πξνηεηλόκελεο θαισδίσζεο ξπζκηζηή ζηξνθώλ κε θηλεηήξα θαη PLC (β) Μεηάδνζε ζνξύβνπ κέζσ πςίζπρλσλ
ξεπκάησλ ειεθηξνκαγλεηηθήο παξεκβνιήο ΔΜΙ ζε ηππηθή ηνπνινγία ξπζκηζηή ζηξνθώλ (γ) Μνληεινπνίεζε
δηαδξνκήο ξεπκάησλ θνηλνύ ξπζκνύ (icm) θαη δηαθνξηθνύ ξπζκνύ (idm)
δηνρεηεύεηαη ζην θαιώδην επηθνηλσλίαο κέζσ ηεο παξαζηηηθήο ρσξεηηθόηεηαο Cs, γεηώλεηαη απεπζείαο κέζσ
ηεο επέλδπζεο ηνπ θαισδίνπ επηθνηλσλίαο θαη δελ εηζέξρεηαη ζην βξόρν επηθνηλσλίαο ώζηε λα δεκηνπξγήζεη
παξεκβνιέο. Πξνο απηήλ ηελ θαηεύζπλζε, ε εγθαηάζηαζε ησλ θαισδίσλ ηζρύνο γίλεηαη ζε απόζηαζε
ηνπιάρηζηνλ 200mm κε ηα θαιώδηα επηθνηλσλίαο ώζηε λα κεησζνύλ νη παξαζηηηθέο ρσξεηηθνηήηεο. Ζ
νινθιεξσκέλε κνξθή ηεο πξνηεηλόκελεο θαισδίσζεο γηα ηελ ηειηθή εθαξκνγή θαίλεηαη ζην ρ. 3.16(α).
Πέξα από ηε ρσξεηηθή ζύδεπμε γηα ηε κεηάδνζε πςίζπρλνπ ζνξύβνπ, όπσο αλαιύζεθε παξαπάλσ,
ειεθηξνκαγλεηηθόο ζόξπβνο ΔΜΗ κπνξεί λα κεηαθεξζεί αγώγηκα θαη λα απνζπδεπρζεί ζε ζήκαηα ζνξύβνπ
θνηλνύ ξπζκνύ (common mode - CM noise) θαη δηαθνξηθνύ ξπζκνύ (differential mode – DM noise). O CM
ζόξπβνο πεξηιακβάλεη ηα πςίζπρλα ζήκαηα ξεύκαηνο πνπ κεηαθέξνληαη δηακέζνπ ησλ θαισδίσλ ηζρύνο θαη
ηνπ θαισδίνπ γείσζεο, ελώ ν DM ζόξπβνο πεξηιακβάλεη ηα πςίζπρλα ζήκαηα ξεύκαηνο πνπ αθνινπζνύλ
ηελ ίδηα θνξά κε ηα ηζρπξά ξεύκαηα. Σν ρ. 3.16(β) αθνξά ζηελ απεηθόληζε ησλ πςίζπρλσλ ζεκάησλ
ζνξύβνπ γηα ηελ ηππηθή ηνπνινγία ξπζκηζηή ζηξνθώλ ζηελ πεξίπησζε πνπ ην θαιώδην ηζρύνο πξνο ηνλ
θηλεηήξα δελ έρεη γεησκέλε επέλδπζε, ελώ ην ρ. 3.16(γ) ζρεηίδεηαη κε ηε κνληεινπνίεζε ηεο δηαδξνκήο
ησλ ξεπκάησλ θνηλνύ ξπζκνύ (icm) θαη δηαθνξηθνύ ξπζκνύ (idm). Με ζύλζεηε αληίζηαζε Z αλαπαξίζηαηαη ε
ζπλνιηθή αληίζηαζε ηνπ δηθηύνπ από ηε γελλήηξηα έσο ην ζεκείν θνηλήο ζύλδεζεο (PCC) ζηνλ θύξην πίλαθα
(MSB), ελώ ζε απηήλ ηελ πεξίπησζε ν ξπζκηζηήο ζηξνθώλ ζπλδέεηαη κε ηνλ θηλεηήξα κε θαιώδην ηζρύνο
VFD
Shielded power cable from ship’s supply
EarthEarth
Shielded motor cable
Preferred earth
PE
Process Controller - PLC
Pow
er
supp
ly
M
Shielded control cable
Shield
ScreenInsulation
Main’s supplyVFD
PE
Unscreened motor cable
Motor
Z
Z
Z
Ship’s Hull
L1
L2
L3
U
V
W
PCC
Other load
Cs
Shielded supply cable
Cs
PE
idm
idm
idm
icm
icm
icm
icm,1
icm,2icm,3
icm,4
icm,5
icm
icm
icm
icm
M
icm
idm
Z1
Z2
i1
i2
Z
Z
Vn
ZG
ig
idm
idm
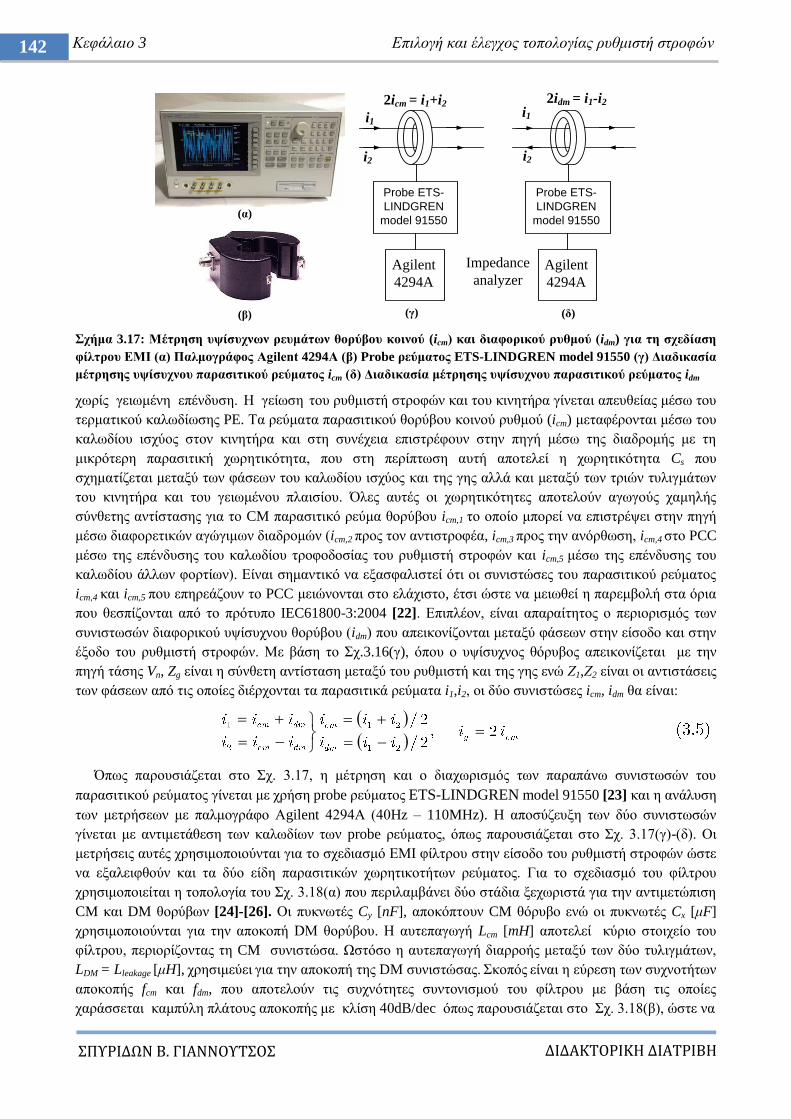
ΔΙΔΑΚΣΟΡΙΚΗ ΔΙΑΣΡΙΒΗ
ΠΤΡΙΔΩΝ Β. ΓΙΑΝΝΟΤΣΟ
142 Κεθάιαην 3 Δπηινγή θαη έιεγρνο ηνπνινγίαο ξπζκηζηή ζηξνθώλ
ρήκα 3.17: Μέηξεζε πςίζπρλσλ ξεπκάησλ ζνξύβνπ θνηλνύ (icm) θαη δηαθνξηθνύ ξπζκνύ (idm) γηα ηε ζρεδίαζε
θίιηξνπ ΔΜΙ (α) Παικνγξάθνο Αgilent 4294Α (β) Probe ξεύκαηνο ETS-LINDGREN model 91550 (γ) Γηαδηθαζία
κέηξεζεο πςίζπρλνπ παξαζηηηθνύ ξεύκαηνο icm (δ) Γηαδηθαζία κέηξεζεο πςίζπρλνπ παξαζηηηθνύ ξεύκαηνο idm
ρσξίο γεησκέλε επέλδπζε. Ζ γείσζε ηνπ ξπζκηζηή ζηξνθώλ θαη ηνπ θηλεηήξα γίλεηαη απεπζείαο κέζσ ηνπ
ηεξκαηηθνύ θαισδίσζεο PE. Σα ξεύκαηα παξαζηηηθνύ ζνξύβνπ θνηλνύ ξπζκνύ (icm) κεηαθέξνληαη κέζσ ηνπ
θαισδίνπ ηζρύνο ζηνλ θηλεηήξα θαη ζηε ζπλέρεηα επηζηξέθνπλ ζηελ πεγή κέζσ ηεο δηαδξνκήο κε ηε
κηθξόηεξε παξαζηηηθή ρσξεηηθόηεηα, πνπ ζηε πεξίπησζε απηή απνηειεί ε ρσξεηηθόηεηα Cs πνπ
ζρεκαηίδεηαη κεηαμύ ησλ θάζεσλ ηνπ θαισδίνπ ηζρύνο θαη ηεο γεο αιιά θαη κεηαμύ ησλ ηξηώλ ηπιηγκάησλ
ηνπ θηλεηήξα θαη ηνπ γεησκέλνπ πιαηζίνπ. Όιεο απηέο νη ρσξεηηθόηεηεο απνηεινύλ αγσγνύο ρακειήο
ζύλζεηεο αληίζηαζεο γηα ην CM παξαζηηηθό ξεύκα ζνξύβνπ icm,1 ην νπνίν κπνξεί λα επηζηξέςεη ζηελ πεγή
κέζσ δηαθνξεηηθώλ αγώγηκσλ δηαδξνκώλ (icm,2 πξνο ηνλ αληηζηξνθέα, icm,3 πξνο ηελ αλόξζσζε, icm,4 ζην PCC
κέζσ ηεο επέλδπζεο ηνπ θαισδίνπ ηξνθνδνζίαο ηνπ ξπζκηζηή ζηξνθώλ θαη icm,5 κέζσ ηεο επέλδπζεο ηνπ
θαισδίνπ άιισλ θνξηίσλ). Δίλαη ζεκαληηθό λα εμαζθαιηζηεί όηη νη ζπληζηώζεο ηνπ παξαζηηηθνύ ξεύκαηνο
icm,4 θαη icm,5 πνπ επεξεάδνπλ ην PCC κεηώλνληαη ζην ειάρηζην, έηζη ώζηε λα κεησζεί ε παξεκβνιή ζηα όξηα
πνπ ζεζπίδνληαη από ην πξόηππν IEC61800-3:2004 [22]. Δπηπιένλ, είλαη απαξαίηεηνο ν πεξηνξηζκόο ησλ
ζπληζησζώλ δηαθνξηθνύ πςίζπρλνπ ζνξύβνπ (idm) πνπ απεηθνλίδνληαη κεηαμύ θάζεσλ ζηελ είζνδν θαη ζηελ
έμνδν ηνπ ξπζκηζηή ζηξνθώλ. Με βάζε ην ρ.3.16(γ), όπνπ ν πςίζπρλνο ζόξπβνο απεηθνλίδεηαη κε ηελ
πεγή ηάζεο Vn, Zg είλαη ε ζύλζεηε αληίζηαζε κεηαμύ ηνπ ξπζκηζηή θαη ηεο γεο ελώ Ε1,Ε2 είλαη νη αληηζηάζεηο
ησλ θάζεσλ από ηηο νπνίεο δηέξρνληαη ηα παξαζηηηθά ξεύκαηα i1,i2, νη δύν ζπληζηώζεο icm, idm ζα είλαη:
Όπσο παξνπζηάδεηαη ζην ρ. 3.17, ε κέηξεζε θαη ν δηαρσξηζκόο ησλ παξαπάλσ ζπληζησζώλ ηνπ
παξαζηηηθνύ ξεύκαηνο γίλεηαη κε ρξήζε probe ξεύκαηνο ETS-LINDGREN model 91550 [23] θαη ε αλάιπζε
ησλ κεηξήζεσλ κε παικνγξάθν Αgilent 4294Α (40Hz – 110MHz). H απνζύδεπμε ησλ δύν ζπληζησζώλ
γίλεηαη κε αληηκεηάζεζε ησλ θαισδίσλ ησλ probe ξεύκαηνο, όπσο παξνπζηάδεηαη ζην ρ. 3.17(γ)-(δ). Οη
κεηξήζεηο απηέο ρξεζηκνπνηνύληαη γηα ην ζρεδηαζκό ΔΜΗ θίιηξνπ ζηελ είζνδν ηνπ ξπζκηζηή ζηξνθώλ ώζηε
λα εμαιεηθζνύλ θαη ηα δύν είδε παξαζηηηθώλ ρσξεηηθνηήησλ ξεύκαηνο. Γηα ην ζρεδηαζκό ηνπ θίιηξνπ
ρξεζηκνπνηείηαη ε ηνπνινγία ηνπ ρ. 3.18(α) πνπ πεξηιακβάλεη δύν ζηάδηα μερσξηζηά γηα ηελ αληηκεηώπηζε
CM θαη DM ζνξύβσλ [24]-[26]. Οη ππθλσηέο Cy [nF], απνθόπηνπλ CM ζόξπβν ελώ νη ππθλσηέο Cx [κF]
ρξεζηκνπνηνύληαη γηα ηελ απνθνπή DM ζνξύβνπ. Ζ απηεπαγσγή Lcm [mH] απνηειεί θύξην ζηνηρείν ηνπ
θίιηξνπ, πεξηνξίδνληαο ηε CM ζπληζηώζα. Χζηόζν ε απηεπαγσγή δηαξξνήο κεηαμύ ησλ δύν ηπιηγκάησλ,
LDM = Lleakage [κH], ρξεζηκεύεη γηα ηελ απνθνπή ηεο DM ζπληζηώζαο. θνπόο είλαη ε εύξεζε ησλ ζπρλνηήησλ
απνθνπήο fcm θαη fdm, πνπ απνηεινύλ ηηο ζπρλόηεηεο ζπληνληζκνύ ηνπ θίιηξνπ κε βάζε ηηο νπνίεο
ραξάζζεηαη θακπύιε πιάηνπο απνθνπήο κε θιίζε 40dB/dec όπσο παξνπζηάδεηαη ζην ρ. 3.18(β), ώζηε λα
2icm = i1+i2
i1
i2
i1
i2
2idm = i1-i2
Probe ETS-
LINDGREN
model 91550
Agilent
4294A
Impedance
analyzer
Probe ETS-
LINDGREN
model 91550
Agilent
4294A
(α)
(β) (γ) (δ)
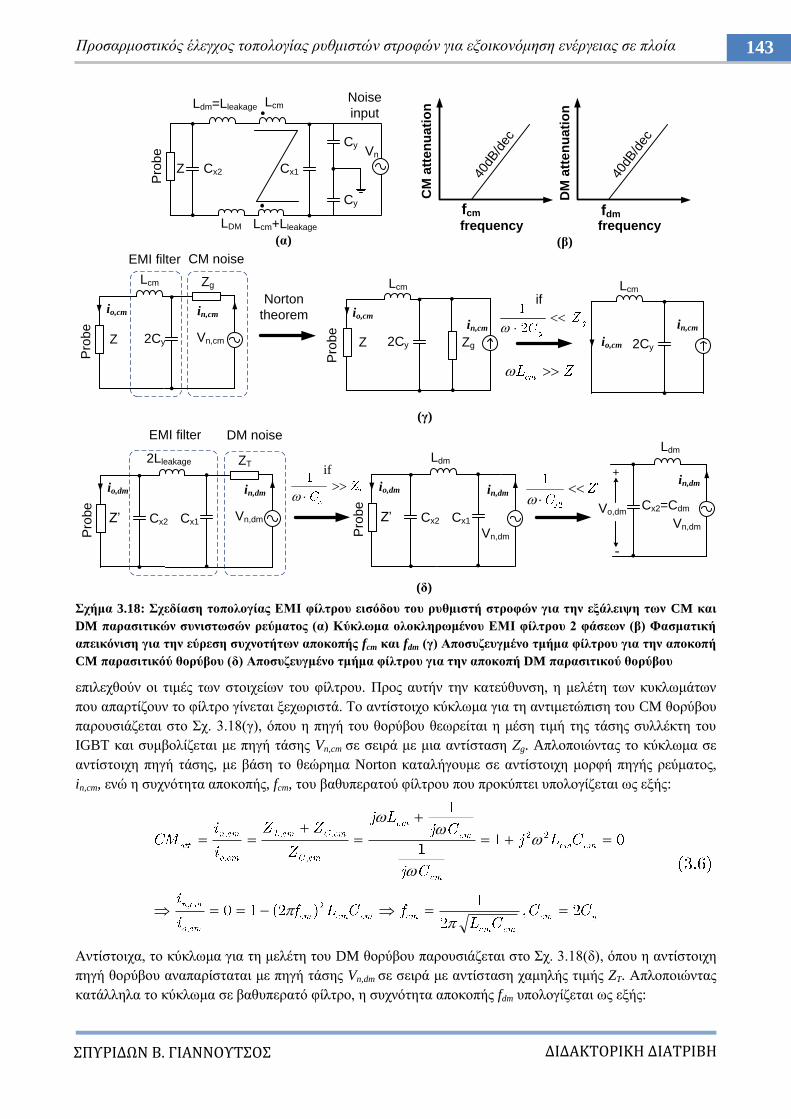
ΔΙΔΑΚΣΟΡΙΚΗ ΔΙΑΣΡΙΒΗ
ΠΤΡΙΔΩΝ Β. ΓΙΑΝΝΟΤΣΟ
143 Πξνζαξκνζηηθόο έιεγρνο ηνπνινγίαο ξπζκηζηώλ ζηξνθώλ γηα εμνηθνλόκεζε ελέξγεηαο ζε πινία
ρήκα 3.18: ρεδίαζε ηνπνινγίαο ΔΜΙ θίιηξνπ εηζόδνπ ηνπ ξπζκηζηή ζηξνθώλ γηα ηελ εμάιεηςε ησλ CM θαη
DM παξαζηηηθώλ ζπληζησζώλ ξεύκαηνο (α) Κύθισκα νινθιεξσκέλνπ ΔΜΙ θίιηξνπ 2 θάζεσλ (β) Φαζκαηηθή
απεηθόληζε γηα ηελ εύξεζε ζπρλνηήησλ απνθνπήο fcm θαη fdm (γ) Απνζπδεπγκέλν ηκήκα θίιηξνπ γηα ηελ απνθνπή
CM παξαζηηηθόύ ζνξύβνπ (δ) Απνζπδεπγκέλν ηκήκα θίιηξνπ γηα ηελ απνθνπή DM παξαζηηηθνύ ζνξύβνπ
επηιερζνύλ νη ηηκέο ησλ ζηνηρείσλ ηνπ θίιηξνπ. Πξνο απηήλ ηελ θαηεύζπλζε, ε κειέηε ησλ θπθισκάησλ
πνπ απαξηίδνπλ ην θίιηξν γίλεηαη μερσξηζηά. Σν αληίζηνηρν θύθισκα γηα ηε αληηκεηώπηζε ηνπ CM ζνξύβνπ
παξνπζηάδεηαη ζην ρ. 3.18(γ), όπνπ ε πεγή ηνπ ζνξύβνπ ζεσξείηαη ε κέζε ηηκή ηεο ηάζεο ζπιιέθηε ηνπ
IGBT θαη ζπκβνιίδεηαη κε πεγή ηάζεο Vn,cm ζε ζεηξά κε κηα αληίζηαζε Εg. Aπινπνηώληαο ην θύθισκα ζε
αληίζηνηρε πεγή ηάζεο, κε βάζε ην ζεώξεκα Norton θαηαιήγνπκε ζε αληίζηνηρε κνξθή πεγήο ξεύκαηνο,
in,cm, ελώ ε ζπρλόηεηα απνθνπήο, fcm, ηνπ βαζππεξαηνύ θίιηξνπ πνπ πξνθύπηεη ππνινγίδεηαη σο εμήο:
Αληίζηνηρα, ην θύθισκα γηα ηε κειέηε ηνπ DM ζνξύβνπ παξνπζηάδεηαη ζην ρ. 3.18(δ), όπνπ ε αληίζηνηρε
πεγή ζνξύβνπ αλαπαξίζηαηαη κε πεγή ηάζεο Vn,dm ζε ζεηξά κε αληίζηαζε ρακειήο ηηκήο ZT. Απινπνηώληαο
θαηάιιεια ην θύθισκα ζε βαζππεξαηό θίιηξν, ε ζπρλόηεηα απνθνπήο fdm ππνινγίδεηαη σο εμήο:
Ldm=Lleakage Lcm
Pro
be
Cx2 Cx1
Cy
Cy
Vn
Noise
input
2Cy
io,cm
Lcm
CM noise
Zg
Vn,cm
in,cm
Pro
be
Z
EMI filter
Norton
theorem io,cm
Pro
be
Lcm
2Cy Zg
in,cm
Z Z
Lcm
2Cy
in,cm
io,cm
if
Cx2
io,dm
2Lleakage
EMI filter
ZT
Vn,dm
in,dm
Pro
be
Z’ Cx1 Cx2
io,dm
Ldm
Vn,dm
in,dm
Pro
be
Z’ Cx1
if
Vn,dm
in,dm
Ldm
Vo,dm
+
-
Cx2=Cdm
40dB
/dec
fcm
40dB
/dec
CM
att
en
ua
tio
n
frequency frequency
DM
att
en
ua
tio
n
(α) (β)
(γ)
(δ)
LDM Lcm+Lleakage
fdm
DM noise
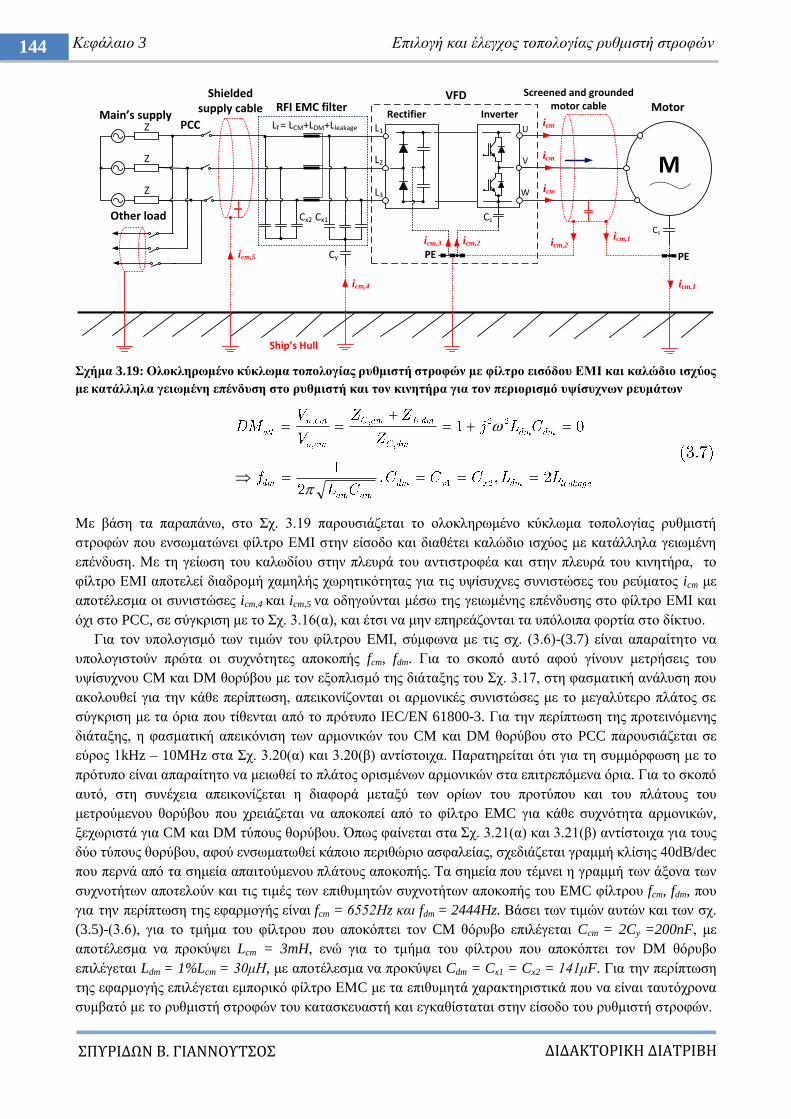
ΔΙΔΑΚΣΟΡΙΚΗ ΔΙΑΣΡΙΒΗ
ΠΤΡΙΔΩΝ Β. ΓΙΑΝΝΟΤΣΟ
144 Κεθάιαην 3 Δπηινγή θαη έιεγρνο ηνπνινγίαο ξπζκηζηή ζηξνθώλ
ρήκα 3.19: Οινθιεξσκέλν θύθισκα ηνπνινγίαο ξπζκηζηή ζηξνθώλ κε θίιηξν εηζόδνπ ΔΜΙ θαη θαιώδην ηζρύνο
κε θαηάιιεια γεησκέλε επέλδπζε ζην ξπζκηζηή θαη ηνλ θηλεηήξα γηα ηνλ πεξηνξηζκό πςίζπρλσλ ξεπκάησλ
Με βάζε ηα παξαπάλσ, ζην ρ. 3.19 παξνπζηάδεηαη ην νινθιεξσκέλν θύθισκα ηνπνινγίαο ξπζκηζηή
ζηξνθώλ πνπ ελζσκαηώλεη θίιηξν ΔΜΗ ζηελ είζνδν θαη δηαζέηεη θαιώδην ηζρύνο κε θαηάιιεια γεησκέλε
επέλδπζε. Με ηε γείσζε ηνπ θαισδίνπ ζηελ πιεπξά ηνπ αληηζηξνθέα θαη ζηελ πιεπξά ηνπ θηλεηήξα, ην
θίιηξν ΔΜΗ απνηειεί δηαδξνκή ρακειήο ρσξεηηθόηεηαο γηα ηηο πςίζπρλεο ζπληζηώζεο ηνπ ξεύκαηνο icm κε
απνηέιεζκα νη ζπληζηώζεο icm,4 θαη icm,5 λα νδεγνύληαη κέζσ ηεο γεησκέλεο επέλδπζεο ζην θίιηξν ΔΜΗ θαη
όρη ζην PCC, ζε ζύγθξηζε κε ην ρ. 3.16(α), θαη έηζη λα κελ επεξεάδνληαη ηα ππόινηπα θνξηία ζην δίθηπν.
Γηα ηνλ ππνινγηζκό ησλ ηηκώλ ηνπ θίιηξνπ ΔΜΗ, ζύκθσλα κε ηηο ζρ. (3.6)-(3.7) είλαη απαξαίηεην λα
ππνινγηζηνύλ πξώηα νη ζπρλόηεηεο απνθνπήο fcm, fdm. Γηα ην ζθνπό απηό αθνύ γίλνπλ κεηξήζεηο ηνπ
πςίζπρλνπ CM θαη DM ζνξύβνπ κε ηνλ εμνπιηζκό ηεο δηάηαμεο ηνπ ρ. 3.17, ζηε θαζκαηηθή αλάιπζε πνπ
αθνινπζεί γηα ηελ θάζε πεξίπησζε, απεηθνλίδνληαη νη αξκνληθέο ζπληζηώζεο κε ην κεγαιύηεξν πιάηνο ζε
ζύγθξηζε κε ηα όξηα πνπ ηίζεληαη από ην πξόηππν ΗΔC/EN 61800-3. Γηα ηελ πεξίπησζε ηεο πξνηεηλόκελεο
δηάηαμεο, ε θαζκαηηθή απεηθόληζε ησλ αξκνληθώλ ηνπ CM θαη DM ζνξύβνπ ζην PCC παξνπζηάδεηαη ζε
εύξνο 1kHz – 10MHz ζηα ρ. 3.20(α) θαη 3.20(β) αληίζηνηρα. Παξαηεξείηαη όηη γηα ηε ζπκκόξθσζε κε ην
πξόηππν είλαη απαξαίηεην λα κεησζεί ην πιάηνο νξηζκέλσλ αξκνληθώλ ζηα επηηξεπόκελα όξηα. Γηα ην ζθνπό
απηό, ζηε ζπλέρεηα απεηθνλίδεηαη ε δηαθνξά κεηαμύ ησλ νξίσλ ηνπ πξνηύπνπ θαη ηνπ πιάηνπο ηνπ
κεηξνύκελνπ ζνξύβνπ πνπ ρξεηάδεηαη λα απνθνπεί από ην θίιηξν EMC γηα θάζε ζπρλόηεηα αξκνληθώλ,
μερσξηζηά γηα CM θαη DM ηύπνπο ζνξύβνπ. Όπσο θαίλεηαη ζηα ρ. 3.21(α) θαη 3.21(β) αληίζηνηρα γηα ηνπο
δύν ηύπνπο ζνξύβνπ, αθνύ ελζσκαησζεί θάπνην πεξηζώξην αζθαιείαο, ζρεδηάδεηαη γξακκή θιίζεο 40dB/dec
πνπ πεξλά από ηα ζεκεία απαηηνύκελνπ πιάηνπο απνθνπήο. Σα ζεκεία πνπ ηέκλεη ε γξακκή ησλ άμνλα ησλ
ζπρλνηήησλ απνηεινύλ θαη ηηο ηηκέο ησλ επηζπκεηώλ ζπρλνηήησλ απνθνπήο ηνπ EMC θίιηξνπ fcm, fdm, πνπ
γηα ηελ πεξίπησζε ηεο εθαξκνγήο είλαη fcm = 6552Ζz θαη fdm = 2444Hz. Βάζεη ησλ ηηκώλ απηώλ θαη ησλ ζρ.
(3.5)-(3.6), γηα ην ηκήκα ηνπ θίιηξνπ πνπ απνθόπηεη ηνλ CM ζόξπβν επηιέγεηαη Ccm = 2Cy =200nF, κε
απνηέιεζκα λα πξνθύςεη Lcm = 3mH, ελώ γηα ην ηκήκα ηνπ θίιηξνπ πνπ απνθόπηεη ηνλ DM ζόξπβν
επηιέγεηαη Ldm = 1%Lcm = 30κΖ, κε απνηέιεζκα λα πξνθύςεη Cdm = Cx1 = Cx2 = 141κF. Γηα ηελ πεξίπησζε
ηεο εθαξκνγήο επηιέγεηαη εκπνξηθό θίιηξν ΔΜC κε ηα επηζπκεηά ραξαθηεξηζηηθά πνπ λα είλαη ηαπηόρξνλα
ζπκβαηό κε ην ξπζκηζηή ζηξνθώλ ηνπ θαηαζθεπαζηή θαη εγθαζίζηαηαη ζηελ είζνδν ηνπ ξπζκηζηή ζηξνθώλ.
Main’s supply
Screened and groundedmotor cable Motor
Z
Z
Z
Ship’s Hull
L1
L2
L3
U
V
W
PCC
Other load
Shielded supply cable
Cs
PE
RFI EMC filter
Cx2 Cx1
Cy
Lf = LCM+LDM+Lleakage
M
VFD
PE
icm,2icm,3
icm
icm
icm
Rectifier Inverter
Cs
icm,2icm,1
icm,4
icm,5
icm,1
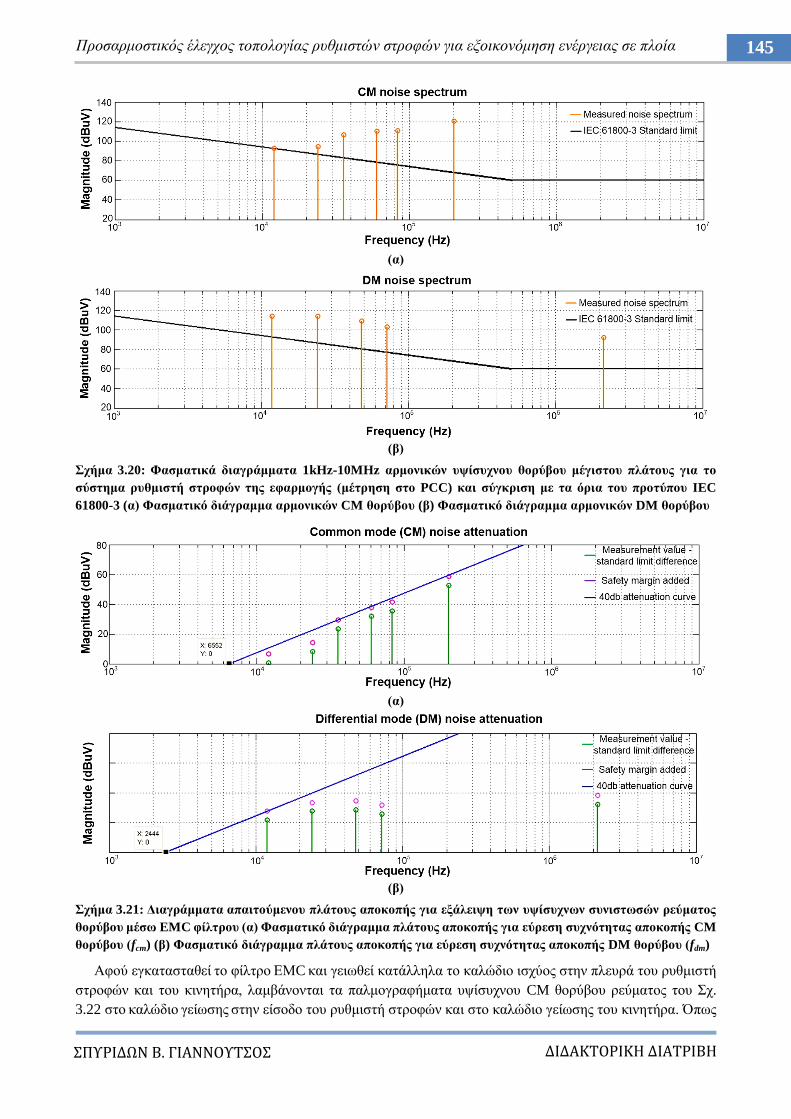
ΔΙΔΑΚΣΟΡΙΚΗ ΔΙΑΣΡΙΒΗ
ΠΤΡΙΔΩΝ Β. ΓΙΑΝΝΟΤΣΟ
145 Πξνζαξκνζηηθόο έιεγρνο ηνπνινγίαο ξπζκηζηώλ ζηξνθώλ γηα εμνηθνλόκεζε ελέξγεηαο ζε πινία
(α)
(β)
ρήκα 3.20: Φαζκαηηθά δηαγξάκκαηα 1kHz-10MHz αξκνληθώλ πςίζπρλνπ ζνξύβνπ κέγηζηνπ πιάηνπο γηα ην
ζύζηεκα ξπζκηζηή ζηξνθώλ ηεο εθαξκνγήο (κέηξεζε ζην PCC) θαη ζύγθξηζε κε ηα όξηα ηνπ πξνηύπνπ IEC
61800-3 (α) Φαζκαηηθό δηάγξακκα αξκνληθώλ CM ζνξύβνπ (β) Φαζκαηηθό δηάγξακκα αξκνληθώλ DM ζνξύβνπ
(α)
(β)
ρήκα 3.21: Γηαγξάκκαηα απαηηνύκελνπ πιάηνπο απνθνπήο γηα εμάιεηςε ησλ πςίζπρλσλ ζπληζησζώλ ξεύκαηνο
ζνξύβνπ κέζσ EMC θίιηξνπ (α) Φαζκαηηθό δηάγξακκα πιάηνπο απνθνπήο γηα εύξεζε ζπρλόηεηαο απνθνπήο CM
ζνξύβνπ (fcm) (β) Φαζκαηηθό δηάγξακκα πιάηνπο απνθνπήο γηα εύξεζε ζπρλόηεηαο απνθνπήο DM ζνξύβνπ (fdm)
Αθνύ εγθαηαζηαζεί ην θίιηξν ΔΜC θαη γεησζεί θαηάιιεια ην θαιώδην ηζρύνο ζηελ πιεπξά ηνπ ξπζκηζηή
ζηξνθώλ θαη ηνπ θηλεηήξα, ιακβάλνληαη ηα παικνγξαθήκαηα πςίζπρλνπ CM ζνξύβνπ ξεύκαηνο ηνπ ρ.
3.22 ζην θαιώδην γείσζεο ζηελ είζνδν ηνπ ξπζκηζηή ζηξνθώλ θαη ζην θαιώδην γείσζεο ηνπ θηλεηήξα. Όπσο
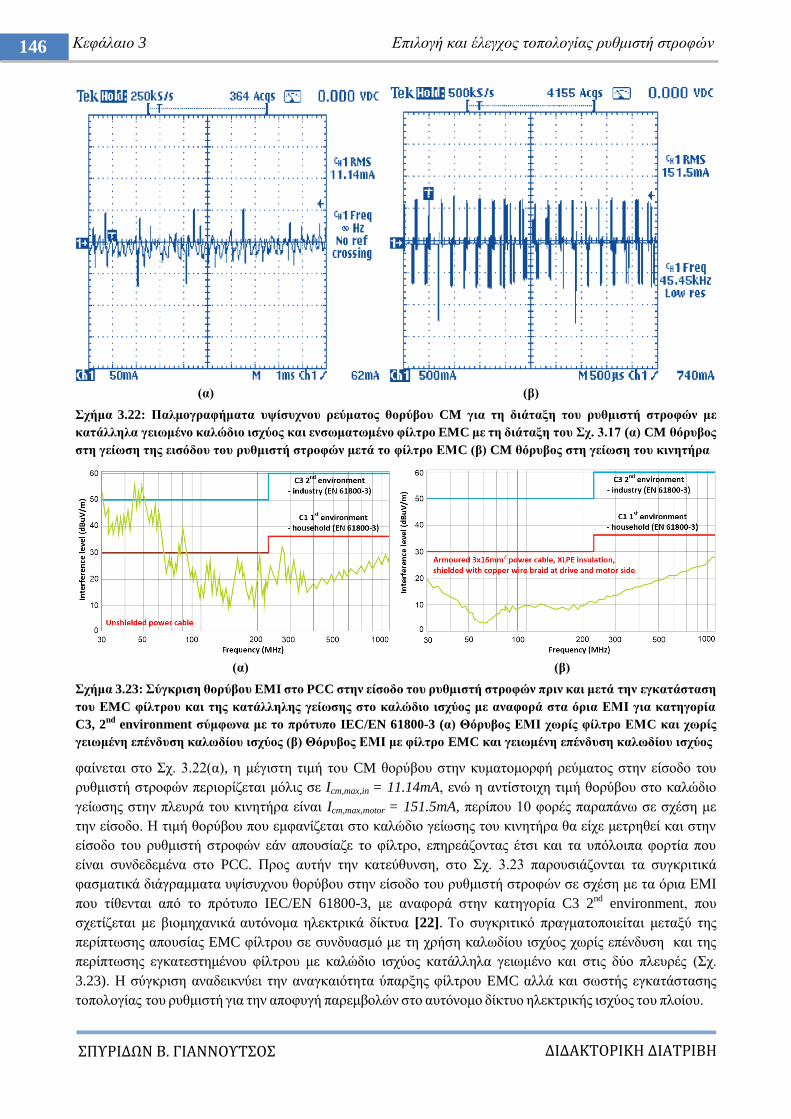
ΔΙΔΑΚΣΟΡΙΚΗ ΔΙΑΣΡΙΒΗ
ΠΤΡΙΔΩΝ Β. ΓΙΑΝΝΟΤΣΟ
146 Κεθάιαην 3 Δπηινγή θαη έιεγρνο ηνπνινγίαο ξπζκηζηή ζηξνθώλ
(α) (β)
ρήκα 3.22: Παικνγξαθήκαηα πςίζπρλνπ ξεύκαηνο ζνξύβνπ CM γηα ηε δηάηαμε ηνπ ξπζκηζηή ζηξνθώλ κε
θαηάιιεια γεησκέλν θαιώδην ηζρύνο θαη ελζσκαησκέλν θίιηξν EMC κε ηε δηάηαμε ηνπ ρ. 3.17 (α) CM ζόξπβνο
ζηε γείσζε ηεο εηζόδνπ ηνπ ξπζκηζηή ζηξνθώλ κεηά ην θίιηξν ΔΜC (β) CM ζόξπβνο ζηε γείσζε ηνπ θηλεηήξα
(α) (β)
ρήκα 3.23: ύγθξηζε ζνξύβνπ EMI ζην PCC ζηελ είζνδν ηνπ ξπζκηζηή ζηξνθώλ πξηλ θαη κεηά ηελ εγθαηάζηαζε
ηνπ ΔMC θίιηξνπ θαη ηεο θαηάιιειεο γείσζεο ζην θαιώδην ηζρύνο κε αλαθνξά ζηα όξηα ΔΜΙ γηα θαηεγνξία
C3, 2nd
environment ζύκθσλα κε ην πξόηππν IEC/EN 61800-3 (α) Θόξπβνο ΔΜΙ ρσξίο θίιηξν ΔΜC θαη ρσξίο
γεησκέλε επέλδπζε θαισδίνπ ηζρύνο (β) Θόξπβνο ΔΜΙ κε θίιηξν EMC θαη γεησκέλε επέλδπζε θαισδίνπ ηζρύνο
θαίλεηαη ζην ρ. 3.22(α), ε κέγηζηε ηηκή ηνπ CM ζνξύβνπ ζηελ θπκαηνκνξθή ξεύκαηνο ζηελ είζνδν ηνπ
ξπζκηζηή ζηξνθώλ πεξηνξίδεηαη κόιηο ζε Icm,max,in = 11.14mA, ελώ ε αληίζηνηρε ηηκή ζνξύβνπ ζην θαιώδην
γείσζεο ζηελ πιεπξά ηνπ θηλεηήξα είλαη Icm,max,motor = 151.5mA, πεξίπνπ 10 θνξέο παξαπάλσ ζε ζρέζε κε
ηελ είζνδν. Ζ ηηκή ζνξύβνπ πνπ εκθαλίδεηαη ζην θαιώδην γείσζεο ηνπ θηλεηήξα ζα είρε κεηξεζεί θαη ζηελ
είζνδν ηνπ ξπζκηζηή ζηξνθώλ εάλ απνπζίαδε ην θίιηξν, επεξεάδνληαο έηζη θαη ηα ππόινηπα θνξηία πνπ
είλαη ζπλδεδεκέλα ζην PCC. Πξνο απηήλ ηελ θαηεύζπλζε, ζην ρ. 3.23 παξνπζηάδνληαη ηα ζπγθξηηηθά
θαζκαηηθά δηάγξακκαηα πςίζπρλνπ ζνξύβνπ ζηελ είζνδν ηνπ ξπζκηζηή ζηξνθώλ ζε ζρέζε κε ηα όξηα ΔΜΗ
πνπ ηίζεληαη από ην πξόηππν ΗEC/EN 61800-3, κε αλαθνξά ζηελ θαηεγνξία C3 2nd
environment, πνπ
ζρεηίδεηαη κε βηνκεραληθά απηόλνκα ειεθηξηθά δίθηπα [22]. Σν ζπγθξηηηθό πξαγκαηνπνηείηαη κεηαμύ ηεο
πεξίπησζεο απνπζίαο EMC θίιηξνπ ζε ζπλδπαζκό κε ηε ρξήζε θαισδίνπ ηζρύνο ρσξίο επέλδπζε θαη ηεο
πεξίπησζεο εγθαηεζηεκέλνπ θίιηξνπ κε θαιώδην ηζρύνο θαηάιιεια γεησκέλν θαη ζηηο δύν πιεπξέο (ρ.
3.23). Ζ ζύγθξηζε αλαδεηθλύεη ηελ αλαγθαηόηεηα ύπαξμεο θίιηξνπ EMC αιιά θαη ζσζηήο εγθαηάζηαζεο
ηνπνινγίαο ηνπ ξπζκηζηή γηα ηελ απνθπγή παξεκβνιώλ ζην απηόλνκν δίθηπν ειεθηξηθήο ηζρύνο ηνπ πινίνπ.
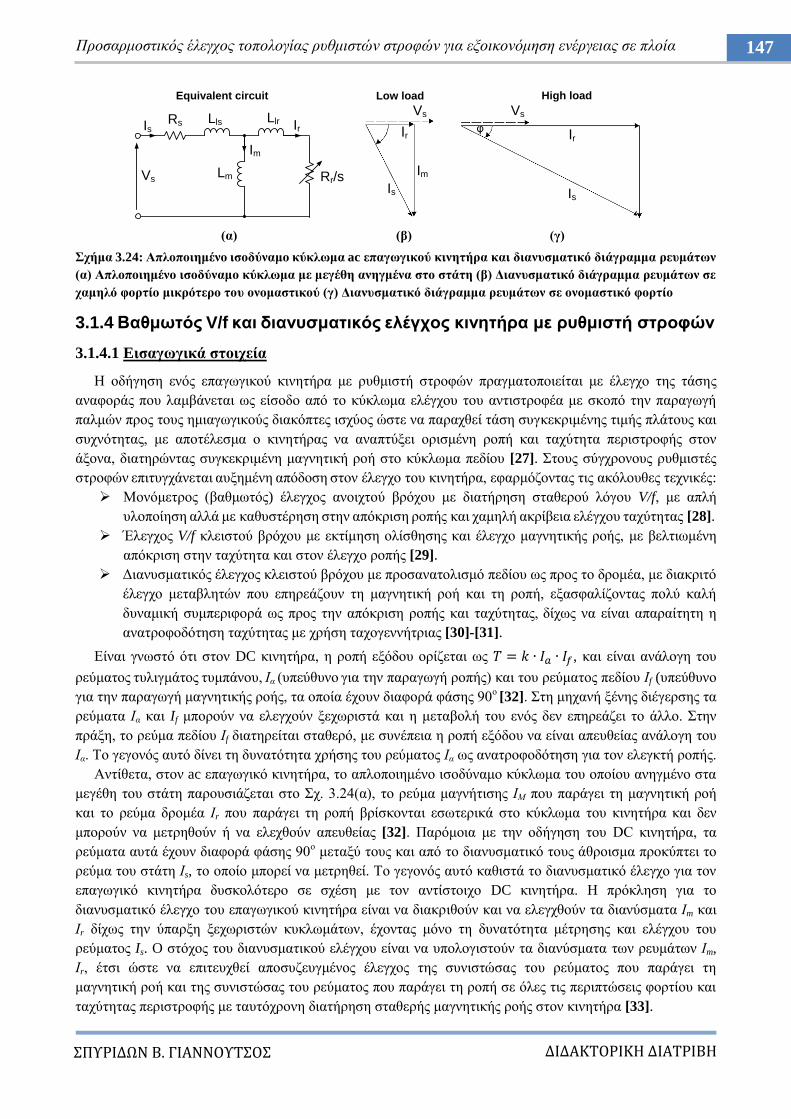
ΔΙΔΑΚΣΟΡΙΚΗ ΔΙΑΣΡΙΒΗ
ΠΤΡΙΔΩΝ Β. ΓΙΑΝΝΟΤΣΟ
147 Πξνζαξκνζηηθόο έιεγρνο ηνπνινγίαο ξπζκηζηώλ ζηξνθώλ γηα εμνηθνλόκεζε ελέξγεηαο ζε πινία
(α) (β) (γ)
ρήκα 3.24: Απινπνηεκέλν ηζνδύλακν θύθισκα ac επαγσγηθνύ θηλεηήξα θαη δηαλπζκαηηθό δηάγξακκα ξεπκάησλ
(α) Απινπνηεκέλν ηζνδύλακν θύθισκα κε κεγέζε αλεγκέλα ζην ζηάηε (β) Γηαλπζκαηηθό δηάγξακκα ξεπκάησλ ζε
ρακειό θνξηίν κηθξόηεξν ηνπ νλνκαζηηθνύ (γ) Γηαλπζκαηηθό δηάγξακκα ξεπκάησλ ζε νλνκαζηηθό θνξηίν
3.1.4 Βαζκσηόο V/f θαη δηαλπζκαηηθόο ειέγρνο θηλεηήξα κε ξπζκηζηή ζηξνθώλ
3.1.4.1 Eηζαγσγηθά ζηνηρεία
Ζ νδήγεζε ελόο επαγσγηθνύ θηλεηήξα κε ξπζκηζηή ζηξνθώλ πξαγκαηνπνηείηαη κε έιεγρν ηεο ηάζεο
αλαθνξάο πνπ ιακβάλεηαη σο είζνδν από ην θύθισκα ειέγρνπ ηνπ αληηζηξνθέα κε ζθνπό ηελ παξαγσγή
παικώλ πξνο ηνπο εκηαγσγηθνύο δηαθόπηεο ηζρύνο ώζηε λα παξαρζεί ηάζε ζπγθεθξηκέλεο ηηκήο πιάηνπο θαη
ζπρλόηεηαο, κε απνηέιεζκα ν θηλεηήξαο λα αλαπηύμεη νξηζκέλε ξνπή θαη ηαρύηεηα πεξηζηξνθήο ζηνλ
άμνλα, δηαηεξώληαο ζπγθεθξηκέλε καγλεηηθή ξνή ζην θύθισκα πεδίνπ [27]. ηνπο ζύγρξνλνπο ξπζκηζηέο
ζηξνθώλ επηηπγράλεηαη απμεκέλε απόδνζε ζηνλ έιεγρν ηνπ θηλεηήξα, εθαξκόδνληαο ηηο αθόινπζεο ηερληθέο:
Μνλόκεηξνο (βαζκσηόο) έιεγρνο αλνηρηνύ βξόρνπ κε δηαηήξεζε ζηαζεξνύ ιόγνπ V/f, κε απιή
πινπνίεζε αιιά κε θαζπζηέξεζε ζηελ απόθξηζε ξνπήο θαη ρακειή αθξίβεηα ειέγρνπ ηαρύηεηαο [28].
Έιεγρνο V/f θιεηζηνύ βξόρνπ κε εθηίκεζε νιίζζεζεο θαη έιεγρν καγλεηηθήο ξνήο, κε βειηησκέλε
απόθξηζε ζηελ ηαρύηεηα θαη ζηνλ έιεγρν ξνπήο [29].
Γηαλπζκαηηθόο έιεγρνο θιεηζηνύ βξόρνπ κε πξνζαλαηνιηζκό πεδίνπ σο πξνο ην δξνκέα, κε δηαθξηηό
έιεγρν κεηαβιεηώλ πνπ επεξεάδνπλ ηε καγλεηηθή ξνή θαη ηε ξνπή, εμαζθαιίδνληαο πνιύ θαιή
δπλακηθή ζπκπεξηθνξά σο πξνο ηελ απόθξηζε ξνπήο θαη ηαρύηεηαο, δίρσο λα είλαη απαξαίηεηε ε
αλαηξνθνδόηεζε ηαρύηεηαο κε ρξήζε ηαρνγελλήηξηαο [30]-[31].
Δίλαη γλσζηό όηη ζηνλ DC θηλεηήξα, ε ξνπή εμόδνπ νξίδεηαη σο , θαη είλαη αλάινγε ηνπ
ξεύκαηνο ηπιηγκάηνο ηπκπάλνπ, Ηα (ππεύζπλν γηα ηελ παξαγσγή ξνπήο) θαη ηνπ ξεύκαηνο πεδίνπ Ηf (ππεύζπλν
γηα ηελ παξαγσγή καγλεηηθήο ξνήο, ηα νπνία έρνπλ δηαθνξά θάζεο 90ν [32]. ηε κεραλή μέλεο δηέγεξζεο ηα
ξεύκαηα Ηα θαη If κπνξνύλ λα ειεγρνύλ μερσξηζηά θαη ε κεηαβνιή ηνπ ελόο δελ επεξεάδεη ην άιιν. ηελ
πξάμε, ην ξεύκα πεδίνπ Ηf δηαηεξείηαη ζηαζεξό, κε ζπλέπεηα ε ξνπή εμόδνπ λα είλαη απεπζείαο αλάινγε ηνπ
Ηα. Σν γεγνλόο απηό δίλεη ηε δπλαηόηεηα ρξήζεο ηνπ ξεύκαηνο Ηα σο αλαηξνθνδόηεζε γηα ηνλ ειεγθηή ξνπήο.
Αληίζεηα, ζηνλ ac επαγσγηθό θηλεηήξα, ην απινπνηεκέλν ηζνδύλακν θύθισκα ηνπ νπνίνπ αλεγκέλν ζηα
κεγέζε ηνπ ζηάηε παξνπζηάδεηαη ζην ρ. 3.24(α), ην ξεύκα καγλήηηζεο ΗΜ πνπ παξάγεη ηε καγλεηηθή ξνή
θαη ην ξεύκα δξνκέα Ηr πνπ παξάγεη ηε ξνπή βξίζθνληαη εζσηεξηθά ζην θύθισκα ηνπ θηλεηήξα θαη δελ
κπνξνύλ λα κεηξεζνύλ ή λα ειερζνύλ απεπζείαο [32]. Παξόκνηα κε ηελ νδήγεζε ηνπ DC θηλεηήξα, ηα
ξεύκαηα απηά έρνπλ δηαθνξά θάζεο 90ν κεηαμύ ηνπο θαη από ην δηαλπζκαηηθό ηνπο άζξνηζκα πξνθύπηεη ην
ξεύκα ηνπ ζηάηε Ηs, ην νπνίν κπνξεί λα κεηξεζεί. Σν γεγνλόο απηό θαζηζηά ην δηαλπζκαηηθό έιεγρν γηα ηνλ
επαγσγηθό θηλεηήξα δπζθνιόηεξν ζε ζρέζε κε ηνλ αληίζηνηρν DC θηλεηήξα. Ζ πξόθιεζε γηα ην
δηαλπζκαηηθό έιεγρν ηνπ επαγσγηθνύ θηλεηήξα είλαη λα δηαθξηζνύλ θαη λα ειεγρζνύλ ηα δηαλύζκαηα Ηm θαη
Ηr δίρσο ηελ ύπαξμε μερσξηζηώλ θπθισκάησλ, έρνληαο κόλν ηε δπλαηόηεηα κέηξεζεο θαη ειέγρνπ ηνπ
ξεύκαηνο Is. O ζηόρνο ηνπ δηαλπζκαηηθνύ ειέγρνπ είλαη λα ππνινγηζηνύλ ηα δηαλύζκαηα ησλ ξεπκάησλ Ηm,
Ηr, έηζη ώζηε λα επηηεπρζεί απνζπδεπγκέλνο έιεγρνο ηεο ζπληζηώζαο ηνπ ξεύκαηνο πνπ παξάγεη ηε
καγλεηηθή ξνή θαη ηεο ζπληζηώζαο ηνπ ξεύκαηνο πνπ παξάγεη ηε ξνπή ζε όιεο ηηο πεξηπηώζεηο θνξηίνπ θαη
ηαρύηεηαο πεξηζηξνθήο κε ηαπηόρξνλε δηαηήξεζε ζηαζεξήο καγλεηηθήο ξνήο ζηνλ θηλεηήξα [33].
Vs
Low load
Ιr
ImIs
Equivalent circuit
Vs Vs
High load
φΙr
Is
Rs Lls Llr
Rr/sLm
Is Ir
Im
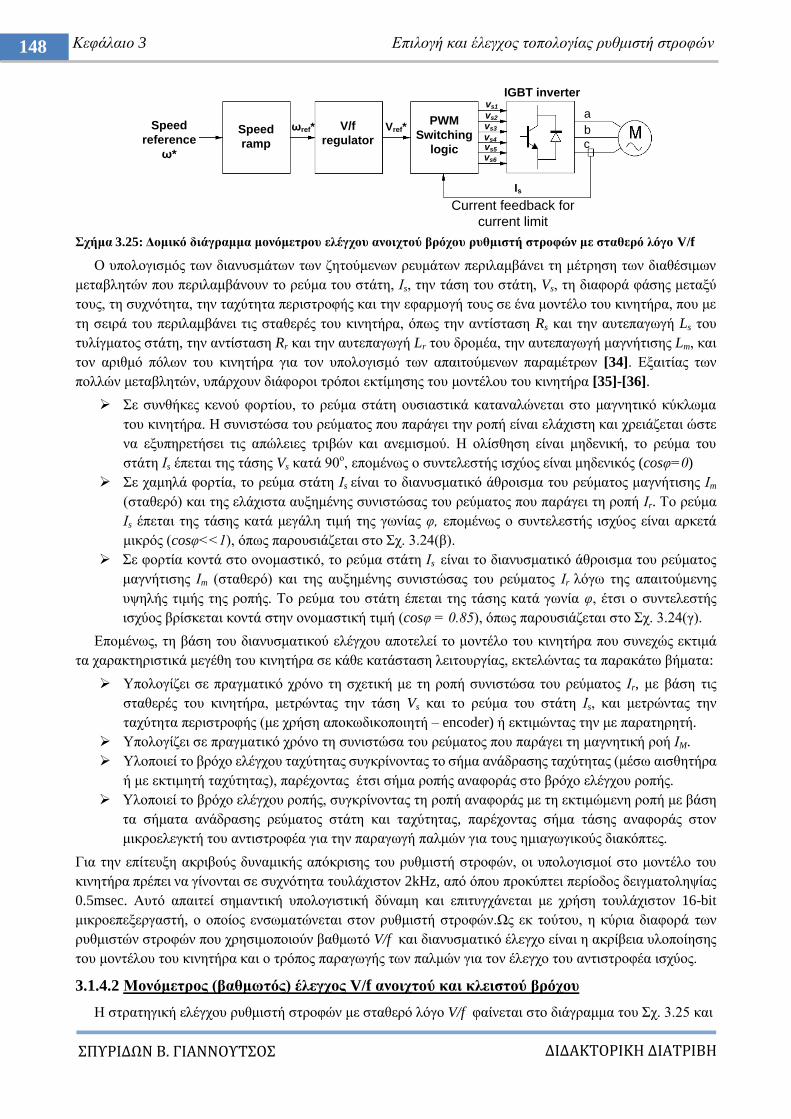
ΔΙΔΑΚΣΟΡΙΚΗ ΔΙΑΣΡΙΒΗ
ΠΤΡΙΔΩΝ Β. ΓΙΑΝΝΟΤΣΟ
148 Κεθάιαην 3 Δπηινγή θαη έιεγρνο ηνπνινγίαο ξπζκηζηή ζηξνθώλ
ρήκα 3.25: Γνκηθό δηάγξακκα κνλόκεηξνπ ειέγρνπ αλνηρηνύ βξόρνπ ξπζκηζηή ζηξνθώλ κε ζηαζεξό ιόγν V/f
Ο ππνινγηζκόο ησλ δηαλπζκάησλ ησλ δεηνύκελσλ ξεπκάησλ πεξηιακβάλεη ηε κέηξεζε ησλ δηαζέζηκσλ
κεηαβιεηώλ πνπ πεξηιακβάλνπλ ην ξεύκα ηνπ ζηάηε, Ηs, ηελ ηάζε ηνπ ζηάηε, Vs, ηε δηαθνξά θάζεο κεηαμύ
ηνπο, ηε ζπρλόηεηα, ηελ ηαρύηεηα πεξηζηξνθήο θαη ηελ εθαξκνγή ηνπο ζε έλα κνληέιν ηνπ θηλεηήξα, πνπ κε
ηε ζεηξά ηνπ πεξηιακβάλεη ηηο ζηαζεξέο ηνπ θηλεηήξα, όπσο ηελ αληίζηαζε Rs θαη ηελ απηεπαγσγή Ls ηνπ
ηπιίγκαηνο ζηάηε, ηελ αληίζηαζε Rr θαη ηελ απηεπαγσγή Lr ηνπ δξνκέα, ηελ απηεπαγσγή καγλήηηζεο Lm, θαη
ηνλ αξηζκό πόισλ ηνπ θηλεηήξα γηα ηνλ ππνινγηζκό ησλ απαηηνύκελσλ παξακέηξσλ [34]. Δμαηηίαο ησλ
πνιιώλ κεηαβιεηώλ, ππάξρνπλ δηάθνξνη ηξόπνη εθηίκεζεο ηνπ κνληέινπ ηνπ θηλεηήξα [35]-[36].
ε ζπλζήθεο θελνύ θνξηίνπ, ην ξεύκα ζηάηε νπζηαζηηθά θαηαλαιώλεηαη ζην καγλεηηθό θύθισκα
ηνπ θηλεηήξα. Ζ ζπληζηώζα ηνπ ξεύκαηνο πνπ παξάγεη ηελ ξνπή είλαη ειάρηζηε θαη ρξεηάδεηαη ώζηε
λα εμππεξεηήζεη ηηο απώιεηεο ηξηβώλ θαη αλεκηζκνύ. Ζ νιίζζεζε είλαη κεδεληθή, ην ξεύκα ηνπ
ζηάηε Ηs έπεηαη ηεο ηάζεο Vs θαηά 90ν, επνκέλσο ν ζπληειεζηήο ηζρύνο είλαη κεδεληθόο (cosθ=0)
ε ρακειά θνξηία, ην ξεύκα ζηάηε Ηs είλαη ην δηαλπζκαηηθό άζξνηζκα ηνπ ξεύκαηνο καγλήηηζεο Ηm
(ζηαζεξό) θαη ηεο ειάρηζηα απμεκέλεο ζπληζηώζαο ηνπ ξεύκαηνο πνπ παξάγεη ηε ξνπή Ηr. Σν ξεύκα
Ηs έπεηαη ηεο ηάζεο θαηά κεγάιε ηηκή ηεο γσλίαο θ, επνκέλσο ν ζπληειεζηήο ηζρύνο είλαη αξθεηά
κηθξόο (cosθ<<1), όπσο παξνπζηάδεηαη ζην ρ. 3.24(β).
ε θνξηία θνληά ζην νλνκαζηηθό, ην ξεύκα ζηάηε Ηs είλαη ην δηαλπζκαηηθό άζξνηζκα ηνπ ξεύκαηνο
καγλήηηζεο Ηm (ζηαζεξό) θαη ηεο απμεκέλεο ζπληζηώζαο ηνπ ξεύκαηνο Ηr ιόγσ ηεο απαηηνύκελεο
πςειήο ηηκήο ηεο ξνπήο. Σν ξεύκα ηνπ ζηάηε έπεηαη ηεο ηάζεο θαηά γσλία θ, έηζη ν ζπληειεζηήο
ηζρύνο βξίζθεηαη θνληά ζηελ νλνκαζηηθή ηηκή (cosθ = 0.85), όπσο παξνπζηάδεηαη ζην ρ. 3.24(γ).
Δπνκέλσο, ηε βάζε ηνπ δηαλπζκαηηθνύ ειέγρνπ απνηειεί ην κνληέιν ηνπ θηλεηήξα πνπ ζπλερώο εθηηκά
ηα ραξαθηεξηζηηθά κεγέζε ηνπ θηλεηήξα ζε θάζε θαηάζηαζε ιεηηνπξγίαο, εθηειώληαο ηα παξαθάησ βήκαηα:
Τπνινγίδεη ζε πξαγκαηηθό ρξόλν ηε ζρεηηθή κε ηε ξνπή ζπληζηώζα ηνπ ξεύκαηνο Ηr, κε βάζε ηηο
ζηαζεξέο ηνπ θηλεηήξα, κεηξώληαο ηελ ηάζε Vs θαη ην ξεύκα ηνπ ζηάηε Ηs, θαη κεηξώληαο ηελ
ηαρύηεηα πεξηζηξνθήο (κε ρξήζε απνθσδηθνπνηεηή – encoder) ή εθηηκώληαο ηελ κε παξαηεξεηή.
Τπνινγίδεη ζε πξαγκαηηθό ρξόλν ηε ζπληζηώζα ηνπ ξεύκαηνο πνπ παξάγεη ηε καγλεηηθή ξνή ΗM.
Τινπνηεί ην βξόρν ειέγρνπ ηαρύηεηαο ζπγθξίλνληαο ην ζήκα αλάδξαζεο ηαρύηεηαο (κέζσ αηζζεηήξα
ή κε εθηηκεηή ηαρύηεηαο), παξέρνληαο έηζη ζήκα ξνπήο αλαθνξάο ζην βξόρν ειέγρνπ ξνπήο.
Τινπνηεί ην βξόρν ειέγρνπ ξνπήο, ζπγθξίλνληαο ηε ξνπή αλαθνξάο κε ηε εθηηκώκελε ξνπή κε βάζε
ηα ζήκαηα αλάδξαζεο ξεύκαηνο ζηάηε θαη ηαρύηεηαο, παξέρνληαο ζήκα ηάζεο αλαθνξάο ζηνλ
κηθξνειεγθηή ηνπ αληηζηξνθέα γηα ηελ παξαγσγή παικώλ γηα ηνπο εκηαγσγηθνύο δηαθόπηεο.
Γηα ηελ επίηεπμε αθξηβνύο δπλακηθήο απόθξηζεο ηνπ ξπζκηζηή ζηξνθώλ, νη ππνινγηζκνί ζην κνληέιν ηνπ
θηλεηήξα πξέπεη λα γίλνληαη ζε ζπρλόηεηα ηνπιάρηζηνλ 2kHz, από όπνπ πξνθύπηεη πεξίνδνο δεηγκαηνιεςίαο
0.5msec. Απηό απαηηεί ζεκαληηθή ππνινγηζηηθή δύλακε θαη επηηπγράλεηαη κε ρξήζε ηνπιάρηζηνλ 16-bit
κηθξνεπεμεξγαζηή, ν νπνίνο ελζσκαηώλεηαη ζηνλ ξπζκηζηή ζηξνθώλ.Χο εθ ηνύηνπ, ε θύξηα δηαθνξά ησλ
ξπζκηζηώλ ζηξνθώλ πνπ ρξεζηκνπνηνύλ βαζκσηό V/f θαη δηαλπζκαηηθό έιεγρν είλαη ε αθξίβεηα πινπνίεζεο
ηνπ κνληέινπ ηνπ θηλεηήξα θαη ν ηξόπνο παξαγσγήο ησλ παικώλ γηα ηνλ έιεγρν ηνπ αληηζηξνθέα ηζρύνο.
3.1.4.2 Μνλόκεηξνο (βαζκσηόο) έιεγρνο V/f αλνηρηνύ θαη θιεηζηνύ βξόρνπ
Ζ ζηξαηεγηθή ειέγρνπ ξπζκηζηή ζηξνθώλ κε ζηαζεξό ιόγν V/f θαίλεηαη ζην δηάγξακκα ηνπ ρ. 3.25 θαη
Speed
reference
σ*
Speed
ramp
σref* Vref*V/f
regulator
PWM
Switching
logic
vs1
vs2
vs3
vs4
vs5
vs6
IGBT inverter
Is
Current feedback for
current limit
a
b
c
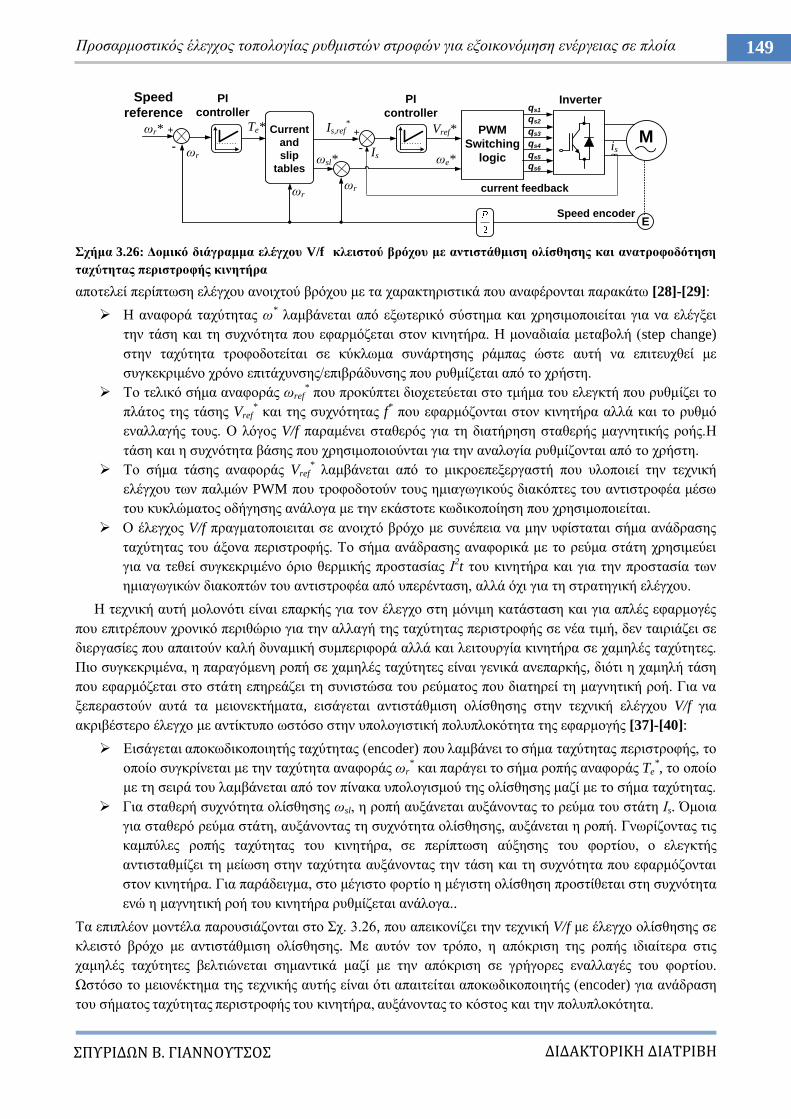
ΔΙΔΑΚΣΟΡΙΚΗ ΔΙΑΣΡΙΒΗ
ΠΤΡΙΔΩΝ Β. ΓΙΑΝΝΟΤΣΟ
149 Πξνζαξκνζηηθόο έιεγρνο ηνπνινγίαο ξπζκηζηώλ ζηξνθώλ γηα εμνηθνλόκεζε ελέξγεηαο ζε πινία
ρήκα 3.26: Γνκηθό δηάγξακκα ειέγρνπ V/f θιεηζηνύ βξόρνπ κε αληηζηάζκηζε νιίζζεζεο θαη αλαηξνθνδόηεζε
ηαρύηεηαο πεξηζηξνθήο θηλεηήξα
απνηειεί πεξίπησζε ειέγρνπ αλνηρηνύ βξόρνπ κε ηα ραξαθηεξηζηηθά πνπ αλαθέξνληαη παξαθάησ [28]-[29]:
H αλαθνξά ηαρύηεηαο σ* ιακβάλεηαη από εμσηεξηθό ζύζηεκα θαη ρξεζηκνπνηείηαη γηα λα ειέγμεη
ηελ ηάζε θαη ηε ζπρλόηεηα πνπ εθαξκόδεηαη ζηνλ θηλεηήξα. Ζ κνλαδηαία κεηαβνιή (step change)
ζηελ ηαρύηεηα ηξνθνδνηείηαη ζε θύθισκα ζπλάξηεζεο ξάκπαο ώζηε απηή λα επηηεπρζεί κε
ζπγθεθξηκέλν ρξόλν επηηάρπλζεο/επηβξάδπλζεο πνπ ξπζκίδεηαη από ην ρξήζηε.
Σν ηειηθό ζήκα αλαθνξάο σref* πνπ πξνθύπηεη δηνρεηεύεηαη ζην ηκήκα ηνπ ειεγθηή πνπ ξπζκίδεη ην
πιάηνο ηεο ηάζεο Vref* θαη ηεο ζπρλόηεηαο f
* πνπ εθαξκόδνληαη ζηνλ θηλεηήξα αιιά θαη ην ξπζκό
ελαιιαγήο ηνπο. Ο ιόγνο V/f παξακέλεη ζηαζεξόο γηα ηε δηαηήξεζε ζηαζεξήο καγλεηηθήο ξνήο.Ζ
ηάζε θαη ε ζπρλόηεηα βάζεο πνπ ρξεζηκνπνηνύληαη γηα ηελ αλαινγία ξπζκίδνληαη από ην ρξήζηε.
Σν ζήκα ηάζεο αλαθνξάο Vref* ιακβάλεηαη από ην κηθξνεπεμεξγαζηή πνπ πινπνηεί ηελ ηερληθή
ειέγρνπ ησλ παικώλ PWM πνπ ηξνθνδνηνύλ ηνπο εκηαγσγηθνύο δηαθόπηεο ηνπ αληηζηξνθέα κέζσ
ηνπ θπθιώκαηνο νδήγεζεο αλάινγα κε ηελ εθάζηνηε θσδηθνπνίεζε πνπ ρξεζηκνπνηείηαη.
Ο έιεγρνο V/f πξαγκαηνπνηεηηαη ζε αλνηρηό βξόρν κε ζπλέπεηα λα κελ πθίζηαηαη ζήκα αλάδξαζεο
ηαρύηεηαο ηνπ άμνλα πεξηζηξνθήο. Σν ζήκα αλάδξαζεο αλαθνξηθά κε ην ξεύκα ζηάηε ρξεζηκεύεη
γηα λα ηεζεί ζπγθεθξηκέλν όξην ζεξκηθήο πξνζηαζίαο Η2t ηνπ θηλεηήξα θαη γηα ηελ πξνζηαζία ησλ
εκηαγσγηθώλ δηαθνπηώλ ηνπ αληηζηξνθέα από ππεξέληαζε, αιιά όρη γηα ηε ζηξαηεγηθή ειέγρνπ.
Ζ ηερληθή απηή κνινλόηη είλαη επαξθήο γηα ηνλ έιεγρν ζηε κόληκε θαηάζηαζε θαη γηα απιέο εθαξκνγέο
πνπ επηηξέπνπλ ρξνληθό πεξηζώξην γηα ηελ αιιαγή ηεο ηαρύηεηαο πεξηζηξνθήο ζε λέα ηηκή, δελ ηαηξηάδεη ζε
δηεξγαζίεο πνπ απαηηνύλ θαιή δπλακηθή ζπκπεξηθνξά αιιά θαη ιεηηνπξγία θηλεηήξα ζε ρακειέο ηαρύηεηεο.
Πην ζπγθεθξηκέλα, ε παξαγόκελε ξνπή ζε ρακειέο ηαρύηεηεο είλαη γεληθά αλεπαξθήο, δηόηη ε ρακειή ηάζε
πνπ εθαξκόδεηαη ζην ζηάηε επεξεάδεη ηε ζπληζηώζα ηνπ ξεύκαηνο πνπ δηαηεξεί ηε καγλεηηθή ξνή. Γηα λα
μεπεξαζηνύλ απηά ηα κεηνλεθηήκαηα, εηζάγεηαη αληηζηάζκηζε νιίζζεζεο ζηελ ηερληθή ειέγρνπ V/f γηα
αθξηβέζηεξν έιεγρν κε αληίθηππν σζηόζν ζηελ ππνινγηζηηθή πνιππινθόηεηα ηεο εθαξκνγήο [37]-[40]:
Δηζάγεηαη απνθσδηθνπνηεηήο ηαρύηεηαο (encoder) πνπ ιακβάλεη ην ζήκα ηαρύηεηαο πεξηζηξνθήο, ην
νπνίν ζπγθξίλεηαη κε ηελ ηαρύηεηα αλαθνξάο σr* θαη παξάγεη ην ζήκα ξνπήο αλαθνξάο Te
*, ην νπνίν
κε ηε ζεηξά ηνπ ιακβάλεηαη από ηνλ πίλαθα ππνινγηζκνύ ηεο νιίζζεζεο καδί κε ην ζήκα ηαρύηεηαο.
Γηα ζηαζεξή ζπρλόηεηα νιίζζεζεο σsl, ε ξνπή απμάλεηαη απμάλνληαο ην ξεύκα ηνπ ζηάηε Ηs. Όκνηα
γηα ζηαζεξό ξεύκα ζηάηε, απμάλoληαο ηε ζπρλόηεηα νιίζζεζεο, απμάλεηαη ε ξνπή. Γλσξίδνληαο ηηο
θακπύιεο ξνπήο ηαρύηεηαο ηνπ θηλεηήξα, ζε πεξίπησζε αύμεζεο ηνπ θνξηίνπ, ν ειεγθηήο
αληηζηαζκίδεη ηε κείσζε ζηελ ηαρύηεηα απμάλνληαο ηελ ηάζε θαη ηε ζπρλόηεηα πνπ εθαξκόδνληαη
ζηνλ θηλεηήξα. Γηα παξάδεηγκα, ζην κέγηζην θνξηίν ε κέγηζηε νιίζζεζε πξνζηίζεηαη ζηε ζπρλόηεηα
ελώ ε καγλεηηθή ξνή ηνπ θηλεηήξα ξπζκίδεηαη αλάινγα..
Σα επηπιένλ κνληέια παξνπζηάδνληαη ζην ρ. 3.26, πνπ απεηθνλίδεη ηελ ηερληθή V/f κε έιεγρν νιίζζεζεο ζε
θιεηζηό βξόρν κε αληηζηάζκηζε νιίζζεζεο. Με απηόλ ηνλ ηξόπν, ε απόθξηζε ηεο ξνπήο ηδηαίηεξα ζηηο
ρακειέο ηαρύηεηεο βειηηώλεηαη ζεκαληηθά καδί κε ηελ απόθξηζε ζε γξήγνξεο ελαιιαγέο ηνπ θνξηίνπ.
Χζηόζν ην κεηνλέθηεκα ηεο ηερληθήο απηήο είλαη όηη απαηηείηαη απνθσδηθνπνηεηήο (encoder) γηα αλάδξαζε
ηνπ ζήκαηνο ηαρύηεηαο πεξηζηξνθήο ηνπ θηλεηήξα, απμάλνληαο ην θόζηνο θαη ηελ πνιππινθόηεηα.
PWM
Switching
logic
Speed
reference
σr* +
- σr
PI
controller
Speed encoder
σsl*
+
-
qs1
qs2
qs3
qs4
qs5
qs6
σe*
Inverter
MCurrent
and
slip
tables
is
Is,ref*
Is
Vref*
PI
controller
Te*
σrσr
E
current feedback
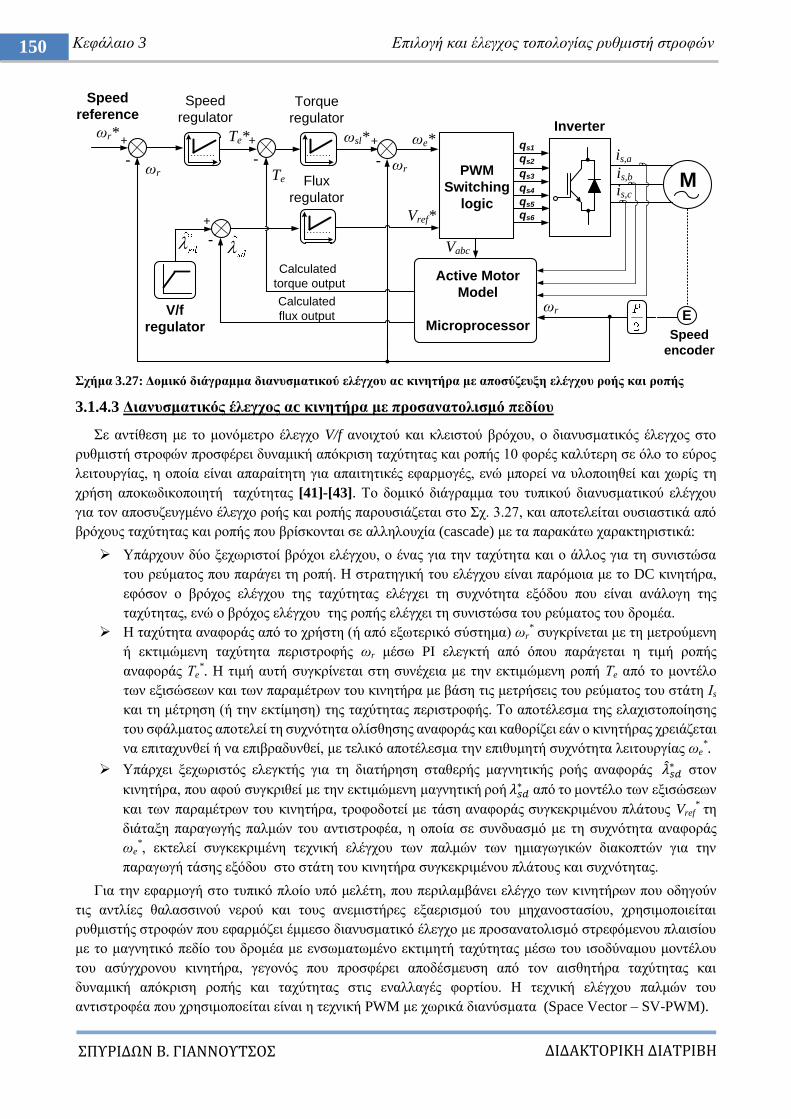
ΔΙΔΑΚΣΟΡΙΚΗ ΔΙΑΣΡΙΒΗ
ΠΤΡΙΔΩΝ Β. ΓΙΑΝΝΟΤΣΟ
150 Κεθάιαην 3 Δπηινγή θαη έιεγρνο ηνπνινγίαο ξπζκηζηή ζηξνθώλ
ρήκα 3.27: Γνκηθό δηάγξακκα δηαλπζκαηηθνύ ειέγρνπ αc θηλεηήξα κε απνζύδεπμε ειέγρνπ ξνήο θαη ξνπήο
3.1.4.3 Γηαλπζκαηηθόο έιεγρνο αc θηλεηήξα κε πξνζαλαηνιηζκό πεδίνπ
ε αληίζεζε κε ην κνλόκεηξν έιεγρν V/f αλνηρηνύ θαη θιεηζηνύ βξόρνπ, ν δηαλπζκαηηθόο έιεγρνο ζην
ξπζκηζηή ζηξνθώλ πξνζθέξεη δπλακηθή απόθξηζε ηαρύηεηαο θαη ξνπήο 10 θνξέο θαιύηεξε ζε όιν ην εύξνο
ιεηηνπξγίαο, ε νπνία είλαη απαξαίηεηε γηα απαηηεηηθέο εθαξκνγέο, ελώ κπνξεί λα πινπνηεζεί θαη ρσξίο ηε
ρξήζε απνθσδηθνπνηεηή ηαρύηεηαο [41]-[43]. Σν δνκηθό δηάγξακκα ηνπ ηππηθνύ δηαλπζκαηηθνύ ειέγρνπ
γηα ηνλ απνζπδεπγκέλν έιεγρν ξνήο θαη ξνπήο παξνπζηάδεηαη ζην ρ. 3.27, θαη απνηειείηαη νπζηαζηηθά από
βξόρνπο ηαρύηεηαο θαη ξνπήο πνπ βξίζθνληαη ζε αιιεινπρία (cascade) κε ηα παξαθάησ ραξαθηεξηζηηθά:
Τπάξρνπλ δύν μερσξηζηνί βξόρνη ειέγρνπ, ν έλαο γηα ηελ ηαρύηεηα θαη ν άιινο γηα ηε ζπληζηώζα
ηνπ ξεύκαηνο πνπ παξάγεη ηε ξνπή. Ζ ζηξαηεγηθή ηνπ ειέγρνπ είλαη παξόκνηα κε ην DC θηλεηήξα,
εθόζνλ ν βξόρνο ειέγρνπ ηεο ηαρύηεηαο ειέγρεη ηε ζπρλόηεηα εμόδνπ πνπ είλαη αλάινγε ηεο
ηαρύηεηαο, ελώ ν βξόρνο ειέγρνπ ηεο ξνπήο ειέγρεη ηε ζπληζηώζα ηνπ ξεύκαηνο ηνπ δξνκέα.
Ζ ηαρύηεηα αλαθνξάο από ην ρξήζηε (ή από εμσηεξηθό ζύζηεκα) σr* ζπγθξίλεηαη κε ηε κεηξνύκελε
ή εθηηκώκελε ηαρύηεηα πεξηζηξνθήο σr κέζσ PI ειεγθηή από όπνπ παξάγεηαη ε ηηκή ξνπήο
αλαθνξάο Σe*. H ηηκή απηή ζπγθξίλεηαη ζηε ζπλέρεηα κε ηελ εθηηκώκελε ξνπή Σe από ην κνληέιν
ησλ εμηζώζεσλ θαη ησλ παξακέηξσλ ηνπ θηλεηήξα κε βάζε ηηο κεηξήζεηο ηνπ ξεύκαηνο ηνπ ζηάηε Ηs
θαη ηε κέηξεζε (ή ηελ εθηίκεζε) ηεο ηαρύηεηαο πεξηζηξνθήο. Σν απνηέιεζκα ηεο ειαρηζηνπνίεζεο
ηνπ ζθάικαηνο απνηειεί ηε ζπρλόηεηα νιίζζεζεο αλαθνξάο θαη θαζνξίδεη εάλ ν θηλεηήξαο ρξεηάδεηαη
λα επηηαρπλζεί ή λα επηβξαδπλζεί, κε ηειηθό απνηέιεζκα ηελ επηζπκεηή ζπρλόηεηα ιεηηνπξγίαο σe*.
Τπάξρεη μερσξηζηόο ειεγθηήο γηα ηε δηαηήξεζε ζηαζεξήο καγλεηηθήο ξνήο αλαθνξάο ζηνλ
θηλεηήξα, πνπ αθνύ ζπγθξηζεί κε ηελ εθηηκώκελε καγλεηηθή ξνή από ην κνληέιν ησλ εμηζώζεσλ
θαη ησλ παξακέηξσλ ηνπ θηλεηήξα, ηξνθνδνηεί κε ηάζε αλαθνξάο ζπγθεθξηκέλνπ πιάηνπο Vref* ηε
δηάηαμε παξαγσγήο παικώλ ηνπ αληηζηξνθέα, ε νπνία ζε ζπλδπαζκό κε ηε ζπρλόηεηα αλαθνξάο
σe*, εθηειεί ζπγθεθξηκέλε ηερληθή ειέγρνπ ησλ παικώλ ησλ εκηαγσγηθώλ δηαθνπηώλ γηα ηελ
παξαγσγή ηάζεο εμόδνπ ζην ζηάηε ηνπ θηλεηήξα ζπγθεθξηκέλνπ πιάηνπο θαη ζπρλόηεηαο.
Γηα ηελ εθαξκνγή ζην ηππηθό πινίν ππό κειέηε, πνπ πεξηιακβάλεη ειέγρν ησλ θηλεηήξσλ πνπ νδεγνύλ
ηηο αληιίεο ζαιαζζηλνύ λεξνύ θαη ηνπο αλεκηζηήξεο εμαεξηζκνύ ηνπ κεραλνζηαζίνπ, ρξεζηκνπνηείηαη
ξπζκηζηήο ζηξνθώλ πνπ εθαξκόδεη έκκεζν δηαλπζκαηηθό έιεγρν κε πξνζαλαηνιηζκό ζηξεθόκελνπ πιαηζίνπ
κε ην καγλεηηθό πεδίν ηνπ δξνκέα κε ελζσκαησκέλν εθηηκεηή ηαρύηεηαο κέζσ ηνπ ηζνδύλακνπ κνληέινπ
ηνπ αζύγρξνλνπ θηλεηήξα, γεγνλόο πνπ πξνζθέξεη απνδέζκεπζε από ηνλ αηζζεηήξα ηαρύηεηαο θαη
δπλακηθή απόθξηζε ξνπήο θαη ηαρύηεηαο ζηηο ελαιιαγέο θνξηίνπ. Ζ ηερληθή ειέγρνπ παικώλ ηνπ
αληηζηξνθέα πνπ ρξεζηκνπνείηαη είλαη ε ηερληθή PWM κε ρσξηθά δηαλύζκαηα (Space Vector – SV-PWM).
PWM
Switching
logic
+
-σr
Te*+
-
M
Speed
encoder
Active Motor
Model
Microprocessor
Te
σsl*
is,a
qs1
qs2
qs3
qs4
qs5
qs6Vref*
Inverter
Speed
reference
σr*
Speed
regulatorTorque
regulator
V/f
regulator
+
-
Calculated
flux output
Flux
regulator
Calculated
torque output
Vabc
is,b
is,c
σr E
σe*
σr
+
-
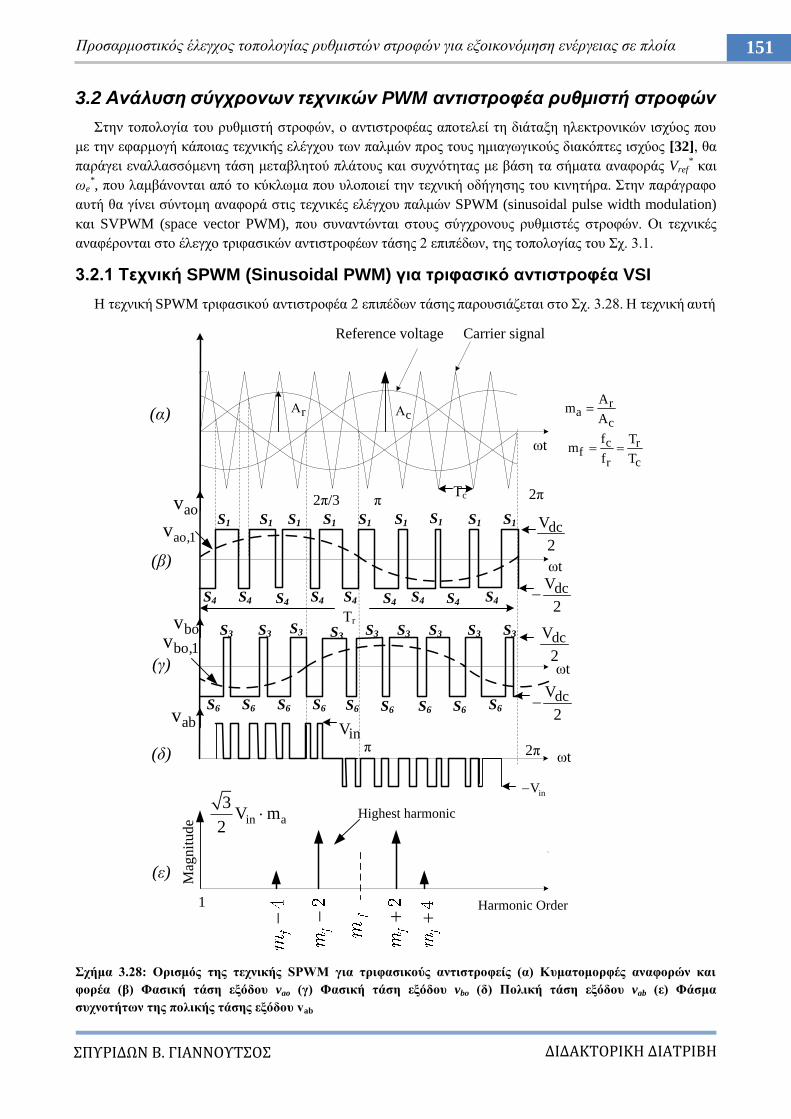
ΔΙΔΑΚΣΟΡΙΚΗ ΔΙΑΣΡΙΒΗ
ΠΤΡΙΔΩΝ Β. ΓΙΑΝΝΟΤΣΟ
151 Πξνζαξκνζηηθόο έιεγρνο ηνπνινγίαο ξπζκηζηώλ ζηξνθώλ γηα εμνηθνλόκεζε ελέξγεηαο ζε πινία
3.2 Ανάλςζη ζύγσπονυν ηεσνικών PWM ανηιζηποθέα πςθμιζηή ζηποθών
ηελ ηνπνινγία ηνπ ξπζκηζηή ζηξνθώλ, ν αληηζηξνθέαο απνηειεί ηε δηάηαμε ειεθηξνληθώλ ηζρύνο πνπ
κε ηελ εθαξκνγή θάπνηαο ηερληθήο ειέγρνπ ησλ παικώλ πξνο ηνπο εκηαγσγηθνύο δηαθόπηεο ηζρύνο [32], ζα
παξάγεη ελαιιαζζόκελε ηάζε κεηαβιεηνύ πιάηνπο θαη ζπρλόηεηαο κε βάζε ηα ζήκαηα αλαθνξάο Vref* θαη
σe*, πνπ ιακβάλνληαη από ην θύθισκα πνπ πινπνηεί ηελ ηερληθή νδήγεζεο ηνπ θηλεηήξα. ηελ παξάγξαθν
απηή ζα γίλεη ζύληνκε αλαθνξά ζηηο ηερληθέο ειέγρνπ παικώλ SPWM (sinusoidal pulse width modulation)
θαη SVPWM (space vector PWM), πνπ ζπλαληώληαη ζηνπο ζύγρξνλνπο ξπζκηζηέο ζηξνθώλ. Οη ηερληθέο
αλαθέξνληαη ζην έιεγρν ηξηθαζηθώλ αληηζηξνθέσλ ηάζεο 2 επηπέδσλ, ηεο ηνπνινγίαο ηνπ ρ. 3.1.
3.2.1 Σερληθή SPWM (Sinusoidal PWM) γηα ηξηθαζηθό αληηζηξνθέα VSI
H ηερληθή SPWM ηξηθαζηθνύ αληηζηξνθέα 2 επηπέδσλ ηάζεο παξνπζηάδεηαη ζην ρ. 3.28. Ζ ηερληθή απηή
ρήκα 3.28: Οξηζκόο ηεο ηερληθήο SPWM γηα ηξηθαζηθνύο αληηζηξνθείο (α) Κπκαηνκνξθέο αλαθνξώλ θαη
θνξέα (β) Φαζηθή ηάζε εμόδνπ vao (γ) Φαζηθή ηάζε εμόδνπ vbo (δ) Πνιηθή ηάζε εμόδνπ vab (ε) Φάζκα
ζπρλνηήησλ ηεο πνιηθήο ηάζεο εμόδνπ vab
σt
Σc
(α)
σt
S4 S4 S4 S4 S4 S4 S4 S4 S4
S1 S1 S1 S1 S1 S1 S1 S1 S1
2π
Σr
σt
S6 S6 S6 S6 S6 S6 S6 S6 S6
S3 S3 S3 S3 S3 S3 S3 S3S3
(β)
(γ)
π2π/3
σt2π(δ)
(ε)
1
in a
3V m
2
inV
inV
dcV
2
dcV
2
dcV
2
dcV
2
abv
aov
bov
Harmonic Order
Mag
nit
ud
e
ra
c
Am
A
c rf
r c
f Tm
f T
π
bo,1v
ao,1v
Highest harmonic
rc
Reference voltage Carrier signal
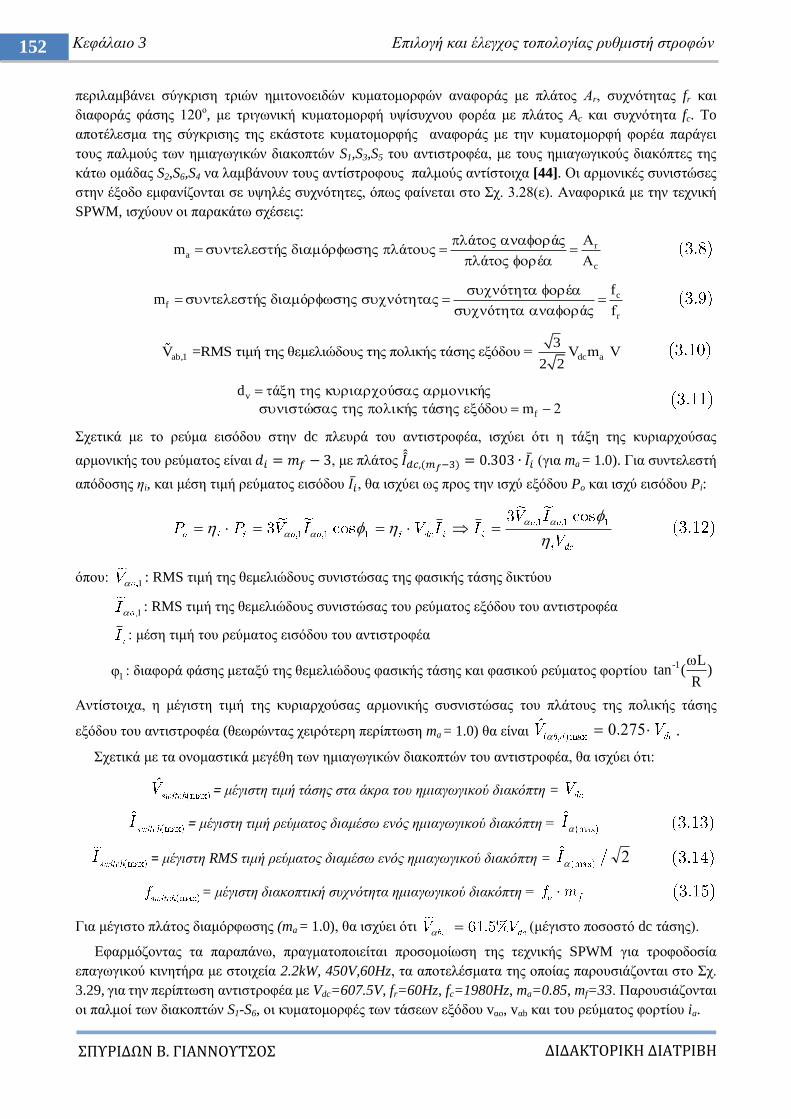
ΔΙΔΑΚΣΟΡΙΚΗ ΔΙΑΣΡΙΒΗ
ΠΤΡΙΔΩΝ Β. ΓΙΑΝΝΟΤΣΟ
152 Κεθάιαην 3 Δπηινγή θαη έιεγρνο ηνπνινγίαο ξπζκηζηή ζηξνθώλ
πεξηιακβάλεη ζύγθξηζε ηξηώλ εκηηνλνεηδώλ θπκαηνκνξθώλ αλαθνξάο κε πιάηνο Αr, ζπρλόηεηαο fr θαη
δηαθνξάο θάζεο 120ν, κε ηξηγσληθή θπκαηνκνξθή πςίζπρλνπ θνξέα κε πιάηνο Ac θαη ζπρλόηεηα fc. To
απνηέιεζκα ηεο ζύγθξηζεο ηεο εθάζηνηε θπκαηνκνξθήο αλαθνξάο κε ηελ θπκαηνκνξθή θνξέα παξάγεη
ηνπο παικνύο ησλ εκηαγσγηθώλ δηαθνπηώλ S1,S3,S5 ηνπ αληηζηξνθέα, κε ηνπο εκηαγσγηθνύο δηαθόπηεο ηεο
θάησ νκάδαο S2,S6,S4 λα ιακβάλνπλ ηνπο αληίζηξνθνπο παικνύο αληίζηνηρα [44]. Οη αξκνληθέο ζπληζηώζεο
ζηελ έμνδν εκθαλίδνληαη ζε πςειέο ζπρλόηεηεο, όπσο θαίλεηαη ζην ρ. 3.28(ε). Αλαθνξηθά κε ηελ ηερληθή
SPWM, ηζρύνπλ νη παξαθάησ ζρέζεηο:
ra
c
ά άm ή ό ά
ά έ A
cf
r
fό έm ή ό ό
ό ά f
ab,1 dc a
3V =RMS ηιμή ηης θεμελιώδους ηης πολικής ηάζης εξόδου = V m V
2 2
v
f
d ά ύ ή
ώ ή ά ό m 2
ρεηηθά κε ην ξεύκα εηζόδνπ ζηελ dc πιεπξά ηνπ αληηζηξνθέα, ηζρύεη όηη ε ηάμε ηεο θπξηαξρνύζαο
αξκνληθήο ηνπ ξεύκαηνο είλαη , κε πιάηνο (γηα ma = 1.0). Γηα ζπληειεζηή
απόδνζεο εi, θαη κέζε ηηκή ξεύκαηνο εηζόδνπ , ζα ηζρύεη σο πξνο ηελ ηζρύ εμόδνπ Po θαη ηζρύ εηζόδνπ Pi:
όπνπ: 1: RMS ηηκή ηεο ζεκειηώδνπο ζπληζηώζαο ηεο θαζηθήο ηάζεο δηθηύνπ
1: RMS ηηκή ηεο ζεκειηώδνπο ζπληζηώζαο ηνπ ξεύκαηνο εμόδνπ ηνπ αληηζηξνθέα
: κέζε ηηκή ηνπ ξεύκαηνο εηζόδνπ ηνπ αληηζηξνθέα
1θ : δηαθνξά θάζεο κεηαμύ ηεο ζεκειηώδνπο θαζηθήο ηάζεο θαη θαζηθνύ ξεύκαηνο θνξηίνπ -1 L
tan ( )R
Αληίζηνηρα, ε κέγηζηε ηηκή ηεο θπξηαξρνύζαο αξκνληθήο ζπζληζηώζαο ηνπ πιάηνπο ηεο πνιηθήο ηάζεο
εμόδνπ ηνπ αληηζηξνθέα (ζεσξώληαο ρεηξόηεξε πεξίπησζε ma = 1.0) ζα είλαη 2750 .
ρεηηθά κε ηα νλνκαζηηθά κεγέζε ησλ εκηαγσγηθώλ δηαθνπηώλ ηνπ αληηζηξνθέα, ζα ηζρύεη όηη:
= κέγηζηε ηηκή ηάζεο ζηα άθξα ηνπ εκηαγσγηθνύ δηαθόπηε =
= κέγηζηε ηηκή ξεύκαηνο δηακέζσ ελόο εκηαγσγηθνύ δηαθόπηε =
= κέγηζηε RMS ηηκή ξεύκαηνο δηακέζσ ελόο εκηαγσγηθνύ δηαθόπηε = 2
= κέγηζηε δηαθνπηηθή ζπρλόηεηα εκηαγσγηθνύ δηαθόπηε =
Γηα κέγηζην πιάηνο δηακόξθσζεο (ma = 1.0), ζα ηζρύεη όηη (κέγηζην πνζνζηό dc ηάζεο).
Δθαξκόδνληαο ηα παξαπάλσ, πξαγκαηνπνηείηαη πξνζνκνίσζε ηεο ηερληθήο SPWM γηα ηξνθνδνζία
επαγσγηθνύ θηλεηήξα κε ζηνηρεία 2.2kW, 450V,60Hz, ηα απνηειέζκαηα ηεο νπνίαο παξνπζηάδνληαη ζην ρ.
3.29, γηα ηελ πεξίπησζε αληηζηξνθέα κε Vdc=607.5V, fr=60Hz, fc=1980Hz, ma=0.85, mf=33. Παξνπζηάδνληαη
νη παικνί ησλ δηαθνπηώλ S1-S6, νη θπκαηνκνξθέο ησλ ηάζεσλ εμόδνπ vαν, vαb θαη ηνπ ξεύκαηνο θνξηίνπ ia.
ΔΙΔΑΚΣΟΡΙΚΗ ΔΙΑΣΡΙΒΗ
ΠΤΡΙΔΩΝ Β. ΓΙΑΝΝΟΤΣΟ
153 Πξνζαξκνζηηθόο έιεγρνο ηνπνινγίαο ξπζκηζηώλ ζηξνθώλ γηα εμνηθνλόκεζε ελέξγεηαο ζε πινία
(α)
(β)
(γ)
ρήκα 3.29: Πξνζνκνίσζε ηερληθήο SPWM γηα ηξηθαζηθό VSI 2 επηπέδσλ ηάζεο (ma=0.85, mf=33, fc=1980Hz) (α)
ύγθξηζε θπκαηνκνξθήο αλαθνξάο πιάηνπο Αr, ζπρλόηεηαο fr κε θπκαηνκνξθή θνξέα πιάηνπο Αc, ζπρλόηεηαο fc
(β) Παικνί δηαθνπηώλ S1-S6 (γ) Κπκαηνκνξθέο εμόδνπ θαζηθήο ηάζεο vao, πνιηθήο ηάζεο vab, ξεύκαηνο θνξηίνπ ia
ΔΙΔΑΚΣΟΡΙΚΗ ΔΙΑΣΡΙΒΗ
ΠΤΡΙΔΩΝ Β. ΓΙΑΝΝΟΤΣΟ
154 Κεθάιαην 3 Δπηινγή θαη έιεγρνο ηνπνινγίαο ξπζκηζηή ζηξνθώλ
3.2.2 Σερληθή SV-PWM ειέγρνπ ηξηθαζηθνύ αληηζηξνθέα κε ρσξηθά δηαλύζκαηα
Ζ ηερληθή SV-PWM πξόθεηηαη νπζηαζηηθά γηα ηνλ έιεγρν ρσξηθώλ δηαλπζκάησλ ηάζεσο κε βάζε
ζπγθεθξηκέλε αθνινπζία δηαθνπηηθώλ ζπλδπαζκώλ ηνπ αληηζηξνθέα [44]–[45]. Πην ζπγθεθξηκέλα, κε
γλσζηό ρσξηθό δηάλπζκα ηάζεο αλαθνξάο, ε ηερληθή SV-PWM ππνινγίδεη ηε βέιηηζηε δηαθνπηηθή αθνινπζία
γηα ηνλ ηξηθαζηθό αληηζηξνθέα, εμαζθαιίδνληαο όηη ιακβάλεηαη ην επηζπκεηό ρσξηθό δηάλπζκα ηάζεο. Οη
ππνινγηζκνί πξαγκαηνπνηνύληαη ζην ζηαζεξό πιαίζην αλαθνξάο α-β ή ζην πιαίζην ρσξηθώλ δηαλπζκάησλ.
Θεσξείηαη θαηαιιειόηεξε γηα εθαξκνγέο νδήγεζεο θηλεηήξσλ εμαηηίαο αληαγσληζηηθώλ πιενλεθηεκάησλ
ζε ζρέζε κε ηελ πξόηεξε ηερληθή SPWM, πνπ πεξηιακβάλνπλ θαιύηεξε αμηνπνίεζε ηεο DC πεγήο ηάζεο,
ιηγόηεξεο δηαθνπηηθέο απώιεηεο θαη κηθξόηεξε ζηηγκηαία δηαθύκαλζε ζην ξεύκα ηνπ θηλεηήξα [46]-[48].
3.2.2.1 Μεηαζρεκαηηζκόο Clarke
Ζ ηερληθή SV-PWM βαζίδεηαη ζην κεηαζρεκαηηζκό Clarke, πνπ πεξηιακβάλεη ηε κεηαθνξά ηξηθαζηθώλ
δηαλπζκάησλ ηάζεο θαη ξεύκαηνο ζε ζηαζεξό δηθαζηθό πιαίζην αλαθνξάο α-β [44]-[48]. Αγλνώληαο ηε
ζπληζηώζα κεδεληθήο αθνινπζίαο, θαη ζεσξώληαο κήηξα κεηαζρεκαηηζκνύ Κabc-αβ, ην δηάλπζκα ηάζεο va(t),
vb(t), vc(t) κεηαζρεκαηίδεηαη ζηελ αθνινπζία πα (t),πβ (t) σο εμήο:
Σν ρσξηθό δηάλπζκα ηάζεο παξηζηάλεηαη ζην ρ. 3.30(α) γηα ρξνληθά κεηαβαιιόκελε γσλία σet+θπ:
Γηα ζπκκεηξηθή ηξηθαζηθή αθνινπζία ηάζεσλ, όπσο θαίλεηαη ζην ρ. 3.30(β), ην ρσξηθό δηάλπζκα ηάζεο ζα
πεξηζηξέθεηαη ζε θύθιν σο πξνο ηνπο άμνλεο πα (t),πβ (t) θαη ζα εθηειεί πιήξε πεξηζηξνθή ζε κηα πεξίνδν,
όπσο παξνπζηάδεηαη ζην ρ. 3.30(γ). Αληίζηνηρα ν αληίζηξνθνο κεηαζρεκαηηζκόο Clarke, αγλνώληαο ηα
ξεύκαηα κεδεληθήο αθνινπζίαο, είλαη:
(α) (β) (γ)
ρήκα 3.30: Οξηζκόο θαη απεηθόληζε κεηαζρεκαηηζκνύ Clarke (α) Υσξηθό δηάλπζκα ηάζεο ζε άμνλεο πα (t), πβ(t)
(β) πκκεηξηθή ηξηθαζηθή αθνινπζία ηάζεσλ πa(t), πb(t), πc(t) (γ) Γηαδξνκή ρσξηθνύ δηαλύζκαηνο ζε κηα πεξίνδν
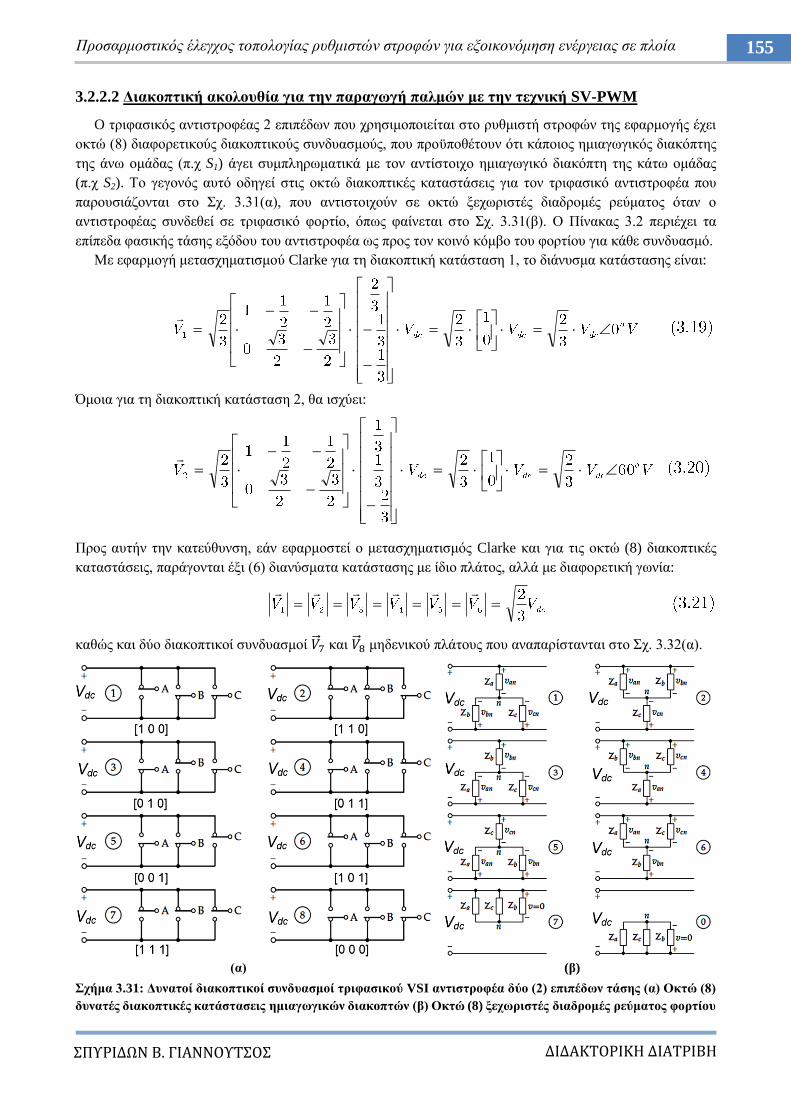
ΔΙΔΑΚΣΟΡΙΚΗ ΔΙΑΣΡΙΒΗ
ΠΤΡΙΔΩΝ Β. ΓΙΑΝΝΟΤΣΟ
155 Πξνζαξκνζηηθόο έιεγρνο ηνπνινγίαο ξπζκηζηώλ ζηξνθώλ γηα εμνηθνλόκεζε ελέξγεηαο ζε πινία
3.2.2.2 Γηαθνπηηθή αθνινπζία γηα ηελ παξαγσγή παικώλ κε ηελ ηερληθή SV-PWM
O ηξηθαζηθόο αληηζηξνθέαο 2 επηπέδσλ πνπ ρξεζηκνπνηείηαη ζην ξπζκηζηή ζηξνθώλ ηεο εθαξκνγήο έρεη
νθηώ (8) δηαθνξεηηθνύο δηαθνπηηθνύο ζπλδπαζκνύο, πνπ πξνϋπνζέηνπλ όηη θάπνηνο εκηαγσγηθόο δηαθόπηεο
ηεο άλσ νκάδαο (π.ρ S1) άγεη ζπκπιεξσκαηηθά κε ηνλ αληίζηνηρν εκηαγσγηθό δηαθόπηε ηεο θάησ νκάδαο
(π.ρ S2). Σν γεγνλόο απηό νδεγεί ζηηο νθηώ δηαθνπηηθέο θαηαζηάζεηο γηα ηνλ ηξηθαζηθό αληηζηξνθέα πνπ
παξνπζηάδνληαη ζην ρ. 3.31(α), πνπ αληηζηνηρνύλ ζε νθηώ μερσξηζηέο δηαδξνκέο ξεύκαηνο όηαλ ν
αληηζηξνθέαο ζπλδεζεί ζε ηξηθαζηθό θνξηίν, όπσο θαίλεηαη ζην ρ. 3.31(β). Ο Πίλαθαο 3.2 πεξηέρεη ηα
επίπεδα θαζηθήο ηάζεο εμόδνπ ηνπ αληηζηξνθέα σο πξνο ηνλ θνηλό θόκβν ηνπ θνξηίνπ γηα θάζε ζπλδπαζκό.
Με εθαξκνγή κεηαζρεκαηηζκνύ Clarke γηα ηε δηαθνπηηθή θαηάζηαζε 1, ην δηάλπζκα θαηάζηαζεο είλαη:
Όκνηα γηα ηε δηαθνπηηθή θαηάζηαζε 2, ζα ηζρύεη:
Πξνο απηήλ ηελ θαηεύζπλζε, εάλ εθαξκνζηεί ν κεηαζρεκαηηζκόο Clarke θαη γηα ηηο νθηώ (8) δηαθνπηηθέο
θαηαζηάζεηο, παξάγνληαη έμη (6) δηαλύζκαηα θαηάζηαζεο κε ίδην πιάηνο, αιιά κε δηαθνξεηηθή γσλία:
θαζώο θαη δύν δηαθνπηηθνί ζπλδπαζκνί θαη κεδεληθνύ πιάηνπο πνπ αλαπαξίζηαληαη ζην ρ. 3.32(α).
(α) (β)
ρήκα 3.31: Γπλαηνί δηαθνπηηθνί ζπλδπαζκνί ηξηθαζηθνύ VSI αληηζηξνθέα δύν (2) επηπέδσλ ηάζεο (α) Οθηώ (8)
δπλαηέο δηαθνπηηθέο θαηάζηαζεηο εκηαγσγηθώλ δηαθνπηώλ (β) Οθηώ (8) μερσξηζηέο δηαδξνκέο ξεύκαηνο θνξηίνπ
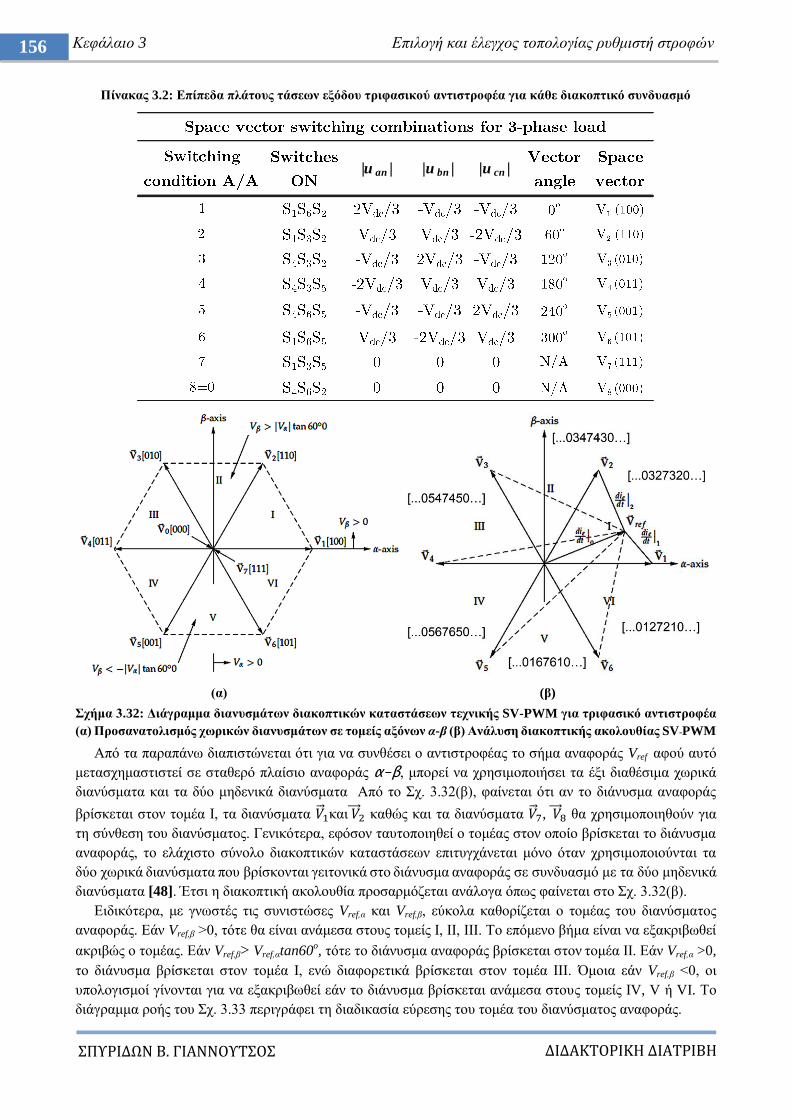
ΔΙΔΑΚΣΟΡΙΚΗ ΔΙΑΣΡΙΒΗ
ΠΤΡΙΔΩΝ Β. ΓΙΑΝΝΟΤΣΟ
156 Κεθάιαην 3 Δπηινγή θαη έιεγρνο ηνπνινγίαο ξπζκηζηή ζηξνθώλ
Πίλαθαο 3.2: Δπίπεδα πιάηνπο ηάζεσλ εμόδνπ ηξηθαζηθνύ αληηζηξνθέα γηα θάζε δηαθνπηηθό ζπλδπαζκό
(α) (β)
ρήκα 3.32: Γηάγξακκα δηαλπζκάησλ δηαθνπηηθώλ θαηαζηάζεσλ ηερληθήο SV-PWM γηα ηξηθαζηθό αληηζηξνθέα
(α) Πξνζαλαηνιηζκόο ρσξηθώλ δηαλπζκάησλ ζε ηνκείο αμόλσλ α-β (β) Αλάιπζε δηαθνπηηθήο αθνινπζίαο SV-PWM
Από ηα παξαπάλσ δηαπηζηώλεηαη όηη γηα λα ζπλζέζεη ν αληηζηξνθέαο ην ζήκα αλαθνξάο Vref αθνύ απηό
κεηαζρεκαζηηζηεί ζε ζηαζεξό πιαίζην αλαθνξάο α-β, κπνξεί λα ρξεζηκνπνηήζεη ηα έμη δηαζέζηκα ρσξηθά
δηαλύζκαηα θαη ηα δύν κεδεληθά δηαλύζκαηα Από ην ρ. 3.32(β), θαίλεηαη όηη αλ ην δηάλπζκα αλαθνξάο
βξίζθεηαη ζηνλ ηνκέα Η, ηα δηαλύζκαηα θαη θαζώο θαη ηα δηαλύζκαηα , ζα ρξεζηκνπνηεζνύλ γηα
ηε ζύλζεζε ηνπ δηαλύζκαηνο. Γεληθόηεξα, εθόζνλ ηαπηνπνηεζεί ν ηνκέαο ζηνλ νπνίν βξίζθεηαη ην δηάλπζκα
αλαθνξάο, ην ειάρηζην ζύλνιν δηαθνπηηθώλ θαηαζηάζεσλ επηηπγράλεηαη κόλν όηαλ ρξεζηκνπνηνύληαη ηα
δύν ρσξηθά δηαλύζκαηα πνπ βξίζθνληαη γεηηνληθά ζην δηάλπζκα αλαθνξάο ζε ζπλδπαζκό κε ηα δύν κεδεληθά
δηαλύζκαηα [48]. Έηζη ε δηαθνπηηθή αθνινπζία πξνζαξκόδεηαη αλάινγα όπσο θαίλεηαη ζην ρ. 3.32(β).
Δηδηθόηεξα, κε γλσζηέο ηηο ζπληζηώζεο Vref,α θαη Vref,β, εύθνια θαζνξίδεηαη ν ηνκέαο ηνπ δηαλύζκαηνο
αλαθνξάο. Δάλ Vref,β >0, ηόηε ζα είλαη αλάκεζα ζηνπο ηνκείο Η, ΗΗ, ΗΗΗ. Σν επόκελν βήκα είλαη λα εμαθξηβσζεί
αθξηβώο ν ηνκέαο. Δάλ Vref,β> Vref,αtan60o, ηόηε ην δηάλπζκα αλαθνξάο βξίζθεηαη ζηνλ ηνκέα ΗΗ. Δάλ Vref,α >0,
ην δηάλπζκα βξίζθεηαη ζηνλ ηνκέα Η, ελώ δηαθνξεηηθά βξίζθεηαη ζηνλ ηνκέα ΗΗΗ. Όκνηα εάλ Vref,β <0, νη
ππνινγηζκνί γίλνληαη γηα λα εμαθξηβσζεί εάλ ην δηάλπζκα βξίζθεηαη αλάκεζα ζηνπο ηνκείο ΗV, V ή VI. Σν
δηάγξακκα ξνήο ηνπ ρ. 3.33 πεξηγξάθεη ηε δηαδηθαζία εύξεζεο ηνπ ηνκέα ηνπ δηαλύζκαηνο αλαθνξάο.
|u an | |u bn | |u cn |
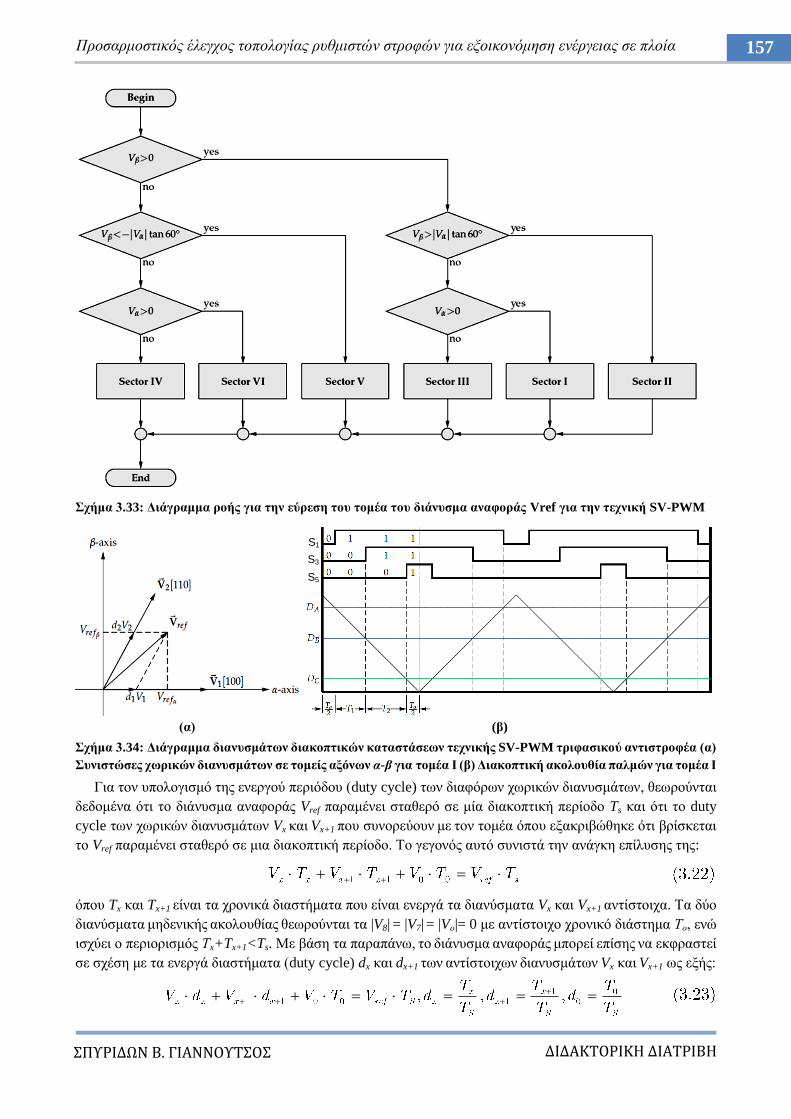
ΔΙΔΑΚΣΟΡΙΚΗ ΔΙΑΣΡΙΒΗ
ΠΤΡΙΔΩΝ Β. ΓΙΑΝΝΟΤΣΟ
157 Πξνζαξκνζηηθόο έιεγρνο ηνπνινγίαο ξπζκηζηώλ ζηξνθώλ γηα εμνηθνλόκεζε ελέξγεηαο ζε πινία
ρήκα 3.33: Γηάγξακκα ξνήο γηα ηελ εύξεζε ηνπ ηνκέα ηνπ δηάλπζκα αλαθνξάο Vref γηα ηελ ηερληθή SV-PWM
(α) (β)
ρήκα 3.34: Γηάγξακκα δηαλπζκάησλ δηαθνπηηθώλ θαηαζηάζεσλ ηερληθήο SV-PWM ηξηθαζηθνύ αληηζηξνθέα (α)
πληζηώζεο ρσξηθώλ δηαλπζκάησλ ζε ηνκείο αμόλσλ α-β γηα ηνκέα Ι (β) Γηαθνπηηθή αθνινπζία παικώλ γηα ηνκέα Ι
Γηα ηνλ ππνινγηζκό ηεο ελεξγνύ πεξηόδνπ (duty cycle) ησλ δηαθόξσλ ρσξηθώλ δηαλπζκάησλ, ζεσξνύληαη
δεδνκέλα όηη ην δηάλπζκα αλαθνξάο Vref παξακέλεη ζηαζεξό ζε κία δηαθνπηηθή πεξίνδν Ts θαη όηη ην duty
cycle ησλ ρσξηθώλ δηαλπζκάησλ Vx θαη Vx+1 πνπ ζπλνξεύνπλ κε ηνλ ηνκέα όπνπ εμαθξηβώζεθε όηη βξίζθεηαη
ην Vref παξακέλεη ζηαζεξό ζε κηα δηαθνπηηθή πεξίνδν. Σν γεγνλόο απηό ζπληζηά ηελ αλάγθε επίιπζεο ηεο:
όπνπ Tx θαη Tx+1 είλαη ηα ρξνληθά δηαζηήκαηα πνπ είλαη ελεξγά ηα δηαλύζκαηα Vx θαη Vx+1 αληίζηνηρα. Σα δύν
δηαλύζκαηα κεδεληθήο αθνινπζίαο ζεσξνύληαη ηα |V8| = |V7| = |Vν|= 0 κε αληίζηνηρν ρξνληθό δηάζηεκα Σν, ελώ
ηζρύεη ν πεξηνξηζκόο Σx+Tx+1<Ts. Με βάζε ηα παξαπάλσ, ην δηάλπζκα αλαθνξάο κπνξεί επίζεο λα εθθξαζηεί
ζε ζρέζε κε ηα ελεξγά δηαζηήκαηα (duty cycle) dx θαη dx+1 ησλ αληίζηνηρσλ δηαλπζκάησλ Vx θαη Vx+1 σο εμήο:
S1
S3
S5
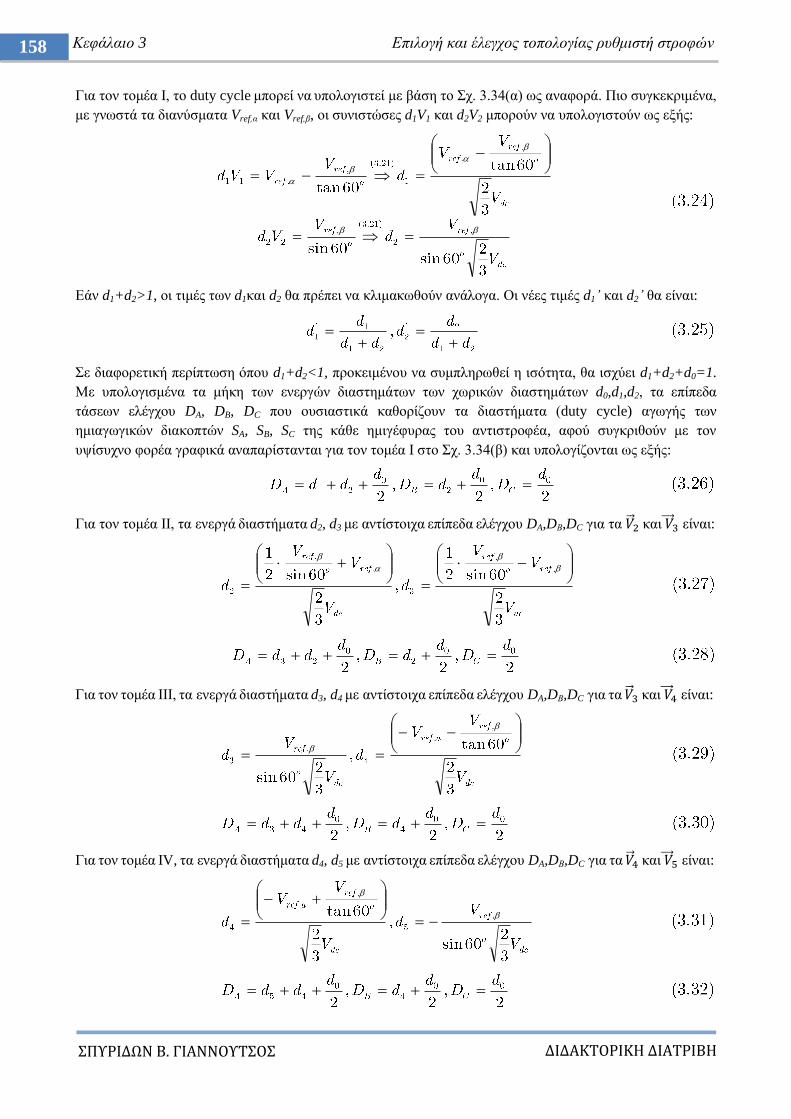
ΔΙΔΑΚΣΟΡΙΚΗ ΔΙΑΣΡΙΒΗ
ΠΤΡΙΔΩΝ Β. ΓΙΑΝΝΟΤΣΟ
158 Κεθάιαην 3 Δπηινγή θαη έιεγρνο ηνπνινγίαο ξπζκηζηή ζηξνθώλ
Γηα ηνλ ηνκέα Η, ην duty cycle κπνξεί λα ππνινγηζηεί κε βάζε ην ρ. 3.34(α) σο αλαθνξά. Πην ζπγθεθξηκέλα,
κε γλσζηά ηα δηαλύζκαηα Vref,α θαη Vref,β, νη ζπληζηώζεο d1V1 θαη d2V2 κπνξνύλ λα ππνινγηζηνύλ σο εμήο:
Δάλ d1+d2>1, νη ηηκέο ησλ d1θαη d2 ζα πξέπεη λα θιηκαθσζνύλ αλάινγα. Οη λέεο ηηκέο d1’ θαη d2’ ζα είλαη:
ε δηαθνξεηηθή πεξίπησζε όπνπ d1+d2<1, πξνθεηκέλνπ λα ζπκπιεξσζεί ε ηζόηεηα, ζα ηζρύεη d1+d2+d0=1.
Με ππνινγηζκέλα ηα κήθε ησλ ελεξγώλ δηαζηεκάησλ ησλ ρσξηθώλ δηαζηεκάησλ d0,d1,d2, ηα επίπεδα
ηάζεσλ ειέγρνπ DA, DB, DC πνπ νπζηαζηηθά θαζνξίδνπλ ηα δηαζηήκαηα (duty cycle) αγσγήο ησλ
εκηαγσγηθώλ δηαθνπηώλ SA, SB, SC ηεο θάζε εκηγέθπξαο ηνπ αληηζηξνθέα, αθνύ ζπγθξηζνύλ κε ηνλ
πςίζπρλν θνξέα γξαθηθά αλαπαξίζηαληαη γηα ηνλ ηνκέα Η ζην ρ. 3.34(β) θαη ππνινγίδνληαη σο εμήο:
Γηα ηνλ ηνκέα ΗΗ, ηα ελεξγά δηαζηήκαηα d2, d3 κε αληίζηνηρα επίπεδα ειέγρνπ DA,DΒ,DC γηα ηα θαη είλαη:
Γηα ηνλ ηνκέα ΗΗΗ, ηα ελεξγά δηαζηήκαηα d3, d4 κε αληίζηνηρα επίπεδα ειέγρνπ DA,DΒ,DC γηα ηα θαη είλαη:
Γηα ηνλ ηνκέα ΗV, ηα ελεξγά δηαζηήκαηα d4, d5 κε αληίζηνηρα επίπεδα ειέγρνπ DA,DΒ,DC γηα ηα θαη είλαη:
ΔΙΔΑΚΣΟΡΙΚΗ ΔΙΑΣΡΙΒΗ
ΠΤΡΙΔΩΝ Β. ΓΙΑΝΝΟΤΣΟ
159 Πξνζαξκνζηηθόο έιεγρνο ηνπνινγίαο ξπζκηζηώλ ζηξνθώλ γηα εμνηθνλόκεζε ελέξγεηαο ζε πινία
Γηα ηνλ ηνκέα V, ηα ελεξγά δηαζηήκαηα d5, d6 κε αληίζηνηρα επίπεδα ειέγρνπ DA,DΒ,DC γηα ηα θαη είλαη:
Γηα ηνλ ηνκέα VI, ηα ελεξγά δηαζηήκαηα d6, d1 κε αληίζηνηρα επίπεδα ειέγρνπ DA,DΒ,DC γηα ηα θαη είλαη:
ηε γξακκηθή πεξηνρή ιεηηνπξγίαο, ην επηζπκεηό δηάλπζκα θαηάζηαζεο πάληνηε παξακέλεη εληόο ηνπ
θαλνληθνύ εμαγώλνπ. ηελ πεξίπησζε απηή, ν δείθηεο δηακόξθσζεο δίλεηαη από ηε ζρέζε:
όπνπ ην επηζπκεηό πιάηνο ηεο ζεκειηώδνπο ζπληζηώζαο ηεο θαζηθήο ηάζεο εμόδνπ θαη
ην πιάηνο ηεο ζεκειηώδνπο ζπληζηώζαο θαζηθήο ηάζεο εμόδνπ γηα ιεηηνπξγία αληηζηξνθέα κε
ηεηξαγσληθό παικό ηάζεο. Ο δείθηεο δηακόξθσζεο ιακβάλεη ηηκέο από 0 έσο 1, όπνπ γηα κνλάδα έρνπκε
ιεηηνπξγία κε ηεηξαγσληθό παικό. Σν πιάηνο ηεο ζεκειηώδνπο ζπληζηώζαο ηεο θαζηθήο ηάζεο εμόδνπ είλαη:
Άξα ε ελδεηθλύκελε (rms) ηηκή ηεο πνιηθήο ηάζεο εμόδνπ ζα είλαη:
Μνληεινπνηώληαο ηελ ηερληθή, ε παξαγσγή ησλ παικώλ κπνξεί λα γίλεη κε ηε ζύγθξηζε κηαο πςίζπρλεο
ηξηγσληθήο θπκαηνκνξθήο θνξέα vtri δηαθνπηηθήο ζπρλόηεηαο fc, κε θαζνξηζκέλεο ηηκέο επηπέδσλ ειέγρνπ
vDA,vDB, vDC, πνπ πξνθύπηνπλ από ηηο παξαθάησ ζρέζεηο, ιακβάλνληαο ππόςε ην ιόγν δηακόξθσζεο ma:
όπνπ ε ηηκή λk δίλεηαη από ηε ζρέζε:
ε ζρέζε κε ηελ SPWM ηζρύεη όηη ην πνζνζηό αμηνπνίεζεο ηεο πεγήο είλαη .
Δθηειώληαο αληίζηνηρα πξνζνκνίσζε ηεο ηερληθήο SV-PWM, γηα ηξνθνδνζία επαγσγηθνύ θηλεηήξα 2.2kW,
450V,60Hz, θαη αληηζηξνθέα κε Vdc=607.5V, fr=60Hz, fc=1980Hz, ma=0.85, mf=33, ζην ρ. 3.35 θαίλνληαη
νη παικνί ησλ δηαθνπηώλ S1-S6, νη θπκαηνκνξθέο ηεο ηάζεο εμόδνπ vαb θαη ηνπ ξεύκαηνο θνξηίνπ ia. Δπηπιένλ
ζην ρ. 3.36 παξνπζηάδεηαη ε ηξνρηά ηνπ δηαλύζκαηνο αλαθνξάο (ma=0.85) θαη ηα ινηπά ρσξηθά δηαλύζκαηα.
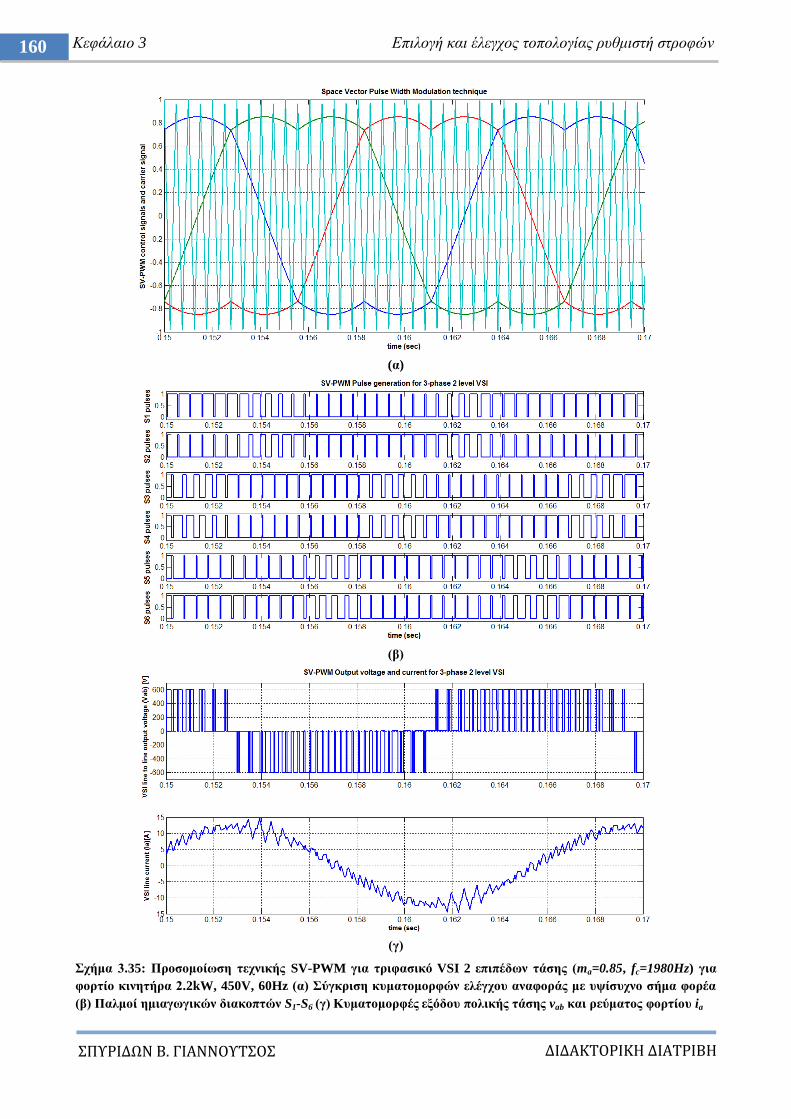
ΔΙΔΑΚΣΟΡΙΚΗ ΔΙΑΣΡΙΒΗ
ΠΤΡΙΔΩΝ Β. ΓΙΑΝΝΟΤΣΟ
160 Κεθάιαην 3 Δπηινγή θαη έιεγρνο ηνπνινγίαο ξπζκηζηή ζηξνθώλ
(α)
(β)
(γ)
ρήκα 3.35: Πξνζνκνίσζε ηερληθήο SV-PWM γηα ηξηθαζηθό VSI 2 επηπέδσλ ηάζεο (ma=0.85, fc=1980Hz) γηα
θνξηίν θηλεηήξα 2.2kW, 450V, 60Hz (α) ύγθξηζε θπκαηνκνξθώλ ειέγρνπ αλαθνξάο κε πςίζπρλν ζήκα θνξέα
(β) Παικνί εκηαγσγηθώλ δηαθνπηώλ S1-S6 (γ) Κπκαηνκνξθέο εμόδνπ πνιηθήο ηάζεο vab θαη ξεύκαηνο θνξηίνπ ia
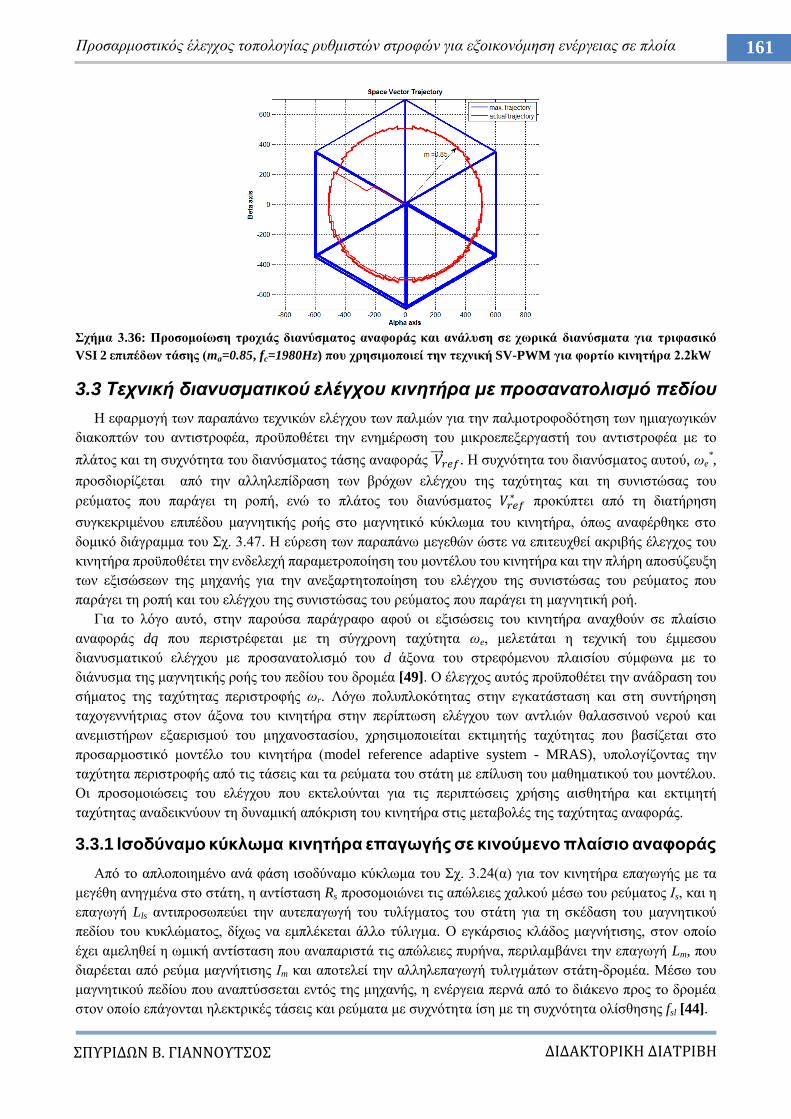
ΔΙΔΑΚΣΟΡΙΚΗ ΔΙΑΣΡΙΒΗ
ΠΤΡΙΔΩΝ Β. ΓΙΑΝΝΟΤΣΟ
161 Πξνζαξκνζηηθόο έιεγρνο ηνπνινγίαο ξπζκηζηώλ ζηξνθώλ γηα εμνηθνλόκεζε ελέξγεηαο ζε πινία
ρήκα 3.36: Πξνζνκνίσζε ηξνρηάο δηαλύζκαηνο αλαθνξάο θαη αλάιπζε ζε ρσξηθά δηαλύζκαηα γηα ηξηθαζηθό
VSI 2 επηπέδσλ ηάζεο (ma=0.85, fc=1980Hz) πνπ ρξεζηκνπνηεί ηελ ηερληθή SV-PWM γηα θνξηίν θηλεηήξα 2.2kW
3.3 Τεσνική διανςζμαηικού ελέγσος κινηηήπα με πποζαναηολιζμό πεδίος
Ζ εθαξκνγή ησλ παξαπάλσ ηερληθώλ ειέγρνπ ησλ παικώλ γηα ηελ παικνηξνθνδόηεζε ησλ εκηαγσγηθώλ
δηαθνπηώλ ηνπ αληηζηξνθέα, πξνϋπνζέηεη ηελ ελεκέξσζε ηνπ κηθξνεπεμεξγαζηή ηνπ αληηζηξνθέα κε ην
πιάηνο θαη ηε ζπρλόηεηα ηνπ δηαλύζκαηνο ηάζεο αλαθνξάο . Ζ ζπρλόηεηα ηνπ δηαλύζκαηνο απηνύ, σe*,
πξνζδηνξίδεηαη από ηελ αιιειεπίδξαζε ησλ βξόρσλ ειέγρνπ ηεο ηαρύηεηαο θαη ηε ζπληζηώζαο ηνπ
ξεύκαηνο πνπ παξάγεη ηε ξνπή, ελώ ην πιάηνο ηνπ δηαλύζκαηνο πξνθύπηεη από ηε δηαηήξεζε
ζπγθεθξηκέλνπ επηπέδνπ καγλεηηθήο ξνήο ζην καγλεηηθό θύθισκα ηνπ θηλεηήξα, όπσο αλαθέξζεθε ζην
δνκηθό δηάγξακκα ηνπ ρ. 3.47. Ζ εύξεζε ησλ παξαπάλσ κεγεζώλ ώζηε λα επηηεπρζεί αθξηβήο έιεγρνο ηνπ
θηλεηήξα πξνϋπνζέηεη ηελ ελδειερή παξακεηξνπνίεζε ηνπ κνληέινπ ηνπ θηλεηήξα θαη ηελ πιήξε απνζύδεπμε
ησλ εμηζώζεσλ ηεο κεραλήο γηα ηελ αλεμαξηεηνπνίεζε ηνπ ειέγρνπ ηεο ζπληζηώζαο ηνπ ξεύκαηνο πνπ
παξάγεη ηε ξνπή θαη ηνπ ειέγρνπ ηεο ζπληζηώζαο ηνπ ξεύκαηνο πνπ παξάγεη ηε καγλεηηθή ξνή.
Γηα ην ιόγν απηό, ζηελ παξνύζα παξάγξαθν αθνύ νη εμηζώζεηο ηνπ θηλεηήξα αλαρζνύλ ζε πιαίζην
αλαθνξάο dq πνπ πεξηζηξέθεηαη κε ηε ζύγρξνλε ηαρύηεηα σe, κειεηάηαη ε ηερληθή ηνπ έκκεζνπ
δηαλπζκαηηθνύ ειέγρνπ κε πξνζαλαηνιηζκό ηνπ d άμνλα ηνπ ζηξεθόκελνπ πιαηζίνπ ζύκθσλα κε ην
δηάλπζκα ηεο καγλεηηθήο ξνήο ηνπ πεδίνπ ηνπ δξνκέα [49]. Ο έιεγρνο απηόο πξνϋπνζέηεη ηελ αλάδξαζε ηνπ
ζήκαηνο ηεο ηαρύηεηαο πεξηζηξνθήο σr. Λόγσ πνιππινθόηεηαο ζηελ εγθαηάζηαζε θαη ζηε ζπληήξεζε
ηαρνγελλήηξηαο ζηνλ άμνλα ηνπ θηλεηήξα ζηελ πεξίπησζε ειέγρνπ ησλ αληιηώλ ζαιαζζηλνύ λεξνύ θαη
αλεκηζηήξσλ εμαεξηζκνύ ηνπ κεραλνζηαζίνπ, ρξεζηκνπνηείηαη εθηηκεηήο ηαρύηεηαο πνπ βαζίδεηαη ζην
πξνζαξκνζηηθό κνληέιν ηνπ θηλεηήξα (model reference adaptive system - MRAS), ππνινγίδνληαο ηελ
ηαρύηεηα πεξηζηξνθήο από ηηο ηάζεηο θαη ηα ξεύκαηα ηνπ ζηάηε κε επίιπζε ηνπ καζεκαηηθνύ ηνπ κνληέινπ.
Οη πξνζνκνηώζεηο ηνπ ειέγρνπ πνπ εθηεινύληαη γηα ηηο πεξηπηώζεηο ρξήζεο αηζζεηήξα θαη εθηηκεηή
ηαρύηεηαο αλαδεηθλύνπλ ηε δπλακηθή απόθξηζε ηνπ θηλεηήξα ζηηο κεηαβνιέο ηεο ηαρύηεηαο αλαθνξάο.
3.3.1 Ιζνδύλακν θύθισκα θηλεηήξα επαγσγήο ζε θηλνύκελν πιαίζην αλαθνξάο
Από ην απινπνηεκέλν αλά θάζε ηζνδύλακν θύθισκα ηνπ ρ. 3.24(α) γηα ηνλ θηλεηήξα επαγσγήο κε ηα
κεγέζε αλεγκέλα ζην ζηάηε, ε αληίζηαζε Rs πξνζνκνηώλεη ηηο απώιεηεο ραιθνύ κέζσ ηνπ ξεύκαηνο Ηs, θαη ε
επαγσγή Lls αληηπξνζσπεύεη ηελ απηεπαγσγή ηνπ ηπιίγκαηνο ηνπ ζηάηε γηα ηε ζθέδαζε ηνπ καγλεηηθνύ
πεδίνπ ηνπ θπθιώκαηνο, δίρσο λα εκπιέθεηαη άιιν ηύιηγκα. Ο εγθάξζηνο θιάδνο καγλήηηζεο, ζηνλ νπνίν
έρεη ακειεζεί ε σκηθή αληίζηαζε πνπ αλαπαξηζηά ηηο απώιεηεο ππξήλα, πεξηιακβάλεη ηελ επαγσγή Lm, πνπ
δηαξέεηαη από ξεύκα καγλήηηζεο Ηm θαη απνηειεί ηελ αιιειεπαγσγή ηπιηγκάησλ ζηάηε-δξνκέα. Μέζσ ηνπ
καγλεηηθνύ πεδίνπ πνπ αλαπηύζζεηαη εληόο ηεο κεραλήο, ε ελέξγεηα πεξλά από ην δηάθελν πξνο ην δξνκέα
ζηνλ νπνίν επάγνληαη ειεθηξηθέο ηάζεηο θαη ξεύκαηα κε ζπρλόηεηα ίζε κε ηε ζπρλόηεηα νιίζζεζεο fsl [44].
ΔΙΔΑΚΣΟΡΙΚΗ ΔΙΑΣΡΙΒΗ
ΠΤΡΙΔΩΝ Β. ΓΙΑΝΝΟΤΣΟ
162 Κεθάιαην 3 Δπηινγή θαη έιεγρνο ηνπνινγίαο ξπζκηζηή ζηξνθώλ
Καζώο νη εμηζώζεηο πνπ πεξηγξάθνπλ ηε δπλακηθή ιεηηνπξγία ηεο αζύγρξνλεο κεραλήο είλαη δηαθνξηθέο
εμηζώζεηο κε ρξνληθά εμαξηεκέλεο κεηαβιεηέο εθόζνλ ν δξνκέαο πεξηζηξέθεηαη, είλαη απαξαίηεην γηα ηε
κειέηε απηέο λα απινπνηεζνύλ ζε εμηζώζεηο κε ζηαζεξνύο ζπληειεζηέο, γεγνλόο πνπ επηηπγράλεηαη κε ηελ
αλαγσγή ζε πιαίζην αλαθνξάο πνπ πεξηζηξέθεηαη κε ηε ζύγρξνλε ηαρύηεηα σ = σe. Ο κεηαζρεκαηηζκόο κε
ηνλ νπνίν ην ηξηθαζηθό ζύζηεκα ξεπκάησλ αλάγεηαη ζε θηλνύκελν κε ζηαζεξή ηαρύηεηα πιαίζην αλαθνξάο
dq κε επζύ άμνλα d (direct axis) θαη εγθάξζην άμνλα q (quadrature axis) γηα ηελ πεξίπησζε ζπκκεηξηθήο
ηξηθαζηθήο νκάδαο ξεπκάησλ is,a,is,b,is,c ζα είλαη [32]:
όπνπ ε γσλία ηνπ πιαηζίνπ ζ πνπ εθθξάδεη ηε δηαθνξά θάζεο κεηαμύ ηνπ δηαλύζκαηνο iq θαη ia, είλαη ην
απνηέιεζκα ηεο νινθιήξσζεο ηεο γσληαθήο ηαρύηεηαο πεξηζηξνθήο ηνπ πιαηζίνπ σe. Όκνηα, ν αληίζηξνθνο
κεηαζρεκαηηζκόο dq νξίδεηαη σο εμήο:
Με ηε ρξήζε πιαηζίνπ αλαθνξάο κε ζηαζεξή ηαρύηεηα πεξηζηξνθήο, νη επαγσγέο δελ είλαη πηα ρξνληθά
κεηαβαιιόκελεο θαη ε αλάιπζε ηεο κεραλήο απινπζηεύεηαη. ην ρ. 3.37(α). παξνπζηάδεηαη ε γξαθηθή
παξάζηαζε ησλ αμόλσλ ηνπ πιαηζίνπ dq ζε ζρέζε κε ηνπο άμνλεο ηνπ ηξηθαζηθνύ ζπζηήκαηνο ξεπκάησλ.
H επαγσγή ηνπ ζηάηε νξίδεηαη σο Ls=Lls+Lm, θαη όκνηα ε επαγσγή ηνπ δξνκέα ζα είλαη Lr=Llr+Lm, ελώ ε
πεπιεγκέλε καγλεηηθή ξνή ηεο κεραλήο πνπ πξνέξρεηαη από ην ξεύκα ζηάηε ιs θαη αληίζηνηρα γηα ην δξνκέα
ε καγλεηηθή ξνή ιr, εθθξάδνληαη ζην ηξηθαζηθό πιαίζην ξεπκάησλ θαη ζην πεξηζηξεθόκελν κε ηαρύηεηα σe:
ρεηηθά κε ηηο ρξνλνκεηαβιεηέο εμηζώζεηο ηάζεο ηνπ ζηάηε ηεο κεραλήο λs,a,λs,b,λs,c ιόγσ κεηαβνιήο ησλ
καγλεηηθώλ ξνώλ ηνπ ζηάηε θαη ηνπ δξνκέα θαηά ηελ πεξηζηξνθή ηνπ δξνκέα, απηέο εθθξάδνληαη ζε
ηξηθαζηθό θαη πεξηζηξεθόκελν πιαίζην αλαθνξάο κε ηε ζύγρξνλε ηαρύηεηα όπσο όπσο θαίλεηαη παξαθάησ:
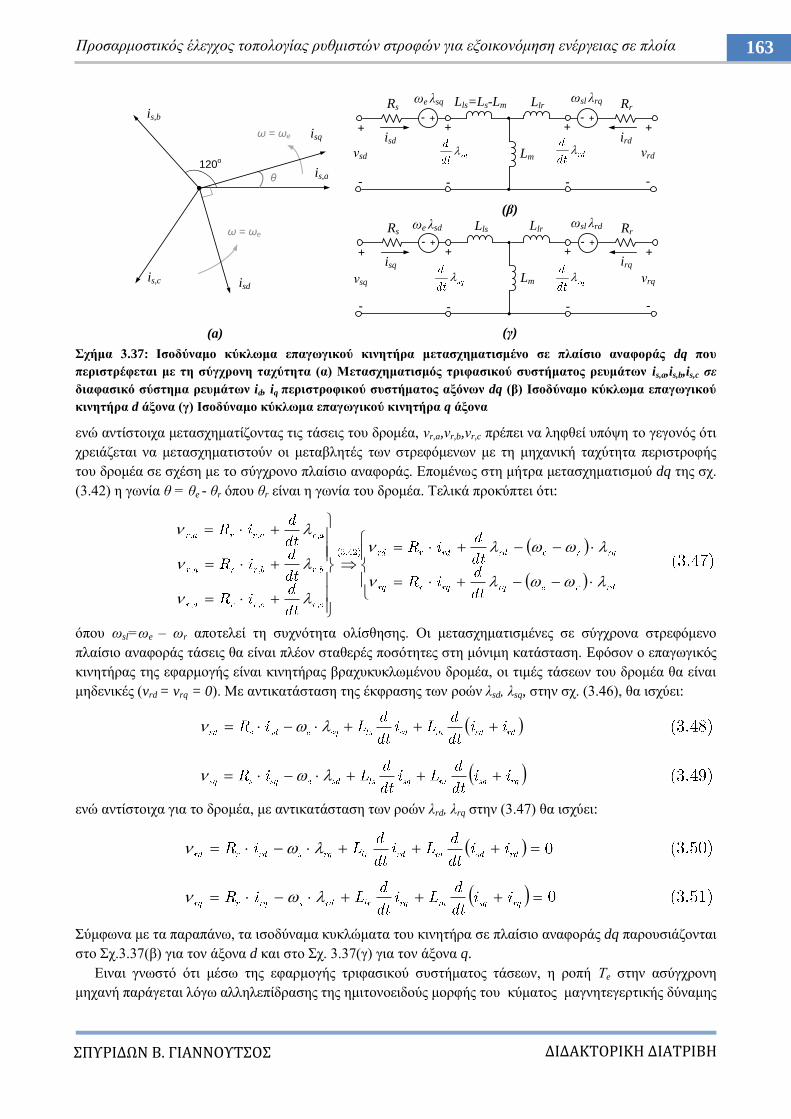
ΔΙΔΑΚΣΟΡΙΚΗ ΔΙΑΣΡΙΒΗ
ΠΤΡΙΔΩΝ Β. ΓΙΑΝΝΟΤΣΟ
163 Πξνζαξκνζηηθόο έιεγρνο ηνπνινγίαο ξπζκηζηώλ ζηξνθώλ γηα εμνηθνλόκεζε ελέξγεηαο ζε πινία
ρήκα 3.37: Ιζνδύλακν θύθισκα επαγσγηθνύ θηλεηήξα κεηαζρεκαηηζκέλν ζε πιαίζην αλαθνξάο dq πνπ
πεξηζηξέθεηαη κε ηε ζύγρξνλε ηαρύηεηα (α) Μεηαζρεκαηηζκόο ηξηθαζηθνύ ζπζηήκαηνο ξεπκάησλ is,a,is,b,is,c ζε
δηαθαζηθό ζύζηεκα ξεπκάησλ id, iq πεξηζηξνθηθνύ ζπζηήκαηνο αμόλσλ dq (β) Ιζνδύλακν θύθισκα επαγσγηθνύ
θηλεηήξα d άμνλα (γ) Ιζνδύλακν θύθισκα επαγσγηθνύ θηλεηήξα q άμνλα
ελώ αληίζηνηρα κεηαζρεκαηίδνληαο ηηο ηάζεηο ηνπ δξνκέα, λr,a,λr,b,λr,c πξέπεη λα ιεθζεί ππόςε ην γεγνλόο όηη
ρξεηάδεηαη λα κεηαζρεκαηηζηνύλ νη κεηαβιεηέο ησλ ζηξεθόκελσλ κε ηε κεραληθή ηαρύηεηα πεξηζηξνθήο
ηνπ δξνκέα ζε ζρέζε κε ην ζύγρξνλν πιαίζην αλαθνξάο. Δπνκέλσο ζηε κήηξα κεηαζρεκαηηζκνύ dq ηεο ζρ.
(3.42) ε γσλία ζ = ζe - ζr όπνπ ζr είλαη ε γσλία ηνπ δξνκέα. Σειηθά πξνθύπηεη όηη:
όπνπ σsl=σe – σr απνηειεί ηε ζπρλόηεηα νιίζζεζεο. Οη κεηαζρεκαηηζκέλεο ζε ζύγρξνλα ζηξεθόκελν
πιαίζην αλαθνξάο ηάζεηο ζα είλαη πιένλ ζηαζεξέο πνζόηεηεο ζηε κόληκε θαηάζηαζε. Eθόζνλ ν επαγσγηθόο
θηλεηήξαο ηεο εθαξκνγήο είλαη θηλεηήξαο βξαρπθπθισκέλνπ δξνκέα, νη ηηκέο ηάζεσλ ηνπ δξνκέα ζα είλαη
κεδεληθέο (vrd = vrq = 0). Με αληηθαηάζηαζε ηεο έθθξαζεο ησλ ξνώλ ιsd, ιsq, ζηελ ζρ. (3.46), ζα ηζρύεη:
ελώ αληίζηνηρα γηα ην δξνκέα, κε αληηθαηάζηαζε ησλ ξνώλ ιrd, ιrq ζηελ (3.47) ζα ηζρύεη:
ύκθσλα κε ηα παξαπάλσ, ηα ηζνδύλακα θπθιώκαηα ηνπ θηλεηήξα ζε πιαίζην αλαθνξάο dq παξνπζηάδνληαη
ζην ρ.3.37(β) γηα ηνλ άμνλα d θαη ζην ρ. 3.37(γ) γηα ηνλ άμνλα q.
Δηλαη γλσζηό όηη κέζσ ηεο εθαξκνγήο ηξηθαζηθνύ ζπζηήκαηνο ηάζεσλ, ε ξνπή Σe ζηελ αζύγρξνλε
κεραλή παξάγεηαη ιόγσ αιιειεπίδξαζεο ηεο εκηηνλνεηδνύο κνξθήο ηνπ θύκαηνο καγλεηεγεξηηθήο δύλακεο
isq
θ is,a
ω = ωe
is,b
120o
ω = ωe
is,c isd
+-
σe ιsq Lls=Ls-LmRs
Lm
Llr
+-
σsl ιrq Rr
+
-
λsd
+
-
isd ird
+
-
λrd
+
-
+-Rs
Lm
+-Rr
+
-
λsq
+
-
isq irq
+
-
λrq
+
-
σe ιsd Lls Llrσsl ιrd
(a)
(β)
(γ)
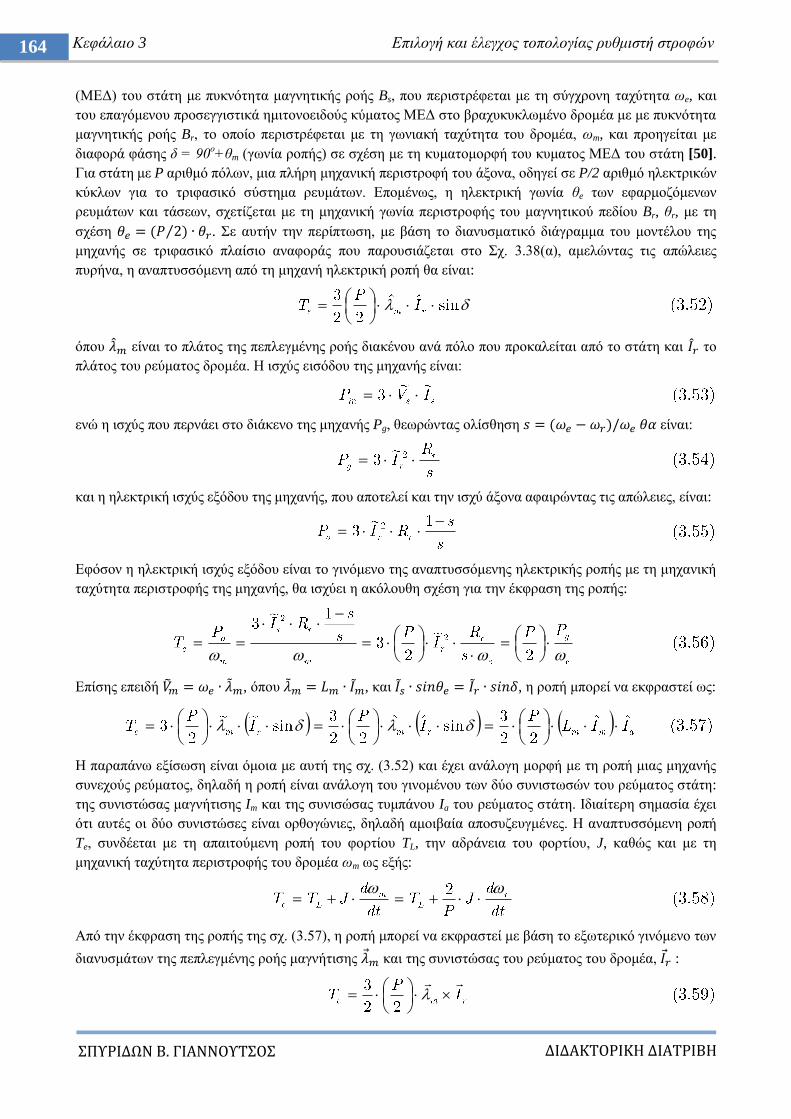
ΔΙΔΑΚΣΟΡΙΚΗ ΔΙΑΣΡΙΒΗ
ΠΤΡΙΔΩΝ Β. ΓΙΑΝΝΟΤΣΟ
164 Κεθάιαην 3 Δπηινγή θαη έιεγρνο ηνπνινγίαο ξπζκηζηή ζηξνθώλ
(ΜΔΓ) ηνπ ζηάηε κε ππθλόηεηα καγλεηηθήο ξνήο Bs, πνπ πεξηζηξέθεηαη κε ηε ζύγρξνλε ηαρύηεηα σe, θαη
ηνπ επαγόκελνπ πξνζεγγηζηηθά εκηηνλνεηδνύο θύκαηνο ΜΔΓ ζην βξαρπθπθισκέλν δξνκέα κε κε ππθλόηεηα
καγλεηηθήο ξνήο Br, ην νπνίν πεξηζηξέθεηαη κε ηε γσληαθή ηαρύηεηα ηνπ δξνκέα, σm, θαη πξνεγείηαη κε
δηαθνξά θάζεο δ = 90ν+ζm (γσλία ξνπήο) ζε ζρέζε κε ηε θπκαηνκνξθή ηνπ θπκαηνο ΜΔΓ ηνπ ζηάηε [50].
Γηα ζηάηε κε P αξηζκό πόισλ, κηα πιήξε κεραληθή πεξηζηξνθή ηνπ άμνλα, νδεγεί ζε P/2 αξηζκό ειεθηξηθώλ
θύθισλ γηα ην ηξηθαζηθό ζύζηεκα ξεπκάησλ. Δπνκέλσο, ε ειεθηξηθή γσλία ζe ησλ εθαξκνδόκελσλ
ξεπκάησλ θαη ηάζεσλ, ζρεηίδεηαη κε ηε κεραληθή γσλία πεξηζηξνθήο ηνπ καγλεηηθνύ πεδίνπ Br, ζr, κε ηε
ζρέζε ⁄ . ε απηήλ ηελ πεξίπησζε, κε βάζε ην δηαλπζκαηηθό δηάγξακκα ηνπ κνληέινπ ηεο
κεραλήο ζε ηξηθαζηθό πιαίζην αλαθνξάο πνπ παξνπζηάδεηαη ζην ρ. 3.38(α), ακειώληαο ηηο απώιεηεο
ππξήλα, ε αλαπηπζζόκελε από ηε κεραλή ειεθηξηθή ξνπή ζα είλαη:
όπνπ είλαη ην πιάηνο ηεο πεπιεγκέλεο ξνήο δηαθέλνπ αλά πόιν πνπ πξνθαιείηαη από ην ζηάηε θαη ην
πιάηνο ηνπ ξεύκαηνο δξνκέα. Ζ ηζρύο εηζόδνπ ηεο κεραλήο είλαη:
ελώ ε ηζρύο πνπ πεξλάεη ζην δηάθελν ηεο κεραλήο Pg, ζεσξώληαο νιίζζεζε είλαη:
θαη ε ειεθηξηθή ηζρύο εμόδνπ ηεο κεραλήο, πνπ απνηειεί θαη ηελ ηζρύ άμνλα αθαηξώληαο ηηο απώιεηεο, είλαη:
Δθόζνλ ε ειεθηξηθή ηζρύο εμόδνπ είλαη ην γηλόκελν ηεο αλαπηπζζόκελεο ειεθηξηθήο ξνπήο κε ηε κεραληθή
ηαρύηεηα πεξηζηξνθήο ηεο κεραλήο, ζα ηζρύεη ε αθόινπζε ζρέζε γηα ηελ έθθξαζε ηεο ξνπήο:
Δπίζεο επεηδή , όπνπ , θαη , ε ξνπή κπνξεί λα εθθξαζηεί σο:
H παξαπάλσ εμίζσζε είλαη όκνηα κε απηή ηεο ζρ. (3.52) θαη έρεη αλάινγε κνξθή κε ηε ξνπή κηαο κεραλήο
ζπλερνύο ξεύκαηνο, δειαδή ε ξνπή είλαη αλάινγε ηνπ γηλνκέλνπ ησλ δύν ζπληζησζώλ ηνπ ξεύκαηνο ζηάηε:
ηεο ζπληζηώζαο καγλήηηζεο Im θαη ηεο ζπληζώζαο ηπκπάλνπ Ia ηνπ ξεύκαηνο ζηάηε. Ηδηαίηεξε ζεκαζία έρεη
όηη απηέο νη δύν ζπληζηώζεο είλαη νξζνγώληεο, δειαδή ακνηβαία απνζπδεπγκέλεο. Ζ αλαπηπζζόκελε ξνπή
Te, ζπλδέεηαη κε ηε απαηηνύκελε ξνπή ηνπ θνξηίνπ TL, ηελ αδξάλεηα ηνπ θνξηίνπ, J, θαζώο θαη κε ηε
κεραληθή ηαρύηεηα πεξηζηξνθήο ηνπ δξνκέα σm σο εμήο:
Από ηελ έθθξαζε ηεο ξνπήο ηεο ζρ. (3.57), ε ξνπή κπνξεί λα εθθξαζηεί κε βάζε ην εμσηεξηθό γηλόκελν ησλ
δηαλπζκάησλ ηεο πεπιεγκέλεο ξνήο καγλήηηζεο θαη ηεο ζπληζηώζαο ηνπ ξεύκαηνο ηνπ δξνκέα, :
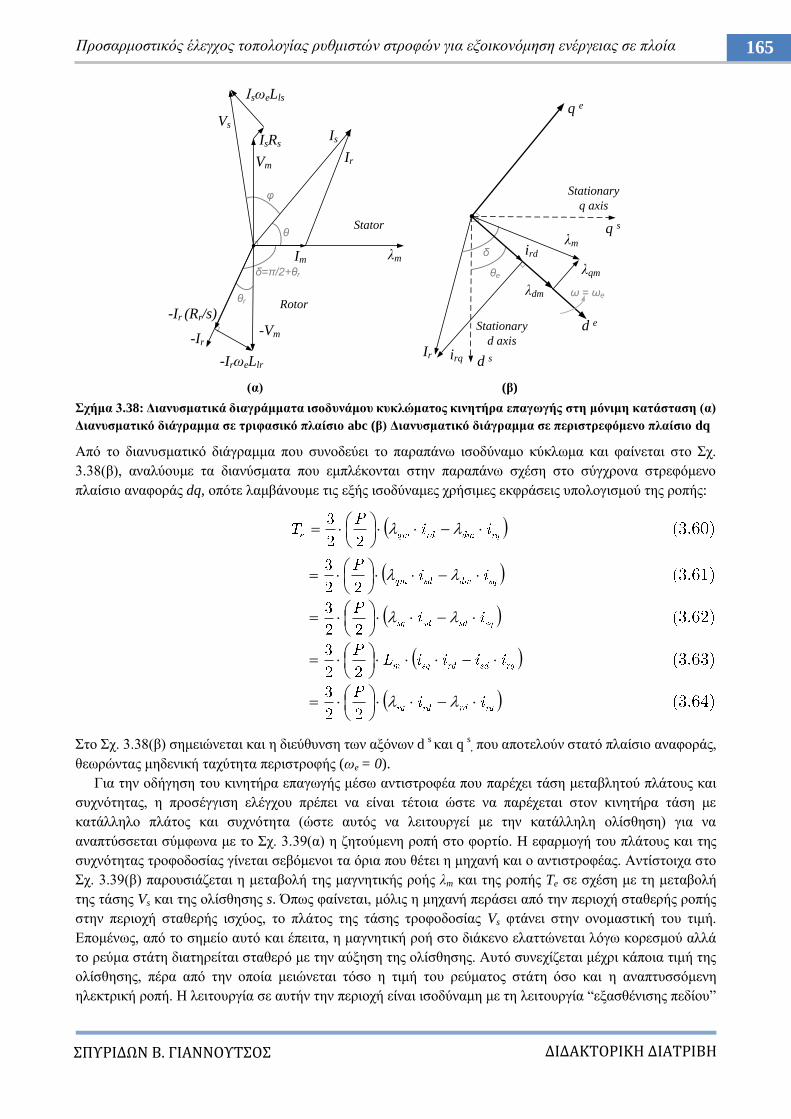
ΔΙΔΑΚΣΟΡΙΚΗ ΔΙΑΣΡΙΒΗ
ΠΤΡΙΔΩΝ Β. ΓΙΑΝΝΟΤΣΟ
165 Πξνζαξκνζηηθόο έιεγρνο ηνπνινγίαο ξπζκηζηώλ ζηξνθώλ γηα εμνηθνλόκεζε ελέξγεηαο ζε πινία
(α) (β)
ρήκα 3.38: Γηαλπζκαηηθά δηαγξάκκαηα ηζνδπλάκνπ θπθιώκαηνο θηλεηήξα επαγσγήο ζηε κόληκε θαηάζηαζε (α)
Γηαλπζκαηηθό δηάγξακκα ζε ηξηθαζηθό πιαίζην abc (β) Γηαλπζκαηηθό δηάγξακκα ζε πεξηζηξεθόκελν πιαίζην dq
Από ην δηαλπζκαηηθό δηάγξακκα πνπ ζπλνδεύεη ην παξαπάλσ ηζνδύλακν θύθισκα θαη θαίλεηαη ζην ρ.
3.38(β), αλαιύνπκε ηα δηαλύζκαηα πνπ εκπιέθνληαη ζηελ παξαπάλσ ζρέζε ζην ζύγρξνλα ζηξεθόκελν
πιαίζην αλαθνξάο dq, νπόηε ιακβάλνπκε ηηο εμήο ηζνδύλακεο ρξήζηκεο εθθξάζεηο ππνινγηζκνύ ηεο ξνπήο:
ην ρ. 3.38(β) ζεκεηώλεηαη θαη ε δηεύζπλζε ησλ αμόλσλ d s θαη q
s, πνπ απνηεινύλ ζηαηό πιαίζην αλαθνξάο,
ζεσξώληαο κεδεληθή ηαρύηεηα πεξηζηξνθήο (σe = 0).
Γηα ηελ νδήγεζε ηνπ θηλεηήξα επαγσγήο κέζσ αληηζηξνθέα πνπ παξέρεη ηάζε κεηαβιεηνύ πιάηνπο θαη
ζπρλόηεηαο, ε πξνζέγγηζε ειέγρνπ πξέπεη λα είλαη ηέηνηα ώζηε λα παξέρεηαη ζηνλ θηλεηήξα ηάζε κε
θαηάιιειν πιάηνο θαη ζπρλόηεηα (ώζηε απηόο λα ιεηηνπξγεί κε ηελ θαηάιιειε νιίζζεζε) γηα λα
αλαπηύζζεηαη ζύκθσλα κε ην ρ. 3.39(α) ε δεηνύκελε ξνπή ζην θνξηίν. H εθαξκνγή ηνπ πιάηνπο θαη ηεο
ζπρλόηεηαο ηξνθνδνζίαο γίλεηαη ζεβόκελνη ηα όξηα πνπ ζέηεη ε κεραλή θαη ν αληηζηξνθέαο. Αληίζηνηρα ζην
ρ. 3.39(β) παξνπζηάδεηαη ε κεηαβνιή ηεο καγλεηηθήο ξνήο ιm θαη ηεο ξνπήο Te ζε ζρέζε κε ηε κεηαβνιή
ηεο ηάζεο Vs θαη ηεο νιίζζεζεο s. Όπσο θαίλεηαη, κόιηο ε κεραλή πεξάζεη από ηελ πεξηνρή ζηαζεξήο ξνπήο
ζηελ πεξηνρή ζηαζεξήο ηζρύνο, ην πιάηνο ηεο ηάζεο ηξνθνδνζίαο Vs θηάλεη ζηελ νλνκαζηηθή ηνπ ηηκή.
Δπνκέλσο, από ην ζεκείν απηό θαη έπεηηα, ε καγλεηηθή ξνή ζην δηάθελν ειαηηώλεηαη ιόγσ θνξεζκνύ αιιά
ην ξεύκα ζηάηε δηαηεξείηαη ζηαζεξό κε ηελ αύμεζε ηεο νιίζζεζεο. Απηό ζπλερίδεηαη κέρξη θάπνηα ηηκή ηεο
νιίζζεζεο, πέξα από ηελ νπνία κεηώλεηαη ηόζν ε ηηκή ηνπ ξεύκαηνο ζηάηε όζν θαη ε αλαπηπζζόκελε
ειεθηξηθή ξνπή. Ζ ιεηηνπξγία ζε απηήλ ηελ πεξηνρή είλαη ηζνδύλακε κε ηε ιεηηνπξγία “εμαζζέληζεο πεδίνπ”
φ
ΗsσeLls
θ
θr
Vs
Vm
IsRsIs
Ir
Im ιm
δ=π/2+θr
-Vm
-Ir (Rr/s)
-Ir
-IrσeLlr
Rotor
Stator
irqIr
d s
q s
d e
q e
ιm
ιqm
ιdm ω = ωe
Stationary
q axis
Stationary
d axis
θe
δ ird
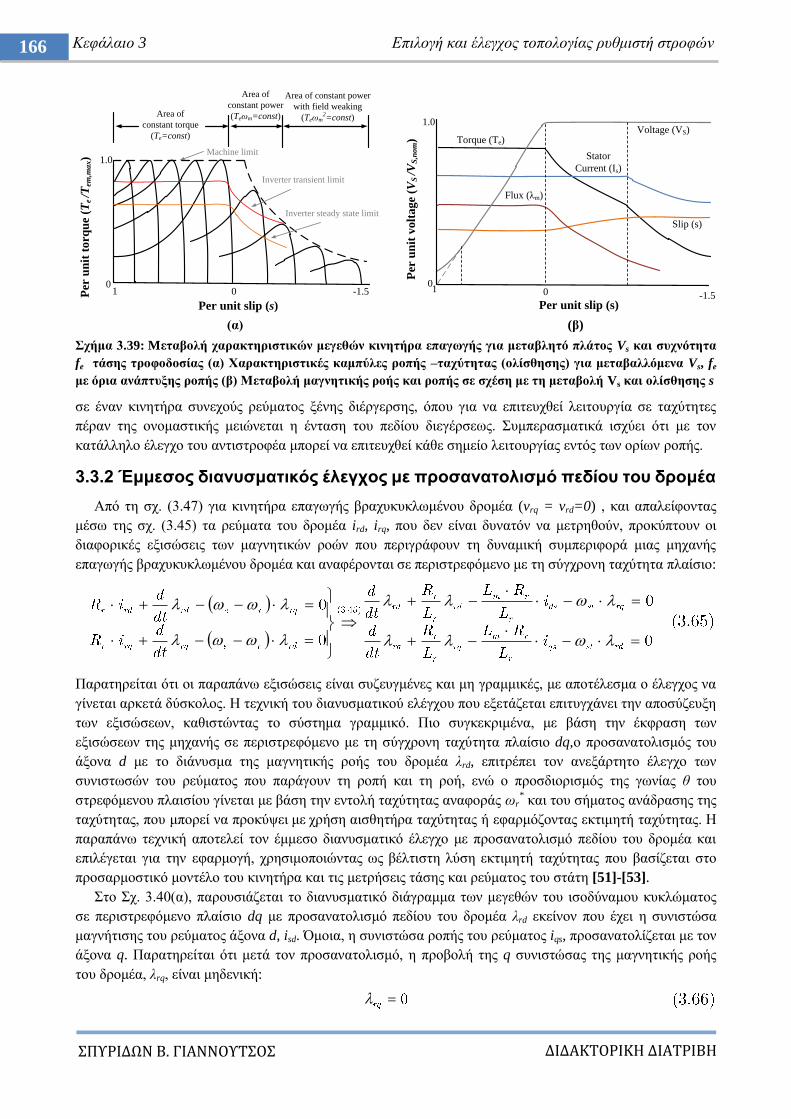
ΔΙΔΑΚΣΟΡΙΚΗ ΔΙΑΣΡΙΒΗ
ΠΤΡΙΔΩΝ Β. ΓΙΑΝΝΟΤΣΟ
166 Κεθάιαην 3 Δπηινγή θαη έιεγρνο ηνπνινγίαο ξπζκηζηή ζηξνθώλ
(α) (β)
ρήκα 3.39: Mεηαβνιή ραξαθηεξηζηηθώλ κεγεζώλ θηλεηήξα επαγσγήο γηα κεηαβιεηό πιάηνο Vs θαη ζπρλόηεηα
fe ηάζεο ηξνθνδνζίαο (α) Υαξαθηεξηζηηθέο θακπύιεο ξνπήο –ηαρύηεηαο (νιίζζεζεο) γηα κεηαβαιιόκελα Vs, fe
κε όξηα αλάπηπμεο ξνπήο (β) Μεηαβνιή καγλεηηθήο ξνήο θαη ξνπήο ζε ζρέζε κε ηε κεηαβνιή Vs θαη νιίζζεζεο s
ζε έλαλ θηλεηήξα ζπλερνύο ξεύκαηνο μέλεο δηέξγεξζεο, όπνπ γηα λα επηηεπρζεί ιεηηνπξγία ζε ηαρύηεηεο
πέξαλ ηεο νλνκαζηηθήο κεηώλεηαη ε έληαζε ηνπ πεδίνπ δηεγέξζεσο. πκπεξαζκαηηθά ηζρύεη όηη κε ηνλ
θαηάιιειν έιεγρν ηνπ αληηζηξνθέα κπνξεί λα επηηεπρζεί θάζε ζεκείν ιεηηνπξγίαο εληόο ησλ νξίσλ ξνπήο.
3.3.2 Έκκεζνο δηαλπζκαηηθόο έιεγρνο κε πξνζαλαηνιηζκό πεδίνπ ηνπ δξνκέα
Από ηε ζρ. (3.47) γηα θηλεηήξα επαγσγήο βξαρπθπθισκέλνπ δξνκέα (vrq = vrd=0) , θαη απαιείθνληαο
κέζσ ηεο ζρ. (3.45) ηα ξεύκαηα ηνπ δξνκέα ird, irq, πνπ δελ είλαη δπλαηόλ λα κεηξεζνύλ, πξνθύπηνπλ νη
δηαθνξηθέο εμηζώζεηο ησλ καγλεηηθώλ ξνώλ πνπ πεξηγξάθνπλ ηε δπλακηθή ζπκπεξηθνξά κηαο κεραλήο
επαγσγήο βξαρπθπθισκέλνπ δξνκέα θαη αλαθέξνληαη ζε πεξηζηξεθόκελν κε ηε ζύγρξνλε ηαρύηεηα πιαίζην:
Παξαηεξείηαη όηη νη παξαπάλσ εμηζώζεηο είλαη ζπδεπγκέλεο θαη κε γξακκηθέο, κε απνηέιεζκα ν έιεγρνο λα
γίλεηαη αξθεηά δύζθνινο. Ζ ηερληθή ηνπ δηαλπζκαηηθνύ ειέγρνπ πνπ εμεηάδεηαη επηηπγράλεη ηελ απνζύδεπμε
ησλ εμηζώζεσλ, θαζηζηώληαο ην ζύζηεκα γξακκηθό. Πην ζπγθεθξηκέλα, κε βάζε ηελ έθθξαζε ησλ
εμηζώζεσλ ηεο κεραλήο ζε πεξηζηξεθόκελν κε ηε ζύγρξνλε ηαρύηεηα πιαίζην dq,ν πξνζαλαηνιηζκόο ηνπ
άμνλα d κε ην δηάλπζκα ηεο καγλεηηθήο ξνήο ηνπ δξνκέα ιrd, επηηξέπεη ηνλ αλεμάξηεην έιεγρν ησλ
ζπληζησζώλ ηνπ ξεύκαηνο πνπ παξάγνπλ ηε ξνπή θαη ηε ξνή, ελώ ν πξνζδηνξηζκόο ηεο γσλίαο ζ ηνπ
ζηξεθόκελνπ πιαηζίνπ γίλεηαη κε βάζε ηελ εληνιή ηαρύηεηαο αλαθνξάο σr* θαη ηνπ ζήκαηνο αλάδξαζεο ηεο
ηαρύηεηαο, πνπ κπνξεί λα πξνθύςεη κε ρξήζε αηζζεηήξα ηαρύηεηαο ή εθαξκόδνληαο εθηηκεηή ηαρύηεηαο. Ζ
παξαπάλσ ηερληθή απνηειεί ηνλ έκκεζν δηαλπζκαηηθό έιεγρν κε πξνζαλαηνιηζκό πεδίνπ ηνπ δξνκέα θαη
επηιέγεηαη γηα ηελ εθαξκνγή, ρξεζηκνπνηώληαο σο βέιηηζηε ιύζε εθηηκεηή ηαρύηεηαο πνπ βαζίδεηαη ζην
πξνζαξκνζηηθό κνληέιν ηνπ θηλεηήξα θαη ηηο κεηξήζεηο ηάζεο θαη ξεύκαηνο ηνπ ζηάηε [51]-[53].
ην ρ. 3.40(α), παξνπζηάδεηαη ην δηαλπζκαηηθό δηάγξακκα ησλ κεγεζώλ ηνπ ηζνδύλακνπ θπθιώκαηνο
ζε πεξηζηξεθόκελν πιαίζην dq κε πξνζαλαηνιηζκό πεδίνπ ηνπ δξνκέα ιrd εθείλνλ πνπ έρεη ε ζπληζηώζα
καγλήηηζεο ηνπ ξεύκαηνο άμνλα d, isd. Όκνηα, ε ζπληζηώζα ξνπήο ηνπ ξεύκαηνο iqs, πξνζαλαηνιίδεηαη κε ηνλ
άμνλα q. Παξαηεξείηαη όηη κεηά ηνλ πξνζαλαηνιηζκό, ε πξνβνιή ηεο q ζπληζηώζαο ηεο καγλεηηθήο ξνήο
ηνπ δξνκέα, ιrq, είλαη κεδεληθή:
Per
un
it t
orq
ue
(Te /T
em,m
ax)
Per unit slip (s)
0
1.0
1 0 -1.5
Area of
constant torque
(Te=const)
Area of
constant power
(Teσm=const)
Area of constant power
with field weaking
(Teσm2=const)
Machine limit
Inverter transient limit
Inverter steady state limit
Torque (Te)Voltage (VS)
Flux (ιm)
Stator
Current (Is)
Slip (s)
1.0
01
Per unit slip (s)
Per
un
it v
olt
ag
e (V
S /V
S,n
om
)
0 -1.5
ΔΙΔΑΚΣΟΡΙΚΗ ΔΙΑΣΡΙΒΗ
ΠΤΡΙΔΩΝ Β. ΓΙΑΝΝΟΤΣΟ
167 Πξνζαξκνζηηθόο έιεγρνο ηνπνινγίαο ξπζκηζηώλ ζηξνθώλ γηα εμνηθνλόκεζε ελέξγεηαο ζε πινία
ρήκα 3.40: Σερληθή έκκεζνπ δηαλπζκαηηθνύ ειέγρνπ κε πξνζαλαηνιηζκό ηνπ d άμνλα κε ην δηάλπζκα καγλεηηθήο
ξνήο ηνπ πεδίνπ ηνπ δξνκέα (α) Γηαλπζκαηηθό δηάγξακκα ηζνδύλακνπ θπθιώκαηνο ζε πεξηζηξεθόκελν πιαίζην
dq κε πξνζαλαηνιηζκό πεδίνπ ηνπ δξνκέα ιrd κε ηε ζπληζηώζα ηνπ ξεύκαηνο άμνλα d, isd (β) Ιζνδύλακν θύθισκα
d άμνλα θηλεηήξα κεηά ηνλ πξνζαλαηνιηζκό (γ) Ιζνδύλακν θύθισκα q άμνλα θηλεηήξα κεηά ηνλ πξνζαλαηνιηζκό
Eπνκέλσο, γηα ηελ q ζπληζηώζα ηνπ ξεύκαηνο ηνπ δξνκέα irq, κε ρξήζε ηεο ζρ. (3.45) πξνθύπηεη ε ζρέζε:
Tα ηζνδύλακα θπθιώκαηα d,q ηνπ θηλεηήξα κεηά ηνλ πξνζαλαηνιηζκό ηνπ άμνλα d ηνπ πιαηζίνπ κε ην
δηάλπζκα καγλεηηθήο ξνήο ηνπ δξνκέα ηνπ θηλεηήξα βξαρπθπθισκέλνπ δξνκέα (vrq = vrd=0), θαίλνληαη ζηα
ρ. 3.40(β), (γ). Με αληηθαηάζηαζε ηεο ζρ. (3.67), ζηε ζρ. (3.47), πξνθύπηεη ε ηαρύηεηα νιίζζεζεο σsl :
όπνπ Σr = Lr / Rr νξίδεηαη σο ζηαζεξά ηνπ δξνκέα. Αληίζηνηρα, γηα ηελ έθθξαζε ηεο ξνπήο Σe, ε ζρ. (3.64) κε
αληηθαηάζηαζε ηεο ζρ. (3.66) θαη (3.67) ζα δώζεη ηελ εμήο έθθξαζε:
Πξνθεηκέλνπ λα θαηαζηεί ζαθήο ε εμάξηεζε ηεο καγλεηηθήο ξνήο ηνπ δξνκέα ιrd κε ηε ζπληζηώζα
άμνλα d ηνπ ξεύκαηνο ηνπ ζηάηε isd, παξνπζηάδεηαη ζην ρ. 3.41(α) κηα απινπνηεκέλε εθδνρή ηνπ
θπθιώκαηνο άμνλα d ηνπ ρ. 3.40(β), ζεσξώληαο όηη ην isd παξέρεηαη από κηα πεγή ξεύκαηνο. Δθαξκόδνληαο
κεηαζρεκαηηζκό Laplace, ην θύθισκα πξνο κειέηε ζην πεδίν ηεο ζπρλόηεηαο θαίλεηαη ζην ρ. 3.41(β),
όπνπ ην ξεύκα ird ππνινγίδεηαη σο εμήο:
θ
ω = ωe
ωr
θe
θr
ιrd
isd
isq
Is
isq s ιrq s
ιrq=0
d s
q s
d e
q e
d rRotor
axis
isq
isd s
ιrd sθsl
ωsl
+-
σe ιsq Lls=Ls-LmRs
Lm
Llr Rr
+
-
+
-
isd ird
+
-
λrd = 0
+
-
+ -
Rs
Lm+
-
Rr
+
-
+
-
isq irq
+
-
λrq = 0
+
-
σe ιsd Lls Llr
σsl ιrd
(α)
(β)
(γ)
λsd
λsq
rq
dtd
= 0
λrq = 0
+
-
irq
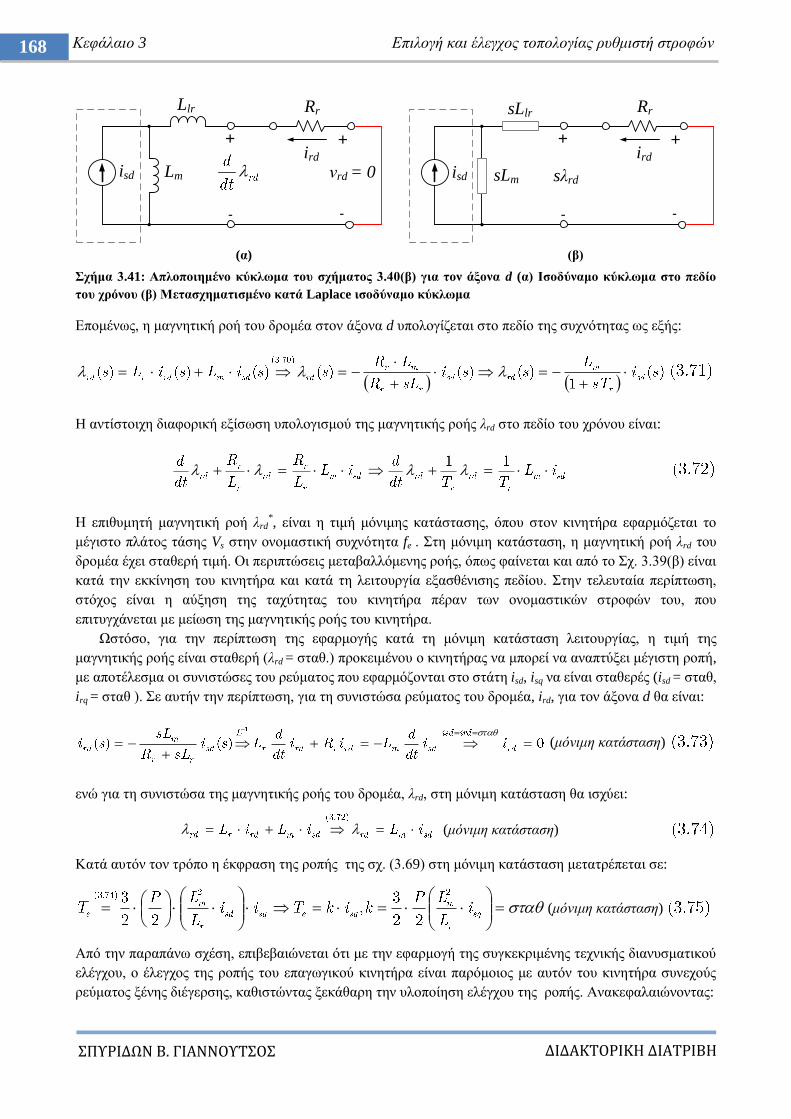
ΔΙΔΑΚΣΟΡΙΚΗ ΔΙΑΣΡΙΒΗ
ΠΤΡΙΔΩΝ Β. ΓΙΑΝΝΟΤΣΟ
168 Κεθάιαην 3 Δπηινγή θαη έιεγρνο ηνπνινγίαο ξπζκηζηή ζηξνθώλ
(α) (β)
ρήκα 3.41: Απινπνηεκέλν θύθισκα ηνπ ζρήκαηνο 3.40(β) γηα ηνλ άμνλα d (α) Ιζνδύλακν θύθισκα ζην πεδίν
ηνπ ρξόλνπ (β) Μεηαζρεκαηηζκέλν θαηά Laplace ηζνδύλακν θύθισκα
Δπνκέλσο, ε καγλεηηθή ξνή ηνπ δξνκέα ζηνλ άμνλα d ππνινγίδεηαη ζην πεδίν ηεο ζπρλόηεηαο σο εμήο:
H αληίζηνηρε δηαθνξηθή εμίζσζε ππνινγηζκνύ ηεο καγλεηηθήο ξνήο ιrd ζην πεδίν ηνπ ρξόλνπ είλαη:
Ζ επηζπκεηή καγλεηηθή ξνή ιrd*, είλαη ε ηηκή κόληκεο θαηάζηαζεο, όπνπ ζηνλ θηλεηήξα εθαξκόδεηαη ην
κέγηζην πιάηνο ηάζεο Vs ζηελ νλνκαζηηθή ζπρλόηεηα fe . ηε κόληκε θαηάζηαζε, ε καγλεηηθή ξνή ιrd ηνπ
δξνκέα έρεη ζηαζεξή ηηκή. Οη πεξηπηώζεηο κεηαβαιιόκελεο ξνήο, όπσο θαίλεηαη θαη από ην ρ. 3.39(β) είλαη
θαηά ηελ εθθίλεζε ηνπ θηλεηήξα θαη θαηά ηε ιεηηνπξγία εμαζζέληζεο πεδίνπ. ηελ ηειεπηαία πεξίπησζε,
ζηόρνο είλαη ε αύμεζε ηεο ηαρύηεηαο ηνπ θηλεηήξα πέξαλ ησλ νλνκαζηηθώλ ζηξνθώλ ηνπ, πνπ
επηηπγράλεηαη κε κείσζε ηεο καγλεηηθήο ξνήο ηνπ θηλεηήξα.
Χζηόζν, γηα ηελ πεξίπησζε ηεο εθαξκνγήο θαηά ηε κόληκε θαηάζηαζε ιεηηνπξγίαο, ε ηηκή ηεο
καγλεηηθήο ξνήο είλαη ζηαζεξή (ιrd = ζηαζ.) πξνθεηκέλνπ ν θηλεηήξαο λα κπνξεί λα αλαπηύμεη κέγηζηε ξνπή,
κε απνηέιεζκα νη ζπληζηώζεο ηνπ ξεύκαηνο πνπ εθαξκόδνληαη ζην ζηάηε isd, isq λα είλαη ζηαζεξέο (isd = ζηαζ,
irq = ζηαζ ). ε απηήλ ηελ πεξίπησζε, γηα ηε ζπληζηώζα ξεύκαηνο ηνπ δξνκέα, ird, γηα ηνλ άμνλα d ζα είλαη:
(κόληκε θαηάζηαζε)
ελώ γηα ηε ζπληζηώζα ηεο καγλεηηθήο ξνήο ηνπ δξνκέα, ιrd, ζηε κόληκε θαηάζηαζε ζα ηζρύεη:
(κόληκε θαηάζηαζε)
Καηά απηόλ ηνλ ηξόπν ε έθθξαζε ηεο ξνπήο ηεο ζρ. (3.69) ζηε κόληκε θαηάζηαζε κεηαηξέπεηαη ζε:
(κόληκε θαηάζηαζε)
Από ηελ παξαπάλσ ζρέζε, επηβεβαηώλεηαη όηη κε ηελ εθαξκνγή ηεο ζπγθεθξηκέλεο ηερληθήο δηαλπζκαηηθνύ
ειέγρνπ, ν έιεγρνο ηεο ξνπήο ηνπ επαγσγηθνύ θηλεηήξα είλαη παξόκνηνο κε απηόλ ηνπ θηλεηήξα ζπλερνύο
ξεύκαηνο μέλεο δηέγεξζεο, θαζηζηώληαο μεθάζαξε ηελ πινπνίεζε ειέγρνπ ηεο ξνπήο. Αλαθεθαιαηώλνληαο:
Rr
ird
+
-
λrd = 0
+
-
Llr
Lmisd
Rr
ird
+
-
+
-
sLlr
sLm sιrdisd
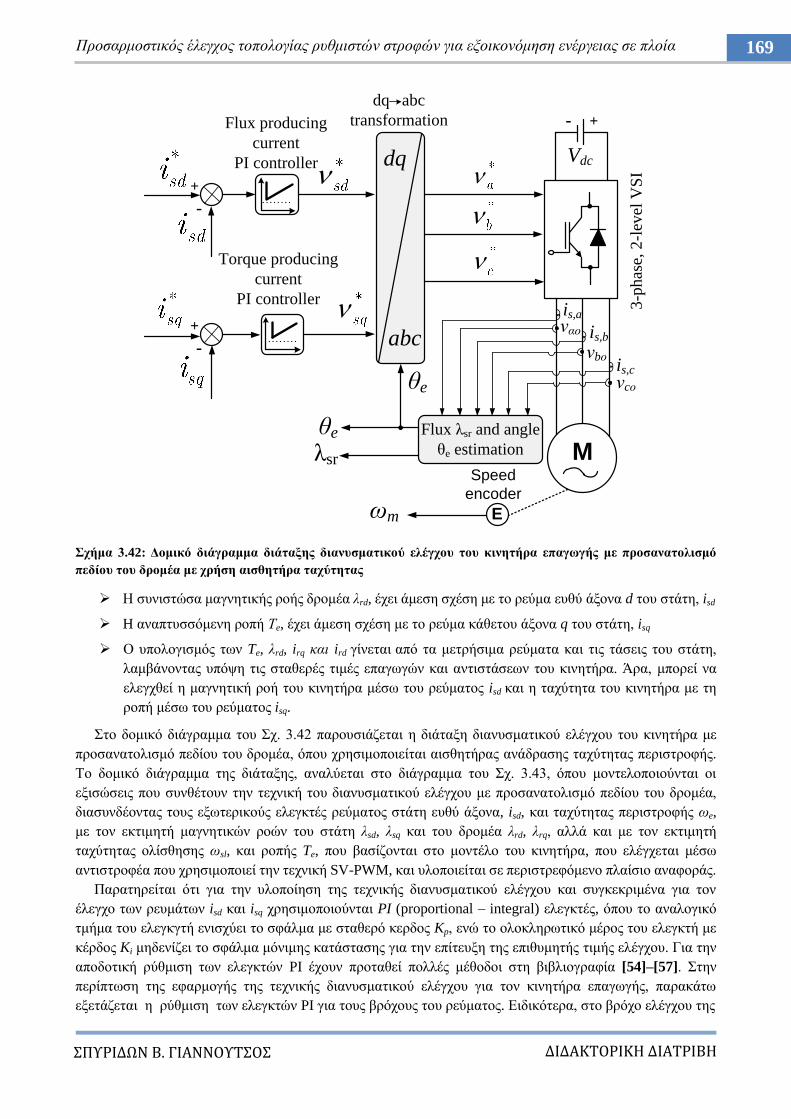
ΔΙΔΑΚΣΟΡΙΚΗ ΔΙΑΣΡΙΒΗ
ΠΤΡΙΔΩΝ Β. ΓΙΑΝΝΟΤΣΟ
169 Πξνζαξκνζηηθόο έιεγρνο ηνπνινγίαο ξπζκηζηώλ ζηξνθώλ γηα εμνηθνλόκεζε ελέξγεηαο ζε πινία
ρήκα 3.42: Γνκηθό δηάγξακκα δηάηαμεο δηαλπζκαηηθνύ ειέγρνπ ηνπ θηλεηήξα επαγσγήο κε πξνζαλαηνιηζκό
πεδίνπ ηνπ δξνκέα κε ρξήζε αηζζεηήξα ηαρύηεηαο
Ζ ζπληζηώζα καγλεηηθήο ξνήο δξνκέα ιrd, έρεη άκεζε ζρέζε κε ην ξεύκα επζύ άμνλα d ηνπ ζηάηε, isd
H αλαπηπζζόκελε ξνπή Σe, έρεη άκεζε ζρέζε κε ην ξεύκα θάζεηνπ άμνλα q ηνπ ζηάηε, isq
Ο ππνινγηζκόο ησλ Te, ιrd, irq θαη ird γίλεηαη από ηα κεηξήζηκα ξεύκαηα θαη ηηο ηάζεηο ηνπ ζηάηε,
ιακβάλνληαο ππόςε ηηο ζηαζεξέο ηηκέο επαγσγώλ θαη αληηζηάζεσλ ηνπ θηλεηήξα. Άξα, κπνξεί λα
ειεγρζεί ε καγλεηηθή ξνή ηνπ θηλεηήξα κέζσ ηνπ ξεύκαηνο isd θαη ε ηαρύηεηα ηνπ θηλεηήξα κε ηε
ξνπή κέζσ ηνπ ξεύκαηνο isq.
ην δνκηθό δηάγξακκα ηνπ ρ. 3.42 παξνπζηάδεηαη ε δηάηαμε δηαλπζκαηηθνύ ειέγρνπ ηνπ θηλεηήξα κε
πξνζαλαηνιηζκό πεδίνπ ηνπ δξνκέα, όπνπ ρξεζηκνπνηείηαη αηζζεηήξαο αλάδξαζεο ηαρύηεηαο πεξηζηξνθήο.
Σν δνκηθό δηάγξακκα ηεο δηάηαμεο, αλαιύεηαη ζην δηάγξακκα ηνπ ρ. 3.43, όπνπ κνληεινπνηνύληαη νη
εμηζώζεηο πνπ ζπλζέηνπλ ηελ ηερληθή ηνπ δηαλπζκαηηθνύ ειέγρνπ κε πξνζαλαηνιηζκό πεδίνπ ηνπ δξνκέα,
δηαζπλδένληαο ηνπο εμσηεξηθνύο ειεγθηέο ξεύκαηνο ζηάηε επζύ άμνλα, isd, θαη ηαρύηεηαο πεξηζηξνθήο σe,
κε ηνλ εθηηκεηή καγλεηηθώλ ξνώλ ηνπ ζηάηε ιsd, ιsq θαη ηνπ δξνκέα ιrd, ιrq, αιιά θαη κε ηνλ εθηηκεηή
ηαρύηεηαο νιίζζεζεο σsl, θαη ξνπήο Te, πνπ βαζίδνληαη ζην κνληέιν ηνπ θηλεηήξα, πνπ ειέγρεηαη κέζσ
αληηζηξνθέα πνπ ρξεζηκνπνηεί ηελ ηερληθή SV-PWM, θαη πινπνηείηαη ζε πεξηζηξεθόκελν πιαίζην αλαθνξάο.
Παξαηεξείηαη όηη γηα ηελ πινπνίεζε ηεο ηερληθήο δηαλπζκαηηθνύ ειέγρνπ θαη ζπγθεθξηκέλα γηα ηνλ
έιεγρν ησλ ξεπκάησλ isd θαη isq ρξεζηκνπνηνύληαη PI (proportional – integral) ειεγθηέο, όπνπ ην αλαινγηθό
ηκήκα ηνπ ειεγθγηή εληζρύεη ην ζθάικα κε ζηαζεξό θεξδνο Kp, ελώ ην νινθιεξσηηθό κέξνο ηνπ ειεγθηή κε
θέξδνο Ki κεδελίδεη ην ζθάικα κόληκεο θαηάζηαζεο γηα ηελ επίηεπμε ηεο επηζπκεηήο ηηκήο ειέγρνπ. Γηα ηελ
απνδνηηθή ξύζκηζε ησλ ειεγθηώλ PI έρνπλ πξνηαζεί πνιιέο κέζνδνη ζηε βηβιηνγξαθία [54]–[57]. ηελ
πεξίπησζε ηεο εθαξκνγήο ηεο ηερληθήο δηαλπζκαηηθνύ ειέγρνπ γηα ηνλ θηλεηήξα επαγσγήο, παξαθάησ
εμεηάδεηαη ε ξύζκηζε ησλ ειεγθηώλ PI γηα ηνπο βξόρνπο ηνπ ξεύκαηνο. Δηδηθόηεξα, ζην βξόρν ειέγρνπ ηεο
M
is,a
is,b
is,c
+-
Vdc
dq
abc
ζe
dq abc
transformation
+
-
Flux producing
current
PI controller
Torque producing
current
PI controller
+
-
3-p
has
e, 2
-lev
el V
SI
λαν
λbν
λcν
Flux ιsr and angle
ζe estimation
Eσm
Speed
encoder
ιsr
ζe
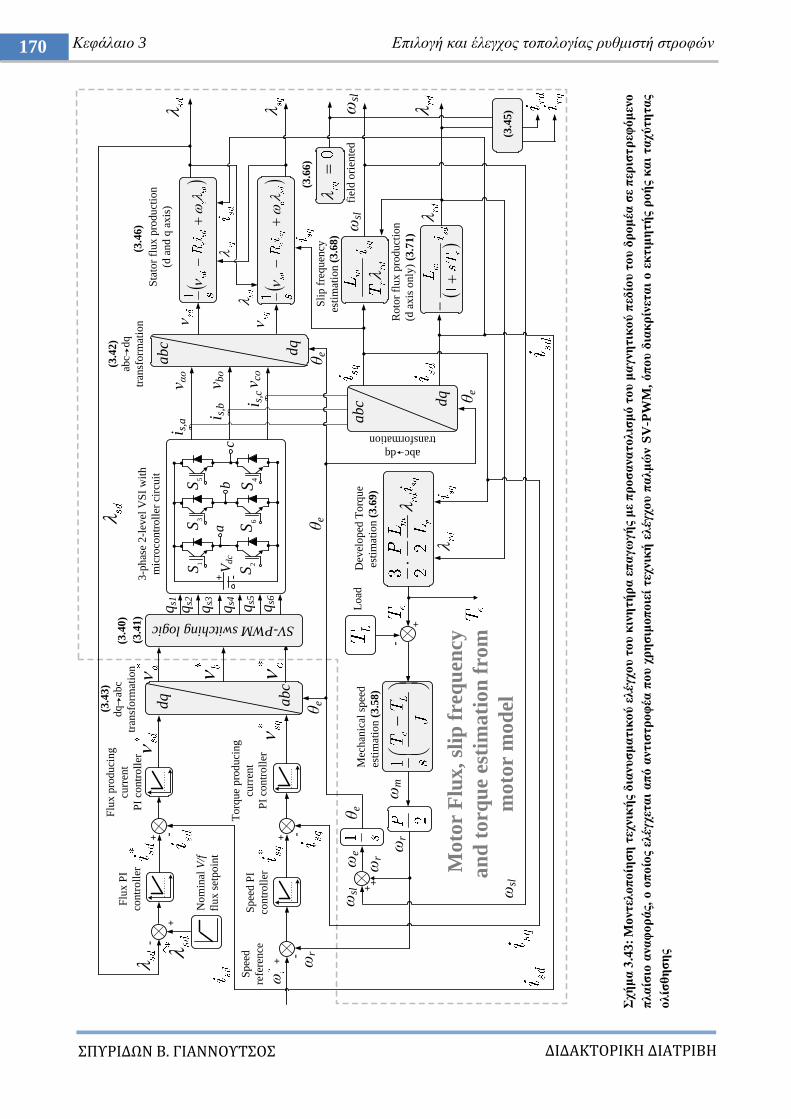
ΔΙΔΑΚΣΟΡΙΚΗ ΔΙΑΣΡΙΒΗ
ΠΤΡΙΔΩΝ Β. ΓΙΑΝΝΟΤΣΟ
170 Κεθάιαην 3 Δπηινγή θαη έιεγρνο ηνπνινγίαο ξπζκηζηή ζηξνθώλ
ρή
κα
3.4
3:
Mo
ληει
νπ
νίε
ζε
ηερ
ληθ
ήο
δηα
λπ
ζκ
αηηθ
νύ
ειέγ
ρν
π η
νπ
θηλ
εηή
ξα
επ
αγσ
γή
ο κ
ε π
ξν
ζα
λα
ην
ιηζ
κό
ην
π κ
αγλε
ηηθ
νύ
πεδ
ίνπ
ην
π δ
ξν
κέα
ζε
πεξ
ηζη
ξεθ
όκ
ελν
πια
ίζην
αλα
θν
ξά
ο, ν
νπ
νίν
ο ει
έγρεη
αη
απ
ό α
ληηζ
ηξ
νθ
έα π
νπ
ρξ
εζ
ηκν
πν
ηεί
ηερ
ληθ
ή ε
ιέγ
ρν
π π
αικ
ώλ S
V-P
WM
, ό
πν
π δ
ηαθ
ξίλ
εηα
η ν
εθ
ηηκ
εηή
ο ξ
νή
ο θ
αη
ηα
ρύ
ηε
ηα
ο
νιίζ
ζε
ζε
ο
Nom
inal
V/f
flux s
etpoin
t
+
-
Flu
x P
I
contr
oll
er
+ -
Flu
x p
roduci
ng
curr
ent
PI
contr
oll
er
+
-σ
r
Spee
d P
I
contr
oll
er
Torq
ue
pro
duci
ng
curr
ent
PI
contr
oll
er
+ -
dq
abc
ζe
dq a
bc
tran
sform
atio
n
σsl
SV-PWM switching logic
qs1
ab
1S
3S
5S
2S
6S
4S
c
qs2
qs3
Vd
c+ -
qs4 qs5
qs6
λ αν
λ bν
λ cνab
c dq
tran
sform
atio
n
dq
abc
ζe
Sta
tor
flux p
roduct
ion
(d a
nd q
axis
) i
s,a i
s,b i
s,c
abc d
q
abc dq
transformation
(3.4
6)
ζe
Roto
r fl
ux p
roduct
ion
(d a
xis
only
)
(3.7
1)
(3.6
8)
S
lip f
requen
cy
esti
mat
ion
σsl
(3.6
6)
fi
eld o
rien
ted
3-p
has
e 2-l
evel
VS
I w
ith
mic
roco
ntr
oll
er c
ircu
it
D
evel
oped
Torq
ue
est
imat
ion (
3.6
9)
+
-
Load
ζe
σ
m
Mec
han
ical
spee
d
esti
mat
ion (
3.5
8)
σr
++
σr
σsl
σe
σsl
Spee
d
refe
rence
ζe
Mo
tor
Flu
x,
slip
fre
qu
ency
an
d t
orq
ue
esti
ma
tio
n f
rom
mo
tor
mo
del
(3.4
0)
(3.4
1)
(3.4
3)
(3.4
2)
(3.4
5)
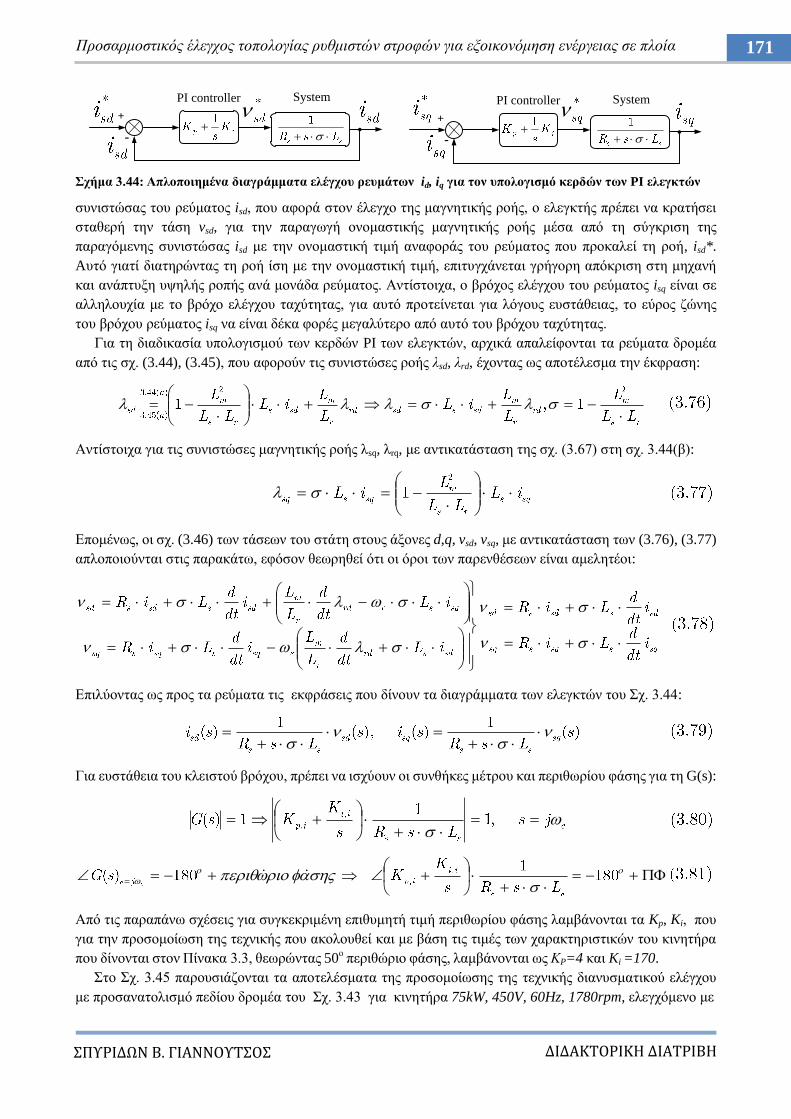
ΔΙΔΑΚΣΟΡΙΚΗ ΔΙΑΣΡΙΒΗ
ΠΤΡΙΔΩΝ Β. ΓΙΑΝΝΟΤΣΟ
171 Πξνζαξκνζηηθόο έιεγρνο ηνπνινγίαο ξπζκηζηώλ ζηξνθώλ γηα εμνηθνλόκεζε ελέξγεηαο ζε πινία
ρήκα 3.44: Απινπνηεκέλα δηαγξάκκαηα ειέγρνπ ξεπκάησλ id, iq γηα ηνλ ππνινγηζκό θεξδώλ ησλ PI ειεγθηώλ
ζπληζηώζαο ηνπ ξεύκαηνο isd, πνπ αθνξά ζηνλ έιεγρν ηεο καγλεηηθήο ξνήο, ν ειεγθηήο πξέπεη λα θξαηήζεη
ζηαζεξή ηελ ηάζε vsd, γηα ηελ παξαγσγή νλνκαζηηθήο καγλεηηθήο ξνήο κέζα από ηε ζύγθξηζε ηεο
παξαγόκελεο ζπληζηώζαο isd κε ηελ νλνκαζηηθή ηηκή αλαθνξάο ηνπ ξεύκαηνο πνπ πξνθαιεί ηε ξνή, isd*.
Aπηό γηαηί δηαηεξώληαο ηε ξνή ίζε κε ηελ νλνκαζηηθή ηηκή, επηηπγράλεηαη γξήγνξε απόθξηζε ζηε κεραλή
θαη αλάπηπμε πςειήο ξνπήο αλά κνλάδα ξεύκαηνο. Αληίζηνηρα, ν βξόρνο ειέγρνπ ηνπ ξεύκαηνο isq είλαη ζε
αιιεινπρία κε ην βξόρν ειέγρνπ ηαρύηεηαο, γηα απηό πξνηείλεηαη γηα ιόγνπο επζηάζεηαο, ην εύξνο δώλεο
ηνπ βξόρνπ ξεύκαηνο isq λα είλαη δέθα θνξέο κεγαιύηεξν από απηό ηνπ βξόρνπ ηαρύηεηαο.
Γηα ηε δηαδηθαζία ππνινγηζκνύ ησλ θεξδώλ PI ησλ ειεγθηώλ, αξρηθά απαιείθνληαη ηα ξεύκαηα δξνκέα
από ηηο ζρ. (3.44), (3.45), πνπ αθνξνύλ ηηο ζπληζηώζεο ξνήο ιsd, ιrd, έρνληαο σο απνηέιεζκα ηελ έθθξαζε:
Αληίζηνηρα γηα ηηο ζπληζηώζεο καγλεηηθήο ξνήο ιsq, ιrq, κε αληηθαηάζηαζε ηεο ζρ. (3.67) ζηε ζρ. 3.44(β):
Δπνκέλσο, νη ζρ. (3.46) ησλ ηάζεσλ ηνπ ζηάηε ζηνπο άμνλεο d,q, vsd, vsq, κε αληηθαηάζηαζε ησλ (3.76), (3.77)
απινπνηνύληαη ζηηο παξαθάησ, εθόζνλ ζεσξεζεί όηη νη όξνη ησλ παξελζέζεσλ είλαη ακειεηένη:
Δπηιύνληαο σο πξνο ηα ξεύκαηα ηηο εθθξάζεηο πνπ δίλνπλ ηα δηαγξάκκαηα ησλ ειεγθηώλ ηνπ ρ. 3.44:
Γηα επζηάζεηα ηνπ θιεηζηνύ βξόρνπ, πξέπεη λα ηζρύνπλ νη ζπλζήθεο κέηξνπ θαη πεξηζσξίνπ θάζεο γηα ηε G(s):
Από ηηο παξαπάλσ ζρέζεηο γηα ζπγθεθξηκέλε επηζπκεηή ηηκή πεξηζσξίνπ θάζεο ιακβάλνληαη ηα Kp, Ki, πνπ
γηα ηελ πξνζνκνίσζε ηεο ηερληθήο πνπ αθνινπζεί θαη κε βάζε ηηο ηηκέο ησλ ραξαθηεξηζηηθώλ ηνπ θηλεηήξα
πνπ δίλνληαη ζηνλ Πίλαθα 3.3, ζεσξώληαο 50ν πεξηζώξην θάζεο, ιακβάλνληαη σο ΚP=4 θαη Ki =170.
ην ρ. 3.45 παξνπζηάδνληαη ηα απνηειέζκαηα ηεο πξνζνκνίσζεο ηεο ηερληθήο δηαλπζκαηηθνύ ειέγρνπ
κε πξνζαλαηνιηζκό πεδίνπ δξνκέα ηνπ ρ. 3.43 γηα θηλεηήξα 75kW, 450V, 60Hz, 1780rpm, ειεγρόκελν κε
+
-
PI controller System
+
-
PI controller System
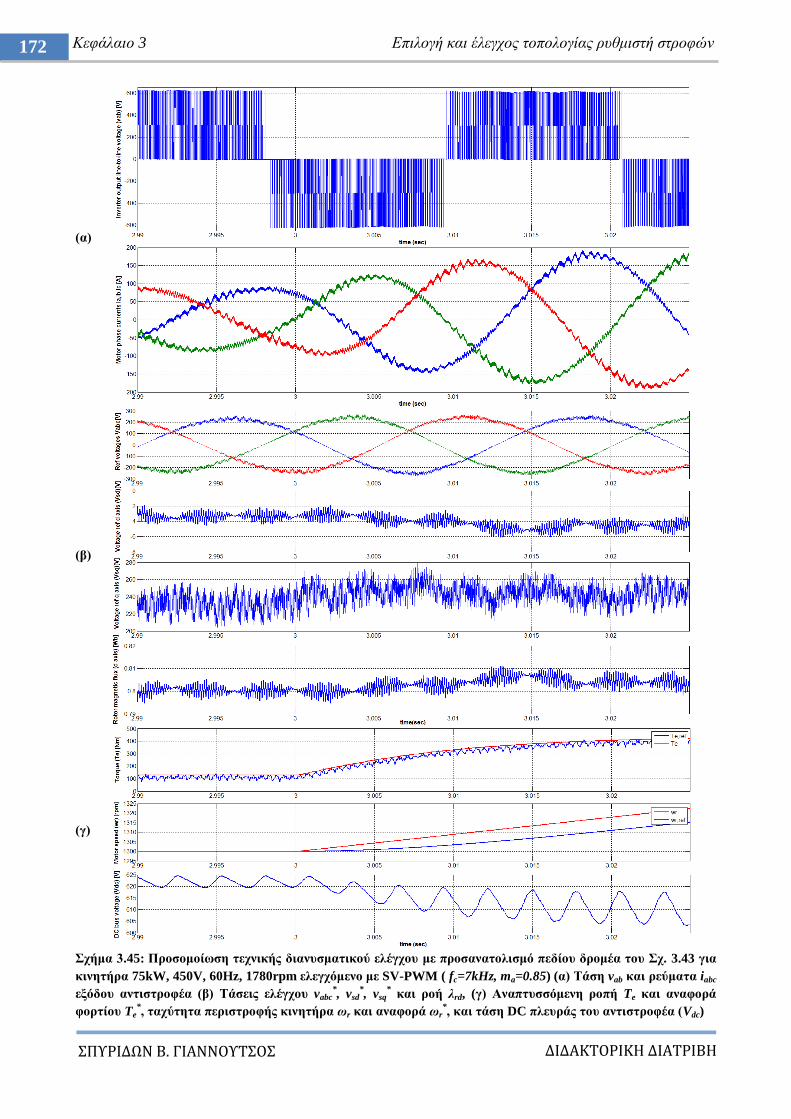
ΔΙΔΑΚΣΟΡΙΚΗ ΔΙΑΣΡΙΒΗ
ΠΤΡΙΔΩΝ Β. ΓΙΑΝΝΟΤΣΟ
172 Κεθάιαην 3 Δπηινγή θαη έιεγρνο ηνπνινγίαο ξπζκηζηή ζηξνθώλ
(α)
(β)
(γ)
ρήκα 3.45: Πξνζνκνίσζε ηερληθήο δηαλπζκαηηθνύ ειέγρνπ κε πξνζαλαηνιηζκό πεδίνπ δξνκέα ηνπ ρ. 3.43 γηα
θηλεηήξα 75kW, 450V, 60Hz, 1780rpm ειεγρόκελν κε SV-PWM ( fc=7kHz, ma=0.85) (α) Σάζε vab θαη ξεύκαηα iabc
εμόδνπ αληηζηξνθέα (β) Σάζεηο ειέγρνπ vabc*, vsd
*, vsq
* θαη ξνή ιrd, (γ) Αλαπηπζζόκελε ξνπή Te θαη αλαθνξά
θνξηίνπ Te*, ηαρύηεηα πεξηζηξνθήο θηλεηήξα σr θαη αλαθνξά σr
*, θαη ηάζε DC πιεπξάο ηνπ αληηζηξνθέα (Vdc)
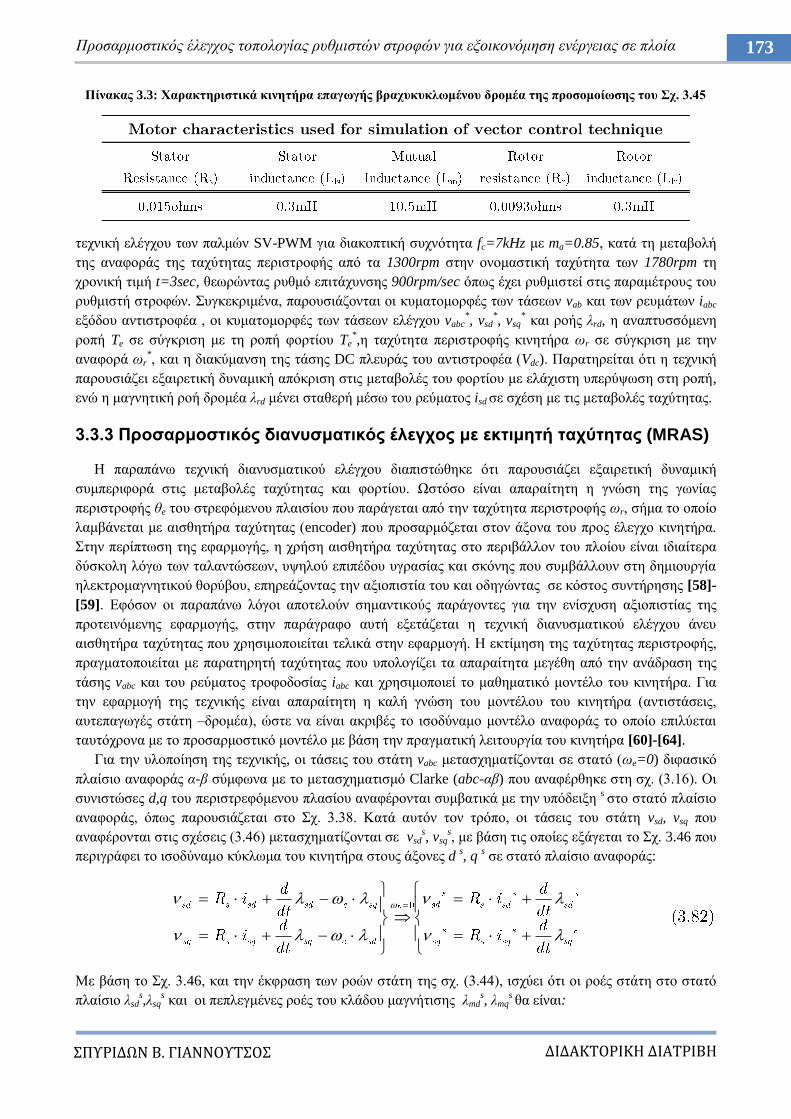
ΔΙΔΑΚΣΟΡΙΚΗ ΔΙΑΣΡΙΒΗ
ΠΤΡΙΔΩΝ Β. ΓΙΑΝΝΟΤΣΟ
173 Πξνζαξκνζηηθόο έιεγρνο ηνπνινγίαο ξπζκηζηώλ ζηξνθώλ γηα εμνηθνλόκεζε ελέξγεηαο ζε πινία
Πίλαθαο 3.3: Υαξαθηεξηζηηθά θηλεηήξα επαγσγήο βξαρπθπθισκέλνπ δξνκέα ηεο πξνζνκνίσζεο ηνπ ρ. 3.45
ηερληθή ειέγρνπ ησλ παικώλ SV-PWM γηα δηαθνπηηθή ζπρλόηεηα fc=7kHz κε ma=0.85, θαηά ηε κεηαβνιή
ηεο αλαθνξάο ηεο ηαρύηεηαο πεξηζηξνθήο από ηα 1300rpm ζηελ νλνκαζηηθή ηαρύηεηα ησλ 1780rpm ηε
ρξνληθή ηηκή t=3sec, ζεσξώληαο ξπζκό επηηάρπλζεο 900rpm/sec όπσο έρεη ξπζκηζηεί ζηηο παξακέηξνπο ηνπ
ξπζκηζηή ζηξνθώλ. πγθεθξηκέλα, παξνπζηάδνληαη νη θπκαηνκνξθέο ησλ ηάζεσλ vab θαη ησλ ξεπκάησλ iabc
εμόδνπ αληηζηξνθέα , νη θπκαηνκνξθέο ησλ ηάζεσλ ειέγρνπ vabc*, vsd
*, vsq
* θαη ξνήο ιrd, ε αλαπηπζζόκελε
ξνπή Te ζε ζύγθξηζε κε ηε ξνπή θνξηίνπ Te*,ε ηαρύηεηα πεξηζηξνθήο θηλεηήξα σr ζε ζύγθξηζε κε ηελ
αλαθνξά σr*, θαη ε δηαθύκαλζε ηεο ηάζεο DC πιεπξάο ηνπ αληηζηξνθέα (Vdc). Παξαηεξείηαη όηη ε ηερληθή
παξνπζηάδεη εμαηξεηηθή δπλακηθή απόθξηζε ζηηο κεηαβνιέο ηνπ θνξηίνπ κε ειάρηζηε ππεξύςσζε ζηε ξνπή,
ελώ ε καγλεηηθή ξνή δξνκέα ιrd κέλεη ζηαζεξή κέζσ ηνπ ξεύκαηνο isd ζε ζρέζε κε ηηο κεηαβνιέο ηαρύηεηαο.
3.3.3 Πξνζαξκνζηηθόο δηαλπζκαηηθόο έιεγρνο κε εθηηκεηή ηαρύηεηαο (MRAS)
Ζ παξαπάλσ ηερληθή δηαλπζκαηηθνύ ειέγρνπ δηαπηζηώζεθε όηη παξνπζηάδεη εμαηξεηηθή δπλακηθή
ζπκπεξηθνξά ζηηο κεηαβνιέο ηαρύηεηαο θαη θνξηίνπ. Χζηόζν είλαη απαξαίηεηε ε γλώζε ηεο γσλίαο
πεξηζηξνθήο ζe ηνπ ζηξεθόκελνπ πιαηζίνπ πνπ παξάγεηαη από ηελ ηαρύηεηα πεξηζηξνθήο σr, ζήκα ην νπνίν
ιακβάλεηαη κε αηζζεηήξα ηαρύηεηαο (encoder) πνπ πξνζαξκόδεηαη ζηνλ άμνλα ηνπ πξνο έιεγρν θηλεηήξα.
ηελ πεξίπησζε ηεο εθαξκνγήο, ε ρξήζε αηζζεηήξα ηαρύηεηαο ζην πεξηβάιινλ ηνπ πινίνπ είλαη ηδηαίηεξα
δύζθνιε ιόγσ ησλ ηαιαληώζεσλ, πςεινύ επηπέδνπ πγξαζίαο θαη ζθόλεο πνπ ζπκβάιινπλ ζηε δεκηνπξγία
ειεθηξνκαγλεηηθνύ ζνξύβνπ, επεξεάδνληαο ηελ αμηνπηζηία ηνπ θαη νδεγώληαο ζε θόζηνο ζπληήξεζεο [58]-
[59]. Δθόζνλ νη παξαπάλσ ιόγνη απνηεινύλ ζεκαληηθνύο παξάγνληεο γηα ηελ ελίζρπζε αμηνπηζηίαο ηεο
πξνηεηλόκελεο εθαξκνγήο, ζηελ παξάγξαθν απηή εμεηάδεηαη ε ηερληθή δηαλπζκαηηθνύ ειέγρνπ άλεπ
αηζζεηήξα ηαρύηεηαο πνπ ρξεζηκνπνηείηαη ηειηθά ζηελ εθαξκνγή. Ζ εθηίκεζε ηεο ηαρύηεηαο πεξηζηξνθήο,
πξαγκαηνπνηείηαη κε παξαηεξεηή ηαρύηεηαο πνπ ππνινγίδεη ηα απαξαίηεηα κεγέζε από ηελ αλάδξαζε ηεο
ηάζεο vabc θαη ηνπ ξεύκαηνο ηξνθνδνζίαο iabc θαη ρξεζηκνπνηεί ην καζεκαηηθό κνληέιν ηνπ θηλεηήξα. Γηα
ηελ εθαξκνγή ηεο ηερληθήο είλαη απαξαίηεηε ε θαιή γλώζε ηνπ κνληέινπ ηνπ θηλεηήξα (αληηζηάζεηο,
απηεπαγσγέο ζηάηε –δξνκέα), ώζηε λα είλαη αθξηβέο ην ηζνδύλακν κνληέιν αλαθνξάο ην νπνίν επηιύεηαη
ηαπηόρξνλα κε ην πξνζαξκνζηηθό κνληέιν κε βάζε ηελ πξαγκαηηθή ιεηηνπξγία ηνπ θηλεηήξα [60]-[64].
Γηα ηελ πινπνίεζε ηεο ηερληθήο, νη ηάζεηο ηνπ ζηάηε vabc κεηαζρεκαηίδνληαη ζε ζηαηό (σe=0) δηθαζηθό
πιαίζην αλαθνξάο α-β ζύκθσλα κε ην κεηαζρεκαηηζκό Clarke (abc-αβ) πνπ αλαθέξζεθε ζηε ζρ. (3.16). Οη
ζπληζηώζεο d,q ηνπ πεξηζηξεθόκελνπ πιαζίνπ αλαθέξνληαη ζπκβαηηθά κε ηελ ππόδεημε s ζην ζηαηό πιαίζην
αλαθνξάο, όπσο παξνπζηάδεηαη ζην ρ. 3.38. Καηά απηόλ ηνλ ηξόπν, νη ηάζεηο ηνπ ζηάηε vsd, vsq πνπ
αλαθέξνληαη ζηηο ζρέζεηο (3.46) κεηαζρεκαηίδνληαη ζε vsds, vsq
s, κε βάζε ηηο νπνίεο εμάγεηαη ην ρ. 3.46 πνπ
πεξηγξάθεη ην ηζνδύλακν θύθισκα ηνπ θηλεηήξα ζηνπο άμνλεο d s, q
s ζε ζηαηό πιαίζην αλαθνξάο:
Με βάζε ην ρ. 3.46, θαη ηελ έθθξαζε ησλ ξνώλ ζηάηε ηεο ζρ. (3.44), ηζρύεη όηη νη ξνέο ζηάηε ζην ζηαηό
πιαίζην ιsds,ιsq
s θαη νη πεπιεγκέλεο ξνέο ηνπ θιάδνπ καγλήηηζεο ιmd
s, ιmq
s ζα είλαη:
ΔΙΔΑΚΣΟΡΙΚΗ ΔΙΑΣΡΙΒΗ
ΠΤΡΙΔΩΝ Β. ΓΙΑΝΝΟΤΣΟ
174 Κεθάιαην 3 Δπηινγή θαη έιεγρνο ηνπνινγίαο ξπζκηζηή ζηξνθώλ
(α) (β)
ρήκα 3.46: Ιζνδύλακν θύθισκα επαγσγηθνύ θηλεηήξα κεηαζρεκαηηζκέλν ζε ζηαηό πιαίζην αλαθνξάο ds, q
s
(σe = 0) (α) Ιζνδύλακν θύθισκα ds άμνλα (β) Ιζνδύλακν θύθισκα q
s άμνλα
3.3.3.1 Δμαγσγή κνληέινπ αλαθνξάο (reference model) ηεο κεραλήο
Γηα ην κνληέιν αλαθνξάο. ζπλδπάδνληαο ηηο ζρ. (3.82) θαη (3.83) πξνθύπηεη ε έθθξαζε ησλ ηάζεσλ vsds, vsq
s:
Από ην ρ. 3.46, πξνθύπηεη όηη νη ξνέο ηνπ δξνκέα ζην ζηαηό πιαίζην αλαθνξάο, ιrds, ιrq
s , ζα είλαη:
Δπηιύνληαο ηηο ζρ. (3.83) σο πξνο ηα ξεύκαηα irds, irq
s, θαη αληηθαζηζηώληαο ζηελ (3.85), ηζρύεη όηη:
πλδπάδνληαο ηηο ζρ. (3.84) θαη (3.86), θαη αληηθαζηζηώληαο ηηο ξνέο ηνπ θιάδνπ καγλήηηζεο ιm,dq, ζα ηζρύεη:
Αλαδηαηάζζνληαο ηελ παξαπάλσ σο πξνο ηηο ξνέο ηνπ δξνκέα, πξνθύπηεη ην κνληέιν αλαθνξάο ηεο κεραλήο:
ην νπνίν κε βάζε ηηο ηηκέο vsds, vsq
s, isd
s, isq
s, πνπ κεηξνύληαη από ην ζηάηε ηεο κεραλήο νδεγνύλ ζηελ
Lls=Ls-LmRs
Lm
Llr
+ -
σr ιrqs
Rr
+
-
λsds
+
-
isds
irds+
-
λrds
+
-
Rs
Lm
+-Rr
+
-
λsqs
+
-
isqs
irqs+
-
λrqs
+
-
Lls Llrσr ιrd
s
ΔΙΔΑΚΣΟΡΙΚΗ ΔΙΑΣΡΙΒΗ
ΠΤΡΙΔΩΝ Β. ΓΙΑΝΝΟΤΣΟ
175 Πξνζαξκνζηηθόο έιεγρνο ηνπνινγίαο ξπζκηζηώλ ζηξνθώλ γηα εμνηθνλόκεζε ελέξγεηαο ζε πινία
εμαγσγή ησλ ζπληζησζώλ καγλεηηθήο ξνήο ηνπ δξνκέα ιrds, ιrq
s. ε κνξθή πίλαθα ζα είλαη:
3.3.3.2 Δμαγσγή πξνζαξκνζηηθνύ κνληέινπ (adaptive model) ηεο κεραλήο
Γηα ηελ εμαγσγή ηνπ πξνζαξκνζηηθνύ κνληέινπ, κε βάζε ην ρ. 3.46 ηζρύεη γηα ηηο ηάζεηο ηνπ δξνκέα vr,dqs:
Αλ ζηελ παξαπάλσ ζρέζε πξνζζέζνπκε ηνπο όξνπο ( θαη
αληίζηνηρα:
Αληηθαζηζηώληαο ηνπο όξνπο ησλ παξελζέζεσλ κε ηηο εθθξάζεηο ησλ καγλεηηθώλ ξνώλ δξνκέα ηεο ζρ. 3.85,
πξνθύπηεη ην πξνζαξκνζηηθό κνληέιν ηεο κεραλήο, ην νπνίν δίλεη ηηο εθηηκνύκελεο ηηκέο ξνώλ
:
,
πνπ ζπζρεηίδεη ηελ ηαρύηεηα πεξηζηξνθήο ηνπ δξνκέα κε ηηο ζπληζηώζεο ηεο ξνήο δξνκέα. ε κνξθή πίλαθα:
3.3.3.3 Τινπνίεζε ηερληθήο πξνζαξκνζηηθνύ δηαλπζκαηηθνύ ειέγρνπ κε εθηηκεηή ηαρύηεηαο
Ζ επίιπζε ηεο ζρ. (3.89) κε βάζε ηηο ηηκέο ηάζεσλ vsds, vsq
s, θαη ξεπκάησλ isd
s, isq
s, πνπ ιακβάλνληαη από
ην ζηάηε ηεο κεραλήο πξνζδηνξίδεη ηηο ζπληζηώζεο αλαθνξάο ηεο καγλεηηθήο ξνήο ηνπ δξνκέα ιrds, ιrq
s,
δίρσο λα απαηηείηαη ε γλώζε ηεο ηαρύηεηαο ηνπ δξνκέα. Παξάιιεια όκσο επηιύεηαη θαη ε εμίζσζε (3.93)
ηνπ πξνζαξκνζηηθνύ κνληέινπ, ε νπνία γηα λα εθηηκήζεη ζσζηά ηηο ξνέο ηνπ δξνκέα
, ρξεηάδεηαη ην
ζήκα ηεο ηαρύηεηαο ηνπ δξνκέα (σr). Aπό ηε ζύγθξηζε ησλ γηλνκέλσλ
πξνθύπηεη έλα
ζθάικα πνπ νθείιεηαη ζηε ιαλζαζκέλε εθηίκεζε ηεο ηαρύηεηαο πεξηζηξνθήο ηνπ δξνκέα, κέζσ ηνπ
πξνζαξκνζηηθνύ κνληέινπ. Ο κεδεληζκόο ηνπ ζθάικαηνο πξαγκαηνπνηείηαη από έλαλ ειεγθηή PI, έηζη ώζηε
λα ηξνθνδνηείηαη ζην πξνζαξκνζηηθό κνληέιν ε αθξηβήο ηηκή ηεο ζπρλόηεηαο. Σν δνκηθό δηάγξακκα ηεο
δηάηαμεο πξνζαξκνζηηθνύ δηαλπζκαηηθνύ ειέγρνπ ηνπ θηλεηήξα επαγσγήο κε εθηηκεηή ηαρύηεηαο θαίλεηαη
ζην ρ. 3.47, ελώ ε κνληεινπνίεζε ησλ εμηζώζεσλ ηεο ηερληθήο αλαιύνληαη ζην δηάγξακκα ηνπ ρ. 3.48.
ην ρ. 3.49 παξνπζηάδνληαη ηα απνηειέζκαηα ηεο πξνζνκνίσζεο ηεο ηερληθήο δηαλπζκαηηθνύ ειέγρνπ
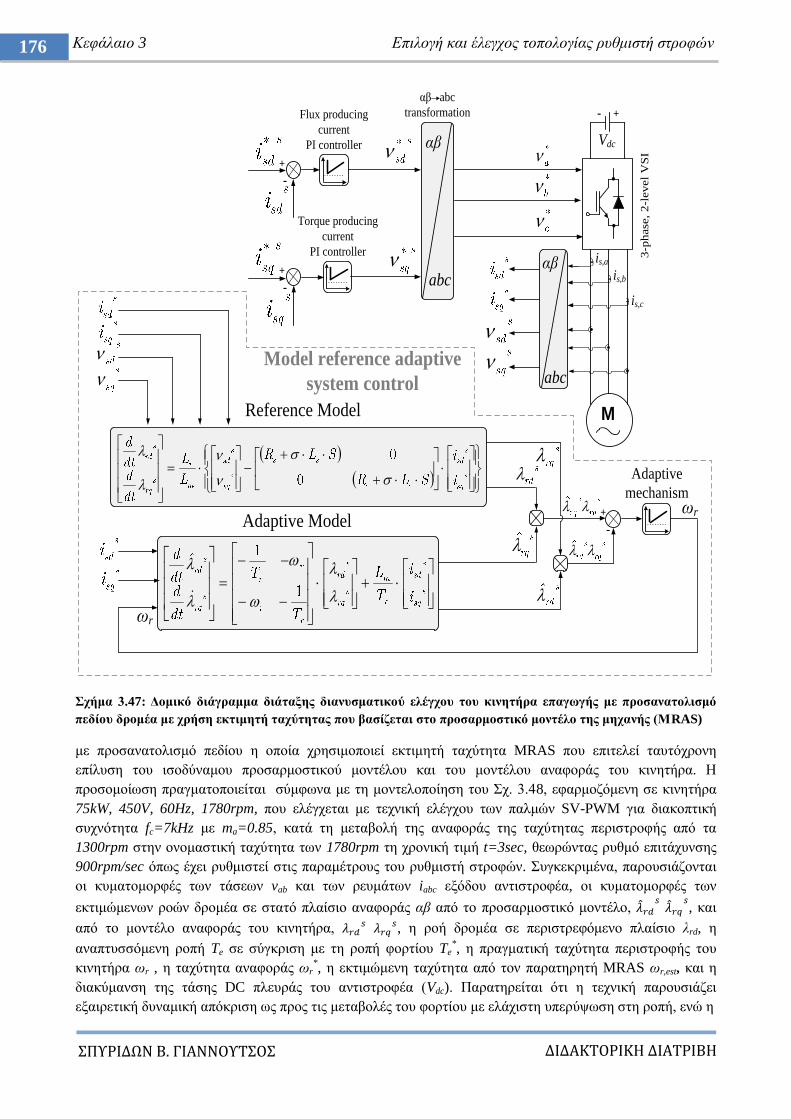
ΔΙΔΑΚΣΟΡΙΚΗ ΔΙΑΣΡΙΒΗ
ΠΤΡΙΔΩΝ Β. ΓΙΑΝΝΟΤΣΟ
176 Κεθάιαην 3 Δπηινγή θαη έιεγρνο ηνπνινγίαο ξπζκηζηή ζηξνθώλ
ρήκα 3.47: Γνκηθό δηάγξακκα δηάηαμεο δηαλπζκαηηθνύ ειέγρνπ ηνπ θηλεηήξα επαγσγήο κε πξνζαλαηνιηζκό
πεδίνπ δξνκέα κε ρξήζε εθηηκεηή ηαρύηεηαο πνπ βαζίδεηαη ζην πξνζαξκνζηηθό κνληέιν ηεο κεραλήο (ΜRAS)
κε πξνζαλαηνιηζκό πεδίνπ ε νπνία ρξεζηκνπνηεί εθηηκεηή ηαρύηεηα MRAS πνπ επηηειεί ηαπηόρξνλε
επίιπζε ηνπ ηζνδύλακνπ πξνζαξκνζηηθνύ κνληέινπ θαη ηνπ κνληέινπ αλαθνξάο ηνπ θηλεηήξα. Ζ
πξνζνκνίσζε πξαγκαηνπνηείηαη ζύκθσλα κε ηε κνληεινπνίεζε ηνπ ρ. 3.48, εθαξκνδόκελε ζε θηλεηήξα
75kW, 450V, 60Hz, 1780rpm, πνπ ειέγρεηαη κε ηερληθή ειέγρνπ ησλ παικώλ SV-PWM γηα δηαθνπηηθή
ζπρλόηεηα fc=7kHz κε ma=0.85, θαηά ηε κεηαβνιή ηεο αλαθνξάο ηεο ηαρύηεηαο πεξηζηξνθήο από ηα
1300rpm ζηελ νλνκαζηηθή ηαρύηεηα ησλ 1780rpm ηε ρξνληθή ηηκή t=3sec, ζεσξώληαο ξπζκό επηηάρπλζεο
900rpm/sec όπσο έρεη ξπζκηζηεί ζηηο παξακέηξνπο ηνπ ξπζκηζηή ζηξνθώλ. πγθεθξηκέλα, παξνπζηάδνληαη
νη θπκαηνκνξθέο ησλ ηάζεσλ vab θαη ησλ ξεπκάησλ iabc εμόδνπ αληηζηξνθέα, νη θπκαηνκνξθέο ησλ
εθηηκώκελσλ ξνώλ δξνκέα ζε ζηαηό πιαίζην αλαθνξάο αβ από ην πξνζαξκνζηηθό κνληέιν,
, θαη
από ην κνληέιν αλαθνξάο ηνπ θηλεηήξα,
, ε ξνή δξνκέα ζε πεξηζηξεθόκελν πιαίζην ιrd, ε
αλαπηπζζόκελε ξνπή Te ζε ζύγθξηζε κε ηε ξνπή θνξηίνπ Te*, ε πξαγκαηηθή ηαρύηεηα πεξηζηξνθήο ηνπ
θηλεηήξα σr , ε ηαρύηεηα αλαθνξάο σr*, ε εθηηκώκελε ηαρύηεηα από ηνλ παξαηεξεηή MRAS σr,est, θαη ε
δηαθύκαλζε ηεο ηάζεο DC πιεπξάο ηνπ αληηζηξνθέα (Vdc). Παξαηεξείηαη όηη ε ηερληθή παξνπζηάδεη
εμαηξεηηθή δπλακηθή απόθξηζε σο πξνο ηηο κεηαβνιέο ηνπ θνξηίνπ κε ειάρηζηε ππεξύςσζε ζηε ξνπή, ελώ ε
M
is,a
is,b
is,c
+-
Vdc
αβ
abc
αβ abc
transformation
+
-
Flux producing
current
PI controller
Torque producing
current
PI controller
+
-
3-p
hase
, 2-l
evel
VS
I
αβ
abc
Reference Model
Adaptive Model
+
-
Adaptive
mechanismσr
σr
Model reference adaptive
system control
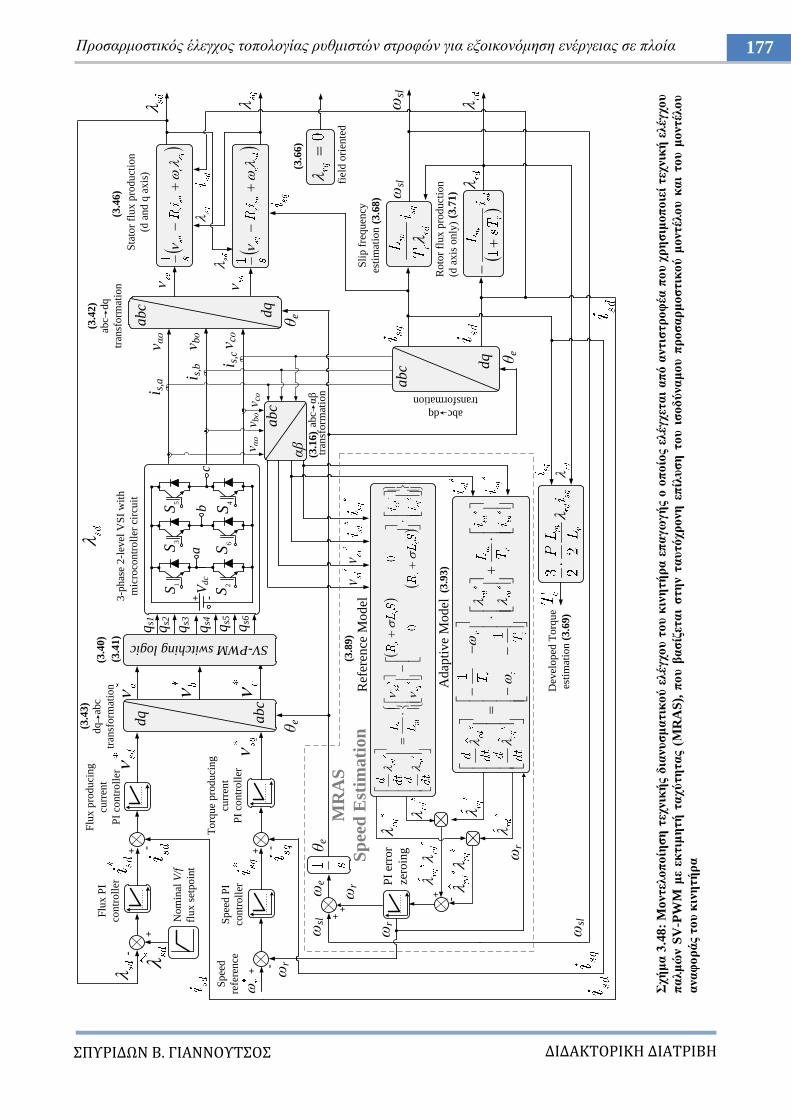
ΔΙΔΑΚΣΟΡΙΚΗ ΔΙΑΣΡΙΒΗ
ΠΤΡΙΔΩΝ Β. ΓΙΑΝΝΟΤΣΟ
177 Πξνζαξκνζηηθόο έιεγρνο ηνπνινγίαο ξπζκηζηώλ ζηξνθώλ γηα εμνηθνλόκεζε ελέξγεηαο ζε πινία
ρή
κα
3.4
8:
Mo
ληει
νπ
νίε
ζε
ηερ
ληθ
ήο
δηα
λπ
ζκ
αηηθ
νύ
ειέγ
ρν
π η
νπ
θηλ
εηή
ξα
επ
αγσ
γή
ο ν
νπ
νίν
ο ει
έγρεη
αη
απ
ό α
ληηζ
ηξ
νθ
έα π
νπ
ρξ
εζ
ηκν
πν
ηεί
ηερ
ληθ
ή ε
ιέγ
ρν
π
πα
ικ
ώλ
SV
-PW
M κ
ε εθ
ηηκ
εηή
ηα
ρύ
ηε
ηα
ο (Μ
RA
S),
πν
π β
αζ
ίδεη
αη
ζηε
λ η
απ
ηό
ρξ
νλε
επ
ίιπ
ζε
ην
π η
ζν
δύ
λακ
νπ
πξ
νζ
αξ
κν
ζηηθ
νύ
κν
ληέι
νπ
θα
η ην
π κ
νληέι
νπ
αλα
θν
ξά
ο ην
π θ
ηλε
ηή
ξα
No
min
al V
/f
flu
x s
etp
oin
t
+
-
Flu
x P
I
con
tro
ller
+ -
Flu
x p
rod
uci
ng
curr
ent
PI
con
tro
ller
+
-σ
r
Sp
eed
PI
con
tro
ller
To
rqu
e p
rod
uci
ng
curr
ent
PI
con
tro
ller
+ -
dq
abc
dq
a
bc
tran
sfo
rmat
ion
σsl
SV-PWM switching logic
qs1
ab
1S
3S
5S
2S
6S
4S
c
qs2
qs3
Vd
c+ -
qs4 qs5
qs6
λ αν
λ bν
λ cνab
c
dq
tran
sfo
rmat
ion
dq
abc
ζe
Sta
tor
flu
x p
rod
uct
ion
(d a
nd
q a
xis
) i
s,a i
s,b i
s,c
abc d
q
abc dq
transformation
(3.4
6)
ζe
Ro
tor
flu
x p
rod
uct
ion
(d a
xis
on
ly)
(3.7
1)
(3.6
8)
S
lip
fre
qu
ency
esti
mat
ion
σsl
3-p
has
e 2
-lev
el V
SI
wit
h
mic
roco
ntr
oll
er c
ircu
it
D
evel
op
ed T
orq
ue
est
imat
ion
(3
.69
)
σr
+
σr
σsl
σe
σsl
Sp
eed
refe
ren
ce
ζe
(3.4
0)
(3.4
1)
(3.4
3)
(3.4
2)
λ αν
λ bν
λ cν
abc
αβ
+ -
PI
erro
r
zero
ing
+
Adap
tive
Model
Ref
eren
ce M
odel
ab
c
αβ
(3.6
6)
fi
eld
ori
ente
d
tran
sfo
rmat
ion
ζe
MR
AS
Sp
eed
Est
ima
tio
n(3
.89
)
(3.9
3)
(3.1
6)
σr
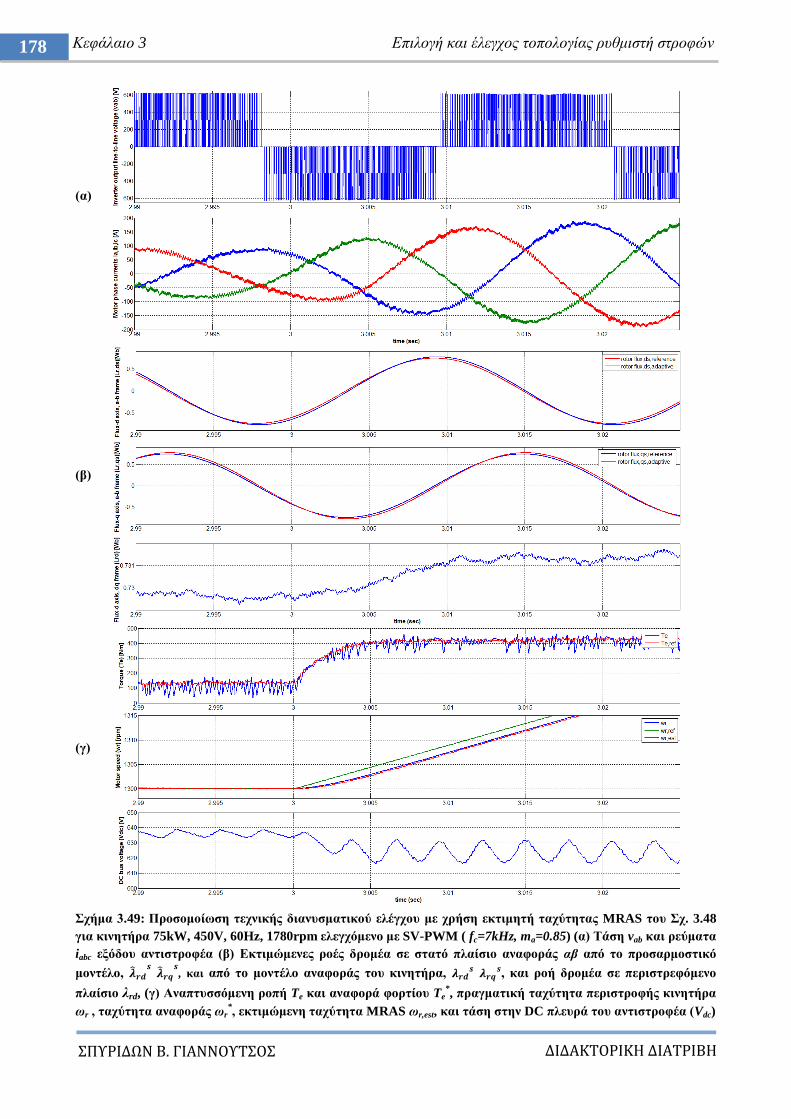
ΔΙΔΑΚΣΟΡΙΚΗ ΔΙΑΣΡΙΒΗ
ΠΤΡΙΔΩΝ Β. ΓΙΑΝΝΟΤΣΟ
178 Κεθάιαην 3 Δπηινγή θαη έιεγρνο ηνπνινγίαο ξπζκηζηή ζηξνθώλ
(α)
(β)
(γ)
ρήκα 3.49: Πξνζνκνίσζε ηερληθήο δηαλπζκαηηθνύ ειέγρνπ κε ρξήζε εθηηκεηή ηαρύηεηαο MRAS ηνπ ρ. 3.48
γηα θηλεηήξα 75kW, 450V, 60Hz, 1780rpm ειεγρόκελν κε SV-PWM ( fc=7kHz, ma=0.85) (α) Σάζε vab θαη ξεύκαηα
iabc εμόδνπ αληηζηξνθέα (β) Δθηηκώκελεο ξνέο δξνκέα ζε ζηαηό πιαίζην αλαθνξάο αβ από ην πξνζαξκνζηηθό
κνληέιν,
, θαη από ην κνληέιν αλαθνξάο ηνπ θηλεηήξα,
, θαη ξνή δξνκέα ζε πεξηζηξεθόκελν
πιαίζην ιrd, (γ) Αλαπηπζζόκελε ξνπή Te θαη αλαθνξά θνξηίνπ Te*, πξαγκαηηθή ηαρύηεηα πεξηζηξνθήο θηλεηήξα
σr , ηαρύηεηα αλαθνξάο σr*, εθηηκώκελε ηαρύηεηα MRAS σr,est, θαη ηάζε ζηελ DC πιεπξά ηνπ αληηζηξνθέα (Vdc)
ΔΙΔΑΚΣΟΡΙΚΗ ΔΙΑΣΡΙΒΗ
ΠΤΡΙΔΩΝ Β. ΓΙΑΝΝΟΤΣΟ
179 Πξνζαξκνζηηθόο έιεγρνο ηνπνινγίαο ξπζκηζηώλ ζηξνθώλ γηα εμνηθνλόκεζε ελέξγεηαο ζε πινία
καγλεηηθή ξνή δξνκέα ιrd κέλεη ζηαζεξή κέζσ ηνπ ξεύκαηνο isd ζε ζρέζε κε ηηο κεηαβνιέο ηαρύηεηαο.
Δπηπιένλ, ε εθηίκεζε ηεο ηαρύηεηαο πεξηζηξνθήο από ηνλ παξαηεξεηή MRAS γίλεηαη κε ειάρηζην ζθάικα.
H ηηκή ηεο ηάζεο ζην DC-link θπκαίλεηαη κεηαμύ επηηξεπηώλ νξίσλ, γεγνλόο πνπ ππνδειώλεη όηη ν ρξόλνο
επηβξάδπλζεο ηνπ δξνκέα κέζσ ηνπ ξπζκηζηή ζηξνθώλ είλαη θαηάιιεινο γηα ηελ εθαξκνγή.
ην πξνηεηλόκελν ζύζηεκα, ην κνληέιν ηνπ ρ. 3.48 είλαη ελζσκαησκέλν θαη επηιύεηαη ζε πξαγκαηηθό
ρξόλν ζηνλ κηθξνεπεμεξγαζηή ηνπ ξπζκηζηή ζηξνθώλ, ν νπνίνο ειέγρεη ηνλ θηλεηήξα πνπ νδεγεί ηελ αληιία
ζαιαζζηλνύ λεξνύ ή ηνλ εθάζηνηε αλεκηζηήξα εμαεξηζκνύ ηνπ κεραλνζηαζίνπ. Ζ ηαρύηεηα αλαθνξάο ηνπ
θηλεηήξα σr*, παξέρεηαη από εμσηεξηθό πξνηεηλόκελν ειεγθηή, πινπνηεκέλν ζε PLC πνπ πξνζαξκόδεη ηελ
ηηκή ηεο ζύκθσλα κε ηα δεδνκέλα πηέζεσλ θαη ζεξκνθξαζηώλ θαζώο θαη ηηο δπλακηθά κεηαβαιιόκελεο
απαηηήζεηο ξνήο ησλ αληίζηνηρσλ δηεξγαζηώλ αλάινγα κε ηε ιεηηνπξγηθή θαηάζηαζε ηνπ πινίνπ κε ζθνπό
ηελ ελεξγεηαθή βειηηζηνπνίεζε ηνπ ηζνδπγίνπ ηζρύνο.
3.4 Δπιλογή ηοπολογίαρ πςθμιζηή ζηποθών πποηεινόμενος ζςζηήμαηορ
Ζ ηνπνινγία ξπζκηζηή ζηξνθώλ πνπ επηιέγεηαη γηα ηελ πινπνίεζε ηνπ πξνηεηλόκελνπ ζπζηήκαηνο έρεη
ηε δνκή ηνπ ρ 3.1 θαη ιακβάλεη ππόςε ηα ραξαθηεξηζηηθά πνπ κειεηήζεθαλ παξαπάλσ, έηζη ώζηε λα
ηθαλνπνηεί ηηο απαηηήζεηο ηεο εθαξκνγήο, πνπ πεξηιακβάλεη δηαζύλδεζε ζπζηήκαηνο επνπηείαο γηα ηελ
επηθνηλσλία ηνπ ξπζκηζηή ζηξνθώλ (VFD) κε πξνγξακκαηηδόκελν ινγηθό ειεγθηή (PLC) θαη νζόλε
αιιειεπίδξαζεο αλζξώπνπ κεραλήο (HMI). ηελ παξάγξαθν απηή αλαθέξνληαη ζπλνπηηθά ε δνκή θαη ηα
ραξαθηεξηζηηθά ηνπ κνληέινπ ηνπ ξπζκηζηή ζηξνθώλ πνπ επηιέγεηαη γηα ηελ νδήγεζε ησλ θηλεηήξσλ ηεο
εθαξκνγήο, θαζώο θαη ε δηαζύλδεζε κε ην κνληέιν ηνπ PLC ζην νπνίν πινπνηείηαη ν πξνηεηλόκελνο
ειεγθηήο πξνζαξκνζηηθνύ ειέγρνπ δεδνκέλσλ δηεξγαζηώλ κεηαβιεηήο ξνήο, αιιά θαη ε αιιειεπίδξαζε κε
ηελ νζόλε HMI, ζηελ νπνία πξαγκαηνπνηείηαη ν επνπηηθόο έιεγρνο ησλ δηεξγαζηώλ γηα ηελ εθαξκνγή.
Δπηπιένλ, παξνπζηάδνληαη ζπλνπηηθά ηα πξνγξακκαηηζηηθά πεξηβάιινληα ηνπ PLC θαη ηεο νζόλεο ΖΜΗ.
3.4.1 Γνκή, ραξαθηεξηζηηθά θαη δηαζύλδεζε κνληέινπ ξπζκηζηή ζηξνθώλ
Ζ επηινγή ηνπ ξπζκηζηή ζηξνθώλ πξαγκαηνπνηείηαη ώζηε λα ηθαλνπνηνύληαη νη απαηηήζεηο ηεο
εθαξκνγήο, ελώ παξάιιεια ην κνληέιν πξέπεη λα δηαζέηεη θαηάιιειν πηζηνπνηεηηθό ζπκβαηόηεηαο (type
approval) γηα ηε ρξήζε ζην πεξηβάιινλ ηνπ πινίνπ, όπνπ απαηηεί ηδηαίηεξεο αληνρέο σο πξνο ηελ απμεκέλε
ζεξκνθξαζία, ηελ πγξαζία θαη ηνπο θξαδαζκνύο, ώζηε λα ηθαλνπνηνύληαη νη απαηηήζεηο ηνπ λενγλώκνλα.
Γηα ηελ πεξίπησζε ηνπ ABS γηα ην πινίν ππό κειέηε νη απαηηήζεηο απηέο αλαθέξνληαη ζηνπο θαλνληζκνύο
2013 Steel Vessels Rules: 1-1-4/7.7,4-8-3/1.11,4-8-3/Table 2,4-8-3/5 [65]. Όπσο δηαπηζηώζεθε παξαπάλσ, ν
ξπζκηζηήο ζηξνθώλ ρξεηάδεηαη λα δηαζέηεη EMC θίιηξν γηα ηελ απνθνπή CM θαη DM πςίζπρλνπ ζνξύβνπ,
ώζηε λα ηθαλνπνηνύληαη ηα όξηα θαηεγνξίαο C3, 2nd
environment ηνπ πξνηύπνπ EN/IEC 61800-3 [22], ελώ
είλαη απαξαίηεην λα δηαζέηεη ηηο θαηάιιειεο αλνρέο ζηηο κόληκεο θαη απνδεθηέο κεηαβνιέο ηεο ηάζεο θαη ηεο
ζπρλόηεηαο ηξνθνδνζίαο πνπ ζπκβαίλνπλ ζην απηόλνκν δηθηπν ειεθηξηθήο ηζρύνο ηνπ πινίνπ [20], όπσο
απηέο αλαθέξζεθαλ ζηελ παξάγξαθν 1.3.3. Λόγσ ηεο ηδηαηηεξόηεηαο ηνπ ζπζηήκαηνο ειεθηξηθήο ηζρύνο ηνπ
πινίνπ, πνπ πεξηιακβάλεη θαηαλαισηέο ησλ νπνίσλ ε ζπλερή ιεηηνπξγία απνηειεί πξνηεξαηόηεηα ύςηζηεο
ζεκαζίαο, ν ξπζκηζηήο ζηξνθώλ δηαζέηεη πξνζηαζίεο αλαθνξηθά κε ηε ζεξκηθή θαηαπόλεζε ηνπ ξπζκηζηή
θαη ηνπ θηλεηήξα, ηελ απώιεηα θάζεο από ηελ πιεπξά ηεο παξνρήο ηνπ δηθηύνπ ή από ηελ πιεπξά ηνπ
θηλεηήξα, ηελ ππέξηαζε ζηελ DC ηξνθνδνζία ηνπ αληηζηξνθέα, ην ζθάικα ππεξέληαζεο σο πξνο θάζε θαη
σο γε, ηελ ππέξηαζε ή ππόηαζε ζηελ ηξνθνδνζία θαζώο θαη ζθάικαηα ζην θύθισκα ειέγρνπ. Δθόζνλ ν
ξπζκηζηήο ζα ζπλδεζεί κε PLC θαη HMI γηα ηνλ έιεγρν ησλ δηεξγαζηώλ, ρξεηάδεηαη λα δηαζέηεη θαηάιιειν
αξηζκό ςεθηαθώλ θαη αλαινγηθώλ εηζόδσλ θαη εμόδσλ πνπ λα θαιύπηνπλ όιεο ηηο θαηαζηάζεηο ιεηηνπξγίαο,
θαζώο θαη επηινγέο δηαζύλδεζεο κε θαηάιιεια πξσηόθνιια δηθηπαθήο επηθνηλσλίαο κε ηα ππόινηπα
ππνζπζηήκαηα πνπ λα εμαζθαιίδνπλ ελίζρπζε ηεο αμηνπηζηίαο γηα ηε κεηαθνξά ησλ δεδνκέλσλ. Δπηπιένλ, ν
ξπζκηζηήο ρξεηάδεηαη λα παξέρεη ηελ θαηάιιειε παξακεηξνπνίεζε σο πξνο ηε ξύζκηζε ρξόλνπ επηηάρπλζεο
θαη επηβξάδπλζεο, ελώ παξάιιεια λα παξνπζηάδεη θαιή απόθξηζε ζηε ξνπή θαη ηελ ηαρύηεηα, δίρσο ηε ρξήζε
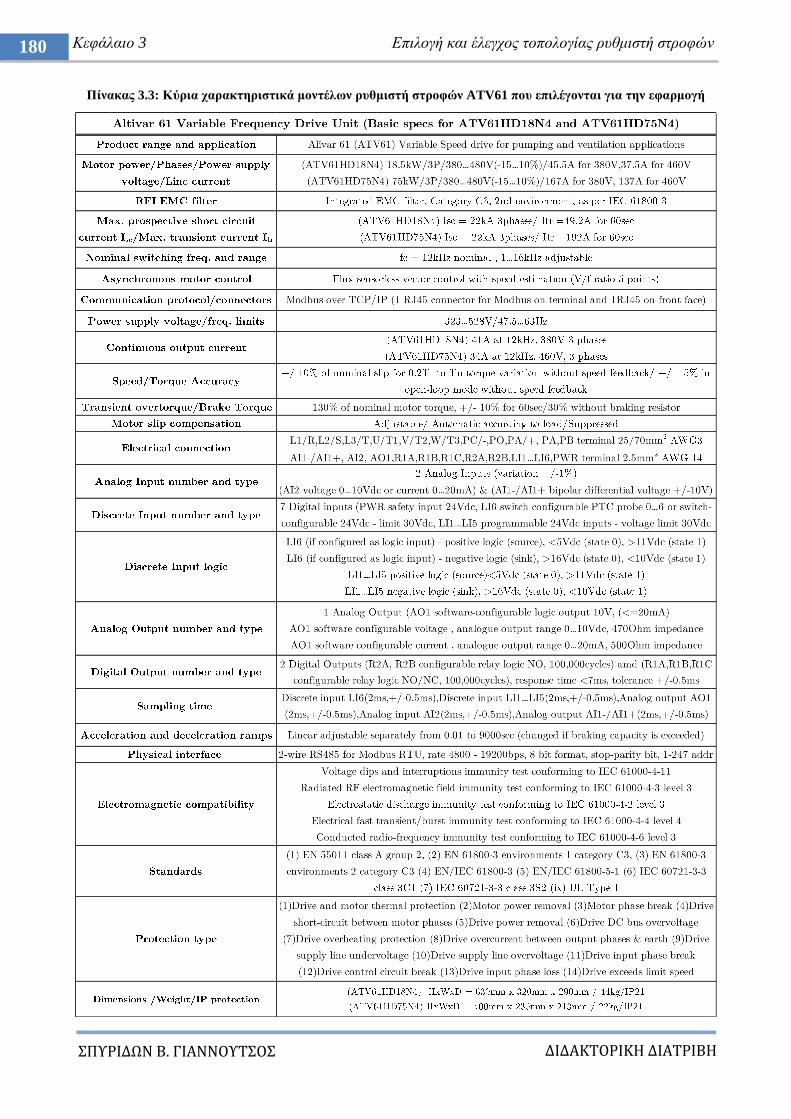
ΔΙΔΑΚΣΟΡΙΚΗ ΔΙΑΣΡΙΒΗ
ΠΤΡΙΔΩΝ Β. ΓΙΑΝΝΟΤΣΟ
180 Κεθάιαην 3 Δπηινγή θαη έιεγρνο ηνπνινγίαο ξπζκηζηή ζηξνθώλ
Πίλαθαο 3.3: Κύξηα ραξαθηεξηζηηθά κνληέισλ ξπζκηζηή ζηξνθώλ ATV61 πνπ επηιέγνληαη γηα ηελ εθαξκνγή
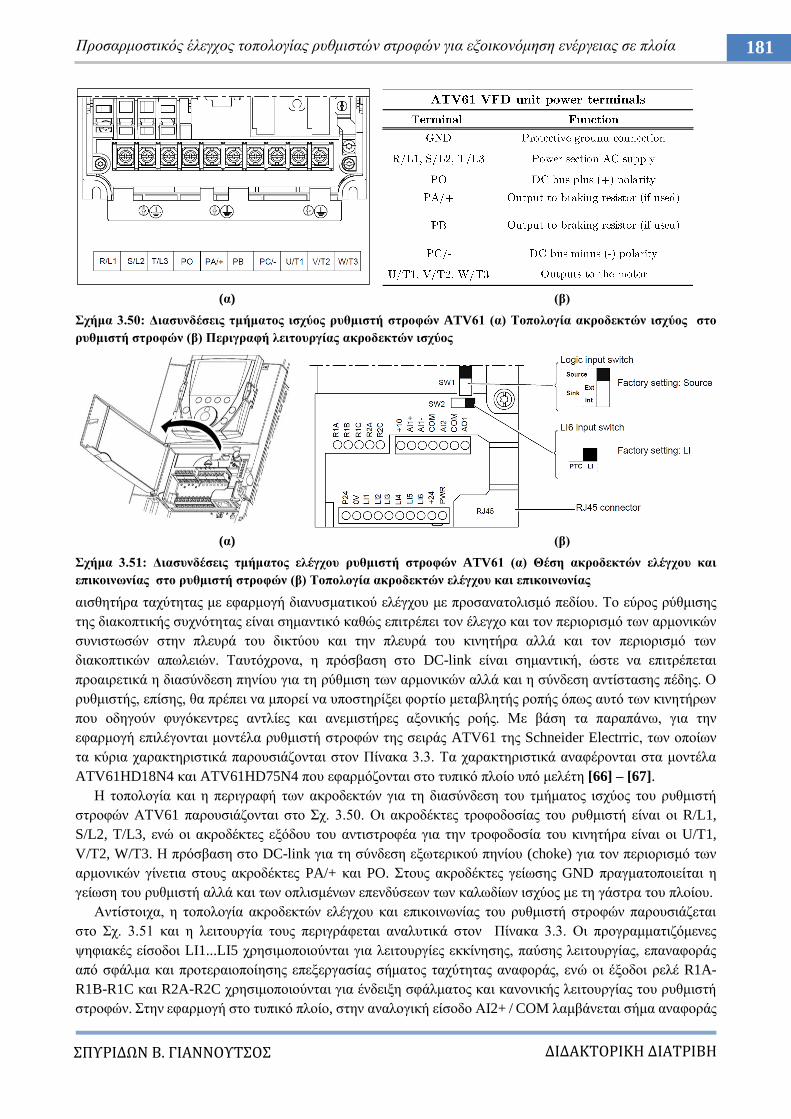
ΔΙΔΑΚΣΟΡΙΚΗ ΔΙΑΣΡΙΒΗ
ΠΤΡΙΔΩΝ Β. ΓΙΑΝΝΟΤΣΟ
181 Πξνζαξκνζηηθόο έιεγρνο ηνπνινγίαο ξπζκηζηώλ ζηξνθώλ γηα εμνηθνλόκεζε ελέξγεηαο ζε πινία
(α) (β)
ρήκα 3.50: Γηαζπλδέζεηο ηκήκαηνο ηζρύνο ξπζκηζηή ζηξνθώλ ATV61 (α) Σνπνινγία αθξνδεθηώλ ηζρύνο ζην
ξπζκηζηή ζηξνθώλ (β) Πεξηγξαθή ιεηηνπξγίαο αθξνδεθηώλ ηζρύνο
(α) (β)
ρήκα 3.51: Γηαζπλδέζεηο ηκήκαηνο ειέγρνπ ξπζκηζηή ζηξνθώλ ATV61 (α) Θέζε αθξνδεθηώλ ειέγρνπ θαη
επηθνηλσλίαο ζην ξπζκηζηή ζηξνθώλ (β) Σνπνινγία αθξνδεθηώλ ειέγρνπ θαη επηθνηλσλίαο
αηζζεηήξα ηαρύηεηαο κε εθαξκνγή δηαλπζκαηηθνύ ειέγρνπ κε πξνζαλαηνιηζκό πεδίνπ. Σν εύξνο ξύζκηζεο
ηεο δηαθνπηηθήο ζπρλόηεηαο είλαη ζεκαληηθό θαζώο επηηξέπεη ηνλ έιεγρν θαη ηνλ πεξηνξηζκό ησλ αξκνληθώλ
ζπληζησζώλ ζηελ πιεπξά ηνπ δηθηύνπ θαη ηελ πιεπξά ηνπ θηλεηήξα αιιά θαη ηνλ πεξηνξηζκό ησλ
δηαθνπηηθώλ απσιεηώλ. Σαπηόρξνλα, ε πξόζβαζε ζην DC-link είλαη ζεκαληηθή, ώζηε λα επηηξέπεηαη
πξναηξεηηθά ε δηαζύλδεζε πελίνπ γηα ηε ξύζκηζε ησλ αξκνληθώλ αιιά θαη ε ζύλδεζε αληίζηαζεο πέδεο. Ο
ξπζκηζηήο, επίζεο, ζα πξέπεη λα κπνξεί λα ππνζηεξίμεη θνξηίν κεηαβιεηήο ξνπήο όπσο απηό ησλ θηλεηήξσλ
πνπ νδεγνύλ θπγόθεληξεο αληιίεο θαη αλεκηζηήξεο αμνληθήο ξνήο. Με βάζε ηα παξαπάλσ, γηα ηελ
εθαξκνγή επηιέγνληαη κνληέια ξπζκηζηή ζηξνθώλ ηεο ζεηξάο ATV61 ηεο Schneider Electrric, ησλ νπνίσλ
ηα θύξηα ραξαθηεξηζηηθά παξνπζηάδνληαη ζηνλ Πίλαθα 3.3. Σα ραξαθηεξηζηηθά αλαθέξνληαη ζηα κνληέια
ATV61HD18N4 θαη ATV61HD75N4 πνπ εθαξκόδνληαη ζην ηππηθό πινίν ππό κειέηε [66] – [67].
Ζ ηνπνινγία θαη ε πεξηγξαθή ησλ αθξνδεθηώλ γηα ηε δηαζύλδεζε ηνπ ηκήκαηνο ηζρύνο ηνπ ξπζκηζηή
ζηξνθώλ ΑΣV61 παξνπζηάδνληαη ζην ρ. 3.50. Οη αθξνδέθηεο ηξνθνδνζίαο ηνπ ξπζκηζηή είλαη νη R/L1,
S/L2, T/L3, ελώ νη αθξνδέθηεο εμόδνπ ηνπ αληηζηξνθέα γηα ηελ ηξνθνδνζία ηνπ θηλεηήξα είλαη νη U/T1,
V/T2, W/T3. Ζ πξόζβαζε ζην DC-link γηα ηε ζύλδεζε εμσηεξηθνύ πελίνπ (choke) γηα ηνλ πεξηνξηζκό ησλ
αξκνληθώλ γίλεηηα ζηνπο αθξνδέθηεο PA/+ θαη PO. ηνπο αθξνδέθηεο γείσζεο GND πξαγκαηνπνηείηαη ε
γείσζε ηνπ ξπζκηζηή αιιά θαη ησλ νπιηζκέλσλ επελδύζεσλ ησλ θαισδίσλ ηζρύνο κε ηε γάζηξα ηνπ πινίνπ.
Αληίζηνηρα, ε ηνπνινγία αθξνδεθηώλ ειέγρνπ θαη επηθνηλσλίαο ηνπ ξπζκηζηή ζηξνθώλ παξνπζηάδεηαη
ζην ρ. 3.51 θαη ε ιεηηνπξγία ηνπο πεξηγξάθεηαη αλαιπηηθά ζηνλ Πίλαθα 3.3. Οη πξνγξακκαηηδόκελεο
ςεθηαθέο είζνδνη LI1...LI5 ρξεζηκνπνηνύληαη γηα ιεηηνπξγίεο εθθίλεζεο, παύζεο ιεηηνπξγίαο, επαλαθνξάο
από ζθάικα θαη πξνηεξαηνπνίεζεο επεμεξγαζίαο ζήκαηνο ηαρύηεηαο αλαθνξάο, ελώ νη έμνδνη ξειέ R1A-
R1B-R1C θαη R2A-R2C ρξεζηκνπνηνύληαη γηα έλδεημε ζθάικαηνο θαη θαλνληθήο ιεηηνπξγίαο ηνπ ξπζκηζηή
ζηξνθώλ. ηελ εθαξκνγή ζην ηππηθό πινίν, ζηελ αλαινγηθή είζνδν ΑI2+ / COM ιακβάλεηαη ζήκα αλαθνξάο
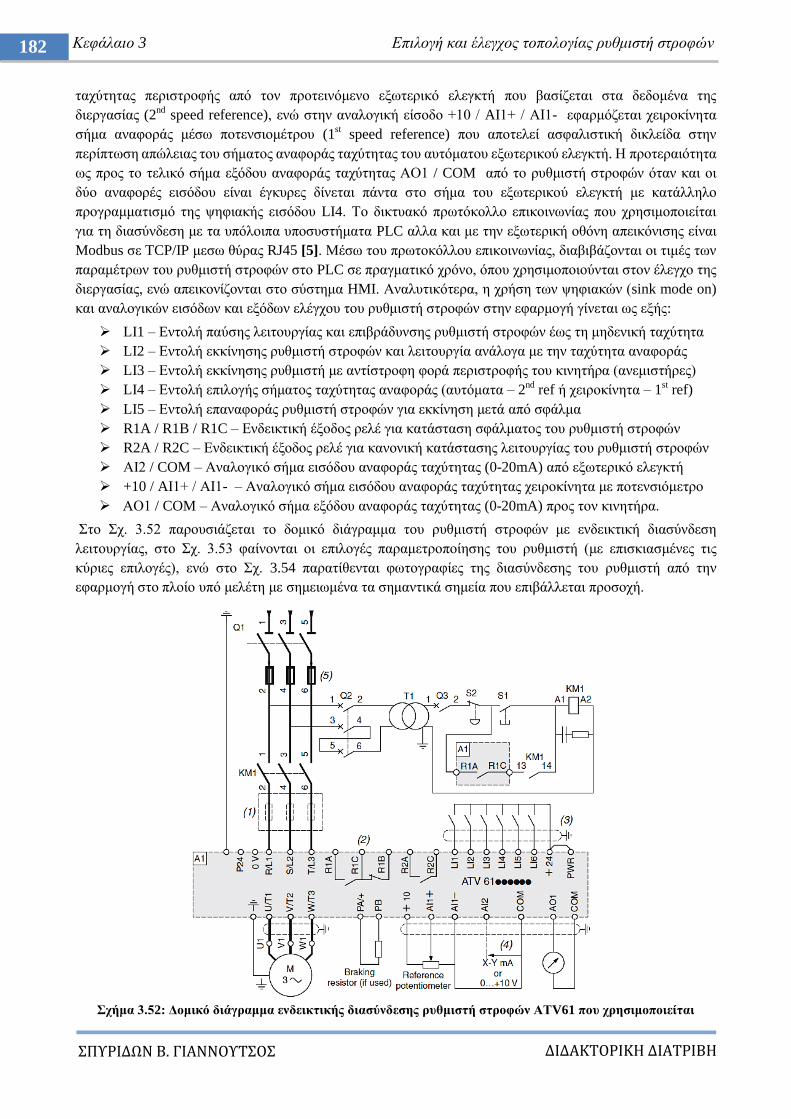
ΔΙΔΑΚΣΟΡΙΚΗ ΔΙΑΣΡΙΒΗ
ΠΤΡΙΔΩΝ Β. ΓΙΑΝΝΟΤΣΟ
182 Κεθάιαην 3 Δπηινγή θαη έιεγρνο ηνπνινγίαο ξπζκηζηή ζηξνθώλ
ηαρύηεηαο πεξηζηξνθήο από ηνλ πξνηεηλόκελν εμσηεξηθό ειεγθηή πνπ βαζίδεηαη ζηα δεδνκέλα ηεο
δηεξγαζίαο (2nd
speed reference), ελώ ζηελ αλαινγηθή είζνδν +10 / AI1+ / ΑΗ1- εθαξκόδεηαη ρεηξνθίλεηα
ζήκα αλαθνξάο κέζσ πνηελζηνκέηξνπ (1st speed reference) πνπ απνηειεί αζθαιηζηηθή δηθιείδα ζηελ
πεξίπησζε απώιεηαο ηνπ ζήκαηνο αλαθνξάο ηαρύηεηαο ηνπ απηόκαηνπ εμσηεξηθνύ ειεγθηή. Ζ πξνηεξαηόηεηα
σο πξνο ην ηειηθό ζήκα εμόδνπ αλαθνξάο ηαρύηεηαο ΑΟ1 / COM από ην ξπζκηζηή ζηξνθώλ όηαλ θαη νη
δύν αλαθνξέο εηζόδνπ είλαη έγθπξεο δίλεηαη πάληα ζην ζήκα ηνπ εμσηεξηθνύ ειεγθηή κε θαηάιιειν
πξνγξακκαηηζκό ηεο ςεθηαθήο εηζόδνπ LI4. Σν δηθηπαθό πξσηόθνιιν επηθνηλσλίαο πνπ ρξεζηκνπνηείηαη
γηα ηε δηαζύλδεζε κε ηα ππόινηπα ππνζπζηήκαηα PLC αιια θαη κε ηελ εμσηεξηθή νζόλε απεηθόληζεο είλαη
Modbus ζε TCP/IP κεζσ ζύξαο RJ45 [5]. Μέζσ ηνπ πξσηνθόιινπ επηθνηλσλίαο, δηαβηβάδνληαη νη ηηκέο ησλ
παξακέηξσλ ηνπ ξπζκηζηή ζηξνθώλ ζην PLC ζε πξαγκαηηθό ρξόλν, όπνπ ρξεζηκνπνηνύληαη ζηνλ έιεγρν ηεο
δηεξγαζίαο, ελώ απεηθνλίδνληαη ζην ζύζηεκα HMI. Αλαιπηηθόηεξα, ε ρξήζε ησλ ςεθηαθώλ (sink mode on)
θαη αλαινγηθώλ εηζόδσλ θαη εμόδσλ ειέγρνπ ηνπ ξπζκηζηή ζηξνθώλ ζηελ εθαξκνγή γίλεηαη σο εμήο:
LI1 – Eληνιή παύζεο ιεηηνπξγίαο θαη επηβξάδπλζεο ξπζκηζηή ζηξνθώλ έσο ηε κεδεληθή ηαρύηεηα
LI2 – Δληνιή εθθίλεζεο ξπζκηζηή ζηξνθώλ θαη ιεηηνπξγία αλάινγα κε ηελ ηαρύηεηα αλαθνξάο
LI3 – Δληνιή εθθίλεζεο ξπζκηζηή κε αληίζηξνθε θνξά πεξηζηξνθήο ηνπ θηλεηήξα (αλεκηζηήξεο)
LI4 – Δληνιή επηινγήο ζήκαηνο ηαρύηεηαο αλαθνξάο (απηόκαηα – 2nd
ref ή ρεηξνθίλεηα – 1st ref)
LI5 – Δληνιή επαλαθνξάο ξπζκηζηή ζηξνθώλ γηα εθθίλεζε κεηά από ζθάικα
R1A / R1B / R1C – Δλδεηθηηθή έμνδνο ξειέ γηα θαηάζηαζε ζθάικαηνο ηνπ ξπζκηζηή ζηξνθώλ
R2A / R2C – Δλδεηθηηθή έμνδνο ξειέ γηα θαλνληθή θαηάζηαζεο ιεηηνπξγίαο ηνπ ξπζκηζηή ζηξνθώλ
ΑΗ2 / COM – Αλαινγηθό ζήκα εηζόδνπ αλαθνξάο ηαρύηεηαο (0-20mA) από εμσηεξηθό ειεγθηή
+10 / AI1+ / ΑΗ1- – Αλαινγηθό ζήκα εηζόδνπ αλαθνξάο ηαρύηεηαο ρεηξνθίλεηα κε πνηελζηόκεηξν
ΑΟ1 / COM – Αλαινγηθό ζήκα εμόδνπ αλαθνξάο ηαρύηεηαο (0-20mA) πξνο ηνλ θηλεηήξα.
ην ρ. 3.52 παξνπζηάδεηαη ην δνκηθό δηάγξακκα ηνπ ξπζκηζηή ζηξνθώλ κε ελδεηθηηθή δηαζύλδεζε
ιεηηνπξγίαο, ζην ρ. 3.53 θαίλνληαη νη επηινγέο παξακεηξνπνίεζεο ηνπ ξπζκηζηή (κε επηζθηαζκέλεο ηηο
θύξηεο επηινγέο), ελώ ζην ρ. 3.54 παξαηίζεληαη θσηνγξαθίεο ηεο δηαζύλδεζεο ηνπ ξπζκηζηή από ηελ
εθαξκνγή ζην πινίν ππό κειέηε κε ζεκεησκέλα ηα ζεκαληηθά ζεκεία πνπ επηβάιιεηαη πξνζνρή.
ρήκα 3.52: Γνκηθό δηάγξακκα ελδεηθηηθήο δηαζύλδεζεο ξπζκηζηή ζηξνθώλ ΑΣV61 πνπ ρξεζηκνπνηείηαη
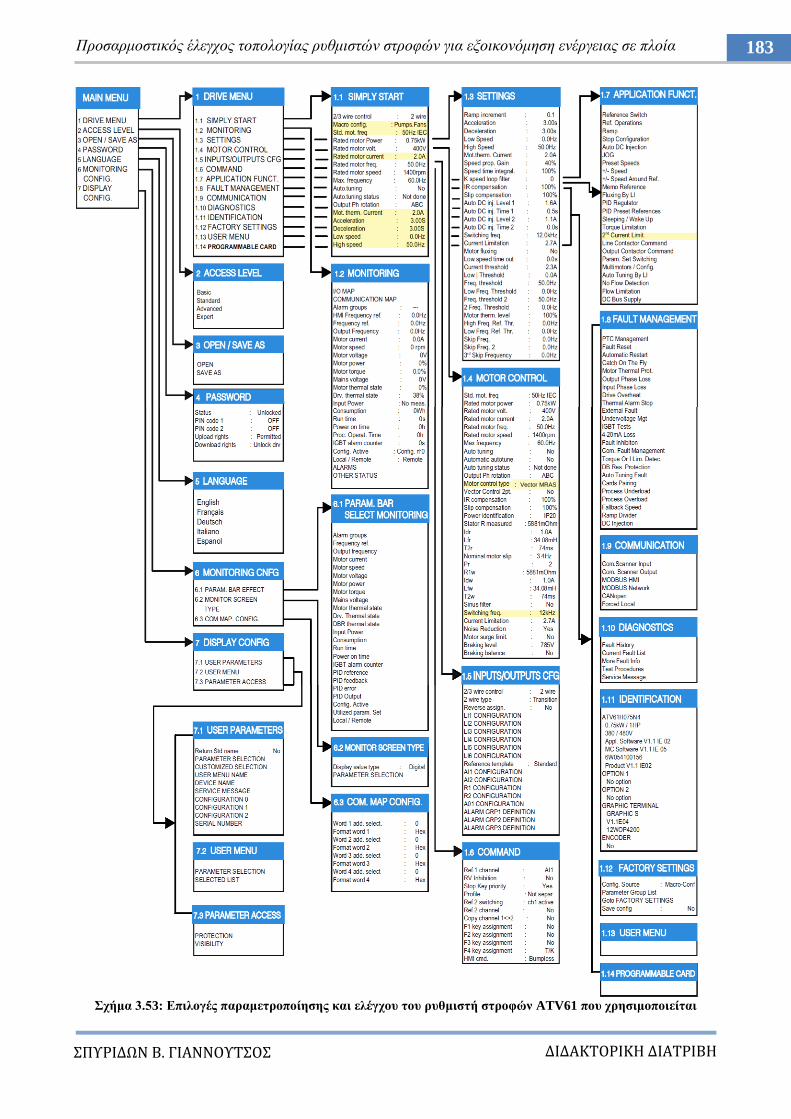
ΔΙΔΑΚΣΟΡΙΚΗ ΔΙΑΣΡΙΒΗ
ΠΤΡΙΔΩΝ Β. ΓΙΑΝΝΟΤΣΟ
183 Πξνζαξκνζηηθόο έιεγρνο ηνπνινγίαο ξπζκηζηώλ ζηξνθώλ γηα εμνηθνλόκεζε ελέξγεηαο ζε πινία
ρήκα 3.53: Δπηινγέο παξακεηξνπνίεζεο θαη ειέγρνπ ηνπ ξπζκηζηή ζηξνθώλ ATV61 πνπ ρξεζηκνπνηείηαη
: Vector MRAS
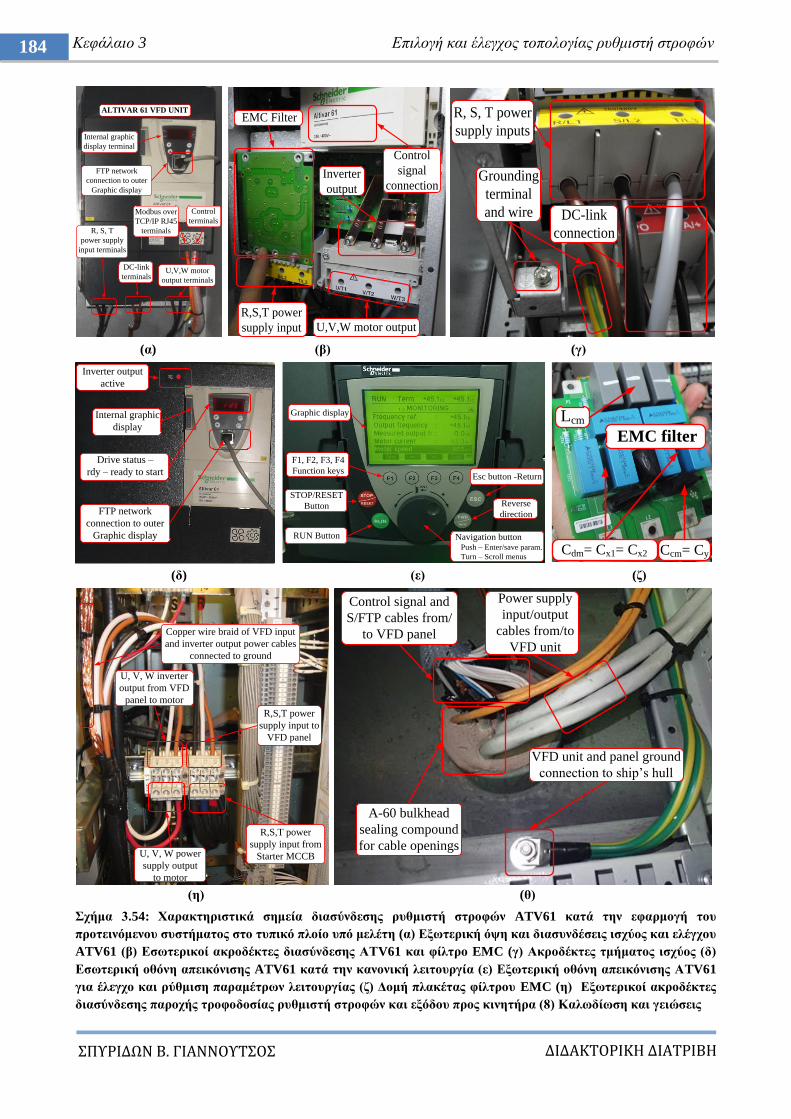
ΔΙΔΑΚΣΟΡΙΚΗ ΔΙΑΣΡΙΒΗ
ΠΤΡΙΔΩΝ Β. ΓΙΑΝΝΟΤΣΟ
184 Κεθάιαην 3 Δπηινγή θαη έιεγρνο ηνπνινγίαο ξπζκηζηή ζηξνθώλ
(α) (β) (γ)
(δ) (ε) (δ)
(ε) (ζ)
ρήκα 3.54: Υαξαθηεξηζηηθά ζεκεία δηαζύλδεζεο ξπζκηζηή ζηξνθώλ ATV61 θαηά ηελ εθαξκνγή ηνπ
πξνηεηλόκελνπ ζπζηήκαηνο ζην ηππηθό πινίν ππό κειέηε (α) Δμσηεξηθή όςε θαη δηαζπλδέζεηο ηζρύνο θαη ειέγρνπ
ATV61 (β) Δζσηεξηθνί αθξνδέθηεο δηαζύλδεζεο ΑΣV61 θαη θίιηξν EMC (γ) Αθξνδέθηεο ηκήκαηνο ηζρύνο (δ)
Δζσηεξηθή νζόλε απεηθόληζεο ATV61 θαηά ηελ θαλνληθή ιεηηνπξγία (ε) Δμσηεξηθή νζόλε απεηθόληζεο ΑTV61
γηα έιεγρν θαη ξύζκηζε παξακέηξσλ ιεηηνπξγίαο (δ) Γνκή πιαθέηαο θίιηξνπ EMC (ε) Δμσηεξηθνί αθξνδέθηεο
δηαζύλδεζεο παξνρήο ηξνθνδνζίαο ξπζκηζηή ζηξνθώλ θαη εμόδνπ πξνο θηλεηήξα (8) Καισδίσζε θαη γεηώζεηο
R, S, T
power supply
input terminals
DC-link
terminalsU,V,W motor
output terminals
Control
terminals
Internal graphic
display terminal
FTP network
connection to outer
Graphic display
ALTIVAR 61 VFD UNIT
Modbus over
TCP/IP RJ45
terminals
EMC Filter
R,S,T power
supply input
Control
signal
connection Inverter
output
U,V,W motor output
Grounding
terminal
and wire
R, S, T power
supply inputs
DC-link
connection
Internal graphic
display
Drive status –
rdy – ready to start
Inverter output
active
FTP network
connection to outer
Graphic display
Graphic display
F1, F2, F3, F4
Function keys
STOP/RESET
Button
RUN Button Navigation button Push – Enter/save param.
Turn – Scroll menus
Reverse
direction
Esc button -Return
Cdm= Cx1= Cx2
Lcm
Ccm= Cy
EMC filter
R,S,T power
supply input from
Starter MCCB
R,S,T power
supply input to
VFD panel
U, V, W inverter
output from VFD
panel to motor
U, V, W power
supply output
to motor
Copper wire braid of VFD input
and inverter output power cables
connected to ground
VFD unit and panel ground
connection to ship‟s hull
A-60 bulkhead
sealing compound
for cable openings
Power supply
input/output
cables from/to
VFD unit
Control signal and
S/FTP cables from/
to VFD panel
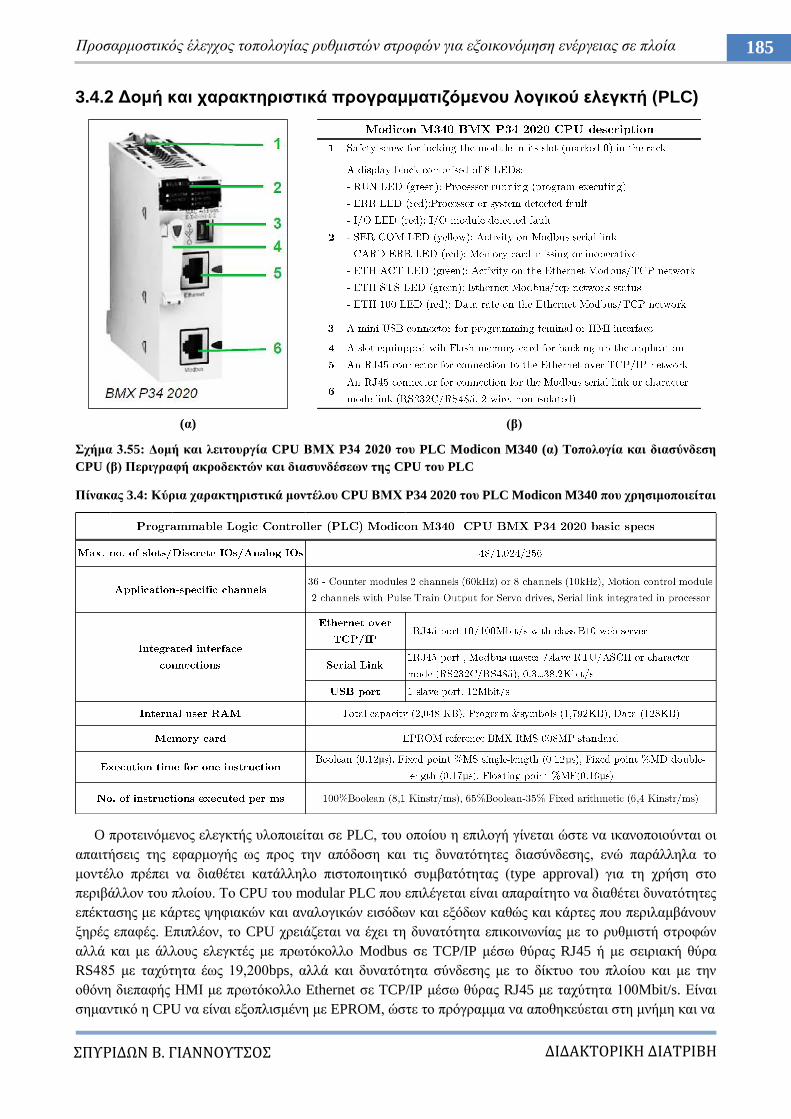
ΔΙΔΑΚΣΟΡΙΚΗ ΔΙΑΣΡΙΒΗ
ΠΤΡΙΔΩΝ Β. ΓΙΑΝΝΟΤΣΟ
185 Πξνζαξκνζηηθόο έιεγρνο ηνπνινγίαο ξπζκηζηώλ ζηξνθώλ γηα εμνηθνλόκεζε ελέξγεηαο ζε πινία
3.4.2 Γνκή θαη ραξαθηεξηζηηθά πξνγξακκαηηδόκελνπ ινγηθνύ ειεγθηή (PLC)
(α) (β)
ρήκα 3.55: Γνκή θαη ιεηηνπξγία CPU ΒΜΥ P34 2020 ηνπ PLC Modicon M340 (α) Toπνινγία θαη δηαζύλδεζε
CPU (β) Πεξηγξαθή αθξνδεθηώλ θαη δηαζπλδέζεσλ ηεο CPU ηνπ PLC
Πίλαθαο 3.4: Κύξηα ραξαθηεξηζηηθά κνληέινπ CPU ΒΜΥ P34 2020 ηνπ PLC Modicon M340 πνπ ρξεζηκνπνηείηαη
O πξνηεηλόκελνο ειεγθηήο πινπνηείηαη ζε PLC, ηνπ νπνίνπ ε επηινγή γίλεηαη ώζηε λα ηθαλνπνηνύληαη νη
απαηηήζεηο ηεο εθαξκνγήο σο πξνο ηελ απόδνζε θαη ηηο δπλαηόηεηεο δηαζύλδεζεο, ελώ παξάιιεια ην
κνληέιν πξέπεη λα δηαζέηεη θαηάιιειν πηζηνπνηεηηθό ζπκβαηόηεηαο (type approval) γηα ηε ρξήζε ζην
πεξηβάιινλ ηνπ πινίνπ. Σν CPU ηνπ modular PLC πνπ επηιέγεηαη είλαη απαξαίηεην λα δηαζέηεη δπλαηόηεηεο
επέθηαζεο κε θάξηεο ςεθηαθώλ θαη αλαινγηθώλ εηζόδσλ θαη εμόδσλ θαζώο θαη θάξηεο πνπ πεξηιακβάλνπλ
μεξέο επαθέο. Δπηπιένλ, ην CPU ρξεηάδεηαη λα έρεη ηε δπλαηόηεηα επηθνηλσλίαο κε ην ξπζκηζηή ζηξνθώλ
αιιά θαη κε άιινπο ειεγθηέο κε πξσηόθνιιν Modbus ζε TCP/IP κέζσ ζύξαο RJ45 ή κε ζεηξηαθή ζύξα
RS485 κε ηαρύηεηα έσο 19,200bps, αιιά θαη δπλαηόηεηα ζύλδεζεο κε ην δίθηπν ηνπ πινίνπ θαη κε ηελ
νζόλε δηεπαθήο ΖΜΗ κε πξσηόθνιιν Ethernet ζε TCP/IP κέζσ ζύξαο RJ45 κε ηαρύηεηα 100Μbit/s. Δίλαη
ζεκαληηθό ε CPU λα είλαη εμνπιηζκέλε κε EPROM, ώζηε ην πξόγξακκα λα απνζεθεύεηαη ζηε κλήκε θαη λα
κ μ
μ μ
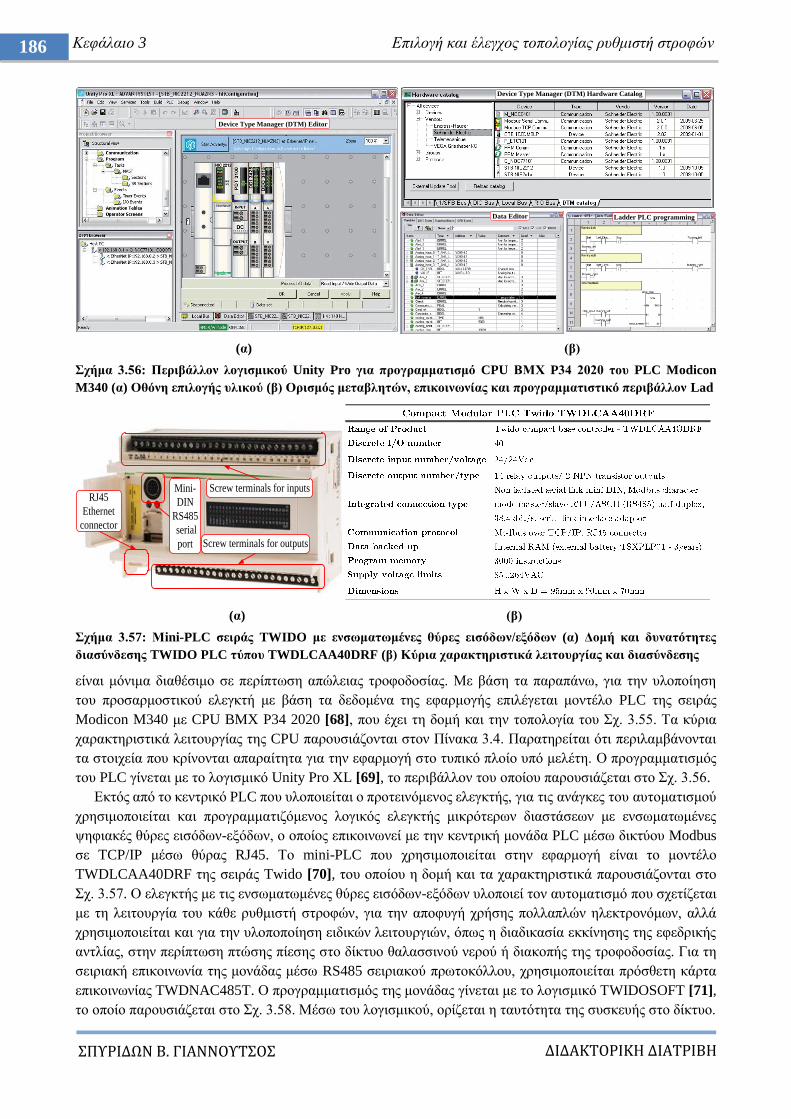
ΔΙΔΑΚΣΟΡΙΚΗ ΔΙΑΣΡΙΒΗ
ΠΤΡΙΔΩΝ Β. ΓΙΑΝΝΟΤΣΟ
186 Κεθάιαην 3 Δπηινγή θαη έιεγρνο ηνπνινγίαο ξπζκηζηή ζηξνθώλ
(α) (β)
ρήκα 3.56: Πεξηβάιινλ ινγηζκηθνύ Unity Pro γηα πξνγξακκαηηζκό CPU ΒΜΥ P34 2020 ηνπ PLC Modicon
M340 (α) Οζόλε επηινγήο πιηθνύ (β) Οξηζκόο κεηαβιεηώλ, επηθνηλσλίαο θαη πξνγξακκαηηζηηθό πεξηβάιινλ Lad
(α) (β)
ρήκα 3.57: Μini-PLC ζεηξάο TWIDO κε ελζσκαησκέλεο ζύξεο εηζόδσλ/εμόδσλ (α) Γνκή θαη δπλαηόηεηεο
δηαζύλδεζεο TWIDO PLC ηύπνπ TWDLCAA40DRF (β) Κύξηα ραξαθηεξηζηηθά ιεηηνπξγίαο θαη δηαζύλδεζεο
είλαη κόληκα δηαζέζηκν ζε πεξίπησζε απώιεηαο ηξνθνδνζίαο. Με βάζε ηα παξαπάλσ, γηα ηελ πινπνίεζε
ηνπ πξνζαξκνζηηθνύ ειεγθηή κε βάζε ηα δεδνκέλα ηεο εθαξκνγήο επηιέγεηαη κνληέιν PLC ηεο ζεηξάο
Modicon M340 κε CPU BMX P34 2020 [68], πνπ έρεη ηε δνκή θαη ηελ ηνπνινγία ηνπ ρ. 3.55. Σα θύξηα
ραξαθηεξηζηηθά ιεηηνπξγίαο ηεο CPU παξνπζηάδνληαη ζηνλ Πίλαθα 3.4. Παξαηεξείηαη όηη πεξηιακβάλνληαη
ηα ζηνηρεία πνπ θξίλνληαη απαξαίηεηα γηα ηελ εθαξκνγή ζην ηππηθό πινίν ππό κειέηε. Ο πξνγξακκαηηζκόο
ηνπ PLC γίλεηαη κε ην ινγηζκηθό Unity Pro XL [69], ην πεξηβάιινλ ηνπ νπνίνπ παξνπζηάδεηαη ζην ρ. 3.56.
Δθηόο από ην θεληξηθό PLC πνπ πινπνηείηαη ν πξνηεηλόκελνο ειεγθηήο, γηα ηηο αλάγθεο ηνπ απηνκαηηζκνύ
ρξεζηκνπνηείηαη θαη πξνγξακκαηηδόκελνο ινγηθόο ειεγθηήο κηθξόηεξσλ δηαζηάζεσλ κε ελζσκαησκέλεο
ςεθηαθέο ζύξεο εηζόδσλ-εμόδσλ, ν νπνίνο επηθνηλσλεί κε ηελ θεληξηθή κνλάδα PLC κέζσ δηθηύνπ Modbus
ζε TCP/IP κέζσ ζύξαο RJ45. Σν mini-PLC πνπ ρξεζηκνπνηείηαη ζηελ εθαξκνγή είλαη ην κνληέιν
TWDLCAA40DRF ηεο ζεηξάο Twido [70], ηνπ νπνίνπ ε δνκή θαη ηα ραξαθηεξηζηηθά παξνπζηάδνληαη ζην
ρ. 3.57. Ο ειεγθηήο κε ηηο ελζσκαησκέλεο ζύξεο εηζόδσλ-εμόδσλ πινπνηεί ηνλ απηνκαηηζκό πνπ ζρεηίδεηαη
κε ηε ιεηηνπξγία ηνπ θάζε ξπζκηζηή ζηξνθώλ, γηα ηελ απνθπγή ρξήζεο πνιιαπιώλ ειεθηξνλόκσλ, αιιά
ρξεζηκνπνηείηαη θαη γηα ηελ πινπνπνίεζε εηδηθώλ ιεηηνπξγηώλ, όπσο ε δηαδηθαζία εθθίλεζεο ηεο εθεδξηθήο
αληιίαο, ζηελ πεξίπησζε πηώζεο πίεζεο ζην δίθηπν ζαιαζζηλνύ λεξνύ ή δηαθνπήο ηεο ηξνθνδνζίαο. Γηα ηε
ζεηξηαθή επηθνηλσλία ηεο κνλάδαο κέζσ RS485 ζεηξηαθνύ πξσηνθόιινπ, ρξεζηκνπνηείηαη πξόζζεηε θάξηα
επηθνηλσλίαο TWDNAC485T. Ο πξνγξακκαηηζκόο ηεο κνλάδαο γίλεηαη κε ην ινγηζκηθό ΣWIDOSOFT [71],
ην νπνίν παξνπζηάδεηαη ζην ρ. 3.58. Μέζσ ηνπ ινγηζκηθνύ, νξίδεηαη ε ηαπηόηεηα ηεο ζπζθεπήο ζην δίθηπν.
Device Type Manager (DTM) Editor
Device Type Manager (DTM) Hardware Catalog
Data Editor Ladder PLC programming
Screw terminals for inputs
Screw terminals for outputs
RJ45
Ethernet
connector
Mini-
DIN
RS485
serial
port
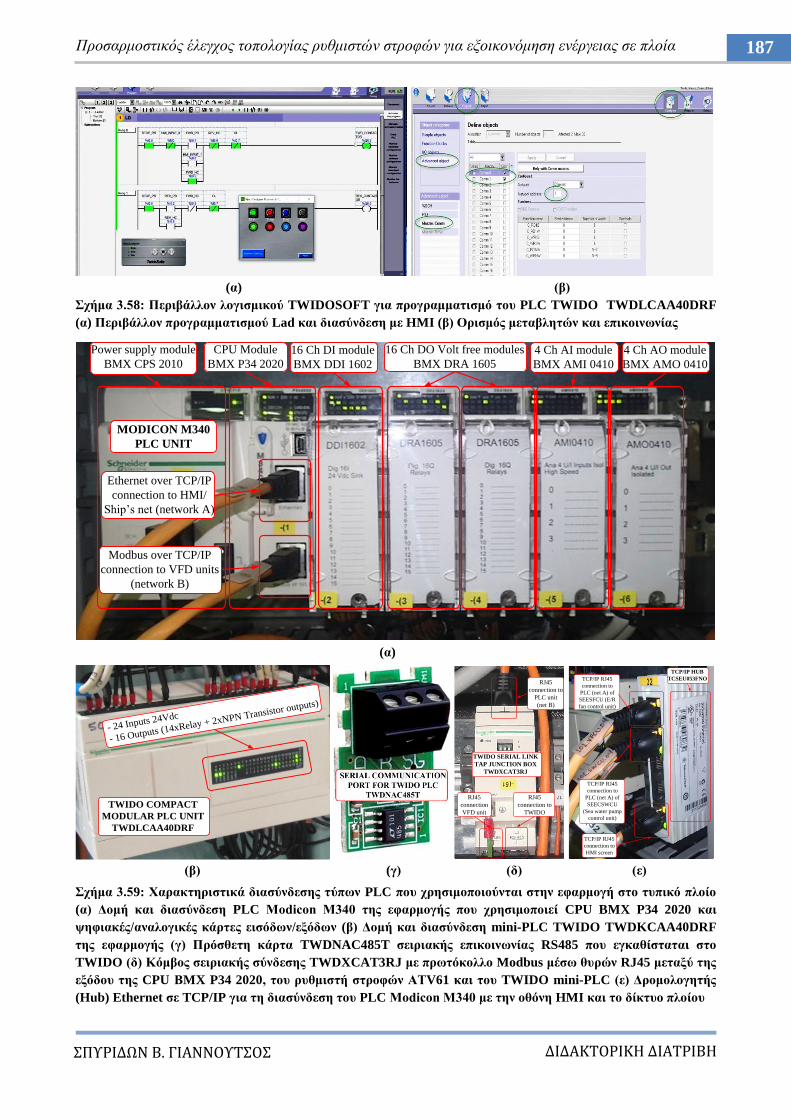
ΔΙΔΑΚΣΟΡΙΚΗ ΔΙΑΣΡΙΒΗ
ΠΤΡΙΔΩΝ Β. ΓΙΑΝΝΟΤΣΟ
187 Πξνζαξκνζηηθόο έιεγρνο ηνπνινγίαο ξπζκηζηώλ ζηξνθώλ γηα εμνηθνλόκεζε ελέξγεηαο ζε πινία
(α) (β)
ρήκα 3.58: Πεξηβάιινλ ινγηζκηθνύ TWIDOSOFT γηα πξνγξακκαηηζκό ηνπ PLC TWIDO TWDLCAA40DRF
(α) Πεξηβάιινλ πξνγξακκαηηζκνύ Lad θαη δηαζύλδεζε κε HMI (β) Οξηζκόο κεηαβιεηώλ θαη επηθνηλσλίαο
(α)
(β) (γ) (δ) (ε)
ρήκα 3.59: Υαξαθηεξηζηηθά δηαζύλδεζεο ηύπσλ PLC πνπ ρξεζηκνπνηνύληαη ζηελ εθαξκνγή ζην ηππηθό πινίν
(α) Γνκή θαη δηαζύλδεζε PLC Μνdicon M340 ηεο εθαξκνγήο πνπ ρξεζηκνπνηεί CPU BMX P34 2020 θαη
ςεθηαθέο/αλαινγηθέο θάξηεο εηζόδσλ/εμόδσλ (β) Γνκή θαη δηαζύλδεζε mini-PLC TWIDO TWDKCAA40DRF
ηεο εθαξκνγήο (γ) Πξόζζεηε θάξηα TWDNAC485T ζεηξηαθήο επηθνηλσλίαο RS485 πνπ εγθαζίζηαηαη ζην
TWIDO (δ) Κόκβνο ζεηξηαθήο ζύλδεζεο TWDXCAT3RJ κε πξσηόθνιιν Modbus κέζσ ζπξώλ RJ45 κεηαμύ ηεο
εμόδνπ ηεο CPU ΒMX P34 2020, ηνπ ξπζκηζηή ζηξνθώλ ΑΣV61 θαη ηνπ TWIDO mini-PLC (ε) Γξνκνινγεηήο
(Hub) Ethernet ζε TCP/IP γηα ηε δηαζύλδεζε ηνπ PLC Modicon M340 κε ηελ νζόλε HMI θαη ην δίθηπν πινίνπ
Power supply module
BMX CPS 2010
CPU Module
BMX P34 2020
16 Ch DI module
BMX DDI 1602
16 Ch DO Volt free modules
BMX DRA 1605
4 Ch AI module
BMX AMI 0410
4 Ch AO module
BMX AMO 0410
Ethernet over TCP/IP
connection to HMI/
Ship‟s net (network A)
Modbus over TCP/IP
connection to VFD units
(network B)
MODICON M340
PLC UNIT
TWIDO COMPACT
MODULAR PLC UNIT
TWDLCAA40DRF
- 24 Inputs 24Vdc
- 16 Outputs (14xRelay + 2xNPN Transistor outputs)
TWIDO SERIAL LINK
TAP JUNCTION BOX
TWDXCAT3RJ
RJ45
connection to
PLC unit
(net B)
RJ45
connection
VFD unit
RJ45
connection to
TWIDO
TCP/IP RJ45
connection to
HMI screen
TCP/IP RJ45
connection to
PLC (net A) of
SEESFCU (E/R
fan control unit)
TCP/IP RJ45
connection to
PLC (net A) of
SEECSWCU
(Sea water pump
control unit)
TCP/IP HUB
TCSEU053FNO
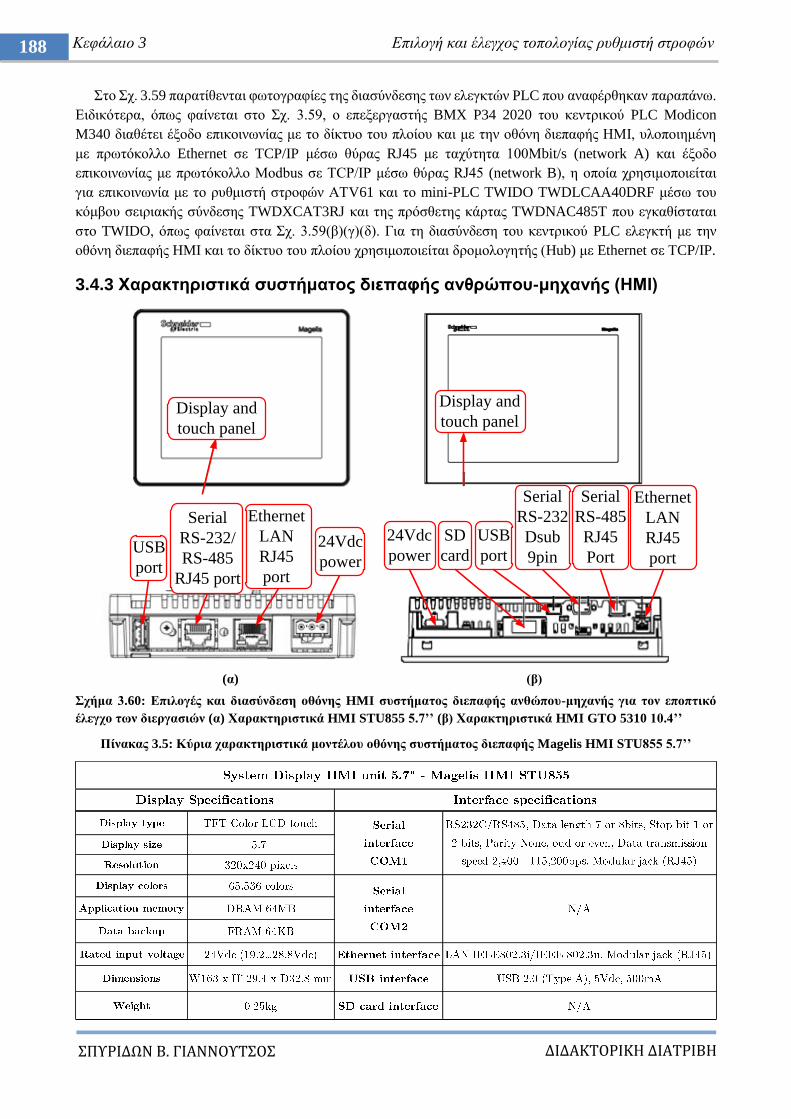
ΔΙΔΑΚΣΟΡΙΚΗ ΔΙΑΣΡΙΒΗ
ΠΤΡΙΔΩΝ Β. ΓΙΑΝΝΟΤΣΟ
188 Κεθάιαην 3 Δπηινγή θαη έιεγρνο ηνπνινγίαο ξπζκηζηή ζηξνθώλ
ην ρ. 3.59 παξαηίζεληαη θσηνγξαθίεο ηεο δηαζύλδεζεο ησλ ειεγθηώλ PLC πνπ αλαθέξζεθαλ παξαπάλσ.
Δηδηθόηεξα, όπσο θαίλεηαη ζην ρ. 3.59, ν επεμεξγαζηήο BMX P34 2020 ηνπ θεληξηθνύ PLC Modicon
M340 δηαζέηεη έμνδν επηθνηλσλίαο κε ην δίθηπν ηνπ πινίνπ θαη κε ηελ νζόλε δηεπαθήο ΖΜΗ, πινπνηεκέλε
κε πξσηόθνιιν Ethernet ζε TCP/IP κέζσ ζύξαο RJ45 κε ηαρύηεηα 100Μbit/s (network A) θαη έμνδν
επηθνηλσλίαο κε πξσηόθνιιν Modbus ζε TCP/IP κέζσ ζύξαο RJ45 (network B), ε νπνία ρξεζηκνπνηείηαη
γηα επηθνηλσλία κε ην ξπζκηζηή ζηξνθώλ ΑΣV61 θαη ην mini-PLC TWIDO TWDLCAA40DRF κέζσ ηνπ
θόκβνπ ζεηξηαθήο ζύλδεζεο TWDXCAT3RJ θαη ηεο πξόζζεηεο θάξηαο TWDNAC485T πνπ εγθαζίζηαηαη
ζην TWIDO, όπσο θαίλεηαη ζηα ρ. 3.59(β)(γ)(δ). Γηα ηε δηαζύλδεζε ηνπ θεληξηθνύ PLC ειεγθηή κε ηελ
νζόλε δηεπαθήο HMI θαη ην δίθηπν ηνπ πινίνπ ρξεζηκνπνηείηαη δξνκνινγεηήο (Hub) κε Ethernet ζε ΣCP/IP.
3.4.3 Υαξαθηεξηζηηθά ζπζηήκαηνο δηεπαθήο αλζξώπνπ-κεραλήο (ΗΜΙ)
(α) (β)
ρήκα 3.60: Δπηινγέο θαη δηαζύλδεζε νζόλεο HMI ζπζηήκαηνο δηεπαθήο αλζώπνπ-κεραλήο γηα ηνλ επνπηηθό
έιεγρν ησλ δηεξγαζηώλ (α) Υαξαθηεξηζηηθά HMI STU855 5.7’’ (β) Υαξαθηεξηζηηθά HMI GTO 5310 10.4’’
Πίλαθαο 3.5: Κύξηα ραξαθηεξηζηηθά κνληέινπ νζόλεο ζπζηήκαηνο δηεπαθήο Magelis HMI STU855 5.7’’
Display and
touch panel
USB
port
Serial
RS-232/
RS-485
RJ45 port
Ethernet
LAN
RJ45
port
24Vdc
power
Display and
touch panel
SD
card
24Vdc
power
USB
port
Ethernet
LAN
RJ45
port
Serial
RS-232
Dsub
9pin
Serial
RS-485
RJ45
Port
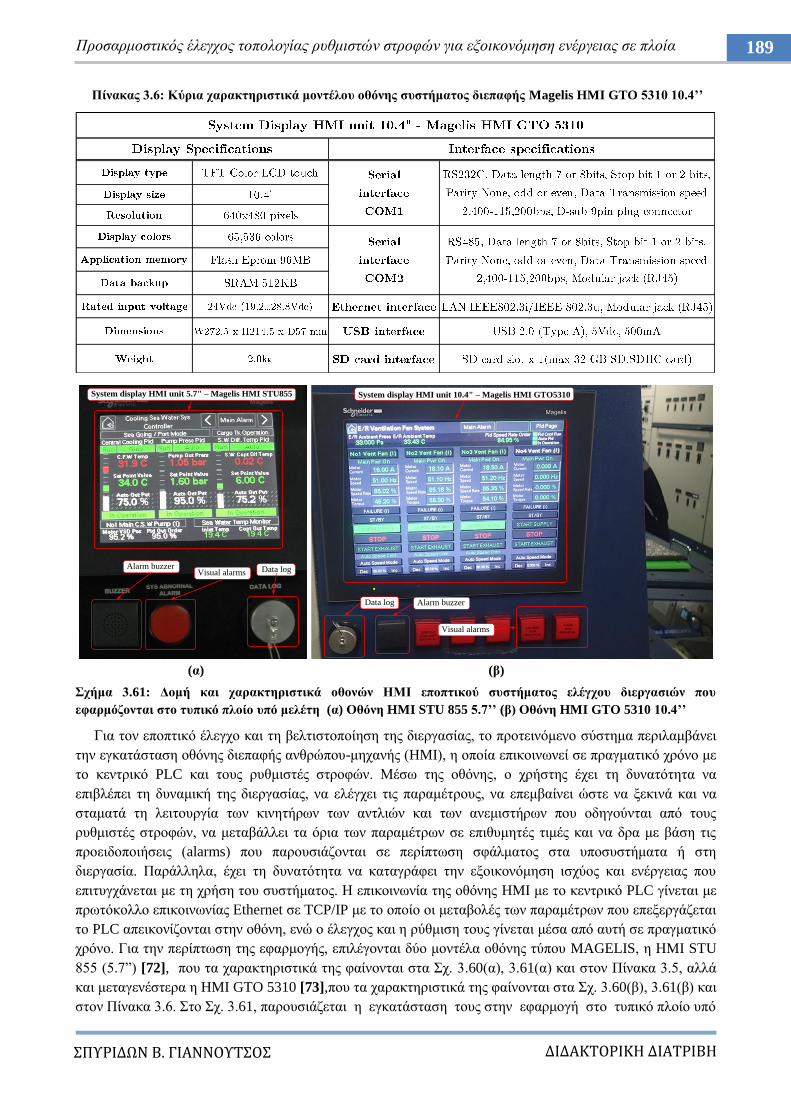
ΔΙΔΑΚΣΟΡΙΚΗ ΔΙΑΣΡΙΒΗ
ΠΤΡΙΔΩΝ Β. ΓΙΑΝΝΟΤΣΟ
189 Πξνζαξκνζηηθόο έιεγρνο ηνπνινγίαο ξπζκηζηώλ ζηξνθώλ γηα εμνηθνλόκεζε ελέξγεηαο ζε πινία
Πίλαθαο 3.6: Κύξηα ραξαθηεξηζηηθά κνληέινπ νζόλεο ζπζηήκαηνο δηεπαθήο Magelis HMI GTO 5310 10.4’’
(α) (β)
ρήκα 3.61: Γνκή θαη ραξαθηεξηζηηθά νζνλώλ ΗΜΙ επνπηηθνύ ζπζηήκαηνο ειέγρνπ δηεξγαζηώλ πνπ
εθαξκόδνληαη ζην ηππηθό πινίν ππό κειέηε (α) Οζόλε HMI STU 855 5.7’’ (β) Οζόλε HMI GTO 5310 10.4’’
Γηα ηνλ επνπηηθό έιεγρν θαη ηε βειηηζηνπνίεζε ηεο δηεξγαζίαο, ην πξνηεηλόκελν ζύζηεκα πεξηιακβάλεη
ηελ εγθαηάζηαζε νζόλεο δηεπαθήο αλζξώπνπ-κεραλήο (HMI), ε νπνία επηθνηλσλεί ζε πξαγκαηηθό ρξόλν κε
ην θεληξηθό PLC θαη ηνπο ξπζκηζηέο ζηξνθώλ. Μέζσ ηεο νζόλεο, ν ρξήζηεο έρεη ηε δπλαηόηεηα λα
επηβιέπεη ηε δπλακηθή ηεο δηεξγαζίαο, λα ειέγρεη ηηο παξακέηξνπο, λα επεκβαίλεη ώζηε λα μεθηλά θαη λα
ζηακαηά ηε ιεηηνπξγία ησλ θηλεηήξσλ ησλ αληιηώλ θαη ησλ αλεκηζηήξσλ πνπ νδεγνύληαη από ηνπο
ξπζκηζηέο ζηξνθώλ, λα κεηαβάιιεη ηα όξηα ησλ παξακέηξσλ ζε επηζπκεηέο ηηκέο θαη λα δξα κε βάζε ηηο
πξνεηδνπνηήζεηο (alarms) πνπ παξνπζηάδνληαη ζε πεξίπησζε ζθάικαηνο ζηα ππνζπζηήκαηα ή ζηε
δηεξγαζία. Παξάιιεια, έρεη ηε δπλαηόηεηα λα θαηαγξάθεη ηελ εμνηθνλόκεζε ηζρύνο θαη ελέξγεηαο πνπ
επηηπγράλεηαη κε ηε ρξήζε ηνπ ζπζηήκαηνο. Ζ επηθνηλσλία ηεο νζόλεο HMI κε ην θεληξηθό PLC γίλεηαη κε
πξσηόθνιιν επηθνηλσλίαο Δthernet ζε TCP/IP κε ην νπνίν νη κεηαβνιέο ησλ παξακέηξσλ πνπ επεμεξγάδεηαη
ην PLC απεηθνλίδνληαη ζηελ νζόλε, ελώ ν έιεγρνο θαη ε ξύζκηζε ηνπο γίλεηαη κέζα από απηή ζε πξαγκαηηθό
ρξόλν. Γηα ηελ πεξίπησζε ηεο εθαξκνγήο, επηιέγνληαη δύν κνληέια νζόλεο ηύπνπ MAGELIS, ε ΖMI STU
855 (5.7”) [72], πνπ ηα ραξαθηεξηζηηθά ηεο θαίλνληαη ζηα ρ. 3.60(α), 3.61(α) θαη ζηνλ Πίλαθα 3.5, αιιά
θαη κεηαγελέζηεξα ε HMI GTO 5310 [73],πνπ ηα ραξαθηεξηζηηθά ηεο θαίλνληαη ζηα ρ. 3.60(β), 3.61(β) θαη
ζηνλ Πίλαθα 3.6. ην ρ. 3.61, παξνπζηάδεηαη ε εγθαηάζηαζε ηνπο ζηελ εθαξκνγή ζην ηππηθό πινίν ππό
Data logAlarm buzzerVisual alarms
System display HMI unit 5.7" – Magelis HMI STU855 System display HMI unit 10.4" – Magelis HMI GTO5310
Alarm buzzerData log
Visual alarms
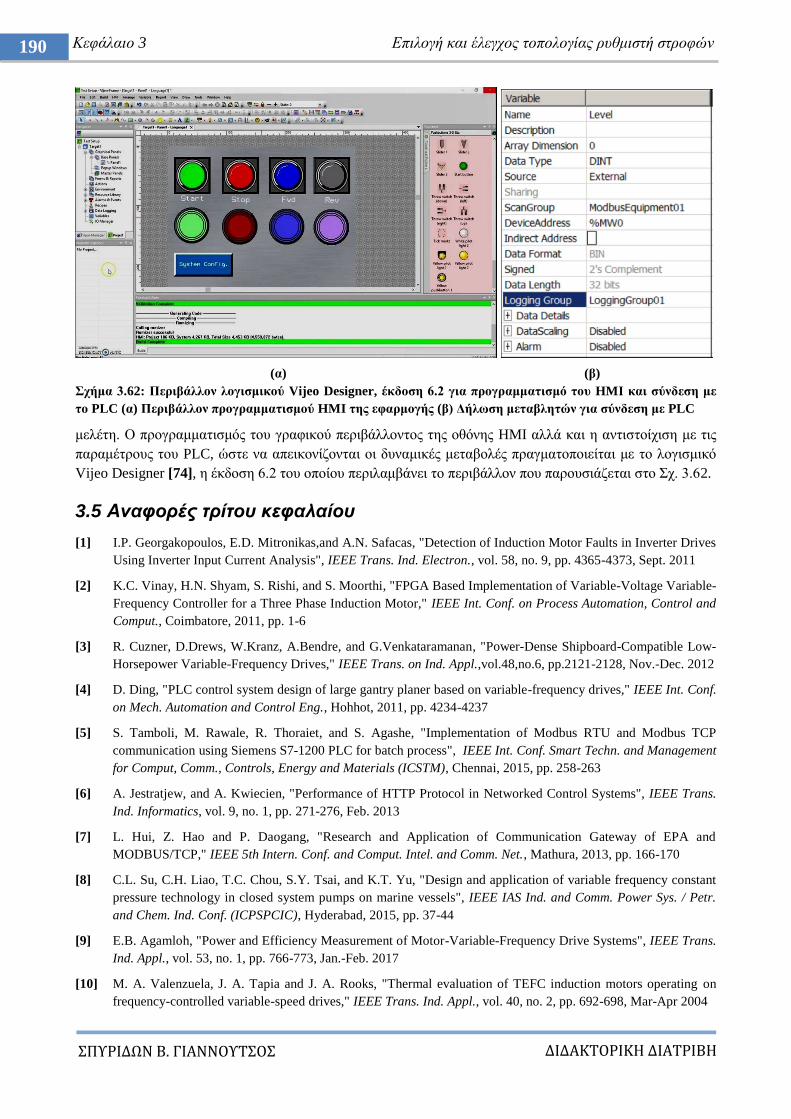
ΔΙΔΑΚΣΟΡΙΚΗ ΔΙΑΣΡΙΒΗ
ΠΤΡΙΔΩΝ Β. ΓΙΑΝΝΟΤΣΟ
190 Κεθάιαην 3 Δπηινγή θαη έιεγρνο ηνπνινγίαο ξπζκηζηή ζηξνθώλ
(α) (β)
ρήκα 3.62: Πεξηβάιινλ ινγηζκηθνύ Vijeo Designer, έθδνζε 6.2 γηα πξνγξακκαηηζκό ηνπ HMI θαη ζύλδεζε κε
ην PLC (α) Πεξηβάιινλ πξνγξακκαηηζκνύ HMI ηεο εθαξκνγήο (β) Γήισζε κεηαβιεηώλ γηα ζύλδεζε κε PLC
κειέηε. Ο πξνγξακκαηηζκόο ηνπ γξαθηθνύ πεξηβάιινληνο ηεο νζόλεο HMI αιιά θαη ε αληηζηνίρηζε κε ηηο
παξακέηξνπο ηνπ PLC, ώζηε λα απεηθνλίδνληαη νη δπλακηθέο κεηαβνιέο πξαγκαηνπνηείηαη κε ην ινγηζκηθό
Vijeo Designer [74], ε έθδνζε 6.2 ηνπ νπνίνπ πεξηιακβάλεη ην πεξηβάιινλ πνπ παξνπζηάδεηαη ζην ρ. 3.62.
3.5 Αναθοπέρ ηπίηος κεθαλαίος
[1] I.P. Georgakopoulos, E.D. Mitronikas,and A.N. Safacas, "Detection of Induction Motor Faults in Inverter Drives
Using Inverter Input Current Analysis", IEEE Trans. Ind. Electron., vol. 58, no. 9, pp. 4365-4373, Sept. 2011
[2] K.C. Vinay, H.N. Shyam, S. Rishi, and S. Moorthi, "FPGA Based Implementation of Variable-Voltage Variable-
Frequency Controller for a Three Phase Induction Motor," IEEE Int. Conf. on Process Automation, Control and
Comput., Coimbatore, 2011, pp. 1-6
[3] R. Cuzner, D.Drews, W.Kranz, A.Bendre, and G.Venkataramanan, "Power-Dense Shipboard-Compatible Low-
Horsepower Variable-Frequency Drives," IEEE Trans. on Ind. Appl.,vol.48,no.6, pp.2121-2128, Nov.-Dec. 2012
[4] D. Ding, "PLC control system design of large gantry planer based on variable-frequency drives," IEEE Int. Conf.
on Mech. Automation and Control Eng., Hohhot, 2011, pp. 4234-4237
[5] S. Tamboli, M. Rawale, R. Thoraiet, and S. Agashe, "Implementation of Modbus RTU and Modbus TCP
communication using Siemens S7-1200 PLC for batch process", IEEE Int. Conf. Smart Techn. and Management
for Comput, Comm., Controls, Energy and Materials (ICSTM), Chennai, 2015, pp. 258-263
[6] A. Jestratjew, and A. Kwiecien, "Performance of HTTP Protocol in Networked Control Systems", IEEE Trans.
Ind. Informatics, vol. 9, no. 1, pp. 271-276, Feb. 2013
[7] L. Hui, Z. Hao and P. Daogang, "Research and Application of Communication Gateway of EPA and
MODBUS/TCP," IEEE 5th Intern. Conf. and Comput. Intel. and Comm. Net., Mathura, 2013, pp. 166-170
[8] C.L. Su, C.H. Liao, T.C. Chou, S.Y. Tsai, and K.T. Yu, "Design and application of variable frequency constant
pressure technology in closed system pumps on marine vessels", IEEE IAS Ind. and Comm. Power Sys. / Petr.
and Chem. Ind. Conf. (ICPSPCIC), Hyderabad, 2015, pp. 37-44
[9] E.B. Agamloh, "Power and Efficiency Measurement of Motor-Variable-Frequency Drive Systems", IEEE Trans.
Ind. Appl., vol. 53, no. 1, pp. 766-773, Jan.-Feb. 2017
[10] M. A. Valenzuela, J. A. Tapia and J. A. Rooks, "Thermal evaluation of TEFC induction motors operating on
frequency-controlled variable-speed drives," IEEE Trans. Ind. Appl., vol. 40, no. 2, pp. 692-698, Mar-Apr 2004
ΔΙΔΑΚΣΟΡΙΚΗ ΔΙΑΣΡΙΒΗ
ΠΤΡΙΔΩΝ Β. ΓΙΑΝΝΟΤΣΟ
191 Πξνζαξκνζηηθόο έιεγρνο ηνπνινγίαο ξπζκηζηώλ ζηξνθώλ γηα εμνηθνλόκεζε ελέξγεηαο ζε πινία
[11] B.Bose,“Power Electronics & Variable Frequency Drives:Technology & Applications”,IEEE Press,(1sted.), 1996
[12] M. Rastogi and P.W. Hammond, "Dual-frequency braking in AC drives", IEEE Trans. Power Electron., vol. 17,
no. 6, pp. 1032-1040, Nov 2002
[13] M. Hinkkanen and J. Luomi, "Braking Scheme for Vector-Controlled Induction Motor Drives Equipped with
Diode Rectifier Without Braking Resistor", IEEE Trans. Ind. Appl., vol.42, no.5, pp. 1257-1263, Sept.-Oct. 2006
[14] S.Z. Djokic, S.M. Munshi, and C.E. Cresswell "The influence of overcurrent and undervoltage protection settings
on ASD sensitivity to voltage sags and short interruptions," 4th IET Conf. Power Electron., Machines and
Drives, New York, 2008, pp. 130-134
[15] H. Jamal, S. Albatran, and I. A. Smadi "Variable switching frequency algorithm for optimal tradeoff between
switching losses and total demand distortion in grid-tied three-phase voltage-source inverters," IEEE Energy
Conv. Congr. and Exp. (ECCE), Milwaukee, WI, 2016, pp. 1-7
[16] International Association of Classification Societies – IACS, “Requirements Concerning Machinery
Installations - IACS Requirement 2004”, [Online].
Available:http://www.iacs.org.uk/document/public/Publications/Unified_requirements/PDF/UR_M_pdf2793.pdf
[17] D. Han, S. Li, Y. Wu, W. Choi and B. Sarlioglu, "Comparative Analysis on Conducted CM EMI Emission of
Motor Drives: WBG Versus Si Devices," IEEE Trans. Ind. Electron., vol. 64, no. 10, pp. 8353-8363, Oct. 2017
[18] Z. Liu and G. L. Skibinski, "Method to reduce overvoltage on AC motor insulation from inverters with ultra-long
cable", IEEE Int. Electric Machines and Drives Conf., (IEMDC), Miami, FL, 2017, pp. 1-8
[19] H. Akagi, "Influence of high dv/dt switching on a motor drive system: a practical solution to EMI issues", IEEE
Proceedings of the 16th Int. Symp. on Power Sem. Devices and ICs, Kitakyushu, Japan, 2004, pp. 139-142
[20] International Electrotechnical Commission – IEC, “IEC TS 60034-25:2014 – “Rotating electrical machines - Part
25: AC electrical machines used in power drive systems - Application guide”, [Online]. Available:
https://webstore.iec.ch/publication/128
[21] S. Sengupta, "Analysis of crosstalk induction by EMI source on a twisted pair transmission line", Proceedings of
the IEEE Int. Conf. on Electromagnetic Interference and Compatibility, 1999, pp. 406-409
[22] International Electrotechnical Commission – IEC, “IEC 61800-3:2004 – “Adjustable speed electrical power
drive systems - Part 3: EMC requirements and specific test methods”, [Online]. Available:
https://webstore.iec.ch/publication/5933
[23] ETS-LINDGREN®, “Model 91550 Series”, in Current Probes Manual, Feb 2005, [Online]. Available:
http://www.ets-lindgren.com/manuals/91550-1.pdf
[24] F. Shih, D. Chen, Y. Wu, and Y. Chen, “A Procedure for Designing EMI Filters for AC Line Applications”,
IEEE Trans. Power Electron., vol. 11, pp 170 - 181, Jan. 1996
[25] K. Gulez, N. Mutoh, F. Harashima, and K. Ohnishi, "An approximation to EMI noise problem to design an
appropriate EMI filter for induction motor control systems", Proc.40th
SICE Annual Conf.,Nagoya,2001,pp. 6-11
[26] S. Wang, F.C. Lee, and W.G. Odendaal,"Characterization, evaluation, and design of noise Separator for
conducted EMI noise diagnosis", IEEE Trans. Power Electron., vol. 20, no. 4, pp. 974-982, July 2005
[27] B. Bose, “Modern Power Electronics and AC Drives”, Prentice Hall , (1sted.), 2001
[28] Z. Zhang, Y. Liu, and A. M. Bazzi, "An improved high-performance open-loop V/f control method for induction
machines," IEEE Applied Power Electron. Conf. and Exp. (APEC), Tampa, FL, 2017, pp. 615-619
[29] K.S. Kumar, and K. P. Satsangi, "Micro-controller based closed loop control of induction motor using V/F
method”, IET Int. Conf. on Inf. and Comm. Techn. in El. Sciences (ICTES 2007),Tamil Nadu,2007,pp. 340-342
[30] M.S. Morey, V.B. Virulkar and G.A. Dhomane, "MRAS based Speed identification and online updating of rotor
time constant for sensorless field oriented controlled induction motor", Int. Conf. on Emerg. Trends in Electron.
& Sust. Energy Sys. (ICETEESES), Sultanpur, 2016, pp. 179-185
[31] T. Orlowska-Kowalska and M. Dybkowski, "Stator-Current-Based MRAS Estimator for a Wide Range Speed-
Sensorless Induction-Motor Drive", IEEE Trans. Ind. Electron., vol. 57, no. 4, pp. 1296-1308, April 2010
ΔΙΔΑΚΣΟΡΙΚΗ ΔΙΑΣΡΙΒΗ
ΠΤΡΙΔΩΝ Β. ΓΙΑΝΝΟΤΣΟ
192 Κεθάιαην 3 Δπηινγή θαη έιεγρνο ηνπνινγίαο ξπζκηζηή ζηξνθώλ
[32] N. Mohan, T.M. Udeland, and W.P. Robins, “Power Electronics: Converters, Applications, and Design”, John
Wiley & Sons , (2nd
ed.), 1995
[33] S. A. Odhano, R. Bojoi, A. Boglietti, Ş. G. Roşu, and G. Griva, "Maximum Efficiency per Torque Direct Flux
Vector Control of Induction Motor Drives", IEEE Trans. Ind. Appl.,vol. 51,no. 6,pp. 4415-4424,Nov.-Dec. 2015
[34] E. D. Mitronikas, A. N. Safacas, and E. C. Tatakis, "A new stator resistance tuning method for stator-flux-
oriented vector-controlled induction motor drive",IEEE Trans. Ind. Electron.,vol.48,no.6,pp.1148-1157,Dec 2001
[35] J. O. Pinto, B. K. Bose, and L.E.B. da Silva, "A stator-flux-oriented vector-controlled induction motor drive with
space-vector PWM and flux-vector synthesis by neural networks", IEEE Trans. Ind. Appl., vol. 37, no. 5, pp.
1308-1318, Sep-Oct 2001
[36] J. Holtz and T. Thimm, "Identification of the machine parameters in a vector-controlled induction motor drive,"
IEEE Trans. Ind. Appl., vol. 27, no. 6, pp. 1111-1118, Nov/Dec 1991
[37] M.W. Degner, J.M. Guerrero and F.Briz, "Slip-gain estimation in field-orientation-controlled induction machines
using the system transient response", IEEE Trans. Ind. Appl., vol. 42, no. 3, pp. 702-711, May-June 2006
[38] C. Lu, G. E. Dawson, and T. R. Eastham, "Dynamic performance of a linear induction motor with slip frequency
control," IEEE Proc. of Canadian Conf. on Electr. and Comp. Eng., Vancouver, BC, 1993, pp. 1057-1060
[39] A. Consoli, G. Scarcella and A. Testa, "Slip-frequency detection for indirect field-oriented control drives", IEEE
Trans. Ind. Appl., vol. 40, no. 1, pp. 194-201, Jan.-Feb. 2004
[40] A. Munoz-Garcia, T. A. Lipo and D. W. Novotny, "A new induction motor V/f control method capable of high-
performance regulation at low speeds", IEEE Trans. Ind. Appl., vol. 34, no. 4, pp. 813-821, Jul/Aug 1998
[41] B.I. Jeftenic, M.Z. Bebic and N.N. Mitrovic, "A simple speed sensorless control for variable frequency induction
motor drives", IEEE Trans. Energy Conv., vol. 14, no. 3, pp. 500-505, Sep 1999
[42] D. Perna and A. Del Pizzo, "An assisted speed-sensorless control of induction motor drives for railways
applications", ΗΔΔΔ Int. Conf. on Electr. Sys. for Aircraft, Railway, Ship Propulsion and Road Vehicles & Int.
Transp. Electr. Conf. (ESARS-ITEC), Toulouse, 2016, pp.1-7
[43] A. Pal, S. Das and A. K. Chattopadhyay, "An Improved Rotor Flux Space Vector Based MRAS for Field
Oriented Control of Induction Motor Drives," IEEE Trans. on Power Electr., vol. PP, no. 99, pp. 1-1, 2017
[44] S.N. Manias, “Power Electronics and Motor Drive Systems”, Elsevier, (1st
ed.), 2017
[45] R. Cordero, J.O.P. Pinto, and J. O. Soares, "New simplification of SV-PWM based on conditional rotation of the
reference vector", IEEE Int. Power Electron. Conf. - ECCE ASIA, Sapporo, 2010, pp. 2992-2999
[46] N. Mohan, P. Jose, T. Brekken, K. Mohapatra, W. Sulkowski and T. Undeland, "Explaining synthesis of three-
phase sinusoidal voltages using SV-PWM in the first power electronics course", IEEE Workshop Power Electron.
Education, 2005, pp. 40-44
[47] A. Lewicki, Z. Krzeminski and H.Abu-Rub, "Space-Vector Pulsewidth Modulation for Three-Level NPC
Converter With Neutral Point Voltage Control",IEEE Trans. Ind. Electron,vol.58,no.11,pp.5076-5086, Nov.2011
[48] H. Khan, E.H. Miliani and K.E.K. Drissi, "Discontinuous Random Space Vector Modulation for Electric Drives:
A Digital Approach", IEEE Trans. on Power Electron., vol. 27, no. 12, pp. 4944-4951, Dec. 2012
[49] R. Gabriel, W. Leonhard, and C.J. Nordby, "Field-Oriented Control of a Standard AC Motor Using
Microprocessors", IEEE Trans. Ind. Appl., vol. IA-16, no. 2, pp. 186-192, March 1980.
[50] V. T. Buyukdegirmenci, and P. T. Krein, "Control for high momentary torque from vector-controlled induction
machines", IEEE Int. Electric Machines & Drives Conf. (IEMDC), Coeur d'Alene, ID, 2015, pp. 897-903.
[51] L. Zhao, J. Huang, J. Chen, and M. Ye, "A Parallel Speed and Rotor Time Constant Identification Scheme for
Indirect Field Oriented Induction Motor Drives",IEEE Trans. Power Elec.,vol. 31,no.9,pp.6494-6503,Sept. 2016
[52] D. L. Mon-Nzongo, T. Jin, G. Ekemb and L. Bitjoka, "Decoupling Network of Field-Oriented Control in
Variable-Frequency Drives," IEEE Trans. Ind. Electron., vol. 64, no. 7, pp. 5746-5750, July 2017
ΔΙΔΑΚΣΟΡΙΚΗ ΔΙΑΣΡΙΒΗ
ΠΤΡΙΔΩΝ Β. ΓΙΑΝΝΟΤΣΟ
193 Πξνζαξκνζηηθόο έιεγρνο ηνπνινγίαο ξπζκηζηώλ ζηξνθώλ γηα εμνηθνλόκεζε ελέξγεηαο ζε πινία
[53] M. Mengoni, L. Zarri, A. Tani, G. Serra, and D. Casadei, "Stator Flux Vector Control of Induction Motor Drive
in the Field Weakening Region", IEEE Trans. Power Electron., vol. 23, no. 2, pp. 941-949, March 2008
[54] W. K. Ho, O. P. Gan, E. B. Tay, and E. L. Ang, "Performance and gain and phase margins of well-known PID
tuning formulas", IEEE Trans. on Control Sys. Techn., vol. 4, no. 4, pp. 473-477, Jul 1996.
[55] S. W. Sung, J. Lee, and I-B. Lee, "Proportional-Integral-Derivative Controller Tuning", Process Identification
and PID Control , 1, Wiley-IEEE Press, 2009, pp.151-199
[56] C. C. Hang, K. J. Astrom, and W. K. Ho, "Refinements of the Ziegler-Nichols tuning formula", IEE Proceedings
D - Control Theory and Appl., vol. 138, no. 2, pp. 111-118, March 1991
[57] S. Tzafestas and N. P. Papanikolopoulos, "Incremental fuzzy expert PID control," IEEE Trans. Ind. Electron,
vol. 37, no. 5, pp. 365-371, Oct 1990
[58] J. Maes, and J. A. Melkebeek, "Speed-sensorless direct torque control of induction motors using an adaptive flux
observer", IEEE Trans. Ind. Appl., vol. 36, no. 3, pp. 778-785, May-Jun 2000
[59] A.N. Smith, S.M. Gadoue and J.W. Finch, "Improved Rotor Flux Estimation at Low Speeds for Torque MRAS-
Based Sensorless Induction Motor Drives", IEEE Trans. Energy Conv., vol. 31, no. 1, pp. 270-282, March 2016
[60] M. Montanari, S. M. Peresada, C. Rossi and A. Tilli, "Speed Sensorless Control of Induction Motors Based on a
Reduced-Order Adaptive Observer", IEEE Trans. Control Sys. Techn., vol. 15, no. 6, pp. 1049-1064, Nov. 2007
[61] M. Taniguchi, T. Yoshinaga and K. Matsuse, "A speed-sensorless vector control of parallel-connected multiple
induction motor drives with adaptive rotor flux observers",37th
IEEE Power Electr.Spec. Conf.,Jeju, 2006,pp.1-5
[62] B. K. Bose, N. R. Patel and K. Rajashekara, "A start-up method for a speed sensorless stator-flux-oriented
vector-controlled induction motor drive", IEEE Trans. Ind. Electron., vol. 44, no. 4, pp. 587-590, Aug 1997
[63] S. Yang, D. Ding, X. Li, Z. Xie, X. Zhang and L. Chang, "A novel online parameter estimation method for
indirect field oriented induction motor drives", IEEE Trans. on Energy Conv., vol. PP, no. 99, pp. 1-1
[64] P. Cao, X. Zhang and S. Yang, "A Unified-Model-Based Analysis of MRAS for Online Rotor Time Constant
Estimation in an Induction Motor Drive", IEEE Trans. Ind. Electron., vol. 64, no. 6, pp. 4361-4371, June 2017
[65] American Bureau of Shipping (ABS):“Rules for Building and Classing Steel Vessels 2013 Part 4:Vessel Systems
and Machinery”, [Online] Available:
http://www.eagle.org/eagleExternalPortalWEB/ShowProperty/BEA%20Repository/Rules&Guides/Archives/2_S
VR_2013/part4
[66] Schneider Electric, “ATV61 Series Variable Frequency Unit ATV61HD18N4 datasheet”, [Online]. Available:
http://datasheet.octopart.com/ATV61HD18N4-Schneider-Electric-datasheet-14410565.pdf
[67] Schneider Electric, “ATV61 Series Variable Frequency Unit ATV61HD75N4 datasheet”, [Online] Available:
http://datasheet.octopart.com/ATV61HD75N4-Schneider-Electric-datasheet-14410526.pdf
[68] Schneider Electric, “BMXP342020 datasheet”, [Online] Available: http://datasheet.octopart.com/BMXP342020-
Schneider-Electric-datasheet-86815190.pdf
[69] Schneider Electric, “Modicon M340 Unity Pro software manual”, [Online] Available: http://static.schneider-
electric.us/docs/Automation%20Products/35006144.pdf
[70] Schneider Electric, “TWIDO TWDLCAE40DRF datasheet”, [Online] Available: https://www.schneider-
electric.us/en/product/download-pdf/TWDLCAE40DRF
[71] Schneider Electric, “TWIDOSOFT Software for TWIDO mini-PLC”, [Online] Available: https://www.schneider-
electric.com.eg/en/download/document/35011386K01000/
[72] Schneider Electric, “HMI STU855 manual”, [Online] Available: http://www.farnell.com/datasheets/1975768.pdf
[73] Schneider Electric, “HMI GTO5310 manual”, [Online] Available: http://www.farnell.com/datasheets/1702618.pdf
[74] Schneider Electric, “Vijeo Designer Software”, [Online] Available:http://www.schneider-electric.com/en/product-
range/1054-vijeo-designer/
ΔΙΔΑΚΣΟΡΙΚΗ ΔΙΑΣΡΙΒΗ
ΠΤΡΙΔΩΝ Β. ΓΙΑΝΝΟΤΣΟ
194 Κεθάιαην 4 Πξνζαξκνζηηθόο ειεγθηήο γηα βειηηζηνπνίεζε ηνπ ζπζηήκαηνο θεληξηθήο ςύμεο
Κεθάιαην 4
Πξνηεηλόκελνο πξνζαξκνζηηθόο ειεγθηήο γηα
βειηηζηνπνίεζε ηνπ ζπζηήκαηνο θεληξηθήο ςύμεο
4.1 Διζαγυγή
Ζ απνδνηηθή ιεηηνπξγία ηεο Κ/Μ σο πξνο ηελ θαηαλάισζε θαπζίκνπ, ζύκθσλα κε ηελ κειέηε πνπ
πξαγκαηνπνηήζεθε παξαπάλσ κε γλώκνλα ην ηππηθό πινίν ππό κειέηε, επηηπγράλεηαη κε ηελ εθαξκνγή ηεο
πξαθηηθήο κείσζεο ηεο ηαρύηεηαο πιεύζεο [1]. Απηή ζε ζπλδπαζκό κε ηηο ζηνραζηηθέο ζπλζήθεο ιεηηνπξγίαο
ηνπ πινίνπ, νδεγνύλ ζε κεηαβαιιόκελεο απαηηήζεηο παξνρήο λεξνύ από ηελ αληιία ζαιαζζηλνύ λεξνύ πνπ
είλαη κέξνο ηνπ ζπζηήκαηνο θεληξηθήο ςύμεο ηεο Κ/Μ θαη ησλ βνεζεηηθώλ κεραλεκάησλ, δεκηνπξγώληαο
πεξηζώξην εμνηθνλόκεζεο ηζρύνο όπσο δηαπηζηώζεθε από ηε κειέηε πνπ εθπνλήζεθε ζην δεύηεξν θεθάιαην
κε νδεγό ην πινίν ππό κειέηε [2] – [3]. Χζηόζν, γηα ηηο αληιίεο ζαιαζζηλνύ λεξνύ, ε ξύζκηζε ηεο παξνρήο
πξαγκαηνπνηείηαη κε ην πεξηνξηζκό ηεο δηθιείδαο ζηελ θαηάζιηςε ηεο αληιίαο, πνπ νδεγεί ζε πςειόηεξε
αλαπηπζζόκελε πίεζε ζην δίθηπν θαη δε κεηαβάιιεη ηελ θαηαλάισζε ηζρύνο από ηνλ θηλεηήξα πνπ νδεγεί
ηελ αληιία. Ζ εθαξκνγή ξπζκηζηώλ ζηξνθώλ (VFD) γηα ηνλ έιεγρν παξνρήο ζηα αληιεηηθά ζπζηήκαηα
κπνξεί λα νδεγήζεη ζε ζεκαληηθή εμνηθνλόκεζε ηζρύνο [4] – [5]. πγθεθξηκέλα γηα ηνλ θηλεηήξα πνπ νδεγεί
ηελ αληιία παξνρήο ζαιαζζηλνύ λεξνύ, ε ζεσξεηηθή κείσζε ηεο ξνήο θαηά 50% κε ηαπηόρξνλε κείσζε ησλ
ζηξνθώλ ηνπ θηλεηήξα θαηά 50% νδεγεί ζε κείσζε ηεο θαηαλαιηζθόκελεο ηζρύνο θαηά 87.5% ζε ζρέζε κε
ην Ppump,MCR, έρνληαο ζεκαληηθή επίδξαζε ζην ηζνδύγην ηζρύνο ηνπ πινίνπ, εάλ απηό ζπγθξηζεί κε ηελ
αληίζηνηρε ειάρηζηε κείσζε ηεο ηζρύνο (~20%) πνπ πξνθύπηεη από ηνλ ζηξαγγαιηζκό ηνπ επηζηνκίνπ.
Οη πεξηζζόηεξεο κειέηεο ζρεηηθέο κε ηελ απόδνζε ηεο εθαξκνγήο ξπζκηζηώλ ζηξνθώλ ζε θπγνθεληξηθέο
αληιίεο [6] – [10], βαζίδνληαη ζε επαξθή πνζνηηθή γλώζε ησλ παξακέηξσλ θαη ηνπ κνληέινπ ηεο δηεξγαζίαο
θαη πεξηνξίδνληαη ζε κηα δεδνκέλε ιεηηνπξγηθή θαηάζηαζε, ώζηε λα βειηηζηνπνηήζνπλ ηελ απόδνζε ηνπ
ξπζκηζηή ζηξνθώλ πνπ ρξεζηκνπνηείηαη [11] – [14], γεγνλόο πνπ δελ είλαη πξαθηηθά εθηθηό ζε πεξίπησζε
δπλακηθώλ κεηαβνιιώλ ηεο θαηάζηαζεο ιεηηνπξγίαο ηεο δηεξγαζίαο. Χζηόζν, ζηελ πεξίπησζε ηνπ δηθηύνπ
θεληξηθήο ςύμεο ηνπ πινίνπ, εθόζνλ ε ιεηηνπξγία ηεο αληιίαο παξνρήο ζαιαζζηλνύ λεξνύ ζπζρεηίδεηαη κε
κηα ζπγθεθξηκέλε δηεξγαζία, ηεο νπνίαο νη παξάκεηξνη κεηαβάιινληαη ζε κεγάιν βαζκό ζε ζρέζε κε ηε
ιεηηνπξγηθή θαηάζηαζε ηνπ πινίνπ, ην θνξηίν ηεο Κ/Μ, ηελ θαηάζηαζε ησλ βνεζεηηθώλ κεραλεκάησλ θαη
ηνπο θπζηθνύο πεξηνξηζκνύο ηνπ ζπζηήκαηνο, ε ξύζκηζε ηεο παξνρήο qΝ θαη άξα ηεο ηαρύηεηαο πεξηζηξνθήο
ηνπ θηλεηήξα δελ κπνξεί λα επηηεπρζεί απιά έρνληαο σο βάζε ηε κνληεινπνίεζε ηνπ ζπζηήκαηνο, δίρσο λα
ζέηνληαη ππό θίλδπλν θαη αβεβαηόηεηα ε ζπλέρεηα θαη ε αμηνπηζηία ηεο δηεξγαζίαο [4]-[6].
Ο ζζελαξόο πξνζαξκνζηηθόο έιεγρνο κε βάζε ηα δεδνκέλα, από ηελ άιιε, κπνξεί λα ρξεζηκνπνηεζεί γηα
ηνλ έιεγρν θαη ηε δηάγλσζε ζθαικάησλ ζε πνιύπινθεο βηνκεραληθέο δηεξγαζίεο [15]. Με απηόλ ηνλ ηξόπν,
κπνξεί λα πινπνηεζεί ζύζηεκα πνπ βαζίδεηαη ζε κεηξήζεηο ζε πξαγκαηηθό ρξόλν, ην νπνίν ρξεζηκνπνηεί
κεζόδνπο δεηγκαηνιεςίαο θαη δπλακηθήο γξακκηθνπνίεζεο ησλ δηαλπζκάησλ θαηάζηαζεο κέζσ παξαηεξεηή
γηα ηελ απηνξύζκηζε ηνπ ειεγθηή ώζηε λα επηηεπρζεί ζζελαξόο έιεγρνο κε γξακκηθώλ, ρξνληθά κεηαβιεηώλ
ζπζηεκάησλ [16]–[19]. Πξνο απηήλ ηελ θαηεύζπλζε, ν πξνηεηλόκελνο ζζελαξόο πξνζαξκνζηηθόο ειεγθηήο
κε βάζε ηα δεδνκέλα, απηνξπζκίδεηαη κέζσ κεηξήζεσλ από ηε δηεξγαζία ζε πξαγκαηηθό ρξόλν, κε ζηόρν ν
θηλεηήξαο πνπ νδεγεί ηελ αληιία ζαιαζζηλνύ λεξνύ λα ιεηηνπξγεί ζηε βέιηηζηε ηαρύηεηα, ώζηε λα
επηηπγράλεηαη ε κέγηζηε εμνηθνλόκεζε ηζρύνο, ελώ παξάιιεια ε ειάρηζηε δπλαηή ηαρύηεηα ιεηηνπξγίαο,
σmin λα πξνζαξκόδεηαη δπλακηθά αληίζηνηρα κε ηελ ειάρηζηε απαηηνύκελε παξνρή, qmin, πνπ κεηαβάιιεηαη
αλάινγα κε ηηο απαηηήζεηο απαγσγήο ζεξκόηεηαο ηεο Κ/Μ θαη ησλ βνεζεηηθώλ κεραλεκάησλ.
ΔΙΔΑΚΣΟΡΙΚΗ ΔΙΑΣΡΙΒΗ
ΠΤΡΙΔΩΝ Β. ΓΙΑΝΝΟΤΣΟ
195 Πξνζαξκνζηηθόο έιεγρνο ηνπνινγίαο ξπζκηζηώλ ζηξνθώλ γηα εμνηθνλόκεζε ελέξγεηαο ζε πινία
ην πιαίζην απηό, νη αιιαγέο ζηελ ζεξκνθξαζία ηεο ζάιαζζαο, νη κεηαβνιέο ζηελ πίεζε ζαιαζζηλνύ
λεξνύ πνπ παξέρεηαη σο είζνδν ζηνλ θεληξηθό ελαιιάθηε ζεξκόηεηαο θαη ζηνλ αηκνζθαηξηθό ζπκππθλσηή
γηα απξνβιεκάηηζηε ιεηηνπξγία, ηα όξηα ειάρηζηεο ζεξκνθξαζίαο θαη πίεζεο γηα ηελ ςύμε ησλ ρηησλίσλ ηεο
Κ/Μ θαη ησλ θπιίλδξσλ ησλ Ζ/Γ ζην δίθηπν γιπθνύ λεξνύ, ε θαηάζηαζε ηνπ θεληξηθνύ ελαιιάθηε
ζεξκόηεηαο θαη ηνπ δηθηύνπ ςύμεο, θαζώο νη κεηαβνιέο ζεξκνθξαζίαο ζηνλ ζπκππθλσηή θελνύ απνηεινύλ
παξάγνληεο πνπ ρξεηάδεηαη λα ιακβάλνληαη ππόςε από ηνλ ειεγθηή πνπ ζα παξέρεη ηελ εληνιή αλαθνξάο
ηαρύηεηαο πεξηζηξνθήο θαη ζα ζέηεη ηα όξηα αζθαινύο ιεηηνπξγίαο. Ο πξνηεηλόκελνο ειεγθηήο, ν νπνίνο
ζρεδηάδεηαη, πινπνηείηαη θαη εθαξκόδεηαη ζην ηππηθό πινίν ππό κειέηε, έρεη σο ζηόρν ηελ ειαρηζηνπνίεζε
ηεο θαηαλάισζεο ηζρύνο ηνπ θηλεηήξα πνπ νδεγεί ηελ αληιία ςύμεο, ελώ ηαπηόρξνλα ηθαλνπνηεί ηηο
δπλακηθά κεηαβαιιόκελεο παξακέηξνπο ηεο δηεξγαζίαο, δίρσο λα βαζίδεηαη ζηε κνληεινπνίεζε ηεο.
Λεηηνπξγίεο έθηαθηεο αλάγθεο πνπ ελεξγνπνηνύληαη ζε πεξίπησζε αλίρλεπζεο ζθάικαηνο, επίζεο
ελζσκαηώλνληαη ζηνλ ειεγθηή θαη εμεηάδνληαη ζηε ζπλέρεηα. Ζ απόδνζε ηνπ πξνηεηλόκελνπ ειεγθηή
εμεηάδεηαη σο πξνο ηε δπλακηθή ηνπ απόθξηζε ζηηο κεηαβνιέο ησλ παξακέηξσλ θαη ηε βειηηζηνπνίεζε ζηελ
εμνηθνλόκεζε ηζρύνο θαη θαπζίκνπ από ηηο Ζ/Γ κε αλαθνξά ην ηππηθό πινίν ππό κειέηε όπνπ πινπνηείηαη.
4.2 Σσεδίαζη, απσή λειηοςπγίαρ και πύθμιζη ηος πποηεινόμενος ελεγκηή
Με βάζε ην ζύζηεκα θεληξηθήο ςύμεο ηεο Κ/Μ θαη ησλ βνεζεηηθώλ κεραλεκάησλ πνπ παξνπζηάζηεθε
ζην ρ. 1.23 θαη ηε κνληεινπνίεζε απηνύ ζην ρ. 2.26, ε δηαζύλδεζε ηνπ πξνηεηλόκελνπ ειεγθηή κε ηε
δηεξγαζία πξαγκαηνπνηείηαη ώζηε λα θαιύπηνληαη ζε πξαγκαηηθό ρξόλν νη ιεηηνπξγηθέο κεηαβνιέο πνπ
εκθαλίδνληαη ζηε δηεξγαζία, ιακβάλνληαο δεδνκέλα κεηξήζεσλ ώζηε λα ξπζκίδνληαη απηόκαηα νη ηηκέο
αλαθνξάο (set-point) ησλ παξακέηξσλ θαη λα παξέρεηαη ε ηαρύηεηα αλαθνξάο πξνο ηνλ θηλεηήξα.
4.2.1 Γηαζύλδεζε πξνηεηλόκελνπ ειεγθηή κε ην ζύζηεκα θεληξηθήο ςύμεο
Καηά ηε δηάξθεηα ηεο πιεύζηκεο πεξηόδνπ (sea-going), ηεο αλακνλήο ζε ιηκάλη, θαη ηεο πεξηόδνπ ειηγκώλ
ή θόξησζεο, ιακβάλεηαη κέζσ αηζζεηήξα ε ζεξκνθξαζία ζηελ πιεπξά γιπθνύ λεξνύ (F.W) ηνπ θεληξηθνύ
ελαιιάθηε ζεξκόηεηαο κεηά ηελ ηξηνδηθή ζεξκνζηαηηθή δηθιείδα, ΣF.W_out [oC], θαη παξέρεηαη σο είζνδνο
αλάδξαζεο ζηνλ πξνηεηλόκελν πξνζαξκνζηηθό ειεγθηή. Ζ κεηαβιεηή απηή ρξεζηκνπνηείηαη ώζηε λα ειέγρεη
θαη λα δηαηεξεί ζηαζεξή αλαθνξά ζεξκνθξαζίαο γιπθνύ λεξνύ, Σ*
F.W_out [oC], ε νπνία εμαξηάηαη από ηε
ζεξκνθξαζία ζαιαζζηλνύ λεξνύ ζηελ είζνδν ηνπ θεληξηθνύ ελαιιάθηε, ΣS.W_in [oC], έρνληαο άκεζν αληίθηππν
ζηε ιεηηνπξγία ησλ ελαιιαθηώλ ςύμεο ηνπ ρώξνπ ζάξσζεο ηεο Κ/Μ (scavenge air cooler), πνπ ζπλδέεηαη
παξάιιεια κε ηνλ ελαιιάθηε ςύμεο ηνπ ιαδηνύ ιίπαλζεο (lubricating oil cooler) θαη κε ηνλ ελαιιάθηε
ςύμεο λεξνύ γηα ηνλ ρώξν ησλ ρηησλίσλ ηεο Κ/Μ (jacket water cooler). Σαπηόρξνλα, ε ζέζε ηεο ηξηνδηθήο
δηθιείδαο παξάθακςεο ηνπ θεληξηθνύ ελαιιάθηε, v/vpos [%] ιάκβαλεηαη κέζσ θαηάιιεινπ αηζζεηήξα θαη
ξπζκίδεηαη κέζσ ζεξβνκεραληζκνύ (actuator) κε βάζε ηε ζεξκνθξαζία αλαθνξάο Σ*
F.W_out ώζηε λα
επηηεπρζεί θαιύηεξε δπλακηθή ζπκπεξηθνξά ζηηο κεηαβνιέο θνξηίνπ. Δπηπιένλ, ην επίπεδν ηεο ζρεηηθήο
πίεζεο πνπ αλαπηύζζεηαη ζηελ θαηάζιηςε ηεο αληιίαο ζαιαζζηλνύ λεξνύ, PS.W_out [bar], ιακβάλεηαη κέζσ
αηζζεηήξα θαη παξέρεηαη σο αλαινγηθή είζνδνο αλάδξαζεο ζηνλ πξνηεηλόκελν ειεγθηή, ώζηε λα δηαηεξείηαη
ζηαζεξή επηζπκεηή αλαθνξά πίεζεο, P*S.W_out [bar], πνπ εμαξηάηαη επίζεο από ηε κέηξεζε ηεο ζεξκνθξαζίαο
ζαιαζζηλνύ λεξνύ ζηελ αλαξξόθεζε ηεο αληιίαο ζαιαζζηλνύ λεξνύ, ΣS.W_in, έηζη ώζηε λα ηθαλνπνηνύληαη νη
απαηηήζεηο πίεζεο ησλ βνεζεηηθώλ κεραλεκάησλ ζην δίθηπν ζαιαζζηλνύ (S.W) θαη γιπθνύ λεξνύ (F.W)
ςύμεο, θαη παξάιιεια λα απνθεύγεηαη ν πεξηνξηζκόο ξνήο λεξνύ ζηνλ αηκνζθαηξηθό ζπκπηεζηή
(atmospheric condenser) γηα ηελ απνδνηηθή πγξνπνίεζε ηνπ αηκνύ ηνπ δηθηύνπ αηκνύ θαη ηε κεηέπεηηα
ηξνθνδνζία ζην ιέβεηα θαπζίκνπ. Σαπηόρξνλα, εηζάγεηαη ειάρηζην όξην ηαρύηεηαο νδήγεζεο ηνπ θηλεηήξα
ηεο αληιίαο, σmin_sea, πνπ είλαη αλάινγν κε ην ειάρηζην όξην ξνήο ζαιαζζηλνύ λεξνύ qsw_min, κε βάζε ηηο
κεηξήζεηο θαη ηνπο θπζηθνύο πεξηνξηζκνύο ηνπ ζπζηήκαηνο όπσο πξνθύπηνπλ από ππoινγηζκνύο κε βάζε
ηελ ηνπνινγία ηνπ δηθηύνπ θεληξηθήο ςύμεο ηνπ πινίνπ, έηζη ώζηε λα απνθεπρζεί ε θξαγή ησλ ζσιελώζεσλ
ηνπ θεληξηθνύ ελαιιάθηε ιόγσ επηθαζίζεσλ θαη λα απνθεύγνληαη θαηλνκέλα ζπειαίσζεο ησλ αληιηώλ.
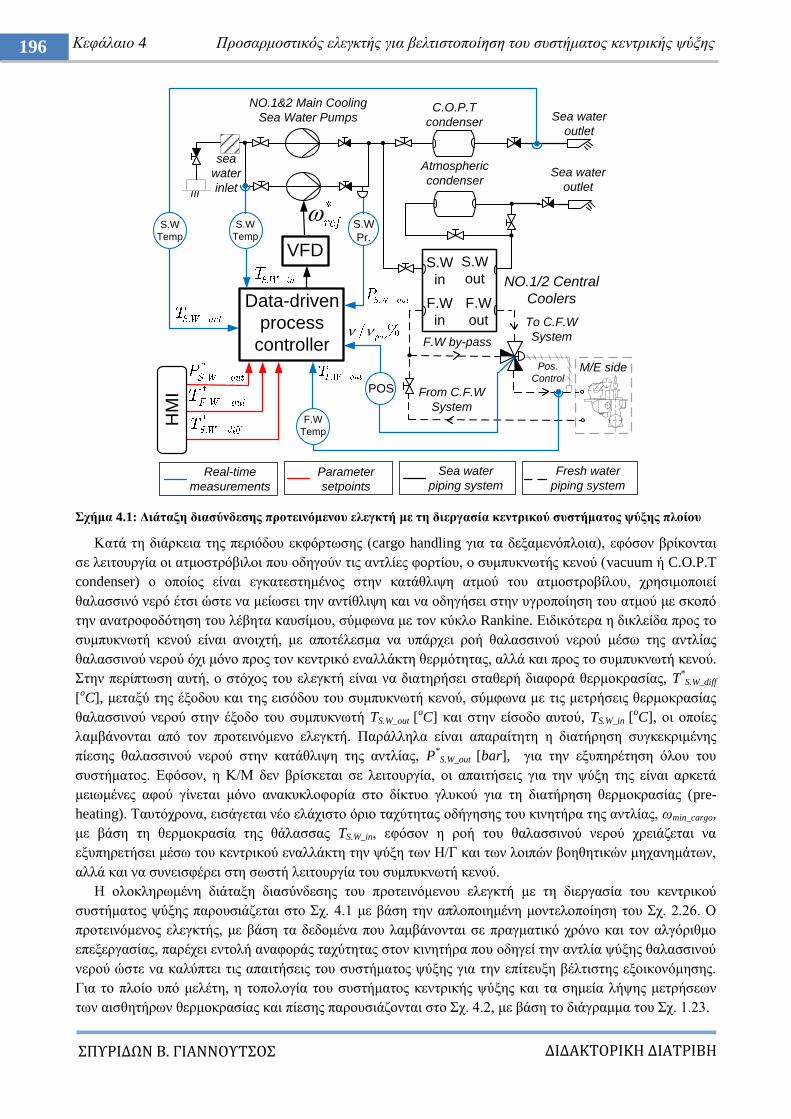
ΔΙΔΑΚΣΟΡΙΚΗ ΔΙΑΣΡΙΒΗ
ΠΤΡΙΔΩΝ Β. ΓΙΑΝΝΟΤΣΟ
196 Κεθάιαην 4 Πξνζαξκνζηηθόο ειεγθηήο γηα βειηηζηνπνίεζε ηνπ ζπζηήκαηνο θεληξηθήο ςύμεο
ρήκα 4.1: Γηάηαμε δηαζύλδεζεο πξνηεηλόκελνπ ειεγθηή κε ηε δηεξγαζία θεληξηθνύ ζπζηήκαηνο ςύμεο πινίνπ
Καηά ηε δηάξθεηα ηεο πεξηόδνπ εθθόξησζεο (cargo handling γηα ηα δεμακελόπινηα), εθόζνλ βξίθνληαη
ζε ιεηηνπξγία νη αηκνζηξόβηινη πνπ νδεγνύλ ηηο αληιίεο θνξηίνπ, ν ζπκππθλσηήο θελνύ (vacuum ή C.O.P.T
condenser) ν νπνίνο είλαη εγθαηεζηεκέλνο ζηελ θαηάζιηςε αηκνύ ηνπ αηκνζηξνβίινπ, ρξεζηκνπνηεί
ζαιαζζηλό λεξό έηζη ώζηε λα κείσζεη ηελ αληίζιηςε θαη λα νδεγήζεη ζηελ πγξνπνίεζε ηνπ αηκνύ κε ζθνπό
ηελ αλαηξνθνδόηεζε ηνπ ιέβεηα θαπζίκνπ, ζύκθσλα κε ηνλ θύθιν Rankine. Δηδηθόηεξα ε δηθιείδα πξνο ην
ζπκππθλσηή θελνύ είλαη αλνηρηή, κε απνηέιεζκα λα ππάξρεη ξνή ζαιαζζηλνύ λεξνύ κέζσ ηεο αληιίαο
ζαιαζζηλνύ λεξνύ όρη κόλν πξνο ηνλ θεληξηθό ελαιιάθηε ζεξκόηεηαο, αιιά θαη πξνο ην ζπκππθλσηή θελνύ.
ηελ πεξίπησζε απηή, ν ζηόρνο ηνπ ειεγθηή είλαη λα δηαηεξήζεη ζηαζεξή δηαθνξά ζεξκνθξαζίαο, T*
S.W_diff
[oC], κεηαμύ ηεο έμνδνπ θαη ηεο εηζόδνπ ηνπ ζπκππθλσηή θελνύ, ζύκθσλα κε ηηο κεηξήζεηο ζεξκνθξαζίαο
ζαιαζζηλνύ λεξνύ ζηελ έμνδν ηνπ ζπκππθλσηή TS.W_out [oC] θαη ζηελ είζνδν απηνύ, TS.W_in [
oC], νη νπνίεο
ιακβάλνληαη από ηνλ πξνηεηλόκελν ειεγθηή. Παξάιιεια είλαη απαξαίηεηε ε δηαηήξεζε ζπγθεθξηκέλεο
πίεζεο ζαιαζζηλνύ λεξνύ ζηελ θαηάζιηςε ηεο αληιίαο, P*
S.W_out [bar], γηα ηελ εμππεξέηεζε όινπ ηνπ
ζπζηήκαηνο. Δθόζνλ, ε Κ/Μ δελ βξίζθεηαη ζε ιεηηνπξγία, νη απαηηήζεηο γηα ηελ ςύμε ηεο είλαη αξθεηά
κεησκέλεο αθνύ γίλεηαη κόλν αλαθπθινθνξία ζην δίθηπν γιπθνύ γηα ηε δηαηήξεζε ζεξκνθξαζίαο (pre-
heating). Σαπηόρξνλα, εηζάγεηαη λέν ειάρηζην όξην ηαρύηεηαο νδήγεζεο ηνπ θηλεηήξα ηεο αληιίαο, σmin_cargo,
κε βάζε ηε ζεξκνθξαζία ηεο ζάιαζζαο TS.W_in, εθόζνλ ε ξνή ηνπ ζαιαζζηλνύ λεξνύ ρξεηάδεηαη λα
εμππεξεηήζεη κέζσ ηνπ θεληξηθνύ ελαιιάθηε ηελ ςύμε ησλ Ζ/Γ θαη ησλ ινηπώλ βνεζεηηθώλ κεραλεκάησλ,
αιιά θαη λα ζπλεηζθέξεη ζηε ζσζηή ιεηηνπξγία ηνπ ζπκππθλσηή θελνύ.
Ζ νινθιεξσκέλε δηάηαμε δηαζύλδεζεο ηνπ πξνηεηλόκελνπ ειεγθηή κε ηε δηεξγαζία ηνπ θεληξηθνύ
ζπζηήκαηνο ςύμεο παξνπζηάδεηαη ζην ρ. 4.1 κε βάζε ηελ απινπνηεκέλε κνληεινπνίεζε ηνπ ρ. 2.26. Ο
πξνηεηλόκελνο ειεγθηήο, κε βάζε ηα δεδνκέλα πνπ ιακβάλνληαη ζε πξαγκαηηθό ρξόλν θαη ηνλ αιγόξηζκν
επεμεξγαζίαο, παξέρεη εληνιή αλαθνξάο ηαρύηεηαο ζηνλ θηλεηήξα πνπ νδεγεί ηελ αληιία ςύμεο ζαιαζζηλνύ
λεξνύ ώζηε λα θαιύπηεη ηηο απαηηήζεηο ηνπ ζπζηήκαηνο ςύμεο γηα ηελ επίηεπμε βέιηηζηεο εμνηθνλόκεζεο.
Γηα ην πινίν ππό κειέηε, ε ηνπνινγία ηνπ ζπζηήκαηνο θεληξηθήο ςύμεο θαη ηα ζεκεία ιήςεο κεηξήζεσλ
ησλ αηζζεηήξσλ ζεξκνθξαζίαο θαη πίεζεο παξνπζηάδνληαη ζην ρ. 4.2, κε βάζε ην δηάγξακκα ηνπ ρ. 1.23.
sea
water
inlet
Sea water
outlet
S.W
in
S.W
out
F.W
in
F.W
out
C.O.P.T
condenser
Atmospheric
condenserSea water
outlet
From C.F.W
System
F.W by-pass
M/E side
NO.1/2 Central
Coolers
NO.1&2 Main Cooling
Sea Water Pumps
To C.F.W
System
Pos.
ControlPOS
F.W
Temp
S.W
Pr.
S.W
Temp
S.W
Temp
Data-driven
process
controller
VFD
HM
I
Real-time
measurements
Parameter
setpoints
Sea water
piping system
Fresh water
piping system
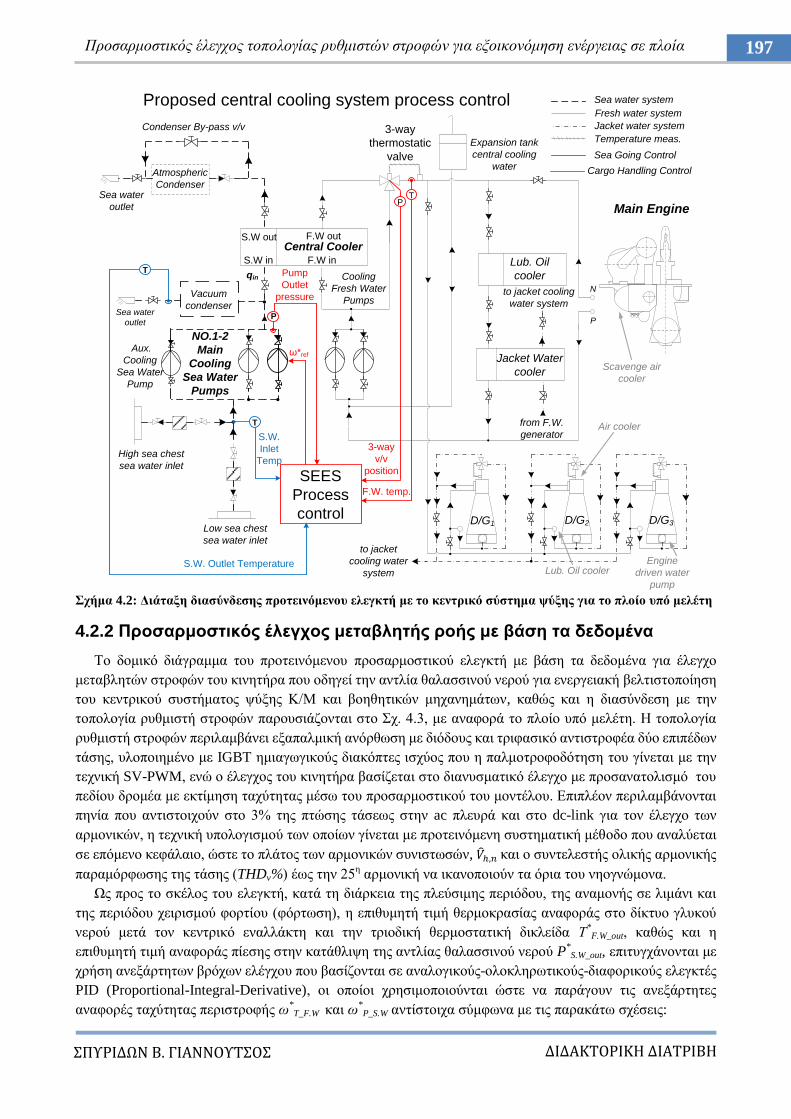
ΔΙΔΑΚΣΟΡΙΚΗ ΔΙΑΣΡΙΒΗ
ΠΤΡΙΔΩΝ Β. ΓΙΑΝΝΟΤΣΟ
197 Πξνζαξκνζηηθόο έιεγρνο ηνπνινγίαο ξπζκηζηώλ ζηξνθώλ γηα εμνηθνλόκεζε ελέξγεηαο ζε πινία
ρήκα 4.2: Γηάηαμε δηαζύλδεζεο πξνηεηλόκελνπ ειεγθηή κε ην θεληξηθό ζύζηεκα ςύμεο γηα ην πινίν ππό κειέηε
4.2.2 Πξνζαξκνζηηθόο έιεγρνο κεηαβιεηήο ξνήο κε βάζε ηα δεδνκέλα
Σν δνκηθό δηάγξακκα ηνπ πξνηεηλόκελνπ πξνζαξκνζηηθνύ ειεγθηή κε βάζε ηα δεδνκέλα γηα έιεγρν
κεηαβιεηώλ ζηξνθώλ ηνπ θηλεηήξα πνπ νδεγεί ηελ αληιία ζαιαζζηλνύ λεξνύ γηα ελεξγεηαθή βειηηζηνπνίεζε
ηνπ θεληξηθνύ ζπζηήκαηνο ςύμεο Κ/Μ θαη βνεζεηηθώλ κεραλεκάησλ, θαζώο θαη ε δηαζύλδεζε κε ηελ
ηνπνινγία ξπζκηζηή ζηξνθώλ παξνπζηάδνληαη ζην ρ. 4.3, κε αλαθνξά ην πινίν ππό κειέηε. Ζ ηνπνινγία
ξπζκηζηή ζηξνθώλ πεξηιακβάλεη εμαπαικηθή αλόξζσζε κε δηόδνπο θαη ηξηθαζηθό αληηζηξνθέα δύν επηπέδσλ
ηάζεο, πινπνηεκέλν κε IGBT εκηαγσγηθνύο δηαθόπηεο ηζρύνο πνπ ε παικνηξνθνδόηεζε ηνπ γίλεηαη κε ηελ
ηερληθή SV-PWM, ελώ ν έιεγρνο ηνπ θηλεηήξα βαζίδεηαη ζην δηαλπζκαηηθό έιεγρν κε πξνζαλαηνιηζκό ηνπ
πεδίνπ δξνκέα κε εθηίκεζε ηαρύηεηαο κέζσ ηνπ πξνζαξκνζηηθνύ ηνπ κνληέινπ. Δπηπιένλ πεξηιακβάλνληαη
πελία πνπ αληηζηνηρνύλ ζην 3% ηεο πηώζεο ηάζεσο ζηελ ac πιεπξά θαη ζην dc-link γηα ηνλ έιεγρν ησλ
αξκνληθώλ, ε ηερληθή ππνινγηζκνύ ησλ νπνίσλ γίλεηαη κε πξνηεηλόκελε ζπζηεκαηηθή κέζνδν πνπ αλαιύεηαη
ζε επόκελν θεθάιαην, ώζηε ην πιάηνο ησλ αξκνληθώλ ζπληζησζώλ, θαη ν ζπληειεζηήο νιηθήο αξκνληθήο
παξακόξθσζεο ηεο ηάζεο (THDv%) έσο ηελ 25ε αξκνληθή λα ηθαλνπνηνύλ ηα όξηα ηνπ λενγλώκνλα.
Χο πξνο ην ζθέινο ηνπ ειεγθηή, θαηά ηε δηάξθεηα ηεο πιεύζηκεο πεξηόδνπ, ηεο αλακνλήο ζε ιηκάλη θαη
ηεο πεξηόδνπ ρεηξηζκνύ θνξηίνπ (θόξησζε), ε επηζπκεηή ηηκή ζεξκνθξαζίαο αλαθνξάο ζην δίθηπν γιπθνύ
λεξνύ κεηά ηνλ θεληξηθό ελαιιάθηε θαη ηελ ηξηνδηθή ζεξκνζηαηηθή δηθιείδα Σ*
F.W_out, θαζώο θαη ε
επηζπκεηή ηηκή αλαθνξάο πίεζεο ζηελ θαηάζιηςε ηεο αληιίαο ζαιαζζηλνύ λεξνύ P*
S.W_out, επηηπγράλνληαη κε
ρξήζε αλεμάξηεησλ βξόρσλ ειέγρνπ πνπ βαζίδνληαη ζε αλαινγηθνύο-νινθιεξσηηθνύο-δηαθνξηθνύο ειεγθηέο
PID (Proportional-Integral-Derivative), νη νπνίνη ρξεζηκνπνηνύληαη ώζηε λα παξάγνπλ ηηο αλεμάξηεηεο
αλαθνξέο ηαρύηεηαο πεξηζηξνθήο σ*T_F.W θαη σ
*P_S.W αληίζηνηρα ζύκθσλα κε ηηο παξαθάησ ζρέζεηο:
Vacuum
condenser
Central Cooler
Atmospheric
Condenser
S.W in
S.W out
F.W in
F.W out
Aux.
Cooling
Sea Water
Pump
High sea chest
sea water inlet
Low sea chest
sea water inlet
Sea water
outlet
Sea water
outlet
Expansion tank
central cooling
water
Lub. Oil
cooler
Jacket Water
cooler
from F.W.
generator
to jacket cooling
water system
D/G1 D/G2 D/G3
Cooling
Fresh Water
Pumps
P
N
Main Engine
to jacket
cooling water
system
Scavenge air
cooler
Air cooler
Engine
driven water
pump
Lub. Oil cooler
T
P
P
Pump
Outlet
pressure
3-way
thermostatic
valve
3-way
v/v
position
F.W. temp.
SEES
Process
control
ω*ref
qin
Sea water system
Fresh water system
Jacket water system
Temperature meas.
Sea Going Control
NO.1-2
Main
Cooling
Sea Water
Pumps
Condenser By-pass v/v
T
Cargo Handling Control
T
Proposed central cooling system process control
S.W. Outlet Temperature
S.W.
Inlet
Temp
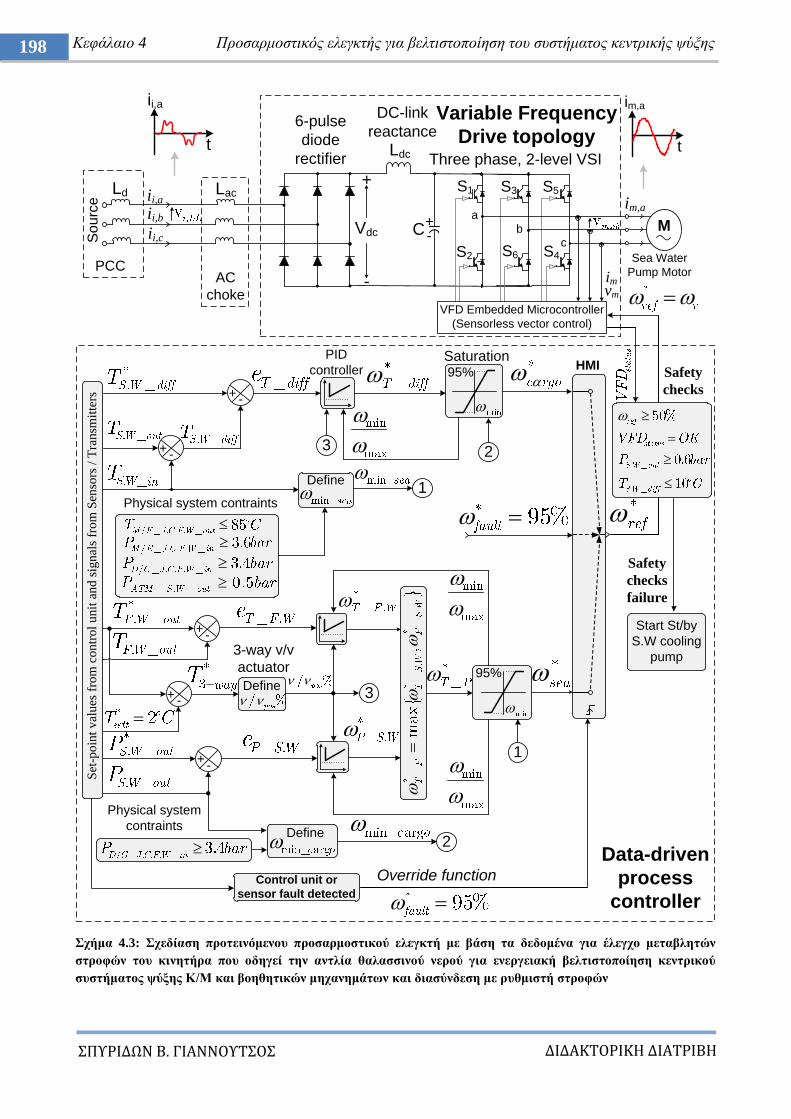
ΔΙΔΑΚΣΟΡΙΚΗ ΔΙΑΣΡΙΒΗ
ΠΤΡΙΔΩΝ Β. ΓΙΑΝΝΟΤΣΟ
198 Κεθάιαην 4 Πξνζαξκνζηηθόο ειεγθηήο γηα βειηηζηνπνίεζε ηνπ ζπζηήκαηνο θεληξηθήο ςύμεο
ρήκα 4.3: ρεδίαζε πξνηεηλόκελνπ πξνζαξκνζηηθνύ ειεγθηή κε βάζε ηα δεδνκέλα γηα έιεγρν κεηαβιεηώλ
ζηξνθώλ ηνπ θηλεηήξα πνπ νδεγεί ηελ αληιία ζαιαζζηλνύ λεξνύ γηα ελεξγεηαθή βειηηζηνπνίεζε θεληξηθνύ
ζπζηήκαηνο ςύμεο Κ/Μ θαη βνεζεηηθώλ κεραλεκάησλ θαη δηαζύλδεζε κε ξπζκηζηή ζηξνθώλ
Ldc
CVdc
+
-
Three phase, 2-level VSI
im,a
S1 S3 S5
S2 S4S6 Sea Water
Pump Motor
6-pulse
diode
rectifier
LacLd
So
urc
e
Variable Frequency
Drive topology
+-
ii,a
ii,b
ii,c
ii,a
t
VFD Embedded Microcontroller
(Sensorless vector control)
DC-link
reactance
PCC
-+
PID
controller
95%
Saturation95%
Set
-po
int
val
ues
fro
m c
on
tro
l u
nit
an
d s
ign
als
fro
m S
enso
rs /
Tra
nsm
itte
rs
HMI
Control unit or
sensor fault detected
imvm
im,a
t
Data-driven
process
controller
AC
choke
Define
Physical system contraints
Define
3-way v/v
actuator
1
1
2Define
2
Physical system
contraints
Override function
-+
-+
-+
-+
Safety
checks
3
3
a
bc
M
Safety
checks
failure
Start St/by
S.W cooling
pump
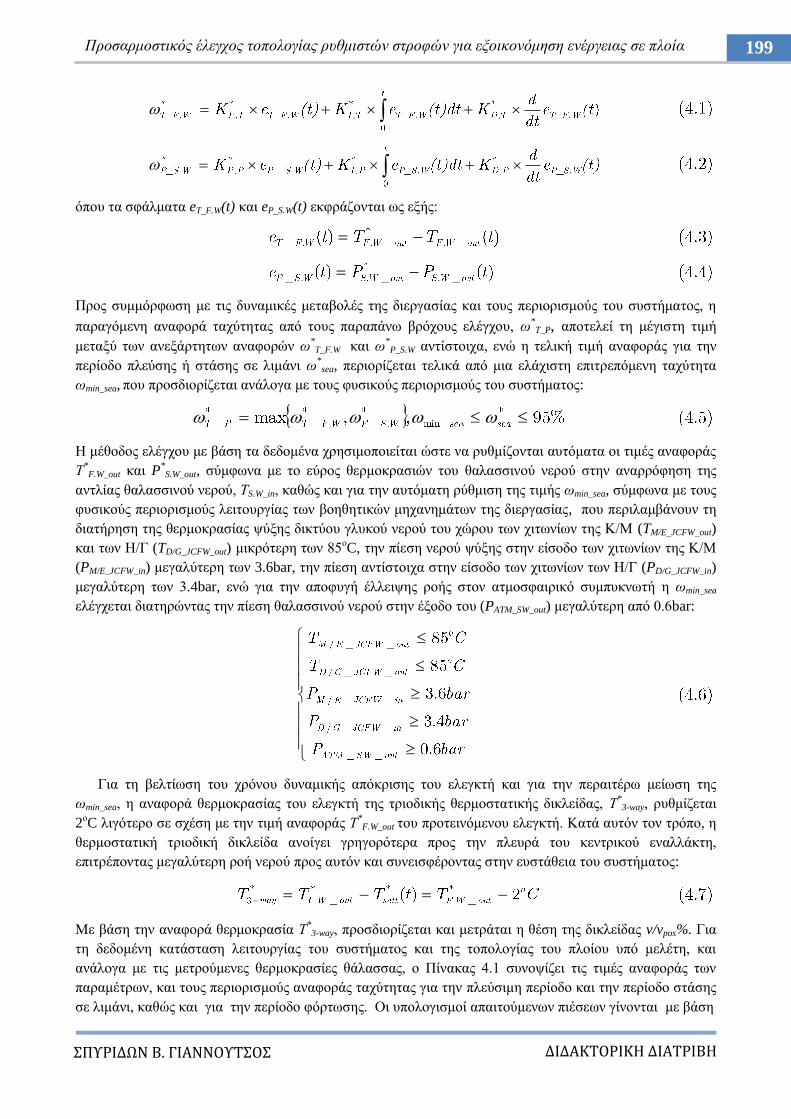
ΔΙΔΑΚΣΟΡΙΚΗ ΔΙΑΣΡΙΒΗ
ΠΤΡΙΔΩΝ Β. ΓΙΑΝΝΟΤΣΟ
199 Πξνζαξκνζηηθόο έιεγρνο ηνπνινγίαο ξπζκηζηώλ ζηξνθώλ γηα εμνηθνλόκεζε ελέξγεηαο ζε πινία
όπνπ ηα ζθάικαηα eT_F.W(t) θαη eP_S.W(t) εθθξάδνληαη σο εμήο:
Πξνο ζπκκόξθσζε κε ηηο δπλακηθέο κεηαβνιέο ηεο δηεξγαζίαο θαη ηνπο πεξηνξηζκνύο ηνπ ζπζηήκαηνο, ε
παξαγόκελε αλαθνξά ηαρύηεηαο από ηνπο παξαπάλσ βξόρνπο ειέγρνπ, σ*T_P, απνηειεί ηε κέγηζηε ηηκή
κεηαμύ ησλ αλεμάξηεησλ αλαθνξώλ σ*T_F.W θαη σ
*P_S.W αληίζηνηρα, ελώ ε ηειηθή ηηκή αλαθνξάο γηα ηελ
πεξίνδν πιεύζεο ή ζηάζεο ζε ιηκάλη σ*sea, πεξηνξίδεηαη ηειηθά από κηα ειάρηζηε επηηξεπόκελε ηαρύηεηα
σmin_sea, πνπ πξνζδηνξίδεηαη αλάινγα κε ηνπο θπζηθνύο πεξηνξηζκνύο ηνπ ζπζηήκαηνο:
Ζ κέζνδνο ειέγρνπ κε βάζε ηα δεδνκέλα ρξεζηκνπνηείηαη ώζηε λα ξπζκίδνληαη απηόκαηα νη ηηκέο αλαθνξάο
Σ*
F.W_out θαη P*S.W_out, ζύκθσλα κε ην εύξνο ζεξκνθξαζηώλ ηνπ ζαιαζζηλνύ λεξνύ ζηελ αλαξξόθεζε ηεο
αληιίαο ζαιαζζηλνύ λεξνύ, ΣS.W_in, θαζώο θαη γηα ηελ απηόκαηε ξύζκηζε ηεο ηηκήο σmin_sea, ζύκθσλα κε ηνπο
θπζηθνύο πεξηνξηζκνύο ιεηηνπξγίαο ησλ βνεζεηηθώλ κεραλεκάησλ ηεο δηεξγαζίαο, πνπ πεξηιακβάλνπλ ηε
δηαηήξεζε ηεο ζεξκνθξαζίαο ςύμεο δηθηύνπ γιπθνύ λεξνύ ηνπ ρώξνπ ησλ ρηησλίσλ ηεο Κ/Μ (TM/E_JCFW_out)
θαη ησλ Ζ/Γ (TD/G_JCFW_out) κηθξόηεξε ησλ 85νC, ηελ πίεζε λεξνύ ςύμεο ζηελ είζνδν ησλ ρηησλίσλ ηεο Κ/Μ
(PM/E_JCFW_in) κεγαιύηεξε ησλ 3.6bar, ηελ πίεζε αληίζηνηρα ζηελ είζνδν ησλ ρηησλίσλ ησλ Ζ/Γ (PD/G_JCFW_in)
κεγαιύηεξε ησλ 3.4bar, ελώ γηα ηελ απνθπγή έιιεηςεο ξνήο ζηνλ αηκνζθαηξηθό ζπκππθλσηή ε σmin_sea
ειέγρεηαη δηαηεξώληαο ηελ πίεζε ζαιαζζηλνύ λεξνύ ζηελ έμνδν ηνπ (PATM_SW_out) κεγαιύηεξε από 0.6bar:
Γηα ηε βειηίσζε ηνπ ρξόλνπ δπλακηθήο απόθξηζεο ηνπ ειεγθηή θαη γηα ηελ πεξαηηέξσ κείσζε ηεο
σmin_sea, ε αλαθνξά ζεξκνθξαζίαο ηνπ ειεγθηή ηεο ηξηνδηθήο ζεξκνζηαηηθήο δηθιείδαο, Σ*
3-way, ξπζκίδεηαη
2νC ιηγόηεξν ζε ζρέζε κε ηελ ηηκή αλαθνξάο Σ
*F.W_out ηνπ πξνηεηλόκελνπ ειεγθηή. Καηά απηόλ ηνλ ηξόπν, ε
ζεξκνζηαηηθή ηξηνδηθή δηθιείδα αλνίγεη γξεγνξόηεξα πξνο ηελ πιεπξά ηνπ θεληξηθνύ ελαιιάθηε,
επηηξέπνληαο κεγαιύηεξε ξνή λεξνύ πξνο απηόλ θαη ζπλεηζθέξνληαο ζηελ επζηάζεηα ηνπ ζπζηήκαηνο:
Με βάζε ηελ αλαθνξά ζεξκνθξαζία Σ*3-way, πξνζδηνξίδεηαη θαη κεηξάηαη ε ζέζε ηεο δηθιείδαο v/vpos%. Γηα
ηε δεδνκέλε θαηάζηαζε ιεηηνπξγίαο ηνπ ζπζηήκαηνο θαη ηεο ηνπνινγίαο ηνπ πινίνπ ππό κειέηε, θαη
αλάινγα κε ηηο κεηξνύκελεο ζεξκνθξαζίεο ζάιαζζαο, ν Πίλαθαο 4.1 ζπλνςίδεη ηηο ηηκέο αλαθνξάο ησλ
παξακέηξσλ, θαη ηνπο πεξηνξηζκνύο αλαθνξάο ηαρύηεηαο γηα ηελ πιεύζηκε πεξίνδν θαη ηελ πεξίνδν ζηάζεο
ζε ιηκάλη, θαζώο θαη γηα ηελ πεξίνδν θόξησζεο. Οη ππνινγηζκνί απαηηνύκελσλ πηέζεσλ γίλνληαη κε βάζε
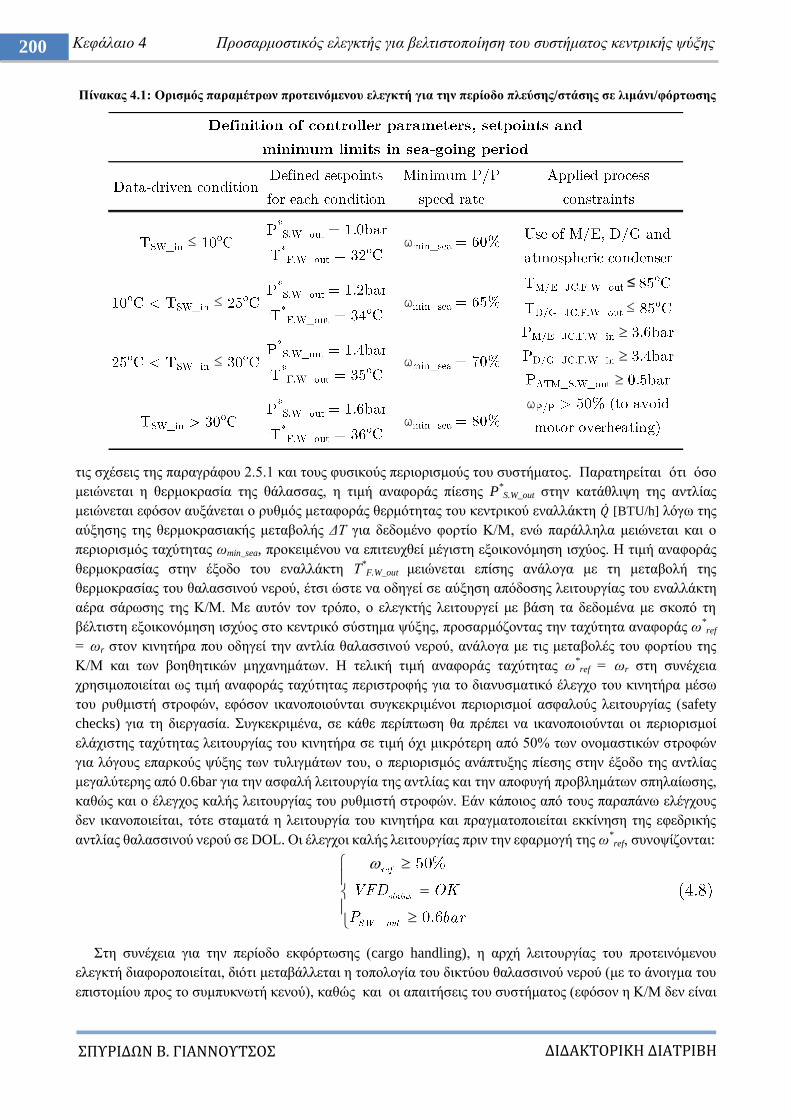
ΔΙΔΑΚΣΟΡΙΚΗ ΔΙΑΣΡΙΒΗ
ΠΤΡΙΔΩΝ Β. ΓΙΑΝΝΟΤΣΟ
200 Κεθάιαην 4 Πξνζαξκνζηηθόο ειεγθηήο γηα βειηηζηνπνίεζε ηνπ ζπζηήκαηνο θεληξηθήο ςύμεο
Πίλαθαο 4.1: Οξηζκόο παξακέηξσλ πξνηεηλόκελνπ ειεγθηή γηα ηελ πεξίνδν πιεύζεο/ζηάζεο ζε ιηκάλη/θόξησζεο
ηηο ζρέζεηο ηεο παξαγξάθνπ 2.5.1 θαη ηνπο θπζηθνύο πεξηνξηζκνύο ηνπ ζπζηήκαηνο. Παξαηεξείηαη όηη όζν
κεηώλεηαη ε ζεξκνθξαζία ηεο ζάιαζζαο, ε ηηκή αλαθνξάο πίεζεο P*S.W_out ζηελ θαηάζιηςε ηεο αληιίαο
κεηώλεηαη εθόζνλ απμάλεηαη ν ξπζκόο κεηαθνξάο ζεξκόηεηαο ηνπ θεληξηθνύ ελαιιάθηε [BTU/h] ιόγσ ηεο
αύμεζεο ηεο ζεξκνθξαζηαθήο κεηαβνιήο ΓΣ γηα δεδνκέλν θνξηίν Κ/Μ, ελώ παξάιιεια κεηώλεηαη θαη ν
πεξηνξηζκόο ηαρύηεηαο σmin_sea, πξνθεηκέλνπ λα επηηεπρζεί κέγηζηε εμνηθνλόκεζε ηζρύνο. Ζ ηηκή αλαθνξάο
ζεξκνθξαζίαο ζηελ έμνδν ηνπ ελαιιάθηε Σ*F.W_out κεηώλεηαη επίζεο αλάινγα κε ηε κεηαβνιή ηεο
ζεξκνθξαζίαο ηνπ ζαιαζζηλνύ λεξνύ, έηζη ώζηε λα νδεγεί ζε αύμεζε απόδνζεο ιεηηνπξγίαο ηνπ ελαιιάθηε
αέξα ζάξσζεο ηεο Κ/Μ. Με απηόλ ηνλ ηξόπν, ν ειεγθηήο ιεηηνπξγεί κε βάζε ηα δεδνκέλα κε ζθνπό ηε
βέιηηζηε εμνηθνλόκεζε ηζρύνο ζην θεληξηθό ζύζηεκα ςύμεο, πξνζαξκόδνληαο ηελ ηαρύηεηα αλαθνξάο σ*ref
= σr ζηνλ θηλεηήξα πνπ νδεγεί ηελ αληιία ζαιαζζηλνύ λεξνύ, αλάινγα κε ηηο κεηαβνιέο ηνπ θνξηίνπ ηεο
Κ/Μ θαη ησλ βνεζεηηθώλ κεραλεκάησλ. H ηειηθή ηηκή αλαθνξάο ηαρύηεηαο σ*
ref = σr ζηε ζπλέρεηα
ρξεζηκνπνηείηαη σο ηηκή αλαθνξάο ηαρύηεηαο πεξηζηξνθήο γηα ην δηαλπζκαηηθό έιεγρν ηνπ θηλεηήξα κέζσ
ηνπ ξπζκηζηή ζηξνθώλ, εθόζνλ ηθαλνπνηνύληαη ζπγθεθξηκέλνη πεξηνξηζκνί αζθαινύο ιεηηνπξγίαο (safety
checks) γηα ηε δηεξγαζία. πγθεθξηκέλα, ζε θάζε πεξίπησζε ζα πξέπεη λα ηθαλνπνηνύληαη νη πεξηνξηζκνί
ειάρηζηεο ηαρύηεηαο ιεηηνπξγίαο ηνπ θηλεηήξα ζε ηηκή όρη κηθξόηεξε από 50% ησλ νλνκαζηηθώλ ζηξνθώλ
γηα ιόγνπο επαξθνύο ςύμεο ησλ ηπιηγκάησλ ηνπ, ν πεξηνξηζκόο αλάπηπμεο πίεζεο ζηελ έμνδν ηεο αληιίαο
κεγαιύηεξεο από 0.6bar γηα ηελ αζθαιή ιεηηνπξγία ηεο αληιίαο θαη ηελ απνθπγή πξνβιεκάησλ ζπειαίσζεο,
θαζώο θαη ν έιεγρνο θαιήο ιεηηνπξγίαο ηνπ ξπζκηζηή ζηξνθώλ. Δάλ θάπνηνο από ηνπο παξαπάλσ ειέγρνπο
δελ ηθαλνπνηείηαη, ηόηε ζηακαηά ε ιεηηνπξγία ηνπ θηλεηήξα θαη πξαγκαηνπνηείηαη εθθίλεζε ηεο εθεδξηθήο
αληιίαο ζαιαζζηλνύ λεξνύ ζε DOL. Οη έιεγρνη θαιήο ιεηηνπξγίαο πξηλ ηελ εθαξκνγή ηεο σ*
ref, ζπλνςίδνληαη:
ηε ζπλέρεηα γηα ηελ πεξίνδν εθθόξησζεο (cargo handling), ε αξρή ιεηηνπξγίαο ηνπ πξνηεηλόκελνπ
ειεγθηή δηαθνξνπνηείηαη, δηόηη κεηαβάιιεηαη ε ηνπνινγία ηνπ δηθηύνπ ζαιαζζηλνύ λεξνύ (κε ην άλνηγκα ηνπ
επηζηνκίνπ πξνο ην ζπκππθλσηή θελνύ), θαζώο θαη νη απαηηήζεηο ηνπ ζπζηήκαηνο (εθόζνλ ε Κ/Μ δελ είλαη
≤ ω
≤ ω
≤ ω
ω
≤
≤
ω
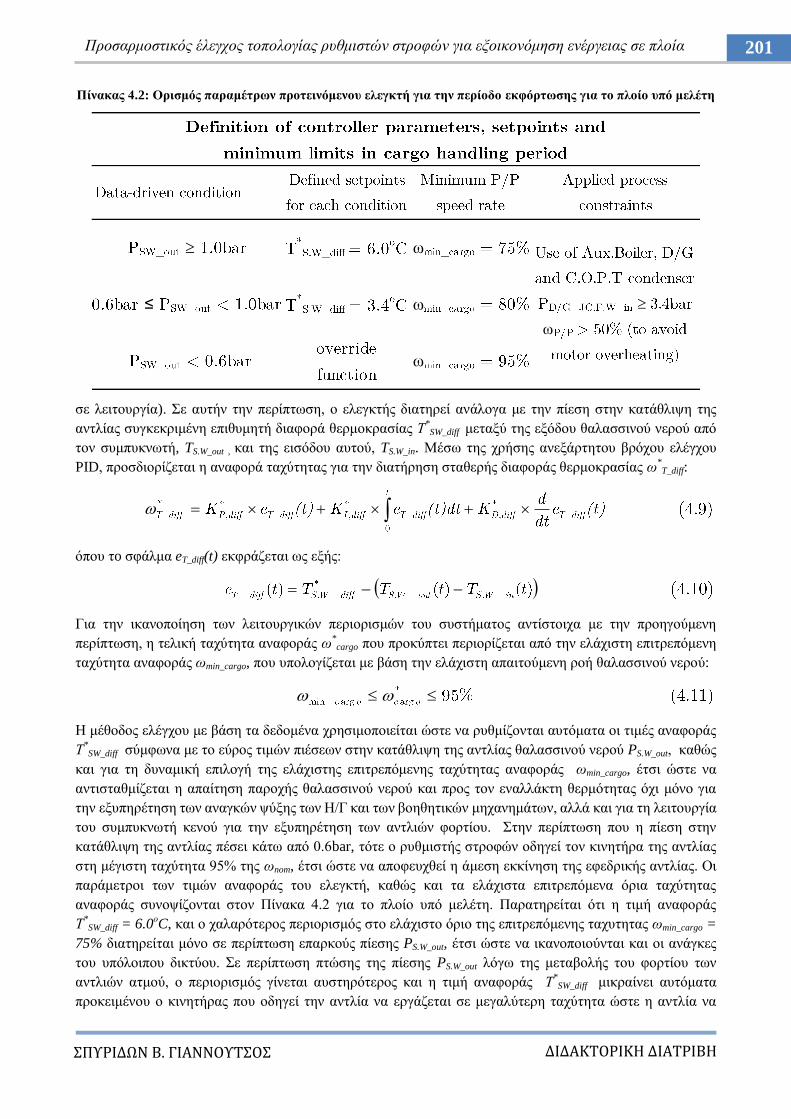
ΔΙΔΑΚΣΟΡΙΚΗ ΔΙΑΣΡΙΒΗ
ΠΤΡΙΔΩΝ Β. ΓΙΑΝΝΟΤΣΟ
201 Πξνζαξκνζηηθόο έιεγρνο ηνπνινγίαο ξπζκηζηώλ ζηξνθώλ γηα εμνηθνλόκεζε ελέξγεηαο ζε πινία
Πίλαθαο 4.2: Οξηζκόο παξακέηξσλ πξνηεηλόκελνπ ειεγθηή γηα ηελ πεξίνδν εθθόξησζεο γηα ην πινίν ππό κειέηε
ζε ιεηηνπξγία). ε απηήλ ηελ πεξίπησζε, ν ειεγθηήο δηαηεξεί αλάινγα κε ηελ πίεζε ζηελ θαηάζιηςε ηεο
αληιίαο ζπγθεθξηκέλε επηζπκεηή δηαθνξά ζεξκνθξαζίαο Σ*SW_diff κεηαμύ ηεο εμόδνπ ζαιαζζηλνύ λεξνύ από
ηνλ ζπκππθλσηή, TS.W_out , θαη ηεο εηζόδνπ απηνύ, TS.W_in. Μέζσ ηεο ρξήζεο αλεμάξηεηνπ βξόρνπ ειέγρνπ
PID, πξνζδηνξίδεηαη ε αλαθνξά ηαρύηεηαο γηα ηελ δηαηήξεζε ζηαζεξήο δηαθνξάο ζεξκνθξαζίαο σ*
T_diff:
όπνπ ηo ζθάικα eT_diff(t) εθθξάδεηαη σο εμήο:
Γηα ηελ ηθαλνπνίεζε ησλ ιεηηνπξγηθώλ πεξηνξηζκώλ ηνπ ζπζηήκαηνο αληίζηνηρα κε ηελ πξνεγνύκελε
πεξίπησζε, ε ηειηθή ηαρύηεηα αλαθνξάο σ*cargo πνπ πξνθύπηεη πεξηνξίδεηαη από ηελ ειάρηζηε επηηξεπόκελε
ηαρύηεηα αλαθνξάο σmin_cargo, πνπ ππνινγίδεηαη κε βάζε ηελ ειάρηζηε απαηηνύκελε ξνή ζαιαζζηλνύ λεξνύ:
Ζ κέζνδνο ειέγρνπ κε βάζε ηα δεδνκέλα ρξεζηκνπνηείηαη ώζηε λα ξπζκίδνληαη απηόκαηα νη ηηκέο αλαθνξάο
Σ*SW_diff ζύκθσλα κε ην εύξνο ηηκώλ πηέζεσλ ζηελ θαηάζιηςε ηεο αληιίαο ζαιαζζηλνύ λεξνύ PS.W_out, θαζώο
θαη γηα ηε δπλακηθή επηινγή ηεο ειάρηζηεο επηηξεπόκελεο ηαρύηεηαο αλαθνξάο σmin_cargo, έηζη ώζηε λα
αληηζηαζκίδεηαη ε απαίηεζε παξνρήο ζαιαζζηλνύ λεξνύ θαη πξνο ηνλ ελαιιάθηε ζεξκόηεηαο όρη κόλν γηα
ηελ εμππεξέηεζε ησλ αλαγθώλ ςύμεο ησλ Ζ/Γ θαη ησλ βνεζεηηθώλ κεραλεκάησλ, αιιά θαη γηα ηε ιεηηνπξγία
ηνπ ζπκππθλσηή θελνύ γηα ηελ εμππεξέηεζε ησλ αληιηώλ θνξηίνπ. ηελ πεξίπησζε πνπ ε πίεζε ζηελ
θαηάζιηςε ηεο αληιίαο πέζεη θάησ από 0.6bar, ηόηε ν ξπζκηζηήο ζηξνθώλ νδεγεί ηνλ θηλεηήξα ηεο αληιίαο
ζηε κέγηζηε ηαρύηεηα 95% ηεο σnom, έηζη ώζηε λα απνθεπρζεί ε άκεζε εθθίλεζε ηεο εθεδξηθήο αληιίαο. Οη
παξάκεηξνη ησλ ηηκώλ αλαθνξάο ηνπ ειεγθηή, θαζώο θαη ηα ειάρηζηα επηηξεπόκελα όξηα ηαρύηεηαο
αλαθνξάο ζπλνςίδνληαη ζηνλ Πίλαθα 4.2 γηα ην πινίν ππό κειέηε. Παξαηεξείηαη όηη ε ηηκή αλαθνξάο
Σ*SW_diff = 6.0
νC, θαη ν ραιαξόηεξνο πεξηνξηζκόο ζην ειάρηζην όξην ηεο επηηξεπόκελεο ηαρπηεηαο σmin_cargo =
75% δηαηεξείηαη κόλν ζε πεξίπησζε επαξθνύο πίεζεο PS.W_out, έηζη ώζηε λα ηθαλνπνηνύληαη θαη νη αλάγθεο
ηνπ ππόινηπνπ δηθηύνπ. ε πεξίπησζε πηώζεο ηεο πίεζεο PS.W_out ιόγσ ηεο κεηαβνιήο ηνπ θνξηίνπ ησλ
αληιηώλ αηκνύ, ν πεξηνξηζκόο γίλεηαη απζηεξόηεξνο θαη ε ηηκή αλαθνξάο Σ*
SW_diff κηθξαίλεη απηόκαηα
πξνθεηκέλνπ ν θηλεηήξαο πνπ νδεγεί ηελ αληιία λα εξγάδεηαη ζε κεγαιύηεξε ηαρύηεηα ώζηε ε αληιία λα
σ
≤ σ
σ
σ
ΔΙΔΑΚΣΟΡΙΚΗ ΔΙΑΣΡΙΒΗ
ΠΤΡΙΔΩΝ Β. ΓΙΑΝΝΟΤΣΟ
202 Κεθάιαην 4 Πξνζαξκνζηηθόο ειεγθηήο γηα βειηηζηνπνίεζε ηνπ ζπζηήκαηνο θεληξηθήο ςύμεο
παξέρεη πεξηζζόηεξε ξνή ζαιαζζηλνύ λεξνύ ζην δίθηπν. Παξάιιεια θαη ζε απηήλ ηελ πεξίπησζε ηζρύεη όηη
ε πίεζε ζηελ είζνδν ησλ ρηησλίσλ ησλ Ζ/Γ (PD/G_JCFW_in) πξέπεη λα δηαηεξείηαη κεγαιύηεξε ησλ 3.4bar.
Ζ ζσζηή ξύζκηζε ησλ παξακέηξσλ ηνπ ειεγθηή PID γηα ηε δηαηήξεζε ηεο πίεζεο ζην δίθηπν ζαιαζζηλνύ
λεξνύ θαηά ηελ πεξίνδν πιεύζεο απνηειεί ζεκαληηθό παξάγνληα, εθόζνλ ην θνξηίν ηεο Κ/Μ κεηαβάιιεηαη
δπλακηθά. ύκθσλα κε πξόζθαηεο κειέηεο ξύζκηζεο ηνπ PID ειεγθηή, ε ξύζκηζε κπνξεί λα γίλεη ζεσξώληαο
ηε γεληθεπκέλε ζπλάξηεζε κεηαθνξάο ηνπ ζπζηήκαηνο, ε νπνία απνηειείηαη από αλαιπηηθέο εθθξάζεηο πνπ
πεξηιακβάλνπλ ηηο παξακέηξνπο ηεο δηεξγαζίαο [20], ή κε κεζόδνπο αζαθνύο ινγηθήο πνπ ρξεζηκνπνηνύλ
ζπλαξηήζεηο επαηζζεζίαο [21]. Πάξνιν πνπ νη παξαπάλσ κέζνδνη νδεγνύλ ζε γξήγνξε απόθξηζε κε θαιά
ραξαθηεξηζηηθά απόδνζεο, πξνϋπνζέηνπλ πιήξε θαη αθξηβή γλώζε ηνπ αλαιπηηθνύ κνληέινπ ηεο δηεξγαζίαο,
απμάλνληαο ηελ ππνινγηζηηθή πνιππινθόηεηα. ηελ ζπγθεθξηκέλε δηεξγαζία ηνπ θεληξηθνύ ζπζηήκαηνο
ςύμεο πνπ εμεηάδεηαη γηα ην πινίν ππό κειέηε, ην ζύζηεκα ππόθεηηαη ζε δπλακηθέο κεηαβνιέο ζηελ
ηνπνινγία ηνπ, θαζώο θαη ζηνλ ηξόπν θαη ηηο παξακέηξνπο ιεηηνπξγίαο ηνπ αλάινγα κε ηηο αιιαγέο ζηε
ιεηνηπξγηθή θαηάζηαζε ηνπ πινίνπ, κε απνηέιεζκα ηα θέξδε ησλ ξπζκηζηώλ ζηνλ πξνηεηλόκελν ειεγθηή λα
απηνξπζκίδνληαη αλάινγα κε ηηο ηηκέο πνπ ιακβάλνληαη ζε πξαγκαηηθό ρξόλν από ηηο αξγά κεηαβαιιόκελεο
ηηκέο ηεο ζεξκνθξαζίαο θαη γξεγνξόηεξα κεηαβαιιόκελεο ηηκέο ηεο πίεζεο.
Πην ζπγθεθξηκέλα, ζηνλ πξνηεηλόκελν έιεγρν ε ειάρηζηε επηηξεπόκελε ηαρύηεηα αλαθνξάο σmin, νξίδεηαη
δπλακηθά αλάινγα κε ηηο απαηηήζεηο θαη ηνπο θπζηθνύο πεξηνξηζκνύο ηεο δηεξγαζίαο γηα θάζε θαηάζηαζε
ιεηηνπξγίαο. ε απηήλ ηελ πεξίπησζε, ν ιόγνο σmin/σmax κπνξεί λα ρξεζηκνπνηεζεί γηα ηελ απηνξύζκηζε ηνπ
αλαινγηθνύ θέξδνπο Κ*
P ηνπ PID ειεγθηή. Μηθξόηεξε ηηκή σmin έρεη σο απνηέιεζκα κηθξόηεξε παξνρή θαη
πίεζε ζαιαζζηλνύ λεξνύ ζην ζύζηεκα, νδεγώληαο ζηελ αλάγθε αύμεζεο ηνπ ρξόλνπ ππεξύςσζεο θαη
κείσζεο ηνπ πνζνζηνύ ππεξύςσζεο κεηώλνληαο ην ζπληειεζηή Κ*
P, έηζη ώζηε λα πξνζηαηεπηεί ε δηεξγαζία
από μαθληθέο θνξπθέο πνπ κπνξεί λα εκθαληζηνύλ ζηελ πίεζε ζαιαζζηλνύ λεξνύ ζηελ θαηάζιηςε ηεο
αληιίαο από ηελ αιιαγή ηεο ηηκήο ηεο ηαρύηεηαο αλαθνξάο θαη αληίζηξνθα. Δπηπιένλ, ε ζέζε ηεο ηξηνδηθήο
ζεξκνζηαηηθήο δηθιείδαο v/vpos% πνπ θαζνξίδεηαη από ηελ ηηκή αλαθνξάο Σ*
F.W_out, ρξεζηκνπνηείηαη γηα ηε
ξύζκηζε ηνπ δηαθνξηθνύ ζπληειεζηή K*D ηνπ PID ειεγθηή. ηελ πεξίπησζε πνπ ε ζεξκνζηαηηθή δηθιείδα
αλνίγεη πξνο ηελ πιεπξά ηνπ θεληξηθνύ ελαιιάθηε, ε ηηκή v/vpos% κεηώλεηαη, πξνζθέξνληαο ηελ δπλαηόηεηα
αύμεζεο ηνπ K*
D ώζηε λα κεησζεί ην αληίζηνηρν πνζνζηό ππεξύςσζεο θαη ν ρξόλνο απνθαηάζηαζεο ζηελ
απόθξηζε ηνπ ειεγθηή, ζπλεηζθέξνληαο ζηελ επζηάζεηα ηνπ ζπζηήκαηνο. Γηαθνξνπνηώληαο ηε κέζνδν
Ziegler-Nichols [22]-[23], ηα παξαπάλσ ραξαθηεξηζηηθά ελζσκαηώλνληαη ώζηε λα απμήζνπλ ηελ απόδνζε
ηεο απόθξηζεο. Ζ ξύζκηζε ησλ θεξδώλ ηνπ ειεγθηή κε βάζε ηα δεδνκέλα ζπλνςίδεηαη παξαθάησ:
όπνπ Κu είλαη ην απόιπην θέξδνο ηνπ ειεγθηή όηαλ ε έμνδνο ηαιαληώλεηαη ζε ζηαζεξό πιάηνο γηα πεξίνδν
Σu. Γηα ηελ αξρηθή ξύζκηζε ηνπ ειεγθηή, ε αληιία ιεηηνπξγεί ζην σmax = 95%, ελώ v/vpos% = 100%.
ηνλ ειεγθηή ελζσκαηώλεηαη ιεηηνπξγία απόθξηζεο ζηελ πεξίπησζε ζθάικαηνο είηε ζε θάπνην
αηζζεηήξα, είηε ζην ζύζηεκα ειέγρνπ είηε ζθάικα ζηελ επηθνηλσλία κε ην ξπζκηζηή ζηξνθώλ. ε απηέο ηηο
πεξηπηώζεηο ε ηηκή αλαθνξάο ηαρύηεηαο πεξηζηξνθήο πξνο ηνλ θηλεηήξα ζα είλαη σ*
ref = σ*
fault = 95%. ε
πεξίπησζε νιηθήο βιάβεο ηνπ ζπζηήκαηνο ειέγρνπ θαη ηεο νζόλεο δηεπαθήο, ε εληνιή αλαθνξάο ηαρύηεηαο
πεξηζηξνθήο δίλεηαη ζην ξπζκηζηή ζηξνθώλ απεπζείαο θαη ρεηξνθίλεηα κέζσ πνηελζηνκέηξνπ. Ο αιγόξηζκνο
ιεηηνπξγίαο πνπ ελζσκαηώλεηαη ζηνλ πξνηεηλόκελν ειεγθηή παξνπζηάδεηαη ζην ρ. 4.4 σο αθνινπζηαθό
δηάγξακκα ξνήο (sequential function chart – SFC), όπνπ θαίλεηαη ν πξώηνο θύθινο ιεηηνπξγίαο ηνπ
ζπζηήκαηνο, ελώ ην δηάγξακκα ξνήο ηνπ ρ. 4.5 δείρλεη ηελ απόθξηζε ζε δηάθνξεο ζπλζήθεο ιεηηνπξγίαο.
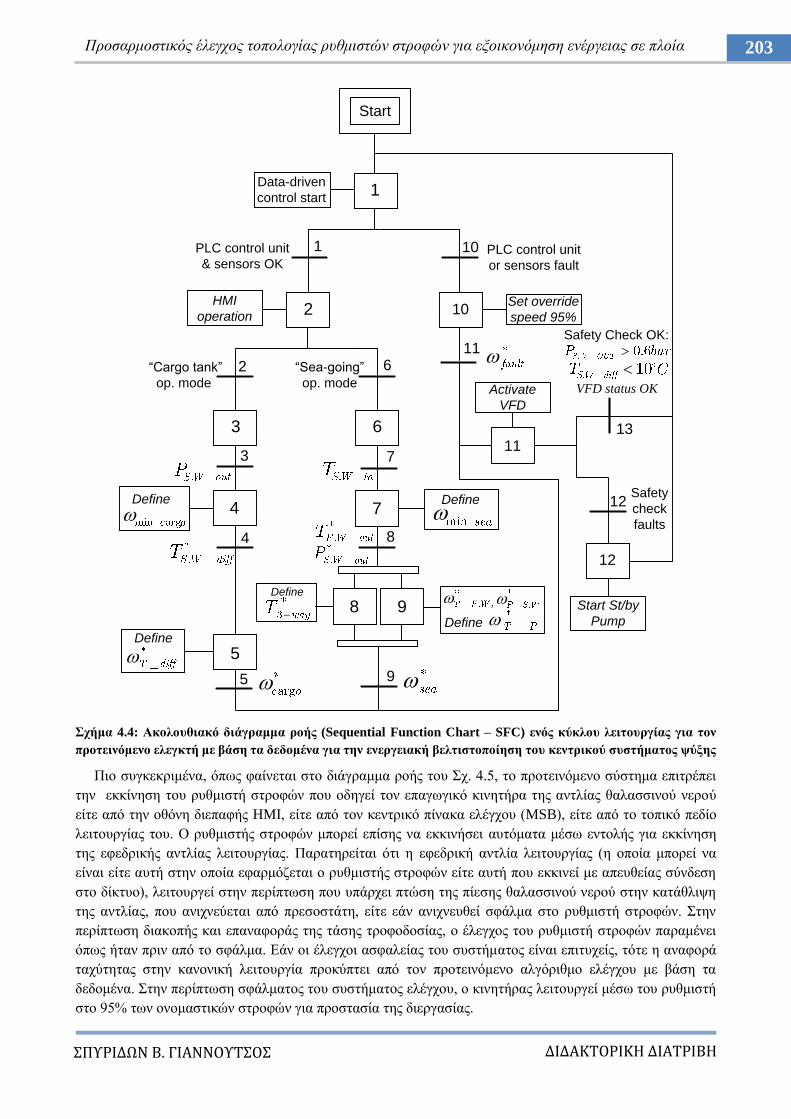
ΔΙΔΑΚΣΟΡΙΚΗ ΔΙΑΣΡΙΒΗ
ΠΤΡΙΔΩΝ Β. ΓΙΑΝΝΟΤΣΟ
203 Πξνζαξκνζηηθόο έιεγρνο ηνπνινγίαο ξπζκηζηώλ ζηξνθώλ γηα εμνηθνλόκεζε ελέξγεηαο ζε πινία
ρήκα 4.4: Αθνινπζηαθό δηάγξακκα ξνήο (Sequential Function Chart – SFC) ελόο θύθινπ ιεηηνπξγίαο γηα ηνλ
πξνηεηλόκελν ειεγθηή κε βάζε ηα δεδνκέλα γηα ηελ ελεξγεηαθή βειηηζηνπνίεζε ηνπ θεληξηθνύ ζπζηήκαηνο ςύμεο
Πην ζπγθεθξηκέλα, όπσο θαίλεηαη ζην δηάγξακκα ξνήο ηνπ ρ. 4.5, ην πξνηεηλόκελν ζύζηεκα επηηξέπεη
ηελ εθθίλεζε ηνπ ξπζκηζηή ζηξνθώλ πνπ νδεγεί ηνλ επαγσγηθό θηλεηήξα ηεο αληιίαο ζαιαζζηλνύ λεξνύ
είηε από ηελ νζόλε δηεπαθήο HMI, είηε από ηνλ θεληξηθό πίλαθα ειέγρνπ (MSB), είηε από ην ηνπηθό πεδίν
ιεηηνπξγίαο ηνπ. Ο ξπζκηζηήο ζηξνθώλ κπνξεί επίζεο λα εθθηλήζεη απηόκαηα κέζσ εληνιήο γηα εθθίλεζε
ηεο εθεδξηθήο αληιίαο ιεηηνπξγίαο. Παξαηεξείηαη όηη ε εθεδξηθή αληιία ιεηηνπξγίαο (ε νπνία κπνξεί λα
είλαη είηε απηή ζηελ νπνία εθαξκόδεηαη ν ξπζκηζηήο ζηξνθώλ είηε απηή πνπ εθθηλεί κε απεπζείαο ζύλδεζε
ζην δίθηπν), ιεηηνπξγεί ζηελ πεξίπησζε πνπ ππάξρεη πηώζε ηεο πίεζεο ζαιαζζηλνύ λεξνύ ζηελ θαηάζιηςε
ηεο αληιίαο, πνπ αληρλεύεηαη από πξεζνζηάηε, είηε εάλ αληρλεπζεί ζθάικα ζην ξπζκηζηή ζηξνθώλ. ηελ
πεξίπησζε δηαθνπήο θαη επαλαθνξάο ηεο ηάζεο ηξνθνδνζίαο, ν έιεγρνο ηνπ ξπζκηζηή ζηξνθώλ παξακέλεη
όπσο ήηαλ πξηλ από ην ζθάικα. Δάλ νη έιεγρνη αζθαιείαο ηνπ ζπζηήκαηνο είλαη επηηπρείο, ηόηε ε αλαθνξά
ηαρύηεηαο ζηελ θαλνληθή ιεηηνπξγία πξνθύπηεη από ηνλ πξνηεηλόκελν αιγόξηζκν ειέγρνπ κε βάζε ηα
δεδνκέλα. ηελ πεξίπησζε ζθάικαηνο ηνπ ζπζηήκαηνο ειέγρνπ, ν θηλεηήξαο ιεηηνπξγεί κέζσ ηνπ ξπζκηζηή
ζην 95% ησλ νλνκαζηηθώλ ζηξνθώλ γηα πξνζηαζία ηεο δηεξγαζίαο.
Start
1Data-driven
control start
1 10PLC control unit
& sensors OKPLC control unit
or sensors fault
2HMI
operation10
Set override
speed 95%
11
Activate
VFD
―Cargo tank‖
op. mode
―Sea-going‖
op. mode
Define
Define
Define
Define
Define
Start St/by
Pump
Safety Check OK:
VFD status OK
Safety
check
faults
6
7
8
3
4
5
9
12
2
3
4
5
6
7
8
9
11
12
13
,
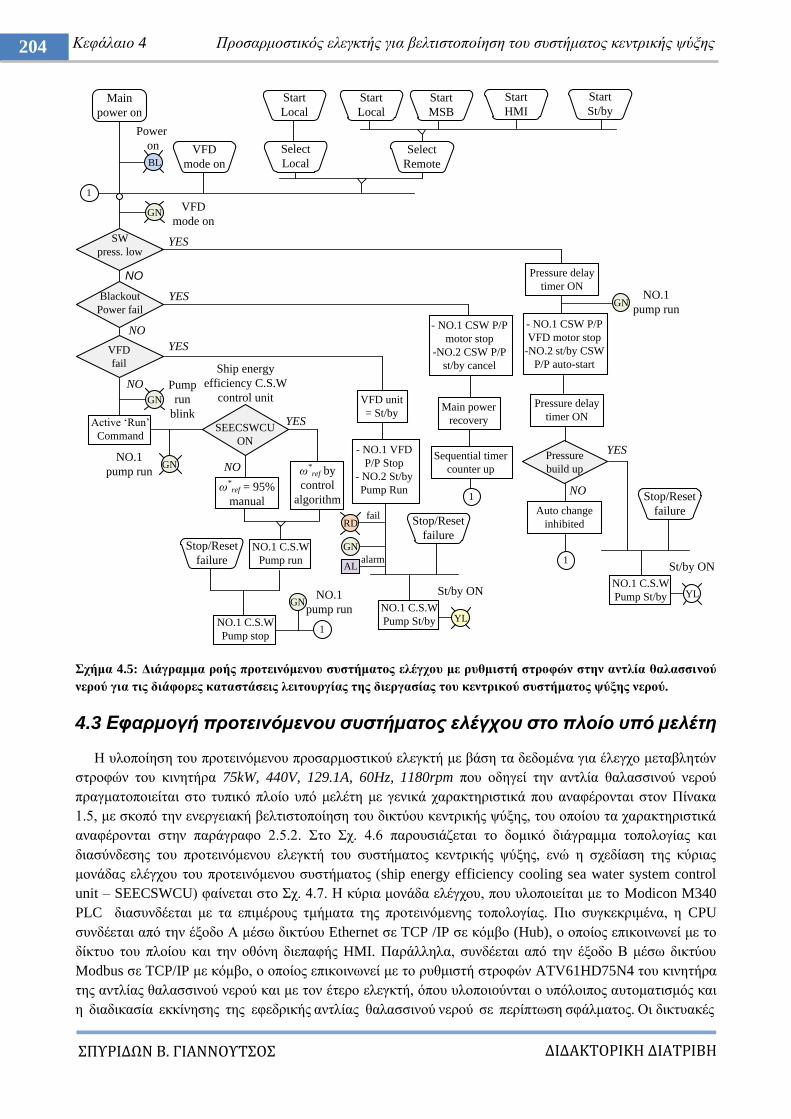
ΔΙΔΑΚΣΟΡΙΚΗ ΔΙΑΣΡΙΒΗ
ΠΤΡΙΔΩΝ Β. ΓΙΑΝΝΟΤΣΟ
204 Κεθάιαην 4 Πξνζαξκνζηηθόο ειεγθηήο γηα βειηηζηνπνίεζε ηνπ ζπζηήκαηνο θεληξηθήο ςύμεο
ρήκα 4.5: Γηάγξακκα ξνήο πξνηεηλόκελνπ ζπζηήκαηνο ειέγρνπ κε ξπζκηζηή ζηξνθώλ ζηελ αληιία ζαιαζζηλνύ
λεξνύ γηα ηηο δηάθνξεο θαηαζηάζεηο ιεηηνπξγίαο ηεο δηεξγαζίαο ηνπ θεληξηθνύ ζπζηήκαηνο ςύμεο λεξνύ.
4.3 Δθαπμογή πποηεινόμενος ζςζηήμαηορ ελέγσος ζηο πλοίο ςπό μελέηη
Ζ πινπνίεζε ηνπ πξνηεηλόκελνπ πξνζαξκνζηηθνύ ειεγθηή κε βάζε ηα δεδνκέλα γηα έιεγρν κεηαβιεηώλ
ζηξνθώλ ηνπ θηλεηήξα 75kW, 440V, 129.1A, 60Hz, 1180rpm πνπ νδεγεί ηελ αληιία ζαιαζζηλνύ λεξνύ
πξαγκαηνπνηείηαη ζην ηππηθό πινίν ππό κειέηε κε γεληθά ραξαθηεξηζηηθά πνπ αλαθέξνληαη ζηνλ Πίλαθα
1.5, κε ζθνπό ηελ ελεξγεηαθή βειηηζηνπνίεζε ηνπ δηθηύνπ θεληξηθήο ςύμεο, ηνπ νπνίνπ ηα ραξαθηεξηζηηθά
αλαθέξνληαη ζηελ παξάγξαθν 2.5.2. ην ρ. 4.6 παξνπζηάδεηαη ην δνκηθό δηάγξακκα ηνπνινγίαο θαη
δηαζύλδεζεο ηνπ πξνηεηλόκελνπ ειεγθηή ηνπ ζπζηήκαηνο θεληξηθήο ςύμεο, ελώ ε ζρεδίαζε ηεο θύξηαο
κνλάδαο ειέγρνπ ηνπ πξνηεηλόκελνπ ζπζηήκαηνο (ship energy efficiency cooling sea water system control
unit – SEECSWCU) θαίλεηαη ζην ρ. 4.7. Ζ θύξηα κνλάδα ειέγρνπ, πνπ πινπνηείηαη κε ην Modicon M340
PLC δηαζπλδέεηαη κε ηα επηκέξνπο ηκήκαηα ηεο πξνηεηλόκελεο ηνπνινγίαο. Πην ζπγθεθξηκέλα, ε CPU
ζπλδέεηαη από ηελ έμνδν Α κέζσ δηθηύνπ Ethernet ζε TCP /IP ζε θόκβν (Hub), ν νπνίνο επηθνηλσλεί κε ην
δίθηπν ηνπ πινίνπ θαη ηελ νζόλε δηεπαθήο HMI. Παξάιιεια, ζπλδέεηαη από ηελ έμνδν Β κέζσ δηθηύνπ
Modbus ζε TCP/IP κε θόκβν, ν νπνίνο επηθνηλσλεί κε ην ξπζκηζηή ζηξνθώλ ATV61HD75N4 ηνπ θηλεηήξα
ηεο αληιίαο ζαιαζζηλνύ λεξνύ θαη κε ηνλ έηεξν ειεγθηή, όπνπ πινπνηoύληαη ν ππόινηπνο απηνκαηηζκόο θαη
ε δηαδηθαζία εθθίλεζεο ηεο εθεδξηθήο αληιίαο ζαιαζζηλνύ λεξνύ ζε πεξίπησζε ζθάικαηνο. Οη δηθηπαθέο
Main
power on
BL
VFD
mode on
Start
Local
Select
Local
Start
MSB
Start
HMI
Start
St/by
Select
Remote
GN
SW
press. low
Blackout
Power fail
VFD
fail
VFD
mode on
Power
on
YES
NO
NO
YES
NO
YES
Active „Run‟
Command
GN
Pump
run
blink
GNNO.1
pump run
SEECSWCU
ON
Ship energy
efficiency C.S.W
control unit
NO
YES
σ*ref = 95%
manual
σ*ref by
control
algorithm
NO.1 C.S.W
Pump run
1
Stop/Reset
failure
GN
NO.1 C.S.W
Pump stop1
NO.1
pump run
VFD unit
= St/by
- NO.1 VFD
P/P Stop
- NO.2 St/by
Pump Run
Stop/Reset
failureRD
GN
fail
ALalarm
NO.1 C.S.W
Pump St/by YL
St/by ON
- NO.1 CSW P/P
motor stop
-NO.2 CSW P/P
st/by cancel
Main power
recovery
Sequential timer
counter up
1
Pressure delay
timer ON
- NO.1 CSW P/P
VFD motor stop
-NO.2 st/by CSW
P/P auto-start
GNNO.1
pump run
Pressure delay
timer ON
Pressure
build up
Auto change
inhibited
YES
NOStop/Reset
failure
NO.1 C.S.W
Pump St/by YL
St/by ON1
Start
Local
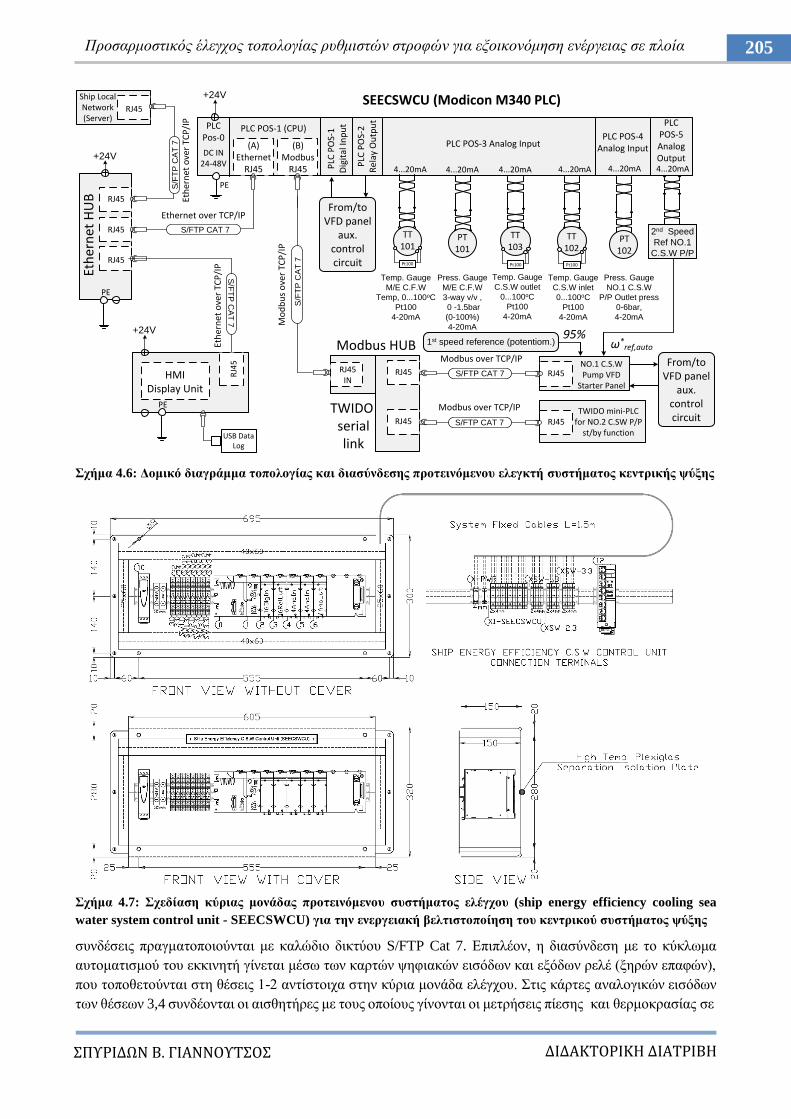
ΔΙΔΑΚΣΟΡΙΚΗ ΔΙΑΣΡΙΒΗ
ΠΤΡΙΔΩΝ Β. ΓΙΑΝΝΟΤΣΟ
205 Πξνζαξκνζηηθόο έιεγρνο ηνπνινγίαο ξπζκηζηώλ ζηξνθώλ γηα εμνηθνλόκεζε ελέξγεηαο ζε πινία
ρήκα 4.6: Γνκηθό δηαγξάκκα ηνπνινγίαο θαη δηαζύλδεζεο πξνηεηλόκελνπ ειεγθηή ζπζηήκαηνο θεληξηθήο ςύμεο
ρήκα 4.7: ρεδίαζε θύξηαο κνλάδαο πξνηεηλόκελνπ ζπζηήκαηνο ειέγρνπ (ship energy efficiency cooling sea
water system control unit - SEECSWCU) γηα ηελ ελεξγεηαθή βειηηζηνπνίεζε ηνπ θεληξηθνύ ζπζηήκαηνο ςύμεο
ζπλδέζεηο πξαγκαηνπνηνύληαη κε θαιώδην δηθηύνπ S/FTP Cat 7. Δπηπιένλ, ε δηαζύλδεζε κε ην θύθισκα
απηνκαηηζκνύ ηνπ εθθηλεηή γίλεηαη κέζσ ησλ θαξηώλ ςεθηαθώλ εηζόδσλ θαη εμόδσλ ξειέ (μεξώλ επαθώλ),
πνπ ηνπνζεηνύληαη ζηε ζέζεηο 1-2 αληίζηνηρα ζηελ θύξηα κνλάδα ειέγρνπ. ηηο θάξηεο αλαινγηθώλ εηζόδσλ
ησλ ζέζεσλ 3,4 ζπλδένληαη νη αηζζεηήξεο κε ηνπο νπνίνπο γίλνληαη νη κεηξήζεηο πίεζεο θαη ζεξκνθξαζίαο ζε
DC IN24-48V
PLC Pos-0
PLC POS-1 (CPU)
S/F
TP
CA
T 7
RJ45IN
S/FTP CAT 7 RJ45NO.1 C.S.W Pump VFD
Starter Panel
PE
Modbus HUB
Modbus over TCP/IP
RJ45
RJ45
RJ45
PE
Eth
ern
et H
UB
S/F
TP
CA
T 7
RJ45
Ship Local Network (Server)
S/F
TP
CA
T 7
S/FTP CAT 7R
J45
HMI Display Unit
PE
Ethernet over TCP/IP
Eth
ern
et o
ver
TCP
/IP
Eth
ern
et o
ver
TCP
/IP
USB Data Log
+24V
+24V
+24V
TT101
PT101
PT102
(A)Ethernet
RJ45
(B)Modbus
RJ45
PLC POS-3 Analog Input
4...20mA 4...20mA 4...20mA 4...20mA
PLC POS-5 Analog Output 4...20mA
Pt100
Temp. Gauge
M/E C.F.W
Temp, 0...100oC
Pt100
4-20mA
Press. Gauge
M/E C.F.W
3-way v/v ,
0 -1.5bar
(0-100%)
4-20mA
Press. Gauge
NO.1 C.S.W
P/P Outlet press
0-6bar,
4-20mA
Mo
db
us
ove
r TC
P/I
P
SEECSWCU (Modicon M340 PLC)
4...20mA
TT103
Pt100
Temp. Gauge
C.S.W outlet
0...100oC
Pt100
4-20mA
Pt100
TT102
Temp. Gauge
C.S.W inlet
0...100oC
Pt100
4-20mA
PLC
PO
S-1
D
igit
al In
pu
t
PLC
PO
S-2
R
elay
Ou
tpu
t
From/toVFD panel
aux. control circuit
RJ45
PLC POS-4 Analog Input
2nd Speed
Ref NO.1
C.S.W P/P
From/toVFD panel
aux. control circuitRJ45 S/FTP CAT 7 RJ45
TWIDO mini-PLC for NO.2 C.SW P/P
st/by function
Modbus over TCP/IP
TWIDO serial link
1st speed reference (potentiom.) ω*ref,auto
95%
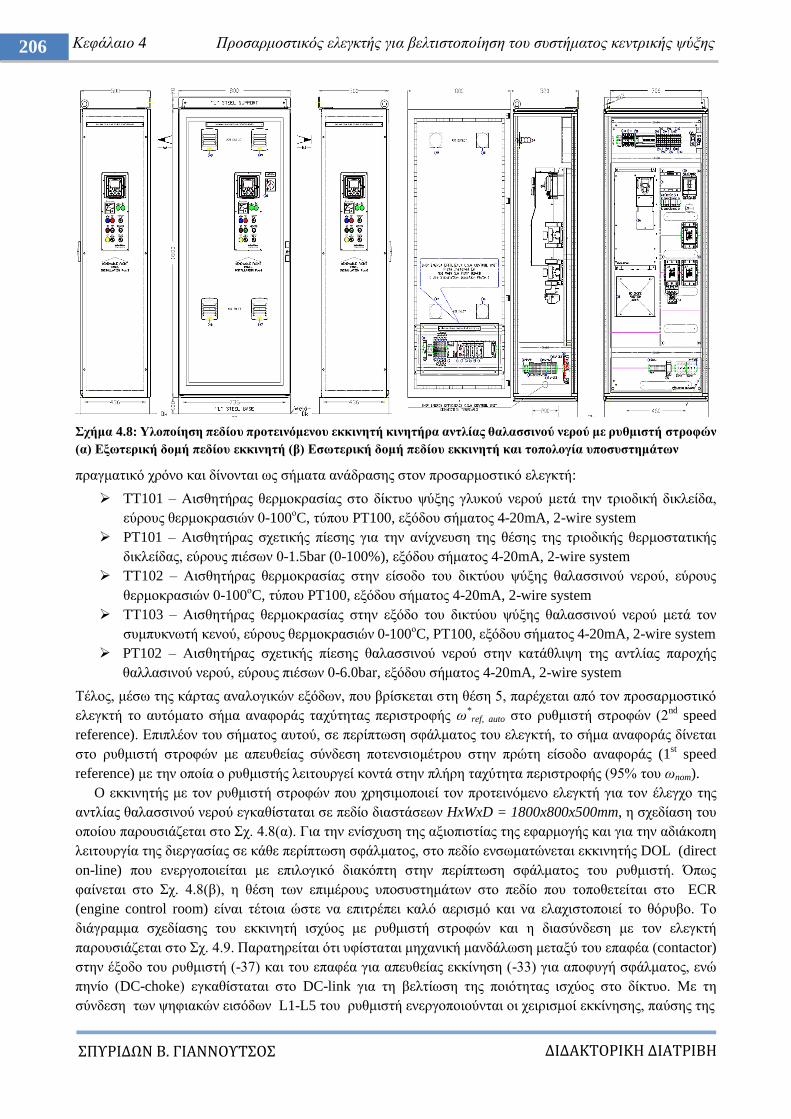
ΔΙΔΑΚΣΟΡΙΚΗ ΔΙΑΣΡΙΒΗ
ΠΤΡΙΔΩΝ Β. ΓΙΑΝΝΟΤΣΟ
206 Κεθάιαην 4 Πξνζαξκνζηηθόο ειεγθηήο γηα βειηηζηνπνίεζε ηνπ ζπζηήκαηνο θεληξηθήο ςύμεο
ρήκα 4.8: Τινπνίεζε πεδίνπ πξνηεηλόκελνπ εθθηλεηή θηλεηήξα αληιίαο ζαιαζζηλνύ λεξνύ κε ξπζκηζηή ζηξνθώλ
(α) Δμσηεξηθή δνκή πεδίνπ εθθηλεηή (β) Δζσηεξηθή δνκή πεδίνπ εθθηλεηή θαη ηνπνινγία ππνζπζηεκάησλ
πξαγκαηηθό ρξόλν θαη δίλνληαη σο ζήκαηα αλάδξαζεο ζηνλ πξνζαξκνζηηθό ειεγθηή:
TT101 – Αηζζεηήξαο ζεξκνθξαζίαο ζην δίθηπν ςύμεο γιπθνύ λεξνύ κεηά ηελ ηξηνδηθή δηθιείδα,
εύξνπο ζεξκνθξαζηώλ 0-100νC, ηύπνπ PT100, εμόδνπ ζήκαηνο 4-20mA, 2-wire system
PT101 – Αηζζεηήξαο ζρεηηθήο πίεζεο γηα ηελ αλίρλεπζε ηεο ζέζεο ηεο ηξηνδηθήο ζεξκνζηαηηθήο
δηθιείδαο, εύξνπο πηέζσλ 0-1.5bar (0-100%), εμόδνπ ζήκαηνο 4-20mA, 2-wire system
TT102 – Αηζζεηήξαο ζεξκνθξαζίαο ζηελ είζνδν ηνπ δηθηύνπ ςύμεο ζαιαζζηλνύ λεξνύ, εύξνπο
ζεξκνθξαζηώλ 0-100νC, ηύπνπ PT100, εμόδνπ ζήκαηνο 4-20mA, 2-wire system
TT103 – Αηζζεηήξαο ζεξκνθξαζίαο ζηελ εμόδν ηνπ δηθηύνπ ςύμεο ζαιαζζηλνύ λεξνύ κεηά ηνλ
ζπκππθλσηή θελνύ, εύξνπο ζεξκνθξαζηώλ 0-100νC, PT100, εμόδνπ ζήκαηνο 4-20mA, 2-wire system
PT102 – Αηζζεηήξαο ζρεηηθήο πίεζεο ζαιαζζηλνύ λεξνύ ζηελ θαηάζιηςε ηεο αληιίαο παξνρήο
ζαιιαζηλνύ λεξνύ, εύξνπο πηέζσλ 0-6.0bar, εμόδνπ ζήκαηνο 4-20mA, 2-wire system
Σέινο, κέζσ ηεο θάξηαο αλαινγηθώλ εμόδσλ, πνπ βξίζθεηαη ζηε ζέζε 5, παξέρεηαη από ηνλ πξνζαξκνζηηθό
ειεγθηή ην απηόκαην ζήκα αλαθνξάο ηαρύηεηαο πεξηζηξνθήο σ*ref, auto ζην ξπζκηζηή ζηξνθώλ (2
nd speed
reference). Δπηπιένλ ηνπ ζήκαηνο απηνύ, ζε πεξίπησζε ζθάικαηνο ηνπ ειεγθηή, ην ζήκα αλαθνξάο δίλεηαη
ζην ξπζκηζηή ζηξνθώλ κε απεπζείαο ζύλδεζε πνηελζηoκέηξνπ ζηελ πξώηε είζνδν αλαθνξάο (1st speed
reference) κε ηελ νπνία ν ξπζκηζηήο ιεηηνπξγεί θνληά ζηελ πιήξε ηαρύηεηα πεξηζηξνθήο (95% ηνπ σnom).
O εθθηλεηήο κε ηνλ ξπζκηζηή ζηξνθώλ πνπ ρξεζηκνπνηεί ηνλ πξνηεηλόκελν ειεγθηή γηα ηνλ έιεγρν ηεο
αληιίαο ζαιαζζηλνύ λεξνύ εγθαζίζηαηαη ζε πεδίν δηαζηάζεσλ HxWxD = 1800x800x500mm, ε ζρεδίαζε ηνπ
νπνίνπ παξνπζηάδεηαη ζην ρ. 4.8(α). Γηα ηελ ελίζρπζε ηεο αμηνπηζηίαο ηεο εθαξκνγήο θαη γηα ηελ αδηάθνπε
ιεηηνπξγία ηεο δηεξγαζίαο ζε θάζε πεξίπησζε ζθάικαηνο, ζην πεδίν ελζσκαηώλεηαη εθθηλεηήο DOL (direct
on-line) πνπ ελεξγνπνηείηαη κε επηινγηθό δηαθόπηε ζηελ πεξίπησζε ζθάικαηνο ηνπ ξπζκηζηή. Όπσο
θαίλεηαη ζην ρ. 4.8(β), ε ζέζε ησλ επηκέξνπο ππνζπζηεκάησλ ζην πεδίν πνπ ηνπνζεηείηαη ζην ECR
(engine control room) είλαη ηέηνηα ώζηε λα επηηξέπεη θαιό αεξηζκό θαη λα ειαρηζηνπνηεί ην ζόξπβν. Σν
δηάγξακκα ζρεδίαζεο ηνπ εθθηλεηή ηζρύνο κε ξπζκηζηή ζηξνθώλ θαη ε δηαζύλδεζε κε ηνλ ειεγθηή
παξνπζηάδεηαη ζην ρ. 4.9. Παξαηεξείηαη όηη πθίζηαηαη κεραληθή καλδάισζε κεηαμύ ηνπ επαθέα (contactor)
ζηελ έμνδν ηνπ ξπζκηζηή (-37) θαη ηνπ επαθέα γηα απεπζείαο εθθίλεζε (-33) γηα απνθπγή ζθάικαηνο, ελώ
πελίν (DC-choke) εγθαζίζηαηαη ζην DC-link γηα ηε βειηίσζε ηεο πνηόηεηαο ηζρύνο ζην δίθηπν. Με ηε
ζύλδεζε ησλ ςεθηαθώλ εηζόδσλ L1-L5 ηνπ ξπζκηζηή ελεξγνπνηνύληαη νη ρεηξηζκνί εθθίλεζεο, παύζεο ηεο
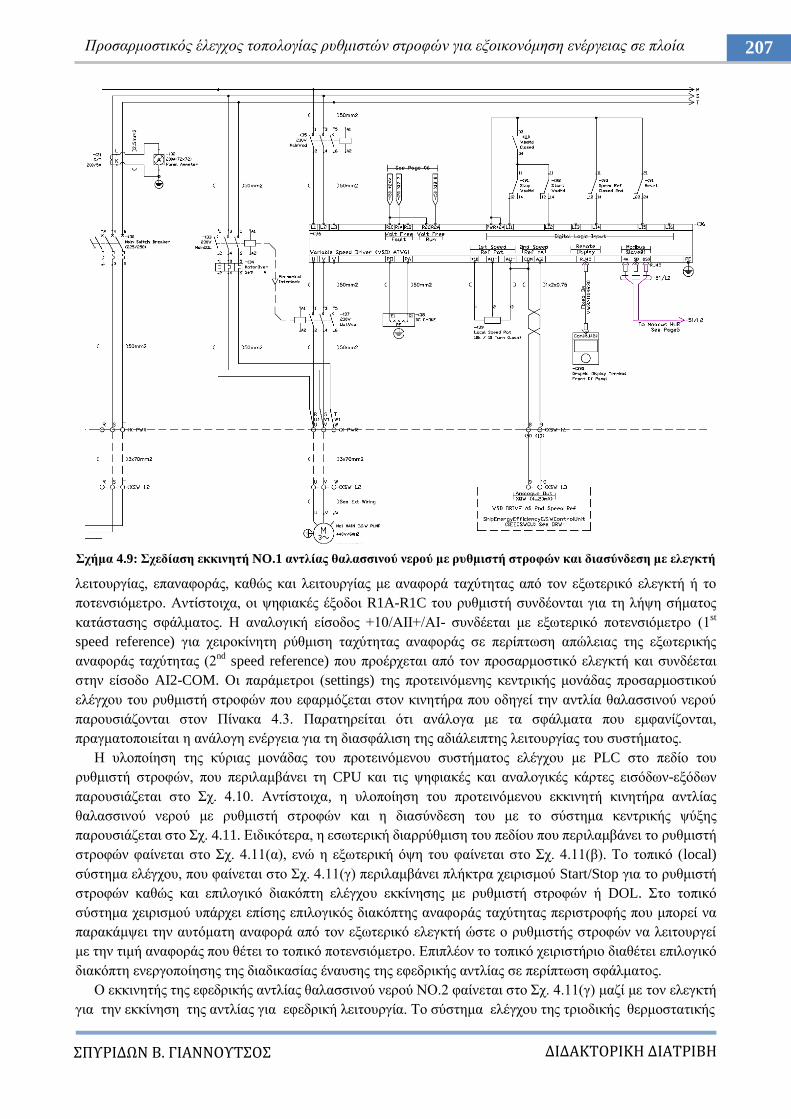
ΔΙΔΑΚΣΟΡΙΚΗ ΔΙΑΣΡΙΒΗ
ΠΤΡΙΔΩΝ Β. ΓΙΑΝΝΟΤΣΟ
207 Πξνζαξκνζηηθόο έιεγρνο ηνπνινγίαο ξπζκηζηώλ ζηξνθώλ γηα εμνηθνλόκεζε ελέξγεηαο ζε πινία
ρήκα 4.9: ρεδίαζε εθθηλεηή NO.1 αληιίαο ζαιαζζηλνύ λεξνύ κε ξπζκηζηή ζηξνθώλ θαη δηαζύλδεζε κε ειεγθηή
ιεηηνπξγίαο, επαλαθνξάο, θαζώο θαη ιεηηνπξγίαο κε αλαθνξά ηαρύηεηαο από ηνλ εμσηεξηθό ειεγθηή ή ην
πνηελζηόκεηξν. Αληίζηνηρα, νη ςεθηαθέο έμνδνη R1A-R1C ηνπ ξπζκηζηή ζπλδένληαη γηα ηε ιήςε ζήκαηνο
θαηάζηαζεο ζθάικαηνο. Ζ αλαινγηθή είζνδνο +10/ΑΗΗ+/ΑΗ- ζπλδέεηαη κε εμσηεξηθό πνηελζηόκεηξν (1st
speed reference) γηα ρεηξνθίλεηε ξύζκηζε ηαρύηεηαο αλαθνξάο ζε πεξίπησζε απώιεηαο ηεο εμσηεξηθήο
αλαθνξάο ηαρύηεηαο (2nd
speed reference) πνπ πξνέξρεηαη από ηνλ πξνζαξκνζηηθό ειεγθηή θαη ζπλδέεηαη
ζηελ είζνδν AI2-COM. Οη παξάκεηξνη (settings) ηεο πξνηεηλόκελεο θεληξηθήο κνλάδαο πξνζαξκνζηηθνύ
ειέγρνπ ηνπ ξπζκηζηή ζηξνθώλ πνπ εθαξκόδεηαη ζηνλ θηλεηήξα πνπ νδεγεί ηελ αληιία ζαιαζζηλνύ λεξνύ
παξνπζηάδνληαη ζηνλ Πίλαθα 4.3. Παξαηεξείηαη όηη αλάινγα κε ηα ζθάικαηα πνπ εκθαλίδνληαη,
πξαγκαηνπνηείηαη ε αλάινγε ελέξγεηα γηα ηε δηαζθάιηζε ηεο αδηάιεηπηεο ιεηηνπξγίαο ηνπ ζπζηήκαηνο.
Ζ πινπνίεζε ηεο θύξηαο κνλάδαο ηνπ πξνηεηλόκελνπ ζπζηήκαηνο ειέγρνπ κε PLC ζην πεδίν ηνπ
ξπζκηζηή ζηξνθώλ, πνπ πεξηιακβάλεη ηε CPU θαη ηηο ςεθηαθέο θαη αλαινγηθέο θάξηεο εηζόδσλ-εμόδσλ
παξνπζηάδεηαη ζην ρ. 4.10. Αληίζηνηρα, ε πινπνίεζε ηνπ πξνηεηλόκελνπ εθθηλεηή θηλεηήξα αληιίαο
ζαιαζζηλνύ λεξνύ κε ξπζκηζηή ζηξνθώλ θαη ε δηαζύλδεζε ηνπ κε ην ζύζηεκα θεληξηθήο ςύμεο
παξνπζηάδεηαη ζην ρ. 4.11. Δηδηθόηεξα, ε εζσηεξηθή δηαξξύζκηζε ηνπ πεδίνπ πνπ πεξηιακβάλεη ην ξπζκηζηή
ζηξνθώλ θαίλεηαη ζην ρ. 4.11(α), ελώ ε εμσηεξηθή όςε ηνπ θαίλεηαη ζην ρ. 4.11(β). Σν ηνπηθό (local)
ζύζηεκα ειέγρνπ, πνπ θαίλεηαη ζην ρ. 4.11(γ) πεξηιακβάλεη πιήθηξα ρεηξηζκνύ Start/Stop γηα ην ξπζκηζηή
ζηξνθώλ θαζώο θαη επηινγηθό δηαθόπηε ειέγρνπ εθθίλεζεο κε ξπζκηζηή ζηξνθώλ ή DOL. ην ηνπηθό
ζύζηεκα ρεηξηζκνύ ππάξρεη επίζεο επηινγηθόο δηαθόπηεο αλαθνξάο ηαρύηεηαο πεξηζηξνθήο πνπ κπνξεί λα
παξαθάκςεη ηελ απηόκαηε αλαθνξά από ηνλ εμσηεξηθό ειεγθηή ώζηε ν ξπζκηζηήο ζηξνθώλ λα ιεηηνπξγεί
κε ηελ ηηκή αλαθνξάο πνπ ζέηεη ην ηνπηθό πνηελζηόκεηξν. Δπηπιένλ ην ηνπηθό ρεηξηζηήξην δηαζέηεη επηινγηθό
δηαθόπηε ελεξγνπνίεζεο ηεο δηαδηθαζίαο έλαπζεο ηεο εθεδξηθήο αληιίαο ζε πεξίπησζε ζθάικαηνο.
Ο εθθηλεηήο ηεο εθεδξηθήο αληιίαο ζαιαζζηλνύ λεξνύ ΝΟ.2 θαίλεηαη ζην ρ. 4.11(γ) καδί κε ηνλ ειεγθηή
γηα ηελ εθθίλεζε ηεο αληιίαο γηα εθεδξηθή ιεηηνπξγία. Σν ζύζηεκα ειέγρνπ ηεο ηξηνδηθήο ζεξκνζηαηηθήο
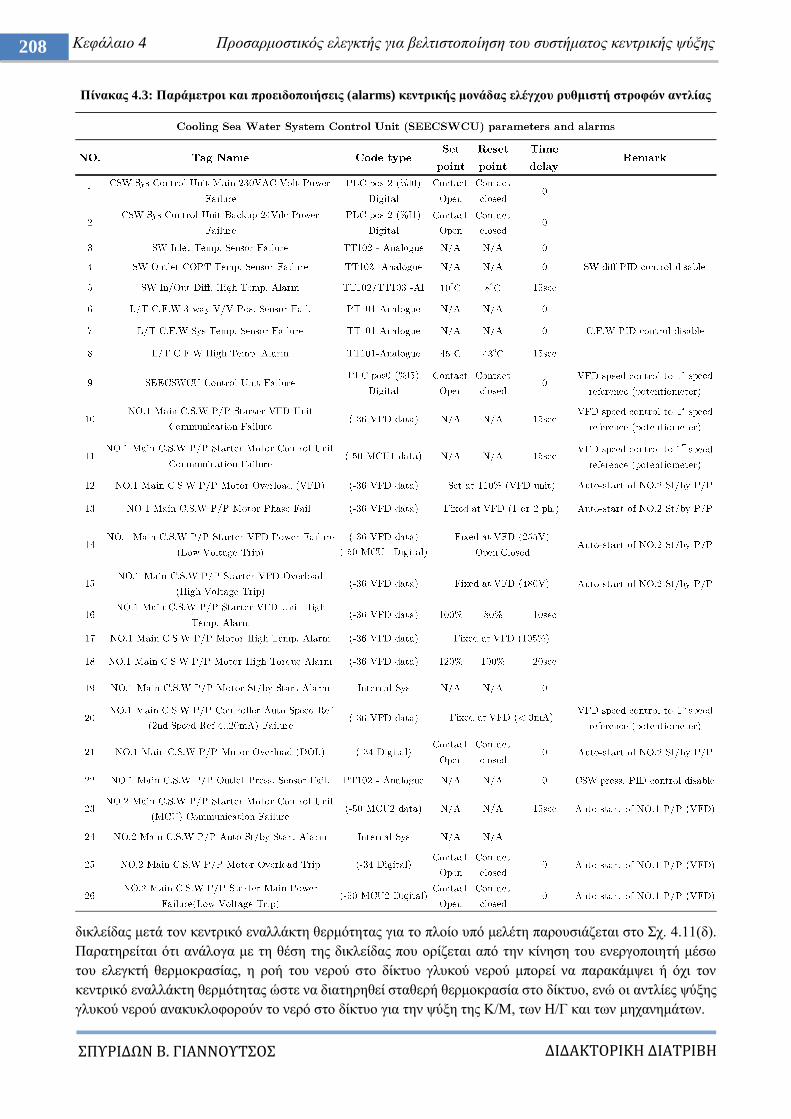
ΔΙΔΑΚΣΟΡΙΚΗ ΔΙΑΣΡΙΒΗ
ΠΤΡΙΔΩΝ Β. ΓΙΑΝΝΟΤΣΟ
208 Κεθάιαην 4 Πξνζαξκνζηηθόο ειεγθηήο γηα βειηηζηνπνίεζε ηνπ ζπζηήκαηνο θεληξηθήο ςύμεο
Πίλαθαο 4.3: Παξάκεηξνη θαη πξνεηδνπνηήζεηο (alarms) θεληξηθήο κνλάδαο ειέγρνπ ξπζκηζηή ζηξνθώλ αληιίαο
δηθιείδαο κεηά ηνλ θεληξηθό ελαιιάθηε ζεξκόηεηαο γηα ην πινίν ππό κειέηε παξνπζηάδεηαη ζην ρ. 4.11(δ).
Παξαηεξείηαη όηη αλάινγα κε ηε ζέζε ηεο δηθιείδαο πνπ νξίδεηαη από ηελ θίλεζε ηνπ ελεξγνπνηεηή κέζσ
ηνπ ειεγθηή ζεξκνθξαζίαο, ε ξνή ηνπ λεξνύ ζην δίθηπν γιπθνύ λεξνύ κπνξεί λα παξαθάκςεη ή όρη ηνλ
θεληξηθό ελαιιάθηε ζεξκόηεηαο ώζηε λα δηαηεξεζεί ζηαζεξή ζεξκνθξαζία ζην δίθηπν, ελώ νη αληιίεο ςύμεο
γιπθνύ λεξνύ αλαθπθινθνξνύλ ην λεξό ζην δίθηπν γηα ηελ ςύμε ηεο Κ/Μ, ησλ Ζ/Γ θαη ησλ κεραλεκάησλ.
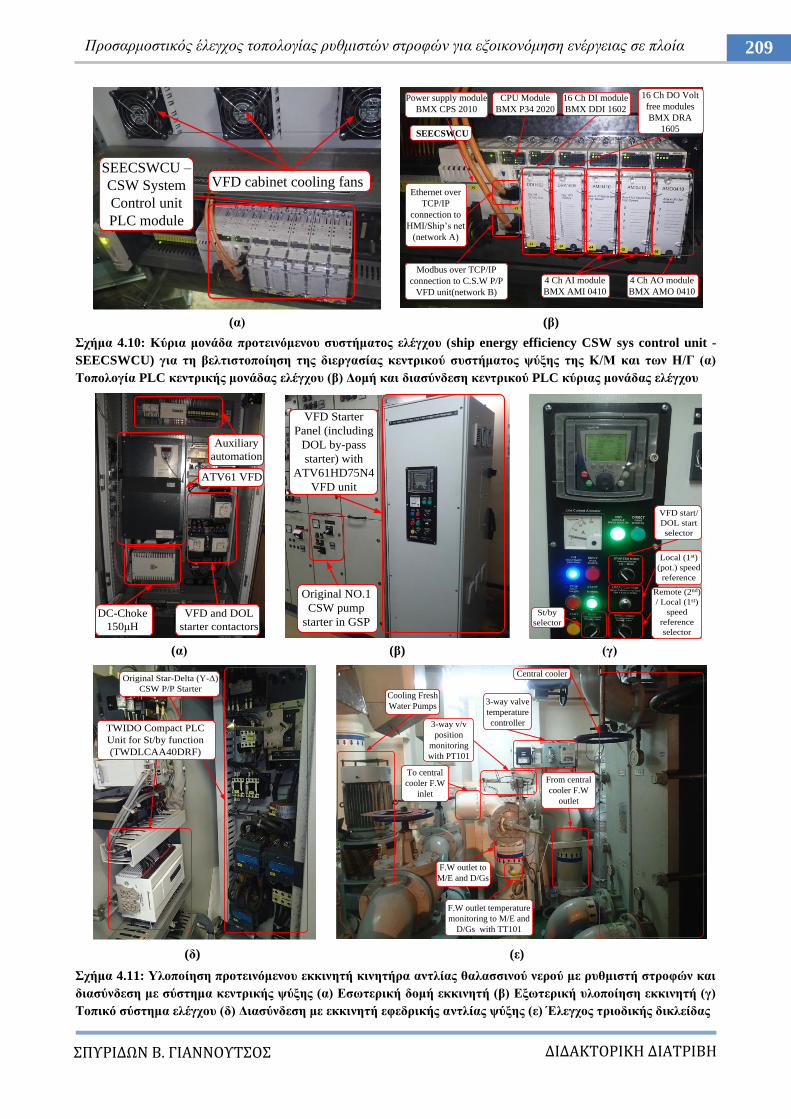
ΔΙΔΑΚΣΟΡΙΚΗ ΔΙΑΣΡΙΒΗ
ΠΤΡΙΔΩΝ Β. ΓΙΑΝΝΟΤΣΟ
209 Πξνζαξκνζηηθόο έιεγρνο ηνπνινγίαο ξπζκηζηώλ ζηξνθώλ γηα εμνηθνλόκεζε ελέξγεηαο ζε πινία
(α) (β)
ρήκα 4.10: Κύξηα κνλάδα πξνηεηλόκελνπ ζπζηήκαηνο ειέγρνπ (ship energy efficiency CSW sys control unit -
SEECSWCU) γηα ηε βειηηζηνπνίεζε ηεο δηεξγαζίαο θεληξηθνύ ζπζηήκαηνο ςύμεο ηεο Κ/Μ θαη ησλ Η/Γ (α)
Σνπνινγία PLC θεληξηθήο κνλάδαο ειέγρνπ (β) Γνκή θαη δηαζύλδεζε θεληξηθνύ PLC θύξηαο κνλάδαο ειέγρνπ
(α) (β) (γ)
(δ) (ε)
ρήκα 4.11: Τινπνίεζε πξνηεηλόκελνπ εθθηλεηή θηλεηήξα αληιίαο ζαιαζζηλνύ λεξνύ κε ξπζκηζηή ζηξνθώλ θαη
δηαζύλδεζε κε ζύζηεκα θεληξηθήο ςύμεο (α) Δζσηεξηθή δνκή εθθηλεηή (β) Δμσηεξηθή πινπνίεζε εθθηλεηή (γ)
Σνπηθό ζύζηεκα ειέγρνπ (δ) Γηαζύλδεζε κε εθθηλεηή εθεδξηθήο αληιίαο ςύμεο (ε) Έιεγρνο ηξηνδηθήο δηθιείδαο
SEECSWCU –
CSW System
Control unit
PLC module
VFD cabinet cooling fans
Power supply module
BMX CPS 2010
CPU Module
BMX P34 2020
16 Ch DI module
BMX DDI 1602
16 Ch DO Volt
free modules
BMX DRA
1605
4 Ch AI module
BMX AMI 0410
4 Ch AO module
BMX AMO 0410
Ethernet over
TCP/IP
connection to
HMI/Ship‟s net
(network A)
Modbus over TCP/IP
connection to C.S.W P/P
VFD unit(network B)
SEECSWCU
DC-Choke
150κH
VFD and DOL
starter contactors
Auxiliary
automation
ATV61 VFD
VFD Starter
Panel (including
DOL by-pass
starter) with
ATV61HD75N4
VFD unit
Original NO.1
CSW pump
starter in GSP
VFD start/
DOL start
selector
Local (1st)
(pot.) speed
reference
Remote (2nd)
/ Local (1st)
speed
reference
selector
St/by
selector
Original Star-Delta (Τ-Γ)
CSW P/P Starter
TWIDO Compact PLC
Unit for St/by function
(TWDLCAA40DRF)
3-way valve
temperature
controller
Cooling Fresh
Water Pumps
To central
cooler F.W
inlet
From central
cooler F.W
outlet
3-way v/v
position
monitoring
with PT101
F.W outlet temperature
monitoring to M/E and
D/Gs with TT101
F.W outlet to
M/E and D/Gs
Central cooler
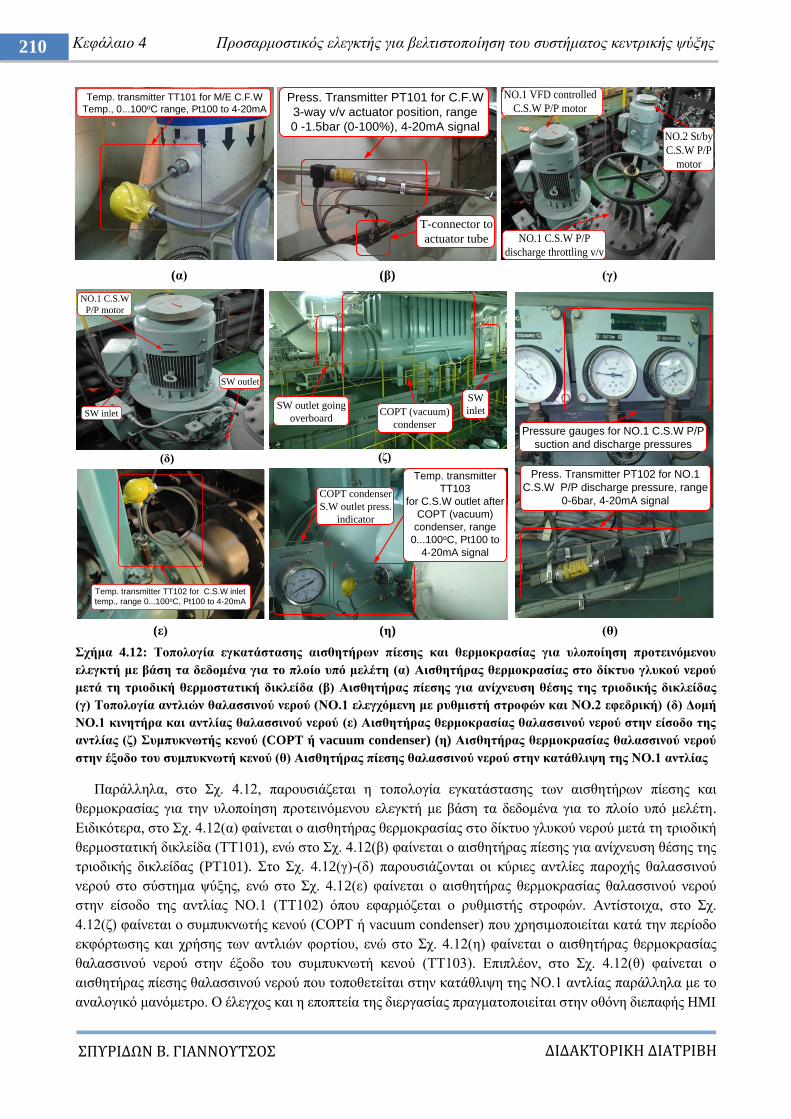
ΔΙΔΑΚΣΟΡΙΚΗ ΔΙΑΣΡΙΒΗ
ΠΤΡΙΔΩΝ Β. ΓΙΑΝΝΟΤΣΟ
210 Κεθάιαην 4 Πξνζαξκνζηηθόο ειεγθηήο γηα βειηηζηνπνίεζε ηνπ ζπζηήκαηνο θεληξηθήο ςύμεο
(α) (β) (γ)
(ε) (ε) (ζ)
ρήκα 4.12: Σνπνινγία εγθαηάζηαζεο αηζζεηήξσλ πίεζεο θαη ζεξκνθξαζίαο γηα πινπνίεζε πξνηεηλόκελνπ
ειεγθηή κε βάζε ηα δεδνκέλα γηα ην πινίν ππό κειέηε (α) Αηζζεηήξαο ζεξκνθξαζίαο ζην δίθηπν γιπθνύ λεξνύ
κεηά ηε ηξηνδηθή ζεξκνζηαηηθή δηθιείδα (β) Αηζζεηήξαο πίεζεο γηα αλίρλεπζε ζέζεο ηεο ηξηνδηθήο δηθιείδαο
(γ) Σνπνινγία αληιηώλ ζαιαζζηλνύ λεξνύ (ΝΟ.1 ειεγρόκελε κε ξπζκηζηή ζηξνθώλ θαη ΝΟ.2 εθεδξηθή) (δ) Γνκή
ΝΟ.1 θηλεηήξα θαη αληιίαο ζαιαζζηλνύ λεξνύ (ε) Αηζζεηήξαο ζεξκνθξαζίαο ζαιαζζηλνύ λεξνύ ζηελ είζνδν ηεο
αληιίαο (δ) πκππθλσηήο θελνύ (COPT ή vacuum condenser) (ε) Αηζζεηήξαο ζεξκνθξαζίαο ζαιαζζηλνύ λεξνύ
ζηελ έμνδν ηνπ ζπκππθλσηή θελνύ (ζ) Αηζζεηήξαο πίεζεο ζαιαζζηλνύ λεξνύ ζηελ θαηάζιηςε ηεο ΝΟ.1 αληιίαο
Παξάιιεια, ζην ρ. 4.12, παξνπζηάδεηαη ε ηνπνινγία εγθαηάζηαζεο ησλ αηζζεηήξσλ πίεζεο θαη
ζεξκνθξαζίαο γηα ηελ πινπνίεζε πξνηεηλόκελνπ ειεγθηή κε βάζε ηα δεδνκέλα γηα ην πινίν ππό κειέηε.
Δηδηθόηεξα, ζην ρ. 4.12(α) θαίλεηαη ν αηζζεηήξαο ζεξκνθξαζίαο ζην δίθηπν γιπθνύ λεξνύ κεηά ηε ηξηνδηθή
ζεξκνζηαηηθή δηθιείδα (ΣΣ101), ελώ ζην ρ. 4.12(β) θαίλεηαη ν αηζζεηήξαο πίεζεο γηα αλίρλεπζε ζέζεο ηεο
ηξηνδηθήο δηθιείδαο (PT101). ην ρ. 4.12(γ)-(δ) παξνπζηάδνληαη νη θύξηεο αληιίεο παξνρήο ζαιαζζηλνύ
λεξνύ ζην ζύζηεκα ςύμεο, ελώ ζην ρ. 4.12(ε) θαίλεηαη ν αηζζεηήξαο ζεξκνθξαζίαο ζαιαζζηλνύ λεξνύ
ζηελ είζνδν ηεο αληιίαο ΝΟ.1 (ΣΣ102) όπνπ εθαξκόδεηαη ν ξπζκηζηήο ζηξνθώλ. Αληίζηνηρα, ζην ρ.
4.12(δ) θαίλεηαη ν ζπκππθλσηήο θελνύ (COPT ή vacuum condenser) πνπ ρξεζηκνπνηείηαη θαηά ηελ πεξίνδν
εθθόξησζεο θαη ρξήζεο ησλ αληιηώλ θνξηίνπ, ελώ ζην ρ. 4.12(ε) θαίλεηαη ν αηζζεηήξαο ζεξκνθξαζίαο
ζαιαζζηλνύ λεξνύ ζηελ έμνδν ηνπ ζπκππθλσηή θελνύ (ΣΣ103). Δπηπιένλ, ζην ρ. 4.12(ζ) θαίλεηαη ν
αηζζεηήξαο πίεζεο ζαιαζζηλνύ λεξνύ πνπ ηνπνζεηείηαη ζηελ θαηάζιηςε ηεο ΝΟ.1 αληιίαο παξάιιεια κε ην
αλαινγηθό καλόκεηξν. Ο έιεγρνο θαη ε επνπηεία ηεο δηεξγαζίαο πξαγκαηνπνηείηαη ζηελ νζόλε δηεπαθήο HMI
Temp. transmitter TT101 for M/E C.F.W
Temp., 0...100oC range, Pt100 to 4-20mAPress. Transmitter PT101 for C.F.W
3-way v/v actuator position, range
0 -1.5bar (0-100%), 4-20mA signal
T-connector to
actuator tube
NO.1 VFD controlled
C.S.W P/P motor
NO.1 C.S.W P/P
discharge throttling v/v
NO.2 St/by
C.S.W P/P
motor
Temp. transmitter TT102 for C.S.W inlet
temp., range 0...100oC, Pt100 to 4-20mA
(δ)
NO.1 C.S.W
P/P motor
SW inlet
SW outlet
Temp. transmitter
TT103
for C.S.W outlet after
COPT (vacuum)
condenser, range
0...100oC, Pt100 to
4-20mA signal
COPT condenser
S.W outlet press.
indicator
(δ)
COPT (vacuum)
condenser
SW outlet going
overboard
SW
inlet
Press. Transmitter PT102 for NO.1
C.S.W P/P discharge pressure, range
0-6bar, 4-20mA signal
Pressure gauges for NO.1 C.S.W P/P
suction and discharge pressures
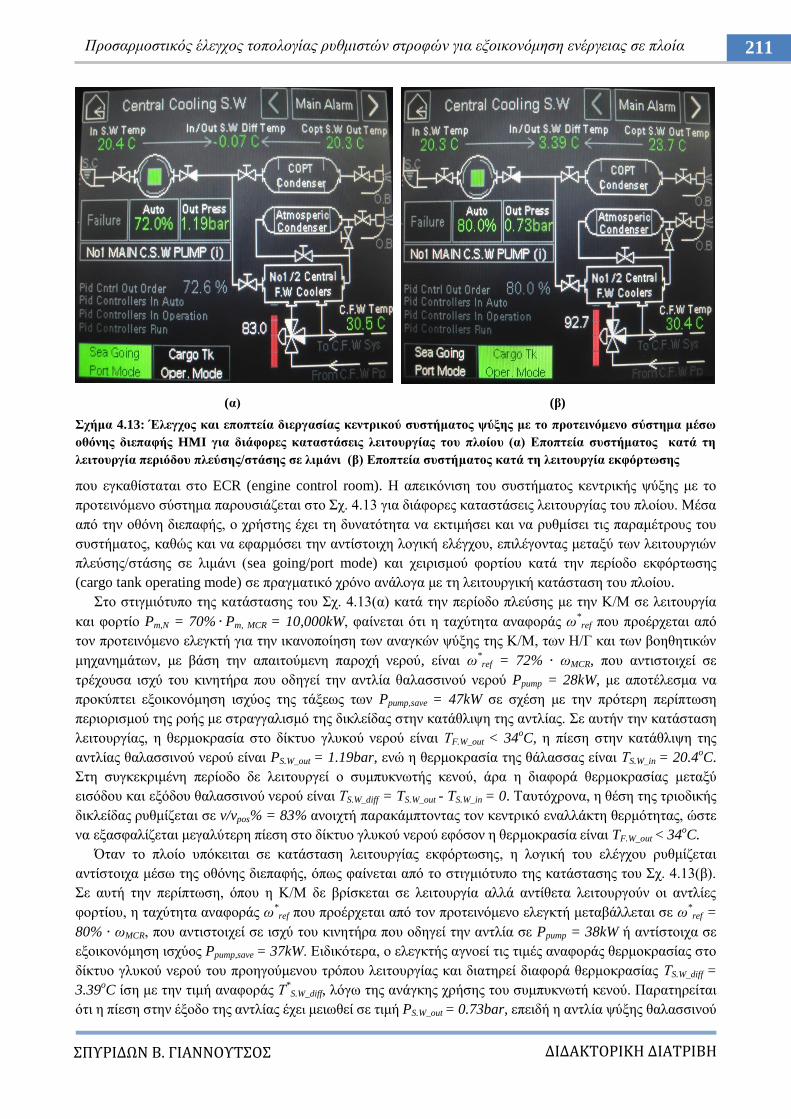
ΔΙΔΑΚΣΟΡΙΚΗ ΔΙΑΣΡΙΒΗ
ΠΤΡΙΔΩΝ Β. ΓΙΑΝΝΟΤΣΟ
211 Πξνζαξκνζηηθόο έιεγρνο ηνπνινγίαο ξπζκηζηώλ ζηξνθώλ γηα εμνηθνλόκεζε ελέξγεηαο ζε πινία
(α) (β)
ρήκα 4.13: Έιεγρνο θαη επνπηεία δηεξγαζίαο θεληξηθνύ ζπζηήκαηνο ςύμεο κε ην πξνηεηλόκελν ζύζηεκα κέζσ
νζόλεο δηεπαθήο HMI γηα δηάθνξεο θαηαζηάζεηο ιεηηνπξγίαο ηνπ πινίνπ (α) Δπνπηεία ζπζηήκαηνο θαηά ηε
ιεηηνπξγία πεξηόδνπ πιεύζεο/ζηάζεο ζε ιηκάλη (β) Δπνπηεία ζπζηήκαηνο θαηά ηε ιεηηνπξγία εθθόξησζεο
πνπ εγθαζίζηαηαη ζην ECR (engine control room). Ζ απεηθόληζε ηνπ ζπζηήκαηνο θεληξηθήο ςύμεο κε ην
πξνηεηλόκελν ζύζηεκα παξνπζηάδεηαη ζην ρ. 4.13 γηα δηάθνξεο θαηαζηάζεηο ιεηηνπξγίαο ηνπ πινίνπ. Μέζα
από ηελ νζόλε δηεπαθήο, ν ρξήζηεο έρεη ηε δπλαηόηεηα λα εθηηκήζεη θαη λα ξπζκίζεη ηηο παξακέηξνπο ηνπ
ζπζηήκαηνο, θαζώο θαη λα εθαξκόζεη ηελ αληίζηνηρε ινγηθή ειέγρνπ, επηιέγνληαο κεηαμύ ησλ ιεηηνπξγηώλ
πιεύζεο/ζηάζεο ζε ιηκάλη (sea going/port mode) θαη ρεηξηζκνύ θνξηίνπ θαηά ηελ πεξίνδν εθθόξησζεο
(cargo tank operating mode) ζε πξαγκαηηθό ρξόλν αλάινγα κε ηε ιεηηνπξγηθή θαηάζηαζε ηνπ πινίνπ.
ην ζηηγκηόηππν ηεο θαηάζηαζεο ηνπ ρ. 4.13(α) θαηά ηελ πεξίνδν πιεύζεο κε ηελ Κ/Μ ζε ιεηηνπξγία
θαη θνξηίν Pm,N = 70% Pm, MCR = 10,000kW, θαίλεηαη όηη ε ηαρύηεηα αλαθνξάο σ*ref πνπ πξνέξρεηαη από
ηνλ πξνηεηλόκελν ειεγθηή γηα ηελ ηθαλνπνίεζε ησλ αλαγθώλ ςύμεο ηεο Κ/Μ, ησλ Ζ/Γ θαη ησλ βνεζεηηθώλ
κεραλεκάησλ, κε βάζε ηελ απαηηνύκελε παξνρή λεξνύ, είλαη σ*ref = 72% σMCR, πνπ αληηζηνηρεί ζε
ηξέρνπζα ηζρύ ηνπ θηλεηήξα πνπ νδεγεί ηελ αληιία ζαιαζζηλνύ λεξνύ Ppump = 28kW, κε απνηέιεζκα λα
πξνθύπηεη εμνηθνλόκεζε ηζρύνο ηεο ηάμεσο ησλ Ppump,save = 47kW ζε ζρέζε κε ηελ πξόηεξε πεξίπησζε
πεξηνξηζκνύ ηεο ξνήο κε ζηξαγγαιηζκό ηεο δηθιείδαο ζηελ θαηάζιηςε ηεο αληιίαο. ε απηήλ ηελ θαηάζηαζε
ιεηηνπξγίαο, ε ζεξκνθξαζία ζην δίθηπν γιπθνύ λεξνύ είλαη ΣF.W_out < 34oC, ε πίεζε ζηελ θαηάζιηςε ηεο
αληιίαο ζαιαζζηλνύ λεξνύ είλαη PS.W_out = 1.19bar, ελώ ε ζεξκνθξαζία ηεο ζάιαζζαο είλαη ΣS.W_in = 20.4oC.
ηε ζπγθεθξηκέλε πεξίνδν δε ιεηηνπξγεί ν ζπκππθλσηήο θελνύ, άξα ε δηαθνξά ζεξκνθξαζίαο κεηαμύ
εηζόδνπ θαη εμόδνπ ζαιαζζηλνύ λεξνύ είλαη ΣS.W_diff = TS.W_out - TS.W_in = 0. Σαπηόρξνλα, ε ζέζε ηεο ηξηνδηθήο
δηθιείδαο ξπζκίδεηαη ζε v/vpos% = 83% αλνηρηή παξαθάκπηνληαο ηνλ θεληξηθό ελαιιάθηε ζεξκόηεηαο, ώζηε
λα εμαζθαιίδεηαη κεγαιύηεξε πίεζε ζην δίθηπν γιπθνύ λεξνύ εθόζνλ ε ζεξκνθξαζία είλαη TF.W_out < 34oC.
Όηαλ ην πινίν ππόθεηηαη ζε θαηάζηαζε ιεηηνπξγίαο εθθόξησζεο, ε ινγηθή ηνπ ειέγρνπ ξπζκίδεηαη
αληίζηνηρα κέζσ ηεο νζόλεο δηεπαθήο, όπσο θαίλεηαη από ην ζηηγκηόηππν ηεο θαηάζηαζεο ηνπ ρ. 4.13(β).
ε απηή ηελ πεξίπησζε, όπνπ ε Κ/Μ δε βξίζθεηαη ζε ιεηηνπξγία αιιά αληίζεηα ιεηηνπξγνύλ νη αληιίεο
θνξηίνπ, ε ηαρύηεηα αλαθνξάο σ*ref πνπ πξνέξρεηαη από ηνλ πξνηεηλόκελν ειεγθηή κεηαβάιιεηαη ζε σ
*ref =
80% σMCR, πνπ αληηζηνηρεί ζε ηζρύ ηνπ θηλεηήξα πνπ νδεγεί ηελ αληιία ζε Ppump = 38kW ή αληίζηνηρα ζε
εμνηθνλόκεζε ηζρύνο Ppump,save = 37kW. Δηδηθόηεξα, ν ειεγθηήο αγλνεί ηηο ηηκέο αλαθνξάο ζεξκνθξαζίαο ζην
δίθηπν γιπθνύ λεξνύ ηνπ πξνεγνύκελνπ ηξόπνπ ιεηηνπξγίαο θαη δηαηεξεί δηαθνξά ζεξκνθξαζίαο ΣS.W_diff =
3.39oC ίζε κε ηελ ηηκή αλαθνξάο Σ
*S.W_diff, ιόγσ ηεο αλάγθεο ρξήζεο ηνπ ζπκππθλσηή θελνύ. Παξαηεξείηαη
όηη ε πίεζε ζηελ έμνδν ηεο αληιίαο έρεη κεησζεί ζε ηηκή PS.W_out = 0.73bar, επεηδή ε αληιία ςύμεο ζαιαζζηλνύ
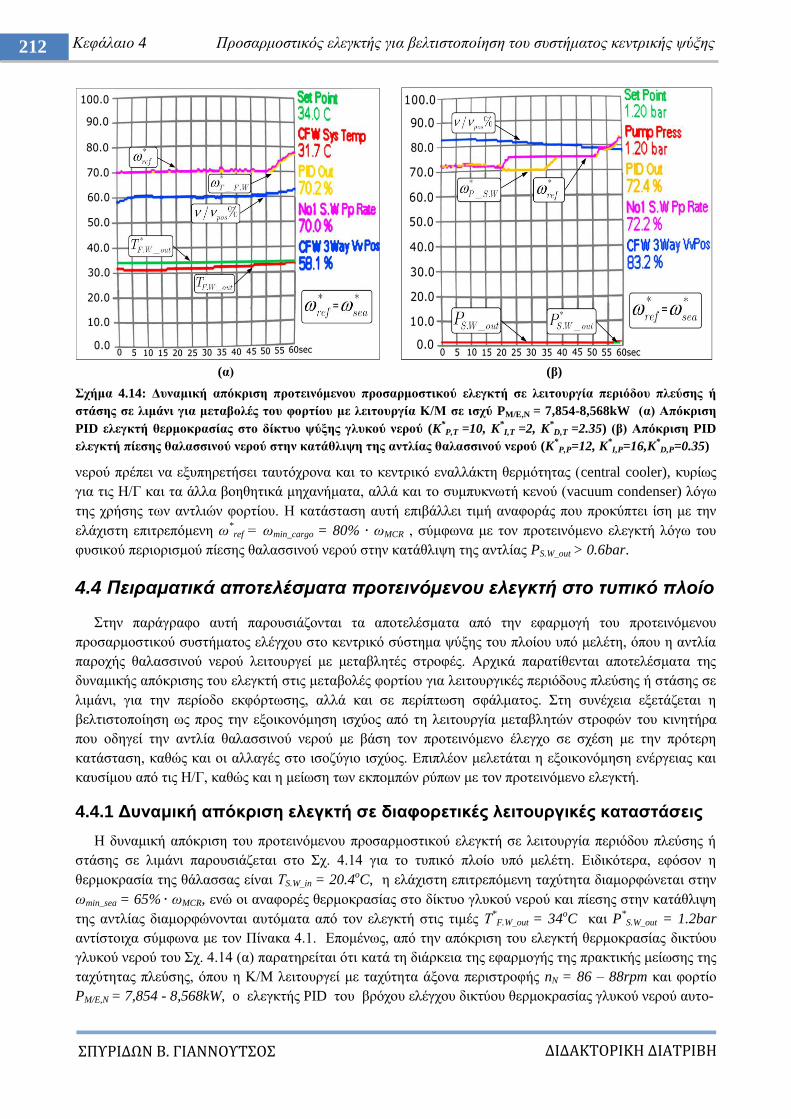
ΔΙΔΑΚΣΟΡΙΚΗ ΔΙΑΣΡΙΒΗ
ΠΤΡΙΔΩΝ Β. ΓΙΑΝΝΟΤΣΟ
212 Κεθάιαην 4 Πξνζαξκνζηηθόο ειεγθηήο γηα βειηηζηνπνίεζε ηνπ ζπζηήκαηνο θεληξηθήο ςύμεο
(α) (β)
ρήκα 4.14: Γπλακηθή απόθξηζε πξνηεηλόκελνπ πξνζαξκνζηηθνύ ειεγθηή ζε ιεηηνπξγία πεξηόδνπ πιεύζεο ή
ζηάζεο ζε ιηκάλη γηα κεηαβνιέο ηνπ θνξηίνπ κε ιεηηνπξγία Κ/Μ ζε ηζρύ PM/E,N = 7,854-8,568kW (α) Απόθξηζε
PID ειεγθηή ζεξκνθξαζίαο ζην δίθηπν ςύμεο γιπθνύ λεξνύ (K*P,T =10, K
*I,T =2, K
*D,T =2.35) (β) Απόθξηζε PID
ειεγθηή πίεζεο ζαιαζζηλνύ λεξνύ ζηελ θαηάζιηςε ηεο αληιίαο ζαιαζζηλνύ λεξνύ (K*
P,P=12, K*I,P=16,K
*D,P=0.35)
λεξνύ πξέπεη λα εμππεξεηήζεη ηαπηόρξνλα θαη ην θεληξηθό ελαιιάθηε ζεξκόηεηαο (central cooler), θπξίσο
γηα ηηο Ζ/Γ θαη ηα άιια βνεζεηηθά κεραλήκαηα, αιιά θαη ην ζπκππθλσηή θελνύ (vacuum condenser) ιόγσ
ηεο ρξήζεο ησλ αληιηώλ θνξηίνπ. Ζ θαηάζηαζε απηή επηβάιιεη ηηκή αλαθνξάο πνπ πξνθύπηεη ίζε κε ηελ
ειάρηζηε επηηξεπόκελε σ*ref = σmin_cargo = 80% σMCR , ζύκθσλα κε ηνλ πξνηεηλόκελν ειεγθηή ιόγσ ηνπ
θπζηθνύ πεξηνξηζκνύ πίεζεο ζαιαζζηλνύ λεξνύ ζηελ θαηάζιηςε ηεο αληιίαο PS.W_out > 0.6bar.
4.4 Πειπαμαηικά αποηελέζμαηα πποηεινόμενος ελεγκηή ζηο ηςπικό πλοίο
ηελ παξάγξαθν απηή παξνπζηάδνληαη ηα απνηειέζκαηα από ηελ εθαξκνγή ηνπ πξνηεηλόκελνπ
πξνζαξκνζηηθνύ ζπζηήκαηνο ειέγρνπ ζην θεληξηθό ζύζηεκα ςύμεο ηνπ πινίνπ ππό κειέηε, όπνπ ε αληιία
παξνρήο ζαιαζζηλνύ λεξνύ ιεηηνπξγεί κε κεηαβιεηέο ζηξνθέο. Αξρηθά παξαηίζεληαη απνηειέζκαηα ηεο
δπλακηθήο απόθξηζεο ηνπ ειεγθηή ζηηο κεηαβνιέο θνξηίνπ γηα ιεηηνπξγηθέο πεξηόδνπο πιεύζεο ή ζηάζεο ζε
ιηκάλη, γηα ηελ πεξίνδν εθθόξησζεο, αιιά θαη ζε πεξίπησζε ζθάικαηνο. ηε ζπλέρεηα εμεηάδεηαη ε
βειηηζηνπνίεζε σο πξνο ηελ εμνηθνλόκεζε ηζρύνο από ηε ιεηηνπξγία κεηαβιεηώλ ζηξνθώλ ηνπ θηλεηήξα
πνπ νδεγεί ηελ αληιία ζαιαζζηλνύ λεξνύ κε βάζε ηνλ πξνηεηλόκελν έιεγρν ζε ζρέζε κε ηελ πξόηεξε
θαηάζηαζε, θαζώο θαη νη αιιαγέο ζην ηζνδύγην ηζρύνο. Δπηπιένλ κειεηάηαη ε εμνηθνλόκεζε ελέξγεηαο θαη
θαπζίκνπ από ηηο Ζ/Γ, θαζώο θαη ε κείσζε ησλ εθπνκπώλ ξύπσλ κε ηνλ πξνηεηλόκελν ειεγθηή.
4.4.1 Γπλακηθή απόθξηζε ειεγθηή ζε δηαθνξεηηθέο ιεηηνπξγηθέο θαηαζηάζεηο
Ζ δπλακηθή απόθξηζε ηνπ πξνηεηλόκελνπ πξνζαξκνζηηθνύ ειεγθηή ζε ιεηηνπξγία πεξηόδνπ πιεύζεο ή
ζηάζεο ζε ιηκάλη παξνπζηάδεηαη ζην ρ. 4.14 γηα ην ηππηθό πινίν ππό κειέηε. Δηδηθόηεξα, εθόζνλ ε
ζεξκνθξαζία ηεο ζάιαζζαο είλαη ΣS.W_in = 20.4oC, ε ειάρηζηε επηηξεπόκελε ηαρύηεηα δηακνξθώλεηαη ζηελ
σmin_sea = 65% σMCR, ελώ νη αλαθνξέο ζεξκνθξαζίαο ζην δίθηπν γιπθνύ λεξνύ θαη πίεζεο ζηελ θαηάζιηςε
ηεο αληιίαο δηακνξθώλνληαη απηόκαηα από ηνλ ειεγθηή ζηηο ηηκέο Σ*
F.W_out = 34oC θαη P
*S.W_out = 1.2bar
αληίζηνηρα ζύκθσλα κε ηνλ Πίλαθα 4.1. Δπνκέλσο, από ηελ απόθξηζε ηνπ ειεγθηή ζεξκνθξαζίαο δηθηύνπ
γιπθνύ λεξνύ ηνπ ρ. 4.14 (α) παξαηεξείηαη όηη θαηά ηε δηάξθεηα ηεο εθαξκνγήο ηεο πξαθηηθήο κείσζεο ηεο
ηαρύηεηαο πιεύζεο, όπνπ ε Κ/Μ ιεηηνπξγεί κε ηαρύηεηα άμνλα πεξηζηξνθήο nN = 86 – 88rpm θαη θνξηίν
PM/E,N = 7,854 - 8,568kW, o ειεγθηήο PID ηνπ βξόρνπ ειέγρνπ δηθηύνπ ζεξκνθξαζίαο γιπθνύ λεξνύ απην-
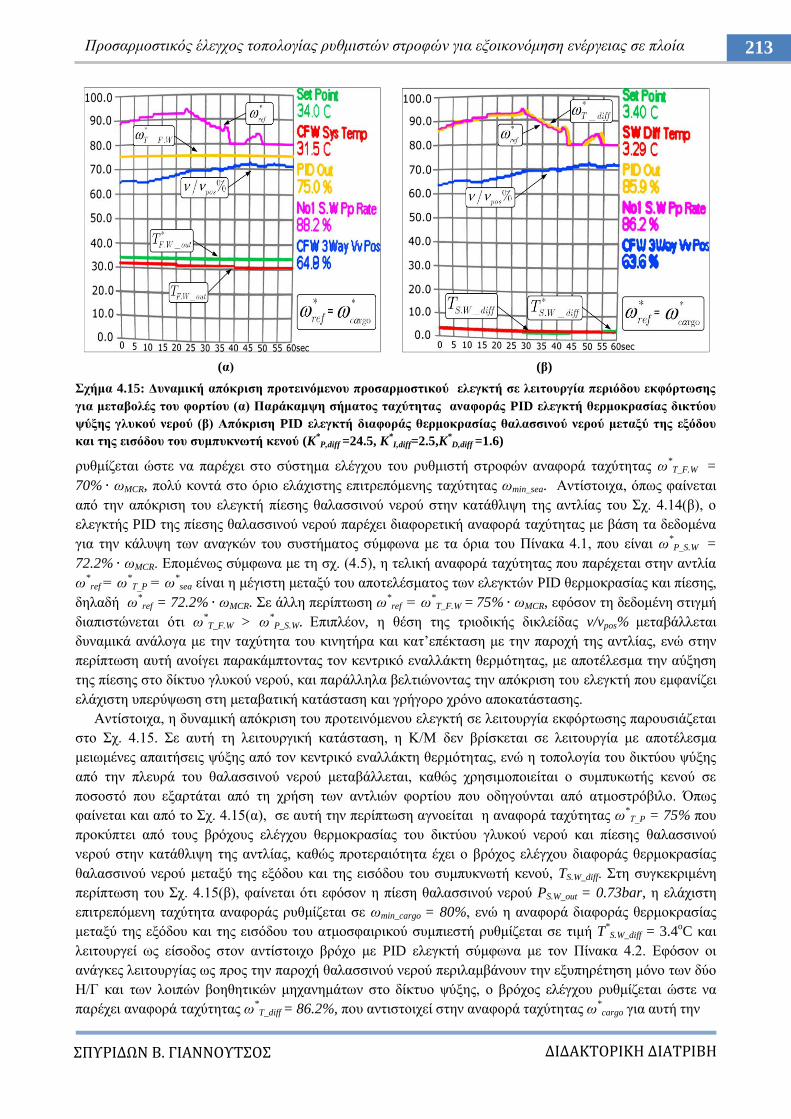
ΔΙΔΑΚΣΟΡΙΚΗ ΔΙΑΣΡΙΒΗ
ΠΤΡΙΔΩΝ Β. ΓΙΑΝΝΟΤΣΟ
213 Πξνζαξκνζηηθόο έιεγρνο ηνπνινγίαο ξπζκηζηώλ ζηξνθώλ γηα εμνηθνλόκεζε ελέξγεηαο ζε πινία
(α) (β)
ρήκα 4.15: Γπλακηθή απόθξηζε πξνηεηλόκελνπ πξνζαξκνζηηθνύ ειεγθηή ζε ιεηηνπξγία πεξηόδνπ εθθόξησζεο
γηα κεηαβνιέο ηνπ θνξηίνπ (α) Παξάθακςε ζήκαηνο ηαρύηεηαο αλαθνξάο PID ειεγθηή ζεξκνθξαζίαο δηθηύνπ
ςύμεο γιπθνύ λεξνύ (β) Απόθξηζε PID ειεγθηή δηαθνξάο ζεξκνθξαζίαο ζαιαζζηλνύ λεξνύ κεηαμύ ηεο εμόδνπ
θαη ηεο εηζόδνπ ηνπ ζπκππθλσηή θελνύ (K*P,diff =24.5, K
*I,diff=2.5,K
*D,diff =1.6)
ξπζκίδεηαη ώζηε λα παξέρεη ζην ζύζηεκα ειέγρνπ ηνπ ξπζκηζηή ζηξνθώλ αλαθνξά ηαρύηεηαο σ*
T_F.W =
70% σMCR, πνιύ θνληά ζην όξην ειάρηζηεο επηηξεπόκελεο ηαρύηεηαο σmin_sea. Αληίζηνηρα, όπσο θαίλεηαη
από ηελ απόθξηζε ηνπ ειεγθηή πίεζεο ζαιαζζηλνύ λεξνύ ζηελ θαηάζιηςε ηεο αληιίαο ηνπ ρ. 4.14(β), ν
ειεγθηήο PID ηεο πίεζεο ζαιαζζηλνύ λεξνύ παξέρεη δηαθνξεηηθή αλαθνξά ηαρύηεηαο κε βάζε ηα δεδνκέλα
γηα ηελ θάιπςε ησλ αλαγθώλ ηνπ ζπζηήκαηνο ζύκθσλα κε ηα όξηα ηνπ Πίλαθα 4.1, πνπ είλαη σ*
P_S.W =
72.2% σMCR. Δπνκέλσο ζύκθσλα κε ηε ζρ. (4.5), ε ηειηθή αλαθνξά ηαρύηεηαο πνπ παξέρεηαη ζηελ αληιία
σ*
ref = σ*Σ_P = σ
*sea είλαη ε κέγηζηε κεηαμύ ηνπ απνηειέζκαηνο ησλ ειεγθηώλ PID ζεξκνθξαζίαο θαη πίεζεο,
δειαδή σ*
ref = 72.2% σMCR. ε άιιε πεξίπησζε σ*
ref = σ*
T_F.W = 75% σMCR, εθόζνλ ηε δεδνκέλε ζηηγκή
δηαπηζηώλεηαη όηη σ*
T_F.W > σ*P_S.W. Δπηπιένλ, ε ζέζε ηεο ηξηνδηθήο δηθιείδαο v/vpos% κεηαβάιιεηαη
δπλακηθά αλάινγα κε ηελ ηαρύηεηα ηνπ θηλεηήξα θαη θαη‟επέθηαζε κε ηελ παξνρή ηεο αληιίαο, ελώ ζηελ
πεξίπησζε απηή αλνίγεη παξαθάκπηνληαο ηνλ θεληξηθό ελαιιάθηε ζεξκόηεηαο, κε απνηέιεζκα ηελ αύμεζε
ηεο πίεζεο ζην δίθηπν γιπθνύ λεξνύ, θαη παξάιιεια βειηηώλνληαο ηελ απόθξηζε ηνπ ειεγθηή πνπ εκθαλίδεη
ειάρηζηε ππεξύςσζε ζηε κεηαβαηηθή θαηάζηαζε θαη γξήγνξν ρξόλν απνθαηάζηαζεο.
Αληίζηνηρα, ε δπλακηθή απόθξηζε ηνπ πξνηεηλόκελνπ ειεγθηή ζε ιεηηνπξγία εθθόξησζεο παξνπζηάδεηαη
ζην ρ. 4.15. ε απηή ηε ιεηηνπξγηθή θαηάζηαζε, ε Κ/Μ δελ βξίζθεηαη ζε ιεηηνπξγία κε απνηέιεζκα
κεησκέλεο απαηηήζεηο ςύμεο από ηνλ θεληξηθό ελαιιάθηε ζεξκόηεηαο, ελώ ε ηνπνινγία ηνπ δηθηύνπ ςύμεο
από ηελ πιεπξά ηνπ ζαιαζζηλνύ λεξνύ κεηαβάιιεηαη, θαζώο ρξεζηκνπνηείηαη ν ζπκππθσηήο θελνύ ζε
πνζνζηό πνπ εμαξηάηαη από ηε ρξήζε ησλ αληιηώλ θνξηίνπ πνπ νδεγνύληαη από αηκνζηξόβηιν. Όπσο
θαίλεηαη θαη από ην ρ. 4.15(α), ζε απηή ηελ πεξίπησζε αγλνείηαη ε αλαθνξά ηαρύηεηαο σ*
Σ_P = 75% πνπ
πξνθύπηεη από ηνπο βξόρνπο ειέγρνπ ζεξκνθξαζίαο ηνπ δηθηύνπ γιπθνύ λεξνύ θαη πίεζεο ζαιαζζηλνύ
λεξνύ ζηελ θαηάζιηςε ηεο αληιίαο, θαζώο πξνηεξαηόηεηα έρεη ν βξόρνο ειέγρνπ δηαθνξάο ζεξκνθξαζίαο
ζαιαζζηλνύ λεξνύ κεηαμύ ηεο εμόδνπ θαη ηεο εηζόδνπ ηνπ ζπκππθλσηή θελνύ, TS.W_diff. ηε ζπγθεθξηκέλε
πεξίπησζε ηνπ ρ. 4.15(β), θαίλεηαη όηη εθόζνλ ε πίεζε ζαιαζζηλνύ λεξνύ PS.W_out = 0.73bar, ε ειάρηζηε
επηηξεπόκελε ηαρύηεηα αλαθνξάο ξπζκίδεηαη ζε σmin_cargo = 80%, ελώ ε αλαθνξά δηαθνξάο ζεξκνθξαζίαο
κεηαμύ ηεο εμόδνπ θαη ηεο εηζόδνπ ηνπ αηκνζθαηξηθνύ ζπκπηεζηή ξπζκίδεηαη ζε ηηκή T*
S.W_diff = 3.4oC θαη
ιεηηνπξγεί σο είζνδνο ζηνλ αληίζηνηρν βξόρν κε PID ειεγθηή ζύκθσλα κε ηνλ Πίλαθα 4.2. Δθόζνλ νη
αλάγθεο ιεηηνπξγίαο σο πξνο ηελ παξνρή ζαιαζζηλνύ λεξνύ πεξηιακβάλνπλ ηελ εμππεξέηεζε κόλν ησλ δύν
Ζ/Γ θαη ησλ ινηπώλ βνεζεηηθώλ κεραλεκάησλ ζην δίθηπν ςύμεο, ν βξόρνο ειέγρνπ ξπζκίδεηαη ώζηε λα
παξέρεη αλαθνξά ηαρύηεηαο σ*T_diff = 86.2%, πνπ αληηζηνηρεί ζηελ αλαθνξά ηαρύηεηαο σ
*cargo γηα απηή ηελ
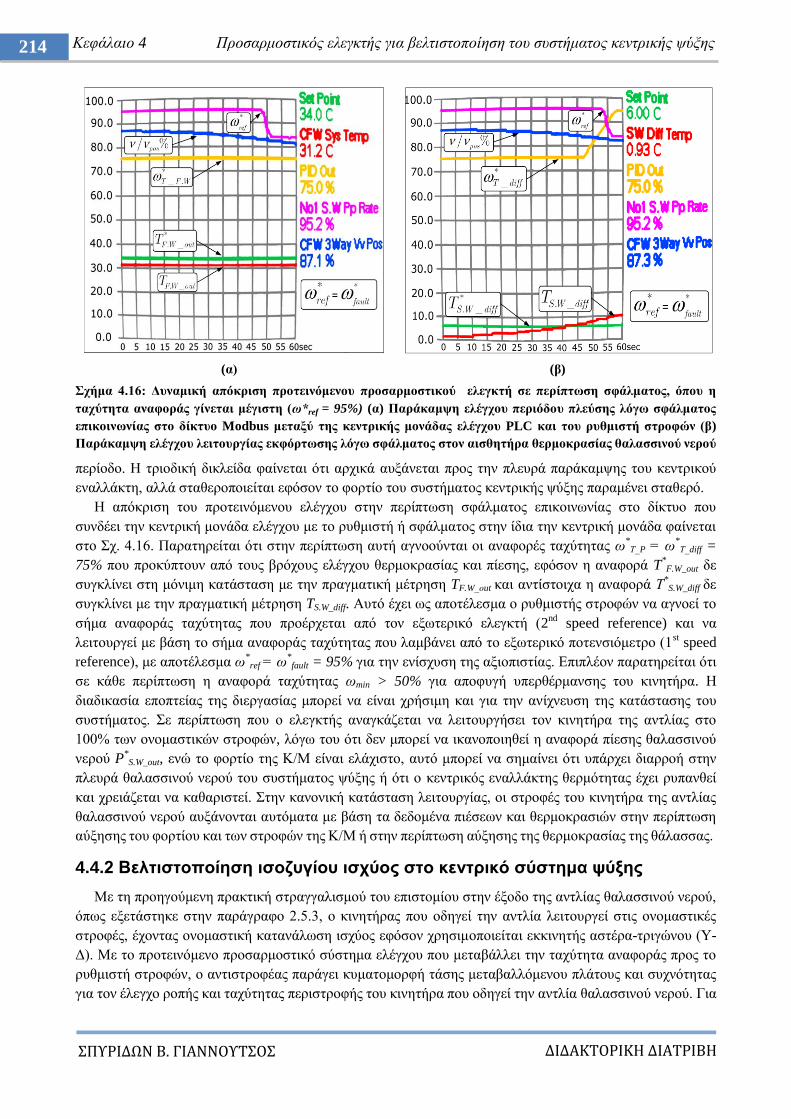
ΔΙΔΑΚΣΟΡΙΚΗ ΔΙΑΣΡΙΒΗ
ΠΤΡΙΔΩΝ Β. ΓΙΑΝΝΟΤΣΟ
214 Κεθάιαην 4 Πξνζαξκνζηηθόο ειεγθηήο γηα βειηηζηνπνίεζε ηνπ ζπζηήκαηνο θεληξηθήο ςύμεο
(α) (β)
ρήκα 4.16: Γπλακηθή απόθξηζε πξνηεηλόκελνπ πξνζαξκνζηηθνύ ειεγθηή ζε πεξίπησζε ζθάικαηνο, όπνπ ε
ηαρύηεηα αλαθνξάο γίλεηαη κέγηζηε (σ*ref = 95%) (α) Παξάθακςε ειέγρνπ πεξηόδνπ πιεύζεο ιόγσ ζθάικαηνο
επηθνηλσλίαο ζην δίθηπν Modbus κεηαμύ ηεο θεληξηθήο κνλάδαο ειέγρνπ PLC θαη ηνπ ξπζκηζηή ζηξνθώλ (β)
Παξάθακςε ειέγρνπ ιεηηνπξγίαο εθθόξησζεο ιόγσ ζθάικαηνο ζηνλ αηζζεηήξα ζεξκνθξαζίαο ζαιαζζηλνύ λεξνύ
πεξίνδν. Ζ ηξηνδηθή δηθιείδα θαίλεηαη όηη αξρηθά απμάλεηαη πξνο ηελ πιεπξά παξάθακςεο ηνπ θεληξηθνύ
ελαιιάθηε, αιιά ζηαζεξνπνηείηαη εθόζνλ ην θνξηίν ηνπ ζπζηήκαηνο θεληξηθήο ςύμεο παξακέλεη ζηαζεξό.
Ζ απόθξηζε ηνπ πξνηεηλόκελνπ ειέγρνπ ζηελ πεξίπησζε ζθάικαηνο επηθνηλσλίαο ζην δίθηπν πνπ
ζπλδέεη ηελ θεληξηθή κνλάδα ειέγρνπ κε ην ξπζκηζηή ή ζθάικαηνο ζηελ ίδηα ηελ θεληξηθή κνλάδα θαίλεηαη
ζην ρ. 4.16. Παξαηεξείηαη όηη ζηελ πεξίπησζε απηή αγλννύληαη νη αλαθνξέο ηαρύηεηαο σ*Σ_P = σ
*Σ_diff =
75% πνπ πξνθύπηνπλ από ηνπο βξόρνπο ειέγρνπ ζεξκνθξαζίαο θαη πίεζεο, εθόζνλ ε αλαθνξά T*F.W_out δε
ζπγθιίλεη ζηε κόληκε θαηάζηαζε κε ηελ πξαγκαηηθή κέηξεζε TF.W_νut θαη αληίζηνηρα ε αλαθνξά Σ*
S.W_diff δε
ζπγθιίλεη κε ηελ πξαγκαηηθή κέηξεζε TS.W_diff. Απηό έρεη σο απνηέιεζκα ν ξπζκηζηήο ζηξνθώλ λα αγλνεί ην
ζήκα αλαθνξάο ηαρύηεηαο πνπ πξνέξρεηαη από ηνλ εμσηεξηθό ειεγθηή (2nd
speed reference) θαη λα
ιεηηνπξγεί κε βάζε ην ζήκα αλαθνξάο ηαρύηεηαο πνπ ιακβάλεη από ην εμσηεξηθό πνηελζηόκεηξν (1st speed
reference), κε απνηέιεζκα σ*
ref = σ*fault = 95% γηα ηελ ελίζρπζε ηεο αμηνπηζηίαο. Δπηπιένλ παξαηεξείηαη όηη
ζε θάζε πεξίπησζε ε αλαθνξά ηαρύηεηαο σmin > 50% γηα απνθπγή ππεξζέξκαλζεο ηνπ θηλεηήξα. Ζ
δηαδηθαζία επνπηείαο ηεο δηεξγαζίαο κπνξεί λα είλαη ρξήζηκε θαη γηα ηελ αλίρλεπζε ηεο θαηάζηαζεο ηνπ
ζπζηήκαηνο. ε πεξίπησζε πνπ ν ειεγθηήο αλαγθάδεηαη λα ιεηηνπξγήζεη ηνλ θηλεηήξα ηεο αληιίαο ζην
100% ησλ νλνκαζηηθώλ ζηξνθώλ, ιόγσ ηνπ όηη δελ κπνξεί λα ηθαλνπνηεζεί ε αλαθνξά πίεζεο ζαιαζζηλνύ
λεξνύ P*
S.W_out, ελώ ην θνξηίν ηεο Κ/Μ είλαη ειάρηζην, απηό κπνξεί λα ζεκαίλεη όηη ππάξρεη δηαξξνή ζηελ
πιεπξά ζαιαζζηλνύ λεξνύ ηνπ ζπζηήκαηνο ςύμεο ή όηη ν θεληξηθόο ελαιιάθηεο ζεξκόηεηαο έρεη ξππαλζεί
θαη ρξεηάδεηαη λα θαζαξηζηεί. ηελ θαλνληθή θαηάζηαζε ιεηηνπξγίαο, νη ζηξνθέο ηνπ θηλεηήξα ηεο αληιίαο
ζαιαζζηλνύ λεξνύ απμάλνληαη απηόκαηα κε βάζε ηα δεδνκέλα πηέζεσλ θαη ζεξκνθξαζηώλ ζηελ πεξίπησζε
αύμεζεο ηνπ θνξηίνπ θαη ησλ ζηξνθώλ ηεο Κ/Μ ή ζηελ πεξίπησζε αύμεζεο ηεο ζεξκνθξαζίαο ηεο ζάιαζζαο.
4.4.2 Βειηηζηνπνίεζε ηζνδπγίνπ ηζρύνο ζην θεληξηθό ζύζηεκα ςύμεο
Με ηε πξνεγνύκελε πξαθηηθή ζηξαγγαιηζκνύ ηνπ επηζηνκίνπ ζηελ έμνδν ηεο αληιίαο ζαιαζζηλνύ λεξνύ,
όπσο εμεηάζηεθε ζηελ παξάγξαθν 2.5.3, ν θηλεηήξαο πνπ νδεγεί ηελ αληιία ιεηηνπξγεί ζηηο νλνκαζηηθέο
ζηξνθέο, έρνληαο νλνκαζηηθή θαηαλάισζε ηζρύνο εθόζνλ ρξεζηκνπνηείηαη εθθηλεηήο αζηέξα-ηξηγώλνπ (Τ-
Γ). Με ην πξνηεηλόκελν πξνζαξκνζηηθό ζύζηεκα ειέγρνπ πνπ κεηαβάιιεη ηελ ηαρύηεηα αλαθνξάο πξνο ην
ξπζκηζηή ζηξνθώλ, ν αληηζηξνθέαο παξάγεη θπκαηνκνξθή ηάζεο κεηαβαιιόκελνπ πιάηνπο θαη ζπρλόηεηαο
γηα ηνλ έιεγρν ξνπήο θαη ηαρύηεηαο πεξηζηξνθήο ηνπ θηλεηήξα πνπ νδεγεί ηελ αληιία ζαιαζζηλνύ λεξνύ. Γηα
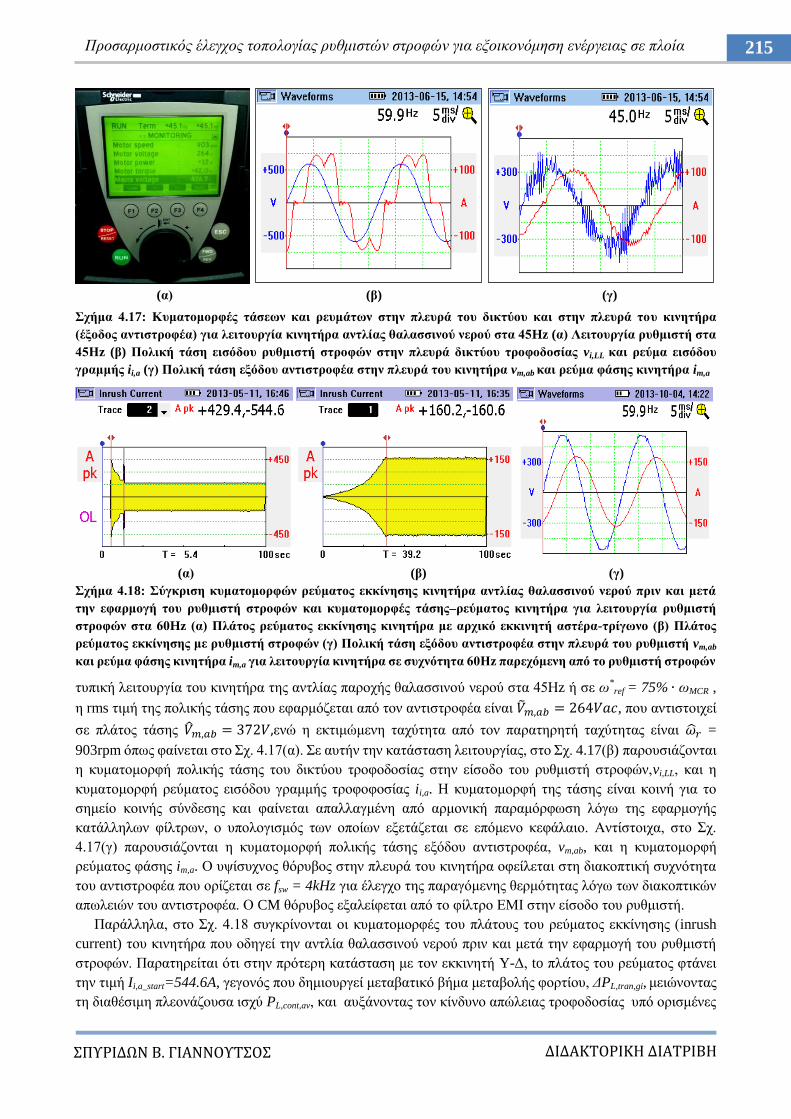
ΔΙΔΑΚΣΟΡΙΚΗ ΔΙΑΣΡΙΒΗ
ΠΤΡΙΔΩΝ Β. ΓΙΑΝΝΟΤΣΟ
215 Πξνζαξκνζηηθόο έιεγρνο ηνπνινγίαο ξπζκηζηώλ ζηξνθώλ γηα εμνηθνλόκεζε ελέξγεηαο ζε πινία
(α) (β) (γ)
ρήκα 4.17: Κπκαηνκνξθέο ηάζεσλ θαη ξεπκάησλ ζηελ πιεπξά ηνπ δηθηύνπ θαη ζηελ πιεπξά ηνπ θηλεηήξα
(έμνδνο αληηζηξνθέα) γηα ιεηηνπξγία θηλεηήξα αληιίαο ζαιαζζηλνύ λεξνύ ζηα 45Hz (α) Λεηηνπξγία ξπζκηζηή ζηα
45Ηz (β) Πνιηθή ηάζε εηζόδνπ ξπζκηζηή ζηξνθώλ ζηελ πιεπξά δηθηύνπ ηξνθνδνζίαο vi,LL θαη ξεύκα εηζόδνπ
γξακκήο ii,a (γ) Πνιηθή ηάζε εμόδνπ αληηζηξνθέα ζηελ πιεπξά ηνπ θηλεηήξα vm,ab θαη ξεύκα θάζεο θηλεηήξα im,a
(α) (β) (γ)
ρήκα 4.18: ύγθξηζε θπκαηνκνξθώλ ξεύκαηνο εθθίλεζεο θηλεηήξα αληιίαο ζαιαζζηλνύ λεξνύ πξηλ θαη κεηά
ηελ εθαξκνγή ηνπ ξπζκηζηή ζηξνθώλ θαη θπκαηνκνξθέο ηάζεο–ξεύκαηνο θηλεηήξα γηα ιεηηνπξγία ξπζκηζηή
ζηξνθώλ ζηα 60Hz (α) Πιάηνο ξεύκαηνο εθθίλεζεο θηλεηήξα κε αξρηθό εθθηλεηή αζηέξα-ηξίγσλν (β) Πιάηνο
ξεύκαηνο εθθίλεζεο κε ξπζκηζηή ζηξνθώλ (γ) Πνιηθή ηάζε εμόδνπ αληηζηξνθέα ζηελ πιεπξά ηνπ ξπζκηζηή vm,ab
θαη ξεύκα θάζεο θηλεηήξα im,a γηα ιεηηνπξγία θηλεηήξα ζε ζπρλόηεηα 60Ηz παξερόκελε από ην ξπζκηζηή ζηξνθώλ
ηππηθή ιεηηνπξγία ηνπ θηλεηήξα ηεο αληιίαο παξνρήο ζαιαζζηλνύ λεξνύ ζηα 45Ζz ή ζε σ*ref = 75% σMCR ,
ε rms ηηκή ηεο πνιηθήο ηάζεο πνπ εθαξκόδεηαη από ηνλ αληηζηξνθέα είλαη , πνπ αληηζηνηρεί
ζε πιάηνο ηάζεο ελώ ε εθηηκώκελε ηαρύηεηα από ηνλ παξαηεξεηή ηαρύηεηαο είλαη =
903rpm όπσο θαίλεηαη ζην ρ. 4.17(α). ε απηήλ ηελ θαηάζηαζε ιεηηνπξγίαο, ζην ρ. 4.17(β) παξνπζηάδνληαη
ε θπκαηνκνξθή πνιηθήο ηάζεο ηνπ δηθηύνπ ηξνθνδνζίαο ζηελ είζνδν ηνπ ξπζκηζηή ζηξνθώλ,vi,LL, θαη ε
θπκαηνκνξθή ξεύκαηνο εηζόδνπ γξακκήο ηξνθνθνζίαο ii,a. Ζ θπκαηνκνξθή ηεο ηάζεο είλαη θνηλή γηα ην
ζεκείν θνηλήο ζύλδεζεο θαη θαίλεηαη απαιιαγκέλε από αξκνληθή παξακόξθσζε ιόγσ ηεο εθαξκνγήο
θαηάιιεισλ θίιηξσλ, ν ππνινγηζκόο ησλ νπνίσλ εμεηάδεηαη ζε επόκελν θεθάιαην. Αληίζηνηρα, ζην ρ.
4.17(γ) παξνπζηάδνληαη ε θπκαηνκνξθή πνιηθήο ηάζεο εμόδνπ αληηζηξνθέα, vm,ab, θαη ε θπκαηνκνξθή
ξεύκαηνο θάζεο im,a. Ο πςίζπρλνο ζόξπβνο ζηελ πιεπξά ηνπ θηλεηήξα νθείιεηαη ζηε δηαθνπηηθή ζπρλόηεηα
ηνπ αληηζηξνθέα πνπ νξίδεηαη ζε fsw = 4kHz γηα έιεγρν ηεο παξαγόκελεο ζεξκόηεηαο ιόγσ ησλ δηαθνπηηθώλ
απσιεηώλ ηνπ αληηζηξνθέα. Ο CM ζόξπβνο εμαιείθεηαη από ην θίιηξν ΔΜΗ ζηελ είζνδν ηνπ ξπζκηζηή.
Παξάιιεια, ζην ρ. 4.18 ζπγθξίλνληαη νη θπκαηνκνξθέο ηνπ πιάηνπο ηνπ ξεύκαηνο εθθίλεζεο (inrush
current) ηνπ θηλεηήξα πνπ νδεγεί ηελ αληιία ζαιαζζηλνύ λεξνύ πξηλ θαη κεηά ηελ εθαξκνγή ηνπ ξπζκηζηή
ζηξνθώλ. Παξαηεξείηαη όηη ζηελ πξόηεξε θαηάζηαζε κε ηνλ εθθηλεηή Y-Γ, to πιάηνο ηνπ ξεύκαηνο θηάλεη
ηελ ηηκή Ii,a_start=544.6A, γεγνλόο πνπ δεκηνπξγεί κεηαβαηηθό βήκα κεηαβνιήο θνξηίνπ, ΓPL,tran,gi, κεηώλνληαο
ηε δηαζέζηκε πιενλάδνπζα ηζρύ PL,cont,av, θαη απμάλνληαο ηνλ θίλδπλν απώιεηαο ηξνθνδνζίαο ππό νξηζκέλεο
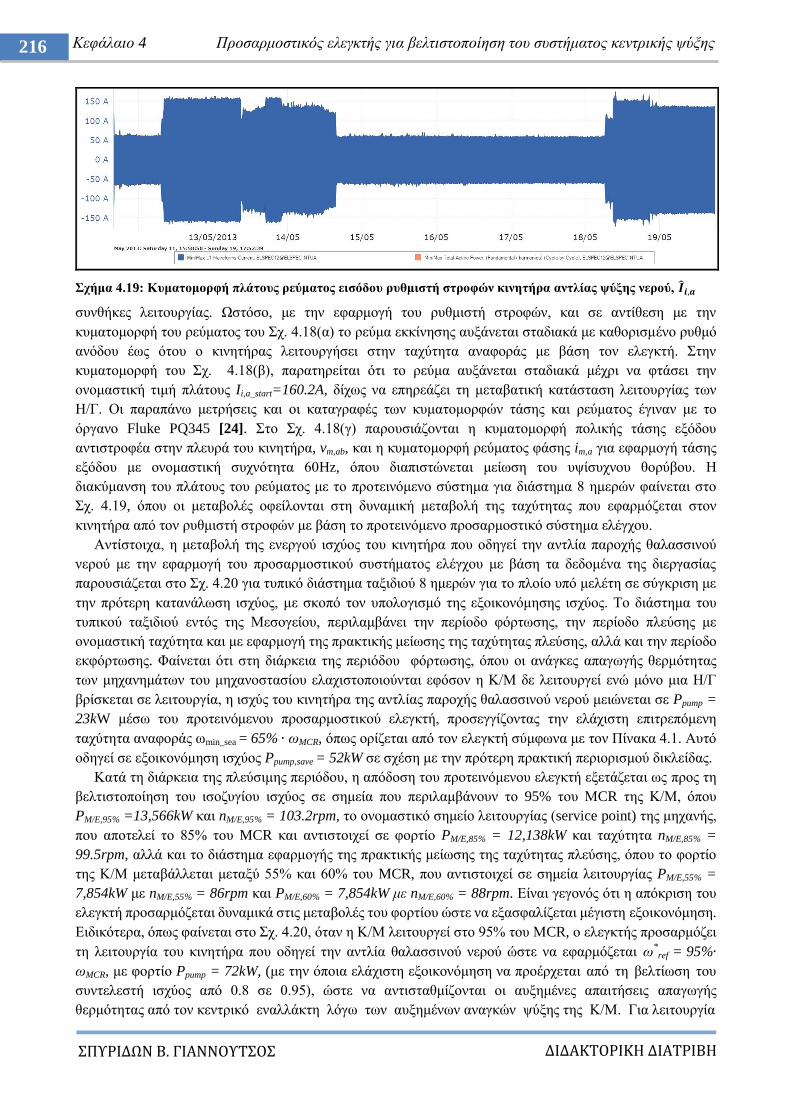
ΔΙΔΑΚΣΟΡΙΚΗ ΔΙΑΣΡΙΒΗ
ΠΤΡΙΔΩΝ Β. ΓΙΑΝΝΟΤΣΟ
216 Κεθάιαην 4 Πξνζαξκνζηηθόο ειεγθηήο γηα βειηηζηνπνίεζε ηνπ ζπζηήκαηνο θεληξηθήο ςύμεο
ρήκα 4.19: Κπκαηνκνξθή πιάηνπο ξεύκαηνο εηζόδνπ ξπζκηζηή ζηξνθώλ θηλεηήξα αληιίαο ςύμεο λεξνύ,
ζπλζήθεο ιεηηνπξγίαο. Χζηόζν, κε ηελ εθαξκνγή ηνπ ξπζκηζηή ζηξνθώλ, θαη ζε αληίζεζε κε ηελ
θπκαηνκνξθή ηνπ ξεύκαηνο ηνπ ρ. 4.18(α) ην ξεύκα εθθίλεζεο απμάλεηαη ζηαδηαθά κε θαζνξηζκέλν ξπζκό
αλόδνπ έσο όηνπ ν θηλεηήξαο ιεηηνπξγήζεη ζηελ ηαρύηεηα αλαθνξάο κε βάζε ηνλ ειεγθηή. ηελ
θπκαηνκνξθή ηνπ ρ. 4.18(β), παξαηεξείηαη όηη ην ξεύκα απμάλεηαη ζηαδηαθά κέρξη λα θηάζεη ηελ
νλνκαζηηθή ηηκή πιάηνπο Ii,a_start=160.2A, δίρσο λα επεξεάδεη ηε κεηαβαηηθή θαηάζηαζε ιεηηνπξγίαο ησλ
Ζ/Γ. Οη παξαπάλσ κεηξήζεηο θαη νη θαηαγξαθέο ησλ θπκαηνκνξθώλ ηάζεο θαη ξεύκαηνο έγηλαλ κε ην
όξγαλν Fluke PQ345 [24]. ην ρ. 4.18(γ) παξνπζηάδνληαη ε θπκαηνκνξθή πνιηθήο ηάζεο εμόδνπ
αληηζηξνθέα ζηελ πιεπξά ηνπ θηλεηήξα, vm,ab, θαη ε θπκαηνκνξθή ξεύκαηνο θάζεο im,a γηα εθαξκνγή ηάζεο
εμόδνπ κε νλνκαζηηθή ζπρλόηεηα 60Hz, όπνπ δηαπηζηώλεηαη κείσζε ηνπ πςίζπρλνπ ζνξύβνπ. Ζ
δηαθύκαλζε ηνπ πιάηνπο ηνπ ξεύκαηνο κε ην πξνηεηλόκελν ζύζηεκα γηα δηάζηεκα 8 εκεξώλ θαίλεηαη ζην
ρ. 4.19, όπνπ νη κεηαβνιέο νθείινληαη ζηε δπλακηθή κεηαβνιή ηεο ηαρύηεηαο πνπ εθαξκόδεηαη ζηνλ
θηλεηήξα από ηνλ ξπζκηζηή ζηξνθώλ κε βάζε ην πξνηεηλόκελν πξνζαξκνζηηθό ζύζηεκα ειέγρνπ.
Αληίζηνηρα, ε κεηαβνιή ηεο ελεξγνύ ηζρύνο ηνπ θηλεηήξα πνπ νδεγεί ηελ αληιία παξνρήο ζαιαζζηλνύ
λεξνύ κε ηελ εθαξκνγή ηνπ πξνζαξκνζηηθνύ ζπζηήκαηνο ειέγρνπ κε βάζε ηα δεδνκέλα ηεο δηεξγαζίαο
παξνπζηάδεηαη ζην ρ. 4.20 γηα ηππηθό δηάζηεκα ηαμηδηνύ 8 εκεξώλ γηα ην πινίν ππό κειέηε ζε ζύγθξηζε κε
ηελ πξόηεξε θαηαλάισζε ηζρύνο, κε ζθνπό ηνλ ππνινγηζκό ηεο εμνηθνλόκεζεο ηζρύνο. Σν δηάζηεκα ηνπ
ηππηθνύ ηαμηδηνύ εληόο ηεο Μεζνγείνπ, πεξηιακβάλεη ηελ πεξίνδν θόξησζεο, ηελ πεξίνδν πιεύζεο κε
νλνκαζηηθή ηαρύηεηα θαη κε εθαξκνγή ηεο πξαθηηθήο κείσζεο ηεο ηαρύηεηαο πιεύζεο, αιιά θαη ηελ πεξίνδν
εθθόξησζεο. Φαίλεηαη όηη ζηε δηάξθεηα ηεο πεξηόδνπ θόξησζεο, όπνπ νη αλάγθεο απαγσγήο ζεξκόηεηαο
ησλ κεραλεκάησλ ηνπ κεραλνζηαζίνπ ειαρηζηνπνηνύληαη εθόζνλ ε Κ/Μ δε ιεηηνπξγεί ελώ κόλν κηα Ζ/Γ
βξίζθεηαη ζε ιεηηνπξγία, ε ηζρύο ηνπ θηλεηήξα ηεο αληιίαο παξνρήο ζαιαζζηλνύ λεξνύ κεηώλεηαη ζε Ppump =
23kW κέζσ ηνπ πξνηεηλόκελνπ πξνζαξκνζηηθνύ ειεγθηή, πξνζεγγίδνληαο ηελ ειάρηζηε επηηξεπόκελε
ηαρύηεηα αλαθνξάο σmin_sea = 65% σMCR, όπσο νξίδεηαη από ηνλ ειεγθηή ζύκθσλα κε ηνλ Πίλαθα 4.1. Απηό
νδεγεί ζε εμνηθνλόκεζε ηζρύνο Ppump,save = 52kW ζε ζρέζε κε ηελ πξόηεξε πξαθηηθή πεξηνξηζκνύ δηθιείδαο.
Καηά ηε δηάξθεηα ηεο πιεύζηκεο πεξηόδνπ, ε απόδνζε ηνπ πξνηεηλόκελνπ ειεγθηή εμεηάδεηαη σο πξνο ηε
βειηηζηνπνίεζε ηνπ ηζνδπγίνπ ηζρύνο ζε ζεκεία πνπ πεξηιακβάλνπλ ην 95% ηνπ ΜCR ηεο Κ/Μ, όπνπ
PM/E,95% =13,566kW θαη nM/E,95% = 103.2rpm, ην νλνκαζηηθό ζεκείν ιεηηνπξγίαο (service point) ηεο κεραλήο,
πνπ απνηειεί ην 85% ηνπ MCR θαη αληηζηνηρεί ζε θνξηίν PM/E,85% = 12,138kW θαη ηαρύηεηα nM/E,85% =
99.5rpm, αιιά θαη ην δηάζηεκα εθαξκνγήο ηεο πξαθηηθήο κείσζεο ηεο ηαρύηεηαο πιεύζεο, όπνπ ην θνξηίν
ηεο Κ/Μ κεηαβάιιεηαη κεηαμύ 55% θαη 60% ηνπ MCR, πνπ αληηζηνηρεί ζε ζεκεία ιεηηνπξγίαο PM/E,55% =
7,854kW κε nM/E,55% = 86rpm θαη PM/E,60% = 7,854kW κε nM/E,60% = 88rpm. Δίλαη γεγνλόο όηη ε απόθξηζε ηνπ
ειεγθηή πξνζαξκόδεηαη δπλακηθά ζηηο κεηαβνιέο ηνπ θνξηίνπ ώζηε λα εμαζθαιίδεηαη κέγηζηε εμνηθνλόκεζε.
Δηδηθόηεξα, όπσο θαίλεηαη ζην ρ. 4.20, όηαλ ε Κ/Μ ιεηηνπξγεί ζην 95% ηνπ ΜCR, ν ειεγθηήο πξνζαξκόδεη
ηε ιεηηνπξγία ηνπ θηλεηήξα πνπ νδεγεί ηελ αληιία ζαιαζζηλνύ λεξνύ ώζηε λα εθαξκόδεηαη σ*ref = 95%
σMCR, κε θνξηίν Ppump = 72kW, (κε ηελ όπνηα ειάρηζηε εμνηθνλόκεζε λα πξνέξρεηαη από ηε βειηίσζε ηνπ
ζπληειεζηή ηζρύνο από 0.8 ζε 0.95), ώζηε λα αληηζηαζκίδνληαη νη απμεκέλεο απαηηήζεηο απαγσγήο
ζεξκόηεηαο από ηνλ θεληξηθό ελαιιάθηε ιόγσ ησλ απμεκέλσλ αλαγθώλ ςύμεο ηεο Κ/Μ. Γηα ιεηηνπξγία
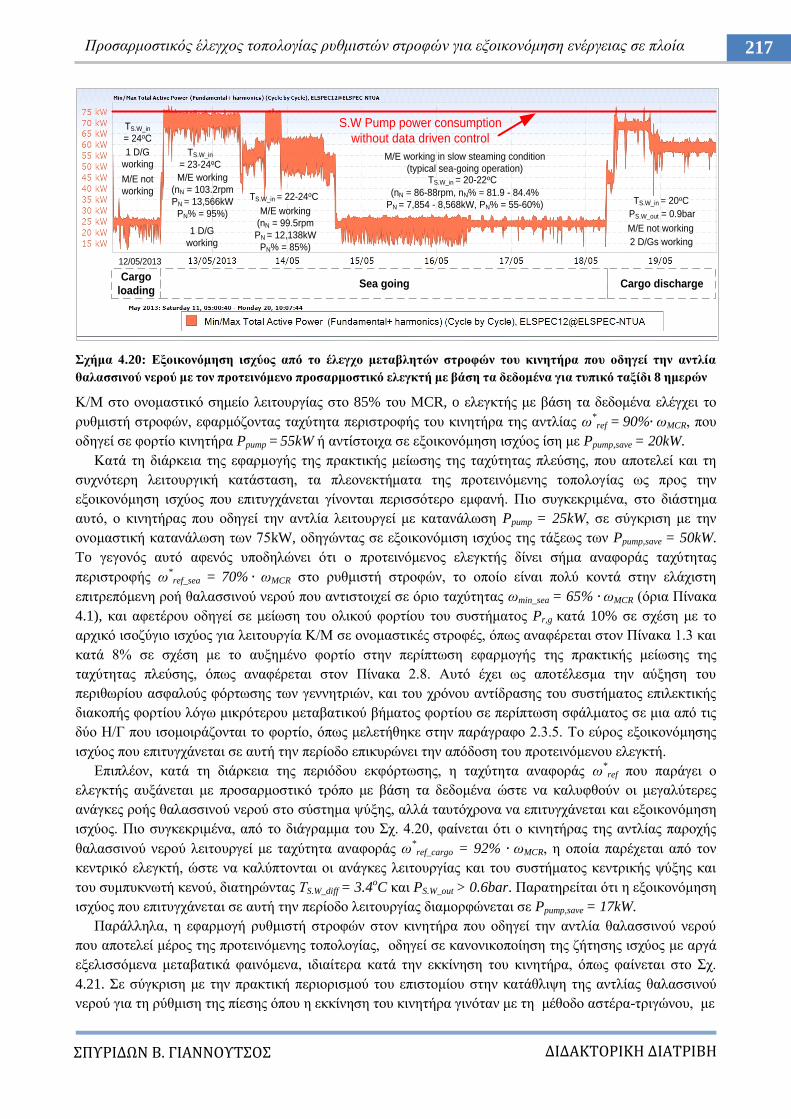
ΔΙΔΑΚΣΟΡΙΚΗ ΔΙΑΣΡΙΒΗ
ΠΤΡΙΔΩΝ Β. ΓΙΑΝΝΟΤΣΟ
217 Πξνζαξκνζηηθόο έιεγρνο ηνπνινγίαο ξπζκηζηώλ ζηξνθώλ γηα εμνηθνλόκεζε ελέξγεηαο ζε πινία
ρήκα 4.20: Δμνηθνλόκεζε ηζρύνο από ην έιεγρν κεηαβιεηώλ ζηξνθώλ ηνπ θηλεηήξα πνπ νδεγεί ηελ αληιία
ζαιαζζηλνύ λεξνύ κε ηνλ πξνηεηλόκελν πξνζαξκνζηηθό ειεγθηή κε βάζε ηα δεδνκέλα γηα ηππηθό ηαμίδη 8 εκεξώλ
Κ/Μ ζην νλνκαζηηθό ζεκείν ιεηηνπξγίαο ζην 85% ηνπ ΜCR, o ειεγθηήο κε βάζε ηα δεδνκέλα ειέγρεη ην
ξπζκηζηή ζηξνθώλ, εθαξκόδνληαο ηαρύηεηα πεξηζηξνθήο ηνπ θηλεηήξα ηεο αληιίαο σ*
ref = 90% σMCR, πνπ
νδεγεί ζε θνξηίν θηλεηήξα Ppump = 55kW ή αληίζηνηρα ζε εμνηθνλόκεζε ηζρύνο ίζε κε Ppump,save = 20kW.
Καηά ηε δηάξθεηα ηεο εθαξκνγήο ηεο πξαθηηθήο κείσζεο ηεο ηαρύηεηαο πιεύζεο, πνπ απνηειεί θαη ηε
ζπρλόηεξε ιεηηνπξγηθή θαηάζηαζε, ηα πιενλεθηήκαηα ηεο πξνηεηλόκελεο ηνπνινγίαο σο πξνο ηελ
εμνηθνλόκεζε ηζρύνο πνπ επηηπγράλεηαη γίλνληαη πεξηζζόηεξν εκθαλή. Πην ζπγθεθξηκέλα, ζην δηάζηεκα
απηό, ν θηλεηήξαο πνπ νδεγεί ηελ αληιία ιεηηνπξγεί κε θαηαλάισζε Ppump = 25kW, ζε ζύγθξηζε κε ηελ
νλνκαζηηθή θαηαλάισζε ησλ 75kW, νδεγώληαο ζε εμνηθνλόκηζε ηζρύνο ηεο ηάμεσο ησλ Ppump,save = 50kW.
To γεγνλόο απηό αθελόο ππνδειώλεη όηη ν πξνηεηλόκελνο ειεγθηήο δίλεη ζήκα αλαθνξάο ηαρύηεηαο
πεξηζηξνθήο σ*ref_sea = 70% σMCR ζην ξπζκηζηή ζηξνθώλ, ην νπνίν είλαη πνιύ θνληά ζηελ ειάρηζηε
επηηξεπόκελε ξνή ζαιαζζηλνύ λεξνύ πνπ αληηζηνηρεί ζε όξην ηαρύηεηαο σmin_sea = 65% σMCR (όξηα Πίλαθα
4.1), θαη αθεηέξνπ νδεγεί ζε κείσζε ηνπ νιηθνύ θνξηίνπ ηνπ ζπζηήκαηνο Pr,g θαηά 10% ζε ζρέζε κε ην
αξρηθό ηζνδύγην ηζρύνο γηα ιεηηνπξγία Κ/Μ ζε νλνκαζηηθέο ζηξνθέο, όπσο αλαθέξεηαη ζηνλ Πίλαθα 1.3 θαη
θαηά 8% ζε ζρέζε κε ην απμεκέλν θνξηίν ζηελ πεξίπησζε εθαξκνγήο ηεο πξαθηηθήο κείσζεο ηεο
ηαρύηεηαο πιεύζεο, όπσο αλαθέξεηαη ζηνλ Πίλαθα 2.8. Απηό έρεη σο απνηέιεζκα ηελ αύμεζε ηνπ
πεξηζσξίνπ αζθαινύο θόξησζεο ησλ γελλεηξηώλ, θαη ηνπ ρξόλνπ αληίδξαζεο ηνπ ζπζηήκαηνο επηιεθηηθήο
δηαθνπήο θνξηίνπ ιόγσ κηθξόηεξνπ κεηαβαηηθνύ βήκαηνο θνξηίνπ ζε πεξίπησζε ζθάικαηνο ζε κηα από ηηο
δύν Ζ/Γ πνπ ηζνκνηξάδνληαη ην θνξηίν, όπσο κειεηήζεθε ζηελ παξάγξαθν 2.3.5. Σν εύξνο εμνηθνλόκεζεο
ηζρύνο πνπ επηηπγράλεηαη ζε απηή ηελ πεξίνδν επηθπξώλεη ηελ απόδνζε ηνπ πξνηεηλόκελνπ ειεγθηή.
Δπηπιένλ, θαηά ηε δηάξθεηα ηεο πεξηόδνπ εθθόξησζεο, ε ηαρύηεηα αλαθνξάο σ*
ref πνπ παξάγεη ν
ειεγθηήο απμάλεηαη κε πξνζαξκνζηηθό ηξόπν κε βάζε ηα δεδνκέλα ώζηε λα θαιπθζνύλ νη κεγαιύηεξεο
αλάγθεο ξνήο ζαιαζζηλνύ λεξνύ ζην ζύζηεκα ςύμεο, αιιά ηαπηόρξνλα λα επηηπγράλεηαη θαη εμνηθνλόκεζε
ηζρύνο. Πην ζπγθεθξηκέλα, από ην δηάγξακκα ηνπ ρ. 4.20, θαίλεηαη όηη ν θηλεηήξαο ηεο αληιίαο παξνρήο
ζαιαζζηλνύ λεξνύ ιεηηνπξγεί κε ηαρύηεηα αλαθνξάο σ*
ref_cargo = 92% σMCR, ε νπνία παξέρεηαη από ηνλ
θεληξηθό ειεγθηή, ώζηε λα θαιύπηνληαη νη αλάγθεο ιεηηνπξγίαο θαη ηνπ ζπζηήκαηνο θεληξηθήο ςύμεο θαη
ηνπ ζπκππθλσηή θελνύ, δηαηεξώληαο ΣS.W_diff = 3.4oC θαη PS.W_out > 0.6bar. Παξαηεξείηαη όηη ε εμνηθνλόκεζε
ηζρύνο πνπ επηηπγράλεηαη ζε απηή ηελ πεξίνδν ιεηηνπξγίαο δηακνξθώλεηαη ζε Ppump,save = 17kW.
Παξάιιεια, ε εθαξκνγή ξπζκηζηή ζηξνθώλ ζηνλ θηλεηήξα πνπ νδεγεί ηελ αληιία ζαιαζζηλνύ λεξνύ
πνπ απνηειεί κέξνο ηεο πξνηεηλόκελεο ηνπνινγίαο, νδεγεί ζε θαλνληθνπνίεζε ηεο δήηεζεο ηζρύνο κε αξγά
εμειηζζόκελα κεηαβαηηθά θαηλόκελα, ηδηαίηεξα θαηά ηελ εθθίλεζε ηνπ θηλεηήξα, όπσο θαίλεηαη ζην ρ.
4.21. ε ζύγθξηζε κε ηελ πξαθηηθή πεξηνξηζκνύ ηνπ επηζηνκίνπ ζηελ θαηάζιηςε ηεο αληιίαο ζαιαζζηλνύ
λεξνύ γηα ηε ξύζκηζε ηεο πίεζεο όπνπ ε εθθίλεζε ηνπ θηλεηήξα γηλόηαλ κε ηε κέζνδν αζηέξα-ηξηγώλνπ, κε
Cargo
loading
12/05/2013
Sea going Cargo discharge
TS.W_in
= 24oC
1 D/G
working
M/E not
working
TS.W_in
= 23-24oC
M/E working
(nN = 103.2rpm
PN = 13,566kW
PN% = 95%)
1 D/G
working
TS.W_in = 22-24oC
M/E working
(nN = 99.5rpm
PN = 12,138kW
PN% = 85%)
TS.W_in = 20-22oC
M/E working in slow steaming condition
(typical sea-going operation)
(nN = 86-88rpm, nN% = 81.9 - 84.4%
PN = 7,854 - 8,568kW, PN% = 55-60%)
M/E not working
TS.W_in = 20oC
2 D/Gs working
S.W Pump power consumption
without data driven control
PS.W_out = 0.9bar
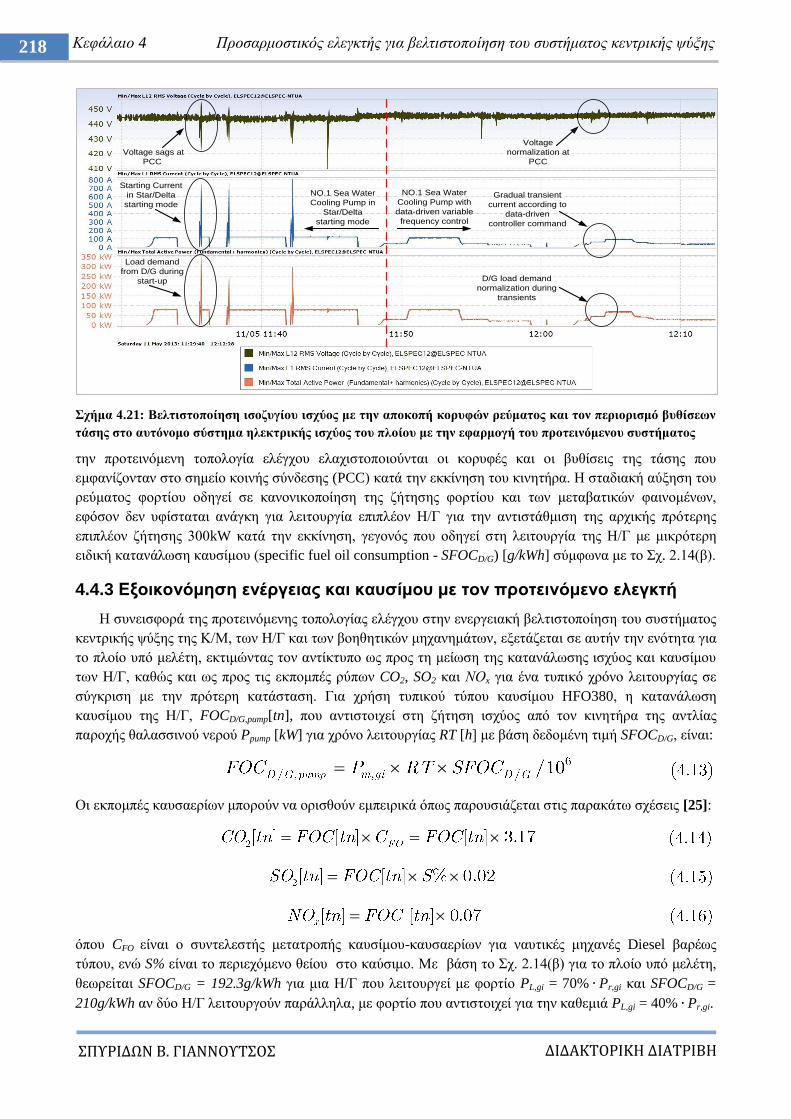
ΔΙΔΑΚΣΟΡΙΚΗ ΔΙΑΣΡΙΒΗ
ΠΤΡΙΔΩΝ Β. ΓΙΑΝΝΟΤΣΟ
218 Κεθάιαην 4 Πξνζαξκνζηηθόο ειεγθηήο γηα βειηηζηνπνίεζε ηνπ ζπζηήκαηνο θεληξηθήο ςύμεο
ρήκα 4.21: Βειηηζηνπνίεζε ηζνδπγίνπ ηζρύνο κε ηελ απνθνπή θνξπθώλ ξεύκαηνο θαη ηνλ πεξηνξηζκό βπζίζεσλ
ηάζεο ζην απηόλνκν ζύζηεκα ειεθηξηθήο ηζρύνο ηνπ πινίνπ κε ηελ εθαξκνγή ηνπ πξνηεηλόκελνπ ζπζηήκαηνο
ηελ πξνηεηλόκελε ηνπνινγία ειέγρνπ ειαρηζηνπνηνύληαη νη θνξπθέο θαη νη βπζίζεηο ηεο ηάζεο πνπ
εκθαλίδνληαλ ζην ζεκείν θνηλήο ζύλδεζεο (PCC) θαηά ηελ εθθίλεζε ηνπ θηλεηήξα. Ζ ζηαδηαθή αύμεζε ηνπ
ξεύκαηνο θνξηίνπ νδεγεί ζε θαλνληθνπνίεζε ηεο δήηεζεο θνξηίνπ θαη ησλ κεηαβαηηθώλ θαηλνκέλσλ,
εθόζνλ δελ πθίζηαηαη αλάγθε γηα ιεηηνπξγία επηπιένλ Ζ/Γ γηα ηελ αληηζηάζκηζε ηεο αξρηθήο πξόηεξεο
επηπιένλ δήηεζεο 300kW θαηά ηελ εθθίλεζε, γεγνλόο πνπ νδεγεί ζηε ιεηηνπξγία ηεο Ζ/Γ κε κηθξόηεξε
εηδηθή θαηαλάισζε θαπζίκνπ (specific fuel oil consumption - SFOCD/G) [g/kWh] ζύκθσλα κε ην ρ. 2.14(β).
4.4.3 Δμνηθνλόκεζε ελέξγεηαο θαη θαπζίκνπ κε ηνλ πξνηεηλόκελν ειεγθηή
Ζ ζπλεηζθνξά ηεο πξνηεηλόκελεο ηνπνινγίαο ειέγρνπ ζηελ ελεξγεηαθή βειηηζηνπνίεζε ηνπ ζπζηήκαηνο
θεληξηθήο ςύμεο ηεο Κ/Μ, ησλ Ζ/Γ θαη ησλ βνεζεηηθώλ κεραλεκάησλ, εμεηάδεηαη ζε απηήλ ηελ ελόηεηα γηα
ην πινίν ππό κειέηε, εθηηκώληαο ηνλ αληίθηππν σο πξνο ηε κείσζε ηεο θαηαλάισζεο ηζρύνο θαη θαπζίκνπ
ησλ Ζ/Γ, θαζώο θαη σο πξνο ηηο εθπνκπέο ξύπσλ CO2, SO2 θαη ΝΟx γηα έλα ηππηθό ρξόλν ιεηηνπξγίαο ζε
ζύγθξηζε κε ηελ πξόηεξε θαηάζηαζε. Γηα ρξήζε ηππηθνύ ηύπνπ θαπζίκνπ ΖFO380, ε θαηαλάισζε
θαπζίκνπ ηεο Ζ/Γ, FOCD/G,pump[tn], πνπ αληηζηνηρεί ζηε δήηεζε ηζρύνο από ηνλ θηλεηήξα ηεο αληιίαο
παξνρήο ζαιαζζηλνύ λεξνύ Ppump [kW] γηα ρξόλν ιεηηνπξγίαο RT [h] κε βάζε δεδνκέλε ηηκή SFOCD/G, είλαη:
Οη εθπνκπέο θαπζαεξίσλ κπνξνύλ λα νξηζζνύλ εκπεηξηθά όπσο παξνπζηάδεηαη ζηηο παξαθάησ ζρέζεηο [25]:
όπνπ CFO είλαη ν ζπληειεζηήο κεηαηξνπήο θαπζίκνπ-θαπζαεξίσλ γηα λαπηηθέο κεραλέο Diesel βαξέσο
ηύπνπ, ελώ S% είλαη ην πεξηερόκελν ζείνπ ζην θαύζηκν. Με βάζε ην ρ. 2.14(β) γηα ην πινίν ππό κειέηε,
ζεσξείηαη SFOCD/G = 192.3g/kWh γηα κηα Ζ/Γ πνπ ιεηηνπξγεί κε θνξηίν PL,gi = 70% Pr,gi θαη SFOCD/G =
210g/kWh αλ δύν Ζ/Γ ιεηηνπξγνύλ παξάιιεια, κε θνξηίν πνπ αληηζηνηρεί γηα ηελ θαζεκηά PL,gi = 40% Pr,gi.
NO.1 Sea Water
Cooling Pump in
Star/Delta
starting mode
NO.1 Sea Water
Cooling Pump with
data-driven variable
frequency control
Voltage sags at
PCC
Starting Current
in Star/Delta
starting mode
Load demand
from D/G during
start-up
Voltage
normalization at
PCC
Gradual transient
current according to
data-driven
controller command
D/G load demand
normalization during
transients
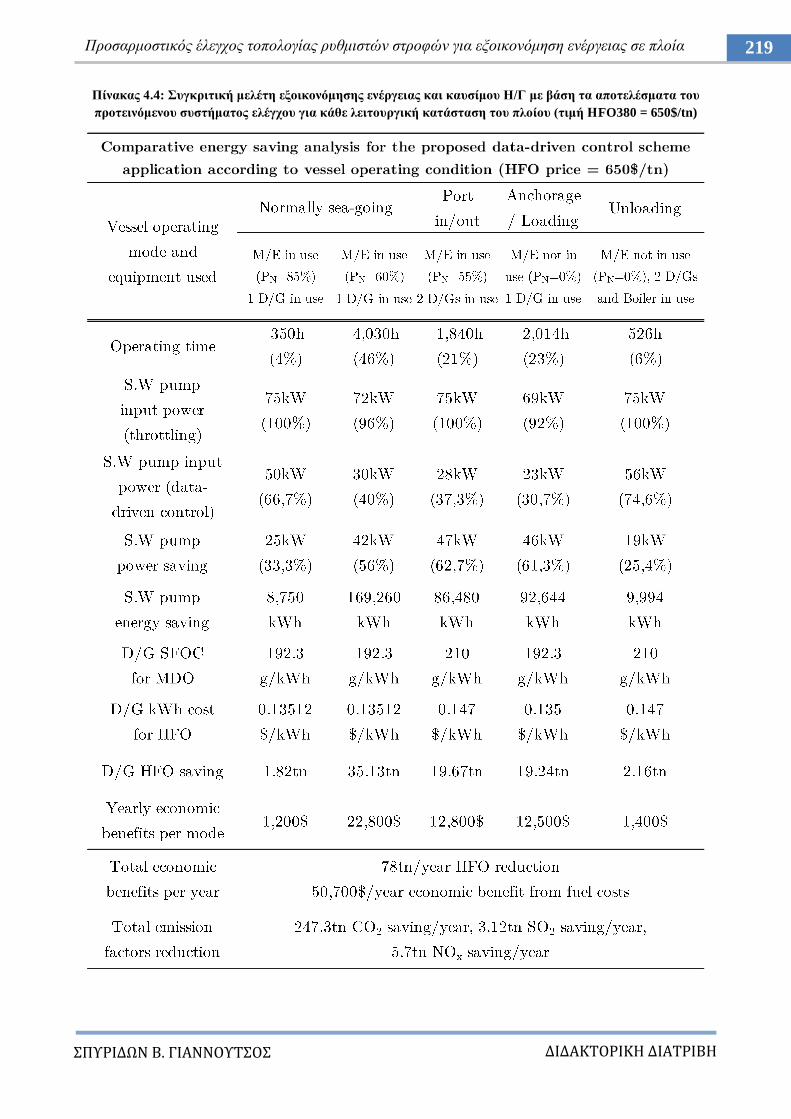
ΔΙΔΑΚΣΟΡΙΚΗ ΔΙΑΣΡΙΒΗ
ΠΤΡΙΔΩΝ Β. ΓΙΑΝΝΟΤΣΟ
219 Πξνζαξκνζηηθόο έιεγρνο ηνπνινγίαο ξπζκηζηώλ ζηξνθώλ γηα εμνηθνλόκεζε ελέξγεηαο ζε πινία
Πίλαθαο 4.4: πγθξηηηθή κειέηε εμνηθνλόκεζεο ελέξγεηαο θαη θαπζίκνπ Η/Γ κε βάζε ηα απνηειέζκαηα ηνπ
πξνηεηλόκελνπ ζπζηήκαηνο ειέγρνπ γηα θάζε ιεηηνπξγηθή θαηάζηαζε ηνπ πινίνπ (ηηκή ΗFO380 = 650$/tn)
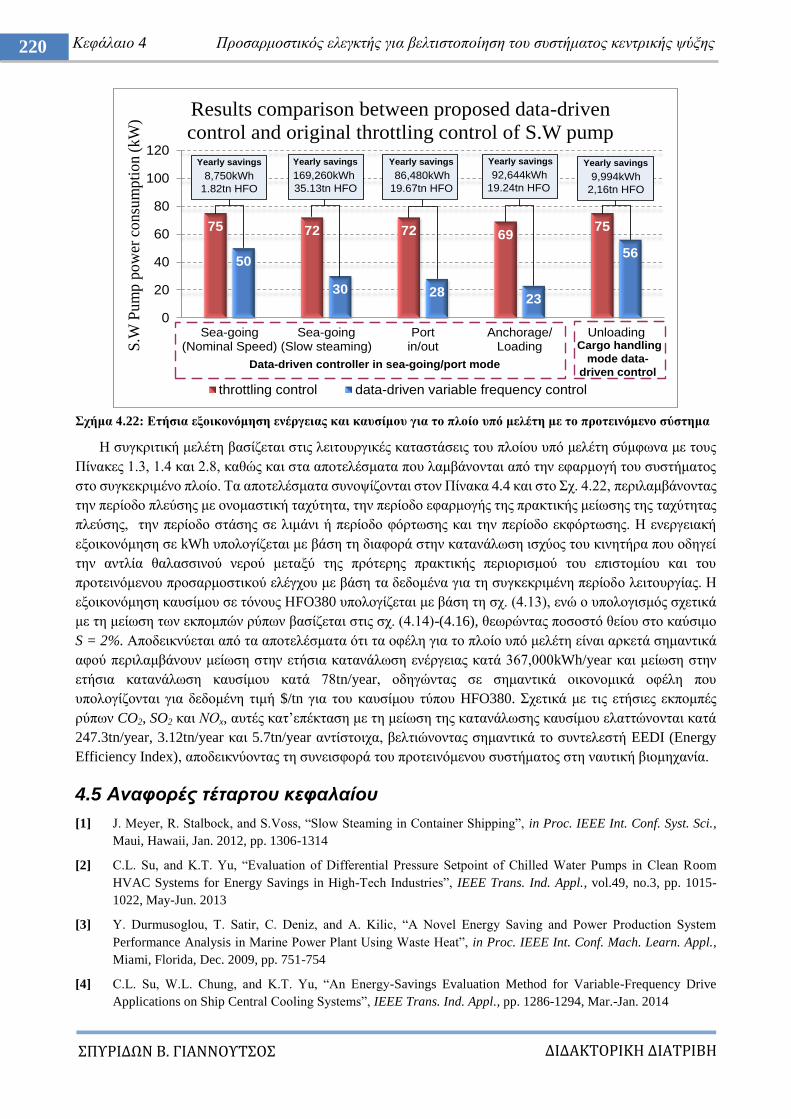
ΔΙΔΑΚΣΟΡΙΚΗ ΔΙΑΣΡΙΒΗ
ΠΤΡΙΔΩΝ Β. ΓΙΑΝΝΟΤΣΟ
220 Κεθάιαην 4 Πξνζαξκνζηηθόο ειεγθηήο γηα βειηηζηνπνίεζε ηνπ ζπζηήκαηνο θεληξηθήο ςύμεο
ρήκα 4.22: Δηήζηα εμνηθνλόκεζε ελέξγεηαο θαη θαπζίκνπ γηα ην πινίν ππό κειέηε κε ην πξνηεηλόκελν ζύζηεκα
Ζ ζπγθξηηηθή κειέηε βαζίδεηαη ζηηο ιεηηνπξγηθέο θαηαζηάζεηο ηνπ πινίνπ ππό κειέηε ζύκθσλα κε ηνπο
Πίλαθεο 1.3, 1.4 θαη 2.8, θαζώο θαη ζηα απνηειέζκαηα πνπ ιακβάλνληαη από ηελ εθαξκνγή ηνπ ζπζηήκαηνο
ζην ζπγθεθξηκέλν πινίν. Σα απνηειέζκαηα ζπλνςίδνληαη ζηνλ Πίλαθα 4.4 θαη ζην ρ. 4.22, πεξηιακβάλνληαο
ηελ πεξίνδν πιεύζεο κε νλνκαζηηθή ηαρύηεηα, ηελ πεξίνδν εθαξκνγήο ηεο πξαθηηθήο κείσζεο ηεο ηαρύηεηαο
πιεύζεο, ηελ πεξίνδν ζηάζεο ζε ιηκάλη ή πεξίνδν θόξησζεο θαη ηελ πεξίνδν εθθόξησζεο. Ζ ελεξγεηαθή
εμνηθνλόκεζε ζε kWh ππνινγίδεηαη κε βάζε ηε δηαθνξά ζηελ θαηαλάισζε ηζρύνο ηνπ θηλεηήξα πνπ νδεγεί
ηελ αληιία ζαιαζζηλνύ λεξνύ κεηαμύ ηεο πξόηεξεο πξαθηηθήο πεξηνξηζκνύ ηνπ επηζηνκίνπ θαη ηνπ
πξνηεηλόκελνπ πξνζαξκνζηηθνύ ειέγρνπ κε βάζε ηα δεδνκέλα γηα ηε ζπγθεθξηκέλε πεξίνδν ιεηηνπξγίαο. Ζ
εμνηθνλόκεζε θαπζίκνπ ζε ηόλνπο ΖFO380 ππνινγίδεηαη κε βάζε ηε ζρ. (4.13), ελώ ν ππνινγηζκόο ζρεηηθά
κε ηε κείσζε ησλ εθπνκπώλ ξύπσλ βαζίδεηαη ζηηο ζρ. (4.14)-(4.16), ζεσξώληαο πνζνζηό ζείνπ ζην θαύζηκν
S = 2%. Aπνδεηθλύεηαη από ηα απνηειέζκαηα όηη ηα νθέιε γηα ην πινίν ππό κειέηε είλαη αξθεηά ζεκαληηθά
αθνύ πεξηιακβάλνπλ κείσζε ζηελ εηήζηα θαηαλάισζε ελέξγεηαο θαηά 367,000kWh/year θαη κείσζε ζηελ
εηήζηα θαηαλάισζε θαπζίκνπ θαηά 78tn/year, νδεγώληαο ζε ζεκαληηθά νηθνλνκηθά νθέιε πνπ
ππνινγίδνληαη γηα δεδνκέλε ηηκή $/tn γηα ηνπ θαπζίκνπ ηύπνπ HFO380. ρεηηθά κε ηηο εηήζηεο εθπνκπέο
ξύπσλ CO2, SO2 θαη ΝΟx, απηέο θαη‟επέθηαζε κε ηε κείσζε ηεο θαηαλάισζεο θαπζίκνπ ειαηηώλνληαη θαηά
247.3tn/year, 3.12tn/year θαη 5.7tn/year αληίζηνηρα, βειηηώλνληαο ζεκαληηθά ην ζπληειεζηή EEDI (Energy
Efficiency Index), απνδεηθλύνληαο ηε ζπλεηζθνξά ηνπ πξνηεηλόκελνπ ζπζηήκαηνο ζηε λαπηηθή βηνκεραλία.
4.5 Αναθοπέρ ηέηαπηος κεθαλαίος
[1] J. Meyer, R. Stalbock, and S.Voss, “Slow Steaming in Container Shipping”, in Proc. IEEE Int. Conf. Syst. Sci.,
Maui, Hawaii, Jan. 2012, pp. 1306-1314
[2] C.L. Su, and K.T. Yu, “Evaluation of Differential Pressure Setpoint of Chilled Water Pumps in Clean Room
HVAC Systems for Energy Savings in High-Tech Industries”, IEEE Trans. Ind. Appl., vol.49, no.3, pp. 1015-
1022, May-Jun. 2013
[3] Y. Durmusoglou, T. Satir, C. Deniz, and A. Kilic, “A Novel Energy Saving and Power Production System
Performance Analysis in Marine Power Plant Using Waste Heat”, in Proc. IEEE Int. Conf. Mach. Learn. Appl.,
Miami, Florida, Dec. 2009, pp. 751-754
[4] C.L. Su, W.L. Chung, and K.T. Yu, “An Energy-Savings Evaluation Method for Variable-Frequency Drive
Applications on Ship Central Cooling Systems”, IEEE Trans. Ind. Appl., pp. 1286-1294, Mar.-Jan. 2014
75 72 72 6975
50
30 2823
56
0
20
40
60
80
100
120
Sea-going(Nominal Speed)
Sea-going(Slow steaming)
Portin/out
Anchorage/Loading
Unloading
S.W
Pu
mp
po
wer
co
nsu
mp
tio
n (
kW
)
Results comparison between proposed data-driven
control and original throttling control of S.W pump
throttling control data-driven variable frequency control
Yearly savings
8,750kWh
1.82tn HFO
Yearly savings
169,260kWh
35.13tn HFO
Yearly savings
86,480kWh
19.67tn HFO
Yearly savings
92,644kWh
19.24tn HFO
Yearly savings
9,994kWh
2,16tn HFO
Data-driven controller in sea-going/port mode
Cargo handling
mode data-
driven control
ΔΙΔΑΚΣΟΡΙΚΗ ΔΙΑΣΡΙΒΗ
ΠΤΡΙΔΩΝ Β. ΓΙΑΝΝΟΤΣΟ
221 Πξνζαξκνζηηθόο έιεγρνο ηνπνινγίαο ξπζκηζηώλ ζηξνθώλ γηα εμνηθνλόκεζε ελέξγεηαο ζε πινία
[5] J.A. Rooks and A. K. Wallace, “Energy efficiency of VSDs”, IEEE Ind. Appl. Mag., vol.10, no.3, pp. 57-61,
May-Jun. 2004
[6] F.J.T.E. Ferreira, J.A.C. Fong, and A.T. de Almeida, “Eco-analysis of Variable Speed Drives for Flow
Regulation in Pumping Systems”, IEEE Trans. Ind. Electron., vol. 58, no. 6, pp. 2117-2125, Jun. 2011
[7] A.T. Almeida, F.J Ferreira, and D. Both, “Technical and economical considerations in the application of variable-
speed drives with electric motor systems”, IEEE Trans. Ind. Appl.,vol.41,no.1, pp.188-199,Jan.-Feb. 2005
[8] G. Dong, and O. Ojo, “Efficiency optimizing control of induction motor using natural variables”, IEEE Trans.
Ind. Electron., vol. 53, no. 6, pp. 1791 -1798, Dec. 2006
[9] E.P. Wiechmann, P. Aqueveque, R. Burgos, and J. Rodriguez, “On the efficiency of voltage source and current
source inverters for high-power drives”, IEEE Trans. Ind. Electron., vol. 55, no. 4, pp. 1771 -1782, Apr. 2008
[10] D.G. Holmes, B.P. McGrath, and S.G Parker, “Current Regulation Strategies for Vector-Controlled Induction
Motor Drives”, IEEE Trans. Ind. Electron., vol. 59, no. 10, pp. 3680 – 3689, Oct. 2012
[11] J. Arribas, and C. Gonzalez, “Optimal vector control of pumping and ventilation induction motor drives”, IEEE
Trans. Ind. Electron., vol. 49, no. 4, pp. 889 -895, Aug. 2002
[12] D. Gritter, S.S. Kalsi, and N. Henderson, “Variable speed electric drive options for electric ships”, in Proc. IEEE
Elect. Ship Techn. Symp., Philadelphia, Pennsylvania, pp. 347-354, Jul. 2005
[13] P.G. Kini, R.C. Bansal, and R.S. Aithal, “Performance analysis of centrifugal pumps subjected to voltage
variation and unbalance”, IEEE Trans. Ind. Electron., vol. 55, no. 2, pp. 562-569, Feb. 2008
[14] T. Ahohen, J. Tamminen, J. Ahola, and J. Kestila, “Frequency-Converter-Based Hybrid Estimation Method for
the Centrifugal Pump Operational State”, IEEE Trans. Ind. Electron., vol. 59, no. 12, pp. 4803 - 4809, Dec. 2012
[15] D. Xuewu, and G. Zhivei, “From Model, Signal to Knowledge: A Data-Driven Perspective of Fault Detection
and Diagnosis”, IEEE Trans. Ind. Inf., vol. 9, no. 4, , pp. 2226 -2238, Nov. 2013
[16] S. Yin, H. Luo, and S.X. Ding, “Real Time Implementation of Fault Tolerant Control Systems With Performance
Optimization”, IEEE Trans. Ind. Electron., vol. 61, no. 5, pp. 2402 -2411, May 2014
[17] S. Yin, S.X. Ding, A. Haghani, H. Hao, and P. Zhang, “A comparison study of basic data-driven fault diagnosis
and process monitoring methods on the benchmark Tennessee Eastman process”, J. of Process Control, vol. 22,
no. 9, pp. 1567-1581, Oct. 2012
[18] W. Zhuo, and L. Derong, “A Data-Based State Feedback Control Method for a Class of Nonlinear Systems”,
IEEE Trans. Ind. Inf., vol. 9, no. 4, pp. 2284 -2292, Nov. 2013
[19] H. Zhongsheng, and Z. Yuanming, “Controller-Dynamic-Linearization-Based Model Free Adaptive Control for
Discrete-Time Nonlinear Systems”, IEEE Trans. Ind. Inf., vol. 9, no. 4, pp. 2301-2309, Nov. 2013
[20] K.G. Papadopoulos, E.N. Papastefanaki, and N.I. Margaris, “Explicit Analytical PID Tuning Rules for the Design
of Type-III Control Loops”, IEEE Trans. Ind. Electron., vol. 60 no. 10, pp. 4650 - 4664, Oct. 2013
[21] D. Xiao-Gang, D. Hua, and L. Han-Xiong, “A Saturation-Based Tuning Method for Fuzzy PID Controller”,
IEEE Trans. Ind. Electron., vol. 60, no. 11, pp. 5177-5185, Nov. 2013
[22] C.C. Hang, K.J. Astrom and W.K. Ho, "Refinements of the Ziegler-Nichols tuning formula", IEE Proceedings D
- Control Theory and Appl., vol. 138, no. 2, pp. 111-118, March 1991.
[23] A.S. Bazanella, L.F.A. Pereira and A.Parraga, "A New Method for PID Tuning Including Plants Without
Ultimate Frequency", IEEE Trans. on Control Sys. Techn., vol. 25, no. 2, pp. 637-644, March 2017
[24] Fluke, “Fluke PQ-345 Clamp Meter manual”, [Online] Available: http://en-us.fluke.com/products/power-
quality-analyzers/fluke-345-clamp-meter.html
[25] A. Sarvi, C.J. Fogelholm and R. Zevenhoven: “Emissions from largescale medium-speed diesel engines: 2.
Influence of fuel type and operating mode”, J. of Fuel Process. Techn., Vol. 89, No. 5, pp. 520-527 , 2008
ΔΙΔΑΚΣΟΡΙΚΗ ΔΙΑΣΡΙΒΗ
ΠΤΡΙΔΩΝ Β. ΓΙΑΝΝΟΤΣΟ
222 Κεθάιαην 5 Πξνζαξκνζηηθόο ειεγθηήο γηα βειηηζηνπνίεζε ηνπ ζπζηήκαηνο εμαεξηζκνύ
Κεθάιαην 5
Πξνηεηλόκελνο πξνζαξκνζηηθόο ειεγθηήο γηα
βειηηζηνπνίεζε ηνπ ζπζηήκαηνο εμαεξηζκνύ
5.1 Διζαγυγή
Ο ζηόρνο ηνπ ζπζηήκαηνο εμαεξηζκνύ ηνπ κεραλνζηαζίνπ ηνπ πινίνπ, πνπ πεξηιακβάλεη αλεκηζηήξεο
αμνληθήο ξνήο νδεγνύκελνπο από ειεθηξηθνύο θηλεηήξεο, είλαη ε παξνρή απαξαίηεηεο ξνήο αέξα γηα θαύζε
θπξίσο ζηνπο κεγαιύηεξνπο θαηαλαισηέο ηνπ κεραλνζηαζίνπ, όπσο ε Κ/Μ, νη Ζ/Γ θαη ν ιέβεηαο θαπζίκνπ,
θαη ηαπηόρξνλα ε απαγσγή ζεξκόηεηαο από ηα παξαπάλσ κεραλήκαηα. Ζ δηαζηαζηνιόγεζε ησλ
αλεκηζηήξσλ γίλεηαη από ην λαππεγίν έηζη ώζηε λα θαιύπηνληαη νη αλάγθεο παξνρήο αέξα θαύζεο θαη
απαγσγήο ζεξκόηεηαο γηα ιεηηνπξγία ηεο Κ/Μ, H/Γ θαη ιέβεηα ζην 100% ηνπ κέγηζηνπ θνξηίνπ (MCR), ην
νπνίν νδεγεί ζε ζπλερόκελε ιεηηνπξγία ησλ θηλεηήξσλ ζηηο νλνκαζηηθέο ζηξνθέο θαη ηζρύ, γεγνλόο πνπ δελ
αληηζηνηρεί ζηηο κεηαβαιιόκελεο πξαγκαηηθέο απαηηήζεηο ξνήο αέξα αλάινγα κε ηηο ζπλζήθεο ιεηηνπξγίαο
ηνπ πινίνπ θαη δελ εμαζθαιίδεη εμνηθνλόκεζε ηζρύνο. Όπσο δηαπηζηώζεθε από ηε κειέηε ηεο παξαγξάθνπ
γηα ην ηππηθό πινίν ππό κειέηε, ιόγσ ησλ κεηαβαιιόκελσλ ιεηηνπξγηθώλ θαηαζηάζεσλ ηνπ πινίνπ, θαη
θπξίσο ιόγσ ηεο εθαξκνγήο ηεο πξαθηηθήο κείσζεο ηεο ηαρύηεηαο πιεύζεο [1], δεκηνπξγείηαη πεξηζώξην
εμνηθνλόκεζεο ηζρύνο πνπ πξνέξρεηαη από ηηο κεησκέλεο αλάγθεο παξνρήο αέξα γηα ηε ζπλερή ιεηηνπξγία
ησλ επηκέξνπο κεραλεκάησλ. Δμεηάδνληαο ηε δπλαηόηεηα κείσζεο ηεο παξνρήο αέξα κεηαβάιινληαο ηηο
ζηξνθέο ησλ θηλεηήξσλ πνπ νδεγνύλ ηνπο αλεκηζηήξεο κε ηε ρξήζε ξπζκηζηώλ ζηξνθώλ, παξαηεξείηαη όηη
γηα κείσζε ηεο παξνρήο αέξα θαηά 50%, ε ηζρύο κεηώλεηαη ζεσξεηηθά ζην 12.5% ηεο νλνκαζηηθήο ηζρύνο
Pfan,MCR, έρνληαο ζεκαληηθή επίδξαζε ζην ηζνδύγην ηζρύνο ζε ζρέζε κε ηελ πξνεγνύκελε θαηάζηαζε.
Οη πεξηζζόηεξεο κειέηεο ζρεηηθέο κε ηελ απόδνζε ηεο εθαξκνγήο ξπζκηζηώλ ζηξνθώλ ζε επαγσγηθνύο
θηλεηήξεο γηα ηελ νδήγεζε αλεκηζηήξσλ θαη αληιηώλ βαζίδνληαη ζε επαξθή πνζνηηθή γλώζε ησλ
παξακέηξσλ θαη ηνπ κνληέινπ ηεο δηεξγαζίαο θαη πεξηνξίδνληαη ζε κηα δεδνκέλε ιεηηνπξγηθή θαηάζηαζε,
ώζηε λα βειηηζηνπνηήζνπλ ηελ απόδνζε ηνπ ξπζκηζηή ζηξνθώλ πνπ ρξεζηκνπνηείηαη [2] – [5]. Δπηπιένλ
εμεηάδνληαη πεξηπηώζεηο κεηαβνιήο ηεο απόδνζεο ηνπ ξπζκηζηή ζηξνθώλ θαηά ηελ νδήγεζε αμνληθώλ
αλεκηζηήξσλ γηα κεηαβνιέο ηεο ηάζεο ηξνθνδνζίαο θαη γηα αζπκκεηξία ηνπ θνξηίνπ [6] – [8]. Χζηόζν,
εθόζνλ ε ιεηηνπξγία ησλ θηλεηήξσλ πνπ νδεγνύλ ηνπο αλεκηζηήξεο ζπζρεηίδεηαη κε ηε ζπγθεθξηκέλε
δηεξγαζία εμαεξηζκνύ ηνπ κεραλνζηαζίνπ, όπνπ νη απαηηήζεηο παξνρήο αέξα κεηαβάιινληαη δπλακηθά ζε
ζρέζε κε ηε ιεηηνπξγηθή θαηάζηαζε ηεο Κ/Μ θαη ησλ βνεζεηηθώλ κεραλεκάησλ, ε ξύζκηζε ηεο ηαρύηεηαο
πεξηζηξνθήο σfan, απιά κε βάζε ηε κνληεινπνίεζε ηνπ ζπζηήκαηνο δελ είλαη επαξθήο θαη κπνξεί λα ζέζεη
ζε θίλδπλν ηελ αζθάιεηα θαη ηελ αμηνπηζηία ηνπ εμνπιηζκνύ. Ο ζζελαξόο πξνζαξκνζηηθόο έιεγρνο κε βάζε
ηα δεδνκέλα, από ηελ άιιε, κπνξεί λα ρξεζηκνπνηεζεί γηα ηνλ έιεγρν θαη ηε δηάγλσζε ζθαικάησλ ζε
πνιύπινθεο βηνκεραληθέο δηεξγαζίεο [9]. Με απηόλ ηνλ ηξόπν, κπνξεί λα πινπνηεζεί ζύζηεκα πνπ
βαζίδεηαη ζε κεηξήζεηο ζε πξαγκαηηθό ρξόλν, ην νπνίν ρξεζηκνπνηεί κεζόδνπο δεηγκαηνιεςίαο θαη
δπλακηθήο γξακκηθνπνίεζεο ησλ δηαλπζκάησλ θαηάζηαζεο κέζσ παξαηεξεηή γηα ηελ απηνξύζκηζε ηνπ
ειεγθηή ώζηε λα επηηεπρζεί ζζελαξόο έιεγρνο κε γξακκηθώλ, ρξνληθά κεηαβιεηώλ ζπζηεκάησλ [10]–[15].
Ο ζηόρνο ηνπ πξνηεηλόκελνπ ζπζηήκαηνο ειέγρνπ ζε απηήλ ηελ πεξίπησζε, είλαη ε ιεηηνπξγία ησλ
θηλεηήξσλ πνπ νδεγνύλ ηνπο αλεκηζηήξεο εμαεξηζκνύ ηνπ κεραλνζηαζίνπ ζηε βέιηηζηε ηαρύηεηα κε βάζε
ηα δεδνκέλα ηεο δηεξγαζίαο, πνπ αλαηξνθνδνηνύληαη ζε πξαγκαηηθό ρξόλν, αιιά θαη κε βάζε ηνπο
πεξηνξηζκνύο ζηε ιεηηνπξγία ησλ κεραλεκάησλ έηζη ώζηε λα επηηεπρζεί κέγηζηε εμνηθνλόκεζε ηζρύνο. Ζ
ειάρηζηε ηαρύηεηα πεξηζηξνθήο, σmin, θαζνξίδεηαη δπλακηθά ζύκθσλα κε ηελ ειάρηζηε απαηηνύκελε παξνρή
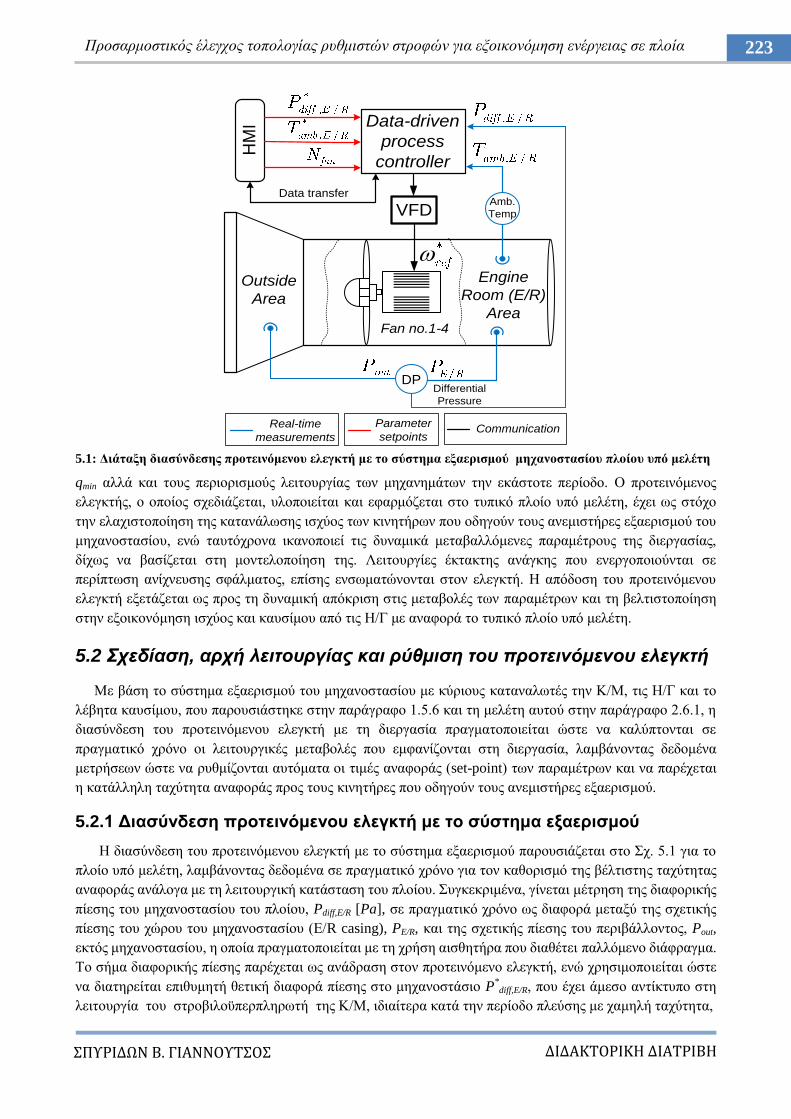
ΔΙΔΑΚΣΟΡΙΚΗ ΔΙΑΣΡΙΒΗ
ΠΤΡΙΔΩΝ Β. ΓΙΑΝΝΟΤΣΟ
223 Πξνζαξκνζηηθόο έιεγρνο ηνπνινγίαο ξπζκηζηώλ ζηξνθώλ γηα εμνηθνλόκεζε ελέξγεηαο ζε πινία
5.1: Γηάηαμε δηαζύλδεζεο πξνηεηλόκελνπ ειεγθηή κε ην ζύζηεκα εμαεξηζκνύ κεραλνζηαζίνπ πινίνπ ππό κειέηε
qmin αιιά θαη ηνπο πεξηνξηζκνύο ιεηηνπξγίαο ησλ κεραλεκάησλ ηελ εθάζηνηε πεξίνδν. Ο πξνηεηλόκελνο
ειεγθηήο, ν νπνίνο ζρεδηάδεηαη, πινπνηείηαη θαη εθαξκόδεηαη ζην ηππηθό πινίν ππό κειέηε, έρεη σο ζηόρν
ηελ ειαρηζηνπνίεζε ηεο θαηαλάισζεο ηζρύνο ησλ θηλεηήξσλ πνπ νδεγνύλ ηνπο αλεκηζηήξεο εμαεξηζκνύ ηνπ
κεραλνζηαζίνπ, ελώ ηαπηόρξνλα ηθαλνπνηεί ηηο δπλακηθά κεηαβαιιόκελεο παξακέηξνπο ηεο δηεξγαζίαο,
δίρσο λα βαζίδεηαη ζηε κνληεινπνίεζε ηεο. Λεηηνπξγίεο έθηαθηεο αλάγθεο πνπ ελεξγνπνηνύληαη ζε
πεξίπησζε αλίρλεπζεο ζθάικαηνο, επίζεο ελζσκαηώλνληαη ζηνλ ειεγθηή. Ζ απόδνζε ηνπ πξνηεηλόκελνπ
ειεγθηή εμεηάδεηαη σο πξνο ηε δπλακηθή απόθξηζε ζηηο κεηαβνιέο ησλ παξακέηξσλ θαη ηε βειηηζηνπνίεζε
ζηελ εμνηθνλόκεζε ηζρύνο θαη θαπζίκνπ από ηηο Ζ/Γ κε αλαθνξά ην ηππηθό πινίν ππό κειέηε.
5.2 Σσεδίαζη, απσή λειηοςπγίαρ και πύθμιζη ηος πποηεινόμενος ελεγκηή
Με βάζε ην ζύζηεκα εμαεξηζκνύ ηνπ κεραλνζηαζίνπ κε θύξηνπο θαηαλαισηέο ηελ Κ/Μ, ηηο Ζ/Γ θαη ην
ιέβεηα θαπζίκνπ, πνπ παξνπζηάζηεθε ζηελ παξάγξαθν 1.5.6 θαη ηε κειέηε απηνύ ζηελ παξάγξαθν 2.6.1, ε
δηαζύλδεζε ηνπ πξνηεηλόκελνπ ειεγθηή κε ηε δηεξγαζία πξαγκαηνπνηείηαη ώζηε λα θαιύπηνληαη ζε
πξαγκαηηθό ρξόλν νη ιεηηνπξγηθέο κεηαβνιέο πνπ εκθαλίδνληαη ζηε δηεξγαζία, ιακβάλνληαο δεδνκέλα
κεηξήζεσλ ώζηε λα ξπζκίδνληαη απηόκαηα νη ηηκέο αλαθνξάο (set-point) ησλ παξακέηξσλ θαη λα παξέρεηαη
ε θαηάιιειε ηαρύηεηα αλαθνξάο πξνο ηνπο θηλεηήξεο πνπ νδεγνύλ ηνπο αλεκηζηήξεο εμαεξηζκνύ.
5.2.1 Γηαζύλδεζε πξνηεηλόκελνπ ειεγθηή κε ην ζύζηεκα εμαεξηζκνύ
Ζ δηαζύλδεζε ηνπ πξνηεηλόκελνπ ειεγθηή κε ην ζύζηεκα εμαεξηζκνύ παξνπζηάδεηαη ζην ρ. 5.1 γηα ην
πινίν ππό κειέηε, ιακβάλνληαο δεδνκέλα ζε πξαγκαηηθό ρξόλν γηα ηνλ θαζνξηζκό ηεο βέιηηζηεο ηαρύηεηαο
αλαθνξάο αλάινγα κε ηε ιεηηνπξγηθή θαηάζηαζε ηνπ πινίνπ. πγθεθξηκέλα, γίλεηαη κέηξεζε ηεο δηαθνξηθήο
πίεζεο ηνπ κεραλνζηαζίνπ ηνπ πινίνπ, Pdiff,E/R [Pa], ζε πξαγκαηηθό ρξόλν σο δηαθνξά κεηαμύ ηεο ζρεηηθήο
πίεζεο ηνπ ρώξνπ ηνπ κεραλνζηαζίνπ (Δ/R casing), PE/R, θαη ηεο ζρεηηθήο πίεζεο ηνπ πεξηβάιινληνο, Pout,
εθηόο κεραλνζηαζίνπ, ε νπνία πξαγκαηνπνηείηαη κε ηε ρξήζε αηζζεηήξα πνπ δηαζέηεη παιιόκελν δηάθξαγκα.
Σν ζήκα δηαθνξηθήο πίεζεο παξέρεηαη σο αλάδξαζε ζηνλ πξνηεηλόκελν ειεγθηή, ελώ ρξεζηκνπνηείηαη ώζηε
λα δηαηεξείηαη επηζπκεηή ζεηηθή δηαθνξά πίεζεο ζην κεραλνζηάζην P*
diff,E/R, πνπ έρεη άκεζν αληίθηππν ζηε
ιεηηνπξγία ηνπ ζηξνβηινϋπεξπιεξσηή ηεο Κ/Μ, ηδηαίηεξα θαηά ηελ πεξίνδν πιεύζεο κε ρακειή ηαρύηεηα,
Data-driven
process
controller
VFD
Engine
Room (E/R)
Area
Outside
Area
DP
Amb.
Temp
Real-time
measurements
Parameter
setpointsCommunication
HM
I
Differential
Pressure
Fan no.1-4
Data transfer
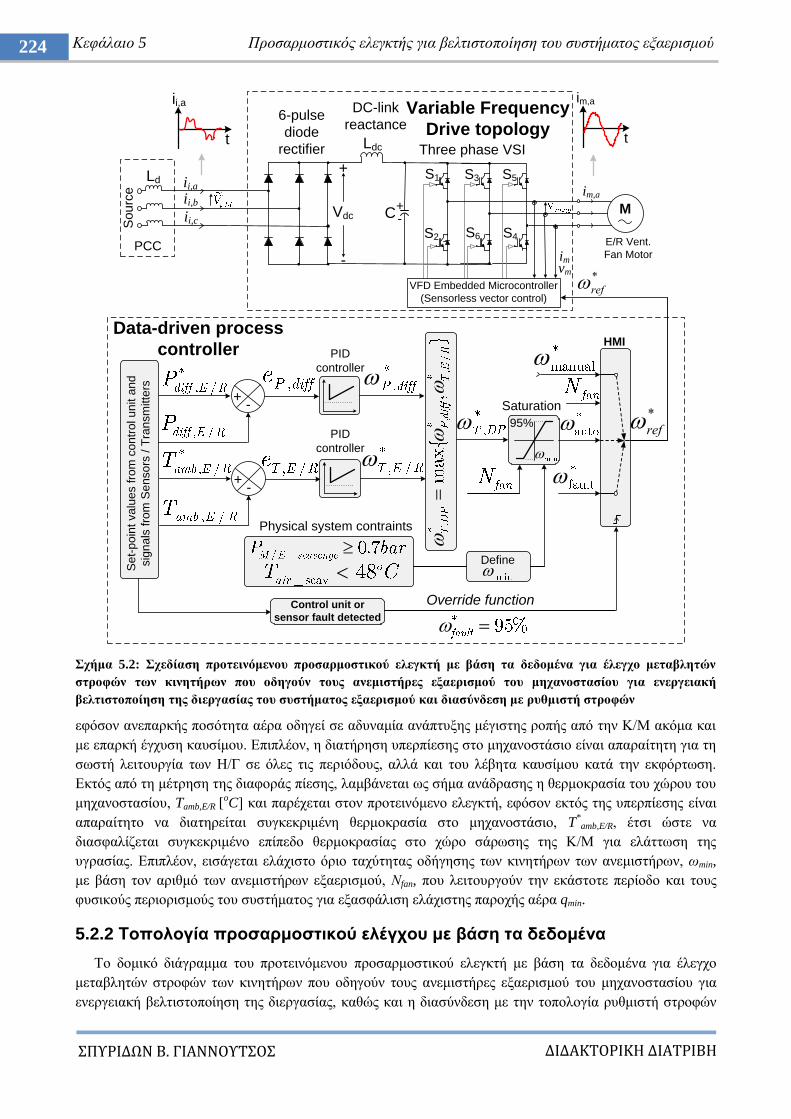
ΔΙΔΑΚΣΟΡΙΚΗ ΔΙΑΣΡΙΒΗ
ΠΤΡΙΔΩΝ Β. ΓΙΑΝΝΟΤΣΟ
224 Κεθάιαην 5 Πξνζαξκνζηηθόο ειεγθηήο γηα βειηηζηνπνίεζε ηνπ ζπζηήκαηνο εμαεξηζκνύ
ρήκα 5.2: ρεδίαζε πξνηεηλόκελνπ πξνζαξκνζηηθνύ ειεγθηή κε βάζε ηα δεδνκέλα γηα έιεγρν κεηαβιεηώλ
ζηξνθώλ ησλ θηλεηήξσλ πνπ νδεγνύλ ηνπο αλεκηζηήξεο εμαεξηζκνύ ηνπ κεραλνζηαζίνπ γηα ελεξγεηαθή
βειηηζηνπνίεζε ηεο δηεξγαζίαο ηνπ ζπζηήκαηνο εμαεξηζκνύ θαη δηαζύλδεζε κε ξπζκηζηή ζηξνθώλ
εθόζνλ αλεπαξθήο πνζόηεηα αέξα νδεγεί ζε αδπλακία αλάπηπμεο κέγηζηεο ξνπήο από ηελ Κ/Μ αθόκα θαη
κε επαξθή έγρπζε θαπζίκνπ. Δπηπιένλ, ε δηαηήξεζε ππεξπίεζεο ζην κεραλνζηάζην είλαη απαξαίηεηε γηα ηε
ζσζηή ιεηηνπξγία ησλ Ζ/Γ ζε όιεο ηηο πεξηόδνπο, αιιά θαη ηνπ ιέβεηα θαπζίκνπ θαηά ηελ εθθόξησζε.
Δθηόο από ηε κέηξεζε ηεο δηαθνξάο πίεζεο, ιακβάλεηαη σο ζήκα αλάδξαζεο ε ζεξκνθξαζία ηνπ ρώξνπ ηνπ
κεραλνζηαζίνπ, Tamb,E/R [oC] θαη παξέρεηαη ζηνλ πξνηεηλόκελν ειεγθηή, εθόζνλ εθηόο ηεο ππεξπίεζεο είλαη
απαξαίηεην λα δηαηεξείηαη ζπγθεθξηκέλε ζεξκνθξαζία ζην κεραλνζηάζην, T*
amb,E/R, έηζη ώζηε λα
δηαζθαιίδεηαη ζπγθεθξηκέλν επίπεδν ζεξκνθξαζίαο ζην ρώξν ζάξσζεο ηεο Κ/Μ γηα ειάηησζε ηεο
πγξαζίαο. Δπηπιένλ, εηζάγεηαη ειάρηζην όξην ηαρύηεηαο νδήγεζεο ησλ θηλεηήξσλ ησλ αλεκηζηήξσλ, σmin,
κε βάζε ηνλ αξηζκό ησλ αλεκηζηήξσλ εμαεξηζκνύ, Νfan, πνπ ιεηηνπξγνύλ ηελ εθάζηνηε πεξίνδν θαη ηνπο
θπζηθνύο πεξηνξηζκνύο ηνπ ζπζηήκαηνο γηα εμαζθάιηζε ειάρηζηεο παξνρήο αέξα qmin.
5.2.2 Σνπνινγία πξνζαξκνζηηθνύ ειέγρνπ κε βάζε ηα δεδνκέλα
Σν δνκηθό δηάγξακκα ηνπ πξνηεηλόκελνπ πξνζαξκνζηηθνύ ειεγθηή κε βάζε ηα δεδνκέλα γηα έιεγρν
κεηαβιεηώλ ζηξνθώλ ησλ θηλεηήξσλ πνπ νδεγνύλ ηνπο αλεκηζηήξεο εμαεξηζκνύ ηνπ κεραλνζηαζίνπ γηα
ελεξγεηαθή βειηηζηνπνίεζε ηεο δηεξγαζίαο, θαζώο θαη ε δηαζύλδεζε κε ηελ ηνπνινγία ξπζκηζηή ζηξνθώλ
Ldc
CVdc
+
-
Three phase VSI
im,a
S1 S3 S5
S2 S4S6E/R Vent.
Fan Motor
6-pulse
diode
rectifier
Ld
So
urc
e
Variable Frequency
Drive topology
+-
ii,a
ii,b
ii,c
ii,a
t
VFD Embedded Microcontroller
(Sensorless vector control)
DC-link
reactance
PCCimvm *
ref
im,a
t
-+
95%
Se
t-p
oin
t va
lue
s fro
m c
on
tro
l u
nit a
nd
sig
na
ls fro
m S
en
so
rs / T
ran
sm
itte
rs
-+
Control unit or
sensor fault detected
Override function
Physical system contraints
Define
Data-driven process
controller PID
controller
PID
controller
Saturation
HMI
*
ref
M
ΔΙΔΑΚΣΟΡΙΚΗ ΔΙΑΣΡΙΒΗ
ΠΤΡΙΔΩΝ Β. ΓΙΑΝΝΟΤΣΟ
225 Πξνζαξκνζηηθόο έιεγρνο ηνπνινγίαο ξπζκηζηώλ ζηξνθώλ γηα εμνηθνλόκεζε ελέξγεηαο ζε πινία
παξνπζηάδνληαη ζην ρ. 5.2, κε αλαθνξά ζην πινίν ππό κειέηε. Ζ ηνπνινγία ξπζκηζηή ζηξνθώλ
πεξηιακβάλεη εμαπαικηθή αλόξζσζε κε δηόδνπο θαη ηξηθαζηθό αληηζηξνθέα δύν επηπέδσλ ηάζεο,
πινπνηεκέλν κε IGBT εκηαγσγηθνύο δηαθόπηεο ηζρύνο πνπ ε παικνηξνθνδόηεζε ηνπο γίλεηαη κε ηελ
ηερληθή SV-PWM, ελώ ν έιεγρνο ηνπ θηλεηήξα βαζίδεηαη ζην δηαλπζκαηηθό έιεγρν κε πξνζαλαηνιηζκό ηνπ
πεδίνπ ηνπ δξνκέα κε εθηίκεζε ηαρύηεηαο κέζσ ηνπ πξνζαξκνζηηθνύ ηνπ κνληέινπ. Δπηπιένλ
πεξηιακβάλνληαη πελία ζην dc-link πνπ αληηζηνηρνύλ ζην 3% ηεο πηώζεο ηάζεσο γηα ηνλ έιεγρν ησλ
αξκνληθώλ, ε ηερληθή ππνινγηζκνύ ησλ νπνίσλ γίλεηαη κε πξνηεηλόκελε ζπζηεκαηηθή κέζνδν πνπ αλαιύεηαη
ζε επόκελν θεθάιαην, ώζηε ην πιάηνο ησλ αξκνληθώλ ζπληζησζώλ, θαη ν ζπληειεζηήο νιηθήο αξκνληθήο
παξακόξθσζεο ηεο ηάζεο (THDv%) έσο ηελ 25ε αξκνληθή λα ηθαλνπνηνύλ ηα όξηα ηνπ λενγλώκνλα.
Χο πξνο ην ζθέινο ηνπ ειεγθηή, νη επηζπκεηέο ηηκέο ππεξπίεζεο P*
diff,E/R, θαη ζεξκνθξαζίαο T *
amb,E/R,
επηηπγράλνληαη κέζσ δύν αλεμάξηεησλ βξόρσλ ειέγρνπ PID πίεζεο θαη ζεξκνθξαζίαο, πνπ παξέρνπλ δύν
μερσξηζηέο αλαθνξέο ηαρύηεηαο, σ*
P,diff θαη σ*T,E/R αληίζηνηρα, έηζη ώζηε λα ηθαλνπνηνύληαη νη απαηηήζεηο
παξνρήο αέξα γηα ηηο δηαδηθαζίεο θαύζεο από ηνπο θαηαλαισηέο ηνπ κεραλνζηαζίνπ θαη γηα ηελ απαγσγή
ζεξκόηεηαο κε ζθνπό ηε ζσζηή ιεηηνπξγία ησλ κεραλεκάησλ:
όπνπ ηα ζθάικαηα eP,diff (t) and eP,T (t) εθθξάδνληαη σο εμήο:
Πξνο ζπκκόξθσζε κε ηηο δπλακηθέο κεηαβνιέο ηνπ ζπζηήκαηνο εμαεξηζκνύ ηνπ κεραλνζηαζίνπ θαη κε ηηο
κεηαβνιέο ζηε δηεξγαζία, ε έμνδνο αλαθνξάο ηαρύηεηαο πνπ πξνθύπηεη, σ*T,DP, όπσο θαίλεηαη θαη από ηε
δηάηαμε ηνπ ρ. 5.2, είλαη ε κέγηζηε ηηκή κεηαμύ ησλ δύν αλαθνξώλ, ελώ ε ηειηθή ηηκή αλαθνξάο πνπ
παξέρεηαη ζηνπο ξπζκηζηέο ζηξνθώλ πνπ νδεγνύλ ηνπο θηλεηήξεο ησλ αλεκηζηήξσλ εμαεξηζκνύ ηνπ
κεραλνζηαζίνπ, σ*auto, έρεη σο ειάρηζηε επηηξεπηή ηηκή ηαρύηεηαο αλαθνξάο ηελ σmin, ζύκθσλα κε ηε ζρέζε:
Ζ ξύζκηζε ησλ ειεγθηώλ PID γίλεηαη αλεμάξηεηα γηα θάζε βξόρν ειέγρνπ κε βάζε ηε κέζνδν Ziegler-
Nichols [16]-[17], εθηηκώληαο ην απόιπην θέξδνο Ku, όπνπ ε έμνδνο ηαιαληώλεηαη κε ζηαζεξό πιάηνο κε
πεξίνδν Tu. Ο ππνινγηζκόο ησλ θεξδώλ ηνπ ειεγθηή PID, γίλεηαη κε ηνλ παξαθάησ ηξόπν:
5.2.3 Ρύζκηζε παξακέηξσλ θαη δηάγξακκα ξνήο πξνζαξκνζηηθνύ ειεγθηή
Από ηε κειέηε απαηηνύκελεο παξνρήο κε βάζε ην πινίν ππό κειέηε πνπ πξαγκαηνπνηήζεθε ζηελ
παξάγξαθν 2.6.2, δηαπηζηώζεθε όηη νη αλάγθεο παξνρήο αέξα γηα θαύζε θαη απαγσγή ζεξκόηεηαο γηα ηνπο
θαηαλαισηέο ηνπ κεραλνζηαζίνπ κεηαβάιινληαη κεηαμύ ησλ πεξηόδσλ πιεύζεο, ζηάζεο ζε ιηκάλη θαη
εθθόξησζεο, αλαδεηθλύνληαο ηελ αλάγθε πξνζαξκνγήο ησλ επηζπκεηώλ ηηκώλ πίεζεο θαη ζεξκνθξαζίαο
κέζσ ηνπ πξνηεηλόκελνπ ειεγθηή. ε απηήλ ηελ παξάγξαθν, ηεθκεξηώλεηαη ε ξύζκηζε ησλ παξακέηξσλ ηνπ
ειεγθηή θαη παξνπζηάδεηαη ην δηάγξακκα ξνήο πνπ πεξηγξάθεη ηε ιεηηνπξγία ηνπ.
ΔΙΔΑΚΣΟΡΙΚΗ ΔΙΑΣΡΙΒΗ
ΠΤΡΙΔΩΝ Β. ΓΙΑΝΝΟΤΣΟ
226 Κεθάιαην 5 Πξνζαξκνζηηθόο ειεγθηήο γηα βειηηζηνπνίεζε ηνπ ζπζηήκαηνο εμαεξηζκνύ
5.2.3.1 Ρύζκηζε πίεζεο παξερόκελνπ αέξα κεραλνζηαζίνπ
ε θάζε ιεηηνπξγηθή θαηάζηαζε, ζηόρνο είλαη ε δηαηήξεζε ππεξπίεζεο ζην ρώξν ηνπ κεραλνζηαζίνπ:
Ζ ππεξπίεζε απηή ζα πξέπεη λα είλαη ζεηηθή ζε θάπνην βαζκό αιιά ζε θακία πεξίπησζε κεγαιύηεξε από
5mmWC (ζηήιε λεξνύ) ή 0.5mbar παξαπάλσ από από ηελ αηκνζθαηξηθή πίεζε εθηόο ηνπ κεραλνζηαζίνπ
γηα ηελ θαιή ιεηηνπξγία ηεο Κ/Μ [18]. Οη βνεζεηηθνί ζπκπηεζηέο ηεο Κ/Μ (M/E aux. blowers) ιεηηνπξγνύλ
θαηά ηελ εθθίλεζε ηεο Κ/Μ θαη θαηά ηελ πεξίνδν ειηγκώλ, θαζώο θαη ζηελ πεξίπησζε εθαξκνγήο ηεο
πξαθηηθήο κείσζεο ηεο ηαρύηεηαο πιεύζεο, ελώ θαηά ηε δηάξθεηα ηεο πεξηόδνπ πιεύζεο κε νλνκαζηηθή
ηαρύηεηα ιεηηνπξγεί κόλν ν ζηξνβηινϋπεξπιεξσηήο (turbocharger). Δπνκέλσο, ην επίπεδν ηεο ππεξπίεζεο
ζην κεραλνζηάζην θαηά ηε δηάξθεηα ηεο πεξηόδνπ πιεύζεο επηιέγεηαη νύησο ώζηε ν ζηξνβηινϋπεξπιεξσηήο
ηεο Κ/Μ λα εηζάγεη αέξα ππό πίεζε, κε απνηέιεζκα ε πίεζε ζην ρώξν ζάξσζεο ησλ ρηησλίσλ ηεο Κ/Μ λα
δηαηεξείηαη πάληνηε ζε ηηκέο PM/E,scavenge > 0.7bar γηα ηελ απνδνηηθή ιεηηνπξγία ηεο Κ/Μ. Όπσο θαίλεηαη θαη
από ηηο ηηκέο ηνπ Πίλαθα 2.13 γηα ην πινίν ππό κειέηε, θαηά ηε δηάξθεηα ηεο ζηάζεο ζε ιηκάλη ή θαηά ηε
δηάξθεηα ηεο πεξηόδνπ εθθόξησζεο, ε Κ/Μ δε βξίζθεηαη ζε ιεηηνπξγία, επνκέλσο παξνρή ζπκπηεζκέλνπ
αέξα ρξεηάδεηαη κόλν γηα ηε ιεηηνπξγία ηνπ ζηξνβηινϋπεξπιεξσηή ησλ Ζ/Γ θαη ηνπ ιέβεηα θαπζίκνπ,
νδεγώληαο ζε ρακειόηεξεο αλάγθεο γηα ηηο δηεξγαζίεο θαύζεο. Δπνκέλσο, ην επίπεδν ηεο αλαθνξάο
ππεξπίεζεο, P*
diff,E/R, θαη ε ειάρηζηε επηηξεπόκελε ηαρύηεηα αλαθνξάο, σmin, επηιέγνληαη δπλακηθά ζην
εύξνο 15-45Pa θαη 50-85% αληίζηνηρα, αλάινγα κε ηνλ αξηζκό ησλ αλεκηζηήξσλ, Nfan, πνπ ιεηηνπξγνύλ ζε
θάζε πεξίνδν ώζηε λα βειηηζηνπνηεζεί ε θαηαλάισζε ησλ θηλεηήξσλ πνπ νδεγνύλ ηνπο αλεκηζηήξεο
αμνληθήο ξνήο, ιακβάλνληαο ππόςε ηνπο θπζηθνύο πεξηνξηζκνύο ηεο δηεξγαζίαο.
Δθόζνλ ε εμσηεξηθή βαξνκεηξηθή πίεζε δελ είλαη ζηαζεξή, αιιά κεηαβάιιεηαη ζε εύξνο 980-1040mbar,
ν δηαθνξηθόο αηζζεηήξαο πίεζεο ρξεζηκνπνηεί δηάθξαγκα πνπ πάιιεηαη αλάινγα κε ηε δηαθνξά πίεζεο πνπ
κεηξάηαη κεηαμύ ησλ πιεπξώλ πνπ ζπλδένληαη κέζσ ζσιήλσλ ζηελ πιεπξά εληόο θαη εθηόο κεραλνζηαζίνπ.
Ο αηζζεηήξαο εγθαζίζηαηαη ζην πςειόηεξν επίπεδν ηνπ πεξηβιήκαηνο ηνπ κεραλνζηαζίνπ (Δ/R casing),
δίπια ζηελ πόξηα εμόδνπ ζην επίπεδν ηεο θαπλνδόρνπ θαπζαεξίσλ ηεο Κ/Μ θαη ησλ βνεζεηηθώλ
κεραλεκάησλ, όπνπ ε ξνή ηνπ αέξα ζηαζεξνπνηείηαη.
5.2.3.2 Ρύζκηζε ζεξκνθξαζίαο κεραλνζηαζίνπ
Μεηξήζεηο ζην ρώξν ηνπ κεραλνζηαζίνπ έρνπλ δείμεη όηη ε ζεξκνθξαζία ηνπ κεραλνζηαζίνπ, Tamb,E/R,
είλαη θαηά κέζν όξν 10-12oC πςειόηεξε ζε ζρέζε κε ηε αηκνζθαηξηθή ζεξκνθξαζία εθηόο κεραλνζηαζίνπ,
Tamb,out, ε νπνία ζρεηίδεηαη κε ηε ζεξκνθξαζία ηεο ζάιαζζαο ΣS.W [19]. Mε βάζε ηα παξαπάλσ, ε κέζε
ζεξκνθξαζία ζην κεραλνζηάζην ηππηθνύ πινίνπ πνπ ιεηηνπξγνύλ αλεκηζηήξεο εμαεξηζκνύ κε μερσξηζηέο
δηαθιαδώζεηο δελ μεπεξλά ηε ζεξκνθξαζία , όπσο πεξηγξάθεηαη παξαθάησ:
όπνπ εάλ ζεσξεζεί κέγηζηε ζεξκνθξαζία ζάιαζζαο = 32
oC, ηόηε ν ζρεδηαζκόο ησλ κεραλεκάησλ
ηνπ κεραλνζηαζίνπ γίλεηαη γηα κέγηζηε επηηξεπόκελε ζεξκνθξαζία 51oC, ή 55
νC, εάλ ελζσκαησζεί θάπνην
πεξηζώξην ζθάικαηνο. Χζηόζν εθόζνλ νη δηαθιάδσζεηο ηνπ ζπζηήκαηνο εμαεξηζκνύ ηνπνζεηνύληαη θνληά
ζηνπο ζηξνβηινϋπεξπιεξσηέο ώζηε ν παξερόκελνο αέξαο λα έρεη ηε κεγαιύηεξε πίεζε, ε ζεξκνθξαζία ζηελ
είζνδν ηεο πιεπξάο ηνπ ζηξνβίινπ ηνπ ζηξνβηινϋπεξπιεξσηή ζα είλαη πνιύ θνληά ζηε ζεξκνθξαζία Σamb,out:
όπνπ ε κέγηζηε ζεξκνθξαζία ηνπ αέξα ζηελ πιεπξά ηνπ ζηξνβηινϋπεξπιεξσηή ζα είλαη 42oC, ή 45
oC, εάλ
ελζσκαησζεί θάπνην πεξηζώξην ζθάικαηνο. Ζ ζεξκνθξαζία απηή ζρεηίδεηαη άκεζα κε κε ηε ζεξκνθξαζία
ζην ρώξν ζάξσζεο (scavenge space) ησλ ρηησλίσλ ηεο Κ/Μ, Σair,scav, πνπ εμαξηάηαη από ηε ζεξκνθξαζία ηνπ
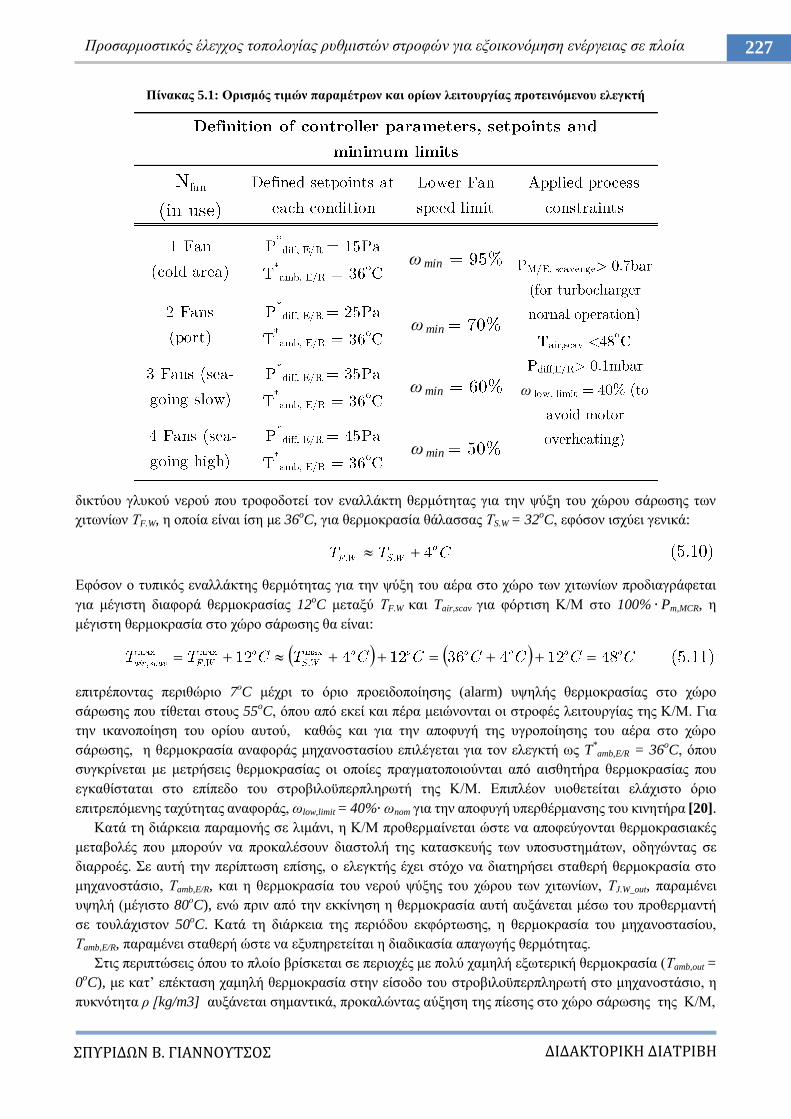
ΔΙΔΑΚΣΟΡΙΚΗ ΔΙΑΣΡΙΒΗ
ΠΤΡΙΔΩΝ Β. ΓΙΑΝΝΟΤΣΟ
227 Πξνζαξκνζηηθόο έιεγρνο ηνπνινγίαο ξπζκηζηώλ ζηξνθώλ γηα εμνηθνλόκεζε ελέξγεηαο ζε πινία
Πίλαθαο 5.1: Οξηζκόο ηηκώλ παξακέηξσλ θαη νξίσλ ιεηηνπξγίαο πξνηεηλόκελνπ ειεγθηή
δηθηύνπ γιπθνύ λεξνύ πνπ ηξνθνδνηεί ηνλ ελαιιάθηε ζεξκόηεηαο γηα ηελ ςύμε ηνπ ρώξνπ ζάξσζεο ησλ
ρηησλίσλ ΣF.W, ε νπνία είλαη ίζε κε 36oC, γηα ζεξκνθξαζία ζάιαζζαο ΣS.W = 32
oC, εθόζνλ ηζρύεη γεληθά:
Δθόζνλ ν ηππηθόο ελαιιάθηεο ζεξκόηεηαο γηα ηελ ςύμε ηνπ αέξα ζην ρώξν ησλ ρηησλίσλ πξνδηαγξάθεηαη
γηα κέγηζηε δηαθνξά ζεξκνθξαζίαο 12oC κεηαμύ ΣF.W θαη Tair,scav γηα θόξηηζε Κ/Μ ζην 100% Pm,MCR, ε
κέγηζηε ζεξκνθξαζία ζην ρώξν ζάξσζεο ζα είλαη:
επηηξέπνληαο πεξηζώξην 7νC κέρξη ην όξην πξνεηδνπνίεζεο (alarm) πςειήο ζεξκνθξαζίαο ζην ρώξν
ζάξσζεο πνπ ηίζεηαη ζηνπο 55oC, όπνπ από εθεί θαη πέξα κεηώλνληαη νη ζηξνθέο ιεηηνπξγίαο ηεο Κ/Μ. Γηα
ηελ ηθαλνπνίεζε ηνπ νξίνπ απηνύ, θαζώο θαη γηα ηελ απνθπγή ηεο πγξνπνίεζεο ηνπ αέξα ζην ρώξν
ζάξσζεο, ε ζεξκνθξαζία αλαθνξάο κεραλνζηαζίνπ επηιέγεηαη γηα ηνλ ειεγθηή σο T*amb,E/R = 36
oC, όπνπ
ζπγθξίλεηαη κε κεηξήζεηο ζεξκνθξαζίαο νη νπνίεο πξαγκαηνπνηνύληαη από αηζζεηήξα ζεξκνθξαζίαο πνπ
εγθαζίζηαηαη ζην επίπεδν ηνπ ζηξνβηινϋπεξπιεξσηή ηεο Κ/Μ. Δπηπιένλ πηνζεηείηαη ειάρηζην όξην
επηηξεπόκελεο ηαρύηεηαο αλαθνξάο, σlow,limit = 40% σnom γηα ηελ απνθπγή ππεξζέξκαλζεο ηνπ θηλεηήξα [20].
Καηά ηε δηάξθεηα παξακνλήο ζε ιηκάλη, ε Κ/Μ πξνζεξκαίλεηαη ώζηε λα απνθεύγνληαη ζεξκνθξαζηαθέο
κεηαβνιέο πνπ κπνξνύλ λα πξνθαιέζνπλ δηαζηνιή ηεο θαηαζθεπήο ησλ ππνζπζηεκάησλ, νδεγώληαο ζε
δηαξξνέο. ε απηή ηελ πεξίπησζε επίζεο, ν ειεγθηήο έρεη ζηόρν λα δηαηεξήζεη ζηαζεξή ζεξκνθξαζία ζην
κεραλνζηάζην, Σamb,E/R, θαη ε ζεξκνθξαζία ηνπ λεξνύ ςύμεο ηνπ ρώξνπ ησλ ρηησλίσλ, ΣJ.W_out, παξακέλεη
πςειή (κέγηζην 80νC), ελώ πξηλ από ηελ εθθίλεζε ε ζεξκνθξαζία απηή απμάλεηαη κέζσ ηνπ πξνζεξκαληή
ζε ηνπιάρηζηνλ 50oC. Καηά ηε δηάξθεηα ηεο πεξηόδνπ εθθόξησζεο, ε ζεξκνθξαζία ηνπ κεραλνζηαζίνπ,
Σamb,E/R, παξακέλεη ζηαζεξή ώζηε λα εμππεξεηείηαη ε δηαδηθαζία απαγσγήο ζεξκόηεηαο.
ηηο πεξηπηώζεηο όπνπ ην πινίν βξίζθεηαη ζε πεξηνρέο κε πνιύ ρακειή εμσηεξηθή ζεξκνθξαζία (Σamb,out =
0oC), κε θαη‟ επέθηαζε ρακειή ζεξκνθξαζία ζηελ είζνδν ηνπ ζηξνβηινϋπεξπιεξσηή ζην κεραλνζηάζην, ε
ππθλόηεηα ξ [kg/m3] απμάλεηαη ζεκαληηθά, πξνθαιώληαο αύμεζε ηεο πίεζεο ζην ρώξν ζάξσζεο ηεο Κ/Μ,
ωmin
ωmin
ωmin
ωmin
ω
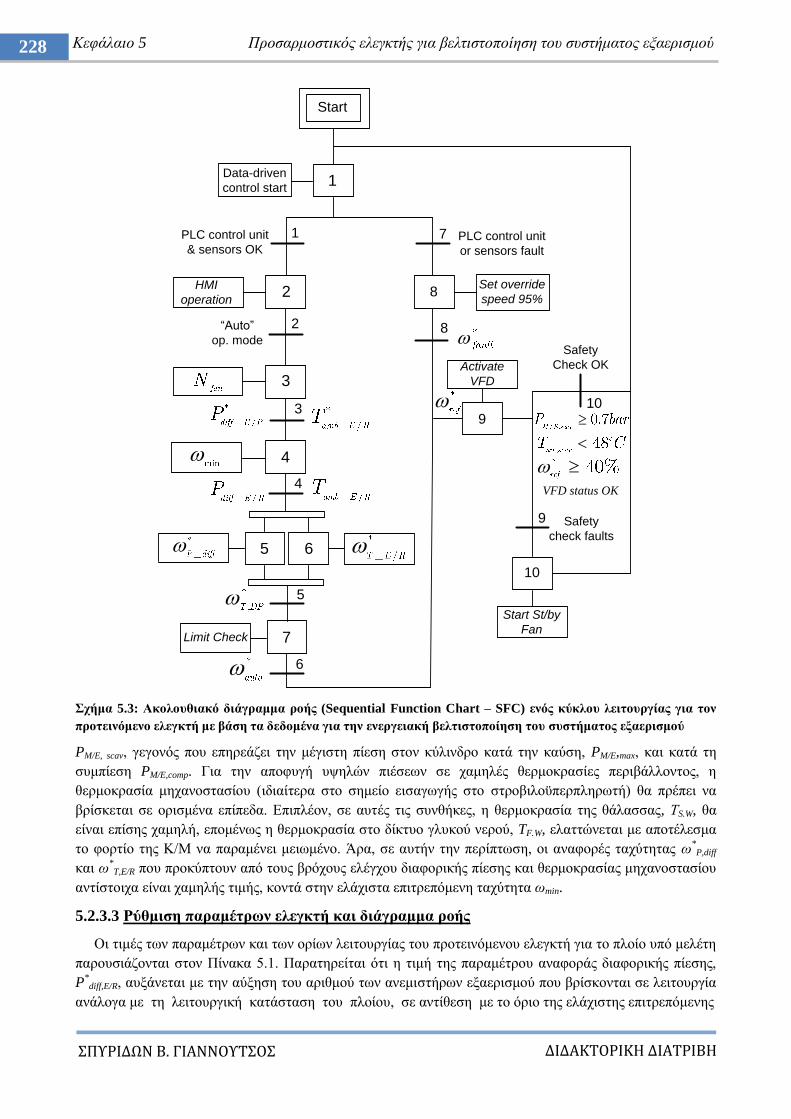
ΔΙΔΑΚΣΟΡΙΚΗ ΔΙΑΣΡΙΒΗ
ΠΤΡΙΔΩΝ Β. ΓΙΑΝΝΟΤΣΟ
228 Κεθάιαην 5 Πξνζαξκνζηηθόο ειεγθηήο γηα βειηηζηνπνίεζε ηνπ ζπζηήκαηνο εμαεξηζκνύ
ρήκα 5.3: Αθνινπζηαθό δηάγξακκα ξνήο (Sequential Function Chart – SFC) ελόο θύθινπ ιεηηνπξγίαο γηα ηνλ
πξνηεηλόκελν ειεγθηή κε βάζε ηα δεδνκέλα γηα ηελ ελεξγεηαθή βειηηζηνπνίεζε ηνπ ζπζηήκαηνο εμαεξηζκνύ
PM/E, scav, γεγνλόο πνπ επεξεάδεη ηελ κέγηζηε πίεζε ζηνλ θύιηλδξν θαηά ηελ θαύζε, PM/E,max, θαη θαηά ηε
ζπκπίεζε PM/E,comp. Γηα ηελ απνθπγή πςειώλ πηέζεσλ ζε ρακειέο ζεξκνθξαζίεο πεξηβάιινληνο, ε
ζεξκνθξαζία κεραλνζηαζίνπ (ηδηαίηεξα ζην ζεκείν εηζαγσγήο ζην ζηξνβηινϋπεξπιεξσηή) ζα πξέπεη λα
βξίζθεηαη ζε νξηζκέλα επίπεδα. Δπηπιένλ, ζε απηέο ηηο ζπλζήθεο, ε ζεξκνθξαζία ηεο ζάιαζζαο, ΣS.W, ζα
είλαη επίζεο ρακειή, επνκέλσο ε ζεξκνθξαζία ζην δίθηπν γιπθνύ λεξνύ, TF.W, ειαηηώλεηαη κε απνηέιεζκα
ην θνξηίν ηεο Κ/Μ λα παξακέλεη κεησκέλν. Άξα, ζε απηήλ ηελ πεξίπησζε, νη αλαθνξέο ηαρύηεηαο σ*P,diff
θαη σ*
T,E/R πνπ πξνθύπηνπλ από ηνπο βξόρνπο ειέγρνπ δηαθνξηθήο πίεζεο θαη ζεξκνθξαζίαο κεραλνζηαζίνπ
αληίζηνηρα είλαη ρακειήο ηηκήο, θνληά ζηελ ειάρηζηα επηηξεπόκελε ηαρύηεηα σmin.
5.2.3.3 Ρύζκηζε παξακέηξσλ ειεγθηή θαη δηάγξακκα ξνήο
Οη ηηκέο ησλ παξακέηξσλ θαη ησλ νξίσλ ιεηηνπξγίαο ηνπ πξνηεηλόκελνπ ειεγθηή γηα ην πινίν ππό κειέηε
παξνπζηάδνληαη ζηνλ Πίλαθα 5.1. Παξαηεξείηαη όηη ε ηηκή ηεο παξακέηξνπ αλαθνξάο δηαθνξηθήο πίεζεο,
P*diff,E/R, απμάλεηαη κε ηελ αύμεζε ηνπ αξηζκνύ ησλ αλεκηζηήξσλ εμαεξηζκνύ πνπ βξίζθνληαη ζε ιεηηνπξγία
αλάινγα κε ηε ιεηηνπξγηθή θαηάζηαζε ηνπ πινίνπ, ζε αληίζεζε κε ην όξην ηεο ειάρηζηεο επηηξεπόκελεο
Start
1Data-driven
control start
1 7PLC control unit
& sensors OKPLC control unit
or sensors fault
2HMI
operation8
Set override
speed 95%
9
Activate
VFD
―Auto‖
op. mode
Start St/by
Fan
Safety
Check OK
VFD status OK
Safety
check faults
3
4
5 6
10
2
3
4
5
8
9
10
7
Limit Check
6
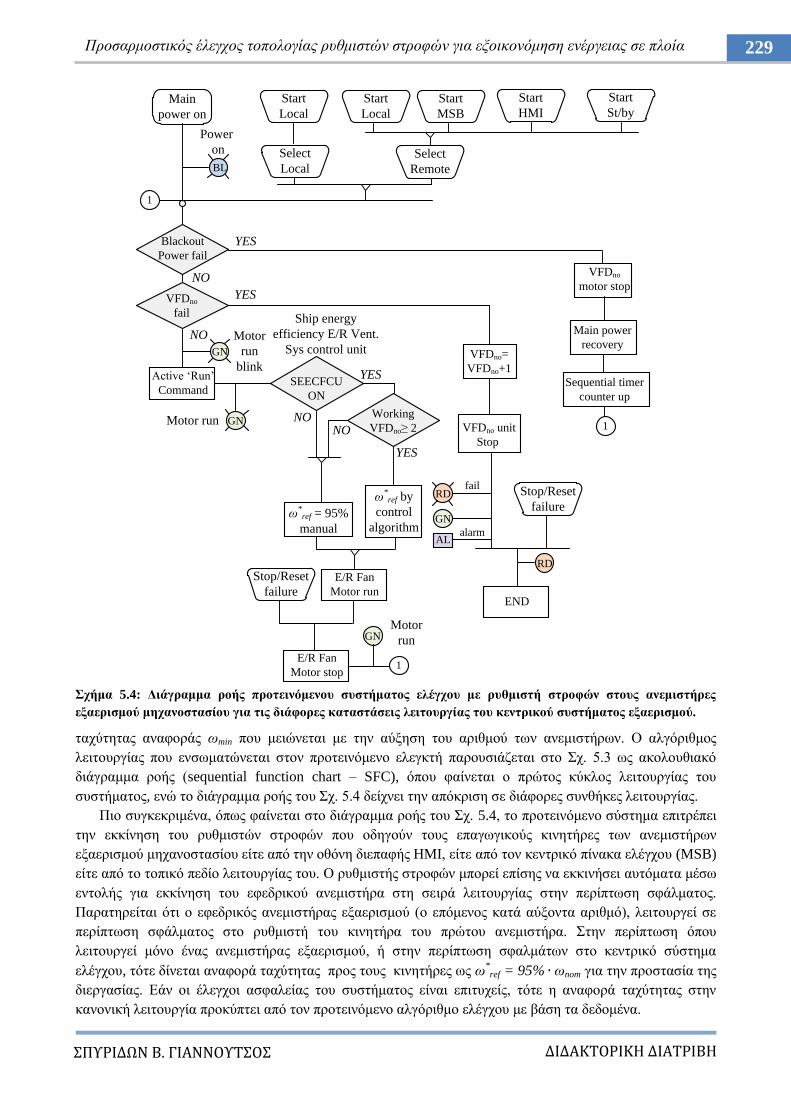
ΔΙΔΑΚΣΟΡΙΚΗ ΔΙΑΣΡΙΒΗ
ΠΤΡΙΔΩΝ Β. ΓΙΑΝΝΟΤΣΟ
229 Πξνζαξκνζηηθόο έιεγρνο ηνπνινγίαο ξπζκηζηώλ ζηξνθώλ γηα εμνηθνλόκεζε ελέξγεηαο ζε πινία
ρήκα 5.4: Γηάγξακκα ξνήο πξνηεηλόκελνπ ζπζηήκαηνο ειέγρνπ κε ξπζκηζηή ζηξνθώλ ζηνπο αλεκηζηήξεο
εμαεξηζκνύ κεραλνζηαζίνπ γηα ηηο δηάθνξεο θαηαζηάζεηο ιεηηνπξγίαο ηνπ θεληξηθνύ ζπζηήκαηνο εμαεξηζκνύ.
ηαρύηεηαο αλαθνξάο σmin πνπ κεηώλεηαη κε ηελ αύμεζε ηνπ αξηζκνύ ησλ αλεκηζηήξσλ. Ο αιγόξηζκνο
ιεηηνπξγίαο πνπ ελζσκαηώλεηαη ζηνλ πξνηεηλόκελν ειεγθηή παξνπζηάδεηαη ζην ρ. 5.3 σο αθνινπζηαθό
δηάγξακκα ξνήο (sequential function chart – SFC), όπνπ θαίλεηαη ν πξώηνο θύθινο ιεηηνπξγίαο ηνπ
ζπζηήκαηνο, ελώ ην δηάγξακκα ξνήο ηνπ ρ. 5.4 δείρλεη ηελ απόθξηζε ζε δηάθνξεο ζπλζήθεο ιεηηνπξγίαο.
Πην ζπγθεθξηκέλα, όπσο θαίλεηαη ζην δηάγξακκα ξνήο ηνπ ρ. 5.4, ην πξνηεηλόκελν ζύζηεκα επηηξέπεη
ηελ εθθίλεζε ηνπ ξπζκηζηώλ ζηξνθώλ πνπ νδεγνύλ ηνπο επαγσγηθνύο θηλεηήξεο ησλ αλεκηζηήξσλ
εμαεξηζκνύ κεραλνζηαζίνπ είηε από ηελ νζόλε δηεπαθήο HMI, είηε από ηνλ θεληξηθό πίλαθα ειέγρνπ (MSB)
είηε από ην ηνπηθό πεδίν ιεηηνπξγίαο ηνπ. Ο ξπζκηζηήο ζηξνθώλ κπνξεί επίζεο λα εθθηλήζεη απηόκαηα κέζσ
εληνιήο γηα εθθίλεζε ηνπ εθεδξηθνύ αλεκηζηήξα ζηε ζεηξά ιεηηνπξγίαο ζηελ πεξίπησζε ζθάικαηνο.
Παξαηεξείηαη όηη ν εθεδξηθόο αλεκηζηήξαο εμαεξηζκνύ (ν επόκελνο θαηά αύμνληα αξηζκό), ιεηηνπξγεί ζε
πεξίπησζε ζθάικαηνο ζην ξπζκηζηή ηνπ θηλεηήξα ηνπ πξώηνπ αλεκηζηήξα. ηελ πεξίπησζε όπνπ
ιεηηνπξγεί κόλν έλαο αλεκηζηήξαο εμαεξηζκνύ, ή ζηελ πεξίπησζε ζθαικάησλ ζην θεληξηθό ζύζηεκα
ειέγρνπ, ηόηε δίλεηαη αλαθνξά ηαρύηεηαο πξνο ηνπο θηλεηήξεο σο σ*ref = 95% σnom γηα ηελ πξνζηαζία ηεο
δηεξγαζίαο. Δάλ νη έιεγρνη αζθαιείαο ηνπ ζπζηήκαηνο είλαη επηηπρείο, ηόηε ε αλαθνξά ηαρύηεηαο ζηελ
θαλνληθή ιεηηνπξγία πξνθύπηεη από ηνλ πξνηεηλόκελν αιγόξηζκν ειέγρνπ κε βάζε ηα δεδνκέλα.
Main
power on
BL
Start
Local
Select
Local
Start
MSB
Start
HMI
Start
St/by
Select
Remote
Blackout
Power fail
VFDno
fail
Power
on
NO
YES
NO
YES
Active „Run‟
Command
GN
Motor
run
blink
GNMotor run
SEECFCU
ON
Ship energy
efficiency E/R Vent.
Sys control unit
NO
YES
σ*ref = 95%
manual
σ*ref by
control
algorithm
E/R Fan
Motor run
1
Stop/Reset
failure
GN
E/R Fan
Motor stop 1
Motor
run
VFDno=
VFDno+1
VFDno unit
Stop
Stop/Reset
failureRD
GN
fail
ALalarm
END
VFDno
motor stop
Main power
recovery
Sequential timer
counter up
1
Start
Local
Working
VFDno≥ 2
YES
NO
RD
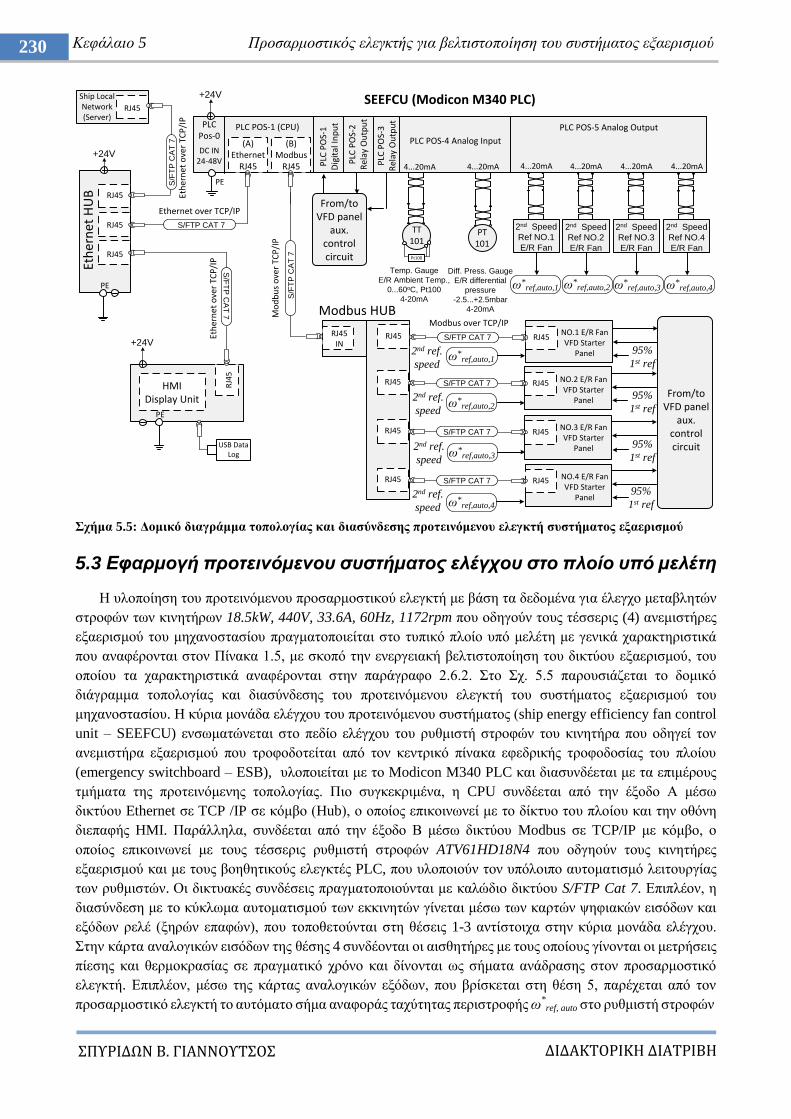
ΔΙΔΑΚΣΟΡΙΚΗ ΔΙΑΣΡΙΒΗ
ΠΤΡΙΔΩΝ Β. ΓΙΑΝΝΟΤΣΟ
230 Κεθάιαην 5 Πξνζαξκνζηηθόο ειεγθηήο γηα βειηηζηνπνίεζε ηνπ ζπζηήκαηνο εμαεξηζκνύ
ρήκα 5.5: Γνκηθό δηαγξάκκα ηνπνινγίαο θαη δηαζύλδεζεο πξνηεηλόκελνπ ειεγθηή ζπζηήκαηνο εμαεξηζκνύ
5.3 Δθαπμογή πποηεινόμενος ζςζηήμαηορ ελέγσος ζηο πλοίο ςπό μελέηη
Ζ πινπνίεζε ηνπ πξνηεηλόκελνπ πξνζαξκνζηηθνύ ειεγθηή κε βάζε ηα δεδνκέλα γηα έιεγρν κεηαβιεηώλ
ζηξνθώλ ησλ θηλεηήξσλ 18.5kW, 440V, 33.6A, 60Hz, 1172rpm πνπ νδεγνύλ ηνπο ηέζζεξηο (4) αλεκηζηήξεο
εμαεξηζκνύ ηνπ κεραλνζηαζίνπ πξαγκαηνπνηείηαη ζην ηππηθό πινίν ππό κειέηε κε γεληθά ραξαθηεξηζηηθά
πνπ αλαθέξνληαη ζηνλ Πίλαθα 1.5, κε ζθνπό ηελ ελεξγεηαθή βειηηζηνπνίεζε ηνπ δηθηύνπ εμαεξηζκνύ, ηνπ
νπνίνπ ηα ραξαθηεξηζηηθά αλαθέξνληαη ζηελ παξάγξαθν 2.6.2. ην ρ. 5.5 παξνπζηάδεηαη ην δνκηθό
δηάγξακκα ηνπνινγίαο θαη δηαζύλδεζεο ηνπ πξνηεηλόκελνπ ειεγθηή ηνπ ζπζηήκαηνο εμαεξηζκνύ ηνπ
κεραλνζηαζίνπ. H θύξηα κνλάδα ειέγρνπ ηνπ πξνηεηλόκελνπ ζπζηήκαηνο (ship energy efficiency fan control
unit – SEEFCU) ελζσκαηώλεηαη ζην πεδίν ειέγρνπ ηνπ ξπζκηζηή ζηξνθώλ ηνπ θηλεηήξα πνπ νδεγεί ηνλ
αλεκηζηήξα εμαεξηζκνύ πνπ ηξνθνδνηείηαη από ηνλ θεληξηθό πίλαθα εθεδξηθήο ηξνθνδνζίαο ηνπ πινίνπ
(emergency switchboard – ESB), πινπνηείηαη κε ην Modicon M340 PLC θαη δηαζπλδέεηαη κε ηα επηκέξνπο
ηκήκαηα ηεο πξνηεηλόκελεο ηνπνινγίαο. Πην ζπγθεθξηκέλα, ε CPU ζπλδέεηαη από ηελ έμνδν Α κέζσ
δηθηύνπ Ethernet ζε TCP /IP ζε θόκβν (Hub), ν νπνίνο επηθνηλσλεί κε ην δίθηπν ηνπ πινίνπ θαη ηελ νζόλε
δηεπαθήο HMI. Παξάιιεια, ζπλδέεηαη από ηελ έμνδν Β κέζσ δηθηύνπ Modbus ζε TCP/IP κε θόκβν, ν
νπνίνο επηθνηλσλεί κε ηνπο ηέζζεξηο ξπζκηζηή ζηξνθώλ ATV61HD18N4 πνπ νδγενύλ ηνπο θηλεηήξεο
εμαεξηζκνύ θαη κε ηνπο βνεζεηηθνύο ειεγθηέο PLC, πνπ πινπνηνύλ ηνλ ππόινηπν απηνκαηηζκό ιεηηνπξγίαο
ησλ ξπζκηζηώλ. Οη δηθηπαθέο ζπλδέζεηο πξαγκαηνπνηνύληαη κε θαιώδην δηθηύνπ S/FTP Cat 7. Δπηπιένλ, ε
δηαζύλδεζε κε ην θύθισκα απηνκαηηζκνύ ησλ εθθηλεηώλ γίλεηαη κέζσ ησλ θαξηώλ ςεθηαθώλ εηζόδσλ θαη
εμόδσλ ξειέ (μεξώλ επαθώλ), πνπ ηνπνζεηνύληαη ζηε ζέζεηο 1-3 αληίζηνηρα ζηελ θύξηα κνλάδα ειέγρνπ.
ηελ θάξηα αλαινγηθώλ εηζόδσλ ηεο ζέζεο 4 ζπλδένληαη νη αηζζεηήξεο κε ηνπο νπνίνπο γίλνληαη νη κεηξήζεηο
πίεζεο θαη ζεξκνθξαζίαο ζε πξαγκαηηθό ρξόλν θαη δίλνληαη σο ζήκαηα αλάδξαζεο ζηνλ πξνζαξκνζηηθό
ειεγθηή. Δπηπιένλ, κέζσ ηεο θάξηαο αλαινγηθώλ εμόδσλ, πνπ βξίζθεηαη ζηε ζέζε 5, παξέρεηαη από ηνλ
πξνζαξκνζηηθό ειεγθηή ην απηόκαην ζήκα αλαθνξάο ηαρύηεηαο πεξηζηξνθήο σ*
ref, auto ζην ξπζκηζηή ζηξνθώλ
DC IN24-48V
PLC Pos-0
PLC POS-1 (CPU)
S/F
TP
CA
T 7
RJ45IN
S/FTP CAT 7 RJ45NO.1 E/R Fan VFD Starter
Panel
PE
Modbus HUB
RJ45
RJ45
RJ45
PE
Eth
ern
et H
UB
S/F
TP
CA
T 7
RJ45
Ship Local Network (Server)
S/F
TP
CA
T 7
S/FTP CAT 7R
J45
HMI Display Unit
PE
Ethernet over TCP/IP
Eth
ern
et o
ver
TCP
/IP
Eth
ern
et o
ver
TCP
/IP
USB Data Log
+24V
+24V
+24V
TT101
PT101
(A)Ethernet
RJ45
(B)Modbus
RJ45
PLC POS-4 Analog Input
4...20mA
PLC POS-5 Analog Output
4...20mA
Pt100
Temp. Gauge
E/R Ambient Temp.,
0...60oC, Pt100
4-20mA
Diff. Press. Gauge
E/R differential
pressure
-2.5...+2.5mbar
4-20mA
Mo
db
us
ove
r TC
P/I
P
SEEFCU (Modicon M340 PLC)
4...20mAPLC
PO
S-1
D
igit
al In
pu
t
PLC
PO
S-2
R
elay
Ou
tpu
t
From/toVFD panel
aux. control circuit
RJ45
2nd Speed
Ref NO.1
E/R Fan
From/toVFD panel
aux. control circuit
Modbus over TCP/IP
σ*ref,auto,1
PLC
PO
S-3
R
elay
Ou
tpu
tS/FTP CAT 7 RJ45 NO.2 E/R Fan
VFD Starter Panel
RJ45
S/FTP CAT 7 RJ45NO.3 E/R Fan VFD Starter
Panel
RJ45
S/FTP CAT 7 RJ45 NO.4 E/R Fan VFD Starter
Panel
RJ45
4...20mA
2nd Speed
Ref NO.2
E/R Fan
4...20mA
2nd Speed
Ref NO.3
E/R Fan
4...20mA
2nd Speed
Ref NO.4
E/R Fan
σ*ref,auto,2 σ*
ref,auto,3 σ*ref,auto,4
σ*ref,auto,1
σ*ref,auto,2
σ*ref,auto,3
σ*ref,auto,4
95%
1st ref
95%
1st ref
95%
1st ref
95%
1st ref2nd ref.
speed
2nd ref.
speed
2nd ref.
speed
2nd ref.
speed
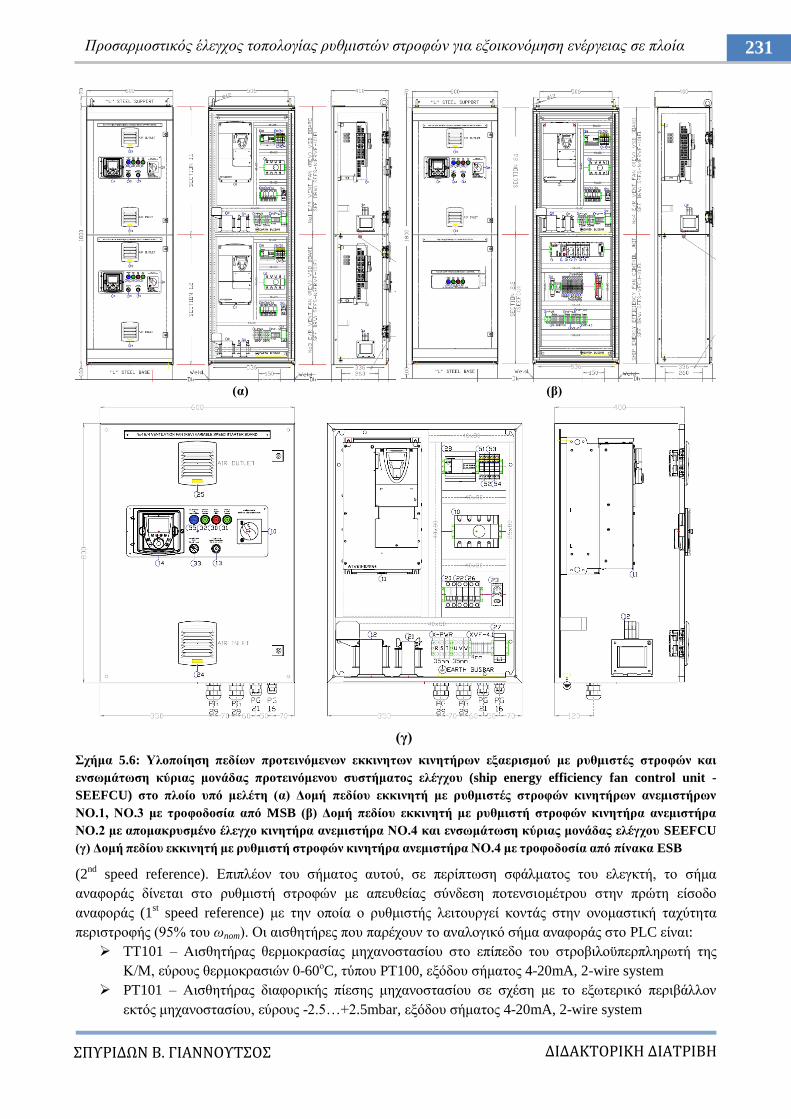
ΔΙΔΑΚΣΟΡΙΚΗ ΔΙΑΣΡΙΒΗ
ΠΤΡΙΔΩΝ Β. ΓΙΑΝΝΟΤΣΟ
231 Πξνζαξκνζηηθόο έιεγρνο ηνπνινγίαο ξπζκηζηώλ ζηξνθώλ γηα εμνηθνλόκεζε ελέξγεηαο ζε πινία
(α) (β)
(γ)
ρήκα 5.6: Τινπνίεζε πεδίσλ πξνηεηλόκελσλ εθθηλεησλ θηλεηήξσλ εμαεξηζκνύ κε ξπζκηζηέο ζηξνθώλ θαη
ελζσκάησζε θύξηαο κνλάδαο πξνηεηλόκελνπ ζπζηήκαηνο ειέγρνπ (ship energy efficiency fan control unit -
SEEFCU) ζην πινίν ππό κειέηε (α) Γνκή πεδίνπ εθθηλεηή κε ξπζκηζηέο ζηξνθώλ θηλεηήξσλ αλεκηζηήξσλ
ΝΟ.1, ΝΟ.3 κε ηξνθνδνζία από MSB (β) Γνκή πεδίνπ εθθηλεηή κε ξπζκηζηή ζηξνθώλ θηλεηήξα αλεκηζηήξα
ΝΟ.2 κε απνκαθξπζκέλν έιεγρν θηλεηήξα αλεκηζηήξα ΝΟ.4 θαη ελζσκάησζε θύξηαο κνλάδαο ειέγρνπ SEEFCU
(γ) Γνκή πεδίνπ εθθηλεηή κε ξπζκηζηή ζηξνθώλ θηλεηήξα αλεκηζηήξα ΝΟ.4 κε ηξνθνδνζία από πίλαθα ESB
(2nd
speed reference). Δπηπιένλ ηνπ ζήκαηνο απηνύ, ζε πεξίπησζε ζθάικαηνο ηνπ ειεγθηή, ην ζήκα
αλαθνξάο δίλεηαη ζην ξπζκηζηή ζηξνθώλ κε απεπζείαο ζύλδεζε πνηελζηoκέηξνπ ζηελ πξώηε είζνδν
αλαθνξάο (1st speed reference) κε ηελ νπνία ν ξπζκηζηήο ιεηηνπξγεί θνληάο ζηελ νλνκαζηηθή ηαρύηεηα
πεξηζηξνθήο (95% ηνπ σnom). Οη αηζζεηήξεο πνπ παξέρνπλ ην αλαινγηθό ζήκα αλαθνξάο ζην PLC είλαη:
TT101 – Αηζζεηήξαο ζεξκνθξαζίαο κεραλνζηαζίνπ ζην επίπεδν ηνπ ζηξνβηινϋπεξπιεξσηή ηεο
Κ/Μ, εύξνπο ζεξκνθξαζηώλ 0-60νC, ηύπνπ PT100, εμόδνπ ζήκαηνο 4-20mA, 2-wire system
PT101 – Αηζζεηήξαο δηαθνξηθήο πίεζεο κεραλνζηαζίνπ ζε ζρέζε κε ην εμσηεξηθό πεξηβάιινλ
εθηόο κεραλνζηαζίνπ, εύξνπο -2.5…+2.5mbar, εμόδνπ ζήκαηνο 4-20mA, 2-wire system
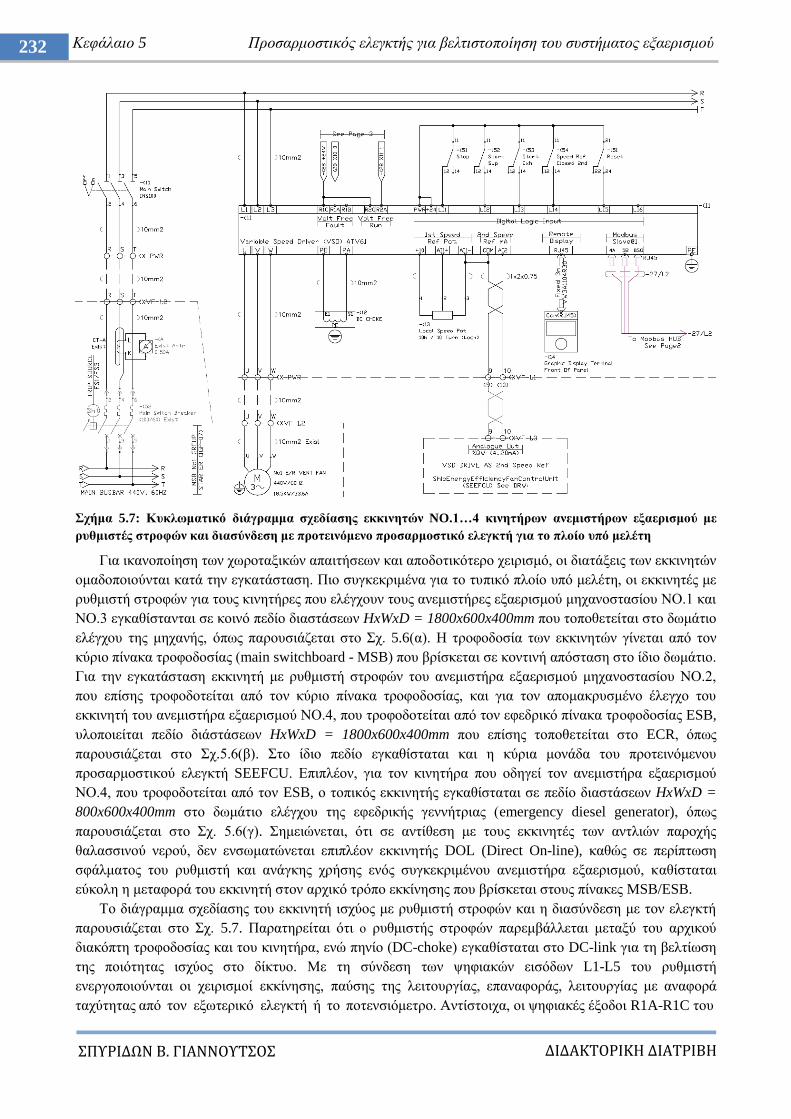
ΔΙΔΑΚΣΟΡΙΚΗ ΔΙΑΣΡΙΒΗ
ΠΤΡΙΔΩΝ Β. ΓΙΑΝΝΟΤΣΟ
232 Κεθάιαην 5 Πξνζαξκνζηηθόο ειεγθηήο γηα βειηηζηνπνίεζε ηνπ ζπζηήκαηνο εμαεξηζκνύ
ρήκα 5.7: Κπθισκαηηθό δηάγξακκα ζρεδίαζεο εθθηλεηώλ NO.1…4 θηλεηήξσλ αλεκηζηήξσλ εμαεξηζκνύ κε
ξπζκηζηέο ζηξνθώλ θαη δηαζύλδεζε κε πξνηεηλόκελν πξνζαξκνζηηθό ειεγθηή γηα ην πινίν ππό κειέηε
Γηα ηθαλνπνίεζε ησλ ρσξνηαμηθώλ απαηηήζεσλ θαη απνδνηηθόηεξν ρεηξηζκό, νη δηαηάμεηο ησλ εθθηλεηώλ
νκαδνπνηνύληαη θαηά ηελ εγθαηάζηαζε. Πην ζπγθεθξηκέλα γηα ην ηππηθό πινίν ππό κειέηε, νη εθθηλεηέο κε
ξπζκηζηή ζηξνθώλ γηα ηνπο θηλεηήξεο πνπ ειέγρνπλ ηνπο αλεκηζηήξεο εμαεξηζκνύ κεραλνζηαζίνπ ΝΟ.1 θαη
ΝΟ.3 εγθαζίζηαληαη ζε θνηλό πεδίν δηαζηάζεσλ HxWxD = 1800x600x400mm πνπ ηνπνζεηείηαη ζην δσκάηην
ειέγρνπ ηεο κεραλήο, όπσο παξνπζηάδεηαη ζην ρ. 5.6(α). Ζ ηξνθνδνζία ησλ εθθηλεηώλ γίλεηαη από ηνλ
θύξην πίλαθα ηξνθνδνζίαο (main switchboard - MSB) πνπ βξίζθεηαη ζε θνληηλή απόζηαζε ζην ίδην δσκάηην.
Γηα ηελ εγθαηάζηαζε εθθηλεηή κε ξπζκηζηή ζηξνθώλ ηνπ αλεκηζηήξα εμαεξηζκνύ κεραλνζηαζίνπ ΝΟ.2,
πνπ επίζεο ηξνθνδνηείηαη από ηνλ θύξην πίλαθα ηξνθνδνζίαο, θαη γηα ηνλ απνκαθξπζκέλν έιεγρν ηνπ
εθθηλεηή ηνπ αλεκηζηήξα εμαεξηζκνύ ΝΟ.4, πνπ ηξνθνδνηείηαη από ηνλ εθεδξηθό πίλαθα ηξνθνδνζίαο ESB,
πινπνηείηαη πεδίν δηάζηάζεσλ HxWxD = 1800x600x400mm πνπ επίζεο ηνπνζεηείηαη ζην ECR, όπσο
παξνπζηάδεηαη ζην ρ.5.6(β). ην ίδην πεδίν εγθαζίζηαηαη θαη ε θύξηα κνλάδα ηνπ πξνηεηλόκελνπ
πξνζαξκνζηηθνύ ειεγθηή SEEFCU. Δπηπιένλ, γηα ηνλ θηλεηήξα πνπ νδεγεί ηνλ αλεκηζηήξα εμαεξηζκνύ
ΝΟ.4, πνπ ηξνθνδνηείηαη από ηνλ ESB, ν ηνπηθόο εθθηλεηήο εγθαζίζηαηαη ζε πεδίν δηαζηάζεσλ HxWxD =
800x600x400mm ζην δσκάηην ειέγρνπ ηεο εθεδξηθήο γελλήηξηαο (emergency diesel generator), όπσο
παξνπζηάδεηαη ζην ρ. 5.6(γ). εκεηώλεηαη, όηη ζε αληίζεζε κε ηνπο εθθηλεηέο ησλ αληιηώλ παξνρήο
ζαιαζζηλνύ λεξνύ, δελ ελζσκαηώλεηαη επηπιένλ εθθηλεηήο DOL (Direct On-line), θαζώο ζε πεξίπησζε
ζθάικαηνο ηνπ ξπζκηζηή θαη αλάγθεο ρξήζεο ελόο ζπγθεθξηκέλνπ αλεκηζηήξα εμαεξηζκνύ, θαζίζηαηαη
εύθνιε ε κεηαθνξά ηνπ εθθηλεηή ζηνλ αξρηθό ηξόπν εθθίλεζεο πνπ βξίζθεηαη ζηνπο πίλαθεο MSB/ESB.
Σν δηάγξακκα ζρεδίαζεο ηνπ εθθηλεηή ηζρύνο κε ξπζκηζηή ζηξνθώλ θαη ε δηαζύλδεζε κε ηνλ ειεγθηή
παξνπζηάδεηαη ζην ρ. 5.7. Παξαηεξείηαη όηη ν ξπζκηζηήο ζηξνθώλ παξεκβάιιεηαη κεηαμύ ηνπ αξρηθνύ
δηαθόπηε ηξνθνδνζίαο θαη ηνπ θηλεηήξα, ελώ πελίν (DC-choke) εγθαζίζηαηαη ζην DC-link γηα ηε βειηίσζε
ηεο πνηόηεηαο ηζρύνο ζην δίθηπν. Με ηε ζύλδεζε ησλ ςεθηαθώλ εηζόδσλ L1-L5 ηνπ ξπζκηζηή
ελεξγνπνηνύληαη νη ρεηξηζκνί εθθίλεζεο, παύζεο ηεο ιεηηνπξγίαο, επαλαθνξάο, ιεηηνπξγίαο κε αλαθνξά
ηαρύηεηαο από ηνλ εμσηεξηθό ειεγθηή ή ην πνηελζηόκεηξν. Αληίζηνηρα, νη ςεθηαθέο έμνδνη R1A-R1C ηνπ
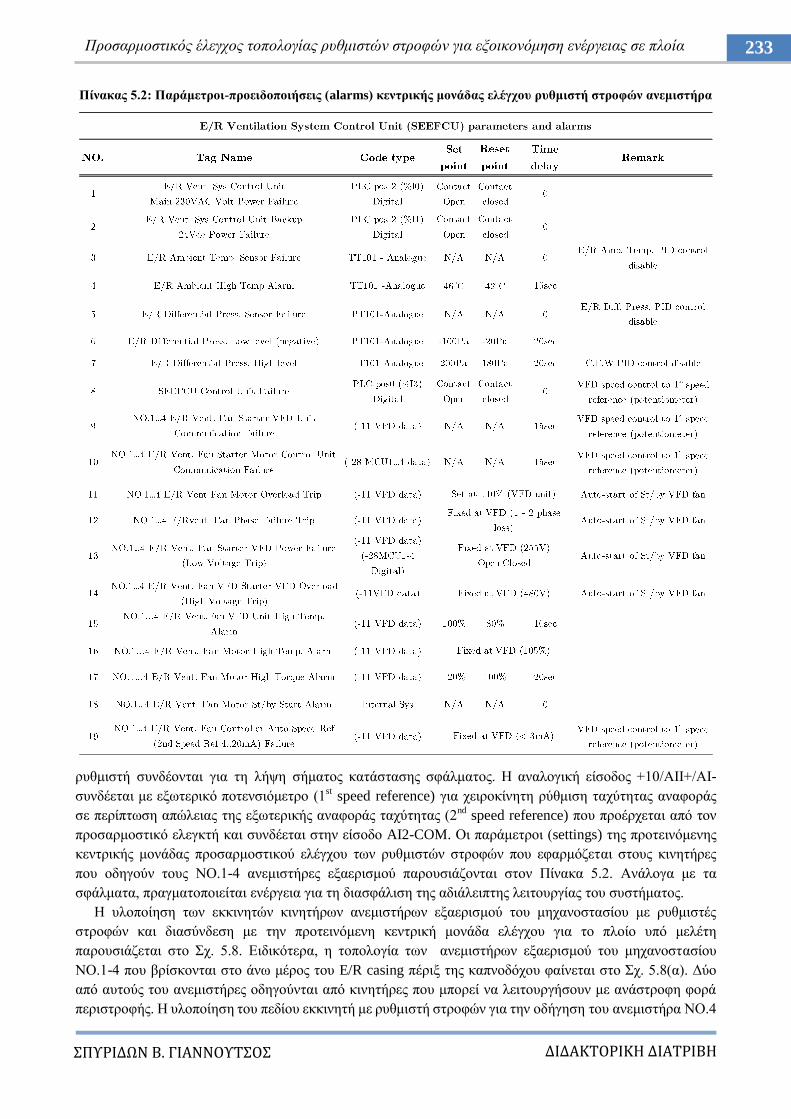
ΔΙΔΑΚΣΟΡΙΚΗ ΔΙΑΣΡΙΒΗ
ΠΤΡΙΔΩΝ Β. ΓΙΑΝΝΟΤΣΟ
233 Πξνζαξκνζηηθόο έιεγρνο ηνπνινγίαο ξπζκηζηώλ ζηξνθώλ γηα εμνηθνλόκεζε ελέξγεηαο ζε πινία
Πίλαθαο 5.2: Παξάκεηξνη-πξνεηδνπνηήζεηο (alarms) θεληξηθήο κνλάδαο ειέγρνπ ξπζκηζηή ζηξνθώλ αλεκηζηήξα
ξπζκηζηή ζπλδένληαη γηα ηε ιήςε ζήκαηνο θαηάζηαζεο ζθάικαηνο. Ζ αλαινγηθή είζνδνο +10/ΑΗΗ+/ΑΗ-
ζπλδέεηαη κε εμσηεξηθό πνηελζηόκεηξν (1st speed reference) γηα ρεηξνθίλεηε ξύζκηζε ηαρύηεηαο αλαθνξάο
ζε πεξίπησζε απώιεηαο ηεο εμσηεξηθήο αλαθνξάο ηαρύηεηαο (2nd
speed reference) πνπ πξνέξρεηαη από ηνλ
πξνζαξκνζηηθό ειεγθηή θαη ζπλδέεηαη ζηελ είζνδν AI2-COM. Οη παξάκεηξνη (settings) ηεο πξνηεηλόκελεο
θεληξηθήο κνλάδαο πξνζαξκνζηηθνύ ειέγρνπ ησλ ξπζκηζηώλ ζηξνθώλ πνπ εθαξκόδεηαη ζηνπο θηλεηήξεο
πνπ νδεγνύλ ηνπο ΝΟ.1-4 αλεκηζηήξεο εμαεξηζκνύ παξνπζηάδνληαη ζηνλ Πίλαθα 5.2. Αλάινγα κε ηα
ζθάικαηα, πξαγκαηνπνηείηαη ελέξγεηα γηα ηε δηαζθάιηζε ηεο αδηάιεηπηεο ιεηηνπξγίαο ηνπ ζπζηήκαηνο.
Ζ πινπνίεζε ησλ εθθηλεηώλ θηλεηήξσλ αλεκηζηήξσλ εμαεξηζκνύ ηνπ κεραλνζηαζίνπ κε ξπζκηζηέο
ζηξνθώλ θαη δηαζύλδεζε κε ηελ πξνηεηλόκελε θεληξηθή κνλάδα ειέγρνπ γηα ην πινίν ππό κειέηε
παξνπζηάδεηαη ζην ρ. 5.8. Δηδηθόηεξα, ε ηνπνινγία ησλ αλεκηζηήξσλ εμαεξηζκνύ ηνπ κεραλνζηαζίνπ
ΝΟ.1-4 πνπ βξίζθνληαη ζην άλσ κέξνο ηνπ E/R casing πέξημ ηεο θαπλνδόρνπ θαίλεηαη ζην ρ. 5.8(α). Γύν
από απηνύο ηνπ αλεκηζηήξεο νδεγνύληαη από θηλεηήξεο πνπ κπνξεί λα ιεηηνπξγήζνπλ κε αλάζηξνθε θνξά
πεξηζηξνθήο. Ζ πινπνίεζε ηνπ πεδίνπ εθθηλεηή κε ξπζκηζηή ζηξνθώλ γηα ηελ νδήγεζε ηνπ αλεκηζηήξα ΝΟ.4
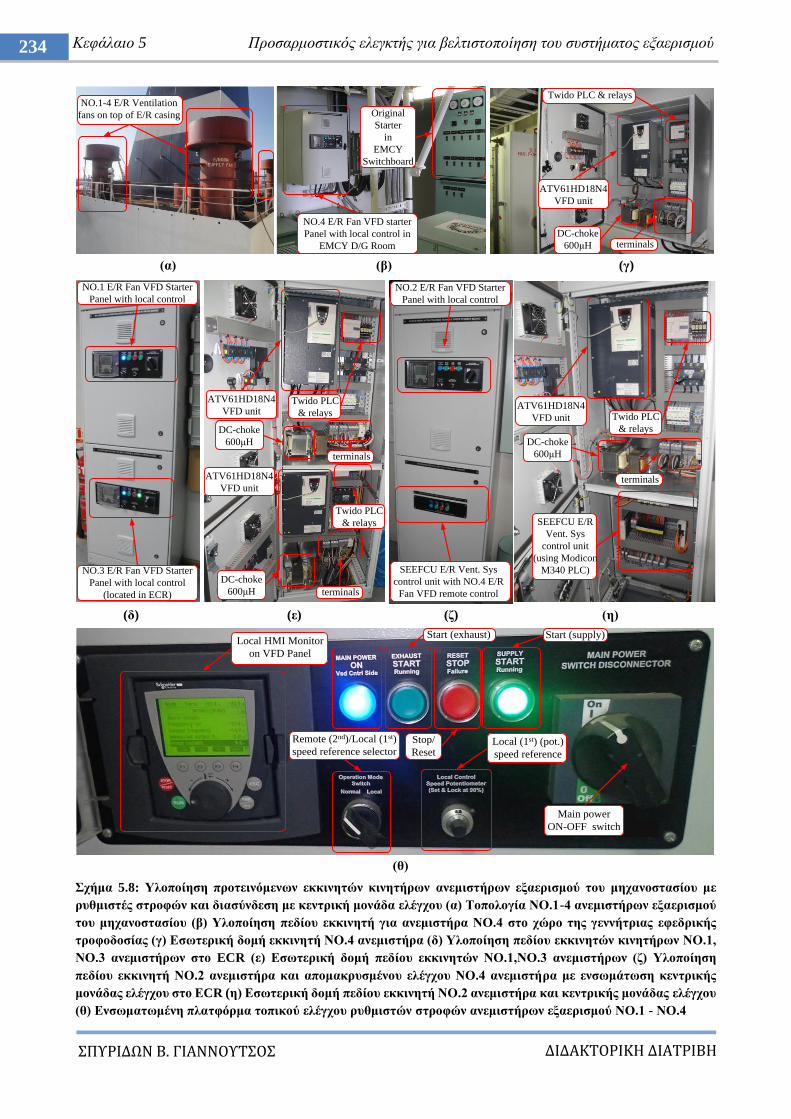
ΔΙΔΑΚΣΟΡΙΚΗ ΔΙΑΣΡΙΒΗ
ΠΤΡΙΔΩΝ Β. ΓΙΑΝΝΟΤΣΟ
234 Κεθάιαην 5 Πξνζαξκνζηηθόο ειεγθηήο γηα βειηηζηνπνίεζε ηνπ ζπζηήκαηνο εμαεξηζκνύ
(α) (β) (γ)
(δ) (ε) (δ) (ε)
(ζ)
ρήκα 5.8: Τινπνίεζε πξνηεηλόκελσλ εθθηλεηώλ θηλεηήξσλ αλεκηζηήξσλ εμαεξηζκνύ ηνπ κεραλνζηαζίνπ κε
ξπζκηζηέο ζηξνθώλ θαη δηαζύλδεζε κε θεληξηθή κνλάδα ειέγρνπ (α) Σνπνινγία ΝΟ.1-4 αλεκηζηήξσλ εμαεξηζκνύ
ηνπ κεραλνζηαζίνπ (β) Τινπνίεζε πεδίνπ εθθηλεηή γηα αλεκηζηήξα ΝΟ.4 ζην ρώξν ηεο γελλήηξηαο εθεδξηθήο
ηξνθνδνζίαο (γ) Δζσηεξηθή δνκή εθθηλεηή ΝΟ.4 αλεκηζηήξα (δ) Τινπνίεζε πεδίνπ εθθηλεηώλ θηλεηήξσλ ΝΟ.1,
ΝΟ.3 αλεκηζηήξσλ ζην ECR (ε) Δζσηεξηθή δνκή πεδίνπ εθθηλεηώλ ΝΟ.1,ΝΟ.3 αλεκηζηήξσλ (δ) Τινπνίεζε
πεδίνπ εθθηλεηή ΝΟ.2 αλεκηζηήξα θαη απνκαθξπζκέλνπ ειέγρνπ ΝΟ.4 αλεκηζηήξα κε ελζσκάησζε θεληξηθήο
κνλάδαο ειέγρνπ ζην ΔCR (ε) Δζσηεξηθή δνκή πεδίνπ εθθηλεηή ΝΟ.2 αλεκηζηήξα θαη θεληξηθήο κνλάδαο ειέγρνπ
(ζ) Δλζσκαησκέλε πιαηθόξκα ηνπηθνύ ειέγρνπ ξπζκηζηώλ ζηξνθώλ αλεκηζηήξσλ εμαεξηζκνύ ΝΟ.1 - ΝΟ.4
NO.4 E/R Fan VFD starter
Panel with local control in
EMCY D/G Room
Original
Starter
in
EMCY
Switchboard
ATV61HD18N4
VFD unit
Twido PLC & relays
DC-choke
600κH terminals
NO.1-4 E/R Ventilation
fans on top of E/R casing
NO.1 E/R Fan VFD Starter
Panel with local control
NO.3 E/R Fan VFD Starter
Panel with local control
(located in ECR)
NO.2 E/R Fan VFD Starter
Panel with local control
SEEFCU E/R Vent. Sys
control unit with NO.4 E/R
Fan VFD remote control
ATV61HD18N4
VFD unit
ATV61HD18N4
VFD unit
DC-choke
600κH
Twido PLC
& relays
terminals
Twido PLC
& relays
DC-choke
600κH terminals
ATV61HD18N4
VFD unit
DC-choke
600κH
terminals
Twido PLC
& relays
SEEFCU E/R
Vent. Sys
control unit
(using Modicon
M340 PLC)
Main power
ON-OFF switch
Local HMI Monitor
on VFD Panel
Local (1st) (pot.)
speed reference
Remote (2nd)/Local (1st)
speed reference selector
Start (supply)Start (exhaust)
Stop/
Reset
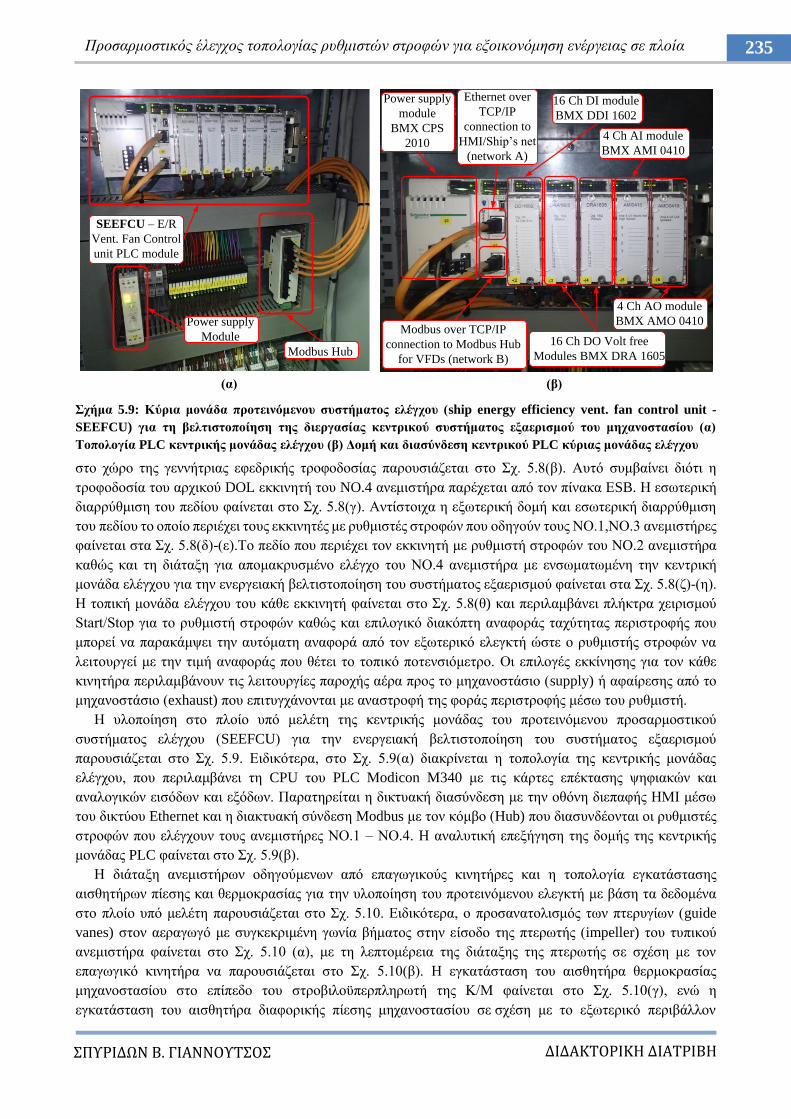
ΔΙΔΑΚΣΟΡΙΚΗ ΔΙΑΣΡΙΒΗ
ΠΤΡΙΔΩΝ Β. ΓΙΑΝΝΟΤΣΟ
235 Πξνζαξκνζηηθόο έιεγρνο ηνπνινγίαο ξπζκηζηώλ ζηξνθώλ γηα εμνηθνλόκεζε ελέξγεηαο ζε πινία
(α) (β)
ρήκα 5.9: Κύξηα κνλάδα πξνηεηλόκελνπ ζπζηήκαηνο ειέγρνπ (ship energy efficiency vent. fan control unit -
SEEFCU) γηα ηε βειηηζηνπνίεζε ηεο δηεξγαζίαο θεληξηθνύ ζπζηήκαηνο εμαεξηζκνύ ηνπ κεραλνζηαζίνπ (α)
Σνπνινγία PLC θεληξηθήο κνλάδαο ειέγρνπ (β) Γνκή θαη δηαζύλδεζε θεληξηθνύ PLC θύξηαο κνλάδαο ειέγρνπ
ζην ρώξν ηεο γελλήηξηαο εθεδξηθήο ηξνθνδνζίαο παξνπζηάδεηαη ζην ρ. 5.8(β). Απηό ζπκβαίλεη δηόηη ε
ηξνθνδνζία ηνπ αξρηθνύ DOL εθθηλεηή ηνπ NO.4 αλεκηζηήξα παξέρεηαη από ηνλ πίλαθα ΔSB. Ζ εζσηεξηθή
δηαξξύζκηζε ηνπ πεδίνπ θαίλεηαη ζην ρ. 5.8(γ). Αληίζηνηρα ε εμσηεξηθή δνκή θαη εζσηεξηθή δηαξξύζκηζε
ηνπ πεδίνπ ην νπνίν πεξηέρεη ηνπο εθθηλεηέο κε ξπζκηζηέο ζηξνθώλ πνπ νδεγνύλ ηνπο ΝΟ.1,ΝΟ.3 αλεκηζηήξεο
θαίλεηαη ζηα ρ. 5.8(δ)-(ε).Σν πεδίν πνπ πεξηέρεη ηνλ εθθηλεηή κε ξπζκηζηή ζηξνθώλ ηνπ ΝΟ.2 αλεκηζηήξα
θαζώο θαη ηε δηάηαμε γηα απνκαθξπζκέλν ειέγρν ηνπ ΝΟ.4 αλεκηζηήξα κε ελζσκαησκέλε ηελ θεληξηθή
κνλάδα ειέγρνπ γηα ηελ ελεξγεηαθή βειηηζηνπνίεζε ηνπ ζπζηήκαηνο εμαεξηζκνύ θαίλεηαη ζηα ρ. 5.8(δ)-(ε).
Ζ ηνπηθή κνλάδα ειέγρνπ ηνπ θάζε εθθηλεηή θαίλεηαη ζην ρ. 5.8(ζ) θαη πεξηιακβάλεη πιήθηξα ρεηξηζκνύ
Start/Stop γηα ην ξπζκηζηή ζηξνθώλ θαζώο θαη επηινγηθό δηαθόπηε αλαθνξάο ηαρύηεηαο πεξηζηξνθήο πνπ
κπνξεί λα παξαθάκςεη ηελ απηόκαηε αλαθνξά από ηνλ εμσηεξηθό ειεγθηή ώζηε ν ξπζκηζηήο ζηξνθώλ λα
ιεηηνπξγεί κε ηελ ηηκή αλαθνξάο πνπ ζέηεη ην ηνπηθό πνηελζηόκεηξν. Οη επηινγέο εθθίλεζεο γηα ηνλ θάζε
θηλεηήξα πεξηιακβάλνπλ ηηο ιεηηνπξγίεο παξνρήο αέξα πξνο ην κεραλνζηάζην (supply) ή αθαίξεζεο από ην
κεραλνζηάζην (exhaust) πνπ επηηπγράλνληαη κε αλαζηξνθή ηεο θνξάο πεξηζηξνθήο κέζσ ηνπ ξπζκηζηή.
Ζ πινπνίεζε ζην πινίν ππό κειέηε ηεο θεληξηθήο κνλάδαο ηνπ πξνηεηλόκελνπ πξνζαξκνζηηθνύ
ζπζηήκαηνο ειέγρνπ (SEEFCU) γηα ηελ ελεξγεηαθή βειηηζηνπνίεζε ηνπ ζπζηήκαηνο εμαεξηζκνύ
παξνπζηάδεηαη ζην ρ. 5.9. Δηδηθόηεξα, ζην ρ. 5.9(α) δηαθξίλεηαη ε ηνπνινγία ηεο θεληξηθήο κνλάδαο
ειέγρνπ, πνπ πεξηιακβάλεη ηε CPU ηνπ PLC Modicon M340 κε ηηο θάξηεο επέθηαζεο ςεθηαθώλ θαη
αλαινγηθώλ εηζόδσλ θαη εμόδσλ. Παξαηεξείηαη ε δηθηπαθή δηαζύλδεζε κε ηελ νζόλε δηεπαθήο ΖΜΗ κέζσ
ηνπ δηθηύνπ Ethernet θαη ε δηαθηπαθή ζύλδεζε Modbus κε ηνλ θόκβν (Hub) πνπ δηαζπλδένληαη νη ξπζκηζηέο
ζηξνθώλ πνπ ειέγρνπλ ηνπο αλεκηζηήξεο ΝΟ.1 – ΝΟ.4. Ζ αλαιπηηθή επεμήγεζε ηεο δνκήο ηεο θεληξηθήο
κνλάδαο PLC θαίλεηαη ζην ρ. 5.9(β).
Ζ δηάηαμε αλεκηζηήξσλ νδεγνύκελσλ από επαγσγηθνύο θηλεηήξεο θαη ε ηνπνινγία εγθαηάζηαζεο
αηζζεηήξσλ πίεζεο θαη ζεξκνθξαζίαο γηα ηελ πινπνίεζε ηνπ πξνηεηλόκελνπ ειεγθηή κε βάζε ηα δεδνκέλα
ζην πινίν ππό κειέηε παξνπζηάδεηαη ζην ρ. 5.10. Δηδηθόηεξα, ν πξνζαλαηνιηζκόο ησλ πηεξπγίσλ (guide
vanes) ζηνλ αεξαγσγό κε ζπγθεθξηκέλε γσλία βήκαηνο ζηελ είζνδν ηεο πηεξσηήο (impeller) ηνπ ηππηθνύ
αλεκηζηήξα θαίλεηαη ζην ρ. 5.10 (α), κε ηε ιεπηνκέξεηα ηεο δηάηαμεο ηεο πηεξσηήο ζε ζρέζε κε ηνλ
επαγσγηθό θηλεηήξα λα παξνπζηάδεηαη ζην ρ. 5.10(β). Ζ εγθαηάζηαζε ηνπ αηζζεηήξα ζεξκνθξαζίαο
κεραλνζηαζίνπ ζην επίπεδν ηνπ ζηξνβηινϋπεξπιεξσηή ηεο Κ/Μ θαίλεηαη ζην ρ. 5.10(γ), ελώ ε
εγθαηάζηαζε ηνπ αηζζεηήξα δηαθνξηθήο πίεζεο κεραλνζηαζίνπ ζε ζρέζε κε ην εμσηεξηθό πεξηβάιινλ
SEEFCU – E/R
Vent. Fan Control
unit PLC module
Modbus Hub
Power supply
Module
Power supply
module
BMX CPS
2010
16 Ch DI module
BMX DDI 1602
Ethernet over
TCP/IP
connection to
HMI/Ship‟s net
(network A)
Modbus over TCP/IP
connection to Modbus Hub
for VFDs (network B)
16 Ch DO Volt free
Modules BMX DRA 1605
4 Ch AI module
BMX AMI 0410
4 Ch AO module
BMX AMO 0410
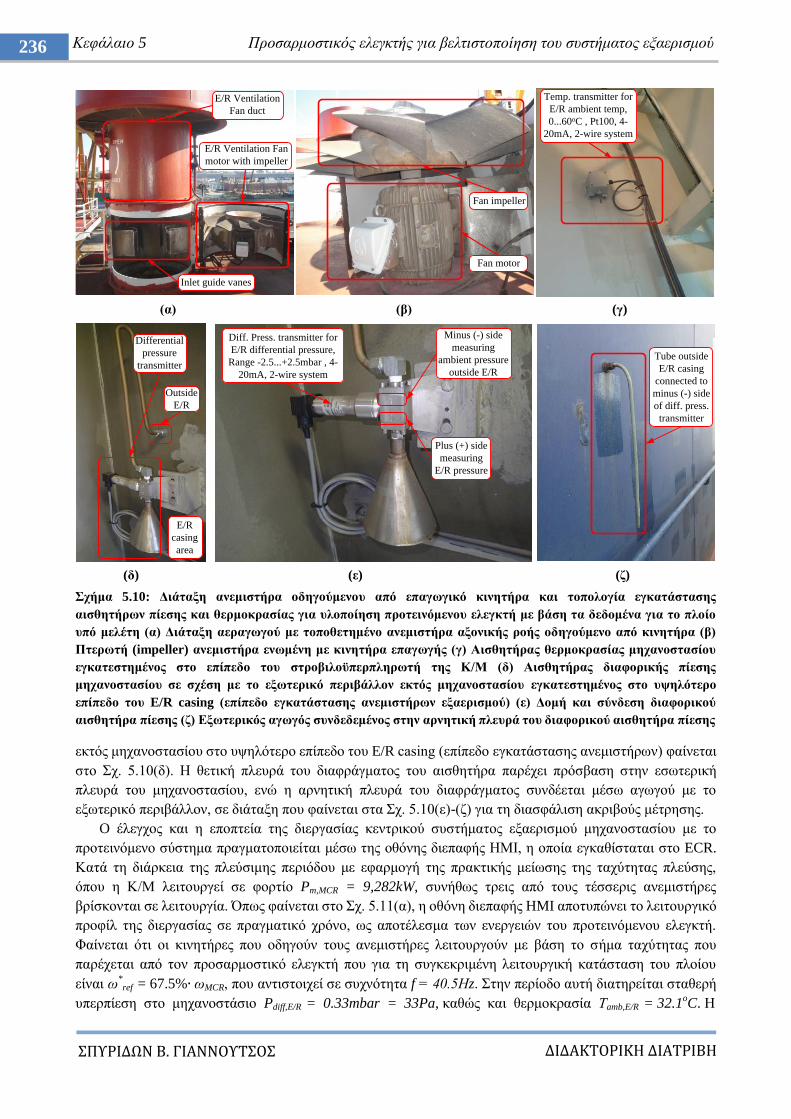
ΔΙΔΑΚΣΟΡΙΚΗ ΔΙΑΣΡΙΒΗ
ΠΤΡΙΔΩΝ Β. ΓΙΑΝΝΟΤΣΟ
236 Κεθάιαην 5 Πξνζαξκνζηηθόο ειεγθηήο γηα βειηηζηνπνίεζε ηνπ ζπζηήκαηνο εμαεξηζκνύ
(α) (β) (γ)
(δ) (ε) (δ)
ρήκα 5.10: Γηάηαμε αλεκηζηήξα νδεγνύκελνπ από επαγσγηθό θηλεηήξα θαη ηνπνινγία εγθαηάζηαζεο
αηζζεηήξσλ πίεζεο θαη ζεξκνθξαζίαο γηα πινπνίεζε πξνηεηλόκελνπ ειεγθηή κε βάζε ηα δεδνκέλα γηα ην πινίν
ππό κειέηε (α) Γηάηαμε αεξαγσγνύ κε ηνπνζεηεκέλν αλεκηζηήξα αμνληθήο ξνήο νδεγνύκελν από θηλεηήξα (β)
Πηεξσηή (impeller) αλεκηζηήξα ελσκέλε κε θηλεηήξα επαγσγήο (γ) Αηζζεηήξαο ζεξκνθξαζίαο κεραλνζηαζίνπ
εγθαηεζηεκέλνο ζην επίπεδν ηνπ ζηξνβηινϋπεξπιεξσηή ηεο Κ/Μ (δ) Αηζζεηήξαο δηαθνξηθήο πίεζεο
κεραλνζηαζίνπ ζε ζρέζε κε ην εμσηεξηθό πεξηβάιινλ εθηόο κεραλνζηαζίνπ εγθαηεζηεκέλνο ζην πςειόηεξν
επίπεδν ηνπ E/R casing (επίπεδν εγθαηάζηαζεο αλεκηζηήξσλ εμαεξηζκνύ) (ε) Γνκή θαη ζύλδεζε δηαθνξηθνύ
αηζζεηήξα πίεζεο (δ) Δμσηεξηθόο αγσγόο ζπλδεδεκέλνο ζηελ αξλεηηθή πιεπξά ηνπ δηαθνξηθνύ αηζζεηήξα πίεζεο
εθηόο κεραλνζηαζίνπ ζην πςειόηεξν επίπεδν ηνπ E/R casing (επίπεδν εγθαηάζηαζεο αλεκηζηήξσλ) θαίλεηαη
ζην ρ. 5.10(δ). Ζ ζεηηθή πιεπξά ηνπ δηαθξάγκαηνο ηνπ αηζζεηήξα παξέρεη πξόζβαζε ζηελ εζσηεξηθή
πιεπξά ηνπ κεραλνζηαζίνπ, ελώ ε αξλεηηθή πιεπξά ηνπ δηαθξάγκαηνο ζπλδέεηαη κέζσ αγσγνύ κε ην
εμσηεξηθό πεξηβάιινλ, ζε δηάηαμε πνπ θαίλεηαη ζηα ρ. 5.10(ε)-(δ) γηα ηε δηαζθάιηζε αθξηβνύο κέηξεζεο.
O έιεγρνο θαη ε επνπηεία ηεο δηεξγαζίαο θεληξηθνύ ζπζηήκαηνο εμαεξηζκνύ κεραλνζηαζίνπ κε ην
πξνηεηλόκελν ζύζηεκα πξαγκαηνπνηείηαη κέζσ ηεο νζόλεο δηεπαθήο HMI, ε νπνία εγθαζίζηαηαη ζην ECR.
Καηά ηε δηάξθεηα ηεο πιεύζηκεο πεξηόδνπ κε εθαξκνγή ηεο πξαθηηθήο κείσζεο ηεο ηαρύηεηαο πιεύζεο,
όπνπ ε Κ/Μ ιεηηνπξγεί ζε θνξηίν Pm,MCR = 9,282kW, ζπλήζσο ηξεηο από ηνπο ηέζζεξηο αλεκηζηήξεο
βξίζθνληαη ζε ιεηηνπξγία. Όπσο θαίλεηαη ζην ρ. 5.11(α), ε νζόλε δηεπαθήο HMI απνηππώλεη ην ιεηηνπξγηθό
πξνθίι ηεο δηεξγαζίαο ζε πξαγκαηηθό ρξόλν, σο απνηέιεζκα ησλ ελεξγεηώλ ηνπ πξνηεηλόκελνπ ειεγθηή.
Φαίλεηαη όηη νη θηλεηήξεο πνπ νδεγνύλ ηνπο αλεκηζηήξεο ιεηηνπξγνύλ κε βάζε ην ζήκα ηαρύηεηαο πνπ
παξέρεηαη από ηνλ πξνζαξκνζηηθό ειεγθηή πνπ γηα ηε ζπγθεθξηκέλε ιεηηνπξγηθή θαηάζηαζε ηνπ πινίνπ
είλαη σ*ref = 67.5% σMCR, πνπ αληηζηνηρεί ζε ζπρλόηεηα f = 40.5Ζz. ηελ πεξίνδν απηή δηαηεξείηαη ζηαζεξή
ππεξπίεζε ζην κεραλνζηάζην Pdiff,E/R = 0.33mbar = 33Pa, θαζώο θαη ζεξκνθξαζία Σamb,E/R = 32.1oC. Ζ
E/R Ventilation Fan
motor with impeller
E/R Ventilation
Fan duct
Inlet guide vanes
Fan impeller
Fan motor
Temp. transmitter for
E/R ambient temp,
0...60oC , Pt100, 4-
20mA, 2-wire system
Differential
pressure
transmitter
E/R
casing
area
Outside
E/R
Diff. Press. transmitter for
E/R differential pressure,
Range -2.5...+2.5mbar , 4-
20mA, 2-wire system
Plus (+) side
measuring
E/R pressure
Minus (-) side
measuring
ambient pressure
outside E/R
Tube outside
E/R casing
connected to
minus (-) side
of diff. press.
transmitter
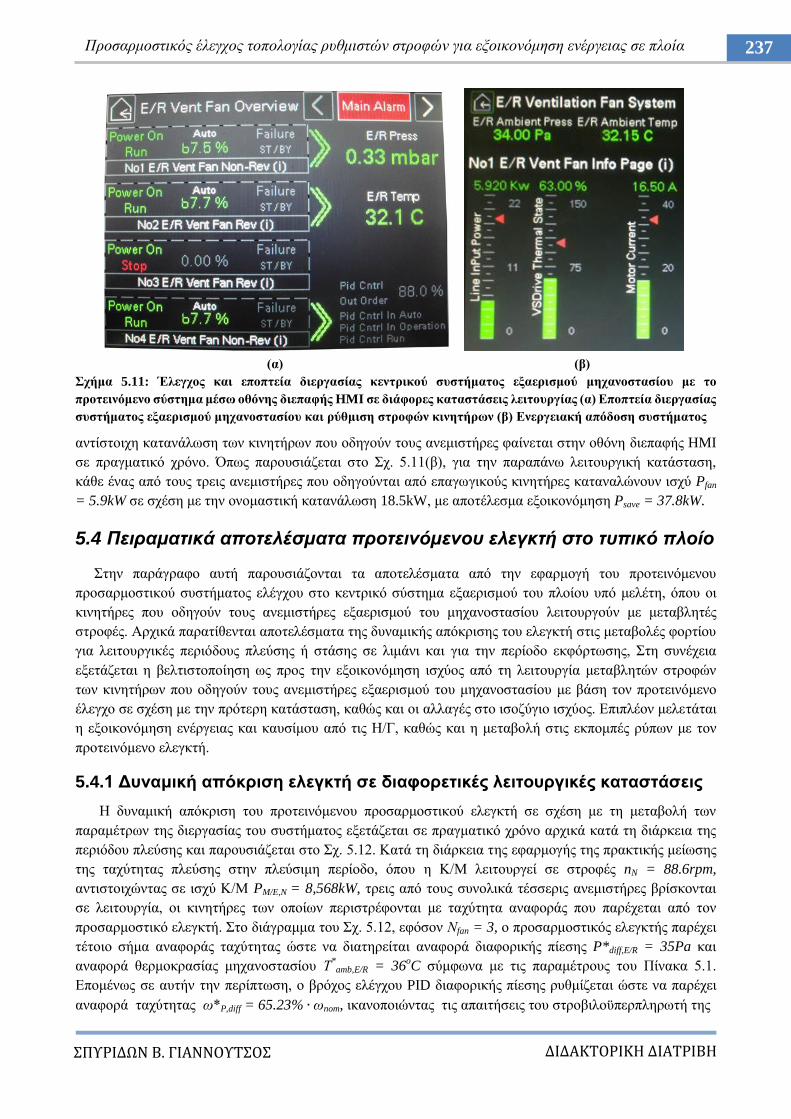
ΔΙΔΑΚΣΟΡΙΚΗ ΔΙΑΣΡΙΒΗ
ΠΤΡΙΔΩΝ Β. ΓΙΑΝΝΟΤΣΟ
237 Πξνζαξκνζηηθόο έιεγρνο ηνπνινγίαο ξπζκηζηώλ ζηξνθώλ γηα εμνηθνλόκεζε ελέξγεηαο ζε πινία
(α) (β)
ρήκα 5.11: Έιεγρνο θαη επνπηεία δηεξγαζίαο θεληξηθνύ ζπζηήκαηνο εμαεξηζκνύ κεραλνζηαζίνπ κε ην
πξνηεηλόκελν ζύζηεκα κέζσ νζόλεο δηεπαθήο HMI ζε δηάθνξεο θαηαζηάζεηο ιεηηνπξγίαο (α) Δπνπηεία δηεξγαζίαο
ζπζηήκαηνο εμαεξηζκνύ κεραλνζηαζίνπ θαη ξύζκηζε ζηξνθώλ θηλεηήξσλ (β) Δλεξγεηαθή απόδνζε ζπζηήκαηνο
αληίζηνηρε θαηαλάισζε ησλ θηλεηήξσλ πνπ νδεγνύλ ηνπο αλεκηζηήξεο θαίλεηαη ζηελ νζόλε δηεπαθήο HMI
ζε πξαγκαηηθό ρξόλν. Όπσο παξνπζηάδεηαη ζην ρ. 5.11(β), γηα ηελ παξαπάλσ ιεηηνπξγηθή θαηάζηαζε,
θάζε έλαο από ηνπο ηξεηο αλεκηζηήξεο πνπ νδεγνύληαη από επαγσγηθνύο θηλεηήξεο θαηαλαιώλνπλ ηζρύ Pfan
= 5.9kW ζε ζρέζε κε ηελ νλνκαζηηθή θαηαλάισζε 18.5kW, κε απνηέιεζκα εμνηθνλόκεζε Psave = 37.8kW.
5.4 Πειπαμαηικά αποηελέζμαηα πποηεινόμενος ελεγκηή ζηο ηςπικό πλοίο
ηελ παξάγξαθν απηή παξνπζηάδνληαη ηα απνηειέζκαηα από ηελ εθαξκνγή ηνπ πξνηεηλόκελνπ
πξνζαξκνζηηθνύ ζπζηήκαηνο ειέγρνπ ζην θεληξηθό ζύζηεκα εμαεξηζκνύ ηνπ πινίνπ ππό κειέηε, όπνπ νη
θηλεηήξεο πνπ νδεγνύλ ηνπο αλεκηζηήξεο εμαεξηζκνύ ηνπ κεραλνζηαζίνπ ιεηηνπξγνύλ κε κεηαβιεηέο
ζηξνθέο. Αξρηθά παξαηίζεληαη απνηειέζκαηα ηεο δπλακηθήο απόθξηζεο ηνπ ειεγθηή ζηηο κεηαβνιέο θνξηίνπ
γηα ιεηηνπξγηθέο πεξηόδνπο πιεύζεο ή ζηάζεο ζε ιηκάλη θαη γηα ηελ πεξίνδν εθθόξησζεο, ηε ζπλέρεηα
εμεηάδεηαη ε βειηηζηνπνίεζε σο πξνο ηελ εμνηθνλόκεζε ηζρύνο από ηε ιεηηνπξγία κεηαβιεηώλ ζηξνθώλ
ησλ θηλεηήξσλ πνπ νδεγνύλ ηνπο αλεκηζηήξεο εμαεξηζκνύ ηνπ κεραλνζηαζίνπ κε βάζε ηνλ πξνηεηλόκελν
έιεγρν ζε ζρέζε κε ηελ πξόηεξε θαηάζηαζε, θαζώο θαη νη αιιαγέο ζην ηζνδύγην ηζρύνο. Δπηπιένλ κειεηάηαη
ε εμνηθνλόκεζε ελέξγεηαο θαη θαπζίκνπ από ηηο Ζ/Γ, θαζώο θαη ε κεηαβνιή ζηηο εθπνκπέο ξύπσλ κε ηνλ
πξνηεηλόκελν ειεγθηή.
5.4.1 Γπλακηθή απόθξηζε ειεγθηή ζε δηαθνξεηηθέο ιεηηνπξγηθέο θαηαζηάζεηο
Ζ δπλακηθή απόθξηζε ηνπ πξνηεηλόκελνπ πξνζαξκνζηηθνύ ειεγθηή ζε ζρέζε κε ηε κεηαβνιή ησλ
παξακέηξσλ ηεο δηεξγαζίαο ηνπ ζπζηήκαηνο εμεηάδεηαη ζε πξαγκαηηθό ρξόλν αξρηθά θαηά ηε δηάξθεηα ηεο
πεξηόδνπ πιεύζεο θαη παξνπζηάδεηαη ζην ρ. 5.12. Καηά ηε δηάξθεηα ηεο εθαξκνγήο ηεο πξαθηηθήο κείσζεο
ηεο ηαρύηεηαο πιεύζεο ζηελ πιεύζηκε πεξίνδν, όπνπ ε Κ/Μ ιεηηνπξγεί ζε ζηξνθέο nN = 88.6rpm,
αληηζηνηρώληαο ζε ηζρύ Κ/Μ PM/E,N = 8,568kW, ηξεηο από ηνπο ζπλνιηθά ηέζζεξηο αλεκηζηήξεο βξίζθνληαη
ζε ιεηηνπξγία, νη θηλεηήξεο ησλ νπνίσλ πεξηζηξέθνληαη κε ηαρύηεηα αλαθνξάο πνπ παξέρεηαη από ηνλ
πξνζαξκνζηηθό ειεγθηή. ην δηάγξακκα ηνπ ρ. 5.12, εθόζνλ Νfan = 3, o πξνζαξκνζηηθόο ειεγθηήο παξέρεη
ηέηνην ζήκα αλαθνξάο ηαρύηεηαο ώζηε λα δηαηεξείηαη αλαθνξά δηαθνξηθήο πίεζεο P*diff,E/R = 35Pa θαη
αλαθνξά ζεξκνθξαζίαο κεραλνζηαζίνπ Σ*amb,E/R = 36
oC ζύκθσλα κε ηηο παξακέηξνπο ηνπ Πίλαθα 5.1.
Δπνκέλσο ζε απηήλ ηελ πεξίπησζε, ν βξόρνο ειέγρνπ PID δηαθνξηθήο πίεζεο ξπζκίδεηαη ώζηε λα παξέρεη
αλαθνξά ηαρύηεηαο σ*P,diff = 65.23% σnom, ηθαλνπνηώληαο ηηο απαηηήζεηο ηνπ ζηξνβηινϋπεξπιεξσηή ηεο
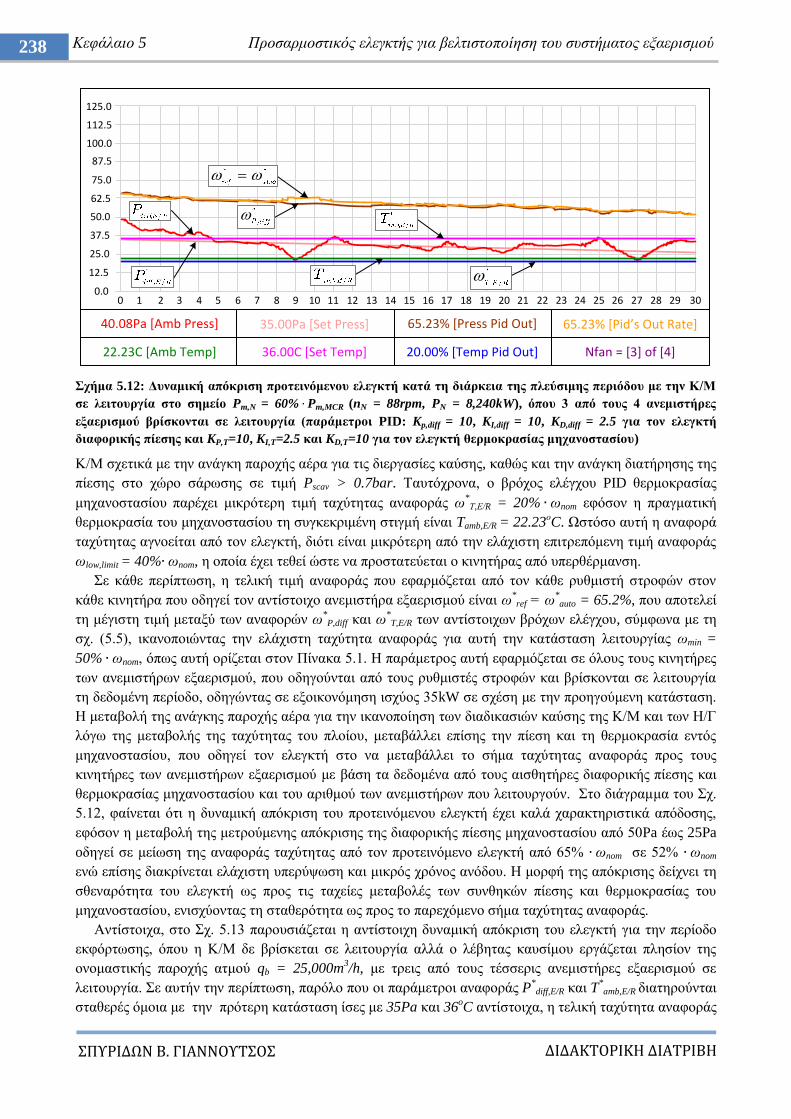
ΔΙΔΑΚΣΟΡΙΚΗ ΔΙΑΣΡΙΒΗ
ΠΤΡΙΔΩΝ Β. ΓΙΑΝΝΟΤΣΟ
238 Κεθάιαην 5 Πξνζαξκνζηηθόο ειεγθηήο γηα βειηηζηνπνίεζε ηνπ ζπζηήκαηνο εμαεξηζκνύ
ρήκα 5.12: Γπλακηθή απόθξηζε πξνηεηλόκελνπ ειεγθηή θαηά ηε δηάξθεηα ηεο πιεύζηκεο πεξηόδνπ κε ηελ Κ/Μ
ζε ιεηηνπξγία ζην ζεκείν Pm,N = 60% Pm,MCR (nN = 88rpm, PN = 8,240kW), όπνπ 3 από ηνπο 4 αλεκηζηήξεο
εμαεξηζκνύ βξίζθνληαη ζε ιεηηνπξγία (παξάκεηξνη PID: Kp,diff = 10, KI,diff = 10, KD,diff = 2.5 γηα ηνλ ειεγθηή
δηαθνξηθήο πίεζεο θαη KP,T=10, KI,T=2.5 θαη KD,T=10 γηα ηνλ ειεγθηή ζεξκνθξαζίαο κεραλνζηαζίνπ)
Κ/Μ ζρεηηθά κε ηελ αλάγθε παξνρήο αέξα γηα ηηο δηεξγαζίεο θαύζεο, θαζώο θαη ηελ αλάγθε δηαηήξεζεο ηεο
πίεζεο ζην ρώξν ζάξσζεο ζε ηηκή Pscav > 0.7bar. Σαπηόρξνλα, ν βξόρνο ειέγρνπ PID ζεξκνθξαζίαο
κεραλνζηαζίνπ παξέρεη κηθξόηεξε ηηκή ηαρύηεηαο αλαθνξάο σ*Σ,Δ/R = 20% σnom εθόζνλ ε πξαγκαηηθή
ζεξκνθξαζία ηνπ κεραλνζηαζίνπ ηε ζπγθεθξηκέλε ζηηγκή είλαη Tamb,E/R = 22.23νC. Χζηόζν απηή ε αλαθνξά
ηαρύηεηαο αγλνείηαη από ηνλ ειεγθηή, δηόηη είλαη κηθξόηεξε από ηελ ειάρηζηε επηηξεπόκελε ηηκή αλαθνξάο
σlow,limit = 40% σnom, ε νπνία έρεη ηεζεί ώζηε λα πξνζηαηεύεηαη ν θηλεηήξαο από ππεξζέξκαλζε.
ε θάζε πεξίπησζε, ε ηειηθή ηηκή αλαθνξάο πνπ εθαξκόδεηαη από ηνλ θάζε ξπζκηζηή ζηξνθώλ ζηνλ
θάζε θηλεηήξα πνπ νδεγεί ηνλ αληίζηνηρν αλεκηζηήξα εμαεξηζκνύ είλαη σ*ref = σ
*auto = 65.2%, πνπ απνηειεί
ηε κέγηζηε ηηκή κεηαμύ ησλ αλαθνξώλ σ*P,diff θαη σ
*T,E/R ησλ αληίζηνηρσλ βξόρσλ ειέγρνπ, ζύκθσλα κε ηε
ζρ. (5.5), ηθαλνπνηώληαο ηελ ειάρηζηε ηαρύηεηα αλαθνξάο γηα απηή ηελ θαηάζηαζε ιεηηνπξγίαο σmin =
50% σnom, όπσο απηή νξίδεηαη ζηνλ Πίλαθα 5.1. Ζ παξάκεηξνο απηή εθαξκόδεηαη ζε όινπο ηνπο θηλεηήξεο
ησλ αλεκηζηήξσλ εμαεξηζκνύ, πνπ νδεγνύληαη από ηνπο ξπζκηζηέο ζηξνθώλ θαη βξίζθνληαη ζε ιεηηνπξγία
ηε δεδνκέλε πεξίνδν, νδεγώληαο ζε εμνηθνλόκεζε ηζρύνο 35kW ζε ζρέζε κε ηελ πξνεγνύκελε θαηάζηαζε.
Ζ κεηαβνιή ηεο αλάγθεο παξνρήο αέξα γηα ηελ ηθαλνπνίεζε ησλ δηαδηθαζηώλ θαύζεο ηεο Κ/Μ θαη ησλ Ζ/Γ
ιόγσ ηεο κεηαβνιήο ηεο ηαρύηεηαο ηνπ πινίνπ, κεηαβάιιεη επίζεο ηελ πίεζε θαη ηε ζεξκνθξαζία εληόο
κεραλνζηαζίνπ, πνπ νδεγεί ηνλ ειεγθηή ζην λα κεηαβάιιεη ην ζήκα ηαρύηεηαο αλαθνξάο πξνο ηνπο
θηλεηήξεο ησλ αλεκηζηήξσλ εμαεξηζκνύ κε βάζε ηα δεδνκέλα από ηνπο αηζζεηήξεο δηαθνξηθήο πίεζεο θαη
ζεξκνθξαζίαο κεραλνζηαζίνπ θαη ηνπ αξηζκνύ ησλ αλεκηζηήξσλ πνπ ιεηηνπξγνύλ. ην δηάγξακκα ηνπ ρ.
5.12, θαίλεηαη όηη ε δπλακηθή απόθξηζε ηνπ πξνηεηλόκελνπ ειεγθηή έρεη θαιά ραξαθηεξηζηηθά απόδνζεο,
εθόζνλ ε κεηαβνιή ηεο κεηξνύκελεο απόθξηζεο ηεο δηαθνξηθήο πίεζεο κεραλνζηαζίνπ από 50Pa έσο 25Pa
oδεγεί ζε κείσζε ηεο αλαθνξάο ηαρύηεηαο από ηνλ πξνηεηλόκελν ειεγθηή από 65% σnom ζε 52% σnom
ελώ επίζεο δηαθξίλεηαη ειάρηζηε ππεξύςσζε θαη κηθξόο ρξόλνο αλόδνπ. Ζ κνξθή ηεο απόθξηζεο δείρλεη ηε
ζζελαξόηεηα ηνπ ειεγθηή σο πξνο ηηο ηαρείεο κεηαβνιέο ησλ ζπλζεθώλ πίεζεο θαη ζεξκνθξαζίαο ηνπ
κεραλνζηαζίνπ, εληζρύνληαο ηε ζηαζεξόηεηα σο πξνο ην παξερόκελν ζήκα ηαρύηεηαο αλαθνξάο.
Αληίζηνηρα, ζην ρ. 5.13 παξνπζηάδεηαη ε αληίζηνηρε δπλακηθή απόθξηζε ηνπ ειεγθηή γηα ηελ πεξίνδν
εθθόξησζεο, όπνπ ε Κ/Μ δε βξίζθεηαη ζε ιεηηνπξγία αιιά ν ιέβεηαο θαπζίκνπ εξγάδεηαη πιεζίνλ ηεο
νλνκαζηηθήο παξνρήο αηκνύ qb = 25,000m3/h, κε ηξεηο από ηνπο ηέζζεξηο αλεκηζηήξεο εμαεξηζκνύ ζε
ιεηηνπξγία. ε απηήλ ηελ πεξίπησζε, παξόιν πνπ νη παξάκεηξνη αλαθνξάο P*
diff,E/R θαη T*amb,E/R δηαηεξνύληαη
ζηαζεξέο όκνηα κε ηελ πξόηεξε θαηάζηαζε ίζεο κε 35Pa θαη 36oC αληίζηνηρα, ε ηειηθή ηαρύηεηα αλαθνξάο
0.0
100.0
87.5
75.0
62.5
50.0
37.5
25.0
12.5
0 1 2 3 4 5 6 7 8 9 10 11 12 13 14 15 16 17 18 19 20 21 22 23 24 25 26 27 28 29 30
40.08Pa [Amb Press]
22.23C [Amb Temp]
35.00Pa [Set Press]
36.00C [Set Temp]
65.23% [Press Pid Out]
20.00% [Temp Pid Out]
65.23% [Pid’s Out Rate]
Nfan = [3] of [4]
112.5
125.0
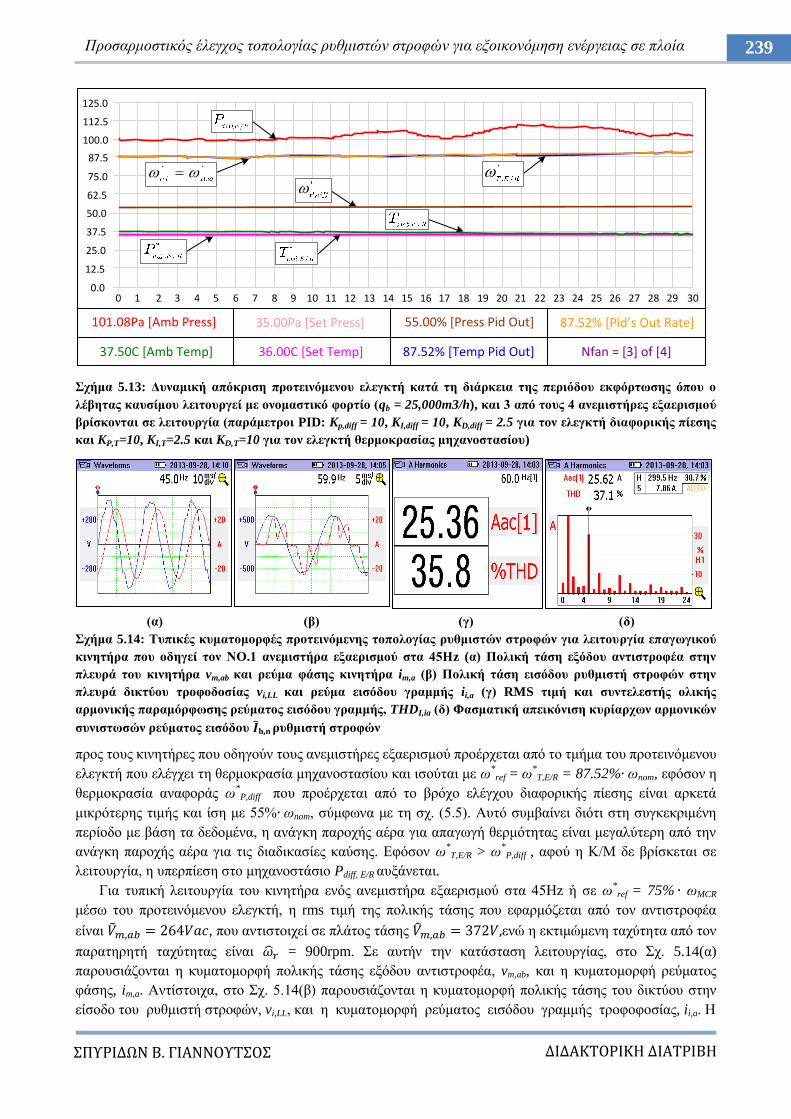
ΔΙΔΑΚΣΟΡΙΚΗ ΔΙΑΣΡΙΒΗ
ΠΤΡΙΔΩΝ Β. ΓΙΑΝΝΟΤΣΟ
239 Πξνζαξκνζηηθόο έιεγρνο ηνπνινγίαο ξπζκηζηώλ ζηξνθώλ γηα εμνηθνλόκεζε ελέξγεηαο ζε πινία
ρήκα 5.13: Γπλακηθή απόθξηζε πξνηεηλόκελνπ ειεγθηή θαηά ηε δηάξθεηα ηεο πεξηόδνπ εθθόξησζεο όπνπ ν
ιέβεηαο θαπζίκνπ ιεηηνπξγεί κε νλνκαζηηθό θνξηίν (qb = 25,000m3/h), θαη 3 από ηνπο 4 αλεκηζηήξεο εμαεξηζκνύ
βξίζθνληαη ζε ιεηηνπξγία (παξάκεηξνη PID: Kp,diff = 10, KI,diff = 10, KD,diff = 2.5 γηα ηνλ ειεγθηή δηαθνξηθήο πίεζεο
θαη KP,T=10, KI,T=2.5 θαη KD,T=10 γηα ηνλ ειεγθηή ζεξκνθξαζίαο κεραλνζηαζίνπ)
(α) (β) (γ) (δ)
ρήκα 5.14: Σππηθέο θπκαηνκνξθέο πξνηεηλόκελεο ηνπνινγίαο ξπζκηζηώλ ζηξνθώλ γηα ιεηηνπξγία επαγσγηθνύ
θηλεηήξα πνπ νδεγεί ηνλ ΝΟ.1 αλεκηζηήξα εμαεξηζκνύ ζηα 45Ηz (α) Πνιηθή ηάζε εμόδνπ αληηζηξνθέα ζηελ
πιεπξά ηνπ θηλεηήξα vm,ab θαη ξεύκα θάζεο θηλεηήξα im,a (β) Πνιηθή ηάζε εηζόδνπ ξπζκηζηή ζηξνθώλ ζηελ
πιεπξά δηθηύνπ ηξνθνδνζίαο vi,LL θαη ξεύκα εηζόδνπ γξακκήο ii,a (γ) RMS ηηκή θαη ζπληειεζηήο νιηθήο
αξκνληθήο παξακόξθσζεο ξεύκαηνο εηζόδνπ γξακκήο, THDI,ia (δ) Φαζκαηηθή απεηθόληζε θπξίαξρσλ αξκνληθώλ
ζπληζησζώλ ξεύκαηνο εηζόδνπ h,n ξπζκηζηή ζηξνθώλ
πξνο ηνπο θηλεηήξεο πνπ νδεγνύλ ηνπο αλεκηζηήξεο εμαεξηζκνύ πξνέξρεηαη από ην ηκήκα ηνπ πξνηεηλόκελνπ
ειεγθηή πνπ ειέγρεη ηε ζεξκνθξαζία κεραλνζηαζίνπ θαη ηζνύηαη κε σ*ref = σ
*T,E/R = 87.52% σnom, εθόζνλ ε
ζεξκνθξαζία αλαθνξάο σ*
P,diff πνπ πξνέξρεηαη από ην βξόρν ειέγρνπ δηαθνξηθήο πίεζεο είλαη αξθεηά
κηθξόηεξεο ηηκήο θαη ίζε κε 55% σnom, ζύκθσλα κε ηε ζρ. (5.5). Απηό ζπκβαίλεη δηόηη ζηε ζπγθεθξηκέλε
πεξίνδν κε βάζε ηα δεδνκέλα, ε αλάγθε παξνρήο αέξα γηα απαγσγή ζεξκόηεηαο είλαη κεγαιύηεξε από ηελ
αλάγθε παξνρήο αέξα γηα ηηο δηαδηθαζίεο θαύζεο. Δθόζνλ σ*T,E/R > σ
*P,diff , αθνύ ε Κ/Μ δε βξίζθεηαη ζε
ιεηηνπξγία, ε ππεξπίεζε ζην κεραλνζηάζην Pdiff, E/R απμάλεηαη.
Γηα ηππηθή ιεηηνπξγία ηνπ θηλεηήξα ελόο αλεκηζηήξα εμαεξηζκνύ ζηα 45Ζz ή ζε σ*ref = 75% σMCR
κέζσ ηνπ πξνηεηλόκελνπ ειεγθηή, ε rms ηηκή ηεο πνιηθήο ηάζεο πνπ εθαξκόδεηαη από ηνλ αληηζηξνθέα
είλαη , πνπ αληηζηνηρεί ζε πιάηνο ηάζεο ελώ ε εθηηκώκελε ηαρύηεηα από ηνλ
παξαηεξεηή ηαρύηεηαο είλαη = 900rpm. ε απηήλ ηελ θαηάζηαζε ιεηηνπξγίαο, ζην ρ. 5.14(α)
παξνπζηάδνληαη ε θπκαηνκνξθή πνιηθήο ηάζεο εμόδνπ αληηζηξνθέα, vm,ab, θαη ε θπκαηνκνξθή ξεύκαηνο
θάζεο, im,a. Αληίζηνηρα, ζην ρ. 5.14(β) παξνπζηάδνληαη ε θπκαηνκνξθή πνιηθήο ηάζεο ηνπ δηθηύνπ ζηελ
είζνδν ηνπ ξπζκηζηή ζηξνθώλ, vi,LL, θαη ε θπκαηνκνξθή ξεύκαηνο εηζόδνπ γξακκήο ηξνθνθνζίαο, ii,a. Ζ
0.0
100.0
87.5
75.0
62.5
50.0
37.5
25.0
12.5
112.5
125.0
0 1 2 3 4 5 6 7 8 9 10 11 12 13 14 15 16 17 18 19 20 21 22 23 24 25 26 27 28 29 30
37.50C [Amb Temp] 36.00C [Set Temp] 87.52% [Temp Pid Out] Nfan = [3] of [4]
101.08Pa [Amb Press] 35.00Pa [Set Press] 55.00% [Press Pid Out] 87.52% [Pid’s Out Rate]
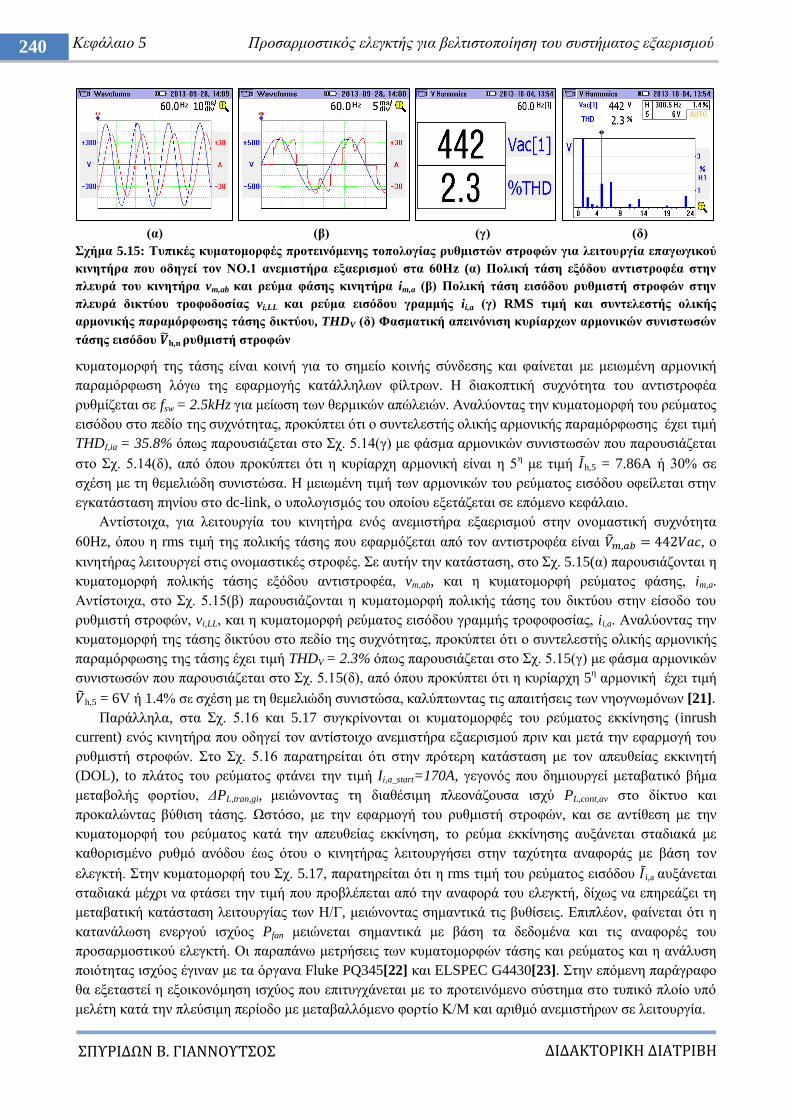
ΔΙΔΑΚΣΟΡΙΚΗ ΔΙΑΣΡΙΒΗ
ΠΤΡΙΔΩΝ Β. ΓΙΑΝΝΟΤΣΟ
240 Κεθάιαην 5 Πξνζαξκνζηηθόο ειεγθηήο γηα βειηηζηνπνίεζε ηνπ ζπζηήκαηνο εμαεξηζκνύ
(α) (β) (γ) (δ)
ρήκα 5.15: Σππηθέο θπκαηνκνξθέο πξνηεηλόκελεο ηνπνινγίαο ξπζκηζηώλ ζηξνθώλ γηα ιεηηνπξγία επαγσγηθνύ
θηλεηήξα πνπ νδεγεί ηνλ ΝΟ.1 αλεκηζηήξα εμαεξηζκνύ ζηα 60Ηz (α) Πνιηθή ηάζε εμόδνπ αληηζηξνθέα ζηελ
πιεπξά ηνπ θηλεηήξα vm,ab θαη ξεύκα θάζεο θηλεηήξα im,a (β) Πνιηθή ηάζε εηζόδνπ ξπζκηζηή ζηξνθώλ ζηελ
πιεπξά δηθηύνπ ηξνθνδνζίαο vi,LL θαη ξεύκα εηζόδνπ γξακκήο ii,a (γ) RMS ηηκή θαη ζπληειεζηήο νιηθήο
αξκνληθήο παξακόξθσζεο ηάζεο δηθηύνπ, THDV (δ) Φαζκαηηθή απεηλόληζε θπξίαξρσλ αξκνληθώλ ζπληζησζώλ
ηάζεο εηζόδνπ h,n ξπζκηζηή ζηξνθώλ
θπκαηνκνξθή ηεο ηάζεο είλαη θνηλή γηα ην ζεκείν θνηλήο ζύλδεζεο θαη θαίλεηαη κε κεησκέλε αξκνληθή
παξακόξθσζε ιόγσ ηεο εθαξκνγήο θαηάιιεισλ θίιηξσλ. Ζ δηαθνπηηθή ζπρλόηεηα ηνπ αληηζηξνθέα
ξπζκίδεηαη ζε fsw = 2.5kHz γηα κείσζε ησλ ζεξκηθώλ απώιεηώλ. Αλαιύνληαο ηελ θπκαηνκνξθή ηνπ ξεύκαηνο
εηζόδνπ ζην πεδίν ηεο ζπρλόηεηαο, πξνθύπηεη όηη ν ζπληειεζηήο νιηθήο αξκνληθήο παξακόξθσζεο έρεη ηηκή
THDΗ,ia = 35.8% όπσο παξνπζηάδεηαη ζην ρ. 5.14(γ) κε θάζκα αξκνληθώλ ζπληζησζώλ πνπ παξνπζηάδεηαη
ζην ρ. 5.14(δ), από όπνπ πξνθύπηεη όηη ε θπξίαξρε αξκνληθή είλαη ε 5ε κε ηηκή h,5 = 7.86A ή 30% ζε
ζρέζε κε ηε ζεκειηώδε ζπληζηώζα. Ζ κεησκέλε ηηκή ησλ αξκνληθώλ ηνπ ξεύκαηνο εηζόδνπ νθείιεηαη ζηελ
εγθαηάζηαζε πελίνπ ζην dc-link, ν ππνινγηζκόο ηνπ νπνίνπ εμεηάδεηαη ζε επόκελν θεθάιαην.
Αληίζηνηρα, γηα ιεηηνπξγία ηνπ θηλεηήξα ελόο αλεκηζηήξα εμαεξηζκνύ ζηελ νλνκαζηηθή ζπρλόηεηα
60Ζz, όπνπ ε rms ηηκή ηεο πνιηθήο ηάζεο πνπ εθαξκόδεηαη από ηνλ αληηζηξνθέα είλαη , ν
θηλεηήξαο ιεηηνπξγεί ζηηο νλνκαζηηθέο ζηξνθέο. ε απηήλ ηελ θαηάζηαζε, ζην ρ. 5.15(α) παξνπζηάδνληαη ε
θπκαηνκνξθή πνιηθήο ηάζεο εμόδνπ αληηζηξνθέα, vm,ab, θαη ε θπκαηνκνξθή ξεύκαηνο θάζεο, im,a.
Αληίζηνηρα, ζην ρ. 5.15(β) παξνπζηάδνληαη ε θπκαηνκνξθή πνιηθήο ηάζεο ηνπ δηθηύνπ ζηελ είζνδν ηνπ
ξπζκηζηή ζηξνθώλ, vi,LL, θαη ε θπκαηνκνξθή ξεύκαηνο εηζόδνπ γξακκήο ηξνθνθνζίαο, ii,a. Αλαιύνληαο ηελ
θπκαηνκνξθή ηεο ηάζεο δηθηύνπ ζην πεδίν ηεο ζπρλόηεηαο, πξνθύπηεη όηη ν ζπληειεζηήο νιηθήο αξκνληθήο
παξακόξθσζεο ηεο ηάζεο έρεη ηηκή THDV = 2.3% όπσο παξνπζηάδεηαη ζην ρ. 5.15(γ) κε θάζκα αξκνληθώλ
ζπληζησζώλ πνπ παξνπζηάδεηαη ζην ρ. 5.15(δ), από όπνπ πξνθύπηεη όηη ε θπξίαξρε 5ε αξκνληθή έρεη ηηκή
h,5 = 6V ή 1.4% ζε ζρέζε κε ηε ζεκειηώδε ζπληζηώζα, θαιύπησληαο ηηο απαηηήζεηο ησλ λενγλσκόλσλ [21].
Παξάιιεια, ζηα ρ. 5.16 θαη 5.17 ζπγθξίλνληαη νη θπκαηνκνξθέο ηνπ ξεύκαηνο εθθίλεζεο (inrush
current) ελόο θηλεηήξα πνπ νδεγεί ηνλ αληίζηνηρν αλεκηζηήξα εμαεξηζκνύ πξηλ θαη κεηά ηελ εθαξκνγή ηνπ
ξπζκηζηή ζηξνθώλ. ην ρ. 5.16 παξαηεξείηαη όηη ζηελ πξόηεξε θαηάζηαζε κε ηνλ απεπζείαο εθθηλεηή
(DOL), to πιάηνο ηνπ ξεύκαηνο θηάλεη ηελ ηηκή Ii,a_start=170A, γεγνλόο πνπ δεκηνπξγεί κεηαβαηηθό βήκα
κεηαβνιήο θνξηίνπ, ΓPL,tran,gi, κεηώλνληαο ηε δηαζέζηκε πιενλάδνπζα ηζρύ PL,cont,av ζην δίθηπν θαη
πξνθαιώληαο βύζηζε ηάζεο. Χζηόζν, κε ηελ εθαξκνγή ηνπ ξπζκηζηή ζηξνθώλ, θαη ζε αληίζεζε κε ηελ
θπκαηνκνξθή ηνπ ξεύκαηνο θαηά ηελ απεπζείαο εθθίλεζε, ην ξεύκα εθθίλεζεο απμάλεηαη ζηαδηαθά κε
θαζνξηζκέλν ξπζκό αλόδνπ έσο όηνπ ν θηλεηήξαο ιεηηνπξγήζεη ζηελ ηαρύηεηα αλαθνξάο κε βάζε ηνλ
ειεγθηή. ηελ θπκαηνκνξθή ηνπ ρ. 5.17, παξαηεξείηαη όηη ε rms ηηκή ηνπ ξεύκαηνο εηζόδνπ i,a απμάλεηαη
ζηαδηαθά κέρξη λα θηάζεη ηελ ηηκή πνπ πξνβιέπεηαη από ηελ αλαθνξά ηνπ ειεγθηή, δίρσο λα επεξεάδεη ηε
κεηαβαηηθή θαηάζηαζε ιεηηνπξγίαο ησλ Ζ/Γ, κεηώλνληαο ζεκαληηθά ηηο βπζίζεηο. Δπηπιένλ, θαίλεηαη όηη ε
θαηαλάισζε ελεξγνύ ηζρύνο Pfan κεηώλεηαη ζεκαληηθά κε βάζε ηα δεδνκέλα θαη ηηο αλαθνξέο ηνπ
πξνζαξκνζηηθνύ ειεγθηή. Οη παξαπάλσ κεηξήζεηο ησλ θπκαηνκνξθώλ ηάζεο θαη ξεύκαηνο θαη ε αλάιπζε
πνηόηεηαο ηζρύνο έγηλαλ κε ηα όξγαλα Fluke PQ345[22] θαη ELSPEC G4430[23]. ηελ επόκελε παξάγξαθν
ζα εμεηαζηεί ε εμνηθνλόκεζε ηζρύνο πνπ επηηπγράλεηαη κε ην πξνηεηλόκελν ζύζηεκα ζην ηππηθό πινίν ππό
κειέηε θαηά ηελ πιεύζηκε πεξίνδν κε κεηαβαιιόκελν θνξηίν Κ/Μ θαη αξηζκό αλεκηζηήξσλ ζε ιεηηνπξγία.
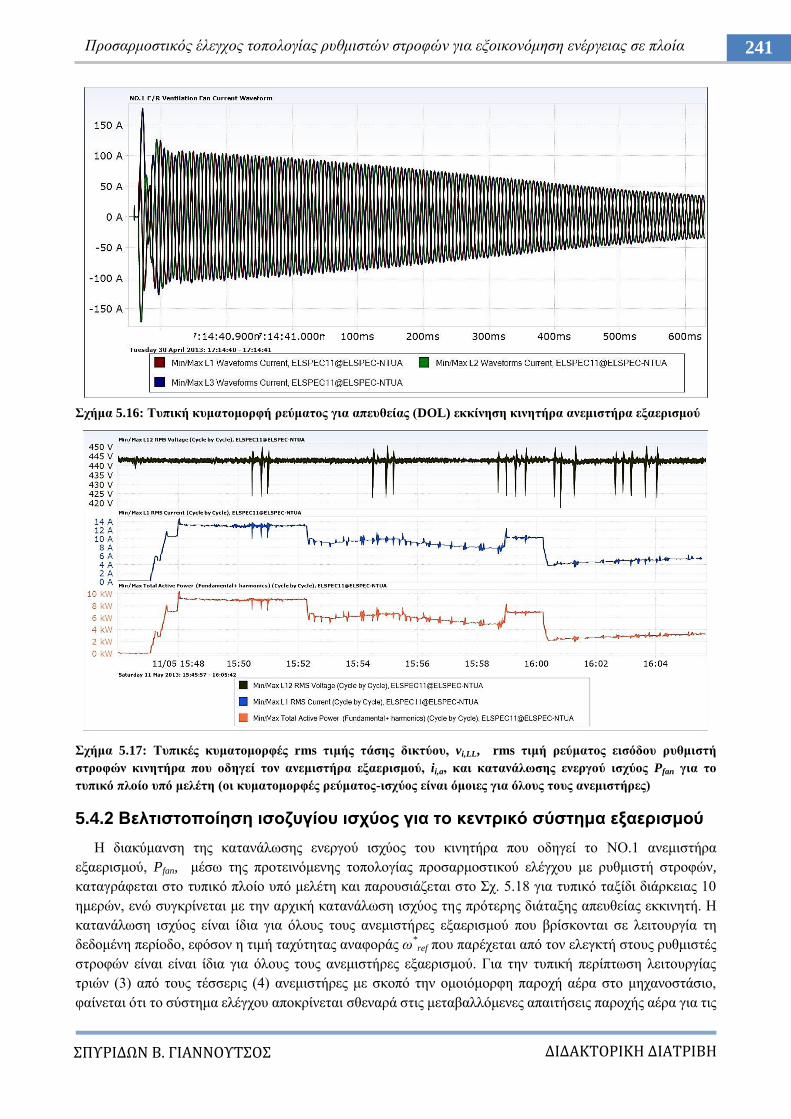
ΔΙΔΑΚΣΟΡΙΚΗ ΔΙΑΣΡΙΒΗ
ΠΤΡΙΔΩΝ Β. ΓΙΑΝΝΟΤΣΟ
241 Πξνζαξκνζηηθόο έιεγρνο ηνπνινγίαο ξπζκηζηώλ ζηξνθώλ γηα εμνηθνλόκεζε ελέξγεηαο ζε πινία
ρήκα 5.16: Σππηθή θπκαηνκνξθή ξεύκαηνο γηα απεπζείαο (DOL) εθθίλεζε θηλεηήξα αλεκηζηήξα εμαεξηζκνύ
ρήκα 5.17: Σππηθέο θπκαηνκνξθέο rms ηηκήο ηάζεο δηθηύνπ, vi,LL, rms ηηκή ξεύκαηνο εηζόδνπ ξπζκηζηή
ζηξνθώλ θηλεηήξα πνπ νδεγεί ηνλ αλεκηζηήξα εμαεξηζκνύ, ii,a, θαη θαηαλάισζεο ελεξγνύ ηζρύνο Pfan γηα ην
ηππηθό πινίν ππό κειέηε (νη θπκαηνκνξθέο ξεύκαηνο-ηζρύνο είλαη όκνηεο γηα όινπο ηνπο αλεκηζηήξεο)
5.4.2 Βειηηζηνπνίεζε ηζνδπγίνπ ηζρύνο γηα ην θεληξηθό ζύζηεκα εμαεξηζκνύ
Ζ δηαθύκαλζε ηεο θαηαλάισζεο ελεξγνύ ηζρύνο ηνπ θηλεηήξα πνπ νδεγεί ην ΝΟ.1 αλεκηζηήξα
εμαεξηζκνύ, Pfan, κέζσ ηεο πξνηεηλόκελεο ηνπνινγίαο πξνζαξκνζηηθνύ ειέγρνπ κε ξπζκηζηή ζηξνθώλ,
θαηαγξάθεηαη ζην ηππηθό πινίν ππό κειέηε θαη παξνπζηάδεηαη ζην ρ. 5.18 γηα ηππηθό ηαμίδη δηάξθεηαο 10
εκεξώλ, ελώ ζπγθξίλεηαη κε ηελ αξρηθή θαηαλάισζε ηζρύνο ηεο πξόηεξεο δηάηαμεο απεπζείαο εθθηλεηή. Ζ
θαηαλάισζε ηζρύνο είλαη ίδηα γηα όινπο ηνπο αλεκηζηήξεο εμαεξηζκνύ πνπ βξίζθνληαη ζε ιεηηνπξγία ηε
δεδνκέλε πεξίνδν, εθόζνλ ε ηηκή ηαρύηεηαο αλαθνξάο σ*
ref πνπ παξέρεηαη από ηνλ ειεγθηή ζηνπο ξπζκηζηέο
ζηξνθώλ είλαη είλαη ίδηα γηα όινπο ηνπο αλεκηζηήξεο εμαεξηζκνύ. Γηα ηελ ηππηθή πεξίπησζε ιεηηνπξγίαο
ηξηώλ (3) από ηνπο ηέζζεξηο (4) αλεκηζηήξεο κε ζθνπό ηελ νκνηόκνξθε παξνρή αέξα ζην κεραλνζηάζην,
θαίλεηαη όηη ην ζύζηεκα ειέγρνπ απνθξίλεηαη ζζελαξά ζηηο κεηαβαιιόκελεο απαηηήζεηο παξνρήο αέξα γηα ηηο
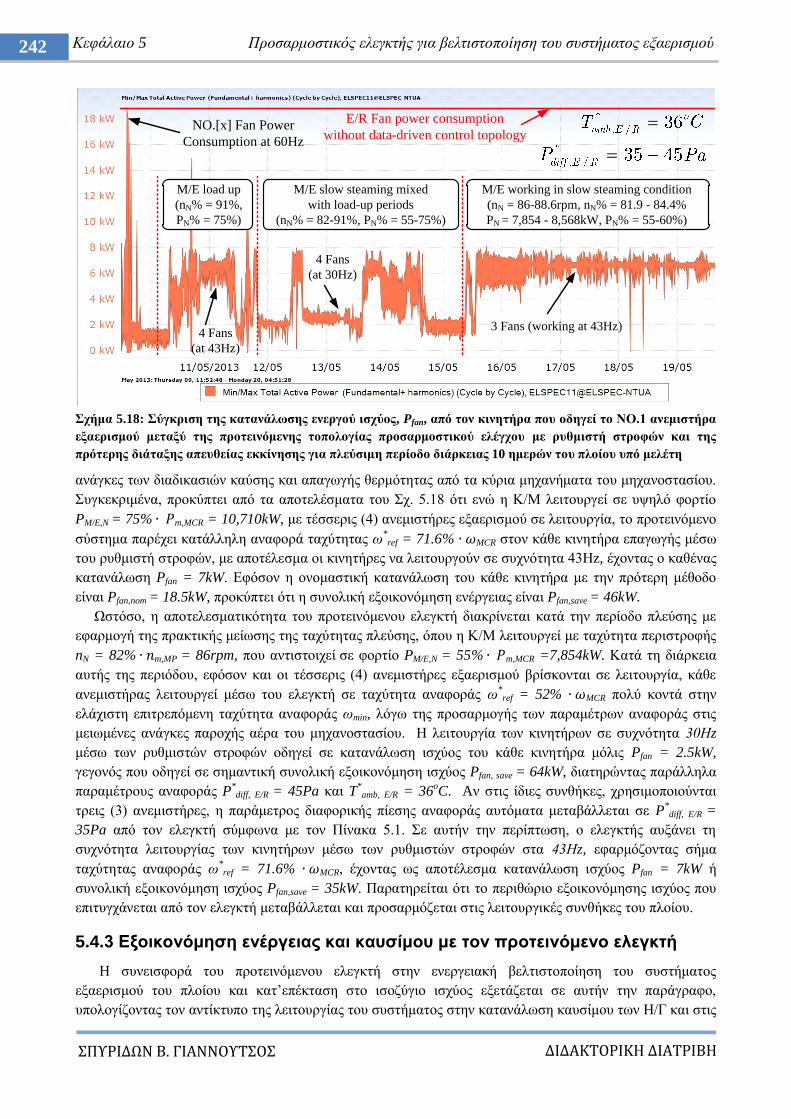
ΔΙΔΑΚΣΟΡΙΚΗ ΔΙΑΣΡΙΒΗ
ΠΤΡΙΔΩΝ Β. ΓΙΑΝΝΟΤΣΟ
242 Κεθάιαην 5 Πξνζαξκνζηηθόο ειεγθηήο γηα βειηηζηνπνίεζε ηνπ ζπζηήκαηνο εμαεξηζκνύ
ρήκα 5.18: ύγθξηζε ηεο θαηαλάισζεο ελεξγνύ ηζρύνο, Pfan, από ηνλ θηλεηήξα πνπ νδεγεί ην ΝΟ.1 αλεκηζηήξα
εμαεξηζκνύ κεηαμύ ηεο πξνηεηλόκελεο ηνπνινγίαο πξνζαξκνζηηθνύ ειέγρνπ κε ξπζκηζηή ζηξνθώλ θαη ηεο
πξόηεξεο δηάηαμεο απεπζείαο εθθίλεζεο γηα πιεύζηκε πεξίνδν δηάξθεηαο 10 εκεξώλ ηνπ πινίνπ ππό κειέηε
αλάγθεο ησλ δηαδηθαζηώλ θαύζεο θαη απαγσγήο ζεξκόηεηαο από ηα θύξηα κεραλήκαηα ηνπ κεραλνζηαζίνπ.
πγθεθξηκέλα, πξνθύπηεη από ηα απνηειέζκαηα ηνπ ρ. 5.18 όηη ελώ ε Κ/Μ ιεηηνπξγεί ζε πςειό θνξηίν
PM/E,N = 75% m,MCR = 10,710kW, κε ηέζζεξηο (4) αλεκηζηήξεο εμαεξηζκνύ ζε ιεηηνπξγία, ην πξνηεηλόκελν
ζύζηεκα παξέρεη θαηάιιειε αλαθνξά ηαρύηεηαο σ*
ref = 71.6% MCR ζηνλ θάζε θηλεηήξα επαγσγήο κέζσ
ηνπ ξπζκηζηή ζηξνθώλ, κε απνηέιεζκα νη θηλεηήξεο λα ιεηηνπξγνύλ ζε ζπρλόηεηα 43Ζz, έρνληαο ν θαζέλαο
θαηαλάισζε Pfan = 7kW. Δθόζνλ ε νλνκαζηηθή θαηαλάισζε ηνπ θάζε θηλεηήξα κε ηελ πξόηεξε κέζνδν
είλαη Pfan,nom = 18.5kW, πξνθύπηεη όηη ε ζπλνιηθή εμνηθνλόκεζε ελέξγεηαο είλαη Pfan,save = 46kW.
Χζηόζν, ε απνηειεζκαηηθόηεηα ηνπ πξνηεηλόκελνπ ειεγθηή δηαθξίλεηαη θαηά ηελ πεξίνδν πιεύζεο κε
εθαξκνγή ηεο πξαθηηθήο κείσζεο ηεο ηαρύηεηαο πιεύζεο, όπνπ ε Κ/Μ ιεηηνπξγεί κε ηαρύηεηα πεξηζηξνθήο
nN = 82% m,MP = 86rpm, πνπ αληηζηνηρεί ζε θνξηίν PM/E,N = 55% m,MCR =7,854kW. Καηά ηε δηάξθεηα
απηήο ηεο πεξηόδνπ, εθόζνλ θαη νη ηέζζεξηο (4) αλεκηζηήξεο εμαεξηζκνύ βξίζθνληαη ζε ιεηηνπξγία, θάζε
αλεκηζηήξαο ιεηηνπξγεί κέζσ ηνπ ειεγθηή ζε ηαρύηεηα αλαθνξάο σ*ref = 52% MCR πνιύ θνληά ζηελ
ειάρηζηε επηηξεπόκελε ηαρύηεηα αλαθνξάο σmin, ιόγσ ηεο πξνζαξκνγήο ησλ παξακέηξσλ αλαθνξάο ζηηο
κεησκέλεο αλάγθεο παξνρήο αέξα ηνπ κεραλνζηαζίνπ. Ζ ιεηηνπξγία ησλ θηλεηήξσλ ζε ζπρλόηεηα 30Ζz
κέζσ ησλ ξπζκηζηώλ ζηξνθώλ νδεγεί ζε θαηαλάισζε ηζρύνο ηνπ θάζε θηλεηήξα κόιηο Pfan = 2.5kW,
γεγνλόο πνπ νδεγεί ζε ζεκαληηθή ζπλνιηθή εμνηθνλόκεζε ηζρύνο Pfan, save = 64kW, δηαηεξώληαο παξάιιεια
παξακέηξνπο αλαθνξάο P*diff, E/R = 45Pa θαη T
*amb, E/R = 36
oC. Aλ ζηηο ίδηεο ζπλζήθεο, ρξεζηκνπνηνύληαη
ηξεηο (3) αλεκηζηήξεο, ε παξάκεηξνο δηαθνξηθήο πίεζεο αλαθνξάο απηόκαηα κεηαβάιιεηαη ζε P*diff, E/R =
35Pa από ηνλ ειεγθηή ζύκθσλα κε ηνλ Πίλαθα 5.1. ε απηήλ ηελ πεξίπησζε, ν ειεγθηήο απμάλεη ηε
ζπρλόηεηα ιεηηνπξγίαο ησλ θηλεηήξσλ κέζσ ησλ ξπζκηζηώλ ζηξνθώλ ζηα 43Ζz, εθαξκόδνληαο ζήκα
ηαρύηεηαο αλαθνξάο σ*ref = 71.6% MCR, έρνληαο σο απνηέιεζκα θαηαλάισζε ηζρύνο Pfan = 7kW ή
ζπλνιηθή εμνηθνλόκεζε ηζρύνο Pfan,save = 35kW. Παξαηεξείηαη όηη ην πεξηζώξην εμνηθνλόκεζεο ηζρύνο πνπ
επηηπγράλεηαη από ηνλ ειεγθηή κεηαβάιιεηαη θαη πξνζαξκόδεηαη ζηηο ιεηηνπξγηθέο ζπλζήθεο ηνπ πινίνπ.
5.4.3 Δμνηθνλόκεζε ελέξγεηαο θαη θαπζίκνπ κε ηνλ πξνηεηλόκελν ειεγθηή
Ζ ζπλεηζθνξά ηνπ πξνηεηλόκελνπ ειεγθηή ζηελ ελεξγεηαθή βειηηζηνπνίεζε ηνπ ζπζηήκαηνο
εμαεξηζκνύ ηνπ πινίνπ θαη θαη‟επέθηαζε ζην ηζνδύγην ηζρύνο εμεηάδεηαη ζε απηήλ ηελ παξάγξαθν,
ππνινγίδνληαο ηνλ αληίθηππν ηεο ιεηηνπξγίαο ηνπ ζπζηήκαηνο ζηελ θαηαλάισζε θαπζίκνπ ησλ Ζ/Γ θαη ζηηο
E/R Fan power consumption
without data-driven control topologyNO.[x] Fan Power
Consumption at 60Hz
3 Fans (working at 43Hz)4 Fans
(at 43Hz)
4 Fans
(at 30Hz)
M/E working in slow steaming condition
(nN = 86-88.6rpm, nN% = 81.9 - 84.4%
PN = 7,854 - 8,568kW, PN% = 55-60%)
M/E load up
(nN% = 91%,
PN% = 75%)
M/E slow steaming mixed
with load-up periods
(nN% = 82-91%, PN% = 55-75%)
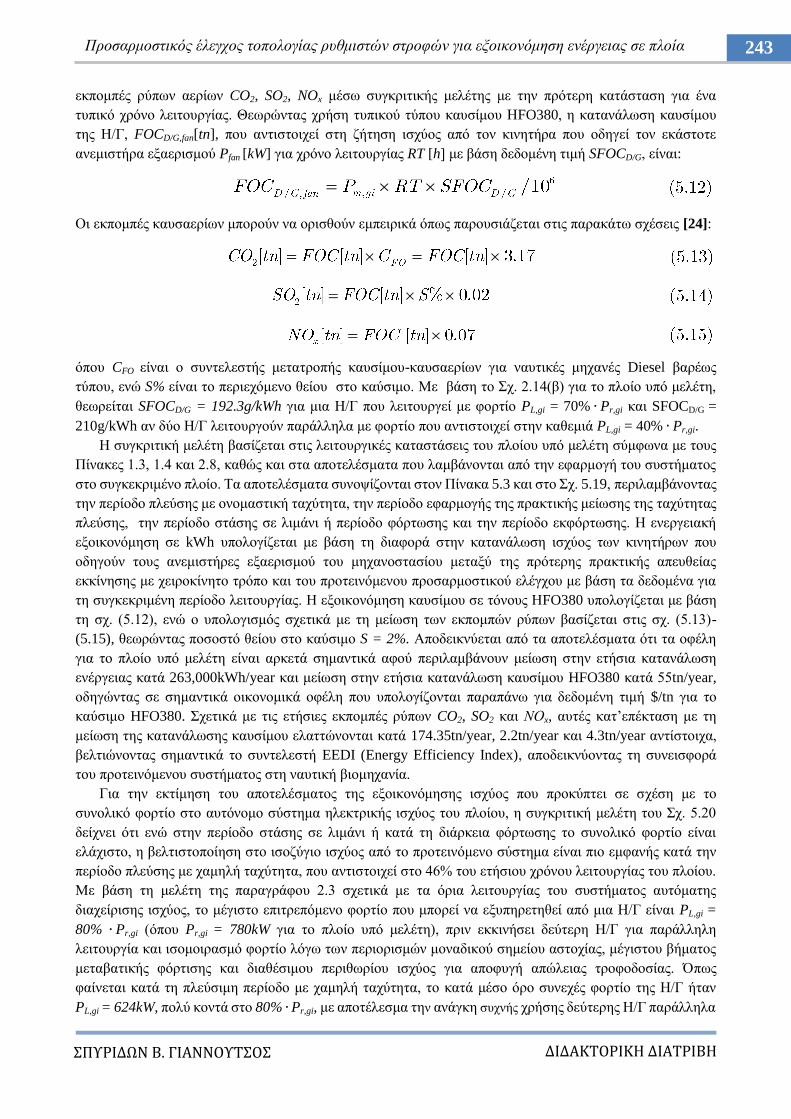
ΔΙΔΑΚΣΟΡΙΚΗ ΔΙΑΣΡΙΒΗ
ΠΤΡΙΔΩΝ Β. ΓΙΑΝΝΟΤΣΟ
243 Πξνζαξκνζηηθόο έιεγρνο ηνπνινγίαο ξπζκηζηώλ ζηξνθώλ γηα εμνηθνλόκεζε ελέξγεηαο ζε πινία
εθπνκπέο ξύπσλ αεξίσλ CO2, SO2, NOx κέζσ ζπγθξηηηθήο κειέηεο κε ηελ πξόηεξε θαηάζηαζε γηα έλα
ηππηθό ρξόλν ιεηηνπξγίαο. Θεσξώληαο ρξήζε ηππηθνύ ηύπνπ θαπζίκνπ ΖFO380, ε θαηαλάισζε θαπζίκνπ
ηεο Ζ/Γ, FOCD/G,fan[tn], πνπ αληηζηνηρεί ζηε δήηεζε ηζρύνο από ηνλ θηλεηήξα πνπ νδεγεί ηνλ εθάζηνηε
αλεκηζηήξα εμαεξηζκνύ Pfan [kW] γηα ρξόλν ιεηηνπξγίαο RT [h] κε βάζε δεδνκέλε ηηκή SFOCD/G, είλαη:
Οη εθπνκπέο θαπζαεξίσλ κπνξνύλ λα νξηζζνύλ εκπεηξηθά όπσο παξνπζηάδεηαη ζηηο παξαθάησ ζρέζεηο [24]:
όπνπ CFO είλαη ν ζπληειεζηήο κεηαηξνπήο θαπζίκνπ-θαπζαεξίσλ γηα λαπηηθέο κεραλέο Diesel βαξέσο
ηύπνπ, ελώ S% είλαη ην πεξηερόκελν ζείνπ ζην θαύζηκν. Με βάζε ην ρ. 2.14(β) γηα ην πινίν ππό κειέηε,
ζεσξείηαη SFOCD/G = 192.3g/kWh γηα κηα Ζ/Γ πνπ ιεηηνπξγεί κε θνξηίν PL,gi = 70% Pr,gi θαη SFOCD/G =
210g/kWh αλ δύν Ζ/Γ ιεηηνπξγνύλ παξάιιεια κε θνξηίν πνπ αληηζηνηρεί ζηελ θαζεκηά PL,gi = 40% Pr,gi.
Ζ ζπγθξηηηθή κειέηε βαζίδεηαη ζηηο ιεηηνπξγηθέο θαηαζηάζεηο ηνπ πινίνπ ππό κειέηε ζύκθσλα κε ηνπο
Πίλαθεο 1.3, 1.4 θαη 2.8, θαζώο θαη ζηα απνηειέζκαηα πνπ ιακβάλνληαη από ηελ εθαξκνγή ηνπ ζπζηήκαηνο
ζην ζπγθεθξηκέλν πινίν. Σα απνηειέζκαηα ζπλνςίδνληαη ζηνλ Πίλαθα 5.3 θαη ζην ρ. 5.19, πεξηιακβάλνληαο
ηελ πεξίνδν πιεύζεο κε νλνκαζηηθή ηαρύηεηα, ηελ πεξίνδν εθαξκνγήο ηεο πξαθηηθήο κείσζεο ηεο ηαρύηεηαο
πιεύζεο, ηελ πεξίνδν ζηάζεο ζε ιηκάλη ή πεξίνδν θόξησζεο θαη ηελ πεξίνδν εθθόξησζεο. Ζ ελεξγεηαθή
εμνηθνλόκεζε ζε kWh ππνινγίδεηαη κε βάζε ηε δηαθνξά ζηελ θαηαλάισζε ηζρύνο ησλ θηλεηήξσλ πνπ
νδεγνύλ ηνπο αλεκηζηήξεο εμαεξηζκνύ ηνπ κεραλνζηαζίνπ κεηαμύ ηεο πξόηεξεο πξαθηηθήο απεπζείαο
εθθίλεζεο κε ρεηξνθίλεην ηξόπν θαη ηνπ πξνηεηλόκελνπ πξνζαξκνζηηθνύ ειέγρνπ κε βάζε ηα δεδνκέλα γηα
ηε ζπγθεθξηκέλε πεξίνδν ιεηηνπξγίαο. Ζ εμνηθνλόκεζε θαπζίκνπ ζε ηόλνπο ΖFO380 ππνινγίδεηαη κε βάζε
ηε ζρ. (5.12), ελώ ν ππνινγηζκόο ζρεηηθά κε ηε κείσζε ησλ εθπνκπώλ ξύπσλ βαζίδεηαη ζηηο ζρ. (5.13)-
(5.15), ζεσξώληαο πνζνζηό ζείνπ ζην θαύζηκν S = 2%. Aπνδεηθλύεηαη από ηα απνηειέζκαηα όηη ηα νθέιε
γηα ην πινίν ππό κειέηε είλαη αξθεηά ζεκαληηθά αθνύ πεξηιακβάλνπλ κείσζε ζηελ εηήζηα θαηαλάισζε
ελέξγεηαο θαηά 263,000kWh/year θαη κείσζε ζηελ εηήζηα θαηαλάισζε θαπζίκνπ HFO380 θαηά 55tn/year,
νδεγώληαο ζε ζεκαληηθά νηθνλνκηθά νθέιε πνπ ππνινγίδνληαη παξαπάλσ γηα δεδνκέλε ηηκή $/tn γηα ην
θαύζηκν HFO380. ρεηηθά κε ηηο εηήζηεο εθπνκπέο ξύπσλ CO2, SO2 θαη ΝΟx, απηέο θαη‟επέθηαζε κε ηε
κείσζε ηεο θαηαλάισζεο θαπζίκνπ ειαηηώλνληαη θαηά 174.35tn/year, 2.2tn/year θαη 4.3tn/year αληίζηνηρα,
βειηηώλνληαο ζεκαληηθά ην ζπληειεζηή EEDI (Energy Efficiency Index), απνδεηθλύνληαο ηε ζπλεηζθνξά
ηνπ πξνηεηλόκελνπ ζπζηήκαηνο ζηε λαπηηθή βηνκεραλία.
Γηα ηελ εθηίκεζε ηνπ απνηειέζκαηνο ηεο εμνηθνλόκεζεο ηζρύνο πνπ πξνθύπηεη ζε ζρέζε κε ην
ζπλνιηθό θνξηίν ζην απηόλνκν ζύζηεκα ειεθηξηθήο ηζρύνο ηνπ πινίνπ, ε ζπγθξηηηθή κειέηε ηνπ ρ. 5.20
δείρλεη όηη ελώ ζηελ πεξίνδν ζηάζεο ζε ιηκάλη ή θαηά ηε δηάξθεηα θόξησζεο ην ζπλνιηθό θνξηίν είλαη
ειάρηζην, ε βειηηζηνπνίεζε ζην ηζνδύγην ηζρύνο από ην πξνηεηλόκελν ζύζηεκα είλαη πην εκθαλήο θαηά ηελ
πεξίνδν πιεύζεο κε ρακειή ηαρύηεηα, πνπ αληηζηνηρεί ζην 46% ηνπ εηήζηνπ ρξόλνπ ιεηηνπξγίαο ηνπ πινίνπ.
Με βάζε ηε κειέηε ηεο παξαγξάθνπ 2.3 ζρεηηθά κε ηα όξηα ιεηηνπξγίαο ηνπ ζπζηήκαηνο απηόκαηεο
δηαρείξηζεο ηζρύνο, ην κέγηζην επηηξεπόκελν θνξηίν πνπ κπνξεί λα εμππεξεηεζεί από κηα Ζ/Γ είλαη PL,gi =
80% Pr,gi (όπνπ Pr,gi = 780kW γηα ην πινίν ππό κειέηε), πξηλ εθθηλήζεη δεύηεξε Ζ/Γ γηα παξάιιειε
ιεηηνπξγία θαη ηζνκνηξαζκό θνξηίν ιόγσ ησλ πεξηνξηζκώλ κνλαδηθνύ ζεκείνπ αζηνρίαο, κέγηζηνπ βήκαηνο
κεηαβαηηθήο θόξηηζεο θαη δηαζέζηκνπ πεξηζσξίνπ ηζρύνο γηα απνθπγή απώιεηαο ηξνθνδνζίαο. Όπσο
θαίλεηαη θαηά ηε πιεύζηκε πεξίνδν κε ρακειή ηαρύηεηα, ην θαηά κέζν όξν ζπλερέο θνξηίν ηεο Ζ/Γ ήηαλ
PL,gi = 624kW, πνιύ θνληά ζην 80% Pr,gi, κε απνηέιεζκα ηελ αλάγθε ζπρλήο ρξήζεο δεύηεξεο Ζ/Γ παξάιιεια
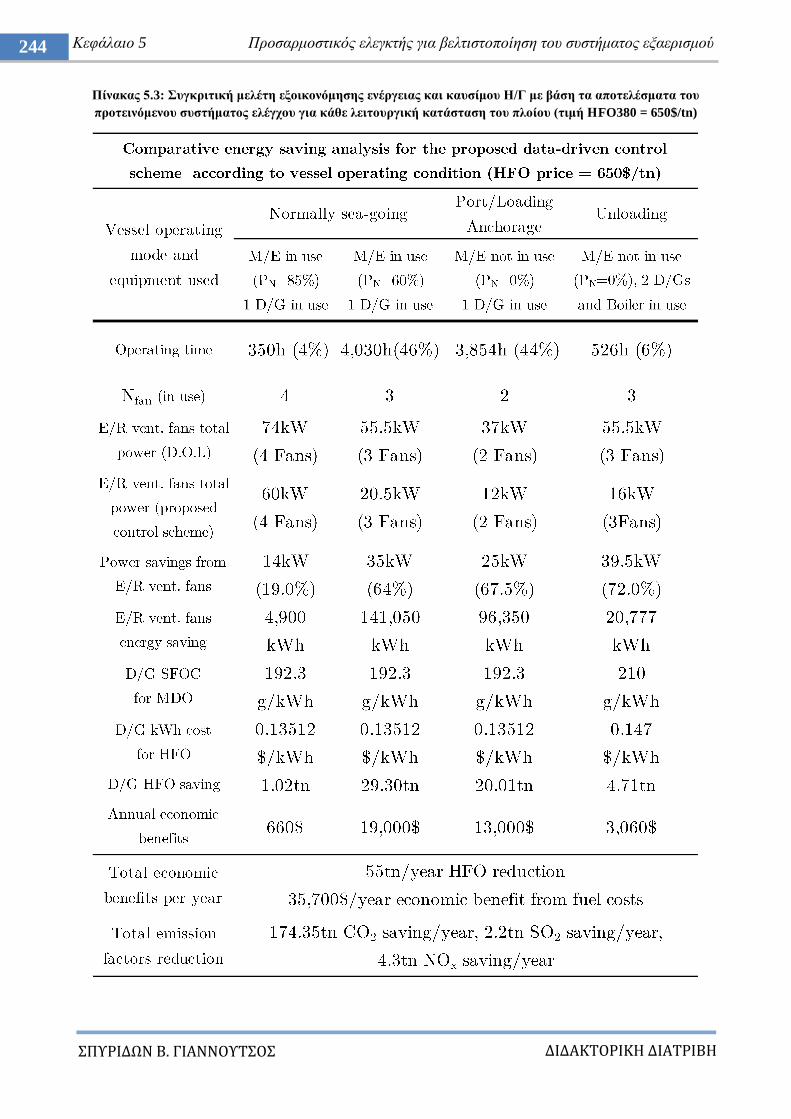
ΔΙΔΑΚΣΟΡΙΚΗ ΔΙΑΣΡΙΒΗ
ΠΤΡΙΔΩΝ Β. ΓΙΑΝΝΟΤΣΟ
244 Κεθάιαην 5 Πξνζαξκνζηηθόο ειεγθηήο γηα βειηηζηνπνίεζε ηνπ ζπζηήκαηνο εμαεξηζκνύ
Πίλαθαο 5.3: πγθξηηηθή κειέηε εμνηθνλόκεζεο ελέξγεηαο θαη θαπζίκνπ Η/Γ κε βάζε ηα απνηειέζκαηα ηνπ
πξνηεηλόκελνπ ζπζηήκαηνο ειέγρνπ γηα θάζε ιεηηνπξγηθή θαηάζηαζε ηνπ πινίνπ (ηηκή ΗFO380 = 650$/tn)
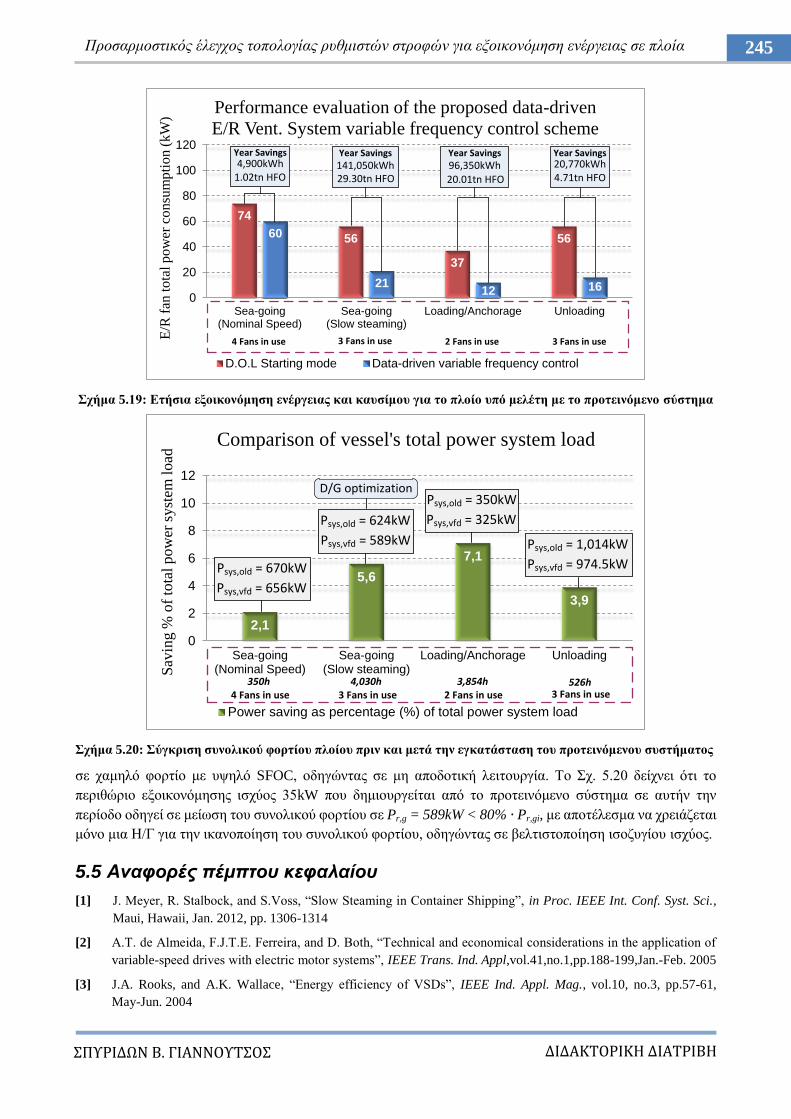
ΔΙΔΑΚΣΟΡΙΚΗ ΔΙΑΣΡΙΒΗ
ΠΤΡΙΔΩΝ Β. ΓΙΑΝΝΟΤΣΟ
245 Πξνζαξκνζηηθόο έιεγρνο ηνπνινγίαο ξπζκηζηώλ ζηξνθώλ γηα εμνηθνλόκεζε ελέξγεηαο ζε πινία
ρήκα 5.19: Δηήζηα εμνηθνλόκεζε ελέξγεηαο θαη θαπζίκνπ γηα ην πινίν ππό κειέηε κε ην πξνηεηλόκελν ζύζηεκα
ρήκα 5.20: ύγθξηζε ζπλνιηθνύ θνξηίνπ πινίνπ πξηλ θαη κεηά ηελ εγθαηάζηαζε ηνπ πξνηεηλόκελνπ ζπζηήκαηνο
ζε ρακειό θνξηίν κε πςειό SFOC, νδεγώληαο ζε κε απνδνηηθή ιεηηνπξγία. Σν ρ. 5.20 δείρλεη όηη ην
πεξηζώξην εμνηθνλόκεζεο ηζρύνο 35kW πνπ δεκηνπξγείηαη από ην πξνηεηλόκελν ζύζηεκα ζε απηήλ ηελ
πεξίνδν νδεγεί ζε κείσζε ηνπ ζπλνιηθνύ θνξηίνπ ζε Pr,g = 589kW < 80% Pr,gi, κε απνηέιεζκα λα ρξεηάδεηαη
κόλν κηα Ζ/Γ γηα ηελ ηθαλνπνίεζε ηνπ ζπλνιηθνύ θνξηίνπ, νδεγώληαο ζε βειηηζηνπνίεζε ηζνδπγίνπ ηζρύνο.
5.5 Αναθοπέρ πέμπηος κεθαλαίος
[1] J. Meyer, R. Stalbock, and S.Voss, “Slow Steaming in Container Shipping”, in Proc. IEEE Int. Conf. Syst. Sci.,
Maui, Hawaii, Jan. 2012, pp. 1306-1314
[2] A.T. de Almeida, F.J.T.E. Ferreira, and D. Both, “Technical and economical considerations in the application of
variable-speed drives with electric motor systems”, IEEE Trans. Ind. Appl,vol.41,no.1,pp.188-199,Jan.-Feb. 2005
[3] J.A. Rooks, and A.K. Wallace, “Energy efficiency of VSDs”, IEEE Ind. Appl. Mag., vol.10, no.3, pp.57-61,
May-Jun. 2004
74
56
37
5660
2112 16
0
20
40
60
80
100
120
Sea-going(Nominal Speed)
Sea-going(Slow steaming)
Loading/Anchorage Unloading
E/R
fan
to
tal
po
wer
co
nsu
mp
tio
n (
kW
)
Performance evaluation of the proposed data-driven
E/R Vent. System variable frequency control scheme
D.O.L Starting mode Data-driven variable frequency control
1.02tn HFO
Year Savings4,900kWh
29.30tn HFO
Year Savings141,050kWh
20.01tn HFO
Year Savings96,350kWh
4 Fans in use 3 Fans in use 2 Fans in use 3 Fans in use
4.71tn HFO
Year Savings20,770kWh
2,1
5,6
7,1
3,9
0
2
4
6
8
10
12
Sea-going(Nominal Speed)
Sea-going(Slow steaming)
Loading/Anchorage Unloading
Sav
ing
% o
f to
tal
po
wer
sy
stem
lo
ad Comparison of vessel's total power system load
Power saving as percentage (%) of total power system load
4 Fans in use 3 Fans in use 2 Fans in use 3 Fans in use
Psys,old = 670kW
Psys,vfd = 656kW
Psys,old = 624kW
Psys,vfd = 589kW
Psys,old = 350kW
Psys,vfd = 325kW
Psys,old = 1,014kW
Psys,vfd = 974.5kW
350h 4,030h 3,854h 526h
D/G optimization
ΔΙΔΑΚΣΟΡΙΚΗ ΔΙΑΣΡΙΒΗ
ΠΤΡΙΔΩΝ Β. ΓΙΑΝΝΟΤΣΟ
246 Κεθάιαην 5 Πξνζαξκνζηηθόο ειεγθηήο γηα βειηηζηνπνίεζε ηνπ ζπζηήκαηνο εμαεξηζκνύ
[4] D. Gritter, S.S. Kalsi, and N. Henderson, “Variable speed electric drive options for electric ships”, in Proc. IEEE
Elect. Ship Techn. Symp., Philadelphia, Pennsylvania, pp. 347-354, Jul. 2005
[5] R. Cuzner, D. Drews, W. Kranz, A. Bendre, and G. Venkataramanan, “Power-Dense Shipboard-Compatible Low-
Horsepower Variable-Frequency Drives”, IEEE Trans. Ind. Appl., vol. 48, no. 6, pp. 2121-2128, Nov.-Dec. 2012
[6] K. Lee, G. Venkataramanan, and T.M. Jahns, “Modeling Effects of Voltage Unbalances in Industrial Distribution
Systems with Adjustable-Speed Drives”, IEEE Trans. Ind. Appl., vol. 44, no.5, pp. 1322-1332, Sept.-Oct. 2008
[7] J. Tamminen, T. Ahonen, J. Ahola, and M. Niemela, “Detection of Mass Increase in a Fan Impeller With a
Frequency Converter”, IEEE Trans. Ind. Electron., vol. 60, no. 4, pp. 3968-3975, Sept. 2013
[8] J. Rodriguez, J. Pontt, C. Silva, R. Musalem, P. Newman, R. Vargas and S. Fuentes, “Resonances and
overvoltages in a medium-voltage fan motor drive with long cables in an underground mine”, IEEE Trans. Ind.
Appl., vol. 42, no. 3, pp.856-863, May-Jun. 2006
[9] S. Yin, S.X. Ding, X. Xie, and H. Luo, “A Review on Basic Data-Driven Approaches for Industrial Process
Monitoring”, IEEE Trans. Ind. Electron., vol. 61, no. 11, pp. 6418-6428, Nov. 2014
[10] D. Xuewu, and G. Zhivei, “From Model, Signal to Knowledge: A Data-Driven Perspective of Fault Detection
and Diagnosis”, IEEE Trans. Ind. Inf., vol. 9, no. 4, pp. 2226 -2238, Nov. 2013
[11] S. Yin, H. Luo and S.X. Ding: “Real Time Implementation of Fault Tolerant Control Systems With Performance
Optimization”, IEEE Trans. Ind. Electron., vol. 61, no. 5, pp. 2402 -2411, May 2014
[12] W. Zhuo, and L. Derong, “A Data-Based State Feedback Control Method for a Class of Nonlinear Systems”,
IEEE Trans. Ind. Inf., vol. 9, no. 4, pp. 2284 -2292, Nov. 2013
[13] M. Radac, R. Precup, E.M. Petriu, and S. Preitl, “Iterative Data-Driven Tuning of Controllers for Nonlinear
Systems With Constraints”, IEEE Trans. Ind. Electron., vol. 61, no. 11, pp. 6360-6368, Nov. 2014
[14] Z. Hou, and Y. Zhu, “Controller-Dynamic-Linearization-Based Model Free Adaptive Control for Discrete-Time
Nonlinear Systems”, IEEE Trans. Ind. Inf., vol. 9, no. 4, pp. 2301-2309, Nov. 2013
[15] J.K. Huusom, N.K. Poulsen, and S.B. Jørgensen, “Improving convergence of iterative feedback tuning” J. of
Process Control, vol. 19, no. 4, pp. 570–578, Apr. 2009
[16] C.C. Hang, K.J. Astrom and W.K. Ho, "Refinements of the Ziegler-Nichols tuning formula", IEE Proceedings D
- Control Theory and Appl., vol. 138, no. 2, pp. 111-118, March 1991.
[17] A.S. Bazanella, L.F.A. Pereira and A.Parraga, "A New Method for PID Tuning Including Plants Without
Ultimate Frequency", IEEE Trans. on Control Sys. Techn., vol. 25, no. 2, pp. 637-644, March 2017
[18] Shipbuilding-Engine room ventilation in diesel-engined ships - Design requirements and basis of calculations,
Int. Std. ISO 8861:1998
[19] MAN B&W Diesel Turbo,“Influence of Ambient Temperature Conditions on Main Engine Operation”,2010,Man
B&W, [Online].Available:http://www.mandieselturbo.com/files/news/filesof15010/5510-0074-00ppr_low.pdf
[20] M.A. Valenzuela, and P. Reyes, “Simple and Reliable Model for the Thermal Protection of Variable-Speed Self-
Ventilated Induction Motor Drives”, IEEE Trans. Ind. Appl., vol. 46, no.2, pp. 770-778, Mar.-Apr. 2010
[21] American Bureau of Shipping (ABS), “Rules for Building and Classing Steel Vessels 2013 Part 4: Vessel
Systems and Machinery”, [Online] Available:
http://www.eagle.org/eagleExternalPortalWEB/ShowProperty/BEA%20Repository/Rules&Guides/Archives/2_S
VR_2013/part4
[22] Fluke, “Fluke PQ-345 Clamp Meter manual”, [Online] Available: http://en-us.fluke.com/products/power-
quality-analyzers/fluke-345-clamp-meter.html
[23] Δlspec, “Elspec G4430 Power Quality Analyzer”, [Online] Available: http://elspec-ltd.com/support/manuals/
[24] A. Sarvi, C.J. Fogelholm and R. Zevenhoven: “Emissions from largescale medium-speed diesel engines: 2.
Influence of fuel type and operating mode”, J. of Fuel Process. Techn., Vol. 89, No. 5, pp. 520-527 , 2008

ΔΙΔΑΚΣΟΡΙΚΗ ΔΙΑΣΡΙΒΗ
ΠΤΡΙΔΩΝ Β. ΓΙΑΝΝΟΤΣΟ
247 Πξνζαξκνζηηθόο έιεγρνο ηνπνινγίαο ξπζκηζηώλ ζηξνθώλ γηα εμνηθνλόκεζε ελέξγεηαο ζε πινία
ΔΙΔΑΚΣΟΡΙΚΗ ΔΙΑΣΡΙΒΗ
ΠΤΡΙΔΩΝ Β. ΓΙΑΝΝΟΤΣΟ
248 Κεθάιαην 6 πζηεκαηηθή κειέηε πνηόηεηαο ηζρύνο πινίσλ γηα εθαξκνγή ξπζκηζηώλ ζηξνθώλ
Κεθάιαην 6
πζηεκαηηθή κειέηε πνηόηεηαο ηζρύνο δηθηύνπ
πινίσλ γηα ηελ εθαξκνγή ξπζκηζηώλ ζηξνθώλ
6.1 Διζαγυγή
Δίλαη γεγνλόο όηη ζηηο ζύγρξνλεο εγθαηαζηάζεηο ζπζηεκάησλ ηζρύνο πινίσλ γίλεηαη εθηεηακέλε ρξήζε
ξπζκηζηώλ ζηξνθώλ κε ζθνπό ηε βειηηζηνπνίεζε ησλ δηεξγαζηώλ ηόζν ζε επίπεδν ειέγρνπ θαη αιιά θαη ζε
επίπεδν εμνηθνλόκεζεο ηζρύνο, κε ηελ πξνηεηλόκελε εθαξκνγή λα απνηειεί ραξαθηεξηζηηθό παξάδεηγκα [1]-
[5]. Χζηόζν ε πξνζζήθε πνιιαπιώλ κε γξακκηθώλ θνξηίσλ πνπ ιεηηνπξγνύλ ζε πςειέο δηαθνπηηθέο
ζπρλόηεηεο ζην απηόλνκν δίθηπν ειεθηξηθήο ηζρύνο ηνπ πινίνπ, πξνθαιεί ηελ παξαγσγή θαη έγρπζε
αξκνληθώλ ζπληζησζώλ ξεύκαηνο πξνο ην δίθηπν, πνπ πεξηιακβάλεη πεγέο ρακειήο ηζρύνο βξαρπθύθισζεο,
όπσο νη Ζ/Γ πνπ νδεγνύληαη από κεραλέο εζσηεξηθήο θαύζεο, κε απνηέιεζκα ηελ εκθάληζε πςεινύ
επηπέδνπ αξκνληθώλ ηάζεο ζην ζεκείν θνηλήο ζύλδεζεο εάλ δε ιεθζνύλ θαηάιιεια κέηξα πεξηνξηζκνύ [6]-
[10]. Με βάζε ηε κειέηε ηεο παξαγξάθνπ 2.2 ζρεηηθά κε ηελ απόθξηζε ησλ βξόρσλ ειέγρνπ ζπρλόηεηαο θαη
ηάζεο ζην απηόλνκν δίθηπν ειεθηξηθήο ηζρύνο ηνπ πινίνπ, είλαη γλσζηό όηη ν ζπλδπαζκόο πςίζπρλεο
αξκνληθήο παξακόξθσζεο θαη ε εκθάληζε δηαθνπηηθώλ εγθνπώλ (commutation notching) ζηελ θπκαηνκνξθή
ηεο ηάζεο κπνξεί λα νδεγήζνπλ ζε ηαιαληώζεηο θαη αζηάζεηα ην βξόρν ειέγρνπ ηάζεο πνπ ρξεζηκνπνηεί ν
απηόκαηνο ξπζκηζηήο ηάζεο (AVR) θαη ην βξόρν ειέγρνπ ζπρλόηεηαο ηνπ ξπζκηζηή ζηξνθώλ (governor) ηεο
H/Γ, όπσο ζπκβαίλεη θαη ζε πεξηπηώζεηο ζπληνληζκνύ ζπρλνηήησλ ζην δίθηπν [11] – [12].
Ζ ζεκαζία ηεο ρξήζεο δεηθηώλ αλαγλώξηζεο επηπέδνπ αξκνληθώλ ζπληζησζώλ θαη ζνξύβσλ ζην δίθηπν,
πνπ νδεγνύλ ζηελ εθηίκεζε ηεο αξκνληθήο παξακόξθσζεο αλαδεηθλύεηαη ζπλερώο [13] – [15]. Πξνβιήκαηα
ζρεηηθά κε ηελ πνηόηεηα ηζρύνο ζεσξνύληαη ζεκαληηθά δηόηη κπνξεί λα νδεγήζνπλ ζε ζνβαξά ζθάικαηα
ιεηηνπξγίαο, νδεγώληαο ζηελ εθαξκνγή πξνηύπσλ πνπ ζεζπίδνπλ όξηα ιεηηνπξγίαο, όπσο ην πξόηππν ΗΔC
610000-3-2 [16]. Αληίζηνηρα, ην πξόηππν IEEE 1159 θαζνξίδεη ηηο πξαθηηθέο πξνζδηνξηζκνύ, κέηξεζεο,
πνζνηηθνπνίεζεο θαη αλάιπζεο ειεθηξνκαγλεηηθώλ παξεκβνιώλ ζην δίθηπν ηζρύνο [17]. Πξνζπάζεηα
πξνζαξκνγήο ησλ πξνηεηλόκελσλ πξαθηηθώλ έρεη γίλεη θαηά θαηξνύο θαη ζηα απηόλνκα δίθηπα πινίσλ δίρσο
ώζηνζν λα είλαη ζπζηεκαηηθή [18]-[19]. Γηα ηελ αληηκεηώπηζε ελδερόκελσλ πξνβιεκάησλ πνηόηεηαο ηζρύνο
ζην δίθηπν ηζρύνο ηνπ πινίνπ θαη ησλ πιαηθνξκώλ εμόξπμεο πεηξειαίνπ, έρνπλ πηνζεηεζεί ζπγθεθξηκέλα
πξόηππα πνπ εθαξκόδνληαη ζηε λαπηηθή βηνκεραλία γηα ηε δηαζθάιηζε ηεο αμηνπηζηίαο [20]-[22].
Πξνο απηήλ ηελ θαηεύζπλζε, έρνπλ πξαγκαηνπνηεζεί κειέηεο γηα ηε βειηηζηνπνίεζε ηεο πνηόηεηαο
ηζρύνο κε πεξηνξηζκό ησλ αξκνληθώλ ζπληζησζώλ, κείσζε ζηε δηαθύκαλζε θαη ηελ αζπκκεηξία ηάζεο ζην
δίθηπν [23]-[25], θαζώο επίζεο θαη κειέηεο γηα ην ζρεδηαζκό θίιηξσλ απνθνπήο αξκνληθώλ γηα εθαξκνγή
ζηε βηνκεραλία [26]. Ζ επίδξαζε ηεο εγθαηάζηαζεο απηεπαγσγώλ γηα ηελ αληηζηάζκηζε αξκνληθώλ
ξεύκαηνο πνπ παξάγνληαη από ηνπο ξπζκηζηέο ζηξνθώλ θαζώο θαη ε πεξίπησζε ρξήζεο παζεηηθώλ θίιηξσλ
βειηηώλνπλ ην επίπεδν αξκνληθώλ, πξνϋπνζέηνληαο όκσο θαηάιιειε ζρεδίαζε γηα απνθπγή ζθαικάησλ
[27]-[29]. Οη παξαπάλσ πξνζεγγίζεηο, σζηόζν, δελ ζπλζέηνπλ κηα ζπζηεκαηηθή κεζνδνινγία αλάιπζεο
πνηόηεηαο ηζρύνο, ιακβάλνληαο ππόςε ηηο ηδηαηηεξόηεηεο ηεο ηνπνινγίαο ηνπ απηόλνκνπ δηθηύνπ ειεθηξηθήο
ηζρύνο ηνπ πινίνπ, έηζη ώζηε θαηά ηελ εθαξκνγή ξπζκηζηώλ ζηξνθώλ ζε επαγσγηθνύο θηλεηήξεο ζην πινίν
λα επηβεβαηώλεηαη ε ζπκβαηόηεηα κε ηα όξηα πνηόηεηαο ηζρύνο πνπ ζεζπίδνπλ νη λενγλώκνλεο, πξνθεηκέλνπ
λα δηαζθαιίδεηαη ε ζηαζεξόηεηα ηνπ ζπζηήκαηνο ειεθηξηθήο ελέξγεηαο ηνπ πινίνπ.
ε απηό ην θεθάιαην, πξνηείλεηαη ζπζηεκαηηθή κεζνδνινγία πξνζδηνξηζκνύ θαη κέηξεζεο πνηόηεηαο
ηζρύνο ζην δίθηπν ηνπ πινίνπ, κε ζθνπό ηνλ θαζνξηζκό ηνπ κεγέζνπο θαη ηνπ ηύπνπ ησλ θίιηξσλ αξκνληθώλ
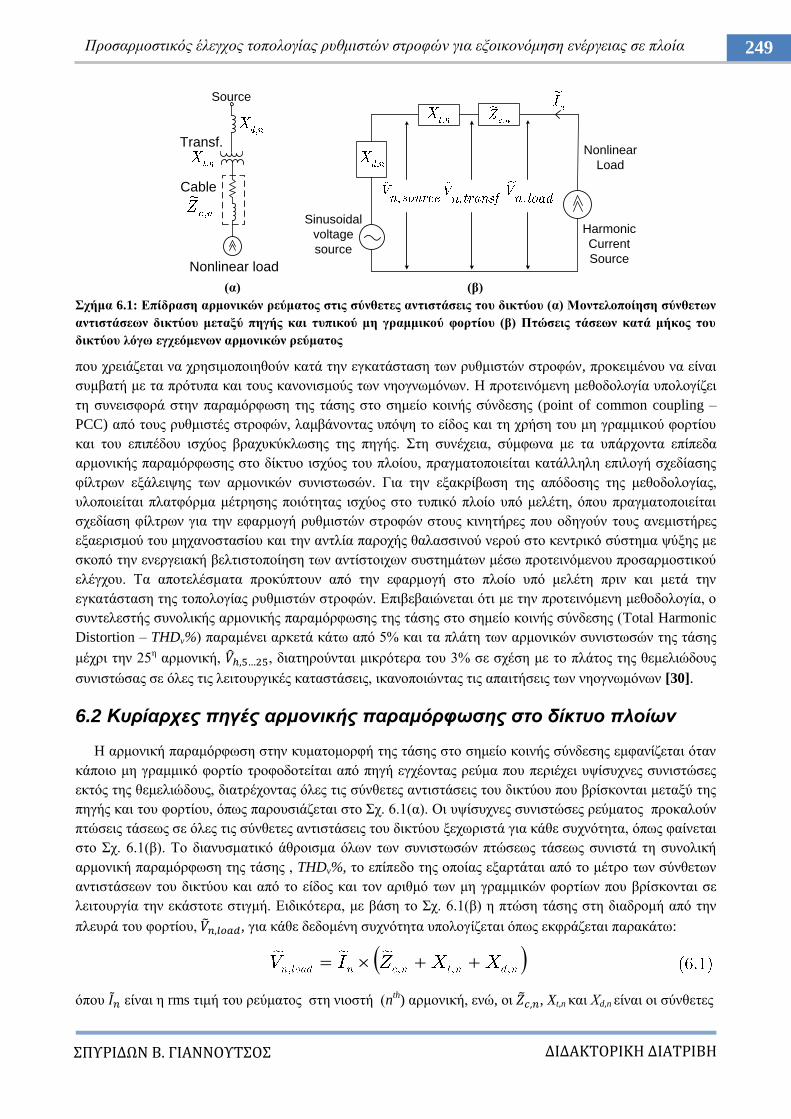
ΔΙΔΑΚΣΟΡΙΚΗ ΔΙΑΣΡΙΒΗ
ΠΤΡΙΔΩΝ Β. ΓΙΑΝΝΟΤΣΟ
249 Πξνζαξκνζηηθόο έιεγρνο ηνπνινγίαο ξπζκηζηώλ ζηξνθώλ γηα εμνηθνλόκεζε ελέξγεηαο ζε πινία
(α) (β)
ρήκα 6.1: Δπίδξαζε αξκνληθώλ ξεύκαηνο ζηηο ζύλζεηεο αληηζηάζεηο ηνπ δηθηύνπ (α) Μνληεινπνίεζε ζύλζεησλ
αληηζηάζεσλ δηθηύνπ κεηαμύ πεγήο θαη ηππηθνύ κε γξακκηθνύ θνξηίνπ (β) Πηώζεηο ηάζεσλ θαηά κήθνο ηνπ
δηθηύνπ ιόγσ εγρεόκελσλ αξκνληθώλ ξεύκαηνο
πνπ ρξεηάδεηαη λα ρξεζηκνπνηεζνύλ θαηά ηελ εγθαηάζηαζε ησλ ξπζκηζηώλ ζηξνθώλ, πξνθεηκέλνπ λα είλαη
ζπκβαηή κε ηα πξόηππα θαη ηνπο θαλνληζκνύο ησλ λενγλσκόλσλ. Ζ πξνηεηλόκελε κεζνδνινγία ππνινγίδεη
ηε ζπλεηζθνξά ζηελ παξακόξθσζε ηεο ηάζεο ζην ζεκείν θνηλήο ζύλδεζεο (point of common coupling –
PCC) από ηνπο ξπζκηζηέο ζηξνθώλ, ιακβάλνληαο ππόςε ην είδνο θαη ηε ρξήζε ηνπ κε γξακκηθνύ θνξηίνπ
θαη ηνπ επηπέδνπ ηζρύνο βξαρπθύθισζεο ηεο πεγήο. ηε ζπλέρεηα, ζύκθσλα κε ηα ππάξρνληα επίπεδα
αξκνληθήο παξακόξθσζεο ζην δίθηπν ηζρύνο ηνπ πινίνπ, πξαγκαηνπνηείηαη θαηάιιειε επηινγή ζρεδίαζεο
θίιηξσλ εμάιεηςεο ησλ αξκνληθώλ ζπληζησζώλ. Γηα ηελ εμαθξίβσζε ηεο απόδνζεο ηεο κεζνδνινγίαο,
πινπνηείηαη πιαηθόξκα κέηξεζεο πνηόηεηαο ηζρύνο ζην ηππηθό πινίν ππό κειέηε, όπνπ πξαγκαηνπνηείηαη
ζρεδίαζε θίιηξσλ γηα ηελ εθαξκνγή ξπζκηζηώλ ζηξνθώλ ζηνπο θηλεηήξεο πνπ νδεγνύλ ηνπο αλεκηζηήξεο
εμαεξηζκνύ ηνπ κεραλνζηαζίνπ θαη ηελ αληιία παξνρήο ζαιαζζηλνύ λεξνύ ζην θεληξηθό ζύζηεκα ςύμεο κε
ζθνπό ηελ ελεξγεηαθή βειηηζηνπνίεζε ησλ αληίζηνηρσλ ζπζηεκάησλ κέζσ πξνηεηλόκελνπ πξνζαξκνζηηθνύ
ειέγρνπ. Σα απνηειέζκαηα πξνθύπηνπλ από ηελ εθαξκνγή ζην πινίν ππό κειέηε πξηλ θαη κεηά ηελ
εγθαηάζηαζε ηεο ηνπνινγίαο ξπζκηζηώλ ζηξνθώλ. Δπηβεβαηώλεηαη όηη κε ηελ πξνηεηλόκελε κεζνδνινγία, ν
ζπληειεζηήο ζπλνιηθήο αξκνληθήο παξακόξθσζεο ηεο ηάζεο ζην ζεκείν θνηλήο ζύλδεζεο (Total Harmonic
Distortion – THDv%) παξακέλεη αξθεηά θάησ από 5% θαη ηα πιάηε ησλ αξκνληθώλ ζπληζησζώλ ηεο ηάζεο
κέρξη ηελ 25ε αξκνληθή, , δηαηεξνύληαη κηθξόηεξα ηνπ 3% ζε ζρέζε κε ην πιάηνο ηεο ζεκειηώδνπο
ζπληζηώζαο ζε όιεο ηηο ιεηηνπξγηθέο θαηαζηάζεηο, ηθαλνπνηώληαο ηηο απαηηήζεηο ησλ λενγλσκόλσλ [30].
6.2 Κςπίαπσερ πηγέρ απμονικήρ παπαμόπθυζηρ ζηο δίκηςο πλοίυν
Ζ αξκνληθή παξακόξθσζε ζηελ θπκαηνκνξθή ηεο ηάζεο ζην ζεκείν θνηλήο ζύλδεζεο εκθαλίδεηαη όηαλ
θάπνην κε γξακκηθό θνξηίν ηξνθνδνηείηαη από πεγή εγρένληαο ξεύκα πνπ πεξηέρεη πςίζπρλεο ζπληζηώζεο
εθηόο ηεο ζεκειηώδνπο, δηαηξέρνληαο όιεο ηηο ζύλζεηεο αληηζηάζεηο ηνπ δηθηύνπ πνπ βξίζθνληαη κεηαμύ ηεο
πεγήο θαη ηνπ θνξηίνπ, όπσο παξνπζηάδεηαη ζην ρ. 6.1(α). Οη πςίζπρλεο ζπληζηώζεο ξεύκαηνο πξνθαινύλ
πηώζεηο ηάζεσο ζε όιεο ηηο ζύλζεηεο αληηζηάζεηο ηνπ δηθηύνπ μερσξηζηά γηα θάζε ζπρλόηεηα, όπσο θαίλεηαη
ζην ρ. 6.1(β). Σν δηαλπζκαηηθό άζξνηζκα όισλ ησλ ζπληζησζώλ πηώζεσο ηάζεσο ζπληζηά ηε ζπλνιηθή
αξκνληθή παξακόξθσζε ηεο ηάζεο , THDv%, ην επίπεδν ηεο νπνίαο εμαξηάηαη από ην κέηξν ησλ ζύλζεησλ
αληηζηάζεσλ ηνπ δηθηύνπ θαη από ην είδνο θαη ηνλ αξηζκό ησλ κε γξακκηθώλ θνξηίσλ πνπ βξίζθνληαη ζε
ιεηηνπξγία ηελ εθάζηνηε ζηηγκή. Δηδηθόηεξα, κε βάζε ην ρ. 6.1(β) ε πηώζε ηάζεο ζηε δηαδξνκή από ηελ
πιεπξά ηνπ θνξηίνπ, , γηα θάζε δεδνκέλε ζπρλόηεηα ππνινγίδεηαη όπσο εθθξάδεηαη παξαθάησ:
όπνπ είλαη ε rms ηηκή ηνπ ξεύκαηνο ζηε ληνζηή (nth) αξκνληθή, ελώ, νη , Xt,n θαη Υd,n είλαη νη ζύλζεηεο
Source
Transf.
Cable
Nonlinear load
Sinusoidal
voltage
source
Nonlinear
Load
Harmonic
Current
Source
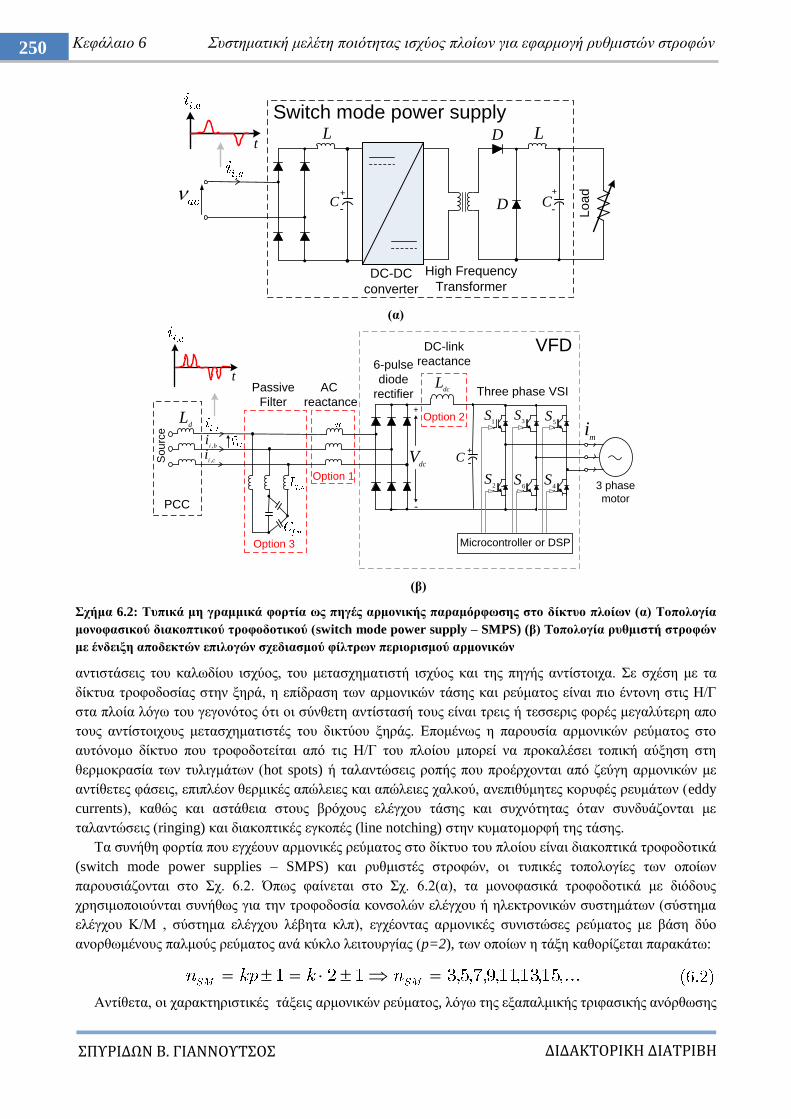
ΔΙΔΑΚΣΟΡΙΚΗ ΔΙΑΣΡΙΒΗ
ΠΤΡΙΔΩΝ Β. ΓΙΑΝΝΟΤΣΟ
250 Κεθάιαην 6 πζηεκαηηθή κειέηε πνηόηεηαο ηζρύνο πινίσλ γηα εθαξκνγή ξπζκηζηώλ ζηξνθώλ
(α)
(β)
ρήκα 6.2: Σππηθά κε γξακκηθά θνξηία σο πεγέο αξκνληθήο παξακόξθσζεο ζην δίθηπν πινίσλ (α) Σνπνινγία
κνλνθαζηθνύ δηαθνπηηθνύ ηξνθνδνηηθνύ (switch mode power supply – SMPS) (β) Toπνινγία ξπζκηζηή ζηξνθώλ
κε έλδεημε απνδεθηώλ επηινγώλ ζρεδηαζκνύ θίιηξσλ πεξηνξηζκνύ αξκνληθώλ
αληηζηάζεηο ηνπ θαισδίνπ ηζρύνο, ηνπ κεηαζρεκαηηζηή ηζρύνο θαη ηεο πεγήο αληίζηνηρα. ε ζρέζε κε ηα
δίθηπα ηξνθνδνζίαο ζηελ μεξά, ε επίδξαζε ησλ αξκνληθώλ ηάζεο θαη ξεύκαηνο είλαη πην έληνλε ζηηο Ζ/Γ
ζηα πινία ιόγσ ηνπ γεγνλόηνο όηη νη ζύλζεηε αληίζηαζή ηνπο είλαη ηξεηο ή ηεζζεξηο θνξέο κεγαιύηεξε απν
ηνπο αληίζηνηρνπο κεηαζρεκαηηζηέο ηνπ δηθηύνπ μεξάο. Δπνκέλσο ε παξνπζία αξκνληθώλ ξεύκαηνο ζην
απηόλνκν δίθηπν πνπ ηξνθνδνηείηαη από ηηο Ζ/Γ ηνπ πινίνπ κπνξεί λα πξνθαιέζεη ηνπηθή αύμεζε ζηε
ζεξκνθξαζία ησλ ηπιηγκάησλ (hot spots) ή ηαιαληώζεηο ξνπήο πνπ πξνέξρνληαη από δεύγε αξκνληθώλ κε
αληίζεηεο θάζεηο, επηπιένλ ζεξκηθέο απώιεηεο θαη απώιεηεο ραιθνύ, αλεπηζύκεηεο θνξπθέο ξεπκάησλ (eddy
currents), θαζώο θαη αζηάζεηα ζηνπο βξόρνπο ειέγρνπ ηάζεο θαη ζπρλόηεηαο όηαλ ζπλδπάδνληαη κε
ηαιαληώζεηο (ringing) θαη δηαθνπηηθέο εγθνπέο (line notching) ζηελ θπκαηνκνξθή ηεο ηάζεο.
Σα ζπλήζε θνξηία πνπ εγρένπλ αξκνληθέο ξεύκαηνο ζην δίθηπν ηνπ πινίνπ είλαη δηαθνπηηθά ηξνθνδνηηθά
(switch mode power supplies – SMPS) θαη ξπζκηζηέο ζηξνθώλ, νη ηππηθέο ηνπνινγίεο ησλ νπνίσλ
παξνπζηάδνληαη ζην ρ. 6.2. Όπσο θαίλεηαη ζην ρ. 6.2(α), ηα κνλνθαζηθά ηξνθνδνηηθά κε δηόδνπο
ρξεζηκνπνηνύληαη ζπλήζσο γηα ηελ ηξνθνδνζία θνλζνιώλ ειέγρνπ ή ειεθηξνληθώλ ζπζηεκάησλ (ζύζηεκα
ειέγρνπ Κ/Μ , ζύζηεκα ειέγρνπ ιέβεηα θιπ), εγρένληαο αξκνληθέο ζπληζηώζεο ξεύκαηνο κε βάζε δύν
αλνξζσκέλνπο παικνύο ξεύκαηνο αλά θύθιν ιεηηνπξγίαο (p=2), ησλ νπνίσλ ε ηάμε θαζνξίδεηαη παξαθάησ:
Αληίζεηα, νη ραξαθηεξηζηηθέο ηάμεηο αξκνληθώλ ξεύκαηνο, ιόγσ ηεο εμαπαικηθήο ηξηθαζηθήο αλόξζσζεο
+
-
DC-DC
converter
+
- Lo
ad
High Frequency
Transformer
Switch mode power supply
L
C
LD
D
t
C
+
-
Three phase VSI
3 phase
motor
6-pulse
diode
rectifier
So
urc
e
VFD
+
-
Option 3
Option 1
Option 2
Microcontroller or DSP
DC-link
reactance
AC
reactance
Passive
Filter
PCC
dL
bii
,
cii
,
tdc
L
1S
3S
5S
2S
6S
4S
Cdc
V
mi
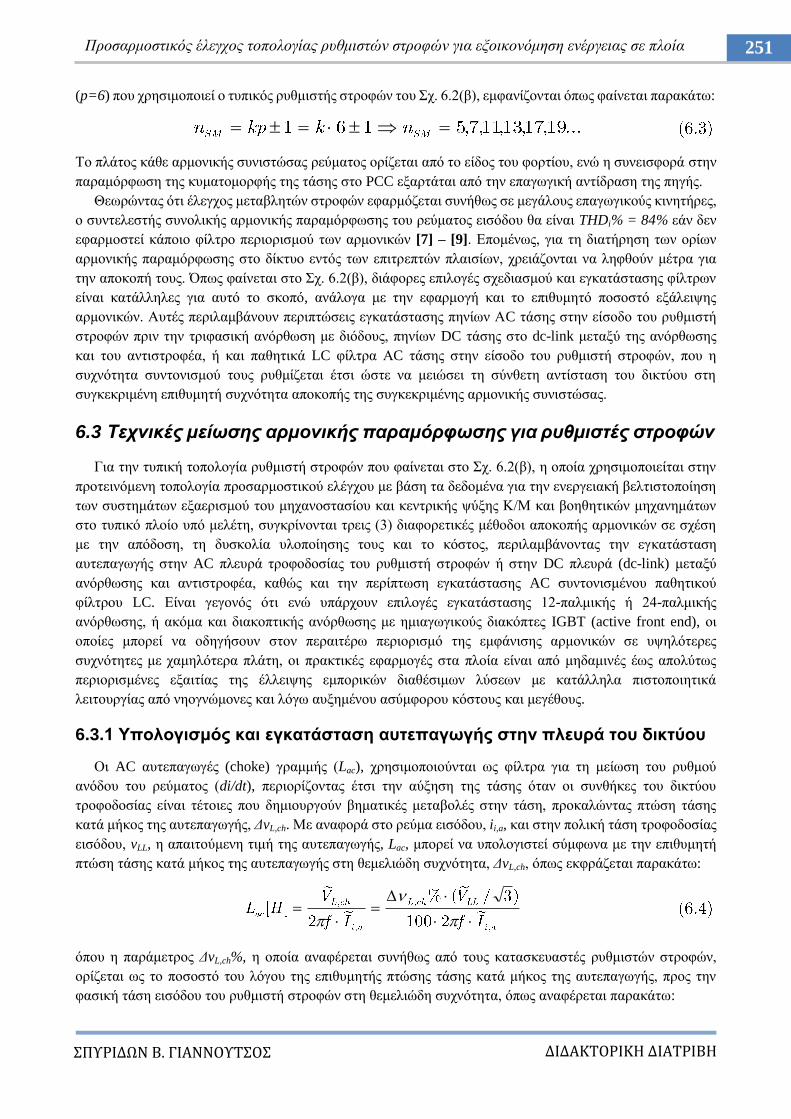
ΔΙΔΑΚΣΟΡΙΚΗ ΔΙΑΣΡΙΒΗ
ΠΤΡΙΔΩΝ Β. ΓΙΑΝΝΟΤΣΟ
251 Πξνζαξκνζηηθόο έιεγρνο ηνπνινγίαο ξπζκηζηώλ ζηξνθώλ γηα εμνηθνλόκεζε ελέξγεηαο ζε πινία
(p=6) πνπ ρξεζηκνπνηεί ν ηππηθόο ξπζκηζηήο ζηξνθώλ ηνπ ρ. 6.2(β), εκθαλίδνληαη όπσο θαίλεηαη παξαθάησ:
Σν πιάηνο θάζε αξκνληθήο ζπληζηώζαο ξεύκαηνο νξίδεηαη από ην είδνο ηνπ θνξηίνπ, ελώ ε ζπλεηζθνξά ζηελ
παξακόξθσζε ηεο θπκαηνκνξθήο ηεο ηάζεο ζην PCC εμαξηάηαη από ηελ επαγσγηθή αληίδξαζε ηεο πεγήο.
Θεσξώληαο όηη έιεγρνο κεηαβιεηώλ ζηξνθώλ εθαξκόδεηαη ζπλήζσο ζε κεγάινπο επαγσγηθνύο θηλεηήξεο,
ν ζπληειεζηήο ζπλνιηθήο αξκνληθήο παξακόξθσζεο ηνπ ξεύκαηνο εηζόδνπ ζα είλαη THDi% = 84% εάλ δελ
εθαξκνζηεί θάπνην θίιηξν πεξηνξηζκνύ ησλ αξκνληθώλ [7] – [9]. Δπνκέλσο, γηα ηε δηαηήξεζε ησλ νξίσλ
αξκνληθήο παξακόξθσζεο ζην δίθηπν εληόο ησλ επηηξεπηώλ πιαηζίσλ, ρξεηάδνληαη λα ιεθζνύλ κέηξα γηα
ηελ απνθνπή ηνπο. Όπσο θαίλεηαη ζην ρ. 6.2(β), δηάθνξεο επηινγέο ζρεδηαζκνύ θαη εγθαηάζηαζεο θίιηξσλ
είλαη θαηάιιειεο γηα απηό ην ζθνπό, αλάινγα κε ηελ εθαξκνγή θαη ην επηζπκεηό πνζνζηό εμάιεηςεο
αξκνληθώλ. Απηέο πεξηιακβάλνπλ πεξηπηώζεηο εγθαηάζηαζεο πελίσλ ΑC ηάζεο ζηελ είζνδν ηνπ ξπζκηζηή
ζηξνθώλ πξηλ ηελ ηξηθαζηθή αλόξζσζε κε δηόδνπο, πελίσλ DC ηάζεο ζην dc-link κεηαμύ ηεο αλόξζσζεο
θαη ηνπ αληηζηξνθέα, ή θαη παζεηηθά LC θίιηξα ΑC ηάζεο ζηελ είζνδν ηνπ ξπζκηζηή ζηξνθώλ, πνπ ε
ζπρλόηεηα ζπληνληζκνύ ηνπο ξπζκίδεηαη έηζη ώζηε λα κεηώζεη ηε ζύλζεηε αληίζηαζε ηνπ δηθηύνπ ζηε
ζπγθεθξηκέλε επηζπκεηή ζπρλόηεηα απνθνπήο ηεο ζπγθεθξηκέλεο αξκνληθήο ζπληζηώζαο.
6.3 Τεσνικέρ μείυζηρ απμονικήρ παπαμόπθυζηρ για πςθμιζηέρ ζηποθών
Γηα ηελ ηππηθή ηνπνινγία ξπζκηζηή ζηξνθώλ πνπ θαίλεηαη ζην ρ. 6.2(β), ε νπνία ρξεζηκνπνηείηαη ζηελ
πξνηεηλόκελε ηνπνινγία πξνζαξκνζηηθνύ ειέγρνπ κε βάζε ηα δεδνκέλα γηα ηελ ελεξγεηαθή βειηηζηνπνίεζε
ησλ ζπζηεκάησλ εμαεξηζκνύ ηνπ κεραλνζηαζίνπ θαη θεληξηθήο ςύμεο Κ/Μ θαη βνεζεηηθώλ κεραλεκάησλ
ζην ηππηθό πινίν ππό κειέηε, ζπγθξίλνληαη ηξεηο (3) δηαθνξεηηθέο κέζνδνη απνθνπήο αξκνληθώλ ζε ζρέζε
κε ηελ απόδνζε, ηε δπζθνιία πινπνίεζεο ηνπο θαη ην θόζηνο, πεξηιακβάλνληαο ηελ εγθαηάζηαζε
απηεπαγσγήο ζηελ AC πιεπξά ηξνθνδνζίαο ηνπ ξπζκηζηή ζηξνθώλ ή ζηελ DC πιεπξά (dc-link) κεηαμύ
αλόξζσζεο θαη αληηζηξνθέα, θαζώο θαη ηελ πεξίπησζε εγθαηάζηαζεο AC ζπληνληζκέλνπ παζεηηθνύ
θίιηξνπ LC. Δίλαη γεγνλόο όηη ελώ ππάξρνπλ επηινγέο εγθαηάζηαζεο 12-παικηθήο ή 24-παικηθήο
αλόξζσζεο, ή αθόκα θαη δηαθνπηηθήο αλόξζσζεο κε εκηαγσγηθνύο δηαθόπηεο IGBT (active front end), νη
νπνίεο κπνξεί λα νδεγήζνπλ ζηνλ πεξαηηέξσ πεξηνξηζκό ηεο εκθάληζεο αξκνληθώλ ζε πςειόηεξεο
ζπρλόηεηεο κε ρακειόηεξα πιάηε, νη πξαθηηθέο εθαξκνγέο ζηα πινία είλαη από κεδακηλέο έσο απνιύησο
πεξηνξηζκέλεο εμαηηίαο ηεο έιιεηςεο εκπνξηθώλ δηαζέζηκσλ ιύζεσλ κε θαηάιιεια πηζηνπνηεηηθά
ιεηηνπξγίαο από λενγλώκνλεο θαη ιόγσ απμεκέλνπ αζύκθνξνπ θόζηνπο θαη κεγέζνπο.
6.3.1 Τπνινγηζκόο θαη εγθαηάζηαζε απηεπαγσγήο ζηελ πιεπξά ηνπ δηθηύνπ
Οη AC απηεπαγσγέο (choke) γξακκήο (Lac), ρξεζηκνπνηνύληαη σο θίιηξα γηα ηε κείσζε ηνπ ξπζκνύ
αλόδνπ ηνπ ξεύκαηνο (di/dt), πεξηνξίδνληαο έηζη ηελ αύμεζε ηεο ηάζεο όηαλ νη ζπλζήθεο ηνπ δηθηύνπ
ηξνθνδνζίαο είλαη ηέηνηεο πνπ δεκηνπξγνύλ βεκαηηθέο κεηαβνιέο ζηελ ηάζε, πξνθαιώληαο πηώζε ηάζεο
θαηά κήθνο ηεο απηεπαγσγήο, ΓvL,ch. Με αλαθνξά ζην ξεύκα εηζόδνπ, ii,a, θαη ζηελ πνιηθή ηάζε ηξνθνδνζίαο
εηζόδνπ, vLL, ε απαηηνύκελε ηηκή ηεο απηεπαγσγήο, Lac, κπνξεί λα ππνινγηζηεί ζύκθσλα κε ηελ επηζπκεηή
πηώζε ηάζεο θαηά κήθνο ηεο απηεπαγσγήο ζηε ζεκειηώδε ζπρλόηεηα, ΓvL,ch, όπσο εθθξάδεηαη παξαθάησ:
όπνπ ε παξάκεηξνο ΓvL,ch%, ε νπνία αλαθέξεηαη ζπλήζσο από ηνπο θαηαζθεπαζηέο ξπζκηζηώλ ζηξνθώλ,
νξίδεηαη σο ην πνζνζηό ηνπ ιόγνπ ηεο επηζπκεηήο πηώζεο ηάζεο θαηά κήθνο ηεο απηεπαγσγήο, πξνο ηελ
θαζηθή ηάζε εηζόδνπ ηνπ ξπζκηζηή ζηξνθώλ ζηε ζεκειηώδε ζπρλόηεηα, όπσο αλαθέξεηαη παξαθάησ:
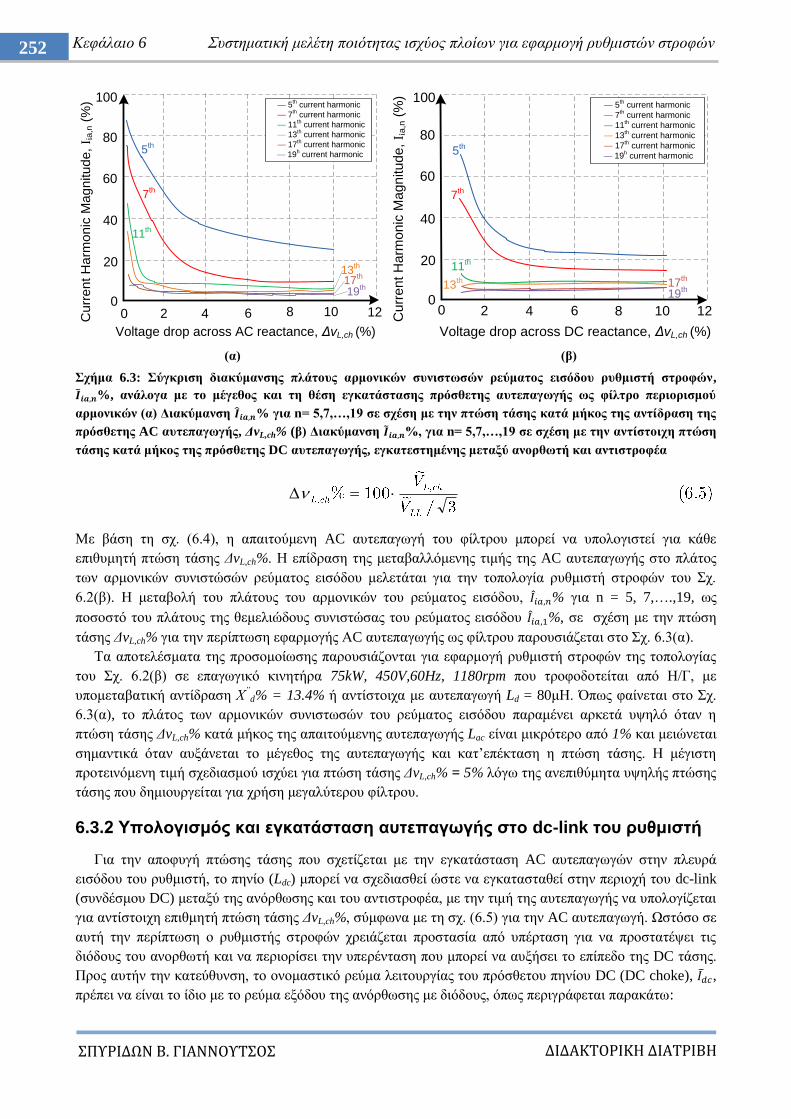
ΔΙΔΑΚΣΟΡΙΚΗ ΔΙΑΣΡΙΒΗ
ΠΤΡΙΔΩΝ Β. ΓΙΑΝΝΟΤΣΟ
252 Κεθάιαην 6 πζηεκαηηθή κειέηε πνηόηεηαο ηζρύνο πινίσλ γηα εθαξκνγή ξπζκηζηώλ ζηξνθώλ
(α) (β)
ρήκα 6.3: ύγθξηζε δηαθύκαλζεο πιάηνπο αξκνληθώλ ζπληζησζώλ ξεύκαηνο εηζόδνπ ξπζκηζηή ζηξνθώλ,
%, αλάινγα κε ην κέγεζνο θαη ηε ζέζε εγθαηάζηαζεο πξόζζεηεο απηεπαγσγήο σο θίιηξν πεξηνξηζκνύ
αξκνληθώλ (α) Γηαθύκαλζε % γηα n= 5,7,…,19 ζε ζρέζε κε ηελ πηώζε ηάζεο θαηά κήθνο ηεο αληίδξαζε ηεο
πξόζζεηεο AC απηεπαγσγήο, ΓvL,ch% (β) Γηαθύκαλζε %, γηα n= 5,7,…,19 ζε ζρέζε κε ηελ αληίζηνηρε πηώζε
ηάζεο θαηά κήθνο ηεο πξόζζεηεο DC απηεπαγσγήο, εγθαηεζηεκέλεο κεηαμύ αλνξζσηή θαη αληηζηξνθέα
Με βάζε ηε ζρ. (6.4), ε απαηηνύκελε AC απηεπαγσγή ηνπ θίιηξνπ κπνξεί λα ππνινγηζηεί γηα θάζε
επηζπκεηή πηώζε ηάζεο ΓvL,ch%. Ζ επίδξαζε ηεο κεηαβαιιόκελεο ηηκήο ηεο AC απηεπαγσγήο ζην πιάηνο
ησλ αξκνληθώλ ζπληζηώζώλ ξεύκαηνο εηζόδνπ κειεηάηαη γηα ηελ ηνπνινγία ξπζκηζηή ζηξνθώλ ηνπ ρ.
6.2(β). Ζ κεηαβνιή ηνπ πιάηνπο ηνπ αξκνληθώλ ηνπ ξεύκαηνο εηζόδνπ, % γηα n = 5, 7,….,19, σο
πνζνζηό ηνπ πιάηνπο ηεο ζεκειηώδνπο ζπληζηώζαο ηνπ ξεύκαηνο εηζόδνπ %, ζε ζρέζε κε ηελ πηώζε
ηάζεο ΓvL,ch% γηα ηελ πεξίπησζε εθαξκνγήο ΑC απηεπαγσγήο σο θίιηξνπ παξνπζηάδεηαη ζην ρ. 6.3(α).
Σα απνηειέζκαηα ηεο πξνζνκνίσζεο παξνπζηάδνληαη γηα εθαξκνγή ξπζκηζηή ζηξνθώλ ηεο ηνπνινγίαο
ηνπ ρ. 6.2(β) ζε επαγσγηθό θηλεηήξα 75kW, 450V,60Hz, 1180rpm πνπ ηξνθνδνηείηαη από Ζ/Γ, κε
ππνκεηαβαηηθή αληίδξαζε Υ”
d% = 13.4% ή αληίζηνηρα κε απηεπαγσγή Ld = 80κΖ. Όπσο θαίλεηαη ζην ρ.
6.3(α), ην πιάηνο ησλ αξκνληθώλ ζπληζησζώλ ηνπ ξεύκαηνο εηζόδνπ παξακέλεη αξθεηά πςειό όηαλ ε
πηώζε ηάζεο ΓvL,ch% θαηά κήθνο ηεο απαηηνύκελεο απηεπαγσγήο Lac είλαη κηθξόηεξν από 1% θαη κεηώλεηαη
ζεκαληηθά όηαλ απμάλεηαη ην κέγεζνο ηεο απηεπαγσγήο θαη θαη‟επέθηαζε ε πηώζε ηάζεο. Ζ κέγηζηε
πξνηεηλόκελε ηηκή ζρεδηαζκνύ ηζρύεη γηα πηώζε ηάζεο ΓvL,ch% = 5% ιόγσ ηεο αλεπηζύκεηα πςειήο πηώζεο
ηάζεο πνπ δεκηνπξγείηαη γηα ρξήζε κεγαιύηεξνπ θίιηξνπ.
6.3.2 Τπνινγηζκόο θαη εγθαηάζηαζε απηεπαγσγήο ζην dc-link ηνπ ξπζκηζηή
Γηα ηελ απνθπγή πηώζεο ηάζεο πνπ ζρεηίδεηαη κε ηελ εγθαηάζηαζε AC απηεπαγσγώλ ζηελ πιεπξά
εηζόδνπ ηνπ ξπζκηζηή, ην πελίν (Ldc) κπνξεί λα ζρεδηαζζεί ώζηε λα εγθαηαζηαζεί ζηελ πεξηνρή ηνπ dc-link
(ζπλδέζκνπ DC) κεηαμύ ηεο αλόξζσζεο θαη ηνπ αληηζηξνθέα, κε ηελ ηηκή ηεο απηεπαγσγήο λα ππνινγίδεηαη
γηα αληίζηνηρε επηζκεηή πηώζε ηάζεο ΓvL,ch%, ζύκθσλα κε ηε ζρ. (6.5) γηα ηελ AC απηεπαγσγή. Χζηόζν ζε
απηή ηελ πεξίπησζε ν ξπζκηζηήο ζηξνθώλ ρξεηάδεηαη πξνζηαζία από ππέξηαζε γηα λα πξνζηαηέςεη ηηο
δηόδνπο ηνπ αλνξζσηή θαη λα πεξηνξίζεη ηελ ππεξέληαζε πνπ κπνξεί λα απμήζεη ην επίπεδν ηεο DC ηάζεο.
Πξνο απηήλ ηελ θαηεύζπλζε, ην νλνκαζηηθό ξεύκα ιεηηνπξγίαο ηνπ πξόζζεηνπ πελίνπ DC (DC choke), ,
πξέπεη λα είλαη ην ίδην κε ην ξεύκα εμόδνπ ηεο αλόξζσζεο κε δηόδνπο, όπσο πεξηγξάθεηαη παξαθάησ:
Voltage drop across AC reactance, ΔvL,ch (%)
2 4 6 8 10
5th
7th
11th
13th
17th
19th
0
20
40
60
80
100
0
— 5th current harmonic
— 7th current harmonic
— 11th current harmonic
— 13th current harmonic
— 17th current harmonic
— 19h current harmonic
12Cu
rre
nt H
arm
on
ic M
ag
nitu
de
, I i
a,n (
%)
0 2 4 6 8 100
20
40
60
805
th
7th
11th
13th 17
th
19th
12
— 5th current harmonic
— 7th current harmonic
— 11th current harmonic
— 13th current harmonic
— 17th current harmonic
— 19h current harmonic
100
Voltage drop across DC reactance, ΔvL,ch (%)
Cu
rre
nt H
arm
on
ic M
ag
nitu
de
, I i
a,n (
%)
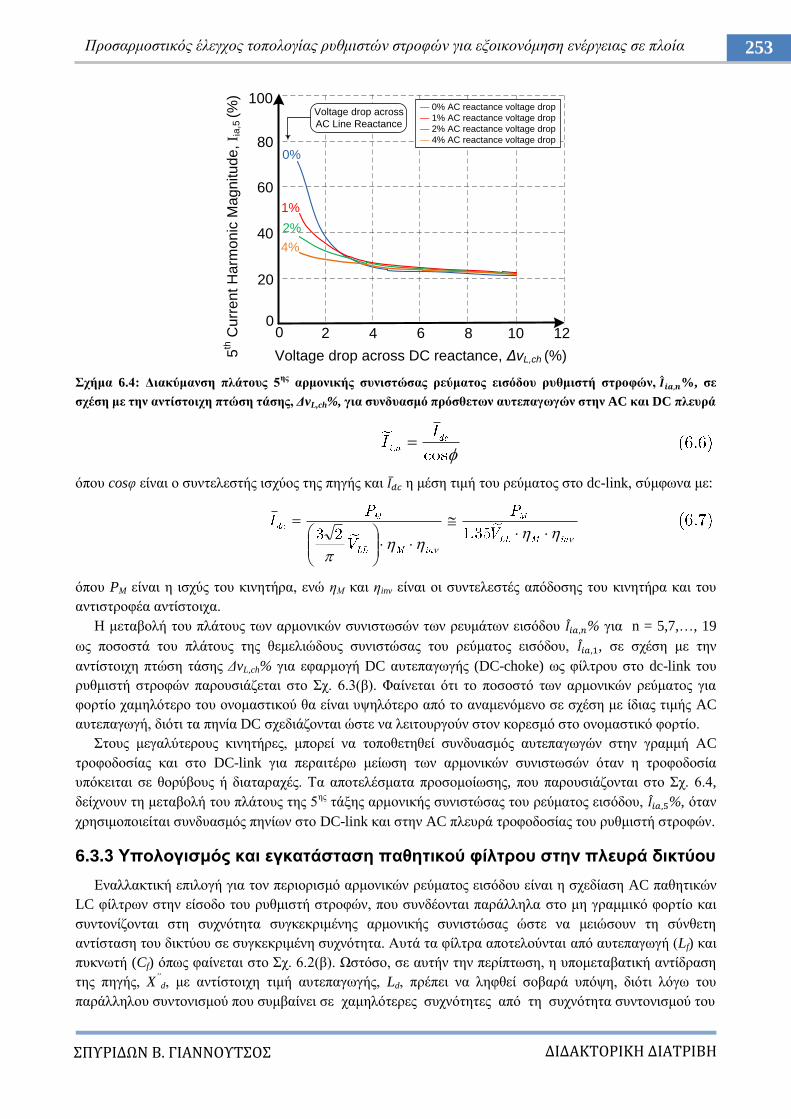
ΔΙΔΑΚΣΟΡΙΚΗ ΔΙΑΣΡΙΒΗ
ΠΤΡΙΔΩΝ Β. ΓΙΑΝΝΟΤΣΟ
253 Πξνζαξκνζηηθόο έιεγρνο ηνπνινγίαο ξπζκηζηώλ ζηξνθώλ γηα εμνηθνλόκεζε ελέξγεηαο ζε πινία
ρήκα 6.4: Γηαθύκαλζε πιάηνπο 5εο
αξκνληθήο ζπληζηώζαο ξεύκαηνο εηζόδνπ ξπζκηζηή ζηξνθώλ, %, ζε
ζρέζε κε ηελ αληίζηνηρε πηώζε ηάζεο, ΓvL,ch%, γηα ζπλδπαζκό πξόζζεησλ απηεπαγσγώλ ζηελ AC θαη DC πιεπξά
όπνπ cosθ είλαη ν ζπληειεζηήο ηζρύνο ηεο πεγήο θαη ε κέζε ηηκή ηνπ ξεύκαηνο ζην dc-link, ζύκθσλα κε:
όπνπ PM είλαη ε ηζρύο ηνπ θηλεηήξα, ελώ εΜ θαη εinv είλαη νη ζπληειεζηέο απόδνζεο ηνπ θηλεηήξα θαη ηνπ
αληηζηξνθέα αληίζηνηρα.
Ζ κεηαβνιή ηνπ πιάηνπο ησλ αξκνληθώλ ζπληζησζώλ ησλ ξεπκάησλ εηζόδνπ % γηα n = 5,7,…, 19
σο πνζνζηά ηνπ πιάηνπο ηεο ζεκειηώδνπο ζπληζηώζαο ηνπ ξεύκαηνο εηζόδνπ, , ζε ζρέζε κε ηελ
αληίζηνηρε πηώζε ηάζεο ΓvL,ch% γηα εθαξκνγή DC απηεπαγσγήο (DC-choke) σο θίιηξνπ ζην dc-link ηνπ
ξπζκηζηή ζηξνθώλ παξνπζηάδεηαη ζην ρ. 6.3(β). Φαίλεηαη όηη ην πνζνζηό ησλ αξκνληθώλ ξεύκαηνο γηα
θνξηίν ρακειόηεξν ηνπ νλνκαζηηθνύ ζα είλαη πςειόηεξν από ην αλακελόκελν ζε ζρέζε κε ίδηαο ηηκήο AC
απηεπαγσγή, δηόηη ηα πελία DC ζρεδηάδνληαη ώζηε λα ιεηηνπξγνύλ ζηνλ θνξεζκό ζην νλνκαζηηθό θνξηίν.
ηνπο κεγαιύηεξνπο θηλεηήξεο, κπνξεί λα ηνπνζεηεζεί ζπλδπαζκόο απηεπαγσγώλ ζηελ γξακκή ΑC
ηξνθνδνζίαο θαη ζην DC-link γηα πεξαηηέξσ κείσζε ησλ αξκνληθώλ ζπληζησζώλ όηαλ ε ηξνθνδνζία
ππόθεηηαη ζε ζνξύβνπο ή δηαηαξαρέο. Σα απνηειέζκαηα πξνζνκνίσζεο, πνπ παξνπζηάδνληαη ζην ρ. 6.4,
δείρλνπλ ηε κεηαβνιή ηνπ πιάηνπο ηεο 5εο
ηάμεο αξκνληθήο ζπληζηώζαο ηνπ ξεύκαηνο εηζόδνπ, %, όηαλ
ρξεζηκνπνηείηαη ζπλδπαζκόο πελίσλ ζην DC-link θαη ζηελ AC πιεπξά ηξνθνδνζίαο ηνπ ξπζκηζηή ζηξνθώλ.
6.3.3 Τπνινγηζκόο θαη εγθαηάζηαζε παζεηηθνύ θίιηξνπ ζηελ πιεπξά δηθηύνπ
Δλαιιαθηηθή επηινγή γηα ηνλ πεξηνξηζκό αξκνληθώλ ξεύκαηνο εηζόδνπ είλαη ε ζρεδίαζε AC παζεηηθώλ
LC θίιηξσλ ζηελ είζνδν ηνπ ξπζκηζηή ζηξνθώλ, πνπ ζπλδένληαη παξάιιεια ζην κε γξακκηθό θνξηίν θαη
ζπληνλίδνληαη ζηε ζπρλόηεηα ζπγθεθξηκέλεο αξκνληθήο ζπληζηώζαο ώζηε λα κεηώζνπλ ηε ζύλζεηε
αληίζηαζε ηνπ δηθηύνπ ζε ζπγθεθξηκέλε ζπρλόηεηα. Απηά ηα θίιηξα απνηεινύληαη από απηεπαγσγή (Lf) θαη
ππθλσηή (Cf) όπσο θαίλεηαη ζην ρ. 6.2(β). Χζηόζν, ζε απηήλ ηελ πεξίπησζε, ε ππνκεηαβαηηθή αληίδξαζε
ηεο πεγήο, X”
d, κε αληίζηνηρε ηηκή απηεπαγσγήο, Ld, πξέπεη λα ιεθζεί ζνβαξά ππόςε, δηόηη ιόγσ ηνπ
παξάιιεινπ ζπληνληζκνύ πνπ ζπκβαίλεη ζε ρακειόηεξεο ζπρλόηεηεο από ηε ζπρλόηεηα ζπληνληζκνύ ηνπ
0
20
40
60
80
100
5th C
urr
en
t H
arm
on
ic M
ag
nitu
de
, I i
a,5
(%
)
0 2 4 6 8 10 12
0%
1%
2%
4%
— 0% AC reactance voltage drop
— 1% AC reactance voltage drop
— 2% AC reactance voltage drop
— 4% AC reactance voltage drop
Voltage drop across
AC Line Reactance
Voltage drop across DC reactance, ΔvL,ch (%)
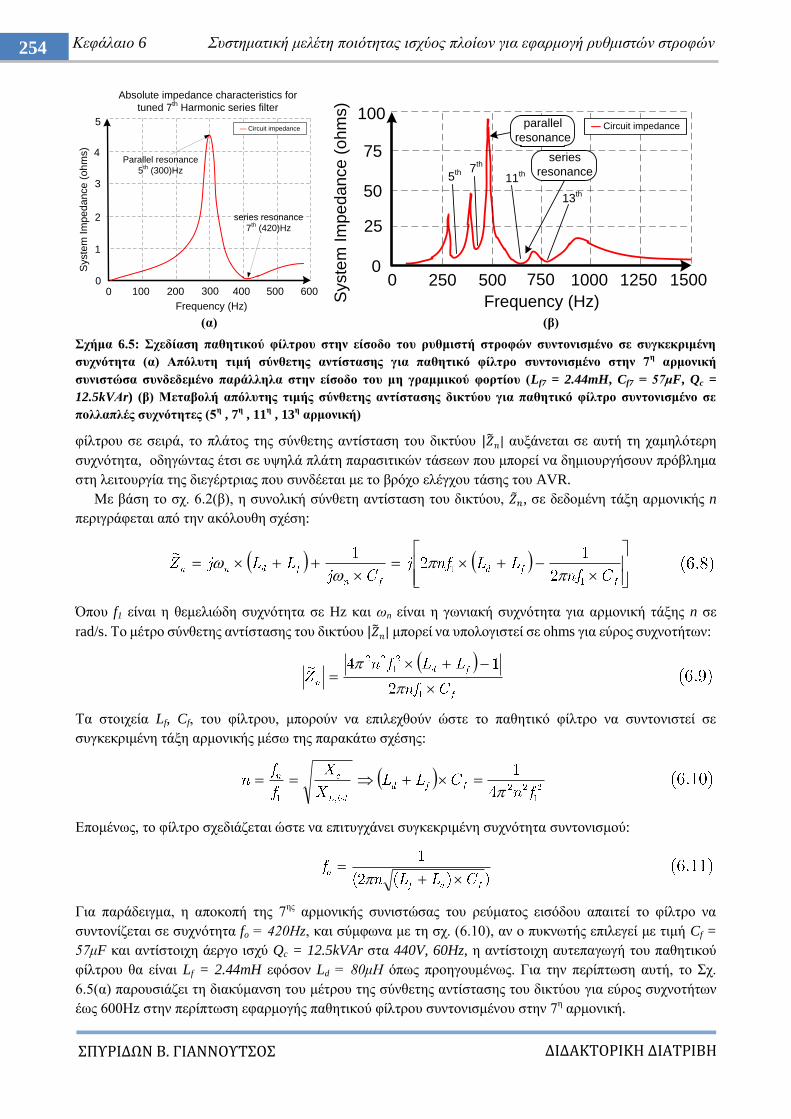
ΔΙΔΑΚΣΟΡΙΚΗ ΔΙΑΣΡΙΒΗ
ΠΤΡΙΔΩΝ Β. ΓΙΑΝΝΟΤΣΟ
254 Κεθάιαην 6 πζηεκαηηθή κειέηε πνηόηεηαο ηζρύνο πινίσλ γηα εθαξκνγή ξπζκηζηώλ ζηξνθώλ
(α) (β)
ρήκα 6.5: ρεδίαζε παζεηηθνύ θίιηξνπ ζηελ είζνδν ηνπ ξπζκηζηή ζηξνθώλ ζπληνληζκέλν ζε ζπγθεθξηκέλε
ζπρλόηεηα (α) Απόιπηε ηηκή ζύλζεηεο αληίζηαζεο γηα παζεηηθό θίιηξν ζπληνληζκέλν ζηελ 7ε αξκνληθή
ζπληζηώζα ζπλδεδεκέλν παξάιιεια ζηελ είζνδν ηνπ κε γξακκηθνύ θνξηίνπ (Lf7 = 2.44mH, Cf7 = 57κF, Qc =
12.5kVΑr) (β) Μεηαβνιή απόιπηεο ηηκήο ζύλζεηεο αληίζηαζεο δηθηύνπ γηα παζεηηθό θίιηξν ζπληνληζκέλν ζε
πνιιαπιέο ζπρλόηεηεο (5ε , 7
ε , 11
ε , 13
ε αξκνληθή)
θίιηξνπ ζε ζεηξά, ην πιάηνο ηεο ζύλζεηεο αληίζηαζε ηνπ δηθηύνπ απμάλεηαη ζε απηή ηε ρακειόηεξε
ζπρλόηεηα, νδεγώληαο έηζη ζε πςειά πιάηε παξαζηηηθώλ ηάζεσλ πνπ κπνξεί λα δεκηνπξγήζνπλ πξόβιεκα
ζηε ιεηηνπξγία ηεο δηεγέξηξηαο πνπ ζπλδέεηαη κε ην βξόρν ειέγρνπ ηάζεο ηνπ AVR.
Με βάζε ην ζρ. 6.2(β), ε ζπλνιηθή ζύλζεηε αληίζηαζε ηνπ δηθηύνπ, , ζε δεδνκέλε ηάμε αξκνληθήο n
πεξηγξάθεηαη από ηελ αθόινπζε ζρέζε:
Όπνπ f1 είλαη ε ζεκειηώδε ζπρλόηεηα ζε Hz θαη σn είλαη ε γσληαθή ζπρλόηεηα γηα αξκνληθή ηάμεο n ζε
rad/s. Σν κέηξν ζύλζεηεο αληίζηαζεο ηνπ δηθηύνπ κπνξεί λα ππνινγηζηεί ζε ohms γηα εύξνο ζπρλνηήησλ:
Σα ζηνηρεία Lf, Cf, ηνπ θίιηξνπ, κπνξνύλ λα επηιερζνύλ ώζηε ην παζεηηθό θίιηξν λα ζπληνληζηεί ζε
ζπγθεθξηκέλε ηάμε αξκνληθήο κέζσ ηεο παξαθάησ ζρέζεο:
Δπνκέλσο, ην θίιηξν ζρεδηάδεηαη ώζηε λα επηηπγράλεη ζπγθεθξηκέλε ζπρλόηεηα ζπληνληζκνύ:
Γηα παξάδεηγκα, ε απνθνπή ηεο 7εο
αξκνληθήο ζπληζηώζαο ηνπ ξεύκαηνο εηζόδνπ απαηηεί ην θίιηξν λα
ζπληνλίδεηαη ζε ζπρλόηεηα fo = 420Ζz, θαη ζύκθσλα κε ηε ζρ. (6.10), αλ ν ππθλσηήο επηιεγεί κε ηηκή Cf =
57κF θαη αληίζηνηρε άεξγν ηζρύ Qc = 12.5kVAr ζηα 440V, 60Hz, ε αληίζηνηρε απηεπαγσγή ηνπ παζεηηθνύ
θίιηξνπ ζα είλαη Lf = 2.44mH εθόζνλ Ld = 80κΖ όπσο πξνεγνπκέλσο. Γηα ηελ πεξίπησζε απηή, ην ρ.
6.5(α) παξνπζηάδεη ηε δηαθύκαλζε ηνπ κέηξνπ ηεο ζύλζεηεο αληίζηαζεο ηνπ δηθηύνπ γηα εύξνο ζπρλνηήησλ
έσο 600Ζz ζηελ πεξίπησζε εθαξκνγήο παζεηηθνύ θίιηξνπ ζπληνληζκέλνπ ζηελ 7ε αξκνληθή.
Frequency (Hz)
Syste
m Im
pe
da
nce
(o
hm
s)
100 200 300 4000 500
Parallel resonance
5th (300)Hz
series resonance
7th (420)Hz
1
2
3
4
5
0600
Absolute impedance characteristics for
tuned 7th Harmonic series filter
— Circuit impedance
250 500 750 100000
25
50
75
100
15001250
Frequency (Hz)
5th 7
th
11th
13th
Syste
m Im
pe
da
nce
(o
hm
s)
— Circuit impedanceparallel
resonance
series
resonance
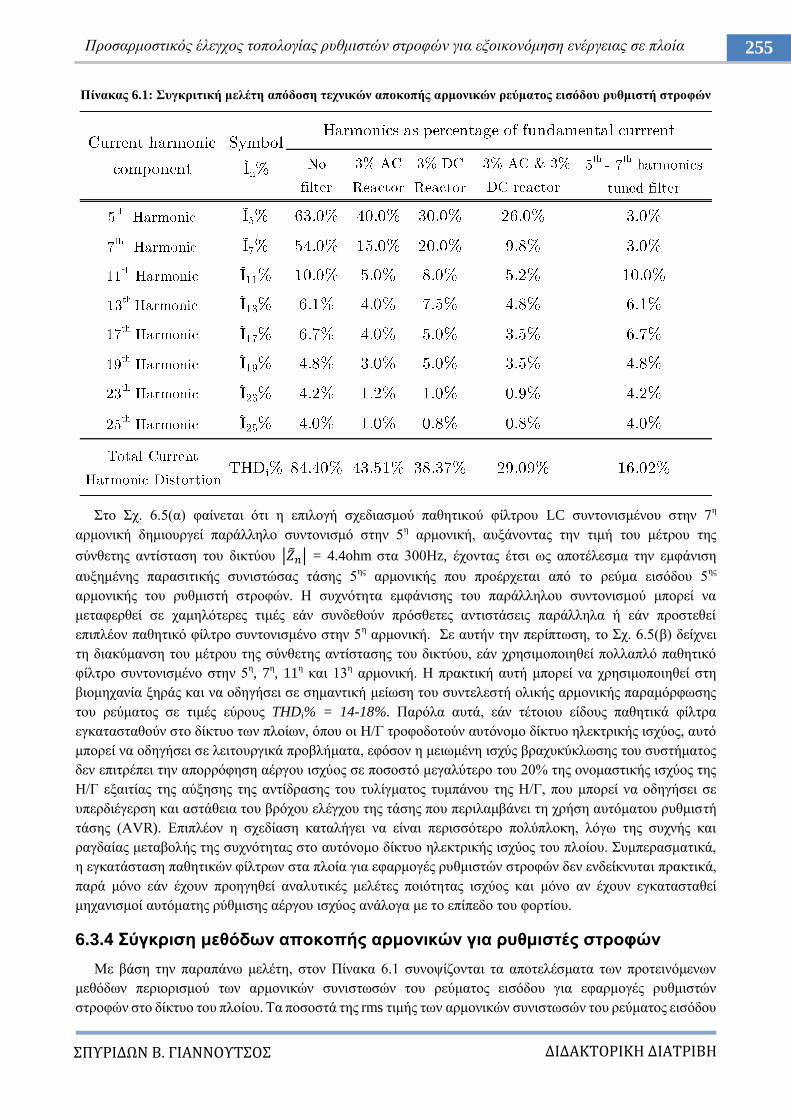
ΔΙΔΑΚΣΟΡΙΚΗ ΔΙΑΣΡΙΒΗ
ΠΤΡΙΔΩΝ Β. ΓΙΑΝΝΟΤΣΟ
255 Πξνζαξκνζηηθόο έιεγρνο ηνπνινγίαο ξπζκηζηώλ ζηξνθώλ γηα εμνηθνλόκεζε ελέξγεηαο ζε πινία
Πίλαθαο 6.1: πγθξηηηθή κειέηε απόδνζε ηερληθώλ απνθνπήο αξκνληθώλ ξεύκαηνο εηζόδνπ ξπζκηζηή ζηξνθώλ
ην ρ. 6.5(α) θαίλεηαη όηη ε επηινγή ζρεδηαζκνύ παζεηηθνύ θίιηξνπ LC ζπληνληζκέλνπ ζηελ 7ε
αξκνληθή δεκηνπξγεί παξάιιειν ζπληνληζκό ζηελ 5ε αξκνληθή, απμάλνληαο ηελ ηηκή ηνπ κέηξνπ ηεο
ζύλζεηεο αληίζηαζε ηνπ δηθηύνπ | | = 4.4ohm ζηα 300Ζz, έρνληαο έηζη σο απνηέιεζκα ηελ εκθάληζε
απμεκέλεο παξαζηηηθήο ζπληζηώζαο ηάζεο 5εο
αξκνληθήο πνπ πξνέξρεηαη από ην ξεύκα εηζόδνπ 5εο
αξκνληθήο ηνπ ξπζκηζηή ζηξνθώλ. Ζ ζπρλόηεηα εκθάληζεο ηνπ παξάιιεινπ ζπληνληζκνύ κπνξεί λα
κεηαθεξζεί ζε ρακειόηεξεο ηηκέο εάλ ζπλδεζνύλ πξόζζεηεο αληηζηάζεηο παξάιιεια ή εάλ πξνζηεζεί
επηπιένλ παζεηηθό θίιηξν ζπληνληζκέλν ζηελ 5ε αξκνληθή. ε απηήλ ηελ πεξίπησζε, ην ρ. 6.5(β) δείρλεη
ηε δηαθύκαλζε ηνπ κέηξνπ ηεο ζύλζεηεο αληίζηαζεο ηνπ δηθηύνπ, εάλ ρξεζηκνπνηεζεί πνιιαπιό παζεηηθό
θίιηξν ζπληνληζκέλν ζηελ 5ε, 7
ε, 11
ε θαη 13
ε αξκνληθή. Ζ πξαθηηθή απηή κπνξεί λα ρξεζηκνπνηεζεί ζηε
βηνκεραλία μεξάο θαη λα νδεγήζεη ζε ζεκαληηθή κείσζε ηνπ ζπληειεζηή νιηθήο αξκνληθήο παξακόξθσζεο
ηνπ ξεύκαηνο ζε ηηκέο εύξνπο THDi% = 14-18%. Παξόια απηά, εάλ ηέηνηνπ είδνπο παζεηηθά θίιηξα
εγθαηαζηαζνύλ ζην δίθηπν ησλ πινίσλ, όπνπ νη Ζ/Γ ηξνθνδνηνύλ απηόλνκν δίθηπν ειεθηξηθήο ηζρύνο, απηό
κπνξεί λα νδεγήζεη ζε ιεηηνπξγηθά πξνβιήκαηα, εθόζνλ ε κεησκέλε ηζρύο βξαρπθύθισζεο ηνπ ζπζηήκαηνο
δελ επηηξέπεη ηελ απνξξόθεζε αέξγνπ ηζρύνο ζε πνζνζηό κεγαιύηεξν ηνπ 20% ηεο νλνκαζηηθήο ηζρύνο ηεο
Ζ/Γ εμαηηίαο ηεο αύμεζεο ηεο αληίδξαζεο ηνπ ηπιίγκαηνο ηπκπάλνπ ηεο Ζ/Γ, πνπ κπνξεί λα νδεγήζεη ζε
ππεξδηέγεξζε θαη αζηάζεηα ηνπ βξόρνπ ειέγρνπ ηεο ηάζεο πνπ πεξηιακβάλεη ηε ρξήζε απηόκαηνπ ξπζκηζηή
ηάζεο (ΑVR). Δπηπιένλ ε ζρεδίαζε θαηαιήγεη λα είλαη πεξηζζόηεξν πνιύπινθε, ιόγσ ηεο ζπρλήο θαη
ξαγδαίαο κεηαβνιήο ηεο ζπρλόηεηαο ζην απηόλνκν δίθηπν ειεθηξηθήο ηζρύνο ηνπ πινίνπ. πκπεξαζκαηηθά,
ε εγθαηάζηαζε παζεηηθώλ θίιηξσλ ζηα πινία γηα εθαξκνγέο ξπζκηζηώλ ζηξνθώλ δελ ελδείθλπηαη πξαθηηθά,
παξά κόλν εάλ έρνπλ πξνεγεζεί αλαιπηηθέο κειέηεο πνηόηεηαο ηζρύνο θαη κόλν αλ έρνπλ εγθαηαζηαζεί
κεραληζκνί απηόκαηεο ξύζκηζεο αέξγνπ ηζρύνο αλάινγα κε ην επίπεδν ηνπ θνξηίνπ.
6.3.4 ύγθξηζε κεζόδσλ απνθνπήο αξκνληθώλ γηα ξπζκηζηέο ζηξνθώλ
Με βάζε ηελ παξαπάλσ κειέηε, ζηνλ Πίλαθα 6.1 ζπλνςίδνληαη ηα απνηειέζκαηα ησλ πξνηεηλόκελσλ
κεζόδσλ πεξηνξηζκνύ ησλ αξκνληθώλ ζπληζησζώλ ηνπ ξεύκαηνο εηζόδνπ γηα εθαξκνγέο ξπζκηζηώλ
ζηξνθώλ ζην δίθηπν ηνπ πινίνπ. Σα πνζνζηά ηεο rms ηηκήο ησλ αξκνληθώλ ζπληζησζώλ ηνπ ξεύκαηνο εηζόδνπ
ΔΙΔΑΚΣΟΡΙΚΗ ΔΙΑΣΡΙΒΗ
ΠΤΡΙΔΩΝ Β. ΓΙΑΝΝΟΤΣΟ
256 Κεθάιαην 6 πζηεκαηηθή κειέηε πνηόηεηαο ηζρύνο πινίσλ γηα εθαξκνγή ξπζκηζηώλ ζηξνθώλ
Πίλαθαο 6.2: πγθξηηηθά θόζηε ηερληθώλ απνθνπήο αξκνληθώλ ζε ζρέζε κε ην θόζηνο ηνπ ξπζκηζηή ζηξνθώλ
ηνπ ξπζκηζηή ζηξνθώλ, , πνπ εκθαλίδνληαη κε ηελ θάζε ηερληθή πεξηνξηζκνύ θαη θηιηξαξίζκαηνο ησλ
αξκνληθώλ, ρξεζηκνπνηνύληαη σο παξάκεηξνη ζηελ πξνηεηλόκελε κεζνδνινγία πξνζδηνξηζκνύ πνηόηεηαο
ηζρύνο πνπ πεξηγξάθεηαη ζηελ επόκελε παξάγξαθν, ε νπνία νδεγεί ζηε ζπζηεκαηηθή επηινγή ζρεδίαζεο
θίιηξσλ όηαλ ξπζκηζηέο ζηξνθώλ εθαξκόδνληαη ζην δίθηπν ησλ πινίσλ, κε ζθνπό ηε ζπκκόξθσζε κε ηα
όξηα αξκνληθώλ πνπ ζεζπίδνληαη ζηνπο θαλνληζκνύο ησλ λενγλσκόλσλ. Σα ζρεηηθά θόζηε ηεο θάζε
ζρεδηαζηηθήο επηινγήο ζπγθξίλνληαη κε ην θόζηνο ηνπ αληηζηνηρνπ ξπζκηζηή ζηξνθώλ ζηνλ Πίλαθα 6.2.
6.4 Πποηεινόμενη μεθοδολογία πποζδιοπιζμού ποιόηηηαρ ιζσύορ πλοίος
Καηά ηε δηάξθεηα ηνπ ζηαδίνπ ζρεδίαζεο ηεο εθαξκνγήο ξπζκηζηώλ ζηξνθώλ σο κεηαζθεπή (retrofit)
ζην ππάξρνλ δίθηπν ηζρύνο, είλαη απαξαίηεηε ε δηεμαγσγή κειέηεο πνηόηεηαο ηζρύνο γηα ηνλ πξνζδηνξηζκό
ηνπ επηπέδνπ ηεο παξακόξθσζεο ηεο ηάζεο ζην ζεκείν θνηλήο ζύλδεζεο (PCC), ώζηε λα δηαζθαιηζζεί όηη ν
ζρεδηαζκόο είλαη ζπκβαηόο κε ηα όξηα πνπ ζεζπίδνληαη από ηνπο λενγλώκνλεο. Δηδηθόηεξα, ζύκθσλα κε ην
κέξνο 4, θεθάιαην 8, εδάθην 2, παξάγξαθνο 7.21 ησλ θαλνληζκώλ ηνπ ακεξηθάληθνπ λενγλώκνλα (American
Bureau of Shipping – ABS) ν ζπληειεζηήο ζπλνιηθήο αξκνληθήο παξακόξθσζεο ηεο ηάζεο (THDv%) δελ
πξέπεη λα ππεξβαίλεη ην 5% ζην PCC θαη ην πνζνζηό ηεο rms ηηκήο ηνπ πιάηνπο ηεο θάζε αξκνληθήο
ζπληζηώζαο έσο ηελ 25ε, , δελ πξέπεη λα ππεξβαίλεη ην 3% ζε ζρέζε κε ηε ζεκειηώδε αξκνληθή [30].
Ζ πξνηεηλόκελε κεζνδνινγία αλάιπζεο θαη επνπηείαο πνηόηεηαο ηζρύνο παξνπζηάδεηαη ζην ρ. 6.6 κε
αλαθνξά ζην ειεθηξηθό δίθηπν δηαλνκήο ηζρύνο ηνπ ηππηθνύ πινίνπ ππό κειέηε, γηα ηελ πεξίπησζε όπνπ
εθαξκόδνληαη πξόζζεηνη ξπζκηζηέο ζηξνθώλ ηεο ηνπνινγία ηνπ ρ. 6.2(β) ζηνπο θηλεηήξεο πνπ νδεγνύλ
ηνπο θηλεηήξεο εμαεξηζκνύ ηνπ κεραλνζηαζίνπ θαη ηηο αληιίεο παξνρήο ζαιαζζηλνύ λεξνύ κε ζθνπό ηελ
ελεξγεηαθή βειηηζηνπνίεζε ηνπ ηζνδπγίνπ ηζρύνο. Σν PCC ζπλίζηαηαη ζηνλ δπγό ζύλδεζεο 450Vac ηξηώλ
όκνησλ Ζ/Γ, κε ίδηα ηηκή θαηλόκελεο ηζρύνο, Si [kVA], ίδηα rms ηηκή ξεύκαηνο θνξηίνπ, [A], θαη
ππνκεηαβαηηθήο αληίδξαζεο, Υ”
d,i [%]. Απν ην δπγό απηό ηξνθνδνηνύληαη νη πξόζζεηνη ξπζκηζηέο ζηξνθώλ.
Ζ θαηλόκελε ηζρύο κηαο Ζ/Γ επηιέγεηαη σο ηζρύο βάζεο ηνπ ζπζηήκαηνο (Sbase = Si). ύκθσλα κε ηε
κειέηε ηζνδπγίνπ ηζρύνο, ηελ πεξίνδν πιεύζεο κε νλνκαζηηθή ηαρύηεηα θαη ηελ πεξίνδν εθθόξησζεο δύν
Ζ/Γ είλαη ζπλδεδεκέλεο παξάιιεια ιόγσ κέγηζηνπ θνξηίνπ πνπ πεξηιακβάλεη θαη ηα κε γξακκηθά θνξηία
ζηα νπνία εθαξκόδνληαη ξπζκηζηέο ζηξνθώλ. Ζ ηζνδύλακε ππνκεηαβαηηθή αληίδξαζε ππνινγίδεηαη σο εμήο:
Ζ ηζρύο βξαρπθύθισζεο ζην PCC, Ssc, ζηε ζπλέρεηα ππνινγίδεηαη γηα ηε δεδνκέλε θαηάζηαζε ιεηηνπξγίαο:
H rms ηηκή ηνπ ξεύκαηνο βξαρπθύθισζεο ζην PCC, , κπνξεί ζηε ζπλέρεηα λα ππνινγηζηεί σο εμήο:
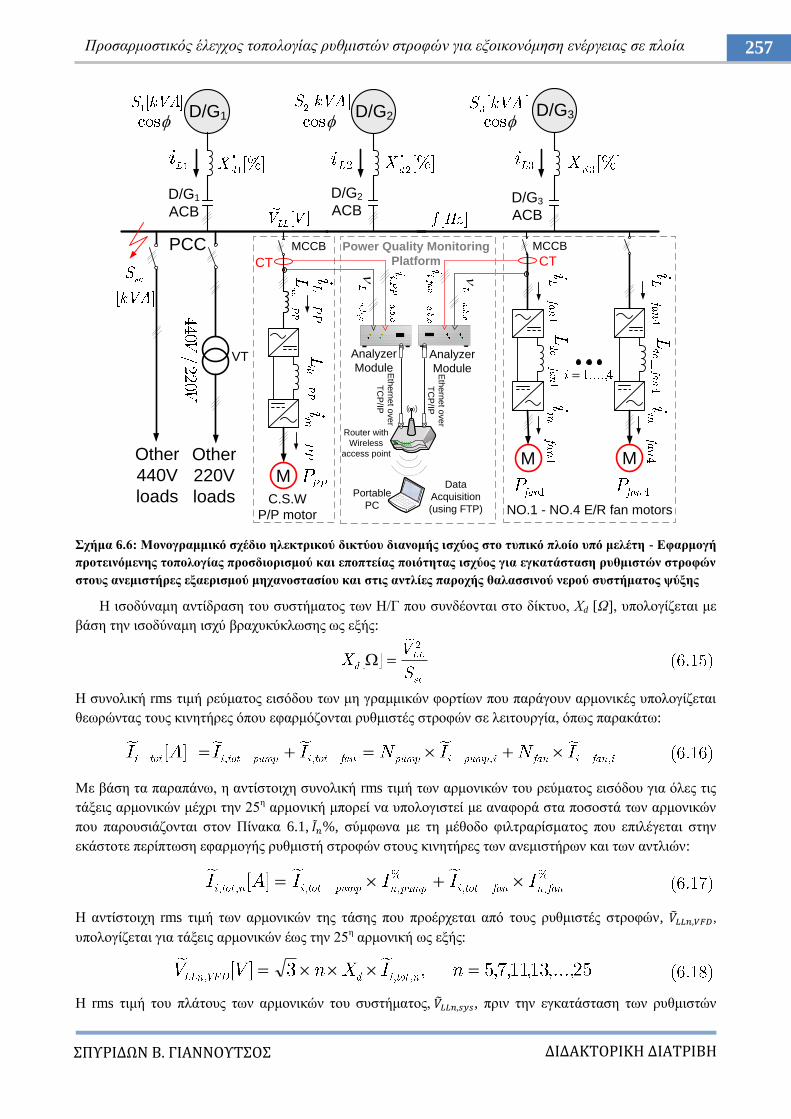
ΔΙΔΑΚΣΟΡΙΚΗ ΔΙΑΣΡΙΒΗ
ΠΤΡΙΔΩΝ Β. ΓΙΑΝΝΟΤΣΟ
257 Πξνζαξκνζηηθόο έιεγρνο ηνπνινγίαο ξπζκηζηώλ ζηξνθώλ γηα εμνηθνλόκεζε ελέξγεηαο ζε πινία
ρήκα 6.6: Μνλνγξακκηθό ζρέδην ειεθηξηθνύ δηθηύνπ δηαλνκήο ηζρύνο ζην ηππηθό πινίν ππό κειέηε - Δθαξκνγή
πξνηεηλόκελεο ηνπνινγίαο πξνζδηνξηζκνύ θαη επνπηείαο πνηόηεηαο ηζρύνο γηα εγθαηάζηαζε ξπζκηζηώλ ζηξνθώλ
ζηνπο αλεκηζηήξεο εμαεξηζκνύ κεραλνζηαζίνπ θαη ζηηο αληιίεο παξνρήο ζαιαζζηλνύ λεξνύ ζπζηήκαηνο ςύμεο
Ζ ηζνδύλακε αληίδξαζε ηνπ ζπζηήκαηνο ησλ Ζ/Γ πνπ ζπλδένληαη ζην δίθηπν, Υd [Ω], ππνινγίδεηαη κε
βάζε ηελ ηζνδύλακε ηζρύ βξαρπθύθισζεο σο εμήο:
Ζ ζπλνιηθή rms ηηκή ξεύκαηνο εηζόδνπ ησλ κε γξακκηθώλ θνξηίσλ πνπ παξάγνπλ αξκνληθέο ππνινγίδεηαη
ζεσξώληαο ηνπο θηλεηήξεο όπνπ εθαξκόδνληαη ξπζκηζηέο ζηξνθώλ ζε ιεηηνπξγία, όπσο παξαθάησ:
Με βάζε ηα παξαπάλσ, ε αληίζηνηρε ζπλνιηθή rms ηηκή ησλ αξκνληθώλ ηνπ ξεύκαηνο εηζόδνπ γηα όιεο ηηο
ηάμεηο αξκνληθώλ κέρξη ηελ 25ε αξκνληθή κπνξεί λα ππνινγηζηεί κε αλαθνξά ζηα πνζνζηά ησλ αξκνληθώλ
πνπ παξνπζηάδνληαη ζηνλ Πίλαθα 6.1, %, ζύκθσλα κε ηε κέζνδν θηιηξαξίζκαηνο πνπ επηιέγεηαη ζηελ
εθάζηνηε πεξίπησζε εθαξκνγήο ξπζκηζηή ζηξνθώλ ζηνπο θηλεηήξεο ησλ αλεκηζηήξσλ θαη ησλ αληιηώλ:
Ζ αληίζηνηρε rms ηηκή ησλ αξκνληθώλ ηεο ηάζεο πνπ πξνέξρεηαη από ηνπο ξπζκηζηέο ζηξνθώλ, ,
ππνινγίδεηαη γηα ηάμεηο αξκνληθώλ έσο ηελ 25ε αξκνληθή σο εμήο:
Ζ rms ηηκή ηνπ πιάηνπο ησλ αξκνληθώλ ηνπ ζπζηήκαηνο, , πξηλ ηελ εγθαηάζηαζε ησλ ξπζκηζηώλ
D/G1
D/G2
ACBD/G3
ACB
PCC
D/G2 D/G3
D/G1
ACB
Other
440V
loads
Other
220V
loadsM
M M
NO.1 - NO.4 E/R fan motors
C.S.W
P/P motor
CT
Analyzer
ModuleAnalyzer
Module
CT
MCCB MCCB
VT
Eth
ern
et o
ve
r
TC
P/IP
Eth
ern
et o
ve
r
TC
P/IP
Router with
Wireless
access point
Data
Acquisition
(using FTP)
Portable
PC
Power Quality Monitoring
Platform
ΔΙΔΑΚΣΟΡΙΚΗ ΔΙΑΣΡΙΒΗ
ΠΤΡΙΔΩΝ Β. ΓΙΑΝΝΟΤΣΟ
258 Κεθάιαην 6 πζηεκαηηθή κειέηε πνηόηεηαο ηζρύνο πινίσλ γηα εθαξκνγή ξπζκηζηώλ ζηξνθώλ
ζηξνθώλ, ιακβάλνληαη κε κεηξήζεηο πνηόηεηαο ηζρύνο πνπ πξαγκαηνπνηνύληαη πξηλ ηελ εγθαηάζηαζε ησλ
ξπζκηζηώλ. Δπνκέλσο, ε rms ηηκή ησλ ζπλνιηθώλ αξκνληθώλ ηάζεο ζην PCC γηα θάζε ζπρλόηεηα ζα είλαη:
Σα αληίζηνηρα πνζνζηά αξκνληθώλ κε αλαθνξά ζηε ζεκειηώδε ζπλρόηεηα ηεο πνιηθήο ηάζεο ηνπ PCC, ,
ππνινγίδνληαη ώζηε λα ζπγθξηζνύλ κε ηα όξηα πνπ δηέπνπλ νη λενγλώκνλεο ζύκθσλα κε ηελ παξαθάησ ζρέζε:
Ο ζπληειεζηήο ζπλνιηθήο αξκνληθήο παξακόξθσζεο ηεο ηάζεο (ΣΖDv%), ππνινγίδεηαη ζηε ζπλέρεηα θαη
ζπγθξίλεηαη επίζεο κε ηηο απαηηήζεηο ησλ θαλνληζκώλ:
∑
Eθόζνλ νη ππνινγηζκνί γίλνληαη γηα ηε ρεηξόηεξε πεξίπησζε ιεηηνπξγίαο από άπνςε έγρπζεο αξκνληθώλ
ζην δίθηπν, όπνπ νη θηλεηήξεο πνπ νδεγνύληαη από ξπζκηζηέο ζηξνθώλ ιεηηνπξγνύλ ζην 100% ησλ
νλνκαζηηθώλ ζηξνθώλ (60Ζz), νη ηηκέο πιάηνπο ησλ αξκνληθώλ ζπληζησζώλ ζα βξίζθνληαη θάησ από ηα
πξνβιεπόκελα όξηα θαζόιεο ηηο πεξηόδνπο ιεηηνπξγίαο ηνπ πινίνπ. Δάλ κεηά από ηνπο ππνινγηζκνύο, νη
πξνθύπηνπζεο ηηκέο δε ζπκκνξθώλνληαη κε ηα όξηα ησλ θαλνληζκώλ, ζα πξέπεη λα επηιερζεί δηαθνξεηηθή
κέζνδνο απνθνπήο ζύκθσλα κε ηνλ Πίλαθα 6.1 θαη νη ππνινγηζκνί ζα ρξεηαζηεί λα επαλαιεθζνύλ.
Γηα λα δηαζθαιηζζεί όηη ε πνηόηεηα ηζρύνο ζην PCC κε βάζε ηελ πξνηεηλόκελε κεζνδνινγία είλαη
πάληνηε εληόο πξνβιεπόκελσλ νξίσλ, πινπνηείηαη ηνπνινγία κέηξεζεο θαη επνπηείαο πνηόηεηαο ηζρύνο κε
ιήςε θαη επεμεξγαζία κεηξήζεσλ ζε πξαγκαηηθό ρξόλν, όπσο παξνπζηάδεηαη ζην ρ. 6.6. Ζ ηνπνινγία
πεξηιακβάλεη αλαιπηέο πνηόηεηαο ηζρύνο πνπ ιακβάλνπλ κεηξήζεηο ηάζεο θαη ζπρλόηεηαο ζε πξαγκαηηθό
ρξόλν, νη νπνίνη ηνπνζεηνύληαη κεηά από ηνπο δηαθόπηεο ηζρύνο πνπ ηξνθνδνηνύλ ηνπο ξπζκηζηέο ζηξνθώλ.
Οη αλαιπηέο ΔLSPEC G4430 [31], επηθνηλσλνύλ κε δξνκνινγεηέο (access points) ρξεζηκνπνηώληαο Ethernet
ζε TCP/IP. Ο ππνινγηζηήο ιήςεο δεδνκέλσλ, ιεηηνπξγεί σο δηαθνκηζηήο ν νπνίνο ζπγρξνλίδεηαη κε ηνπο
αλαιπηέο. Απηό επηηξέπεη ηελ θαηαγξαθή ησλ δεδνκέλσλ πνπ πξνέξρνληαη από δηαθνξεηηθνύο αλαιπηέο ζε
θνηλή ρξνληθή θιίκαθα, ώζηε λα δηεπθνιύλεηαη ε αλάιπζε κε επεμεξγαζία πξηλ θαη κεηά από έλα γεγνλόο.
6.5 Δθαπμογή πποηεινόμενηρ μεθοδολογίαρ ζηο πλοίο ςπό μελέηη
Ζ πξνηεηλόκελε κεζνδνινγία εθαξκόδεηαη θαηά ηε δηάξθεηα ηνπ ζρεδηαζκνύ ηεο εγθαηάζηαζεο ησλ
ξπζκηζηώλ ζηξνθώλ ζηνπο θηλεηήξεο πνπ νδεγνύλ ηνπο ηέζζεξηο (4) αλεκηζηήξεο εμαεξηζκνύ κεραλνζηαζίνπ
(Pfan = 18.5kW, i_fan,i = 33.6A, =450V, f = 60Hz) θαη ηελ αληιία παξνρήο ζαιαζζηλνύ λεξνύ (Ppump =
75kW, i_pump,i = 129.1A, =450V, f = 60Hz) ζην πινίν ππό κειέηε κε βάζε ηελ ηνπνινγία ηνπ ρ. 6.6. Οη
ζπληειεζηέο απόδνζεο ησλ θηλεηήξσλ ησλ αλεκηζηήξσλ εμαεξηζκνύ θαη ηεο αληιίαο παξνρήο ζαιαζζηλνύ
λεξνύ είλαη 0.9 θαη 0.95 αληίζηνηρα. Γηα ηνπο ξπζκηζηέο ζηξνθώλ ησλ αλεκηζηήξσλ επηιέγεηαη θίιηξν
πελίνπ απηεπαγσγήο Ldc,fan (dc – choke) ζην DC-link ηέηνηνπ κεγέζνπο ώζηε ΓvL,ch% = 3%, ελώ γηα ην
ξπζκηζηή ζηξνθώλ ησλ αληιηώλ ζαιαζζηλνύ λεξνύ επηιέγεηαη ε εγθαηάζηαζε ζπλδπαζκνύ θίιηξσλ κε
πελίν απηεπαγσγήο Lac,pump ζηελ πιεπξά ηξνθνδνζίαο AC ηνπ ξπζκηζηή θαη πελίν απηεπαγσγήο Ldc,pump ζην
DC-link κε ηέηνην κέγεζνο ώζηε ΓvL,ch% = 3% θαη γηα ηηο δύν πεξηπηώζεηο. Δθαξκόδνληαο ηηο ζρ. (6.4)-(6.5),
ε απηεπαγσγή κεγέζνπο 3% πνπ εγθαζίζηαηαη ζην DC-link ησλ ξπζκηζηώλ ζηξνθώλ ησλ αλεκηζηήξσλ
ππνινγίδεηαη ζηελ ηηκή Ldc,fan = 600κΖ, ελώ νη απηεπαγσγέο πνπ εγθαζίζηαληαη ζηελ AC θαη ηελ DC πιεπξά
ηνπ ξπζκηζηή ζηξνθώλ πνπ εθαξκόδεηαη ζηελ αληιία έρνπλ ηηκέο Lαc,pump = Ldc,pump = 150κΖ. Οη θηλεηήξεο
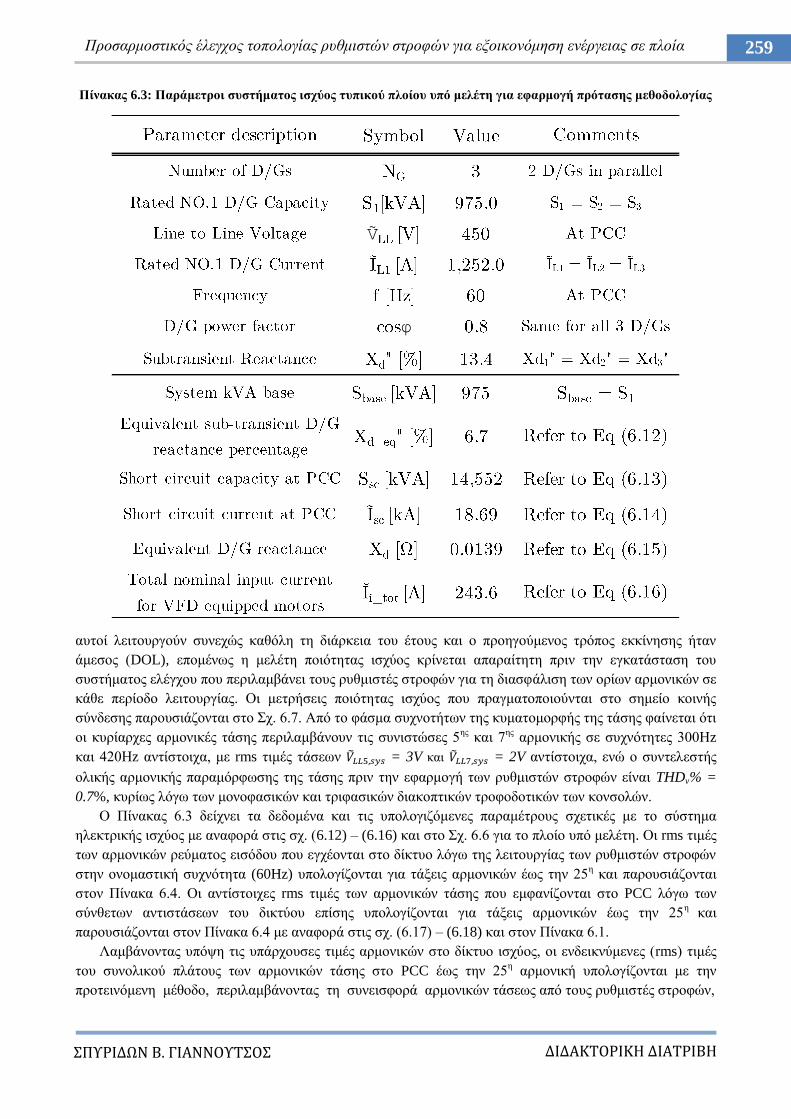
ΔΙΔΑΚΣΟΡΙΚΗ ΔΙΑΣΡΙΒΗ
ΠΤΡΙΔΩΝ Β. ΓΙΑΝΝΟΤΣΟ
259 Πξνζαξκνζηηθόο έιεγρνο ηνπνινγίαο ξπζκηζηώλ ζηξνθώλ γηα εμνηθνλόκεζε ελέξγεηαο ζε πινία
Πίλαθαο 6.3: Παξάκεηξνη ζπζηήκαηνο ηζρύνο ηππηθνύ πινίνπ ππό κειέηε γηα εθαξκνγή πξόηαζεο κεζνδνινγίαο
απηνί ιεηηνπξγνύλ ζπλερώο θαζόιε ηε δηάξθεηα ηνπ έηνπο θαη ν πξνεγνύκελνο ηξόπνο εθθίλεζεο ήηαλ
άκεζνο (DOL), επνκέλσο ε κειέηε πνηόηεηαο ηζρύνο θξίλεηαη απαξαίηεηε πξηλ ηελ εγθαηάζηαζε ηνπ
ζπζηήκαηνο ειέγρνπ πνπ πεξηιακβάλεη ηνπο ξπζκηζηέο ζηξνθώλ γηα ηε δηαζθάιηζε ησλ νξίσλ αξκνληθώλ ζε
θάζε πεξίνδν ιεηηνπξγίαο. Οη κεηξήζεηο πνηόηεηαο ηζρύνο πνπ πξαγκαηνπνηνύληαη ζην ζεκείν θνηλήο
ζύλδεζεο παξνπζηάδνληαη ζην ρ. 6.7. Από ην θάζκα ζπρλνηήησλ ηεο θπκαηνκνξθήο ηεο ηάζεο θαίλεηαη όηη
νη θπξίαξρεο αξκνληθέο ηάζεο πεξηιακβάλνπλ ηηο ζπληζηώζεο 5εο
θαη 7εο
αξκνληθήο ζε ζπρλόηεηεο 300Ζz
θαη 420Ζz αληίζηνηρα, κε rms ηηκέο ηάζεσλ = 3V θαη = 2V αληίζηνηρα, ελώ ν ζπληειεζηήο
νιηθήο αξκνληθήο παξακόξθσζεο ηεο ηάζεο πξηλ ηελ εθαξκνγή ησλ ξπζκηζηώλ ζηξνθώλ είλαη THDv% =
0.7%, θπξίσο ιόγσ ησλ κνλνθαζηθώλ θαη ηξηθαζηθώλ δηαθνπηηθώλ ηξνθνδνηηθώλ ησλ θνλζνιώλ.
Ο Πίλαθαο 6.3 δείρλεη ηα δεδνκέλα θαη ηηο ππνινγηδόκελεο παξακέηξνπο ζρεηηθέο κε ην ζύζηεκα
ειεθηξηθήο ηζρύνο κε αλαθνξά ζηηο ζρ. (6.12) – (6.16) θαη ζην ρ. 6.6 γηα ην πινίν ππό κειέηε. Οη rms ηηκέο
ησλ αξκνληθώλ ξεύκαηνο εηζόδνπ πνπ εγρένληαη ζην δίθηπν ιόγσ ηεο ιεηηνπξγίαο ησλ ξπζκηζηώλ ζηξνθώλ
ζηελ νλνκαζηηθή ζπρλόηεηα (60Hz) ππνινγίδνληαη γηα ηάμεηο αξκνληθώλ έσο ηελ 25ε θαη παξνπζηάδνληαη
ζηνλ Πίλαθα 6.4. Οη αληίζηνηρεο rms ηηκέο ησλ αξκνληθώλ ηάζεο πνπ εκθαλίδνληαη ζην PCC ιόγσ ησλ
ζύλζεησλ αληηζηάζεσλ ηνπ δηθηύνπ επίζεο ππνινγίδνληαη γηα ηάμεηο αξκνληθώλ έσο ηελ 25ε
θαη
παξνπζηάδνληαη ζηνλ Πίλαθα 6.4 κε αλαθνξά ζηηο ζρ. (6.17) – (6.18) θαη ζηνλ Πίλαθα 6.1.
Λακβάλνληαο ππόςε ηηο ππάξρνπζεο ηηκέο αξκνληθώλ ζην δίθηπν ηζρύνο, νη ελδεηθλύκελεο (rms) ηηκέο
ηνπ ζπλνιηθνύ πιάηνπο ησλ αξκνληθώλ ηάζεο ζην PCC έσο ηελ 25ε αξκνληθή ππνινγίδνληαη κε ηελ
πξνηεηλόκελε κέζνδν, πεξηιακβάλνληαο ηε ζπλεηζθνξά αξκνληθώλ ηάζεσο από ηνπο ξπζκηζηέο ζηξνθώλ,
Ṽ
φ
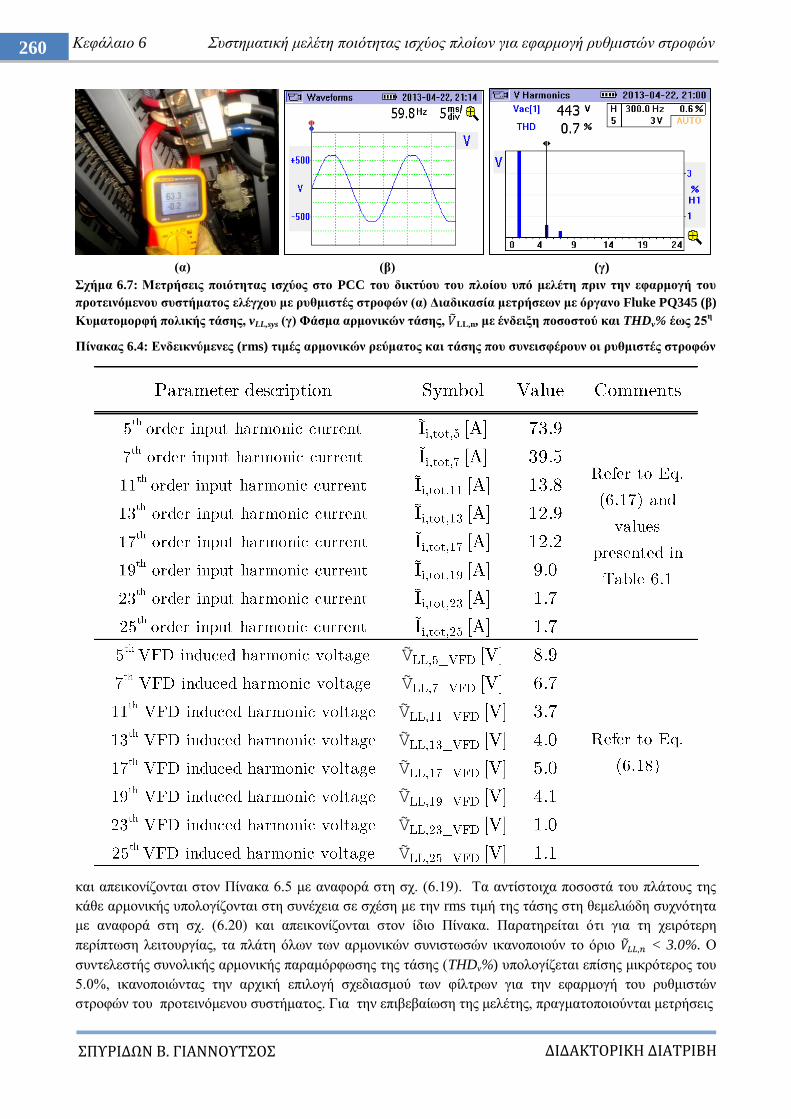
ΔΙΔΑΚΣΟΡΙΚΗ ΔΙΑΣΡΙΒΗ
ΠΤΡΙΔΩΝ Β. ΓΙΑΝΝΟΤΣΟ
260 Κεθάιαην 6 πζηεκαηηθή κειέηε πνηόηεηαο ηζρύνο πινίσλ γηα εθαξκνγή ξπζκηζηώλ ζηξνθώλ
(α) (β) (γ)
ρήκα 6.7: Μεηξήζεηο πνηόηεηαο ηζρύνο ζην PCC ηνπ δηθηύνπ ηνπ πινίνπ ππό κειέηε πξηλ ηελ εθαξκνγή ηνπ
πξνηεηλόκελνπ ζπζηήκαηνο ειέγρνπ κε ξπζκηζηέο ζηξνθώλ (α) Γηαδηθαζία κεηξήζεσλ κε όξγαλν Fluke PQ345 (β)
Κπκαηνκνξθή πνιηθήο ηάζεο, vLL,sys (γ) Φάζκα αξκνληθώλ ηάζεο, LL,n, κε έλδεημε πνζνζηνύ θαη THDv% έσο 25ε
Πίλαθαο 6.4: Δλδεηθλύκελεο (rms) ηηκέο αξκνληθώλ ξεύκαηνο θαη ηάζεο πνπ ζπλεηζθέξνπλ νη ξπζκηζηέο ζηξνθώλ
θαη απεηθνλίδνληαη ζηνλ Πίλαθα 6.5 κε αλαθνξά ζηε ζρ. (6.19). Σα αληίζηνηρα πνζνζηά ηνπ πιάηνπο ηεο
θάζε αξκνληθήο ππνινγίδνληαη ζηε ζπλέρεηα ζε ζρέζε κε ηελ rms ηηκή ηεο ηάζεο ζηε ζεκειηώδε ζπρλόηεηα
κε αλαθνξά ζηε ζρ. (6.20) θαη απεηθνλίδνληαη ζηνλ ίδην Πίλαθα. Παξαηεξείηαη όηη γηα ηε ρεηξόηεξε
πεξίπησζε ιεηηνπξγίαο, ηα πιάηε όισλ ησλ αξκνληθώλ ζπληζησζώλ ηθαλνπνηνύλ ην όξην < 3.0%. Ο
ζπληειεζηήο ζπλνιηθήο αξκνληθήο παξακόξθσζεο ηεο ηάζεο (THDv%) ππνινγίδεηαη επίζεο κηθξόηεξνο ηνπ
5.0%, ηθαλνπνηώληαο ηελ αξρηθή επηινγή ζρεδηαζκνύ ησλ θίιηξσλ γηα ηελ εθαξκνγή ηνπ ξπζκηζηώλ
ζηξνθώλ ηνπ πξνηεηλόκελνπ ζπζηήκαηνο. Γηα ηελ επηβεβαίσζε ηεο κειέηεο, πξαγκαηνπνηνύληαη κεηξήζεηο
Ṽ
Ṽ
Ṽ
Ṽ
Ṽ
Ṽ
Ṽ
Ṽ
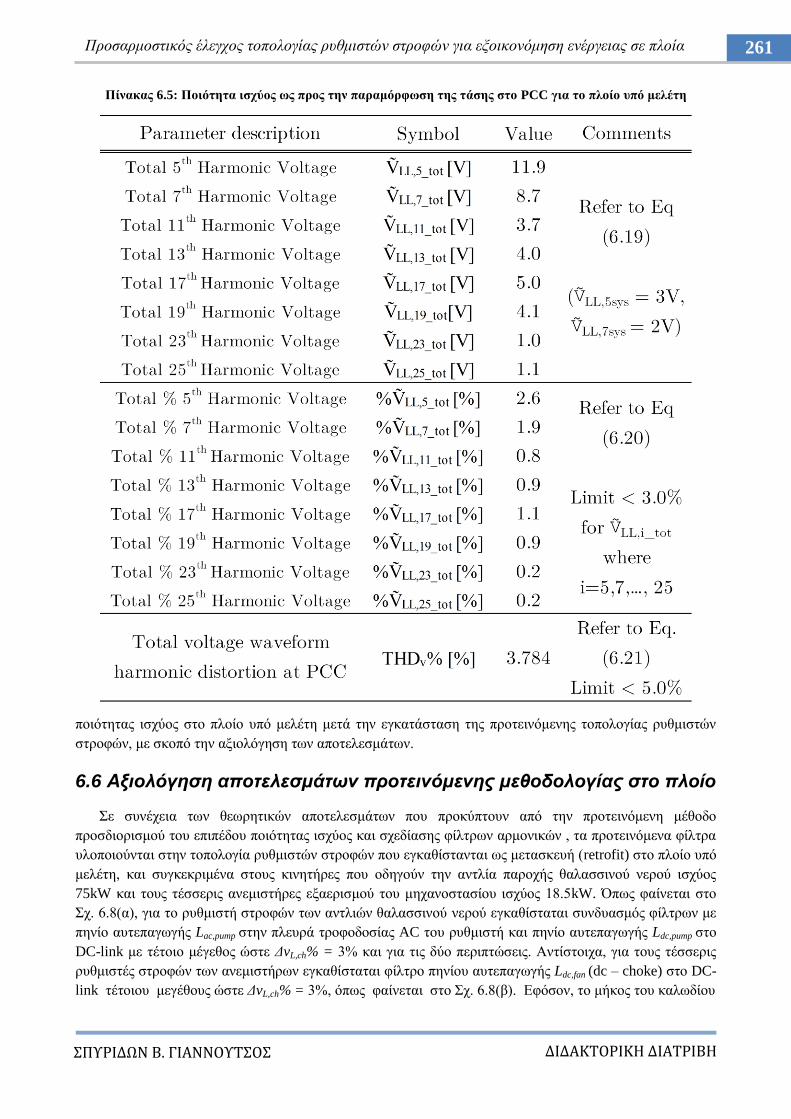
ΔΙΔΑΚΣΟΡΙΚΗ ΔΙΑΣΡΙΒΗ
ΠΤΡΙΔΩΝ Β. ΓΙΑΝΝΟΤΣΟ
261 Πξνζαξκνζηηθόο έιεγρνο ηνπνινγίαο ξπζκηζηώλ ζηξνθώλ γηα εμνηθνλόκεζε ελέξγεηαο ζε πινία
Πίλαθαο 6.5: Πνηόηεηα ηζρύνο σο πξνο ηελ παξακόξθσζε ηεο ηάζεο ζην PCC γηα ην πινίν ππό κειέηε
πνηόηεηαο ηζρύνο ζην πινίν ππό κειέηε κεηά ηελ εγθαηάζηαζε ηεο πξνηεηλόκελεο ηνπνινγίαο ξπζκηζηώλ
ζηξνθώλ, κε ζθνπό ηελ αμηνιόγεζε ησλ απνηειεζκάησλ.
6.6 Αξιολόγηζη αποηελεζμάηυν πποηεινόμενηρ μεθοδολογίαρ ζηο πλοίο
ε ζπλέρεηα ησλ ζεσξεηηθώλ απνηειεζκάησλ πνπ πξνθύπηνπλ από ηελ πξνηεηλόκελε κέζνδν
πξνζδηνξηζκνύ ηνπ επηπέδνπ πνηόηεηαο ηζρύνο θαη ζρεδίαζεο θίιηξσλ αξκνληθώλ , ηα πξνηεηλόκελα θίιηξα
πινπνηνύληαη ζηελ ηνπνινγία ξπζκηζηώλ ζηξνθώλ πνπ εγθαζίζηαληαη σο κεηαζθεπή (retrofit) ζην πινίν ππό
κειέηε, θαη ζπγθεθξηκέλα ζηνπο θηλεηήξεο πνπ νδεγνύλ ηελ αληιία παξνρήο ζαιαζζηλνύ λεξνύ ηζρύνο
75kW θαη ηνπο ηέζζεξηο αλεκηζηήξεο εμαεξηζκνύ ηνπ κεραλνζηαζίνπ ηζρύνο 18.5kW. Όπσο θαίλεηαη ζην
ρ. 6.8(α), γηα ην ξπζκηζηή ζηξνθώλ ησλ αληιηώλ ζαιαζζηλνύ λεξνύ εγθαζίζηαηαη ζπλδπαζκόο θίιηξσλ κε
πελίν απηεπαγσγήο Lac,pump ζηελ πιεπξά ηξνθνδνζίαο AC ηνπ ξπζκηζηή θαη πελίν απηεπαγσγήο Ldc,pump ζην
DC-link κε ηέηνην κέγεζνο ώζηε ΓvL,ch% = 3% θαη γηα ηηο δύν πεξηπηώζεηο. Αληίζηνηρα, γηα ηνπο ηέζζεξηο
ξπζκηζηέο ζηξνθώλ ησλ αλεκηζηήξσλ εγθαζίζηαηαη θίιηξν πελίνπ απηεπαγσγήο Ldc,fan (dc – choke) ζην DC-
link ηέηνηνπ κεγέζνπο ώζηε ΓvL,ch% = 3%, όπσο θαίλεηαη ζην ρ. 6.8(β). Δθόζνλ, ην κήθνο ηνπ θαισδίνπ
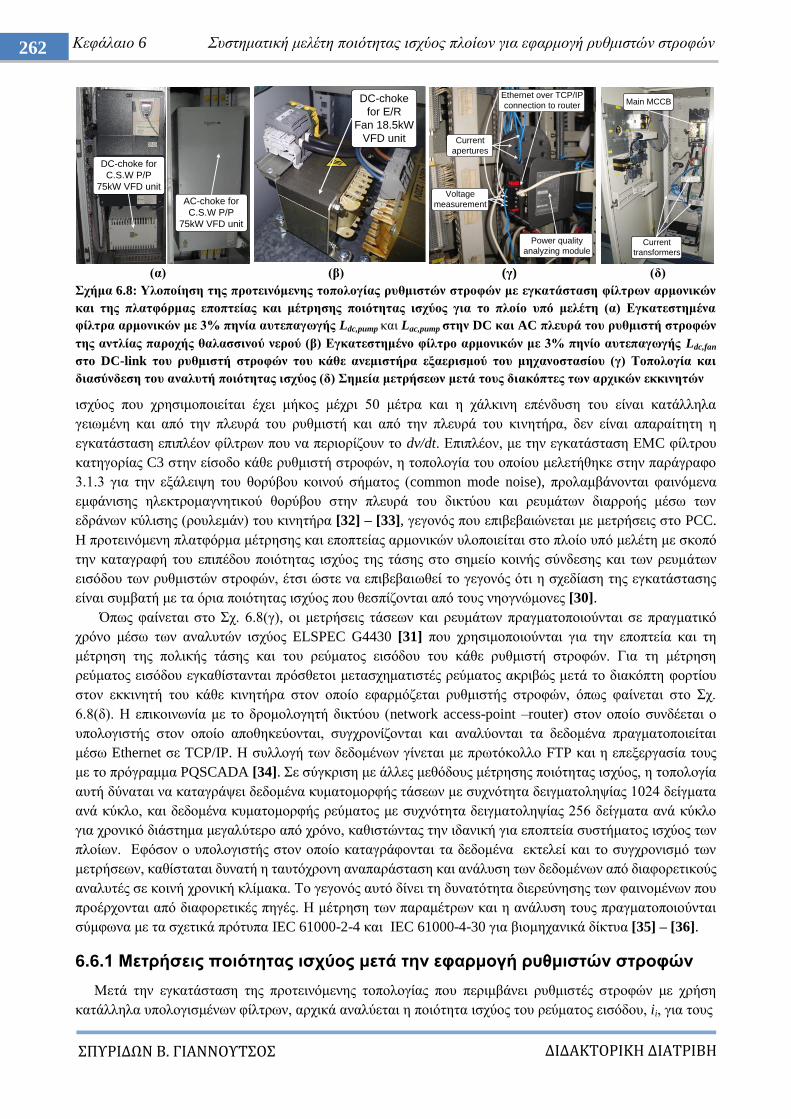
ΔΙΔΑΚΣΟΡΙΚΗ ΔΙΑΣΡΙΒΗ
ΠΤΡΙΔΩΝ Β. ΓΙΑΝΝΟΤΣΟ
262 Κεθάιαην 6 πζηεκαηηθή κειέηε πνηόηεηαο ηζρύνο πινίσλ γηα εθαξκνγή ξπζκηζηώλ ζηξνθώλ
(α) (β) (γ) (δ)
ρήκα 6.8: Τινπνίεζε ηεο πξνηεηλόκελεο ηνπνινγίαο ξπζκηζηώλ ζηξνθώλ κε εγθαηάζηαζε θίιηξσλ αξκνληθώλ
θαη ηεο πιαηθόξκαο επνπηείαο θαη κέηξεζεο πνηόηεηαο ηζρύνο γηα ην πινίν ππό κειέηε (α) Δγθαηεζηεκέλα
θίιηξα αξκνληθώλ κε 3% πελία απηεπαγσγήο Ldc,pump θαη Lac,pump ζηελ DC θαη AC πιεπξά ηνπ ξπζκηζηή ζηξνθώλ
ηεο αληιίαο παξνρήο ζαιαζζηλνύ λεξνύ (β) Δγθαηεζηεκέλν θίιηξν αξκνληθώλ κε 3% πελίν απηεπαγσγήο Ldc,fan
ζην DC-link ηνπ ξπζκηζηή ζηξνθώλ ηνπ θάζε αλεκηζηήξα εμαεξηζκνύ ηνπ κεραλνζηαζίνπ (γ) Σνπνινγία θαη
δηαζύλδεζε ηνπ αλαιπηή πνηόηεηαο ηζρύνο (δ) εκεία κεηξήζεσλ κεηά ηνπο δηαθόπηεο ησλ αξρηθώλ εθθηλεηώλ
ηζρύνο πνπ ρξεζηκνπνηείηαη έρεη κήθνο κέρξη 50 κέηξα θαη ε ράιθηλε επέλδπζε ηνπ είλαη θαηάιιεια
γεησκέλε θαη από ηελ πιεπξά ηνπ ξπζκηζηή θαη από ηελ πιεπξά ηνπ θηλεηήξα, δελ είλαη απαξαίηεηε ε
εγθαηάζηαζε επηπιένλ θίιηξσλ πνπ λα πεξηνξίδνπλ ην dv/dt. Δπηπιένλ, κε ηελ εγθαηάζηαζε ΔΜC θίιηξνπ
θαηεγνξίαο C3 ζηελ είζνδν θάζε ξπζκηζηή ζηξνθώλ, ε ηνπνινγία ηνπ νπνίνπ κειεηήζεθε ζηελ παξάγξαθν
3.1.3 γηα ηελ εμάιεηςε ηνπ ζνξύβνπ θνηλνύ ζήκαηνο (common mode noise), πξνιακβάλνληαη θαηλόκελα
εκθάληζεο ειεθηξνκαγλεηηθνύ ζνξύβνπ ζηελ πιεπξά ηνπ δηθηύνπ θαη ξεπκάησλ δηαξξνήο κέζσ ησλ
εδξάλσλ θύιηζεο (ξνπιεκάλ) ηνπ θηλεηήξα [32] – [33], γεγνλόο πνπ επηβεβαηώλεηαη κε κεηξήζεηο ζην PCC.
H πξνηεηλόκελε πιαηθόξκα κέηξεζεο θαη επνπηείαο αξκνληθώλ πινπνηείηαη ζην πινίν ππό κειέηε κε ζθνπό
ηελ θαηαγξαθή ηνπ επηπέδνπ πνηόηεηαο ηζρύνο ηεο ηάζεο ζην ζεκείν θνηλήο ζύλδεζεο θαη ησλ ξεπκάησλ
εηζόδνπ ησλ ξπζκηζηώλ ζηξνθώλ, έηζη ώζηε λα επηβεβαησζεί ην γεγνλόο όηη ε ζρεδίαζε ηεο εγθαηάζηαζεο
είλαη ζπκβαηή κε ηα όξηα πνηόηεηαο ηζρύνο πνπ ζεζπίδνληαη από ηνπο λενγλώκνλεο [30].
Όπσο θαίλεηαη ζην ρ. 6.8(γ), νη κεηξήζεηο ηάζεσλ θαη ξεπκάησλ πξαγκαηνπνηνύληαη ζε πξαγκαηηθό
ρξόλν κέζσ ησλ αλαιπηώλ ηζρύνο ELSPEC G4430 [31] πνπ ρξεζηκνπνηνύληαη γηα ηελ επνπηεία θαη ηε
κέηξεζε ηεο πνιηθήο ηάζεο θαη ηνπ ξεύκαηνο εηζόδνπ ηνπ θάζε ξπζκηζηή ζηξνθώλ. Γηα ηε κέηξεζε
ξεύκαηνο εηζόδνπ εγθαζίζηαληαη πξόζζεηνη κεηαζρεκαηηζηέο ξεύκαηνο αθξηβώο κεηά ην δηαθόπηε θνξηίνπ
ζηνλ εθθηλεηή ηνπ θάζε θηλεηήξα ζηνλ νπνίν εθαξκόδεηαη ξπζκηζηήο ζηξνθώλ, όπσο θαίλεηαη ζην ρ.
6.8(δ). Ζ επηθνηλσλία κε ην δξνκνινγεηή δηθηύνπ (network access-point –router) ζηνλ νπνίν ζπλδέεηαη ν
ππνινγηζηήο ζηνλ νπνίν απνζεθεύνληαη, ζπγρξνλίδνληαη θαη αλαιύνληαη ηα δεδνκέλα πξαγκαηνπνηείηαη
κέζσ Ethernet ζε TCP/IP. H ζπιινγή ησλ δεδνκέλσλ γίλεηαη κε πξσηόθνιιν FTP θαη ε επεμεξγαζία ηνπο
κε ην πξόγξακκα PQSCADA [34]. ε ζύγθξηζε κε άιιεο κεζόδνπο κέηξεζεο πνηόηεηαο ηζρύνο, ε ηνπνινγία
απηή δύλαηαη λα θαηαγξάςεη δεδνκέλα θπκαηνκνξθήο ηάζεσλ κε ζπρλόηεηα δεηγκαηνιεςίαο 1024 δείγκαηα
αλά θύθιν, θαη δεδνκέλα θπκαηνκνξθήο ξεύκαηνο κε ζπρλόηεηα δεηγκαηνιεςίαο 256 δείγκαηα αλά θύθιν
γηα ρξνληθό δηάζηεκα κεγαιύηεξν από ρξόλν, θαζηζηώληαο ηελ ηδαληθή γηα επνπηεία ζπζηήκαηνο ηζρύνο ησλ
πινίσλ. Δθόζνλ ν ππνινγηζηήο ζηνλ νπνίν θαηαγξάθνληαη ηα δεδνκέλα εθηειεί θαη ην ζπγρξνληζκό ησλ
κεηξήζεσλ, θαζίζηαηαη δπλαηή ε ηαπηόρξνλε αλαπαξάζηαζε θαη αλάιπζε ησλ δεδνκέλσλ από δηαθνξεηηθνύο
αλαιπηέο ζε θνηλή ρξνληθή θιίκαθα. Σν γεγνλόο απηό δίλεη ηε δπλαηόηεηα δηεξεύλεζεο ησλ θαηλνκέλσλ πνπ
πξνέξρνληαη από δηαθνξεηηθέο πεγέο. Ζ κέηξεζε ησλ παξακέηξσλ θαη ε αλάιπζε ηνπο πξαγκαηνπνηνύληαη
ζύκθσλα κε ηα ζρεηηθά πξόηππα IEC 61000-2-4 θαη IEC 61000-4-30 γηα βηνκεραληθά δίθηπα [35] – [36].
6.6.1 Μεηξήζεηο πνηόηεηαο ηζρύνο κεηά ηελ εθαξκνγή ξπζκηζηώλ ζηξνθώλ
Μεηά ηελ εγθαηάζηαζε ηεο πξνηεηλόκελεο ηνπνινγίαο πνπ πεξηκβάλεη ξπζκηζηέο ζηξνθώλ κε ρξήζε
θαηάιιεια ππνινγηζκέλσλ θίιηξσλ, αξρηθά αλαιύεηαη ε πνηόηεηα ηζρύνο ηνπ ξεύκαηνο εηζόδνπ, ii, γηα ηνπο
DC-choke for
C.S.W P/P
75kW VFD unit
AC-choke for
C.S.W P/P
75kW VFD unit
DC-choke
for E/R
Fan 18.5kW
VFD unit Current
apertures
Voltage
measurement
Ethernet over TCP/IP
connection to router
Power quality
analyzing module Current
transformers
Main MCCB
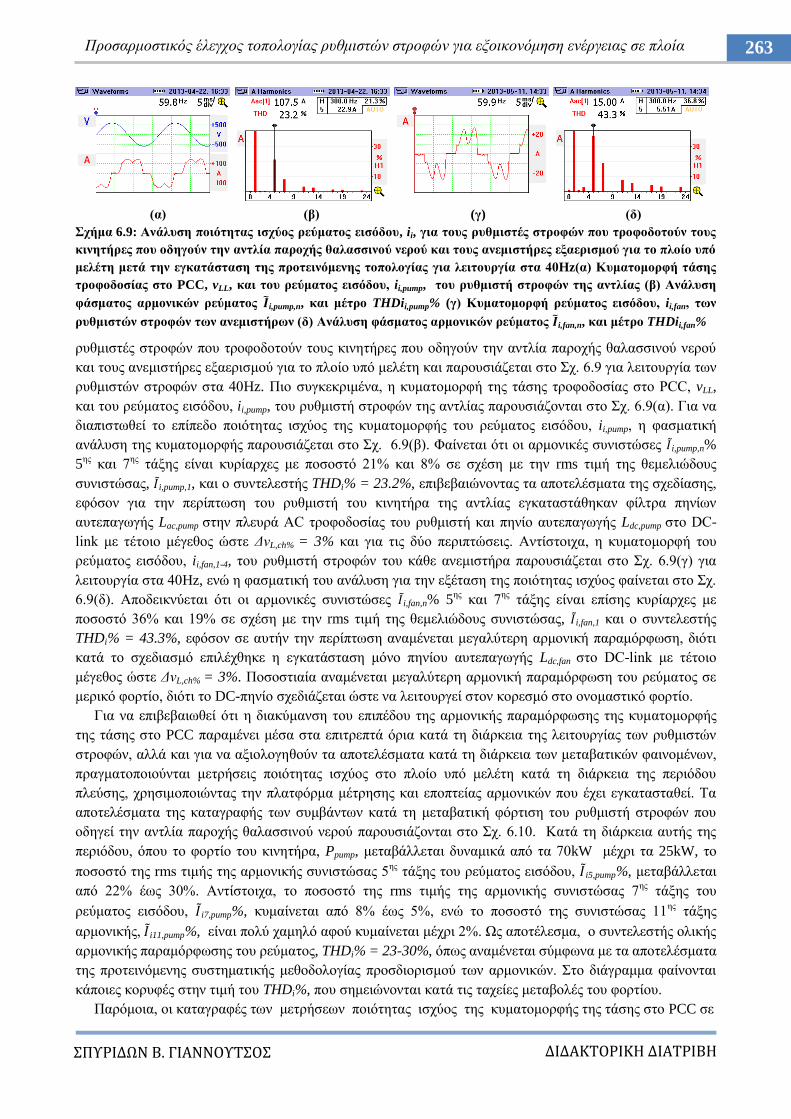
ΔΙΔΑΚΣΟΡΙΚΗ ΔΙΑΣΡΙΒΗ
ΠΤΡΙΔΩΝ Β. ΓΙΑΝΝΟΤΣΟ
263 Πξνζαξκνζηηθόο έιεγρνο ηνπνινγίαο ξπζκηζηώλ ζηξνθώλ γηα εμνηθνλόκεζε ελέξγεηαο ζε πινία
(α) (β) (γ) (δ)
ρήκα 6.9: Αλάιπζε πνηόηεηαο ηζρύνο ξεύκαηνο εηζόδνπ, ii, γηα ηνπο ξπζκηζηέο ζηξνθώλ πνπ ηξνθνδνηνύλ ηνπο
θηλεηήξεο πνπ νδεγνύλ ηελ αληιία παξνρήο ζαιαζζηλνύ λεξνύ θαη ηνπο αλεκηζηήξεο εμαεξηζκνύ γηα ην πινίν ππό
κειέηε κεηά ηελ εγθαηάζηαζε ηεο πξνηεηλόκελεο ηνπνινγίαο γηα ιεηηνπξγία ζηα 40Hz(α) Κπκαηνκνξθή ηάζεο
ηξνθνδνζίαο ζην PCC, vLL, θαη ηνπ ξεύκαηνο εηζόδνπ, ii,pump, ηνπ ξπζκηζηή ζηξνθώλ ηεο αληιίαο (β) Αλάιπζε
θάζκαηνο αξκνληθώλ ξεύκαηνο i,pump,n, θαη κέηξν THDii,pump% (γ) Κπκαηνκνξθή ξεύκαηνο εηζόδνπ, ii,fan, ησλ
ξπζκηζηώλ ζηξνθώλ ησλ αλεκηζηήξσλ (δ) Αλάιπζε θάζκαηνο αξκνληθώλ ξεύκαηνο i,fan,n, θαη κέηξν THDii,fan%
ξπζκηζηέο ζηξνθώλ πνπ ηξνθνδνηνύλ ηνπο θηλεηήξεο πνπ νδεγνύλ ηελ αληιία παξνρήο ζαιαζζηλνύ λεξνύ
θαη ηνπο αλεκηζηήξεο εμαεξηζκνύ γηα ην πινίν ππό κειέηε θαη παξνπζηάδεηαη ζην ρ. 6.9 γηα ιεηηνπξγία ησλ
ξπζκηζηώλ ζηξνθώλ ζηα 40Hz. Πην ζπγθεθξηκέλα, ε θπκαηνκνξθή ηεο ηάζεο ηξνθνδνζίαο ζην PCC, vLL,
θαη ηνπ ξεύκαηνο εηζόδνπ, ii,pump, ηνπ ξπζκηζηή ζηξνθώλ ηεο αληιίαο παξνπζηάδνληαη ζην ρ. 6.9(α). Γηα λα
δηαπηζησζεί ην επίπεδν πνηόηεηαο ηζρύνο ηεο θπκαηνκνξθήο ηνπ ξεύκαηνο εηζόδνπ, ii,pump, ε θαζκαηηθή
αλάιπζε ηεο θπκαηνκνξθήο παξνπζηάδεηαη ζην ρ. 6.9(β). Φαίλεηαη όηη νη αξκνληθέο ζπληζηώζεο i,pump,n%
5εο
θαη 7εο
ηάμεο είλαη θπξίαξρεο κε πνζνζηό 21% θαη 8% ζε ζρέζε κε ηελ rms ηηκή ηεο ζεκειηώδνπο
ζπληζηώζαο, i,pump,1, θαη ν ζπληειεζηήο THDi% = 23.2%, επηβεβαηώλνληαο ηα απνηειέζκαηα ηεο ζρεδίαζεο,
εθόζνλ γηα ηελ πεξίπησζε ηνπ ξπζκηζηή ηνπ θηλεηήξα ηεο αληιίαο εγθαηαζηάζεθαλ θίιηξα πελίσλ
απηεπαγσγήο Lac,pump ζηελ πιεπξά AC ηξνθνδνζίαο ηνπ ξπζκηζηή θαη πελίν απηεπαγσγήο Ldc,pump ζην DC-
link κε ηέηνην κέγεζνο ώζηε ΓvL,ch% = 3% θαη γηα ηηο δύν πεξηπηώζεηο. Αληίζηνηρα, ε θπκαηνκνξθή ηνπ
ξεύκαηνο εηζόδνπ, ii,fan,1-4, ηνπ ξπζκηζηή ζηξνθώλ ηνπ θάζε αλεκηζηήξα παξνπζηάδεηαη ζην ρ. 6.9(γ) γηα
ιεηηνπξγία ζηα 40Hz, ελώ ε θαζκαηηθή ηνπ αλάιπζε γηα ηελ εμέηαζε ηεο πνηόηεηαο ηζρύνο θαίλεηαη ζην ρ.
6.9(δ). Απνδεηθλύεηαη όηη νη αξκνληθέο ζπληζηώζεο i,fan,n% 5εο
θαη 7εο
ηάμεο είλαη επίζεο θπξίαξρεο κε
πνζνζηό 36% θαη 19% ζε ζρέζε κε ηελ rms ηηκή ηεο ζεκειηώδνπο ζπληζηώζαο, i,fan,1 θαη ν ζπληειεζηήο
THDi% = 43.3%, εθόζνλ ζε απηήλ ηελ πεξίπησζε αλακέλεηαη κεγαιύηεξε αξκνληθή παξακόξθσζε, δηόηη
θαηά ην ζρεδηαζκό επηιέρζεθε ε εγθαηάζηαζε κόλν πελίνπ απηεπαγσγήο Ldc,fan ζην DC-link κε ηέηνην
κέγεζνο ώζηε ΓvL,ch% = 3%. Πνζνζηηαία αλακέλεηαη κεγαιύηεξε αξκνληθή παξακόξθσζε ηνπ ξεύκαηνο ζε
κεξηθό θνξηίν, δηόηη ην DC-πελίν ζρεδηάδεηαη ώζηε λα ιεηηνπξγεί ζηνλ θνξεζκό ζην νλνκαζηηθό θνξηίν.
Γηα λα επηβεβαησζεί όηη ε δηαθύκαλζε ηνπ επηπέδνπ ηεο αξκνληθήο παξακόξθσζεο ηεο θπκαηνκνξθήο
ηεο ηάζεο ζην PCC παξακέλεη κέζα ζηα επηηξεπηά όξηα θαηά ηε δηάξθεηα ηεο ιεηηνπξγίαο ησλ ξπζκηζηώλ
ζηξνθώλ, αιιά θαη γηα λα αμηνινγεζνύλ ηα απνηειέζκαηα θαηά ηε δηάξθεηα ησλ κεηαβαηηθώλ θαηλνκέλσλ,
πξαγκαηνπνηνύληαη κεηξήζεηο πνηόηεηαο ηζρύνο ζην πινίν ππό κειέηε θαηά ηε δηάξθεηα ηεο πεξηόδνπ
πιεύζεο, ρξεζηκνπνηώληαο ηελ πιαηθόξκα κέηξεζεο θαη επνπηείαο αξκνληθώλ πνπ έρεη εγθαηαζηαζεί. Σα
απνηειέζκαηα ηεο θαηαγξαθήο ησλ ζπκβάλησλ θαηά ηε κεηαβαηηθή θόξηηζε ηνπ ξπζκηζηή ζηξνθώλ πνπ
νδεγεί ηελ αληιία παξνρήο ζαιαζζηλνύ λεξνύ παξνπζηάδνληαη ζην ρ. 6.10. Καηά ηε δηάξθεηα απηήο ηεο
πεξηόδνπ, όπνπ ην θνξηίν ηνπ θηλεηήξα, Ppump, κεηαβάιιεηαη δπλακηθά από ηα 70kW κέρξη ηα 25kW, ην
πνζνζηό ηεο rms ηηκήο ηεο αξκνληθήο ζπληζηώζαο 5εο
ηάμεο ηνπ ξεύκαηνο εηζόδνπ, i5,pump%, κεηαβάιιεηαη
από 22% έσο 30%. Αληίζηνηρα, ην πνζνζηό ηεο rms ηηκήο ηεο αξκνληθήο ζπληζηώζαο 7εο
ηάμεο ηνπ
ξεύκαηνο εηζόδνπ, i7,pump%, θπκαίλεηαη από 8% έσο 5%, ελώ ην πνζνζηό ηεο ζπληζηώζαο 11εο
ηάμεο
αξκνληθήο, i11,pump%, είλαη πνιύ ρακειό αθνύ θπκαίλεηαη κέρξη 2%. Χο απνηέιεζκα, ν ζπληειεζηήο νιηθήο
αξκνληθήο παξακόξθσζεο ηνπ ξεύκαηνο, THDi% = 23-30%, όπσο αλακέλεηαη ζύκθσλα κε ηα απνηειέζκαηα
ηεο πξνηεηλόκελεο ζπζηεκαηηθήο κεζνδνινγίαο πξνζδηνξηζκνύ ησλ αξκνληθώλ. ην δηάγξακκα θαίλνληαη
θάπνηεο θνξπθέο ζηελ ηηκή ηνπ THDi%, πνπ ζεκεηώλνληαη θαηά ηηο ηαρείεο κεηαβνιέο ηνπ θνξηίνπ.
Παξόκνηα, νη θαηαγξαθέο ησλ κεηξήζεσλ πνηόηεηαο ηζρύνο ηεο θπκαηνκνξθήο ηεο ηάζεο ζην PCC ζε
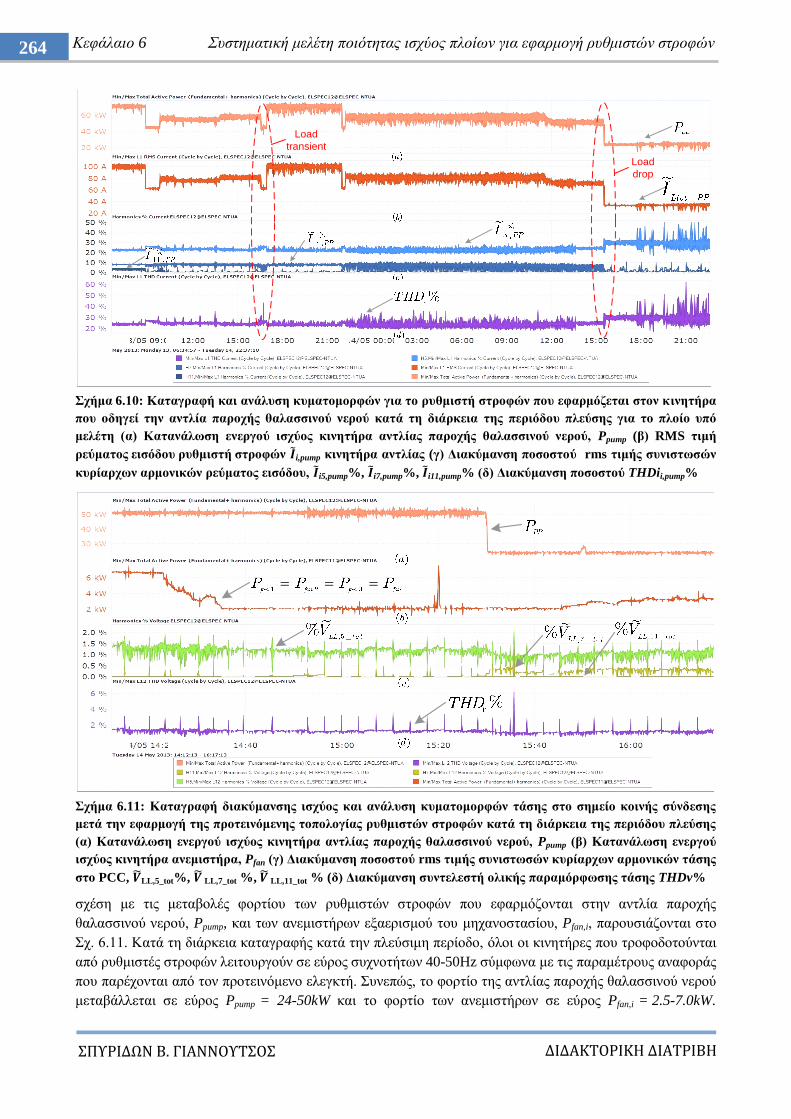
ΔΙΔΑΚΣΟΡΙΚΗ ΔΙΑΣΡΙΒΗ
ΠΤΡΙΔΩΝ Β. ΓΙΑΝΝΟΤΣΟ
264 Κεθάιαην 6 πζηεκαηηθή κειέηε πνηόηεηαο ηζρύνο πινίσλ γηα εθαξκνγή ξπζκηζηώλ ζηξνθώλ
ρήκα 6.10: Καηαγξαθή θαη αλάιπζε θπκαηνκνξθώλ γηα ην ξπζκηζηή ζηξνθώλ πνπ εθαξκόδεηαη ζηνλ θηλεηήξα
πνπ νδεγεί ηελ αληιία παξνρήο ζαιαζζηλνύ λεξνύ θαηά ηε δηάξθεηα ηεο πεξηόδνπ πιεύζεο γηα ην πινίν ππό
κειέηε (α) Καηαλάισζε ελεξγνύ ηζρύνο θηλεηήξα αληιίαο παξνρήο ζαιαζζηλνύ λεξνύ, Ppump (β) RMS ηηκή
ξεύκαηνο εηζόδνπ ξπζκηζηή ζηξνθώλ i,pump θηλεηήξα αληιίαο (γ) Γηαθύκαλζε πνζνζηνύ rms ηηκήο ζπληζησζώλ
θπξίαξρσλ αξκνληθώλ ξεύκαηνο εηζόδνπ, i5,pump%, i7,pump%, i11,pump% (δ) Γηαθύκαλζε πνζνζηνύ THDii,pump%
ρήκα 6.11: Καηαγξαθή δηαθύκαλζεο ηζρύνο θαη αλάιπζε θπκαηνκνξθώλ ηάζεο ζην ζεκείν θνηλήο ζύλδεζεο
κεηά ηελ εθαξκνγή ηεο πξνηεηλόκελεο ηνπνινγίαο ξπζκηζηώλ ζηξνθώλ θαηά ηε δηάξθεηα ηεο πεξηόδνπ πιεύζεο
(α) Καηαλάισζε ελεξγνύ ηζρύνο θηλεηήξα αληιίαο παξνρήο ζαιαζζηλνύ λεξνύ, Ppump (β) Καηαλάισζε ελεξγνύ
ηζρύνο θηλεηήξα αλεκηζηήξα, Pfan (γ) Γηαθύκαλζε πνζνζηνύ rms ηηκήο ζπληζησζώλ θπξίαξρσλ αξκνληθώλ ηάζεο
ζην PCC, LL,5_tot%, LL,7_tot %, LL,11_tot % (δ) Γηαθύκαλζε ζπληειεζηή νιηθήο παξακόξθσζεο ηάζεο THDv%
ζρέζε κε ηηο κεηαβνιέο θνξηίνπ ησλ ξπζκηζηώλ ζηξνθώλ πνπ εθαξκόδνληαη ζηελ αληιία παξνρήο
ζαιαζζηλνύ λεξνύ, Ppump, θαη ησλ αλεκηζηήξσλ εμαεξηζκνύ ηνπ κεραλνζηαζίνπ, Pfan,i, παξνπζηάδνληαη ζην
ρ. 6.11. Καηά ηε δηάξθεηα θαηαγξαθήο θαηά ηελ πιεύζηκε πεξίνδν, όινη νη θηλεηήξεο πνπ ηξνθνδνηνύληαη
από ξπζκηζηέο ζηξνθώλ ιεηηνπξγνύλ ζε εύξνο ζπρλνηήησλ 40-50Hz ζύκθσλα κε ηηο παξακέηξνπο αλαθνξάο
πνπ παξέρνληαη από ηνλ πξνηεηλόκελν ειεγθηή. πλεπώο, ην θνξηίν ηεο αληιίαο παξνρήο ζαιαζζηλνύ λεξνύ
κεηαβάιιεηαη ζε εύξνο Ppump = 24-50kW θαη ην θνξηίν ησλ αλεκηζηήξσλ ζε εύξνο Pfan,i = 2.5-7.0kW.
Load
transient
Load
drop
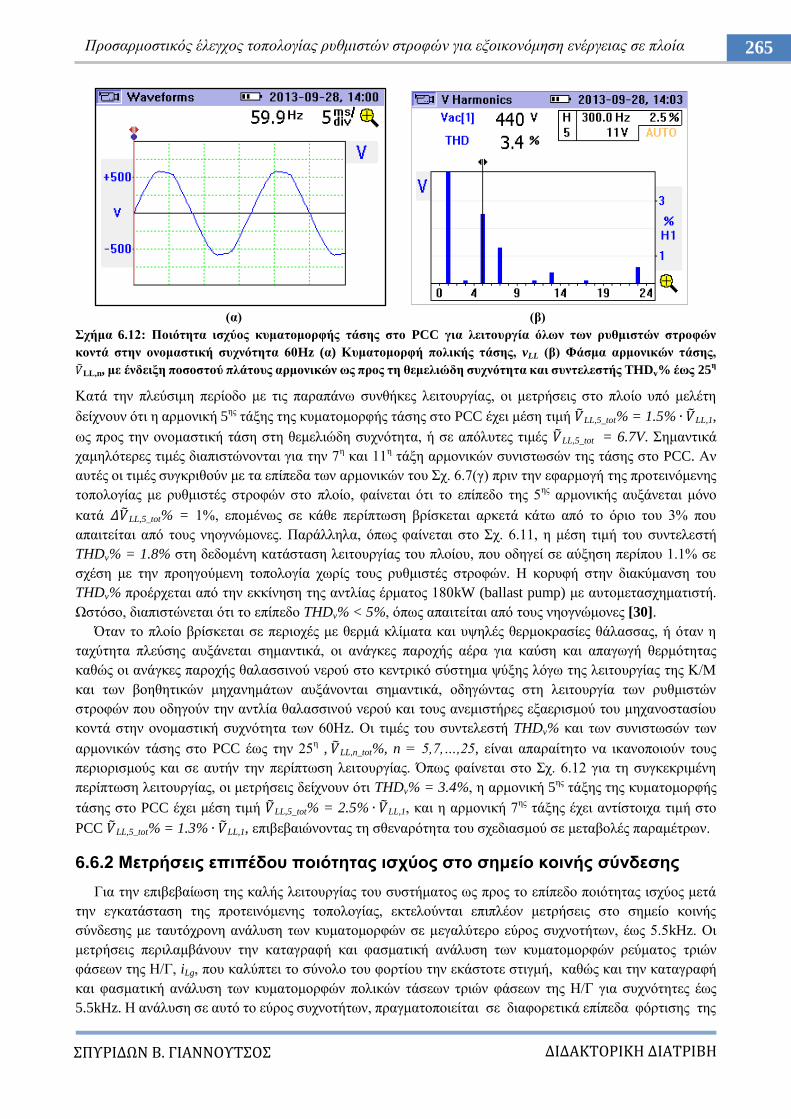
ΔΙΔΑΚΣΟΡΙΚΗ ΔΙΑΣΡΙΒΗ
ΠΤΡΙΔΩΝ Β. ΓΙΑΝΝΟΤΣΟ
265 Πξνζαξκνζηηθόο έιεγρνο ηνπνινγίαο ξπζκηζηώλ ζηξνθώλ γηα εμνηθνλόκεζε ελέξγεηαο ζε πινία
(α) (β)
ρήκα 6.12: Πνηόηεηα ηζρύνο θπκαηνκνξθήο ηάζεο ζην PCC γηα ιεηηνπξγία όισλ ησλ ξπζκηζηώλ ζηξνθώλ
θνληά ζηελ νλνκαζηηθή ζπρλόηεηα 60Hz (α) Κπκαηνκνξθή πνιηθήο ηάζεο, vLL (β) Φάζκα αξκνληθώλ ηάζεο,
LL,n, κε έλδεημε πνζνζηνύ πιάηνπο αξκνληθώλ σο πξνο ηε ζεκειηώδε ζπρλόηεηα θαη ζπληειεζηήο THDv% έσο 25ε
Καηά ηελ πιεύζηκε πεξίνδν κε ηηο παξαπάλσ ζπλζήθεο ιεηηνπξγίαο, νη κεηξήζεηο ζην πινίν ππό κειέηε
δείρλνπλ όηη ε αξκνληθή 5εο
ηάμεο ηεο θπκαηνκνξθήο ηάζεο ζην PCC έρεη κέζε ηηκή LL,5_tot% = 1.5% LL,1,
σο πξνο ηελ νλνκαζηηθή ηάζε ζηε ζεκειηώδε ζπρλόηεηα, ή ζε απόιπηεο ηηκέο LL,5_tot = 6.7V. εκαληηθά
ρακειόηεξεο ηηκέο δηαπηζηώλνληαη γηα ηελ 7ε θαη 11
ε ηάμε αξκνληθώλ ζπληζησζώλ ηεο ηάζεο ζην PCC. Αλ
απηέο νη ηηκέο ζπγθξηζνύλ κε ηα επίπεδα ησλ αξκνληθώλ ηνπ ρ. 6.7(γ) πξηλ ηελ εθαξκνγή ηεο πξνηεηλόκελεο
ηνπνινγίαο κε ξπζκηζηέο ζηξνθώλ ζην πινίν, θαίλεηαη όηη ην επίπεδν ηεο 5εο
αξκνληθήο απμάλεηαη κόλν
θαηά LL,5_tot% = 1%, επνκέλσο ζε θάζε πεξίπησζε βξίζθεηαη αξθεηά θάησ από ην όξην ηνπ 3% πνπ
απαηηείηαη από ηνπο λενγλώκνλεο. Παξάιιεια, όπσο θαίλεηαη ζην ρ. 6.11, ε κέζε ηηκή ηνπ ζπληειεζηή
THDv% = 1.8% ζηε δεδνκέλε θαηάζηαζε ιεηηνπξγίαο ηνπ πινίνπ, πνπ νδεγεί ζε αύμεζε πεξίπνπ 1.1% ζε
ζρέζε κε ηελ πξνεγνύκελε ηνπνινγία ρσξίο ηνπο ξπζκηζηέο ζηξνθώλ. Ζ θνξπθή ζηελ δηαθύκαλζε ηνπ
THDv% πξνέξρεηαη από ηελ εθθίλεζε ηεο αληιίαο έξκαηνο 180kW (ballast pump) κε απηνκεηαζρεκαηηζηή.
Χζηόζν, δηαπηζηώλεηαη όηη ην επίπεδν THDv% < 5%, όπσο απαηηείηαη από ηνπο λενγλώκνλεο [30].
Όηαλ ην πινίν βξίζθεηαη ζε πεξηνρέο κε ζεξκά θιίκαηα θαη πςειέο ζεξκνθξαζίεο ζάιαζζαο, ή όηαλ ε
ηαρύηεηα πιεύζεο απμάλεηαη ζεκαληηθά, νη αλάγθεο παξνρήο αέξα γηα θαύζε θαη απαγσγή ζεξκόηεηαο
θαζώο νη αλάγθεο παξνρήο ζαιαζζηλνύ λεξνύ ζην θεληξηθό ζύζηεκα ςύμεο ιόγσ ηεο ιεηηνπξγίαο ηεο Κ/Μ
θαη ησλ βνεζεηηθώλ κεραλεκάησλ απμάλνληαη ζεκαληηθά, νδεγώληαο ζηε ιεηηνπξγία ησλ ξπζκηζηώλ
ζηξνθώλ πνπ νδεγνύλ ηελ αληιία ζαιαζζηλνύ λεξνύ θαη ηνπο αλεκηζηήξεο εμαεξηζκνύ ηνπ κεραλνζηαζίνπ
θνληά ζηελ νλνκαζηηθή ζπρλόηεηα ησλ 60Ζz. Οη ηηκέο ηνπ ζπληειεζηή THDv% θαη ησλ ζπληζησζώλ ησλ
αξκνληθώλ ηάζεο ζην PCC έσο ηελ 25ε , LL,n_tot%, n = 5,7,…,25, είλαη απαξαίηεην λα ηθαλνπνηνύλ ηνπο
πεξηνξηζκνύο θαη ζε απηήλ ηελ πεξίπησζε ιεηηνπξγίαο. Όπσο θαίλεηαη ζην ρ. 6.12 γηα ηε ζπγθεθξηκέλε
πεξίπησζε ιεηηνπξγίαο, νη κεηξήζεηο δείρλνπλ όηη THDv% = 3.4%, ε αξκνληθή 5εο
ηάμεο ηεο θπκαηνκνξθήο
ηάζεο ζην PCC έρεη κέζε ηηκή LL,5_tot% = 2.5% LL,1, θαη ε αξκνληθή 7εο
ηάμεο έρεη αληίζηνηρα ηηκή ζην
PCC LL,5_tot% = 1.3% LL,1, επηβεβαηώλνληαο ηε ζζελαξόηεηα ηνπ ζρεδηαζκνύ ζε κεηαβνιέο παξακέηξσλ.
6.6.2 Μεηξήζεηο επηπέδνπ πνηόηεηαο ηζρύνο ζην ζεκείν θνηλήο ζύλδεζεο
Γηα ηελ επηβεβαίσζε ηεο θαιήο ιεηηνπξγίαο ηνπ ζπζηήκαηνο σο πξνο ην επίπεδν πνηόηεηαο ηζρύνο κεηά
ηελ εγθαηάζηαζε ηεο πξνηεηλόκελεο ηνπνινγίαο, εθηεινύληαη επηπιένλ κεηξήζεηο ζην ζεκείν θνηλήο
ζύλδεζεο κε ηαπηόρξνλε αλάιπζε ησλ θπκαηνκνξθώλ ζε κεγαιύηεξν εύξνο ζπρλνηήησλ, έσο 5.5kHz. Οη
κεηξήζεηο πεξηιακβάλνπλ ηελ θαηαγξαθή θαη θαζκαηηθή αλάιπζε ησλ θπκαηνκνξθώλ ξεύκαηνο ηξηώλ
θάζεσλ ηεο Ζ/Γ, iLg, πνπ θαιύπηεη ην ζύλνιν ηνπ θνξηίνπ ηελ εθάζηνηε ζηηγκή, θαζώο θαη ηελ θαηαγξαθή
θαη θαζκαηηθή αλάιπζε ησλ θπκαηνκνξθώλ πνιηθώλ ηάζεσλ ηξηώλ θάζεσλ ηεο Ζ/Γ γηα ζπρλόηεηεο έσο
5.5kHz. Ζ αλάιπζε ζε απηό ην εύξνο ζπρλνηήησλ, πξαγκαηνπνηείηαη ζε δηαθνξεηηθά επίπεδα θόξηηζεο ηεο
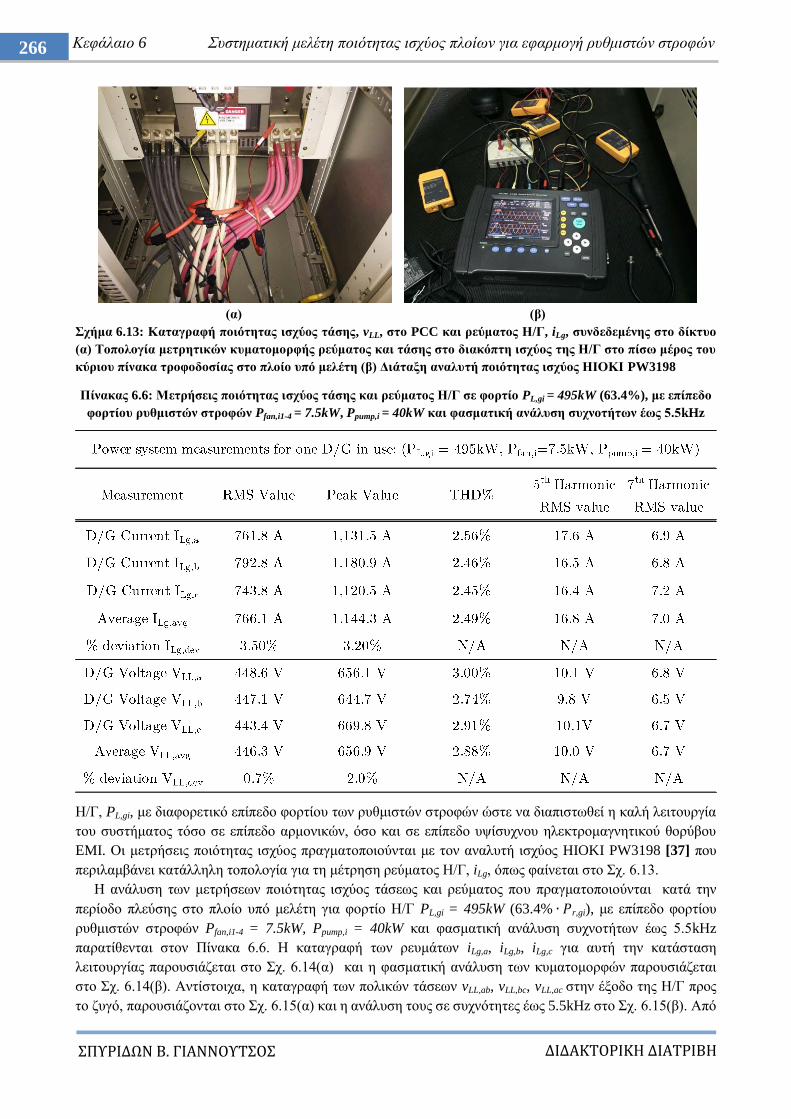
ΔΙΔΑΚΣΟΡΙΚΗ ΔΙΑΣΡΙΒΗ
ΠΤΡΙΔΩΝ Β. ΓΙΑΝΝΟΤΣΟ
266 Κεθάιαην 6 πζηεκαηηθή κειέηε πνηόηεηαο ηζρύνο πινίσλ γηα εθαξκνγή ξπζκηζηώλ ζηξνθώλ
(α) (β)
ρήκα 6.13: Καηαγξαθή πνηόηεηαο ηζρύνο ηάζεο, vLL, ζην PCC θαη ξεύκαηνο Η/Γ, iLg, ζπλδεδεκέλεο ζην δίθηπν
(α) Σνπνινγία κεηξεηηθώλ θπκαηνκνξθήο ξεύκαηνο θαη ηάζεο ζην δηαθόπηε ηζρύνο ηεο Η/Γ ζην πίζσ κέξνο ηνπ
θύξηνπ πίλαθα ηξνθνδνζίαο ζην πινίν ππό κειέηε (β) Γηάηαμε αλαιπηή πνηόηεηαο ηζρύνο ΗΙΟΚΙ PW3198
Πίλαθαο 6.6: Μεηξήζεηο πνηόηεηαο ηζρύνο ηάζεο θαη ξεύκαηνο Η/Γ ζε θνξηίν PL,gi = 495kW (63.4%), κε επίπεδν
θνξηίνπ ξπζκηζηώλ ζηξνθώλ Pfan,i1-4 = 7.5kW, Ppump,i = 40kW θαη θαζκαηηθή αλάιπζε ζπρλνηήησλ έσο 5.5kHz
Ζ/Γ, PL,gi, κε δηαθνξεηηθό επίπεδν θνξηίνπ ησλ ξπζκηζηώλ ζηξνθώλ ώζηε λα δηαπηζησζεί ε θαιή ιεηηνπξγία
ηνπ ζπζηήκαηνο ηόζν ζε επίπεδν αξκνληθώλ, όζν θαη ζε επίπεδν πςίζπρλνπ ειεθηξνκαγλεηηθνύ ζνξύβνπ
EMI. Οη κεηξήζεηο πνηόηεηαο ηζρύνο πξαγκαηνπνηνύληαη κε ηνλ αλαιπηή ηζρύνο HIOKI PW3198 [37] πνπ
πεξηιακβάλεη θαηάιιειε ηνπνινγία γηα ηε κέηξεζε ξεύκαηνο Ζ/Γ, iLg, όπσο θαίλεηαη ζην ρ. 6.13.
Ζ αλάιπζε ησλ κεηξήζεσλ πνηόηεηαο ηζρύνο ηάζεσο θαη ξεύκαηνο πνπ πξαγκαηνπνηνύληαη θαηά ηελ
πεξίνδν πιεύζεο ζην πινίν ππό κειέηε γηα θνξηίν Ζ/Γ PL,gi = 495kW (63.4% r,gi), κε επίπεδν θνξηίνπ
ξπζκηζηώλ ζηξνθώλ Pfan,i1-4 = 7.5kW, Ppump,i = 40kW θαη θαζκαηηθή αλάιπζε ζπρλνηήησλ έσο 5.5kHz
παξαηίζεληαη ζηνλ Πίλαθα 6.6. Ζ θαηαγξαθή ησλ ξεπκάησλ iLg,a, iLg,b, iLg,c γηα απηή ηελ θαηάζηαζε
ιεηηνπξγίαο παξνπζηάδεηαη ζην ρ. 6.14(α) θαη ε θαζκαηηθή αλάιπζε ησλ θπκαηνκνξθώλ παξνπζηάδεηαη
ζην ρ. 6.14(β). Αληίζηνηρα, ε θαηαγξαθή ησλ πνιηθώλ ηάζεσλ vLL,ab, vLL,bc, vLL,ac ζηελ έμνδν ηεο Ζ/Γ πξνο
ην δπγό, παξνπζηάδνληαη ζην ρ. 6.15(α) θαη ε αλάιπζε ηνπο ζε ζπρλόηεηεο έσο 5.5kHz ζην ρ. 6.15(β). Από
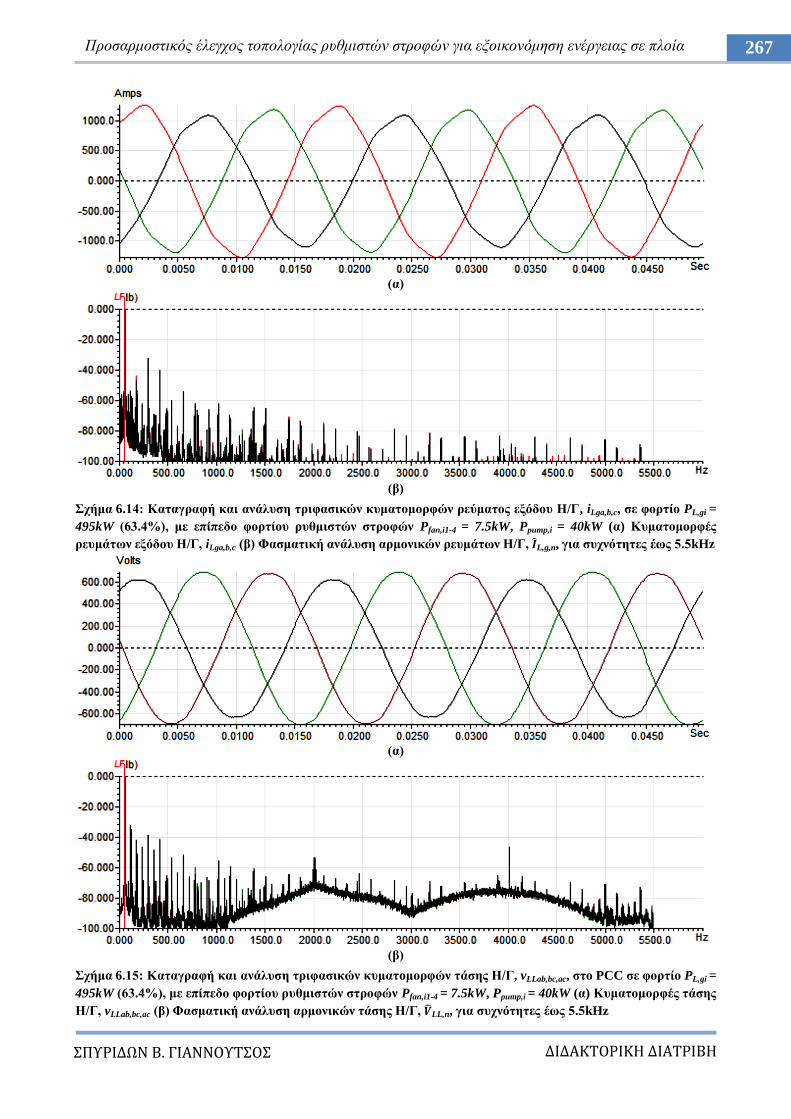
ΔΙΔΑΚΣΟΡΙΚΗ ΔΙΑΣΡΙΒΗ
ΠΤΡΙΔΩΝ Β. ΓΙΑΝΝΟΤΣΟ
267 Πξνζαξκνζηηθόο έιεγρνο ηνπνινγίαο ξπζκηζηώλ ζηξνθώλ γηα εμνηθνλόκεζε ελέξγεηαο ζε πινία
(α)
(β)
ρήκα 6.14: Καηαγξαθή θαη αλάιπζε ηξηθαζηθώλ θπκαηνκνξθώλ ξεύκαηνο εμόδνπ Η/Γ, iLga,b,c, ζε θνξηίν PL,gi =
495kW (63.4%), κε επίπεδν θνξηίνπ ξπζκηζηώλ ζηξνθώλ Pfan,i1-4 = 7.5kW, Ppump,i = 40kW (α) Κπκαηνκνξθέο
ξεπκάησλ εμόδνπ Η/Γ, iLga,b,c (β) Φαζκαηηθή αλάιπζε αξκνληθώλ ξεπκάησλ Η/Γ, L,g,n, γηα ζπρλόηεηεο έσο 5.5kHz
(α)
(β)
ρήκα 6.15: Καηαγξαθή θαη αλάιπζε ηξηθαζηθώλ θπκαηνκνξθώλ ηάζεο Η/Γ, vLLab,bc,ac, ζην PCC ζε θνξηίν PL,gi =
495kW (63.4%), κε επίπεδν θνξηίνπ ξπζκηζηώλ ζηξνθώλ Pfan,i1-4 = 7.5kW, Ppump,i = 40kW (α) Κπκαηνκνξθέο ηάζεο
Η/Γ, vLLab,bc,ac (β) Φαζκαηηθή αλάιπζε αξκνληθώλ ηάζεο Η/Γ, LL,n, γηα ζπρλόηεηεο έσο 5.5kHz
ΔΙΔΑΚΣΟΡΙΚΗ ΔΙΑΣΡΙΒΗ
ΠΤΡΙΔΩΝ Β. ΓΙΑΝΝΟΤΣΟ
268 Κεθάιαην 6 πζηεκαηηθή κειέηε πνηόηεηαο ηζρύνο πινίσλ γηα εθαξκνγή ξπζκηζηώλ ζηξνθώλ
Πίλαθαο 6.7: Μεηξήζεηο πνηόηεηαο ηζρύνο ηάζεο θαη ξεύκαηνο Η/Γ ζε θνξηίν PL,gi = 539kW (69.1%), κε επίπεδν
θνξηίνπ ξπζκηζηώλ ζηξνθώλ Pfan,i1-4 = 15kW, Ppump,i = 54kW θαη θαζκαηηθή αλάιπζε ζπρλνηήησλ έσο 5.5kHz
ηηο παξαπάλσ κεηξήζεηο, δηαπηζηώλεηαη όηη γηα κέζε rms ηηκή ξεύκαηνο Ζ/Γ, Lg,avg = 766.1 A, ην THDi% =
2.49%, κε κέζε rms ηηκή ηεο 5εο
αξκνληθήο ξεύκαηνο, Lg,avg.5 = 16.8 A θαη κέζε rms ηηκή ηεο 7εο
αξκνληθήο
ξεύκαηνο Lg,avg.7 = 7.0A. Δπηπιένλ, ην πνζνζηό ηεο αζπκκεηξίαο ξεπκάησλ εμόδνπ ηεο Ζ/Γ είλαη Lg,dev = 3.5%.
Αληίζηνηρα, δηαπηζηώλεηαη όηη γηα κέζε rms ηηκή ηάζεο εμόδνπ Ζ/Γ, LL,avg = 446.3 V, ν ζπληειεζηήο THDv%
= 2.88%, κε κέζε rms ηηκή ηεο 5εο
αξκνληθήο ηάζεο LL,avg,5 = 10 V θαη κέζε rms ηηκή ηεο 7εο
αξκνληθήο ηάζεο
LL,avg,7 = 6.7V. Δπηπιένλ ην πνζνζηό ηεο αζπκκεηξίαο ηάζεο εμόδνπ ηεο Ζ/Γ είλαη LL,dev = 0.7%. ην θάζκα
ζπρλνηήησλ ηεο ηάζεο εμόδνπ, παξνπζηάδνληαη θνξπθέο θεξδώλ ζρεηηθώλ κε ειεθηξνκαγλεηηθό ζόξπβν
ζηηο ζπρλόηεηεο f1 = 2kHz θαη f2 = 4kHz, θνληά ζηηο δηαθνπηηθέο ζπρλόηεηεο fsw = 2.5kHz θαη fsw = 4kHz
πνπ εξγάδνληαη νη ξπζκηζηέο ζηξνθώλ πνπ εθαξκόδνληαη ζηνπο θηλεηήξεο ησλ αλεκηζηήξσλ εμαεξηζκνύ θαη
ηεο αληιίαο παξνρήο ζαιαζζηλνύ λεξνύ ηνπ κεραλνζηαζίνπ ηνπ πινίνπ ππό κειέηε. Ζ κεησκέλε θαηαγξαθή
ειεθηξνκαγλεηηθνύ ζνξύβνπ ζην δίθηπν ηζρύνο νθείιεηαη ζηελ ηνπνζέηεζε EMC θίιηξνπ γηα ηελ απνθνπή
πςίζπρλνπ ζνξύβνπ θνηλνύ θαη δηαθνξηθνύ ζήκαηνο (CM θαη DM αληίζηνηρα), ώζηε λα ηθαλνπνηνύληαη ηα
όξηα θαηεγνξίαο C3, 2nd
environment ηνπ πξνηύπνπ EN/IEC 61800-3 [38].
Παξάιιεια, πξαγκαηνπνηνύληαη κεηξήζεηο θαη αλάιπζε πνηόηεηαο ηζρύνο ηάζεσο θαη ξεύκαηνο θαηά ηελ
πεξίνδν πιεύζεο ζην πινίν ππό κειέηε γηα θνξηίν Ζ/Γ PL,gi = 539kW (69.1% r,gi), κε απμεκέλν επίπεδν
θνξηίνπ ξπζκηζηώλ ζηξνθώλ Pfan,i1-4 = 15.0kW, Ppump,i = 54kW, ηα απνηειέζκαηα ησλ νπνίσλ παξαηίζεληαη
ζηνλ Πίλαθα 6.7. Ζ θαηαγξαθή ξεπκάησλ iLg,a, iLg,b, iLg,c γηα απηή ηελ θαηάζηαζε ιεηηνπξγίαο παξνπζηάδεηαη
ζην ρ. 6.16(α) θαη ε θαζκαηηθή αλάιπζε ησλ θπκαηνκνξθώλ παξνπζηάδεηαη ζην ρ. 6.16(β). Αληίζηνηρα, ε
θαηαγξαθή ησλ πνιηθώλ ηάζεσλ vLL,ab, vLL,bc, vLL,ac ζηελ έμνδν ηεο Ζ/Γ πξνο ην δπγό, παξνπζηάδνληαη ζην ρ.
6.17(α) θαη ε αλάιπζε ηνπο ζε ζπρλόηεηεο έσο 5.5kHz ζην ρ. 6.17(β). Από ηηο παξαπάλσ κεηξήζεηο,
δηαπηζηώλεηαη όηη γηα κέζε rms ηηκή ξεύκαηνο Ζ/Γ, Lg,avg = 840.4A, ν ζπληειεζηήο παξακόξθσζεο ηνπ
ξεύκαηνο απμάλεηαη ζε THDi% = 3.58%, κε κέζε rms ηηκή ηεο 5εο
αξκνληθήο ξεύκαηνο, Lg,avg.5 = 26.8 A θαη
κέζε rms ηηκή ηεο 7εο
αξκνληθήο ξεύκαηνο Lg,avg.7 = 13.3A. Δπηπιένλ, ην πνζνζηό ηεο αζπκκεηξίαο
ξεπκάησλ εμόδνπ ηεο Ζ/Γ είλαη Lg,dev = 3.3%. Αληίζηνηρα, δηαπηζηώλεηαη όηη γηα κέζε rms ηηκή ηάζεο
εμόδνπ Ζ/Γ, LL,avg = 445.9 V, ν ζπληειεζηήο αξκνληθήο παξακόξθσζεο ηεο ηάζεο επίζεο απμάλεηαη ζε
THDv% = 3.4%, κε κέζε rms ηηκή ηεο 5εο
αξκνληθήο ηάζεο LL,avg,5 = 12.3 V θαη κέζε rms ηηκή ηεο 7εο
αξκνληθήο ηάζεο LL,avg,7 = 7.9V. Δπηπιένλ ην πνζνζηό ηεο αζπκκεηξίαο ηάζεο εμόδνπ ηεο Ζ/Γ παξακέλεη
LL,dev=0.7%. ην θάζκα ζπρλνηήησλ ηεο ηάζεο εμόδνπ ζε απηήλ ηελ πεξίπησζε ιεηηνπξγίαο, παξνπζηάδεηαη
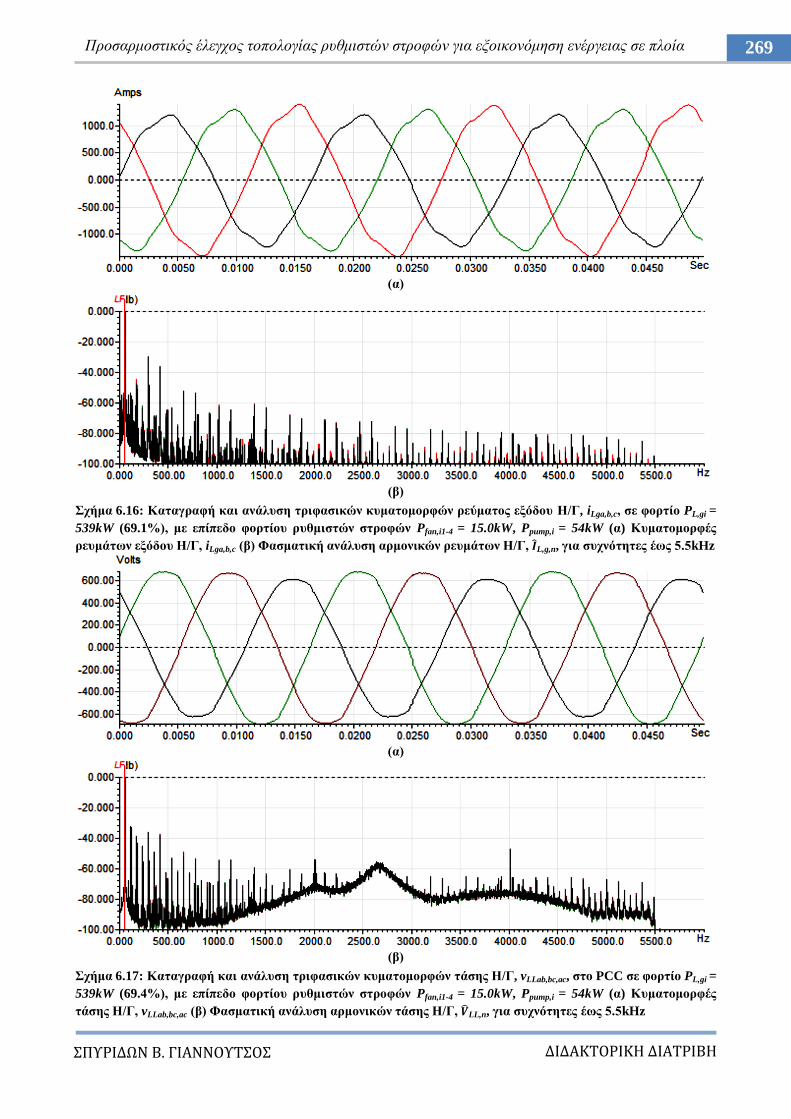
ΔΙΔΑΚΣΟΡΙΚΗ ΔΙΑΣΡΙΒΗ
ΠΤΡΙΔΩΝ Β. ΓΙΑΝΝΟΤΣΟ
269 Πξνζαξκνζηηθόο έιεγρνο ηνπνινγίαο ξπζκηζηώλ ζηξνθώλ γηα εμνηθνλόκεζε ελέξγεηαο ζε πινία
(α)
(β)
ρήκα 6.16: Καηαγξαθή θαη αλάιπζε ηξηθαζηθώλ θπκαηνκνξθώλ ξεύκαηνο εμόδνπ Η/Γ, iLga,b,c, ζε θνξηίν PL,gi =
539kW (69.1%), κε επίπεδν θνξηίνπ ξπζκηζηώλ ζηξνθώλ Pfan,i1-4 = 15.0kW, Ppump,i = 54kW (α) Κπκαηνκνξθέο
ξεπκάησλ εμόδνπ Η/Γ, iLga,b,c (β) Φαζκαηηθή αλάιπζε αξκνληθώλ ξεπκάησλ Η/Γ, L,g,n, γηα ζπρλόηεηεο έσο 5.5kHz
(α)
(β)
ρήκα 6.17: Καηαγξαθή θαη αλάιπζε ηξηθαζηθώλ θπκαηνκνξθώλ ηάζεο Η/Γ, vLLab,bc,ac, ζην PCC ζε θνξηίν PL,gi =
539kW (69.4%), κε επίπεδν θνξηίνπ ξπζκηζηώλ ζηξνθώλ Pfan,i1-4 = 15.0kW, Ppump,i = 54kW (α) Κπκαηνκνξθέο
ηάζεο Η/Γ, vLLab,bc,ac (β) Φαζκαηηθή αλάιπζε αξκνληθώλ ηάζεο Η/Γ, LL,n, γηα ζπρλόηεηεο έσο 5.5kHz
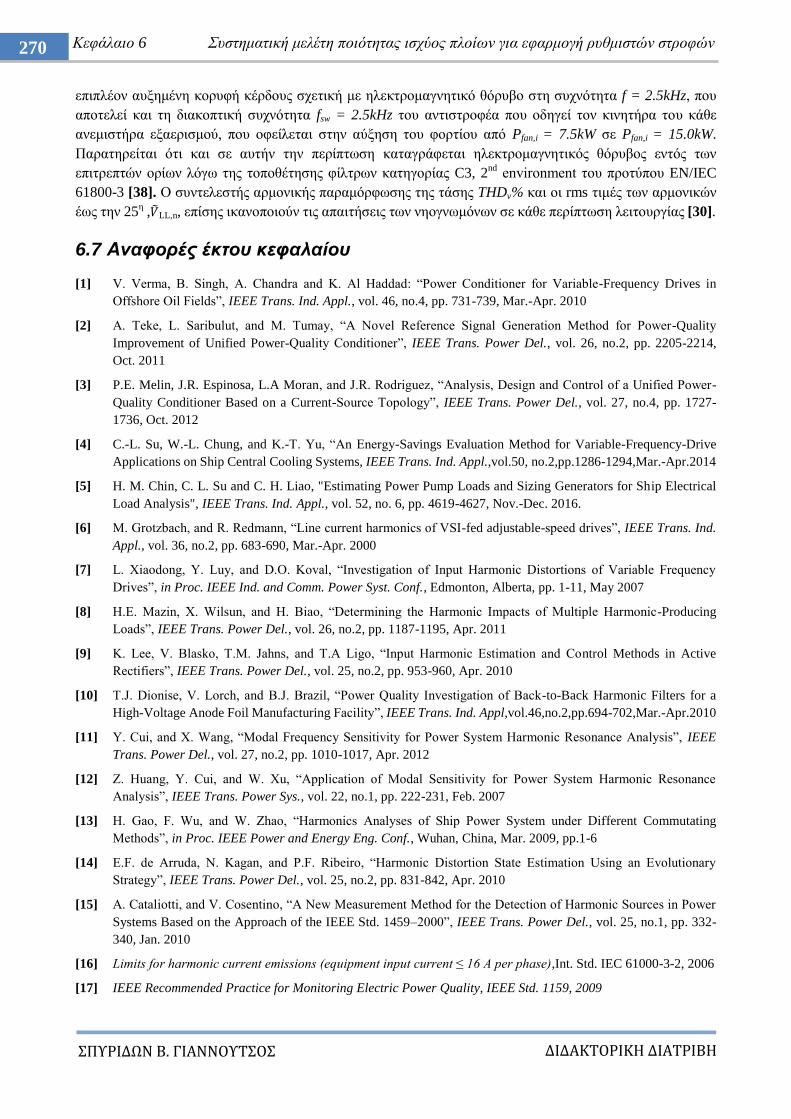
ΔΙΔΑΚΣΟΡΙΚΗ ΔΙΑΣΡΙΒΗ
ΠΤΡΙΔΩΝ Β. ΓΙΑΝΝΟΤΣΟ
270 Κεθάιαην 6 πζηεκαηηθή κειέηε πνηόηεηαο ηζρύνο πινίσλ γηα εθαξκνγή ξπζκηζηώλ ζηξνθώλ
επηπιένλ απμεκέλε θνξπθή θέξδνπο ζρεηηθή κε ειεθηξνκαγλεηηθό ζόξπβν ζηε ζπρλόηεηα f = 2.5kHz, πνπ
απνηειεί θαη ηε δηαθνπηηθή ζπρλόηεηα fsw = 2.5kHz ηνπ αληηζηξνθέα πνπ νδεγεί ηνλ θηλεηήξα ηνπ θάζε
αλεκηζηήξα εμαεξηζκνύ, πνπ νθείιεηαη ζηελ αύμεζε ηνπ θνξηίνπ από Pfan,i = 7.5kW ζε Pfan,i = 15.0kW.
Παξαηεξείηαη όηη θαη ζε απηήλ ηελ πεξίπησζε θαηαγξάθεηαη ειεθηξνκαγλεηηθόο ζόξπβνο εληόο ησλ
επηηξεπηώλ νξίσλ ιόγσ ηεο ηνπνζέηεζεο θίιηξσλ θαηεγνξίαο C3, 2nd
environment ηνπ πξνηύπνπ EN/IEC
61800-3 [38]. Ο ζπληειεζηήο αξκνληθήο παξακόξθσζεο ηεο ηάζεο THDv% θαη νη rms ηηκέο ησλ αξκνληθώλ
έσο ηελ 25ε , LL,n, επίζεο ηθαλνπνηνύλ ηηο απαηηήζεηο ησλ λενγλσκόλσλ ζε θάζε πεξίπησζε ιεηηνπξγίαο [30].
6.7 Αναθοπέρ έκηος κεθαλαίος
[1] V. Verma, B. Singh, A. Chandra and K. Al Haddad: “Power Conditioner for Variable-Frequency Drives in
Offshore Oil Fields”, IEEE Trans. Ind. Appl., vol. 46, no.4, pp. 731-739, Mar.-Apr. 2010
[2] A. Teke, L. Saribulut, and M. Tumay, “A Novel Reference Signal Generation Method for Power-Quality
Improvement of Unified Power-Quality Conditioner”, IEEE Trans. Power Del., vol. 26, no.2, pp. 2205-2214,
Oct. 2011
[3] P.E. Melin, J.R. Espinosa, L.A Moran, and J.R. Rodriguez, “Analysis, Design and Control of a Unified Power-
Quality Conditioner Based on a Current-Source Topology”, IEEE Trans. Power Del., vol. 27, no.4, pp. 1727-
1736, Oct. 2012
[4] C.-L. Su, W.-L. Chung, and K.-T. Yu, “An Energy-Savings Evaluation Method for Variable-Frequency-Drive
Applications on Ship Central Cooling Systems, IEEE Trans. Ind. Appl.,vol.50, no.2,pp.1286-1294,Mar.-Apr.2014
[5] H. M. Chin, C. L. Su and C. H. Liao, "Estimating Power Pump Loads and Sizing Generators for Ship Electrical
Load Analysis", IEEE Trans. Ind. Appl., vol. 52, no. 6, pp. 4619-4627, Nov.-Dec. 2016.
[6] M. Grotzbach, and R. Redmann, “Line current harmonics of VSI-fed adjustable-speed drives”, IEEE Trans. Ind.
Appl., vol. 36, no.2, pp. 683-690, Mar.-Apr. 2000
[7] L. Xiaodong, Y. Luy, and D.O. Koval, “Investigation of Input Harmonic Distortions of Variable Frequency
Drives”, in Proc. IEEE Ind. and Comm. Power Syst. Conf., Edmonton, Alberta, pp. 1-11, May 2007
[8] H.E. Mazin, X. Wilsun, and H. Biao, “Determining the Harmonic Impacts of Multiple Harmonic-Producing
Loads”, IEEE Trans. Power Del., vol. 26, no.2, pp. 1187-1195, Apr. 2011
[9] K. Lee, V. Blasko, T.M. Jahns, and T.A Ligo, “Input Harmonic Estimation and Control Methods in Active
Rectifiers”, IEEE Trans. Power Del., vol. 25, no.2, pp. 953-960, Apr. 2010
[10] T.J. Dionise, V. Lorch, and B.J. Brazil, “Power Quality Investigation of Back-to-Back Harmonic Filters for a
High-Voltage Anode Foil Manufacturing Facility”, IEEE Trans. Ind. Appl,vol.46,no.2,pp.694-702,Mar.-Apr.2010
[11] Y. Cui, and X. Wang, “Modal Frequency Sensitivity for Power System Harmonic Resonance Analysis”, IEEE
Trans. Power Del., vol. 27, no.2, pp. 1010-1017, Apr. 2012
[12] Z. Huang, Y. Cui, and W. Xu, “Application of Modal Sensitivity for Power System Harmonic Resonance
Analysis”, IEEE Trans. Power Sys., vol. 22, no.1, pp. 222-231, Feb. 2007
[13] H. Gao, F. Wu, and W. Zhao, “Harmonics Analyses of Ship Power System under Different Commutating
Methods”, in Proc. IEEE Power and Energy Eng. Conf., Wuhan, China, Mar. 2009, pp.1-6
[14] E.F. de Arruda, N. Kagan, and P.F. Ribeiro, “Harmonic Distortion State Estimation Using an Evolutionary
Strategy”, IEEE Trans. Power Del., vol. 25, no.2, pp. 831-842, Apr. 2010
[15] A. Cataliotti, and V. Cosentino, “A New Measurement Method for the Detection of Harmonic Sources in Power
Systems Based on the Approach of the IEEE Std. 1459–2000”, IEEE Trans. Power Del., vol. 25, no.1, pp. 332-
340, Jan. 2010
[16] Limits for harmonic current emissions (equipment input current ≤ 16 A per phase),Int. Std. IEC 61000-3-2, 2006
[17] IEEE Recommended Practice for Monitoring Electric Power Quality, IEEE Std. 1159, 2009
ΔΙΔΑΚΣΟΡΙΚΗ ΔΙΑΣΡΙΒΗ
ΠΤΡΙΔΩΝ Β. ΓΙΑΝΝΟΤΣΟ
271 Πξνζαξκνζηηθόο έιεγρνο ηνπνινγίαο ξπζκηζηώλ ζηξνθώλ γηα εμνηθνλόκεζε ελέξγεηαο ζε πινία
[18] P. Crapse, J. Wang, J. Abrams, and Y.-J. Shin, “Power Quality Assessment and Management in an Electric Ship
Power System”, in Proc. IEEE Electric Ship Techn. Symp., Arlington, Virginia, May 2007, pp. 328-334
[19] S. Bourget, P. Guerin and R. Le Doeuff: “Analysis of the interharmonics generated by a ship propulsion system”,
in Proc. IEEE Harm. and Qual. of Power Int. Conf., Lake Placid, New York, Sept. 2004, pp. 465-470
[20] P.F. Ribeiro, M. Steuer, and M. Islam, “Reevaluating electric power system harmonic distortion limits for
shipboard systems”, Proc. IEEE Harm. Qual. of Power Int. Conf., Lake Placid,New York,Sept.2004, pp.706-711
[21] T. Hoevenaars, I. Evans and A. Lawson: “New marine harmonic standards”, IEEE Ind. Appl. Mag.,vol.16,no.1,
pp.16-25, Jan.-Feb. 2010
[22] X. Xu, M. He, and H. Zheng, “Study of Electric Power Quality Improvement in Ship Networks”, in Proc. IEEE
Ind. Electron. and Appl. Conf., Singapore, May 2006, pp.1-6
[23] S.X. Duarte and N. Kagan: “A Power-Quality Index to Assess the Impact of Voltage Harmonic Distortions and
Unbalance to Three-Phase Induction Motors”, IEEE Trans. Power Del., vol. 25, no.3, pp. 1846-1854, Jul. 2010
[24] K. Lee, G. Venkataramanan and T.M. Jahns, “Modeling Effects of Voltage Unbalances in Industrial Distribution
Systems with Adjustable-Speed Drives”, IEEE Trans. Ind. Appl., vol. 44, no.5, pp. 1322-1332, Sept.-Oct. 2008
[25] M. H. Chou, C. L. Su, Y. C. Lee, H. M. Chin, G. Parise, and P. Chavdarian, "Voltage-Drop Calculations and
Power Cable Designs for Harbor Electrical Distribution Systems With High Voltge Shore Connection", IEEE
Trans. Ind. Appl., vol. 53, no. 3, pp. 1807-1814, May-June 2017.
[26] T. Thasananutariya, and S. Chatratana, “Planning Study of Harmonic Filter for ASDs in Industrial Facilities”,
IEEE Trans. Ind. Appl., vol. 45, no.1, pp. 295-302, Jan.-Feb. 2009
[27] L. Xiaodong, O. Ilochonwu, and J. Lim, “Influence of reactors on input harmonics of variable frequency drives”,
IEEE Trans. Ind. Appl., vol. 47, no.5, pp. 2195-2203, Sept.-Oct. 2011
[28] C.-L. Su, and C.-J. Hong, “Design of passive harmonic filters to enhance power quality and energy efficiency in
ship power systems”, in Proc. IEEE Ind. Com. Power Sys. Tech. Conf.,Stone Mountain, Georgia, Apr.-May
2013, pp. 1-8
[29] P. Salmeron, and S.P. Litran, “Improvement of the Electric Power Quality Using Series Active and Shunt
Passive Filters”, IEEE Trans. Power Del., vol. 25, no.2, pp. 1058-1067, Apr. 2010
[30] American Bureau of Shipping (ABS), “ Rules for Building and Classing Steel Vessels 2013 Part 4: Vessel
Systems and Machinery”, [Online]Available:
http://www.eagle.org/eagleExternalPortalWEB/ShowProperty/BEA%20Repository/Rules&Guides/Archives/2_S
VR_2013
[31] Δlspec, “Elspec G4430 Power Quality Analyzer”, [Online] Available: http://elspec-ltd.com/support/manuals/
[32] A. Binder, and A. Muetze, “Scaling Effects of Inverter-Induced Bearing Currents in AC Machines”, IEEE Trans.
Ind. Appl., vol. 44, no.3, pp. 769-776, May-Jun. 2008
[33] O. Magdun, and A. Binder, “High-Frequency Induction Machine Modeling for Common Mode Current and
Bearing Voltage Calculation”, IEEE Trans. Ind. Appl., vol. 50, no.3, pp. 1780-1790, May-Jun. 2014
[34] Δlspec, “PQ-SCADA Software”, [Online] Available: http://elspec-ltd.com/power-quality-software-pqscada-
software/
[35] Compatibility levels in industrial plants for low-frequency conducted disturbances, Int. Std. IEC 61000-2-4,2002
[36] Testing and measurement techniques – Power quality measurement methods, Int. Std. IEC 61000-4-30, 2003
[37] Hioki, “Hioki PW3198 Power Analyzer 3-Phase 4-Wire Power Quality Analyzer Compliant to IEC61000-4-30
Class A Standards”, [Online] Available: https://www.hioki.com/en/products/detail/?product_key=5591
[38] International Electrotechnical Commission – IEC, “IEC 61800-3:2004 – “Adjustable speed electrical power
drive systems - Part 3: EMC requirements and specific test methods”, [Online]. Available:
https://webstore.iec.ch/publication/5933
ΔΙΔΑΚΣΟΡΙΚΗ ΔΙΑΣΡΙΒΗ
ΠΤΡΙΔΩΝ Β. ΓΙΑΝΝΟΤΣΟ
272 Κεθάιαην 7 Βειηηζηνπνίεζε ηζνδπγίνπ ηζρύνο πινίνπ θαη ζύλνςε απνηειεζκάησλ
Κεθάιαην 7
Βειηηζηνπνίεζε ηζνδπγίνπ ηζρύνο πινίνπ θαη
θαηαλάισζεο θαπζίκνπ Ζ/Γ – πκπεξάζκαηα
7.1 Διζαγυγή
Σν ζύζηεκα ειεθηξηθήο ηζρύνο ηνπ πινίνπ ππνβάιιεηαη νινέλα θαη ζε πεξηζζόηεξεο δνκηθέο αιιαγέο κε
ζηξαηεγηθέο ειέγρνπ πνπ εηζάγνπλ λέεο κεζόδνπο δηαρείξηζεο ηεο ξνήο θνξηίνπ κε ζθνπό λα επηηεπρζεί
κεγαιύηεξε επειημία, αμηνπηζηία θαη κείσζε ηεο θαηαλάισζεο θαπζίκνπ [1]-[2]. Ζ βέιηηζηε ρξήζε ησλ Ζ/Γ
γηα ηελ εμππεξέηεζε ηνπ θνξηίνπ πξαγκαηνπνηείηαη κέζσ ηνπ απηόκαηνπ ζπζηήκαηνο δηαρείξηζεο ηζρύνο –
PMS, έηζη ώζηε λα ηθαλνπνηεζνύλ νη πεξηνξηζκνί ζπλερνύο αζθαινύο θόξηηζεο θαη επζηάζεηαο θαηά ηε
κεηαβαηηθή κεηαβνιή θνξηίνπ, θαζώο θαη γηα λα δηαηεξεζεί επαξθέο πεξηζώξην δηαζέζηκεο ηζρύνο γηα ηελ
απνθπγή απώιεηαο ηξνθνδνζίαο [3]-[5]. ε ιεηηνπξγηθό επίπεδν, εθαξκόδνληαη κέζνδνη πξνγξακκαηηζκνύ
θαη δηαρείξηζεο ηζρύνο κε βάζε ηε δήηεζε [6], θαζώο θαη κέζνδνη πνπ ππνζηεξίδνπλ ηε δηαρείξηζε ηζρύνο ζε
πεξηπηώζεηο δπλακηθήο κεηαβνιήο θνξηίνπ κε βάζε ηελ θαηάζηαζε ησλ δηαθνπηώλ ηζρύνο ησλ θνξηίσλ θαη
ησλ Ζ/Γ [7]-[9]. Ζ απμαλόκελε δηείζδπζε ησλ κεηαηξνπέσλ ειεθηξνληθώλ ηζρύνο ζε θύξηνπο ηνκείο ηνπ
ζπζηήκαηνο δηαλνκήο ειεθηξηθήο ηζρύνο ηνπ πινίνπ, πεξηιακβάλνληαο ηηο δηαδηθαζίεο πξόσζεο, δηεξγαζηώλ
κεραλνζηαζίνπ θαη ηε ιεηηνπξγία ησλ βνεζεηηθώλ κεραλεκάησλ, νδεγεί ζηε κείσζε ηεο θαηαλάισζεο
θαπζίκνπ θαη ησλ εθπνκπώλ ξύπσλ [10]. Γηα ηε βειηίσζε ηεο απόδνζεο ηνπ ζπζηήκαηνο ζε πεξηπηώζεηο
ειεθηξνπξόσζεο, κπνξνύλ λα εθαξκνζηνύλ πξνβιεπηηθέο κέζνδνη δπλακηθνύ πξνγξακκαηηζκνύ γηα ηελ
εθηίκεζε ηεο ηαρύηεηαο ηνπ πινίνπ θαη ηνπ ζπλνιηθνύ θνξηίνπ ησλ Ζ/Γ, έηζη ώζηε λα γίλεηαη απνζήθεπζε
ηεο ελέξγεηαο ζε ρακειή ηαρύηεηα πιεύζεο θαη ρξήζεο ζε πεξηπηώζεηο πςειήο δήηεζεο [11]-[12]. Άιιεο
κέζνδνη πεξηιακβάλνπλ ηελ ηνπνζέηεζε νκάδσλ ππθλσηώλ γηα βειηίσζε ζπληειεζηή ηζρύνο [13]. Χζηόζν,
απηέο νη κέζνδνη, είηε εθαξκόδνληαη ζε νξηζκέλεο θαηεγνξίεο πινίσλ, ή παξνπζηάδνπλ πξαθηηθά πξνβιήκαηα
θαηά ηελ πινπνίεζε ηνπο ρσξίο κεγάιν νηθνλνκηθό όθεινο.
ηε ζεκεξηλή επνρή ιόγσ ηνπ απμεκέλνπ θόζηνπο θαπζίκνπ, εθαξκόδεηαη ζπρλά ε πξαθηηθή κείσζεο
ηεο ηαρύηεηαο πιεύζεο, πνπ πεξηιακβάλεη ηε ιεηηνπξγία ηεο Κ/Μ ηνπ πινίνπ ζε ρακειή ηαρύηεηα θαη θνξηίν
[14], νδεγώληαο ζε κεηαβνιέο ηνπ ηζνδπγίνπ ηζρύνο ζην απηόλνκν ζύζηεκα ειεθηξηθήο ηζρύνο ηνπ πινίνπ
θαηά ηελ πεξίνδν πιεύζεο, εθόζνλ ε απμεκέλε δήηεζε ειεθηξηθνύ θνξηίνπ πξνϋπνζέηεη ηε ζπρλή ρξήζε
επηπιένλ Ζ/Γ ζπλδεδεκέλεο παξάιιεια, πξνθεηκέλνπ λα ηθαλνπνηεζνύλ ηα όξηα ηνπ ζπζηήκαηνο δηαρείξηζεο
ηζρύνο σο πξνο ηε δηαζέζηκε ηζρύ, απμάλνληαο όκσο έηζη ηελ εηδηθή θαηαλάισζε θαπζίκνπ (SFOCD/G) θαη
ηηο εθπνκπέο ξύπσλ. Όπσο δηαπηζηώζεθε από ηελ κειέηε, ε πξαθηηθή κείσζεο ηεο ηαρύηεηαο πιεύζεο
νδεγεί ζε ρακειόηεξεο απαηηήζεηο παξνρήο αέξα ζην κεραλνζηάζην γηα θαύζε θαη απαγσγή ηεο ζεξκόηεηαο
θαη ζε κηθξόηεξεο απαηηήζεηο παξνρήο ζαιαζζηλνύ λεξνύ ζηνλ θεληξηθό ελαιιάθηε ζεξκόηεηαο γηα ηελ
εμππεξέηεζε ηεο δηεξγαζίαο ςύμεο ηεο Κ/Μ, ησλ Ζ/Γ θαη ησλ βνεζεηηθώλ κεραλεκάησλ [15]-[16]. Γηα λα
επηηεπρζεί ελεξγεηαθή βειηηζηνπνίεζε ζην δίθηπν ηζρύνο, ζρεδηάζηεθε, αλαπηύρζεθε θαη πινπνηήζεθε
ζζελαξόο πξνζαξκνζηηθόο έιεγρνο κεηαβιεηώλ ζηξνθώλ ησλ θηλεηήξσλ πνπ ζπζρεηίδνληαη κε απηέο ηηο
δηεξγαζίεο κε βάζε ηα δεδνκέλα θαη ηηο κεηαβαιιόκελεο απαηηήζεηο θαη πεξηνξηζκνύο ησλ δηεξγαζηώλ. Με
ην πεξηζώξην ηζρύνο πνπ δεκηνπξγείηαη κέζσ ηεο ειεγρόκελεο ιεηηνπξγίαο κεηαβιεηώλ ζηξνθώλ ησλ
θηλεηήξσλ πνπ νδεγνύλ ηνπο αλεκηζηήξεο εμαεξηζκνύ ηνπ κεραλνζηαζίνπ θαη ηελ αληιία παξνρήο
ζαιαζζηλνύ λεξνύ αλάινγα κε ηε ιεηηνπξγηθή θαηάζηαζε ηνπ πινίνπ ζε ζρέζε κε ηελ πξόηεξε θαηάζηαζε,
δίλεηαη ε δπλαηόηεηα βειηηζηνπνίεζεο ηνπ ηζνδπγίνπ ηζρύνο θαη ηνπ πξνθίι ιεηηνπξγίαο ησλ Ζ/Γ ηδηαίηεξα
θαηά ηελ πεξίνδν πιεύζεο [16]-[17]. Αληηζηαζκίδνληαο ην απμεκέλν επίπεδν θνξηίνπ ζην ειεθηξηθό δίθηπν
ηνπ πινίνπ θαηά ηε δηάξθεηα εθαξκνγήο ηεο πξαθηηθήο κείσζεο ηεο ηαρύηεηαο πιεύζεο, κε ην πεξηζώξην
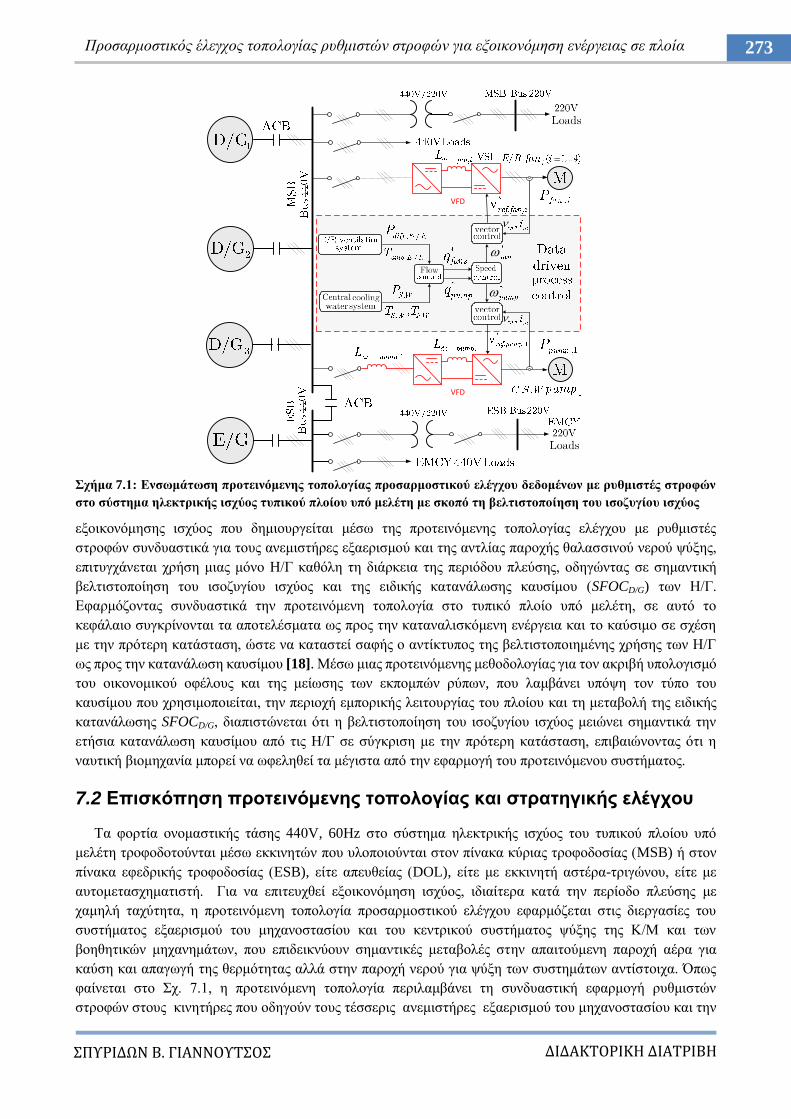
ΔΙΔΑΚΣΟΡΙΚΗ ΔΙΑΣΡΙΒΗ
ΠΤΡΙΔΩΝ Β. ΓΙΑΝΝΟΤΣΟ
273 Πξνζαξκνζηηθόο έιεγρνο ηνπνινγίαο ξπζκηζηώλ ζηξνθώλ γηα εμνηθνλόκεζε ελέξγεηαο ζε πινία
ρήκα 7.1: Δλζσκάησζε πξνηεηλόκελεο ηνπνινγίαο πξνζαξκνζηηθνύ ειέγρνπ δεδνκέλσλ κε ξπζκηζηέο ζηξνθώλ
ζην ζύζηεκα ειεθηξηθήο ηζρύνο ηππηθνύ πινίνπ ππό κειέηε κε ζθνπό ηε βειηηζηνπνίεζε ηνπ ηζνδπγίνπ ηζρύνο
εμνηθνλόκεζεο ηζρύνο πνπ δεκηνπξγείηαη κέζσ ηεο πξνηεηλόκελεο ηνπνινγίαο ειέγρνπ κε ξπζκηζηέο
ζηξνθώλ ζπλδπαζηηθά γηα ηνπο αλεκηζηήξεο εμαεξηζκνύ θαη ηεο αληιίαο παξνρήο ζαιαζζηλνύ λεξνύ ςύμεο,
επηηπγράλεηαη ρξήζε κηαο κόλν Ζ/Γ θαζόιε ηε δηάξθεηα ηεο πεξηόδνπ πιεύζεο, νδεγώληαο ζε ζεκαληηθή
βειηηζηνπνίεζε ηνπ ηζνδπγίνπ ηζρύνο θαη ηεο εηδηθήο θαηαλάισζεο θαπζίκνπ (SFOCD/G) ησλ Ζ/Γ.
Δθαξκόδνληαο ζπλδπαζηηθά ηελ πξνηεηλόκελε ηνπνινγία ζην ηππηθό πινίν ππό κειέηε, ζε απηό ην
θεθάιαην ζπγθξίλνληαη ηα απνηειέζκαηα σο πξνο ηελ θαηαλαιηζθόκελε ελέξγεηα θαη ην θαύζηκν ζε ζρέζε
κε ηελ πξόηεξε θαηάζηαζε, ώζηε λα θαηαζηεί ζαθήο ν αληίθηππνο ηεο βειηηζηνπνηεκέλεο ρξήζεο ησλ Ζ/Γ
σο πξνο ηελ θαηαλάισζε θαπζίκνπ [18]. Μέζσ κηαο πξνηεηλόκελεο κεζνδνινγίαο γηα ηνλ αθξηβή ππνινγηζκό
ηνπ νηθνλνκηθνύ νθέινπο θαη ηεο κείσζεο ησλ εθπνκπώλ ξύπσλ, πνπ ιακβάλεη ππόςε ηνλ ηύπν ηνπ
θαπζίκνπ πνπ ρξεζηκνπνηείηαη, ηελ πεξηνρή εκπνξηθήο ιεηηνπξγίαο ηνπ πινίνπ θαη ηε κεηαβνιή ηεο εηδηθήο
θαηαλάισζεο SFOCD/G, δηαπηζηώλεηαη όηη ε βειηηζηνπνίεζε ηνπ ηζνδπγίνπ ηζρύνο κεηώλεη ζεκαληηθά ηελ
εηήζηα θαηαλάισζε θαπζίκνπ από ηηο Ζ/Γ ζε ζύγθξηζε κε ηελ πξόηεξε θαηάζηαζε, επηβαηώλνληαο όηη ε
λαπηηθή βηνκεραλία κπνξεί λα σθειεζεί ηα κέγηζηα από ηελ εθαξκνγή ηνπ πξνηεηλόκελνπ ζπζηήκαηνο.
7.2 Δπηζθόπεζε πξνηεηλόκελεο ηνπνινγίαο θαη ζηξαηεγηθήο ειέγρνπ
Σα θνξηία νλνκαζηηθήο ηάζεο 440V, 60Hz ζην ζύζηεκα ειεθηξηθήο ηζρύνο ηνπ ηππηθνύ πινίνπ ππό
κειέηε ηξνθνδνηνύληαη κέζσ εθθηλεηώλ πνπ πινπνηνύληαη ζηνλ πίλαθα θύξηαο ηξνθνδνζίαο (MSB) ή ζηνλ
πίλαθα εθεδξηθήο ηξνθνδνζίαο (ESB), είηε απεπζείαο (DOL), είηε κε εθθηλεηή αζηέξα-ηξηγώλνπ, είηε κε
απηνκεηαζρεκαηηζηή. Γηα λα επηηεπρζεί εμνηθνλόκεζε ηζρύνο, ηδηαίηεξα θαηά ηελ πεξίνδν πιεύζεο κε
ρακειή ηαρύηεηα, ε πξνηεηλόκελε ηνπνινγία πξνζαξκνζηηθνύ ειέγρνπ εθαξκόδεηαη ζηηο δηεξγαζίεο ηνπ
ζπζηήκαηνο εμαεξηζκνύ ηνπ κεραλνζηαζίνπ θαη ηνπ θεληξηθνύ ζπζηήκαηνο ςύμεο ηεο Κ/Μ θαη ησλ
βνεζεηηθώλ κεραλεκάησλ, πνπ επηδεηθλύνπλ ζεκαληηθέο κεηαβνιέο ζηελ απαηηνύκελε παξνρή αέξα γηα
θαύζε θαη απαγσγή ηεο ζεξκόηεηαο αιιά ζηελ παξνρή λεξνύ γηα ςύμε ησλ ζπζηεκάησλ αληίζηνηρα. Όπσο
θαίλεηαη ζην ρ. 7.1, ε πξνηεηλόκελε ηνπνινγία πεξηιακβάλεη ηε ζπλδπαζηηθή εθαξκνγή ξπζκηζηώλ
ζηξνθώλ ζηνπο θηλεηήξεο πνπ νδεγνύλ ηνπο ηέζζεξηο αλεκηζηήξεο εμαεξηζκνύ ηνπ κεραλνζηαζίνπ θαη ηελ
VFD
VFD
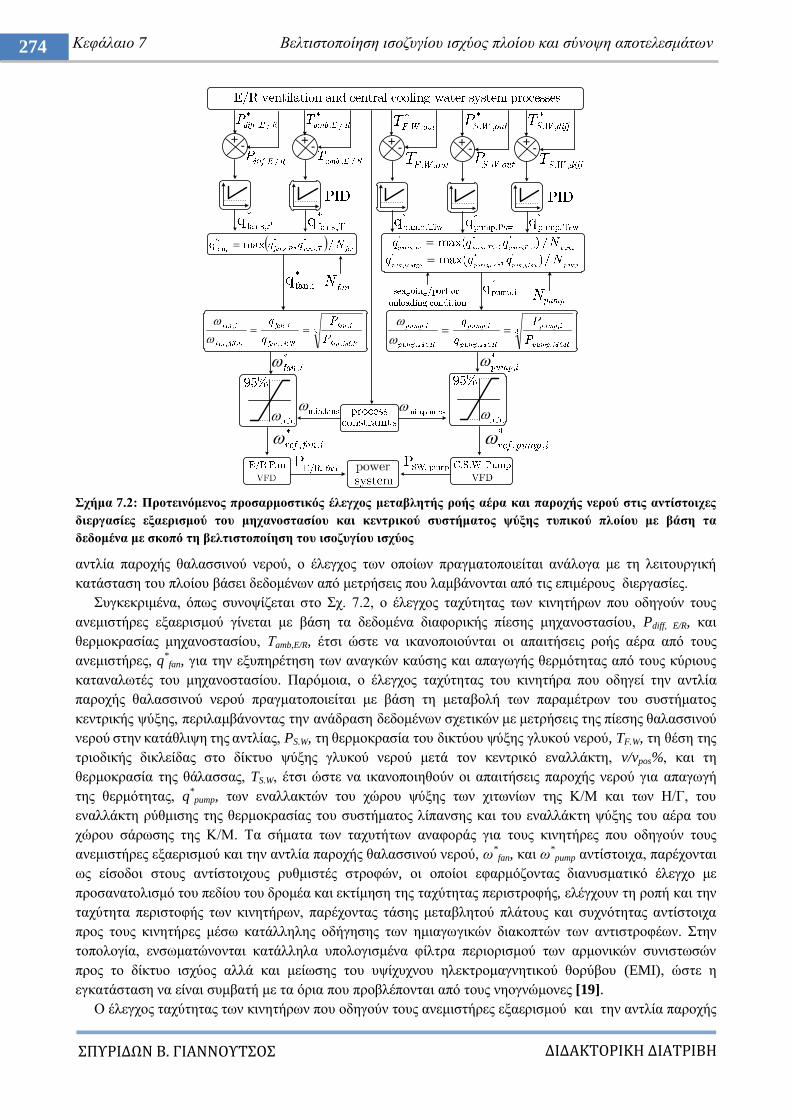
ΔΙΔΑΚΣΟΡΙΚΗ ΔΙΑΣΡΙΒΗ
ΠΤΡΙΔΩΝ Β. ΓΙΑΝΝΟΤΣΟ
274 Κεθάιαην 7 Βειηηζηνπνίεζε ηζνδπγίνπ ηζρύνο πινίνπ θαη ζύλνςε απνηειεζκάησλ
ρήκα 7.2: Πξνηεηλόκελνο πξνζαξκνζηηθόο έιεγρνο κεηαβιεηήο ξνήο αέξα θαη παξνρήο λεξνύ ζηηο αληίζηνηρεο
δηεξγαζίεο εμαεξηζκνύ ηνπ κεραλνζηαζίνπ θαη θεληξηθνύ ζπζηήκαηνο ςύμεο ηππηθνύ πινίνπ κε βάζε ηα
δεδνκέλα κε ζθνπό ηε βειηηζηνπνίεζε ηνπ ηζνδπγίνπ ηζρύνο
αληιία παξνρήο ζαιαζζηλνύ λεξνύ, ν έιεγρνο ησλ νπνίσλ πξαγκαηνπνηείηαη αλάινγα κε ηε ιεηηνπξγηθή
θαηάζηαζε ηνπ πινίνπ βάζεη δεδνκέλσλ από κεηξήζεηο πνπ ιακβάλνληαη από ηηο επηκέξνπο δηεξγαζίεο.
πγθεθξηκέλα, όπσο ζπλνςίδεηαη ζην ρ. 7.2, ν έιεγρνο ηαρύηεηαο ησλ θηλεηήξσλ πνπ νδεγνύλ ηνπο
αλεκηζηήξεο εμαεξηζκνύ γίλεηαη κε βάζε ηα δεδνκέλα δηαθνξηθήο πίεζεο κεραλνζηαζίνπ, Pdiff, E/R, θαη
ζεξκνθξαζίαο κεραλνζηαζίνπ, Σamb,E/R, έηζη ώζηε λα ηθαλνπνηνύληαη νη απαηηήζεηο ξνήο αέξα από ηνπο
αλεκηζηήξεο, q*
fan, γηα ηελ εμππεξέηεζε ησλ αλαγθώλ θαύζεο θαη απαγσγήο ζεξκόηεηαο από ηνπο θύξηνπο
θαηαλαισηέο ηνπ κεραλνζηαζίνπ. Παξόκνηα, ν έιεγρνο ηαρύηεηαο ηνπ θηλεηήξα πνπ νδεγεί ηελ αληιία
παξνρήο ζαιαζζηλνύ λεξνύ πξαγκαηνπνηείηαη κε βάζε ηε κεηαβνιή ησλ παξακέηξσλ ηνπ ζπζηήκαηνο
θεληξηθήο ςύμεο, πεξηιακβάλνληαο ηελ αλάδξαζε δεδνκέλσλ ζρεηηθώλ κε κεηξήζεηο ηεο πίεζεο ζαιαζζηλνύ
λεξνύ ζηελ θαηάζιηςε ηεο αληιίαο, PS.W, ηε ζεξκνθξαζία ηνπ δηθηύνπ ςύμεο γιπθνύ λεξνύ, TF.W, ηε ζέζε ηεο
ηξηνδηθήο δηθιείδαο ζην δίθηπν ςύμεο γιπθνύ λεξνύ κεηά ηνλ θεληξηθό ελαιιάθηε, v/vpos%, θαη ηε
ζεξκνθξαζία ηεο ζάιαζζαο, TS.W, έηζη ώζηε λα ηθαλνπνηεζνύλ νη απαηηήζεηο παξνρήο λεξνύ γηα απαγσγή
ηεο ζεξκόηεηαο, q*pump, ησλ ελαιιαθηώλ ηνπ ρώξνπ ςύμεο ησλ ρηησλίσλ ηεο Κ/Μ θαη ησλ Ζ/Γ, ηνπ
ελαιιάθηε ξύζκηζεο ηεο ζεξκνθξαζίαο ηνπ ζπζηήκαηνο ιίπαλζεο θαη ηνπ ελαιιάθηε ςύμεο ηνπ αέξα ηνπ
ρώξνπ ζάξσζεο ηεο Κ/Μ. Σα ζήκαηα ησλ ηαρπηήησλ αλαθνξάο γηα ηνπο θηλεηήξεο πνπ νδεγνύλ ηνπο
αλεκηζηήξεο εμαεξηζκνύ θαη ηελ αληιία παξνρήο ζαιαζζηλνύ λεξνύ, σ*
fan, θαη σ*
pump αληίζηνηρα, παξέρνληαη
σο είζνδνη ζηνπο αληίζηνηρνπο ξπζκηζηέο ζηξνθώλ, νη νπνίνη εθαξκόδνληαο δηαλπζκαηηθό έιεγρν κε
πξνζαλαηνιηζκό ηνπ πεδίνπ ηνπ δξνκέα θαη εθηίκεζε ηεο ηαρύηεηαο πεξηζηξνθήο, ειέγρνπλ ηε ξνπή θαη ηελ
ηαρύηεηα πεξηζηνθήο ησλ θηλεηήξσλ, παξέρνληαο ηάζεο κεηαβιεηνύ πιάηνπο θαη ζπρλόηεηαο αληίζηνηρα
πξνο ηνπο θηλεηήξεο κέζσ θαηάιιειεο νδήγεζεο ησλ εκηαγσγηθώλ δηαθνπηώλ ησλ αληηζηξνθέσλ. ηελ
ηνπνινγία, ελζσκαηώλνληαη θαηάιιεια ππνινγηζκέλα θίιηξα πεξηνξηζκνύ ησλ αξκνληθώλ ζπληζησζώλ
πξνο ην δίθηπν ηζρύνο αιιά θαη κείσζεο ηνπ πςίρπρλνπ ειεθηξνκαγλεηηθνύ ζνξύβνπ (EMI), ώζηε ε
εγθαηάζηαζε λα είλαη ζπκβαηή κε ηα όξηα πνπ πξνβιέπνληαη από ηνπο λενγλώκνλεο [19].
Ο έιεγρνο ηαρύηεηαο ησλ θηλεηήξσλ πνπ νδεγνύλ ηνπο αλεκηζηήξεο εμαεξηζκνύ θαη ηελ αληιία παξνρήο
-+
-+
-+
-+ -
+
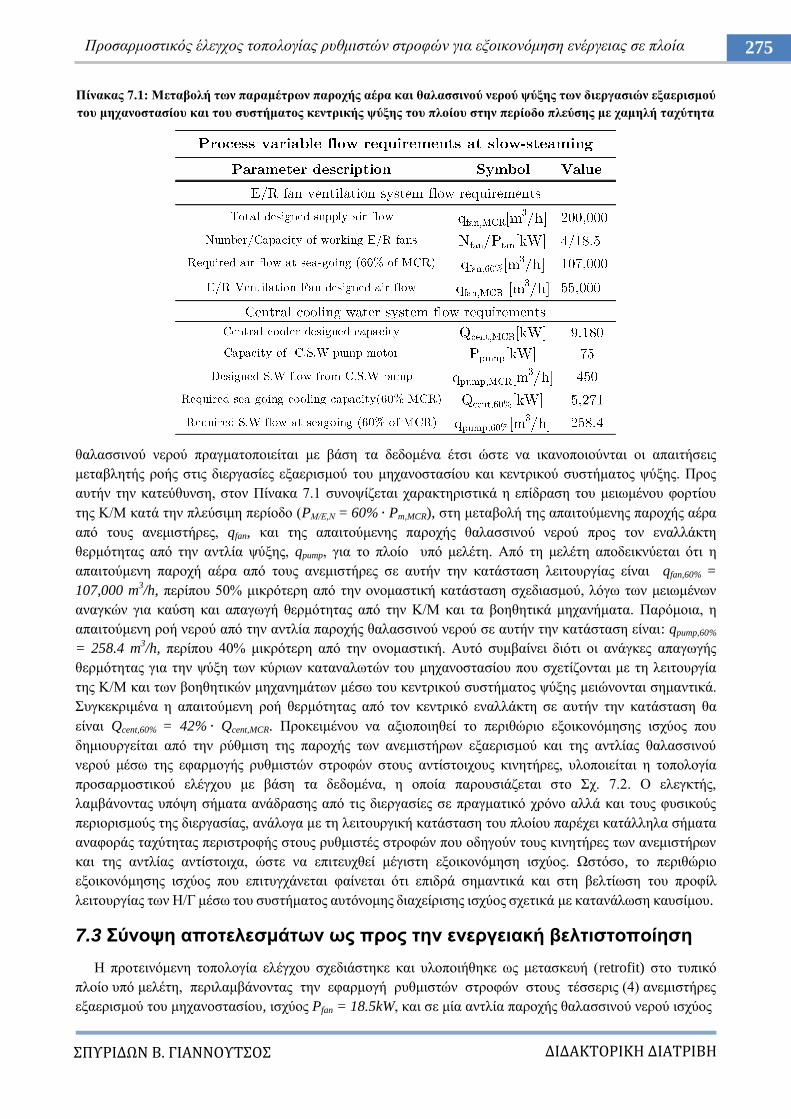
ΔΙΔΑΚΣΟΡΙΚΗ ΔΙΑΣΡΙΒΗ
ΠΤΡΙΔΩΝ Β. ΓΙΑΝΝΟΤΣΟ
275 Πξνζαξκνζηηθόο έιεγρνο ηνπνινγίαο ξπζκηζηώλ ζηξνθώλ γηα εμνηθνλόκεζε ελέξγεηαο ζε πινία
Πίλαθαο 7.1: Μεηαβνιή ησλ παξακέηξσλ παξνρήο αέξα θαη ζαιαζζηλνύ λεξνύ ςύμεο ησλ δηεξγαζηώλ εμαεξηζκνύ
ηνπ κεραλνζηαζίνπ θαη ηνπ ζπζηήκαηνο θεληξηθήο ςύμεο ηνπ πινίνπ ζηελ πεξίνδν πιεύζεο κε ρακειή ηαρύηεηα
ζαιαζζηλνύ λεξνύ πξαγκαηνπνηείηαη κε βάζε ηα δεδνκέλα έηζη ώζηε λα ηθαλνπνηνύληαη νη απαηηήζεηο
κεηαβιεηήο ξνήο ζηηο δηεξγαζίεο εμαεξηζκνύ ηνπ κεραλνζηαζίνπ θαη θεληξηθνύ ζπζηήκαηνο ςύμεο. Πξνο
απηήλ ηελ θαηεύζπλζε, ζηνλ Πίλαθα 7.1 ζπλνςίδεηαη ραξαθηεξηζηηθά ε επίδξαζε ηνπ κεησκέλνπ θνξηίνπ
ηεο Κ/Μ θαηά ηελ πιεύζηκε πεξίνδν (PΜ/Δ,Ν = 60% Pm,MCR), ζηε κεηαβνιή ηεο απαηηνύκελεο παξνρήο αέξα
από ηνπο αλεκηζηήξεο, qfan, θαη ηεο απαηηνύκελεο παξνρήο ζαιαζζηλνύ λεξνύ πξνο ηνλ ελαιιάθηε
ζεξκόηεηαο από ηελ αληιία ςύμεο, qpump, γηα ην πινίν ππό κειέηε. Από ηε κειέηε απνδεηθλύεηαη όηη ε
απαηηνύκελε παξνρή αέξα από ηνπο αλεκηζηήξεο ζε απηήλ ηελ θαηάζηαζε ιεηηνπξγίαο είλαη qfan,60% =
107,000 m3/h, πεξίπνπ 50% κηθξόηεξε από ηελ νλνκαζηηθή θαηάζηαζε ζρεδηαζκνύ, ιόγσ ησλ κεησκέλσλ
αλαγθώλ γηα θαύζε θαη απαγσγή ζεξκόηεηαο από ηελ Κ/Μ θαη ηα βνεζεηηθά κεραλήκαηα. Παξόκνηα, ε
απαηηνύκελε ξνή λεξνύ από ηελ αληιία παξνρήο ζαιαζζηλνύ λεξνύ ζε απηήλ ηελ θαηάζηαζε είλαη: qpump,60%
= 258.4 m3/h, πεξίπνπ 40% κηθξόηεξε από ηελ νλνκαζηηθή. Απηό ζπκβαίλεη δηόηη νη αλάγθεο απαγσγήο
ζεξκόηεηαο γηα ηελ ςύμε ησλ θύξησλ θαηαλαισηώλ ηνπ κεραλνζηαζίνπ πνπ ζρεηίδνληαη κε ηε ιεηηνπξγία
ηεο Κ/Μ θαη ησλ βνεζεηηθώλ κεραλεκάησλ κέζσ ηνπ θεληξηθνύ ζπζηήκαηνο ςύμεο κεηώλνληαη ζεκαληηθά.
πγθεθξηκέλα ε απαηηνύκελε ξνή ζεξκόηεηαο από ηνλ θεληξηθό ελαιιάθηε ζε απηήλ ηελ θαηάζηαζε ζα
είλαη Qcent,60% = 42% Qcent,MCR. Πξνθεηκέλνπ λα αμηνπνηεζεί ην πεξηζώξην εμνηθνλόκεζεο ηζρύνο πνπ
δεκηνπξγείηαη από ηελ ξύζκηζε ηεο παξνρήο ησλ αλεκηζηήξσλ εμαεξηζκνύ θαη ηεο αληιίαο ζαιαζζηλνύ
λεξνύ κέζσ ηεο εθαξκνγήο ξπζκηζηώλ ζηξνθώλ ζηνπο αληίζηνηρνπο θηλεηήξεο, πινπνηείηαη ε ηνπνινγία
πξνζαξκνζηηθνύ ειέγρνπ κε βάζε ηα δεδνκέλα, ε νπνία παξνπζηάδεηαη ζην ρ. 7.2. Ο ειεγθηήο,
ιακβάλνληαο ππόςε ζήκαηα αλάδξαζεο από ηηο δηεξγαζίεο ζε πξαγκαηηθό ρξόλν αιιά θαη ηνπο θπζηθνύο
πεξηνξηζκνύο ηεο δηεξγαζίαο, αλάινγα κε ηε ιεηηνπξγηθή θαηάζηαζε ηνπ πινίνπ παξέρεη θαηάιιεια ζήκαηα
αλαθνξάο ηαρύηεηαο πεξηζηξνθήο ζηνπο ξπζκηζηέο ζηξνθώλ πνπ νδεγνύλ ηνπο θηλεηήξεο ησλ αλεκηζηήξσλ
θαη ηεο αληιίαο αληίζηνηρα, ώζηε λα επηηεπρζεί κέγηζηε εμνηθνλόκεζε ηζρύνο. Χζηόζν, ην πεξηζώξην
εμνηθνλόκεζεο ηζρύνο πνπ επηηπγράλεηαη θαίλεηαη όηη επηδξά ζεκαληηθά θαη ζηε βειηίσζε ηνπ πξνθίι
ιεηηνπξγίαο ησλ Ζ/Γ κέζσ ηνπ ζπζηήκαηνο απηόλνκεο δηαρείξηζεο ηζρύνο ζρεηηθά κε θαηαλάισζε θαπζίκνπ.
7.3 ύλνςε απνηειεζκάησλ σο πξνο ηελ ελεξγεηαθή βειηηζηνπνίεζε
Ζ πξνηεηλόκελε ηνπνινγία ειέγρνπ ζρεδηάζηεθε θαη πινπνηήζεθε σο κεηαζθεπή (retrofit) ζην ηππηθό
πινίν ππό κειέηε, πεξηιακβάλνληαο ηελ εθαξκνγή ξπζκηζηώλ ζηξνθώλ ζηνπο ηέζζεξηο (4) αλεκηζηήξεο
εμαεξηζκνύ ηνπ κεραλνζηαζίνπ, ηζρύνο Pfan = 18.5kW, θαη ζε κία αληιία παξνρήο ζαιαζζηλνύ λεξνύ ηζρύνο
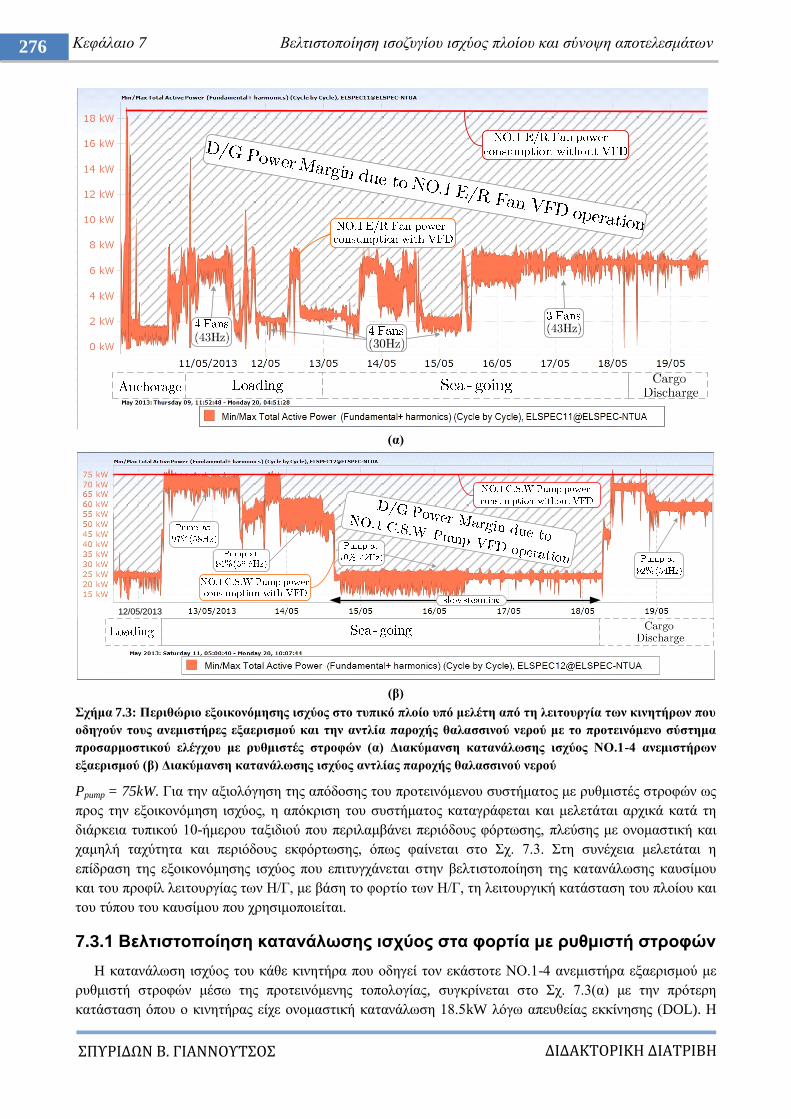
ΔΙΔΑΚΣΟΡΙΚΗ ΔΙΑΣΡΙΒΗ
ΠΤΡΙΔΩΝ Β. ΓΙΑΝΝΟΤΣΟ
276 Κεθάιαην 7 Βειηηζηνπνίεζε ηζνδπγίνπ ηζρύνο πινίνπ θαη ζύλνςε απνηειεζκάησλ
(α)
(β)
ρήκα 7.3: Πεξηζώξην εμνηθνλόκεζεο ηζρύνο ζην ηππηθό πινίν ππό κειέηε από ηε ιεηηνπξγία ησλ θηλεηήξσλ πνπ
νδεγνύλ ηνπο αλεκηζηήξεο εμαεξηζκνύ θαη ηελ αληιία παξνρήο ζαιαζζηλνύ λεξνύ κε ην πξνηεηλόκελν ζύζηεκα
πξνζαξκνζηηθνύ ειέγρνπ κε ξπζκηζηέο ζηξνθώλ (α) Γηαθύκαλζε θαηαλάισζεο ηζρύνο ΝΟ.1-4 αλεκηζηήξσλ
εμαεξηζκνύ (β) Γηαθύκαλζε θαηαλάισζεο ηζρύνο αληιίαο παξνρήο ζαιαζζηλνύ λεξνύ
Ppump = 75kW. Γηα ηελ αμηνιόγεζε ηεο απόδνζεο ηνπ πξνηεηλόκελνπ ζπζηήκαηνο κε ξπζκηζηέο ζηξνθώλ σο
πξνο ηελ εμνηθνλόκεζε ηζρύνο, ε απόθξηζε ηνπ ζπζηήκαηνο θαηαγξάθεηαη θαη κειεηάηαη αξρηθά θαηά ηε
δηάξθεηα ηππηθνύ 10-ήκεξνπ ηαμηδηνύ πνπ πεξηιακβάλεη πεξηόδνπο θόξησζεο, πιεύζεο κε νλνκαζηηθή θαη
ρακειή ηαρύηεηα θαη πεξηόδνπο εθθόξησζεο, όπσο θαίλεηαη ζην ρ. 7.3. ηε ζπλέρεηα κειεηάηαη ε
επίδξαζε ηεο εμνηθνλόκεζεο ηζρύνο πνπ επηηπγράλεηαη ζηελ βειηηζηνπνίεζε ηεο θαηαλάισζεο θαπζίκνπ
θαη ηνπ πξνθίι ιεηηνπξγίαο ησλ Ζ/Γ, κε βάζε ην θνξηίν ησλ Ζ/Γ, ηε ιεηηνπξγηθή θαηάζηαζε ηνπ πινίνπ θαη
ηνπ ηύπνπ ηνπ θαπζίκνπ πνπ ρξεζηκνπνηείηαη.
7.3.1 Βειηηζηνπνίεζε θαηαλάισζεο ηζρύνο ζηα θνξηία κε ξπζκηζηή ζηξνθώλ
H θαηαλάισζε ηζρύνο ηνπ θάζε θηλεηήξα πνπ νδεγεί ηνλ εθάζηνηε ΝΟ.1-4 αλεκηζηήξα εμαεξηζκνύ κε
ξπζκηζηή ζηξνθώλ κέζσ ηεο πξνηεηλόκελεο ηνπνινγίαο, ζπγθξίλεηαη ζην ρ. 7.3(α) κε ηελ πξόηεξε
θαηάζηαζε όπνπ ν θηλεηήξαο είρε νλνκαζηηθή θαηαλάισζε 18.5kW ιόγσ απεπζείαο εθθίλεζεο (DOL). Ζ
12/05/2013
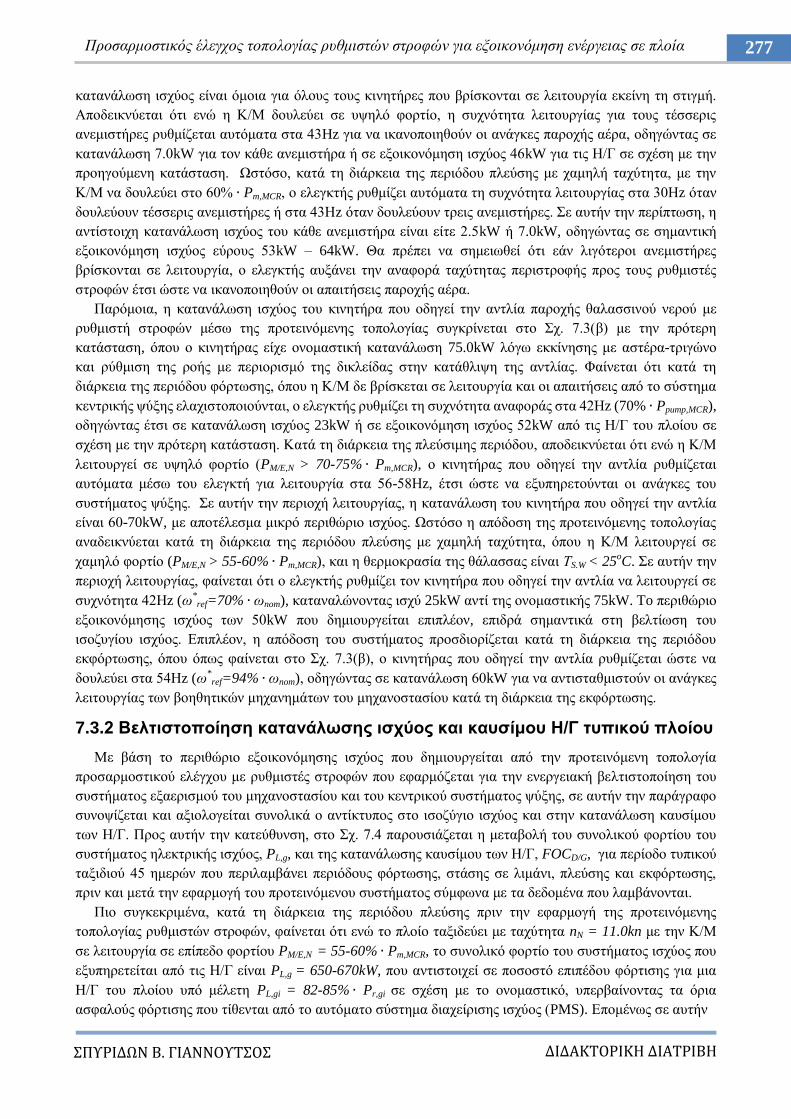
ΔΙΔΑΚΣΟΡΙΚΗ ΔΙΑΣΡΙΒΗ
ΠΤΡΙΔΩΝ Β. ΓΙΑΝΝΟΤΣΟ
277 Πξνζαξκνζηηθόο έιεγρνο ηνπνινγίαο ξπζκηζηώλ ζηξνθώλ γηα εμνηθνλόκεζε ελέξγεηαο ζε πινία
θαηαλάισζε ηζρύνο είλαη όκνηα γηα όινπο ηνπο θηλεηήξεο πνπ βξίζθνληαη ζε ιεηηνπξγία εθείλε ηε ζηηγκή.
Απνδεηθλύεηαη όηη ελώ ε Κ/Μ δνπιεύεη ζε πςειό θνξηίν, ε ζπρλόηεηα ιεηηνπξγίαο γηα ηνπο ηέζζεξηο
αλεκηζηήξεο ξπζκίδεηαη απηόκαηα ζηα 43Hz γηα λα ηθαλνπνηεζνύλ νη αλάγθεο παξνρήο αέξα, νδεγώληαο ζε
θαηαλάισζε 7.0kW γηα ηνλ θάζε αλεκηζηήξα ή ζε εμνηθνλόκεζε ηζρύνο 46kW γηα ηηο Ζ/Γ ζε ζρέζε κε ηελ
πξνεγνύκελε θαηάζηαζε. Χζηόζν, θαηά ηε δηάξθεηα ηεο πεξηόδνπ πιεύζεο κε ρακειή ηαρύηεηα, κε ηελ
Κ/Μ λα δνπιεύεη ζην 60% Pm,MCR, ν ειεγθηήο ξπζκίδεη απηόκαηα ηε ζπρλόηεηα ιεηηνπξγίαο ζηα 30Ζz όηαλ
δνπιεύνπλ ηέζζεξηο αλεκηζηήξεο ή ζηα 43Ζz όηαλ δνπιεύνπλ ηξεηο αλεκηζηήξεο. ε απηήλ ηελ πεξίπησζε, ε
αληίζηνηρε θαηαλάισζε ηζρύνο ηνπ θάζε αλεκηζηήξα είλαη είηε 2.5kW ή 7.0kW, νδεγώληαο ζε ζεκαληηθή
εμνηθνλόκεζε ηζρύνο εύξνπο 53kW – 64kW. Θα πξέπεη λα ζεκεησζεί όηη εάλ ιηγόηεξνη αλεκηζηήξεο
βξίζθνληαη ζε ιεηηνπξγία, ν ειεγθηήο απμάλεη ηελ αλαθνξά ηαρύηεηαο πεξηζηξνθήο πξνο ηνπο ξπζκηζηέο
ζηξνθώλ έηζη ώζηε λα ηθαλνπνηεζνύλ νη απαηηήζεηο παξνρήο αέξα.
Παξόκνηα, ε θαηαλάισζε ηζρύνο ηνπ θηλεηήξα πνπ νδεγεί ηελ αληιία παξνρήο ζαιαζζηλνύ λεξνύ κε
ξπζκηζηή ζηξνθώλ κέζσ ηεο πξνηεηλόκελεο ηνπνινγίαο ζπγθξίλεηαη ζην ρ. 7.3(β) κε ηελ πξόηεξε
θαηάζηαζε, όπνπ ν θηλεηήξαο είρε νλνκαζηηθή θαηαλάισζε 75.0kW ιόγσ εθθίλεζεο κε αζηέξα-ηξηγώλν
θαη ξύζκηζε ηεο ξνήο κε πεξηνξηζκό ηεο δηθιείδαο ζηελ θαηάζιηςε ηεο αληιίαο. Φαίλεηαη όηη θαηά ηε
δηάξθεηα ηεο πεξηόδνπ θόξησζεο, όπνπ ε Κ/Μ δε βξίζθεηαη ζε ιεηηνπξγία θαη νη απαηηήζεηο από ην ζύζηεκα
θεληξηθήο ςύμεο ειαρηζηνπνηνύληαη, ν ειεγθηήο ξπζκίδεη ηε ζπρλόηεηα αλαθνξάο ζηα 42Ζz (70% Ppump,MCR),
νδεγώληαο έηζη ζε θαηαλάισζε ηζρύνο 23kW ή ζε εμνηθνλόκεζε ηζρύνο 52kW από ηηο Ζ/Γ ηνπ πινίνπ ζε
ζρέζε κε ηελ πξόηεξε θαηάζηαζε. Καηά ηε δηάξθεηα ηεο πιεύζηκεο πεξηόδνπ, απνδεηθλύεηαη όηη ελώ ε Κ/Μ
ιεηηνπξγεί ζε πςειό θνξηίν (PM/E,N > 70-75% Pm,MCR), ν θηλεηήξαο πνπ νδεγεί ηελ αληιία ξπζκίδεηαη
απηόκαηα κέζσ ηνπ ειεγθηή γηα ιεηηνπξγία ζηα 56-58Ζz, έηζη ώζηε λα εμππεξεηνύληαη νη αλάγθεο ηνπ
ζπζηήκαηνο ςύμεο. ε απηήλ ηελ πεξηνρή ιεηηνπξγίαο, ε θαηαλάισζε ηνπ θηλεηήξα πνπ νδεγεί ηελ αληιία
είλαη 60-70kW, κε απνηέιεζκα κηθξό πεξηζώξην ηζρύνο. Χζηόζν ε απόδνζε ηεο πξνηεηλόκελεο ηνπνινγίαο
αλαδεηθλύεηαη θαηά ηε δηάξθεηα ηεο πεξηόδνπ πιεύζεο κε ρακειή ηαρύηεηα, όπνπ ε Κ/Μ ιεηηνπξγεί ζε
ρακειό θνξηίν (PM/E,N > 55-60% Pm,MCR), θαη ε ζεξκνθξαζία ηεο ζάιαζζαο είλαη ΣS.W < 25oC. ε απηήλ ηελ
πεξηνρή ιεηηνπξγίαο, θαίλεηαη όηη ν ειεγθηήο ξπζκίδεη ηνλ θηλεηήξα πνπ νδεγεί ηελ αληιία λα ιεηηνπξγεί ζε
ζπρλόηεηα 42Ζz (σ*ref=70% σnom), θαηαλαιώλνληαο ηζρύ 25kW αληί ηεο νλνκαζηηθήο 75kW. To πεξηζώξην
εμνηθνλόκεζεο ηζρύνο ησλ 50kW πνπ δεκηνπξγείηαη επηπιένλ, επηδξά ζεκαληηθά ζηε βειηίσζε ηνπ
ηζνδπγίνπ ηζρύνο. Δπηπιένλ, ε απόδνζε ηνπ ζπζηήκαηνο πξνζδηνξίδεηαη θαηά ηε δηάξθεηα ηεο πεξηόδνπ
εθθόξησζεο, όπνπ όπσο θαίλεηαη ζην ρ. 7.3(β), ν θηλεηήξαο πνπ νδεγεί ηελ αληιία ξπζκίδεηαη ώζηε λα
δνπιεύεη ζηα 54Ζz (σ*
ref=94% σnom), νδεγώληαο ζε θαηαλάισζε 60kW γηα λα αληηζηαζκηζηνύλ νη αλάγθεο
ιεηηνπξγίαο ησλ βνεζεηηθώλ κεραλεκάησλ ηνπ κεραλνζηαζίνπ θαηά ηε δηάξθεηα ηεο εθθόξησζεο.
7.3.2 Βειηηζηνπνίεζε θαηαλάισζεο ηζρύνο θαη θαπζίκνπ Η/Γ ηππηθνύ πινίνπ
Με βάζε ην πεξηζώξην εμνηθνλόκεζεο ηζρύνο πνπ δεκηνπξγείηαη από ηελ πξνηεηλόκελε ηνπνινγία
πξνζαξκνζηηθνύ ειέγρνπ κε ξπζκηζηέο ζηξνθώλ πνπ εθαξκόδεηαη γηα ηελ ελεξγεηαθή βειηηζηνπνίεζε ηνπ
ζπζηήκαηνο εμαεξηζκνύ ηνπ κεραλνζηαζίνπ θαη ηνπ θεληξηθνύ ζπζηήκαηνο ςύμεο, ζε απηήλ ηελ παξάγξαθν
ζπλνςίδεηαη θαη αμηνινγείηαη ζπλνιηθά ν αληίθηππνο ζην ηζνδύγην ηζρύνο θαη ζηελ θαηαλάισζε θαπζίκνπ
ησλ Ζ/Γ. Πξνο απηήλ ηελ θαηεύζπλζε, ζην ρ. 7.4 παξνπζηάδεηαη ε κεηαβνιή ηνπ ζπλνιηθνύ θνξηίνπ ηνπ
ζπζηήκαηνο ειεθηξηθήο ηζρύνο, PL,g, θαη ηεο θαηαλάισζεο θαπζίκνπ ησλ Ζ/Γ, FOCD/G, γηα πεξίνδν ηππηθνύ
ηαμηδηνύ 45 εκεξώλ πνπ πεξηιακβάλεη πεξηόδνπο θόξησζεο, ζηάζεο ζε ιηκάλη, πιεύζεο θαη εθθόξησζεο,
πξηλ θαη κεηά ηελ εθαξκνγή ηνπ πξνηεηλόκελνπ ζπζηήκαηνο ζύκθσλα κε ηα δεδνκέλα πνπ ιακβάλνληαη.
Πην ζπγθεθξηκέλα, θαηά ηε δηάξθεηα ηεο πεξηόδνπ πιεύζεο πξηλ ηελ εθαξκνγή ηεο πξνηεηλόκελεο
ηνπνινγίαο ξπζκηζηώλ ζηξνθώλ, θαίλεηαη όηη ελώ ην πινίν ηαμηδεύεη κε ηαρύηεηα nN = 11.0kn κε ηελ Κ/Μ
ζε ιεηηνπξγία ζε επίπεδν θνξηίνπ PM/E,N = 55-60% Pm,MCR, ην ζπλνιηθό θνξηίν ηνπ ζπζηήκαηνο ηζρύνο πνπ
εμππεξεηείηαη από ηηο Ζ/Γ είλαη PL,g = 650-670kW, πνπ αληηζηνηρεί ζε πνζνζηό επηπέδνπ θόξηηζεο γηα κηα
Ζ/Γ ηνπ πινίνπ ππό κέιεηε PL,gi = 82-85% Pr,gi ζε ζρέζε κε ην νλνκαζηηθό, ππεξβαίλνληαο ηα όξηα
αζθαινύο θόξηηζεο πνπ ηίζεληαη από ην απηόκαην ζύζηεκα δηαρείξηζεο ηζρύνο (PMS). Δπνκέλσο ζε απηήλ
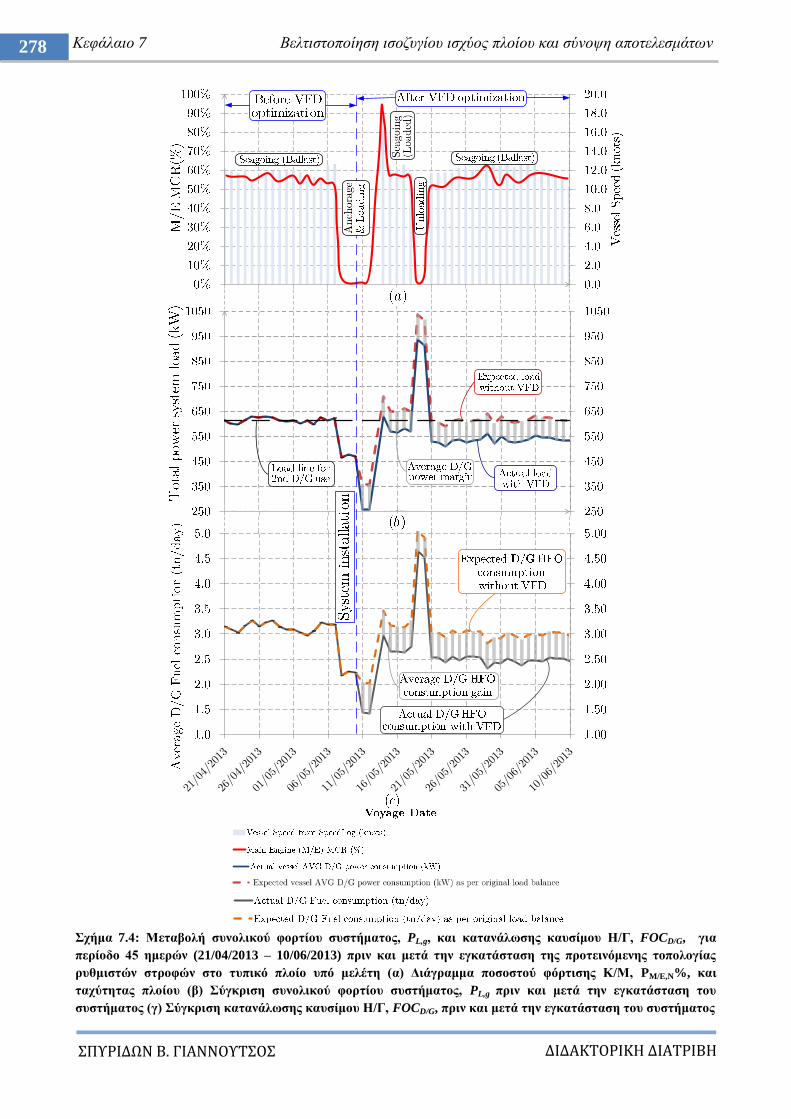
ΔΙΔΑΚΣΟΡΙΚΗ ΔΙΑΣΡΙΒΗ
ΠΤΡΙΔΩΝ Β. ΓΙΑΝΝΟΤΣΟ
278 Κεθάιαην 7 Βειηηζηνπνίεζε ηζνδπγίνπ ηζρύνο πινίνπ θαη ζύλνςε απνηειεζκάησλ
ρήκα 7.4: Μεηαβνιή ζπλνιηθνύ θνξηίνπ ζπζηήκαηνο, PL,g, θαη θαηαλάισζεο θαπζίκνπ Η/Γ, FOCD/G, γηα
πεξίνδν 45 εκεξώλ (21/04/2013 – 10/06/2013) πξηλ θαη κεηά ηελ εγθαηάζηαζε ηεο πξνηεηλόκελεο ηνπνινγίαο
ξπζκηζηώλ ζηξνθώλ ζην ηππηθό πινίν ππό κειέηε (α) Γηάγξακκα πνζνζηνύ θόξηηζεο Κ/Μ, PM/E,N%, θαη
ηαρύηεηαο πινίνπ (β) ύγθξηζε ζπλνιηθνύ θνξηίνπ ζπζηήκαηνο, PL,g πξηλ θαη κεηά ηελ εγθαηάζηαζε ηνπ
ζπζηήκαηνο (γ) ύγθξηζε θαηαλάισζεο θαπζίκνπ Η/Γ, FOCD/G, πξηλ θαη κεηά ηελ εγθαηάζηαζε ηνπ ζπζηήκαηνο
ΔΙΔΑΚΣΟΡΙΚΗ ΔΙΑΣΡΙΒΗ
ΠΤΡΙΔΩΝ Β. ΓΙΑΝΝΟΤΣΟ
279 Πξνζαξκνζηηθόο έιεγρνο ηνπνινγίαο ξπζκηζηώλ ζηξνθώλ γηα εμνηθνλόκεζε ελέξγεηαο ζε πινία
(α) (β)
ρήκα 7.5: Μεηαβνιή εηδηθήο θαηαλάισζεο θαπζίκνπ ζε ζρέζε κε ην επίπεδν θόξηηζεο ηεο Η/Γ σο βάζε ηνπ
αιγνξίζκνπ ππνινγηζκνύ θόζηνπο παξαγόκελεο ελέξγεηαο (α) Μεηαβνιή ηεο εηδηθήο θαηαλάισζεο θαπζίκνπ
(SFOCD/G,MDO) ζε g/kWh κε ην θνξηίν ηεο Η/Γ νδεγνύκελεο από κεραλή Diesel σο πνζνζηό ηεο νλνκαζηηθήο
κεραληθήο ηζρύνο άμνλα (κνληέιν κεραλήο Diesel L23/30H, Pr,gi = 780kW) (β) πζηεκαηηθή κέζνδνο ππνινγηζκνύ
νηθνλνκηθνύ νθέινπο ζην θόζηνο ελέξγεηαο από ηελ εθαξκνγή ηνπ πξνηεηλόκελνπ ζπζηήκαηνο κε βάζε ηε
ιεηηνπξγηθή θαηάζηαζε ηνπ πινίνπ, ην επίπεδν θνξηίνπ ηεο Η/Γ θαη ηελ θαηαλάισζε θαπζίκνπ.
ηελ πεξίπησζε είλαη απαξαίηεηε ε ρξήζε δεύηεξεο Ζ/Γ πνπ ιεηηνπξγεί παξάιιεια κε ηελ ππάξρνπζα γηα
ηζνκνηξαζκό θνξηίνπ (PL,g1 = PL,g2 = 330kW = 42% Pr,gi). Χζηόζν ζύκθσλα κε ηελ θακπύιε ηνπ ρ. 7.5(α),
πνπ δείρλεη ηε κεηαβνιή ηεο εηδηθήο θαηαλάισζεο θαπζίκνπ (SFOCD/G,MDO) ζε g/kWh ζε ζρέζε κε ην θνξηίν
ηεο Ζ/Γ νδεγνύκελεο από κεραλή Diesel σο πνζνζηό ηεο νλνκαζηηθήο κεραληθήο ηζρύνο άμνλα (κνληέιν
κεραλήο Diesel L23/30H, Pr,gi = 780kW), ην γεγνλόο απηό νδεγεί ζε SFOCD/G, MDO = 208.17g/kWh, ην νπνίν
αληηζηνηρεί ζε SFOCD/G,HFO = 225.03g/kWh ζηελ πεξίπησζε ρξήζεο θαπζίκνπ HFO380 βαξέσο ηύπνπ
(Heavy Fuel), εθόζνλ απηό έρεη κηθξόηεξε ζεξκνγόλν δύλακε (LCV) ζε ζρέζε κε ην θαύζηκν ηύπνπ Diesel
(MDO). Όπσο απνδεηθλύεηαη θαη από ηηο κεηξήζεηο ηνπ ρ. 7.4(γ), απηό νδεγεί ζε απμεκέλε εκεξήζηα
θαηαλάισζε θαπζίκνπ ζπλνιηθά από ηηο Ζ/Γ, πεξίπνπ FOCD/G,HFO = 3.5tn. Ζ ρξνληθή πεξίνδνο εθαξκνγήο
ηεο πξαθηηθήο κείσζεο ηεο ηαρύηεηαο πιεύζεο απνηειεί ην 46% ηεο εηήζηαο ιεηηνπξγηθήο πεξηόδνπ ηνπ
πινίνπ, άξα αλακέλεηαη νπζηαζηηθή ζπλεηζθνξά ηνπ πξνηεηλόκελνπ ζπζηήκαηνο ζηε κείσζε ηνπ FOCD/G.
Ζ πξνζδνθία απηή επηβεβαηώλεηαη από ηα απνηειέζκαηα πνπ ιακβάλνληαη θαηά ηε δηάξθεηα ηεο
πεξηόδνπ πιεύζεο κεηά ηελ εγθαηάζηαζε ηνπ πξνηεηλόκελνπ ζπζηήκαηνο. Δηδηθόηεξα, ζην ρ. 7.4(β)
θαίλεηαη όηη ζην ίδην επίπεδν θόξηηζεο ηεο Κ/Μ ζε ζρέζε κε πξηλ, ην κέζν ζπλνιηθό θνξηίν ηνπ ζπζηήκαηνο
ηζρύνο πνπ εμππεξεηείηαη από ηηο Ζ/Γ κεηώλεηαη ηώξα ζε PL,g = 535kW, πνπ αληηζηνηρεί ζε πνζνζηό επηπέδνπ
θόξηηζεο Ζ/Γ PL,gi = 68.6% Pr,gi, ιόγσ ηεο αληηζηάζκηζεο πνπ επηηπγράλεηαη κέζσ ηνπ πεξηζσξίνπ
εμνηθνλόκεζεο ηζρύνο από ηελ ηνπνινγία πνπ ειέγρεη ηνπο θηλεηήξεο ησλ αλεκηζηήξσλ εμαεξηζκνύ θαη ηελ
αληιία ςύμεο κε ξπζκηζηέο ζηξνθώλ. Με απηό ηνλ ηξόπν επηηπγράλεηαη ζπλδπαζηηθή κείσζε ηνπ ζπλνιηθνύ
επηπέδνπ θόξηηζεο ηνπ ζπζηήκαηνο θαηά PL,gsave = 125kW = 19% Pr,gi. Απηό ζεκαίλεη όηη πιένλ ε ιεηηνπξγία
κηαο κόλν Ζ/Γ είλαη επαξθήο γηα ηελ εμππεξέηεζε ηνπ νιηθνύ θνξηίνπ θαηά ηε δηάξθεηα ηεο πεξηόδνπ
εθαξκνγήο ηεο πξαθηηθήο κείσζεο ηεο ηαρύηεηαο πιεύζεο, πνπ νδεγεί ζε ζεκαληηθά πιενλεθηήκαηα.
ΔΙΔΑΚΣΟΡΙΚΗ ΔΙΑΣΡΙΒΗ
ΠΤΡΙΔΩΝ Β. ΓΙΑΝΝΟΤΣΟ
280 Κεθάιαην 7 Βειηηζηνπνίεζε ηζνδπγίνπ ηζρύνο πινίνπ θαη ζύλνςε απνηειεζκάησλ
Πξώην θαη πην ζεκαληηθό γεγνλόο είλαη όηη ε εηδηθή θαηαλάισζε θαπζίκνπ ηεο Ζ/Γ κεηώλεηαη ζε
SFOCD/G,MDO = 193.44g/kWh, πνπ αληηζηνηρεί ζε SFOCD/G,HFO = 209.11g/kWh, εθόζνλ ε Ζ/Γ εμππεξεηεί
κεγαιύηεξν πνζνζηό θνξηίνπ ζε ζρέζε κε ηελ πξνεγνύκελε θαηάζηαζε. Ζ κείσζε ηνπ SFOCD/G θαηά 7%
νδεγεί ζε εκεξήζηα θαηαλάισζε θαπζίκνπ ζπλνιηθά από ηηο Ζ/Γ, πεξίπνπ FOCD/G,HFO = 3.0tn, ή ζε εκεξήζην
θέξδνο θαηαλάισζεο θαπζίκνπ ίζν κε ΓFOCD/G,HFO = 0.5tn = 16.7%. Γεύηεξνλ, ηα θόζηε ζπληήξεζεο
επίζεο κεηώλνληαη ζεκαληηθά εθόζνλ νη ώξεο ιεηηνπξγίαο ηεο δεύηεξεο Ζ/Γ πνπ πξνεγνπκέλσο ήηαλ
ζπλδεδεκέλε παξάιιεια επίζεο κεηώλνληαη. Ζ δεύηεξε Ζ/Γ θαηά ηελ πεξίνδν πιεύζεο ρξεηάδεηαη κόλν ζηελ
πεξίπησζε πνπ θάπνηα δηαθνπηόκελα θνξηία βξίζθνληαη ζε ιεηηνπξγία γηα θάπνην ζπγθεθξηκέλν ρξνληθό
δηάζηεκα, όπσο γηα ηε ζέξκαλζε ηνπ θνξηίνπ ή γηα ηελ πξαγκαηνπνίεζε δηεξγαζηώλ κεηαθνξάο έξκαηνο,
νδεγώληαο ζε ζεκαληηθή βειηίσζε ηνπ ηζνδπγίνπ ηζρύνο θαη ηεο θαηαλάισζεο θαπζίκνπ ζην πινίν.
Παξόιν πνπ ην πεξηζώξην εμνηθνλόκεζεο ηζρύνο πνπ επηηπγράλεηαη επηδξά ζεκαληηθά ζην ηζνδύγην
ηζρύνο θαηά ηε δηάξθεηα ηεο πεξηόδνπ πιεύζεο κε ρακειή ηαρύηεηα, δελ είλαη ην ίδην γηα όιεο ηηο πεξηόδνπο
ιεηηνπξγίαο. Απμάλεηαη αθόκε πεξηζζόηεξν θαηά ηε δηάξθεηα ησλ πεξηόδσλ θόξησζεο ή ζηάζεο ζε ιηκάλη
δηόηη ε Κ/Μ δελ βξίζθεηαη ζε ιεηηνπξγία θαη νη αλάγθεο εμαεξηζκνύ θαη ςύμεο ησλ κεραλεκάησλ είλαη
ειάρηζηεο, ελώ κεηώλεηαη αξθεηά ζηελ πεξίνδν πιεύζεο κε ηαρύηεηα θνληά ζηελ νλνκαζηηθή θαη θαηά ηελ
πεξίνδν εθθόξξησζεο. Όπσο θαίλεηαη ζην ρ. 7.4(β), ην αλακελόκελν ζπλνιηθό επίπεδν θνξηίνπ θαηά ηε
δηάξθεηα ηεο πεξηόδνπ εθθόξησζεο ζηελ πξόηεξε θαηάζηαζε ρσξίο ηελ εθαξκνγή ηεο πξνηεηλόκελεο
ηνπνινγίαο ήηαλ PL,g = 1014kW, ην νπνίν κνηξαδόηαλ ζε δύν Ζ/Γ πνπ ιεηηνπξγνύζαλ ζε επίπεδν θνξηίνπ
PL,g1 = PL,g2 = 507kW = 65% Pr,gi. Μεηά ηελ εθαξκνγή ηεο πξνηεηλόκελεο ηνπνινγίαο, ην ζπλνιηθό θνξηίν
θαηά ηε δηάξθεηα ηεο πεξηόδνπ εθθόξησζεο κεηώλεηαη ζε PL,g = 940kW, ην νπνίν επίζεο είλαη απαξαίηεην λα
ηζνκνηξαζηεί κεηαμύ δύν Ζ/Γ ζε επίπεδα θόξηηζεο PL,g1 = PL,g2 = 470kW = 60% Pr,gi. Θεσξώληαο όηη
θαύζηκν ηύπνπ MDO ρξεζηκνπνηείηαη ζπλήζσο ζηα ιηκάληα εθθόξησζεο, ιόγσ ηεο ρακειήο πεξηεθηηθόηεηαο
ζε ζείν, ε εηδηθή θαηαλάισζε SFOCD/G,MDO = 195.0g/kWh παξακέλεη ζηαζεξή πξηλ θαη κεηά ηελ εθαξκνγή
ηεο πξνηεηλόκελεο ηνπνινγίαο γηα ηελ πεξίνδν εθθόξησζεο ιόγσ ηεο κηθξήο κεηαβνιήο ηεο ιεηηνπξγηθήο
θαηάζηαζεο ησλ Ζ/Γ, νδεγώληαο ζε εμνηθνλόκεζε θαπζίκνπ κόλν ιόγσ ηεο κείσζεο ηεο παξαγόκελεο
ηζρύνο ζε απόιπηεο ηηκέο. Ζ κεηαβνιή ηνπ θνξηίνπ πξαγκαηνπνηείηαη θαηά ηνλ ίδην ηξόπν θαηά ηε δηάξθεηα
ηεο πεξηόδνπ πιεύζεο κε πςειέο ηαρύηεηεο, όπσο απνδεηθλύεηαη ζην ρ. 7.4. Παξόια απηά, ε δηάξθεηα ησλ
πεξηόδσλ πιεύζεο κε πςειέο ηαρύηεηεο θαη εθθόξησζεο ζπληζηνύλ κόλν ην 10% ηνπ εηήζηνπ ρξόλνπ
ιεηηνπξγίαο ηνπ ηππηθνύ πινίνπ ππό κειέηε, εθόζνλ ζην κεγαιύηεξν ηκήκα εθαξκόδεηαη ε πξαθηηθή
κείσζεο ηεο ηαρύηεηαο πιεύζεο, όπνπ ηα απνηειέζκαηα ηνπ πξνηεηλόκελνπ ζπζηήκαηνο είλαη πην εκθαλή.
7.3.3 πζηεκαηηθή ηερλννηθνλνκηθή κέζνδνο ππνινγηζκνύ εμνηθνλόκεζεο
Γηα ηνλ πξνζδηνξηζκό ηεο αθξηβνύο ζρέζεο κεηαμύ ηνπ επηπέδνπ θόξηηζεο ηζρύνο ησλ Ζ/Γ θαη ηεο
αληίζηνηρεο θαηαλάισζεο θαπζίκνπ ζε ζρέζε κε ηα νηθνλνκηθά νθέιε πνπ πξνθύπηνπλ από ηελ εθαξκνγή
ηνπ πξνηεηλόκελνπ ζπζηήκαηνο γηα θάζε ιεηηνπξγηθή θαηάζηαζε ηνπ πινίνπ, πξνηείλεηαη ζπζηεκαηηθή
κέζνδνο πνπ παξνπζηάδεηαη ζην ρ. 7.5(β), ιακβάλνληαο ππόςε ηνλ ηύπν ηνπ θαπζίκνπ πνπ ρξεζηκνπνηείηαη
αλάινγα κε ηε ιεηηνπξγηθή θαηάζηαζε, θαη εθαξκόδεηαη ζην πινίν ππό κειέηε.
Ζ θακπύιε ηεο εηδηθήο θαηαλάισζεο θαπζίκνπ ηνπ ρ. 7.5(α) δείρλεη όηη νη ηηκέο SFOCD/G,MDO
απμάλνληαη ζεκαληηθά εάλ ην θνξηίν ηεο Ζ/Γ κεησζεί θάησ από 55% ηνπ Pr,gi. Δπνκέλσο εάλ νη Ζ/Γ
ρξεηάδεηαη λα ιεηηνπξγήζνπλ παξάιιεια ζε ρακειό επίπεδν θόξηηζεο πξνθεηκέλνπ λα εμππεξεηήζνπλ ην
θνξηίν, απηό ζα έρεη ζεκαληηθό αληίθηππν ζηελ θαηαλάισζε θαπζίκνπ ηεο Ζ/Γ, FOCD/G [tn], σο εμήο:
όπνπ Pm,gi είλαη ε κεραληθή ηζρύο εμόδνπ ηεο κεραλήο Diesel πνπ νδεγεί ηελ Ζ/Γ, θαη ε νπνία κπνξεί λα
ππνινγηζηεί κεηξώληαο ηελ ηζρύ εμόδνπ ηεο Ζ/Γ, PL,gi, θαη ιακβάλνληαο ππόςε ηηο απώιεηεο Ploss, νη νπνίεο
πεξηιακβάλνπλ ηηο απώιεηεο ραιθνύ, Pcop, θαη ηηο απώιεηεο ππξήλα, Pcore, πνπ εμαξηώληαη από ην εθάζηνηε
θνξηίν ηεο Ζ/Γ, θαζώο θαη ηηο κεραληθέο απώιεηεο, Pmech, θαη ηηο απώιεηεο ηξηβώλ θαη αλεκηζκνύ, Pstray, πνπ
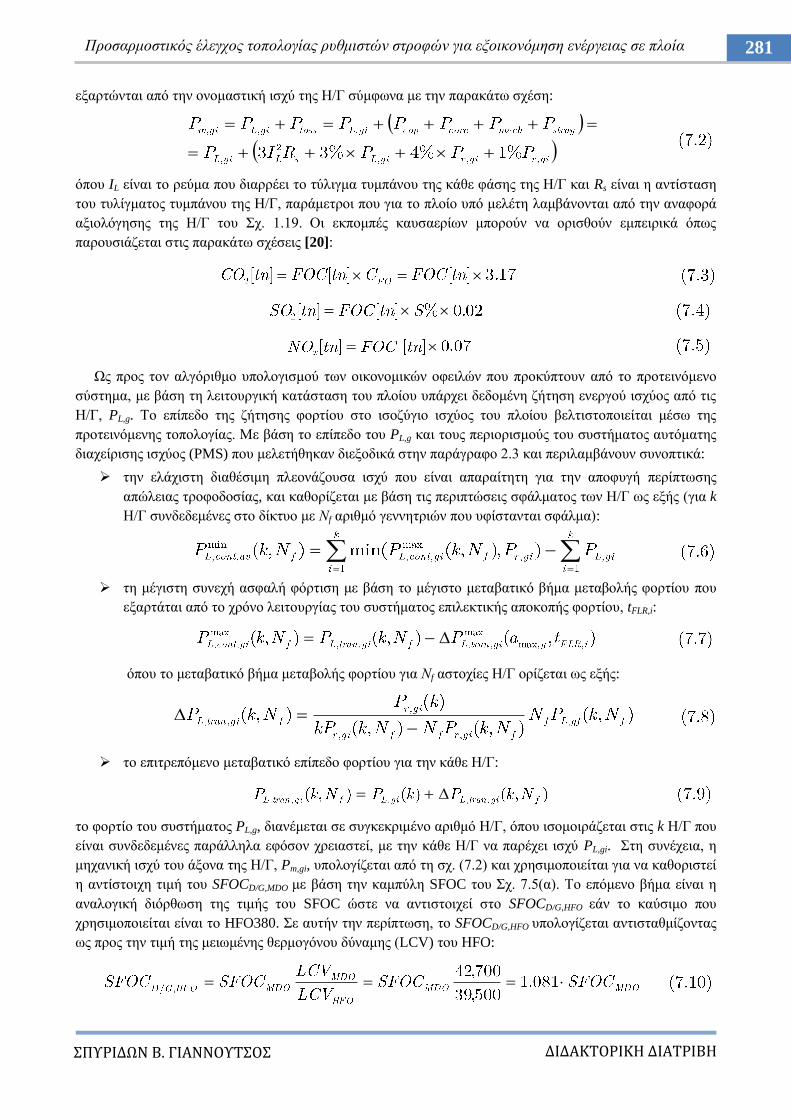
ΔΙΔΑΚΣΟΡΙΚΗ ΔΙΑΣΡΙΒΗ
ΠΤΡΙΔΩΝ Β. ΓΙΑΝΝΟΤΣΟ
281 Πξνζαξκνζηηθόο έιεγρνο ηνπνινγίαο ξπζκηζηώλ ζηξνθώλ γηα εμνηθνλόκεζε ελέξγεηαο ζε πινία
εμαξηώληαη από ηελ νλνκαζηηθή ηζρύ ηεο Ζ/Γ ζύκθσλα κε ηελ παξαθάησ ζρέζε:
όπνπ IL είλαη ην ξεύκα πνπ δηαξξέεη ην ηύιηγκα ηπκπάλνπ ηεο θάζε θάζεο ηεο Ζ/Γ θαη Rs είλαη ε αληίζηαζε
ηνπ ηπιίγκαηνο ηπκπάλνπ ηεο Ζ/Γ, παξάκεηξνη πνπ γηα ην πινίν ππό κειέηε ιακβάλνληαη από ηελ αλαθνξά
αμηνιόγεζεο ηεο Ζ/Γ ηνπ ρ. 1.19. Οη εθπνκπέο θαπζαεξίσλ κπνξνύλ λα νξηζζνύλ εκπεηξηθά όπσο
παξνπζηάδεηαη ζηηο παξαθάησ ζρέζεηο [20]:
Χο πξνο ηνλ αιγόξηζκν ππνινγηζκνύ ησλ νηθνλνκηθώλ νθεηιώλ πνπ πξνθύπηνπλ από ην πξνηεηλόκελν
ζύζηεκα, κε βάζε ηε ιεηηνπξγηθή θαηάζηαζε ηνπ πινίνπ ππάξρεη δεδνκέλε δήηεζε ελεξγνύ ηζρύνο από ηηο
Ζ/Γ, PL,g. Σν επίπεδν ηεο δήηεζεο θνξηίνπ ζην ηζνδύγην ηζρύνο ηνπ πινίνπ βειηηζηνπνηείηαη κέζσ ηεο
πξνηεηλόκελεο ηνπνινγίαο. Με βάζε ην επίπεδν ηνπ PL,g θαη ηνπο πεξηνξηζκνύο ηνπ ζπζηήκαηνο απηόκαηεο
δηαρείξηζεο ηζρύνο (PMS) πνπ κειεηήζεθαλ δηεμνδηθά ζηελ παξάγξαθν 2.3 θαη πεξηιακβάλνπλ ζπλνπηηθά:
ηελ ειάρηζηε δηαζέζηκε πιενλάδνπζα ηζρύ πνπ είλαη απαξαίηεηε γηα ηελ απνθπγή πεξίπησζεο
απώιεηαο ηξνθνδνζίαο, θαη θαζνξίδεηαη κε βάζε ηηο πεξηπηώζεηο ζθάικαηνο ησλ Ζ/Γ σο εμήο (γηα k
Ζ/Γ ζπλδεδεκέλεο ζην δίθηπν κε Νf αξηζκό γελλεηξηώλ πνπ πθίζηαληαη ζθάικα):
ηε κέγηζηε ζπλερή αζθαιή θόξηηζε κε βάζε ην κέγηζην κεηαβαηηθό βήκα κεηαβνιήο θνξηίνπ πνπ
εμαξηάηαη από ην ρξόλν ιεηηνπξγίαο ηνπ ζπζηήκαηνο επηιεθηηθήο απνθνπήο θνξηίνπ, tFLR,i:
όπνπ ην κεηαβαηηθό βήκα κεηαβνιήο θνξηίνπ γηα Νf αζηνρίεο Ζ/Γ νξίδεηαη σο εμήο:
ην επηηξεπόκελν κεηαβαηηθό επίπεδν θνξηίνπ γηα ηελ θάζε Ζ/Γ:
ην θνξηίν ηνπ ζπζηήκαηνο PL,g, δηαλέκεηαη ζε ζπγθεθξηκέλν αξηζκό Ζ/Γ, όπνπ ηζνκνηξάδεηαη ζηηο k Ζ/Γ πνπ
είλαη ζπλδεδεκέλεο παξάιιεια εθόζνλ ρξεηαζηεί, κε ηελ θάζε Ζ/Γ λα παξέρεη ηζρύ PL,gi. ηε ζπλέρεηα, ε
κεραληθή ηζρύ ηνπ άμνλα ηεο Ζ/Γ, Pm,gi, ππνινγίδεηαη από ηε ζρ. (7.2) θαη ρξεζηκνπνηείηαη γηα λα θαζνξηζηεί
ε αληίζηνηρε ηηκή ηνπ SFOCD/G,MDO κε βάζε ηελ θακπύιε SFOC ηνπ ρ. 7.5(α). Σν επόκελν βήκα είλαη ε
αλαινγηθή δηόξζσζε ηεο ηηκήο ηνπ SFOC ώζηε λα αληηζηνηρεί ζην SFOCD/G,HFO εάλ ην θαύζηκν πνπ
ρξεζηκνπνηείηαη είλαη ην HFO380. ε απηήλ ηελ πεξίπησζε, ην SFOCD/G,HFO ππνινγίδεηαη αληηζηαζκίδνληαο
σο πξνο ηελ ηηκή ηεο κεησκέλεο ζεξκνγόλνπ δύλακεο (LCV) ηνπ ΖFO:
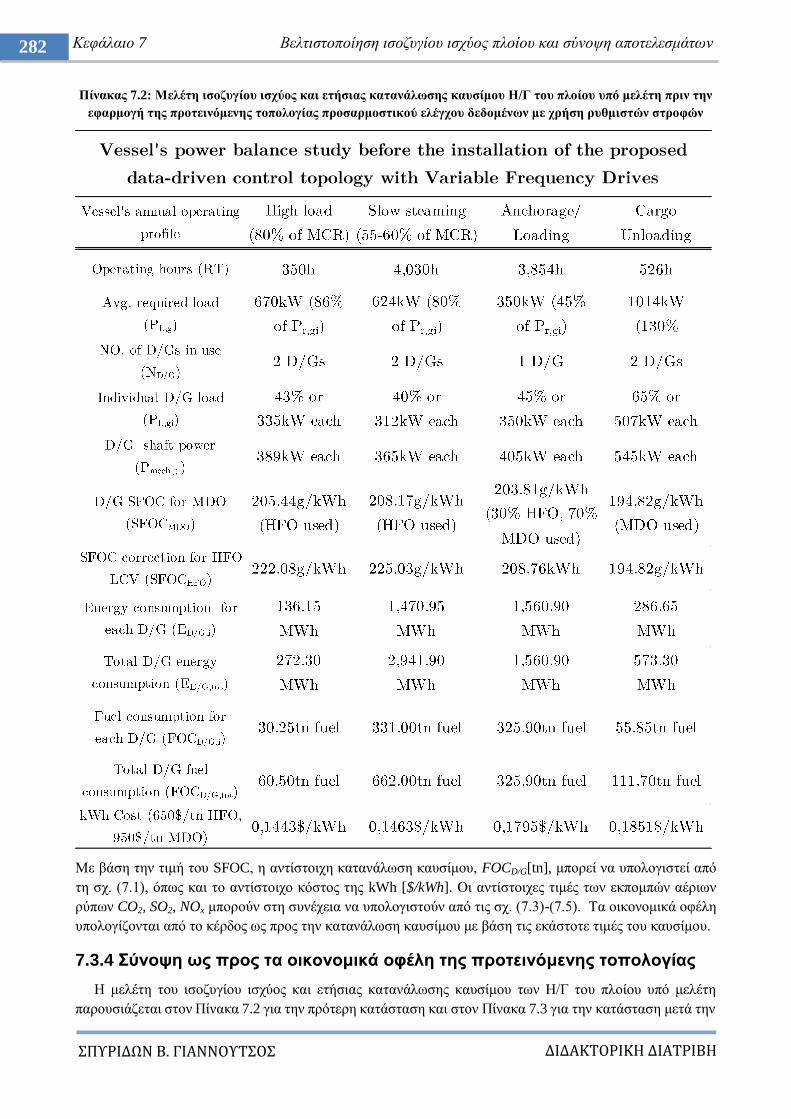
ΔΙΔΑΚΣΟΡΙΚΗ ΔΙΑΣΡΙΒΗ
ΠΤΡΙΔΩΝ Β. ΓΙΑΝΝΟΤΣΟ
282 Κεθάιαην 7 Βειηηζηνπνίεζε ηζνδπγίνπ ηζρύνο πινίνπ θαη ζύλνςε απνηειεζκάησλ
Πίλαθαο 7.2: Μειέηε ηζνδπγίνπ ηζρύνο θαη εηήζηαο θαηαλάισζεο θαπζίκνπ Η/Γ ηνπ πινίνπ ππό κειέηε πξηλ ηελ
εθαξκνγή ηεο πξνηεηλόκελεο ηνπνινγίαο πξνζαξκνζηηθνύ ειέγρνπ δεδνκέλσλ κε ρξήζε ξπζκηζηώλ ζηξνθώλ
Με βάζε ηελ ηηκή ηνπ SFOC, ε αληίζηνηρε θαηαλάισζε θαπζίκνπ, FOCD/G[tn], κπνξεί λα ππνινγηζηεί από
ηε ζρ. (7.1), όπσο θαη ην αληίζηνηρν θόζηνο ηεο kWh [$/kWh]. Οη αληίζηνηρεο ηηκέο ησλ εθπνκπώλ αέξησλ
ξύπσλ CO2, SO2, NOx κπνξνύλ ζηε ζπλέρεηα λα ππνινγηζηνύλ από ηηο ζρ. (7.3)-(7.5). Σα νηθνλνκηθά νθέιε
ππνινγίδνληαη από ην θέξδνο σο πξνο ηελ θαηαλάισζε θαπζίκνπ κε βάζε ηηο εθάζηνηε ηηκέο ηνπ θαπζίκνπ.
7.3.4 ύλνςε σο πξνο ηα νηθνλνκηθά νθέιε ηεο πξνηεηλόκελεο ηνπνινγίαο
Ζ κειέηε ηνπ ηζνδπγίνπ ηζρύνο θαη εηήζηαο θαηαλάισζεο θαπζίκνπ ησλ Ζ/Γ ηνπ πινίνπ ππό κειέηε
παξνπζηάδεηαη ζηνλ Πίλαθα 7.2 γηα ηελ πξόηεξε θαηάζηαζε θαη ζηνλ Πίλαθα 7.3 γηα ηελ θαηάζηαζε κεηά ηελ
ΔΙΔΑΚΣΟΡΙΚΗ ΔΙΑΣΡΙΒΗ
ΠΤΡΙΔΩΝ Β. ΓΙΑΝΝΟΤΣΟ
283 Πξνζαξκνζηηθόο έιεγρνο ηνπνινγίαο ξπζκηζηώλ ζηξνθώλ γηα εμνηθνλόκεζε ελέξγεηαο ζε πινία
Πίλαθαο 7.3: Μειέηε ηζνδπγίνπ ηζρύνο θαη εηήζηαο θαηαλάισζεο θαπζίκνπ Η/Γ ηνπ πινίνπ ππό κειέηε κεηά ηελ
εθαξκνγή ηεο πξνηεηλόκελεο ηνπνινγίαο πξνζαξκνζηηθνύ ειέγρνπ δεδνκέλσλ κε ρξήζε ξπζκηζηώλ ζηξνθώλ
εθαξκνγή ηνπ πξνηεηλόκελνπ ζπζηήκαηνο κε βάζε ηα δεδνκέλα ησλ πεηξακάησλ θαη ηελ αμηνπνίεζε ηεο
ζπζηεκαηηθήο ηερλννηθνλνκηθήο κεζόδνπ ππνινγηζκνύ ηεο εμνηθνλόκεζεο. Σα απνηειέζκαηα παξαηίζεληαη
γηα όιεο ηηο ιεηηνπξγηθέο θαηαζηάζεηο ηνπ πινίνπ ππό κειέηε. Πην ζπγθεθξηκέλα, ζην ρ. 7.6 θαίλεηαη ε
ζεσξεηηθή εηήζηα θαηαλάισζε θαπζίκνπ θαη ζην ρ. 7.7 ε αληίζηνηρε εηήζηα εμνηθνλόκεζε ελέξγεηαο κε ηα
αλάινγα νηθνλνκηθά νθέιε. ηνπο ππνινγηζκνύο ζεσξήζεθε δεδνκέλν όηη θαηά ηε δηάξθεηα ηεο πεξηόδνπ
πιεύζεο ρξεζηκνπνηείηαη πάληνηε θαύζηκν HFO380, ελώ θαηά ηε δηάξθεηα ηεο πεξηόδνπ ζηάζεο ζε ιηκάλη ή
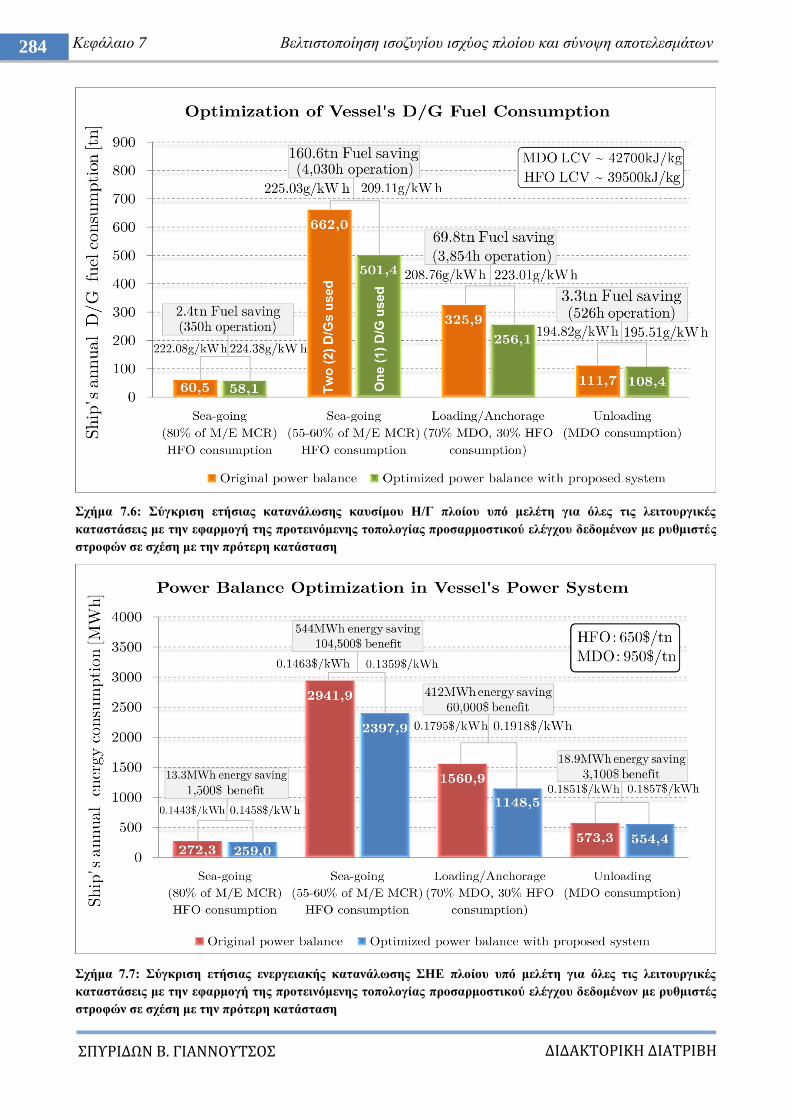
ΔΙΔΑΚΣΟΡΙΚΗ ΔΙΑΣΡΙΒΗ
ΠΤΡΙΔΩΝ Β. ΓΙΑΝΝΟΤΣΟ
284 Κεθάιαην 7 Βειηηζηνπνίεζε ηζνδπγίνπ ηζρύνο πινίνπ θαη ζύλνςε απνηειεζκάησλ
ρήκα 7.6: ύγθξηζε εηήζηαο θαηαλάισζεο θαπζίκνπ Η/Γ πινίνπ ππό κειέηε γηα όιεο ηηο ιεηηνπξγηθέο
θαηαζηάζεηο κε ηελ εθαξκνγή ηεο πξνηεηλόκελεο ηνπνινγίαο πξνζαξκνζηηθνύ ειέγρνπ δεδνκέλσλ κε ξπζκηζηέο
ζηξνθώλ ζε ζρέζε κε ηελ πξόηεξε θαηάζηαζε
ρήκα 7.7: ύγθξηζε εηήζηαο ελεξγεηαθήο θαηαλάισζεο ΗΔ πινίνπ ππό κειέηε γηα όιεο ηηο ιεηηνπξγηθέο
θαηαζηάζεηο κε ηελ εθαξκνγή ηεο πξνηεηλόκελεο ηνπνινγίαο πξνζαξκνζηηθνύ ειέγρνπ δεδνκέλσλ κε ξπζκηζηέο
ζηξνθώλ ζε ζρέζε κε ηελ πξόηεξε θαηάζηαζε
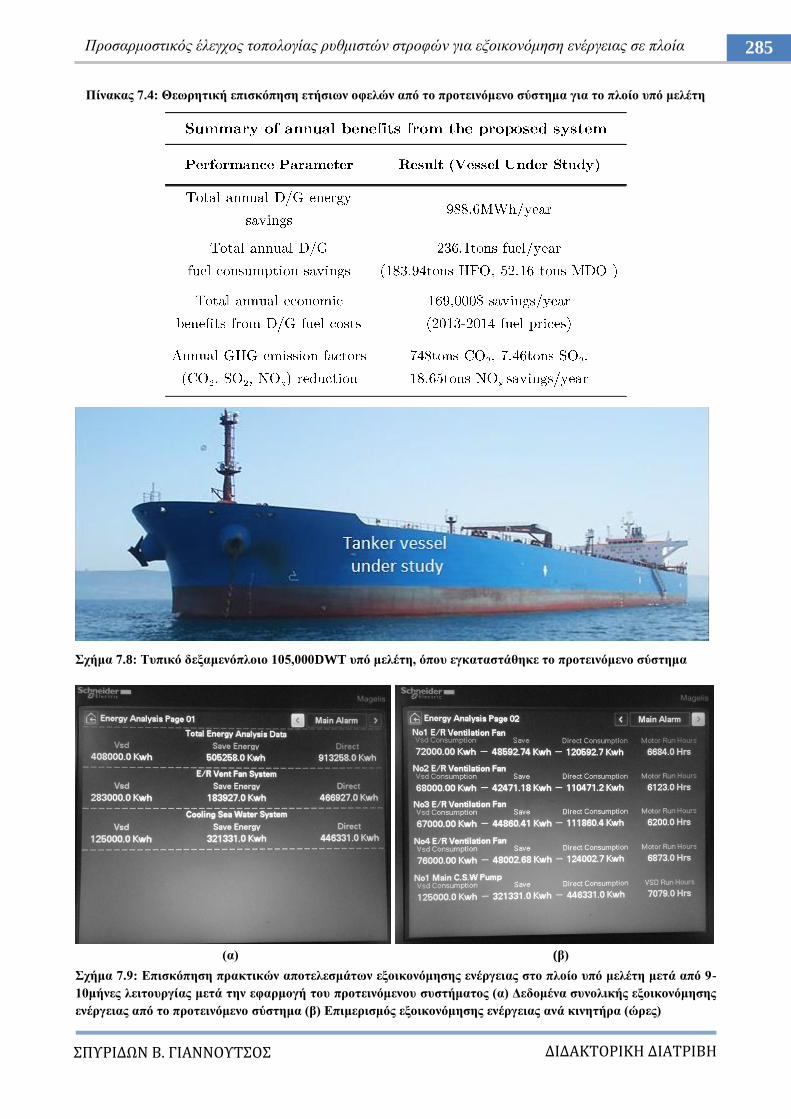
ΔΙΔΑΚΣΟΡΙΚΗ ΔΙΑΣΡΙΒΗ
ΠΤΡΙΔΩΝ Β. ΓΙΑΝΝΟΤΣΟ
285 Πξνζαξκνζηηθόο έιεγρνο ηνπνινγίαο ξπζκηζηώλ ζηξνθώλ γηα εμνηθνλόκεζε ελέξγεηαο ζε πινία
Πίλαθαο 7.4: Θεσξεηηθή επηζθόπεζε εηήζησλ νθειώλ από ην πξνηεηλόκελν ζύζηεκα γηα ην πινίν ππό κειέηε
ρήκα 7.8: Σππηθό δεμακελόπινην 105,000DWT ππό κειέηε, όπνπ εγθαηαζηάζεθε ην πξνηεηλόκελν ζύζηεκα
(α) (β)
ρήκα 7.9: Δπηζθόπεζε πξαθηηθώλ απνηειεζκάησλ εμνηθνλόκεζεο ελέξγεηαο ζην πινίν ππό κειέηε κεηά από 9-
10κήλεο ιεηηνπξγίαο κεηά ηελ εθαξκνγή ηνπ πξνηεηλόκελνπ ζπζηήκαηνο (α) Γεδνκέλα ζπλνιηθήο εμνηθνλόκεζεο
ελέξγεηαο από ην πξνηεηλόκελν ζύζηεκα (β) Δπηκεξηζκόο εμνηθνλόκεζεο ελέξγεηαο αλά θηλεηήξα (ώξεο)
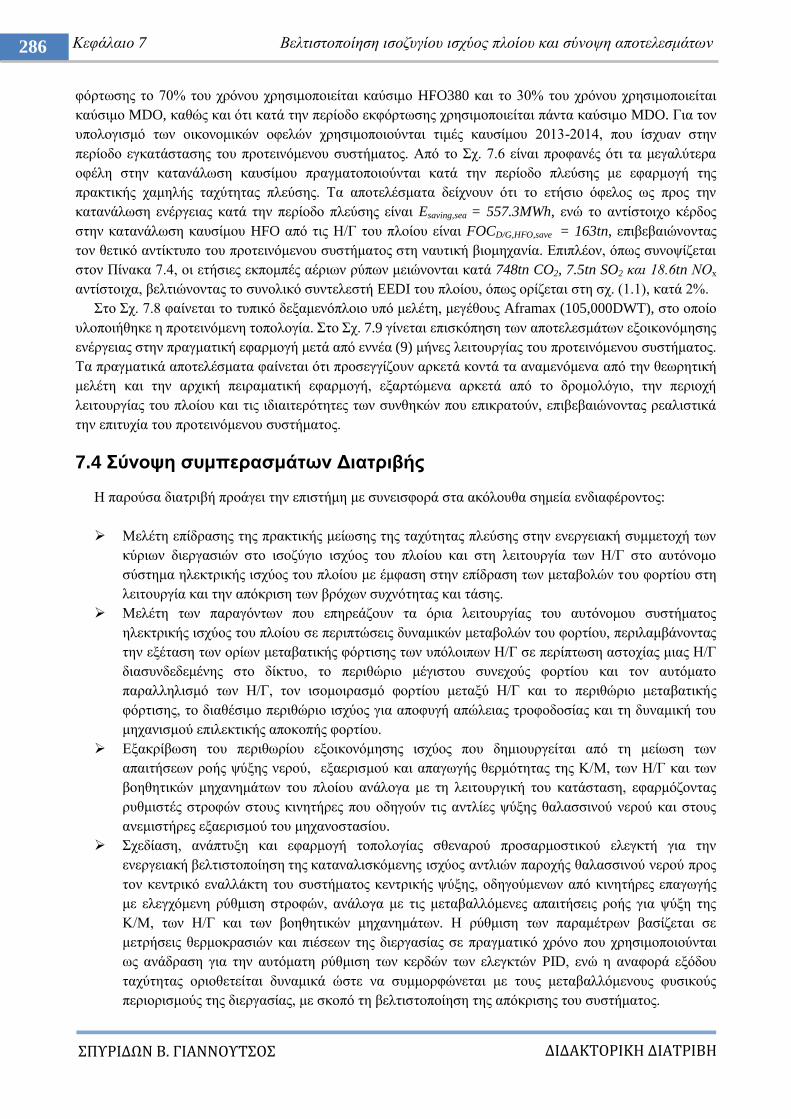
ΔΙΔΑΚΣΟΡΙΚΗ ΔΙΑΣΡΙΒΗ
ΠΤΡΙΔΩΝ Β. ΓΙΑΝΝΟΤΣΟ
286 Κεθάιαην 7 Βειηηζηνπνίεζε ηζνδπγίνπ ηζρύνο πινίνπ θαη ζύλνςε απνηειεζκάησλ
θόξησζεο ην 70% ηνπ ρξόλνπ ρξεζηκνπνηείηαη θαύζηκν HFO380 θαη ην 30% ηνπ ρξόλνπ ρξεζηκνπνηείηαη
θαύζηκν MDO, θαζώο θαη όηη θαηά ηελ πεξίνδν εθθόξησζεο ρξεζηκνπνηείηαη πάληα θαύζηκν MDO. Γηα ηνλ
ππνινγηζκό ησλ νηθνλνκηθώλ νθειώλ ρξεζηκνπνηνύληαη ηηκέο θαπζίκνπ 2013-2014, πνπ ίζρπαλ ζηελ
πεξίνδν εγθαηάζηαζεο ηνπ πξνηεηλόκελνπ ζπζηήκαηνο. Από ην ρ. 7.6 είλαη πξνθαλέο όηη ηα κεγαιύηεξα
νθέιε ζηελ θαηαλάισζε θαπζίκνπ πξαγκαηνπνηνύληαη θαηά ηελ πεξίνδν πιεύζεο κε εθαξκνγή ηεο
πξαθηηθήο ρακειήο ηαρύηεηαο πιεύζεο. Σα απνηειέζκαηα δείρλνπλ όηη ην εηήζην όθεινο σο πξνο ηελ
θαηαλάισζε ελέξγεηαο θαηά ηελ πεξίνδν πιεύζεο είλαη Esaving,sea = 557.3MWh, ελώ ην αληίζηνηρν θέξδνο
ζηελ θαηαλάισζε θαπζίκνπ HFO από ηηο Ζ/Γ ηνπ πινίνπ είλαη FOCD/G,HFO,save = 163tn, επηβεβαηώλνληαο
ηνλ ζεηηθό αληίθηππν ηνπ πξνηεηλόκελνπ ζπζηήκαηνο ζηε λαπηηθή βηνκεραλία. Δπηπιένλ, όπσο ζπλνςίδεηαη
ζηνλ Πίλαθα 7.4, νη εηήζηεο εθπνκπέο αέξησλ ξύπσλ κεηώλνληαη θαηά 748tn CO2, 7.5tn SO2 θαη 18.6tn ΝΟx
αληίζηνηρα, βειηηώλνληαο ην ζπλνιηθό ζπληειεζηή EEDI ηνπ πινίνπ, όπσο νξίδεηαη ζηε ζρ. (1.1), θαηά 2%.
ην ρ. 7.8 θαίλεηαη ην ηππηθό δεμακελόπινην ππό κειέηε, κεγέζνπο Aframax (105,000DWT), ζην νπνίν
πινπνηήζεθε ε πξνηεηλόκελε ηνπνινγία. ην ρ. 7.9 γίλεηαη επηζθόπεζε ησλ απνηειεζκάησλ εμνηθνλόκεζεο
ελέξγεηαο ζηελ πξαγκαηηθή εθαξκνγή κεηά από ελλέα (9) κήλεο ιεηηνπξγίαο ηνπ πξνηεηλόκελνπ ζπζηήκαηνο.
Σα πξαγκαηηθά απνηειέζκαηα θαίλεηαη όηη πξνζεγγίδνπλ αξθεηά θνληά ηα αλακελόκελα από ηελ ζεσξεηηθή
κειέηε θαη ηελ αξρηθή πεηξακαηηθή εθαξκνγή, εμαξηώκελα αξθεηά από ην δξνκνιόγην, ηελ πεξηνρή
ιεηηνπξγίαο ηνπ πινίνπ θαη ηηο ηδηαηηεξόηεηεο ησλ ζπλζεθώλ πνπ επηθξαηνύλ, επηβεβαηώλνληαο ξεαιηζηηθά
ηελ επηηπρία ηνπ πξνηεηλόκελνπ ζπζηήκαηνο.
7.4 ύλνςε ζπκπεξαζκάησλ Γηαηξηβήο
Ζ παξνύζα δηαηξηβή πξνάγεη ηελ επηζηήκε κε ζπλεηζθνξά ζηα αθόινπζα ζεκεία ελδηαθέξνληνο:
Μειέηε επίδξαζεο ηεο πξαθηηθήο κείσζεο ηεο ηαρύηεηαο πιεύζεο ζηελ ελεξγεηαθή ζπκκεηνρή ησλ
θύξησλ δηεξγαζηώλ ζην ηζνδύγην ηζρύνο ηνπ πινίνπ θαη ζηε ιεηηνπξγία ησλ Ζ/Γ ζην απηόλνκν
ζύζηεκα ειεθηξηθήο ηζρύνο ηνπ πινίνπ κε έκθαζε ζηελ επίδξαζε ησλ κεηαβνιώλ ηνπ θνξηίνπ ζηε
ιεηηνπξγία θαη ηελ απόθξηζε ησλ βξόρσλ ζπρλόηεηαο θαη ηάζεο.
Μειέηε ησλ παξαγόλησλ πνπ επεξεάδνπλ ηα όξηα ιεηηνπξγίαο ηνπ απηόλνκνπ ζπζηήκαηνο
ειεθηξηθήο ηζρύνο ηνπ πινίνπ ζε πεξηπηώζεηο δπλακηθώλ κεηαβνιώλ ηνπ θνξηίνπ, πεξηιακβάλνληαο
ηελ εμέηαζε ησλ νξίσλ κεηαβαηηθήο θόξηηζεο ησλ ππόινηπσλ Ζ/Γ ζε πεξίπησζε αζηνρίαο κηαο Ζ/Γ
δηαζπλδεδεκέλεο ζην δίθηπν, ην πεξηζώξην κέγηζηνπ ζπλερνύο θνξηίνπ θαη ηνλ απηόκαην
παξαιιειηζκό ησλ Ζ/Γ, ηνλ ηζνκνηξαζκό θνξηίνπ κεηαμύ Ζ/Γ θαη ην πεξηζώξην κεηαβαηηθήο
θόξηηζεο, ην δηαζέζηκν πεξηζώξην ηζρύνο γηα απνθπγή απώιεηαο ηξνθνδνζίαο θαη ηε δπλακηθή ηνπ
κεραληζκνύ επηιεθηηθήο απνθνπήο θνξηίνπ.
Δμαθξίβσζε ηνπ πεξηζσξίνπ εμνηθνλόκεζεο ηζρύνο πνπ δεκηνπξγείηαη από ηε κείσζε ησλ
απαηηήζεσλ ξνήο ςύμεο λεξνύ, εμαεξηζκνύ θαη απαγσγήο ζεξκόηεηαο ηεο Κ/Μ, ησλ Ζ/Γ θαη ησλ
βνεζεηηθώλ κεραλεκάησλ ηνπ πινίνπ αλάινγα κε ηε ιεηηνπξγηθή ηνπ θαηάζηαζε, εθαξκόδνληαο
ξπζκηζηέο ζηξνθώλ ζηνπο θηλεηήξεο πνπ νδεγνύλ ηηο αληιίεο ςύμεο ζαιαζζηλνύ λεξνύ θαη ζηνπο
αλεκηζηήξεο εμαεξηζκνύ ηνπ κεραλνζηαζίνπ.
ρεδίαζε, αλάπηπμε θαη εθαξκνγή ηνπνινγίαο ζζελαξνύ πξνζαξκνζηηθνύ ειεγθηή γηα ηελ
ελεξγεηαθή βειηηζηνπνίεζε ηεο θαηαλαιηζθόκελεο ηζρύνο αληιηώλ παξνρήο ζαιαζζηλνύ λεξνύ πξνο
ηνλ θεληξηθό ελαιιάθηε ηνπ ζπζηήκαηνο θεληξηθήο ςύμεο, νδεγνύκελσλ από θηλεηήξεο επαγσγήο
κε ειεγρόκελε ξύζκηζε ζηξνθώλ, αλάινγα κε ηηο κεηαβαιιόκελεο απαηηήζεηο ξνήο γηα ςύμε ηεο
Κ/Μ, ησλ Ζ/Γ θαη ησλ βνεζεηηθώλ κεραλεκάησλ. Ζ ξύζκηζε ησλ παξακέηξσλ βαζίδεηαη ζε
κεηξήζεηο ζεξκνθξαζηώλ θαη πηέζεσλ ηεο δηεξγαζίαο ζε πξαγκαηηθό ρξόλν πνπ ρξεζηκνπνηνύληαη
σο αλάδξαζε γηα ηελ απηόκαηε ξύζκηζε ησλ θεξδώλ ησλ ειεγθηώλ PID, ελώ ε αλαθνξά εμόδνπ
ηαρύηεηαο νξηνζεηείηαη δπλακηθά ώζηε λα ζπκκνξθώλεηαη κε ηνπο κεηαβαιιόκελνπο θπζηθνύο
πεξηνξηζκνύο ηεο δηεξγαζίαο, κε ζθνπό ηε βειηηζηνπνίεζε ηεο απόθξηζεο ηνπ ζπζηήκαηνο.
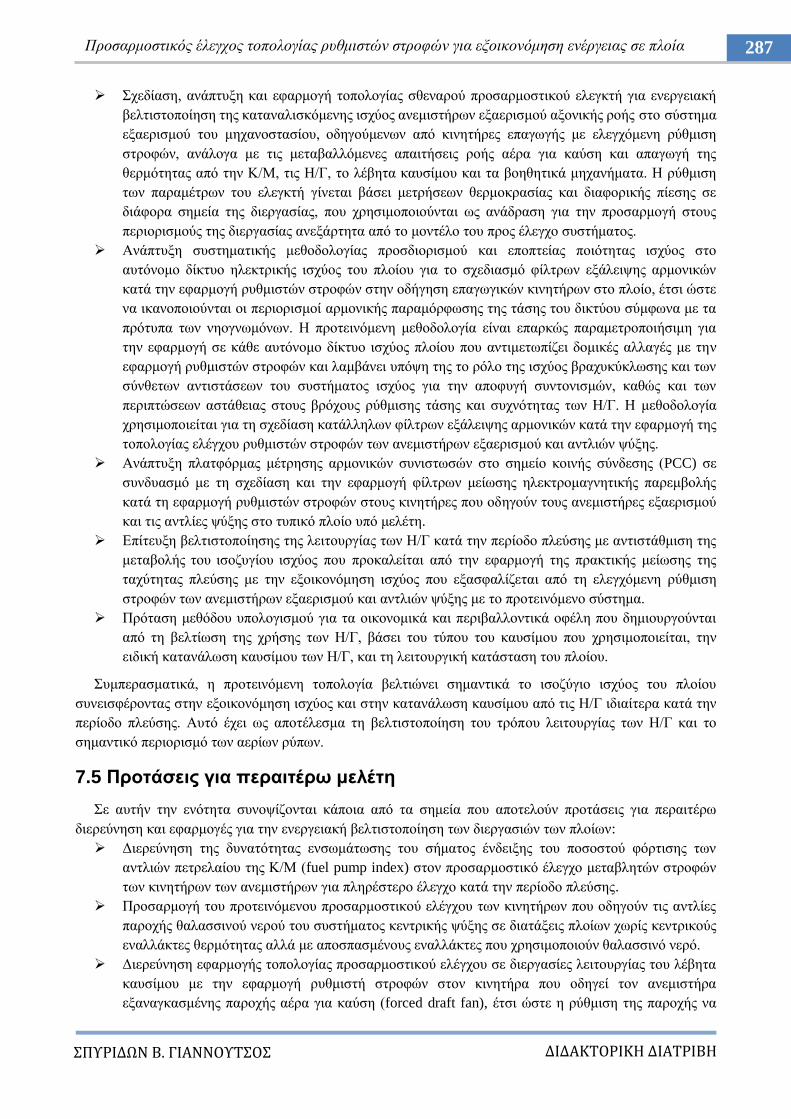
ΔΙΔΑΚΣΟΡΙΚΗ ΔΙΑΣΡΙΒΗ
ΠΤΡΙΔΩΝ Β. ΓΙΑΝΝΟΤΣΟ
287 Πξνζαξκνζηηθόο έιεγρνο ηνπνινγίαο ξπζκηζηώλ ζηξνθώλ γηα εμνηθνλόκεζε ελέξγεηαο ζε πινία
ρεδίαζε, αλάπηπμε θαη εθαξκνγή ηνπνινγίαο ζζελαξνύ πξνζαξκνζηηθνύ ειεγθηή γηα ελεξγεηαθή
βειηηζηνπνίεζε ηεο θαηαλαιηζθόκελεο ηζρύνο αλεκηζηήξσλ εμαεξηζκνύ αμνληθήο ξνήο ζην ζύζηεκα
εμαεξηζκνύ ηνπ κεραλνζηαζίνπ, νδεγνύκελσλ από θηλεηήξεο επαγσγήο κε ειεγρόκελε ξύζκηζε
ζηξνθώλ, αλάινγα κε ηηο κεηαβαιιόκελεο απαηηήζεηο ξνήο αέξα γηα θαύζε θαη απαγσγή ηεο
ζεξκόηεηαο από ηελ Κ/Μ, ηηο Ζ/Γ, ην ιέβεηα θαπζίκνπ θαη ηα βνεζεηηθά κεραλήκαηα. Ζ ξύζκηζε
ησλ παξακέηξσλ ηνπ ειεγθηή γίλεηαη βάζεη κεηξήζεσλ ζεξκνθξαζίαο θαη δηαθνξηθήο πίεζεο ζε
δηάθνξα ζεκεία ηεο δηεξγαζίαο, πνπ ρξεζηκνπνηνύληαη σο αλάδξαζε γηα ηελ πξνζαξκνγή ζηνπο
πεξηνξηζκνύο ηεο δηεξγαζίαο αλεμάξηεηα από ην κνληέιν ηνπ πξνο έιεγρν ζπζηήκαηνο.
Αλάπηπμε ζπζηεκαηηθήο κεζνδνινγίαο πξνζδηνξηζκνύ θαη επνπηείαο πνηόηεηαο ηζρύνο ζην
απηόλνκν δίθηπν ειεθηξηθήο ηζρύνο ηνπ πινίνπ γηα ην ζρεδηαζκό θίιηξσλ εμάιεηςεο αξκνληθώλ
θαηά ηελ εθαξκνγή ξπζκηζηώλ ζηξνθώλ ζηελ νδήγεζε επαγσγηθώλ θηλεηήξσλ ζην πινίν, έηζη ώζηε
λα ηθαλνπνηνύληαη νη πεξηνξηζκνί αξκνληθήο παξακόξθσζεο ηεο ηάζεο ηνπ δηθηύνπ ζύκθσλα κε ηα
πξόηππα ησλ λενγλσκόλσλ. Ζ πξνηεηλόκελε κεζνδνινγία είλαη επαξθώο παξακεηξνπνηήζηκε γηα
ηελ εθαξκνγή ζε θάζε απηόλνκν δίθηπν ηζρύνο πινίνπ πνπ αληηκεησπίδεη δνκηθέο αιιαγέο κε ηελ
εθαξκνγή ξπζκηζηώλ ζηξνθώλ θαη ιακβάλεη ππόςε ηεο ην ξόιν ηεο ηζρύνο βξαρπθύθισζεο θαη ησλ
ζύλζεησλ αληηζηάζεσλ ηνπ ζπζηήκαηνο ηζρύνο γηα ηελ απνθπγή ζπληνληζκώλ, θαζώο θαη ησλ
πεξηπηώζεσλ αζηάζεηαο ζηνπο βξόρνπο ξύζκηζεο ηάζεο θαη ζπρλόηεηαο ησλ Ζ/Γ. Ζ κεζνδνινγία
ρξεζηκνπνηείηαη γηα ηε ζρεδίαζε θαηάιιεισλ θίιηξσλ εμάιεηςεο αξκνληθώλ θαηά ηελ εθαξκνγή ηεο
ηνπνινγίαο ειέγρνπ ξπζκηζηώλ ζηξνθώλ ησλ αλεκηζηήξσλ εμαεξηζκνύ θαη αληιηώλ ςύμεο.
Αλάπηπμε πιαηθόξκαο κέηξεζεο αξκνληθώλ ζπληζησζώλ ζην ζεκείν θνηλήο ζύλδεζεο (PCC) ζε
ζπλδπαζκό κε ηε ζρεδίαζε θαη ηελ εθαξκνγή θίιηξσλ κείσζεο ειεθηξνκαγλεηηθήο παξεκβνιήο
θαηά ηε εθαξκνγή ξπζκηζηώλ ζηξνθώλ ζηνπο θηλεηήξεο πνπ νδεγνύλ ηνπο αλεκηζηήξεο εμαεξηζκνύ
θαη ηηο αληιίεο ςύμεο ζην ηππηθό πινίν ππό κειέηε.
Δπίηεπμε βειηηζηνπνίεζεο ηεο ιεηηνπξγίαο ησλ Ζ/Γ θαηά ηελ πεξίνδν πιεύζεο κε αληηζηάζκηζε ηεο
κεηαβνιήο ηνπ ηζνδπγίνπ ηζρύνο πνπ πξνθαιείηαη από ηελ εθαξκνγή ηεο πξαθηηθήο κείσζεο ηεο
ηαρύηεηαο πιεύζεο κε ηελ εμνηθνλόκεζε ηζρύνο πνπ εμαζθαιίδεηαη από ηε ειεγρόκελε ξύζκηζε
ζηξνθώλ ησλ αλεκηζηήξσλ εμαεξηζκνύ θαη αληιηώλ ςύμεο κε ην πξνηεηλόκελν ζύζηεκα.
Πξόηαζε κεζόδνπ ππνινγηζκνύ γηα ηα νηθνλνκηθά θαη πεξηβαιινληηθά νθέιε πνπ δεκηνπξγνύληαη
από ηε βειηίσζε ηεο ρξήζεο ησλ Ζ/Γ, βάζεη ηνπ ηύπνπ ηνπ θαπζίκνπ πνπ ρξεζηκνπνηείηαη, ηελ
εηδηθή θαηαλάισζε θαπζίκνπ ησλ Ζ/Γ, θαη ηε ιεηηνπξγηθή θαηάζηαζε ηνπ πινίνπ.
πκπεξαζκαηηθά, ε πξνηεηλόκελε ηνπνινγία βειηηώλεη ζεκαληηθά ην ηζνδύγην ηζρύνο ηνπ πινίνπ
ζπλεηζθέξνληαο ζηελ εμνηθνλόκεζε ηζρύνο θαη ζηελ θαηαλάισζε θαπζίκνπ από ηηο Ζ/Γ ηδηαίηεξα θαηά ηελ
πεξίνδν πιεύζεο. Απηό έρεη σο απνηέιεζκα ηε βειηηζηνπνίεζε ηνπ ηξόπνπ ιεηηνπξγίαο ησλ Ζ/Γ θαη ην
ζεκαληηθό πεξηνξηζκό ησλ αεξίσλ ξύπσλ.
7.5 Πξνηάζεηο γηα πεξαηηέξσ κειέηε
ε απηήλ ηελ ελόηεηα ζπλνςίδνληαη θάπνηα από ηα ζεκεία πνπ απνηεινύλ πξνηάζεηο γηα πεξαηηέξσ
δηεξεύλεζε θαη εθαξκνγέο γηα ηελ ελεξγεηαθή βειηηζηνπνίεζε ησλ δηεξγαζηώλ ησλ πινίσλ:
Γηεξεύλεζε ηεο δπλαηόηεηαο ελζσκάησζεο ηνπ ζήκαηνο έλδεημεο ηνπ πνζνζηνύ θόξηηζεο ησλ
αληιηώλ πεηξειαίνπ ηεο Κ/Μ (fuel pump index) ζηνλ πξνζαξκνζηηθό έιεγρν κεηαβιεηώλ ζηξνθώλ
ησλ θηλεηήξσλ ησλ αλεκηζηήξσλ γηα πιεξέζηεξν έιεγρν θαηά ηελ πεξίνδν πιεύζεο.
Πξνζαξκνγή ηνπ πξνηεηλόκελνπ πξνζαξκνζηηθνύ ειέγρνπ ησλ θηλεηήξσλ πνπ νδεγνύλ ηηο αληιίεο
παξνρήο ζαιαζζηλνύ λεξνύ ηνπ ζπζηήκαηνο θεληξηθήο ςύμεο ζε δηαηάμεηο πινίσλ ρσξίο θεληξηθνύο
ελαιιάθηεο ζεξκόηεηαο αιιά κε απνζπαζκέλνπο ελαιιάθηεο πνπ ρξεζηκνπνηνύλ ζαιαζζηλό λεξό.
Γηεξεύλεζε εθαξκνγήο ηνπνινγίαο πξνζαξκνζηηθνύ ειέγρνπ ζε δηεξγαζίεο ιεηηνπξγίαο ηνπ ιέβεηα
θαπζίκνπ κε ηελ εθαξκνγή ξπζκηζηή ζηξνθώλ ζηνλ θηλεηήξα πνπ νδεγεί ηνλ αλεκηζηήξα
εμαλαγθαζκέλεο παξνρήο αέξα γηα θαύζε (forced draft fan), έηζη ώζηε ε ξύζκηζε ηεο παξνρήο λα
ΔΙΔΑΚΣΟΡΙΚΗ ΔΙΑΣΡΙΒΗ
ΠΤΡΙΔΩΝ Β. ΓΙΑΝΝΟΤΣΟ
288 Κεθάιαην 7 Βειηηζηνπνίεζε ηζνδπγίνπ ηζρύνο πινίνπ θαη ζύλνςε απνηειεζκάησλ
γίλεηαη κέζσ ηεο ξύζκηζεο ησλ ζηξνθώλ ηνπ θηλεηήξα ζε ζρέζε κε ηνλ ππάξρνλ έιεγρν ηεο ζέζεο
ησλ πηεξπγίσλ (vanes) ηεο πηεξσηήο ηνπ αλεκηζηήξα (impeller). Με απηόλ ηνλ ηξόπν εμνκαιύλεηαη
ε ξνή αέξα πνπ ρξεζηκνπνηείηαη γηα ηελ θαύζε (air flow), ηδηαίηεξα ζηα ρακειά θνξηία, κε
απνηέιεζκα ηελ θαιύηεξε πνηόηεηα ηεο θαύζεο από ην ιέβεηα θαηά ηελ πεξίνδν ηεο εθθόξησζεο ή
ζηελ πεξίνδν ζέξκαλζεο θνξηίνπ. Δπηπιένλ κε απηή ηε κέζνδν απνθεύγεηαη ε πηώζε ζεξκνθξαζίαο
ζην ζάιακν θαύζεο πνπ δεκηνπξγείηαη ιόγσ ηεο δηαξξνήο αέξα από ηα πηεξύγηα πνπ παξακέλνπλ
ειάρηζηα αλνηρηά όηαλ ν αλεκηζηήξαο ιεηηνπξγεί ζπλερώο ζε ρακειό θνξηίν, όπνπ αθόκε θαη ζε
απηήλ ηελ πεξίπησζε θαηαλαιώλεη ην 50% ηεο νλνκαζηηθήο ηζρύνο. Παξάιιεια, απνθεύγνληαη νη
θνξπθέο ξεύκαηνο θαη νη αληίζηνηρεο πηώζεηο ηάζεο ζην ζύζηεκα ηζρύνο ιόγσ ηεο ζηαδηαθήο
αύμεζεο ηνπ ξεύκαηνο κε ην ξπζκηζηή ζηξνθώλ, νδεγώληαο ζε ζηαζεξνπνίεζε ηεο ιεηηνπξγίαο ηνπ
ιέβεηα ηδηαίηεξα ζηα ρακειά θνξηία.
Γηεξεύλεζε ηεο δπλαηόηεηαο πξνζαξκνζηηθνύ ειέγρνπ κε ξπζκηζηή ζηξνθώλ ηεο ξνήο πνπ παξέρεη
ε αληιία παξνρήο θαπζίκνπ ζηνλ θπγνθεληξηθό θαζαξηζηή (HFO purifier) κε ζθνπό ηελ αύμεζε ηνπ
ρξόλνπ δηαρσξηζκνύ ηνπ θαζαξνύ θαπζίκνπ από ηα θαηάινηπα θαη ηελ αύμεζε ηεο απόδνζεο κε
απνηέιεζκα ηελ θαιύηεξε ιεηηνπξγία ηεο Κ/Μ θαη ηε κείσζε ηνπ θόζηνπο ζπληήξεζεο. Ο έιεγρνο
ξνήο ζε απηήλ ηελ πεξίπησζε ζα κπνξνύζε λα επηηεπρζεί θξαηώληαο ζηαζεξή ζηάζκε ηεο δεμακελήο
πεηξειαίνπ Κ/Μ θαη Ζ/Γ θαζώο θαη ζηαζεξήο ζεξκνθξαζίαο θαπζίκνπ, έηζη ώζηε ε ξνή θαπζίκνπ
πξνο ην HFO purifier λα ξπζκίδεηαη από ηελ αληιία παξνρήο θαπζίκνπ κέζσ ηνπ ειέγρνπ ηνπ
αληίζηνηρνπ θηλεηήξα κε ξπζκηζηή ζηξνθώλ κε βάζε ηε δήηεζε ηνπ θνξηίνπ ηε δεδνκέλε ζηηγκή.
7.6 Αλαθνξέο έβδνκνπ θεθαιαίνπ
[1] T.L. Baldwin, and S.A. Lewis, “Distribution load flow methods for shipboard power systems”, IEEE Trans. Ind.
Appl., vol. 40, no.5, pp. 1183-1190, Sept.-Oct. 2004
[2] B. Stevens, A. Dubey and S. Santoso, "On Improving Reliability of Shipboard Power System", IEEE Trans.
Power Sys., vol. 30, no. 4, pp. 1905-1912, July 2015
[3] C.-L. Su, C.-J. Chen, and C.C. Lee, “Fast Evaluation Methods for Voltage Sags in Ship Electrical Power
Systems”, IEEE Trans. Ind. Appl., vol. 49, no.1, pp. 233-241, Jan.-Feb. 2013
[4] P. Mitra, and G.K. Venayagamoorthy, “Implementation of an Intelligent Reconfiguration Algorithm for an
Electric Ship‟s Power System”, IEEE Trans. Ind. Appl., vol. 47, no.5, pp. 2292-2300, Sept.-Oct 2011
[5] K.L. Butler-Purry, and N.D.R. Sarma, “Self-healing reconfiguration for restoration of naval shipboard power
systems”, IEEE Trans. Power Sys., vol. 19, no.2, pp. 754-762, May. 2004
[6] G. Seenumani, L. Sun, and H. Peng, “Real-Time Power Management of Integrated Power Systems in All
Electric Ships Leveraging Multi Time Scale Property”, IEEE Trans. Control. Sys. Techn., vol. 20, no.1, pp. 232-
240, Nov.-Dec. 2013
[7] F.D. Kanellos, G.J. Tsekouras, and N.D. Hatziargyriou, “Optimal Demand-Side Management and Power
Generation Scheduling in an All-Electric Ship”, IEEE Trans. Sustain. Energy., vol. 59, no.8, pp. 3102-3112,
Aug. 2012
[8] F. Xianyong, K.L. Butler-Purry, and T. Zourntos, “Multi-Agent System-Based Real-Time Load Management for
All-Electric Ship Power Systems in DC Zone Level”, IEEE Trans. Power Sys., vol. 27, no.4, pp. 1719-1728,
Nov. 2012
[9] C. Yan, G.K. Venayagamoorthy, and K. Corzine, “AIS-Based Coordinated and Adaptive Control of Generator
Excitation Systems for an Electric Ship”, IEEE Trans. Ind. Electron., vol. 59, no.8, pp. 3102-3112, Aug. 2012
[10] T. Ericsen, N. Hingorani, and Y. Khersonsky, “Power electronics and future marine electrical systems”, IEEE
Trans. Ind. Appl., vol. 42, no.1, pp. 115-163, Jan.-Feb. 2006
[11] F.D. Kanellos, “Optimal Power Management With GHG Emissions Limitation in All-Electric Ship Power
Systems Comprising Energy Storage Systems”, IEEE Trans. Power Sys., vol. 29, no.1, pp. 330-339, Jan. 2014
ΔΙΔΑΚΣΟΡΙΚΗ ΔΙΑΣΡΙΒΗ
ΠΤΡΙΔΩΝ Β. ΓΙΑΝΝΟΤΣΟ
289 Πξνζαξκνζηηθόο έιεγρνο ηνπνινγίαο ξπζκηζηώλ ζηξνθώλ γηα εμνηθνλόκεζε ελέξγεηαο ζε πινία
[12] T.A Johansen, T.I. Bo, E. Mathiesen, A. Vesker, and A.J Sorensen, “Dynamic Positioning System as Dynamic
Energy Storage on Diesel-Electric Ships” IEEE Trans. Power Sys., vol. 29, no.6, pp. 3806-3091, Nov. 2014
[13] C.-L. Su, M.-C. Lin, and C.-H. Liao, “A Method for Evaluating Energy Efficiency to Justify Power Factor
Correction in Ship Power Systems”, IEEE Trans. Ind. Appl., vol. 49, no.6, pp. 2773-2782, Nov.-Dec. 2013
[14] S. V. Giannoutsos and S. N. Manias, "Development of an integrated energy efficiency control system for ship
power balance and diesel generator fuel consumption optimization", 2013 IEEE Industry Applications Society
Annual Meeting, Lake Buena Vista, FL, 2013, pp. 1-11
[15] C.-L. Su, W.-L. Chung, and K.-T. Yu, “An Energy-Savings Evaluation Method for Variable-Frequency-Drive
Applications on Ship Central Cooling Systems, IEEE Trans. Ind. Appl.,vol.50,no.2,pp.1286-1294, Mar-Apr 2014
[16] S.V. Giannoutsos, and S.N. Manias, “A Data-Driven Process Controller for Energy Efficient Variable-Speed
Pump Operation in the Central Cooling Water System of Marine Vessels”, IEEE Trans. Ind. Electron., vol. 62,
no. 1, pp. 587-598, Jan. 2015
[17] S. V. Giannoutsos and S. N. Manias, "Improving Engine Room Ventilation Systems: A Data-Driven Process
Controller for Energy-Efficient, Variable-Speed Fan Operation in Marine Vessels", IEEE Ind. Appl. Mag., vol.
22, no. 6, pp. 66-81, Nov.-Dec. 2016
[18] S. V. Giannoutsos and S. N. Manias, "Energy management and D/G fuel consumption optimization in the power
system of marine vessels through VFD-based process flow control", IEEE 15th Int. Conf. on Environ. and
Electr. Eng. (EEEIC), Rome, 2015, pp. 842-850
[19] S.V. Giannoutsos, and S.N. Manias, “A Systematic Power Quality Assessment and Harmonic Filter Design
Methodology for Variable Frequency Drive Application in Marine Vessels”, IEEE Trans. Ind. Appl., vol. 51,
no.2, pp. 1909-1919, Mar.-Apr. 2015
[20] A. Sarvi, C.J. Fogelholm and R. Zevenhoven: “Emissions from largescale medium-speed diesel engines: 2.
Influence of fuel type and operating mode”, J. of Fuel Process. Techn., Vol. 89, No. 5, pp. 520-527 , 2008
ΔΙΔΑΚΣΟΡΙΚΗ ΔΙΑΣΡΙΒΗ
ΠΤΡΙΔΩΝ Β. ΓΙΑΝΝΟΤΣΟ
290 Κεθάιαην 7 Βειηηζηνπνίεζε ηζνδπγίνπ ηζρύνο πινίνπ θαη ζύλνςε απνηειεζκάησλ
291 Πξνζαξκνζηηθόο έιεγρνο ηνπνινγίαο ξπζκηζηώλ ζηξνθώλ γηα εμνηθνλόκεζε ελέξγεηαο ζε πινία
Παξάξηεκα
Λίζηα θύξησλ δεκνζηεύζεσλ Γηαηξηβήο
ην παξάξηεκα απηό παξαηίζεληαη νη ζεκαληηθόηεξεο δεκνζηεύζεηο όπσο αλαθέξνληαη παξαθάησ:
[J1] S. V. Giannoutsos and S. N. Manias, "A Data-Driven Process Controller for Energy-Efficient
Variable-Speed Pump Operation in the Central Cooling Water System of Marine Vessels", in IEEE
Transactions on Industrial Electronics, vol. 62, no. 1, pp. 587-598, Jan. 2015
[J2] S. V. Giannoutsos and S. N. Manias, "A Systematic Power-Quality Assessment and Harmonic Filter
Design Methodology for Variable-Frequency Drive Application in Marine Vessels", in IEEE
Transactions on Industry Applications, vol. 51, no. 2, pp. 1909-1919, March-April 2015
[J3] S. V. Giannoutsos and S. N. Manias, "Improving Engine Room Ventilation Systems: A Data-Driven
Process Controller for Energy-Efficient, Variable-Speed Fan Operation in Marine Vessels", in IEEE
Industry Applications Magazine, vol. 22, no. 6, pp. 66-81, Nov.-Dec. 2016
[C1] S. V. Giannoutsos and S. N. Manias, "Energy management and D/G fuel consumption optimization
in the power system of marine vessels through VFD-based process flow control," 2015 IEEE 15th Int.
Conference on Environment and Electrical Engineering (EEEIC), Rome, 2015, pp. 842-850.
[C2] S. V. Giannoutsos, S. Kokosis and S. N. Manias, "A gate drive circuit for Normally-On SiC JFETs
with self-protection functions against overcurrent and shoot-through fault conditions," 2015 IEEE
15th Int. Conference on Environment and Electrical Engineering (EEEIC), Rome, 2015, pp. 851-859.
[C3] S. V. Giannoutsos and S. N. Manias, "Development of an integrated energy efficiency control
system for ship power balance and diesel generator fuel consumption optimization," 2013 IEEE
Industry Applications Society Annual Meeting, Lake Buena Vista, FL, 2013, pp. 1-11
[C4] S. V. Giannoutsos and S. N. Manias, "A cascade control scheme for a grid connected Battery Energy
Storage System (BESS)," 2012 IEEE International Energy Conference and Exhibition
(ENERGYCON), Florence, 2012, pp. 469-474.
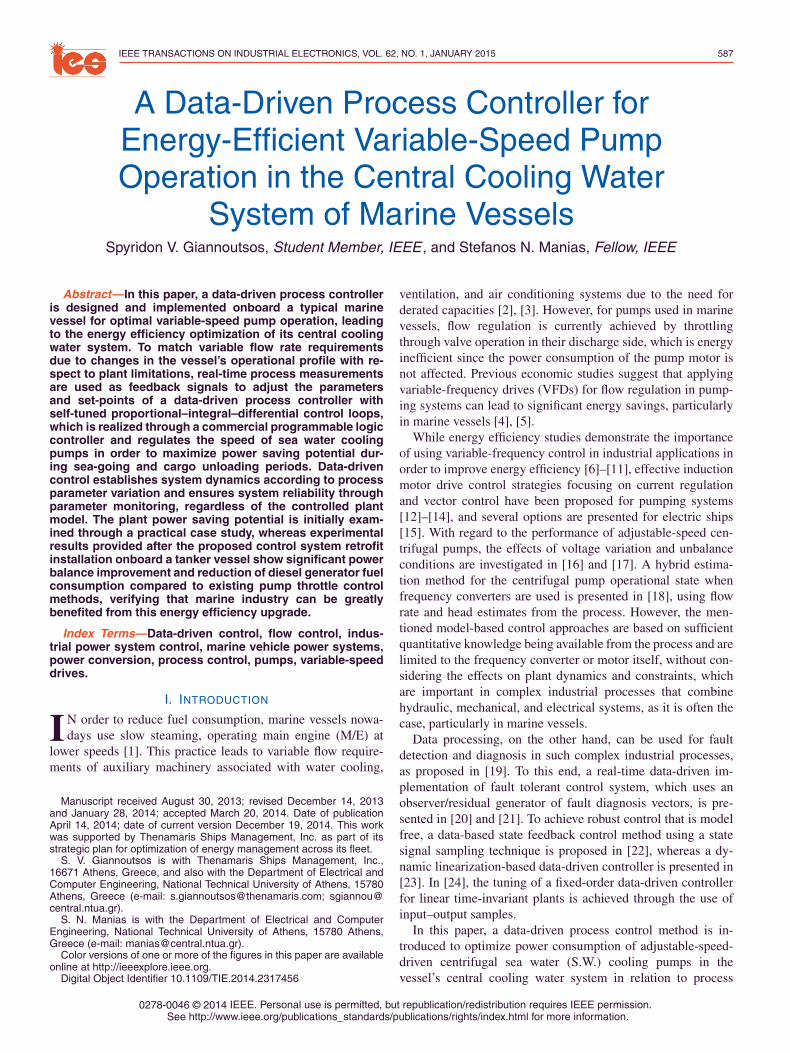
IEEE TRANSACTIONS ON INDUSTRIAL ELECTRONICS, VOL. 62, NO. 1, JANUARY 2015 587
A Data-Driven Process Controller forEnergy-Efficient Variable-Speed PumpOperation in the Central Cooling Water
System of Marine VesselsSpyridon V. Giannoutsos, Student Member, IEEE , and Stefanos N. Manias, Fellow, IEEE
Abstract—In this paper, a data-driven process controlleris designed and implemented onboard a typical marinevessel for optimal variable-speed pump operation, leadingto the energy efficiency optimization of its central coolingwater system. To match variable flow rate requirementsdue to changes in the vessel’s operational profile with re-spect to plant limitations, real-time process measurementsare used as feedback signals to adjust the parametersand set-points of a data-driven process controller withself-tuned proportional–integral–differential control loops,which is realized through a commercial programmable logiccontroller and regulates the speed of sea water coolingpumps in order to maximize power saving potential dur-ing sea-going and cargo unloading periods. Data-drivencontrol establishes system dynamics according to processparameter variation and ensures system reliability throughparameter monitoring, regardless of the controlled plantmodel. The plant power saving potential is initially exam-ined through a practical case study, whereas experimentalresults provided after the proposed control system retrofitinstallation onboard a tanker vessel show significant powerbalance improvement and reduction of diesel generator fuelconsumption compared to existing pump throttle controlmethods, verifying that marine industry can be greatlybenefited from this energy efficiency upgrade.
Index Terms—Data-driven control, flow control, indus-trial power system control, marine vehicle power systems,power conversion, process control, pumps, variable-speeddrives.
I. INTRODUCTION
IN order to reduce fuel consumption, marine vessels nowa-days use slow steaming, operating main engine (M/E) at
lower speeds [1]. This practice leads to variable flow require-ments of auxiliary machinery associated with water cooling,
Manuscript received August 30, 2013; revised December 14, 2013and January 28, 2014; accepted March 20, 2014. Date of publicationApril 14, 2014; date of current version December 19, 2014. This workwas supported by Thenamaris Ships Management, Inc. as part of itsstrategic plan for optimization of energy management across its fleet.
S. V. Giannoutsos is with Thenamaris Ships Management, Inc.,16671 Athens, Greece, and also with the Department of Electrical andComputer Engineering, National Technical University of Athens, 15780Athens, Greece (e-mail: [email protected]; [email protected]).
S. N. Manias is with the Department of Electrical and ComputerEngineering, National Technical University of Athens, 15780 Athens,Greece (e-mail: [email protected]).
Color versions of one or more of the figures in this paper are availableonline at http://ieeexplore.ieee.org.
Digital Object Identifier 10.1109/TIE.2014.2317456
ventilation, and air conditioning systems due to the need forderated capacities [2], [3]. However, for pumps used in marinevessels, flow regulation is currently achieved by throttlingthrough valve operation in their discharge side, which is energyinefficient since the power consumption of the pump motor isnot affected. Previous economic studies suggest that applyingvariable-frequency drives (VFDs) for flow regulation in pump-ing systems can lead to significant energy savings, particularlyin marine vessels [4], [5].
While energy efficiency studies demonstrate the importanceof using variable-frequency control in industrial applications inorder to improve energy efficiency [6]–[11], effective inductionmotor drive control strategies focusing on current regulationand vector control have been proposed for pumping systems[12]–[14], and several options are presented for electric ships[15]. With regard to the performance of adjustable-speed cen-trifugal pumps, the effects of voltage variation and unbalanceconditions are investigated in [16] and [17]. A hybrid estima-tion method for the centrifugal pump operational state whenfrequency converters are used is presented in [18], using flowrate and head estimates from the process. However, the men-tioned model-based control approaches are based on sufficientquantitative knowledge being available from the process and arelimited to the frequency converter or motor itself, without con-sidering the effects on plant dynamics and constraints, whichare important in complex industrial processes that combinehydraulic, mechanical, and electrical systems, as it is often thecase, particularly in marine vessels.
Data processing, on the other hand, can be used for faultdetection and diagnosis in such complex industrial processes,as proposed in [19]. To this end, a real-time data-driven im-plementation of fault tolerant control system, which uses anobserver/residual generator of fault diagnosis vectors, is pre-sented in [20] and [21]. To achieve robust control that is modelfree, a data-based state feedback control method using a statesignal sampling technique is proposed in [22], whereas a dy-namic linearization-based data-driven controller is presented in[23]. In [24], the tuning of a fixed-order data-driven controllerfor linear time-invariant plants is achieved through the use ofinput–output samples.
In this paper, a data-driven process control method is in-troduced to optimize power consumption of adjustable-speed-driven centrifugal sea water (S.W.) cooling pumps in thevessel’s central cooling water system in relation to process
0278-0046 © 2014 IEEE. Personal use is permitted, but republication/redistribution requires IEEE permission.See http://www.ieee.org/publications_standards/publications/rights/index.html for more information.
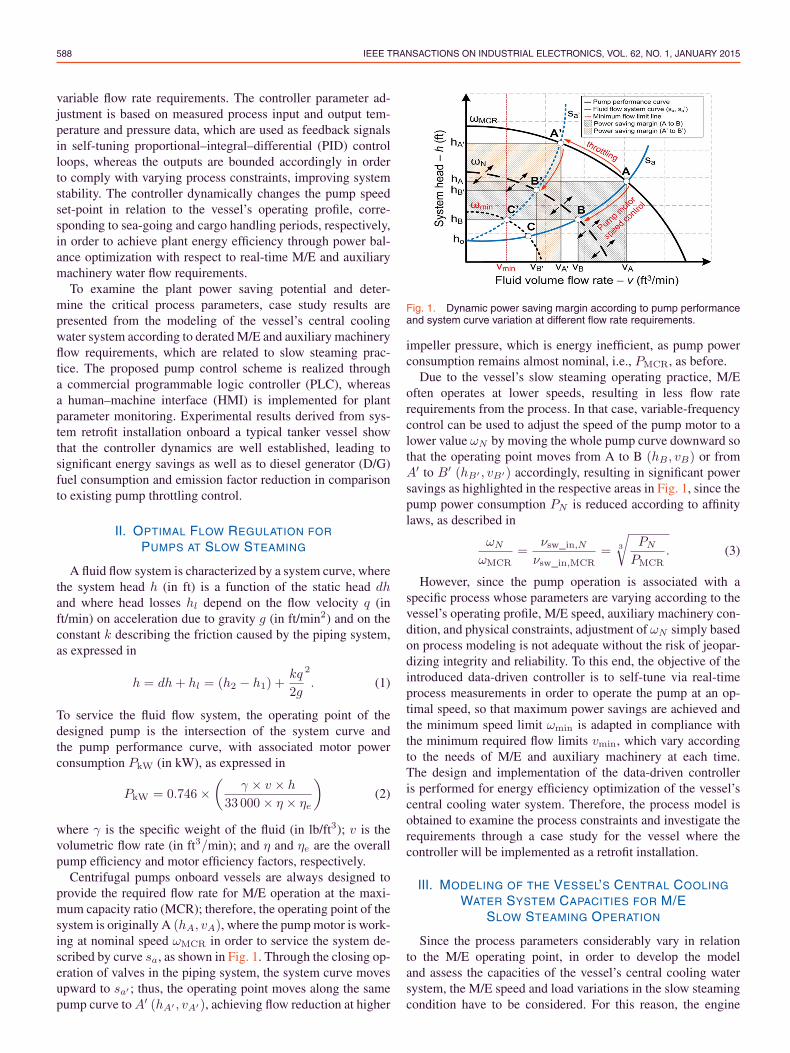
588 IEEE TRANSACTIONS ON INDUSTRIAL ELECTRONICS, VOL. 62, NO. 1, JANUARY 2015
variable flow rate requirements. The controller parameter ad-justment is based on measured process input and output tem-perature and pressure data, which are used as feedback signalsin self-tuning proportional–integral–differential (PID) controlloops, whereas the outputs are bounded accordingly in orderto comply with varying process constraints, improving systemstability. The controller dynamically changes the pump speedset-point in relation to the vessel’s operating profile, corre-sponding to sea-going and cargo handling periods, respectively,in order to achieve plant energy efficiency through power bal-ance optimization with respect to real-time M/E and auxiliarymachinery water flow requirements.
To examine the plant power saving potential and deter-mine the critical process parameters, case study results arepresented from the modeling of the vessel’s central coolingwater system according to derated M/E and auxiliary machineryflow requirements, which are related to slow steaming prac-tice. The proposed pump control scheme is realized througha commercial programmable logic controller (PLC), whereasa human–machine interface (HMI) is implemented for plantparameter monitoring. Experimental results derived from sys-tem retrofit installation onboard a typical tanker vessel showthat the controller dynamics are well established, leading tosignificant energy savings as well as to diesel generator (D/G)fuel consumption and emission factor reduction in comparisonto existing pump throttling control.
II. OPTIMAL FLOW REGULATION FOR
PUMPS AT SLOW STEAMING
A fluid flow system is characterized by a system curve, wherethe system head h (in ft) is a function of the static head dhand where head losses hl depend on the flow velocity q (inft/min) on acceleration due to gravity g (in ft/min2) and on theconstant k describing the friction caused by the piping system,as expressed in
h = dh+ hl = (h2 − h1) +kq
2g
2
. (1)
To service the fluid flow system, the operating point of thedesigned pump is the intersection of the system curve andthe pump performance curve, with associated motor powerconsumption PkW (in kW), as expressed in
PkW = 0.746×(
γ × v × h
33 000× η × ηe
)(2)
where γ is the specific weight of the fluid (in lb/ft3); v is thevolumetric flow rate (in ft3/min); and η and ηe are the overallpump efficiency and motor efficiency factors, respectively.
Centrifugal pumps onboard vessels are always designed toprovide the required flow rate for M/E operation at the maxi-mum capacity ratio (MCR); therefore, the operating point of thesystem is originally A (hA, vA), where the pump motor is work-ing at nominal speed ωMCR in order to service the system de-scribed by curve sa, as shown in Fig. 1. Through the closing op-eration of valves in the piping system, the system curve movesupward to sa′ ; thus, the operating point moves along the samepump curve to A′ (hA′ , vA′), achieving flow reduction at higher
Fig. 1. Dynamic power saving margin according to pump performanceand system curve variation at different flow rate requirements.
impeller pressure, which is energy inefficient, as pump powerconsumption remains almost nominal, i.e., PMCR, as before.
Due to the vessel’s slow steaming operating practice, M/Eoften operates at lower speeds, resulting in less flow raterequirements from the process. In that case, variable-frequencycontrol can be used to adjust the speed of the pump motor to alower value ωN by moving the whole pump curve downward sothat the operating point moves from A to B (hB , vB) or fromA′ to B′ (hB′ , vB′) accordingly, resulting in significant powersavings as highlighted in the respective areas in Fig. 1, since thepump power consumption PN is reduced according to affinitylaws, as described in
ωN
ωMCR=
νsw_in,N
νsw_in,MCR= 3
√PN
PMCR. (3)
However, since the pump operation is associated with aspecific process whose parameters are varying according to thevessel’s operating profile, M/E speed, auxiliary machinery con-dition, and physical constraints, adjustment of ωN simply basedon process modeling is not adequate without the risk of jeopar-dizing integrity and reliability. To this end, the objective of theintroduced data-driven controller is to self-tune via real-timeprocess measurements in order to operate the pump at an op-timal speed, so that maximum power savings are achieved andthe minimum speed limit ωmin is adapted in compliance withthe minimum required flow limits vmin, which vary accordingto the needs of M/E and auxiliary machinery at each time.The design and implementation of the data-driven controlleris performed for energy efficiency optimization of the vessel’scentral cooling water system. Therefore, the process model isobtained to examine the process constraints and investigate therequirements through a case study for the vessel where thecontroller will be implemented as a retrofit installation.
III. MODELING OF THE VESSEL’S CENTRAL COOLING
WATER SYSTEM CAPACITIES FOR M/ESLOW STEAMING OPERATION
Since the process parameters considerably vary in relationto the M/E operating point, in order to develop the modeland assess the capacities of the vessel’s central cooling watersystem, the M/E speed and load variations in the slow steamingcondition have to be considered. For this reason, the engine
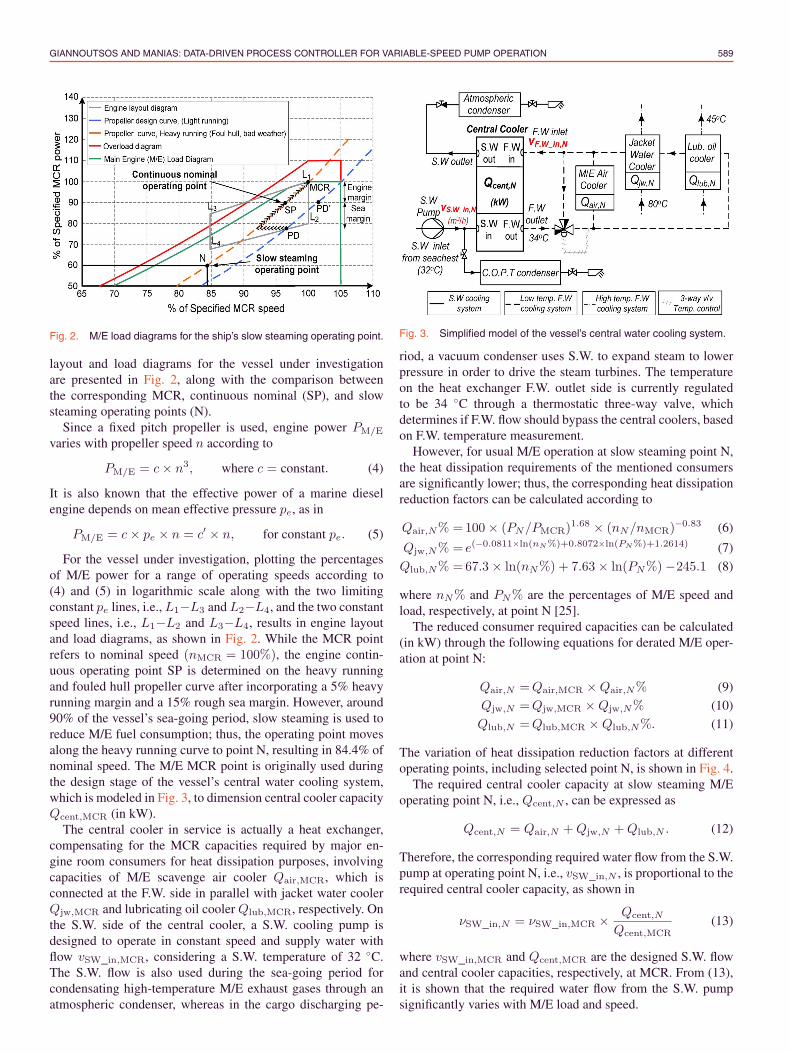
GIANNOUTSOS AND MANIAS: DATA-DRIVEN PROCESS CONTROLLER FOR VARIABLE-SPEED PUMP OPERATION 589
Fig. 2. M/E load diagrams for the ship’s slow steaming operating point.
layout and load diagrams for the vessel under investigationare presented in Fig. 2, along with the comparison betweenthe corresponding MCR, continuous nominal (SP), and slowsteaming operating points (N).
Since a fixed pitch propeller is used, engine power PM/E
varies with propeller speed n according to
PM/E = c× n3, where c = constant. (4)
It is also known that the effective power of a marine dieselengine depends on mean effective pressure pe, as in
PM/E = c× pe × n = c′ × n, for constant pe. (5)
For the vessel under investigation, plotting the percentagesof M/E power for a range of operating speeds according to(4) and (5) in logarithmic scale along with the two limitingconstant pe lines, i.e., L1−L3 and L2−L4, and the two constantspeed lines, i.e., L1−L2 and L3−L4, results in engine layoutand load diagrams, as shown in Fig. 2. While the MCR pointrefers to nominal speed (nMCR = 100%), the engine contin-uous operating point SP is determined on the heavy runningand fouled hull propeller curve after incorporating a 5% heavyrunning margin and a 15% rough sea margin. However, around90% of the vessel’s sea-going period, slow steaming is used toreduce M/E fuel consumption; thus, the operating point movesalong the heavy running curve to point N, resulting in 84.4% ofnominal speed. The M/E MCR point is originally used duringthe design stage of the vessel’s central water cooling system,which is modeled in Fig. 3, to dimension central cooler capacityQcent,MCR (in kW).
The central cooler in service is actually a heat exchanger,compensating for the MCR capacities required by major en-gine room consumers for heat dissipation purposes, involvingcapacities of M/E scavenge air cooler Qair,MCR, which isconnected at the F.W. side in parallel with jacket water coolerQjw,MCR and lubricating oil cooler Qlub,MCR, respectively. Onthe S.W. side of the central cooler, a S.W. cooling pump isdesigned to operate in constant speed and supply water withflow vSW_in,MCR, considering a S.W. temperature of 32 ◦C.The S.W. flow is also used during the sea-going period forcondensating high-temperature M/E exhaust gases through anatmospheric condenser, whereas in the cargo discharging pe-
Fig. 3. Simplified model of the vessel’s central water cooling system.
riod, a vacuum condenser uses S.W. to expand steam to lowerpressure in order to drive the steam turbines. The temperatureon the heat exchanger F.W. outlet side is currently regulatedto be 34 ◦C through a thermostatic three-way valve, whichdetermines if F.W. flow should bypass the central coolers, basedon F.W. temperature measurement.
However, for usual M/E operation at slow steaming point N,the heat dissipation requirements of the mentioned consumersare significantly lower; thus, the corresponding heat dissipationreduction factors can be calculated according to
Qair,N% =100× (PN/PMCR)1.68 × (nN/nMCR)
−0.83 (6)
Qjw,N% = e(−0.0811×ln(nN%)+0.8072×ln(PN%)+1.2614) (7)
Qlub,N% =67.3× ln(nN%) + 7.63× ln(PN%)−245.1 (8)
where nN% and PN% are the percentages of M/E speed andload, respectively, at point N [25].
The reduced consumer required capacities can be calculated(in kW) through the following equations for derated M/E oper-ation at point N:
Qair,N =Qair,MCR ×Qair,N% (9)
Qjw,N =Qjw,MCR ×Qjw,N% (10)
Qlub,N =Qlub,MCR ×Qlub,N%. (11)
The variation of heat dissipation reduction factors at differentoperating points, including selected point N, is shown in Fig. 4.
The required central cooler capacity at slow steaming M/Eoperating point N, i.e., Qcent,N , can be expressed as
Qcent,N = Qair,N +Qjw,N +Qlub,N . (12)
Therefore, the corresponding required water flow from the S.W.pump at operating point N, i.e., vSW_in,N , is proportional to therequired central cooler capacity, as shown in
νSW_in,N = νSW_in,MCR × Qcent,N
Qcent,MCR(13)
where vSW_in,MCR and Qcent,MCR are the designed S.W. flowand central cooler capacities, respectively, at MCR. From (13),it is shown that the required water flow from the S.W. pumpsignificantly varies with M/E load and speed.
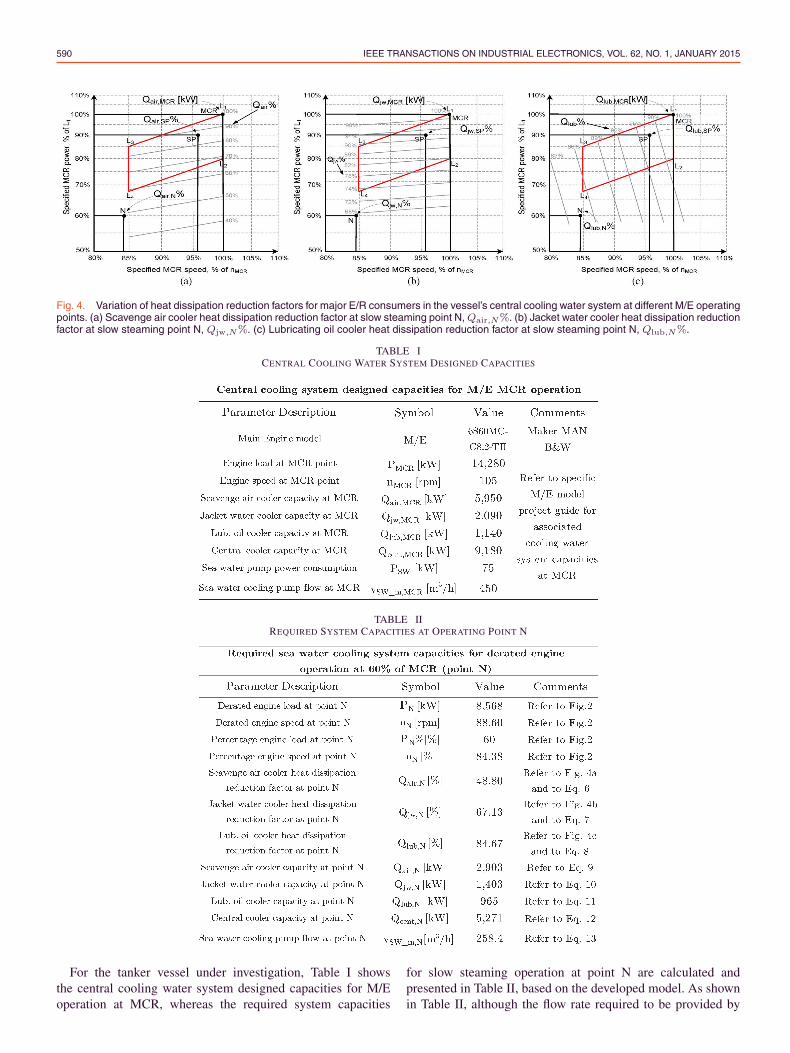
590 IEEE TRANSACTIONS ON INDUSTRIAL ELECTRONICS, VOL. 62, NO. 1, JANUARY 2015
Fig. 4. Variation of heat dissipation reduction factors for major E/R consumers in the vessel’s central cooling water system at different M/E operatingpoints. (a) Scavenge air cooler heat dissipation reduction factor at slow steaming point N, Qair,N%. (b) Jacket water cooler heat dissipation reductionfactor at slow steaming point N, Qjw,N%. (c) Lubricating oil cooler heat dissipation reduction factor at slow steaming point N, Qlub,N%.
TABLE ICENTRAL COOLING WATER SYSTEM DESIGNED CAPACITIES
TABLE IIREQUIRED SYSTEM CAPACITIES AT OPERATING POINT N
For the tanker vessel under investigation, Table I showsthe central cooling water system designed capacities for M/Eoperation at MCR, whereas the required system capacities
for slow steaming operation at point N are calculated andpresented in Table II, based on the developed model. As shownin Table II, although the flow rate required to be provided by
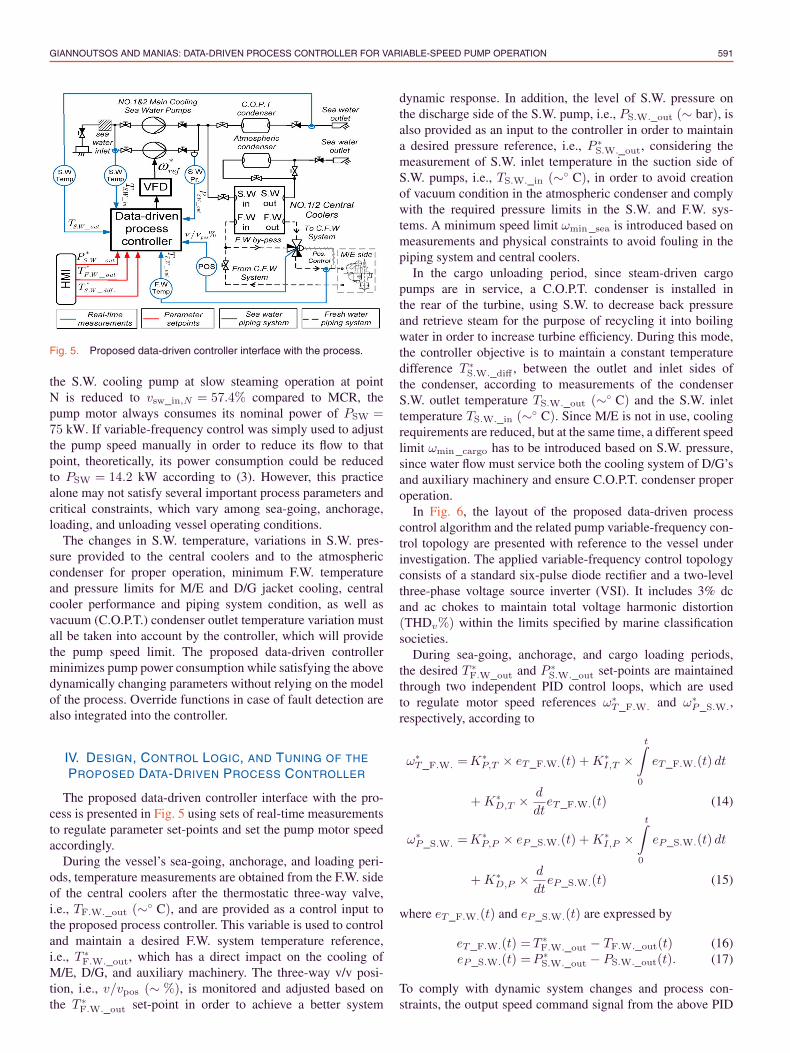
GIANNOUTSOS AND MANIAS: DATA-DRIVEN PROCESS CONTROLLER FOR VARIABLE-SPEED PUMP OPERATION 591
Fig. 5. Proposed data-driven controller interface with the process.
the S.W. cooling pump at slow steaming operation at pointN is reduced to vsw_in,N = 57.4% compared to MCR, thepump motor always consumes its nominal power of PSW =75 kW. If variable-frequency control was simply used to adjustthe pump speed manually in order to reduce its flow to thatpoint, theoretically, its power consumption could be reducedto PSW = 14.2 kW according to (3). However, this practicealone may not satisfy several important process parameters andcritical constraints, which vary among sea-going, anchorage,loading, and unloading vessel operating conditions.
The changes in S.W. temperature, variations in S.W. pres-sure provided to the central coolers and to the atmosphericcondenser for proper operation, minimum F.W. temperatureand pressure limits for M/E and D/G jacket cooling, centralcooler performance and piping system condition, as well asvacuum (C.O.P.T.) condenser outlet temperature variation mustall be taken into account by the controller, which will providethe pump speed limit. The proposed data-driven controllerminimizes pump power consumption while satisfying the abovedynamically changing parameters without relying on the modelof the process. Override functions in case of fault detection arealso integrated into the controller.
IV. DESIGN, CONTROL LOGIC, AND TUNING OF THE
PROPOSED DATA-DRIVEN PROCESS CONTROLLER
The proposed data-driven controller interface with the pro-cess is presented in Fig. 5 using sets of real-time measurementsto regulate parameter set-points and set the pump motor speedaccordingly.
During the vessel’s sea-going, anchorage, and loading peri-ods, temperature measurements are obtained from the F.W. sideof the central coolers after the thermostatic three-way valve,i.e., TF.W._out (∼◦ C), and are provided as a control input tothe proposed process controller. This variable is used to controland maintain a desired F.W. system temperature reference,i.e., T ∗
F.W._out, which has a direct impact on the cooling ofM/E, D/G, and auxiliary machinery. The three-way v/v posi-tion, i.e., v/vpos (∼ %), is monitored and adjusted based onthe T ∗
F.W._out set-point in order to achieve a better system
dynamic response. In addition, the level of S.W. pressure onthe discharge side of the S.W. pump, i.e., PS.W._out (∼ bar), isalso provided as an input to the controller in order to maintaina desired pressure reference, i.e., P ∗
S.W._out, considering themeasurement of S.W. inlet temperature in the suction side ofS.W. pumps, i.e., TS.W._in (∼◦ C), in order to avoid creationof vacuum condition in the atmospheric condenser and complywith the required pressure limits in the S.W. and F.W. sys-tems. A minimum speed limit ωmin_sea is introduced based onmeasurements and physical constraints to avoid fouling in thepiping system and central coolers.
In the cargo unloading period, since steam-driven cargopumps are in service, a C.O.P.T. condenser is installed inthe rear of the turbine, using S.W. to decrease back pressureand retrieve steam for the purpose of recycling it into boilingwater in order to increase turbine efficiency. During this mode,the controller objective is to maintain a constant temperaturedifference T ∗
S.W._diff , between the outlet and inlet sides ofthe condenser, according to measurements of the condenserS.W. outlet temperature TS.W._out (∼◦ C) and the S.W. inlettemperature TS.W._in (∼◦ C). Since M/E is not in use, coolingrequirements are reduced, but at the same time, a different speedlimit ωmin_cargo has to be introduced based on S.W. pressure,since water flow must service both the cooling system of D/G’sand auxiliary machinery and ensure C.O.P.T. condenser properoperation.
In Fig. 6, the layout of the proposed data-driven processcontrol algorithm and the related pump variable-frequency con-trol topology are presented with reference to the vessel underinvestigation. The applied variable-frequency control topologyconsists of a standard six-pulse diode rectifier and a two-levelthree-phase voltage source inverter (VSI). It includes 3% dcand ac chokes to maintain total voltage harmonic distortion(THDv%) within the limits specified by marine classificationsocieties.
During sea-going, anchorage, and cargo loading periods,the desired T ∗
F.W_out and P ∗S.W._out set-points are maintained
through two independent PID control loops, which are usedto regulate motor speed references ω∗
T_F.W. and ω∗P_S.W.,
respectively, according to
ω∗T_F.W. =K∗
P,T × eT_F.W.(t) +K∗I,T ×
t∫0
eT_F.W.(t) dt
+K∗D,T × d
dteT_F.W.(t) (14)
ω∗P_S.W. =K∗
P,P × eP_S.W.(t) +K∗I,P ×
t∫0
eP_S.W.(t) dt
+K∗D,P × d
dteP_S.W.(t) (15)
where eT_F.W.(t) and eP_S.W.(t) are expressed by
eT_F.W.(t) =T ∗F.W._out − TF.W._out(t) (16)
eP_S.W.(t) =P ∗S.W._out − PS.W._out(t). (17)
To comply with dynamic system changes and process con-straints, the output speed command signal from the above PID
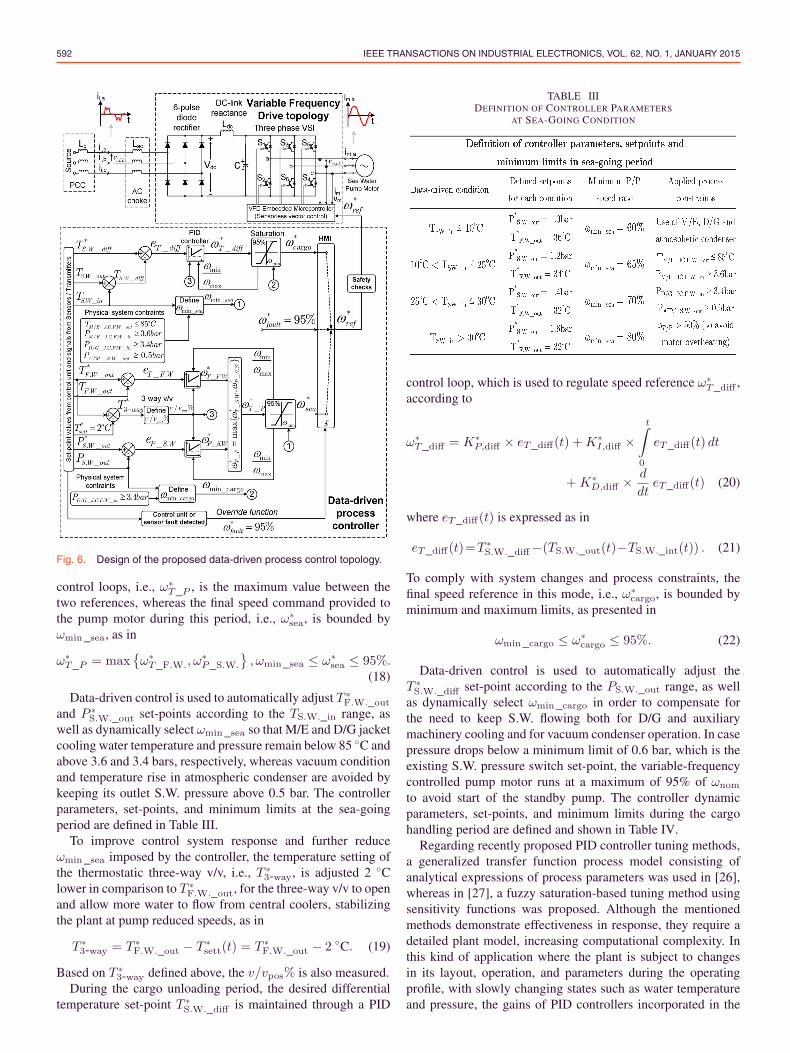
592 IEEE TRANSACTIONS ON INDUSTRIAL ELECTRONICS, VOL. 62, NO. 1, JANUARY 2015
Fig. 6. Design of the proposed data-driven process control topology.
control loops, i.e., ω∗T_P , is the maximum value between the
two references, whereas the final speed command provided tothe pump motor during this period, i.e., ω∗
sea, is bounded byωmin_sea, as in
ω∗T_P = max
{ω∗T_F.W., ω
∗P_S.W.
}, ωmin_sea ≤ ω∗
sea ≤ 95%.(18)
Data-driven control is used to automatically adjust T ∗F.W._out
and P ∗S.W._out set-points according to the TS.W._in range, as
well as dynamically select ωmin_sea so that M/E and D/G jacketcooling water temperature and pressure remain below 85 ◦C andabove 3.6 and 3.4 bars, respectively, whereas vacuum conditionand temperature rise in atmospheric condenser are avoided bykeeping its outlet S.W. pressure above 0.5 bar. The controllerparameters, set-points, and minimum limits at the sea-goingperiod are defined in Table III.
To improve control system response and further reduceωmin_sea imposed by the controller, the temperature setting ofthe thermostatic three-way v/v, i.e., T ∗
3-way, is adjusted 2 ◦Clower in comparison to T ∗
F.W._out, for the three-way v/v to openand allow more water to flow from central coolers, stabilizingthe plant at pump reduced speeds, as in
T ∗3-way = T ∗
F.W._out − T ∗sett(t) = T ∗
F.W._out − 2 ◦C. (19)
Based on T ∗3-way defined above, the v/vpos% is also measured.
During the cargo unloading period, the desired differentialtemperature set-point T ∗
S.W._diff is maintained through a PID
TABLE IIIDEFINITION OF CONTROLLER PARAMETERS
AT SEA-GOING CONDITION
control loop, which is used to regulate speed reference ω∗T_diff ,
according to
ω∗T_diff = K∗
P,diff × eT_diff(t) +K∗I,diff ×
t∫0
eT_diff(t) dt
+ K∗D,diff × d
dteT_diff(t) (20)
where eT_diff(t) is expressed as in
eT_diff(t)=T ∗S.W._diff−(TS.W._out(t)−TS.W._int(t)) . (21)
To comply with system changes and process constraints, thefinal speed reference in this mode, i.e., ω∗
cargo, is bounded byminimum and maximum limits, as presented in
ωmin_cargo ≤ ω∗cargo ≤ 95%. (22)
Data-driven control is used to automatically adjust theT ∗S.W._diff set-point according to the PS.W._out range, as well
as dynamically select ωmin_cargo in order to compensate forthe need to keep S.W. flowing both for D/G and auxiliarymachinery cooling and for vacuum condenser operation. In casepressure drops below a minimum limit of 0.6 bar, which is theexisting S.W. pressure switch set-point, the variable-frequencycontrolled pump motor runs at a maximum of 95% of ωnom
to avoid start of the standby pump. The controller dynamicparameters, set-points, and minimum limits during the cargohandling period are defined and shown in Table IV.
Regarding recently proposed PID controller tuning methods,a generalized transfer function process model consisting ofanalytical expressions of process parameters was used in [26],whereas in [27], a fuzzy saturation-based tuning method usingsensitivity functions was proposed. Although the mentionedmethods demonstrate effectiveness in response, they require adetailed plant model, increasing computational complexity. Inthis kind of application where the plant is subject to changesin its layout, operation, and parameters during the operatingprofile, with slowly changing states such as water temperatureand pressure, the gains of PID controllers incorporated in the
GIANNOUTSOS AND MANIAS: DATA-DRIVEN PROCESS CONTROLLER FOR VARIABLE-SPEED PUMP OPERATION 593
TABLE IVDEFINITION OF CONTROLLER PARAMETERS AT CARGO TANK OPERATION
control scheme are designed to be self-tuned according tovalues obtained through real-time process measurements.
It was shown that ωmin was dynamically defined accordingto plant requirements and process constraints for each operatingperiod. In this case, the ωmin/ωmax ratio can be used to tuneK∗
P . Lower ωmin results in less water flow rate and pressure inthe system, requiring an increase in rise time and decrease inovershoot by lowering K∗
p in order to protect the process fromsudden peaks that may appear in S.W. pressure from a changein the speed set-point and vice versa. Moreover, the three-way thermostatic valve position v/vpos set by the automaticallydefined T ∗
F.W._out set-point is used to regulate K∗D. In case it
opens to the central cooler side, v/vpos% is reduced, providingthe opportunity to increase K∗
D in order to decrease correspond-ing overshoot and settling time of the controller response. Thementioned self-tuning data-driven approach is expressed by
K∗P =(0.60×Ku)×
ωmin
ωmax(23)
K∗I =2× K∗
P
Tu(24)
K∗D =
(K∗
P × Tu
8
)× 1
10× (ν/νpos%/100)(25)
where Ku is the ultimate gain that the output oscillates atconstant amplitude with period Tu. For the initial tuning, thepump operates at ωmax = 95%, whereas v/vpos% = 100%.
A built-in fault detection mode is implemented in thecontroller, where in case there is a sensor, control unit, orcommunication failure, a system override function is activated,and the speed reference is ω∗
fault = 95%. Safety checks areincluded, so that even if in this condition PS.W._out remainsbelow 0.6 bar, VFD fails, or TS.W._diff is greater than 10 ◦C,the standby S.W. pump is activated. To illustrate the differentcontrol algorithms embedded in the controller, the first cycleof the control system evolution is presented in Fig. 7 as asequential function chart (SFC).
V. ARRANGEMENT AND OPERATION OF THE PROPOSED
DATA-DRIVEN PROCESS CONTROLLER
The proposed process control topology for the optimizationof the central cooling water system is built for a typical Afra-max size tanker vessel in order to control the speed of one
Fig. 7. SFC showing the first cycle of the proposed data-driven processcontrol system evolution.
Fig. 8. Arrangement and interface of the proposed control scheme.
75-kW 440-V 60-Hz S.W. cooling pump motor, according tothe proposed control algorithm. The arrangement of the processcontrol unit as well as its interface with sensors, VFD, and HMIunits are shown in Fig. 8.
The control unit includes a Modicon M340 commercial PLCautomation platform unit with its associated analog and digitalinput–output racks and communication modules, interfacingwith an ATV61HD90N4 VFD unit. Process monitoring of theworking plant is performed in a HMISTU855 graphic displayunit, using Vijeo Designer HMI configuration software. Analoginput signals are received by 4–20 mA temperature and pressuretransmitters, which are used to collect the required process dataand provide them as real-time feedback signals to the controller.The range of PT100 temperature sensors is 0–100 ◦C, whereasthe pressure sensor range that records the S.W. pump outlet
594 IEEE TRANSACTIONS ON INDUSTRIAL ELECTRONICS, VOL. 62, NO. 1, JANUARY 2015
Fig. 9. Onboard implementation of the proposed process control topol-ogy. (a) Hardware arrangement of the proposed data-driven processcontroller. (b) Arrangement of the applied pump variable-frequencycontrol topology.
Fig. 10. Process monitoring functions of the controller HMI screen invarious modes of operation. (a) Vessel sea-going/port mode operationand process monitoring. (b) Vessel cargo unloading mode operation andprocess monitoring.
pressure is 0–6.0 bars, to compensate for the 4.0-bar nominalpump discharge pressure value. A pressure transmitter with arange of 0–1.5 bars is used to record three-way v/v positionpneumatically from the existing actuating signal. An analog4–20 mA controller output signal is used to provide the speedreference to the VFD embedded microcontroller module. Mod-bus over TCP/IP is used to synchronize VFD operation with thecontrol unit. The 24-Vdc digital output signals from the controlunit are used to control the start/stop and auxiliary functionsof the VFD, whereas the digital input signals from VFD informthe controller about the system status, including overload, phasefailure, temperature rising, and VFD fail conditions.
The hardware configuration of the process control unit in-stalled onboard the vessel is shown in Fig. 9(a), whereas thearrangement of the VFD topology, which was built inside apanel in compliance with classification society regulations, ispresented in Fig. 9(b). HMI process monitoring functions areshown in Fig. 10 for various operating modes. Through theHMI, it is noted that the user can monitor and adjust importantprocess parameters as well as apply different process controlalgorithms by selecting between sea-going/port and cargo tankoperation modes at every time.
In Fig. 10(a), it is shown that in the sea-going mode, whilethe vessel operates at near 70% of the nominal M/E load(∼10 000 kW), the controller operates the pump at 72.0% ofits nominal speed, resulting in 28 kW power consumptionor 47 kW power savings compared to the previous throttlingoperating practice, whereas TF.W_out is kept below 34 ◦C,PS.W_out is maintained at 1.19 bars, and TS.W._in is 20.4 ◦C.It is noted that since the C.O.P.T. condenser is not in service at
Fig. 11. Dynamics of the sea-going/port mode process control.(a) Central cooler F.W. outlet temperature PID control (K∗
P,T = 10,
K∗I,T = 2,K∗
D,T = 2.35). (b) S.W. outlet pressure PID control (K∗P,P =
12, K∗I,P = 16, K∗
D,P = 0.35).
Fig. 12. Dynamics of the cargo unloading mode process control.(a) Central cooler F.W. outlet temperature PID control (ignored).(b) Differential temperature PID control (K∗
P,diff = 24.5, K∗I,diff =
2.5, K∗D,diff = 1.6).
that point, S.W. inlet and S.W. outlet temperatures are the same.The v/vpos% is adjusted to 83.0% at the central cooler bypassto achieve higher F.W. pressure since TF.W._out is below 34 ◦C.
When the vessel is subject to cargo discharging operation,unloading mode control takes over, as shown in Fig. 10(b).In this mode, the pump motor operates at 80% of its nominalspeed, leading to 38 kW power consumption or 37 kW powersaving from the vessel’s D/G load. It is shown that the controllerignores the set-points of the previous mode and maintains aT ∗S.W._diff of 3.39 ◦C, due to use of the cargo condenser. It
is noted that PS.W._out has dropped to 0.73 bar because theS.W. pump now services both the central cooling water systemand the cargo condenser. This condition imposes 80% as thelower speed limit in this mode, due to the minimum S.W. outletpressure requirement of 0.6 bar.
VI. EXPERIMENTAL RESULTS FROM THE PROPOSED
DATA-DRIVEN CONTROLLER RETROFIT
INSTALLATION IN A TANKER VESSEL
A. Controller Dynamics in Various VesselOperating Conditions
The performance of the proposed data-driven controller withregard to process parameter variations is examined and vali-dated through evaluation of its dynamic responses, as shown inFigs. 11 and 12 for sea-going/port and cargo unloading modesof operation. The controller override functions during the faultdetection mode are presented in Fig. 13.
GIANNOUTSOS AND MANIAS: DATA-DRIVEN PROCESS CONTROLLER FOR VARIABLE-SPEED PUMP OPERATION 595
Fig. 13. Process controller override function dynamics (ω∗ref = 95%).
(a) Sea-going mode control override due to Modbus communicationfailure. (b) Cargo unloading mode control override due to temperaturesensor failure.
In Fig. 11(a) and (b), for the sea-going mode, it is shownthat since TS.W._in is 20.4 ◦C, ωmin_sea is adjusted to 65%,whereas T ∗
F.W._out and P ∗S.W._out are automatically adjusted
to 34 ◦C and 1.2 bars, respectively, according to Table III.Therefore, it is shown that during slow steaming M/E operationat nN = 86−88 r/min or PN = 7854−8568 kW load, the F.W.temperature PID control loop is tuned to provide a speed set-point ω∗
T_F.W., which is equal to 70% of ωnom. At the sametime, the S.W. pressure PID control loop provides a differentspeed set-point of ω∗
P_S.W., which is equal to 72.2% of ωnom,to comply with the requirements mentioned in Table III. There-fore, according to (18), the final speed reference provided tothe pump, i.e., ω∗
sea, is the maximum of the two set-points, i.e.,72.2% of ωnom. It is also shown that the three-way v/v position,i.e., v/vpos%, is dynamically changing according to the pumpoperating speed, assisting to the controller self-tuning, whoseresponse displays minimum overshoot and rise time, as well asexcellent steady-state characteristics.
In Fig. 12(a), for the cargo handling operation mode, M/E isnot working, and the C.O.P.T. condenser is in service since thesteam turbines are in use; therefore, F.W. temperature and S.W.pressure PID control loop outputs are ignored. On the otherhand, in Fig. 12(b), it is shown that since PS.W._out is equalto 0.73 bar, ωmin_cargo is adjusted to 80%, whereas T ∗
S.W._diffis automatically adjusted to 3.4 ◦C according to Table IV.Since one D/G and auxiliary machinery are working, the dif-ferential temperature PID control loop is tuned to provide aspeed set-point ω∗
T_diff equal to 86.2%, corresponding to ω∗cargo
as in (22).As shown in Fig. 13(a) and (b), in case of sensor or commu-
nication failure, the fault detection function is activated, and thecontrol system ignores all set-points in order to drive the pumpmotor at ω∗
fault, equal to 95% of ωnom to preserve the reliabilityof the system. It also noted that the minimum speed limit of thecontroller must be always above 50% of ωnom to protect themotor from overheating.
B. Power Balance Optimization With theProposed Controller
Using the previous throttling practice, the pump motor wasoperating constantly at fixed speed with maximum powerconsumption, since the Star/Delta starting method was used.With the proposed data-driven controller used to provide speed
Fig. 14. Inverter output and grid-side voltage/current waveforms forpump motor operation at 45Hz. (a) VSI-side voltage vm,LL and currentim,a waveforms. (b) Grid-side voltage vi,LL and current ii,a waveforms.
reference to the drive, the VSI generates a reference voltageand current waveform to control the speed of the motor. Ata typical pump motor operation at 75% of ωnom, or 45 Hz,the VSI-side voltage vm,LL and current im,a waveforms arepresented in Fig. 14(a), as measured in the motor stator. Thecorresponding grid-side voltage vi,LL and current ii,a wave-forms are presented in Fig. 14(b). The power quality at thepoint of common coupling (PCC) remains in high level, due toharmonic filtering considerations made during the design stage.
The S.W. pump motor active power consumption variationwith the use of the proposed data-driven controller is measuredand presented in Fig. 15 for a typical vessel eight-day voyagein comparison with its original power consumption before theretrofit installation. It is shown that during the vessel loadingperiod, where the heat dissipation requirements of engine roomconsumers are minimum since M/E is not working and only oneD/G is in use, the pump power consumption PSW is equal to23 kW, which approaches the minimum PSW corresponding tothe minimum allowed speed reference of 65%, as established bythe controller according to Table III. This leads to 52 kW powersaving over throttling control. During the sea-going period,controller performance was tested at the MCR point, where theM/E load PN is equal to 95%, at the nominal M/E operatingpoint (SP), where PN is equal to 85%, and at the usual slowsteaming condition, where PN is equal to 55%–60%. It isshown that the proposed control scheme dynamics are wellestablished during the vessel’s operating profile changes. Inparticular, at MCR, the controller operates the S.W. pump at95%, close to its nominal capacity to compensate for increasedM/E heat dissipation requirements. For vessel operation at theM/E nominal service point, it is shown that the pump operatesat 90% of ωnom, leading to PSW equal to 55 kW or to powersaving equal to 20 kW. In the typical slow steaming condition,however, the advantage of the proposed approach is moreevident, since PSW is just 25 kW, as compared to the pumpnominal power consumption of 75 kW, meaning that the con-troller operates the pump at 70% of ωnom, to achieve the waterflow required by engine room consumers, which is very closeto the minimum water flow corresponding to ωmin (65%) asdefined in Table III. This scale of power saving highlightsthe effectiveness of the controller at this period. During cargooperation, the pump operates at 92%, resulting in PSW equalto 58 kW or power saving of 17 kW, in order to maintain thewater flow required by central cooling system consumers and
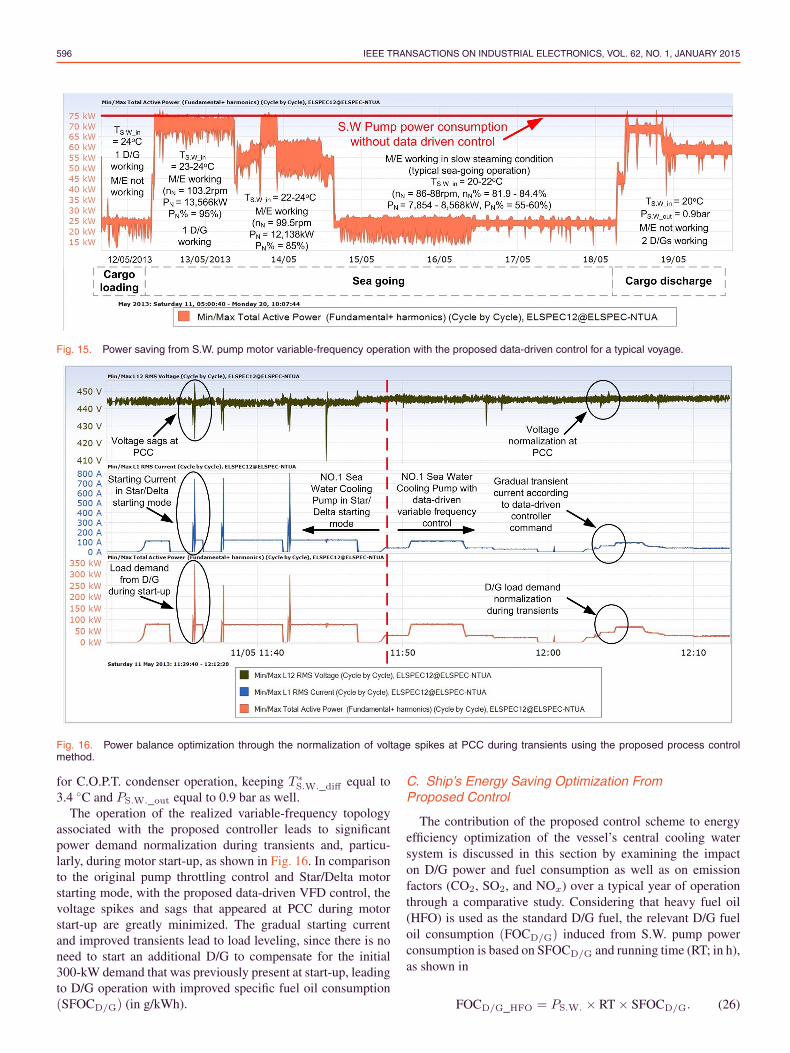
596 IEEE TRANSACTIONS ON INDUSTRIAL ELECTRONICS, VOL. 62, NO. 1, JANUARY 2015
Fig. 15. Power saving from S.W. pump motor variable-frequency operation with the proposed data-driven control for a typical voyage.
Fig. 16. Power balance optimization through the normalization of voltage spikes at PCC during transients using the proposed process controlmethod.
for C.O.P.T. condenser operation, keeping T ∗S.W._diff equal to
3.4 ◦C and PS.W._out equal to 0.9 bar as well.The operation of the realized variable-frequency topology
associated with the proposed controller leads to significantpower demand normalization during transients and, particu-larly, during motor start-up, as shown in Fig. 16. In comparisonto the original pump throttling control and Star/Delta motorstarting mode, with the proposed data-driven VFD control, thevoltage spikes and sags that appeared at PCC during motorstart-up are greatly minimized. The gradual starting currentand improved transients lead to load leveling, since there is noneed to start an additional D/G to compensate for the initial300-kW demand that was previously present at start-up, leadingto D/G operation with improved specific fuel oil consumption(SFOCD/G) (in g/kWh).
C. Ship’s Energy Saving Optimization FromProposed Control
The contribution of the proposed control scheme to energyefficiency optimization of the vessel’s central cooling watersystem is discussed in this section by examining the impacton D/G power and fuel consumption as well as on emissionfactors (CO2, SO2, and NOx) over a typical year of operationthrough a comparative study. Considering that heavy fuel oil(HFO) is used as the standard D/G fuel, the relevant D/G fueloil consumption (FOCD/G) induced from S.W. pump powerconsumption is based on SFOCD/G and running time (RT; in h),as shown in
FOCD/G_HFO = PS.W. × RT × SFOCD/G. (26)
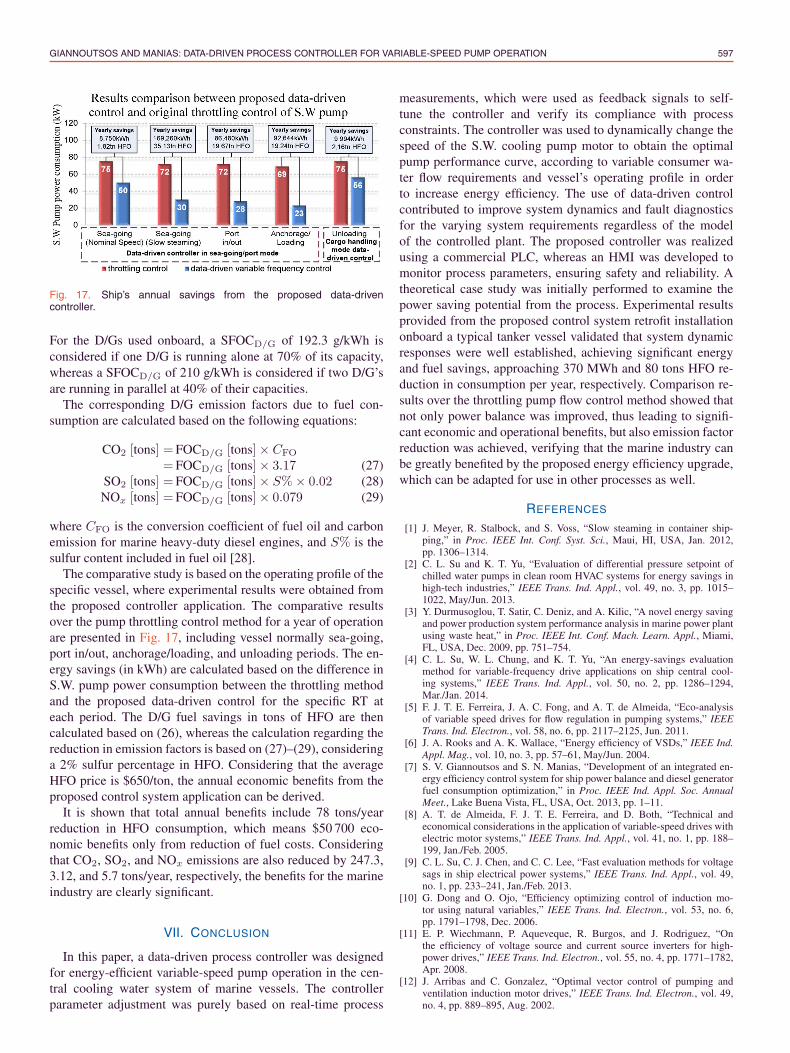
GIANNOUTSOS AND MANIAS: DATA-DRIVEN PROCESS CONTROLLER FOR VARIABLE-SPEED PUMP OPERATION 597
Fig. 17. Ship’s annual savings from the proposed data-drivencontroller.
For the D/Gs used onboard, a SFOCD/G of 192.3 g/kWh isconsidered if one D/G is running alone at 70% of its capacity,whereas a SFOCD/G of 210 g/kWh is considered if two D/G’sare running in parallel at 40% of their capacities.
The corresponding D/G emission factors due to fuel con-sumption are calculated based on the following equations:
CO2 [tons] = FOCD/G [tons]× CFO
= FOCD/G [tons]× 3.17 (27)SO2 [tons] = FOCD/G [tons]× S%× 0.02 (28)NOx [tons] = FOCD/G [tons]× 0.079 (29)
where CFO is the conversion coefficient of fuel oil and carbonemission for marine heavy-duty diesel engines, and S% is thesulfur content included in fuel oil [28].
The comparative study is based on the operating profile of thespecific vessel, where experimental results were obtained fromthe proposed controller application. The comparative resultsover the pump throttling control method for a year of operationare presented in Fig. 17, including vessel normally sea-going,port in/out, anchorage/loading, and unloading periods. The en-ergy savings (in kWh) are calculated based on the difference inS.W. pump power consumption between the throttling methodand the proposed data-driven control for the specific RT ateach period. The D/G fuel savings in tons of HFO are thencalculated based on (26), whereas the calculation regarding thereduction in emission factors is based on (27)–(29), consideringa 2% sulfur percentage in HFO. Considering that the averageHFO price is $650/ton, the annual economic benefits from theproposed control system application can be derived.
It is shown that total annual benefits include 78 tons/yearreduction in HFO consumption, which means $50 700 eco-nomic benefits only from reduction of fuel costs. Consideringthat CO2, SO2, and NOx emissions are also reduced by 247.3,3.12, and 5.7 tons/year, respectively, the benefits for the marineindustry are clearly significant.
VII. CONCLUSION
In this paper, a data-driven process controller was designedfor energy-efficient variable-speed pump operation in the cen-tral cooling water system of marine vessels. The controllerparameter adjustment was purely based on real-time process
measurements, which were used as feedback signals to self-tune the controller and verify its compliance with processconstraints. The controller was used to dynamically change thespeed of the S.W. cooling pump motor to obtain the optimalpump performance curve, according to variable consumer wa-ter flow requirements and vessel’s operating profile in orderto increase energy efficiency. The use of data-driven controlcontributed to improve system dynamics and fault diagnosticsfor the varying system requirements regardless of the modelof the controlled plant. The proposed controller was realizedusing a commercial PLC, whereas an HMI was developed tomonitor process parameters, ensuring safety and reliability. Atheoretical case study was initially performed to examine thepower saving potential from the process. Experimental resultsprovided from the proposed control system retrofit installationonboard a typical tanker vessel validated that system dynamicresponses were well established, achieving significant energyand fuel savings, approaching 370 MWh and 80 tons HFO re-duction in consumption per year, respectively. Comparison re-sults over the throttling pump flow control method showed thatnot only power balance was improved, thus leading to signifi-cant economic and operational benefits, but also emission factorreduction was achieved, verifying that the marine industry canbe greatly benefited by the proposed energy efficiency upgrade,which can be adapted for use in other processes as well.
REFERENCES
[1] J. Meyer, R. Stalbock, and S. Voss, “Slow steaming in container ship-ping,” in Proc. IEEE Int. Conf. Syst. Sci., Maui, HI, USA, Jan. 2012,pp. 1306–1314.
[2] C. L. Su and K. T. Yu, “Evaluation of differential pressure setpoint ofchilled water pumps in clean room HVAC systems for energy savings inhigh-tech industries,” IEEE Trans. Ind. Appl., vol. 49, no. 3, pp. 1015–1022, May/Jun. 2013.
[3] Y. Durmusoglou, T. Satir, C. Deniz, and A. Kilic, “A novel energy savingand power production system performance analysis in marine power plantusing waste heat,” in Proc. IEEE Int. Conf. Mach. Learn. Appl., Miami,FL, USA, Dec. 2009, pp. 751–754.
[4] C. L. Su, W. L. Chung, and K. T. Yu, “An energy-savings evaluationmethod for variable-frequency drive applications on ship central cool-ing systems,” IEEE Trans. Ind. Appl., vol. 50, no. 2, pp. 1286–1294,Mar./Jan. 2014.
[5] F. J. T. E. Ferreira, J. A. C. Fong, and A. T. de Almeida, “Eco-analysisof variable speed drives for flow regulation in pumping systems,” IEEETrans. Ind. Electron., vol. 58, no. 6, pp. 2117–2125, Jun. 2011.
[6] J. A. Rooks and A. K. Wallace, “Energy efficiency of VSDs,” IEEE Ind.Appl. Mag., vol. 10, no. 3, pp. 57–61, May/Jun. 2004.
[7] S. V. Giannoutsos and S. N. Manias, “Development of an integrated en-ergy efficiency control system for ship power balance and diesel generatorfuel consumption optimization,” in Proc. IEEE Ind. Appl. Soc. AnnualMeet., Lake Buena Vista, FL, USA, Oct. 2013, pp. 1–11.
[8] A. T. de Almeida, F. J. T. E. Ferreira, and D. Both, “Technical andeconomical considerations in the application of variable-speed drives withelectric motor systems,” IEEE Trans. Ind. Appl., vol. 41, no. 1, pp. 188–199, Jan./Feb. 2005.
[9] C. L. Su, C. J. Chen, and C. C. Lee, “Fast evaluation methods for voltagesags in ship electrical power systems,” IEEE Trans. Ind. Appl., vol. 49,no. 1, pp. 233–241, Jan./Feb. 2013.
[10] G. Dong and O. Ojo, “Efficiency optimizing control of induction mo-tor using natural variables,” IEEE Trans. Ind. Electron., vol. 53, no. 6,pp. 1791–1798, Dec. 2006.
[11] E. P. Wiechmann, P. Aqueveque, R. Burgos, and J. Rodriguez, “Onthe efficiency of voltage source and current source inverters for high-power drives,” IEEE Trans. Ind. Electron., vol. 55, no. 4, pp. 1771–1782,Apr. 2008.
[12] J. Arribas and C. Gonzalez, “Optimal vector control of pumping andventilation induction motor drives,” IEEE Trans. Ind. Electron., vol. 49,no. 4, pp. 889–895, Aug. 2002.
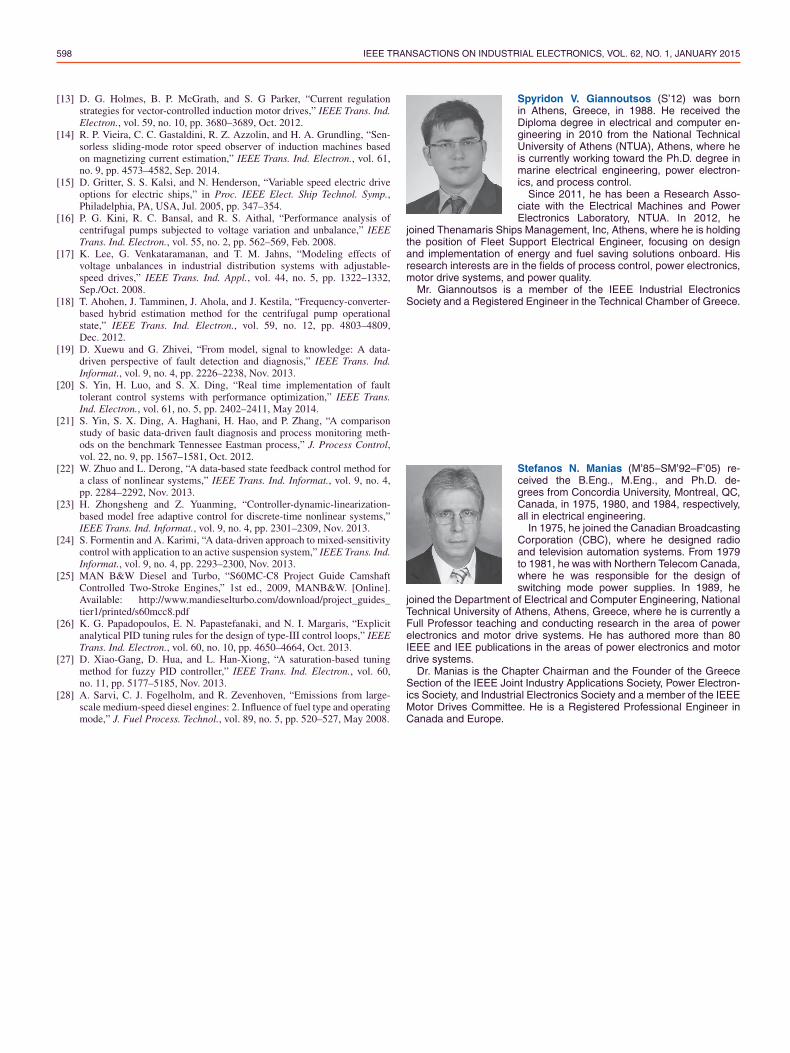
598 IEEE TRANSACTIONS ON INDUSTRIAL ELECTRONICS, VOL. 62, NO. 1, JANUARY 2015
[13] D. G. Holmes, B. P. McGrath, and S. G Parker, “Current regulationstrategies for vector-controlled induction motor drives,” IEEE Trans. Ind.Electron., vol. 59, no. 10, pp. 3680–3689, Oct. 2012.
[14] R. P. Vieira, C. C. Gastaldini, R. Z. Azzolin, and H. A. Grundling, “Sen-sorless sliding-mode rotor speed observer of induction machines basedon magnetizing current estimation,” IEEE Trans. Ind. Electron., vol. 61,no. 9, pp. 4573–4582, Sep. 2014.
[15] D. Gritter, S. S. Kalsi, and N. Henderson, “Variable speed electric driveoptions for electric ships,” in Proc. IEEE Elect. Ship Technol. Symp.,Philadelphia, PA, USA, Jul. 2005, pp. 347–354.
[16] P. G. Kini, R. C. Bansal, and R. S. Aithal, “Performance analysis ofcentrifugal pumps subjected to voltage variation and unbalance,” IEEETrans. Ind. Electron., vol. 55, no. 2, pp. 562–569, Feb. 2008.
[17] K. Lee, G. Venkataramanan, and T. M. Jahns, “Modeling effects ofvoltage unbalances in industrial distribution systems with adjustable-speed drives,” IEEE Trans. Ind. Appl., vol. 44, no. 5, pp. 1322–1332,Sep./Oct. 2008.
[18] T. Ahohen, J. Tamminen, J. Ahola, and J. Kestila, “Frequency-converter-based hybrid estimation method for the centrifugal pump operationalstate,” IEEE Trans. Ind. Electron., vol. 59, no. 12, pp. 4803–4809,Dec. 2012.
[19] D. Xuewu and G. Zhivei, “From model, signal to knowledge: A data-driven perspective of fault detection and diagnosis,” IEEE Trans. Ind.Informat., vol. 9, no. 4, pp. 2226–2238, Nov. 2013.
[20] S. Yin, H. Luo, and S. X. Ding, “Real time implementation of faulttolerant control systems with performance optimization,” IEEE Trans.Ind. Electron., vol. 61, no. 5, pp. 2402–2411, May 2014.
[21] S. Yin, S. X. Ding, A. Haghani, H. Hao, and P. Zhang, “A comparisonstudy of basic data-driven fault diagnosis and process monitoring meth-ods on the benchmark Tennessee Eastman process,” J. Process Control,vol. 22, no. 9, pp. 1567–1581, Oct. 2012.
[22] W. Zhuo and L. Derong, “A data-based state feedback control method fora class of nonlinear systems,” IEEE Trans. Ind. Informat., vol. 9, no. 4,pp. 2284–2292, Nov. 2013.
[23] H. Zhongsheng and Z. Yuanming, “Controller-dynamic-linearization-based model free adaptive control for discrete-time nonlinear systems,”IEEE Trans. Ind. Informat., vol. 9, no. 4, pp. 2301–2309, Nov. 2013.
[24] S. Formentin and A. Karimi, “A data-driven approach to mixed-sensitivitycontrol with application to an active suspension system,” IEEE Trans. Ind.Informat., vol. 9, no. 4, pp. 2293–2300, Nov. 2013.
[25] MAN B&W Diesel and Turbo, “S60MC-C8 Project Guide CamshaftControlled Two-Stroke Engines,” 1st ed., 2009, MANB&W. [Online].Available: http://www.mandieselturbo.com/download/project_guides_tier1/printed/s60mcc8.pdf
[26] K. G. Papadopoulos, E. N. Papastefanaki, and N. I. Margaris, “Explicitanalytical PID tuning rules for the design of type-III control loops,” IEEETrans. Ind. Electron., vol. 60, no. 10, pp. 4650–4664, Oct. 2013.
[27] D. Xiao-Gang, D. Hua, and L. Han-Xiong, “A saturation-based tuningmethod for fuzzy PID controller,” IEEE Trans. Ind. Electron., vol. 60,no. 11, pp. 5177–5185, Nov. 2013.
[28] A. Sarvi, C. J. Fogelholm, and R. Zevenhoven, “Emissions from large-scale medium-speed diesel engines: 2. Influence of fuel type and operatingmode,” J. Fuel Process. Technol., vol. 89, no. 5, pp. 520–527, May 2008.
Spyridon V. Giannoutsos (S’12) was bornin Athens, Greece, in 1988. He received theDiploma degree in electrical and computer en-gineering in 2010 from the National TechnicalUniversity of Athens (NTUA), Athens, where heis currently working toward the Ph.D. degree inmarine electrical engineering, power electron-ics, and process control.
Since 2011, he has been a Research Asso-ciate with the Electrical Machines and PowerElectronics Laboratory, NTUA. In 2012, he
joined Thenamaris Ships Management, Inc, Athens, where he is holdingthe position of Fleet Support Electrical Engineer, focusing on designand implementation of energy and fuel saving solutions onboard. Hisresearch interests are in the fields of process control, power electronics,motor drive systems, and power quality.
Mr. Giannoutsos is a member of the IEEE Industrial ElectronicsSociety and a Registered Engineer in the Technical Chamber of Greece.
Stefanos N. Manias (M’85–SM’92–F’05) re-ceived the B.Eng., M.Eng., and Ph.D. de-grees from Concordia University, Montreal, QC,Canada, in 1975, 1980, and 1984, respectively,all in electrical engineering.
In 1975, he joined the Canadian BroadcastingCorporation (CBC), where he designed radioand television automation systems. From 1979to 1981, he was with Northern Telecom Canada,where he was responsible for the design ofswitching mode power supplies. In 1989, he
joined the Department of Electrical and Computer Engineering, NationalTechnical University of Athens, Athens, Greece, where he is currently aFull Professor teaching and conducting research in the area of powerelectronics and motor drive systems. He has authored more than 80IEEE and IEE publications in the areas of power electronics and motordrive systems.
Dr. Manias is the Chapter Chairman and the Founder of the GreeceSection of the IEEE Joint Industry Applications Society, Power Electron-ics Society, and Industrial Electronics Society and a member of the IEEEMotor Drives Committee. He is a Registered Professional Engineer inCanada and Europe.
IEEE TRANSACTIONS ON INDUSTRY APPLICATIONS, VOL. 51, NO. 2, MARCH/APRIL 2015 1909
A Systematic Power-Quality Assessment andHarmonic Filter Design Methodology for
Variable-Frequency Drive Applicationin Marine Vessels
Spyridon V. Giannoutsos, Student Member, IEEE, and Stefanos N. Manias, Fellow, IEEE
Abstract—In maritime industry, high fuel costs encourage use ofvariable-frequency drives (VFDs) for energy-saving applications.However, introduction of such nonlinear loads in the vessel’spower distribution network induces harmonics, which can lead topotential risks if are not predicted and controlled. In this paper, asystematic power-quality assessment and monitoring methodologyis proposed to calculate VFD contribution to voltage distortionat the point of common coupling (PCC), considering the sourceshort-circuit capacity and the existing vessel’s power system har-monics. According to voltage harmonic distortion limits set bymarine classification societies, design and sizing of appropriateharmonic attenuation filters is made, including ac and dc chokesand frequency-tuned passive filter options. The effectiveness of theproposed power-quality analyzing procedure is evaluated througha real practical example, which includes harmonic filter designfor VFD retrofit application to fan and pump motors that operateconstantly during sea-going operation in a typical tanker vessel.Power-quality field measurements obtained through a harmonicmonitoring platform implemented on board verify that total volt-age harmonic distortion and individual voltage harmonics at PCCare maintained below 5% and 3%, respectively, showing thatdesign complies with relevant marine harmonic standards even inthe worst operating case.
Index Terms—AC–AC power conversion, harmonic distortion,industrial power system harmonics, industrial power systems, ma-rine vehicle power systems, power quality, variable-speed drives.
I. INTRODUCTION
IN recent years, the strive for reduction of fuel consump-tion and improvement of energy management has led to
significant increase in variable-frequency drive (VFD) use onboard ships and in offshore installations for power conditioning
Manuscript received March 6, 2014; revised June 17, 2014; accepted July 21,2014. Date of publication August 13, 2014; date of current version March 17,2015. Paper 2013-PSEC-0998.R1, presented at the 2014 IEEE/IAS Industrialand Commercial Power Systems Technical Conference, Fort Worth, TX, USA,May 20–23, and approved for publication in the IEEE TRANSACTIONS ON
INDUSTRY APPLICATIONS by the Power Systems Engineering Committeeof the IEEE Industry Applications Society. This work was supported byThenamaris Ships Management Inc.
S. V. Giannoutsos is with Thenamaris Ships Management Inc., 16671Athens, Greece, and also with the Department of Electrical and ComputerEngineering, National Technical University of Athens, 15780 Athens, Greece(e-mail: [email protected]; [email protected]).
S. N. Manias is with the Department of Electrical and Computer Engineer-ing, National Technical University of Athens, 15780 Athens, Greece (e-mail:[email protected]).
Color versions of one or more of the figures in this paper are available onlineat http://ieeexplore.ieee.org.
Digital Object Identifier 10.1109/TIA.2014.2347453
and energy-saving purposes [1]–[6]. However, the introductionof such nonlinear loads in the vessel’s power system inducesharmonic currents that are often drawn from sources of limitedshort-circuit capability, such as diesel generators (D/Gs), result-ing in high levels of voltage harmonic distortion if left untreated[7]–[11]. It is a known issue that combination of harmonicdistortion and commutation notching can cause hunting andinstability in voltage and frequency regulation control loopsused by D/G electronic governors, let alone the creation ofresonance in power systems where capacitors are installed forpower-factor correction purposes [12], [13].
The importance of using frequency-based harmonic indexesto assess propagation of disturbances in the system and estimatevoltage distortion is demonstrated in several recent studies[14]–[16]. Power-quality problems have become important is-sues to be considered, leading to the recommended limits ofharmonics in supply current standard by IEC, 61000-3-2 [17].Moreover, IEEE Standard 1159 provides the recommendedpractices for defining, measuring, quantifying and interpretingelectromagnetic disturbances in the power system [18]. In[19] and [20], such assessments were performed in shipboardsystems. To address concerns associated with acceptable elec-trical power system distortion on ships and offshore rigs andplatforms, new standards were adopted, and limits were definedto ensure adequate quality and reliability in marine industry[21]–[23].
To this end, studies on power-quality improvement involvingharmonic mitigation, reduction in deviation of voltage fluctua-tion, and unbalance were performed in [24] and [25], whereasplanning studies for harmonic filtering were presented in [26].The influence of reactances to compensate for input currentharmonics generated by VFDs was studied in [27], whereasin [28] and [29], passive harmonic filters were designed toenhance power quality in the shipboard system. The aboveapproaches, however, do not define an effective harmonic an-alyzing procedure in relation to the vessel’s autonomous powersystem in order to verify compliance with harmonic standardsimposed by marine classification societies when VFDs areapplied to motors on board, while ensuring vessel’s powersystem stability.
In this paper, a systematic power-quality assessment andmonitoring methodology is proposed to define the size andtype of harmonic filters that should be used when VFDs are
0093-9994 © 2014 IEEE. Personal use is permitted, but republication/redistribution requires IEEE permission.See http://www.ieee.org/publications_standards/publications/rights/index.html for more information.
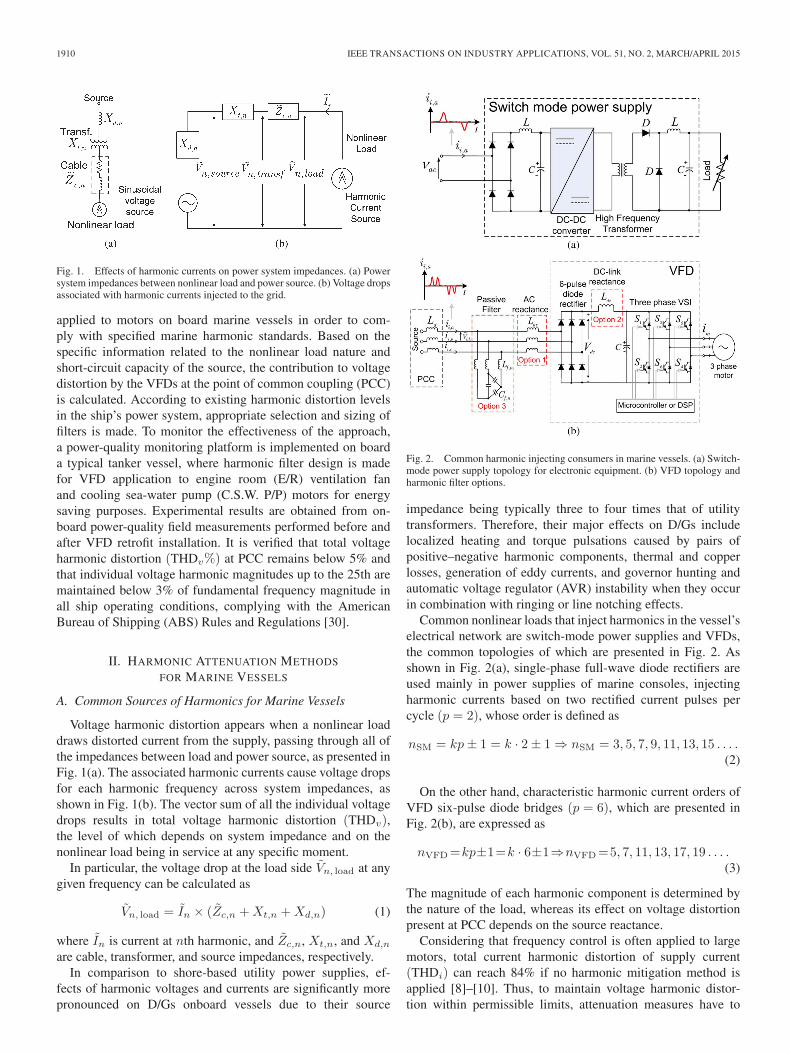
1910 IEEE TRANSACTIONS ON INDUSTRY APPLICATIONS, VOL. 51, NO. 2, MARCH/APRIL 2015
Fig. 1. Effects of harmonic currents on power system impedances. (a) Powersystem impedances between nonlinear load and power source. (b) Voltage dropsassociated with harmonic currents injected to the grid.
applied to motors on board marine vessels in order to com-ply with specified marine harmonic standards. Based on thespecific information related to the nonlinear load nature andshort-circuit capacity of the source, the contribution to voltagedistortion by the VFDs at the point of common coupling (PCC)is calculated. According to existing harmonic distortion levelsin the ship’s power system, appropriate selection and sizing offilters is made. To monitor the effectiveness of the approach,a power-quality monitoring platform is implemented on boarda typical tanker vessel, where harmonic filter design is madefor VFD application to engine room (E/R) ventilation fanand cooling sea-water pump (C.S.W. P/P) motors for energysaving purposes. Experimental results are obtained from on-board power-quality field measurements performed before andafter VFD retrofit installation. It is verified that total voltageharmonic distortion (THDv%) at PCC remains below 5% andthat individual voltage harmonic magnitudes up to the 25th aremaintained below 3% of fundamental frequency magnitude inall ship operating conditions, complying with the AmericanBureau of Shipping (ABS) Rules and Regulations [30].
II. HARMONIC ATTENUATION METHODS
FOR MARINE VESSELS
A. Common Sources of Harmonics for Marine Vessels
Voltage harmonic distortion appears when a nonlinear loaddraws distorted current from the supply, passing through all ofthe impedances between load and power source, as presented inFig. 1(a). The associated harmonic currents cause voltage dropsfor each harmonic frequency across system impedances, asshown in Fig. 1(b). The vector sum of all the individual voltagedrops results in total voltage harmonic distortion (THDv),the level of which depends on system impedance and on thenonlinear load being in service at any specific moment.
In particular, the voltage drop at the load side Vn, load at anygiven frequency can be calculated as
Vn, load = In × (Zc,n +Xt,n +Xd,n) (1)
where In is current at nth harmonic, and Zc,n, Xt,n, and Xd,n
are cable, transformer, and source impedances, respectively.In comparison to shore-based utility power supplies, ef-
fects of harmonic voltages and currents are significantly morepronounced on D/Gs onboard vessels due to their source
Fig. 2. Common harmonic injecting consumers in marine vessels. (a) Switch-mode power supply topology for electronic equipment. (b) VFD topology andharmonic filter options.
impedance being typically three to four times that of utilitytransformers. Therefore, their major effects on D/Gs includelocalized heating and torque pulsations caused by pairs ofpositive–negative harmonic components, thermal and copperlosses, generation of eddy currents, and governor hunting andautomatic voltage regulator (AVR) instability when they occurin combination with ringing or line notching effects.
Common nonlinear loads that inject harmonics in the vessel’selectrical network are switch-mode power supplies and VFDs,the common topologies of which are presented in Fig. 2. Asshown in Fig. 2(a), single-phase full-wave diode rectifiers areused mainly in power supplies of marine consoles, injectingharmonic currents based on two rectified current pulses percycle (p = 2), whose order is defined as
nSM = kp± 1 = k · 2± 1 ⇒ nSM = 3, 5, 7, 9, 11, 13, 15 . . . .(2)
On the other hand, characteristic harmonic current orders ofVFD six-pulse diode bridges (p = 6), which are presented inFig. 2(b), are expressed as
nVFD=kp±1=k · 6±1⇒nVFD=5, 7, 11, 13, 17, 19 . . . .(3)
The magnitude of each harmonic component is determined bythe nature of the load, whereas its effect on voltage distortionpresent at PCC depends on the source reactance.
Considering that frequency control is often applied to largemotors, total current harmonic distortion of supply current(THDi) can reach 84% if no harmonic mitigation method isapplied [8]–[10]. Thus, to maintain voltage harmonic distor-tion within permissible limits, attenuation measures have to
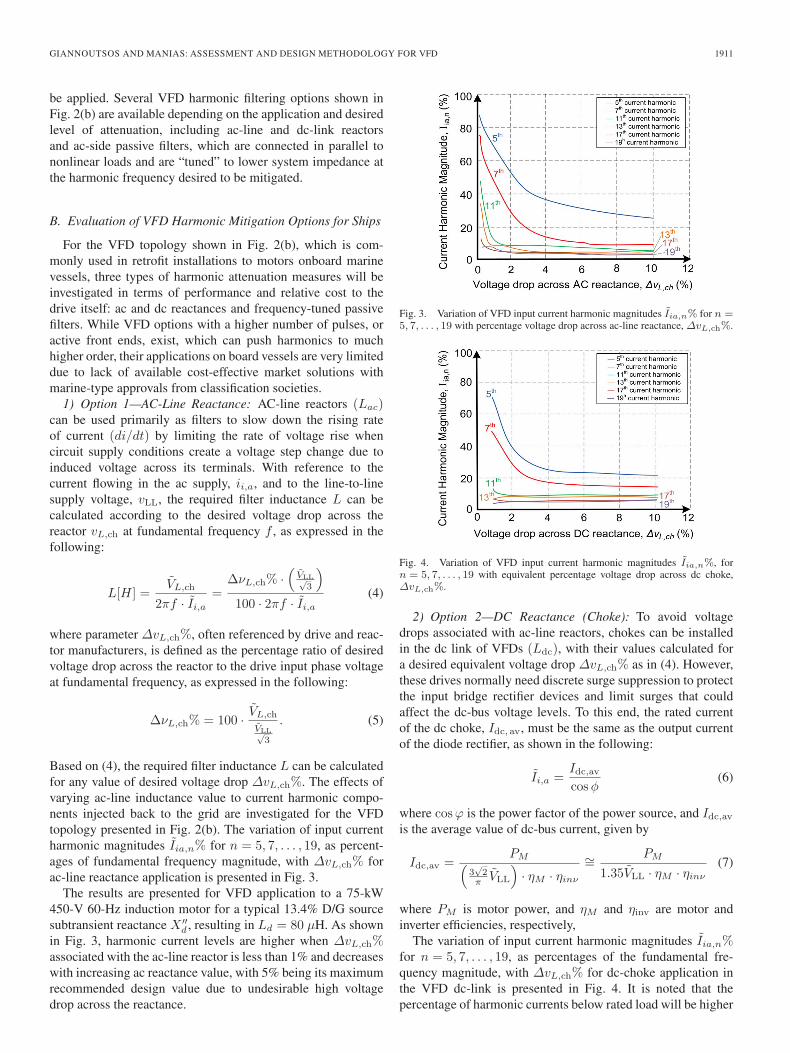
GIANNOUTSOS AND MANIAS: ASSESSMENT AND DESIGN METHODOLOGY FOR VFD 1911
be applied. Several VFD harmonic filtering options shown inFig. 2(b) are available depending on the application and desiredlevel of attenuation, including ac-line and dc-link reactorsand ac-side passive filters, which are connected in parallel tononlinear loads and are “tuned” to lower system impedance atthe harmonic frequency desired to be mitigated.
B. Evaluation of VFD Harmonic Mitigation Options for Ships
For the VFD topology shown in Fig. 2(b), which is com-monly used in retrofit installations to motors onboard marinevessels, three types of harmonic attenuation measures will beinvestigated in terms of performance and relative cost to thedrive itself: ac and dc reactances and frequency-tuned passivefilters. While VFD options with a higher number of pulses, oractive front ends, exist, which can push harmonics to muchhigher order, their applications on board vessels are very limiteddue to lack of available cost-effective market solutions withmarine-type approvals from classification societies.
1) Option 1—AC-Line Reactance: AC-line reactors (Lac)can be used primarily as filters to slow down the rising rateof current (di/dt) by limiting the rate of voltage rise whencircuit supply conditions create a voltage step change due toinduced voltage across its terminals. With reference to thecurrent flowing in the ac supply, ii,a, and to the line-to-linesupply voltage, vLL, the required filter inductance L can becalculated according to the desired voltage drop across thereactor vL,ch at fundamental frequency f , as expressed in thefollowing:
L[H] =VL,ch
2πf · Ii,a=
ΔνL,ch% ·(
VLL√3
)100 · 2πf · Ii,a
(4)
where parameter ΔvL,ch%, often referenced by drive and reac-tor manufacturers, is defined as the percentage ratio of desiredvoltage drop across the reactor to the drive input phase voltageat fundamental frequency, as expressed in the following:
ΔνL,ch% = 100 · VL,ch
VLL√3
. (5)
Based on (4), the required filter inductance L can be calculatedfor any value of desired voltage drop ΔvL,ch%. The effects ofvarying ac-line inductance value to current harmonic compo-nents injected back to the grid are investigated for the VFDtopology presented in Fig. 2(b). The variation of input currentharmonic magnitudes Iia,n% for n = 5, 7, . . . , 19, as percent-ages of fundamental frequency magnitude, with ΔvL,ch% forac-line reactance application is presented in Fig. 3.
The results are presented for VFD application to a 75-kW450-V 60-Hz induction motor for a typical 13.4% D/G sourcesubtransient reactance X ′′
d , resulting in Ld = 80 μH. As shownin Fig. 3, harmonic current levels are higher when ΔvL,ch%associated with the ac-line reactor is less than 1% and decreaseswith increasing ac reactance value, with 5% being its maximumrecommended design value due to undesirable high voltagedrop across the reactance.
Fig. 3. Variation of VFD input current harmonic magnitudes Iia,n% for n =5, 7, . . . , 19 with percentage voltage drop across ac-line reactance, ΔvL,ch%.
Fig. 4. Variation of VFD input current harmonic magnitudes Iia,n%, forn = 5, 7, . . . , 19 with equivalent percentage voltage drop across dc choke,ΔvL,ch%.
2) Option 2—DC Reactance (Choke): To avoid voltagedrops associated with ac-line reactors, chokes can be installedin the dc link of VFDs (Ldc), with their values calculated fora desired equivalent voltage drop ΔvL,ch% as in (4). However,these drives normally need discrete surge suppression to protectthe input bridge rectifier devices and limit surges that couldaffect the dc-bus voltage levels. To this end, the rated currentof the dc choke, Idc,av, must be the same as the output currentof the diode rectifier, as shown in the following:
Ii,a =Idc,avcosφ
(6)
where cosϕ is the power factor of the power source, and Idc,avis the average value of dc-bus current, given by
Idc,av =PM(
3√2
π VLL
)· ηM · ηinν
∼= PM
1.35VLL · ηM · ηinν(7)
where PM is motor power, and ηM and ηinv are motor andinverter efficiencies, respectively,
The variation of input current harmonic magnitudes Iia,n%for n = 5, 7, . . . , 19, as percentages of the fundamental fre-quency magnitude, with ΔvL,ch% for dc-choke application inthe VFD dc-link is presented in Fig. 4. It is noted that thepercentage of harmonic currents below rated load will be higher
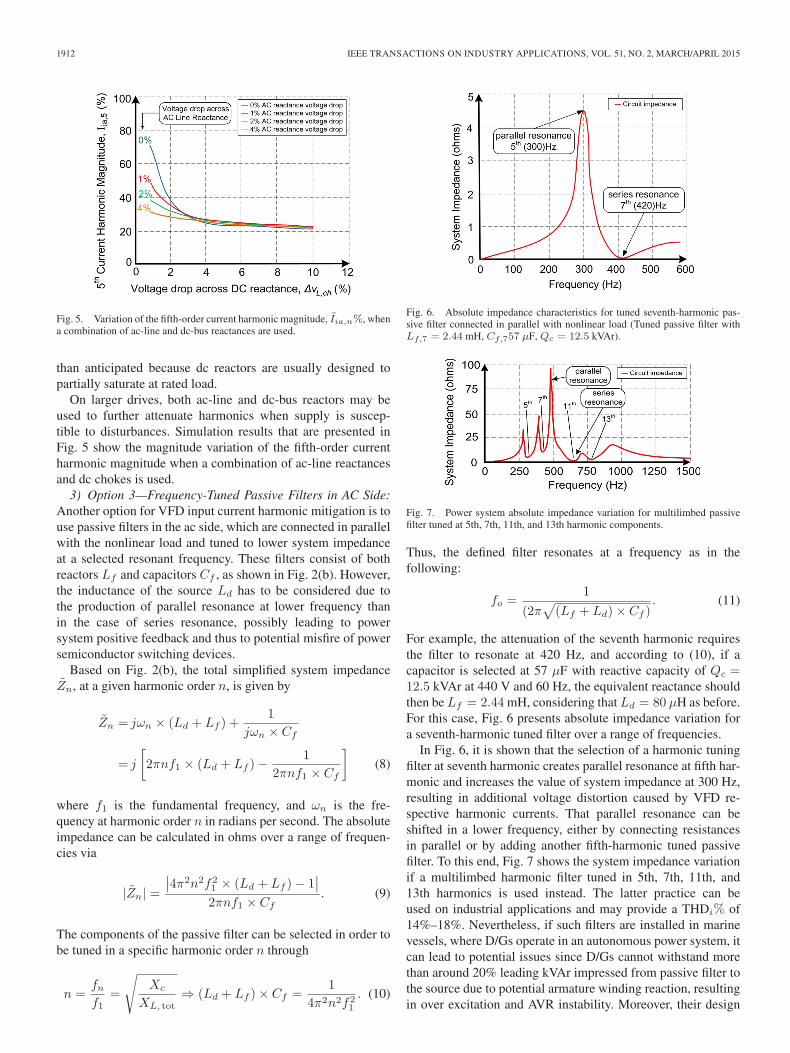
1912 IEEE TRANSACTIONS ON INDUSTRY APPLICATIONS, VOL. 51, NO. 2, MARCH/APRIL 2015
Fig. 5. Variation of the fifth-order current harmonic magnitude, Iia,n%, whena combination of ac-line and dc-bus reactances are used.
than anticipated because dc reactors are usually designed topartially saturate at rated load.
On larger drives, both ac-line and dc-bus reactors may beused to further attenuate harmonics when supply is suscep-tible to disturbances. Simulation results that are presented inFig. 5 show the magnitude variation of the fifth-order currentharmonic magnitude when a combination of ac-line reactancesand dc chokes is used.
3) Option 3—Frequency-Tuned Passive Filters in AC Side:Another option for VFD input current harmonic mitigation is touse passive filters in the ac side, which are connected in parallelwith the nonlinear load and tuned to lower system impedanceat a selected resonant frequency. These filters consist of bothreactors Lf and capacitors Cf , as shown in Fig. 2(b). However,the inductance of the source Ld has to be considered due tothe production of parallel resonance at lower frequency thanin the case of series resonance, possibly leading to powersystem positive feedback and thus to potential misfire of powersemiconductor switching devices.
Based on Fig. 2(b), the total simplified system impedanceZn, at a given harmonic order n, is given by
Zn = jωn × (Ld + Lf ) +1
jωn × Cf
= j
[2πnf1 × (Ld + Lf )−
1
2πnf1 × Cf
](8)
where f1 is the fundamental frequency, and ωn is the fre-quency at harmonic order n in radians per second. The absoluteimpedance can be calculated in ohms over a range of frequen-cies via
|Zn| =∣∣4π2n2f2
1 × (Ld + Lf )− 1∣∣
2πnf1 × Cf. (9)
The components of the passive filter can be selected in order tobe tuned in a specific harmonic order n through
n =fnf1
=
√Xc
XL, tot⇒ (Ld + Lf )× Cf =
1
4π2n2f21
. (10)
Fig. 6. Absolute impedance characteristics for tuned seventh-harmonic pas-sive filter connected in parallel with nonlinear load (Tuned passive filter withLf,7 = 2.44 mH, Cf,757 μF, Qc = 12.5 kVAr).
Fig. 7. Power system absolute impedance variation for multilimbed passivefilter tuned at 5th, 7th, 11th, and 13th harmonic components.
Thus, the defined filter resonates at a frequency as in thefollowing:
fo =1
(2π√
(Lf + Ld)× Cf ). (11)
For example, the attenuation of the seventh harmonic requiresthe filter to resonate at 420 Hz, and according to (10), if acapacitor is selected at 57 μF with reactive capacity of Qc =12.5 kVAr at 440 V and 60 Hz, the equivalent reactance shouldthen be Lf = 2.44 mH, considering that Ld = 80 μH as before.For this case, Fig. 6 presents absolute impedance variation fora seventh-harmonic tuned filter over a range of frequencies.
In Fig. 6, it is shown that the selection of a harmonic tuningfilter at seventh harmonic creates parallel resonance at fifth har-monic and increases the value of system impedance at 300 Hz,resulting in additional voltage distortion caused by VFD re-spective harmonic currents. That parallel resonance can beshifted in a lower frequency, either by connecting resistancesin parallel or by adding another fifth-harmonic tuned passivefilter. To this end, Fig. 7 shows the system impedance variationif a multilimbed harmonic filter tuned in 5th, 7th, 11th, and13th harmonics is used instead. The latter practice can beused on industrial applications and may provide a THDi% of14%–18%. Nevertheless, if such filters are installed in marinevessels, where D/Gs operate in an autonomous power system, itcan lead to potential issues since D/Gs cannot withstand morethan around 20% leading kVAr impressed from passive filter tothe source due to potential armature winding reaction, resultingin over excitation and AVR instability. Moreover, their design
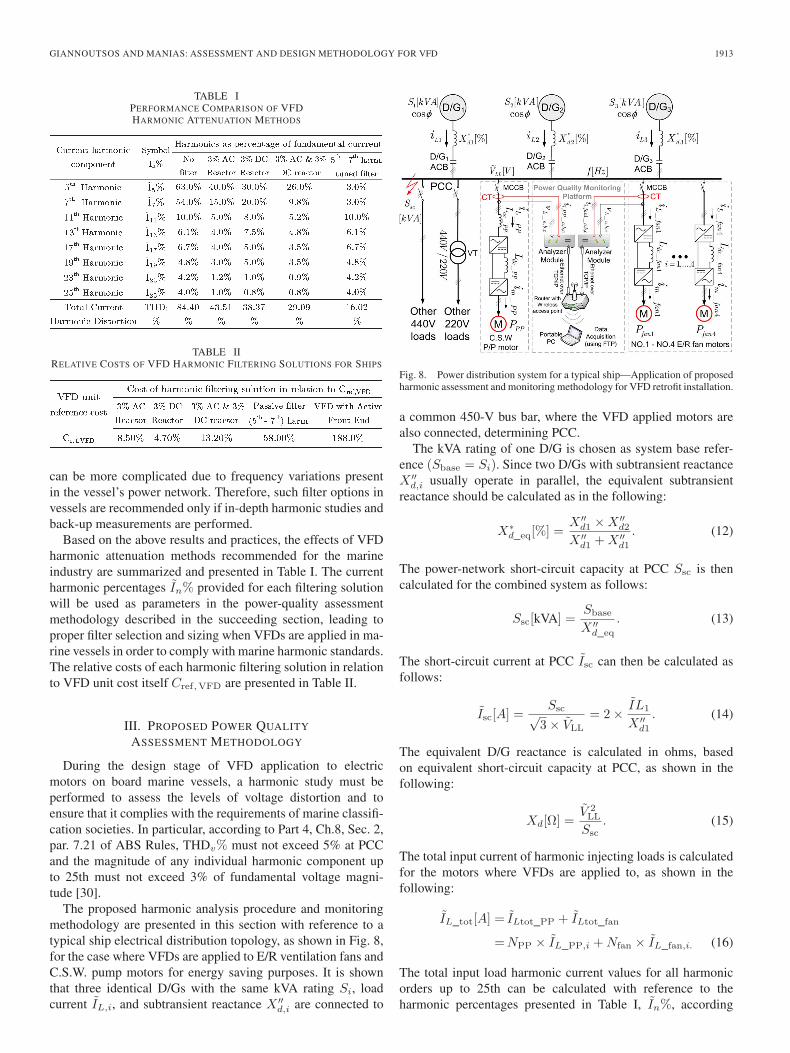
GIANNOUTSOS AND MANIAS: ASSESSMENT AND DESIGN METHODOLOGY FOR VFD 1913
TABLE IPERFORMANCE COMPARISON OF VFDHARMONIC ATTENUATION METHODS
TABLE IIRELATIVE COSTS OF VFD HARMONIC FILTERING SOLUTIONS FOR SHIPS
can be more complicated due to frequency variations presentin the vessel’s power network. Therefore, such filter options invessels are recommended only if in-depth harmonic studies andback-up measurements are performed.
Based on the above results and practices, the effects of VFDharmonic attenuation methods recommended for the marineindustry are summarized and presented in Table I. The currentharmonic percentages In% provided for each filtering solutionwill be used as parameters in the power-quality assessmentmethodology described in the succeeding section, leading toproper filter selection and sizing when VFDs are applied in ma-rine vessels in order to comply with marine harmonic standards.The relative costs of each harmonic filtering solution in relationto VFD unit cost itself Cref,VFD are presented in Table II.
III. PROPOSED POWER QUALITY
ASSESSMENT METHODOLOGY
During the design stage of VFD application to electricmotors on board marine vessels, a harmonic study must beperformed to assess the levels of voltage distortion and toensure that it complies with the requirements of marine classifi-cation societies. In particular, according to Part 4, Ch.8, Sec. 2,par. 7.21 of ABS Rules, THDv% must not exceed 5% at PCCand the magnitude of any individual harmonic component upto 25th must not exceed 3% of fundamental voltage magni-tude [30].
The proposed harmonic analysis procedure and monitoringmethodology are presented in this section with reference to atypical ship electrical distribution topology, as shown in Fig. 8,for the case where VFDs are applied to E/R ventilation fans andC.S.W. pump motors for energy saving purposes. It is shownthat three identical D/Gs with the same kVA rating Si, loadcurrent IL,i, and subtransient reactance X ′′
d,i are connected to
Fig. 8. Power distribution system for a typical ship—Application of proposedharmonic assessment and monitoring methodology for VFD retrofit installation.
a common 450-V bus bar, where the VFD applied motors arealso connected, determining PCC.
The kVA rating of one D/G is chosen as system base refer-ence (Sbase = Si). Since two D/Gs with subtransient reactanceX ′′
d,i usually operate in parallel, the equivalent subtransientreactance should be calculated as in the following:
X∗d_eq[%] =
X ′′d1 ×X ′′
d2
X ′′d1 +X ′′
d1
. (12)
The power-network short-circuit capacity at PCC Ssc is thencalculated for the combined system as follows:
Ssc[kVA] =Sbase
X ′′d_eq
. (13)
The short-circuit current at PCC Isc can then be calculated asfollows:
Isc[A] =Ssc√
3× VLL
= 2× IL1
X ′′d1
. (14)
The equivalent D/G reactance is calculated in ohms, basedon equivalent short-circuit capacity at PCC, as shown in thefollowing:
Xd[Ω] =V 2LL
Ssc. (15)
The total input current of harmonic injecting loads is calculatedfor the motors where VFDs are applied to, as shown in thefollowing:
IL_tot[A] = ILtot_PP + ILtot_fan
=NPP × IL_PP,i +Nfan × IL_fan,i. (16)
The total input load harmonic current values for all harmonicorders up to 25th can be calculated with reference to theharmonic percentages presented in Table I, In%, according
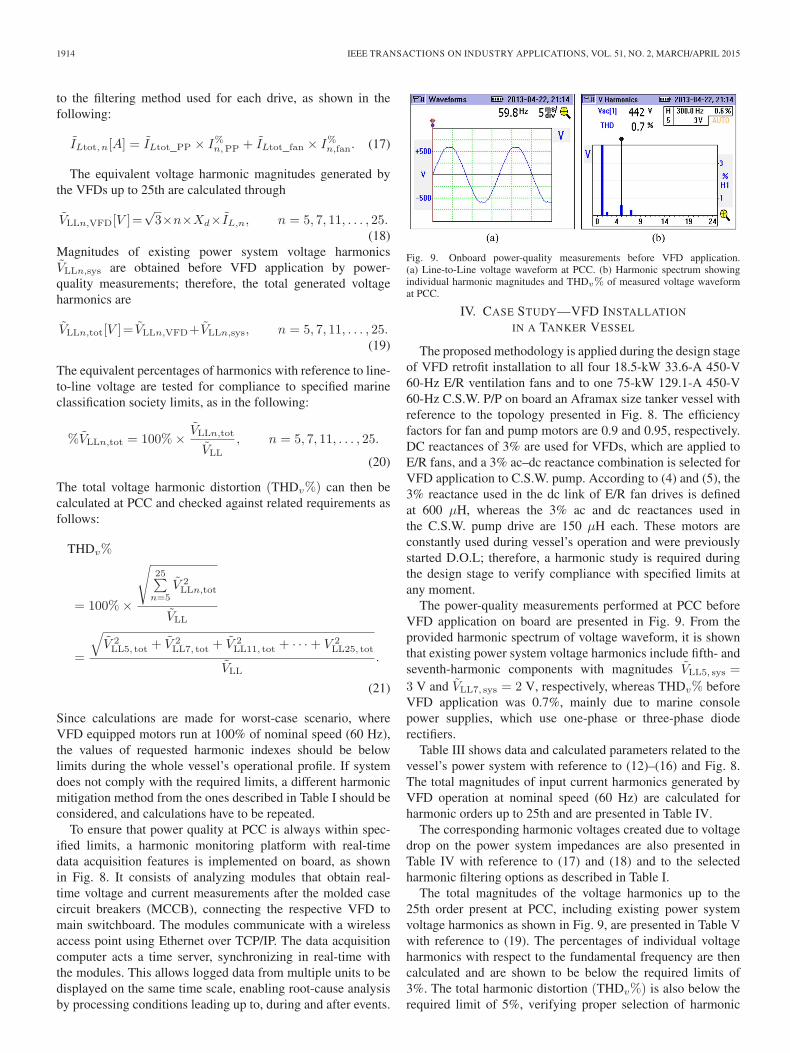
1914 IEEE TRANSACTIONS ON INDUSTRY APPLICATIONS, VOL. 51, NO. 2, MARCH/APRIL 2015
to the filtering method used for each drive, as shown in thefollowing:
ILtot, n[A] = ILtot_PP × I%n,PP + ILtot_fan × I%n,fan. (17)
The equivalent voltage harmonic magnitudes generated bythe VFDs up to 25th are calculated through
VLLn,VFD[V ]=√3×n×Xd×IL,n, n = 5, 7, 11, . . . , 25.
(18)Magnitudes of existing power system voltage harmonicsVLLn,sys are obtained before VFD application by power-quality measurements; therefore, the total generated voltageharmonics are
VLLn,tot[V ]= VLLn,VFD+VLLn,sys, n = 5, 7, 11, . . . , 25.(19)
The equivalent percentages of harmonics with reference to line-to-line voltage are tested for compliance to specified marineclassification society limits, as in the following:
%VLLn,tot = 100%× VLLn,tot
VLL
, n = 5, 7, 11, . . . , 25.
(20)
The total voltage harmonic distortion (THDv%) can then becalculated at PCC and checked against related requirements asfollows:
THDv%
= 100%×
√25∑
n=5V 2LLn,tot
VLL
=
√V 2LL5, tot + V 2
LL7, tot + V 2LL11, tot + · · ·+ V 2
LL25, tot
VLL
.
(21)
Since calculations are made for worst-case scenario, whereVFD equipped motors run at 100% of nominal speed (60 Hz),the values of requested harmonic indexes should be belowlimits during the whole vessel’s operational profile. If systemdoes not comply with the required limits, a different harmonicmitigation method from the ones described in Table I should beconsidered, and calculations have to be repeated.
To ensure that power quality at PCC is always within spec-ified limits, a harmonic monitoring platform with real-timedata acquisition features is implemented on board, as shownin Fig. 8. It consists of analyzing modules that obtain real-time voltage and current measurements after the molded casecircuit breakers (MCCB), connecting the respective VFD tomain switchboard. The modules communicate with a wirelessaccess point using Ethernet over TCP/IP. The data acquisitioncomputer acts a time server, synchronizing in real-time withthe modules. This allows logged data from multiple units to bedisplayed on the same time scale, enabling root-cause analysisby processing conditions leading up to, during and after events.
Fig. 9. Onboard power-quality measurements before VFD application.(a) Line-to-Line voltage waveform at PCC. (b) Harmonic spectrum showingindividual harmonic magnitudes and THDv% of measured voltage waveformat PCC.
IV. CASE STUDY—VFD INSTALLATION
IN A TANKER VESSEL
The proposed methodology is applied during the design stageof VFD retrofit installation to all four 18.5-kW 33.6-A 450-V60-Hz E/R ventilation fans and to one 75-kW 129.1-A 450-V60-Hz C.S.W. P/P on board an Aframax size tanker vessel withreference to the topology presented in Fig. 8. The efficiencyfactors for fan and pump motors are 0.9 and 0.95, respectively.DC reactances of 3% are used for VFDs, which are applied toE/R fans, and a 3% ac–dc reactance combination is selected forVFD application to C.S.W. pump. According to (4) and (5), the3% reactance used in the dc link of E/R fan drives is definedat 600 μH, whereas the 3% ac and dc reactances used inthe C.S.W. pump drive are 150 μH each. These motors areconstantly used during vessel’s operation and were previouslystarted D.O.L; therefore, a harmonic study is required duringthe design stage to verify compliance with specified limits atany moment.
The power-quality measurements performed at PCC beforeVFD application on board are presented in Fig. 9. From theprovided harmonic spectrum of voltage waveform, it is shownthat existing power system voltage harmonics include fifth- andseventh-harmonic components with magnitudes VLL5, sys =
3 V and VLL7, sys = 2 V, respectively, whereas THDv% beforeVFD application was 0.7%, mainly due to marine consolepower supplies, which use one-phase or three-phase dioderectifiers.
Table III shows data and calculated parameters related to thevessel’s power system with reference to (12)–(16) and Fig. 8.The total magnitudes of input current harmonics generated byVFD operation at nominal speed (60 Hz) are calculated forharmonic orders up to 25th and are presented in Table IV.
The corresponding harmonic voltages created due to voltagedrop on the power system impedances are also presented inTable IV with reference to (17) and (18) and to the selectedharmonic filtering options as described in Table I.
The total magnitudes of the voltage harmonics up to the25th order present at PCC, including existing power systemvoltage harmonics as shown in Fig. 9, are presented in Table Vwith reference to (19). The percentages of individual voltageharmonics with respect to the fundamental frequency are thencalculated and are shown to be below the required limits of3%. The total harmonic distortion (THDv%) is also below therequired limit of 5%, verifying proper selection of harmonic
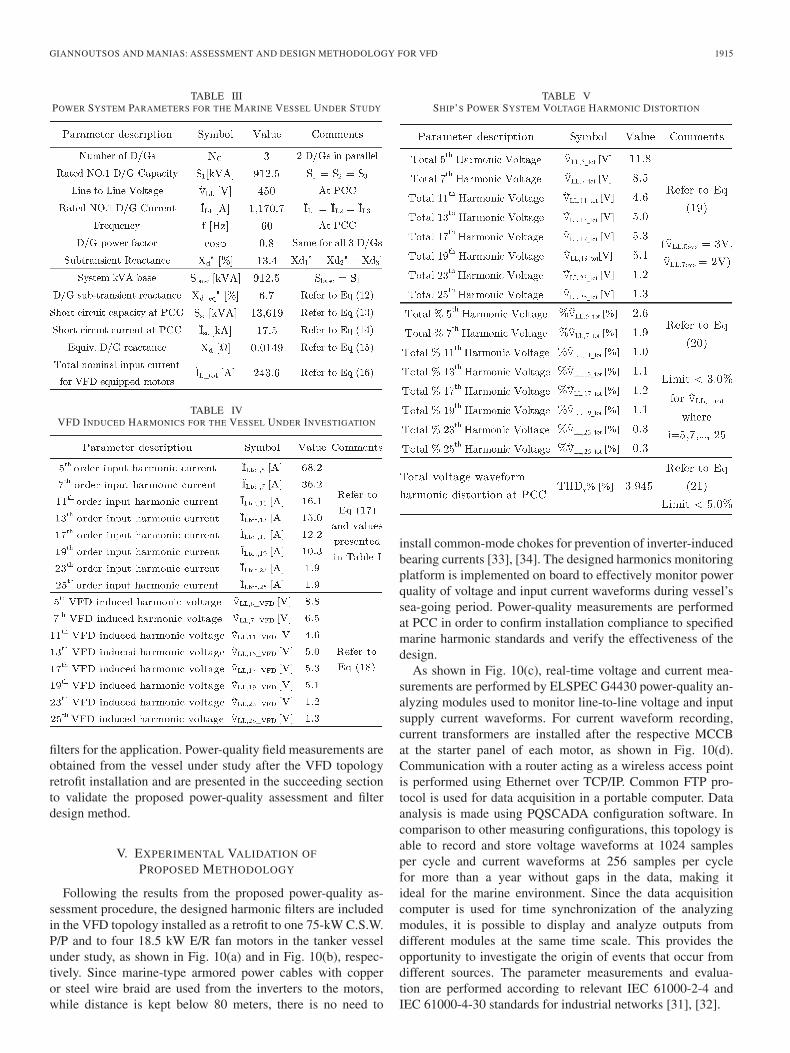
GIANNOUTSOS AND MANIAS: ASSESSMENT AND DESIGN METHODOLOGY FOR VFD 1915
TABLE IIIPOWER SYSTEM PARAMETERS FOR THE MARINE VESSEL UNDER STUDY
TABLE IVVFD INDUCED HARMONICS FOR THE VESSEL UNDER INVESTIGATION
filters for the application. Power-quality field measurements areobtained from the vessel under study after the VFD topologyretrofit installation and are presented in the succeeding sectionto validate the proposed power-quality assessment and filterdesign method.
V. EXPERIMENTAL VALIDATION OF
PROPOSED METHODOLOGY
Following the results from the proposed power-quality as-sessment procedure, the designed harmonic filters are includedin the VFD topology installed as a retrofit to one 75-kW C.S.W.P/P and to four 18.5 kW E/R fan motors in the tanker vesselunder study, as shown in Fig. 10(a) and in Fig. 10(b), respec-tively. Since marine-type armored power cables with copperor steel wire braid are used from the inverters to the motors,while distance is kept below 80 meters, there is no need to
TABLE VSHIP’S POWER SYSTEM VOLTAGE HARMONIC DISTORTION
install common-mode chokes for prevention of inverter-inducedbearing currents [33], [34]. The designed harmonics monitoringplatform is implemented on board to effectively monitor powerquality of voltage and input current waveforms during vessel’ssea-going period. Power-quality measurements are performedat PCC in order to confirm installation compliance to specifiedmarine harmonic standards and verify the effectiveness of thedesign.
As shown in Fig. 10(c), real-time voltage and current mea-surements are performed by ELSPEC G4430 power-quality an-alyzing modules used to monitor line-to-line voltage and inputsupply current waveforms. For current waveform recording,current transformers are installed after the respective MCCBat the starter panel of each motor, as shown in Fig. 10(d).Communication with a router acting as a wireless access pointis performed using Ethernet over TCP/IP. Common FTP pro-tocol is used for data acquisition in a portable computer. Dataanalysis is made using PQSCADA configuration software. Incomparison to other measuring configurations, this topology isable to record and store voltage waveforms at 1024 samplesper cycle and current waveforms at 256 samples per cyclefor more than a year without gaps in the data, making itideal for the marine environment. Since the data acquisitioncomputer is used for time synchronization of the analyzingmodules, it is possible to display and analyze outputs fromdifferent modules at the same time scale. This provides theopportunity to investigate the origin of events that occur fromdifferent sources. The parameter measurements and evalua-tion are performed according to relevant IEC 61000-2-4 andIEC 61000-4-30 standards for industrial networks [31], [32].
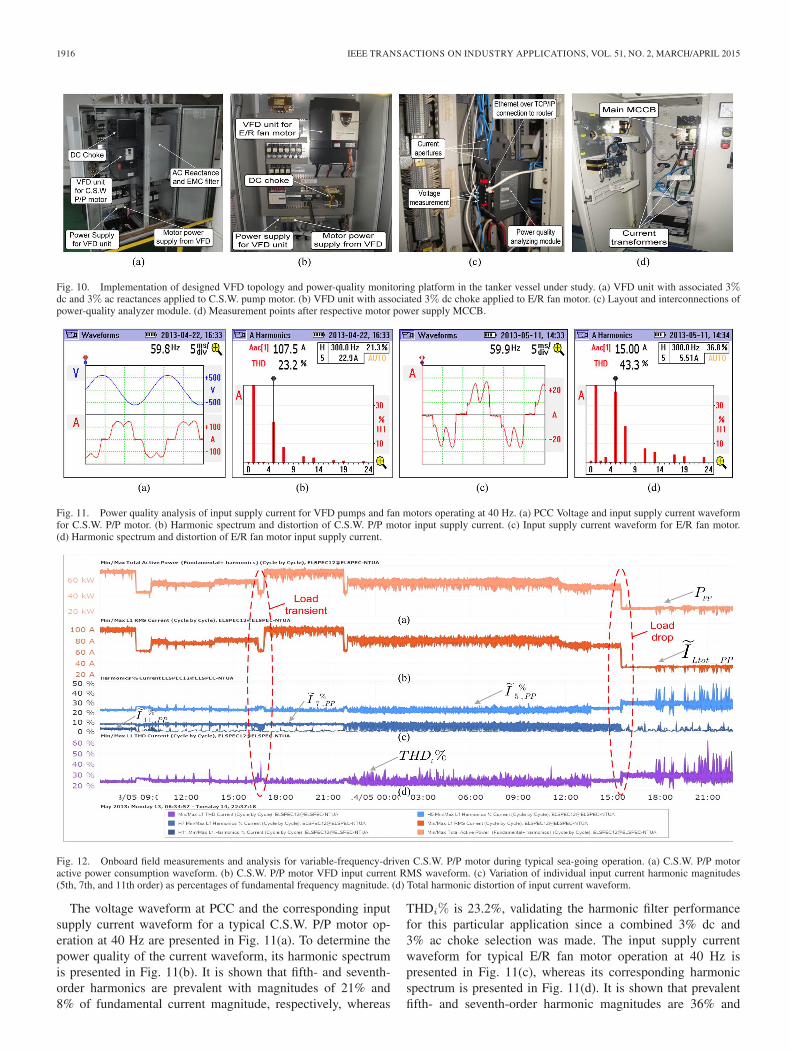
1916 IEEE TRANSACTIONS ON INDUSTRY APPLICATIONS, VOL. 51, NO. 2, MARCH/APRIL 2015
Fig. 10. Implementation of designed VFD topology and power-quality monitoring platform in the tanker vessel under study. (a) VFD unit with associated 3%dc and 3% ac reactances applied to C.S.W. pump motor. (b) VFD unit with associated 3% dc choke applied to E/R fan motor. (c) Layout and interconnections ofpower-quality analyzer module. (d) Measurement points after respective motor power supply MCCB.
Fig. 11. Power quality analysis of input supply current for VFD pumps and fan motors operating at 40 Hz. (a) PCC Voltage and input supply current waveformfor C.S.W. P/P motor. (b) Harmonic spectrum and distortion of C.S.W. P/P motor input supply current. (c) Input supply current waveform for E/R fan motor.(d) Harmonic spectrum and distortion of E/R fan motor input supply current.
Fig. 12. Onboard field measurements and analysis for variable-frequency-driven C.S.W. P/P motor during typical sea-going operation. (a) C.S.W. P/P motoractive power consumption waveform. (b) C.S.W. P/P motor VFD input current RMS waveform. (c) Variation of individual input current harmonic magnitudes(5th, 7th, and 11th order) as percentages of fundamental frequency magnitude. (d) Total harmonic distortion of input current waveform.
The voltage waveform at PCC and the corresponding inputsupply current waveform for a typical C.S.W. P/P motor op-eration at 40 Hz are presented in Fig. 11(a). To determine thepower quality of the current waveform, its harmonic spectrumis presented in Fig. 11(b). It is shown that fifth- and seventh-order harmonics are prevalent with magnitudes of 21% and8% of fundamental current magnitude, respectively, whereas
THDi% is 23.2%, validating the harmonic filter performancefor this particular application since a combined 3% dc and3% ac choke selection was made. The input supply currentwaveform for typical E/R fan motor operation at 40 Hz ispresented in Fig. 11(c), whereas its corresponding harmonicspectrum is presented in Fig. 11(d). It is shown that prevalentfifth- and seventh-order harmonic magnitudes are 36% and
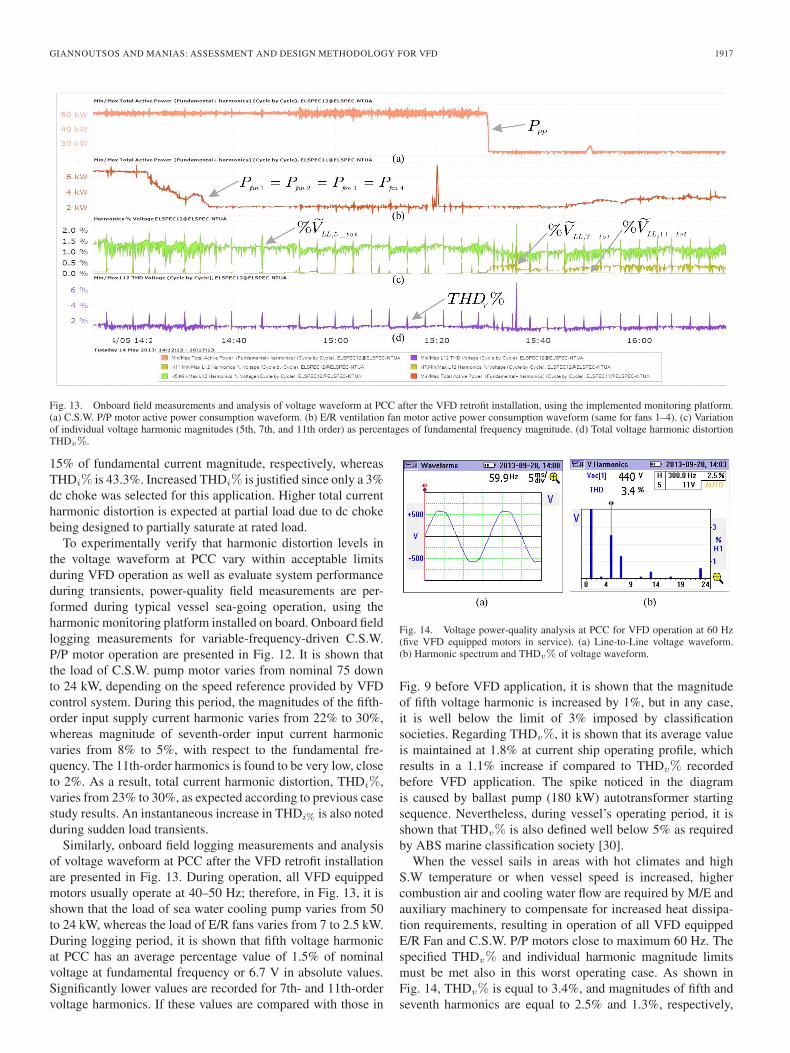
GIANNOUTSOS AND MANIAS: ASSESSMENT AND DESIGN METHODOLOGY FOR VFD 1917
Fig. 13. Onboard field measurements and analysis of voltage waveform at PCC after the VFD retrofit installation, using the implemented monitoring platform.(a) C.S.W. P/P motor active power consumption waveform. (b) E/R ventilation fan motor active power consumption waveform (same for fans 1–4). (c) Variationof individual voltage harmonic magnitudes (5th, 7th, and 11th order) as percentages of fundamental frequency magnitude. (d) Total voltage harmonic distortionTHDv%.
15% of fundamental current magnitude, respectively, whereasTHDi% is 43.3%. Increased THDi% is justified since only a 3%dc choke was selected for this application. Higher total currentharmonic distortion is expected at partial load due to dc chokebeing designed to partially saturate at rated load.
To experimentally verify that harmonic distortion levels inthe voltage waveform at PCC vary within acceptable limitsduring VFD operation as well as evaluate system performanceduring transients, power-quality field measurements are per-formed during typical vessel sea-going operation, using theharmonic monitoring platform installed on board. Onboard fieldlogging measurements for variable-frequency-driven C.S.W.P/P motor operation are presented in Fig. 12. It is shown thatthe load of C.S.W. pump motor varies from nominal 75 downto 24 kW, depending on the speed reference provided by VFDcontrol system. During this period, the magnitudes of the fifth-order input supply current harmonic varies from 22% to 30%,whereas magnitude of seventh-order input current harmonicvaries from 8% to 5%, with respect to the fundamental fre-quency. The 11th-order harmonics is found to be very low, closeto 2%. As a result, total current harmonic distortion, THDi%,varies from 23% to 30%, as expected according to previous casestudy results. An instantaneous increase in THDi% is also notedduring sudden load transients.
Similarly, onboard field logging measurements and analysisof voltage waveform at PCC after the VFD retrofit installationare presented in Fig. 13. During operation, all VFD equippedmotors usually operate at 40–50 Hz; therefore, in Fig. 13, it isshown that the load of sea water cooling pump varies from 50to 24 kW, whereas the load of E/R fans varies from 7 to 2.5 kW.During logging period, it is shown that fifth voltage harmonicat PCC has an average percentage value of 1.5% of nominalvoltage at fundamental frequency or 6.7 V in absolute values.Significantly lower values are recorded for 7th- and 11th-ordervoltage harmonics. If these values are compared with those in
Fig. 14. Voltage power-quality analysis at PCC for VFD operation at 60 Hz(five VFD equipped motors in service). (a) Line-to-Line voltage waveform.(b) Harmonic spectrum and THDv% of voltage waveform.
Fig. 9 before VFD application, it is shown that the magnitudeof fifth voltage harmonic is increased by 1%, but in any case,it is well below the limit of 3% imposed by classificationsocieties. Regarding THDv%, it is shown that its average valueis maintained at 1.8% at current ship operating profile, whichresults in a 1.1% increase if compared to THDv% recordedbefore VFD application. The spike noticed in the diagramis caused by ballast pump (180 kW) autotransformer startingsequence. Nevertheless, during vessel’s operating period, it isshown that THDv% is also defined well below 5% as requiredby ABS marine classification society [30].
When the vessel sails in areas with hot climates and highS.W temperature or when vessel speed is increased, highercombustion air and cooling water flow are required by M/E andauxiliary machinery to compensate for increased heat dissipa-tion requirements, resulting in operation of all VFD equippedE/R Fan and C.S.W. P/P motors close to maximum 60 Hz. Thespecified THDv% and individual harmonic magnitude limitsmust be met also in this worst operating case. As shown inFig. 14, THDv% is equal to 3.4%, and magnitudes of fifth andseventh harmonics are equal to 2.5% and 1.3%, respectively,
1918 IEEE TRANSACTIONS ON INDUSTRY APPLICATIONS, VOL. 51, NO. 2, MARCH/APRIL 2015
with reference to fundamental frequency, verifying the effec-tiveness of proposed design also at this case.
VI. CONCLUSION
In this paper, a power-quality assessment and monitoringmethodology has been introduced to dimension harmonic filtersfor VFD application to electric motors in marine vessels inorder to comply with marine harmonic standards. A highly sys-tematic approach was proposed, considering the importance ofpower system impedances to avoid resonance and D/G governorand AVR instability. The presented methodology is highly pa-rameterized to be adapted for any marine power system facingstructural changes due to VFD application. For the vessel underinvestigation, the proposed power-quality analysis methodol-ogy was used to define the filter design requirements for VFDapplication to E/R fan and C.S.W. pump motors, which areconstantly used during sea-going and cargo handling periods. Apower-quality monitoring platform was implemented on boardto record and analyze current and voltage distortion at PCC.Power-quality measurements are obtained before and after theimplementation of the designed VFD topology in the vesselunder investigation. Experimental results show that the mag-nitudes of individual voltage harmonics up to 25th are below3% of the magnitude of the fundamental frequency, whereasTHDv% is well below 5% even in the case where drives operateall subject motors at 60 Hz, validating the effectiveness of theproposed analysis and design.
REFERENCES
[1] V. Verma, B. Singh, A. Chandra, and K. Al Haddad, “Power conditionerfor variable-frequency drives in offshore oil fields,” IEEE Trans. Ind.Appl., vol. 46, no. 4, pp. 731–739, Mar./Apr. 2010.
[2] A. Teke, L. Saribulut, and M. Tumay, “A novel reference signal gen-eration method for power-quality improvement of unified power-qualityconditioner,” IEEE Trans. Power Del., vol. 26, no. 4, pp. 2205–2214,Oct. 2011.
[3] P. E. Melin, J. R. Espinosa, L. A. Moran, and J. R. Rodriguez, “Anal-ysis, design and control of a unified power-quality conditioner basedon a current-source topology,” IEEE Trans. Power Del., vol. 27, no. 4,pp. 1727–1736, Oct. 2012.
[4] C.-L. Su, W.-L. Chung, and K.-T. Yu, “An energy-savings evaluationmethod for variable-frequency-drive applications on ship central cool-ing systems,” IEEE Trans. Ind. Appl., vol. 50, no. 2, pp. 1286–1294,Mar./Apr. 2014.
[5] S. V. Giannoutsos and S. N. Manias, “Development of an integrated en-ergy efficiency control system for ship power balance and diesel generatorfuel consumption optimization,” in Proc. IEEE Ind. Appl. Soc. Annu.Meet., Orlando, FL, USA, Oct. 2013, pp. 1–11.
[6] S. V. Giannoutsos and S. N. Manias, “A data-driven process controller forenergy efficient variable-speed pump operation in central cooling watersystem of marine vessels,” IEEE Trans. Ind. Electron., vol. 62, no. 1,pp. 587–598, Jan. 2015.
[7] M. Grotzbach and R. Redmann, “Line current harmonics of VSI-fedadjustable-speed drives,” IEEE Trans. Ind. Appl., vol. 36, no. 2, pp. 683–690, Mar./Apr. 2000.
[8] L. Xiaodong, Y. Luy, and D. O. Koval, “Investigation of input harmonicdistortions of variable frequency drives,” in Proc. IEEE Ind. Commun.Power Syst. Conf., Edmonton, AB, Canada, May 2007, pp. 1–11.
[9] H. E. Mazin, X. Wilsun, and H. Biao, “Determining the harmonic impactsof multiple harmonic-producing loads,” IEEE Trans. Power Del., vol. 26,no. 2, pp. 1187–1195, Apr. 2011.
[10] K. Lee, V. Blasko, T. M. Jahns, and T. A. Ligo, “Input harmonic estimationand control methods in active rectifiers,” IEEE Trans. Power Del., vol. 25,no. 2, pp. 953–960, Apr. 2010.
[11] T. J. Dionise, V. Lorch, and B. J. Brazil, “Power quality investigationof back-to-back harmonic filters for a high-voltage anode foil manufac-turing facility,” IEEE Trans. Ind. Appl., vol. 46, no. 2, pp. 694–702,Mar./Apr. 2010.
[12] Y. Cui and X. Wang, “Modal frequency sensitivity for power systemharmonic resonance analysis,” IEEE Trans. Power Del., vol. 27, no. 2,pp. 1010–1017, Apr. 2012.
[13] Z. Huang, Y. Cui, and W. Xu, “Application of modal sensitivity for powersystem harmonic resonance analysis,” IEEE Trans. Power Syst., vol. 22,no. 1, pp. 222–231, Feb. 2007.
[14] H. Gao, F. Wu, and W. Zhao, “Harmonics analyses of ship power systemunder different commutating methods,” in Proc. IEEE Power Energy Eng.Conf., Wuhan, China, Mar. 2009, pp. 1–6.
[15] E. F. de Arruda, N. Kagan, and P. F. Ribeiro, “Harmonic distortion state es-timation using an evolutionary strategy,” IEEE Trans. Power Del., vol. 25,no. 2, pp. 831–842, Apr. 2010.
[16] A. Cataliotti and V. Cosentino, “A new measurement method for thedetection of harmonic sources in power systems based on the approachof the IEEE Std. 1459-2000,” IEEE Trans. Power Del., vol. 25, no. 1,pp. 332–340, Jan. 2010.
[17] Limits for Harmonic Current Emissions (Equipment Input Current ≤16 APer Phase), Int. Std. IEC 61000-3-2, 2006.
[18] IEEE Recommended Practice for Monitoring Electric Power Quality,IEEE Std. 1159, 2009.
[19] P. Crapse, J. Wang, J. Abrams, and Y.-J. Shin, “Power quality as-sessment and management in an electric ship power system,” in Proc.IEEE Elect. Ship Technol. Symp., Arlington, VA, USA, May 2007,pp. 328–334.
[20] S. Bourget, P. Guerin, and R. Le Doeuff, “Analysis of the interharmonicsgenerated by a ship propulsion system,” in Proc. Harmon. Qual. PowerInt. Conf., Lake Placid, NY, USA, Sep. 2004, pp. 465–470.
[21] P. F. Ribeiro, M. Steuer, and M. Islam, “Reevaluating electric powersystem harmonic distortion limits for shipboard systems,” in Proc.Harmon. Qual. Power Int. Conf., Lake Placid, NY, USA, Sep. 2004,pp. 706–711.
[22] T. Hoevenaars, I. Evans, and A. Lawson, “New marine harmonicstandards,” IEEE Ind. Appl. Mag., vol. 16, no. 1, pp. 16–25,Jan./Feb. 2010.
[23] X. Xu, M. He, and H. Zheng, “Study of electric power quality im-provement in ship networks,” in Proc. IEEE Ind. Electron. Appl. Conf.,Singapore, May 2006, pp. 1–6.
[24] S. X. Duarte and N. Kagan, “A power-quality index to assess the im-pact of voltage harmonic distortions and unbalance to three-phase induc-tion motors,” IEEE Trans. Power Del., vol. 25, no. 3, pp. 1846–1854,Jul. 2010.
[25] K. Lee, G. Venkataramanan, and T. M. Jahns, “Modeling effects ofvoltage unbalances in industrial distribution systems with adjustable-speed drives,” IEEE Trans. Ind. Appl., vol. 44, no. 5, pp. 1322–1332,Sep./Oct. 2008.
[26] T. Thasananutariya and S. Chatratana, “Planning study of harmonic filterfor ASDs in industrial facilities,” IEEE Trans. Ind. Appl., vol. 45, no. 1,pp. 295–302, Jan./Feb. 2009.
[27] L. Xiaodong, O. Ilochonwu, and J. Lim, “Influence of reactors on inputharmonics of variable frequency drives,” IEEE Trans. Ind. Appl., vol. 47,no. 5, pp. 2195–2203, Sep./Oct. 2011.
[28] C.-L. Su and C.-J. Hong, “Design of passive harmonic filters to enhancepower quality and energy efficiency in ship power systems,” in Proc. IEEEInd. Commun. Power Sys. Technol. Conf., Stone Mountain, GA, USA,Apr./May 2013, pp. 1–8.
[29] P. Salmeron and S. P. Litran, “Improvement of the electric power qualityusing series active and shunt passive filters,” IEEE Trans. Power Del.,vol. 25, no. 2, pp. 1058–1067, Apr. 2010.
[30] American Bureau of Shipping (ABS), Rules for Building and ClassingSteel Vessels 2013 Part 4: Vessel Systems and Machinery. [Online].Available: http://www.eagle.org/eagleExternalPortalWEB/ShowProperty/BEA%20Repository/Rules&Guides/Archives/2_SVR_2013/part4
[31] Compatibility Levels in Industrial Plants for Low-Frequency ConductedDisturbances, Int. Std. IEC 61000-2-4, 2002.
[32] Testing and Measurement Techniques—Power Quality MeasurementMethods, Int. Std. IEC 61000-4-30, 2003.
[33] A. Binder and A. Muetze, “Scaling effects of inverter-induced bearingcurrents in AC machines,” IEEE Trans. Ind. Appl., vol. 44, no. 3, pp. 769–776, May/Jun. 2008.
[34] O. Magdun and A. Binder, “High-frequency induction machinemodeling for common mode current and bearing voltage calcu-lation,” IEEE Trans. Ind. Appl., vol. 50, no. 3, pp. 1780–1790,May/Jun. 2014.
GIANNOUTSOS AND MANIAS: ASSESSMENT AND DESIGN METHODOLOGY FOR VFD 1919
Spyridon V. Giannoutsos (S’12) received theDiploma in electrical and computer engineeringfrom the National Technical University of Athens(NTUA), Athens, Greece, in 2010. He is currentlyworking toward the Ph.D. degree in marine electricalengineering, power electronics, and process controlwith the Electrical Machines and Power ElectronicsLaboratory, NTUA.
Since 2011, he has also been a Research Associatewith the Electrical Machines and Power ElectronicsLaboratory, NTUA. In 2012, he joined Thenamaris
Ships Management Inc., Athens, where he is holding the position of FleetSupport Electrical Engineer, focusing on design and implementation of energyand fuel saving solutions on board. His research interests include processcontrol, power electronics, motor drives, and power quality.
Mr. Giannoutsos is a member of the IEEE Industry Applications and IEEEIndustrial Electronics Societies and a Registered Professional Engineer of theTechnical Chamber of Greece.
Stefanos N. Manias (M’85–SM’92–F’05) receivedthe B.Eng., M.Eng., and Ph.D. degrees fromConcordia University, Montreal, QC, Canada, in1975, 1980, and 1984, respectively, all in electricalengineering.
In 1975, he joined the Canadian BroadcastingCorporation, where he designed radio and televisionautomation systems. From 1979 to 1981, he waswith Northern Telecom Canada where he designedswitching-mode power supplies. Since 1989, he hasbeen with the Department of Electrical and Com-
puter Engineering, National Technical University of Athens, Athens, Greece,where he is currently a Full Professor, conducting research in the areas of powerelectronics and motor drives with more than 80 IEEE and IEE publications.
Dr. Manias is the Chapter Chair and the Founder of the Greece Section of theIEEE Industry Applications (IAS), IEEE Power Electronics (PELS), and IEEEIndustrial Electronics (IES) Societies, and a member of IEEE Motor DrivesCommittee. He is a Registered Professional Engineer in Canada and Europe.
This article has been accepted for inclusion in a future issue of this journal. Content is final as presented, with the exception of pagination.
1077-2618/16©2016IEEE
IEE
E I
nd
us
try
Ap
plI
cA
tIo
ns
MA
gA
zIn
E •
no
v|
dE
c 2
01
6 •
ww
w.I
EE
E.o
rg
/IA
s
2
A data-driven process controller for energy-efficient, variable-speed fan operation in marine vessels
By spyr Idon v. g IAnnoutsos & stEFAnos n. MAnIAs
he capacity of engine room (e/r) ventilation fans installed in
marine vessels is defined during the design stage based on the maximum air flow
required by the main engine (m/e), diesel generators (d/gs), and boilers. however,
the vessel’s operating profile at reduced m/e power and speed does not justify the use
of full capacities. in this article, a data-driven process controller is proposed to adjust the speed of
e/r ventilation fan motors according to the variation of combustion air-flow and heat emission
requirements to optimize energy efficiency during a ship’s seagoing and cargo operation periods. the
dynamics of the adaptive controller are established through parameter monitoring, regardless of the
model of the controlled plant. for the tanker vessel under investigation, a case study initially defines
IMPROVING ENGINE ROOM VENTILATION SYSTEMS
Digital Object Identifier 10.1109/MIAS.2015.2459088
Date of publication: 7 September 2016
T
This article has been accepted for inclusion in a future issue of this journal. Content is final as presented, with the exception of pagination.
IEE
E In
du
str
y A
pp
lIcA
tIon
s M
Ag
AzIn
E •
no
v|
dE
c 2
01
6 •
ww
w.IE
EE
.or
g/IA
s
3
the plant operational constraints and its power-saving potential. the proposed variable-frequency process con-trol topology is then applied as a retrofit installation to the existing 18.5-kW e/r fan motor starters. onboard experimental results show significant improvement in the vessel’s power balance, d/g fuel consumption, and level of emission factors [carbon dioxide (co2), sulfur dioxide (so2), and nitrogen oxides (nox)], validating the performance of the proposed control topology, which is implemented using commercial programmable logic controllers (plcs) and variable-frequency drive (vfd) units.
Methods of Fuel Consumption Efficiency With rising fuel prices, tighter regulations, and increasing environmental concerns, fuel consumption efficiency is a high priority for charter boat operators as well as for ship operators in the maritime industry. to optimize energy management, attempts to reconfigure the control of the onboard power system have been made in [1] and [2], while a waste heat recovery system was proposed in [3]. in addition, ships today adopt the slow steaming practice and operate the m/e at lower speeds, leading to varying flow requirements for the machinery associated with water cooling and air ventilation systems due to the need for derated capacities [4].
in [5]–[7], techno-economical studies suggest that the application of vfds to electric motors for flow regulation purposes can lead to significant energy sav-ings. options for vfd applications in marine vessels are provided in [8] and [9], while an energy-saving evaluation method for adjustable-speed-driven sea water cooling pumps is described in [10]. optimal vector control design methods for ventilation and pumping induction-motor systems are modeled and presented in [11] and [12], while a converter-based starting method associated with speed control for cen-trifugal loads has been reported in [13]. detailed analysis and performance evaluation of frequency con-trolled centrifugal fans and pumps subject to voltage variation and unbalance is also performed in [14]–[16]. however, the mentioned model-based approaches are limited to the control of the frequency converter and motor itself, based on sufficient quantitative knowledge being available. this is not often the case, especially in marine vessels where the flow regulation relies on varying process requirements, which depend on a ship’s operating profile.
to ensure reliability and safety in the modern indus-trial processes, data-driven methods have received con-siderable attention, particularly for process monitoring purposes [17]–[19]. these approaches can be catego-rized into pure data based, which include real-time sampling of state signals [20], iterative learning for con-troller tuning [21], and model-free adaptive approaches [22], as well as model-data integrated methodologies, which focus on automatic controller feedback tuning [23]. to this end, a self-tuned, data-driven process con-troller for energy-efficient, variable-speed pump opera-tion in a central cooling water system of marine vessels was designed and implemented in [24]. the results
showed significant improvement in energy and fuel consumption compared to existing approaches.
as an extension of the previous work, a data-driven process control topology is introduced in this article to adjust the speed of fan motors in e/r air ventilation sys-tems of marine vessels according to varying combustion and heat evacuation air-flow requirements to optimize process energy management. Based on proportional-inte-gral-differential (pid) control, the controller parameter adjustment is based on real-time pressure and temperature measurements from the process, which are used as feed-back signals to adapt to process constraints regardless of the controlled plant model. case study results are initially obtained from modeling the vessel’s e/r air ventilation system according to derated m/e and auxiliary machinery combustion and heat emission air-flow capacities, which
are related to slow steaming practices to examine the plant power-saving potential and determine the critical process parameters.
the proposed data-driven control topology for ener-gy-saving optimization of a vessel’s e/r ventilation sys-tem is implemented using a commercial plc, while a human–machine interface (hmi) is included for plant parameter monitoring. the proposed topology is applied as a retrofit installation to the existing e/r fan starters in a typical tanker vessel. experimental results show that controller dynamics are well established, lead-ing to significant energy savings as well as to d/g fuel consumption and emission factors reduction. power quality measurements are also performed to show that voltage distortion at point of common coupling (pcc) remains within acceptable levels required by marine classification societies.
Flow Regulation for Variable-Speed-Driven Fansfor the majority of e/r air ventilation systems installed in ships, the impeller of axial flow fans is supplied with the blades adjusted to the pitch angle b , corresponding to the design operating point. the total pressure increase in pascal ( )Pa pft, developed by an axial fan operating at its design point depends on the air-flow density in kilo-grams per cubic meter t, the rotational component imparted by the impeller uC , and the peripheral velocity of the impeller in meters per second .u however, both velocity components vary proportionally with the rota-tional speed in revolutions per minute n and the impel-ler diameter in meters d as shown in
( ) ( )u C nd nd n d# # # # # #? ?t t t= .p u2 2
ft (1)
the radial air volume flow in cubic meters per second q delivered by the fan at the impeller outlet for an axial impeller is given by
( / ) ( / ) ( )q d C d nd n d4 42 2 3# # #? ?r r= o (2)
since vC , which is the axial velocity in meters per second, is proportional to rotational speed and impeller diameter.
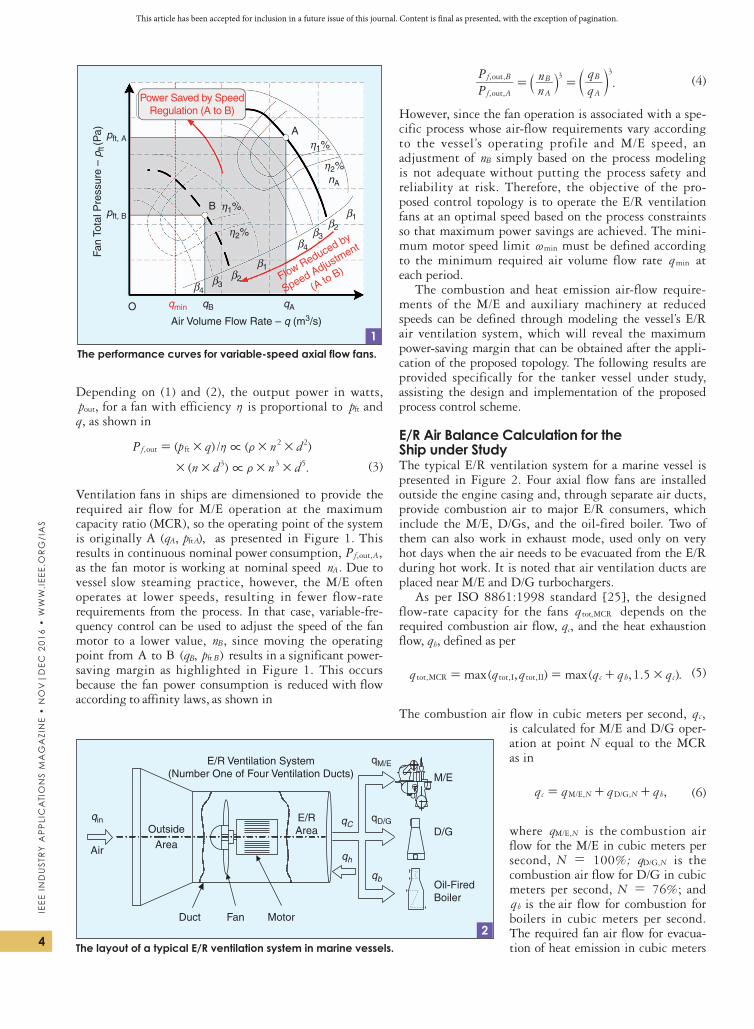
This article has been accepted for inclusion in a future issue of this journal. Content is final as presented, with the exception of pagination.
IEE
E I
nd
us
try
Ap
plI
cA
tIo
ns
MA
gA
zIn
E •
no
v|
dE
c 2
01
6 •
ww
w.I
EE
E.o
rg
/IA
s
4
depending on (1) and (2), the output power in watts, pout, for a fan with efficiency h is proportional to pft and q, as shown in
( ) / ( )
( ) .
P p q n d
n d n d
,f2 2
3 3 5
out ft # # #
# # # #
?
?
h t
t
=
(3)
ventilation fans in ships are dimensioned to provide the required air flow for m/e operation at the maximum capacity ratio (mcr), so the operating point of the system is originally a ,), pA ftA(q as presented in figure 1. this results in continuous nominal power consumption, ,P , ,f Aout as the fan motor is working at nominal speed An . due to
vessel slow steaming practice, however, the m/e often operates at lower speeds, resulting in fewer flow-rate requirements from the process. in that case, variable-fre-quency control can be used to adjust the speed of the fan motor to a lower value, Bn , since moving the operating point from a to B )ft, p BB(q results in a significant power-saving margin as highlighted in figure 1. this occurs because the fan power consumption is reduced with flow
according to affinity laws, as shown in
.PP
nn
, ,
, ,
f A
f B
A
B
A
B3 3
out
out= =` cj m (4)
however, since the fan operation is associated with a spe-cific process whose air-flow requirements vary according to the vessel’s operating profile and m/e speed, an adjustment of Bn simply based on the process modeling is not adequate without putting the process safety and reliability at risk. therefore, the objective of the pro-posed control topology is to operate the e/r ventilation fans at an optimal speed based on the process constraints so that maximum power savings are achieved. the mini-mum motor speed limit min~ must be defined according to the minimum required air volume flow rate qmin at each period.
the combustion and heat emission air-flow require-ments of the m/e and auxiliary machinery at reduced speeds can be defined through modeling the vessel’s e/r air ventilation system, which will reveal the maximum power-saving margin that can be obtained after the appli-cation of the proposed topology. the following results are provided specifically for the tanker vessel under study, assisting the design and implementation of the proposed process control scheme.
E/R Air Balance Calculation for the Ship under Studythe typical e/r ventilation system for a marine vessel is presented in figure 2. four axial flow fans are installed outside the engine casing and, through separate air ducts, provide combustion air to major e/r consumers, which include the m/e, d/gs, and the oil-fired boiler. two of them can also work in exhaust mode, used only on very hot days when the air needs to be evacuated from the e/r during hot work. it is noted that air ventilation ducts are placed near m/e and d/g turbochargers.
as per iso 8861:1998 standard [25], the designed flow-rate capacity for the fans q ,tot MCR depends on the required combustion air flow, qc, and the heat exhaustion flow, qh, defined as per
( , ) ( , . ).max maxq q q q q q1 5, , , c h ctot MCR tot I tot II #= = + (5)
the combustion air flow in cubic meters per second, ,qc is calculated for m/e and d/g oper-ation at point N equal to the mcr as in
,q q q q, ,c N N b/ /M E D G= + + (6)
where q ,NM/E is the combustion air flow for the m/e in cubic meters per second, N = 100%; ,ND/Gq is the
combustion air flow for d/g in cubic meters per second, N = 76%; and qb is the air flow for combustion for boilers in cubic meters per second. the required fan air flow for evacua-tion of heat emission in cubic meters
Fan
Tota
l Pre
ssur
e –
p ft(
Pa) pft, A
pft, B
Power Saved by SpeedRegulation (A to B)
Flow Reduced by
Speed Adjustment
(A to B)
B
A
η1%
η1%
η2%
η2%
β4β3
β2
β1
β4
β3β2
β1
nA
O qmin qB qA
Air Volume Flow Rate – q (m3/s)
The performance curves for variable-speed axial flow fans.1
M/E
D/G
Oil-FiredBoiler
Air
Duct MotorFan
Outside
Area
E/RArea
E/R Ventilation System(Number One of Four Ventilation Ducts)
qin
qh
qC
qb
qD/G
qM/E
The layout of a typical E/R ventilation system in marine vessels.2
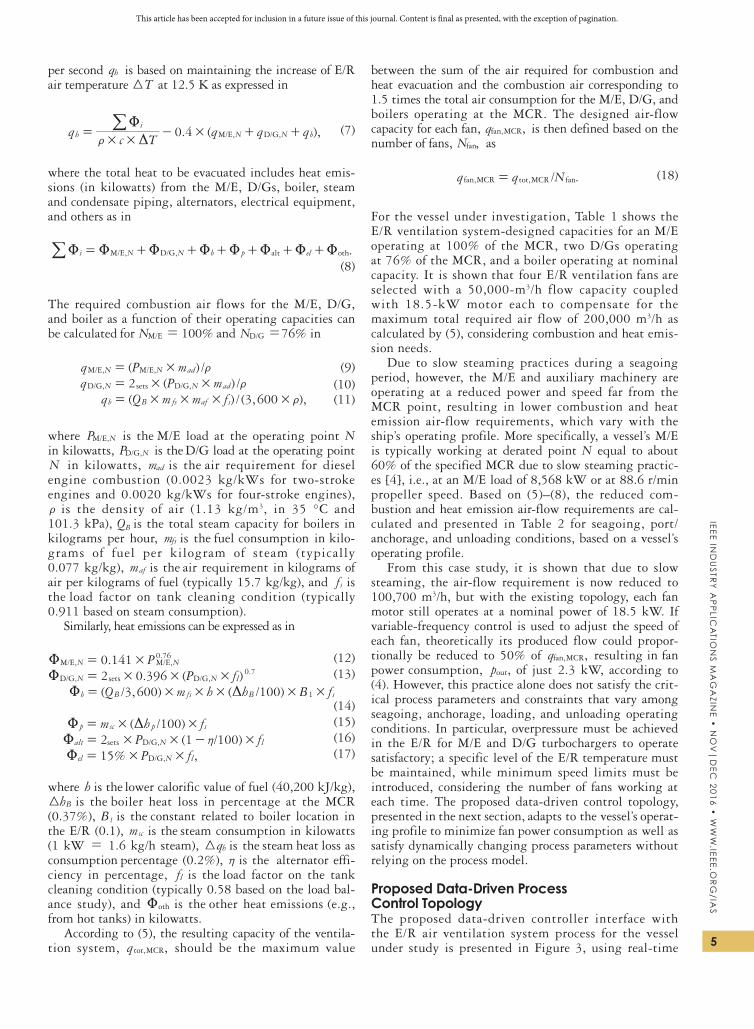
This article has been accepted for inclusion in a future issue of this journal. Content is final as presented, with the exception of pagination.
IEE
E In
du
str
y A
pp
lIcA
tIon
s M
Ag
AzIn
E •
no
v|
dE
c 2
01
6 •
ww
w.IE
EE
.or
g/IA
s
5
per second hq is based on maintaining the increase of e/r air temperature T3 at 12.5 K as expressed in
. ( ),qc T
q q q0 4 , ,hi
N N b/ /M E D G# #
#t D
U= - + +/ (7)
where the total heat to be evacuated includes heat emis-sions (in kilowatts) from the m/e, d/gs, boiler, steam and condensate piping, alternators, electrical equipment, and others as in
., ,i N N b p el/ /M E D G alt othU U U U U U U U= + + + + + +/
(8)
the required combustion air flows for the m/e, d/g, and boiler as a function of their operating capacities can be calculated for NM/E= 100% and ND/G=76% in
( ) /q P m, ,N N ad/ /M E M E # t= (9) ( ) /q P m2, ,N N ad/ /D G sets D G# # t= (10) ( ) / ( , ),q Q m m f 3 600b B fs af s# # # # t= (11)
where P ,NM/E is the m/e load at the operating point N in kilowatts, P ,ND/G is the d/g load at the operating point N in kilowatts, mad is the air requirement for diesel engine combustion (0.0023 kg/kWs for two-stroke engines and 0.0020 kg/kWs for four-stroke engines), t is the density of air (1.13 kg/m3, in 35 °c and 101.3 kpa), QB is the total steam capacity for boilers in kilograms per hour, mfs is the fuel consumption in kilo-grams of fuel per kilogram of steam (typically 0.077 kg/kg), maf is the air requirement in kilograms of air per kilograms of fuel (typically 15.7 kg/kg), and fs is the load factor on tank cleaning condition (typically 0.911 based on steam consumption).
similarly, heat emissions can be expressed as in
. P0 141, ,.
N N0 76
/ /M E M E#U = (12). ( )P f2 0 396, ,
.N N l
0 7/ /D G sets D G# # #U = (13) ( / , ) ( / )Q m h h B f3 600 100b B fs B s1# # # # #U D=
(14) ( / )m h f100p sc p s# #U D= (15) sets ( / )P f2 1 100,alt N l/D G# # #hU = - (16) % ,P f15 ,el N l/D G# #U = (17)
where h is the lower calorific value of fuel (40,200 kJ/kg), Bh3 is the boiler heat loss in percentage at the mcr
(0.37%), B1 is the constant related to boiler location in the e/r (0.1), msc is the steam consumption in kilowatts (1 kW = 1.6 kg/h steam), hq3 is the steam heat loss as
consumption percentage (0.2%), h is the alternator effi-ciency in percentage, fl is the load factor on the tank cleaning condition (typically 0.58 based on the load bal-ance study), and othU is the other heat emissions (e.g., from hot tanks) in kilowatts.
according to (5), the resulting capacity of the ventila-tion system, ,q ,tot MCR should be the maximum value
between the sum of the air required for combustion and heat evacuation and the combustion air corresponding to 1.5 times the total air consumption for the m/e, d/g, and boilers operating at the mcr. the designed air-flow capacity for each fan, ,q ,MCRfan is then defined based on the number of fans, ,Nfan as
/ .q q N, ,fan MCR tot MCR fan= (18)
for the vessel under investigation, table 1 shows the e/r ventilation system-designed capacities for an m/e operating at 100% of the mcr, two d/gs operating at 76% of the mcr, and a boiler operating at nominal capacity. it is shown that four e/r ventilation fans are
selected with a 50,000-m3/h flow capacity coupled with 18.5-kW motor each to compensate for the maximum total required air flow of 200,000 m3/h as calculated by (5), considering combustion and heat emi s -sion needs.
due to slow steaming practices during a seagoing period, however, the m/e and auxiliary machinery are operating at a reduced power and speed far from the mcr point, resulting in lower combustion and heat emission air-flow requirements, which vary with the ship’s operating profile. more specifically, a vessel’s m/e is typically working at derated point N equal to about 60% of the specified mcr due to slow steaming practic-es [4], i.e., at an m/e load of 8,568 kW or at 88.6 r/min propeller speed. Based on (5)–(8), the reduced com-bustion and heat emission air-flow requirements are cal-culated and presented in table 2 for seagoing, port/anchorage, and unloading conditions, based on a vessel’s operating profile.
from this case study, it is shown that due to slow steaming, the air-flow requirement is now reduced to 100,700 m3/h, but with the existing topology, each fan motor still operates at a nominal power of 18.5 kW. if variable-frequency control is used to adjust the speed of each fan, theoretically its produced flow could propor-tionally be reduced to 50% of ,q ,MCRfan resulting in fan
power consumption, pout, of just 2.3 kW, according to (4). however, this practice alone does not satisfy the crit-ical process parameters and constraints that vary among seagoing, anchorage, loading, and unloading operating conditions. in particular, overpressure must be achieved in the e/r for m/e and d/g turbochargers to operate satisfactory; a specific level of the e/r temperature must
be maintained, while minimum speed limits must be introduced, considering the number of fans working at each time. the proposed data-driven control topology, presented in the next section, adapts to the vessel’s operat-ing profile to minimize fan power consumption as well as satisfy dynamically changing process parameters without relying on the process model.
Proposed Data-Driven Process Control Topologythe proposed data-driven controller interface with the e/r air ventilation system process for the vessel under study is presented in figure 3, using real-time
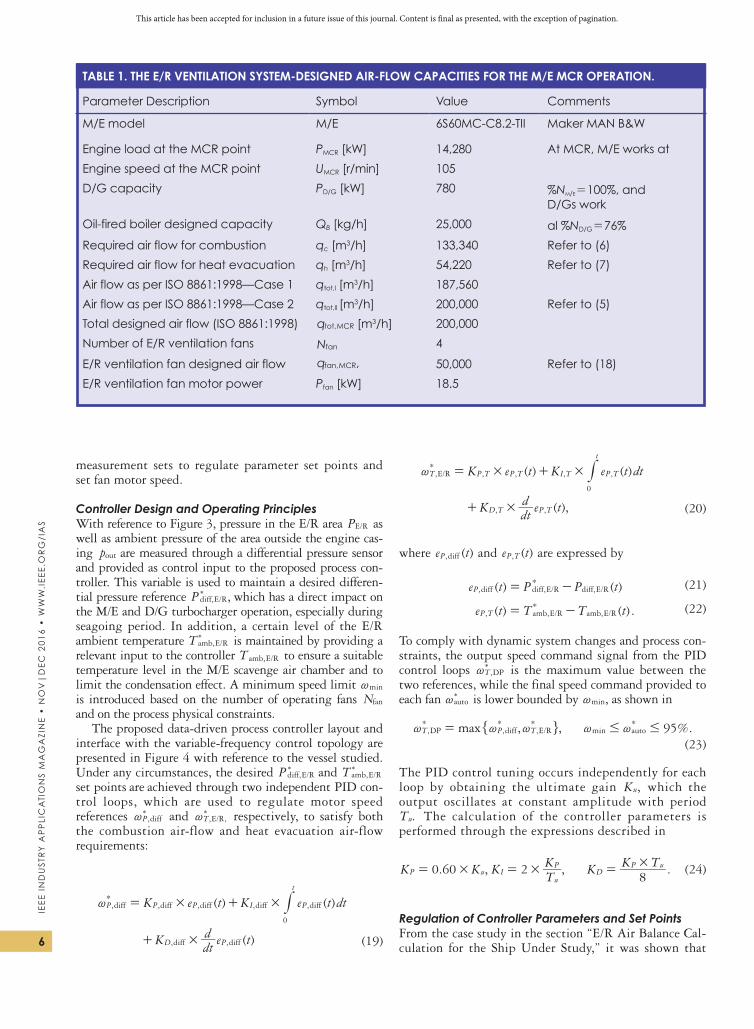
This article has been accepted for inclusion in a future issue of this journal. Content is final as presented, with the exception of pagination.
IEE
E I
nd
us
try
Ap
plI
cA
tIo
ns
MA
gA
zIn
E •
no
v|
dE
c 2
01
6 •
ww
w.I
EE
E.o
rg
/IA
s
6
measurement sets to regulate parameter set points and set fan motor speed.
Controller Design and Operating PrinciplesWith reference to figure 3, pressure in the e/r area PE/R as well as ambient pressure of the area outside the engine cas-ing pout are measured through a differential pressure sensor and provided as control input to the proposed process con-troller. this variable is used to maintain a desired differen-tial pressure reference ,P ,diff E/R
) which has a direct impact on the m/e and d/g turbocharger operation, especially during seagoing period. in addition, a certain level of the e/r ambient temperature T ,amb E/R
) is maintained by providing a relevant input to the controller T ,amb E/R to ensure a suitable temperature level in the m/e scavenge air chamber and to limit the condensation effect. a minimum speed limit min~ is introduced based on the number of operating fans Nfan and on the process physical constraints.
the proposed data-driven process controller layout and interface with the variable-frequency control topology are presented in figure 4 with reference to the vessel studied. Under any circumstances, the desired P ,diff E/R
) and T ,amb E/R
)
set points are achieved through two independent pid con-trol loops, which are used to regulate motor speed references ,P diff~
) and , ,T E/R~) respectively, to satisfy both
the combustion air-flow and heat evacuation air-flow requirements:
( )K e t#+
( ) ( )
K e t K e t dt
dtd
, , , , ,
, ,
*P P P I P
t
D P
0
diff diff diff diff diff
diff diff
# #~ = + #
(19)
( ),K e t#+
( ) ( )
K e t K e t dt
dtd
, , , , ,
, ,
*T P T P T I T P T
t
D T P T
0
/E R # #~ = + #
(20)
where ( )te ,P diff and ( )e t,P T are expressed by
( ) ( )e t P P t, ,*
,P / /diff diff E R diff E R= - (21)
( ) ( ) .e t T T t, ,*
,P T / /amb E R amb E R= - (22)
to comply with dynamic system changes and process con-straints, the output speed command signal from the pid control loops ,T DP~
) is the maximum value between the two references, while the final speed command provided to each fan auto~
) is lower bounded by min~ , as shown in
, , %.max 95,*
,*
,* *
minT P T /DP diff E R auto# #~ ~ ~ ~ ~= " ,
(23)
the pid control tuning occurs independently for each loop by obtaining the ultimate gain ,Ku which the output oscillates at constant amplitude with period
.Tu the calculation of the controller parameters is performed through the expressions described in
. , , .K K KTK K K T0 60 2
8P u Iu
PD
P u# # #= = = (24)
Regulation of Controller Parameters and Set Pointsfrom the case study in the section “e/r air Balance cal-culation for the ship Under study,” it was shown that
TABLE 1. THE E/R VENTILATION SYSTEM-DESIGNED AIR-FLOW CAPACITIES FOR THE M/E MCR OPERATION.
Parameter Description Symbol value Comments
M/E model M/E 6s60Mc-c8.2-tII Maker MAn B&w
Engine load at the MCR point PMCR [kw] 14,280 At MCR, M/E works at
Engine speed at the MCR point UMCR [r/min] 105
D/G capacity PD/G [kw] 780 %Nm/e=100%, and D/Gs work
Oil-fired boiler designed capacity QB [kg/h] 25,000 al %ND/G=76%
required air flow for combustion qc [m3/h] 133,340 Refer to (6)
required air flow for heat evacuation qh [m3/h] 54,220 Refer to (7)
Air flow as per ISO 8861:1998—Case 1 qtot,I [m3/h] 187,560
Air flow as per ISO 8861:1998—Case 2 qtot,II [m3/h] 200,000 Refer to (5)
Total designed air flow (ISO 8861:1998) q ,MCRtot [m3/h] 200,000
number of E/r ventilation fans Nfan 4
E/R ventilation fan designed air flow ,q ,fan MCR 50,000 Refer to (18)
E/R ventilation fan motor power Pfan [kw] 18.5
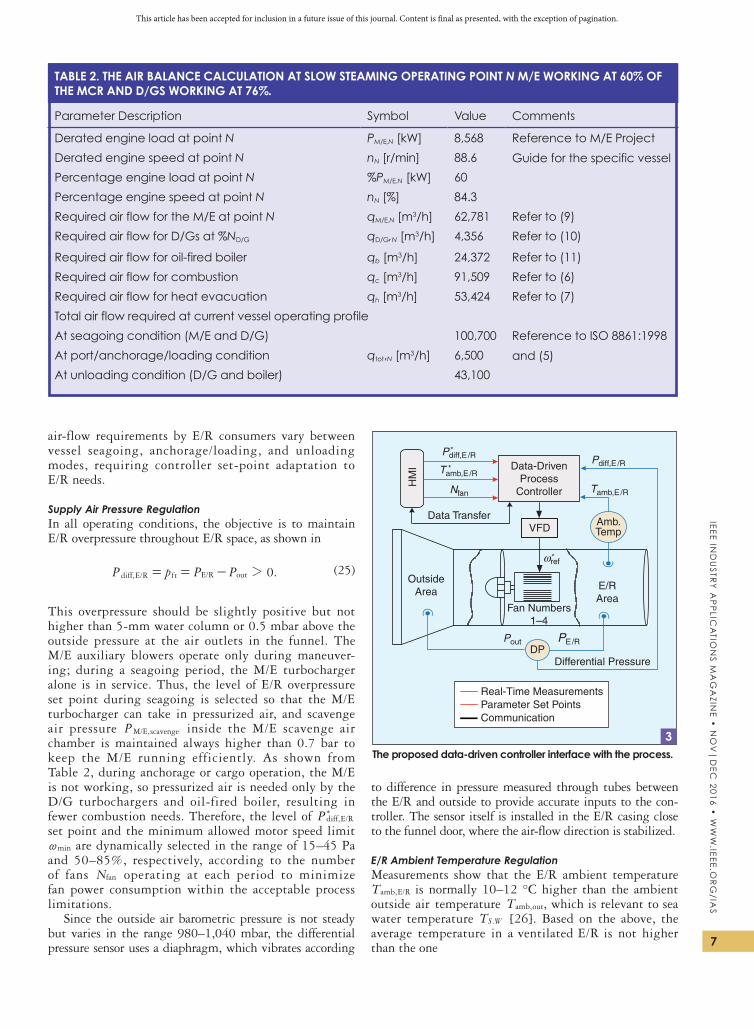
This article has been accepted for inclusion in a future issue of this journal. Content is final as presented, with the exception of pagination.
IEE
E In
du
str
y A
pp
lIcA
tIon
s M
Ag
AzIn
E •
no
v|
dE
c 2
01
6 •
ww
w.IE
EE
.or
g/IA
s
7
air-flow requirements by e/r consumers vary between vessel seagoing, anchorage/loading, and unloading modes, requiring controller set-point adaptation to e/r needs.
Supply Air Pressure Regulationin all operating conditions, the objective is to maintain e/r overpressure throughout e/r space, as shown in
.P p P P 0, / /diff E R f E R out 2= = -t (25)
this overpressure should be slightly positive but not higher than 5-mm water column or 0.5 mbar above the outside pressure at the air outlets in the funnel. the m/e auxiliary blowers operate only during maneuver-ing; during a seagoing period, the m/e turbocharger alone is in service. thus, the level of e/r overpressure set point during seagoing is selected so that the m/e turbocharger can take in pressurized air, and scavenge air pressure P ,M/E scavenge inside the m/e scavenge air chamber is maintained always higher than 0.7 bar to keep the m/e running efficiently. as shown from table 2, during anchorage or cargo operation, the m/e is not working, so pressurized air is needed only by the d/g turbochargers and oil-fired boiler, resulting in fewer combustion needs. therefore, the level of P ,diff E/R
) set point and the minimum allowed motor speed limit
min~ are dynamically selected in the range of 15–45 pa and 50–85%, respectively, according to the number of fans Nfan operating at each period to minimize fan power consumption within the acceptable process limitations.
since the outside air barometric pressure is not steady but varies in the range 980–1,040 mbar, the differential pressure sensor uses a diaphragm, which vibrates according
to difference in pressure measured through tubes between the e/r and outside to provide accurate inputs to the con-troller. the sensor itself is installed in the e/r casing close to the funnel door, where the air-flow direction is stabilized.
E/R Ambient Temperature Regulationmeasurements show that the e/r ambient temperature T ,amb E/R is normally 10–12 °c higher than the ambient outside air temperature T ,amb out, which is relevant to sea
water temperature T .S W [26]. Based on the above, the average temperature in a ventilated e/r is not higher
than the one
TABLE 2. THE AIR BALANCE CALCULATION AT SLOW STEAMING OPERATING POINT N M/E WORKING AT 60% OF THE MCR AND D/GS WORKING AT 76%.
Parameter Description Symbol value Comments
Derated engine load at point N PM/E,N [kw] 8,568 Reference to M/E Project
guide for the specific vesselDerated engine speed at point N nN [r/min] 88.6
Percentage engine load at point N %PM/E,N [kw] 60
Percentage engine speed at point N nN [%] 84.3
required air flow for the M/E at point N qM/E,N [m3/h] 62,781 Refer to (9)
required air flow for d/gs at %ND/G qD/G,N [m3/h] 4,356 Refer to (10)
required air flow for oil-fired boiler qb [m3/h] 24,372 Refer to (11)
required air flow for combustion qc [m3/h] 91,509 Refer to (6)
required air flow for heat evacuation qh [m3/h] 53,424 Refer to (7)
total air flow required at current vessel operating profile
At seagoing condition (M/E and D/G) 100,700 Reference to ISO 8861:1998
and (5)At port/anchorage/loading condition qtot,N [m3/h] 6,500
At unloading condition (d/g and boiler) 43,100
Data-DrivenProcess
Controller
VFD
E/RArea
OutsideArea
DP
Amb.Temp
Real-Time MeasurementsParameter Set PointsCommunication
HM
I
Differential Pressure
Fan Numbers1–4
Data Transfer
Pdiff,E /R*
Pdiff,E /RTamb,E/R
*
Tamb,E/RNfan
ωref*
PE/RPout
The proposed data-driven controller interface with the process.3
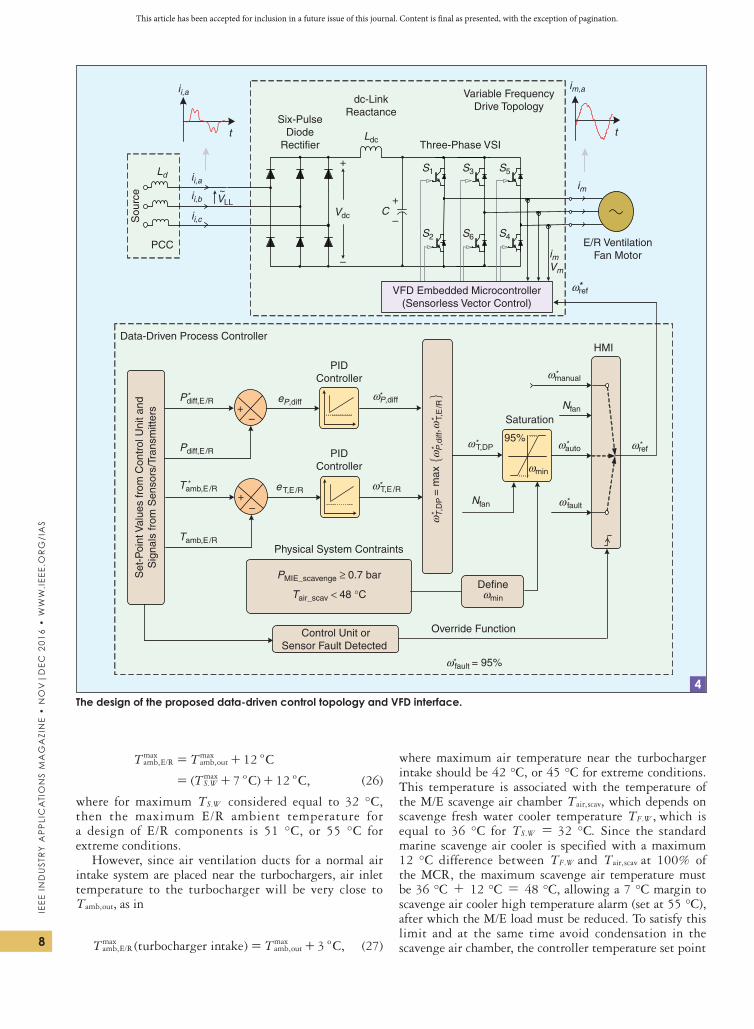
This article has been accepted for inclusion in a future issue of this journal. Content is final as presented, with the exception of pagination.
IEE
E I
nd
us
try
Ap
plI
cA
tIo
ns
MA
gA
zIn
E •
no
v|
dE
c 2
01
6 •
ww
w.I
EE
E.o
rg
/IA
s
8
( ) ,
T T
T
12
7 12
C
C C
, ,
.
max max
maxS W
/amb E R amb outo
o o
= +
= + +
(26)
where for maximum T .S W considered equal to 32 °c, then the maximum e/r ambient temperature for a design of e/r components is 51 °c, or 55 °c for extreme conditions.
however, since air ventilation ducts for a normal air intake system are placed near the turbochargers, air inlet temperature to the turbocharger will be very close to T ,amb out, as in
take( ) ,T Tturbocharger in 3 C, ,max max
/amb E R amb outo= + (27)
where maximum air temperature near the turbocharger intake should be 42 °c, or 45 °c for extreme conditions. this temperature is associated with the temperature of the m/e scavenge air chamber T ,air scav, which depends on scavenge fresh water cooler temperature T .WF , which is
equal to 36 °c for T .S W = 32 °c. since the standard marine scavenge air cooler is specified with a maximum 12 °c difference between T .WF and T ,air scav at 100% of the mcr, the maximum scavenge air temperature must be 36 °c + 12 °c = 48 °c, allowing a 7 °c margin to scavenge air cooler high temperature alarm (set at 55 °c), after which the m/e load must be reduced. to satisfy this limit and at the same time avoid condensation in the scavenge air chamber, the controller temperature set point
Ldc
CVdc
+
–
Three-Phase VSI
im
imVm
S1
S2
S3
S6
S5
S4E/R Ventilation
Fan Motor
Six-PulseDiode
Rectifier
Ld
Sou
rce
Variable FrequencyDrive Topology
+
–
ii,a
ii,b
ii,c
ii,a
t
VFD Embedded Microcontroller(Sensorless Vector Control)
dc-LinkReactance
~
PCC
im,a
t
–+
95%
Set
-Poi
nt V
alue
s fr
om C
ontr
ol U
nit a
ndS
igna
ls fr
om S
enso
rs/T
rans
mitt
ers
–+
Control Unit orSensor Fault Detected
Override Function
Physical System Contraints
Data-Driven Process Controller
PIDController
PIDController
Saturation
HMI
VLL
ωref*
Pdiff,E /R*
Pdiff,E /R
Tamb,E/R*
Tamb,E/R
eP,diff
eT,E/R
ωP,diff*
ωT,E/R*
ωauto*
ω fault*
*ω fault = 95%
ωmanual*
ωref*
ωmin
Defineωmin
ωT,DP*
Nfan
Nfan
PMIE_scavenge ≥ 0.7 bar
Tair_scav < 48 °C
ωP
,diff
, *
ωT
,DP
= m
ax
*ω
T,E
/R*
The design of the proposed data-driven control topology and VFD interface.4
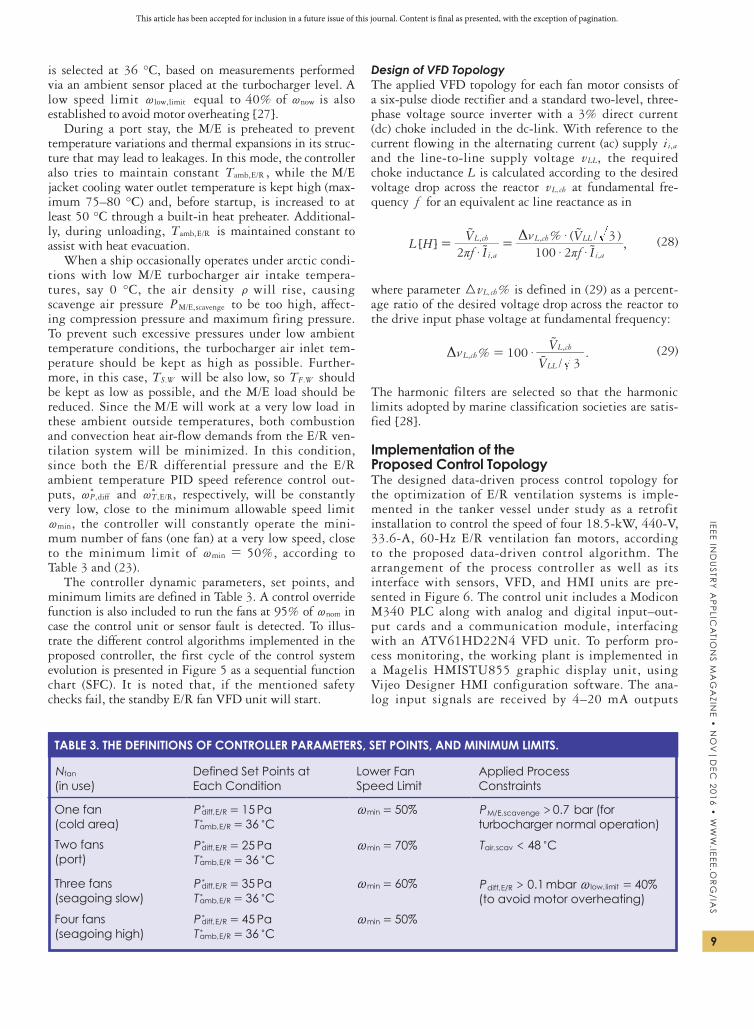
This article has been accepted for inclusion in a future issue of this journal. Content is final as presented, with the exception of pagination.
IEE
E In
du
str
y A
pp
lIcA
tIon
s M
Ag
AzIn
E •
no
v|
dE
c 2
01
6 •
ww
w.IE
EE
.or
g/IA
s
9
is selected at 36 °c, based on measurements performed via an ambient sensor placed at the turbocharger level. a low speed limit it,limlow~ equal to 40% of now~ is also
established to avoid motor overheating [27].during a port stay, the m/e is preheated to prevent
temperature variations and thermal expansions in its struc-ture that may lead to leakages. in this mode, the controller also tries to maintain constant T ,amb E/R , while the m/e
jacket cooling water outlet temperature is kept high (max-imum 75–80 °c) and, before startup, is increased to at least 50 °c through a built-in heat preheater. additional-ly, during unloading, T ,amb E/R is maintained constant to assist with heat evacuation.
When a ship occasionally operates under arctic condi-tions with low m/e turbocharger air intake tempera-tures, say 0 °c, the air density t will rise, causing scavenge air pressure P ,M/E scavenge to be too high, affect-ing compression pressure and maximum firing pressure. to prevent such excessive pressures under low ambient temperature conditions, the turbocharger air inlet tem-perature should be kept as high as possible. further-more, in this case, T .S W will be also low, so T .WF should be kept as low as possible, and the m/e load should be reduced. since the m/e will work at a very low load in
these ambient outside temperatures, both combustion and convection heat air-flow demands from the e/r ven-tilation system will be minimized. in this condition, since both the e/r differential pressure and the e/r ambient temperature pid speed reference control out-puts, ,P diff~
) and ,,T E/R~) respectively, will be constantly
very low, close to the minimum allowable speed limit min~ , the controller will constantly operate the mini-
mum number of fans (one fan) at a very low speed, close to the minimum limit of min~ = 50%, according to table 3 and (23).
the controller dynamic parameters, set points, and minimum limits are defined in table 3. a control override function is also included to run the fans at 95% of nom~ in case the control unit or sensor fault is detected. to illus-trate the different control algorithms implemented in the proposed controller, the first cycle of the control system evolution is presented in figure 5 as a sequential function chart (sfc). it is noted that, if the mentioned safety checks fail, the standby e/r fan vfd unit will start.
Design of VFD Topologythe applied vfd topology for each fan motor consists of a six-pulse diode rectifier and a standard two-level, three-phase voltage source inverter with a 3% direct current (dc) choke included in the dc-link. With reference to the current flowing in the alternating current (ac) supply i ,i a and the line-to-line supply voltage ,vLL the required choke inductance L is calculated according to the desired voltage drop across the reactor v ,L ch at fundamental fre-quency f for an equivalent ac line reactance as in
[ ]% ( / )
,L Hf IV
f IV
2 100 23
,
,
,
,
i a
L ch
i a
L ch LL
$ $ $$
r r
oD= =uu
uu
(28)
where parameter %v ,L ch3 is defined in (29) as a percent-age ratio of the desired voltage drop across the reactor to the drive input phase voltage at fundamental frequency:
%/
.VV
1003
,,
LLL
Lch
ch$oD =u
u (29)
the harmonic filters are selected so that the harmonic limits adopted by marine classification societies are satis-fied [28].
Implementation of the Proposed Control Topologythe designed data-driven process control topology for the optimization of e/r ventilation systems is imple-mented in the tanker vessel under study as a retrofit installation to control the speed of four 18.5-kW, 440-v, 33.6-a, 60-hz e/r ventilation fan motors, according to the proposed data-driven control algorithm. the arrangement of the process controller as well as its interface with sensors, vfd, and hmi units are pre-sented in figure 6. the control unit includes a modicon m340 plc along with analog and digital input–out-put cards and a communication module, interfacing with an atv61hd22n4 vfd unit. to perform pro-cess monitoring, the working plant is implemented in a magelis hmistU855 graphic display unit, using vijeo designer hmi configuration software. the ana-log input signals are received by 4–20 ma outputs
TABLE 3. THE DEFINITIONS OF CONTROLLER PARAMETERS, SET POINTS, AND MINIMUM LIMITS.
Nfan
(in use)Defined Set Points at Each Condition
lower Fan Speed Limit
Applied Process Constraints
One fan (cold area)
P 15Pa,diff E/R =)
T 36 C,amb E/R c=)
%50min~ = .P 0 7>,M/E scavenge bar (for turbocharger normal operation)
Two fans (port)
P 25Pa,diff E/R =)
T 36 C,amb E/R c=)
%07min~ = T 48 C<,air scav c
Three fans (seagoing slow)
P 35Pa,diff E/R =)
T 36 C,amb E/R c=)
%06min~ = .P 0 1>,diff E/R mbar it %40,limlow~ = (to avoid motor overheating)
Four fans (seagoing high)
P 45Pa,diff E/R =)
T 36 C,amb E/R c=)
%05min~ =
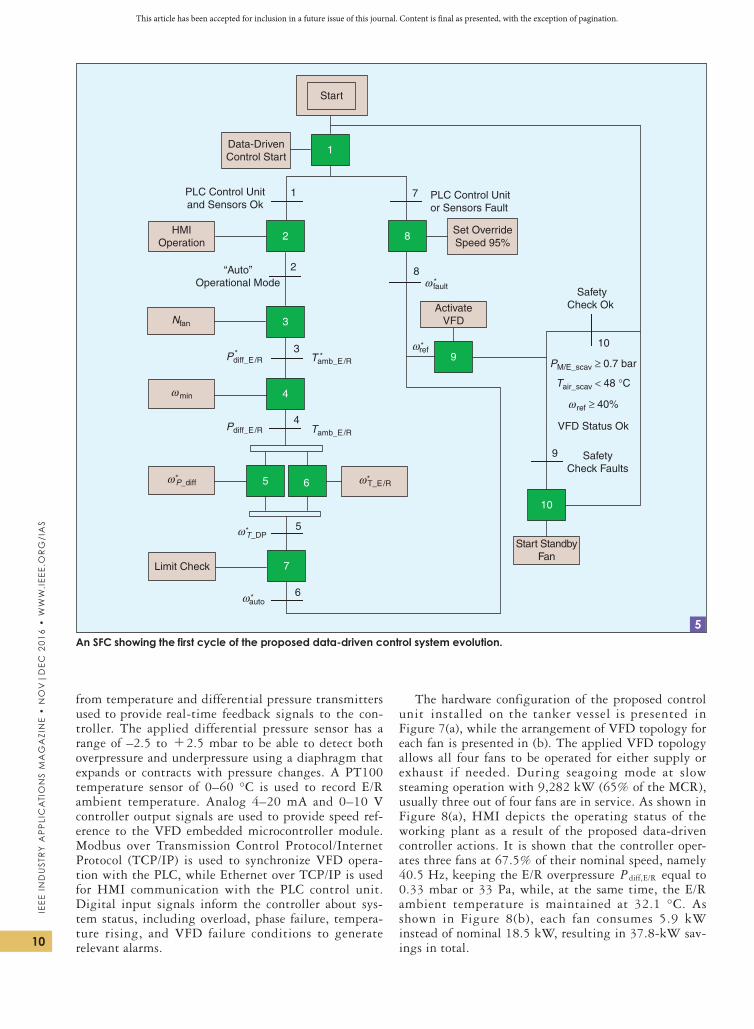
This article has been accepted for inclusion in a future issue of this journal. Content is final as presented, with the exception of pagination.
IEE
E I
nd
us
try
Ap
plI
cA
tIo
ns
MA
gA
zIn
E •
no
v|
dE
c 2
01
6 •
ww
w.I
EE
E.o
rg
/IA
s
10
from temperature and differential pressure transmitters used to provide real-time feedback signals to the con-troller. the applied differential pressure sensor has a range of –2.5 to +2.5 mbar to be able to detect both overpressure and underpressure using a diaphragm that expands or contracts with pressure changes. a pt100 temperature sensor of 0–60 °c is used to record e/r ambient temperature. analog 4–20 ma and 0–10 v controller output signals are used to provide speed ref-erence to the vfd embedded microcontroller module. modbus over transmission control protocol/internet protocol (tcp/ip) is used to synchronize vfd opera-tion with the plc, while ethernet over tcp/ip is used for hmi communication with the plc control unit. digital input signals inform the controller about sys-tem status, including overload, phase failure, tempera-ture rising, and vfd failure conditions to generate relevant alarms.
the hardware configuration of the proposed control unit installed on the tanker vessel is presented in figure 7(a), while the arrangement of vfd topology for each fan is presented in (b). the applied vfd topology allows all four fans to be operated for either supply or exhaust if needed. during seagoing mode at slow steaming operation with 9,282 kW (65% of the mcr), usually three out of four fans are in service. as shown in figure 8(a), hmi depicts the operating status of the working plant as a result of the proposed data-driven controller actions. it is shown that the controller oper-ates three fans at 67.5% of their nominal speed, namely 40.5 hz, keeping the e/r overpressure P ,diff E/R equal to 0.33 mbar or 33 pa, while, at the same time, the e/r ambient temperature is maintained at 32.1 °c. as shown in figure 8(b), each fan consumes 5.9 kW instead of nominal 18.5 kW, resulting in 37.8-kW sav-ings in total.
Start
1Data-DrivenControl Start
1 7PLC Control Unitand Sensors Ok
PLC Control Unitor Sensors Fault
2HMIOperation
8 Set OverrideSpeed 95%
9
ActivateVFD
“Auto”Operational Mode
Start StandbyFan
SafetyCheck Ok
VFD Status Ok
SafetyCheck Faults
3
4
5 6
10
2
3
4
5
8
9
10
7Limit Check
6
Nfan
Pdiff_E/R*
Pdiff_E/R
ωP_diff*
ωmin
ω T_DP*
ω T_E/R*
Tamb_E/R*
Tamb_E/R
ωauto*
ω fault*
ωref*
PM/E_scav ≥ 0.7 bar
ω ref ≥ 40%
Tair_scav < 48 °C
An SFC showing the first cycle of the proposed data-driven control system evolution.5
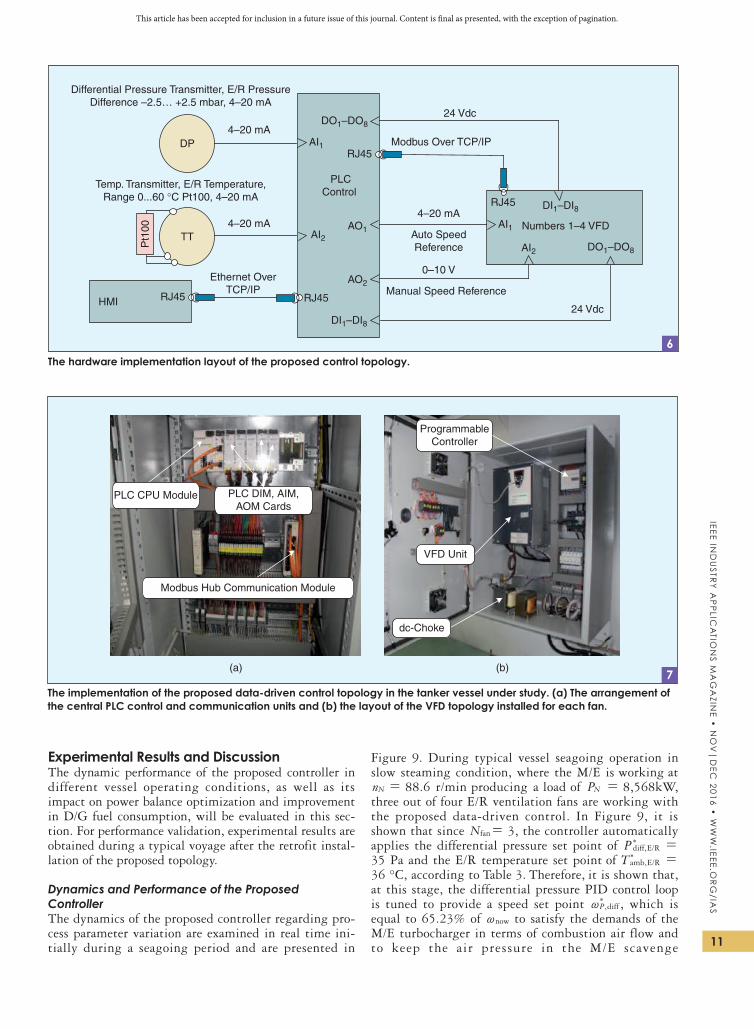
This article has been accepted for inclusion in a future issue of this journal. Content is final as presented, with the exception of pagination.
IEE
E In
du
str
y A
pp
lIcA
tIon
s M
Ag
AzIn
E •
no
v|
dE
c 2
01
6 •
ww
w.IE
EE
.or
g/IA
s
11
Experimental Results and Discussionthe dynamic performance of the proposed controller in different vessel operating conditions, as well as its impact on power balance optimization and improvement in d/g fuel consumption, will be evaluated in this sec-tion. for performance validation, experimental results are obtained during a typical voyage after the retrofit instal-lation of the proposed topology.
Dynamics and Performance of the Proposed Controllerthe dynamics of the proposed controller regarding pro-cess parameter variation are examined in real time ini-tially during a seagoing period and are presented in
figure 9. during typical vessel seagoing operation in slow steaming condition, where the m/e is working at
nN = 88.6 r/min producing a load of PN = 8,568kW, three out of four e/r ventilation fans are working with the proposed data-driven control. in figure 9, it is shown that since Nfan= 3, the controller automatically
applies the differential pressure set point of P ,diff E/R)
=
35 pa and the e/r temperature set point of T ,amb E/R)
=
36 °c, according to table 3. therefore, it is shown that, at this stage, the differential pressure pid control loop is tuned to provide a speed set point ,P diff~
) , which is equal to 65.23% of now~ to satisfy the demands of the m/e turbocharger in terms of combustion air flow and to keep the air pressure in the m/e scavenge
PLCControl
DP
TT
Pt1
00 Numbers 1–4 VFD
Differential Pressure Transmitter, E/R PressureDifference –2.5… +2.5 mbar, 4–20 mA
Temp. Transmitter, E/R Temperature,Range 0...60 °C Pt100, 4–20 mA
Auto SpeedReference
Modbus Over TCP/IPAI1
AI2AO1
AO2Ethernet Over
TCP/IPRJ45
RJ45
RJ45
4–20 mA
4–20 mA4–20 mA
RJ45
DO1–DO824 Vdc
DI1–DI8
DI1–DI8
DO1–DO8
24 VdcHMI
AI2
AI1
0–10 V
Manual Speed Reference
The hardware implementation layout of the proposed control topology.6
PLC CPU Module PLC DIM, AIM,AOM Cards
ProgrammableController
VFD Unit
dc-Choke
(a) (b)
Modbus Hub Communication Module
The implementation of the proposed data-driven control topology in the tanker vessel under study. (a) The arrangement of the central PLC control and communication units and (b) the layout of the VFD topology installed for each fan.
7
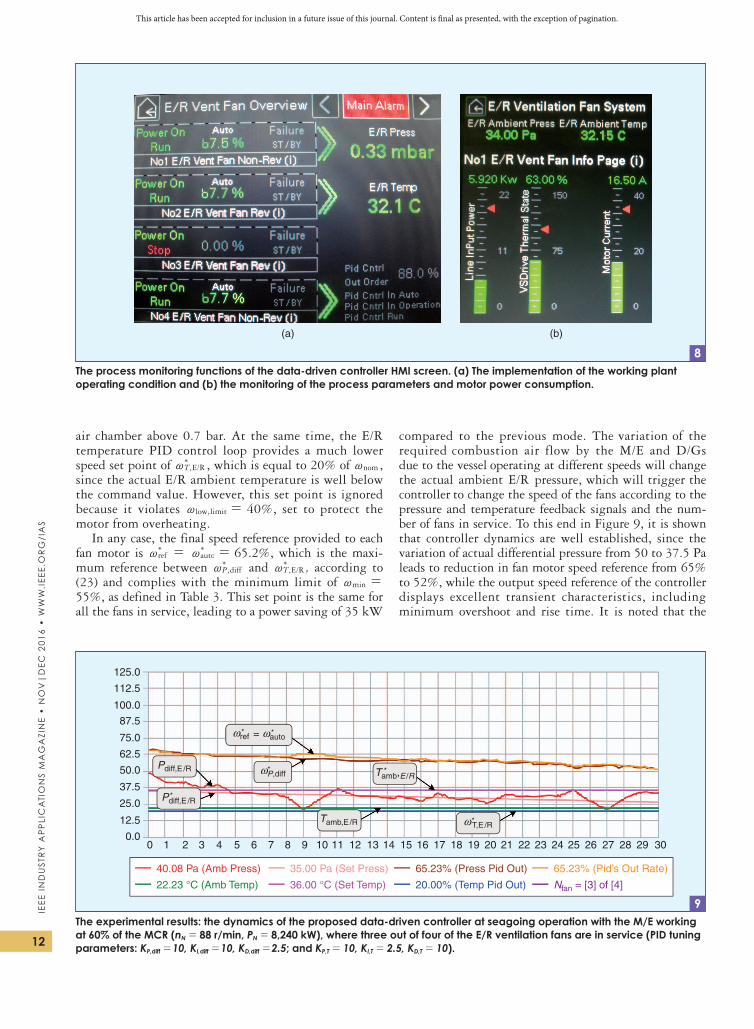
This article has been accepted for inclusion in a future issue of this journal. Content is final as presented, with the exception of pagination.
IEE
E I
nd
us
try
Ap
plI
cA
tIo
ns
MA
gA
zIn
E •
no
v|
dE
c 2
01
6 •
ww
w.I
EE
E.o
rg
/IA
s
12
air chamber above 0.7 bar. at the same time, the e/r temperature pid control loop provides a much lower speed set point of ,T E/R~
) , which is equal to 20% of nom~ , since the actual e/r ambient temperature is well below the command value. however, this set point is ignored because it violates it,limlow~ = 40%, set to protect the motor from overheating.
in any case, the final speed reference provided to each fan motor is ref~
) = auto~
) = 65.2%, which is the maxi-
mum reference between ,P diff~) and ,T E/R~
) , according to (23) and complies with the minimum limit of min~ =
55%, as defined in table 3. this set point is the same for all the fans in service, leading to a power saving of 35 kW
compared to the previous mode. the variation of the
required combustion air flow by the m/e and d/gs due to the vessel operating at different speeds will change the actual ambient e/r pressure, which will trigger the
controller to change the speed of the fans according to the pressure and temperature feedback signals and the num-ber of fans in service. to this end in figure 9, it is shown that controller dynamics are well established, since the variation of actual differential pressure from 50 to 37.5 pa leads to reduction in fan motor speed reference from 65% to 52%, while the output speed reference of the controller displays excellent transient characteristics, including minimum overshoot and rise time. it is noted that the
(a) (b)
The process monitoring functions of the data-driven controller HMI screen. (a) The implementation of the working plant operating condition and (b) the monitoring of the process parameters and motor power consumption.
8
125.0
112.5
100.0
87.5
75.0
62.5
50.0
37.5
25.0
12.5
0.00 1 2 3 4 5 6 7 8 9 10 11 12 13 14 15 16 17 18 19 20 21 22 23 24 25 26 27 28 29 30
40.08 Pa (Amb Press)
22.23 °C (Amb Temp)
35.00 Pa (Set Press)
36.00 °C (Set Temp)
65.23% (Press Pid Out)
20.00% (Temp Pid Out)
65.23% (Pid’s Out Rate)
Nfan = [3] of [4]
Pdiff,E /R*
Pdiff,E /R Tamb,E /R*
Tamb,E/R
ωP,diff*
ωT,E/R*
ωauto*ωref* =
The experimental results: the dynamics of the proposed data-driven controller at seagoing operation with the M/E working at 60% of the MCR (nN = 88 r/min, PN = 8,240 kW), where three out of four of the E/R ventilation fans are in service (PID tuning parameters: KP,diff =10, KI,diff =10, KD,diff =2.5; and KP,T = 10, KI,T = 2.5, KD,T = 10).
9
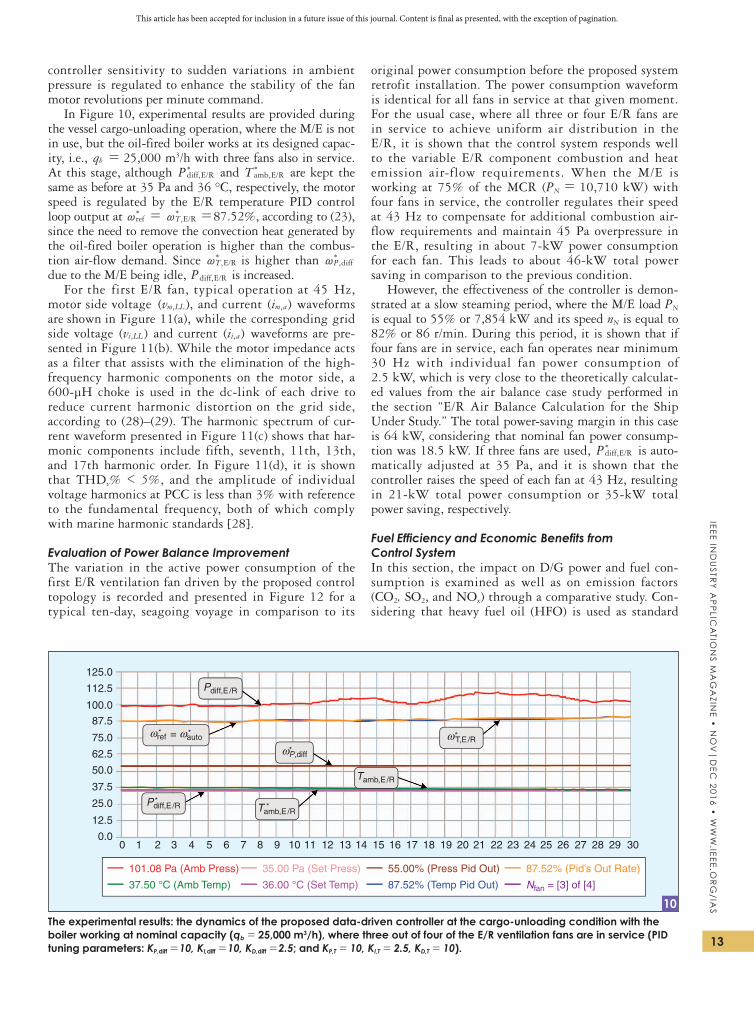
This article has been accepted for inclusion in a future issue of this journal. Content is final as presented, with the exception of pagination.
IEE
E In
du
str
y A
pp
lIcA
tIon
s M
Ag
AzIn
E •
no
v|
dE
c 2
01
6 •
ww
w.IE
EE
.or
g/IA
s
13
controller sensitivity to sudden variations in ambient pressure is regulated to enhance the stability of the fan motor revolutions per minute command.
in figure 10, experimental results are provided during the vessel cargo-unloading operation, where the m/e is not in use, but the oil-fired boiler works at its designed capac-ity, i.e., qb = 25,000 m3/h with three fans also in service. at this stage, although P ,diff E/R
) and T ,amb E/R) are kept the
same as before at 35 pa and 36 °c, respectively, the motor speed is regulated by the e/r temperature pid control loop output at ref~
) = ,T E/R~
) =87.52%, according to (23),
since the need to remove the convection heat generated by the oil-fired boiler operation is higher than the combus-tion air-flow demand. since ,T E/R~
) is higher than ,P diff~
) due to the m/e being idle, P ,diff E/R is increased.
for the first e/r fan, typical operation at 45 hz, motor side voltage ( ),v ,m LL and current ( )i ,am waveforms
are shown in figure 11(a), while the corresponding grid side voltage ( )v ,i LL and current ( )i ,i a waveforms are pre-sented in figure 11(b). While the motor impedance acts as a filter that assists with the elimination of the high-frequency harmonic components on the motor side, a 600-μh choke is used in the dc-link of each drive to reduce current harmonic distortion on the grid side, according to (28)–(29). the harmonic spectrum of cur-rent waveform presented in figure 11(c) shows that har-monic components include fifth, seventh, 11th, 13th, and 17th harmonic order. in figure 11(d), it is shown that thdv% < 5%, and the amplitude of individual voltage harmonics at pcc is less than 3% with reference to the fundamental frequency, both of which comply with marine harmonic standards [28].
Evaluation of Power Balance Improvementthe variation in the active power consumption of the first e/r ventilation fan driven by the proposed control topology is recorded and presented in figure 12 for a typical ten-day, seagoing voyage in comparison to its
original power consumption before the proposed system retrofit installation. the power consumption waveform is identical for all fans in service at that given moment. for the usual case, where all three or four e/r fans are in service to achieve uniform air distribution in the e/r, it is shown that the control system responds well to the variable e/r component combustion and heat emission air-flow requirements. When the m/e is working at 75% of the mcr (PN = 10,710 kW) with four fans in service, the controller regulates their speed at 43 hz to compensate for additional combustion air-flow requirements and maintain 45 pa overpressure in the e/r, resulting in about 7-kW power consumption for each fan. this leads to about 46-kW total power saving in comparison to the previous condition.
however, the effectiveness of the controller is demon-strated at a slow steaming period, where the m/e load PN is equal to 55% or 7,854 kW and its speed nN is equal to 82% or 86 r/min. during this period, it is shown that if four fans are in service, each fan operates near minimum 30 hz with individual fan power consumption of 2.5 kW, which is very close to the theoretically calculat-ed values from the air balance case study performed in the section “e/r air Balance calculation for the ship Under study.” the total power-saving margin in this case is 64 kW, considering that nominal fan power consump-tion was 18.5 kW. if three fans are used, P ,diff E/R
) is auto-matically adjusted at 35 pa, and it is shown that the controller raises the speed of each fan at 43 hz, resulting in 21-kW total power consumption or 35-kW total power saving, respectively.
Fuel Efficiency and Economic Benefits from Control Systemin this section, the impact on d/g power and fuel con-sumption is examined as well as on emission factors (co2, so2, and nox) through a comparative study. con-sidering that heavy fuel oil (hfo) is used as standard
125.0
112.5
100.0
87.5
75.0
62.5
50.0
37.5
25.0
12.5
0.00 1 2 3 4 5 6 7 8 9 10 11 12 13 14 15 16 17 18 19 20 21 22 23 24 25 26 27 28 29 30
101.08 Pa (Amb Press)
37.50 °C (Amb Temp)
35.00 Pa (Set Press)
36.00 °C (Set Temp)
55.00% (Press Pid Out)
87.52% (Temp Pid Out)
87.52% (Pid’s Out Rate)
Nfan = [3] of [4]
Pdiff,E /R*
Pdiff,E /R
Tamb,E/R*
Tamb,E/R
ωP,diff*
ωT,E/R*ωauto*ωref* =
The experimental results: the dynamics of the proposed data-driven controller at the cargo-unloading condition with the boiler working at nominal capacity (qb = 25,000 m3/h), where three out of four of the E/R ventilation fans are in service (PID tuning parameters: KP,diff =10, KI,diff =10, KD,diff =2.5; and KP,T = 10, KI,T = 2.5, KD,T = 10).
10
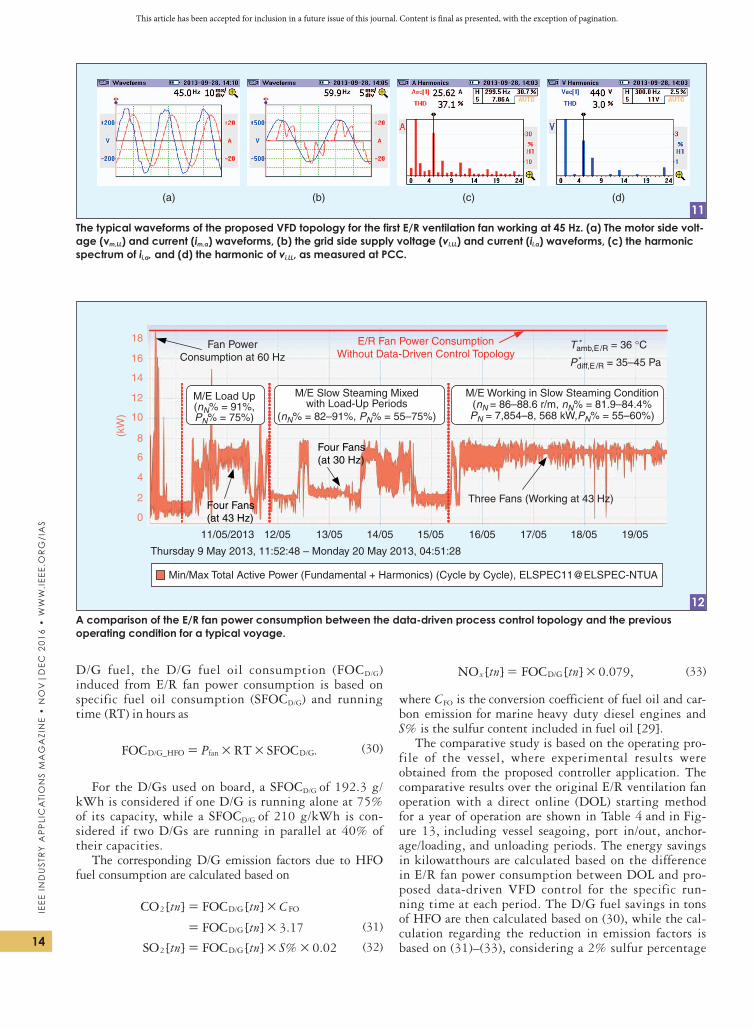
This article has been accepted for inclusion in a future issue of this journal. Content is final as presented, with the exception of pagination.
IEE
E I
nd
us
try
Ap
plI
cA
tIo
ns
MA
gA
zIn
E •
no
v|
dE
c 2
01
6 •
ww
w.I
EE
E.o
rg
/IA
s
14
d/g fuel, the d/g fuel oil consumption (focd/g) induced from e/r fan power consumption is based on specific fuel oil consumption (sfocd/g) and running time (rt) in hours as
.PFOC RT SFOC_/ /D G HFO fan D G# #= (30)
for the d/gs used on board, a sfocd/g of 192.3 g/kWh is considered if one d/g is running alone at 75% of its capacity, while a sfocd/g of 210 g/kWh is con-sidered if two d/gs are running in parallel at 40% of their capacities.
the corresponding d/g emission factors due to hfo fuel consumption are calculated based on
[ ] [ ]
[ ] .
tn tn C
tn 3 17
CO FOC
FOC
2 /
/
D G FO
D G
#
#
=
=
(31)
[ ] [ ] % .tn tn S 0 02SO FOC2 /D G # #= (32)
=[ ] [ ] . ,tn tn 0 079NO FOCx /D G # (33)
where Cfo is the conversion coefficient of fuel oil and car-bon emission for marine heavy duty diesel engines and S% is the sulfur content included in fuel oil [29].
the comparative study is based on the operating pro-file of the vessel, where experimental results were obtained from the proposed controller application. the comparative results over the original e/r ventilation fan operation with a direct online (dol) starting method for a year of operation are shown in table 4 and in fig-ure 13, including vessel seagoing, port in/out, anchor-age/loading, and unloading periods. the energy savings in kilowatthours are calculated based on the difference in e/r fan power consumption between dol and pro-posed data-driven vfd control for the specific run-ning time at each period. the d/g fuel savings in tons of hfo are then calculated based on (30), while the cal-culation regarding the reduction in emission factors is based on (31)–(33), considering a 2% sulfur percentage
(c) (d)(b)(a)
The typical waveforms of the proposed VFD topology for the first E/R ventilation fan working at 45 Hz. (a) The motor side volt-age (vm,LL) and current (im,a) waveforms, (b) the grid side supply voltage (vi,LL) and current (ii,a) waveforms, (c) the harmonic spectrum of ii,a, and (d) the harmonic of vi,LL, as measured at PCC.
11
E/R Fan Power ConsumptionWithout Data-Driven Control Topology
Fan PowerConsumption at 60 Hz
Three Fans (Working at 43 Hz)
Four Fans(at 30 Hz)
Four Fans(at 43 Hz)
M/E Working in Slow Steaming Condition(nN = 86–88.6 r/m, nN% = 81.9–84.4%PN = 7,854–8, 568 kW,PN% = 55–60%)
M/E Load Up(nN% = 91%,PN% = 75%)
M/E Slow Steaming Mixedwith Load-Up Periods
(nN% = 82–91%, PN% = 55–75%)
Pdiff,E /R = 35–45 Pa
Tamb,E/R = 36 °C*
*
18
16
14
12
10
8
6
4
2
0
(kW
)
11/05/2013 12/05 13/05 14/05 15/05 16/05 17/05 18/05 19/05
Thursday 9 May 2013, 11:52:48 – Monday 20 May 2013, 04:51:28
Min/Max Total Active Power (Fundamental + Harmonics) (Cycle by Cycle), ELSPEC11@ELSPEC-NTUA
A comparison of the E/R fan power consumption between the data-driven process control topology and the previous operating condition for a typical voyage.
12
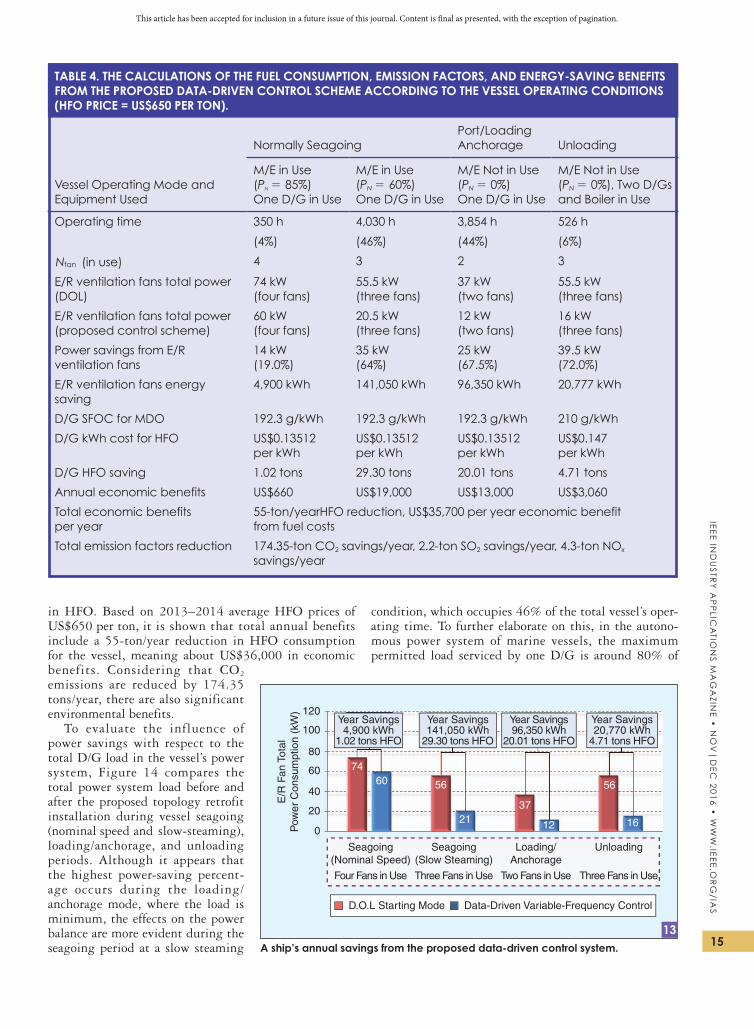
This article has been accepted for inclusion in a future issue of this journal. Content is final as presented, with the exception of pagination.
IEE
E In
du
str
y A
pp
lIcA
tIon
s M
Ag
AzIn
E •
no
v|
dE
c 2
01
6 •
ww
w.IE
EE
.or
g/IA
s
15
in hfo. Based on 2013–2014 average hfo prices of Us$650 per ton, it is shown that total annual benefits include a 55-ton/year reduction in hfo consumption for the vessel, meaning about Us$36,000 in economic benefits. considering that co2 emissions are reduced by 174.35 tons/year, there are also significant
environmental benefits.to evaluate the influence of
power savings with respect to the total d/g load in the vessel’s power system, figure 14 compares the total power system load before and after the proposed topology retrofit installation during vessel seagoing
(nominal speed and slow-steaming), loading/anchorage, and unloading periods. although it appears that the highest power-saving percent-age occurs during the loading/anchorage mode, where the load is minimum, the effects on the power balance are more evident during the seagoing period at a slow steaming
condition, which occupies 46% of the total vessel’s oper-ating time. to further elaborate on this, in the autono-mous power system of marine vessels, the maximum permitted load serviced by one d/g is around 80% of
TABLE 4. THE CALCULATIONS OF THE FUEL CONSUMPTION, EMISSION FACTORS, AND ENERGY-SAVING BENEFITS FROM THE PROPOSED DATA-DRIVEN CONTROL SCHEME ACCORDING TO THE VESSEL OPERATING CONDITIONS (HFO PRICE = US$650 PER TON).
vessel operating Mode and Equipment used
Normally SeagoingPort/Loading Anchorage Unloading
M/E in Use (PN = 85%) One D/G in Use
M/E in Use (PN = 60%) One D/G in Use
M/E Not in Use (PN = 0%) One D/G in Use
M/E Not in Use (PN = 0%), Two D/Gs and Boiler in Use
Operating time 350 h 4,030 h 3,854 h 526 h
(4%) (46%) (44%) (6%)
Nfan (in use) 4 3 2 3
E/R ventilation fans total power (DOL)
74 kw (four fans)
55.5 kw (three fans)
37 kw (two fans)
55.5 kw (three fans)
E/R ventilation fans total power (proposed control scheme)
60 kw (four fans)
20.5 kw (three fans)
12 kw (two fans)
16 kw (three fans)
Power savings from E/R ventilation fans
14 kw (19.0%)
35 kw (64%)
25 kw (67.5%)
39.5 kw (72.0%)
E/R ventilation fans energy saving
4,900 kwh 141,050 kwh 96,350 kwh 20,777 kwh
d/g sFoc for Mdo 192.3 g/kwh 192.3 g/kwh 192.3 g/kwh 210 g/kwh
d/g kwh cost for HFo us$0.13512 per kwh
us$0.13512 per kwh
us$0.13512 per kwh
us$0.147 per kwh
d/g HFo saving 1.02 tons 29.30 tons 20.01 tons 4.71 tons
Annual economic benefits US$660 US$19,000 US$13,000 US$3,060
Total economic benefits per year
55-ton/yearHFo reduction, us$35,700 per year economic benefit from fuel costs
total emission factors reduction 174.35-ton co2 savings/year, 2.2-ton so2 savings/year, 4.3-ton nox savings/year
A ship’s annual savings from the proposed data-driven control system.
0
20
40
60
80
100
120
E/R
Fan
Tot
alP
ower
Con
sum
ptio
n (k
W)
Year Savings4,900 kWh
1.02 tons HFO
Year Savings141,050 kWh
29.30 tons HFO
Year Savings96,350 kWh
20.01 tons HFO
Year Savings20,770 kWh
4.71 tons HFO
7460 56
37
56
21 12 16
Seagoing(Nominal Speed)
Four Fans in Use
Seagoing(Slow Steaming)
Loading/Anchorage
Three Fans in Use Two Fans in Use
Unloading
Three Fans in Use
D.O.L Starting Mode Data-Driven Variable-Frequency Control
13
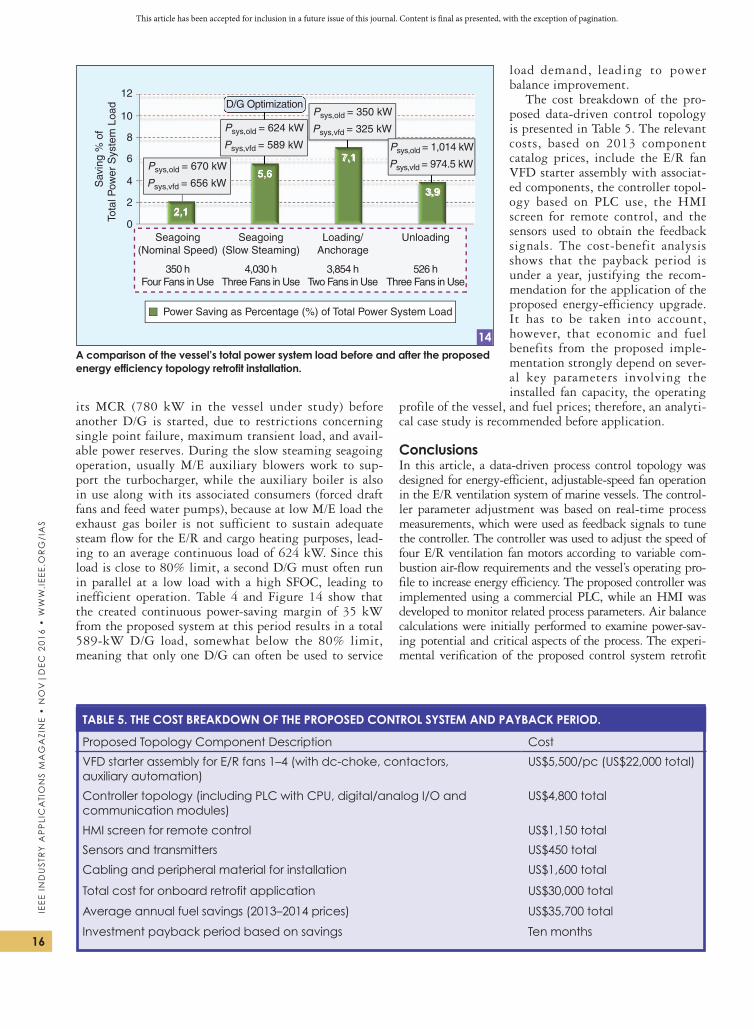
This article has been accepted for inclusion in a future issue of this journal. Content is final as presented, with the exception of pagination.
IEE
E I
nd
us
try
Ap
plI
cA
tIo
ns
MA
gA
zIn
E •
no
v|
dE
c 2
01
6 •
ww
w.I
EE
E.o
rg
/IA
s
16
its mcr (780 kW in the vessel under study) before another d/g is started, due to restrictions concerning single point failure, maximum transient load, and avail-able power reserves. during the slow steaming seagoing operation, usually m/e auxiliary blowers work to sup-port the turbocharger, while the auxiliary boiler is also in use along with its associated consumers (forced draft fans and feed water pumps), because at low m/e load the exhaust gas boiler is not sufficient to sustain adequate steam flow for the e/r and cargo heating purposes, lead-ing to an average continuous load of 624 kW. since this load is close to 80% limit, a second d/g must often run in parallel at a low load with a high sfoc, leading to inefficient operation. table 4 and figure 14 show that the created continuous power-saving margin of 35 kW from the proposed system at this period results in a total 589-kW d/g load, somewhat below the 80% limit, meaning that only one d/g can often be used to service
load demand, leading to power balance improvement.
the cost breakdown of the pro-posed data-driven control topology is presented in table 5. the relevant costs, based on 2013 component catalog prices, include the e/r fan
vfd starter assembly with associat-ed components, the controller topol-ogy based on plc use, the hmi screen for remote control, and the sensors used to obtain the feedback signals. the cost-benefit analysis shows that the payback period is under a year, justifying the recom-mendation for the application of the proposed energy-efficiency upgrade. it has to be taken into account, however, that economic and fuel benefits from the proposed imple-mentation strongly depend on sever-al key parameters involving the installed fan capacity, the operating
profile of the vessel, and fuel prices; therefore, an analyti-cal case study is recommended before application.
Conclusionsin this article, a data-driven process control topology was designed for energy-efficient, adjustable-speed fan operation in the e/r ventilation system of marine vessels. the control-ler parameter adjustment was based on real-time process measurements, which were used as feedback signals to tune the controller. the controller was used to adjust the speed of four e/r ventilation fan motors according to variable com-bustion air-flow requirements and the vessel’s operating pro-file to increase energy efficiency. the proposed controller was implemented using a commercial plc, while an hmi was developed to monitor related process parameters. air balance calculations were initially performed to examine power-sav-ing potential and critical aspects of the process. the experi-mental verification of the proposed control system retrofit
2,1
5,6
7,1
3,9
Sav
ing
% o
fTo
tal P
ower
Sys
tem
Loa
d
D/G Optimization
0
2
4
6
8
10
12
Psys,old = 670 kW
Psys,vfd = 656 kW
Psys,old = 350 kW
Psys,vfd = 325 kWPsys,old = 624 kW
Psys,vfd = 589 kW Psys,old = 1,014 kW
Psys,vfd = 974.5 kW
Seagoing(Nominal Speed)
350 hFour Fans in Use
Seagoing(Slow Steaming)
Loading/Anchorage
4,030 hThree Fans in Use
3,854 hTwo Fans in Use
Unloading
526 hThree Fans in Use
Power Saving as Percentage (%) of Total Power System Load
A comparison of the vessel’s total power system load before and after the proposed energy efficiency topology retrofit installation.
14
TABLE 5. THE COST BREAKDOWN OF THE PROPOSED CONTROL SYSTEM AND PAYBACK PERIOD.
Proposed Topology Component Description Cost
vFd starter assembly for E/r fans 1–4 (with dc-choke, contactors, auxiliary automation)
US$5,500/pc (US$22,000 total)
controller topology (including plc with cpu, digital/analog I/o and communication modules)
US$4,800 total
HMI screen for remote control US$1,150 total
Sensors and transmitters US$450 total
Cabling and peripheral material for installation US$1,600 total
Total cost for onboard retrofit application US$30,000 total
Average annual fuel savings (2013–2014 prices) US$35,700 total
Investment payback period based on savings Ten months
This article has been accepted for inclusion in a future issue of this journal. Content is final as presented, with the exception of pagination.
IEE
E In
du
str
y A
pp
lIcA
tIon
s M
Ag
AzIn
E •
no
v|
dE
c 2
01
6 •
ww
w.IE
EE
.or
g/IA
s
17
installation on board an existing tanker vessel verified that system dynamic responses were well established, achieving significant energy and fuel savings, approaching 260 mWh and 55 tons of hfo reduction in consumption per year, respectively. comparison results over the original e/r venti-lation fan operation method showed significant power bal-ance improvement and emission factor reduction, verifying that the marine industry can greatly benefit from this ener-gy-efficiency upgrade.
References[1] p. mitra and g. K. venayagamoorthy, “implementation of an intelligent
reconfiguration algorithm for an electric ship’s power system,” IEEE Trans. Ind. Appl., vol. 47, no. 5, pp. 2292–2300, sept.–oct. 2011.
[2] s.v. giannoutsos, and s.n. manias, “development of an integrated energy efficiency control system for ship power balance and diesel gen-erator fuel consumption optimization,” in Proc. IEEE Ind. Appl. Soc. Annu. Meeting, orlando, fl, 2013, pp.1–11.
[3] y. durmusoglou, t. satir, c. deniz, and a. Kilic, “a novel energy sav-ing and power production system performance analysis in marine power plant using waste heat,” in Proc. IEEE Int. Conf. Mach. Learn. Applicat., miami, fl, 2009, pp. 751–754.
[4] J. meyer, r. stalbock, and s. voss, “slow steaming in container ship-ping,” in Proc. 2012 45th Hawaii Int. Conf. Syst. Sci., pp. 1306–1314.
[5] a. t. de almeida, f. J. t. e. ferreira, and d. Both, “technical and eco-nomical considerations in the application of variable-speed drives with electric motor systems,” IEEE Trans. Ind. Appl., vol. 41, no. 1, pp. 188–199, Jan.–feb. 2005.
[6] f. J. t. e. ferreira, J. a. c. fong, and a. t. de almeida, “eco-analysis of variable speed drives for flow regulation in pumping systems,” IEEE Trans. Ind. Electron., vol. 58, no. 6, pp. 2117–2125, June 2011.
[7] J. a. rooks and a. K. Wallace, “energy efficiency of vsds,” IEEE Ind. Appl. Mag., vol. 10, no. 3, pp. 57–61, may–June 2004.
[8] d. gritter, s.s. Kalsi, and n. henderson, “variable speed electric drive options for electric ships,” in IEEE Elect. Ship Technol. Symp. 2005, phil-adelphia, pa, pp. 347–354.
[9] r. cuzner, d. drews, W. Kranz, a. Bendre, and g. venkataramanan, “power-dense shipboard-compatible low-horsepower variable-frequen-cy drives,” IEEE Trans. Ind. Appl., vol. 48, no. 6, pp. 2121–2128, nov.–dec. 2012.
[10] c. l. su, W. l. chung, and K. t. yu, “an energy-savings evaluation meth-od for variable-frequency-drive applications on ship central cooling systems,” IEEE Trans. Ind. Appl., vol. 50, no. 2, pp. 1286–1294, mar.–apr. 2014.
[11] J. arribas and c. gonzalez, “optimal vector control of pumping and ventilation induction motor drives,” IEEE Trans. Ind. Electron., vol. 49, no. 4, pp. 889–895, aug. 2002.
[12] d. g. holmes, B. p. mcgrath, and s. g. parker, “current regulation strategies for vector-controlled induction motor drives,” IEEE Trans. Ind. Electron., vol. 59, no. 10, pp. 3680–3689, oct. 2012.
[13] y. Xibo, c. Jianyun, and l. yongdong, “a converter-based starting method and speed control of doubly fed induction machine with cen-trifugal loads,” IEEE Trans. Ind. Appl., vol. 47, no. 3, pp. 1409–1418, may–June 2011.
[14] J. tamminen, t. ahonen, J. ahola, and m. niemela, “detection of mass increase in a fan impeller with a frequency converter,” IEEE Trans. Ind. Electron., vol. 60, no. 4, pp. 3968–3975, sept. 2013.
[15] K. lee, g. venkataramanan, and t. m. Jahns, “modeling effects of voltage unbalances in industrial distribution systems with adjustable-speed drives,” IEEE Trans. Ind. Appl., vol. 44, no. 5, pp. 1322–1332, sept.–oct. 2008.
[16] J. rodriguez, J. pontt, c. silva, r. musalem, p. newman, r. vargas, and s. fuentes, “resonances and overvoltages in a medium-voltage fan motor drive with long cables in an underground mine,” IEEE Trans. Ind. Appl., vol. 42, no. 3, pp. 856–863, may–June 2006.
[17] s. yin, s. X. ding, X. Xie, and h. luo, “a review on basic data-driv-en approaches for industrial process monitoring,” IEEE Trans. Ind. Elec-tron., vol. 61, no. 11, pp. 6418–6428, nov. 2014.
[18] d. Xuewu and g. Zhivei, “from model, signal to knowledge: a data-driven perspective of fault detection and diagnosis,” IEEE Trans. Ind. Informat., vol. 9, no. 4, pp. 2226–2238, nov. 2013.
[19] s. yin, h. luo, and s. X. ding, “real time implementation of fault tolerant control systems with performance optimization,” IEEE Trans. Ind. Electron., vol. 61, no. 5, pp. 2402–2411, may 2014.
[20] W. Zhuo and l. derong, “a data-based state feedback control method for a class of nonlinear systems,” IEEE Trans. Ind. Informat., vol. 9, no. 4, pp. 2284–2292, nov. 2013.
[21] m. radac, r. precup, e. m. petriu, and s. preitl, “iterative data-driv-en tuning of controllers for nonlinear systems with constraints,” IEEE Trans. Ind. Electron., vol. 61, no. 11, pp. 6360–6368, nov. 2014.
[22] Z. hou and y. Zhu, “controller-dynamic-linearization-based model free adaptive control for discrete-time nonlinear systems,” IEEE Trans. Ind. Informat., vol. 9, no. 4, pp. 2301–2309, nov. 2013.
[23] J. K. huusom, n. K. poulsen, and s. B. Jørgensen, “improving con-vergence of iterative feedback tuning,” J. Process Control, vol. 19, no. 4, pp. 570–578, apr. 2009.
[24] s. v. giannoutsos and s. n. manias, “a data-driven process controller for energy efficient variable-speed pump operation in central cooling water system of marine vessels,” IEEE Trans. Ind. Electron., vol. 62, no. 1, pp. 587–598, Jan. 2015.
[25] Shipbuilding-Engine Room Ventilation in Diesel-Engined Ships—Design Requirements and Basis of Calculations, iso standard 8861, 1998.
[26] man diesel & turbo. (2014, sept.). influence of ambient tempera-ture conditions on main engine operation of man B&W two-stroke engines. [online]. available: http://marine.man.eu/docs/librariesprovider6/technical-papers/influence-of-ambient-temperature-conditions.pdf?sfvrsn=26
[27] m. a. valenzuela and p. reyes, “simple and reliable model for the ther-mal protection of variable-speed self-ventilated induction motor drives,” IEEE Trans. Ind. Appl., vol. 46, no. 2, pp. 770–778, mar.–apr. 2010.
[28] s. v. giannoutsos and s. n. manias, “a systematic power quality assessment and harmonic filter design methodology for variable fre-quency drive application in marine vessels,” IEEE Trans. Ind. Appl., vol. 51, no. 2, pp. 1909–1919, mar.–apr. 2015.
[29] a. sarvi, c. J. fogelholm, and r. Zevenhoven, “emissions from large-scale medium-speed diesel engines: 2. influence of fuel type and operating mode,” Fuel Processing Technol., vol. 89, no. 5, pp. 520–527, 2008.
Spyridon V. Giannoutsos ([email protected]) is with the National Technical University of Athens, Greece, and Thena-maris Ships Management, Athens, Greece. Stefanos N. Manias is with the National Technical University of Athens, Greece. Giannoutsos is a Student Member of the IEEE. Manias is a Fel-low of the IEEE. This article first appeared as “A Data-Driven Process Controller for Energy Efficient Variable-Speed Fan Oper-ation in Engine Room Ventilation System of Marine Vessels” at the 2014 IEEE IAS Annual Meeting.
IAS
978-1-4799-7993-6/15/$31.00 ©2015 IEEE
Energy Management and D/G Fuel Consumption
Optimization in the Power System of Marine Vessels
through VFD-based Process Flow Control
Spyridon V. Giannoutsos, Student Member IEEE, and Stefanos N. Manias, Fellow, IEEE
Department of Electrical and Computer Engineering
National Technical University of Athens (NTUA)
9, Iroon Polytechniou str. 15780 Athens, Greece
[email protected]; [email protected]
Abstract—Nowadays marine vessels operate their Main
Engine (M/E) at low speeds to minimize fuel consumption. This
practice leads to significant load balance variation in vessel’s
autonomous power system compared to sea trials, frequently
requiring an additional Diesel Generator (D/G) to work in
parallel at low load to satisfy the limits set by power management
system. To improve D/G operating profile and Specific Fuel Oil
Consumption (SFOC), a data-driven control topology is
proposed, involving speed adjustment of motors related to engine
room ventilation and central cooling water processes that exhibit
varying flow requirements according to ship’s operating profile.
A power saving margin that allows use of only one D/G at sea-
going is created, optimizing D/G fuel consumption for M/E slow
steaming operation. The proposed system is applied as retrofit
installation in a typical tanker vessel’s power system, where
experimental results are compared to the previous operating
condition to show the impact of D/G optimized operation on fuel
consumption. A method is proposed to calculate economic and
environmental benefits depending on type of fuel used, D/G
SFOC and vessel’s trading pattern. Results show that vessel’s
power system annual energy consumption and D/G fuel
consumption are significantly reduced by 18.3% and 20.3%
respectively.
Keywords— Marine vehicle power systems; Industrial power
system control; Energy management; Power conversion; Process
control; Variable speed drives
I. INTRODUCTION
Marine power systems undergo structural changes with new control strategies utilizing distribution automation and network reconfiguration to provide greater flexibility, reliability and reduce fuel consumption [1]-[2]. Optimal Diesel Generator (D/G) allocation control is achieved by the vessel’s Power Management System (PMS) to satisfy safe continuous load, react to transient load step variations as well as maintain sufficient power reserve to prevent blackout conditions [3]-[5]. On operational level, a method for improved demand-side management and power generation scheduling is proposed in [6], while real-time power management techniques that support system critical operations in the event of dynamic load change based on switch status of loads are discussed in [7]-[9]. The growing integration of power electronic converters in several
parts of the ship’s power system including propulsion, power distribution and auxiliaries also affects power balance with the intention to reduce fuel consumption and greenhouse gas (GHG) emissions [10]. To improve efficiency, optimal power management methods are proposed in [11]-[12] for marine power systems integrating energy storage systems, while options for retrofit application of capacitor banks for power factor correction purposes are discussed in [13].
Nowadays, however, the commonly used slow steaming practice, involving vessel’s Main Engine (M/E) operation at lower speeds [14], leads to significant load variation in vessel’s autonomous power system at sea-going period. In contradiction to optimally pre-configured D/G operation based on calculated continuous and intermittent load levels, also tested during sea trials, the load variation due to slow steaming often leads to an additional D/G working in parallel to satisfy the PMS limits for adequate online power reserve. In that case, parallel D/G low load operation increases individual Specific Fuel Oil Consumption (SFOC), subsequently resulting in increased fuel consumption and GHG emissions especially during sea-going.
As a direct consequence, slow steaming leads to derated flow rate requirements in processes relevant to M/E and auxiliary machinery operation due to their variable water cooling, combustion air and heat dissipation needs [15]. To increase energy efficiency, adaptive speed control of motors associated with these processes according to varying process requirements has been proposed in [16]-[17]. However, the dynamic power saving margin created by the variable frequency control of motors, which would otherwise operate constantly at nominal power, could significantly be used to improve vessel’s power balance especially during sea-going.
To exploit this power saving margin in order to optimize D/G operating profile and fuel consumption during sea-going operation at reduced M/E speed while simultaneously satisfy PMS limits, a data-driven control topology is proposed in this work, involving Variable Frequency Drive (VFD) application to motors associated with Engine Room (E/R) ventilation and central cooling water system processes. By compensating the vessel’s load variation due to its slow-steaming operating profile with the created power saving margin from the proposed
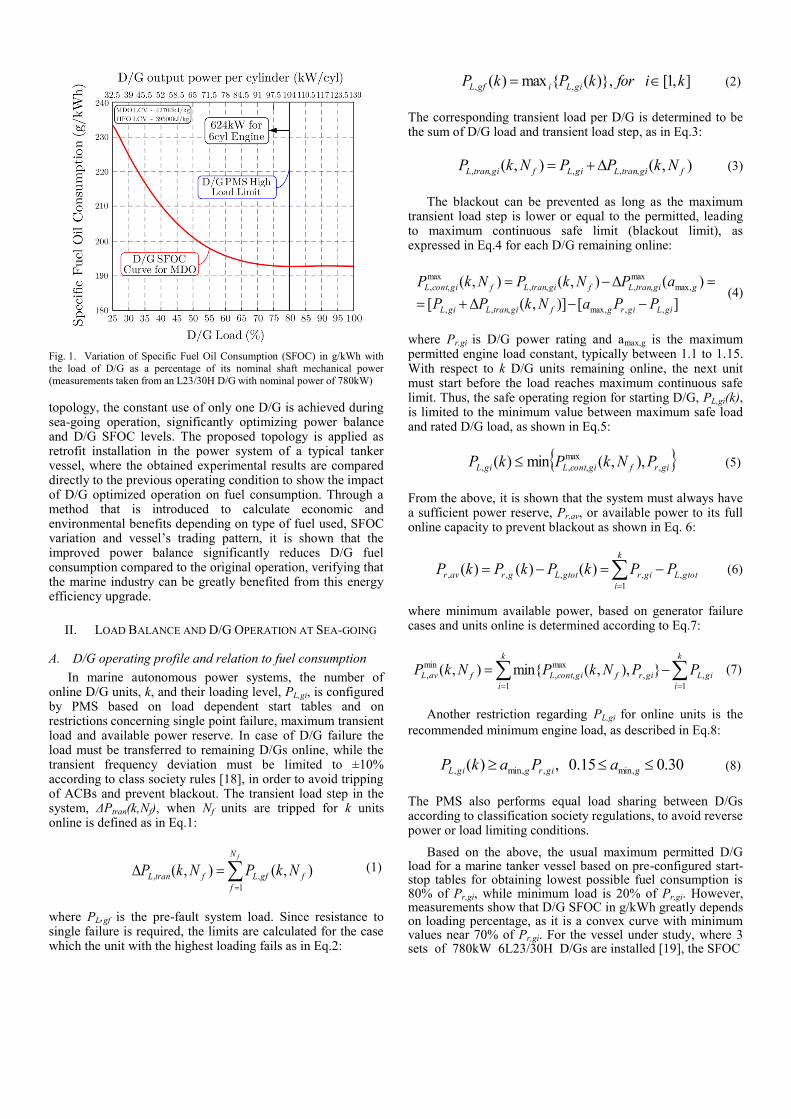
Fig. 1. Variation of Specific Fuel Oil Consumption (SFOC) in g/kWh with
the load of D/G as a percentage of its nominal shaft mechanical power
(measurements taken from an L23/30H D/G with nominal power of 780kW)
topology, the constant use of only one D/G is achieved during sea-going operation, significantly optimizing power balance and D/G SFOC levels. The proposed topology is applied as retrofit installation in the power system of a typical tanker vessel, where the obtained experimental results are compared directly to the previous operating condition to show the impact of D/G optimized operation on fuel consumption. Through a method that is introduced to calculate economic and environmental benefits depending on type of fuel used, SFOC variation and vessel’s trading pattern, it is shown that the improved power balance significantly reduces D/G fuel consumption compared to the original operation, verifying that the marine industry can be greatly benefited from this energy efficiency upgrade.
II. LOAD BALANCE AND D/G OPERATION AT SEA-GOING
A. D/G operating profile and relation to fuel consumption
In marine autonomous power systems, the number of online D/G units, k, and their loading level, PL,gi, is configured by PMS based on load dependent start tables and on
restrictions concerning single point failure, maximum transient load and available power reserve. In case of D/G failure the load must be transferred to remaining D/Gs online, while the transient frequency deviation must be limited to ±10% according to class society rules [18], in order to avoid tripping of ACBs and prevent blackout. The transient load step in the system, ΔPtran(k,Nf), when Nf units are tripped for k units online is defined as in Eq.1:
fN
f
fgfLftranL NkPNkP1
,, ),(),( (1)
where PL,gf is the pre-fault system load. Since resistance to single failure is required, the limits are calculated for the case which the unit with the highest loading fails as in Eq.2:
],1[)},({max)( ,, kiforkPkP giLigfL (2)
The corresponding transient load per D/G is determined to be the sum of D/G load and transient load step, as in Eq.3:
),(),( ,,,,, fgitranLgiLfgitranL NkPPNkP (3)
The blackout can be prevented as long as the maximum transient load step is lower or equal to the permitted, leading to maximum continuous safe limit (blackout limit), as expressed in Eq.4 for each D/G remaining online:
][)],([
)(),(),(
,,max,,,,
max,
max
,,,,
max
,,
giLgirgfgitranLgiL
ggitranLfgitranLfgicontL
PPaNkPP
aPNkPNkP
(4)
where Pr,gi is D/G power rating and amax,g is the maximum permitted engine load constant, typically between 1.1 to 1.15. With respect to k D/G units remaining online, the next unit must start before the load reaches maximum continuous safe limit. Thus, the safe operating region for starting D/G, PL,gi(k), is limited to the minimum value between maximum safe load and rated D/G load, as shown in Eq.5:
girfgicontLgiL PNkPkP ,
max
,,, ),,(min)( (5)
From the above, it is shown that the system must always have a sufficient power reserve, Pr,av, or available power to its full online capacity to prevent blackout as shown in Eq. 6:
k
i
gtotLgirgtotLgravr PPkPkPkP1
,,,,, )()()( (6)
where minimum available power, based on generator failure cases and units online is determined according to Eq.7:
k
i
giL
k
i
girfgicontLfavL PPNkPNkP1
,
1
,
max
,,
min
, }),,(min{),( (7)
Another restriction regarding PL,gi for online units is the
recommended minimum engine load, as described in Eq.8:
30.015.0,)( min,,min,, ggirggiL aPakP (8)
The PMS also performs equal load sharing between D/Gs according to classification society regulations, to avoid reverse power or load limiting conditions.
Based on the above, the usual maximum permitted D/G load for a marine tanker vessel based on pre-configured start-stop tables for obtaining lowest possible fuel consumption is 80% of Pr,gi, while minimum load is 20% of Pr,gi. However, measurements show that D/G SFOC in g/kWh greatly depends on loading percentage, as it is a convex curve with minimum values near 70% of Pr,gi. For the vessel under study, where 3 sets of 780kW 6L23/30H D/Gs are installed [19], the SFOC
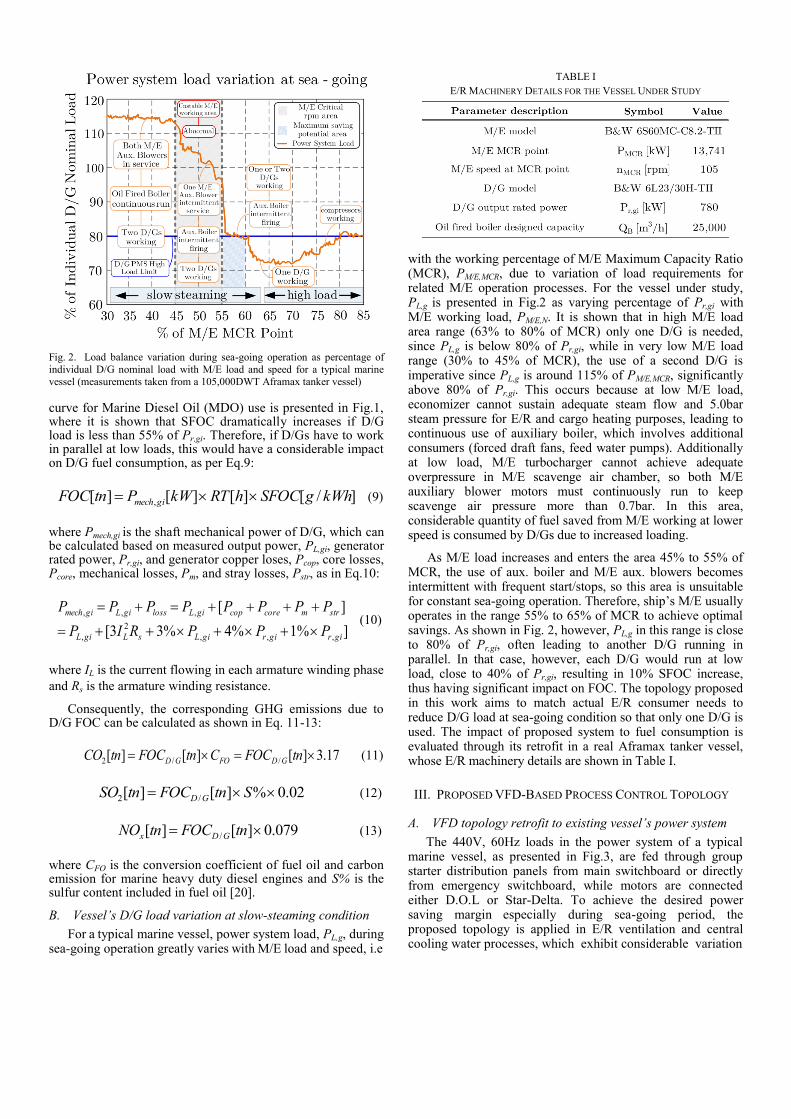
Fig. 2. Load balance variation during sea-going operation as percentage of
individual D/G nominal load with M/E load and speed for a typical marine
vessel (measurements taken from a 105,000DWT Aframax tanker vessel)
curve for Marine Diesel Oil (MDO) use is presented in Fig.1, where it is shown that SFOC dramatically increases if D/G load is less than 55% of Pr,gi. Therefore, if D/Gs have to work in parallel at low loads, this would have a considerable impact on D/G fuel consumption, as per Eq.9:
]/[][][][ , kWhgSFOChRTkWPtnFOC gimech (9)
where Pmech,gi is the shaft mechanical power of D/G, which can be calculated based on measured output power, PL,gi, generator rated power, Pr,gi, and generator copper loses, Pcop, core losses, Pcore, mechanical losses, Pm, and stray losses, Pstr, as in Eq.10:
]%1%4%33[
][
,,,
2
,
,,,
girgirgiLsLgiL
strmcorecopgiLlossgiLgimech
PPPRIP
PPPPPPPP
(10)
where IL is the current flowing in each armature winding phase
and Rs is the armature winding resistance.
Consequently, the corresponding GHG emissions due to D/G FOC can be calculated as shown in Eq. 11-13:
17.3][][][ //2 tnFOCCtnFOCtnCO GDFOGD (11)
02.0%][][ /2 StnFOCtnSO GD (12)
079.0][][ / tnFOCtnNO GDx (13)
where CFO is the conversion coefficient of fuel oil and carbon emission for marine heavy duty diesel engines and S% is the sulfur content included in fuel oil [20].
B. Vessel’s D/G load variation at slow-steaming condition
For a typical marine vessel, power system load, PL,g, during sea-going operation greatly varies with M/E load and speed, i.e
TABLE I
E/R MACHINERY DETAILS FOR THE VESSEL UNDER STUDY
with the working percentage of M/E Maximum Capacity Ratio (MCR), PM/E,MCR, due to variation of load requirements for related M/E operation processes. For the vessel under study, PL,g is presented in Fig.2 as varying percentage of Pr,gi with M/E working load, PM/E,N. It is shown that in high M/E load area range (63% to 80% of MCR) only one D/G is needed, since PL,g is below 80% of Pr,gi, while in very low M/E load range (30% to 45% of MCR), the use of a second D/G is imperative since PL,g is around 115% of PM/E,MCR, significantly above 80% of Pr,gi. This occurs because at low M/E load, economizer cannot sustain adequate steam flow and 5.0bar steam pressure for E/R and cargo heating purposes, leading to continuous use of auxiliary boiler, which involves additional consumers (forced draft fans, feed water pumps). Additionally at low load, M/E turbocharger cannot achieve adequate overpressure in M/E scavenge air chamber, so both M/E auxiliary blower motors must continuously run to keep scavenge air pressure more than 0.7bar. In this area, considerable quantity of fuel saved from M/E working at lower speed is consumed by D/Gs due to increased loading.
As M/E load increases and enters the area 45% to 55% of MCR, the use of aux. boiler and M/E aux. blowers becomes intermittent with frequent start/stops, so this area is unsuitable for constant sea-going operation. Therefore, ship’s M/E usually operates in the range 55% to 65% of MCR to achieve optimal savings. As shown in Fig. 2, however, PL,g in this range is close to 80% of Pr,gi, often leading to another D/G running in parallel. In that case, however, each D/G would run at low load, close to 40% of Pr,gi, resulting in 10% SFOC increase, thus having significant impact on FOC. The topology proposed in this work aims to match actual E/R consumer needs to reduce D/G load at sea-going condition so that only one D/G is used. The impact of proposed system to fuel consumption is evaluated through its retrofit in a real Aframax tanker vessel, whose E/R machinery details are shown in Table I.
III. PROPOSED VFD-BASED PROCESS CONTROL TOPOLOGY
A. VFD topology retrofit to existing vessel’s power system
The 440V, 60Hz loads in the power system of a typical marine vessel, as presented in Fig.3, are fed through group starter distribution panels from main switchboard or directly from emergency switchboard, while motors are connected either D.O.L or Star-Delta. To achieve the desired power saving margin especially during sea-going period, the proposed topology is applied in E/R ventilation and central cooling water processes, which exhibit considerable variation
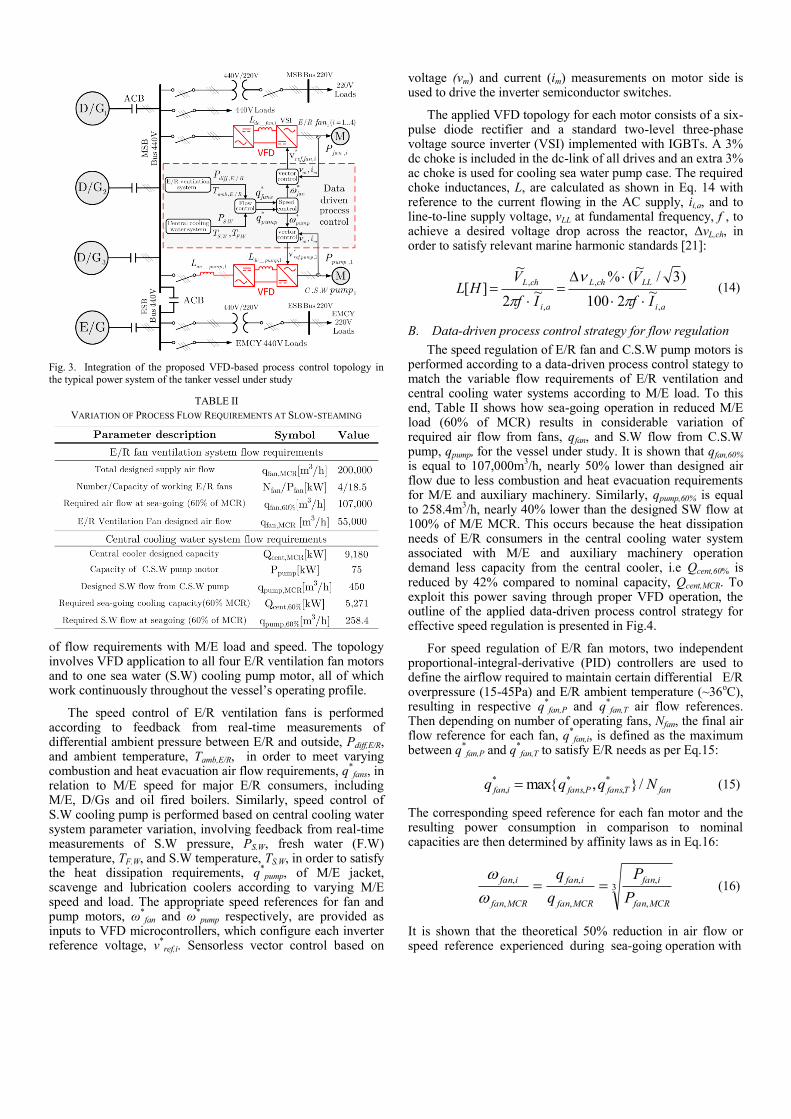
Fig. 3. Integration of the proposed VFD-based process control topology in
the typical power system of the tanker vessel under study
TABLE II
VARIATION OF PROCESS FLOW REQUIREMENTS AT SLOW-STEAMING
of flow requirements with M/E load and speed. The topology involves VFD application to all four E/R ventilation fan motors and to one sea water (S.W) cooling pump motor, all of which work continuously throughout the vessel’s operating profile.
The speed control of E/R ventilation fans is performed according to feedback from real-time measurements of differential ambient pressure between E/R and outside, Pdiff,E/R, and ambient temperature, Tamb,E/R, in order to meet varying combustion and heat evacuation air flow requirements, q
*fans, in
relation to M/E speed for major E/R consumers, including M/E, D/Gs and oil fired boilers. Similarly, speed control of S.W cooling pump is performed based on central cooling water system parameter variation, involving feedback from real-time measurements of S.W pressure, PS.W, fresh water (F.W) temperature, TF.W, and S.W temperature, TS.W, in order to satisfy the heat dissipation requirements, q
*pump, of M/E jacket,
scavenge and lubrication coolers according to varying M/E speed and load. The appropriate speed references for fan and pump motors, ω
*fan and ω
*pump respectively, are provided as
inputs to VFD microcontrollers, which configure each inverter reference voltage, v
*ref,i. Sensorless vector control based on
voltage (vm) and current (im) measurements on motor side is used to drive the inverter semiconductor switches.
The applied VFD topology for each motor consists of a six-pulse diode rectifier and a standard two-level three-phase voltage source inverter (VSI) implemented with IGBTs. A 3% dc choke is included in the dc-link of all drives and an extra 3% ac choke is used for cooling sea water pump case. The required choke inductances, L, are calculated as shown in Eq. 14 with reference to the current flowing in the AC supply, ii,a, and to line-to-line supply voltage, vLL at fundamental frequency, f , to achieve a desired voltage drop across the reactor, ΔvL,ch, in order to satisfy relevant marine harmonic standards [21]:
ai
LLchL
ai
chL
If
V
If
VHL
,
,
,
,
~2100
)3/~(%
~2
~
][
(14)
B. Data-driven process control strategy for flow regulation
The speed regulation of E/R fan and C.S.W pump motors is performed according to a data-driven process control stategy to match the variable flow requirements of E/R ventilation and central cooling water systems according to M/E load. To this end, Table II shows how sea-going operation in reduced M/E load (60% of MCR) results in considerable variation of required air flow from fans, qfan, and S.W flow from C.S.W pump, qpump, for the vessel under study. It is shown that qfan,60%
is equal to 107,000m3/h, nearly 50% lower than designed air
flow due to less combustion and heat evacuation requirements for M/E and auxiliary machinery. Similarly, qpump,60% is equal to 258.4m
3/h, nearly 40% lower than the designed SW flow at
100% of M/E MCR. This occurs because the heat dissipation needs of E/R consumers in the central cooling water system associated with M/E and auxiliary machinery operation demand less capacity from the central cooler, i.e Qcent,60% is reduced by 42% compared to nominal capacity, Qcent,MCR. To exploit this power saving through proper VFD operation, the outline of the applied data-driven process control strategy for effective speed regulation is presented in Fig.4.
For speed regulation of E/R fan motors, two independent proportional-integral-derivative (PID) controllers are used to define the airflow required to maintain certain differential E/R overpressure (15-45Pa) and E/R ambient temperature (~36
oC),
resulting in respective q*fan,P and q
*fan,T air flow references.
Then depending on number of operating fans, Nfan, the final air flow reference for each fan, q
*fan,i, is defined as the maximum
between q*fan,P and q
*fan,T to satisfy E/R needs as per Eq.15:
fanTfansPfansifan Nqqq /},max{ *
,
*
,
*
, (15)
The corresponding speed reference for each fan motor and the resulting power consumption in comparison to nominal capacities are then determined by affinity laws as in Eq.16:
3
,
,
,
,
,
,
MCRfan
ifan
MCRfan
ifan
MCRfan
ifan
P
P
q
q
(16)
It is shown that the theoretical 50% reduction in air flow or speed reference experienced during sea-going operation with
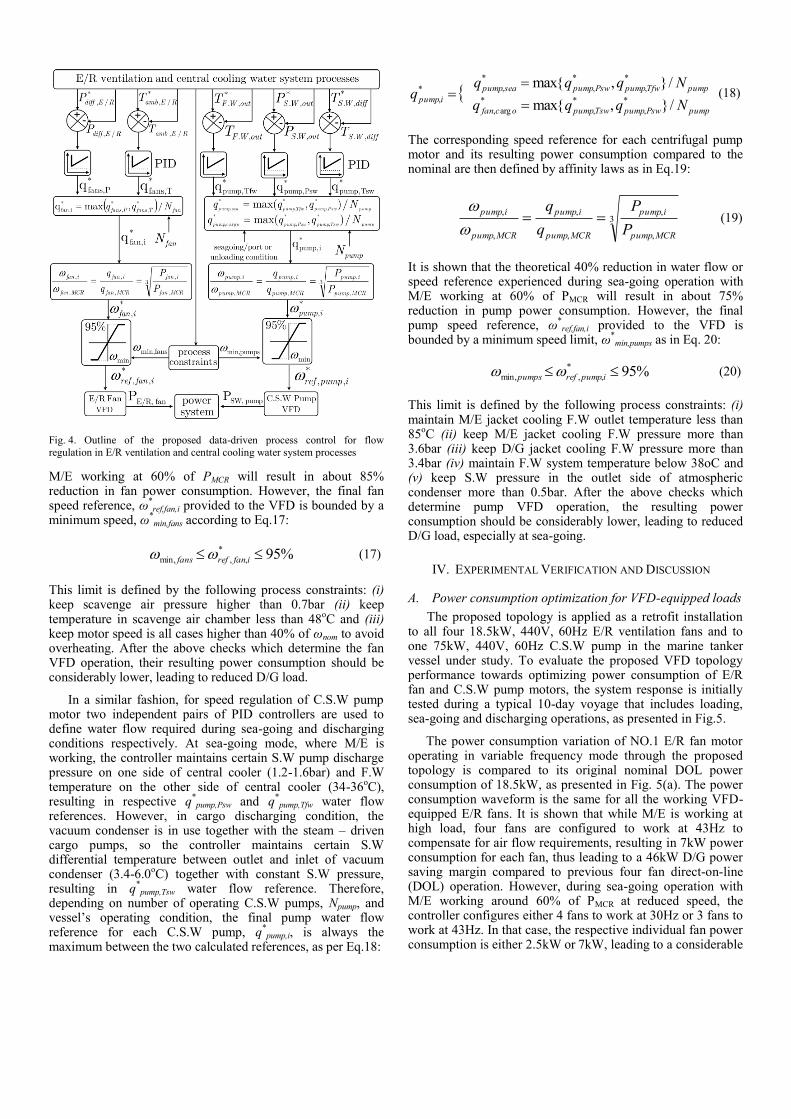
Fig. 4. Outline of the proposed data-driven process control for flow
regulation in E/R ventilation and central cooling water system processes
M/E working at 60% of PMCR will result in about 85% reduction in fan power consumption. However, the final fan speed reference, ω
*ref,fan,i provided to the VFD is bounded by a
minimum speed, ω*min,fans according to Eq.17:
%95*
,,min, ifanreffans (17)
This limit is defined by the following process constraints: (i) keep scavenge air pressure higher than 0.7bar (ii) keep temperature in scavenge air chamber less than 48
oC and (iii)
keep motor speed is all cases higher than 40% of ωnom to avoid overheating. After the above checks which determine the fan VFD operation, their resulting power consumption should be considerably lower, leading to reduced D/G load.
In a similar fashion, for speed regulation of C.S.W pump motor two independent pairs of PID controllers are used to define water flow required during sea-going and discharging conditions respectively. At sea-going mode, where M/E is working, the controller maintains certain S.W pump discharge pressure on one side of central cooler (1.2-1.6bar) and F.W temperature on the other side of central cooler (34-36
oC),
resulting in respective q*pump,Psw and q
*pump,Tfw water flow
references. However, in cargo discharging condition, the vacuum condenser is in use together with the steam – driven cargo pumps, so the controller maintains certain S.W differential temperature between outlet and inlet of vacuum condenser (3.4-6.0
oC) together with constant S.W pressure,
resulting in q*pump,Tsw water flow reference. Therefore,
depending on number of operating C.S.W pumps, Npump, and vessel’s operating condition, the final pump water flow reference for each C.S.W pump, q
*pump,i, is always the
maximum between the two calculated references, as per Eq.18:
pumpPswpumpTswpumpocfan
pumpTfwpumpPswpumpseapump
ipumpNqqq
Nqqqq
/},max{
/},max{*
,
*
,
*
arg,
*
,
*
,
*
,*
,
(18)
The corresponding speed reference for each centrifugal pump motor and its resulting power consumption compared to the nominal are then defined by affinity laws as in Eq.19:
3
,
,
,
,
,
,
MCRpump
ipump
MCRpump
ipump
MCRpump
ipump
P
P
q
q
(19)
It is shown that the theoretical 40% reduction in water flow or speed reference experienced during sea-going operation with M/E working at 60% of PMCR will result in about 75% reduction in pump power consumption. However, the final pump speed reference, ω
*ref,fan,i provided to the VFD is
bounded by a minimum speed limit, ω*min,pumps as in Eq. 20:
%95*
,,min, ipumprefpumps (20)
This limit is defined by the following process constraints: (i) maintain M/E jacket cooling F.W outlet temperature less than 85
oC (ii) keep M/E jacket cooling F.W pressure more than
3.6bar (iii) keep D/G jacket cooling F.W pressure more than 3.4bar (iv) maintain F.W system temperature below 38oC and (v) keep S.W pressure in the outlet side of atmospheric condenser more than 0.5bar. After the above checks which determine pump VFD operation, the resulting power consumption should be considerably lower, leading to reduced D/G load, especially at sea-going.
IV. EXPERIMENTAL VERIFICATION AND DISCUSSION
A. Power consumption optimization for VFD-equipped loads
The proposed topology is applied as a retrofit installation to all four 18.5kW, 440V, 60Hz E/R ventilation fans and to one 75kW, 440V, 60Hz C.S.W pump in the marine tanker vessel under study. To evaluate the proposed VFD topology performance towards optimizing power consumption of E/R fan and C.S.W pump motors, the system response is initially tested during a typical 10-day voyage that includes loading, sea-going and discharging operations, as presented in Fig.5.
The power consumption variation of NO.1 E/R fan motor operating in variable frequency mode through the proposed topology is compared to its original nominal DOL power consumption of 18.5kW, as presented in Fig. 5(a). The power consumption waveform is the same for all the working VFD-equipped E/R fans. It is shown that while M/E is working at high load, four fans are configured to work at 43Hz to compensate for air flow requirements, resulting in 7kW power consumption for each fan, thus leading to a 46kW D/G power saving margin compared to previous four fan direct-on-line (DOL) operation. However, during sea-going operation with M/E working around 60% of PMCR at reduced speed, the controller configures either 4 fans to work at 30Hz or 3 fans to work at 43Hz. In that case, the respective individual fan power consumption is either 2.5kW or 7kW, leading to a considerable
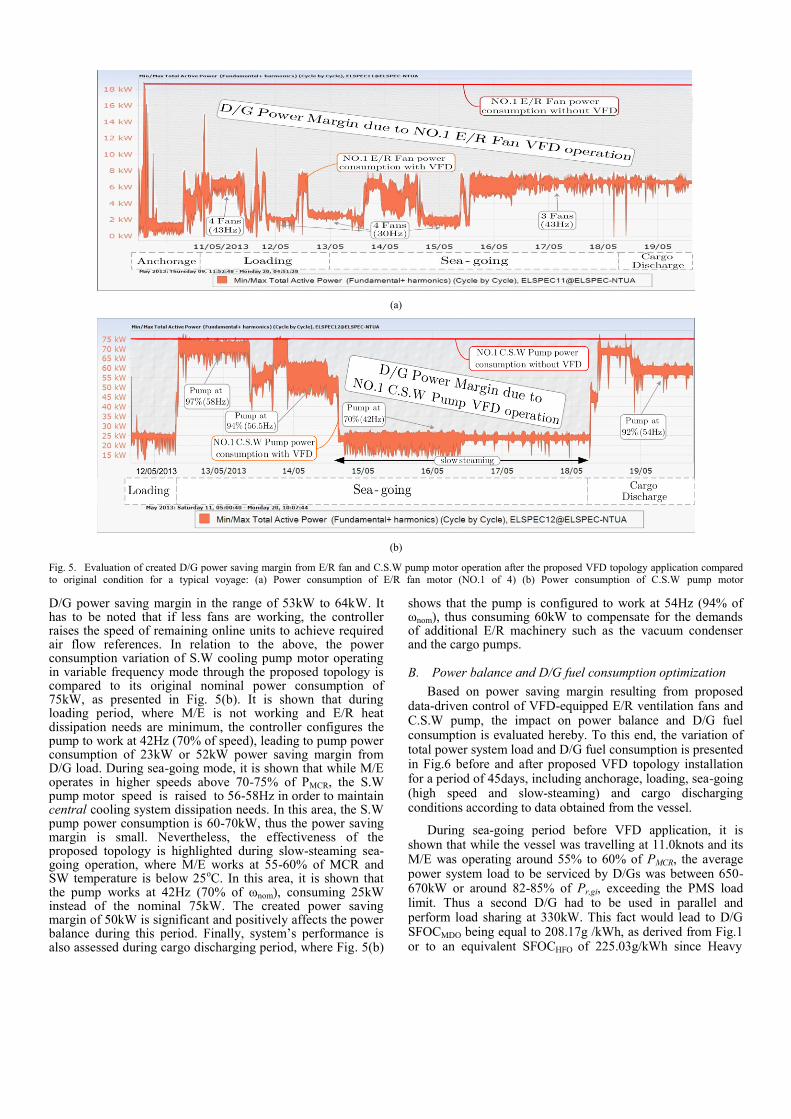
(a)
(b)
Fig. 5. Evaluation of created D/G power saving margin from E/R fan and C.S.W pump motor operation after the proposed VFD topology application compared to original condition for a typical voyage: (a) Power consumption of E/R fan motor (NO.1 of 4) (b) Power consumption of C.S.W pump motor
D/G power saving margin in the range of 53kW to 64kW. It has to be noted that if less fans are working, the controller raises the speed of remaining online units to achieve required air flow references. In relation to the above, the power consumption variation of S.W cooling pump motor operating in variable frequency mode through the proposed topology is compared to its original nominal power consumption of 75kW, as presented in Fig. 5(b). It is shown that during loading period, where M/E is not working and E/R heat dissipation needs are minimum, the controller configures the pump to work at 42Hz (70% of speed), leading to pump power consumption of 23kW or 52kW power saving margin from D/G load. During sea-going mode, it is shown that while M/E operates in higher speeds above 70-75% of PMCR, the S.W pump motor speed is raised to 56-58Hz in order to maintain central cooling system dissipation needs. In this area, the S.W pump power consumption is 60-70kW, thus the power saving margin is small. Nevertheless, the effectiveness of the proposed topology is highlighted during slow-steaming sea-going operation, where M/E works at 55-60% of MCR and SW temperature is below 25
oC. In this area, it is shown that
the pump works at 42Hz (70% of ωnom), consuming 25kW instead of the nominal 75kW. The created power saving margin of 50kW is significant and positively affects the power balance during this period. Finally, system’s performance is also assessed during cargo discharging period, where Fig. 5(b)
shows that the pump is configured to work at 54Hz (94% of ωnom), thus consuming 60kW to compensate for the demands of additional E/R machinery such as the vacuum condenser and the cargo pumps.
B. Power balance and D/G fuel consumption optimization
Based on power saving margin resulting from proposed data-driven control of VFD-equipped E/R ventilation fans and C.S.W pump, the impact on power balance and D/G fuel consumption is evaluated hereby. To this end, the variation of total power system load and D/G fuel consumption is presented in Fig.6 before and after proposed VFD topology installation for a period of 45days, including anchorage, loading, sea-going (high speed and slow-steaming) and cargo discharging conditions according to data obtained from the vessel.
During sea-going period before VFD application, it is shown that while the vessel was travelling at 11.0knots and its M/E was operating around 55% to 60% of PMCR, the average power system load to be serviced by D/Gs was between 650-670kW or around 82-85% of Pr,gi, exceeding the PMS load limit. Thus a second D/G had to be used in parallel and perform load sharing at 330kW. This fact would lead to D/G SFOCMDO being equal to 208.17g /kWh, as derived from Fig.1 or to an equivalent SFOCHFO of 225.03g/kWh since Heavy
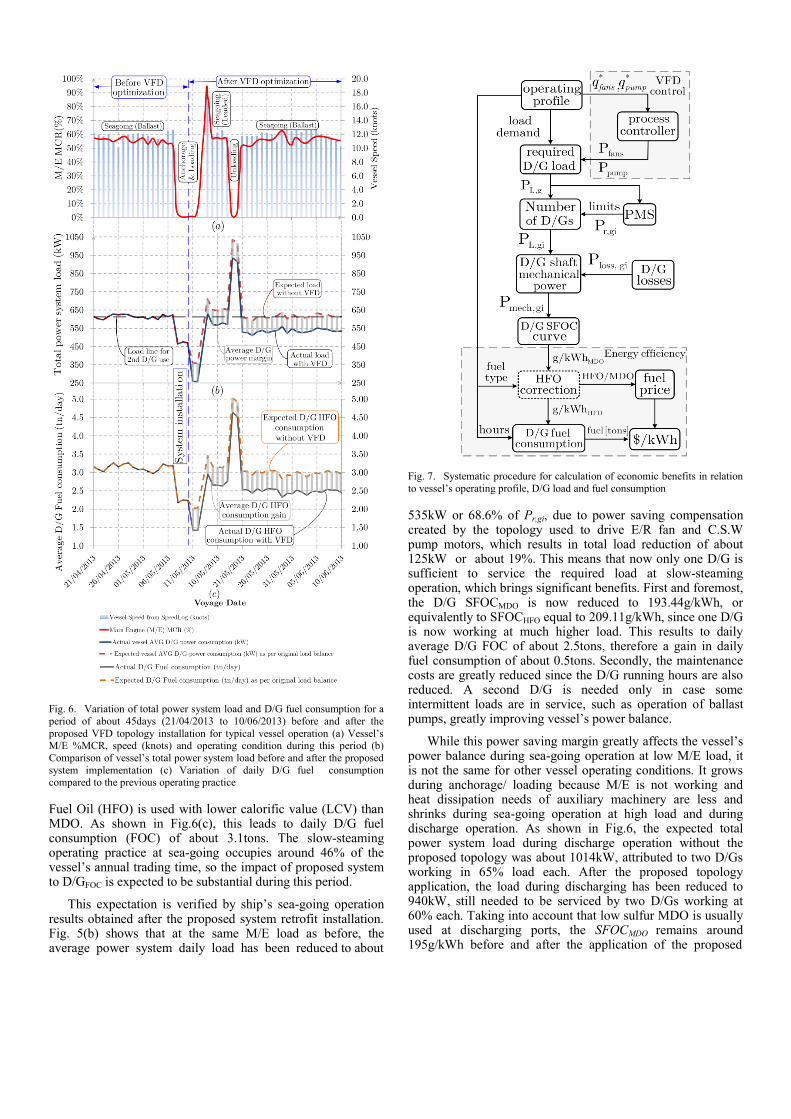
Fig. 6. Variation of total power system load and D/G fuel consumption for a
period of about 45days (21/04/2013 to 10/06/2013) before and after the
proposed VFD topology installation for typical vessel operation (a) Vessel’s M/E %MCR, speed (knots) and operating condition during this period (b)
Comparison of vessel’s total power system load before and after the proposed
system implementation (c) Variation of daily D/G fuel consumption compared to the previous operating practice
Fuel Oil (HFO) is used with lower calorific value (LCV) than MDO. As shown in Fig.6(c), this leads to daily D/G fuel consumption (FOC) of about 3.1tons. The slow-steaming operating practice at sea-going occupies around 46% of the vessel’s annual trading time, so the impact of proposed system to D/GFOC is expected to be substantial during this period.
This expectation is verified by ship’s sea-going operation results obtained after the proposed system retrofit installation. Fig. 5(b) shows that at the same M/E load as before, the average power system daily load has been reduced to about
Fig. 7. Systematic procedure for calculation of economic benefits in relation
to vessel’s operating profile, D/G load and fuel consumption
535kW or 68.6% of Pr,gi, due to power saving compensation created by the topology used to drive E/R fan and C.S.W pump motors, which results in total load reduction of about 125kW or about 19%. This means that now only one D/G is sufficient to service the required load at slow-steaming operation, which brings significant benefits. First and foremost, the D/G SFOCMDO is now reduced to 193.44g/kWh, or equivalently to SFOCHFO equal to 209.11g/kWh, since one D/G is now working at much higher load. This results to daily average D/G FOC of about 2.5tons, therefore a gain in daily fuel consumption of about 0.5tons. Secondly, the maintenance costs are greatly reduced since the D/G running hours are also reduced. A second D/G is needed only in case some intermittent loads are in service, such as operation of ballast pumps, greatly improving vessel’s power balance.
While this power saving margin greatly affects the vessel’s power balance during sea-going operation at low M/E load, it is not the same for other vessel operating conditions. It grows during anchorage/ loading because M/E is not working and heat dissipation needs of auxiliary machinery are less and shrinks during sea-going operation at high load and during discharge operation. As shown in Fig.6, the expected total power system load during discharge operation without the proposed topology was about 1014kW, attributed to two D/Gs working in 65% load each. After the proposed topology application, the load during discharging has been reduced to 940kW, still needed to be serviced by two D/Gs working at 60% each. Taking into account that low sulfur MDO is usually used at discharging ports, the SFOCMDO remains around 195g/kWh before and after the application of the proposed
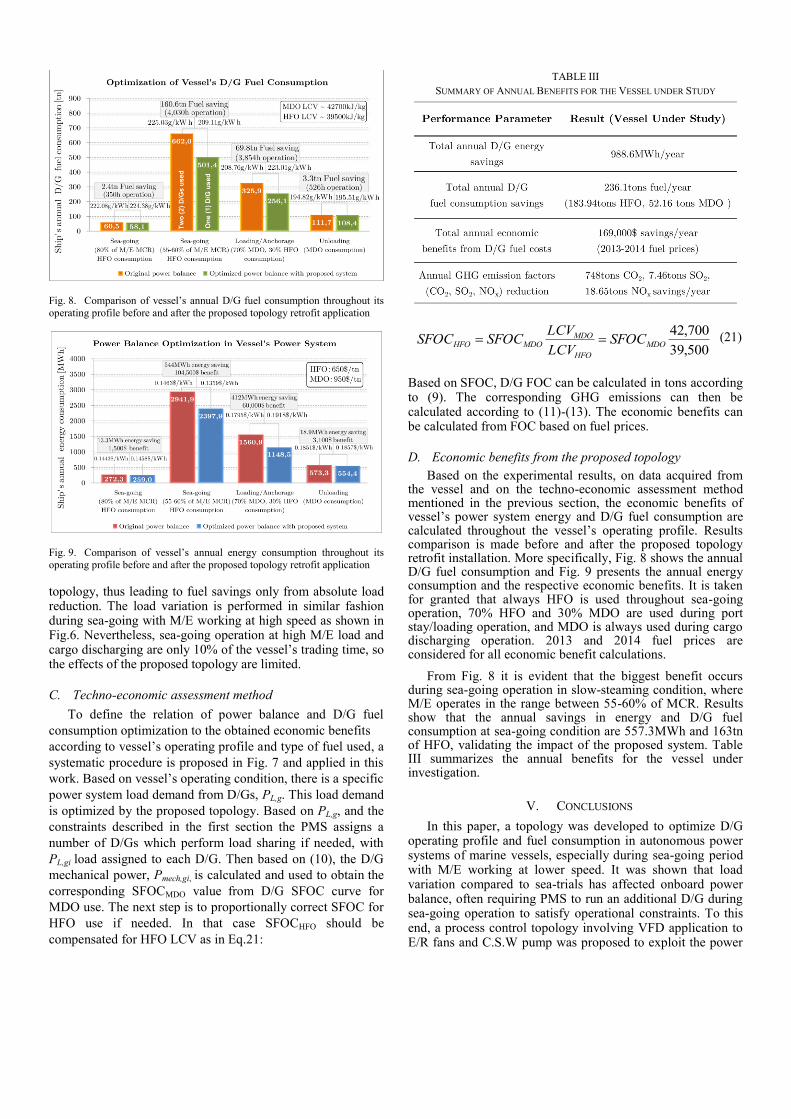
Fig. 8. Comparison of vessel’s annual D/G fuel consumption throughout its
operating profile before and after the proposed topology retrofit application
Fig. 9. Comparison of vessel’s annual energy consumption throughout its
operating profile before and after the proposed topology retrofit application
topology, thus leading to fuel savings only from absolute load reduction. The load variation is performed in similar fashion during sea-going with M/E working at high speed as shown in Fig.6. Nevertheless, sea-going operation at high M/E load and cargo discharging are only 10% of the vessel’s trading time, so the effects of the proposed topology are limited.
C. Techno-economic assessment method
To define the relation of power balance and D/G fuel
consumption optimization to the obtained economic benefits
according to vessel’s operating profile and type of fuel used, a
systematic procedure is proposed in Fig. 7 and applied in this
work. Based on vessel’s operating condition, there is a specific
power system load demand from D/Gs, PL,g. This load demand
is optimized by the proposed topology. Based on PL,g, and the
constraints described in the first section the PMS assigns a
number of D/Gs which perform load sharing if needed, with
PL,gi load assigned to each D/G. Then based on (10), the D/G
mechanical power, Pmech,gi, is calculated and used to obtain the
corresponding SFOCMDO value from D/G SFOC curve for
MDO use. The next step is to proportionally correct SFOC for
HFO use if needed. In that case SFOCHFO should be
compensated for HFO LCV as in Eq.21:
TABLE III
SUMMARY OF ANNUAL BENEFITS FOR THE VESSEL UNDER STUDY
500,39
700,42MDO
HFO
MDOMDOHFO SFOC
LCV
LCVSFOCSFOC (21)
Based on SFOC, D/G FOC can be calculated in tons according to (9). The corresponding GHG emissions can then be calculated according to (11)-(13). The economic benefits can be calculated from FOC based on fuel prices.
D. Economic benefits from the proposed topology
Based on the experimental results, on data acquired from the vessel and on the techno-economic assessment method mentioned in the previous section, the economic benefits of vessel’s power system energy and D/G fuel consumption are
calculated throughout the vessel’s operating profile. Results comparison is made before and after the proposed topology retrofit installation. More specifically, Fig. 8 shows the annual D/G fuel consumption and Fig. 9 presents the annual energy consumption and the respective economic benefits. It is taken for granted that always HFO is used throughout sea-going operation, 70% HFO and 30% MDO are used during port stay/loading operation, and MDO is always used during cargo discharging operation. 2013 and 2014 fuel prices are considered for all economic benefit calculations.
From Fig. 8 it is evident that the biggest benefit occurs during sea-going operation in slow-steaming condition, where M/E operates in the range between 55-60% of MCR. Results show that the annual savings in energy and D/G fuel consumption at sea-going condition are 557.3MWh and 163tn of HFO, validating the impact of the proposed system. Table III summarizes the annual benefits for the vessel under investigation.
V. CONCLUSIONS
In this paper, a topology was developed to optimize D/G operating profile and fuel consumption in autonomous power
systems of marine vessels, especially during sea-going period with M/E working at lower speed. It was shown that load variation compared to sea-trials has affected onboard power balance, often requiring PMS to run an additional D/G during sea-going operation to satisfy operational constraints. To this
end, a process control topology involving VFD application to E/R fans and C.S.W pump was proposed to exploit the power
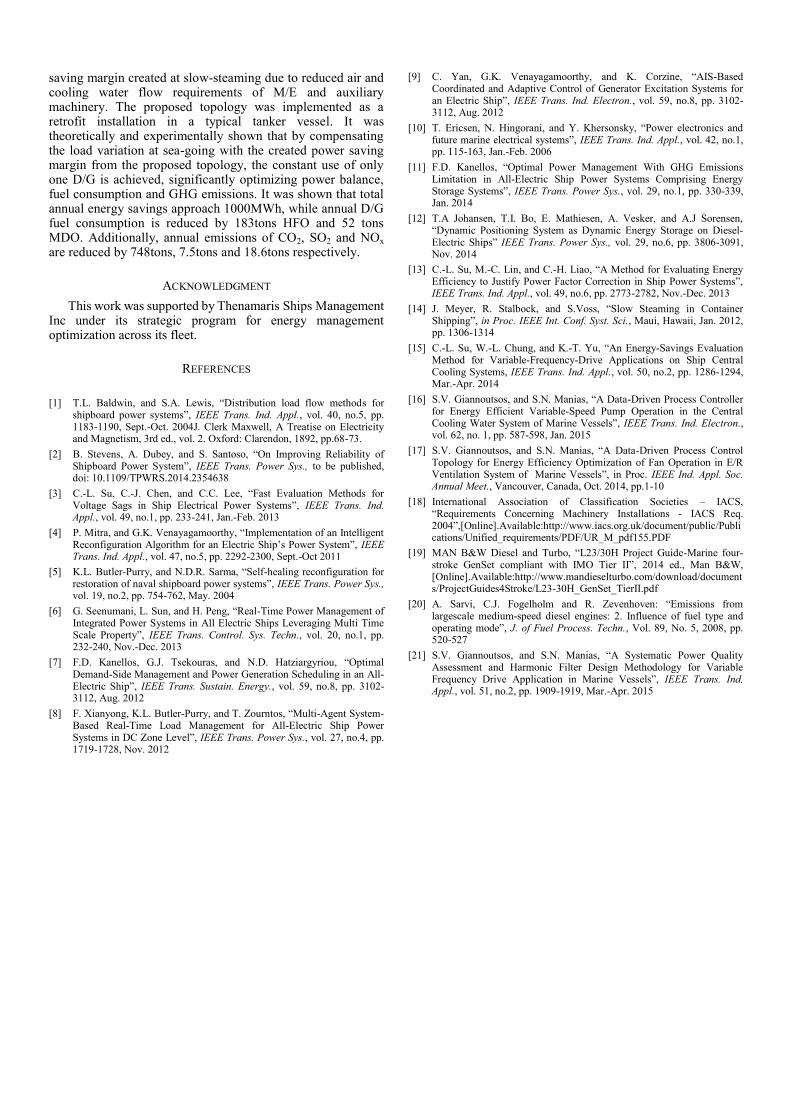
saving margin created at slow-steaming due to reduced air and cooling water flow requirements of M/E and auxiliary machinery. The proposed topology was implemented as a retrofit installation in a typical tanker vessel. It was theoretically and experimentally shown that by compensating the load variation at sea-going with the created power saving margin from the proposed topology, the constant use of only one D/G is achieved, significantly optimizing power balance, fuel consumption and GHG emissions. It was shown that total annual energy savings approach 1000MWh, while annual D/G fuel consumption is reduced by 183tons HFO and 52 tons MDO. Additionally, annual emissions of CO2, SO2 and NOx
are reduced by 748tons, 7.5tons and 18.6tons respectively.
ACKNOWLEDGMENT
This work was supported by Thenamaris Ships Management Inc under its strategic program for energy management optimization across its fleet.
REFERENCES
[1] T.L. Baldwin, and S.A. Lewis, “Distribution load flow methods for
shipboard power systems”, IEEE Trans. Ind. Appl., vol. 40, no.5, pp. 1183-1190, Sept.-Oct. 2004J. Clerk Maxwell, A Treatise on Electricity and Magnetism, 3rd ed., vol. 2. Oxford: Clarendon, 1892, pp.68-73.
[2] B. Stevens, A. Dubey, and S. Santoso, “On Improving Reliability of Shipboard Power System”, IEEE Trans. Power Sys., to be published, doi: 10.1109/TPWRS.2014.2354638
[3] C.-L. Su, C.-J. Chen, and C.C. Lee, “Fast Evaluation Methods for Voltage Sags in Ship Electrical Power Systems”, IEEE Trans. Ind. Appl., vol. 49, no.1, pp. 233-241, Jan.-Feb. 2013
[4] P. Mitra, and G.K. Venayagamoorthy, “Implementation of an Intelligent Reconfiguration Algorithm for an Electric Ship’s Power System”, IEEE Trans. Ind. Appl., vol. 47, no.5, pp. 2292-2300, Sept.-Oct 2011
[5] K.L. Butler-Purry, and N.D.R. Sarma, “Self-healing reconfiguration for restoration of naval shipboard power systems”, IEEE Trans. Power Sys., vol. 19, no.2, pp. 754-762, May. 2004
[6] G. Seenumani, L. Sun, and H. Peng, “Real-Time Power Management of Integrated Power Systems in All Electric Ships Leveraging Multi Time Scale Property”, IEEE Trans. Control. Sys. Techn., vol. 20, no.1, pp. 232-240, Nov.-Dec. 2013
[7] F.D. Kanellos, G.J. Tsekouras, and N.D. Hatziargyriou, “Optimal Demand-Side Management and Power Generation Scheduling in an All-Electric Ship”, IEEE Trans. Sustain. Energy., vol. 59, no.8, pp. 3102-3112, Aug. 2012
[8] F. Xianyong, K.L. Butler-Purry, and T. Zourntos, “Multi-Agent System-Based Real-Time Load Management for All-Electric Ship Power Systems in DC Zone Level”, IEEE Trans. Power Sys., vol. 27, no.4, pp. 1719-1728, Nov. 2012
[9] C. Yan, G.K. Venayagamoorthy, and K. Corzine, “AIS-Based Coordinated and Adaptive Control of Generator Excitation Systems for an Electric Ship”, IEEE Trans. Ind. Electron., vol. 59, no.8, pp. 3102-3112, Aug. 2012
[10] T. Ericsen, N. Hingorani, and Y. Khersonsky, “Power electronics and future marine electrical systems”, IEEE Trans. Ind. Appl., vol. 42, no.1, pp. 115-163, Jan.-Feb. 2006
[11] F.D. Kanellos, “Optimal Power Management With GHG Emissions Limitation in All-Electric Ship Power Systems Comprising Energy Storage Systems”, IEEE Trans. Power Sys., vol. 29, no.1, pp. 330-339, Jan. 2014
[12] T.A Johansen, T.I. Bo, E. Mathiesen, A. Vesker, and A.J Sorensen, “Dynamic Positioning System as Dynamic Energy Storage on Diesel-Electric Ships” IEEE Trans. Power Sys., vol. 29, no.6, pp. 3806-3091, Nov. 2014
[13] C.-L. Su, M.-C. Lin, and C.-H. Liao, “A Method for Evaluating Energy Efficiency to Justify Power Factor Correction in Ship Power Systems”, IEEE Trans. Ind. Appl., vol. 49, no.6, pp. 2773-2782, Nov.-Dec. 2013
[14] J. Meyer, R. Stalbock, and S.Voss, “Slow Steaming in Container Shipping”, in Proc. IEEE Int. Conf. Syst. Sci., Maui, Hawaii, Jan. 2012, pp. 1306-1314
[15] C.-L. Su, W.-L. Chung, and K.-T. Yu, “An Energy-Savings Evaluation Method for Variable-Frequency-Drive Applications on Ship Central Cooling Systems, IEEE Trans. Ind. Appl., vol. 50, no.2, pp. 1286-1294, Mar.-Apr. 2014
[16] S.V. Giannoutsos, and S.N. Manias, “A Data-Driven Process Controller for Energy Efficient Variable-Speed Pump Operation in the Central Cooling Water System of Marine Vessels”, IEEE Trans. Ind. Electron., vol. 62, no. 1, pp. 587-598, Jan. 2015
[17] S.V. Giannoutsos, and S.N. Manias, “A Data-Driven Process Control Topology for Energy Efficiency Optimization of Fan Operation in E/R Ventilation System of Marine Vessels”, in Proc. IEEE Ind. Appl. Soc. Annual Meet., Vancouver, Canada, Oct. 2014, pp.1-10
[18] International Association of Classification Societies – IACS, “Requirements Concerning Machinery Installations - IACS Req. 2004”,[Online].Available:http://www.iacs.org.uk/document/public/Publications/Unified_requirements/PDF/UR_M_pdf155.PDF
[19] MAN B&W Diesel and Turbo, “L23/30H Project Guide-Marine four-stroke GenSet compliant with IMO Tier II”, 2014 ed., Man B&W, [Online].Available:http://www.mandieselturbo.com/download/documents/ProjectGuides4Stroke/L23-30H_GenSet_TierII.pdf
[20] A. Sarvi, C.J. Fogelholm and R. Zevenhoven: “Emissions from largescale medium-speed diesel engines: 2. Influence of fuel type and operating mode”, J. of Fuel Process. Techn., Vol. 89, No. 5, 2008, pp. 520-527
[21] S.V. Giannoutsos, and S.N. Manias, “A Systematic Power Quality Assessment and Harmonic Filter Design Methodology for Variable Frequency Drive Application in Marine Vessels”, IEEE Trans. Ind. Appl., vol. 51, no.2, pp. 1909-1919, Mar.-Apr. 2015
978-1-4799-7993-6/15/$31.00 ©2015 IEEE
A Gate Drive Circuit for Normally-On SiC JFETs
with Self-Protection Functions against Overcurrent
and Shoot-Through Fault Conditions
Spyridon V. Giannoutsos, Student Member IEEE, Sotirios Kokosis, and Stefanos N. Manias, Fellow, IEEE
Department of Electrical and Computer Engineering
National Technical University of Athens (NTUA)
9, Iroon Polytechniou str. 15780 Athens, Greece
[email protected]; [email protected]
Abstract—Normally-On Silicon Carbide (SiC) JFETs are
considered promising switching semiconductor devices due to
their capability to operate in high voltages, frequencies and
temperatures. However, an efficient driving and protection
scheme is required to fully exploit their potential for use in power
converters. In this paper, a proposed self-protection topology is
integrated into a fast switching ac-coupled gate drive to minimize
fault detection time for the prevention of overcurrent and shoot-
through faults caused by the normally-on behavior of the device.
The developed topology uses the desaturation principle through a
sensing diode to detect drain-source voltage under overcurrent
condition. A configuration to keep the device in the off-switching
state in case of gate drive power supply failure is also included.
The gate drive itself applies forward bias to achieve lower on-
state resistance, while design considerations are described in
order to achieve fast switching times. A double pulse tester set-up
with a phase-leg configuration is used to experimentally verify
the performance of the proposed protection schemes under
various fault conditions as well as measure switching losses. The
standalone nature and easy parameterization of the proposed
driving and protection topology makes it suitable for use in any
power converter built with normally-On SiC JFETs.
Keywords— WBG Semiconductors; Silicon Carbide; SiC
JFETs; Desaturation; Normally-On; Protection; Gate drive;
Shoot-through fault
I. INTRODUCTION
During recent years, Silicon Carbide (SiC) power semiconductor device technology has become increasingly attractive for use in power converters over Si due to features that include operation in high temperatures, high voltage blocking capability, thermal conductivity, switching speed, low on-state resistance and low voltage drop [1]-[6]. In particular, JFETs are known to be highly mature among SiC semiconductor devices with normally-on depletion mode (DM) variants possessing the most favorable characteristics for use in high efficiency converters [7]-[9].
Whereas robust gate drive solutions have been presented for normally-off SiC JFET equivalents [10]-[11], the normally-on feature of DM SiC JFETs leads to critical challenges when these power devices operate in a power converter bridge leg configuration. Due to their normally-on feature, a negative
gate-to-source voltage, vgs, lower than pinch-off voltage, Vp, is required to turn-off the device. Therefore, a gate drive malfunction, a mismatch in gating signals or coupled noise through the Miller capacitance, Cgd, could lead to cross
conduction in an inverter bridge leg, causing shoot-through fault. To address the above, the gate drives proposed in [12]-[13] use an RCD network to operate the device in zero bias during on-state and close to its breakdown voltage during off-state. In these approaches, however, the lack of forward bias results in increased conduction losses, especially if pulse width modulation (PWM) techniques are used, since applied vgs may be negative during on-state while pulse width decreases. Moreover, the converter reliability is still vulnerable to overcurrent or shoot-through faults in one of its phase legs, caused by gate drive component or power supply failure.
To deal with these constraints, overcurrent protection methods based on desaturation technique are described and evaluated in [14]-[15]. The drawbacks of these solutions are that shoot-through fault can still occur in case of logic unit, driving circuit or power supply malfunction, while fault response time exceeds 10μs. To this end, a technique dealing with total gate drive power supply failure is presented in [16], where an IGBT and a relay are combined to form a bidirectional switch embedded in the converter dc-link. However, depending on input voltage, inductances and breaker response time, the SiC JFETs are still subject to overcurrent condition from the dc-link loop. Another protection approach to secure inverter operation at power-up without gate drive power supply is proposed in [17], where the impact of JFETs’ aging in the VSI is also evaluated. While the safety system is capable of running in elevated temperatures as well, it is configured to be applied only to SiC inverters. The concept of self-powered gate drive not depending on power supply failure, is introduced in [18]-[19], requiring the design of an LC resonant circuit in a start-up converter, operating for the first quarter of the first time
period. It is shown that a trade-off between performance and stability is required.
In this work, a standalone ac-coupled gate drive with integrated protection functions against overcurrent and shoot-through faults is developed and analyzed for use in power converters built with normally-on SiC JFETs. The gate
(a)
(b)
Fig. 1. Overview of the proposed self-protection topology integrated into the
gate drive for normally-on SiC JFETs (a) Layout of the proposed topology (b)
Laboratory prototype used for experimental verification
drive applies forward bias during on-state, achieving significant conduction and switching loss reduction in comparison to zero bias gate drives. Using a variation of the common RCD network in the output stage, gate-to-drain interactions that induce coupled noise are minimized. Apart from faults associated with distortion of vgs waveform, the proposed gate drive topology deals with power supply failure and overcurrent conditions by turning the device off within its specified fault withstand time (around 50μs). More specifically, the desaturation method is used to monitor drain-to-source voltage, vds, in order to detect overcurrent conditions based on the device saturation characteristics. An overcurrent protection topology clears the fault in less than 5μs by applying negative vgs, thus forcing transition to the off-state. In case of gate drive power supply failure, an additional configuration is activated to keep the device in off-state for sufficient time until converter isolation.
The integrated gate drive and protection topology, which is presented in Fig. 1(a) and implemented in a laboratory prototype, as shown in Fig 1(b), was built with the intention of minimizing parasitic elements. To this end, the topology was built with one layer dedicated to ground plane in order to minimize stray inductances. Throughout the study, the device
used is a TO-247 package, 1200V, 27A normally-on SiC JFET, model SJDP120R085. A double pulse tester set-up is used to experimentally verify the performance of the proposed protection schemes under various fault conditions as well as measure conduction and switching losses when the device operates in a converter bridge leg configuration.
II. PROPOSED GATE DRIVE CIRCUIT USING FORWARD BIAS
The device driving section of the proposed gate drive circuit is shown in Fig.2. The isolation stage, implemented with an optical isolator of reduced propagation delay, provides ohmic isolation between the converter control circuit and the gate drive. The embedded power supply and voltage regulator common nodes are connected to the respective JFET source, which is usually subject to fast changes in potential, enhancing the common mode immunity of the system and eliminating the need for using common mode chokes. The power stage consists of a totem pole N-MOS and P-MOS configuration that applies forward bias during conduction, +VCC, or negative bias at turn-off, -VSS, to the device gate-to-source terminals. The parameters of the output stage, consisting of three parallel R-C-D branches, are designed to optimize performance and minimize coupled noise during switching. The decoupling capacitor, Cg, provides a path to ground for parasitic current icgd during switching, by improving the current divider in the JFET gate terminal. Design considerations for each parameter are made by investigating the operating phases of the proposed driving circuit presented in Fig.3.
A. Device on-state operation
To reduce on-state resistance, Rds-on, a positive bias, +Vcc, is applied across gate-to-source terminals in order to keep the device turned-on. As shown in Fig. 3(a), the gate current, ig, flows through the parallel branch consisting of the Schottky diode Df and the series resistance Rf. According to the device ig - vgs characteristics at forward bias, Rf is selected according to the desired operating point [Vgs-fwd, Ig-fwd] during on-state condition, so that forward gate current ig-fwd is limited to a
desired value with reference to the voltage drop across Df, VDf, as expressed in Eq. 1:
fwdg
DffwdgsCC
fI
VVVR
,
(1)
To minimize gate drive power losses, the desired Ig-fwd is set at 20mA during on-state, corresponding to Vgs-fwd equal to 2.67V. Based on (1), Rf is set at 100Ω. At the same time, capacitance Cac of the upper branch is charged due to voltage difference vCac developed across its terminal during on-state, as shown in Eq. 2:
fwdgsCCCac V (2)
In this operating phase, the conduction energy losses depend on the conducting inverval, ton-state, as expressed in Eq.3:
stateonondsdstateonddsstateon tRitiW 2 (3)
Fig. 2. Proposed ac-coupled gate drive circuit for normally-on SiC JFETs, applying forward bias during device conduction
Fig. 3. Operating phases of the proposed gate drive circuit (a) Device on-
state operation (b) Device on-to-off state transition (c) Device off-state
operation (d) Device off-to-on state transition
B. Device on-to-off state transition
As shown in Fig. 3(b), during device turn-off transition, a
negative voltage, -VSS, is applied to gate-to-source terminals through the upper branch, consisting of Cac and Rac. Nevertheless, since Cac was previously charged, the applied vgs is more negative than –VSS as expressed as in Eq. 4:
CacSSgs V (4)
The series resistance, Rac is selected so that the discharging time of the device intrinsic capacitance Cgs is as small as possible in the range 3-10Ω, while at the same time vds and id oscillations are minimized. For proper value selection, the power stage output resistance and device gate resistance, RG, has to be considered. In this application, Rac is chosen as 5Ω.
Moreover, the capacitance Cac is calculated as in Eq. 5:
Cac
CgCac
acV
QQC
(5)
where QCac is the charge equal to the one required by the device during turn-off switching, QSiC, while QCg is the charge
of the external capacitance Cg, used for minimizing coupled noise. Based on (2) and (5), capacitor Cac should be selected within the range defined by Eq. 6:
fwdgCC
SiCg
ac
fwdgCC
SiCgSS
VV
QQC
VV
QCV
2 (6)
Since the operating point is chosen at the knee of Ig-Vgs characteristic as shown in Fig.4, the limits obtained for Cac are 41.6nF and 65nF according to (6). Therefore, Cac is chosen to be 47nF to achieve optimum performance. Switching losses during on-to-off transition depend on turn-off time, toff, and are calculated by Eq.7:
offt
ddsoffsw dttitW0
)()( (7)
C. Device off-state operation
To limit potential gate breakdown current, Ibr, which may flow in case vgs greatly exceeds Vp with temperature increase, the circuit consisting of a fast recovery Schottky diode, Dp, and a high value resistor in series, Rp, is included in the output stage, as shown in Fig.3(c). The value of Rp is defined by Eq.8
in order to limit the potential avalanche current:
br
gsSS
pI
VR
(8)
A 3kΩ resistor was chosen for this application. Provided that
the normally-on SiC JFET does not enter breakdown region,
the decrease of Rp contributes to dealing with gate-to-drain
interactions, since a low resistance path is formed for the
parasitic current icgd, which flows towards –VSS.
D. Device off-to-on state transition
As shown in Fig. 3(d) during turn-on transition, forward bias, +VCC, is applied to the gate through the output stage branch consisting of Rac and Cac, which is fully discharged from
(a)
(b)
Fig. 4. Normally-on SiC JFET device under test (DUT) (a) ig-vgs
characteristics at forward bias with selected operating point during conduction (b) id-vds saturation characteristics at various temperatures (25oC, 100oC, and
150oC)
the previous operating condition. The switching losses during off-to-on transition can be calculated by Eq. 9:
ont
ddsonsw dttitW0
)()( (9)
The gate driver component selection for the laboratory prototype used in the experiments is presented in Table I.
III. PROPOSED GATE-DRIVER SELF-PROTECTION TOPOLOGY
To protect against overcurrent condition, gate drives built for conventional bipolar semiconductor devices (e.g IGBTs) monitor the current rise and trigger a protection circuit when
TABLE I
COMPONENT SELECTION FOR GATE DRIVE CIRCUIT (FIG.2)
the device pulls out of saturation, resulting in increased collector-emitter voltage. However, unlike most Si devices featuring high impedance constant current active region, transition from ohmic to active region for SiC JFETs is not clearly defined, requiring a different approach. Furthermore, under higher switching speeds, the noise immunity of desaturation circuit should be enhanced in order to avoid false triggering of the protection circuit, while maintaining a fast response time of about 5μs.
The desaturation protection method implemented hereby involves monitoring of voltage drop across drain-to-source terminals, vds, only during conduction of SiC JFET. During normal operation, vds remains less than few hundred mV. When an overcurrent condition occurs, vds increases rapidly following a temperature dependent saturation curve, triggering an overcurrent protection circuit integrated into the gate drive. Regarding the normally-on SiC JFET under study, the ig-vgs characteristics are presented in Fig. 4(a), showing the selected forward bias operating point during conduction phase [Vgs-fwd,Ig-fwd]=[2.67V, 20mA]. In Fig. 4(b), the id - vds
characteristics are provided for temperature range of 25oC-
150oC. It is shown that for a given drain-to-source voltage
drop, the corresponding drain current fault threshold, id, highly depends on ambient temperature. In particular, for a 2V vds
voltage drop level during fault, the corresponding drain current would be 32A at 25
oC, 18A at 100
oC and 14A at
150oC, indicating the need to define vds level that triggers the
protection circuit in relation to ambient temperature.
A. Design of the gate-driver self-protection topology
The design layout of the proposed self-protection topology interacting with the gate drive circuit for normally-on SiC JFETs is presented in Fig. 5. More specifically, it includes two
circuits with protective functions against overcurrent or shoot-through fault conditions during normal gate drive power
supply operation, as shown in Fig. 5(a), and protective functions against gate drive power supply failure, as presented in Fig. 5(b).
1) Overcurrent protection based on desaturation method: The overcurrent protection circuit based on desaturation fault detection method that is implemented in this work is presented in Fig. 5(a). A high voltage fast recovery diode, Dss, whose anode is positively biased with +Vcc, is connected to drain terminal of the normally-on SiC JFET and thus conducts only when the semiconductor switch is in on-state. Once anode
(a)
(b)
Fig. 5. Design of the proposed self-protection topology interacting with the
gate drive for normally-on SiC JFETs (a) Proposed overcurrent protection
circuit based on desaturation fault detection method (b) Proposed gate drive
power supply failure protection circuit
voltage is filtered from spikes and parasitic noise through the low pass filter comprising of Rin and Cin, the signal vdesat is compared to reference voltage, Vref, using a comparator which features fast response time. The fault response time relies on blanking time delay required for vds to reach its fault triggering value following the specific temperature-dependent saturation curve, while vdesat is a function of vds, as in Eq. 10:
ssonDssindsdesat iRRtt )()()( , (10)
where RDss,on is the Dss on-resistance and iss is the current flowing through this diode during conduction state.
The reference voltage, Vref, is set by resistors Rref1 and Rref2 to define the level of desired overcurrent drain current limit, Id,limit, where the comparator would produce a fault signal. To ensure that comparison of vdesat and Vref signals takes place only while the SiC JFET is in the on-state, the circuit that
includes N-Mosfets Mcomp and Mgd interfaces with the gate drive (DRIVE signal) to impose –Vss to the non-inverting input of the comparator during off-state, avoiding any false fault triggering at this period. More specifically, when the gate drive outputs negative voltage –Vss, lower than Vp, to turn-off the SiC JFET, Mgd is cut-off and Mcomp turns-on, leading to Vdesat equal to –Vss. On the other hand, while SiC JFET is in the on-state, the gate drive outputs +Vcc, turning-on Mgd and turning-off Mcomp, so that vdesat follows JFET saturation curve.
Nevertheless, effective synchronization of vgs with vdesat signal during transients is required. In particular, if there is delay in vdesat transition towards low potential, -Vss, and vgs has already reached –Vss due to SiC JFET blanking time, a false error signal will be triggered by the comparator. To overcome this issue, a filter formed by Rdel, Ddel and Cdel was designed to introduce the desirable delay in the turn-off transition of Mcomp, while simultaneously accelerate its turn-on process according to time constants described in Eq.11:
deldelgdoffMcomp
delgdonMcomp
CRRt
CRt
)( 2,
1, (11)
When a fault error signal is triggered by the comparator, it is received by the logic control unit, which includes an RS latch circuit. Its role is to flip and hold at high level output when a fault is detected. This signal is normalized to 3.3V through a zener diode, Zsig, to be provided as a flag signal to the SiC JFET gate signal controller in order to command removal of gating signals. The output of the RS latch is also used to drive the overcurrent protection circuit at the next stage, the role of which is to impose negative potential equal to –Vss to SiC JFET gate-to-source terminals in order to effectively turn-off the device in case an overcurrent fault is detected. To this end, an optocoupler acts as a buffer between the logic unit and the overcurrent protection circuit, while at the same time outputs 0V in case a fault is detected (its output is –Vss if no fault appears). A zener diode with suitable breakdown voltage, Zpr, whose anode is negatively biased at –Vss, regulates negative bias at node C at such level, so that the N-Mosfet, Mpr, is turned-on in case of fault, enforcing negative voltage –Vss at SiC JFET gate-to-source terminals from the gate drive power supply through a fast recovery diode, Dpr. A reset signal acting on the logic unit RS latch must be provided by the user after the overcurrent fault is detected in order to restore proper system operation. It is vital that the overcurrent protection scheme is designed so that fault detection and clearance is made in less than 5μs to limit the rise of fault current to acceptable levels.
2) Gate drive power supply failure protection circuit: The
proposed overcurrent protection scheme based on the
desaturation method functions properly only when gate drive
power supply remains constant and adequate. In case of power
supply failure, the gate driver will not be able to turn-off the
normally-on SiC JFET and the overcurrent protection scheme
will not be able to impose negative voltage to gate-to-source
terminals to keep the device in the off-state, causing shoot-
through fault in converters including phase leg configurations,
such as voltage source inverters (VSIs).
TABLE II
COMPONENT SELECTION FOR OVERCURRENT PROTECTION CIRCUIT-FIG.5(A)
To address this issue, a power supply failure protection circuit, presented in Fig. 5(b), is integrated into the gate drive and keeps the device in the off-state for sufficient time for the converter to be isolated from its power source. The level of gate drive power supply, +Vss, is monitored by a Zener diode, Zsup, whose breakdown voltage is selected to establish the desired level of acceptable power supply voltage. A combination of optocouplers is used to control the conduction of a N-Mosfet switch, Mdis, which in turn controls the discharge of an electrolytic capacitor, Cf, to the gate-to-source terminals of the normally-on SiC JFET, which remains in the off-state until the converter is isolated.
During normal gate drive power supply operation, Mdis is in the cut-off region, while the zener diode, ZD, whose anode is negatively biased with –Vss and its cathode is connected to ground, regulates the gate-to-source voltage of N-Mosfet, Mch, to be about 5V. Since the source of Mch is connected to –Vss and capacitor Cf is not charged, it is valid that Vds,Mch < Vgs,Mch = 5V, so Mch initially conducts in the ohmic (or triode) region. Since the diode, Dch, is conducting as long as Mch is conducting (Vgs,Mch > 0V), capacitor Cf is charging with voltage expressed as in Eq. 12:
tCRRR
fM,chchd,ch
SSCfchMchchd
fe
CRRRVt
)(
1
,,
)(
1)( (12)
where Rd,ch and RM,ch are the on-state resistances of Dch and Mch
respectively. Rch defines the charging speed of Cf ; the higher
is Rch, the slower is Cf charging speed.
In case of inadequate gate drive power supply, the zener diode, Zsup, regulates the voltage level at the input of the first optocoupler so that its output is –VSS. The gate voltage of N-Mosfet, Mdis, is then vg,Mdis = 0V, while the negative terminal of the previously charged electrolytic capacitor, Cf, is connected to the source of Mdis, leading to Vgs,Mdis = +VSS, which turns it on. Therefore, Cf discharges at the SiC JFET gate-to-source terminals through the path formed by Mdis, and
TABLE III
COMPONENT SELECTION FOR GATE DRIVE POWER SUPPLY FAILURE
PROTECTION CIRCUIT-FIG.5(B)
Ddis, and its voltage during this period is expressed by Eq.13:
0),1()0()()(
1
,,
tet
tCRR
CCfdisddisM
f (13)
where vC(0+) is the initial capacitor charge when gate drive
power supply failure occurs, while RM,dis and Rd,dis are the on-
state resistances of Mdis and Ddis respectively. At the same
time, a signal called EN is sent to the enable input of the gate
drive power stage IC to block the gating signals and another
signal is sent to the converter control circuit which provides
the command for the converter to be isolated. The discharge of
Cf via Dch is prevented during power supply failure, since Mch
is in the cut-off region.
B. Implementation of proposed self-protection topology
For the laboratory prototype used in the experiments, component selection for the overcurrent protection circuit presented in Fig. 5(a) is made as shown in Table II. To achieve minimum delays for fault detection and clearance, the propagation delays for the major components, including the sensing diode, comparator, logic unit and optocoupler were chosen 120ns, 200ns, 100ns and 300ns respectively. Similarly, component selection for the gate drive power supply failure protection circuit implemented in the prototype is made as shown in Table III.
IV. EXPERIMENTAL RESULTS AND DISCUSSION
A. Experimental set-up and testing conditions
The performance of the proposed gate drive topology is investigated using the experimental set-up presented in Fig. 6(a). It is a double pulse tester, comprising a 600Vdc source, a 350μH inductor load and two freewheeling SiC diodes. Two identical gate drive topologies are used to supply the upper normally-on SiC JFET and the DUT, interfacing with the control unit that provides the gating signals to the gate drive prototypes. The control unit, implemented with a TI F28335 digital signal processor (DSP), receives the input signals for power supply failure and overcurrent conditions in order to remove the gating signals and isolate the inverter.
(a)
(b)
Fig. 6. Experimental set-up and testing conditions of proposed gate driver
circuit (a) Double pulse tester (b) Peak currents applied to the SiC JFET gate
during turn-on and turn-off
To achieve fast gate drive response times under high switching frequencies, high current peaks were applied at the gate of the normally-on SiC JFET during turn-on and turn-off transients, which in turn affect the response of vgs. As shown in Fig.6(b), for a switching frequency of 2MHz, the gate current peaks, ig,p-p, applied by the gate drive during device turn-on and turn-off transients are 1.1A and 1.5A respectively with a pulse width of 60ns. The corresponding switching times for vgs are ton = 35ns during turn-on and toff = 60ns during turn-off. As shown in Fig.6(b), a positive bias of Vgs-fwd = 2.67V is applied during on-state according to the operating point selected in Fig. 4(a), leading to 7% reduction in conduction losses. Moreover, while turn-off voltage provided by the gate drive is -15V, vgs reaches -18V according to (4), before Cac is fully discharged.
B. Gate drive performance evaluation during transients
The gate drive response during device turn-on process is evaluated from the SiC JFET turn-on characteristics presented in Fig.7(a) for Vdc = 600V, switching frequency, fsw, equal to 25kHz, and 10A load current. It is shown that di/dt for drain current, id, is equal to 0.5kA/μs, resulting in a very fast turn-on time, ton, equal to 20ns. Similarly, vds rises from 0V to 300V with dv/dt equal to 15kV/μs. It is also shown that the design of gate drive results in vgs waveform being free of oscillations that
(a)
(b)
Fig. 7. Performance evaluation of proposed gate drive during transients (fsw =
25kHz, Vdc = 600V, Id =10A) (a) Switching performance evaluation at turn-on
(b) Switching performance evaluation at turn-off
would induce potential gate punch-through or shoot-through faults. According to (9), the switching losses at turn-on depend on turn-on time, ton, where crossover between vds and id waveforms occurs. Based on the experimental results, zero voltage switching (ZVS) takes place, since id begins to rise after vds has almost reached zero. This event leads to practically zero switching losses at turn-on, Wsw-on, which is also visible from switching losses waveform included in Fig. 7(a). The quality of vds and id waveforms during transients is also improved, featuring low overshoots and fast settling times.
The evaluation of gate drive response during the device turn-off process is carried out by examining the SiC JFET turn-off characteristics presented in Fig.7(b) for Vdc equal to 600V, fsw equal to 25kHz and 10A load current. It is shown that di/dt of id is equal to 0.5kA/μs, resulting in a very fast turn-off time, toff, equal to 22ns. Similarly, vds drops from 300V to 0V with dv/dt equal to 13.6kV/μs. It is also shown that vgs waveform is free of oscillations and reaches -18.5V before settling at -15V to sustain the device at off-state. According to (7), the switching losses at turn-off depend on turn-off time, toff, where crossover interval between vds and id
Fig. 8. Experimental evaluation of gate drive overcurrent protection circuit
response, using the implemented desaturation fault detection method, under a shoot-through fault condition (Vref = 3V, Id,limit = 45A, 25oC). Waveforms
include vds, vgs, id and comparator voltage signal, vdesat
waveforms occurs. Based on the experimentally obtained transients, the switching losses distribution waveform at turn-off is derived and presented in Fig.7(b). It is shown that switching losses at turn-off, Wsw-off, are limited to 180μJ, verifying the driving circuit performance.
C. Performance evaluation of overcurrent protection scheme
based on desaturation method
To validate the proposed overcurrent protection scheme performance, a shoot-through fault is caused in the phase leg implemented with SiC JFETs. This is performed by providing a single pulse that turns-on the upper device while the lower DUT is switching at 25kHz. The objective is to measure response time, tr, until the fault is cleared as well as the maximum value that the fault current, Id,max, reaches before it is limited and cleared by the protection circuit. For that purpose, the desired overcurrent limit of drain current is set at Id,limit = 45A, which will yield a drain- to-source voltage of Vds,limit = 3V, according to device saturation curve that
corresponds to the 25oC characteristic, as shown in Fig.4(b).
Therefore, the voltage level of signal vdesat provided to the comparator non-inverting input should rise from few mVs (during normal operation) up to a voltage level higher than the Vds,limit according to (10). Thus, in order to detect and clear the specified level of overcurrent, Id,limit, the comparator reference voltage, Vref, is set via Rref1 to 3V.
Experimental results presented in Fig.8 involve response to overcurrent condition for Vdc = 400V and SiC JFET operation at 25
oC. Before the fault occurs, it is shown that signal vdesat
swings between two values; from a few mV during JFET conduction to -15V while the SiC JFET is in the off-state. This verifies that fault detection takes place only during JFET on-state, while proper synchronization with vgs contributes towards avoid false protection circuit triggering. When the shoot-through fault occurs, id rises with very high di/dt, leading to vds rising according to the device saturation curve at 25
oC, which is sensed by diode Dss. At the exact moment
where specified Id,limit is reached, it is shown that vdesat has risen by ΔVdesat = 4V, triggering a fault signal which is provided to the converter control circuit in order to stop gating signals as well as to the overcurrent protection circuit that imposes -15V to the device gate-to-source terminals from the gate drive power supply. The protection topology response time, tr, is defined from the moment the drain current exceeds the specified limit of Id,limit = 45A until vds becomes equal to Vdc and the fault is cleared. Thus it is experimentally shown that overcurrent condition lasts for tr = 3.5μs, while the maximum level that fault current reaches within this period is Id,max = 70A. Both values are well within limits that the semiconductor device can withstand, verifying the effectiveness of the approach. It is also shown that while the fault is detected within 3.0μs, id drops down from 75A to zero within 0.5μs, validating the overcurrent circuit response. Afterwards, the overcurrent protection circuit keeps the device in the off-state until a reset signal is provided to the logic unit by the user to restore operation.
D. Performance evaluation of protection scheme under gate-
driver power supply failure condition
In order to extract the performance characteristics of the protection circuit presented in Fig.5(b), total power supply failure is caused by switching-off the gate drive power supply while the device operates at 25kHz with Vdc =100V. The response characteristics of the proposed protection circuit are presented in Fig.9. The objective is to evaluate how fast the switch is turned-off as well as the time frame allowed for the converter to be successfully isolated.
From the zoomed view of Fig.9, it is shown that when the gate drive power failure occurs, vp-fail signal measured at SiC JFET gate changes from zero to -15V within less than 0.2μs, since Mdis is turned-on and the previously charged capacitor, Cf, is discharging at the device gate through Ddis. The signal EN is at the same time triggering the enable function of the gate drive power stage IC which blocks the gating signals. From the zoomed out version of the response, it is shown that vgs follows the vp-fail signal according to Cf discharge curve, so the SiC JFET remains in the off-state for 16.8s, which is sufficient time for converter control circuit to command the isolation of power converter from its main power supply. The higher the capacity of the discharging capacitor, the longer is the available time frame for successful converter isolation. However, thorough monitoring of the capacitor condition is important for the reliability of the proposed circuit.
V. CONCLUSIONS
In this paper, a fast forward-biased gate drive circuit
featuring protection functions against overcurrent and gate
drive power supply failure conditions was designed and
implemented for normally-on SiC JFETs used in power
converter applications. Significant design considerations were
discussed for each proposed solution. A laboratory prototype
was built to evaluate the driving and protection schemes. From
the experimental results, it was shown that switching between
operating states takes place within 20ns, achieving transients with minimized overshoot and settling times, while conduction losses are also reduced. The total switching losses
Fig. 9. Experimental evaluation of gate drive power supply failure protection circuit response, following a power supply failure at 25kHz. The waveforms
presented are gate-to-source voltage vgs, capacitor discharge voltage at SiC JFET terminals, vp-fail, drain current, id, and drain-to-source voltage, vds
are limited to 180μJ, while ZVS occurs at turn-on. The
protection functions address all faults associated with the
normally-on characteristic. More specifically, the shoot-
through fault is detected using the desaturation fault detection
method and is cleared within 3.5μs, while the overcurrent
protection circuit can be easily parameterized to act at a
specific fault current level. In case of gate drive power supply
failure, a time frame of 16.8s is provided to effectively isolate
the power converter from its main power.
ACKNOWLEDGMENT
This work was financially supported by the European 7th
Framework Research Program “ANTI-SiC 09 SYN-32-1181”
REFERENCES
[1] J. Rabkowski, D. Peftitsis, and H.-P. Nee, “Silicon Carbide Power Transistors: A New Era in Power Electronics Is Initiated”, IEEE Ind. Electron. Mag., vol.6, no.2, pp. 17-26, Jun. 2012
[2] J. Millan, P. Godignon, X. Perpina, A. Perez-Thomas, and J. Rebollo, “A Survey of Wide Bandgap Power Semiconductor Devices”, IEEE Trans. Power Electron., vol. 29, no. 5, pp. 2155-2163, May 2014
[3] Q. Haihong, Z. Bin, N. Xin, W. Jiaopu, and Y. Yangguang, “Overview of SiC power devices and its applications in power electronic converters”, in Proc. IEEE Ind. Electron. and Appl. Conf., Melbourne, Australia, Jun. 2013, pp. 466-471
[4] J. Biela, M. Schweizer, S Waffler, and J.W Kolar, “SiC versus Si—Evaluation of Potentials for Performance Improvement of Inverter and DC–DC Converter Systems by SiC Power Semiconductors”, IEEE Trans. Ind. Electron., vol. 58, no. 7, pp. 2872-2882, Jul. 2011
[5] B. Zhao, Q. Song, and L. Wenhua, “Experimental Comparison of Isolated Bidirectional DC–DC Converters Based on All-Si and All-SiC Power Devices for Next-Generation Power Conversion Application”, IEEE Trans. Ind. Electron., vol. 61, no. 3, pp. 1389-1393, Mar. 2014
[6] H. Zhang, and L.M. Tolbert, “Efficiency Impact of Silicon Carbide Power Electronics for Modern Wind Turbine Full Scale Frequency Converter”, IEEE Trans. Ind. Electron., vol. 58, no. 1, pp. 21-28, Jan. 2010
[7] B. Zhao, Q. Song, L. Wenhua, and S. Yandong, “Characterization and application of next-generation SiC power devices for high-frequency isolated bidirectional DC-DC converter”, in Proc. IEEE Ind. Electron. Soc. Ann. Conf., Montreal, Quebec, Oct. 2012, pp. 281-286
[8] A. Rodriguez Alonso, M. Ferndndez Diaz, D.G. Lamar, M. Arias Perez de Azpeitia, M.M. Hernando, and J. Sebastian, “ Switching Performance Comparison of the SiC JFET and SiC JFET/Si MOSFET Cascode Configuration”, IEEE Trans. Power Electron., vol. 29, no. 5, pp. 2428-2440, May 2014
[9] H. Di, J. Noppakunkajorn, and B. Sarlioglu, “Analysis of a SiC three-phase voltage source inverter under various current and power factor operations”, in Proc. IEEE Ind. Electron. Soc. Ann. Conf., Vienna, Austria, Oct. 2013, pp. 447-452
[10] T. Friedli, S.D. Round, D. Hassler, and J.W. Kolar, “Design and Performance of a 200-kHz All-SiC JFET Current DC-Link Back-to-Back Converter”, IEEE Trans. Ind. Appl., vol. 45, no. 5, pp. 1868-1878, Sept.-Oct. 2009
[11] B. Wrzecionko, D. Bortis, J. Biela, and J.W. Kolar, “Novel AC-Coupled Gate Driver for Ultrafast Switching of Normally Off SiC JFETs”, IEEE Trans. Power Electron., vol. 27, no. 7, pp. 3452-3463, Jul. 2014
[12] B. Wrzecionko, D. Bortis, and J.W. Kolar, “A 120 °C Ambient Temperature Forced Air-Cooled Normally-off SiC JFET Automotive Inverter System”, IEEE Trans. Power Electron., vol. 29, no. 5, pp. 2345-2358, May 2014
[13] S. Round, M. Heldwein, J. Kolar, I. Hofsajer, and P. Friedrichs, “A SiC JFET driver for a 5 kW, 150 kHz three-phase PWM converter”, in Proc. IEEE Ind. Appl. Soc. Ann. Conf., Kowloon, Hong Kong, Oct. 2005, pp. 410-416
[14] S.V. Giannoutsos, P. Pachos, and S.N. Manias, “Performance evaluation of a proposed gate drive circuit for normally-ON SiC JFETs used in PV inverter applications”, in Proc. IEEE Energy Conf. and Exh., Florence, Italy, Sept. 2012, pp. 26-31
[15] D. Bergogne, D. Risaletto, F. Dubois, A. Hammoud, H. Morel, P. Bevilacqua, B. Allard, O. Berry, F. Meibody-Tabar, S. Rael, R. Meuret, S. Dhokkar, and S. Hispano, “Normally-On SiC JFETs in power converters: Gate driver and safe operation”, in Proc. IEEE Int. Power Electron. Syst. Conf., Nuremberg, Germany, Mar. 2010, pp.1-6
[16] R.L. Kelley, M.S. Mazzola, W.A. Draper, and J. Casady, “Inherently safe DC/DC converter using a normally-on SiC JFET”, in Proc. IEEE Appl. Power Electron. Conf. and Exp., Austin, Texas, Mar. 2005, pp. 1561-1565
[17] R. Lai, F. Wang, R. Burgos, D. Boroyevich, D. Zhang, and P. Ning, “A Shoot-Through Protection Scheme for Converters Built With SiC JFETs”, IEEE Trans. Ind. Appl., vol. 46, no. 6, pp. 2495-2500, Nov.-Dec. 2010
[18] D. Risaletto, D. Bergogne, F. Dubois, H. Morel, B. Allard, and R. Meuret, “A 200 °C Safety System at Power-Up of Normally On SiC JFETs Inverters”, IEEE Trans. Power Electron., vol. 29, no. 5, pp. 2338-2344, May 2014
[19] D. Peftitsis, J. Rabkowski, and H.-P. Nee, “Self-Powered Gate Driver for Normally ON Silicon Carbide Junction Field-Effect Transistors Without External Power Supply”, IEEE Trans. Power Electron., vol. 28, no. 3, pp. 1488–1501, Mar. 2013
[20] D. Peftitsis, J. Rabkowski, and H.-P. Nee, “Self-Powered Gate Driver for Normally-ON SiC JFETs: Design Considerations and System Limtations”, IEEE Trans. Power Electron., vol. 29, no. 10, pp. 5129-5135, Oct. 2014
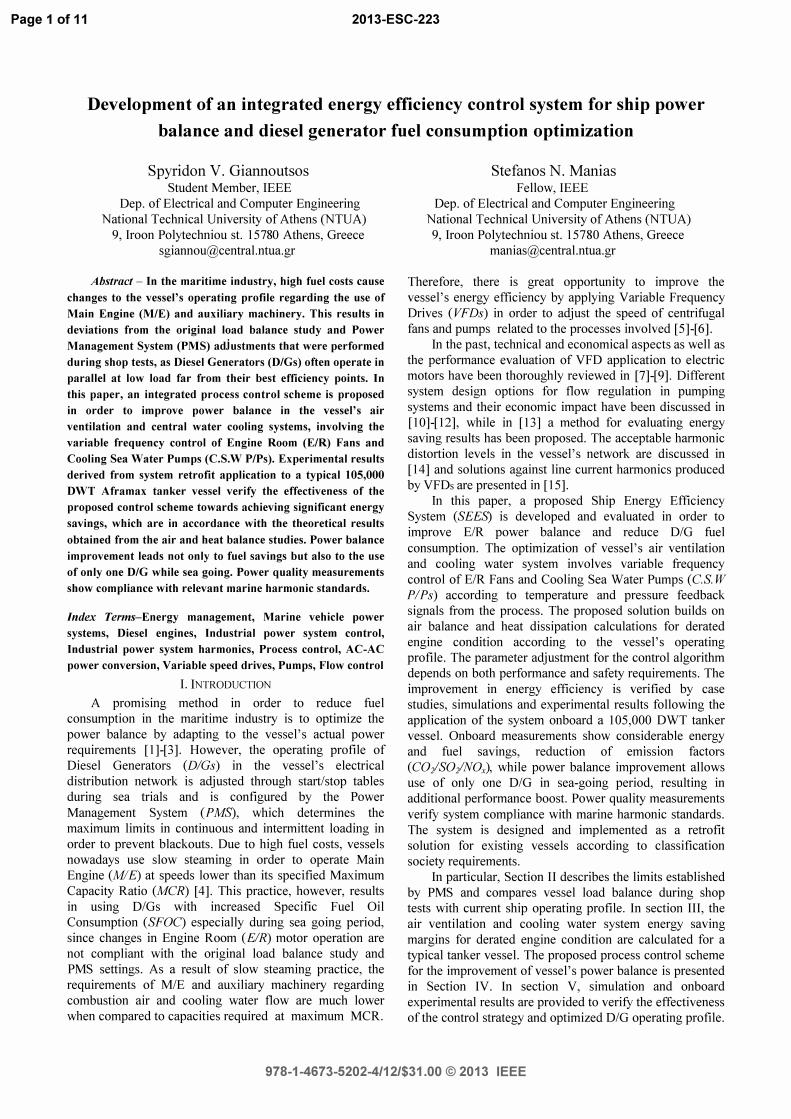
Page 1 of 11 2013-ESC-223
Development of an integrated energy efficiency control system for ship power balance and diesel generator fuel consumption optimization
Spyridon V. Giannoutsos Student Member, IEEE
Dep. of Electrical and Computer Engineering National Technical University of Athens (NTUA)
9, lroon Polytechniou st. 15780 Athens, Greece [email protected]
Abstract - In the maritime industry, high fuel costs cause
changes to the vessel's operating profile regarding the use of
Main Engine (M/E) and auxiliary machinery. This results in
deviations from the original load balance study and Power
Management System (PMS) adjustments that were performed
during shop tests, as Diesel Generators (DIGs) often operate in
parallel at low load far from their best efficiency points. In
this paper, an integrated process control scheme is proposed
in order to improve power balance in the vessel's air
ventilation and central water cooling systems, involving the
variable frequency control of Engine Room (E/R) Fans and
Cooling Sea Water Pumps (C.S.W PIPs). Experimental results
derived from system retrofit application to a typical 105,000 DWT Aframax tanker vessel verify the effectiveness of the
proposed control scheme towards achieving significant energy
savings, which are in accordance with the theoretical results
obtained from the air and heat balance studies. Power balance
improvement leads not only to fuel savings but also to the use
of only one DIG while sea going. Power quality measurements
show compliance with relevant marine harmonic standards.
Index Terms-Energy management, Marine vehicle power
systems, Diesel engines, Industrial power system control,
Industrial power system harmonics, Process control, AC-AC
power conversion, Variable speed drives, Pumps, Flow control
I. INTRODUCTION
A promising method in order to reduce fuel consumption in the maritime industry is to optimize the power balance by adapting to the vessel's actual power requirements [1]-[3]. However, the operating profile of Diesel Generators (DIGs) in the vessel's electrical distribution network is adjusted through startlstop tables during sea trials and is configured by the Power Management System (PMS), which determines the maximum limits in continuous and intermittent loading in order to prevent blackouts. Due to high fuel costs, vessels nowadays use slow steaming in order to operate Main Engine (M/E) at speeds lower than its specified Maximum Capacity Ratio (MCR) [4]. This practice, however, results in using DIGs with increased Specific Fuel Oil Consumption (SFOC) especially during sea going period, since changes in Engine Room (EIR) motor operation are not compliant with the original load balance study and PMS settings. As a result of slow steaming practice, the requirements of MIE and auxiliary machinery regarding combustion air and cooling water flow are much lower when compared to capacities required at maximum MCR.
Stefanos N. Manias Fellow, IEEE
Dep. of Electrical and Computer Engineering National Technical University of Athens (NTUA) 9, lroon Polytechniou st. 15780 Athens, Greece
Therefore, there is great opportunity to improve the vessel's energy efficiency by applying Variable Frequency Drives (VFDs) in order to adjust the speed of centrifugal fans and pumps related to the processes involved [5]-[6].
In the past, technical and economical aspects as well as the performance evaluation of VFD application to electric motors have been thoroughly reviewed in [7]-[9]. Different system design options for flow regulation in pumping systems and their economic impact have been discussed in [10]-[12], while in [13] a method for evaluating energy saving results has been proposed. The acceptable harmonic distortion levels in the vessel's network are discussed in [14] and solutions against line current harmonics produced by VFDs are presented in [15].
In this paper, a proposed Ship Energy Efficiency System (SEES) is developed and evaluated in order to improve E/R power balance and reduce DIG fuel consumption. The optimization of vessel's air ventilation and cooling water system involves variable frequency control of EIR Fans and Cooling Sea Water Pumps (C.s. W PIPs) according to temperature and pressure feedback signals from the process. The proposed solution builds on air balance and heat dissipation calculations for derated engine condition according to the vessel's operating profile. The parameter adjustment for the control algorithm depends on both performance and safety requirements. The improvement in energy efficiency is verified by case studies, simulations and experimental results following the application of the system onboard a 105,000 DWT tanker vessel. Onboard measurements show considerable energy and fuel savings, reduction of emISSIOn factors (CO/SO/NOx), while power balance improvement allows use of only one DIG in sea-going period, resulting in additional performance boost. Power quality measurements verity system compliance with marine harmonic standards. The system is designed and implemented as a retrofit solution for existing vessels according to classification society requirements.
In particular, Section II describes the limits established by PMS and compares vessel load balance during shop tests with current ship operating profile. In section III, the air ventilation and cooling water system energy saving margins for derated engine condition are calculated for a typical tanker vessel. The proposed process control scheme for the improvement of vessel's power balance is presented in Section IV. In section V, simulation and onboard experimental results are provided to verify the effectiveness of the control strategy and optimized DIG operating profile.
978-1-4673-5202-4/12/$31.00 © 2013 IEEE
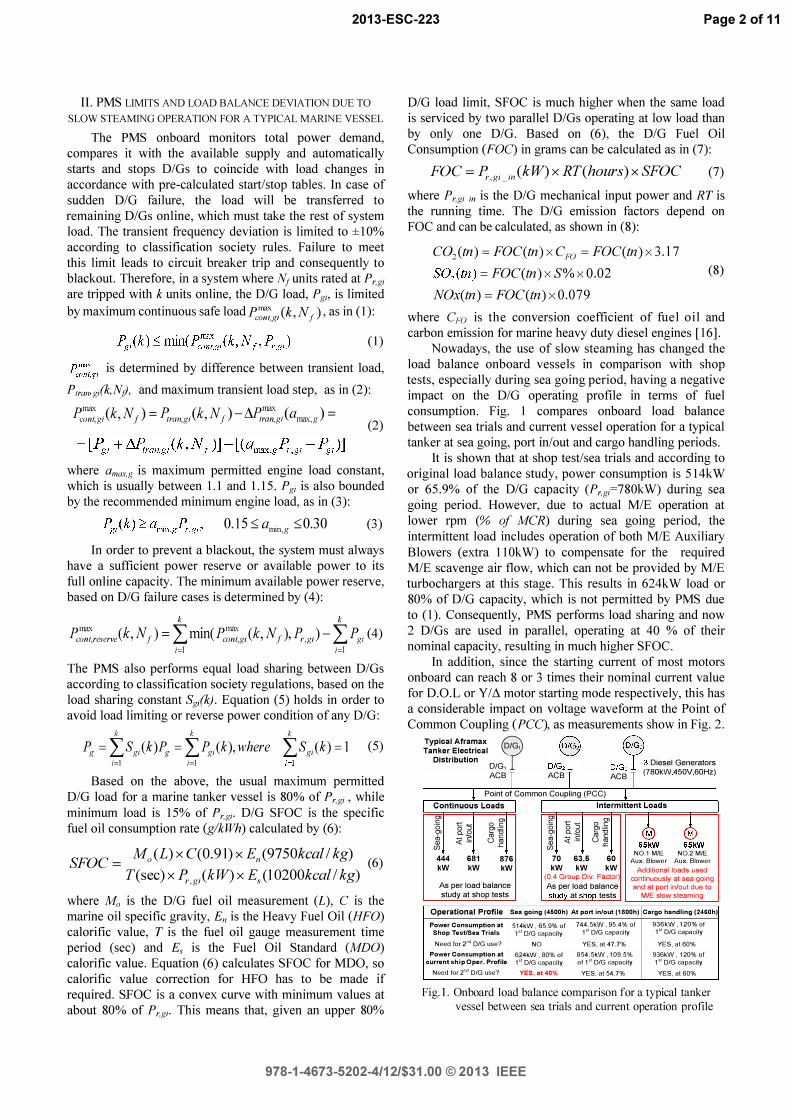
2013-ESC-223 Page 2 of 11
II. PMS LIMITS AND LOAD BALANCE DEVIATION DUE TO
SLOW STEAMING OPERATION FOR A TYPICAL MARINE VESSEL
The PMS onboard monitors total power demand, compares it with the available supply and automatically starts and stops DIGs to coincide with load changes in accordance with pre-calculated startlstop tables. In case of sudden DIG failure, the load will be transferred to remaining DIGs online, which must take the rest of system load. The transient frequency deviation is limited to ±10% according to classification society rules. Failure to meet this limit leads to circuit breaker trip and consequently to blackout. Therefore, in a system where Nfunits rated at Pr,gi are tripped with k units online, the DIG load, P gi, is limited
by maximum continuous safe 10adPc:::'l/k,Nr), as in (1):
(I)
pr""X is determined by difference between transient load, cont,gi
P1rol1>g;{k,N;J, and maximum transient load step, as in (2):
�:�gi(k,Nf) = �ran,gi(k,Nf) - f'lP/::;'�gi(arOOX,g) =
(2)
where amax,g is maximum permitted engine load constant, which is usually between l.1 and l.IS. Pgi is also bounded by the recommended minimum engine load, as in (3):
0.15:::; amin,g :::;0.30 (3)
In order to prevent a blackout, the system must always have a sufficient power reserve or available power to its full online capacity. The minimum available power reserve, based on DIG failure cases is determined by (4):
k k
��:'reserveCk, Nf) = I mine ��:�gJk, Nf), �.,gJ -I Pgi (4) i=1 i=1
The PMS also performs equal load sharing between DIGs according to classification society regulations, based on the load sharing constant Sdk). Equation (S) holds in order to avoid load limiting or reverse power condition of any DIG:
k k k P� = IS�/k)P� = IPg/k), where IS�/k) = 1 (S) i=1 i=1
Based on the above, the usual maximum permitted DIG load for a marine tanker vessel is 80% of P r,gi , while minimum load is IS% of P r,gi' DIG SFOC is the specific fuel oil consumption rate (g/kWh) calculated by (6):
SFOC = Mo(L) x C(0.91) x En (9750kcall kg)
(6) T(sec)x �,g/kW)x E\(10200kcall kg)
where Mo is the DIG fuel oil measurement (L), C is the marine oil specific gravity, En is the Heavy Fuel Oil (HFO) calorific value, T is the fuel oil gauge measurement time period (sec) and Es is the Fuel Oil Standard (MDO) calorific value. Equation (6) calculates SFOC for MDO, so calorific value correction for HFO has to be made if required. SFOC is a convex curve with minimum values at about 80% of Pr,g;' This means that, given an upper 80%
DIG load limit, SFOC is much higher when the same load is serviced by two parallel DIGs operating at low load than by only one DIG. Based on (6), the DIG Fuel Oil Consumption (FOC) in grams can be calculated as in (7):
FOC = p',gi_inCkW) x RT(hours) x SFOC (7)
where P r,gi in is the DIG mechanical input power and RT is the running time. The DIG emission factors depend on FOC and can be calculated, as shown in (8):
CO2(tn) = FOC(tn) x CFO = FOC(tn) x 3.17 SOo(tn) = FOC(tn) x S%x 0.02 NOx(tn) = FOC(tn) x 0.079
(8)
where CFO is the conversion coefficient of fuel oil and carbon emission for marine heavy duty diesel engines [16].
Nowadays, the use of slow steaming has changed the load balance onboard vessels in comparison with shop tests, especially during sea going period, having a negative impact on the DIG operating profile in terms of fuel consumption. Fig. I compares onboard load balance between sea trials and current vessel operation for a typical tanker at sea going, port inlout and cargo handling periods.
It is shown that at shop testlsea trials and according to original load balance study, power consumption is SI4kW or 6S.9% of the DIG capacity (Pr,gi=780kW) during sea going period. However, due to actual M/E operation at lower rpm (% of MCR) during sea going period, the intermittent load includes operation of both M/E Auxiliary Blowers (extra 1l0kW) to compensate for the required M/E scavenge air flow, which can not be provided by M/E turbochargers at this stage. This results in 624kW load or 80% of DIG capacity, which is not permitted by PMS due to (1). Consequently, PMS performs load sharing and now 2 DIGs are used in parallel, operating at 40 % of their nominal capacity, resulting in much higher SFOC.
In addition, since the starting current of most motors onboard can reach 8 or 3 times their nominal current value for D.O.L or Y//1 motor starting mode respectively, this has a considerable impact on voltage waveform at the Point of Common Coupling (PCC), as measurements show in Fig. 2.
Typical Aframax �/G Tanker Electrical 1 Distribution
DIG,
� D/GY
� O/G'=t1 3 Diesel Generators
3 (780kW 450V 60H ) ACB T ACB T ACB T z
l Point of Common Coupling (PCG) l Continuous Loads Intermittent Loads OJ OJ OJ OJ
5�W �W
e t_ e t_ '0 o e '0 o :J o e o :J 0)= 0= %' 0.0 �'" %' o.,Q �'"
- c '" e - e '" e Ujg « .- U '" Q) « .- Q) .<:: (f) (f) 444 681 876 70 63.5 NO.1 MIE NO.2 MIE 60 Aux. Blower Aux. Blower kW kW kW kW kW kW Additional loads used
(0.4 Group Div. Factor) continuously at sea going As per load balance As per load balance and at port in/out due to study at shop tests study at shop tests M/E slow steaming
Operational Profile Sea going (4500h) At port in/out (1800h) Cargo handling (2460h)
Power Consumption at 514kW, 65.9% of 744.5kW, 95.4% of 936kW, 120% of
Shop Test/Sea Trials 1st DIG capacity 151 DIG capacity 1st DIG capacity Need for 2nd DIG use? NO YES, at 47.7% YES, at60%
Power Consumption at 624kW, 80% of 854.SkW, 109.5% 936kW, 120% of current ship Oper. Profile 15t DIG capacity of 15t DIG capacity 151 DIG capacity
Need for 2m DIG use? YES, at 40% YES, at 54.7% YES, at 60%
Fig. 1. Onboard load balance comparison for a typical tanker
vessel between sea trials and current operation profile
978-1-4673-5202-4/12/$31.00 © 2013 IEEE
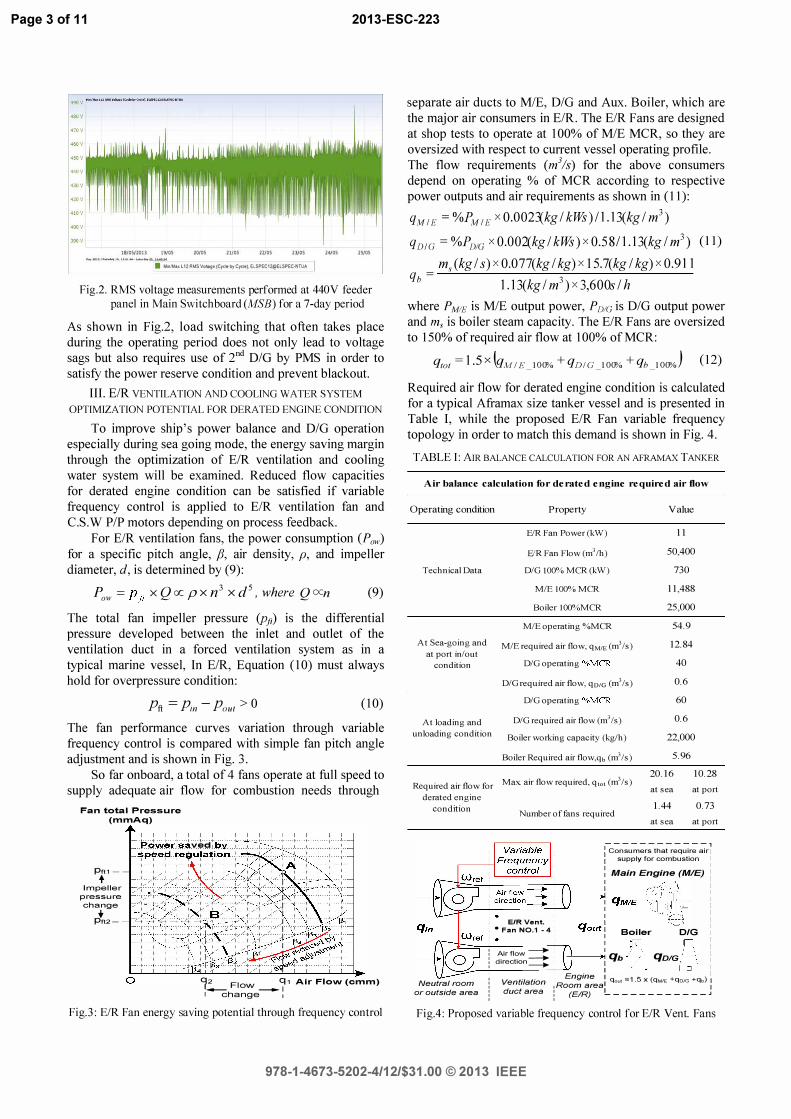
Page 3 of 11 2013-ESC-223
18/05/20ll 19/05 20/05 21/05 22105 23/05 -.,.,-'''�,� -�"i:--
L. M,""",ax L 12 RMS Vwgt (Cyclt by Cycle� ELSPEC12@ELSPEC-NTUA 24/05 25/05
Fig.2. RMS voltage measurements performed at 440V feeder
panel in Main Switchboard (MSB) for a 7-day period
As shown in Fig.2, load switching that often takes place during the operating period does not only lead to voltage sags but also requires use of 2nd DIG by PMS in order to satisfy the power reserve condition and prevent blackout.
III. E/R VENTILATION AND COOLING WATER SYSTEM
OPTIMIZATION POTENTIAL FOR DERATED ENGINE CONDITION
To improve ship's power balance and DIG operation especially during sea going mode, the energy saving margin through the optimization of EIR ventilation and cooling water system will be examined. Reduced flow capacities for derated engine condition can be satisfied if variable frequency control is applied to E/R ventilation fan and C.S.W PIP motors depending on process feedback.
For E/R ventilation fans, the power consumption (Pow) for a specific pitch angle, /3, air density, p, and impeller diameter, d, is determined by (9):
Pow = Pfi X Qoc px n3 x d5, where Qcxn (9)
The total fan impeller pressure (Pji) is the differential pressure developed between the inlet and outlet of the ventilation duct in a forced ventilation system as in a typical marine vessel, In EIR, Equation (10) must always hold for overpressure condition:
pft = Pin - Pout> 0 (10)
The fan performance curves variation through variable frequency control is compared with simple fan pitch angle adjustment and is shown in Fig. 3.
So far onboard, a total of 4 fans operate at full speed to supply adequate air flow for combustion needs through
Fan total Pressure (mmAq)
Pft1---+
Impeller pressure
change
P+ft2-
�f��� r r' r
�'>'� ,,-"'-
�"T r l-f-.
o
, 's,
iY"
;v >,
ved bv
, c c--
A c , "
,;>- [\ /"i ;$-
"'- ."
:i<"\L. /.
, i /1; OY ,
�, tF1J'J
� /'1 0
I l':s;; �
�; '\ / i i\
t::; K�� � G.> '''�T -/ �+ , ..... i""
, ; -. ; .-, -
"." ,.-. , .-'''-
"" '''-"" .
..... , -��
'''-i"-
..... , -""" '''-'i2 Flow q, Air Flovv (cmm)
- -I I change ,
Fig.3 : E/R Fan energy saving potential through frequency control
separate air ducts to M/E, DIG and Aux. Boiler, which are the major air consumers in E/R. The E/R Fans are designed at shop tests to operate at 100% of M/E MCR, so they are oversized with respect to current vessel operating profile. The flow requirements (m%) for the above consumers depend on operating % of MCR according to respective power outputs and air requirements as shown in (I I):
qM It = %PM It x 0.002?(kgl k�)/1.13(kgl m3) q lJiG = %PlJ!(, x O.OO2(kg 1 k�) x O.S 81 1.13(kg 1 m3)
m, (kg 1 s) x 0.0 77(kg 1 kg) x IS.7(kg 1 kg) x 0.911 (II)
qb = 1.13(kglm3)x3,600s1 h where PM/H is M/E output power, Pm; is DIG output power and m, is boiler steam capacity. The E/R Fans are oversized to 150% of required air flow at 100% of MCR:
qtot = 1.5 X �qM I r: _10Cl'1o + qTJ/G _1 0Cl'1o + qh _1 OCl'/J (12)
Required air flow for derated engine condition is calculated for a typical Aframax size tanker vessel and is presented in Table I, while the proposed E/R Fan variable frequency topology in order to match this demand is shown in Fig. 4.
TABLE 1: AIR BALANCE CALCULATION FOR AN AFRAMAX TANKER
Air balance calculation for derated engine required air flow
Operating condition Property
EJR Fan Power (kW)
EJRFan Flow (m'/h)
Technical Data DIG 100% MCR(kW)
M/EIOO% MCR
Boiler lOO%MCR
M/E operating %MCR
Value
II
50,400
730
11,488
25,000
At Sea-going and MIE required air flow, qM/E (m3/s)
54.9
12.84
40
0.6
at port in/out
condition D/Goperating %MCR
At loading and
unloading condition
Required air flow for
derated engine
condition
DIG required air flow, qDlG (m' Is)
DIG operating %MeR
DIG required air flow (m'/s)
Boiler working capacity (kg/h)
Boiler Required airtlow,qb (m]/s)
Max airtlow required, qtol (m3/s)
Number of fans required
60
0.6
22,000
5.96
20.16 10.28 at sea at port
1.44 0.73 at sea at port
------------ ,
E/R Vent. • Fan NO.1 - 4
Consumers that require air supply for combustion
Main Engine (M/E)
Boiler DIG o i �irfl�w �
: dlrectlon ______ � qb qDIG
Neutral room or outside area
, I:,
Ventilation duct area
I = Engine : qoul =1.5 x (qMfE +qDfG +qb) I ,Room area I i (E/R) � ___________ .J
Fig.4: Proposed variable frequency control for E/R Vent. Fans
978-1-4673-5202-4/12/$31.00 © 2013 IEEE
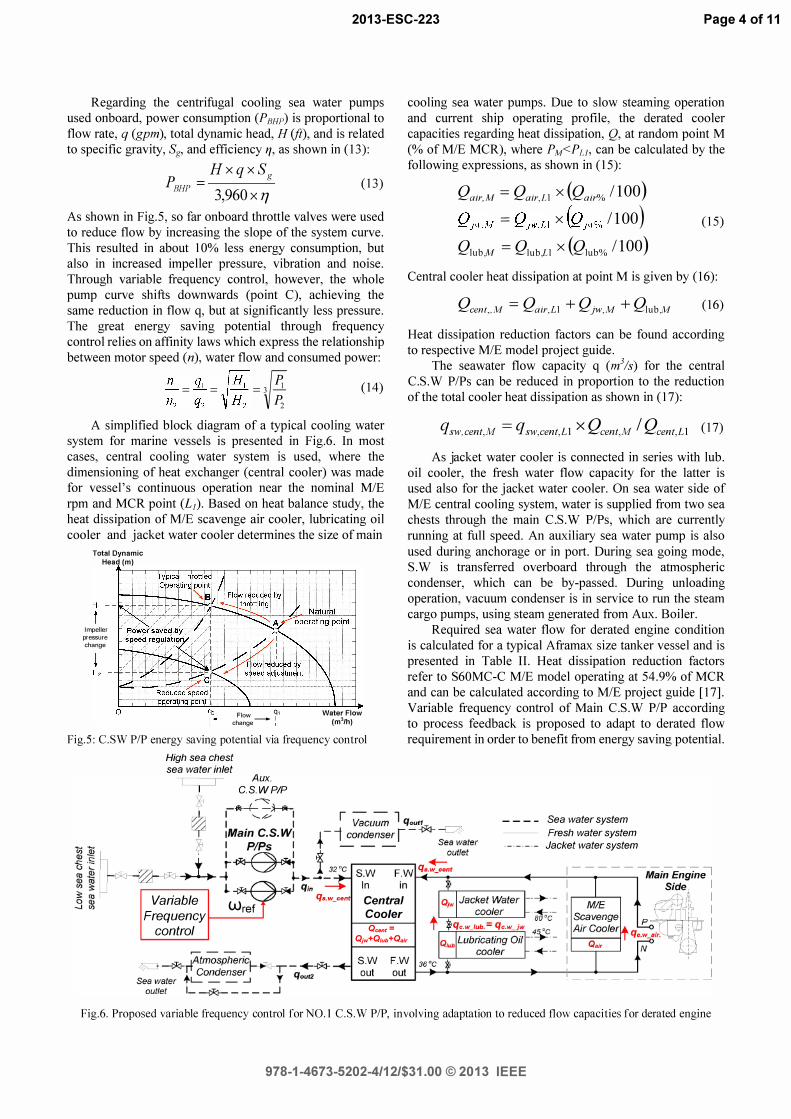
2013-ESC-223 Page 4 of 11
Regarding the centrifugal cooling sea water pumps used onboard, power consumption (PBHF) is proportional to flow rate, q (gpm), total dynamic head, H (ft), and is related to specific gravity, Sg, and efficiency 1'/, as shown in (13):
HxqxS PRHP = 3,960 X 1]g
(13)
As shown in Fig.S, so far onboard throttle valves were used to reduce flow by increasing the slope of the system curve. This resulted in about 10% less energy consumption, but also in increased impeller pressure, vibration and noise. Through variable frequency control, however, the whole pump curve shifts downwards (point C), achieving the same reduction in flow q, but at significantly less pressure. The great energy saving potential through frequency control relies on affinity laws which express the relationship between motor speed (n) , water flow and consumed power:
:: = �: = � Z: = ti (14)
A simplified block diagram of a typical cooling water system for marine vessels is presented in Fig.6. In most cases, central cooling water system is used, where the dimensioning of heat exchanger (central cooler) was made for vessel's continuous operation near the nominal M/E rpm and MCR point (L/). Based on heat balance study, the heat dissipation of MIE scavenge air cooler, lubricating oil cooler and jacket water cooler determines the size of main
Total Dynamic Head (m)
Impeller
pressure
change
Flow q1 -,
change
WaterFlow (m'/h)
Fig. 5 : C .SW PIP energy saving potential via frequency control
High sea chest sea water inlet
,- ' Aux.
C.S.WPIP
Variable Wref Frequency 1------' Cooler
cooling sea water pumps. Due to slow steaming operation and current ship operating profile, the derated cooler capacities regarding heat dissipation, Q, at random point M (% of M/E MCR), where PM<PU, can be calculated by the following expressions, as shown in (15):
Qair,M = Qair,Ll X (Qair% /100) Qjw,M = Qjw,Ll X (QjW% /l00) (15) Qlub,M = Qlub,L1 X (Qlub% /100)
Central cooler heat dissipation at point M is given by (16):
Qcent"M = Qair,Ll + Qjw,M + Qlub,M (16)
Heat dissipation reduction factors can be found according to respective M/E model project guide.
The seawater flow capacity q (m%) for the central C.S.W PIPs can be reduced in proportion to the reduction of the total cooler heat dissipation as shown in (17):
q sW,cent,M = q sW,cent,Ll X Qcent,M / Qcent,Ll (17)
As jacket water cooler is connected in series with lub. oil cooler, the fresh water flow capacity for the latter is used also for the jacket water cooler. On sea water side of M/E central cooling system, water is supplied from two sea chests through the main C.S.W PIPs, which are currently running at full speed. An auxiliary sea water pump is also used during anchorage or in port. During sea going mode, S. W is transferred overboard through the atmospheric condenser, which can be by-passed. During unloading operation, vacuum condenser is in service to run the steam cargo pumps, using steam generated from Aux. Boiler.
Required sea water flow for derated engine condition is calculated for a typical Aframax size tanker vessel and is presented in Table II. Heat dissipation reduction factors refer to S60MC-C M/E model operating at 54.9% of MCR and can be calculated according to M/E project guide [17]. Variable frequency control of Main C.S.W PIP according to process feedback is proposed to adapt to derated flow requirement in order to benefit from energy saving potential.
Sea water system Fresh water system Jacket water system
control Qcent =
Qjw+Q/Ub+Qair
Fig.6 . Proposed variable frequency control for NO.1 C .S . W PIP, involving adaptation to reduced flow capacities for derated engine
978-1-4673-5202-4/12/$31.00 © 2013 IEEE
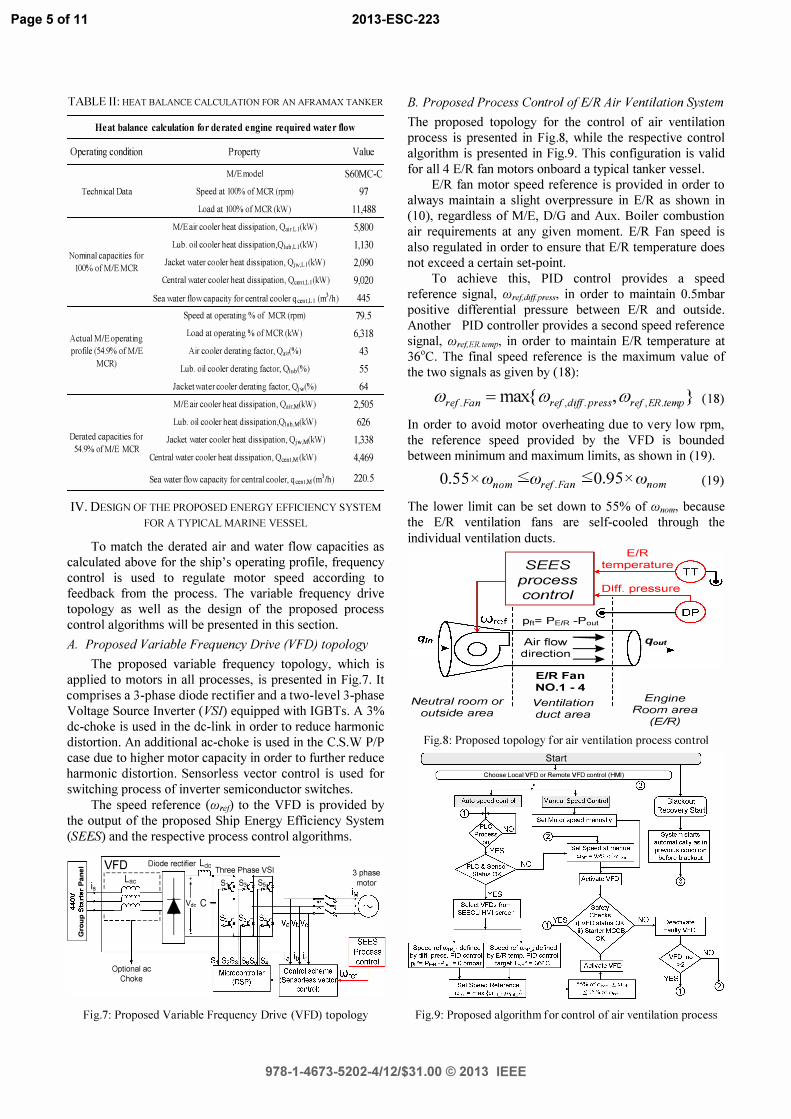
Page 5 of 11 2013-ESC-223
TABLE IT: HEAT BALANCE CALCULATION FOR AN AFRAMAX TANKER
Heat balance calcnlation for derated engine reqnired water flow
Operating condition Property Value
M/Emodel S60MC-C
Technical Data Speed at 100'10 ofMCR (rpm) 97
Load at 100'/0 ofMCR(kW) 11,488
M/Eair cooler heat dissipation, QOi"Ll (kW) 5,800
lob, oil cooler heat dissipation,Qlob,Ll(kW) 1,130 Nominal capacities for
Jacket water cooler heat dissipation, QwLl(kW) 2,090 100'10 ofMIEMCR Central water cooler heat dissipation, Q"ot,Ll(kW) 9,020
Sea water flow capacity for central cooler qceot,LI (m'/h) 445
Speed at operating % of MCR (rpm) 79.5
Actual M/Eoperating Load at operating % ofMCR(kW) 6,318
profile (54,9% ofM/E Air cooler derating factor, Qoi�%) 43 MCR)
lob, oil cooler derating factor, Qh,b(%) 55
Jacket water cooler derating factor, QJw(%) 64
M/Eair cooler heat dissipation, Q"i"N(kW) 2,505
Lub, oil cooler heat dissipation,Qh,b,M(kW) 626 Derated capacities for
54,9% ofM/EMCR Jacket water cooler heat dissipation, QiwN(kW) 1,338
Central water cooler heat dissipation, Q"",,M (kW) 4,469
Sea water flow capacity for central cooler, q"otN (m'/h) 220.5
IV, DESIGN OF THE PROPOSED ENERGY EFFICIENCY SYSTEM
FOR A TYPICAL MARINE VESSEL
To match the derated air and water flow capacities as calculated above for the ship's operating profile, frequency control is used to regulate motor speed according to feedback from the process, The variable frequency drive topology as well as the design of the proposed process control algorithms will be presented in this section,
A, Proposed Variable Frequency Drive (VFD) topology
The proposed variable frequency topology, which is applied to motors in all processes, is presented in Fig,7, It comprises a 3-phase diode rectifier and a two-level 3-phase Voltage Source Inverter (VSJ) equipped with IGBTs, A 3% dc-choke is used in the dc-link in order to reduce harmonic distortion, An additional ac-choke is used in the c'S,W PIP case due to higher motor capacity in order to further reduce harmonic distortion, Sensorless vector control is used for switching process of inverter semiconductor switches,
The speed reference (OJref) to the VFD is provided by the output of the proposed Ship Energy Efficiency System (SEES) and the respective process control algorithms,
VF 0 Diode rectifier Ldc � ,__________ Three Phase VSI 3 phase motor
r-;-;--' ___ ._----.." Vdc c tt�H+:;::::::::'�
�is: Lac if! S, S, SS
� ' ----: I � �--������
Optional ae Choke
Fig.7: Proposed Variable Frequency Drive (VFD) topology
B. Proposed Process Control of E/R Air Ventilation System
The proposed topology for the control of air ventilation process is presented in Fig.8, while the respective control algorithm is presented in Fig.9. This configuration is valid for all 4 E/R fan motors onboard a typical tanker vesseL
E/R fan motor speed reference is provided in order to always maintain a slight overpressure in E/R as shown in (10), regardless of M/E, DIG and Aux. Boiler combustion air requirements at any given moment. EIR Fan speed is also regulated in order to ensure that E/R temperature does not exceed a certain set-point.
To achieve this, PID control provides a speed reference signal, OJref,ditfpres." in order to maintain 0.5mbar positive differential pressure between EIR and outside. Another PID controller provides a second speed reference signal, OJrej,TR.felllp' in order to maintain E/R temperature at 36°C. The fmal speed reference is the maximum value of the two signals as given by (18):
OJref,Fan = max{ OJrej,dijJ.press' OJrej,ER.temp } (18)
In order to avoid motor overheating due to very low rpm, the reference speed provided by the VFD is bounded between minimum and maximum limits, as shown in (\9).
O.55xwnom <Wref,Fan <O.95xwnom (19)
The lower limit can be set down to 55% of OJnom, because the E/R ventilation fans are self-cooled through the individual ventilation ducts.
Neutral room or outside area
SEES process
control
E/R temperature D·ff. pressure
<!:--i----__\. DP Pn= PE/R -Pout
Air flow -----. direction ===!
E/R Fan NO_1 - 4 Ventilation duct area
qout
Engine Room area
(E/R)
Fig. S: Proposed topology for air ventilation process control
Start Choose Local VFD or Remote VFD control (HMI)
Fig. 9: Proposed algorithm for control of air ventilation process
978-1-4673-5202-4/12/$31.00 © 2013 IEEE
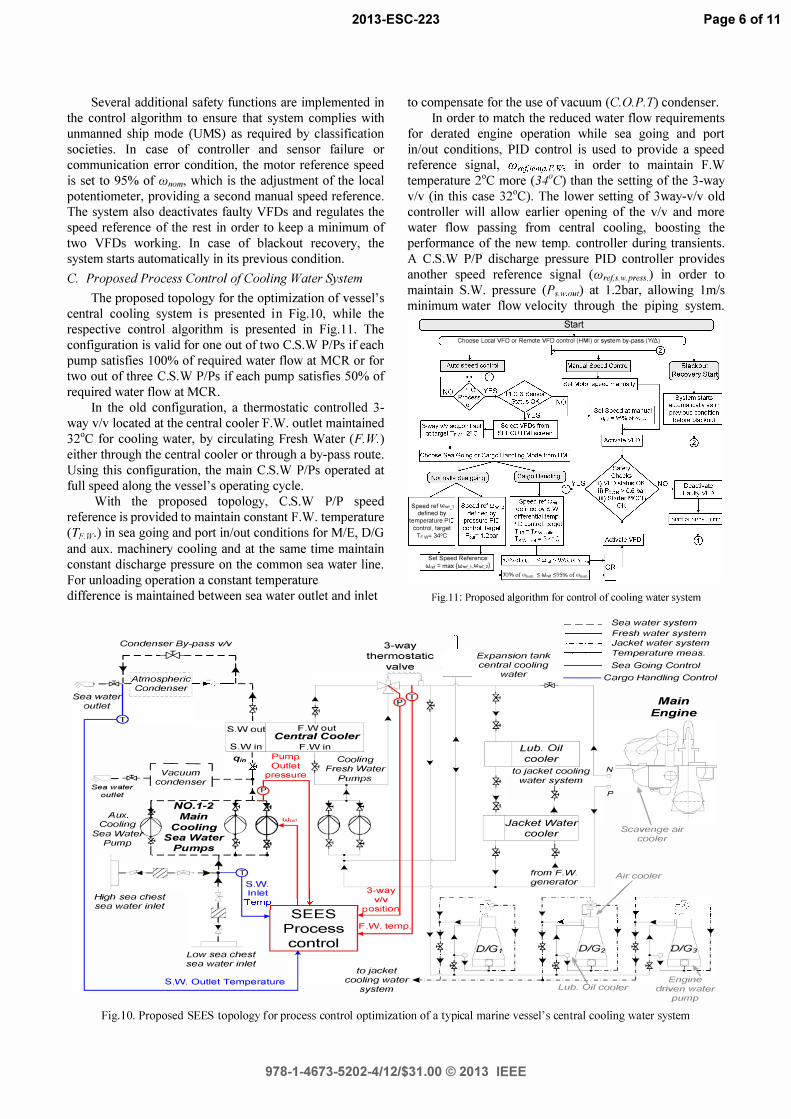
2013-ESC-223 Page 6 of 11
Several additional safety functions are implemented in the control algorithm to ensure that system complies with unmanned ship mode (UMS) as required by classification societies. In case of controller and sensor failure or communication error condition, the motor reference speed is set to 95% of Wnam, which is the adjustment of the local potentiometer, providing a second manual speed reference. The system also deactivates faulty VFDs and regulates the speed reference of the rest in order to keep a minimum of two VFDs working. In case of blackout recovery, the system starts automatically in its previous condition.
C Proposed Process Control o/Cooling Water System
The proposed topology for the optimization of vessel's central cooling system is presented in Fig.IO, while the respective control algorithm is presented in Fig.ll. The configuration is valid for one out of two C.S.W PIPs if each pump satisfies 100% of required water flow at MCR or for two out of three C.S. W PIPs if each pump satisfies 50% of required water flow at MCR.
In the old configuration, a thermostatic controlled 3-way v/v located at the central cooler F.W. outlet maintained 32°C for cooling water, by circulating Fresh Water (F. w.) either through the central cooler or through a by-pass route. Using this configuration, the main C.S.W PIPs operated at full speed along the vessel's operating cycle.
With the proposed topology, C.S.W PIP speed reference is provided to maintain constant F.W. temperature (Trw. ) in sea going and port in/out conditions for M/E, DIG and aux. machinery cooling and at the same time maintain constant discharge pressure on the common sea water line. For unloading operation a constant temperature difference is maintained between sea water outlet and inlet
to compensate for the use of vacuum (Co.P. T) condenser. In order to match the reduced water flow requirements
for derated engine operation while sea going and port in/out conditions, PID control is used to provide a speed reference signal, Wre!.lempFW, in order to maintain F.W temperature 2°C more (34()C) than the setting of the 3-way v/v (in this case 32°C). The lower setting of 3way-v/v old controller will allow earlier opening of the v/v and more water flow passing from central cooling, boosting the performance of the new temp. controller during transients. A C.S.W PIP discharge pressure PID controller provides another speed reference signal (wrej,s.w.press) in order to maintain S.W. pressure (Puvaul) at 1.2bar, allowing I m/s minimum water flow velocity through the piping system.
Start Choose Local VFD or Remote VFD control (HMI) or system by-pass (Y/!':,,)
Speed ref Wref 1 defined by -
temperature PI control, target
TFW= 34°C
Set Speed Reference Wref = max {wreU ,WreC2}
2
70% of �"'IL ::; Wref ::;95% of �"'IL
F ig.ll: Proposed algorithm for control of cooling water system
Condenser By-pass v/v
r - - --t:*::i-- - - - --, 3-way
thermostatic I tj Expansion tank
central cooling water
Sea water system
Fresh water system Jacket water system Temperature meas.
Sea Going Control t ,-----------c- + valve I :Atmosphenc ... I --: Condenser �---- - 1
� I S.Wout
1 $
F.Wout Central Cooler
S.Win F.Win q;n I Pump t Cooling I - - 1 � Outlet Fresh Water
_ Vacuum T pressure - -J>I<J-1 condenser 1- - I P,!mps
se:���er
q;-�::�r�
l
p �.�.� Cooling Cooling
Sea Wate Sea Water Pump
I Pumps . - - - - - 1-- .... ---4 _ � T}_ T
Inlet High sea chest sea water inlet Temp.� __ L-L-____ -.
3-way v/v
osition
------ Cargo Handling Control I-r--'-�.-------I>'<l---
$ Main Engine
I Lub. Oil cooler
to jacket cooling N' water system - �
$ Jacket Water
cooler
.... from F.W.
p
Scavenge air cooler
Air coo/er enerator /
, - - - [c' '-- , �---[7/: +---[1'-- :
SEES Process control
F.W. temp . 1'----. . 0( . I i----±=J1 I
t t t.. t t.. t � D/Gi � D/G2. I � D/G3
Low sea chest sea water inlet
to jacket t �_�J r � � _ _ J r � ��\ J
S.W. Outlet Temperature cooling water ... __ . ...1_._._._._._._._._._ ....... _._._._ _ ____ ._ . ...1 Engine system Lub. Oil cooler driven water
pump
Fig.lO. Proposed SEES topology for process control optimization of a typical marine vessel's central cooling water system
978-1-4673-5202-4/12/$31.00 © 2013 IEEE
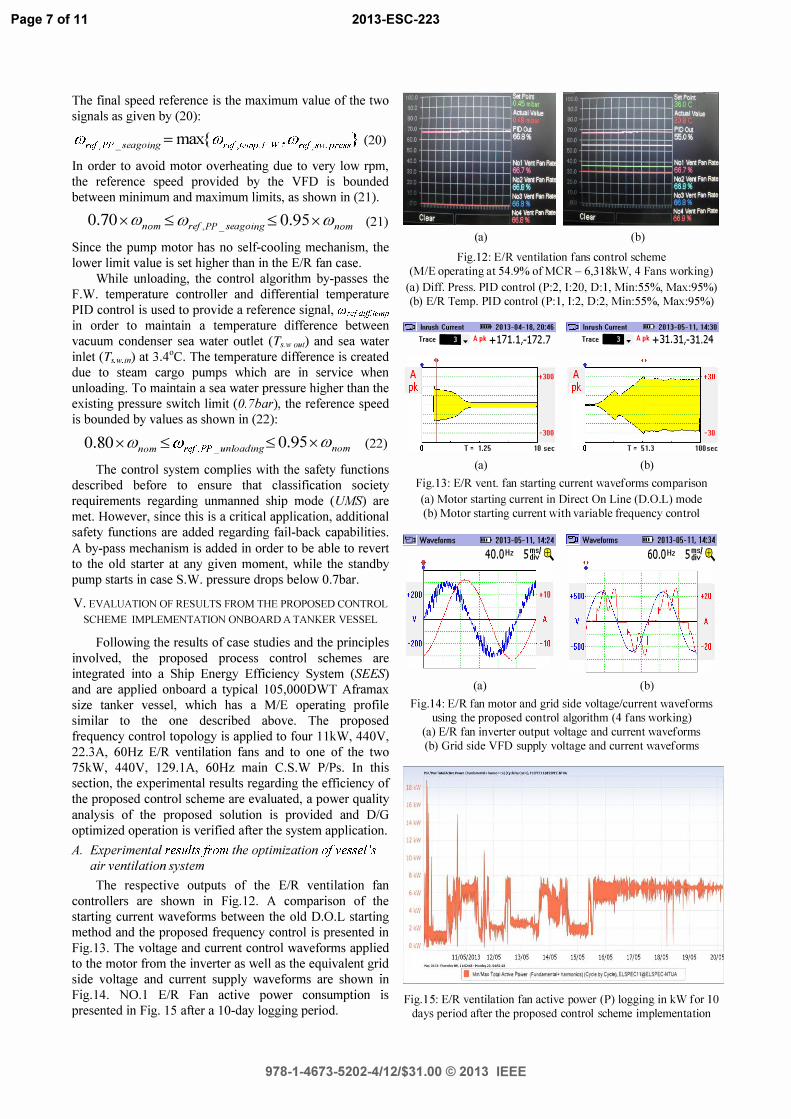
Page 7 of 11 2013-ESC-223
The final speed reference is the maximum value of the two signals as given by (20):
OJrej,pp _seagoing = max{ OJrej,tempF.W' OJrej,swpress} (20)
In order to avoid motor overheating due to very low rpm, the reference speed provided by the VFD is bounded between minimum and maximum limits, as shown in (21).
0.70 X OJnom ::;; OJrej,PP _seagoing ::;; 0.95 X OJnom (21)
Since the pump motor has no self-cooling mechanism, the lower limit value is set higher than in the E/R fan case.
While unloading, the control algorithm by-passes the F.W. temperature controller and differential temperature PID control is used to provide a reference signal, Wrefdifftemp in order to maintain a temperature difference between vacuum condenser sea water outlet (Tuvout) and sea water inlet (Tsw in) at 3Aoe. The temperature difference is created due to steam cargo pumps which are in service when unloading. To maintain a sea water pressure higher than the existing pressure switch limit (0. 7bar), the reference speed is bounded by values as shown in (22):
0.80 X OJnom ::;; OJrej,PP _unloading::;; 0.95 X OJnom (22)
The control system complies with the safety functions described before to ensure that classification society requirements regarding unmanned ship mode (UMS) are met. However, since this is a critical application, additional safety functions are added regarding fail-back capabilities. A by-pass mechanism is added in order to be able to revert to the old starter at any given moment, while the standby pump starts in case S.W. pressure drops below 0.7bar.
V. EVALUATION OF RESULTS FROM THE PROPOSED CONTROL
SCHEME IMPLEMENTATION ON BOARD A TANKER VESSEL
Following the results of case studies and the principles involved, the proposed process control schemes are integrated into a Ship Energy Efficiency System (SEES) and are applied onboard a typical I05,000DWT Aframax size tanker vessel, which has a M/E operating profile similar to the one described above. The proposed frequency control topology is applied to four IlkW, 440V, 22.3A, 60Hz E/R ventilation fans and to one of the two 75kW, 440V, 129.IA, 60Hz main e.s.w PIPs. In this section, the experimental results regarding the efficiency of the proposed control scheme are evaluated, a power quality analysis of the proposed solution is provided and DIG optimized operation is verified after the system application.
A. Experimental results {rom the optimization o{vessel's air ventilation system
The respective outputs of the E/R ventilation fan controllers are shown in Fig.12. A comparison of the starting current waveforms between the old D.O.L starting method and the proposed frequency control is presented in Fig.I3. The voltage and current control waveforms applied to the motor from the inverter as well as the equivalent grid side voltage and current supply waveforms are shown m
Fig.I4. NO.1 E/R Fan active power consumption IS
presented in Fig. 15 after a IO-day logging period.
(a) (b)
Fig.12: E/R ventilation fans control scheme
(M/E operating at 54 .9% of MeR - 6,318kW, 4 Fans working)
(a) Diff. Press. PID control (P:2. 1:20. D:I. Min:55%. Max:95%)
(b) EIR Temp. PID control (P:I. 1:2. D:2. Min:55%. Max:95%)
Inrush Current O!ill 2013-04-18.20:46 Trace _ . Apk +171.1,-172.7
.. A ....... ................................................... +300 pk····· h
E ....... ................................................... -300 T - 1.25 10 sec
(a)
Inrush Current ill} 2013-05-11. 14:30 Trace _ . A pk +31.31,-31.24
A "r::::::-:-==1+30
pk ...... ;;;L • .. •••••• �\J ••• = ••• = ••.. ""
..
=",=""1 -30 T - 51.3 100sec
(b)
Fig. 13 : E/R vent. fan starting current waveforms comparison
(a) Motor starting current in Direct On Line (D.O .L) mode
(b) Motor starting current with variable frequency control
'El! Waveforms ill} 2013-05-11. U:2� Waveforms ill} 2013-05-11. 14:3� 40.0Hz 5��1 � 60.0Hz 5��1 �
···/'I�\"······\ ······ ; ········ · ;·· ·.1'�wl + 1 0
(a) (b)
Fig.14: E/R fan motor and grid side voltage/current waveforms
using the proposed control algorithm (4 fans working)
18 k
IHW
14kW
IlkW
IOkW
(a) E/R fan inverter output voltage and current waveforms
(b) Grid side VFD supply voltage and current waveforms
..... :IIllll ....... ", I�::M"--___________ _ • MinlMu Total Al:ttve Power (Fund.mental+ h8rmo�s) (Cycle by Cyde), ElSP£Cl1@ELSPEC-NTUA
Fig.15: E/R ventilation fan active power (P) logging in kW for 10
days period after the proposed control scheme implementation
978-1-4673-5202-4/12/$31.00 © 2013 IEEE
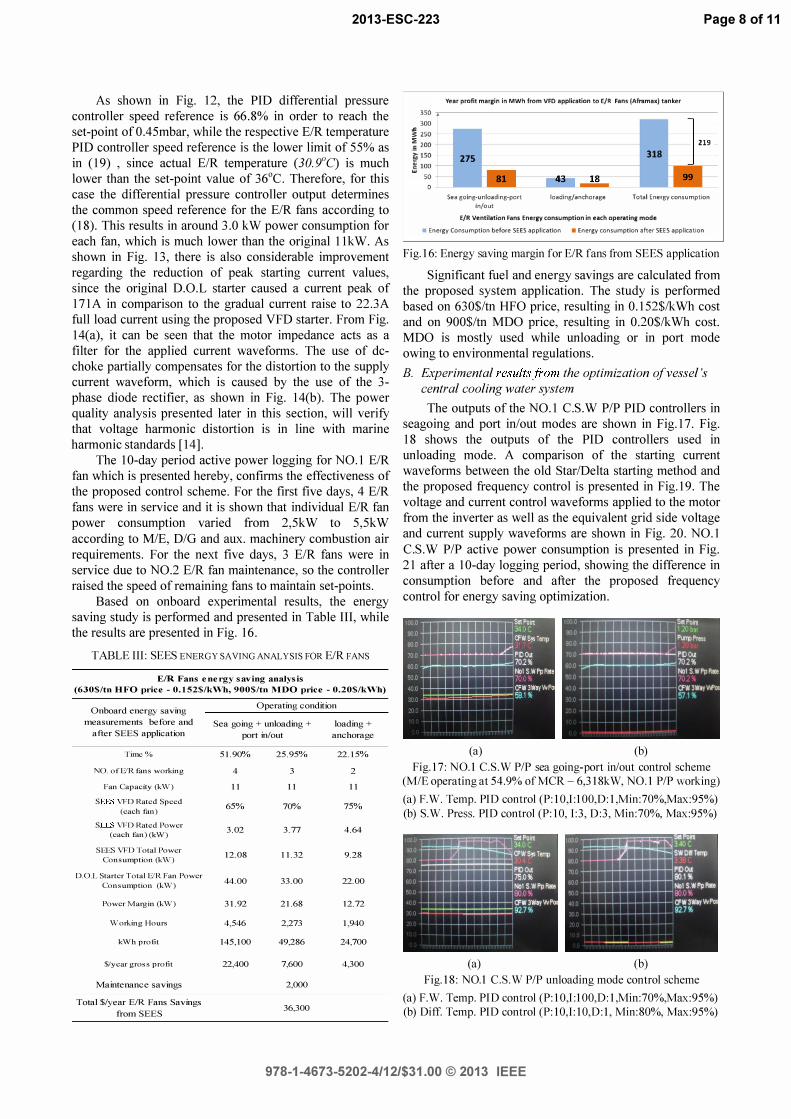
2013-ESC-223 Page 8 of 11
As shown in Fig. 12, the PID differential pressure controller speed reference is 66.S% in order to reach the set-point of 0.45mbar, while the respective E/R temperature PID controller speed reference is the lower limit of 55% as in (19) , since actual E/R temperature (30.9()C) is much lower than the set-point value of 36°C. Therefore, for this case the differential pressure controller output determines the common speed reference for the E/R fans according to (IS). This results in around 3.0 kW power consumption for each fan, which is much lower than the original llkW. As shown in Fig. 13, there is also considerable improvement regarding the reduction of peak starting current values, since the original D.O.L starter caused a current peak of 171 A in comparison to the gradual current raise to 22.3A full load current using the proposed VFD starter. From Fig. 14(a), it can be seen that the motor impedance acts as a filter for the applied current waveforms. The use of dcchoke partially compensates for the distortion to the supply current waveform, which is caused by the use of the 3-phase diode rectifier, as shown in Fig. 14(b). The power quality analysis presented later in this section, will verify that voltage harmonic distortion is in line with marine harmonic standards [14].
The 10-day period active power logging for NO.1 E/R fan which is presented hereby, confirms the effectiveness of the proposed control scheme. For the first five days, 4 E/R fans were in service and it is shown that individual E/R fan power consumption varied from 2,5kW to 5,5kW according to MIE, D/G and aux. machinery combustion air requirements. For the next five days, 3 E/R fans were in service due to NO.2 E/R fan maintenance, so the controller raised the speed of remaining fans to maintain set-points.
Based on onboard experimental results, the energy saving study is performed and presented in Table III, while the results are presented in Fig. 16.
TABLE Ill: SEES ENERGY SAVING ANALYSIS FOR E/R FANS
E/R Fans energy saving analysis
(630$/tn HFO price - O.152$/kWh, 900$/tn MDO price - O.20$/kWh)
Onboard energy saving
measurements before and
after SEES application
Tim\,;%
NO. ofElR±ans working
Pan Capacity (kW)
S .... :J-S YFD Rated Speed
(each fan)
s .... :J-s YFD Rated Power
(each fan) (k\\/)
SIT....'l \iTD Total Power
Consumption (k\\l)
D.O.L Starter Total ElRPan Power
Consumption (kW)
Power Margin (kW)
Working IIours
k\Vh profit
$/ycar gros s profit
Maintenance savings
Total $/year EIR Fans Savings
from SEES
Operating condition
Sea going + unloading + loading + port in/out anchorage
51.90% 25.95% 22.15%
4 3 2
II II II
65% 70% 75%
3.02 3.77 4.64
12.08 11.32 9.28
44.00 33.00 22.00
31.92 21.68 12.72
4,546 2,273 1,940
145,100 49,286 24,700
22,400 7,600 4,300
2,000
36,300
350 300
� O!: 250 .� 200 [0150 � 100
50
Year profit marlin in MWh from VFO application to E/R Fans (Aframax) tanker
219 275 1-------------1 318
18
Sea going-unloading-port
In/out
loading/anchorage Total Energy consumption
E/R VlI!!ntilation Fans Enll!!rgy consumption in lI!!ach oplI!!l'ating mod II!!
• Energy Consumption before SEES application • Energy consumption after SEES application
Fig.16: Energy saving margin for E/R fans from SEES application
Significant fuel and energy savings are calculated from the proposed system application. The study is performed based on 630$/tn HFO price, resulting in 0.152$/kWh cost and on 900$/tn MOO price, resulting in 0.20$/kWh Cost. MOO is mostly used while unloading or in port mode owing to environmental regulations.
B. Experimental resultsfrom the optimization of vessel's central cooling water system
The outputs of the NO.1 C.S.W PIP PID controllers in seagoing and port in/out modes are shown in Fig.17. Fig. IS shows the outputs of the PID controllers used in unloading mode. A comparison of the starting current waveforms between the old Star/Delta starting method and the proposed frequency control is presented in Fig.19. The voltage and current control waveforms applied to the motor from the inverter as well as the equivalent grid side voltage and current supply waveforms are shown in Fig. 20. NO.1 C.S.W PIP active power consumption is presented in Fig. 21 after a 10-day logging period, showing the difference in consumption before and after the proposed frequency control for energy saving optimization.
(a) (b)
Fig.17: NO.1 C .S .W PIP sea going-port inlout control scheme
(MIE operating at 54 .9% of MCR - 6,31SkW, NO.1 PIP working)
(a) F.W. Temp. PID control (P:1O,1:100,D:l,Min:70%,Max:95%)
(b) S.W. Press. PID control (P:lO, 1: 3 , 0:3 , Min:70%, Max:95%)
(a) (b)
Fig.lS: NO.1 C .S .W PIP unloading mode control scheme
(a) F.W. Temp. PID control (P:10,I:100,D:1,Min:70%,Max:95%)
(b) Diff Temp. PID control (P:10,I:10,D:1, Min: SO%, Max:95%)
978-1-4673-5202-4/12/$31.00 © 2013 IEEE
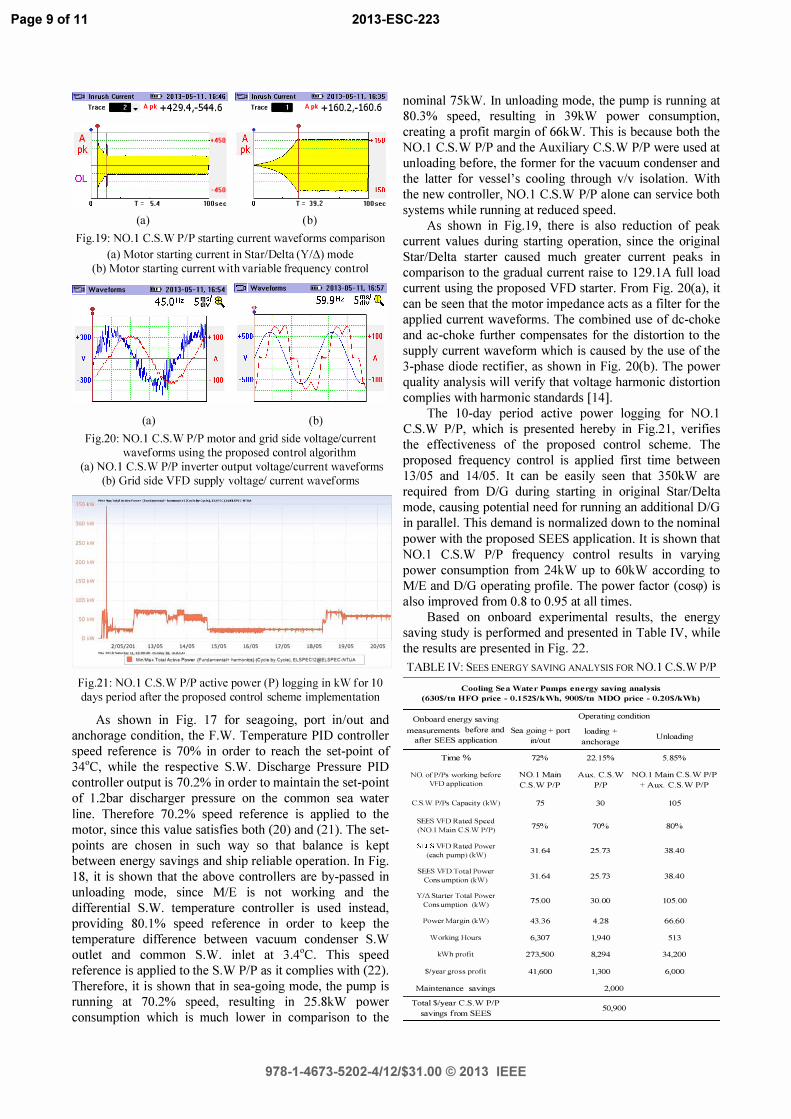
Page 9 of 11 2013-ESC-223
� r Curren IiID 'E::i!: Curren IiID - - • 6' Trace _ . A pk +429.4,-544 . 6 Trace " A pk + 160.2,- 160 .6
A +450 pk l\;'1-· . . ----�-1
OL . ,/ .. -450
T = 5 .4 100sec (a)
:kt • • • ::::;:z:::: • • • • :::: • • • • :::: • • • • :::: ••• . i . . • :: . . . ====4+150
• • • �\f • • -•• . . �. ___ -9-150 T = 3 9 . 2 100 sec
(b)
Fig.19: NO.1 C .S . W PIP starting current waveforms comparison
(a) Motor starting current in StarlDelta (YIL',) mode
(b) Motor starting current with variable frequency control
Ell Waveforms !ill 2 0 1 3-05- 1 1 . 1 6 :5� Waveforms !ill 2 0 1 3-05- 1 1 . 1 6 :57
(a) (b)
Fig.20: NO.1 C .S .W PIP motor and grid side voltagelcurrent
waveforms using the proposed control algorithm
(a) NO.1 C .S .W PIP inverter output voltagelcurrent waveforms
(b) Grid side VFD supply voltagel current waveforms
300 I!:W
2SO kW
200 kW
150 kW
lOO kW
SO kW
O k 2/05/201 13/05 14/05 15/05 16/05 17/05 18/05 19/05 20/05
_ HU._ ... ... ., ___ ... _ ... '.,.7 • • MiniMax 1_1 AcWe Power (Fund.IM"�I. h.rmonoct) (Cycle by Cycle), ELSPEC12@€LSPEC-NTUA
Fig.21: NO.1 C .S .W PIP active power (P) logging in kW for 10
days period after the proposed control scheme implementation
As shown in Fig. 17 for seagoing, port inlout and anchorage condition, the F.W. Temperature PID controller speed reference is 70% in order to reach the set-point of 34°C, while the respective S.W. Discharge Pressure PID controller output is 70.2% in order to maintain the set-point of 1.2bar discharger pressure on the common sea water line. Therefore 70.2% speed reference is applied to the motor, since this value satisfies both (20) and (21). The setpoints are chosen in such way so that balance is kept between energy savings and ship reliable operation. In Fig. IS, it is shown that the above controllers are by-passed in unloading mode, since M/E is not working and the differential S.W. temperature controller is used instead, providing SO. 1 % speed reference in order to keep the temperature difference between vacuum condenser S.W outlet and common S.W. inlet at 3AoC. This speed reference is applied to the S.W PIP as it complies with (22). Therefore, it is shown that in sea-going mode, the pmnp is running at 70.2% speed, resulting in 25.SkW power consumption which is much lower in comparison to the
nominal 75kW. In unloading mode, the pump is running at SO.3% speed, resulting in 39kW power consumption, creating a profit margin of 66kW. This is because both the NO.1 C.S. W PIP and the Auxiliary C.S. W PIP were used at unloading before, the former for the vacuum condenser and the latter for vessel 's cooling through vlv isolation. With the new controller, NO.1 C.S.W PIP alone can service both systems while running at reduced speed.
As shown in Fig.19, there is also reduction of peak current values during starting operation, since the original StarlDelta starter caused much greater current peaks in comparison to the gradual current raise to 129.1 A full load current using the proposed VFD starter. From Fig. 20(a), it can be seen that the motor impedance acts as a filter for the applied current waveforms. The combined use of dc-choke and ac-choke further compensates for the distortion to the supply current waveform which is caused by the use of the 3-phase diode rectifier, as shown in Fig. 20(b). The power quality analysis will verify that voltage harmonic distortion complies with harmonic standards [14].
The 10-day period active power logging for NO.1 C.S.W PIP, which is presented hereby in Fig.21, verifies the effectiveness of the proposed control scheme. The proposed frequency control is applied first time between 13/05 and 14/05. It can be easily seen that 350kW are required from DIG during starting in original StarlDelta mode, causing potential need for running an additional DIG in parallel. This demand is normalized down to the nominal power with the proposed SEES application. It is shown that NO.1 C.S.W PIP frequency control results in varying power consumption from 24kW up to 60kW according to MIE and DIG operating profile. The power factor (coscp) is also improved from O.S to 0.95 at all times.
Based on onboard experimental results, the energy saving study is performed and presented in Table IV, while the results are presented in Fig. 22.
TABLE TV: SEES ENERGY SAVING ANALYSIS FOR NO.1 C .S .W PIP
Cooling Se a Wate l' Pumps e n e rgy saving analysis
(630$/tn HFO pO';ce - 0 . 1 52$/kWh, 900$/tn MDO pO';ce - 0.20$/kWh)
Onboard energy saving
measurements before and Sea going + port
after SEES application in/out
Time % 720/0
NO. ortJ/Ps working befc)re NO. 1 Main VFD application C . s . W PIP
C.S. W IJ/Ps Capacity (kW) 75
SEE") VFD Ratcd Speed 750/0
(NO. 1 Main C.s.\V PIP)
SI -]·S VI·l) Rated IJower 3 1 . 64
(each pump) (kW)
SEE") VFD Total Power
Cons umption (kW) 3 1 . 64
Y/,0. Starter Total Power
Cons umption (kW) 75.00
Power Margin (kW) 43. 3 6
\V orking Hours 6.307
k\Vh profit 273.500
$/year gross profit 4 1 .600
Maintenance savings
Total $/year C . S . W PIP
savings from SEES
Operating condition
loading + anchorage
22. 1 50/0
Aux. C . S . W
PIP
30
700/0
25. 73
25. 73
30. 00
4.28
1.940
8.294
1 .300
2,000
50,900
Unloading
5. 850/0
NO. 1 Main C . s . W PIP
+ Aux. C . s . W P/P
105
800/0
38.40
38.40
105. 00
66.60
5 1 3
34,200
6.000
978-1-4673-5202-4/12/$31.00 © 2013 IEEE
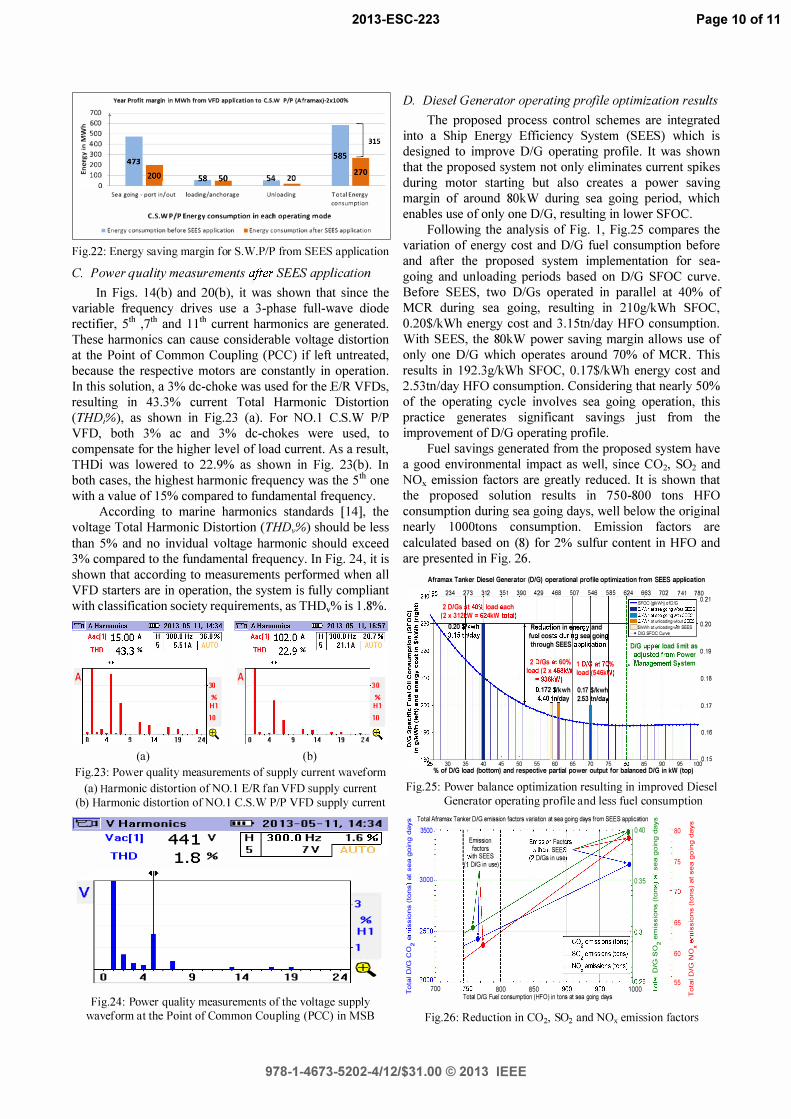
2013-ESC-223 Page 10 of 11
Year Profit margin in Mwh from VFD application to c.s.w pIp (Aframax)-2xlOO% 700
� 600 ;: 500 � 400 i:i 300 � 200
w 100 0 -'---- -.. 54 20
Sea going - port in/out loading/anchorage U n l oading Total Energy co n s u m pt ion
(.s.w pIp Energy consumption in each operating mode • Energy consumption before SEES appl ication • Energy consumption after SEES application
Fig.22: Energy saving margin for S . W.P/P from SEES application
C. Power quality measurements after SEES application
In Figs. I 4(b) and 20(b), it was shown that since the variable frequency drives use a 3-phase full-wave diode rectifier, 5th ,ih and 11 th current harmonics are generated. These harmonics can cause considerable voltage distortion at the Point of Common Coupling (PCC) if left untreated, because the respective motors are constantly in operation. In this solution, a 3% dc-choke was used for the E/R VFDs, resulting in 43.3% current Total Harmonic Distortion (THDi%), as shown in Fig.23 (a). For NO.1 C.S.W PIP VFD, both 3% ac and 3% dc-chokes were used, to compensate for the higher level of load current. As a result, THDi was lowered to 22.9% as shown in Fig. 23(b). In both cases, the highest harmonic frequency was the 5th one with a value of 15% compared to fundamental frequency.
According to marine harmonics standards [14], the voltage Total Harmonic Distortion (THD,,%) should be less than 5% and no invidual voltage harmonic should exceed 3% compared to the fundamental frequency. In Fig. 24, it is shown that according to measurements performed when all VFD starters are in operation, the system is fully compliant with classification society requirements, as THDv% is 1.8%.
A A 30 % H 1 1 0
1 9 24 � 0 4
(a)
..
I I • 9 1 4
(b)
1 9 2 4
3 0 % H 1 1 0
Fig.23 : Power quality measurements of supply current waveform
(a) Harmonic distortion of NO. ! EIR fan VFD supply current
(b) Harmonic distortion of NO. ! C .S .W PIP VFD supply current
'EJ:t V Ha rmon ics
v
Vac[ l ] THO
I • . 0 4
� �
44 1 V 1 . 8 %
• 9
IllD 2 0 1 3 - 0 5 - 1 1 . 1 4 : 3 4 1 � 1 3 0 0 . 0 7H: 1 . 6 %1
3 %
H 1 1
1 4 1 9 2 4 �
Fig.24: Power quality measurements of the voltage supply
waveform at the Point of Common Coupling (PCC) in MSB
D. Diesel Generator operating profile optimization results
The proposed process control schemes are integrated into a Ship Energy Efficiency System (SEES) which is designed to improve DIG operating profile. It was shown that the proposed system not only eliminates current spikes during motor starting but also creates a power saving margin of around 80kW during sea going period, which enables use of only one DIG, resulting in lower SFOC.
Following the analysis of Fig. 1, Fig.25 compares the variation of energy cost and DIG fuel consumption before and after the proposed system implementation for seagoing and unloading periods based on DIG SFOC curve. Before SEES, two DIGs operated in parallel at 40% of MCR during sea going, resulting in 210g/kWh SFOC, 0.20$/kWh energy cost and 3. 15tnlday HFO consumption. With SEES, the 80kW power saving margin allows use of only one DIG which operates around 70% of MCR. This results in 192.3g/kWh SFOC, 0.17$/kWh energy cost and 2.53tnlday HFO consumption. Considering that nearly 50% of the operating cycle involves sea going operation, this practice generates significant savings just from the improvement of DIG operating profile.
Fuel savings generated from the proposed system have a good environmental impact as well, since CO2, S02 and NOx emission factors are greatly reduced. It is shown that the proposed solution results in 750-800 tons HFO consumption during sea going days, well below the original nearly 1000tons consumption. Emission factors are calculated based on (8) for 2% sulfur content in HFO and are presented in Fig. 26.
Aframax Tanker Diesel Generator (DIG) operational profile optimization from SEES application
2401 95 234 273 312 351 390 429 468 507 546 585 624 663 702 741 788. 2 1 I
iii �OC (.kWh) ofD� :1 2 DIGs t 4QoA load ach
(2 x 312 W = 4kW "'tal)
0.20 $ kwh R �ucti
K5 t�day fu I COS th ough
'" 2 IGs
loa (2 x
I' . •• u,
. 1 72 ...... �.40 t
......
n in energy and during sea goin
SEES application
60% 1 D/G at 7 % 68kW load (546k Iv) Ikwh 0.17 $/kwh Iday 2.53 tn/da
l"-
: _$MWh atsea goir.g'l.loLtSEES
I _$fKWh atsea \ping\�thSEES
. : _$MWh at unloacing wout SEES I �$MWh at unloacing I'.ItIl SEES 0.20 ! _ DIG SFOC CU�.I€
I DIG upper load I mit as
I f3djusted from ower
I J. •• Management S stem
0 . 1 9
0 . 1 8
0 . 1 7
0 . 1 6 I I I I il l l l l i l l I I 1 8� 30 35 40 45 50 55 60 65 70 75 85 90 95 1 00°. 1 5 % of DIG load (bottom) and respective partial power output for balanced DIG in kW (top)
Fig.25: Power balance optimization resulting in improved Diesel
Generator operating profile and less fuel consumption
� Total Aframax Tanker DIG emission fa::tors variation at sea going days from SEES application � � 3500 : OAO � g : Emission Emission Fact g> "& : factors without SEE "& CIJ
: rth SEES (2 DIGs in use (IJ � I( DIG in use) � 1il 3000 0.35 : � c g � c 0 .� � E •
ON C) � 0 }ii 0 f-
c g � c o .� �
250° r--tl'i:t7/1----t:====::;- 0.3 .� ON f/J � o
2000 ��'"::-:������������_ 0.25 � 700 50 800 850 1 000 r
Tota DIG Fuel consumption (HFO) in tons at sea going days
� - 80 '"
m "0 Ol C ·0
� 75 Ol m • � "iii
- 70 " c 0 C � c
- 65 0 :�
x 0 - 60 z � 0
55 }ii 0 f-
Fig.26: Reduction in CO2, S02 and NOx emission factors
978-1-4673-5202-4/12/$31.00 © 2013 IEEE
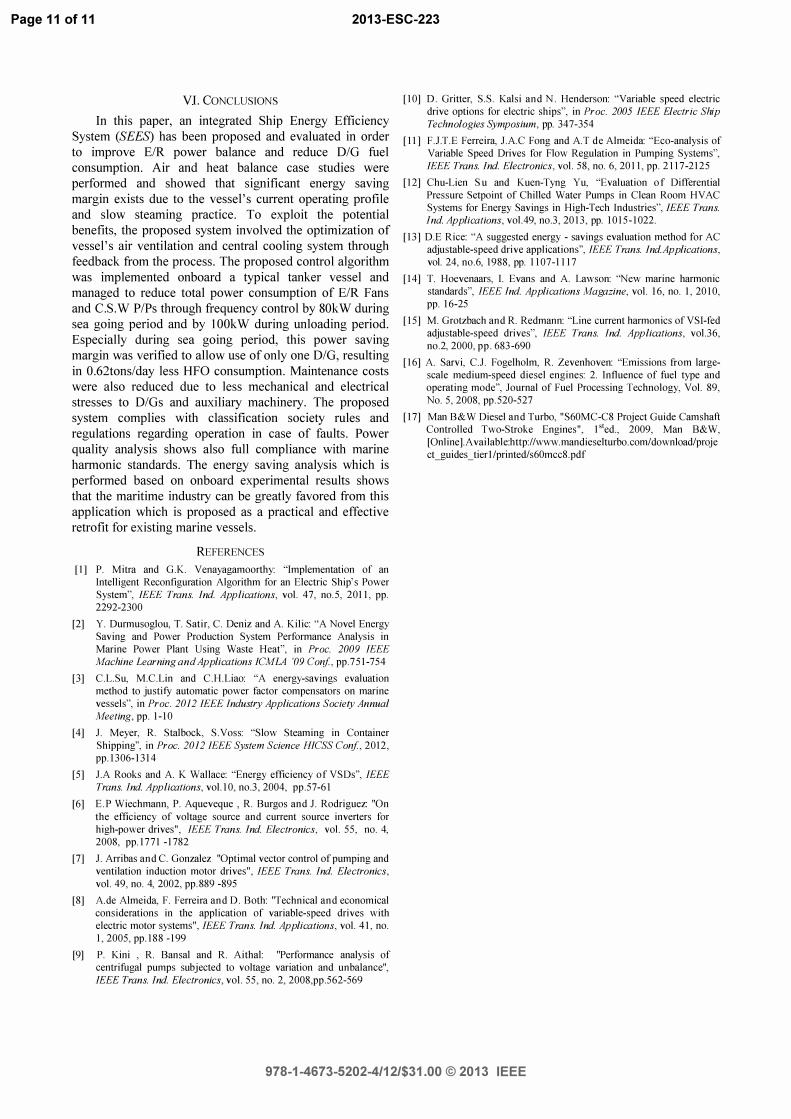
Page 11 of 11 2013-ESC-223
VI. CONCLUSIONS
In this paper, an integrated Ship Energy Efficiency System (SEES) has been proposed and evaluated in order to improve E/R power balance and reduce DIG fuel consumption. Air and heat balance case studies were performed and showed that significant energy saving margin exists due to the vessel's current operating profile and slow steaming practice. To exploit the potential benefits, the proposed system involved the optimization of vessel's air ventilation and central cooling system through feedback from the process. The proposed control algorithm was implemented onboard a typical tanker vessel and managed to reduce total power consumption of EIR Fans and C.S.W PIPs through frequency control by 80kW during sea going period and by lOOk W during unloading period. Especially during sea going period, this power saving margin was verified to allow use of only one DIG, resulting in 0.62tons/day less HFO consumption. Maintenance costs were also reduced due to less mechanical and electrical stresses to DIGs and auxiliary machinery. The proposed system complies with classification society rules and regulations regarding operation in case of faults. Power quality analysis shows also full compliance with marine harmonic standards. The energy saving analysis which is performed based on onboard experimental results shows that the maritime industry can be greatly favored from this application which is proposed as a practical and effective retrofit for existing marine vessels.
REFERENCES
[ I ] P. Mitra and G.K. Venayagamoorthy: "Implementation of an Intelligent Reconfiguration Algorithm for an Electric Ship' s Power System", IEEE Trans. Ind. Applications, vol. 47, no.5, 201 1 , pp. 2292-2300
[2] Y. Durmusoglou, T. Satir, C. Deniz and A Kilic: "A Novel Energy Saving and Power Production System Performance Analysis in Marine Power Plant Using Waste Heat'", in Proc. 2009 IEEE Machine Le arning and Applications ICMLA '09 Con!, pp.7 5 1 -754
[3] C.L.Su, M.C.Lin and C.H.Liao: "A energy-savings evaluation method to justify automatic power factor compensators on marine vessels", in Proc. 2012 IEEE Industry Applications Society Annual Mee ting, pp. 1 - 1 0
[4] l Meyer, R. Stalbock, S.Voss: "Slow Steaming in Container Shipping'", in Proc. 2012 IEEE System Science HlCSS Con!, 2012, pp. 1 3 06- 1 3 1 4
[5] lA Rooks and A K Wallace: "Energy efficiency of VSDs'", IEEE Trans. Ind. Applications, vol. I 0, no.3 , 2004, pp.57-6 1
[6] E.P Wiechmann, P. Aqueveque , R. Burgos and J. Rodriguez: "On the efficiency of voltage source and current source inverters for high-power drives" , IEEE Trans. Ind. Electronics, vol. 55 , no. 4, 2008, pp. I 7 7 1 - 1 782
[7] l Arribas and C. Gonzalez "Optimal vector control of pumping and ventilation induction motor drives" , IEEE Trans. Ind. Electronics, vol. 49, no. 4, 2002, pp.889 -895
[8] Ade Almeida, F. Ferreira and D. Both: "Technical and economical considerations in the application of variable-speed drives with electric motor systems" , IEEE Trans. Ind. Applications, vol. 4 1 , no. 1 , 2005, pp. 1 8 8 - 1 99
[9] P. Kini , R. Bansal and R. Aithal: "Performance analysis of centrifugal pumps subjected to voltage variation and unbalance", IEEE Trans. Ind. Electronics, vol. 55 , no. 2, 2008,pp.562-569
[ 1 0] D. Gritter, S.S. Kalsi and N. Henderson: "Variable speed electric drive options for electric ships", in Proc. 2005 IEEE Electric Ship Technologies Symposium, pp. 347-354
[ 1 1 ] F.lT.E Ferreira, lAC Fong and AT de Almeida: "Eco-analysis of Variable Speed Drives for Flow Regulation in Pumping Systems", IEEE Trans. Ind. Electronics, vol. 58, no. 6, 20 1 1 , pp. 2 1 1 7 -2 1 2 5
[ 1 2] Chu-Lien S u and Kuen-Tyng Yu, "Evaluation o f Diflerential Pressure Setpoint of Chilled Water Pumps in Clean Room HVAC Systems for Energy Savings in High-Tech Industries", IEEE Trans. Ind. Applications, vo1.49, no.3 , 20 1 3 , pp. 1 0 1 5 - 1 022.
[ 1 3 ] D.E Rice: "A suggested energy - savings evaluation method for AC adjustable-speed drive applications'", IEEE Trans. Ind.Applications, vol. 24, no.6, 1988 , pp. I I 07- 1 1 1 7
[ 1 4] T. Hoevenaars, I. Evans and A Lawson: "New marine harmonic standards", IEEE Ind. Applications Magazine, vol. 1 6, no. 1 , 20 1 0, pp. 1 6-25
[ 1 5] M. Grotzbach and R. Redmann: "Line current harmonics of VSI-fed adjustable-speed drives", IEEE Trans. Ind. Applications, vo1.3 6, no.2, 2000, pp. 683 -690
[ 1 6] A Sarvi, C.J. Fogelholm, R. Zevenhoven: "Emissions from largescale medium-speed diesel engines: 2. Influence of fuel type and operating mode'", Journal of Fuel Processing Technology, Vol. 89, No. 5 , 2008, pp.520-527
[ 1 7] Man B&W Diesel and Turbo, "S60MC-C8 Project Guide Camshaft Controlled Two-Stroke Engines" , I sted., 2009, Man B&W, [Online ].Available:http://www.mandieselturbo.comldownload/proje ct_guides _tier I Iprinted/s60mcc8. pdf
978-1-4673-5202-4/12/$31.00 © 2013 IEEE
A cascade control scheme for a grid connected Battery Energy Storage System (BESS)
Spyridon V. Giannoutsos, Student Member, IEEE and Stefanos N. Manias, Fellow, IEEE *
Abstract - The development of a Battery Energy Storage System (BESS) is considered to be very important for peak shaving and power demand normalization, especially in an autonomous power system. This paper presents a control scheme based on a cascade of an external controller that regulates the active and reactive power to generate reference currents and an internal current controller which produces gating signals for the inverter semiconductor switches. The proposed control algorithm takes the state of charge (SOC%) of the battery system into account and implements an active power command override to satisfy the requirements of the SOC% limits of the batteries. System simulations are performed during discharging and charging modes of operation as well as during the active power command override mode for several power demand step variations. The evaluation of the results shows good system performance and dynamic behavior. Index Terms - Battery Energy Storage System (BESS), P-Q control, State of charge (SOC), VSI grid interconnection
I. INTRODUCTION A promising method in order to regulate power
demand in a power system is to store energy when the demand is decreased and inject energy back to the grid at peak load. This can be realized through a battery energy storage system with a four-quadrant grid-synchronized inverter operation, which can store energy from the grid and inject energy back to the grid at a given active (P) and reactive (Q) power command. When a current control is used, the inverter output currents are measured and compared to reference signals in order to provide the voltage reference to an SPWM modulator which provides the gating signals for the inverter semiconductor switches.
In the past, several methods have been proposed for the control of such inverters [1]-[5]. The strategy presented in [1] focuses on islanding detection and fault limit, in [2] effective communication between DG Units through droop control and average power control is implemented, while in [3] unbalanced micro-grids are tested for inverter stability. A comparative study of VSI CSI as an interface for distributed generation (DG) applications has been performed in [4]-[5], while in [6] DG control schemes based on fuel cell, photovoltaic, and wind turbines are presented. Particularly for BESS control
*S.V. Giannoutsos and S.N. Manias are with the School of Electrical and Computer Engineering, National Technical University of Athens (NTUA), 9 Iroon Polytechniou st., 15780 Athens, Greece (e-mail: [email protected])
applications, [7]-[8] focus on the optimal operation of the system using linear and dynamic programming techniques, while control techniques for power conditioning and load leveling are presented in [9] .
The control scheme evaluated in this paper uses the state of charge (SOC %) of the batteries to satisfy the system limits, while regulating the active and reactive power through two control loops in cascade. The system uses a PLL to synchronize the inverter with the grid which makes it insensitive to disturbances, such as voltage sags. Simulations are carried out in MATLAB during the system’s battery discharging and charging modes for load step variations. An active power command override function is included, where the system does not follow the active power command in order to satisfy the SOC limits.
II. BESS TOPOLOGY AND MODES OF OPERATION To achieve peak shaving and load leveling, BESS
should charge the batteries with energy produced from base load power plants during low power demand and discharge at peak load, delivering power back to the grid to normalize power supplied by high cost power plants such as wind or photovoltaic power stations. During intermediate power demand, BESS is used to balance supply and demand in order to maintain constant frequency if it operates as part of an autonomous power system, as shown in Fig.1. During this operation, the system must satisfy the battery SOC limits.
Fig.1. Optimal charging and discharging of BESS batteries for peak shaving and load leveling, achieving max. economic benefits
The under examination BESS topology is presented
in Fig.2. It consists of a Li-ion battery pack, the four-quadrant three phase VSI, which is able to transfer power in both directions, an LCL output filter and the necessary voltage and current measuring equipment placed at the
2nd IEEE ENERGYCON Conference & Exhibition, 2012 / Future Energy Grids and Systems Symp
978-1-4673-1454-1/12/$31.00 © 2012 IEEE 469
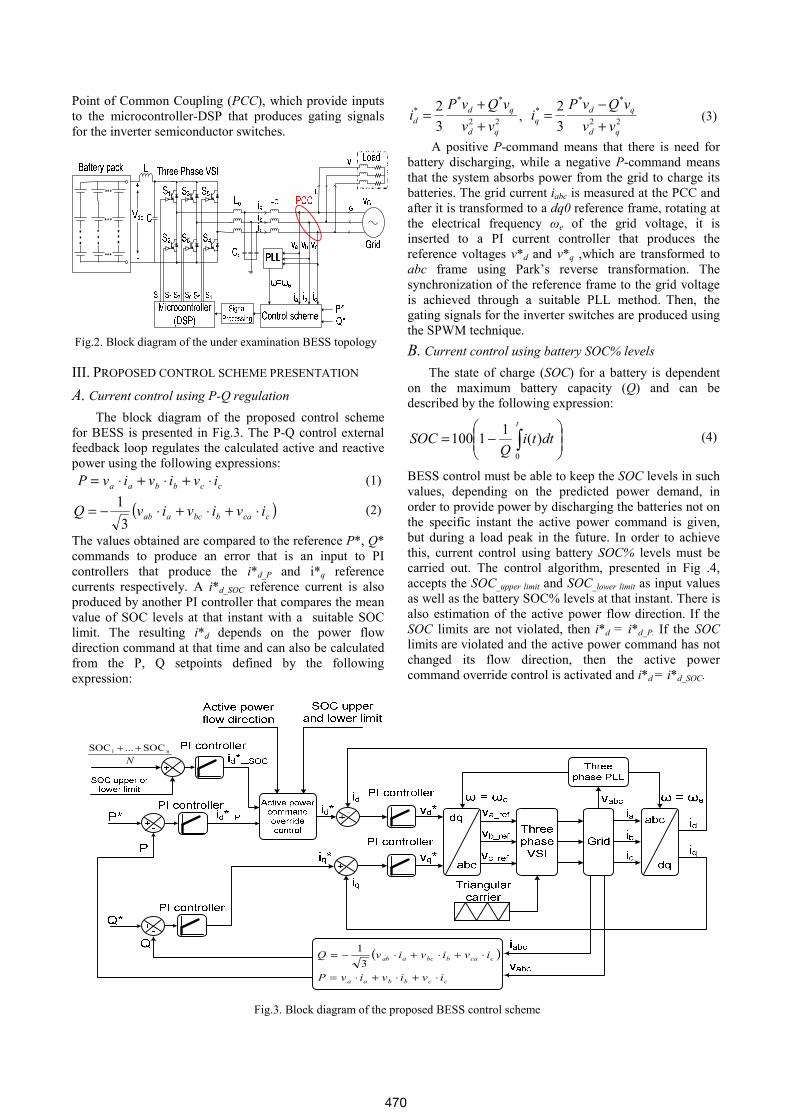
Point of Common Coupling (PCC), which provide inputs to the microcontroller-DSP that produces gating signals for the inverter semiconductor switches.
Fig.2. Block diagram of the under examination BESS topology
III. PROPOSED CONTROL SCHEME PRESENTATION Α. Current control using P-Q regulation
The block diagram of the proposed control scheme for BESS is presented in Fig.3. The P-Q control external feedback loop regulates the calculated active and reactive power using the following expressions: ccbbaa ivivivP ⋅+⋅+⋅= (1)
( )ccabbcaab ivivivQ ⋅+⋅+⋅−=3
1 (2)
The values obtained are compared to the reference P*, Q* commands to produce an error that is an input to PI controllers that produce the i*d_P and i*q reference currents respectively. A i*d_SOC reference current is also produced by another PI controller that compares the mean value of SOC levels at that instant with a suitable SOC limit. The resulting i*d depends on the power flow direction command at that time and can also be calculated from the P, Q setpoints defined by the following expression:
22
***
32
qd
qdd vv
vQvPi
++
= , 22
***
32
qd
qdq vv
vQvPi
+−
=
(3)
A positive P-command means that there is need for battery discharging, while a negative P-command means that the system absorbs power from the grid to charge its batteries. The grid current iabc is measured at the PCC and after it is transformed to a dq0 reference frame, rotating at the electrical frequency ωe of the grid voltage, it is inserted to a PI current controller that produces the reference voltages v*d and v*q ,which are transformed to abc frame using Park’s reverse transformation. The synchronization of the reference frame to the grid voltage is achieved through a suitable PLL method. Then, the gating signals for the inverter switches are produced using the SPWM technique.
B. Current control using battery SOC% levels The state of charge (SOC) for a battery is dependent
on the maximum battery capacity (Q) and can be described by the following expression:
⎟⎟⎠
⎞⎜⎜⎝
⎛−= ∫
t
dttiQ
SOC0
)(11100 (4)
BESS control must be able to keep the SOC levels in such values, depending on the predicted power demand, in order to provide power by discharging the batteries not on the specific instant the active power command is given, but during a load peak in the future. In order to achieve this, current control using battery SOC% levels must be carried out. The control algorithm, presented in Fig .4, accepts the SOC_upper limit and SOC_lower limit as input values as well as the battery SOC% levels at that instant. There is also estimation of the active power flow direction. If the SOC limits are not violated, then i*d = i*d_P. If the SOC limits are violated and the active power command has not changed its flow direction, then the active power command override control is activated and i*d = i*d_SOC.
( )
ccbbaa
ccabbcaab
ivivivP
ivivivQ
⋅+⋅+⋅=
⋅+⋅+⋅−=3
1
Nn1 SOC...SOC ++
Fig.3. Block diagram of the proposed BESS control scheme
470
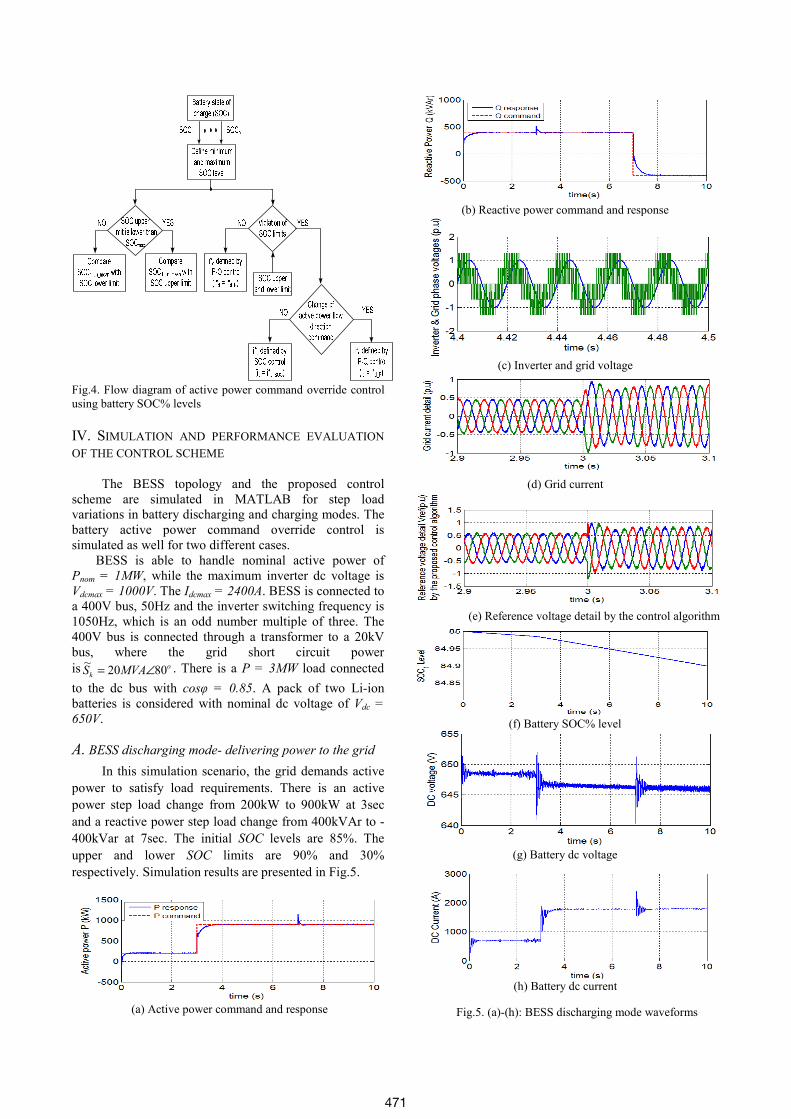
Fig.4. Flow diagram of active power command override control using battery SOC% levels IV. SIMULATION AND PERFORMANCE EVALUATION OF THE CONTROL SCHEME
The BESS topology and the proposed control scheme are simulated in MATLAB for step load variations in battery discharging and charging modes. The battery active power command override control is simulated as well for two different cases.
BESS is able to handle nominal active power of Pnom = 1MW, while the maximum inverter dc voltage is Vdcmax = 1000V. The Idcmax = 2400A. BESS is connected to a 400V bus, 50Hz and the inverter switching frequency is 1050Hz, which is an odd number multiple of three. The 400V bus is connected through a transformer to a 20kV bus, where the grid short circuit power is o
k MVAS 8020~ ∠= . There is a P = 3MW load connected to the dc bus with cosφ = 0.85. A pack of two Li-ion batteries is considered with nominal dc voltage of Vdc = 650V.
Α. BESS discharging mode- delivering power to the grid
In this simulation scenario, the grid demands active power to satisfy load requirements. There is an active power step load change from 200kW to 900kW at 3sec and a reactive power step load change from 400kVAr to -400kVar at 7sec. The initial SOC levels are 85%. The upper and lower SOC limits are 90% and 30% respectively. Simulation results are presented in Fig.5.
(a) Active power command and response
(b) Reactive power command and response
(c) Inverter and grid voltage
(d) Grid current
(e) Reference voltage detail by the control algorithm
(f) Battery SOC% level
(g) Battery dc voltage
(h) Battery dc current
Fig.5. (a)-(h): BESS discharging mode waveforms
471
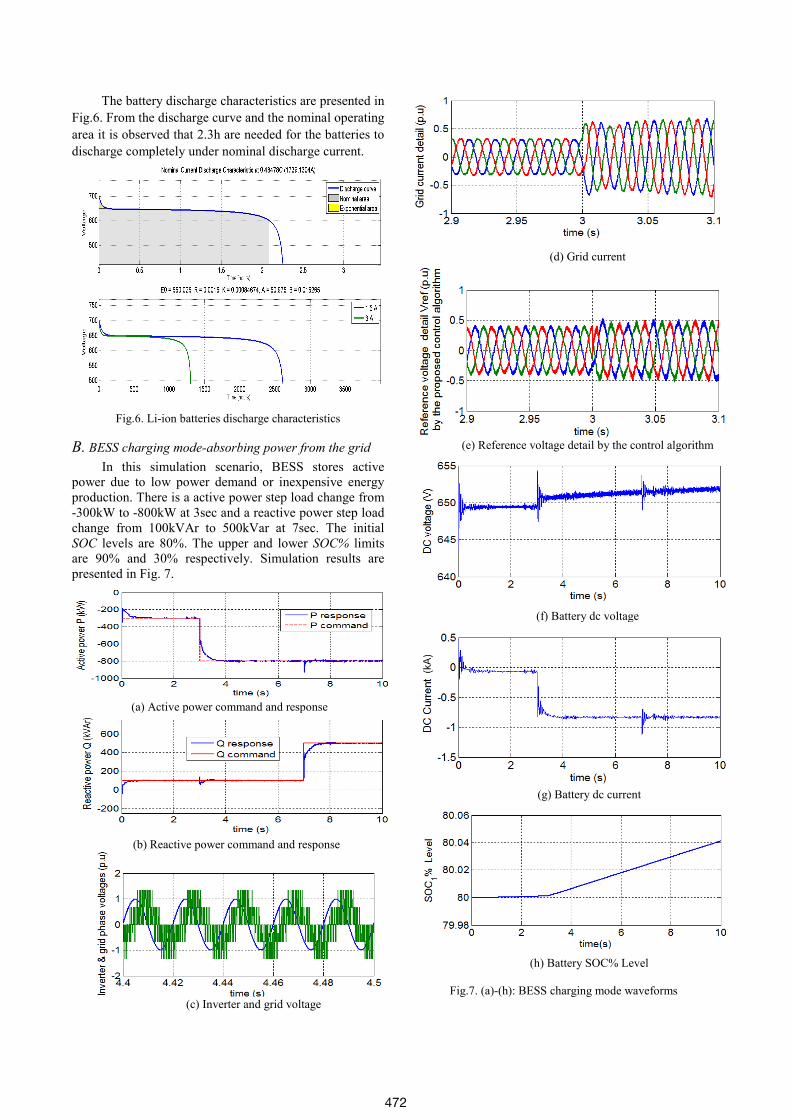
The battery discharge characteristics are presented in Fig.6. From the discharge curve and the nominal operating area it is observed that 2.3h are needed for the batteries to discharge completely under nominal discharge current.
Fig.6. Li-ion batteries discharge characteristics
B. BESS charging mode-absorbing power from the grid
In this simulation scenario, BESS stores active power due to low power demand or inexpensive energy production. There is a active power step load change from -300kW to -800kW at 3sec and a reactive power step load change from 100kVAr to 500kVar at 7sec. The initial SOC levels are 80%. The upper and lower SOC% limits are 90% and 30% respectively. Simulation results are presented in Fig. 7.
(a) Active power command and response
(b) Reactive power command and response
(c) Inverter and grid voltage
(d) Grid current
(e) Reference voltage detail by the control algorithm
(f) Battery dc voltage
(g) Battery dc current
(h) Battery SOC% Level
Fig.7. (a)-(h): BESS charging mode waveforms
472
According to simulation results, it is shown that active and reactive power responses need less than 1s until they reach steady state, while they display minimum overshoots. The switching frequency is fixed at carrier frequency because of SPWM technique. During the battery discharging mode (Fig.5), inverter phase voltage leads in relation to the grid voltage, which means that power transfers from the inverter to the grid. The battery SOC level is slowly decreasing due to discharge, while dc voltage is slowly decreasing as well. In this mode, the voltage source converter operates as an inverter, delivering power to the grid. The opposite occur in the battery charging mode (Fig.7), where the converter operates as a rectifier, charging the batteries. In Fig.8, the frequency spectrum of the grid current is presented and the THDi of 2.91% satisfies IEEE 519 and IEC 61000-3-6 limits [10].
Fig.8 Grid current waveform and its respective frequency
spectrum (THDi = 2.91%)
C. BESS simulation during active power command override Case 1: In this simulation scenario, BESS does not follow the active power command (P*) in order to satisfy the SOC limits.The system can return to the original state only if after a time period the SOC limits are satisfied and the active power flow command has changed direction. In this case, there is an active power command constant at 800kW and a reactive power step load change from 200kVA to -200kVA at 7sec. The upper and lower SOC limits are 90% and 89.998% in order not to discharge the battery now, but in the future. Simulation results are presented in Fig.9.
(a) Active power command and response
(b) Reference voltage detail by the control algorithm
(c) Grid current
(d) Battery dc voltage
(e) Battery dc current
(f) Battery SOC% level
Fig.9. (a)-(f): BESS active power command override control
(simulation of case 1) In Fig. 9 it is shown that even if the system initially follows the P-Q commands, when it reaches the 89,998 lower limit, the active power command override activates
473
and the desired target is now the mean value of the two SOC% levels. Thus, the battery begins to charge, which is observed by the negative dc current. The SOC% levels change periodically. Case 2: In this case, there is an active power step load change command from -800kW to 300kW at 11sec and a reactive power step load change from 100kVA to -300kVA at 7sec. The upper and lower SOC limits are 90.05% and 30% in order not to charge the battery further due to high energy cost .The initial SOC levels are 90%. Simulation results are presented in Fig.10.
(a) Active power command and response
(b) Battery dc current
(c) Battery SOC% level
Fig.10. (a)-(c): BESS active power command override control
(simulation of case 2) In Fig. 9 it is shown that the system initially follows
the P-Q commands until 9sec. At that moment it reaches the high limit of 90.05% the active power command activates. Thus, the battery begins to discharge delivering to the grid the maximum power that the inverter can handle. This control is valid until 11sec. At that moment, the active power command changes its flow direction and the system is within SOC limits. Therefore, from 11sec and after, the system follows the P-Q commands.
V. CONCLUSIONS
In this paper, a control scheme for a battery energy storage system has been presented and analyzed. The proposed control is realized by using two control loops in cascade. The external P-Q control loop produces the reference currents and the internal current loop regulates the gating signals for the inverter semiconductor switches. A Battery SOC% level control is integrated in the control scheme in order to achieve maximum efficiency in peak shaving and load leveling. The active power command is followed only if the battery SOC limits are satisfied. The simulations show that system responses are quick and display minimum overshoot. The power quality is within IEEE 519 and IEC 61000-3-6 limits as the THDi is well below 5%. Last, the switching frequency is fixed at carrier frequency, which is important for the power inverter semiconductor switches.
REFERENCES [1] G. Fang, and M. R. Iravani, “A Control Strategy for a
Distributed Generation Unit in Grid-Connected and Autonomous Modes of Operation”, IEEE Trans. Power Delivery, vol. 23, no. 2, 2008, pp. 850-859
[2] M. N. Marwali, J. Jin-Woo and A. Keyhani, “Control of distributed generation systems - Part II: Load sharing control”, IEEE Trans. Power Electronics, vol. 19, no. 6, 2004, pp. 1551-1561
[3] N. L. Soultanis, S. A. Papathanasiou, and N. D. Hatziargyriou, “A Stability Algorithm for the Dynamic Analysis of Inverter Dominated Unbalanced LV Microgrids,” IEEE Trans. Power Systems, vol. 22, no. 1, 2007, pp. 294-304
[4] F. Blaabjerg , Z. Chen and S. B. Kjaer "Power electronics as efficient interface in dispersed power generation systems", IEEE Trans. Power Electronics, vol. 19, pp.1184 2004
[5] K. Sung-Hun, S. R. Lee, H. Dehbonei et al., “Application of voltage and current-controlled voltage source inverters for distributed generation systems,” IEEE Trans. Energy Conversion, vol. 21, no. 3, 2006, pp. 782-792,
[6] F. Blaabjerg, R. Teodorescu, M. Liserre, A.V. Timbus. 2006. “Overview of control and grid synchronization for distributed power generation systems”, IEEE Trans. Industrial Electronics. Vol. 53, 2006, pp. 1398 – 1409
[7] A. Oudalov, R. Cherkaoui “Sizing and optimal operation of a battery energy storage system for peak shaving application”, IEEE Powertech, 2007, pp. 621-625
[8] L. T Youn, S. Cho “Optimal Operation of Energy Storage Using Linear Programming Technique”, WCECS 2009, Vol 1, San Francisco, USA, Oct 2009
[9] R.S. Bhatia, S.P. Jain, Singh D.K. “Battery Energy Storage System for Power Conditioning of Renewable Energy Sources”, IEEE PEDS, Vol 1, 2005, pp. 501 – 506
[10] IEC 61000-3-6 international standard,” Limits - Assessment of emission limits for the connection of distorting installations to MV, HV and EHV power systems”,2008, pp. 1-58
474
Related Documents


