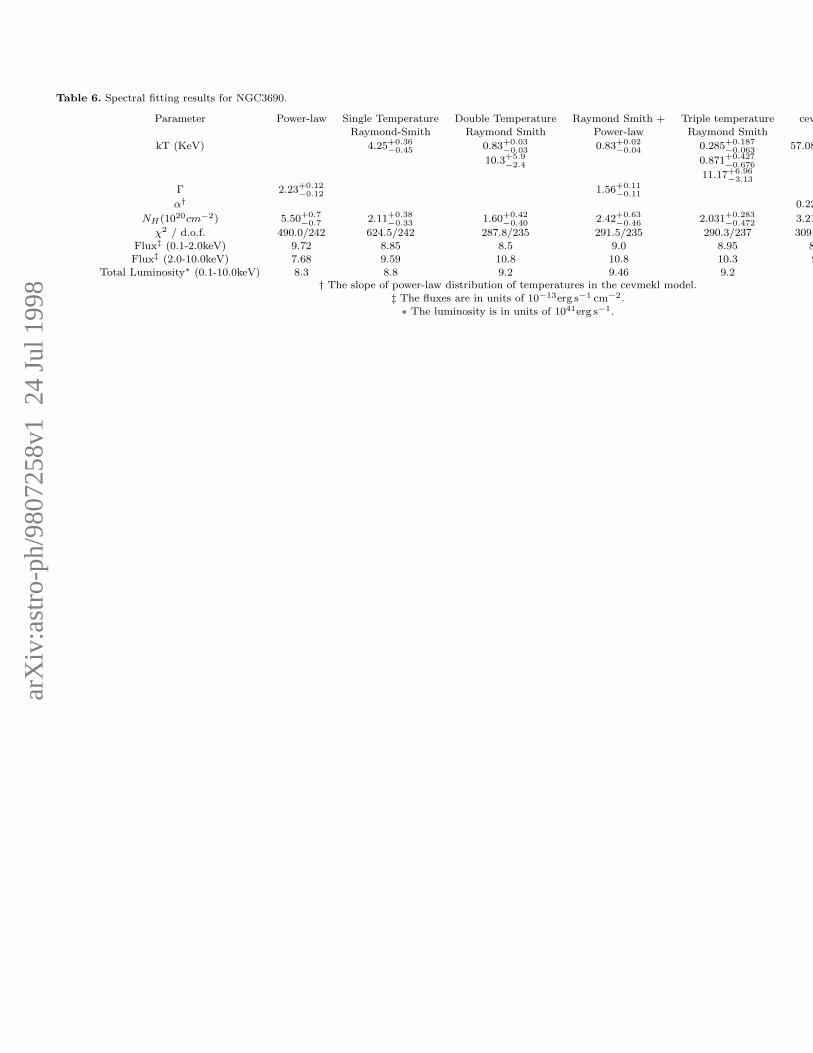
arXiv:astro-ph/9807258v1 24 Jul 1998 Table 6. Spectral fitting results for NGC3690. Parameter Power-law Single Temperature Double Temperature Raymond Smith + Triple temperature cev Raymond-Smith Raymond Smith Power-law Raymond Smith kT (KeV) 4.25 +0.36 −0.45 0.83 +0.03 −0.03 0.83 +0.02 −0.04 0.285 +0.187 −0.063 57.08 10.3 +5.9 −2.4 0.871 +0.427 −0.676 11.17 +6.96 −3.13 Γ 2.23 +0.12 −0.12 1.56 +0.11 −0.11 α † 0.22 N H (10 20 cm −2 ) 5.50 +0.7 −0.7 2.11 +0.38 −0.33 1.60 +0.42 −0.40 2.42 +0.63 −0.46 2.031 +0.283 −0.472 3.21 χ 2 / d.o.f. 490.0/242 624.5/242 287.8/235 291.5/235 290.3/237 309. Flux ‡ (0.1-2.0keV) 9.72 8.85 8.5 9.0 8.95 8 Flux ‡ (2.0-10.0keV) 7.68 9.59 10.8 10.8 10.3 9 Total Luminosity ∗ (0.1-10.0keV) 8.3 8.8 9.2 9.46 9.2 † The slope of power-law distribution of temperatures in the cevmekl model. ‡ The fluxes are in units of 10 −13 erg s −1 cm −2 . ∗ The luminosity is in units of 10 41 erg s −1 .

Welcome message from author
This document is posted to help you gain knowledge. Please leave a comment to let me know what you think about it! Share it to your friends and learn new things together.
Transcript
arX
iv:a
stro
-ph/
9807
258v
1 2
4 Ju
l 199
8
Table 6. Spectral fitting results for NGC3690.
Parameter Power-law Single Temperature Double Temperature Raymond Smith + Triple temperature cevmeklRaymond-Smith Raymond Smith Power-law Raymond Smith
kT (KeV) 4.25+0.36−0.45 0.83+0.03
−0.03 0.83+0.02−0.04 0.285+0.187
−0.063 57.08(
10.3+5.9−2.4 0.871+0.427
−0.676
11.17+6.96−3.13
Γ 2.23+0.12−0.12 1.56+0.11
−0.11
α† 0.22
NH(1020cm−2) 5.50+0.7−0.7 2.11+0.38
−0.33 1.60+0.42−0.40 2.42+0.63
−0.46 2.031+0.283−0.472 3.21
χ2 / d.o.f. 490.0/242 624.5/242 287.8/235 291.5/235 290.3/237 309.Flux‡ (0.1-2.0keV) 9.72 8.85 8.5 9.0 8.95 8.62Flux‡ (2.0-10.0keV) 7.68 9.59 10.8 10.8 10.3 9.9
Total Luminosity∗ (0.1-10.0keV) 8.3 8.8 9.2 9.46 9.2† The slope of power-law distribution of temperatures in the cevmekl model.
‡ The fluxes are in units of 10−13erg s−1 cm−2.∗ The luminosity is in units of 1041erg s−1.
arX
iv:a
stro
-ph/
9807
258v
1 2
4 Ju
l 199
8Mon. Not. R. Astron. Soc. 000, 000–000 (0000) Printed 8 December 2013 (MN LATEX style file v1.4)
ROSAT and ASCA Observations of X-ray Luminous
starburst Galaxies : NGC3310 and NGC3690
A.L. Zezas1, I. Georgantopoulos2 and M. J. Ward1
1 Department of Physics and Astronomy, University of Leicester, Leicester, LE1 7RH2 National Observatory of Athens, Lofos Koufou, Palaia Penteli, 15236, Athens, Greece
8 December 2013
ABSTRACT
We present ROSAT (HRI and PSPC) and ASCA observations of the two luminous(Lx ∼ 1041−42 erg s−1) star-forming galaxies NGC3310 and NGC3690. The HRIshows clearly that the sources are extended with the X-ray emission in NGC3690coming from at least three regions. The combined 0.1-10 keV spectrum of NGC3310can be described by two components, a Raymond-Smith plasma with temperaturekT = 0.81+0.09
−0.12 keV and a hard power-law, Γ = 1.44+0.20
−0.11, (or alternatively a harderRaymond-Smith plasma with kT ∼ 15 keV), while there is no substantial excessabsorption above the Galactic. The soft component emission is probably due to asuper-wind while the nature of the hard emission is more uncertain with likely origins,X-ray binaries, inverse Compton scattering of IR photons, an AGN or a very hot gascomponent (∼ 108 K). The spectrum of NGC3690 is similar, with kT = 0.83+0.02
−0.04
keV and Γ = 1.56+0.11
−0.11. We also employ more complicated models such as a multi-temperature thermal plasma, a non-equilibrium ionization code or the addition ofa third softer component which improve the fit but not at a statistically significantlevel (< 2σ). These results are similar to recent results on the archetypal star-forminggalaxies M82 and NGC253.
Key words: galaxies: starburst-galaxies: merger-X-rays: galaxies-galaxies: individual:NGC3690-galaxies: individual: NGC3310
1 INTRODUCTION
Significant X-ray emission from star-forming galaxies hasbeen known since the EINSTEIN epoch (eg Stewart et al.1982). Their X-ray spectrum in the 0.3-3.5 keV band can befitted by a thermal plasma of temperature about 2 keV withan absorption often higher than the Galactic value (eg. Fab-biano 1988, Kim et al. 1992). However, simple spectral fitssuggested that the emission mechanism may be more com-plicated than a single temperature thermal plasma. Indeed,for a few nearby star-forming galaxies (eg M82 and NGC253)several discrete sources, mostly X-ray binaries, are also re-solved (Long & Van Speybroeck 1983). The EINSTEIN HRIprovided the first evidence for extended X-ray features (egWatson et al. ,1984, Fabbiano and Trinchieri 1984).
The effective area of ROSAT PSPC provided the op-portunity to dramatically increase the number of starform-ing galaxies studied in X-rays. Hot gas halos and outflows,have also been observed, around many starforming galaxies(eg. Read, Ponman & Wolstencroft 1995, Della Ceca, Grif-fiths & Heckman 1996, Read, Ponman & Strickland 1997),as was anticipated based on previous optical (Heckman etal. 1990) and theoretical work (e.g. MacLow and Mc Cray
1988). This wind can be produced by the supply of mechan-ical energy via stellar winds from evolved massive stars andnumerous supernovae. The hot gas is accelerated outwardsforming an expanding superbubble, which on reaching theextent of the minor axis of the galaxy, blows out followingthe onset of the Rayleigh-Taylor instability. These outflowscan extend for several kpc along the minor axis of the galaxy,and have major influence on its subsequent evolution. Thisis especially so in the case of dwarf galaxies, where becauseof their weak gravitational potential, the wind can removethe interstellar medium causing star formation to cease, (egDekel & Silk 1986, Heckman et al. 1995). Combined ROSATand ASCA observations of star-forming galaxies, (eg Ser-lemitsos, Ptak & Yaqoob 1996) suggest that the soft X-rayband can be fitted with a thermal plasma and a power-lawmodel. The plasma temperature is ∼ 0.6 − 0.8keV, with anabsorbing column NH > 1021 cm−2, well above the Galacticvalue, and the power-law photon index is ∼ 1.7. The hard X-ray band can be fitted equally well with a high temperaturethermal plasma model, kT > 6keV, (cf. Ohashi et al. 1990).The soft emission may emanate from the super-wind whilethe origin of the harder power-law X-ray emission may bedue to either X-ray binaries or Inverse Compton scattering
c© 0000 RAS
2 A. L. Zezas,I. Georgantopoulos and M. J. Ward
of infrared-photons by the relativistic electrons generatedby the supernovae (eg Rieke et al. 1980). The presence ofvery hot gas (∼ 108K), or a weak active nucleus cannot beruled out. However, medium spectral resolution, wide energyband (0.5-10 keV) observations of NGC253 and M82 withASCA, show that the above two component models do notgive an acceptable description of the data (Ptak et al 1997,Moran & Lehnert 1997). Even the introduction of a thirdthermal component (kT ∼ 0.3keV) still provides a poor fit tothe high-resolution ASCA SIS spectrum (Moran & Lehnert1997). This suggests that the emission mechanisms are morecomplex than these simple models can explain. Since the X-ray spectra of Galactic supernova remnants (eg Hughes &Singh 1994) cannot be well-fit by a simple Raymond-Smithmodel (their emission is dominated by non-equilibrium pro-cesses) it is likely that we are dealing with a similar situationin starforming galaxies.
One of the interesting results of the ROSAT All-SkySurvey was the discovery of star-forming galaxies with X-ray luminosities ∼ 1042 ergs−1, approaching those of Seyfertgalaxies (eg Moran et al 1995). In order to gain further in-sight into the nature of this powerful X-ray emission andto compare starburst properties with those of the archety-pal (less luminous) star-forming galaxies, we have cross-correlated the ROSAT All Sky Survey Bright Source Cata-logue, RASSBSC, (Voges et al. 1996) with the spectral atlasof nearby galaxies of Ho, Filippenko and Sargent (1995). Theadvantage of the latter sample is that it has high quality op-tical spectra and thus provides us with a reliable classifica-tion for each galaxy. The sample of Ho et al. contains galax-ies with declination δ > 0o and magnitude B < 12.5 whilethe RASS contains almost 20,000 sources over the whole sky.The cross-correlation yielded 43 X-ray counterparts within1 arcmin of the optical galaxy, whereas less than one coinci-dence is expected by chance. Within this sample of galaxiesthe vast majority are AGNs (Seyferts 1&2, and LINERS),but there are also some star-forming galaxies and high lumi-nosity early-type galaxies. Further details of the propertiesof the resulting X-ray sample are given elsewhere (Roberts,1998). The star-forming galaxies are listed in table 1. In thispaper we present X-ray imaging and spectral analysis forthe two most luminous star-forming galaxies in the sample:NGC3310 and NGC3690, excluding NGC5905 which under-went some form of transient phenomenon as yet not under-stood. Both ROSAT and ASCA observations are availablein the HEASARC archive for these two galaxies.
We use a value of Ho = 50km s−1 Mpc−1 for the Hubbleconstant, throughout this paper. All errors quoted refer tothe 90 per cent confidence level.
1.1 NGC 3310
NGC3310 is a well studied nearby galaxy of Sbc(r)pec type(Mulder et al. 1996). Its recession velocity is 980km s−1 (deVaucouleurs et al. 1991) which implies a distance of 19.6Mpc. Its optical image shows some interesting features. Themost prominent is an arc and bow structure which extendsfor 100′′ to the North West of the centre of the galaxy.Bertolla and Sharp (1984) propose that the arc could be partof a spiral arm and the bow is the remnant of an old jet.Balick and Heckman (1985) suggest that the whole struc-ture is the remnant of a collision between the galaxy and a
Table 1. The X-ray luminous starburst galaxiesin the Ho et al. sample
Galaxy X − ray luminosity†
M82 40.88NGC3310 40.89NGC3690 41.62NGC4449 39.24NGC5204 39.54NGC5905 42.18‡
† This is the log of the X-ray luminosity in theROSAT band, from the RASS data.‡ This galaxy has show significant long time vari-ability (Bade et al. 1996); This luminosity refersat the outburst epoch.
dwarf companion. This is in agreement with the suggestionof Mulder et al. (1985) who characterize the system as ayoung merger based on the anomalies found in its rotationcurve. It should be noted that in the radio and near-infraredimages we do not see two resolved nuclei (Telesco and Gat-ley 1984, Balick and Heckman 1981). This could mean thatthe merger phase is now complete as suggested by Balickand Heckman.
Another interesting morphological feature is a giant HIIregion situated ∼ 12′′ SW of the nucleus (Balick and Heck-man 1981). Its size is comparable to the largest extragalacticHII regions known, and its spectral characteristics are dom-inated by signatures of Wolf Rayet stars (Pastoriza et al.1993).
The starburst nature of the activity has been confirmedby numerous observations in many spectral bands (e.g. Tele-sco and Gatley 1984, Smith et al. 1996, Balick and Heckman1981). Evolutionary synthesis models of the starburst givean estimated age range of 107 to 108 years, (Van der Kruitand de Bruyn 1976, Balick and Heckman 1981, Telesco andGatley 1984, Pastoriza et al. 1993).
NGC3310 has been previously observed with the Imag-ing Proportional Counter (IPC) on board the EINSTEIN
observatory (Fabianno et al. 1992) yielding an X-ray fluxfx = 1.1 × 10⁻¹² erg s−1 cm−2 in the 0.3-3.5 keV bandfor a 5keV bremsstrahlung model and Galactic absorp-tion. This corresponds to an X-ray luminosity of 5.0 ×
1040 erg s−1 cm−2.
1.2 NGC 3690
NGC3690 is also a merging system, but in contrast toNGC3310 it is in an earlier merger phase. The system iscomposed of NGC3690, which is the western part of themerger and IC694, the eastern component. The whole sys-tem is also known as Arp 299 or Mrk 171. Casoli et al. (1989)propose that there is a third component in the system thusforming an interacting triplet. Its recession velocity is 3159km s−1 (Sanders and Mirabel 1985), implying a distance of63.2 Mpc. At that distance the projected separation of 22.5′′
of the two components corresponds to 6.9 kpc. The infraredsurface brightness of NGC3690 is at least twice that of IC694(Friedman et al. 1987). The total mass of gas calculated fromradio observations is about 2×10¹¹M⊙ (Casoli et al. . 1989)
The high IR luminosity(LF IR = 1.2×10¹²L⊙) (Soifer et
c© 0000 RAS, MNRAS 000, 000–000
X-ray luminous star-forming galaxies 3
al. 1987), results from re-radiating dust heated by the star-burst activity. This is supported by multi-wavelength stud-ies (Gehrz et al. 1983, Friedman et al. 1987, Nakagawa et al.1989). Detailed analysis of emission line ratios using the di-agnostic diagrams of Veilleux and Osterbrock (1987) clearlyindicate a stellar origin of the ionizing continuum (Friedmanet al. 1987). The infrared emission is extended over a regionof several kpc, but the main sources are located close to thetwo nuclei (Friedman et al. 1987). Modeling of the starbursthas been carried out by Gehrz et al. (1983) and Nakagawa etal. (1989). The latter find a starburst age of about 10Myrs.An interesting point is that the two nuclei have differentproperties, implying either a different age and/or a differentInitial Mass Function (IMF) for each starburst event.
NGC3690 has been previously observed with the HighResolution Imager (HRI) on board the EINSTEIN obser-vatory. 17 counts were detected implying an X-ray fluxfx = 4.8× 10⁻¹³ergs−1cm−2 in the 0.2-4.0keV band, for a 5keV bremsstrahlung model and Galactic absorption (Fabi-anno et al 1992). This corresponds to an X-ray luminosityof 2.3 × 1041 erg s−1 cm−2.
2 OBSERVATIONS AND DATA REDUCTION
2.1 The ROSAT PSPC Observations
NGC3310 and NGC3690 were each observed on two oc-casions with the Position Sensitive Proportional Counter(PSPC) (Pfefferman et al. 1987) on board ROSAT (Trumperet al. 1984). The details of each observation are given in ta-ble 2.
For the data reduction we have followed the standardprocedure, using the ASTERIX package. We excluded thosedata with Master Veto rates higher than 170cps. We ex-tracted a PSPC spectral image (channels 11 to 201) with apixel size of 15′′. To obtain an X-ray spectrum we extracteddata from a circular region of 1.5′ radius around the X-raycentroid. The background was estimated from an annularregion between radii of 15′ and 8.8′ from the centroid, afterexclusion of all the discrete sources detected with the PSSalgorithm (Allen 1992) down to the 5σ level.
2.2 The ROSAT HRI Observations
Both galaxies have been observed with the High ResolutionImager (HRI) (David et al. 1997) on board ROSAT . HRIcovers a field of 38′ diameter and it has a spatial resolutionof about 5′′ (the FWHM of the XRT+HRI Point SpreadFunction). We note that the HRI has very limited spectralresolution so we cannot use it for spectral analysis (Davidet al. 1997). The screening of the data has been carried outusing the ASTERIX package. We have rejected all data withaspect errors greater than 2.
2.3 The ASCA Observations
Both galaxies have been observed with the ASCA satellite(Tanaka et al. 1994). On board ASCA there are four instru-ments: two Gas Imaging Spectrometers (GIS2 and GIS3)(Ohashi et al. 1996) and two Solid-State Imaging Spectrom-eters (SIS0 and SIS1) (Gendreau 1995). For screening of the
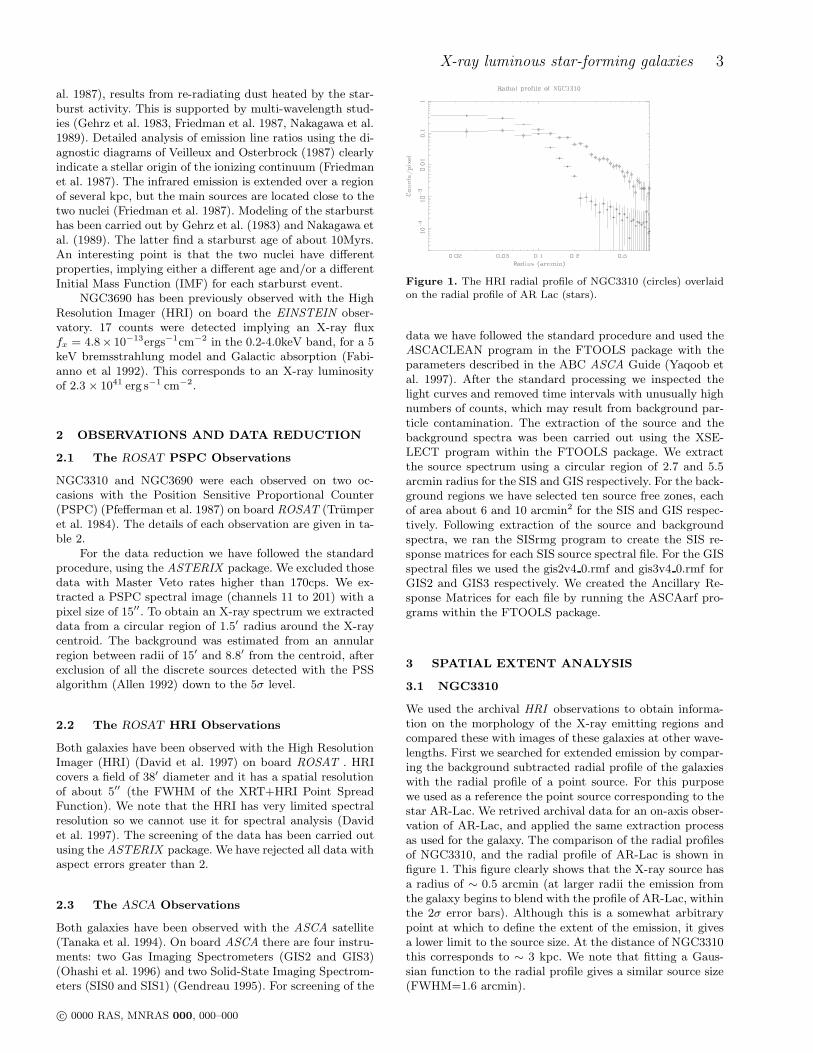
Figure 1. The HRI radial profile of NGC3310 (circles) overlaidon the radial profile of AR Lac (stars).
data we have followed the standard procedure and used theASCACLEAN program in the FTOOLS package with theparameters described in the ABC ASCA Guide (Yaqoob etal. 1997). After the standard processing we inspected thelight curves and removed time intervals with unusually highnumbers of counts, which may result from background par-ticle contamination. The extraction of the source and thebackground spectra was been carried out using the XSE-LECT program within the FTOOLS package. We extractthe source spectrum using a circular region of 2.7 and 5.5arcmin radius for the SIS and GIS respectively. For the back-ground regions we have selected ten source free zones, eachof area about 6 and 10 arcmin2 for the SIS and GIS respec-tively. Following extraction of the source and backgroundspectra, we ran the SISrmg program to create the SIS re-sponse matrices for each SIS source spectral file. For the GISspectral files we used the gis2v4 0.rmf and gis3v4 0.rmf forGIS2 and GIS3 respectively. We created the Ancillary Re-sponse Matrices for each file by running the ASCAarf pro-grams within the FTOOLS package.
3 SPATIAL EXTENT ANALYSIS
3.1 NGC3310
We used the archival HRI observations to obtain informa-tion on the morphology of the X-ray emitting regions andcompared these with images of these galaxies at other wave-lengths. First we searched for extended emission by compar-ing the background subtracted radial profile of the galaxieswith the radial profile of a point source. For this purposewe used as a reference the point source corresponding to thestar AR-Lac. We retrived archival data for an on-axis obser-vation of AR-Lac, and applied the same extraction processas used for the galaxy. The comparison of the radial profilesof NGC3310, and the radial profile of AR-Lac is shown infigure 1. This figure clearly shows that the X-ray source hasa radius of ∼ 0.5 arcmin (at larger radii the emission fromthe galaxy begins to blend with the profile of AR-Lac, withinthe 2σ error bars). Although this is a somewhat arbitrarypoint at which to define the extent of the emission, it givesa lower limit to the source size. At the distance of NGC3310this corresponds to ∼ 3 kpc. We note that fitting a Gaus-sian function to the radial profile gives a similar source size(FWHM=1.6 arcmin).
c© 0000 RAS, MNRAS 000, 000–000
4 A. L. Zezas,I. Georgantopoulos and M. J. Ward
Table 2. Summary of the observations
Galaxy Satellite Instrument Date Observation started Exposure Time†Ksec
NGC3310 ROSAT PSPC 1991-11-16 9.114ROSAT HRI 1995-04-17 41.842ROSAT HRI 1994-11-23 4095ASCA 1994-04-17 GIS: 10.4, SIS:10.4ASCA 1994-11-13 GIS:11.6, SIS:10.2
NGC3690 ROSAT PSPC 1993-04-22 3.534ROSAT PSPC 1991-11-18 6.391ROSAT HRI 1993-04-18 6.751ASCA 1994-04-06 GIS:5.7, SIS:5.3ASCA 1994-12-01 GIS:38.2, SIS:35.5
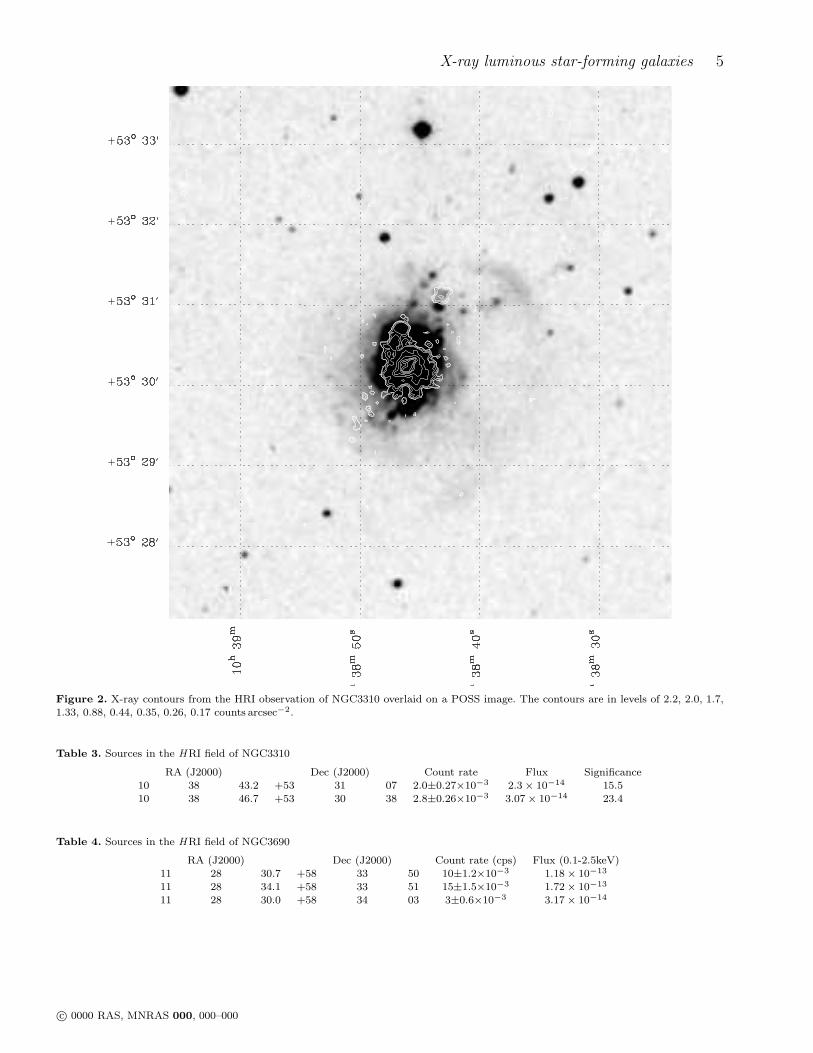
In order to compare the distribution of the X-ray emit-ting gas with the optical image we have resampled the X-rayimage with a pixel size of 1.5 arc-seconds and then smoothedthis image using a two-dimensional gaussian of FWHM=3.5arc-seconds (2.3 pixels) following Della Ceca et al. (1996).The final pixel size is 5.4′′, equal to the XRT+HRI PSF.Then we obtained contours from this image corresponding to2.2, 2.0 ,1.7, 1.33, 0.88, 0.44, 0.35, 0.26, 0.17 counts arcsec−2
and overlaid these onto an optical image obtained from theDigitized Sky Survey. This image is shown in figure 2. Themain problem we faced in attempting to overlay the two im-ages is that of frame registration. There are no X-ray sourceswithin the HRI image which have an obvious optical coun-terpart. Thus in order to overlay the X-ray contour plot ontothe optical image, we are forced to assume that the centroidof the X-ray source corresponds to that of the optical nu-cleus. In the X-ray image of NGC3310 we detect two othersources in addition to the nucleus, at a significance above10σ. The details concerning these sources are presented intable 3. These point sources may correspond to luminousX-ray binaries or young supernova remnants. Unfortunatelythere are no identified optical counterparts for these X-raysources on the POSS plates.
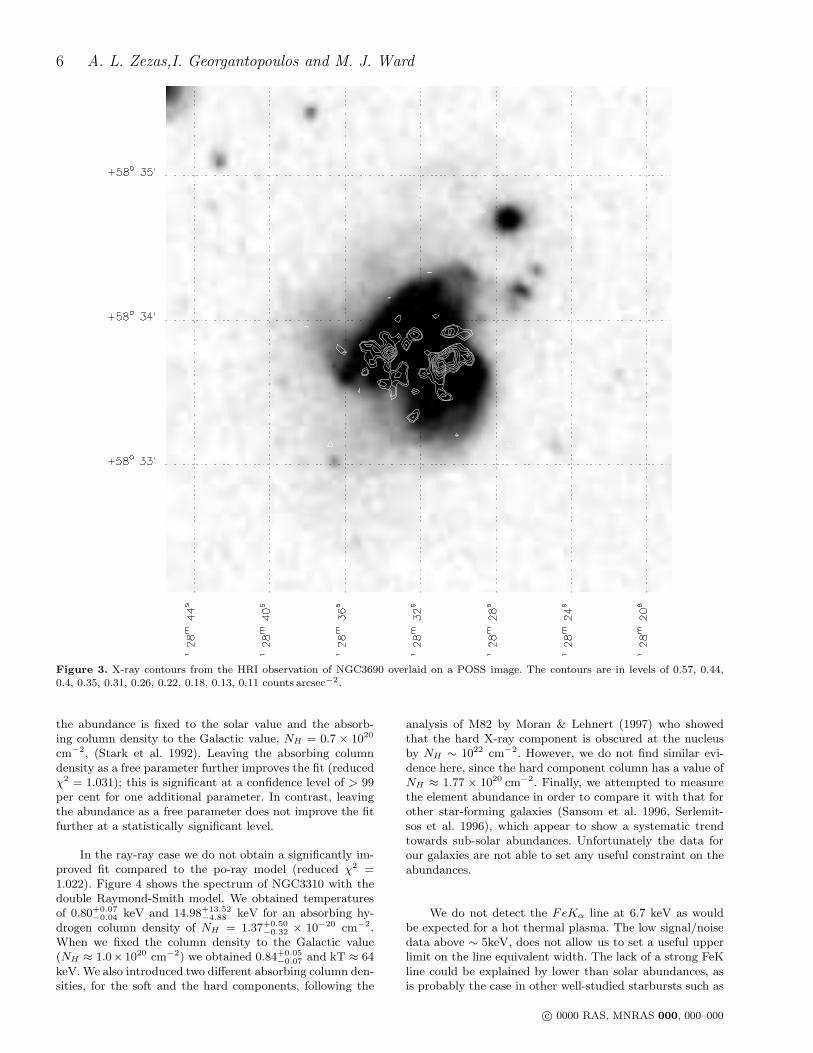
3.2 NGC3690
The HRI analysis of NGC3690 followed the same procedureas for NGC3310. The image pixels were binned to a size of1.5′′ and then smoothed using a two-dimensional gaussianof FWHM 3.5′′. Finally, we overlaid the X-ray contours ona POSS plate image obtained from the Digitized Sky Sur-vey, figure 3; the contours correspond to 0.57, 0.44, 0.40,0.35, 0.31, 0.27, 0.22, 0.18, 0.13 and 0.11 counts arcsec−1 re-spectively. The most striking feature is the existence of threeseparate sources in the X-ray image. The two most luminoussources correspond to the two merging nuclei. Their X-rayfluxes are given in table 4. The third X-ray source corre-sponds to a hot spot seen in the infrared and radio imagesto the north of NGC3690 (the western component). Apartfrom these three sources there are marginal detections ofother sources, but at a low level of significance (below 3σ),and will not be discussed further. We note that the relativestrengths of the three main X-ray sources follow quite wellthe relative strengths of the near infrared sources, suggestinga possible common origin for the IR and the X-ray emission.
We have searched for extended emission from the tworesolved nuclei. From figure 3 it is clear that the emission
from the two resolved nuclei is extended and not symmet-rical. Fitting a Gaussian function to the radial profiles ofNGC3690 and IC694 yields a FWHM of 1.5 and 1.8 arcminrespectively.
Comparison between the X-ray images and radio (VLA-A observation of the H92α radio recombination line, Zhao etal. , 1997) and near-IR images (Wynn-Williams et al. , 1991),available in the literature, shows some clear similarities. Asthe radio and near-IR emission is clearly associated with thestar-forming regions, the spatial coincidence implies that thesoft X-ray emission has its origin in the starburst. We notethat we do not see any evidence of X-ray emission from hotconnecting the two galaxies, unlike the situation in someother interacting star-forming galaxies (e.g. the Antennae,Fabbiano et al. 1997).
4 SPECTRAL ANALYSIS
We fitted all the datasets simultaneously, thus covering anenergy range from 0.1 to 8.0 keV. We rejected all ROSATPSPC data points below 0.1 and above 2.0 keV; and usedonly the SIS and GIS data in the range 0.6 to 8.0 keV andfrom 0.7 to 7.0 keV respectively. In order to apply χ2 statis-tics we re-binned the spectra so as to contain at least 20counts per bin. We used the software package XSPEC (v10)to obtain the spectral fits.
4.1 NGC3310
We first fitted simple one-component models: a thermalbremsstrahlung model, a power-law model and finally aRaymond-Smith plasma model (Raymond & Smith 1977).These models were rejected at greater than the 99.9 per centconfidence level. The results of the spectral fits are given intable 5.
We then fitted two component models: a two tem-perature Raymond-Smith plasma (ray-ray hereafter) and aRaymond-Smith plasma combined with a power-law (po-ray), following the results of Moran & Lehnert (1997)and Ptak et al. (1997) on the starburst galaxies M82 andNGC253. These models provided a much better fit than thesimple models described above, at a confidence level over 90per cent for an addition of two free parameters (eg Bevington& Robinson 1992). We consider first the po-ray model. Weobtained a photon index of Γ = 1.44+0.20
−0.11 and a temperatureof kT = 0.81+0.09
−0.12 keV with a reduced χ2 = 1.115, where
c© 0000 RAS, MNRAS 000, 000–000
X-ray luminous star-forming galaxies 5
Figure 2. X-ray contours from the HRI observation of NGC3310 overlaid on a POSS image. The contours are in levels of 2.2, 2.0, 1.7,1.33, 0.88, 0.44, 0.35, 0.26, 0.17 counts arcsec−2.
Table 3. Sources in the HRI field of NGC3310
RA (J2000) Dec (J2000) Count rate Flux Significance10 38 43.2 +53 31 07 2.0±0.27×10⁻³ 2.3 × 10⁻¹⁴ 15.510 38 46.7 +53 30 38 2.8±0.26×10⁻³ 3.07 × 10⁻¹⁴ 23.4
Table 4. Sources in the HRI field of NGC3690
RA (J2000) Dec (J2000) Count rate (cps) Flux (0.1-2.5keV)11 28 30.7 +58 33 50 10±1.2×10⁻³ 1.18 × 10⁻¹³
11 28 34.1 +58 33 51 15±1.5×10⁻³ 1.72 × 10⁻¹³
11 28 30.0 +58 34 03 3±0.6×10⁻³ 3.17 × 10⁻¹⁴
c© 0000 RAS, MNRAS 000, 000–000
6 A. L. Zezas,I. Georgantopoulos and M. J. Ward
Figure 3. X-ray contours from the HRI observation of NGC3690 overlaid on a POSS image. The contours are in levels of 0.57, 0.44,0.4, 0.35, 0.31, 0.26, 0.22, 0.18, 0.13, 0.11 counts arcsec−2.
the abundance is fixed to the solar value and the absorb-ing column density to the Galactic value, NH = 0.7 × 10²⁰
cm−2, (Stark et al. 1992). Leaving the absorbing columndensity as a free parameter further improves the fit (reducedχ2 = 1.031); this is significant at a confidence level of > 99per cent for one additional parameter. In contrast, leavingthe abundance as a free parameter does not improve the fitfurther at a statistically significant level.
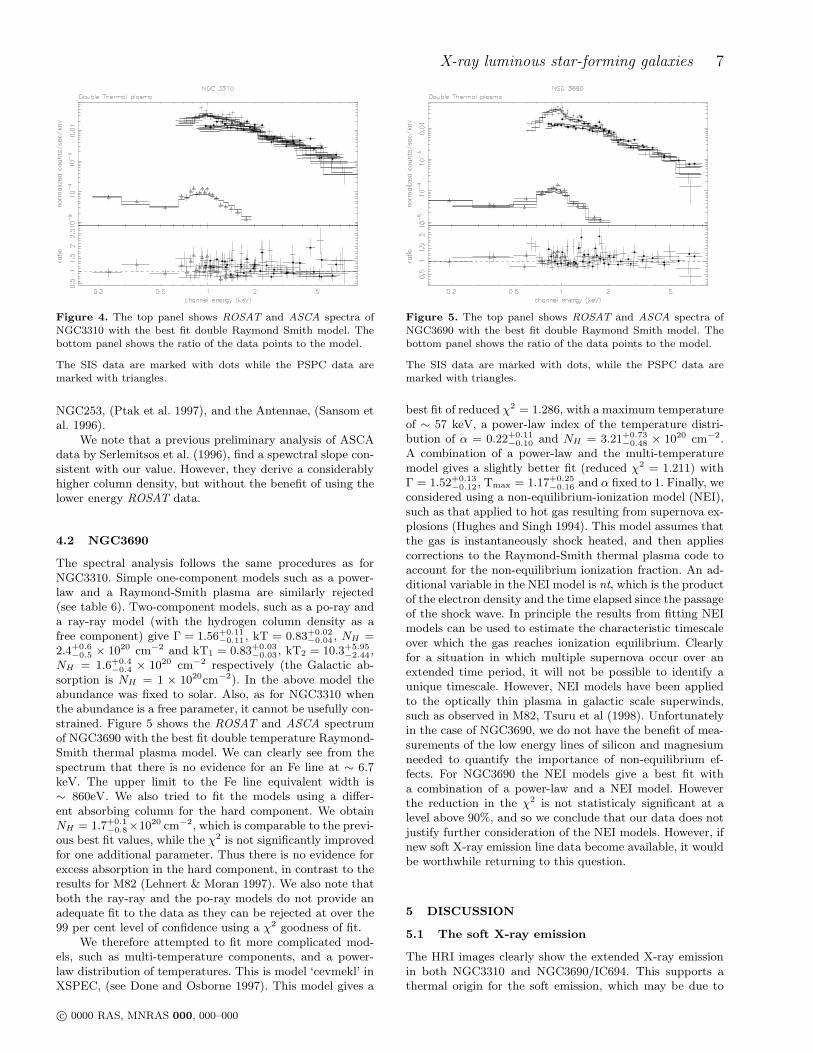
In the ray-ray case we do not obtain a significantly im-proved fit compared to the po-ray model (reduced χ2 =1.022). Figure 4 shows the spectrum of NGC3310 with thedouble Raymond-Smith model. We obtained temperaturesof 0.80+0.07
−0.04 keV and 14.98+13.52−4.88 keV for an absorbing hy-
drogen column density of NH = 1.37+0.50−0.32 × 10⁻²⁰ cm−2.
When we fixed the column density to the Galactic value(NH ≈ 1.0×1020 cm−2) we obtained 0.84+0.05
−0.07 and kT ≈ 64keV. We also introduced two different absorbing column den-sities, for the soft and the hard components, following the
analysis of M82 by Moran & Lehnert (1997) who showedthat the hard X-ray component is obscured at the nucleusby NH ∼ 1022 cm−2. However, we do not find similar evi-dence here, since the hard component column has a value ofNH ≈ 1.77 × 1020 cm−2. Finally, we attempted to measurethe element abundance in order to compare it with that forother star-forming galaxies (Sansom et al. 1996, Serlemit-sos et al. 1996), which appear to show a systematic trendtowards sub-solar abundances. Unfortunately the data forour galaxies are not able to set any useful constraint on theabundances.
We do not detect the FeKα line at 6.7 keV as wouldbe expected for a hot thermal plasma. The low signal/noisedata above ∼ 5keV, does not allow us to set a useful upperlimit on the line equivalent width. The lack of a strong FeKline could be explained by lower than solar abundances, asis probably the case in other well-studied starbursts such as
c© 0000 RAS, MNRAS 000, 000–000
X-ray luminous star-forming galaxies 7
Figure 4. The top panel shows ROSAT and ASCA spectra ofNGC3310 with the best fit double Raymond Smith model. Thebottom panel shows the ratio of the data points to the model.
The SIS data are marked with dots while the PSPC data aremarked with triangles.
NGC253, (Ptak et al. 1997), and the Antennae, (Sansom etal. 1996).
We note that a previous preliminary analysis of ASCAdata by Serlemitsos et al. (1996), find a spewctral slope con-sistent with our value. However, they derive a considerablyhigher column density, but without the benefit of using thelower energy ROSAT data.
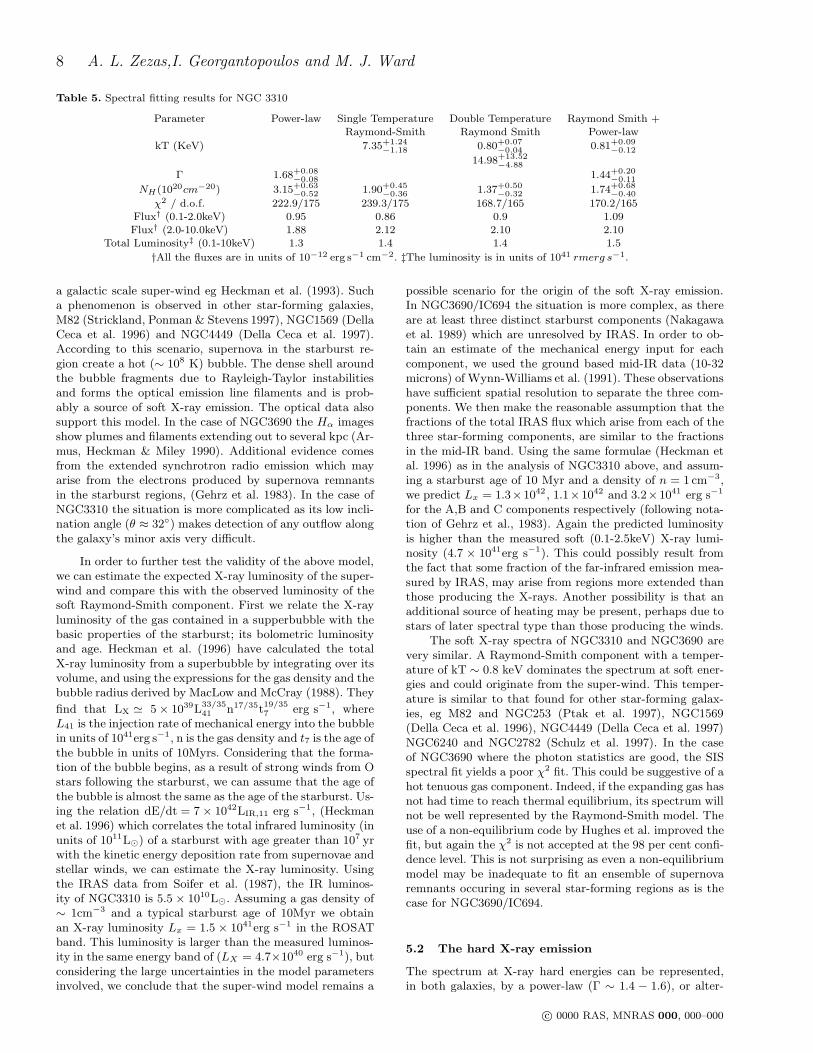
4.2 NGC3690
The spectral analysis follows the same procedures as forNGC3310. Simple one-component models such as a power-law and a Raymond-Smith plasma are similarly rejected(see table 6). Two-component models, such as a po-ray anda ray-ray model (with the hydrogen column density as afree component) give Γ = 1.56+0.11
−0.11 , kT = 0.83+0.02−0.04 , NH =
2.4+0.6−0.5 × 1020 cm−2 and kT1 = 0.83+0.03
−0.03 , kT2 = 10.3+5.95−2.44 ,
NH = 1.6+0.4−0.4 × 1020 cm−2 respectively (the Galactic ab-
sorption is NH = 1 × 1020cm−2). In the above model theabundance was fixed to solar. Also, as for NGC3310 whenthe abundance is a free parameter, it cannot be usefully con-strained. Figure 5 shows the ROSAT and ASCA spectrumof NGC3690 with the best fit double temperature Raymond-Smith thermal plasma model. We can clearly see from thespectrum that there is no evidence for an Fe line at ∼ 6.7keV. The upper limit to the Fe line equivalent width is∼ 860eV. We also tried to fit the models using a differ-ent absorbing column for the hard component. We obtainNH = 1.7+0.1
−0.8×1020 cm−2, which is comparable to the previ-ous best fit values, while the χ2 is not significantly improvedfor one additional parameter. Thus there is no evidence forexcess absorption in the hard component, in contrast to theresults for M82 (Lehnert & Moran 1997). We also note thatboth the ray-ray and the po-ray models do not provide anadequate fit to the data as they can be rejected at over the99 per cent level of confidence using a χ2 goodness of fit.
We therefore attempted to fit more complicated mod-els, such as multi-temperature components, and a power-law distribution of temperatures. This is model ‘cevmekl’ inXSPEC, (see Done and Osborne 1997). This model gives a
Figure 5. The top panel shows ROSAT and ASCA spectra ofNGC3690 with the best fit double Raymond Smith model. Thebottom panel shows the ratio of the data points to the model.
The SIS data are marked with dots, while the PSPC data aremarked with triangles.
best fit of reduced χ2 = 1.286, with a maximum temperatureof ∼ 57 keV, a power-law index of the temperature distri-bution of α = 0.22+0.11
−0.10 and NH = 3.21+0.73−0.48 × 1020 cm−2.
A combination of a power-law and the multi-temperaturemodel gives a slightly better fit (reduced χ2 = 1.211) withΓ = 1.52+0.13
−0.12 , Tmax = 1.17+0.25−0.16 and α fixed to 1. Finally, we
considered using a non-equilibrium-ionization model (NEI),such as that applied to hot gas resulting from supernova ex-plosions (Hughes and Singh 1994). This model assumes thatthe gas is instantaneously shock heated, and then appliescorrections to the Raymond-Smith thermal plasma code toaccount for the non-equilibrium ionization fraction. An ad-ditional variable in the NEI model is nt, which is the productof the electron density and the time elapsed since the passageof the shock wave. In principle the results from fitting NEImodels can be used to estimate the characteristic timescaleover which the gas reaches ionization equilibrium. Clearlyfor a situation in which multiple supernova occur over anextended time period, it will not be possible to identify aunique timescale. However, NEI models have been appliedto the optically thin plasma in galactic scale superwinds,such as observed in M82, Tsuru et al (1998). Unfortunatelyin the case of NGC3690, we do not have the benefit of mea-surements of the low energy lines of silicon and magnesiumneeded to quantify the importance of non-equilibrium ef-fects. For NGC3690 the NEI models give a best fit witha combination of a power-law and a NEI model. Howeverthe reduction in the χ2 is not statisticaly significant at alevel above 90%, and so we conclude that our data does notjustify further consideration of the NEI models. However, ifnew soft X-ray emission line data become available, it wouldbe worthwhile returning to this question.
5 DISCUSSION
5.1 The soft X-ray emission
The HRI images clearly show the extended X-ray emissionin both NGC3310 and NGC3690/IC694. This supports athermal origin for the soft emission, which may be due to
c© 0000 RAS, MNRAS 000, 000–000
8 A. L. Zezas,I. Georgantopoulos and M. J. Ward
Table 5. Spectral fitting results for NGC 3310
Parameter Power-law Single Temperature Double Temperature Raymond Smith +Raymond-Smith Raymond Smith Power-law
kT (KeV) 7.35+1.24−1.18 0.80+0.07
−0.04 0.81+0.09−0.12
14.98+13.52−4.88
Γ 1.68+0.08−0.08 1.44+0.20
−0.11
NH(1020cm−20) 3.15+0.63−0.52 1.90+0.45
−0.36 1.37+0.50−0.32 1.74+0.68
−0.40
χ2 / d.o.f. 222.9/175 239.3/175 168.7/165 170.2/165Flux† (0.1-2.0keV) 0.95 0.86 0.9 1.09Flux† (2.0-10.0keV) 1.88 2.12 2.10 2.10
Total Luminosity‡ (0.1-10keV) 1.3 1.4 1.4 1.5
†All the fluxes are in units of 10−12 erg s−1 cm−2. ‡The luminosity is in units of 1041 rmerg s−1.
a galactic scale super-wind eg Heckman et al. (1993). Sucha phenomenon is observed in other star-forming galaxies,M82 (Strickland, Ponman & Stevens 1997), NGC1569 (DellaCeca et al. 1996) and NGC4449 (Della Ceca et al. 1997).According to this scenario, supernova in the starburst re-gion create a hot (∼ 108 K) bubble. The dense shell aroundthe bubble fragments due to Rayleigh-Taylor instabilitiesand forms the optical emission line filaments and is prob-ably a source of soft X-ray emission. The optical data alsosupport this model. In the case of NGC3690 the Hα imagesshow plumes and filaments extending out to several kpc (Ar-mus, Heckman & Miley 1990). Additional evidence comesfrom the extended synchrotron radio emission which mayarise from the electrons produced by supernova remnantsin the starburst regions, (Gehrz et al. 1983). In the case ofNGC3310 the situation is more complicated as its low incli-nation angle (θ ≈ 32◦) makes detection of any outflow alongthe galaxy’s minor axis very difficult.
In order to further test the validity of the above model,we can estimate the expected X-ray luminosity of the super-wind and compare this with the observed luminosity of thesoft Raymond-Smith component. First we relate the X-rayluminosity of the gas contained in a supperbubble with thebasic properties of the starburst; its bolometric luminosityand age. Heckman et al. (1996) have calculated the totalX-ray luminosity from a superbubble by integrating over itsvolume, and using the expressions for the gas density and thebubble radius derived by MacLow and McCray (1988). They
find that LX ≃ 5 × 1039L33/35
41 n17/35t19/35
7 erg s−1, whereL41 is the injection rate of mechanical energy into the bubblein units of 1041erg s−1, n is the gas density and t7 is the age ofthe bubble in units of 10Myrs. Considering that the forma-tion of the bubble begins, as a result of strong winds from Ostars following the starburst, we can assume that the age ofthe bubble is almost the same as the age of the starburst. Us-ing the relation dE/dt = 7 × 1042LIR,11 erg s−1, (Heckmanet al. 1996) which correlates the total infrared luminosity (inunits of 1011L⊙) of a starburst with age greater than 107 yrwith the kinetic energy deposition rate from supernovae andstellar winds, we can estimate the X-ray luminosity. Usingthe IRAS data from Soifer et al. (1987), the IR luminos-ity of NGC3310 is 5.5 × 10¹⁰L⊙. Assuming a gas density of∼ 1cm−3 and a typical starburst age of 10Myr we obtainan X-ray luminosity Lx = 1.5 × 1041erg s−1 in the ROSATband. This luminosity is larger than the measured luminos-ity in the same energy band of (LX = 4.7×1040 erg s−1), butconsidering the large uncertainties in the model parametersinvolved, we conclude that the super-wind model remains a
possible scenario for the origin of the soft X-ray emission.In NGC3690/IC694 the situation is more complex, as thereare at least three distinct starburst components (Nakagawaet al. 1989) which are unresolved by IRAS. In order to ob-tain an estimate of the mechanical energy input for eachcomponent, we used the ground based mid-IR data (10-32microns) of Wynn-Williams et al. (1991). These observationshave sufficient spatial resolution to separate the three com-ponents. We then make the reasonable assumption that thefractions of the total IRAS flux which arise from each of thethree star-forming components, are similar to the fractionsin the mid-IR band. Using the same formulae (Heckman etal. 1996) as in the analysis of NGC3310 above, and assum-ing a starburst age of 10 Myr and a density of n = 1 cm−3,we predict Lx = 1.3×1042 , 1.1×1042 and 3.2×1041 erg s−1
for the A,B and C components respectively (following nota-tion of Gehrz et al., 1983). Again the predicted luminosityis higher than the measured soft (0.1-2.5keV) X-ray lumi-nosity (4.7 × 1041erg s−1). This could possibly result fromthe fact that some fraction of the far-infrared emission mea-sured by IRAS, may arise from regions more extended thanthose producing the X-rays. Another possibility is that anadditional source of heating may be present, perhaps due tostars of later spectral type than those producing the winds.
The soft X-ray spectra of NGC3310 and NGC3690 arevery similar. A Raymond-Smith component with a temper-ature of kT ∼ 0.8 keV dominates the spectrum at soft ener-gies and could originate from the super-wind. This temper-ature is similar to that found for other star-forming galax-ies, eg M82 and NGC253 (Ptak et al. 1997), NGC1569(Della Ceca et al. 1996), NGC4449 (Della Ceca et al. 1997)NGC6240 and NGC2782 (Schulz et al. 1997). In the caseof NGC3690 where the photon statistics are good, the SISspectral fit yields a poor χ2 fit. This could be suggestive of ahot tenuous gas component. Indeed, if the expanding gas hasnot had time to reach thermal equilibrium, its spectrum willnot be well represented by the Raymond-Smith model. Theuse of a non-equilibrium code by Hughes et al. improved thefit, but again the χ2 is not accepted at the 98 per cent confi-dence level. This is not surprising as even a non-equilibriummodel may be inadequate to fit an ensemble of supernovaremnants occuring in several star-forming regions as is thecase for NGC3690/IC694.
5.2 The hard X-ray emission
The spectrum at X-ray hard energies can be represented,in both galaxies, by a power-law (Γ ∼ 1.4 − 1.6), or alter-
c© 0000 RAS, MNRAS 000, 000–000
X-ray luminous star-forming galaxies 9
natively by a Raymond-Smith component with high tem-perature, (kT>10 keV). There is no strong evidence for thepresence of a large amount of obscuration as is the case forNGC253 and M82 (Ptak et al. 1997). There are at leastfour possibilities for the origin of the hard X-ray emission:a) Inverse Compton scattering of the IR photons producedin the starburst by electrons from the numerous supernovaremnants (eg Schaaf et al. 1989) b) emission from a low-luminosity AGN as is the case in NGC3628 (Yaqoob et al.1995) c) thermal emission from a very hot gas (T ∼ 108 K)and d) emission from X-ray binaries (Griffiths & Padovani1990). We discuss each of these possibility in turn. We con-sider first the possibility, that the hard X-ray emission arisesfrom Inverse Compton (IC) scattering of the copious in-frared photons off of the relativistic electrons generated bythe numerous supernovae. Support for this, especially inthe case of NGC3310, comes from the similarity (withinthe errors) of the spectral index of the hard X-rays andthe spectral index of the radio emission (αrad = 0.61+0.03
−0.03
Niklas et al. 1997). Following Schaaf et al. (1989) we canestimate the X-ray luminosity from Inverse Compton scat-tering. Unfortunately, we can perform this calculation onlyfor NGC3310, as there are no suitable radio data avail-able for NGC3690. From Vallee (1993) we have that the“minimum energy” magnetic field (see Longair 1992) isB = 0.47 × 10⁻⁵ Gauss. Then the minimum energy densityis u = (7/3)(B2/8π) erg cm−3 = 2.05 × 10⁻¹² erg cm−3.Following Schaaf et al. (1989)we have that LIC = (1/3)σTRICLIR
ǫemc2
γ0.82 γ0.2
1 , where σT,RIC, LIR and mc2, ǫe are the Thomson cross-section, thethickness of the disk, the far-IR luminosity, the rest mass ofthe electron and the energy density of the relativistic elec-trons, respectively. For a typical galactic disk RIC ∼ 1kpc(we cannot measure the actual thickness of the disk sinceNGC3310 is almost face on) and for a typical value of thelow frequency cut-off ν = 0.01GHz we have γ1 = 150 for thelower limit of the Lorentz factor, and γ2 = 103 for the maxi-mum Lorentz factor, in order to have IC emission at 10keV(Schaaf et al. 1989). So for the Inverse Compton X-ray lumi-nosity we predict a value of 2.5 × 1038 erg s−1, much lowerthan the detected hard X-ray luminosity of NGC3310, thusimplying that IC can be only a minor component of the to-tal X-ray emission from this galaxy. We caution that thisresult is quiet uncertain as the calculation depends on pa-rameters like the volume of the source and the thickness ofthe disk which are poorly known. Another possible origin ofthe hard X-ray emission is the presence of a low luminosityAGN, although there is no evidence for non-starforming nu-clear activity from diagnostic emission line ratio diagramsbased on optical and near infrared spectra.
However, the hard X-ray power-law spectrum is never-theless consistent with the presence of an active nucleus. Inorder to test this possibility further we use the LX/LHα
relation from Elvis et al. (1984), where LHαis the lu-
minosity of the broad component of the Hα line and Lx
is the hard X-ray luminosity (2-10 keV). LX/LHα≃ 40,
for low-luminosity AGN and thus we estimate f(Hα) ∼
5.3× 10⁻¹⁴ erg s−1 cm−2 and 2.7 × 10⁻¹⁴ erg s−1 cm−2 forNGC3310 and NGC3690 respectively. A broad componentof this strength is easily detectable, but is not seen (Hoet al. 1997). The absorbing columns found from the X-rayspectral fitting (ray-po models in tables 5 and 6) imply low
extinctions, AV ∼ 0.1 mag for both galaxies (Bohlin et al.1978). Hence a BLR reddended by this amount would stillbe observed.
The next possibly is the presence of a very hot thermalcomponent. A Raymond-Smith model with kT>10 keV pro-vides a good fit to the data. However, the strong FeK lineat 6.7 keV which should accompany the thermal emission isnot observed. This could be attributed to a low metallicity,but unfortunately we cannot check this as the abundancesare not well constrained using the present X-ray data. Al-ternatively, the lack of a FeK line could be explained by alow contribution of type Ia supernovae to the enrichment ofthe Interstellar Medium (Sansom et al. 1996).
Finally we consider high mass X-ray binaries as a possi-ble origin of the hard X-ray component. High mass binarieswill form as a consequence of the starburst, and indeed manysuch systems have been identified in nearby star-forminggalaxies (Read et al. 1997, Fabbiano 1995 and referencestherein). Assuming that a typical X-ray luminosity of thesesystems is 1037−38 erg s−1, we can estimate the total num-ber of binaries. As the X-ray luminosity of the hard compo-nent is Lx ∼ 5 × 1041 and Lx ∼ 1041 erg s−1 for NGC3690and NGC3310 respectively, we estimate a range of between5,000-50,000 and 1,000-10,000 X-ray binaries for the twogalaxies. Now we can compare this with the number of ion-izing OB stars determined from the integrated far-infraredluminosity. Making the assumption that it is mostly thesestars that heat the dust, which then reradiates in the mid-far infrared, we estimate ∼ 2 × 10⁵ and ∼ 3.5 × 10⁶ OBstars for NGC3310 and NGC3690, respectively. If, follow-ing Fabbiano et al. (1992), 0.2 percent of these are massiveX-ray binaries, then there are 400, and 7000 such systems,respectively. For the upper range of binary luminosities thepredicted X-ray luminosity is comparable to that observedin both cases. Indeed, if the hard X-ray emission arises frombinaries with low-metallicity and thus high X-ray luminosity(Lx ∼ 1038−39 erg s−1) like those observed in the MagellanicClouds (van Paradijs & McClintock 1995), then they couldeasily produce the observed luminosity. One potential prob-lem is that some point sources observed in nearby galaxieswith the ROSAT PSPC by Read et al. (1997), appear tohave soft spectra (kT ∼ 2 keV), whilst the the high tem-peratures inferred for NGC3310 and NGC3690 are closer tothose predicted for high mass X-ray binaries (see Nagase1989).
6 CONCLUSIONS
We have modelled and interpreted the combined ASCA andROSAT X-ray spectra from 0,1-10 keV, for the star-forminggalaxies NGC3310 and NGC3690. These two galaxies areamongst the most X-ray luminous (Lx ∼ 1041−42) erg s−1
starbursts in the local Universe. In addition, ROSAT HRIimages show that the emission from NGC3310 is extendedout to at least ∼ 3 kpc. The soft X-ray emission fromNGC3690 comes from at least three spatially resolved re-gions. The limited spatial resolution of the ASCA data doesnot allow us to place useful limits on the extent of their hardX-ray components. The X-ray spectrum of NGC3310 can bedescribed by two components: at soft energies a Raymond-Smith component (kT∼0.8 keV) which probably originates
c© 0000 RAS, MNRAS 000, 000–000
10 A. L. Zezas,I. Georgantopoulos and M. J. Ward
from a super-wind. The predicted soft X-ray emission, onthe basis of the supernovae mechanical energy deposited tothe interstellar medium, is comparable to that observed. Atharder energies we can fit either a Raymond-Smith compo-nent (kT∼17 keV) or a power-law Γ ∼ 1.4.
The results for NGC3690 are similar. There are at leasttwo components in its spectrum: a soft Raymond-Smithplasma (kT∼0.8 keV) and a harder component which canbe represented equally well by a Raymond-Smith compo-nent (kT∼10 keV) or a hard power-law Γ ∼ 1.6. However,the best-fit model for NGC3690 is rejected at the 98 per centconfidence level implying that more complicated models arenecessary. Hence we considered a non-equilibrium ionizationmodel (Hughes et al. 1994) and a multi-temperature ther-mal model (Done & Osborne 1996). The above models doimprove the fit, but only at the ∼ 90 per cent confidencelevel. Although non-equilibrium models may be important,additional information such as X-ray emission line ratios arerequired in order to make further quantitative progress.
In neither NGC3310 and NGC3690 do we find evidencefor significant absorption columns above the Galactic values,in either the soft or the hard X-ray component.
The nature of the hard X-ray emission is still uncertain,and we considered various possibilities. Of these we concludethat Inverse Compton scattering by high energy radio elec-trons and infrared photons, can probably provide only a mi-nor contribution. Although the presence of an AGN is a pos-sibility, this is not supported by data at other wavelengths,and the modest columns argue against an obscured nucleus.A very hot thermal component may be present, (∼ 108 K).We do not detect the FeK line at 6.7 keV, possibly becausethe the abundances are sub-solar. To test this possibilityfurther requires information on element abundances, and anextension of the observed spectra to higher energies. Finally,estimates of the number of X-ray binaries, based on the to-tal mid-IR emission, suggests that they may well be able toaccount for the hard X-ray emission.
The X-ray results on these two galaxies are similarto those obtained for other dwarf star-forming galaxies(eg NGC1569, NGC4449) and the archetypal star-forminggalaxies M82 and NGC253, although there is a range in rel-ative contributions from the various X-ray components. Thisimplys that the same general emission mechanisms apply instar-forming galaxies over three decades of luminosity.
7 ACKNOWLEDGMENTS
We are gratefull to J. Hughes for providing the supernovaremnant non-equilibrium XSPEC model.
REFERENCES
Allen D.J., ASTERIX User Note 004, STARLINK, 1992Armus L., Heckman T.M., Miley G.K., 1990, ApJ, 364, 471Bade N., Komossa S. and Dahlem M., 1996, A&A, 309, 35LBalick B. and Heckman T., 1981, A&A, 96, 271Bertolla A.F., and Sharp N.A., 1984, MNRAS, 207, 47Bevington P.R. and Robinson D.K., 1992, Data reductionand error analysis for the physical sciences, 2nd ed., Mc-Graw Hill
Bohlin R.C., Savage B.D. and Drake J.F., 1978, ApJ., 224,132Casoli F., Combes F., Augarde R., Figon P. and MartinJ.M., 1989, A&A, 224, 31David et al. 1997 The ROSAT HRI Calibration Reporthea-www.harvard.edu/rosat/rsdc www/HRI CAL REPORTde Vacouleurs G. et al. , 1991, Third Reference catalogue ofbright galaxies.Dekel A. and Silk J., 1986, ApJ, 303, 39Della Ceca R., Griffiths R.E., Heckman T.M. and MackentyJ.W., 1996, ApJ, 469, 662Della Ceca R., Griffiths R.E. and Heckman T.M., 1997, ApJ,485, 581Done C.D. and Osborne J.P., 1997, MNRAS, 288, 649Elvis M., Soltan A. and Keel W., 1984, ApJ., 283, 479 Fab-biano G., 1988, ApJ, 3310, 672Fabbiano G., 1995, in X-ray Binaries edited by Lewin W.H.,van Paradjis J., and van den Heuvel E.P.J.Fabbiano G. and Trinchieri G., 1984, ApJ, 286, 491Fabbiano G., Kim D.W., and Trinchieri G., 1992, ApJS, 80,531Fabbiano G., Schweizer F. and Mackie G., 1997, 478, 542Friedman S.D., Cohen R.D., Jones B., Smith H.E. and SteinW.A., 1987, AJ, 94, 1480Gehrz R.D., Sramek R.A., Weedman D.W., 1983, ApJ, 267,551Gendreau K.C., 1995, PhD. ThesisGriffiths R.E. and Padovani P., 1990, ApJ., 360, 483Heckman T.M, Armus L.,Miley G.K., 1990, ApJS, 74, 833Heckman T.M, Dahlem M, Lehnert M.D., Fabbiano G.,Gilmore D., Waller W.H., 1995, ApJ., 448, 98Ho L.C., Filippenko A.V., Sargent W.L., 1995, ApJS, 98,477Ho L.C., Filippenko A.V., Sargent W.L.W., 1997, APJS,112, 315Hughes J.P. and Singh K.P., 1994, ApJ, 422, 126Kim D.W., Fabbiano G., Trinchieri G., 1992, ApJS, 80, 645Lehnert M.D. and Heckman T.M., 1996, ApJ, 462, 651Long K.S. and van Spreybroeck L.P., 1983, in Accretiondriven stellar X-ray sources, edited by Lewin W.H.G. andvan Den Heuvel E.P.J., CUPLongair M.S. 1992, High Energy Astrophysics vol.2, CUPMacLow M.M., and McCray R., 1988, ApJ, 324, 776Moran E.C., Halpern J.P., Helfand D.J., 1996, ApJS, 106,341Moran E.C. and Lehnert M.D., 1997, ApJ, 478, 172Mulder P.S. and Van Driel W., 1996, A&A, 309, 403Nagase F., 1989, PASJ, 41, 1Nakagawa T., Nagata T., Geballe T.R., Okuda H., ShibaiH., Matsuhara H., 1989, ApJ, 340, 729Niklas S., Klein U., Weilebinski R., 1997, A&A, 322, 19Ohashi et al. , 1990, ApJ, 365, 180Ohashi et al. , 1996, PASJ, 48, 157Pastoriza M.G., Dottori H.A., Terlevich E., Terlevich R.,Diaz A.I., 1993,MNRAS, 260, 177Pfefferman et al. , 1986, Proc. SPIE, 733, 519Ptak A., Serlemitsos P., Yaqoob T., Mushotzky R., TsuruT., 1997, AJ, 113, 1286Raymont J.C., Smith B.W., 1977, ApJSS, 35, 419Read A.M., Ponman T.J., Strickland D.K., 1997, MNRAS,286, 626
c© 0000 RAS, MNRAS 000, 000–000
X-ray luminous star-forming galaxies 11
Read A.M., Ponman T.J., Wolstencroft R.D., 1995, MN-RAS, 277, 397Rieke G.H., Lebofsky M.J., Thompson R.I., Low F.J., Toku-naga A.T., 1980, ApJ., 238, 24Roberts T., 1998, PhD Thesis, University of Leicester, inpreparationSanders D.B. and Mirabel I.F., 1985, ApJ., 298, 31LSansom A.E., Dotani T., Okada K., Yamashita A., FabbianoG., 1996, MNRAS, 281, 48Schaaf R. et al. , 1989, ApJ, 336, 722Schultz H. et al. , 1997, preprintSerlemitsos P., Ptak A., Yaqoob T., 1996, in The physics ofLINERS in view of recent observations, 1996, edited by M.Eracleous, A. Koratkar, C. Leitherer, and L. HoSmith et al. ,1996, ApJ, 473, L21Soifer B.T. et al. , 1987, ApJ, 320, 238Sutherland R.S., Dopita M.A., 1993, ApJS, 88, 253Stark A. A. et al. , 1992, ApJS, 79, 77Stewart G.C., Fabian A.C., Terlevich R.J., Hazard C., 1982,MNRAS, 200, 61Strickland D.K., Ponman T.J., Stevens I.R., 1997, A&A,320, 378Tanaka Y., Inoue H., Holt S.S., 1994, PASJ, 46, 37LTelesco C.M. and Gatley I., 1984, ApJ, 284, 557Trumper J., 1984, Physica Scripta, T7, 209Tsuru T.G., Awaki H., Koyama K., Ptak A., 1998, PASJ,49, 619Vallee J.P., 1993, MNRAS, 264, 665Van der Kruit P.C. and de Bruyn A.G., 1976, 48, 373Van Paradjis J. and McClintock J.E., 1995, in X-ray Bina-ries edited by Lewin W.H., van Paradjis J., and van denHeuvel E.P.J.Veilleux S., Osterbrock D.E., 1987, ApJS, 63, 295Voges W. et al. , 1996, IAU Circ. 6420Watson M.G., Stanger V., Griffiths R.E., 1984, ApJ, 286,144Wilson A.S.et al. , 1992, ApJ, 391, L75Wynn-Williams et al. ., 1991, ApJ., 377, 426Yaqoob T. et al. , 1995, ApJ, 455, 508Yaqoob T. et al. , 1997, The ASCA ABC Guide, v2.0,NASA/GSFCZhao J.H., Anantharamaiah K.R., Goss W.M., ViallefondF., 1997, ApJ, 482, 186
c© 0000 RAS, MNRAS 000, 000–000
Related Documents