21 st Annual “State of Logistics Report ®” 3PL Summit & Chief Supply Chain Officer Forum 2010 eyeforTransport Atlanta, GA June 22, 2010 Rosalyn Wilson Delcan Corporation The Great Freight Recession

Rosalyn Wilson from Delcan Corporation on ‘Examining the State of Supply Chain & Logistics – Riding Out the Recession’
Jul 15, 2015
Welcome message from author
This document is posted to help you gain knowledge. Please leave a comment to let me know what you think about it! Share it to your friends and learn new things together.
Transcript
21st Annual “State of Logistics Report®”
3PL Summit & Chief Supply Chain Officer Forum 2010
eyeforTransport
Atlanta, GA
June 22, 2010
Rosalyn Wilson
Delcan Corporation
The Great Freight Recession

US Business Logistics Costs
1.01 0.97 0.92 0.95
1.03
1.18
1.31 1.39
1.34
1.10
$ T
rill
ion
s
1
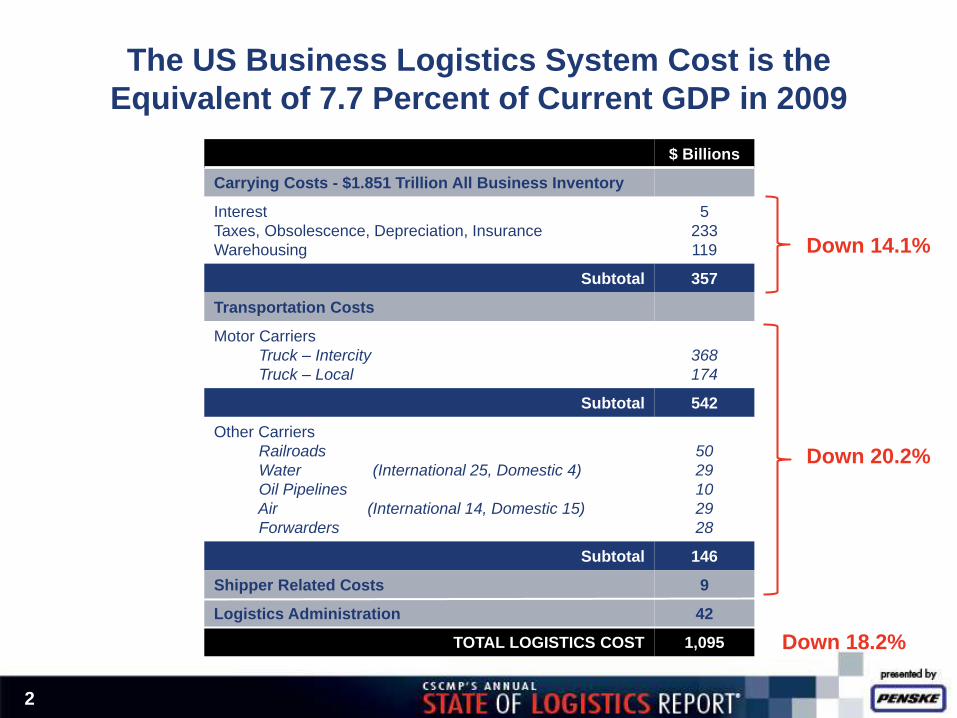
The US Business Logistics System Cost is the
Equivalent of 7.7 Percent of Current GDP in 2009
Down 14.1%
Down 20.2%
Down 18.2%
2
$ Billions
Carrying Costs - $1.851 Trillion All Business Inventory
Interest
Taxes, Obsolescence, Depreciation, Insurance
Warehousing
5
233
119
Subtotal 357
Transportation Costs
Motor Carriers
Truck – Intercity
Truck – Local
368
174
Subtotal 542
Other Carriers
Railroads
Water (International 25, Domestic 4)
Oil Pipelines
Air (International 14, Domestic 15)
Forwarders
50
29
10
29
28
Subtotal 146
Shipper Related Costs 9
Logistics Administration 42
TOTAL LOGISTICS COST 1,095

Logistics Cost As A Percent of GDP
10.3 9.5
8.8 8.6 8.8 9.5 9.8 9.9
9.3
7.7
2000 2001 2002 2003 2004 2005 2006 2007 2008 2009
3

Total US Business Inventories
Source: US Department of Commerce, Census Bureau
1300
1500
1700
1900
2100
2300Billions of Dollars
US Recessions
Recession Dates: 3/1/2001 to 11/1/2001 and 12/1/07 to 7/1/09
4
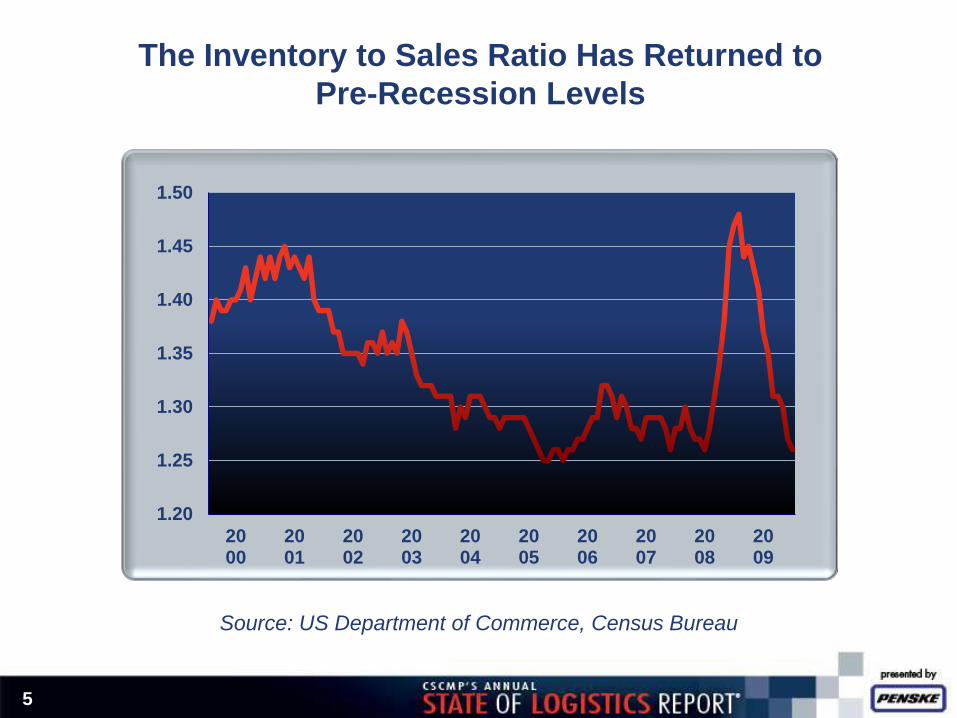
The Inventory to Sales Ratio Has Returned to
Pre-Recession Levels
Source: US Department of Commerce, Census Bureau
1.20
1.25
1.30
1.35
1.40
1.45
1.50
2000
2001
2002
2003
2004
2005
2006
2007
2008
2009
5
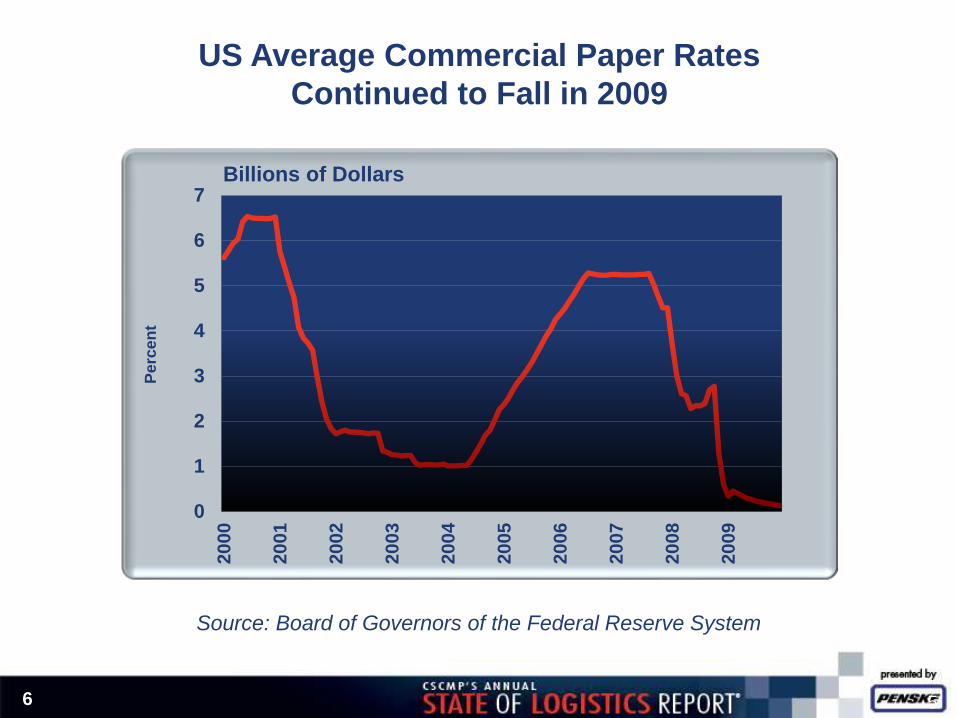
US Average Commercial Paper Rates
Continued to Fall in 2009
Source: Board of Governors of the Federal Reserve System
5
0
1
2
3
4
5
6
7
20
00
20
01
20
02
20
03
20
04
20
05
20
06
20
07
20
08
20
09
Perc
en
t
Billions of Dollars
6

The US Business Logistics System Cost is the
Equivalent of 7.7 Percent of Current GDP in 2009
7
$ Billions
Carrying Costs - $1.851 Trillion All Business Inventory
Interest
Taxes, Obsolescence, Depreciation, Insurance
Warehousing
5
233
119
Subtotal 357
Transportation Costs
Motor Carriers
Truck – Intercity
Truck – Local
368
174
Subtotal 542
Other Carriers
Railroads
Water (International 25, Domestic 4)
Oil Pipelines
Air (International 14, Domestic 15)
Forwarders
50
29
10
29
28
Subtotal 146
Shipper Related Costs 9
Logistics Administration 42
TOTAL LOGISTICS COST 1,095
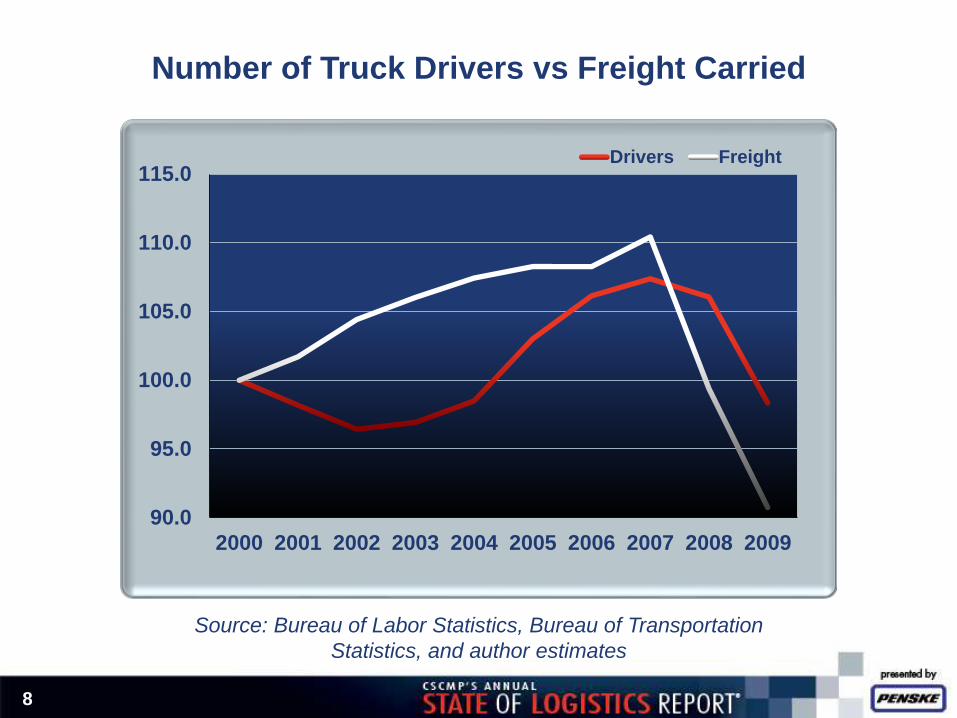
Number of Truck Drivers vs Freight Carried
90.0
95.0
100.0
105.0
110.0
115.0
2000 2001 2002 2003 2004 2005 2006 2007 2008 2009
Drivers Freight
Source: Bureau of Labor Statistics, Bureau of Transportation
Statistics, and author estimates
8
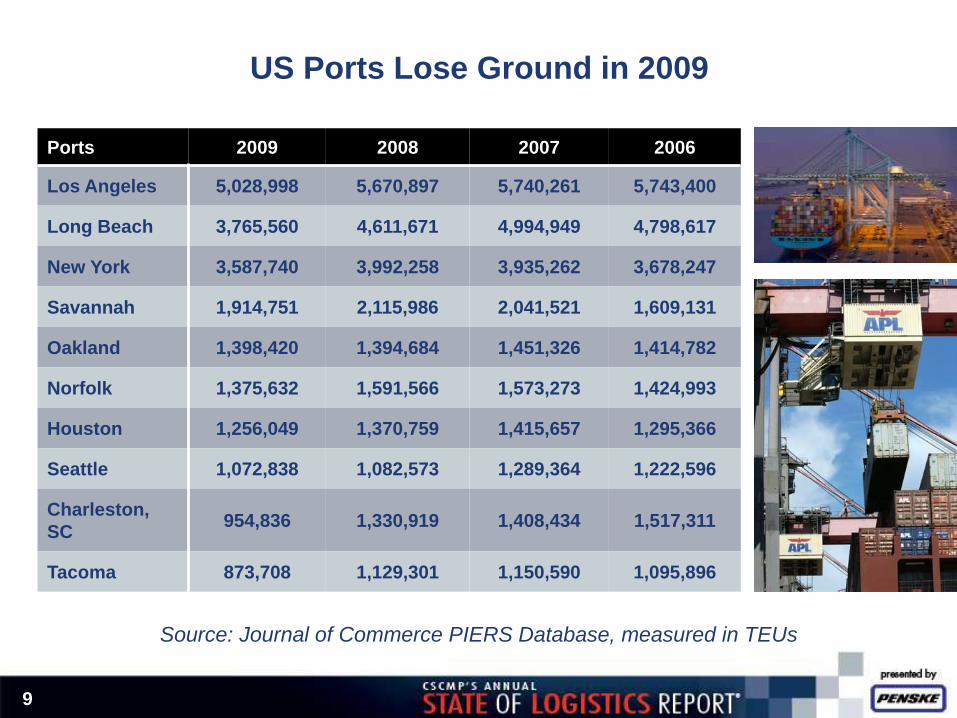
Ports 2009 2008 2007 2006
Los Angeles 5,028,998 5,670,897 5,740,261 5,743,400
Long Beach 3,765,560 4,611,671 4,994,949 4,798,617
New York 3,587,740 3,992,258 3,935,262 3,678,247
Savannah 1,914,751 2,115,986 2,041,521 1,609,131
Oakland 1,398,420 1,394,684 1,451,326 1,414,782
Norfolk 1,375,632 1,591,566 1,573,273 1,424,993
Houston 1,256,049 1,370,759 1,415,657 1,295,366
Seattle 1,072,838 1,082,573 1,289,364 1,222,596
Charleston,
SC 954,836 1,330,919 1,408,434 1,517,311
Tacoma 873,708 1,129,301 1,150,590 1,095,896
Source: Journal of Commerce PIERS Database, measured in TEUs
US Ports Lose Ground in 2009
9
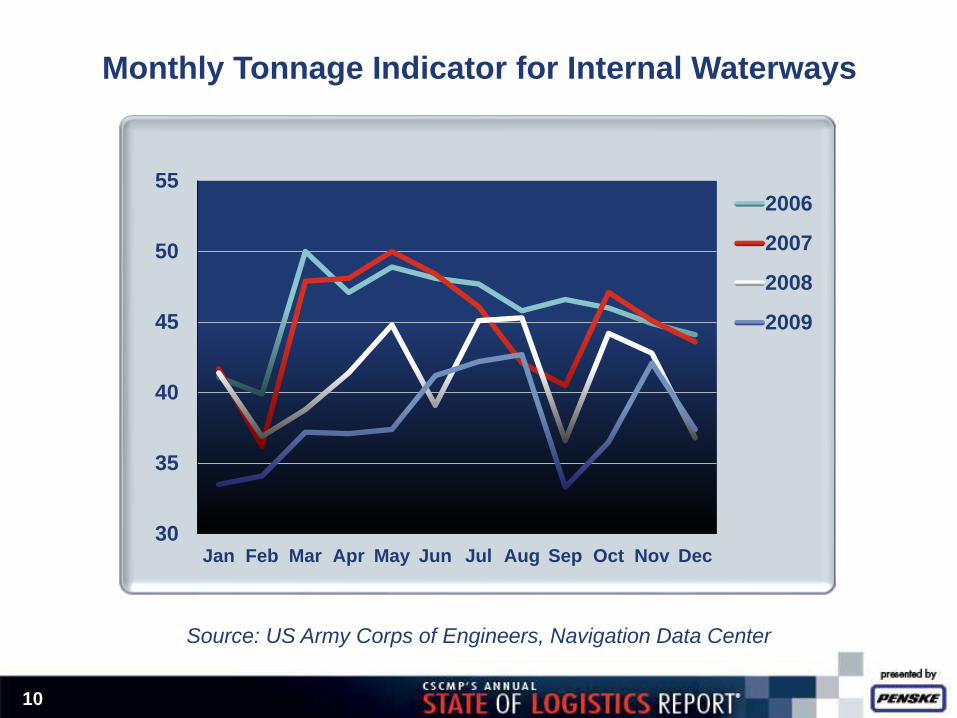
Monthly Tonnage Indicator for Internal Waterways
30
35
40
45
50
55
Jan Feb Mar Apr May Jun Jul Aug Sep Oct Nov Dec
2006
2007
2008
2009
Source: US Army Corps of Engineers, Navigation Data Center
10

Index of Logistics Costs as a Percent of GDP
1989 - 2009
9
30
50
70
90
110
1990 1995 2000 2005 2009
Ind
ex 1
985 =
100
Inventory Transportation Total
US Recessions
11
Recession Dates: 3/1/2001 to 11/1/2001 and 12/1/07 to 7/1/09

GDP Growth and Logistics Cost Growth
2005 2006 2007 2008 2009
GDP Logistics Costs
12

Looking Ahead
• Real GDP estimate for the first quarter of 2010 was revised
downward recently to 3 percent, following a fourth quarter
2009 estimate of 5.6 percent
• Inflation rate remains low at 2.2 percent in April 2010 and the
cost of living declined .1 percent in April as well
• Industrial Production has expanded every month in 2010
-15
-10
-5
0
5
10
Jan 07 Jul 07 Jan 08 Jul 08 Jan 09 Jul 09 Jan 10
Industrial Production
13
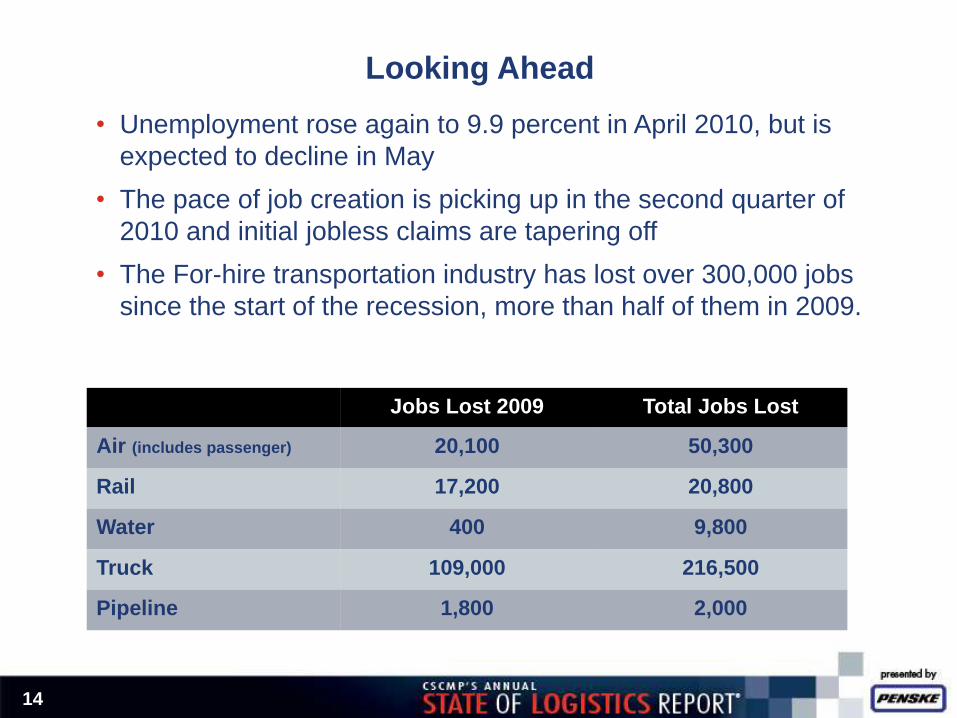
• Unemployment rose again to 9.9 percent in April 2010, but is
expected to decline in May
• The pace of job creation is picking up in the second quarter of
2010 and initial jobless claims are tapering off
• The For-hire transportation industry has lost over 300,000 jobs
since the start of the recession, more than half of them in 2009.
Jobs Lost 2009 Total Jobs Lost
Air (includes passenger) 20,100 50,300
Rail 17,200 20,800
Water 400 9,800
Truck 109,000 216,500
Pipeline 1,800 2,000
14
Looking Ahead

0.00
0.50
1.00
1.50
2.00
Jan Feb Mar Apr
Perc
en
t C
han
ge
2010 Truck Tonnage
-1.5
0.0
1.5
3.0
4.5
Jan Feb Mar Apr
Perc
en
t C
han
ge
2010 Rail Carloadings
-4.5
-3.0
-1.5
0.0
1.5
3.0
Jan Feb Mar Apr
Perc
en
t C
han
ge
2010 Rail Intermodal
0.95
1.00
1.05
1.10
Jan Feb Mar
Millio
n T
EU
s
2010 Container Traffic
15
Looking Ahead
Source: Global Port Tracker Source: AAR RailTime Indicators, SA
Source: ATA Truck Tonnage Index, SA Source: AAR RailTime Indicators, SA

Summary
17
• 2009 Logistics Costs fell to $1.1 trillion
• Transportation costs dropped 20.2 percent and now account
for 4.9 percent of nominal GDP – all modes dropped
substantially
• Logistics cost were equivalent to 7.7 percent of GDP in 2009 –
the lowest level recorded to date
• Inventory carrying costs declined 14.1 percent and now
account for 2.5 percent of nominal GDP – both decreased
inventories and lower interest rates contributed
16
17
• Copies of the 21st Annual State of Logistics Report© are
available at http://cscmp.org/
• More information and related interviews and quotes are
available at http://state-of-logistics.presslift.com/2010
Rosalyn Wilson Delcan Corporation
703-587-6213
Related Documents