Cell Metabolism Article ROS-Triggered Phosphorylation of Complex II by Fgr Kinase Regulates Cellular Adaptation to Fuel Use Rebeca Acı´n-Pe ´ rez, 1 Isabel Carrascoso, 1 Francesc Baixauli, 1 Marta Roche-Molina, 1 Ana Latorre-Pellicer, 1 Patricio Ferna ´ ndez-Silva, 2 Marı ´a Mittelbrunn, 1 Francisco Sanchez-Madrid, 1 Acisclo Pe ´ rez-Martos, 2 Clifford A. Lowell, 3 Giovanni Manfredi, 4 and Jose ´ Antonio Enrı´quez 1,2, * 1 Centro Nacional de Investigaciones Cardiovasculares Carlos III (CNIC), Melchor Ferna ´ ndez Almagro, 3, 28029 Madrid, Spain 2 Departamento de Bioquı ´mica y Biologı ´a Molecular y Celular, Facultad de Ciencias, Universidad de Zaragoza, 50009 Zaragoza, Spain 3 Department of Laboratory Medicine, University of California, San Francisco, San Francisco, CA 94143, USA 4 Brain and Mind Research Institute, Weill Medical College of Cornell University, New York, NY 10065, USA *Correspondence: [email protected] http://dx.doi.org/10.1016/j.cmet.2014.04.015 SUMMARY Electron flux in the mitochondrial electron transport chain is determined by the superassembly of mito- chondrial respiratory complexes. Different superas- semblies are dedicated to receive electrons derived from NADH or FADH 2 , allowing cells to adapt to the particular NADH/FADH 2 ratio generated from avail- able fuel sources. When several fuels are available, cells adapt to the fuel best suited to their type or func- tional status (e.g., quiescent versus proliferative). We show that an appropriate proportion of superas- semblies can be achieved by increasing CII activity through phosphorylation of the complex II catalytic subunit FpSDH. This phosphorylation is mediated by the tyrosine-kinase Fgr, which is activated by hydrogen peroxide. Ablation of Fgr or mutation of the FpSDH target tyrosine abolishes the capacity of mitochondria to adjust metabolism upon nutrient re- striction, hypoxia/reoxygenation, and T cell activa- tion, demonstrating the physiological relevance of this adaptive response. INTRODUCTION To utilize fuels efficiently, cells must exquisitely integrate the ac- tivities of membrane receptors and transporters, the intracellular compartmentalization of molecules, the enzymatic balance of each metabolic step, and the elimination of byproducts (Stanley et al., 2013). Appropriate orchestration of all these changes is critical for the cell’s ability to adapt to changing functional requirements, such as quiescence, proliferation, and differen- tiation, and to environmental changes, including survival in response to diverse insults. Factors known to influence this adaptation include the cellular response to oxygen availability (hypoxia-inducible factors HIF1a and HIF1b); regulators of energy availability such as mammalian target of rapamycin (mTOR), AMP-activated protein kinase, sirtuin, and forkhead box (FOX)O; and mediators of the response to reactive oxygen species (ROS), such as peroxisome proliferator-activated recep- tor gamma coactivator-1 alpha (PGC-1a). The involvement of these factors illustrates the interconnection between the use of alternate carbon substrates (carbohydrates, amino acids, fatty acids and ketone bodies) and the cellular response to stress, particularly oxidative stress. At the core of this process are mitochondria. In response to changes in fuel source, mitochondria must modify their location, structure, and metabolite fluxes in order to balance their contri- bution to anabolism (lipogenesis and antioxidant defenses from citrate, gluconeogenesis, serine and glycine biosynthesis from pyruvate, nucleotide biosynthesis) and catabolism (TCA cycle, b-oxidation, oxidative phosphorylation). Mitochondria are cen- tral to ATP synthesis, redox balance, and ROS production, pa- rameters directly dependent on fuel use. All catabolic processes converge on the mitochondrial electron transport chain (mETC) by supplying electrons in the form of NADH + H + or FADH 2 . The relative proportion of electrons supplied via NADH and FADH 2 varies with the fuel used; for example, oxidative metabolism of glucose generates a NADH/FADH 2 electron ratio of 5, whereas for a typical fatty acid (FA) such as palmitate the ratio is z2 (Speijer, 2011). Our recent work on the dynamic architecture of the mETC re- veals that supercomplex formation defines specific pools of CIII, CIV, CoQ, and cyt c for the receipt of electrons derived from NADH or FAD (Lapuente-Brun et al., 2013). Since CIII preferen- tially interacts with CI, the amount of CI determines the relative availability of CIII for FADH 2 - or NADH-derived electrons. The regulation of CI stability is thus central to cellular adaptation to fuel availability. A substrate shift from glucose to FA requires greater flux from FAD, and this is achieved by a reorganization of the mETC superstructure in which CI is degraded, releasing CIII to receive FAD-derived electrons (Lapuente-Brun et al., 2013; Stanley et al., 2013). Failure of this adaptation results in the harmful generation of reactive oxygen species (ROS) (Speijer, 2011). The proportion of supercomplexes dedicated to receiving NADH electrons is further dependent on the struc- ture and dynamics of mitochondrial cristae (Cogliati et al., 2013; Lapuente-Brun et al., 2013), so that reducing the number of cristae favors flux from FAD. In agreement with this, ablation of the mitochondrial protease OMA1, which prevents optic atrophy 1 (OPA1)-specific proteolysis and cristae remodeling, 1020 Cell Metabolism 19, 1020–1033, June 3, 2014 ª2014 Elsevier Inc.

Welcome message from author
This document is posted to help you gain knowledge. Please leave a comment to let me know what you think about it! Share it to your friends and learn new things together.
Transcript

Cell Metabolism
Article
ROS-Triggered Phosphorylationof Complex II by Fgr Kinase RegulatesCellular Adaptation to Fuel UseRebeca Acın-Perez,1 Isabel Carrascoso,1 Francesc Baixauli,1 Marta Roche-Molina,1 Ana Latorre-Pellicer,1
Patricio Fernandez-Silva,2 Marıa Mittelbrunn,1 Francisco Sanchez-Madrid,1 Acisclo Perez-Martos,2 Clifford A. Lowell,3
Giovanni Manfredi,4 and Jose Antonio Enrıquez1,2,*1Centro Nacional de Investigaciones Cardiovasculares Carlos III (CNIC), Melchor Fernandez Almagro, 3, 28029 Madrid, Spain2Departamento de Bioquımica y Biologıa Molecular y Celular, Facultad de Ciencias, Universidad de Zaragoza, 50009 Zaragoza, Spain3Department of Laboratory Medicine, University of California, San Francisco, San Francisco, CA 94143, USA4Brain and Mind Research Institute, Weill Medical College of Cornell University, New York, NY 10065, USA
*Correspondence: [email protected]://dx.doi.org/10.1016/j.cmet.2014.04.015
SUMMARY
Electron flux in the mitochondrial electron transportchain is determined by the superassembly of mito-chondrial respiratory complexes. Different superas-semblies are dedicated to receive electrons derivedfrom NADH or FADH2, allowing cells to adapt to theparticular NADH/FADH2 ratio generated from avail-able fuel sources. When several fuels are available,cells adapt to the fuel best suited to their type or func-tional status (e.g., quiescent versus proliferative).We show that an appropriate proportion of superas-semblies can be achieved by increasing CII activitythrough phosphorylation of the complex II catalyticsubunit FpSDH. This phosphorylation is mediatedby the tyrosine-kinase Fgr, which is activated byhydrogen peroxide. Ablation of Fgr or mutation ofthe FpSDH target tyrosine abolishes the capacity ofmitochondria to adjust metabolism upon nutrient re-striction, hypoxia/reoxygenation, and T cell activa-tion, demonstrating the physiological relevance ofthis adaptive response.
INTRODUCTION
To utilize fuels efficiently, cells must exquisitely integrate the ac-
tivities of membrane receptors and transporters, the intracellular
compartmentalization of molecules, the enzymatic balance of
each metabolic step, and the elimination of byproducts (Stanley
et al., 2013). Appropriate orchestration of all these changes
is critical for the cell’s ability to adapt to changing functional
requirements, such as quiescence, proliferation, and differen-
tiation, and to environmental changes, including survival in
response to diverse insults. Factors known to influence this
adaptation include the cellular response to oxygen availability
(hypoxia-inducible factors HIF1a and HIF1b); regulators of
energy availability such as mammalian target of rapamycin
(mTOR), AMP-activated protein kinase, sirtuin, and forkhead
box (FOX)O; and mediators of the response to reactive oxygen
1020 Cell Metabolism 19, 1020–1033, June 3, 2014 ª2014 Elsevier In
species (ROS), such as peroxisome proliferator-activated recep-
tor gamma coactivator-1 alpha (PGC-1a). The involvement of
these factors illustrates the interconnection between the use of
alternate carbon substrates (carbohydrates, amino acids, fatty
acids and ketone bodies) and the cellular response to stress,
particularly oxidative stress.
At the core of this process are mitochondria. In response to
changes in fuel source, mitochondria must modify their location,
structure, and metabolite fluxes in order to balance their contri-
bution to anabolism (lipogenesis and antioxidant defenses from
citrate, gluconeogenesis, serine and glycine biosynthesis from
pyruvate, nucleotide biosynthesis) and catabolism (TCA cycle,
b-oxidation, oxidative phosphorylation). Mitochondria are cen-
tral to ATP synthesis, redox balance, and ROS production, pa-
rameters directly dependent on fuel use. All catabolic processes
converge on the mitochondrial electron transport chain (mETC)
by supplying electrons in the form of NADH+H+ or FADH2. The
relative proportion of electrons supplied via NADH and FADH2
varies with the fuel used; for example, oxidative metabolism of
glucose generates a NADH/FADH2 electron ratio of 5, whereas
for a typical fatty acid (FA) such as palmitate the ratio is z2
(Speijer, 2011).
Our recent work on the dynamic architecture of the mETC re-
veals that supercomplex formation defines specific pools of CIII,
CIV, CoQ, and cyt c for the receipt of electrons derived from
NADH or FAD (Lapuente-Brun et al., 2013). Since CIII preferen-
tially interacts with CI, the amount of CI determines the relative
availability of CIII for FADH2- or NADH-derived electrons. The
regulation of CI stability is thus central to cellular adaptation to
fuel availability. A substrate shift from glucose to FA requires
greater flux from FAD, and this is achieved by a reorganization
of the mETC superstructure in which CI is degraded, releasing
CIII to receive FAD-derived electrons (Lapuente-Brun et al.,
2013; Stanley et al., 2013). Failure of this adaptation results
in the harmful generation of reactive oxygen species (ROS)
(Speijer, 2011). The proportion of supercomplexes dedicated
to receiving NADH electrons is further dependent on the struc-
ture and dynamics of mitochondrial cristae (Cogliati et al.,
2013; Lapuente-Brun et al., 2013), so that reducing the number
of cristae favors flux from FAD. In agreement with this, ablation
of the mitochondrial protease OMA1, which prevents optic
atrophy 1 (OPA1)-specific proteolysis and cristae remodeling,
c.
Cell Metabolism
Complex II Activation by ROS through Fgr-Kinase
impairs FA degradation in mice, resulting in obesity and impaired
temperature control (Quiros et al., 2012).
Cells are normally exposed to a mixed supply of fuels, but
despite this, cells are often predisposed to preferentially use
one source over another, according to their physiological role
or status (Stanley et al., 2013). T cells, for example, switch
from oxidative to glycolytic metabolism upon activation, coin-
ciding with entry into a proliferative state, and later increase FA
oxidation when they differentiate into regulatory T cells. These
changes require remodeling of the mETC NADH/FADH2 flux ca-
pacity, but how cells regulate this choice of carbon source is not
understood.
Here, we show that fuel choice is regulated via tyrosine phos-
phorylation of complex II (CII) subunit FpSDH,mediated by ROS-
activation of the tyrosine kinase Fgr. This activation is required
to adjust the level of complex I (CI) to optimize NADH/FADH2
electron use. Our data show this mechanism operating in three
physiological situations: upon T lymphocyte activation, in the
adaptation of liver and cultured cells to starvation, and in the
adaptation of cells to hypoxia/reoxygenation.
RESULTS
Above-Normal CII Activity in Cells Expressing Mutant CIOur laboratory has isolated mouse cell lines carrying different
proportions of a null ND6 mutation (Acın-Perez et al., 2003):
EB2615 (30% mutant mtDNA), E23 (66%), E12 (80%), FG12-1
(95%), and FG23-1 (98%). Mitochondria from ND6 mutants
showed reductions in CI proportional to the mutation load (Fig-
ure 1A). Interestingly, the lines with the highest mutation loads
showed elevated activity of CII (Figure 1B). Similar observations
have been reported in human cells derived from patients with CI
deficiencies (Cardol et al., 2002; Fan et al., 2008; Majander et al.,
1991; Pitkanen and Robinson, 1996) and in CI-deficient mice
(Kruse et al., 2008). Increased CII activity was proposed to
compensate for impaired activity of CI, but the underlying mech-
anism is unknown. This compensatory phenomenon is specific
for CI-deficient cells, since cells lacking CIII or CIV showed no
changes in CII activity (Figure S1A).
As reported (Acın-Perez et al., 2003; Bai and Attardi, 1998), the
amount of CI was reduced in cells with a high ND6 mutant load
(FG12-1, FG23-1; Figure 1C, upper panel), whereas CII content
was unchanged, despite above-normal activity determined
spectrophotometrically (Figure 1B) and by in-gel assay (data
not shown). G3PDH activity did not differ between WT and
ND6 mutants (Figure 1D), indicating that increased CII activity
does not reflect a generalized response of enzymes that donate
electrons to CIII and is a specific response to CI deficiency.
As a further control, we treated WT FBalb/cJ cells with the
specific inhibitor rotenone (200 nM), which blocks CI activity
without affecting CI assembly. Rotenone-mediated inhibition of
CI was accompanied by a parallel increase in CII activity, after
short and long rotenone treatment, indicating that loss of CI
function, not its physical absence, is responsible for the high
CII activity (Figure 1E).
CII Activity Is Regulated by PhosphorylationSeveral groups have proposed that CII subunit A (FpSDH) is a
kinase target (Bykova et al., 2003; Salvi et al., 2007; Schulen-
Cell
berg et al., 2003). To investigate FpSDH phosphorylation,
we separated mitochondrial proteins by 2D IEF/SDS-PAGE
(isoelectric focusing followed by SDS polyacrylamide gel elec-
trophoresis) and detected FpSDH protein by immunoblot (Fig-
ure 1F). The CI subunit NDUFS3 was used as a reference
since the stability and migration of this protein are unaffected
by the failure of CI assembly (Figure S1B). FpSDH in FG23-1
samples migrated as multiple spots, running at more acidic po-
sitions than samples from WT FBalb/cJ cells. This is compatible
with increased phosphorylation of the protein in mutant cells.
Treatment of permeabilized FG23-1 mitochondria with calf-
intestine phosphatase (CIP) to remove phosphoryl residues
restored the WT migration pattern, confirming that the altered
pattern is due to phosphorylation (Figure 1F, lower panels).
Moreover, blockade of CI activity in FBalb/cJ cells reproduced
the FpSDH mobility pattern seen in FG23-1 cells (not shown).
These observations indicate that FpSDH is phosphorylated
when CI activity is impaired. Consistent with these findings,
most FpSDH from FG23-1 mitochondrial samples eluted in
the phosphorylated fraction after separation on phosphopro-
tein-enrichment columns, and this effect was blocked by pre-
treatment of permeabilized mitochondria with CIP (Figure S1C).
In contrast, FpSDH from FBalb/cJ mitochondria was more
concentrated in nonphosphorylated fractions (Figure S1C).
The activity of CII in mitochondria from FBalb/cJ and FG23-1
cells was sensitive to CIP-mediated dephosphorylation, but
this reduction was proportionally more severe in FG23-1 mito-
chondria, suggesting that phosphorylation increases CII activity
(Figure 1G).
Phosphorylation of FpSDH Is Triggered by ROSCells lacking CI contain high levels of ROS (Robinson,
1998), and ND6-deficient cells produce abundant hydrogen
peroxide (Moreno-Loshuertos et al., 2006) (Figure 2A), an effect
mimicked by treatment with the CI inhibitor rotenone (Dlaskova
et al., 2008; Radad et al., 2006). Short and long rotenone treat-
ment of WT cells showed an increase in CII activity (Figure 1E)
that was accompanied by a parallel increase in ROS production
(Figure S2A). ROS modulate several signaling pathways (Droge,
2002; Hamanaka and Chandel, 2010), prompting us to evaluate
the involvement of ROS in CII activation. Culturing cells for
1 week with N-acetyl cysteine (NAC, 5 mM) lowered basal
H2O2 levels and decreased CII activity in control and mutant
cells (Figures 2A and 2B), but the reduction was proportionally
stronger in FG23-1 cells (Figure 2B). Since NAC is not a direct
ROS scavenger but rather a precursor of glutathione, which
changes the redox status of the cell, we investigated H2O2-
dependent CII activity stimulation in isolated mitochondria.
Addition of H2O2 to WT mouse liver mitochondria increased
CII activity (Figure 2C) and the phosphorylation of FpSDH (Fig-
ure 2D). CII activation was blunted by the presence of catalase,
which catalyzes H2O2 decomposition (Figure 2C). As a further
control, we analyzed the response to moderate ROS production
of fibroblasts lacking supercomplex assembly factor I (SCAFI),
which is required for association between CIII and CIV
(Lapuente-Brun et al., 2013). The response of WT and SCAFI-
deficient fibroblasts to ROS (generated by incubation in
the presence of xanthine and xanthine oxidase) was indistin-
guishable, indicating that ROS-induced upregulation of CII is a
Metabolism 19, 1020–1033, June 3, 2014 ª2014 Elsevier Inc. 1021
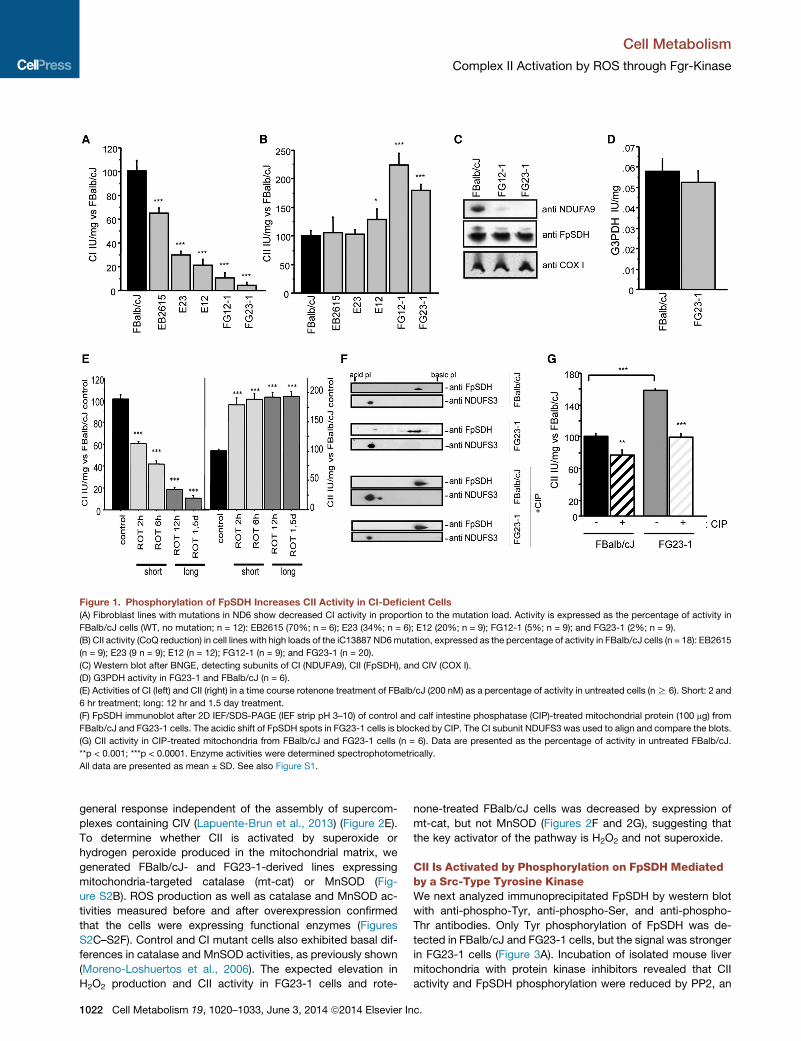
Figure 1. Phosphorylation of FpSDH Increases CII Activity in CI-Deficient Cells
(A) Fibroblast lines with mutations in ND6 show decreased CI activity in proportion to the mutation load. Activity is expressed as the percentage of activity in
FBalb/cJ cells (WT, no mutation; n = 12): EB2615 (70%; n = 6); E23 (34%; n = 6); E12 (20%; n = 9); FG12-1 (5%; n = 9); and FG23-1 (2%; n = 9).
(B) CII activity (CoQ reduction) in cell lines with high loads of the iC13887 ND6mutation, expressed as the percentage of activity in FBalb/cJ cells (n = 18): EB2615
(n = 9); E23 (9 n = 9); E12 (n = 12); FG12-1 (n = 9); and FG23-1 (n = 20).
(C) Western blot after BNGE, detecting subunits of CI (NDUFA9), CII (FpSDH), and CIV (COX I).
(D) G3PDH activity in FG23-1 and FBalb/cJ (n = 6).
(E) Activities of CI (left) and CII (right) in a time course rotenone treatment of FBalb/cJ (200 nM) as a percentage of activity in untreated cells (nR 6). Short: 2 and
6 hr treatment; long: 12 hr and 1.5 day treatment.
(F) FpSDH immunoblot after 2D IEF/SDS-PAGE (IEF strip pH 3–10) of control and calf intestine phosphatase (CIP)-treated mitochondrial protein (100 mg) from
FBalb/cJ and FG23-1 cells. The acidic shift of FpSDH spots in FG23-1 cells is blocked by CIP. The CI subunit NDUFS3 was used to align and compare the blots.
(G) CII activity in CIP-treated mitochondria from FBalb/cJ and FG23-1 cells (n = 6). Data are presented as the percentage of activity in untreated FBalb/cJ.
**p < 0.001; ***p < 0.0001. Enzyme activities were determined spectrophotometrically.
All data are presented as mean ± SD. See also Figure S1.
Cell Metabolism
Complex II Activation by ROS through Fgr-Kinase
general response independent of the assembly of supercom-
plexes containing CIV (Lapuente-Brun et al., 2013) (Figure 2E).
To determine whether CII is activated by superoxide or
hydrogen peroxide produced in the mitochondrial matrix, we
generated FBalb/cJ- and FG23-1-derived lines expressing
mitochondria-targeted catalase (mt-cat) or MnSOD (Fig-
ure S2B). ROS production as well as catalase and MnSOD ac-
tivities measured before and after overexpression confirmed
that the cells were expressing functional enzymes (Figures
S2C–S2F). Control and CI mutant cells also exhibited basal dif-
ferences in catalase and MnSOD activities, as previously shown
(Moreno-Loshuertos et al., 2006). The expected elevation in
H2O2 production and CII activity in FG23-1 cells and rote-
1022 Cell Metabolism 19, 1020–1033, June 3, 2014 ª2014 Elsevier In
none-treated FBalb/cJ cells was decreased by expression of
mt-cat, but not MnSOD (Figures 2F and 2G), suggesting that
the key activator of the pathway is H2O2 and not superoxide.
CII Is Activated by Phosphorylation on FpSDH Mediatedby a Src-Type Tyrosine KinaseWe next analyzed immunoprecipitated FpSDH by western blot
with anti-phospho-Tyr, anti-phospho-Ser, and anti-phospho-
Thr antibodies. Only Tyr phosphorylation of FpSDH was de-
tected in FBalb/cJ and FG23-1 cells, but the signal was stronger
in FG23-1 cells (Figure 3A). Incubation of isolated mouse liver
mitochondria with protein kinase inhibitors revealed that CII
activity and FpSDH phosphorylation were reduced by PP2, an
c.
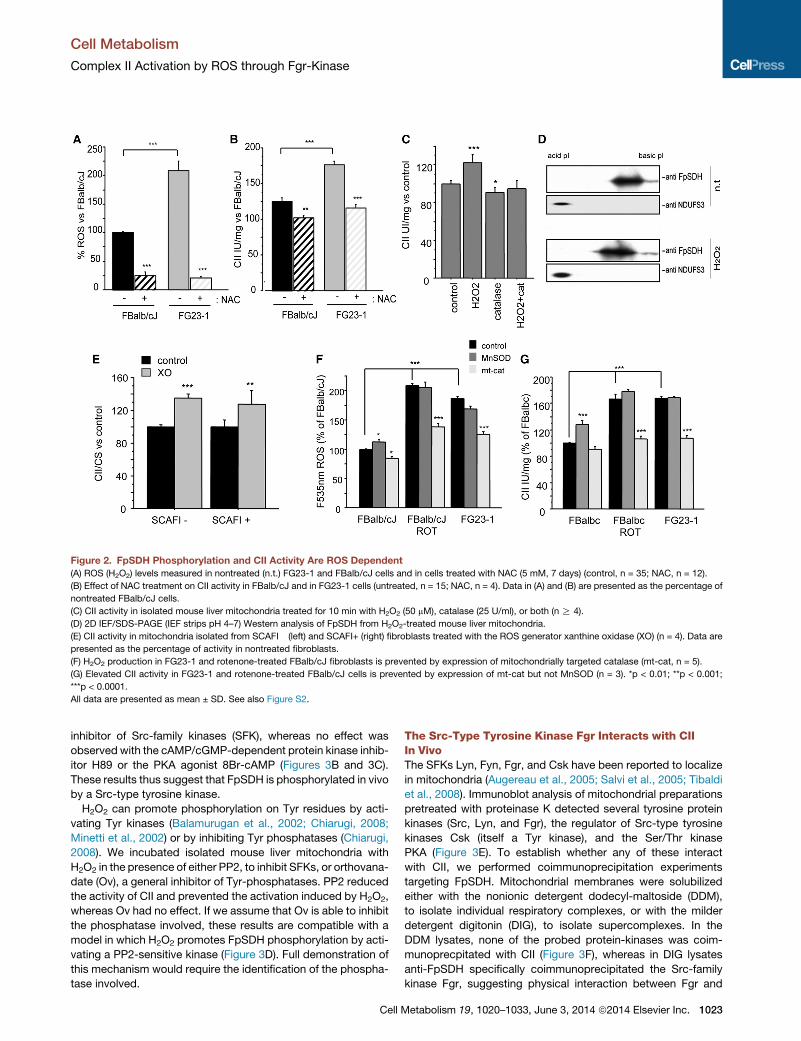
Figure 2. FpSDH Phosphorylation and CII Activity Are ROS Dependent
(A) ROS (H2O2) levels measured in nontreated (n.t.) FG23-1 and FBalb/cJ cells and in cells treated with NAC (5 mM, 7 days) (control, n = 35; NAC, n = 12).
(B) Effect of NAC treatment on CII activity in FBalb/cJ and in FG23-1 cells (untreated, n = 15; NAC, n = 4). Data in (A) and (B) are presented as the percentage of
nontreated FBalb/cJ cells.
(C) CII activity in isolated mouse liver mitochondria treated for 10 min with H2O2 (50 mM), catalase (25 U/ml), or both (n R 4).
(D) 2D IEF/SDS-PAGE (IEF strips pH 4–7) Western analysis of FpSDH from H2O2-treated mouse liver mitochondria.
(E) CII activity in mitochondria isolated from SCAFI� (left) and SCAFI+ (right) fibroblasts treated with the ROS generator xanthine oxidase (XO) (n = 4). Data are
presented as the percentage of activity in nontreated fibroblasts.
(F) H2O2 production in FG23-1 and rotenone-treated FBalb/cJ fibroblasts is prevented by expression of mitochondrially targeted catalase (mt-cat, n = 5).
(G) Elevated CII activity in FG23-1 and rotenone-treated FBalb/cJ cells is prevented by expression of mt-cat but not MnSOD (n = 3). *p < 0.01; **p < 0.001;
***p < 0.0001.
All data are presented as mean ± SD. See also Figure S2.
Cell Metabolism
Complex II Activation by ROS through Fgr-Kinase
inhibitor of Src-family kinases (SFK), whereas no effect was
observed with the cAMP/cGMP-dependent protein kinase inhib-
itor H89 or the PKA agonist 8Br-cAMP (Figures 3B and 3C).
These results thus suggest that FpSDH is phosphorylated in vivo
by a Src-type tyrosine kinase.
H2O2 can promote phosphorylation on Tyr residues by acti-
vating Tyr kinases (Balamurugan et al., 2002; Chiarugi, 2008;
Minetti et al., 2002) or by inhibiting Tyr phosphatases (Chiarugi,
2008). We incubated isolated mouse liver mitochondria with
H2O2 in the presence of either PP2, to inhibit SFKs, or orthovana-
date (Ov), a general inhibitor of Tyr-phosphatases. PP2 reduced
the activity of CII and prevented the activation induced by H2O2,
whereas Ov had no effect. If we assume that Ov is able to inhibit
the phosphatase involved, these results are compatible with a
model in which H2O2 promotes FpSDH phosphorylation by acti-
vating a PP2-sensitive kinase (Figure 3D). Full demonstration of
this mechanism would require the identification of the phospha-
tase involved.
Cell
The Src-Type Tyrosine Kinase Fgr Interacts with CIIIn VivoThe SFKs Lyn, Fyn, Fgr, and Csk have been reported to localize
in mitochondria (Augereau et al., 2005; Salvi et al., 2005; Tibaldi
et al., 2008). Immunoblot analysis of mitochondrial preparations
pretreated with proteinase K detected several tyrosine protein
kinases (Src, Lyn, and Fgr), the regulator of Src-type tyrosine
kinases Csk (itself a Tyr kinase), and the Ser/Thr kinase
PKA (Figure 3E). To establish whether any of these interact
with CII, we performed coimmunoprecipitation experiments
targeting FpSDH. Mitochondrial membranes were solubilized
either with the nonionic detergent dodecyl-maltoside (DDM),
to isolate individual respiratory complexes, or with the milder
detergent digitonin (DIG), to isolate supercomplexes. In the
DDM lysates, none of the probed protein-kinases was coim-
munoprecpitated with CII (Figure 3F), whereas in DIG lysates
anti-FpSDH specifically coimmunoprecipitated the Src-family
kinase Fgr, suggesting physical interaction between Fgr and
Metabolism 19, 1020–1033, June 3, 2014 ª2014 Elsevier Inc. 1023
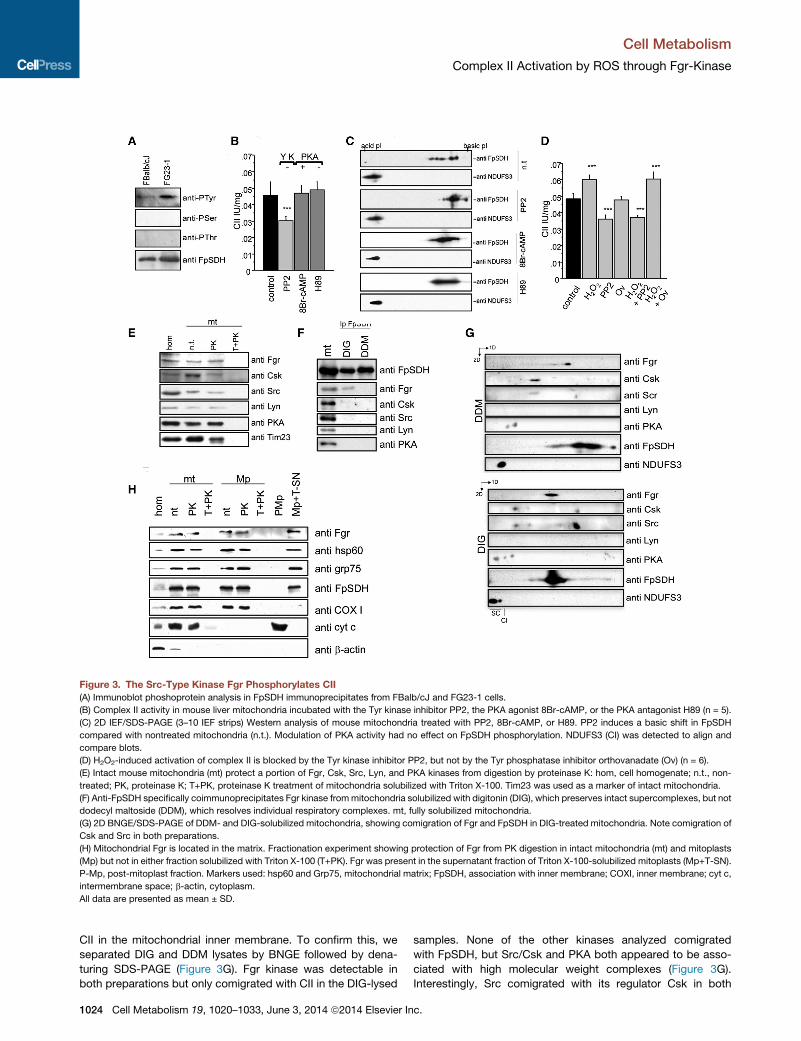
Figure 3. The Src-Type Kinase Fgr Phosphorylates CII
(A) Immunoblot phoshoprotein analysis in FpSDH immunoprecipitates from FBalb/cJ and FG23-1 cells.
(B) Complex II activity in mouse liver mitochondria incubated with the Tyr kinase inhibitor PP2, the PKA agonist 8Br-cAMP, or the PKA antagonist H89 (n = 5).
(C) 2D IEF/SDS-PAGE (3–10 IEF strips) Western analysis of mouse mitochondria treated with PP2, 8Br-cAMP, or H89. PP2 induces a basic shift in FpSDH
compared with nontreated mitochondria (n.t.). Modulation of PKA activity had no effect on FpSDH phosphorylation. NDUFS3 (CI) was detected to align and
compare blots.
(D) H2O2-induced activation of complex II is blocked by the Tyr kinase inhibitor PP2, but not by the Tyr phosphatase inhibitor orthovanadate (Ov) (n = 6).
(E) Intact mouse mitochondria (mt) protect a portion of Fgr, Csk, Src, Lyn, and PKA kinases from digestion by proteinase K: hom, cell homogenate; n.t., non-
treated; PK, proteinase K; T+PK, proteinase K treatment of mitochondria solubilized with Triton X-100. Tim23 was used as a marker of intact mitochondria.
(F) Anti-FpSDH specifically coimmunoprecipitates Fgr kinase frommitochondria solubilized with digitonin (DIG), which preserves intact supercomplexes, but not
dodecyl maltoside (DDM), which resolves individual respiratory complexes. mt, fully solubilized mitochondria.
(G) 2D BNGE/SDS-PAGE of DDM- and DIG-solubilized mitochondria, showing comigration of Fgr and FpSDH in DIG-treated mitochondria. Note comigration of
Csk and Src in both preparations.
(H) Mitochondrial Fgr is located in the matrix. Fractionation experiment showing protection of Fgr from PK digestion in intact mitochondria (mt) and mitoplasts
(Mp) but not in either fraction solubilized with Triton X-100 (T+PK). Fgr was present in the supernatant fraction of Triton X-100-solubilized mitoplasts (Mp+T-SN).
P-Mp, post-mitoplast fraction. Markers used: hsp60 and Grp75, mitochondrial matrix; FpSDH, association with inner membrane; COXI, inner membrane; cyt c,
intermembrane space; b-actin, cytoplasm.
All data are presented as mean ± SD.
Cell Metabolism
Complex II Activation by ROS through Fgr-Kinase
CII in the mitochondrial inner membrane. To confirm this, we
separated DIG and DDM lysates by BNGE followed by dena-
turing SDS-PAGE (Figure 3G). Fgr kinase was detectable in
both preparations but only comigrated with CII in the DIG-lysed
1024 Cell Metabolism 19, 1020–1033, June 3, 2014 ª2014 Elsevier In
samples. None of the other kinases analyzed comigrated
with FpSDH, but Src/Csk and PKA both appeared to be asso-
ciated with high molecular weight complexes (Figure 3G).
Interestingly, Src comigrated with its regulator Csk in both
c.
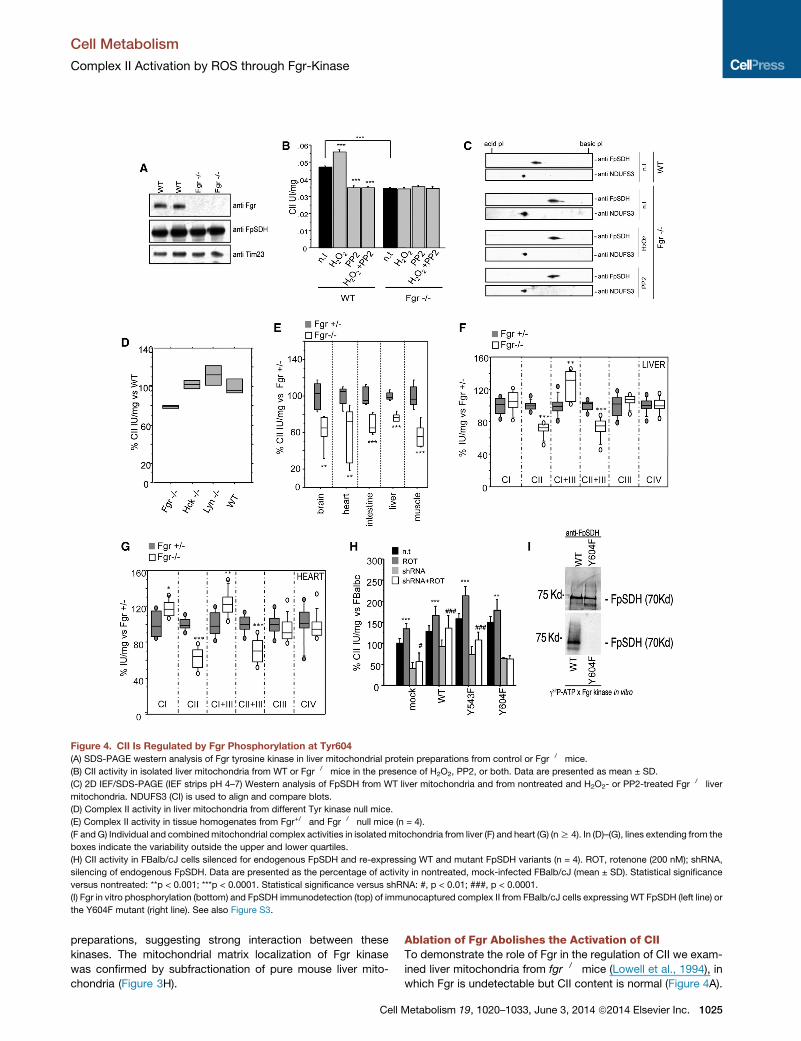
Figure 4. CII Is Regulated by Fgr Phosphorylation at Tyr604
(A) SDS-PAGE western analysis of Fgr tyrosine kinase in liver mitochondrial protein preparations from control or Fgr�/� mice.
(B) CII activity in isolated liver mitochondria from WT or Fgr�/� mice in the presence of H2O2, PP2, or both. Data are presented as mean ± SD.
(C) 2D IEF/SDS-PAGE (IEF strips pH 4–7) Western analysis of FpSDH from WT liver mitochondria and from nontreated and H2O2- or PP2-treated Fgr�/� liver
mitochondria. NDUFS3 (CI) is used to align and compare blots.
(D) Complex II activity in liver mitochondria from different Tyr kinase null mice.
(E) Complex II activity in tissue homogenates from Fgr+/� and Fgr�/� null mice (n = 4).
(F and G) Individual and combinedmitochondrial complex activities in isolated mitochondria from liver (F) and heart (G) (nR 4). In (D)–(G), lines extending from the
boxes indicate the variability outside the upper and lower quartiles.
(H) CII activity in FBalb/cJ cells silenced for endogenous FpSDH and re-expressing WT and mutant FpSDH variants (n = 4). ROT, rotenone (200 nM); shRNA,
silencing of endogenous FpSDH. Data are presented as the percentage of activity in nontreated, mock-infected FBalb/cJ (mean ± SD). Statistical significance
versus nontreated: **p < 0.001; ***p < 0.0001. Statistical significance versus shRNA: #, p < 0.01; ###, p < 0.0001.
(I) Fgr in vitro phosphorylation (bottom) and FpSDH immunodetection (top) of immunocaptured complex II from FBalb/cJ cells expressing WT FpSDH (left line) or
the Y604F mutant (right line). See also Figure S3.
Cell Metabolism
Complex II Activation by ROS through Fgr-Kinase
preparations, suggesting strong interaction between these
kinases. The mitochondrial matrix localization of Fgr kinase
was confirmed by subfractionation of pure mouse liver mito-
chondria (Figure 3H).
Cell
Ablation of Fgr Abolishes the Activation of CIITo demonstrate the role of Fgr in the regulation of CII we exam-
ined liver mitochondria from fgr�/� mice (Lowell et al., 1994), in
which Fgr is undetectable but CII content is normal (Figure 4A).
Metabolism 19, 1020–1033, June 3, 2014 ª2014 Elsevier Inc. 1025
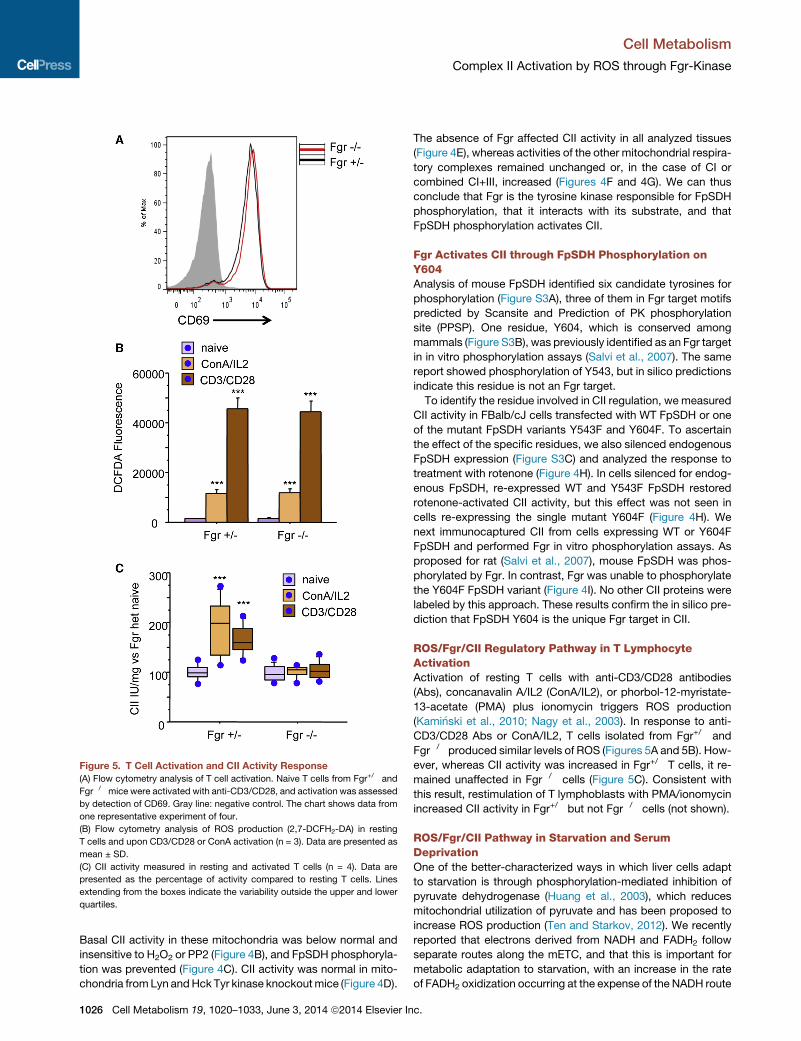
Figure 5. T Cell Activation and CII Activity Response
(A) Flow cytometry analysis of T cell activation. Naive T cells from Fgr+/� and
Fgr�/� mice were activated with anti-CD3/CD28, and activation was assessed
by detection of CD69. Gray line: negative control. The chart shows data from
one representative experiment of four.
(B) Flow cytometry analysis of ROS production (2,7-DCFH2-DA) in resting
T cells and upon CD3/CD28 or ConA activation (n = 3). Data are presented as
mean ± SD.
(C) CII activity measured in resting and activated T cells (n = 4). Data are
presented as the percentage of activity compared to resting T cells. Lines
extending from the boxes indicate the variability outside the upper and lower
quartiles.
Cell Metabolism
Complex II Activation by ROS through Fgr-Kinase
Basal CII activity in these mitochondria was below normal and
insensitive to H2O2 or PP2 (Figure 4B), and FpSDH phosphoryla-
tion was prevented (Figure 4C). CII activity was normal in mito-
chondria fromLyn andHck Tyr kinase knockoutmice (Figure 4D).
1026 Cell Metabolism 19, 1020–1033, June 3, 2014 ª2014 Elsevier In
The absence of Fgr affected CII activity in all analyzed tissues
(Figure 4E), whereas activities of the other mitochondrial respira-
tory complexes remained unchanged or, in the case of CI or
combined CI+III, increased (Figures 4F and 4G). We can thus
conclude that Fgr is the tyrosine kinase responsible for FpSDH
phosphorylation, that it interacts with its substrate, and that
FpSDH phosphorylation activates CII.
Fgr Activates CII through FpSDH Phosphorylation onY604Analysis of mouse FpSDH identified six candidate tyrosines for
phosphorylation (Figure S3A), three of them in Fgr target motifs
predicted by Scansite and Prediction of PK phosphorylation
site (PPSP). One residue, Y604, which is conserved among
mammals (Figure S3B), was previously identified as an Fgr target
in in vitro phosphorylation assays (Salvi et al., 2007). The same
report showed phosphorylation of Y543, but in silico predictions
indicate this residue is not an Fgr target.
To identify the residue involved in CII regulation, we measured
CII activity in FBalb/cJ cells transfected with WT FpSDH or one
of the mutant FpSDH variants Y543F and Y604F. To ascertain
the effect of the specific residues, we also silenced endogenous
FpSDH expression (Figure S3C) and analyzed the response to
treatment with rotenone (Figure 4H). In cells silenced for endog-
enous FpSDH, re-expressed WT and Y543F FpSDH restored
rotenone-activated CII activity, but this effect was not seen in
cells re-expressing the single mutant Y604F (Figure 4H). We
next immunocaptured CII from cells expressing WT or Y604F
FpSDH and performed Fgr in vitro phosphorylation assays. As
proposed for rat (Salvi et al., 2007), mouse FpSDH was phos-
phorylated by Fgr. In contrast, Fgr was unable to phosphorylate
the Y604F FpSDH variant (Figure 4I). No other CII proteins were
labeled by this approach. These results confirm the in silico pre-
diction that FpSDH Y604 is the unique Fgr target in CII.
ROS/Fgr/CII Regulatory Pathway in T LymphocyteActivationActivation of resting T cells with anti-CD3/CD28 antibodies
(Abs), concanavalin A/IL2 (ConA/IL2), or phorbol-12-myristate-
13-acetate (PMA) plus ionomycin triggers ROS production
(Kami�nski et al., 2010; Nagy et al., 2003). In response to anti-
CD3/CD28 Abs or ConA/IL2, T cells isolated from Fgr+/� and
Fgr�/� produced similar levels of ROS (Figures 5A and 5B). How-
ever, whereas CII activity was increased in Fgr+/� T cells, it re-
mained unaffected in Fgr�/� cells (Figure 5C). Consistent with
this result, restimulation of T lymphoblasts with PMA/ionomycin
increased CII activity in Fgr+/� but not Fgr�/� cells (not shown).
ROS/Fgr/CII Pathway in Starvation and SerumDeprivationOne of the better-characterized ways in which liver cells adapt
to starvation is through phosphorylation-mediated inhibition of
pyruvate dehydrogenase (Huang et al., 2003), which reduces
mitochondrial utilization of pyruvate and has been proposed to
increase ROS production (Ten and Starkov, 2012). We recently
reported that electrons derived from NADH and FADH2 follow
separate routes along the mETC, and that this is important for
metabolic adaptation to starvation, with an increase in the rate
of FADH2 oxidization occurring at the expense of the NADH route
c.
Cell Metabolism
Complex II Activation by ROS through Fgr-Kinase
(Lapuente-Brun et al., 2013). Since Fgr-kinase activates CII (and
hence use of FADH2 electrons), we conducted a more detailed
evaluation of the consequences of the lack of Fgr-kinase for liver
mitochondria function. The significantly lowermaximumCII activ-
ity inmitochondrial preparations fromFgr null liverwas accompa-
nied by lower-succinate-driven respiration and ATP synthesis
(Figure 6A). Maximum CI activity was similar for both genotypes
(Figure 6B). Surprisingly, pyruvate-plus-malate- and glutamate-
plus-malate-driven respiration rates were below normal in well-
fed Fgr null mice, and in the case of pyruvate-plus-malate this
was accompanied by significantly lower ATP synthesis (Fig-
ure 6B). Lack of Fgr kinase thus appears to have a broader than
anticipated effect on liver energy metabolism. No significant dif-
ferences in citrate synthase activity were detected that could
explain this decline in CI dependent respiration (Figure 6A). But
although both the CI (NADH route) and the CII (FADH2 route) are
altered in Fgr�/� liver mitochondria, the balance of electron
supply potential to the mETC from NADH and FADH2 is shifted,
increasing the CI/CII activity ratio (Figure 6C). Starving Fgr�/�
mice overnight increased CI activity in liver mitochondria and
reduced CII activity (Figures 6A, 6B, and S4), sharply increasing
the CI/CII activity ratio, whereas the ratio in mitochondria from
starved control mice decreased (Figure 6C). Feeding mitochon-
dria with pyruvate or glutamate should generate intramito-
chondrial NADH, for delivery of electrons to CI. As expected,
starvation-induced downregulation of pyruvate dehydrogenase
activity reduced pyruvate-plus-malate-driven respiration and
ATP synthesis in Fgr+/� and Fgr null mice (Figure 6B). In contrast,
starvation only decreased respiration and ATP synthesis driven
by glutamate-plus-malate in Fgr�/� mice, despite the higher
maximalCI respiration (Figure 6B). Theseobservations unexpect-
edly show that lackof Fgr kinase affects liver glutamate utilization.
To avoid the complex pleiotropic effects of Fgr-kinase ablation
in liver, we mimicked starvation in cultured embryonic fibroblasts
(derived from Fgr+/� and Fgr�/� littermates) by overnight serum
deprivation. Serum-deprived Fgr+/� fibroblasts showed the
typical mitochondrial hyperfusion phenotype required tomaintain
ATP production upon nutrient deprivation (Gomes et al., 2011),
whereas Fgr�/� mitochondria were fragmented (Figure 6D).
Consistently, mitochondria from serum-deprived Fgr�/� cells
showed higher processing of OPA1 (Figure 6E). Serum depriva-
tion increasedCII activity in Fgr+/� but not Fgr�/� cells (Figure 6F),
recapitulating the lack ofCII activation inFgr�/� livermitochondria
from overnight-starved mice. To assess whether starvation re-
sponses were due only to Fgr-dependent CII phosphorylation,
we analyzed the effects of serum deprivation in fibroblasts
silenced for endogenous FpSDH and exogenously re-expressing
WT or Y604F FpSDH. Serum deprivation triggered OPA-1 pro-
cessing in Y604F cells (Figure 6E), mimicking the result in Fgr
null fibroblasts, and only cells re-expressing WT FpSDH upregu-
lated CII activity after serum deprivation (Figure 6G). The blunted
CII activation inY604Fcells compromisedcell survival after serum
deprivation, revealed by a higher proportion of apoptotic annexin
V positive Y604F cells (Figures 6H and S5C).
ROS/Fgr/CII Pathway in Reoxygenation-InducedMetabolic ReprogrammingA drop in O2 availability triggers several adaptive mechanisms,
including reduction in the activities and protein levels of
Cell
OXPHOS components and in ROS production (Ali et al., 2012;
Heather et al., 2012; Papandreou et al., 2006), and a notable
accumulation of succinate (Cascarano et al., 1976). However,
sudden reoxygenation, as occurs in reperfusion after ischemia,
is accompanied by a sharp increase in ROS production as the
electron transport chain readapts to oxygen availability. To
evaluate the role of ROS-mediated phosphorylation of FpSDH
in this adaptation, we cultured Fgr+/� and Fgr�/� fibroblasts
for 48 hr at 21% O2 (normoxia), 1% O2 (hypoxia), or 1% O2
followed by reoxygenation at 21% O2 for an additional 48 hr.
Immunostaining and western blot analysis indicated that
ROS-mediated mitochondrial biogenesis upon reoxygenation
was impaired in Fgr�/� cells, with only Fgr+/� cells recovering
normoxic mitochondrial numbers and shape (Figures 7A and
7B). In both genotypes, hypoxia reduced the amount of the
mitochondrial proteins Tom20 and FpSDH (Figure 7B), consis-
tent with the reported loss of mitochondria upon hypoxia (Kim
et al., 2011). In the FpSDH re-expression model, hypoxia
reduced mitochondrial content (measured as the FpSDH:actin
and Tom20:actin ratios) in FpSDH-silenced fibroblasts re-ex-
pressing WT or Y604F FpSDH. As predicted, reoxygenation
restored or increased mitochondrial protein content in cells
re-expressing WT FpSDH, and this recovery was impaired in
Y604F cells; however, Y604F cells did show partial mitochon-
drial recovery, differing from the more severe phenotype in
Fgr�/� fibroblasts (Figure 7B). The reason for this difference is
likely that germline lack of Fgr affects targets other than CII
required for full recovery.
To test the metabolic effect of reoxygenation, we measured
CII activity in Fgr+/� and Fgr�/� fibroblasts cultured with
25 mM glucose or the more physiological 10 mM. Hypoxia did
not alter CII activity under any conditions, and reoxygenation
increased CII activity only in Fgr+/� cells (Figures 7C and S5A).
Likewise, in re-expression assays only WT FpSDH fibroblasts
upregulated CII activity upon posthypoxia reoxygenation (Fig-
ures 7C and S5B). CII has been proposed to trigger apoptosis,
depending on its attachment to the inner mitochondrial mem-
brane (reviewed in Grimm, 2013). When detached, CII is not
assembled as a holocomplex, and its succinate ubiquinol reduc-
tase (SQR or CII) activity, which involves coenzyme Q reduction,
is decreased. However, succinate dehydrogenase (SDH) activity
is unaltered, resulting in superoxide leakage that leads to
apoptosis (Albayrak et al., 2003; Lemarie et al., 2011). SDH activ-
ity was slightly higher in Y604F-expressing cells in normoxia, but
the proportion of apoptotic cells (annexin V positive) was unaf-
fected. Upon reoxygenation, the balance between CII and SDH
activity in cells re-expressing WT FpSDH shifted toward CII,
whereas in cells re-expressing Y604F it shifted more toward
SDH (Figure 7D). This was reflected in significantly more severe
apoptosis after hypoxia/reoxygenation in Y604F-re-expressing
cells, in which CII activation is blunted, but not in cells re-ex-
pressing WT FpSDH (Figures 7D and S5C).
BNGE revealed a hypoxia-induced generalized decrease
in the content of assembled OXPHOS complexes and Tom20
(consistent with loss of mitochondrial proteins evident in Fig-
ure 7B), with no alteration in the proportion of CIII dedicated to
each coenzyme Q pool (Figure 7E). Posthypoxia reoxygenation
of WT re-expressing cells restored OXPHOS complexes and
supercomplex assembly while maintaining these proportions.
Metabolism 19, 1020–1033, June 3, 2014 ª2014 Elsevier Inc. 1027
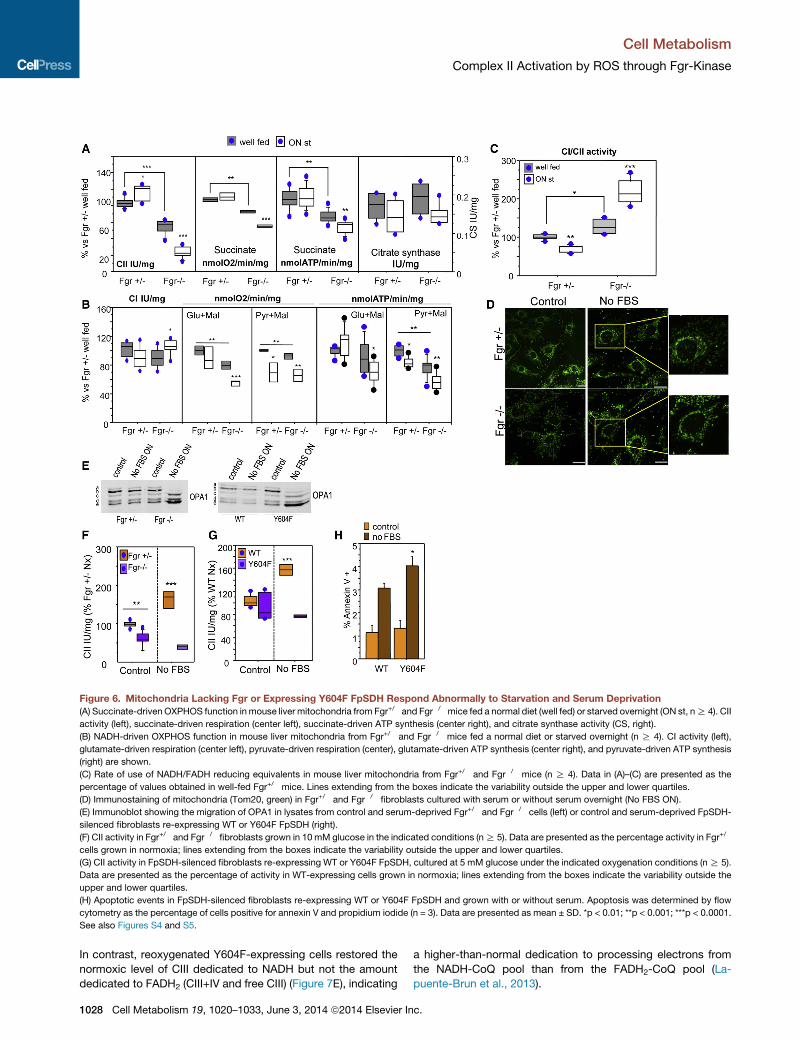
Figure 6. Mitochondria Lacking Fgr or Expressing Y604F FpSDH Respond Abnormally to Starvation and Serum Deprivation
(A) Succinate-driven OXPHOS function in mouse liver mitochondria from Fgr+/� and Fgr�/�mice fed a normal diet (well fed) or starved overnight (ON st, nR 4). CII
activity (left), succinate-driven respiration (center left), succinate-driven ATP synthesis (center right), and citrate synthase activity (CS, right).
(B) NADH-driven OXPHOS function in mouse liver mitochondria from Fgr+/� and Fgr�/� mice fed a normal diet or starved overnight (n R 4). CI activity (left),
glutamate-driven respiration (center left), pyruvate-driven respiration (center), glutamate-driven ATP synthesis (center right), and pyruvate-driven ATP synthesis
(right) are shown.
(C) Rate of use of NADH/FADH reducing equivalents in mouse liver mitochondria from Fgr+/� and Fgr�/� mice (n R 4). Data in (A)–(C) are presented as the
percentage of values obtained in well-fed Fgr+/� mice. Lines extending from the boxes indicate the variability outside the upper and lower quartiles.
(D) Immunostaining of mitochondria (Tom20, green) in Fgr+/� and Fgr�/� fibroblasts cultured with serum or without serum overnight (No FBS ON).
(E) Immunoblot showing the migration of OPA1 in lysates from control and serum-deprived Fgr+/� and Fgr�/� cells (left) or control and serum-deprived FpSDH-
silenced fibroblasts re-expressing WT or Y604F FpSDH (right).
(F) CII activity in Fgr+/� and Fgr�/� fibroblasts grown in 10 mM glucose in the indicated conditions (nR 5). Data are presented as the percentage activity in Fgr+/�
cells grown in normoxia; lines extending from the boxes indicate the variability outside the upper and lower quartiles.
(G) CII activity in FpSDH-silenced fibroblasts re-expressing WT or Y604F FpSDH, cultured at 5 mM glucose under the indicated oxygenation conditions (nR 5).
Data are presented as the percentage of activity in WT-expressing cells grown in normoxia; lines extending from the boxes indicate the variability outside the
upper and lower quartiles.
(H) Apoptotic events in FpSDH-silenced fibroblasts re-expressing WT or Y604F FpSDH and grown with or without serum. Apoptosis was determined by flow
cytometry as the percentage of cells positive for annexin V and propidium iodide (n = 3). Data are presented as mean ± SD. *p < 0.01; **p < 0.001; ***p < 0.0001.
See also Figures S4 and S5.
Cell Metabolism
Complex II Activation by ROS through Fgr-Kinase
In contrast, reoxygenated Y604F-expressing cells restored the
normoxic level of CIII dedicated to NADH but not the amount
dedicated to FADH2 (CIII+IV and free CIII) (Figure 7E), indicating
1028 Cell Metabolism 19, 1020–1033, June 3, 2014 ª2014 Elsevier In
a higher-than-normal dedication to processing electrons from
the NADH-CoQ pool than from the FADH2-CoQ pool (La-
puente-Brun et al., 2013).
c.

Figure 7. Mitochondria Lacking Fgr or Expressing Y604F FpSDH Respond Abnormally to Hypoxia-Reoxygenation
(A) Immunostaining of mitochondria (Tom20, green) in Fgr+/� and Fgr�/� fibroblasts cultured in normoxia (21% O2) or hypoxia (1% O2) for 48 hr followed by 48 hr
normoxia (Reoxy 48 hr).
(B) Left: Immunoblot analysis of Fgr+/� and Fgr�/� cells cultured under normoxia (Nx), hypoxia for 48 hr (Hyp 48 hr), or hypoxia followed by normoxia (Reoxy 48 hr).
Right: Immunoblot analysis of FpSDH-silenced fibroblasts re-expressing WT or Y604F FpSDH and cultured under the indicated oxygenation conditions.
Numbers beneath blots show FpSDH (Fp):actin and Tom20 (T20):actin ratios (n = 4).
(C) Top: CII activity in Fgr+/� and Fgr�/� fibroblasts grown in 10 mM glucose under the indicated conditions (n R 5). Bottom: FpSDH-silenced fibroblasts re-
expressingWT or Y604F FpSDH, cultured with 5mMglucose under the indicated oxygenation conditions (nR 5). Data are presented as the percentage activity in
Fgr+/� cells or WT-FpSDH-re-expressing cells grown in normoxia; lines extending from the boxes indicate the variability outside the upper and lower quartiles.
(D) Top: Relative activities of CII (CoQ reduction) and SDH in WT- and Y604F-re-expressing FpSDH-silenced cells grown in normoxia or through a hypoxia/
reoxygenation cycle. For each cell line and condition, 100% = the sum of CII and SDH activities; absolute SDH activity did not differ between cell lines and
conditions. Bottom: Apoptotic events in FpSDH-silenced fibroblasts re-expressing WT or Y604F FpSDH and grown in normoxia or through a hypoxia/reox-
ygenation cycle. Apoptosis was determined by flow cytometry as the percentage of annexin V- and PI-positive cells (n = 3). Data are presented as mean ± SD.
(E) BNGE of FpSDH-silenced fibroblasts re-expressing WT or Y604F FpSDH cultured at 5 mM glucose under the indicated oxygenation conditions; the blot
reveals the distribution of CIII (anti-core 1 immunodetection) among the different forms of free complex and supercomplexes. The outermembrane protein Tom20
is used as a mitochondrial protein loading control. Upper and lower panels are taken from two independent experiments. Note that upon reoxygenation the
amount of CIII super assembled with CI is abnormally elevated in the Y604F mutant. See also Figure S5.
Cell Metabolism
Complex II Activation by ROS through Fgr-Kinase
DISCUSSION
The data presented here demonstrate that Tyr phosphorylation
of FpSDH increases CII activity in vivo, and that this mechanism
triggers remodeling of the mETC to reset its capacity for pro-
Cell
cessing NADH- versus FADH2-derived electrons. This Tyr phos-
phorylation is H2O2 mediated, is catalyzed by the Src-family
kinase Fgr, and specifically targets Y604 in FpSDH. The finding
that the catalytic subunit of CII can be phosphorylated is consis-
tent with earlier observations (Bykova et al., 2003; Schulenberg
Metabolism 19, 1020–1033, June 3, 2014 ª2014 Elsevier Inc. 1029

Cell Metabolism
Complex II Activation by ROS through Fgr-Kinase
et al., 2003). Moreover, our proposal that Fgr is the tyrosine
kinase responsible for this phosphorylation concurs with a previ-
ous report demonstrating that Fgr, but not Lyn, is able to pro-
mote the in vitro phosphorylation of Y535 and Y596 of rat
FpSDH, which correspond to Y543 and Y604 in mouse (Salvi
et al., 2007).
H2O2-triggered activation of CII provides a mechanism for the
association of increased CII activity and defective CI, observed
in human patients and in a range of organisms from Chlamydo-
monas reinhardtii (Cardol et al., 2002) and Rhodobacter capsula-
tus (Dupuis et al., 1998) to mouse and humans (Esteitie et al.,
2005; Fan et al., 2008; Majander et al., 1991). Another feature
of ROS-driven activation of CII is that since hydrogen peroxide
can permeate through cell membranes, any extramitochondrial
source of H2O2 can potentially activate CII, suggesting a mech-
anism to promote metabolic adaptation in response to signals
that increase H2O2. Our results thus show that activation of CII
by Fgr kinase in response to a primary wave of extramitochon-
drial ROS can trigger a secondary wave of ROS production as
a consequence of CII activation. This pathway provides a mech-
anism for amplifying ROS signals within the cell. The increase in
CII activity triggered by H2O2 is a quick response mechanism,
independent of gene expression and therefore not involving
any increase in mitochondrial biogenesis or regulation through
PGC-1a, a common feature of mitochondrial disease (Moreno-
Loshuertos et al., 2006; Acın-Perez et al., 2009; Srivastava
et al., 2009; Wenz et al., 2008).
FpSDH activity is regulated by acetylation on several lysine
residues, and deacetylation mediated by sirtuin 3 (Cimen
et al., 2010; Finley et al., 2011) increases CII activity indepen-
dently of ROS. The regulation of CII acetylation is incompletely
understood, but fuel availability is likely to play a part, probably
in a complex tissue-specific pattern (Boyle et al., 2013; Finley
et al., 2011). The convergence of multiple posttranslational
modifications on the catalytic subunit of CII highlights the impor-
tance of fine-tuning CII activity to ensure correct cell meta-
bolism. This role has remained unappreciated despite the
considerable knowledge accumulated on the function of the
tricarboxylic acid (TCA) cycle. Two other TCA cycle enzymes,
aconitase and KGDH, are known to be reversibly downregulated
by physiological increases in ROS levels (Bulteau et al., 2003;
Moreno-Loshuertos et al., 2006). Our current results show that
CII should be included among the TCA cycle enzymes regulated
by ROS.
Our results also show that Src-family kinase signaling oper-
ates within mitochondria, regulating the fundamental metabolic
processes of the TCA cycle and oxidative phosphorylation.
SFKs are implicated in a wide variety of signaling pathways,
regulating cell growth, differentiation, cell shape, migration,
and survival (Ingley, 2008; Parsons and Parsons, 2004). More-
over, the physiological role of SFK activation by H2O2 has also
been shown in another model system: the role of Lyn kinase
as a redox sensor activated by H2O2 in leukocyte wound attrac-
tion (Yoo et al., 2011). The role of reversible protein phosphory-
lation in mitochondria is an emerging field (Pagliarini and Dixon,
2006; Pagliarini et al., 2005), and several mitochondrial proteins
have been proposed as Tyr phosphorylation targets (Augereau
et al., 2005; Salvi et al., 2005, 2007; Tibaldi et al., 2008). More-
over, a number of SFKs have been proposed to localize in mito-
1030 Cell Metabolism 19, 1020–1033, June 3, 2014 ª2014 Elsevier In
chondria (Pagliarini and Dixon, 2006; Tibaldi et al., 2008). One
previous report has described the function of a mitochondrial
SFK, demonstrating that c-Src enhances the activity of subunit
II of cytochrome c oxidase, the terminal mETC enzyme (Miya-
zaki et al., 2003). Thus the TCA cycle and the mETC are both
positively regulated by the action of SFKs: Fgr for the TCA cycle
and c-Src for the mETC. By bringing the regulation of mitochon-
drial energetic metabolism within the remit of cellular signaling
pathways regulated by SFKs, these findings have broad impli-
cations for the integration of cell adaptation and energy regula-
tion. The results presented here highlight the importance of
this regulation in the adaptation to loss of CI, regulation of CII
activity during the metabolic switch upon activation of naive
T cells, and metabolic adaptation of mitochondria to starvation
and hypoxia/reoxygenation. CII has also been proposed to act
as universal oxygen sensor (Baysal, 2006), suggesting that
this pathway is also critically important in situations where cells
need to respond rapidly to changes in fuel availability or O2
concentration.
EXPERIMENTAL PROCEDURES
Further details of methods are provided in Supplemental Experimental
Procedures.
Cell Culture
Cell lines were grown in Dulbecco’s modified Eagle’s medium (DMEM;
GIBCOBRL) supplemented with 5% fetal bovine serum (FBS; GIBCOBRL).
Fibroblasts from Fgr+/� and Fgr null mice were isolated from mouse ear and
immortalized by transfection with pLOX-Ttag-iresTK (Addgene) and grown in
DMEM with 10% FBS. FBalb/cJ and FG23-1 cells expressing MnSOD or
HA-tagged mt-catalase and FBalb/cJ cells overexpressing different forms
of FpSDH and silenced for the endogenous FpSDH were generated by viral
infection using polybrene (8 mg/ml).
Isolation of Mitochondria and Mitochondrial Fractions from Mouse
Liver and Cell Lines
Mitochondria were isolated from cell lines as described (Schagger and von
Jagow, 1991) with some modifications, and from mouse liver as described
(Fernandez-Vizarra et al., 2002).
OXPHOS Function and Enzyme Activities
O2 consumption was measured in mouse liver mitochondria (100 mg) as
described (Hofhaus et al., 1996). ATP synthesis in isolated mitochondria (15–
25 mg mitochondrial protein) was measured using a kinetic luminescence
assay (Vives-Bauza et al., 2007). Mitochondrial fractions were prepared and
the activities of individual complexes measured spectrophotometrically
(Birch-Machin and Turnbull, 2001). Catalase activity was measured in total
cell lysates (300 mg) (Moreno-Loshuertos et al., 2006). Total SOD and MnSOD
(KCN insensitive) activities were assessed in total cell lysates (50 mg) using the
SOD Assay Kit (Sigma-Aldrich).
Blue-Native Gel Electrophoresis
Cell-culture-derived mitochondria (50–75 mg) were separated on 5%–13%
gradient blue native gels (Schagger and von Jagow, 1991).
Isoelectric Focusing and 2D SDS-PAGE
Mitochondrial preparations (100 mg) were processed with by Ready Prep 2D
Cleanup (BioRad) and applied to pH 3–10 or pH 4–7 IPG strips (BioRad) and
incubated overnight at room temperature. Isoelectric focusing and second
dimension SDS-PAGE were run under standard conditions.
Phoshoprotein Enrichment
Phosphoprotein-enriched mitochondrial fractions were isolated on phospho-
protein enrichment columns (QIAGEN).
c.
Cell Metabolism
Complex II Activation by ROS through Fgr-Kinase
Immunocapture
Complex II and FpSDH were immunocaptured from mitochondria isolated
from either cells or mouse liver. For details see Supplemental Experimental
Procedures.
In Vitro Fgr Phosphorylation
Recombinant Fgr kinase (Abnova) was used to phosphorylate complex II im-
munocaptured from cells expressingWT and Y604F FpSDH (Salvi et al., 2007).
Immunological Analysis
Antibodies used in this study are listed in Supplemental Experimental
Procedures.
H2O2 Production
H2O2 production wasmeasured in cultured cells grown in the absence or pres-
ence of 5 mM NAC for 7 days (Moreno-Loshuertos et al., 2006).
Isolation and Stimulation of Naive CD4+ and CD8+ T Cells
CD4+ and CD8+ T cells were purified from splenic cell suspensions obtained
from 8- to 10-week-old Fgr+/� and Fgr�/� male mice. To obtain differentiated
T lymphoblasts, naive T cells were cultured with concanavalin A (Sigma) and
human recombinant IL-2 (50 U/ml, Glaxo).
Flow Cytometry ROS Production Determination
ROS production in naive or activated T lymphocytes and in cells before and
after overexpression of detoxifying enzymes was assessed by flow cytometry
of 2,7-DCFH2-DA or MitoSOX staining (Kami�nski et al., 2012).
Determination of Apoptosis in Cultured Cells
Apoptosis was monitored by flow cytometry detection of annexin V and propi-
dium iodide (PI) staining in 106 cells resuspended in 10 mM HEPES/NaOH
(pH 7.4), 140 mM NaCl, 2.5 mM CaCl2.
Mouse Strains
Animal studies were approved by the local ethics committee. Analyses were
performed in 8- to 11-week-old male mice.
In Silico Analysis
See Supplemental Experimental Procedures.
Statistical Analysis
Comparisons between groups were made by one-way ANOVA. Pairwise com-
parisons were made by Fisher’s PLSD post hoc test. Differences were consid-
ered statistically significant at p < 0.05. Data were analyzed with StatView
(Adept Scientific, UK).
SUPPLEMENTAL INFORMATION
Supplemental Information includes five figures and Supplemental Experi-
mental Procedures and can be found with this article online at http://dx.doi.
org/10.1016/j.cmet.2014.04.015.
ACKNOWLEDGMENTS
We thank Dr. Concepcion Jimenez and Andres Gonzalez-Guerra for technical
assistance, Anatoly A. Starkov for a valuable discussion, and Dr. Simon Bar-
tlett (CNIC) for English editing. This study was supported by grants from the
Ministerio de Economıa y Competitividad (SAF2012-1207 and CSD2007-
00020), the Comunidad de Madrid (CAM/API1009), and the EU (UE0/
MCA1108 and UE0/MCA1201). R.A.-P. is recipient of a Ramon y Cajal con-
tract. The CNIC is supported by the Ministerio de Economıa y Competitividad
and the Pro-CNIC Foundation.
Received: November 26, 2013
Revised: February 13, 2014
Accepted: April 3, 2014
Published: May 22, 2014
Cell
REFERENCES
Acın-Perez, R., Bayona-Bafaluy, M.P., Bueno, M., Machicado, C., Fernandez-
Silva, P., Perez-Martos, A., Montoya, J., Lopez-Perez, M.J., Sancho, J., and
Enrıquez, J.A. (2003). An intragenic suppressor in the cytochrome c oxidase
I gene of mouse mitochondrial DNA. Hum. Mol. Genet. 12, 329–339.
Acın-Perez, R., Salazar, E., Brosel, S., Yang, H., Schon, E.A., and Manfredi, G.
(2009). Modulation of mitochondrial protein phosphorylation by soluble ad-
enylyl cyclase ameliorates cytochrome oxidase defects. EMBO Mol Med 1,
392–406.
Albayrak, T., Scherhammer, V., Schoenfeld, N., Braziulis, E., Mund, T., Bauer,
M.K.A., Scheffler, I.E., and Grimm, S. (2003). The tumor suppressor cybL, a
component of the respiratory chain, mediates apoptosis induction. Mol. Biol.
Cell 14, 3082–3096.
Ali, S.S., Hsiao, M., Zhao, H.W., Dugan, L.L., Haddad, G.G., and Zhou, D.
(2012). Hypoxia-adaptation involves mitochondrial metabolic depression
and decreased ROS leakage. PLoS ONE 7, e36801.
Augereau, O., Claverol, S., Boudes, N., Basurko, M.-J., Bonneu, M.,
Rossignol, R., Mazat, J.-P., Letellier, T., and Dachary-Prigent, J. (2005).
Identification of tyrosine-phosphorylated proteins of the mitochondrial oxida-
tive phosphorylation machinery. Cell. Mol. Life Sci. 62, 1478–1488.
Bai, Y., and Attardi, G. (1998). The mtDNA-encoded ND6 subunit of mitochon-
drial NADH dehydrogenase is essential for the assembly of the membrane arm
and the respiratory function of the enzyme. EMBO J. 17, 4848–4858.
Balamurugan, K., Rajaram, R., Ramasami, T., and Narayanan, S. (2002).
Chromium(III)-induced apoptosis of lymphocytes: death decision by ROS
and Src-family tyrosine kinases. Free Radic. Biol. Med. 33, 1622–1640.
Baysal, B.E. (2006). A phenotypic perspective on Mammalian oxygen sensor
candidates. Ann. N Y Acad. Sci. 1073, 221–233.
Birch-Machin, M.A., and Turnbull, D.M. (2001). Assaying mitochondrial respi-
ratory complex activity in mitochondria isolated from human cells and tissues.
Methods Cell Biol. 65, 97–117.
Boyle, K.E., Newsom, S.A., Janssen, R.C., Lappas, M., and Friedman, J.E.
(2013). Skeletal muscle MnSOD, mitochondrial complex II, and SIRT3 enzyme
activities are decreased in maternal obesity during human pregnancy and
gestational diabetes mellitus. J. Clin. Endocrinol. Metab. 98, E1601–E1609.
Bulteau, A.-L., Ikeda-Saito, M., and Szweda, L.I. (2003). Redox-dependent
modulation of aconitase activity in intact mitochondria. Biochemistry 42,
14846–14855.
Bykova, N.V., Egsgaard, H., and Møller, I.M. (2003). Identification of 14 new
phosphoproteins involved in important plant mitochondrial processes. FEBS
Lett. 540, 141–146.
Cardol, P., Matagne, R.F., and Remacle, C. (2002). Impact of mutations
affecting ND mitochondria-encoded subunits on the activity and assembly
of complex I in Chlamydomonas. Implication for the structural organization
of the enzyme. J. Mol. Biol. 319, 1211–1221.
Cascarano, J., Ades, I.Z., and O’Conner, J.D. (1976). Hypoxia: a succinate-
fumerate electron shuttle between peripheral cells and lung. J. Exp. Zool.
198, 149–153.
Chiarugi, P. (2008). Src redox regulation: there is more than meets the eye.
Mol. Cells 26, 329–337.
Cimen, H., Han, M.-J., Yang, Y., Tong, Q., Koc, H., and Koc, E.C. (2010).
Regulation of succinate dehydrogenase activity by SIRT3 in mammalian mito-
chondria. Biochemistry 49, 304–311.
Cogliati, S., Frezza, C., Soriano, M.E., Varanita, T., Quintana-Cabrera, R.,
Corrado, M., Cipolat, S., Costa, V., Casarin, A., Gomes, L.C., et al. (2013).
Mitochondrial cristae shape determines respiratory chain supercomplexes
assembly and respiratory efficiency. Cell 155, 160–171.
Dlaskova, A., Hlavata, L., and Je�zek, P. (2008). Oxidative stress caused by
blocking of mitochondrial complex I H(+) pumping as a link in aging/disease
vicious cycle. Int. J. Biochem. Cell Biol. 40, 1792–1805.
Droge, W. (2002). Free radicals in the physiological control of cell function.
Physiol. Rev. 82, 47–95.
Metabolism 19, 1020–1033, June 3, 2014 ª2014 Elsevier Inc. 1031
Cell Metabolism
Complex II Activation by ROS through Fgr-Kinase
Dupuis, A., Chevallet, M., Darrouzet, E., Duborjal, H., Lunardi, J., and Issartel,
J.P. (1998). The complex I from Rhodobacter capsulatus. Biochim. Biophys.
Acta 1364, 147–165.
Esteitie, N., Hinttala, R., Wibom, R., Nilsson, H., Hance, N., Naess, K., Tear-
Fahnehjelm, K., von Dobeln, U., Majamaa, K., and Larsson, N.-G. (2005).
Secondary metabolic effects in complex I deficiency. Ann. Neurol. 58,
544–552.
Fan, W., Waymire, K.G., Narula, N., Li, P., Rocher, C., Coskun, P.E., Vannan,
M.A., Narula, J., Macgregor, G.R., and Wallace, D.C. (2008). A mouse model
of mitochondrial disease reveals germline selection against severe mtDNA
mutations. Science 319, 958–962.
Fernandez-Vizarra, E., Lopez-Perez, M.J., and Enriquez, J.A. (2002). Isolation
of biogenetically competent mitochondria from mammalian tissues and
cultured cells. Methods 26, 292–297.
Finley, L.W.S., Haas, W., Desquiret-Dumas, V., Wallace, D.C., Procaccio, V.,
Gygi, S.P., and Haigis, M.C. (2011). Succinate dehydrogenase is a direct target
of sirtuin 3 deacetylase activity. PLoS ONE 6, e23295.
Gomes, L.C., Di Benedetto, G., and Scorrano, L. (2011). During autophagy
mitochondria elongate, are spared from degradation and sustain cell viability.
Nat. Cell Biol. 13, 589–598.
Grimm, S. (2013). Respiratory chain complex II as general sensor for
apoptosis. Biochim. Biophys. Acta 1827, 565–572.
Hamanaka, R.B., and Chandel, N.S. (2010). Mitochondrial reactive oxygen
species regulate cellular signaling and dictate biological outcomes. Trends
Biochem. Sci. 35, 505–513.
Heather, L.C., Cole, M.A., Tan, J.-J., Ambrose, L.J.A., Pope, S., Abd-Jamil,
A.H., Carter, E.E., Dodd, M.S., Yeoh, K.K., Schofield, C.J., and Clarke, K.
(2012). Metabolic adaptation to chronic hypoxia in cardiac mitochondria.
Basic Res. Cardiol. 107, 268.
Hofhaus, G., Shakeley, R.M., and Attardi, G. (1996). Use of polarography to
detect respiration defects in cell cultures. Methods Enzymol. 264, 476–483.
Huang, B., Wu, P., Popov, K.M., and Harris, R.A. (2003). Starvation and dia-
betes reduce the amount of pyruvate dehydrogenase phosphatase in rat heart
and kidney. Diabetes 52, 1371–1376.
Ingley, E. (2008). Src family kinases: regulation of their activities, levels and
identification of new pathways. Biochim. Biophys. Acta 1784, 56–65.
Kami�nski, M.M., Sauer, S.W., Klemke, C.-D., Suss, D., Okun, J.G., Krammer,
P.H., and Gulow, K. (2010). Mitochondrial reactive oxygen species control
T cell activation by regulating IL-2 and IL-4 expression: mechanism of cipro-
floxacin-mediated immunosuppression. J. Immunol. 184, 4827–4841.
Kami�nski, M.M., Sauer, S.W., Kami�nski, M., Opp, S., Ruppert, T.,
Grigaravi�cius, P., Grudnik, P., Grone, H.-J., Krammer, P.H., and Gulow, K.
(2012). T cell activation is driven by an ADP-dependent glucokinase linking
enhanced glycolysis with mitochondrial reactive oxygen species generation.
Cell Rep 2, 1300–1315.
Kim, H., Scimia, M.C., Wilkinson, D., Trelles, R.D., Wood, M.R., Bowtell, D.,
Dillin, A., Mercola, M., and Ronai, Z.A. (2011). Fine-tuning of Drp1/Fis1 avail-
ability by AKAP121/Siah2 regulates mitochondrial adaptation to hypoxia.
Mol. Cell 44, 532–544.
Kruse, S.E., Watt, W.C., Marcinek, D.J., Kapur, R.P., Schenkman, K.A., and
Palmiter, R.D. (2008). Mice with mitochondrial complex I deficiency develop
a fatal encephalomyopathy. Cell Metab. 7, 312–320.
Lapuente-Brun, E., Moreno-Loshuertos, R., Acın-Perez, R., Latorre-Pellicer,
A., Colas, C., Balsa, E., Perales-Clemente, E., Quiros, P.M., Calvo, E.,
Rodrıguez-Hernandez, M.A., et al. (2013). Supercomplex assembly deter-
mines electron flux in the mitochondrial electron transport chain. Science
340, 1567–1570.
Lemarie, A., Huc, L., Pazarentzos, E., Mahul-Mellier, A.-L., and Grimm, S.
(2011). Specific disintegration of complex II succinate:ubiquinone oxidoreduc-
tase links pH changes to oxidative stress for apoptosis induction. Cell Death
Differ. 18, 338–349.
Lowell, C.A., Soriano, P., and Varmus, H.E. (1994). Functional overlap in the src
gene family: inactivation of hck and fgr impairs natural immunity. Genes Dev. 8,
387–398.
1032 Cell Metabolism 19, 1020–1033, June 3, 2014 ª2014 Elsevier In
Majander, A., Huoponen, K., Savontaus, M.L., Nikoskelainen, E., and
Wikstrom, M. (1991). Electron transfer properties of NADH:ubiquinone reduc-
tase in the ND1/3460 and the ND4/11778 mutations of the Leber hereditary
optic neuroretinopathy (LHON). FEBS Lett. 292, 289–292.
Minetti, M., Mallozzi, C., and Di Stasi, A.M.M. (2002). Peroxynitrite activates
kinases of the src family and upregulates tyrosine phosphorylation signaling.
Free Radic. Biol. Med. 33, 744–754.
Miyazaki, T., Neff, L., Tanaka, S., Horne, W.C., and Baron, R. (2003).
Regulation of cytochrome c oxidase activity by c-Src in osteoclasts. J. Cell
Biol. 160, 709–718.
Moreno-Loshuertos, R., Acın-Perez, R., Fernandez-Silva, P., Movilla, N.,
Perez-Martos, A., Rodriguez de Cordoba, S.R., Gallardo, M.E., and
Enrıquez, J.A. (2006). Differences in reactive oxygen species production
explain the phenotypes associated with common mouse mitochondrial DNA
variants. Nat. Genet. 38, 1261–1268.
Nagy, G., Koncz, A., and Perl, A. (2003). T cell activation-induced mitochon-
drial hyperpolarization is mediated by Ca2+- and redox-dependent production
of nitric oxide. J. Immunol. 171, 5188–5197.
Pagliarini, D.J., and Dixon, J.E. (2006). Mitochondrial modulation: reversible
phosphorylation takes center stage? Trends Biochem. Sci. 31, 26–34.
Pagliarini, D.J., Wiley, S.E., Kimple, M.E., Dixon, J.R., Kelly, P., Worby, C.A.,
Casey, P.J., and Dixon, J.E. (2005). Involvement of a mitochondrial phospha-
tase in the regulation of ATP production and insulin secretion in pancreatic
beta cells. Mol. Cell 19, 197–207.
Papandreou, I., Cairns, R.A., Fontana, L., Lim, A.L., and Denko, N.C. (2006).
HIF-1 mediates adaptation to hypoxia by actively downregulating mitochon-
drial oxygen consumption. Cell Metab. 3, 187–197.
Parsons, S.J., and Parsons, J.T. (2004). Src family kinases, key regulators of
signal transduction. Oncogene 23, 7906–7909.
Pitkanen, S., and Robinson, B.H. (1996). Mitochondrial complex I deficiency
leads to increased production of superoxide radicals and induction of super-
oxide dismutase. J. Clin. Invest. 98, 345–351.
Quiros, P.M., Ramsay, A.J., Sala, D., Fernandez-Vizarra, E., Rodrıguez, F.,
Peinado, J.R., Fernandez-Garcıa, M.S., Vega, J.A., Enrıquez, J.A., Zorzano,
A., and Lopez-Otın, C. (2012). Loss of mitochondrial protease OMA1 alters
processing of the GTPase OPA1 and causes obesity and defective thermo-
genesis in mice. EMBO J. 31, 2117–2133.
Radad, K., Rausch, W.-D., and Gille, G. (2006). Rotenone induces cell death in
primary dopaminergic culture by increasing ROS production and inhibiting
mitochondrial respiration. Neurochem. Int. 49, 379–386.
Robinson, B.H. (1998). Human complex I deficiency: clinical spectrum
and involvement of oxygen free radicals in the pathogenicity of the defect.
Biochim. Biophys. Acta 1364, 271–286.
Salvi, M., Brunati, A.M., and Toninello, A. (2005). Tyrosine phosphorylation
in mitochondria: a new frontier in mitochondrial signaling. Free Radic. Biol.
Med. 38, 1267–1277.
Salvi, M., Morrice, N.A., Brunati, A.M., and Toninello, A. (2007). Identification
of the flavoprotein of succinate dehydrogenase and aconitase as in vitro
mitochondrial substrates of Fgr tyrosine kinase. FEBS Lett. 581, 5579–5585.
Schagger, H., and von Jagow, G. (1991). Blue native electrophoresis for
isolation of membrane protein complexes in enzymatically active form. Anal.
Biochem. 199, 223–231.
Schulenberg, B., Aggeler, R., Beechem, J.M., Capaldi, R.A., and Patton,
W.F. (2003). Analysis of steady-state protein phosphorylation in mitochondria
using a novel fluorescent phosphosensor dye. J. Biol. Chem. 278, 27251–
27255.
Speijer, D. (2011). Oxygen radicals shaping evolution: why fatty acid catabo-
lism leads to peroxisomeswhile neurons dowithout it: FADH2/NADH flux ratios
determining mitochondrial radical formation were crucial for the eukaryotic
invention of peroxisomes and catabolic tissue differentiation. Bioessays 33,
88–94.
Srivastava, S., Diaz, F., Iommarini, L., Aure, K., Lombes, A., and Moraes, C.T.
(2009). PGC-1alpha/beta induced expression partially compensates for
c.
Cell Metabolism
Complex II Activation by ROS through Fgr-Kinase
respiratory chain defects in cells from patients with mitochondrial disorders.
Hum. Mol. Genet. 18, 1805–1812.
Stanley, I.A., Ribeiro, S.M., Gimenez-Cassina, A., Norberg, E., andDanial, N.N.
(2013). Changing appetites: the adaptive advantages of fuel choice. Trends
Cell Biol. 24, 118–127.
Ten, V.S., and Starkov, A. (2012). Hypoxic-ischemic injury in the developing
brain: the role of reactive oxygen species originating in mitochondria.
Neurol. Res. Int. 2012, 542976.
Tibaldi, E., Brunati, A.M., Massimino, M.L., Stringaro, A., Colone, M.,
Agostinelli, E., Arancia, G., and Toninello, A. (2008). Src-Tyrosine kinases are
Cell
major agents in mitochondrial tyrosine phosphorylation. J. Cell. Biochem.
104, 840–849.
Vives-Bauza, C., Yang, L., and Manfredi, G. (2007). Assay of mitochondrial
ATP synthesis in animal cells and tissues. Methods Cell Biol. 80, 155–171.
Wenz, T., Diaz, F., Spiegelman, B.M., and Moraes, C.T. (2008). Activation of
the PPAR/PGC-1alpha pathway prevents a bioenergetic deficit and effectively
improves a mitochondrial myopathy phenotype. Cell Metab. 8, 249–256.
Yoo, S.K., Starnes, T.W., Deng, Q., and Huttenlocher, A. (2011). Lyn is a redox
sensor that mediates leukocyte wound attraction in vivo. Nature 480,
109–112.
Metabolism 19, 1020–1033, June 3, 2014 ª2014 Elsevier Inc. 1033
Related Documents


