( RIDGE NATIONAL LABORATORY LIBRARIES ORNL/TM-6669 3 445b DS7D3fi4 5 Room-Temperature Elastic-Plastic Tests of Plate-Weldment Specimens T. J. Delph R. L. Battiste M. Richardson

Welcome message from author
This document is posted to help you gain knowledge. Please leave a comment to let me know what you think about it! Share it to your friends and learn new things together.
Transcript

( RIDGE NATIONAL LABORATORY LIBRARIES
ORNL/TM-6669
3 445b DS7D3fi4 5
Room-Temperature Elastic-Plastic Testsof Plate-Weldment Specimens
T. J. DelphR. L. Battiste
M. Richardson

Printed in the United States of America. Available fromthe Department of Energy,
Technical Information Center
P.O. Box 62, Oak Ridge, Tennessee 37830Price: Printed Copy $6.00; Microfiche $3.00
This report was prepared as an account of work sponsored by an agency of the UnitedStates Government. Neither the United States Government nor any agency thereof, norany of their employees, contractors, subcontractors, or their employees, makes anywarranty, express or implied, nor assumes any legal liability or responsibility for anythird party's use or the results of such use of any information, apparatus, product orprocess disclosed in this report, nor represents that its use by such third party wouldnot infringe privately owned rights.

Contract No. W-7405-eng-26
Engineering Technology Division
ORNL/TM-6669Dist. Category UC-79,-79h, -79k
ROOM-TEMPERATURE ELASTIC-PLASTIC TESTS OFPLATE-WELDMENT SPECIMENS
T. J. DelphR. L. Battiste
M. Richardson
Date Published: August 1979
NOTICE This document contains information of a preliminary nature.It is subject to revision or correction and therefore does not represent afinal report.
Prepared by theOAK RIDGE NATIONAL LABORATORY
Oak Ridge, Tennessee 37830operated by
UNION CARBIDE CORPORATION
for the
DEPARTMENT OF ENERGY


Ill
CONTENTS
Page
ABSTRACT 1
1. INTRODUCTION 1
2. EXPERIMENTAL DEFORMATION TESTS 4
3. RESIDUAL STRESS MEASUREMENTS 15
4. ANALYSIS 22
5. RESULTS 30
5.1 Tests W-l and W-2 30
5.2 Test W-3 43
6. DISCUSSION AND CONCLUSIONS 56
ACKNOWLEDGMENTS 64
REFERENCES 65
ROOM-TEMPERATURE ELASTIC-PLASTIC TESTS OF
PLATE-WELDMENT SPECIMENS*
T. J. Delph+R. L. Battiste
M. Richardson
ABSTRACT
Room-temperature strain measurements were performed onthree welded plates under elastic-plastic loading conditions.The plate specimens were fabricated from type 304 stainlesssteel base metal and were welded transversely with type 308stainless-steel-controlled residual element weld metal. Two
of the specimens contained welds in the annealed condition,while the third contained a weld in the as-deposited condition. Residual stress measurements were made on similar
specimens using the hole-drilling technique. Concurrent elastic-plastic finite-element analyses of all three tests wereconducted. The analytically predicted strains showed fairagreement with experimentally measured values in the case ofthe two annealed weld specimens. However, the agreement inthe case of the as-deposited weld specimen was considerablypoorer. The measured residual stress fields were includedin the finite-element analyses of two of the tests, but theresults showed poorer agreement with experiment than did theanalyses in which residual stress effects were ignored.
Key words: Welds, weldments, CRE, residual stress,inelastic analysis, strain measurement, finite-element,hole-drilling technique.
1. INTRODUCTION
Experience has shown that a significant percentage of failures in
pressure vessel and piping systems occurs in and around welded joints.
However, due to their many complexities, the deformation and failure
behaviors of weldments are considerably less well understood than the
behavior of all-base metal structures. These complexities are of a
*Work performed under DOE/RRT 189a OH048, High-Temperature Structural Design.
+Presently employed at Lehigh University, Bethlehem, PA.

formidable nature. They are, to a considerable extent, due to the large
heat inputs and high temperatures required by the welding processes.
These large heat inputs result in the formation of a heat-affected zone
(HAZ) in the base metal immediately adjacent to the weld. The metallur
gical structure and material properties in this area are known to differ
significantly from those in the weld and in the unaffected base metal.
Additionally, the resulting thermal stresses usually exceed the yield
stress for the material. Thus, when the weld is cooled, a residual stress
field with a magnitude on the order of the yield stress may exist. In
thick, multipass welds, the addition of molten weld metal over previously
cooled passes often has an annealing effect on the previous passes, so
that significant variations in material properties may occur through the
thickness of the weld. Other complicating factors are anisotropic weld
metal properties resulting from the existence of preferential solidifica
tion directions and differing material properties between deposited weld
and base metals.
It is obviously not practicable to account for all these factors in
analyzing the behavior of welded joints. Some, however, are more impor
tant than others and probably must be considered in any realistic analy
sis. In the present study, we have investigated the influence of two of
these factors upon the elastic-plastic deformation of a welded joint —
differing weld and base metal material properties, and the presence of a
residual stress field. Specifically, we measured experimentally the
room-temperature deformation field in the neighborhood of a transversely
welded joint in a long, narrow plate under monotonic loading conditions.
Residual stress measurements were made in similar companion specimens by
means of the hole-drilling technique. Elastic-plastic finite-element
analyses of the specimens were then conducted to investigate the effects
of differing weld metal properties and the presence of a residual stress
field upon the predicted deformation field. Comparisons between analyti
cal predictions and experimental data were then made to assess the im
portance of these factors.
The results of this study lay the foundation for future investiga
tions into the deformation and failure behavior of welded joints at ele
vated temperatures where the situation is even more complicated. It is

expected, however, that many of the conclusions drawn in this study of
room-temperature behavior will also prove to be valid at higher tempera
tures.

2. EXPERIMENTAL DEFORMATION TESTS
The specimens for the experimental phase of this study were fabri
cated from 304 stainless steel plate of the ORNL reference heat (9T2796)
and contained a butt-weld on the transverse center line of the plate.
The specimens were approximately 7.6 cm (3 in.) wide, 46 cm (18 in.)
long, and 0.63 cm (0.25 in.) thick. Figure 1 shows a sketch of the speci
men configuration.
The filler metal used was 308 stainless-steel-controlled residual
element (CRE) weld metal.1 This type of weld metal was selected rather
than standard 308 stainless steel weld metal because its material prop
erties have been relatively well characterized in earlier studies at ORNL.
The weld joint was of double-V geometry, tapering from about 0.75 cm
(0.3 in.) wide at the surface to about 0.25 cm (0.1 in.) at the root.
For the first two specimens, designated W-l and W-2, the welds were
deposited in 1.3-cm-thick (0.50-in.) plate by the shielded metal arc
method according to ORNL Welding Procedure Specification (WPS) 301 using
308 CRE stainless-steel-coated stick electrodes. In order to maintain
better dimensional control of the specimens, the welded plates were then
machined to slightly over finished dimensions, given the ORNL reference
solution anneal,* and then machined to final dimensions. The welds in
the W-l and W-2 specimens were thus in the annealed condition.
The final specimen, designated W-3, was welded using the gas-tungsten
arc method and 308 CRE stainless steel wire electrode according to ORNL
WPS 302. The gas-tungsten arc method was used for this specimen and a
companion hole-drilling specimen because of difficulties experienced in
welding previous specimens using the shielded metal arc technique. Spe-
ficially, the diameter of the welding electrodes was too great to allow
efficient weld deposition. Thus, we switched to a smaller diameter wire
electrode available for use with the gas-tungsten arc method. Both
halves of this specimen were machined to slightly greater than finished
dimensions prior to welding, were annealed, and then were welded. After
*30 min in argon at 1092°C (2000°F), then cooled to room temperatureat 100°C/min (180°F/min).

ORNL -DWG 79-7759
Fig. 1. Plate-weldment specimen for tests W-l, W-2, and W-3.

welding, the specimen was machined to final dimensions, leaving the weld
in this specimen in the as-deposited condition. In all three specimens,
the weld bead was removed in order to leave a flat surface on both sides
of the specimen.
Prior to loading, the specimens were bolted into heavy end-plate
fixtures which were then attached, through two load cells, to the load
ing frame. The loading frame used in these experiments was developed by
the Boeing Company under ORNL subcontract for an earlier series of shear-
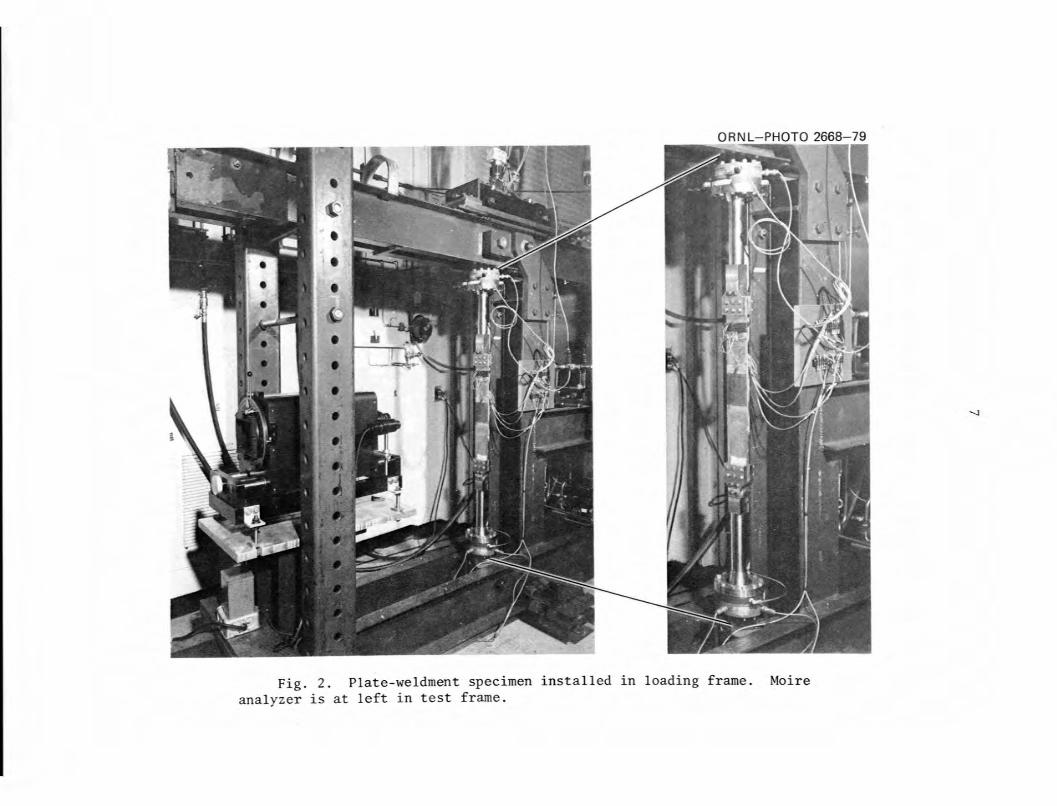
lag plate tests. Figure 2 shows a specimen installed in the loading
frame. In all three tests the specimens were loaded monotonically in
tension along the longitudinal axis until an average longitudinal stress
of approximately 200 MPa (29 ksi) was reached. This load level was suf
ficient to induce plastic yielding in the base metal portions of the
specimen and in the annealed weld metal, but not in the as-deposited weld.
The primary source of strain data was foil strain gages applied on
and around the weldment. Micro-Measurements types EA06-062TT-120, 3.2-
mm (0.125-in.) gage length, and EA06-125BT-120, 1.6-mm (0.0625-in.) gage
length, strain gages were used. Figure 3 shows the strain-gage locations
for tests W-l and W-3, while Fig. 4 shows the corresponding locations for
test W-2 (see Tables 1, 2, and 3 for number of gages and orientation at
each location).
Strain data were additionally acquired by the moire technique in
the W-2 and W-3 tests using a 39 lines/mm (1000 lines/in.) specimen grid,
which covered the central 10 cm (4 in.) of the specimen, and a Photolas-
tic, Inc., moire analyzer. The analyzer and specimen grid are visible
in Fig. 2. The strain-gage locations which were not masked by the speci
men grid were repeated on the other side.
We initially encountered substantial difficulty in obtaining ade
quate moire fringe definition and contrast in the W-2 test because of
the poor quality of the specimen grid. Professor Gary Cloud of Michigan
State University was retained as a consultant to assist in overcoming
this difficulty. Cloud suggested minor modifications to our moire bench
apparatus which resulted in fringe patterns of usable quality. He addi
tionally deposited a high-quality grid on the W-3 specimen by photoetching
techniques which yielded fringes of excellent quality. Figure 5 shows
ORNL-PHOTO 2668-79
Fig. 2. Plate-weldment specimen installed in loading frame. Moireanalyzer is at left in test frame.

Eo
CO
eo
CD
Eo
m
CT
©
G>
©
Y
ORNL-DWG 78-12950
o
©
WELD
X(A)- —
Fig. 3. Strain-gage locations for tests W-l and W-3. 1 in. = 2.54 cm.

ORNL-DWG 78-10446R
® ® ®
15.2 cm
© © ©
7.62 cm7.62 cm
r ® ®
2.54 cm
1
Fig. 4. Strain-gage locations for test W-2. 1 in. = 2.54 cm.

10
Table 1. Measured (strain gage) and predicted strains fortest W-l (all values are x 10"3)
Location/
orientation
Averagelongitudinal
stress
46.9 MPa
(6.8 ksi)149 MPa
(21.6 ksi)200 MPa
(29 ksi)
A/LMeasured
Predicted
0.23
0.28
1.09
0.89
4.00
4.89
A/TMeasured
Predicted
-0.060
-0.064
-0.33
-0.20
-1.31
-2.11
B/LMeasured
Predicted
0.28
0.28
1.33
0.90
3.78
4.70
B/TMeasured
Predicted
-0.07
-0.06
-0.30
-0.20
-1.18
-2.15
C/LMeasured
Predicted
0.27
0.24
1.30
0.76
4.18
4.85
C/TMeasured
Predicted
-0.08
-0.06
-0.35
-0.20
-1.30
-2.14
D/LMeasured
Predicted
0.28
0.24
1.35
0.76
4.24
4.84
D/TMeasured
Predicted
-0.07
-0.06
-0.30
-0.20
-1.20
-2.15
E/LMeasured
Predicted
0.26
0.24
1.03
0.76
3.65
4.88
F/LMeasured
Predicted
0.24
0.24
0.94
0.76
3.73
4.88
F/TMeasured
Predicted
-0.06
-0.06
-0.26
-0.20
-1.23
-2.19
G/LMeasured
Predicted
0.23
0.24
1.11
0.76
4.42
4.90
H/LMeasured
Predicted
0.24
0.24
1.17
0.76
4.36
4.91
H/TMeasured
Predicted
-0.06
-0.06
-0.39
-0.20
-1.80
-2.20
I/LMeasured
Predicted
0.18
0.24
0.99
0.76
4.56
4.91
J/LMeasured
Predicted
0.24
0.24
1.11
0.76
4.75
4.91
J/TMeasured
Predicted
-0.07
-0.06
-0.33
-0.20
-1.97
-2.20
Letters designating locations refer to those in Fig. 3.Orientation: L — Longitudinal; T —Transverse.

11
Table 2. Measured (strain gage) and predicted strains for test W-2(all values are x 10"3)
Location/ Average 46.8 MPa 147 MPa 167 MPa 197 MPaorientationa longitudinal stress (6.79 ksi) (21.3 ksi) (24.2 ksi) (28.5 ksi)
Measured 0.22 1.08 1.64 5.67
A/L Predicted 0.25 0.76 2.51 6.17
Predicted/residual stresses 0.24 0.78 2.75 6.41
Measured -0.06 -0.31 -0.46 -1.93
A/T Predicted -0.07 -0.22 -1.00 -2.72
Predicted/residual stresses -0.07 -0.22 -1.12 -2.91
Measured 0.21 1.10 1.55 4.81
B/L Predicted 0.24 0.76 2.40 6.02
Predicted/residual stresses 0.24 0.91 2.89 6.77
Measured -0.06 -0.30 -0.44 -1.48
B/T Predicted -0.07 -0.22 -1.00 -2.75
Predicted/residual stresses -0.07 -0.30 -1.39 -3.53
Measured 0.28 1.28 1.70 4.56
C/L Predicted 0.28 0.89 2.13 5.31
Predicted/residual stresses 0.28 0.85 2.63 6.15
Measured -0.05 -0.26 -0.37 -1.35
C/T Predicted -0.07 -0.22 -1.96 -2.75
Predicted/residual stresses -0.07 -0.29 -1.39 -3.54
Measured 0.21 0.98 1.58 5.36
D/L Predicted 0.25 0.76 2.52 6.15
Predicted/residual stresses 0.25 0.78 2.02 5.28
Measured 0.22 1.08 1.70 6.07
E/L Predicted 0.25 0.76 2.54 6.18
Predicted/residual stresses 0.24 0.76 1.20 4.57
Measured -0.06 -0.37 -0.59 -2.28
E/T Predicted -0.07 -0.22 -1.06 -2.83
Predicted/residual stresses -0.07 -0.24 -1.28 -3.34
Measured 0.24 1.14 1.82 6.02
F/L Predicted 0.25 0.76 2.61 6.24
Predicted/residual stresses 0.24 0.76 2.55 6.31
Measured 0.22 1.28 1.91 5.68
G/L Predicted 0.25 0.76 2.62 6.25
Predicted/residual stresses 0.24 0.75 2.45 6.01
Measured -0.07 -0.49 -0.79 -2.57
G/T Predicted -0.07 -0.22 -1.13 -2.91
Predicted/residual stresses -0.07 -0.21 -1.00 -2.72
Measured 0.24 1.09 1.78 6.31
H/L Predicted 0.25 0.76 2.62 6.24
Predicted/residual stresses 0.24 0.76 2.61 6.24
Measured 0.24 1.07 1.91 6.82
I/L Predicted 0.25 0.76 2.62 6.24
Predicted/residual stresses 0.24 0.76 2.60 6.23
Measured -0.07 -0.34 -0.71 -3.09
I/T Predicted -0.07 -0.22 -1.13 -2.91
Predicted/residual stresses -0.07 -0.22 -1.12 -2.90
aLetters designating locations refer to those in Fig. 4. Orientation: LLongitudinal; T - Transverse.

12
Table 3. Measured (strain gage) and predicted strains for test W-3(all values are x 10"3)
Location/ Average 45.9 MPa 111 MPa 162 MPa 185 MPalongitudinal stress (6.67 ksi) (20.1 ksi) (23.5 ksi) (26.8 ksi)
Measured 0.210 0.940 1.340 2.110A/L £re^"e* .A 0-220 0.660 0.820 1.052
Predicted/residual stresses 0.220 1.000 1.220 1.410
a/t Measured ^.080 ^).360 ^).530 -0.890A/r Predicted -O.060 -O.180 -0.310 -0.560
Predicted/residual stresses -0.060 -0.340 -O.580 -0.730
Measured 0.250 0.750 0.810 0.930B/L Predicted 0.220 0.640 0.800 1 020
Predicted/residual stresses 0.220 0.560 0.770 0.960
r/t Measured _^,.070 -0.280 ^.400 ^).590B/T Predicted -0.070 -0.200 -0.380 -0 980
Predicted/residual stresses -0.070 -0.420 -0.960 -1.380
Measured 0.230 0.860 1.170 1.800C/L Predicted 0.240 0.720 1.400 4 170
Predicted/residual stresses 0.240 1.280 3.800 6.650
Measured -0.060 -0.230 -O.310 -0 480C/T Predicted -0.070 -0.200 -0.420 -1.180
Predicted/residual stresses -0.060 -0.470 —1.Ot0 -1.720
Measured 0.240 0.710 0.8f) 1150D/L Predicted 0.240 0.710 1.350 2.670
Predicted/residual stresses 0.240 0.720 2.300 3.860
Measured -0.060 -0.370 -0.570 -0 830D/T Predicted -0.070 -0.200 -0.430 -0 990
Predicted/residual stresses -0.060 -0.420 -O.970 -1.410
Measured 0.240 1.010 1.600 3.210E/L Predicted 0.240 0.720 1.380
Predicted/residual stresses 0.240 1.210 3.0803.530
5.320
3.620Measured 0.240 1.270 2.140
Predicted/residual stresses 0.240 2.190 4^90F/L Predicted 0.240 0.720 l!390 3.710
7.330
Measured -O.060 -0.450 -0.830 -1 390F/T Predicted -O.070 -0.210 -0.490
Predicted/residual stresses -0.060 -0.540 -1^200
Predicted/residual stresses 0.240 0.770 K250
Measured 0.240 0.960 1.890
-1.500
-2.010
Measured 0.240 1.020 1.850 4 710/L Predicted ^ ^ 0.240 0.720 1.520 3.990
3.690
4.660H/L Predicted 0.240 0.'720 l!s30 4'o40Predicted/residual stresses 0.240 0.660 0.860 3.080
nf^YIf1, "9-°^° -0.280 -0.640 -1.800-1.830
-1.140
H/T Predicted -0.070 -o!210 -0^600Predicted/residual stresses -0.060 -0.170 -0.250
"ea^Ur!dJ 0-230 1.030 1.840 4.3901.540 4.020
4.010
I/L Predicted 0.240 0^720Predicted/residual stresses 0.240 0.720 1.520
Measured 0.240 1.070 1.770 4 230J/L Predicted 0.240 0.720 1.540 4'o20
Predicted/residual stresses 0.240 0.720 1.560
Measured -0.060 -0.350 -0.600J/T Predicted -0.060 -0.210 -0.600
Predicted/residual stresses -0.060 -0.210 -0.610
a.
Letters designating locations refer to those in Fig. 3. Orientation:Longitudinal; T — Transverse.
4.110
-1.710
-1.810
-1.850
(«) v-DISPLACEMENT CONTOURS (/>) u-DISPLACEMENT CONTOURS
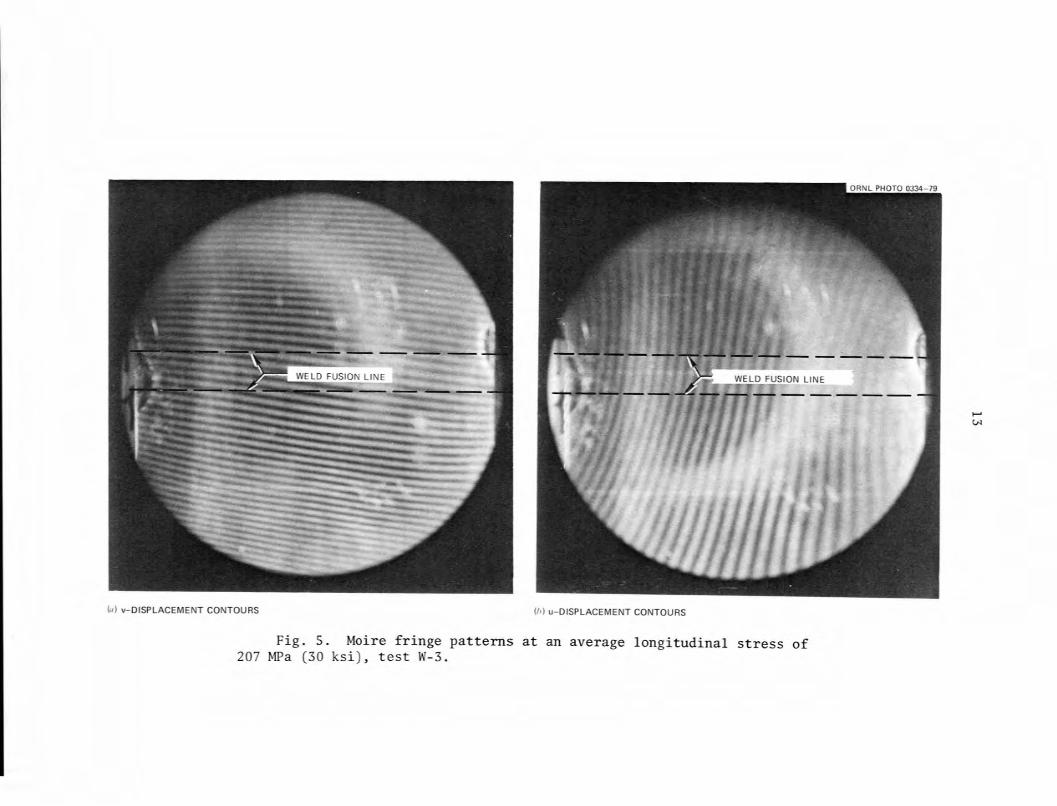
Fig. 5. Moire fringe patterns at an average longitudinal stress of207 MPa (30 ksi), test W-3.
NL PHOTO 0334-79
W
14
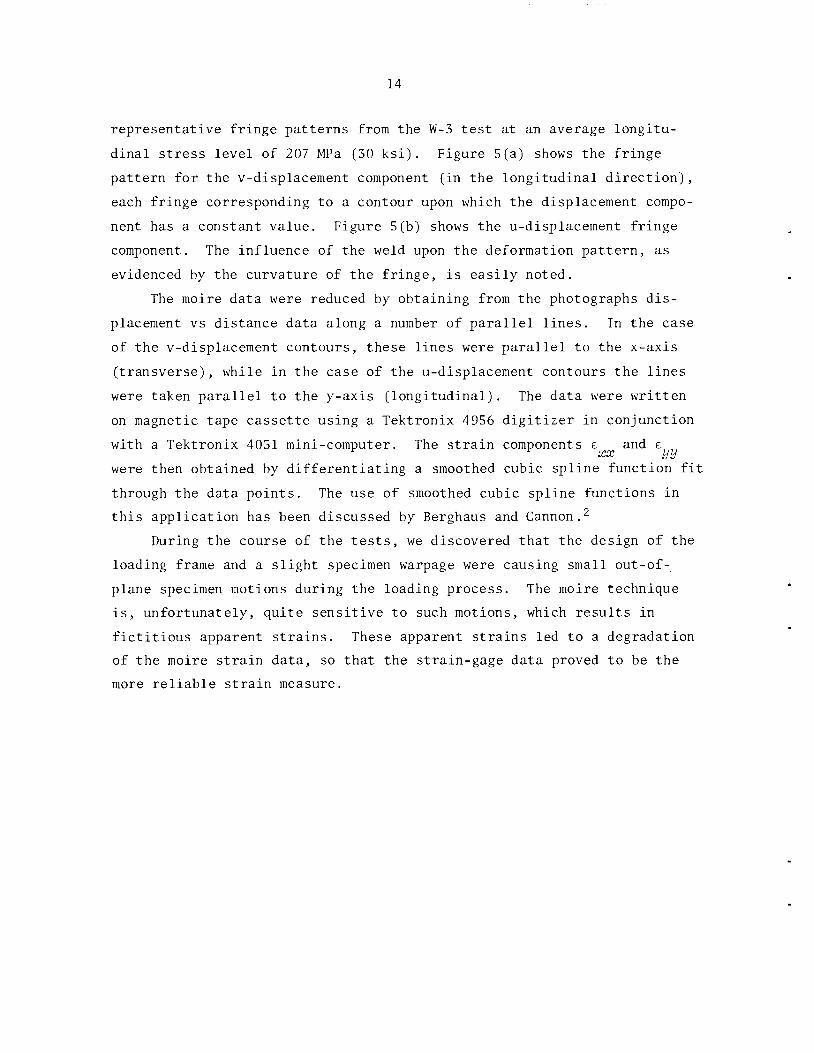
representative fringe patterns from the W-3 test at an average longitu
dinal stress level of 207 MPa (30 ksi). Figure 5(a) shows the fringe
pattern for the v-displacement component (in the longitudinal direction),
each fringe corresponding to a contour upon which the displacement compo
nent has a constant value. Figure 5(b) shows the u-displacement fringe
component. The influence of the weld upon the deformation pattern, as
evidenced by the curvature of the fringe, is easily noted.
The moire data were reduced by obtaining from the photographs dis
placement vs distance data along a number of parallel lines. In the case
of the v-displacement contours, these lines were parallel to the x-axis
(transverse), while in the case of the u-displacement contours the lines
were taken parallel to the y-axis (longitudinal). The data were written
on magnetic tape cassette using a Tektronix 4956 digitizer in conjunction
with a Tektronix 4051 mini-computer. The strain components e and exx yy
were then obtained by differentiating a smoothed cubic spline function fit
through the data points. The use of smoothed cubic spline functions in
this application has been discussed by Berghaus and Cannon.2
During the course of the tests, we discovered that the design of the
loading frame and a slight specimen warpage were causing small out-of-
plane specimen motions during the loading process. The moire technique
is, unfortunately, quite sensitive to such motions, which results in
fictitious apparent strains. These apparent strains led to a degradation
of the moire strain data, so that the strain-gage data proved to be the
more reliable strain measure.

15
3. RESIDUAL STRESS MEASUREMENTS
In order to determine the effect of the residual stress field upon
the deformation field in our plate-weldment specimens, it was necessary
to experimentally measure the residual stresses in the neighborhood of
the weldment. For this purpose we selected two companion plate-weldment
specimens similar to those described in the previous section — one con
taining an annealed weldment and the other a weldment in the as-deposited
condition.
The specimens were initially sent to the Development Division of
the Oak Ridge Y-12 Plant where it was planned to make residual stress
measurements by the x-ray diffraction technique. This technique was
particularly attractive because of its nondestructive nature. Unfortu
nately, the grain size of the 304 stainless steel base metal/308 stainless
steel weld metal combination proved too large to allow accurate measure
ments to be made. We next turned to the hole-drilling technique, a semi-
destructive technique which had previously been used with some success
in the Heavy-Section Steel Technology Program at ORNL.3
The technique utilizes special rosette strain gages with the three
legs of the rosette oriented radially with respect to the center of the
gage. A small-diameter hole is drilled in the center of the rosette,
and the difference between the gage readings before and after the hole
is drilled is measured. These strain measurements are then used in con
junction with the theory of elasticity solution for a hole in an infinite
sheet under in-plane loading to obtain the residual stresses at the
strain-gage location.
In practice, several precautions must be observed. First, the depth
of the hole must be made sufficiently great that no change in the mea
sured strains occurs with increasing hole depth. A hole depth greater
than or equal to the hole diameter is considered adequate for this pur
pose. k>5 Second, it has been noted1* that the hole-drilling process may
itself introduce residual stresses into the specimen under investigation,
especially if a rotating cutter is used. To avoid this problem, several
investigators1*'5 have employed air-abrasive machining as a drilling method.In this technique, fine particles of abrasive material are entrained in

16
an air jet and are directed against the specimen surface. The particles
erode away the metal surface immediately under the jet nozzle at a con
trolled rate, allowing holes of repeatable depth and diameter to be
drilled. Spurious residual stresses introduced into the specimen by this
method have been shown to be negligible.1*'5 In our investigations, we
utilized an Airbrasive* Model K air-abrasive drilling device manufactured
by S. S. White Co.
In order to gain confidence in the hole-drilling technique, a num
ber of uniaxial tension specimens were instrumented with Micro-Measurements
type EA06-062RE-120 rosette strain gages which are especially designed
for this application. Holes were drilled in the center of each gage
rosette, and the specimens were then loaded and held uniaxially in a
testing machine in order to see how well the hole-drilling technique
could measure the known stress field. The results of this initial se
ries of tests were quite encouraging, as it was found that the stress
values determined by the hole-drilling technique were generally within
10% of the known values. Additionally, it was found that the use of a
table of calibration factors given by Beaney5 for the hole-drilling tech
nique seemed to give slightly better results than those obtained by
making use of the theory of elasticity solution to obtain the stress
values. Accordingly, Beaney's calibration factors were used in subse
quent work.
The next step was to instrument both sides of the two plate-weldment
specimens to be used for residual stress measurements with strain-gage
rosettes. The specimen containing the annealed weldment was selected
for the first series of measurements. Figure 6 shows drilling in prog
ress on this specimen. As this specimen had previously been used in the
unsuccessful x-ray diffraction experiments, a portion of the surface in
the neighborhood of the weldment on either side of the specimen had been
chemically etched away to a depth of 0.05 to 0.13 mm (0.002 to 0.005 in.).
Outside the etched area, compressive residual stresses on the order of
97 MPa (14 ksi) were measured, while inside the etched area the magnitude
of the measured stresses did not exceed 41 MPa (6 ksi). It was concluded
*Trade name.

Fig. 6. Residual stress measurements being made on plate-weldment specimen.

that the large stresses measured outside the etched area had been intro
duced by the light machining the specimen received after annealing. Sub
sequently, it was discovered that other investigators utilizing the hole-
drilling technique have found that residual stresses induced by surface
machining are usually confined to a thin surface layer.6 The effects of
these surface stresses may be removed by chemically etching away the sur
face to a depth of 0.02 to 0.03 mm (0.0005 to 0.0010 in.).
An effort was made to correct for the effect of machining stresses
outside the etched area by subtracting an average stress value measured
at a location remote from the weld from the calculated stress values.
This procedure did not prove successful, however, as it led to inconsis
tent results. Thus, data taken at strain-gage locations outside the
etched area were ignored.
Figure 7 shows the results of the residual stress measurements made
inside the etched area of the specimen. Strain-gage locations where data
were unavailable are marked with an "X." Back-to-back gage locations
are drawn so that they occupy similar positions in the figure. The nor
mal stress components (a and a ) were found to fit into a fairly con-r *• xx yyJ
sistent pattern. The a values are negative throughout and seem to be
somewhat smaller in magnitude on the weld centerline than at locations
removed from the weld. The a values are generally positive along theyy
longitudinal centerline of the specimen, decreasing to negative values
with increasing distance from this line. The magnitude of the measured
shear stresses is usually, though not always, about 30% or less of the
normal stress magnitudes measured at that location. These values show
considerable scatter and do not seem to form a consistent pattern, a fact
which may be related to their generally small magnitude.
Prior to instrumenting the specimen containing the as-deposited weld
ment, the surface was etched away to a depth of approximately 0.02 mm
(0.0005 in.) over the area where the strain gages were to be applied.
This procedure led to residual stress values which were much more con
sistent than those obtained in the unetched area of the previous speci
men. The results of the measurements are shown in Fig. 8. The locations
where data were unavailable are marked with an "X." The a values onxx
the weld centerline are seen to be quite large. However, these decrease

DIMENSIONS
Fig. 7. Measured residual stresses (in MPa) made on specimen containing an annealed weldment. 1 ksi = 6.895 MPa; 1 in. = 2.54 cm.
ORNL DWG 78-22051

DIMENSIONS
SIDE 1
Fig. 8. Measured residual stresses (in MPa) made on specimen containing an as-deposited weldment. 1 ksi = 6.895 MPa.
ORNL-DWG 79-7760R
o

21
considerably at locations immediately adjacent to the weld, but increase
again with distance from the weld. It is interesting to note that the
a values measured on this specimen are generally positive, whereas they
were of opposite sign on the specimen containing the annealed weldment.
The a values have their maximum value on the longitudinal centerlineyy
of the specimen and, as in the specimen containing the annealed weld
ment, decrease to negative values with a change in location normal to
this line.
The a values are of somewhat more consistent variation than thosexy
measured on the annealed weldment specimen. In particular, a pattern of
antisymmetry is usually present about the transverse and longitudinal
centerlines. Such a pattern would, of course, be expected of the shear
stress component. However, the values measured along the centerlines
are typically not close to the zero values which antisymmetry would
demand.

22
ANALYSIS
Concurrent finite-element elastic-plastic analyses of all three tests
were.carried out using the ADINA finite-element code for test W-l and
the CREEP-PLAST II code for tests W-2 and W-3. A number of simplifying
assumptions was made for ease of analysis. The specimen was taken to be
in a state of plane stress and was assumed to be symmetric about both its
longitudinal and transverse centerlines. Thus it was necessary to model
only one-quarter of the specimen. Additionally, the effects of the
double-V weld joint geometry were ignored, and the weld joint was mod
eled as a straight-sided butt-joint with the width of the weld metal por
tion of the joint taken to be the average width over the actual double-V
geometry.
Two different sets of material properties were used in the analy
ses - one for the 304 stainless steel base metal and the other for the
308 CRE stainless steel weld metal. Due to a lack of data, no effort was
made to provide a separate set of properties for the heat-affected zone,
although it is known that these may differ considerably from the unaf
fected base metal.
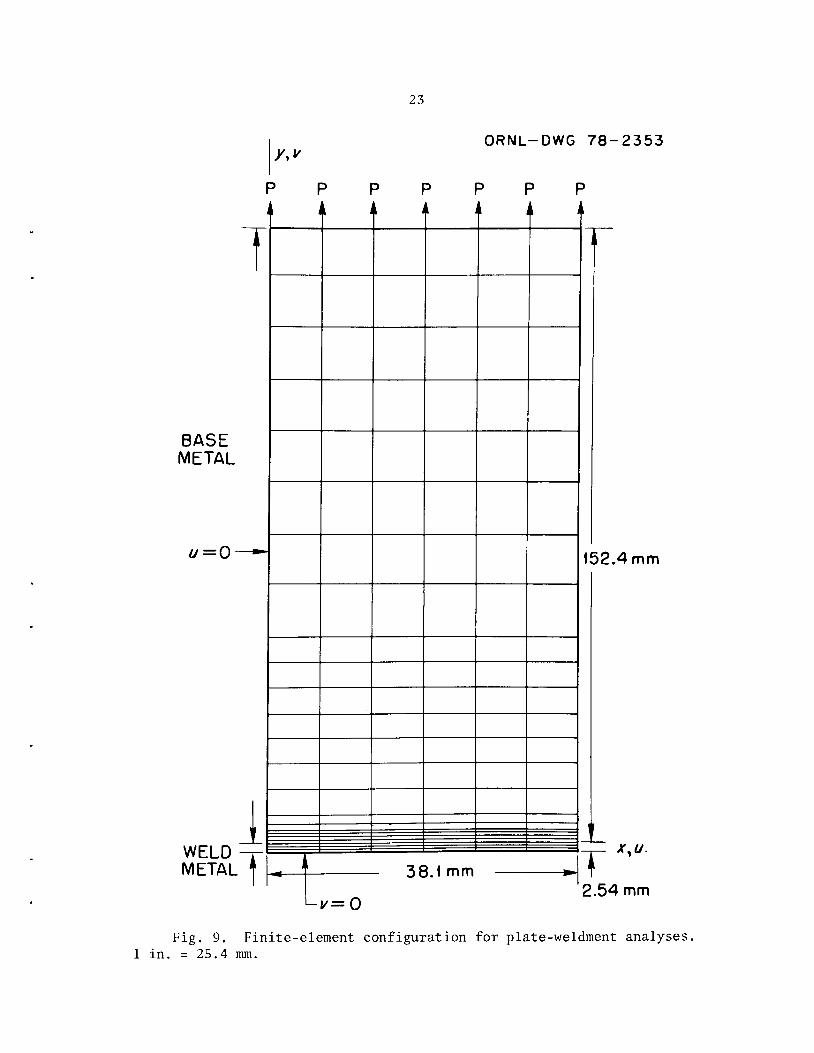
The finite-element mesh used in the analyses is shown in Fig. 9.
The particular type of element used in the analysis of the W-l test was
the four-node isoparametric quadrilateral. In the W-2 and W-3 tests,
constant-strain triangular elements were used, and each of the quadri
lateral elements shown in Fig. 9 was divided diagonally into two tri
angular elements.
For the purpose of the analyses, the elastic-plastic stress-strain
behavior of the base and weld metals was modeled by bilinear represen
tations constructed according to currently recommended procedures.7 The
material constants required for the bilinear representation were ob
tained, in the case of the 304 stainless steel base metal, from strain-
gage data taken from locations remote from the weldment where the speci
men was in a state of uniaxial stress. The constants derived by this
procedure are listed in Table 4 and agree well with similar values re
ported by Clinard and Swindeman.8
BASEMETAL
u=0
y,v
p
1WELD -r-METAL |
P P
ii
v=0
23
ORNL-DWG 78-2353
P P
ii
P
152.4mm
38.1 mm
x.u.
2.54 mm
Fig. 9. Finite-element configuration for plate-weldment analyses.1 in. = 25.4 mm.

24
Table 4. Material properties used infinite-element analyses
[MPaE
(F
7
>si)]ab
V [MPa (psi)]G [MPa (F)Sl)]
Test W-l
Base metal1.93
2.80
X
X
105107
0.26152
2.20 x 101*1.17
1.70
X
X
104106
Weld metal1.65
2.40
X
X
105107
0.24152
2.20 x 101*1.38
2.00
X
X
101*106
Test W-2
Base metal1.93
2.80
X
X
105107
0.26152
2.20 x 101*8.27
1.20
X
X
103106
Weld metal1.65
2.40
X
X
105
1070.24
165
2.40 x 101*9.10
1.32
X
X
103
106
Test W-3
Base metal1.90
2.80
X
X
105107
0.29155
2.25 x 101*9.30
1.35
X
X
103106
Weld metal2.14
3.11
X
X
105107
0.24340
4.93 x 101*7.17
1.04
X
X
101*107
E = Young's modulus.
v = Poisson's ratio.
°o = initial yield stress (0.2% offset).y
E = plastic slope.
Bilinear constants for the as-deposited weld metal in the W-3 test
were obtained from unpublished data generated by the Metals and Ceramics
Division at ORNL.9 These are also listed in Table 4. Unfortunately, no
similar data exist for 308 CRE stainless steel weld metal in the annealed
form. It was, therefore, necessary to estimate the bilinear constants
for the annealed weld metal by assuming that conditions at the central
point of the specimen in the weld metal were approximately uniaxial,
and using the nominal stress-strain curves derived from strain-gage data
taken from this point (location B, test W-l; location C, test W-3) to de
fine the bilinear constants. This procedure is admittedly relatively

25
crude; however, it is at least partially justified by the fact that the
elastic moduli and yield stress for the annealed 308 stainless steel weld
metal are known not to differ too greatly from the corresponding prop
erties for 304 stainless steel.10'11 Thus the presence of the annealed
weldment does not introduce too great a perturbation in the uniaxial
tension field existing in the specimen. A further justification is that
the values of the elastic moduli obtained by this procedure are in good
agreement with those reported by Dewey et al.10 The bilinear constants
are given in Table 4.
It should be noted that experimental evidence10'12 indicates 308
stainless steel weld metal has anisotropic material properties possibly
possessing orthotropic symmetry. This anisotropy comes about as a result
of preferential solidification directions in the molten weld metal which
result in a pronounced dendritic structure in the solidified metal.
However, the experimental results of Dewey et al.10 suggest that, in the
present case, the normal to the plane of the plate may be regarded as an
axis of isotropy. Hence, the weld metal may be considered to have iso
tropic properties in the plane of the specimen.
In order to make an analytical assessment of the effects of the
residual stress field, tests W-2 and W-3 were analyzed twice — once with
out any consideration of residual stresses and once including the mea
sured residual stress pattern discussed in the previous section. Since
the analyses assumed symmetry about both the longitudinal and transverse
specimen axes, it was necessary to modify the measured stress field some
what in order that the residual stress field for input into the analysis
has the same symmetry. To this end, the stress values shown in Figs. 7
and 8 measured at symmetrically-located positions with respect to the
longitudinal and transverse centerlines were averaged, as were stress
values measured at back-to-back locations. Additionally, the shear
stress values along the longitudinal and transverse centerlines were
taken to vanish.
The boundary conditions along the free longitudinal edge require
that the a and a residual stress components vanish. However, no re-xx xy
quirement is placed on the a values along the edge, and, since it was
impossible to obtain measurements here, these were assumed to be the

26
same as the a values measured at the nearest interior strain-gage lo-yy
cation.
Due to the inconsistent variation and generally small magnitude of
the residual shear stress components measured on the annealed weldment
specimen, these were assumed to vanish everywhere. They were, however,
included in averaged form on the as-deposited weldment specimen.
Figure 10 shows the idealized residual stress values constructed
for use in the analysis of the annealed weldment specimen. Figure 11
shows the corresponding values on the as-deposited weldment specimen.
In the annealed specimen, the residual stresses were arbitrarily assumed
to decay to zero along a line 5.3 cm (2.1 in.) from the transverse (weld
ment) centerline. This line was assumed to be located 9.1 cm (3.6 in.)
from the transverse centerline on the as-deposited specimen.
A residual stress whole-field representation was then constructed
by linear interpolation between the values shown in Figs. 10 and 11.
Residual stress values were calculated at the centroid of each element
for input to the finite-element analysis.
The elastic-plastic finite-element analysis including the residual
stress field was carried out by assuming the stresses at a point to be
the sum of the residual stresses at that point plus the incrementally-
calculated stresses. The incremental strains were calculated from the
incremental stresses in the usual fashion starting from assumed initial
unstrained conditions under no load. Since the residual stress field
was input into the analysis essentially as measured, no effort was made
to require that this stress field satisfy equilibrium conditions. Equi
librium conditions were, however, satisfied between the incrementally-
calculated stresses and the external loads, but not between the external
loads and the sum of the residual and incrementally-calculated stresses.
Thus the principal effect of the residual stress field was to alter the
load level at which the onset of plastic yielding was calculated to occur
at any particular point, either advancing or retarding yielding depend
ing on the sign and magnitude of the residual stress field at that point.
It was also necessary to make some assumption about the initial lo
cation of the yield locus in the model, and it was arbitrarily assumed
that initially the yield locus was that appropriate to a virgin material.

27
ORNL DWG 78 22052A
Fig. 10. Idealization of measured residual stress (MPa) field in aplate specimen containing an annealed weldment for input into finite-element analysis. Dimensions in cm (1 in. = 2.54 cm).

28
DIMENSIONS IN<L CENTIMETERS
ORNL-DWG 79-7761
Fig. 11. Idealization of measured residual stress field in plate-weldment specimen containing an as-deposited weldment for input intofinite-element analysis. Dimensions in cm (1 in. = 2.54 cm).
29
This means that the yield locus was taken to be isotropically located in
stress deviation space, and that no shifting of the locus as a result of
previous plastic yielding was assumed to have occurred. Since welding
residual stresses are known to arise from plastic deformation due to
thermal stresses imposed in the welding process, this assumption is prob
ably invalid. However, without a knowledge of the loading history of the
specimen during welding, it was impossible to accurately fix the location
of the yield locus.
The results of the analyses and comparisons with experimental data
are presented in the next section.

30
RESULTS
5.1 Tests W-l and W-2
Tests W-l and W-2 were similar to each other in almost all respects.
Each test had the same loading history, and the weldment in each speci
men had received the ORNL reference solution anneal. The only signifi
cant differences between the two were a slight difference in strain-gage
layouts (Figs. 3 and 4) and the fact that moire strain data were acquired
in test W-2. Tables 1 and 2 give the strain-gage data obtained from
each test. Since the measured strains were reasonably symmetric about
both the longitudinal and transverse centerlines, values from symmetri
cally located gages were averaged together, as were the readings from
back-to-back gages. Predicted values obtained by the finite-element analy
ses discussed in the previous section are included for comparison. As
noted earlier, the W-2 test was analyzed twice — once with and once with
out the presence of the measured residual stress field. No attempt was
made to include residual stresses in the analysis of the W-l test. We
will consider the results of test W-l first.
The most noticeable feature of the strain data given in Table 1 is
the existence of a strain gradient in the longitudinal direction. This
is particularly noticeable at the highest longitudinal stress level [200
MPa (29 ksi)], where the experimentally measured longitudinal and trans
verse strains in the neighborhood of the weldment are, respectively, about
20 and 30% less than those measured at locations I and J remote from the
weldment (Fig. 3). Thus the weldment seems to act somewhat as a stiffener,
restricting the nearby strains to values less than those measured at
some distance from the weldment where conditions are essentially those
of uniaxial stress. This gradient is not well predicted by the analysis,
which shows little variation in longitudinal or transverse strain values
either in the longitudinal or transverse directions.
Generally it can be seen that the analysis does a reasonably ade
quate job of predicting the measured longitudinal strains, but may be
in error by as much as a factor of two in predicting the transverse
strains. The agreement between experiment and analysis tends to be

31
worse at locations in the neighborhood of the weldment than at locations
further removed from the weldment area.
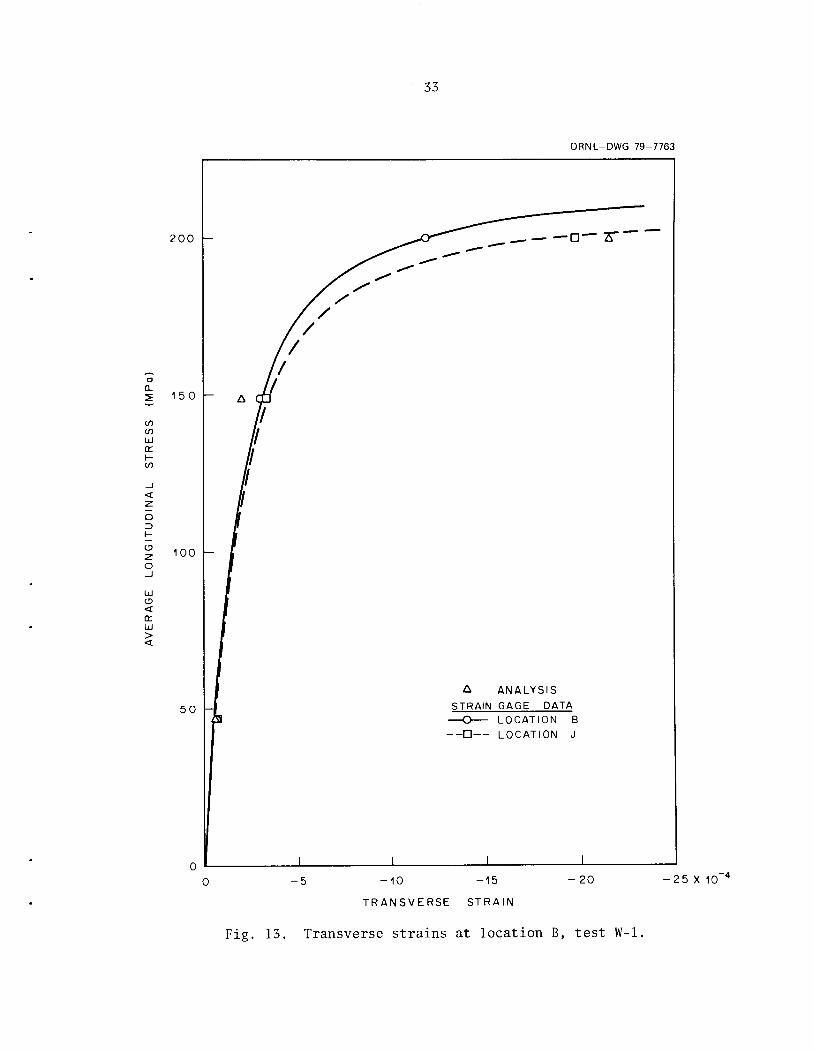
Figures 12 and 13 show, respectively, a comparison of the measuredand predicted longitudinal and transverse strain values at locations Band J (Fig. 3). Figures 14 and 15 show a similar comparison for thecorresponding quantities at locations D and J. By comparing the measuredstrain values at locations B and D to those measured at location J, it
can be seen that the presence of the annealed weldment does not very
greatly affect the strain field in the specimen. This conclusion isalso supported by strain data taken from other strain-gage locations inthe neighborhood of the weldment. This result is not too surprising inview of the previously noted fact that the mechanical properties of theannealed 308 stainless steel weld metal do not seem to differ very much
from those of the 304 stainless steel metal.
As mentioned earlier, the analytical predictions can be seen to
yield fairly reasonable agreement with the measured longitudinal strains,but tend to considerably overpredict the measured transverse strains,
especially at the higher stress levels. Part of the difficulty may bedue to the flatness of the stress-strain curves at the higher stress
levels, since here a small error in calculated stress could result in afairly large error in calculated strain. Such an error in calculatedstress might result, for example, from the presence of a residual stress
field which was not included in the analysis.
The results of test W-2 were qualitatively similar to those of test
W-l, i.e., the presence of the annealed weldment did not affect toogreatly the strain field in the specimen. Table 2 shows the strain-gagedata obtained from the test, along with analytical predictions made with
and without the influence of residual stresses taken into account. A
disturbing feature of the measured strain data is that the values obtained in test W-2 generally exceeded those measured in test W-l at the
same load level by 20 to 30%. This is not, however, outside the limits
of specimen-to-specimen variability commonly encountered in other inelas
tic tests.
As in test W-l, the data from the W-2 test indicate that the pres
ence of the weldment tends to restrict to some extent the strains in the

200 -
f. 150 -
CO
CO
UJ
<r
3
CD
O
UJ
<
or
Ld
><
100 -
50 -
32
2 3
LONGITUDINAL STRAIN
ORNL-DWG 79-7762
5X10 3
Fig. 12. Longitudinal strains at location B, test W-l.
o
0.
CO
CO
UJ
or
o
H
CD
z
o
UJ
CD
<
orUJ
><
200 -
150
100
50
33
ORNL-DWG 79-7763
A ANALYSIS
STRAIN GAGE DATA
—O LOCATION B
._•— LOCATION J
-10 -15
TRANSVERSE STRAIN
Fig. 13. Transverse strains at location B, test W-l.
-25 X 10

0-
5
CO
CO
UJ
or
Q
ID
H
O
z
o
UJ
CD
<or
UJ
>
200
150
100
34
A ANALYSIS
STRAIN GAGE DATA
—O— LOCATION C
—D— LOCATION J
2 3
LONGITUDINAL STRAIN
ORNL-DWG 79-7764
J
5 X 10⁻³
Fig. 14. Longitudinal strains at location D, test W-l.

o.
5
CO
CO
UJ
or
id
<s>
z
o
UJ
o
<or
UJ
><
200
150
100
50
35
ORNL-DWG 79-7765
A ANALYSIS
STRAIN GAGE DATA
—O— LOCATION D
—Q— LOCATION J
-10 -15
TRANSVERSE STRAIN
•20
Fig. 15. Transverse strains at location D, test W-l.
-25 X 10"

36
neighborhood of the weldment as compared to those present at some dis
tance from the weldment, where conditions are essentially those of uni
axial stress. The agreement between the measured and predicted longitu
dinal strains is reasonably good, but some tendency to overpredict the
measured strains in the weldment area may be noted. The comparison
between the measured and predicted transverse strain values is not as
satisfactory. Some transverse strains in the neighborhood of the weld
ment are overpredicted by as much as a factor of two at the highest load
level.
The inclusion of the residual stress field depicted in Fig. 10 in
the analysis does not radically affect the predicted strain values. How
ever, at most strain-gage locations and especially in the neighborhood
of the weldment, the effect is to worsen agreement between analysis and
experiment by overpredicting the measured strains to a greater extent
than when residual stresses were not included. Figures 16 and 17 show,
respectively, the longitudinal and transverse strains at location C (Fig.
4), while Figs. 18 and 19 show these quantities at location B. The over-
predictive tendencies of the analysis are evident in both locations,
though as mentioned previously this tendency is not as bad with regard to
the longitudinal strains as with the transverse strains.
Moire strain data were also acquired in test W-2. We were bothered
here by a specimen grid of poor quality which caused considerable de
gradation in fringe contrast. More seriously, the design of the loading
frame and a slight warpage of the specimen led to small out-of-plane
specimen motions during the course of the loading. This motion led to
progressive defocusing of the moire analyzer with increasing load, causing
an additional loss of fringe contrast and introducing some amount of ap
parent fictitious strain into the results. Thus we were able to obtain
only a limited amount of data over a limited area of the specimen. De
spite these problems, the results were in fairly reasonable agreement
with analytical predictions.
Figure 20 shows the variation of the longitudinal strain component
e along the line x = 2.5 cm (1.0 in.) as measured by the moire tech-yy
nique and as predicted by analysis (without residual stress effects) at
an average longitudinal stress of 197 MPa (28,500 psi). The quantitative

CO
CO
or
HCO
200
175
150
125
- 100
o_i
UJ
CD
<or
UJ
><
75
50
2 5 -,
37
ORNL-DWG 79-7766
LOCATION C
- STRAIN GAGE DATA
A ANALYSIS
o ANALYSIS WITH
RESIDUAL STRESSES
2 3 4
LONGITUDINAL STRAIN
o
7 X 10
Fig. 16. Longitudinal strains at location C, test W-2.

CO
CO
UJ
or
HCO
_l
<
z
Q
Z)
h-
CDz
o
UJ
CD<or
UJ
><
200
1 75
1 50 —
1 25
1 oo
75
50
25
38
ORNL DWG 79-7767
LOCATION C
- STRAIN GAGE DATAA ANALYSIS
O ANALYSIS WITH
RESIDUAL STRESSES
o
-5 -10 -15 -20 -25
TRANSVERSE STRAIN
-30 -35 -40 X 10 4
Fig. 17. Transverse strains at location C, test W-2.

200
CO
CO
UJ
<r
175
150
125
<
I 1003
UJ
CD
<orUJ
><
75
50 -
25 -
AOO
A O
39
A
O
LONGITUDINAL
I
ORNL DWG 78-22053
LOCATION B
STRAIN GAGE DATA
ANALYSIS
ANALYSIS WITH RESIDUAL
STRESSES
4
STRAIN
7 X 10~3
Fig. 18. Longitudinal strains at location B, test W-2,

200
175
150
aO
12 5-
CO
CO
UJ
or
Q
3
CD
Z
o
CD<
or
UJ
>
<
A5>
100
7 5
50
25
40
LOCATION B
-o- STRAIN GAGE DATA
A ANALYSIS
o ANALYSIS WITH
RESIDUAL STRESSES
J_
-10 -15 -20 -25
TRANSVERSE STRAIN
ORNL DWG 78 22054
O
-30 -35 -40X 10"
Fig. 19. Transverse strains at location B, test W-2.

41
ORNL-DWG 78-10449
(x10~3)
6.6
6.4 -
6.2 -
6.0 -
CREEP-PLAST
MOIRE
* 5.8
5.6
5.4
5.2•WELD FUSION LINE
\S
5.0
X0
ty (cm )
Fig. 20. Longitudinal strain (e^) along the line x = 2.5 cm (1.0in.) as measured by the moire technique and predicted by analysis. Average longitudinal stress = 197 MPa (28,500 psi).
42
agreement between the two is good, although the moire data indicate a
considerably higher strain gradient than does the analysis. The longi
tudinal strain is, of course, discontinuous across the weld fusion line,
a fact which is reflected in the analytical predictions. Since the moire
strain data were obtained from a continuous smoothed cubic spline curve
fit, they are not capable of reproducing this discontinuity.
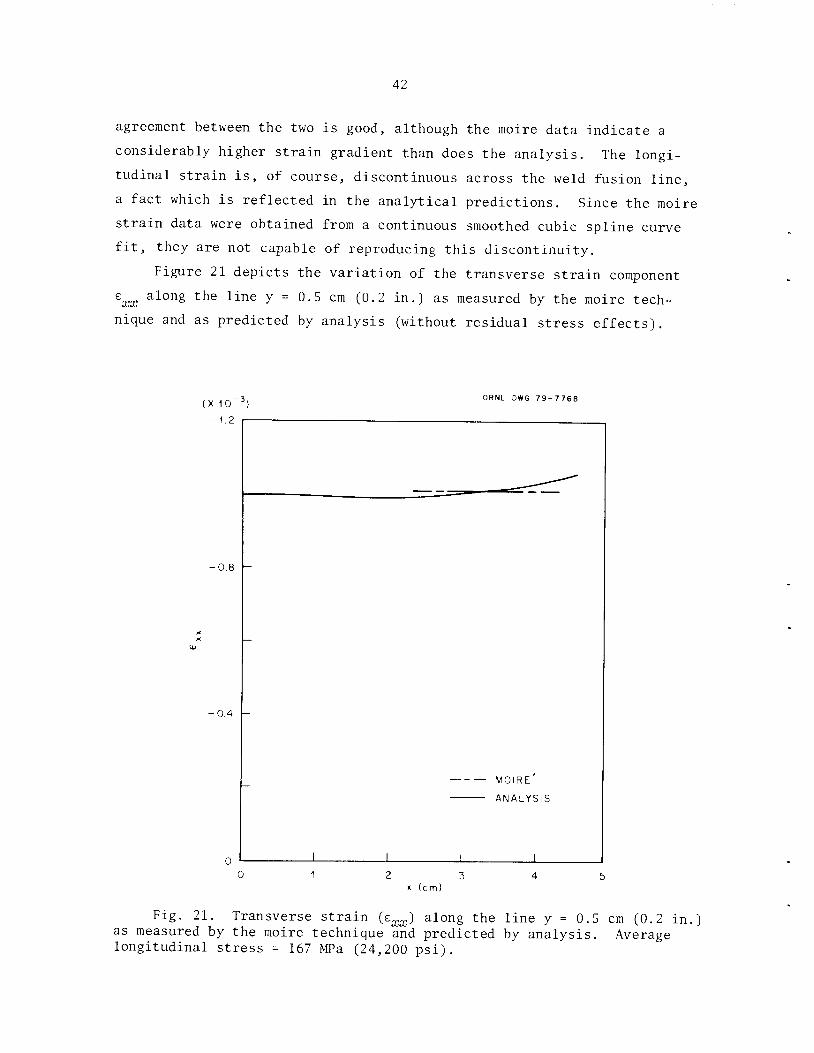
Figure 21 depicts the variation of the transverse strain component
exx alon§ the line y = 0.5 cm (0.2 in.) as measured by the moire tech
nique and as predicted by analysis (without residual stress effects).
;x 10 3)
1.2
-0.8
•0.4
x (cm)
ORNL DWG 79-7768
— MOIRE
ANALYSIS
Fig. 21. Transverse strain (e^) along the line y = 0.5 cm (0.2 in.)as measured by the moire technique and predicted by analysis. Averagelongitudinal stress = 167 MPa (24,200 psi).

43
The average longitudinal stress is 167 MPa (24,200 psi). The agreement
between analysis and experiment is quite good here. Both indicate the
transverse strain to be fairly constant across the specimen.
5.2 Test W-3
Test W-3 was similar in most respects to the previous two tests, the
principal difference being that the specimen for this test contained a
weldment in the as-deposited condition. As in the W-2 test, moire strain
data were collected along with strain-gage data. Table 3 gives the
strain-gage data obtained from the test, along with the analytically pre
dicted values, both with and without residual stresses taken into account.
Again, the tabulated strain-gage values represent the average of gages
located in back to back and symmetrically located positions.
It is clear from the values reported in Table 3 that the presence
of the as-deposited weldment in the specimen has a substantial effect on
the strain field in the neighborhood of the weldment, restricting the
strains to one-half or less of the corresponding values in the portion of
the specimen outside the weldment area. The reason for this behavior
is, of course, the high yield strength of the as-deposited weld metal,
almost twice that of the base metal. Both the analyses and the strain-
gage data indicated very little, if any, plastic yielding at the highest
stress level [185 MPa (26,830 psi)]. Hence, the elastic response of the
weld acted to reduce the strain values in the immediate neighborhood of
the weldment. In the portions of the specimen outside the weldment area,
plastic flow of the base metal was essentially unrestricted and consid
erably larger strains were incurred.
As may be noted from Table 3, the deformation behavior of the speci
men in the area of the weldment was, in general, not very well predicted
by the finite-element analysis. This was especially true at locations
in the base metal immediately adjacent to the heat-affected zone. The
analysis usually, though not always, tended to overpredict the measured
strain values. At the locations where the disagreement between the two
was worst, the analysis overpredicted the measured strain values, both
longitudinal and transverse, by factors greater than two.

44
Unfortunately, the inclusion of the residual stress field shown in
Fig. 11 into the analysis served to worsen the agreement between analysis and experiment at most strain-gage locations, sometimes to a considerable extent. The reason for the generally poorer agreement is the large,positive ayy residual stress values which were measured over the centralportion of the specimen. When incorporated into the finite-element analysis, these acted to lower the load level at which plastic yielding wasfirst calculated to occur. Thus, at a given load level, the analysiswith residual stress effects included usually predicted greater plasticstrains than the analysis in which residual stress effects were ignored,magnifying the generally overpredictive tendencies of the analysis.
Figures 22 and 23 show, respectively, the longitudinal and transverse strains, both measured (strain gage) and predicted, at location A
(Fig. 3). Figures 24 and 25 show the corresponding quantities at location B. Both these locations lie on the weldment itself, and, as notedpreviously, the weldment appears to behave in a linearly elastic mannerup through the highest load level considered [185 MPa (26,830 psi)]. Theapparent departure from linearity at higher load levels noted in Figs.22 through 25 is felt to be due to the nonproportional loading imposedon the weldment by the adjacent base metal, which has yielded plastically.At location A on the edge of the weldment, the finite-element analysisatypically underpredicts the measured longitudinal and transverse strains.Also atypically, the inclusion of residual stresses into the analysisserves to improve the agreement between analysis and experiment at thislocation. The longitudinal strain at location B, in the center of theweldment, is quite well predicted by analysis, with a small improvementin the prediction being brought about by the incorporation of residualstresses into the analysis. The situation with the transverse strain component at location B is more typical, with the analysis overpredictingthe measured values and the inclusion of residual stresses worsening theprediction.
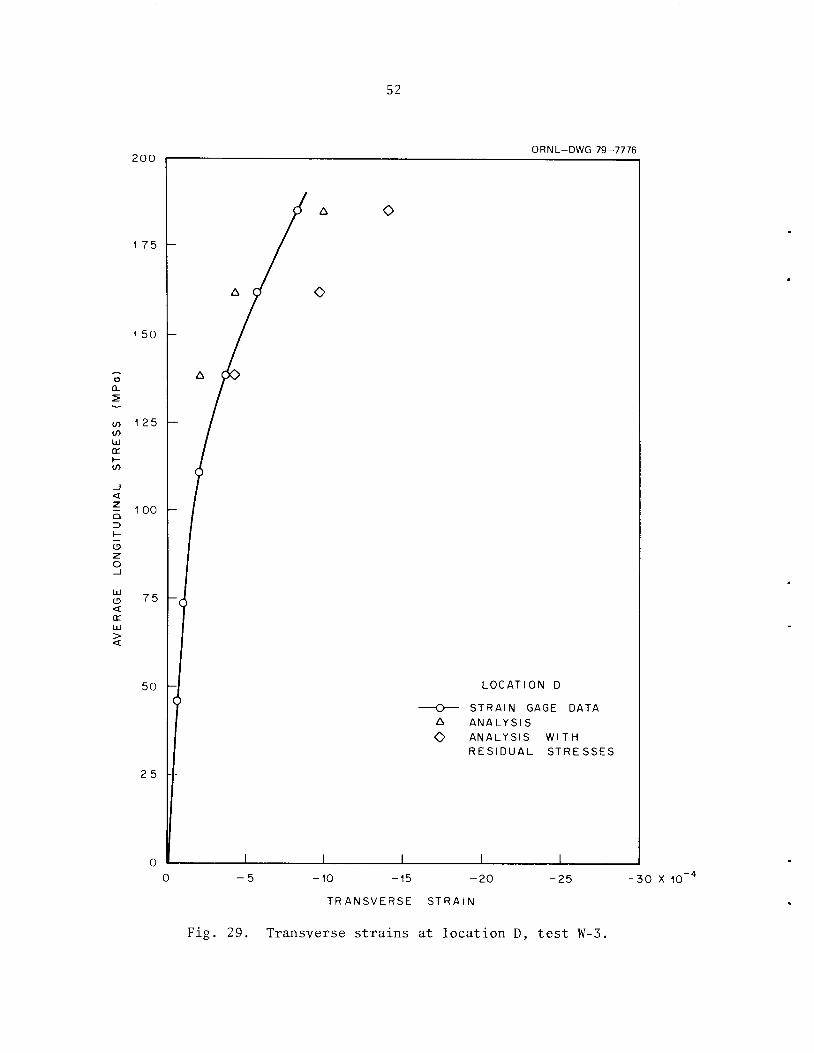
The worst comparison between measured and analytically predictedvalues occurred at locations C and D in the base metal immediately adjacent to the weldment. These locations span the weldment heat-affectedzone. Figures 26 through 29 show the measured and predicted longitudinal

200
45
ORNL-DWG 79-7769
_L
LOCATION A
-O STRAIN GAGE DATA
A ANALYSIS
O ANALYSIS WITH
RESIDUAL STRESSES
3 4 5
LONGITUDINAL STRAIN
Fig. 22. Longitudinal strains at location A, test W-3.
8X 10

200
46
ORNL-DWG 79-7770
I
LOCATION A
- STRAIN GAGE DATAA ANALYSIS
o ANALYSIS WITH
RESIDUAL STRESSES
-10 -15 -20
TRANSVERSE STRAIN
•25
Fig. 23. Transverse strains at location A, test W-3.
-30 X 10 4

o
CL
CO
CO
UJ
or
Q
CD
Z
o
CD<
or
UJ
><
200
175
150 -
125
100
75
50
25
47
ORNL-DWG 79-7771
LOCATION B
- STRAIN GAGE DATA
A ANALYSI S
o ANALYSIS WITH
RESIDUAL STRESSES
_L
3 4 5
LONGITUDINAL STRAIN
-38 X 10
Fig. 24. Longitudinal strains at location B, test W-3.

200
o
a.
CO
CO
UJ
or
o
3
CD
z
o
UJ
CD<
o:
UJ
>
175
150
125
100
50
25
48
ORNL-DWG 79-7772
o
o
_L
A
O
LOCATION B
STRAIN GAGE DATA
ANALYSIS
ANALYSIS WITH
RESIDUAL STRESSES
-L
-10 -15 -20
TRANSVERSE STRAIN
-25
Fig. 25. Transverse strains at location B, test W-3.
-30 X 10

COCO
UJ
or
Q
CD
Z
o
UJ
CD
<or
UJ
><
200
175
150
125
100
75
50
25
49
ORNL-DWG 79-7773
o
o
o
LOCATION C
- STRAIN GAGE DATA
A ANALYSIS
o ANALYSIS WITH
RESIDUAL STRESSES
3 4 5
LONGITUDINAL STRAIN
Fig. 26. Longitudinal strains at location C, test W-3.
-38X10

o
Q.
CO
CO
UJ
Q
I-
CD
Z
o
LU
CD
<
or
UJ
><
200
175
150
125
1 00
75
50
25
A
o
-5
50
ORNL-DWG 79-7774
o
_L
o
LOCATION C
- STRAIN GAGE DATA
A ANALYSIS
o ANALYSIS WITH
RESIDUAL STRESSES
-10 -15 -20
TRANSVERSE STRAIN
•25 -30 X 10
Fig. 27. Transverse strains at location C, test W-3.
- 4

CO
CO
UJ
or
200
1 75
1 50
1 25
3 10°
CD
Z
o
UJ
CD
<
or
UJ
><
75
50
25 -
A O
51
ORNL-DWG 79-7775
o
LOCATION D
- STRAIN GAGE DATA
A ANALYSIS
o ANALYSIS WITH
RESIDUAL STRESSES
3 4 5
LONGITUDINAL STRAIN
8 X 10
Fig. 28. Longitudinal strains at location D, test W-3.
CO
CO
UJ
o:
HCO
o
CD
z
o
UJ
CD
<or
UJ
><
200
1 75
1 50
1 25
100
52
ORNL-DWG 79-7776
o
_L
LOCATION D
-O— STRAIN GAGE DATA
A ANALYSIS
O ANALYSIS WITHRESIDUAL STRESSES
10 -15 -20
TRANSVERSE STRAIN
-25
Fig. 29. Transverse strains at location D, test W-3.
-30 X 10"

53
and transverse strain values at these locations. It is apparent from the
figures, as well as from Table 3, that the analysis predicts strain mag
nitudes at the higher load levels which are considerably in excess of the
measured values. The inclusion of residual stresses into the analysis
acts to worsen the agreement. Table 3 indicates that the tendencies of
the analysis to overpredict the measured strains in the neighborhood of
the weldment and for the inclusion of residual stresses into the analysis
to result in further overprediction is a general one. An exception to
this statement occurs, as previously noted, at locations on the weldment
itself.
The moire fringe patterns obtained from the W-3 test were of quite
good quality (Fig. 5), but the resulting strain data were degraded to
some extent by the introduction of fictitious strains arising from out-
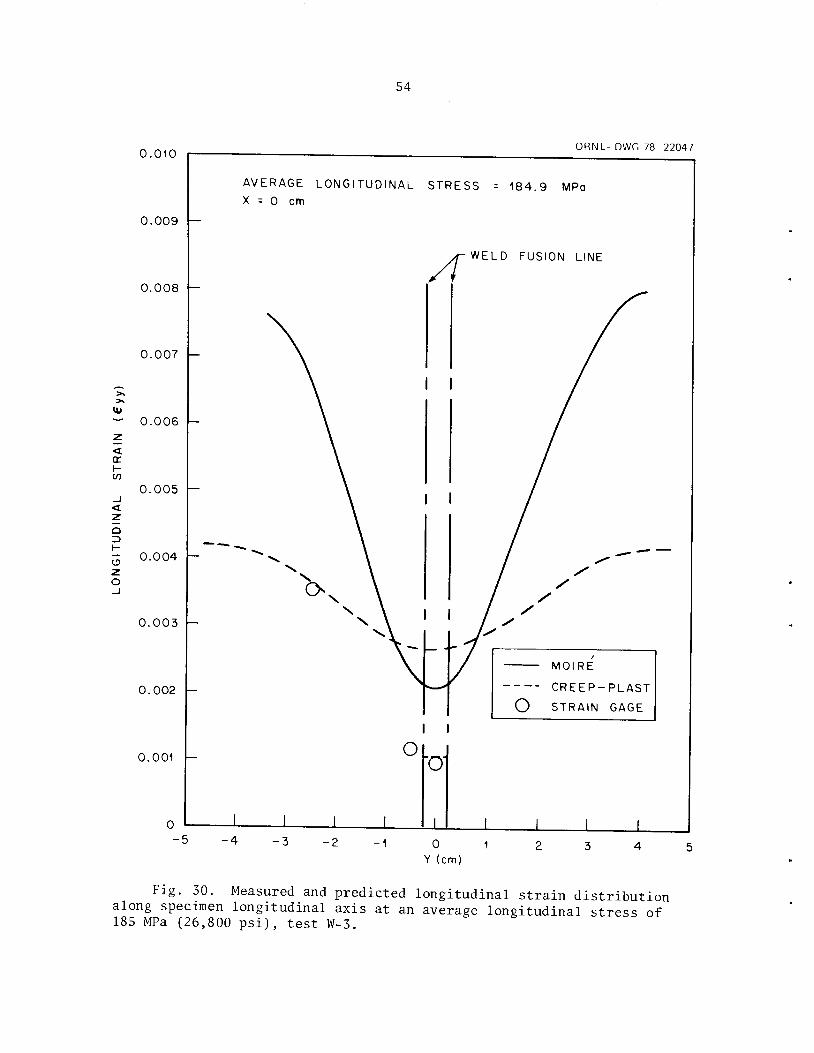
of-plane specimen motions. Figure 30 shows the longitudinal strain dis
tribution derived from the moire data along the longitudinal axis of the
specimen at an average longitudinal stress of 185 MPa (26,830 psi);
strain-gage data and analytical predictions (without the inclusion of
residual stress effects) are included for comparison. The strain-
restricting effect of the weldment is evident.
Figure 31 shows the transverse strain distribution across the speci
men along the line y = 0.89 cm (0.35 in.) at an average longitudinal
stress of 162 MPa (23,500 psi), as obtained by the moire technique,
finite-element analysis (without residual stresses), and strain-gage
data. The strain-gage data and the finite-element analysis are seen to
be in reasonably good agreement, but the moire-derived strains are con
siderably in excess of these. Again this is attributed partly to appar
ent strains introduced by out-of-plane specimen motion.
0.010
0.009
0.008
0.007
ID
- 0.006 h-
<or
0.005
a
3 0.004
0.003
0.002
0.001
54
AVERAGE LONGITUDINAL STRESSX - 0 cm
ORNL- DWG 78-22047
184.9 MPa
WELD FUSION LINE
I I
Oo
MOIRE
CREEP-PLAST
O STRAIN GAGE
-5 -4 -2 0
Y (cm)
Fig. 30. Measured and predicted longitudinal strain distributionalong specimen longitudinal axis at an average longitudinal stress of185 MPa (26,800 psi), test W-3.

(X10
0
-10
-15
-20
-25
-30
-4
o
55
ORNL-DWG 79-7777
o
MOIRE
ANALYSIS
O STRAIN GAGE
-1 0
x (cm)
o
Fig. 31. Measured and predicted transverse strain distributionalong the line y = 0.89 cm (-0.35 in.) at an average longitudinal stressof 162 MPa (23,500 psi), test W-3.

56
6. DISCUSSION AND CONCLUSIONS
The purpose of this series of tests was to acquire accurate room-
temperature deformation data in the neighborhood of a weldment in a rela
tively long, narrow plate under uniaxial loading in order to experimen
tally assess the effect of the weldment upon the deformation field in
the specimen. An equally important objective was to determine whether
or not a finite-element analysis based on the two-property zone approach,
using one set of material properties for the base metal and another for
the weld metal, could accurately predict the observed strains. The ef
fect of an initial residual stress field upon the analytical predictions
was also of considerable interest.
It was found experimentally that the weld tended to act somewhat as
a stiffener, restricting the strains in the neighborhood of the weldment
to some fraction of their value at locations further removed from the
weldment, where conditions were essentially those of uniaxial stress.
In the two specimens containing welds in the annealed condition (tests
W-l and W-2), this effect was not so pronounced since the material prop
erties of the annealed 308 stainless steel weld metal do not differ
greatly from those of the 304 stainless steel base metal. However, it
was particularly apparent in the specimen containing a weldment in the
as-deposited condition (test W-3), as here the yield strength of the weld
metal was about twice that of the base metal.
Residual stress measurements were made on two specimens similar to
the three tested — one containing an annealed weldment and the other a
weldment in the as-deposited condition. Not surprisingly, it was found
that the residual stress levels in the annealed weld specimen were on the
order of one-third to one-half of the values measured in the as-deposited
weld specimen. The measured values in both specimens were of reasonably
consistent variation over the field of measurement, allowing an ideal
ization of the stress field to be constructed for use in finite-element
analyses. One qualitative difference between the residual stress fields
measured on the two specimens was that the a components were usually of
opposite sign, being generally positive on the as-deposited weld speci
men and generally negative on the annealed weld specimen. The reason
for this difference is not readily apparent.

57
The finite-element analyses for the two tests with annealed weld
specimens (tests W-l and W-2) yielded fair agreement with measured longitudinal strain values, but the agreement with measured transverse strain
values was considerably poorer. The analysis consistently overestimated
the measured strains at the highest load level considered, and in the
case of the transverse strains sometimes by a factor of as much as two.
The inclusion of the residual stress field measured on the annealed weld
specimen into the analysis of the W-2 test did not, unfortunately, serveto remedy this situation. It instead usually worsened the degree of agreement by causing overprediction of the measured strains to an even greater
extent.
These tendencies were somewhat magnified in the W-3 test, where the
agreement between analysis and experiment was generally poorer than thatnoted in tests W-l and W-2. This was especially true at locations in
the base metal encompassing the heat-affected zone immediately adjacent
to the weldment. As in the analysis of tests W-l and W-2, the usual
tendency of the analysis was to overpredict the measured strains at thehigher load levels. Again the inclusion of the residual stress fieldmeasured on the as-deposited weld specimen in the analysis of the W-3 test
usually tended to worsen the agreement between analysis and experiment,
often to a significant extent.
It is not apparent which of the assumptions inherent in the analyses
of the three tests are responsible for this generally unsatisfactory
agreement between analytical predictions and experimental results. Oneobvious concern is the basic validity of the two-zone analytical approach,
which neglects the effects of mechanical properties in the heat-affectedzone which may differ from those of either the weld metal or the unaf
fected portion of the base metal. In the absence of realistic mechanical properties for heat-affected zone material, it is impossible to assessthe effects of neglecting the heat-affected zone. However, it may bethat more than two property zones are required in order to obtain accurate deformation predictions in and around a weldment. We may obtainsome guidance here by a consideration of Figs. 32 and 33. These arephotographs taken, respectively, of the weld cross section of the annealedand as-deposited weld specimens used for residual stress measurements.

58
Fig. 32. Weld cross section of annealed plate-weldment specimen.
The sections were etched so as to make visible the heat-affected zone,
which is characterized in these photographs by a lighter color and a
larger grain size than the surrounding base metal. The heat-affected
zone in the annealed specimen is seen, surprisingly enough, to be fairly
large, while that in the as-deposited specimen consists of only a thin
layer adjacent to the weld-base metal interface. This difference is
attributed to the large heat input generated by the shielded-metal arc

59
|Y159591
Fig. 33. Weld cross section of as-deposited plate-weldment specimen.
technique used in welding the annealed specimens. Apparently this re
sulted in a heat-affected zone of comparatively large size which the
annealing process did not entirely remove. On the other hand, the gas-
tungsten arc process used in welding the as-deposited specimens involves
relatively little heat input, and thus only a small heat-affected zone
is generated. From the size of the heat-affected zone observed in the
annealed specimen, it appears that the use of the two-zone approach may

60
have resulted in some degree of error in the analyses of tests W-l and
W-2. However, the small size of the heat-affected zone observed in the
as-deposited specimen makes it unlikely that neglecting the heat-affectedzone significantly affected the results of the W-3 analysis.
Similar comments pertain to any consideration of possible anisotropy or inhomogeneity in the weld metal mechanical properties, since
very little data are available concerning either of those factors. How
ever, in the present case, it seems likely that the thinness of the platespecimens would serve to minimize the effects of inhomogeneities. Also,some available experimental data10 on anisotropics in 308 stainless
steel weld metal suggest that the normal to the plane of the specimenmay be nearly an axis of isotropy. This supports the use of in-planeisotropic weld metal properties, so it is felt that this assumption doesnot contribute significantly to the inaccuracies of the analysis.
An assumption which may have more serious consequences, particularlyin analysis of the W-3 test, is the modeling of the double-V weld jointgeometry as a straight-sided joint of uniform width throughout the thick
ness of the plate. This simplification was introduced in order to allow
a two-dimensional plane-stress analysis of the tests. The effects of
this assumption are difficult to judge; to do so fully would require acostly and time-consuming three-dimensional analysis or at best an ideal
ized two-dimensional plane-strain analysis of across section of the specimen. However, given the large differences between the material properties of the as-deposited 308 stainless steel weld metal and the 304stainless steel base metal, it may be that this assumption is responsiblefor apart of the rather large discrepancy between analysis and experiment present at locations immediately adjacent to the weldment in the W-3test.
Another possible source of analytical error is the material properties used for the weld metal. As described in aprevious section, theproperties used for weld metal in the annealed condition were estimatedin an approximate fashion from the test data. In the absence of otherdata, it is difficult to estimate the error incurred by this procedure.The material properties for weld metal in the as-deposited condition wereobtained in a more rational fashion from uniaxial tests of all-weld metal

61
specimens. However, the specimens used in those uniaxial tests were laid
down by a different welding process (shielded metal arc), and also used
a different heat of weld metal, than that used in welding the W-3 speci
men. The possible effects of the welding process upon the weld metal
material properties are uncertain, but it is known that different heats
of the same material may exhibit significant differences in their inelas
tic properties.13 Thus, these factors could have influenced the analyti
cal error. To avoid these uncertainties in the future, subsequent weld
ment tests will utilize specimens fabricated by a single welding process
(gas-tungsten arc) using a single heat of weld metal with well-charac
terized material properties.
All the above mentioned considerations certainly had some effect on
the errors involved in the analyses; however, it is difficult to estimate
the extent to which each contributed to the total error or to account for
the generally overpredictive tendencies of the analyses. Perhaps the
most puzzling feature of the analytical results is that when an attempt
was made to explicitly take into account the residual stress field mea
sured on similar specimens, the analyses yielded predictions which were
usually in worse agreement with experimental results than were the pre
diction of analyses without the inclusion of the residual stress fields.
Since the usual tendency of the analyses was to overpredict the measured
strains, it was hoped that analytical inclusion of the residual stress
fields would act to reverse this trend and to lower the predicted strain
values. Instead, the opposite effect was observed.
The reason for this particular behavior seems fairly apparent from
a consideration of the idealized residual stress fields (Figs. 10 and 11)
and the manner in which these were included into the analysis. As dis
cussed in Section 4, the principal effect that the residual stress field
had on the analysis was to alter the load level at which plastic yield
ing was calculated to occur, either retarding or advancing the onset of
yielding. In order to reduce the magnitude of the analytically calcu
lated strains, the residual stress field would in general have had to
delay the onset of yielding to a higher load level than would have been
predicted by an analysis without the inclusion of residual stresses. We
may note from Figs. 10 and 11, however, that the sign of the idealized
62
residual stress values is usually such that when these are added to the
stresses imposed by loading, the effect is to predict the occurrence of
yielding at a lower load level than would have occurred had the resid
ual stresses not been considered. By way of example, the analysis with
out residual stresses predicts tensile longitudinal (a ) stresses andyy
compressive transverse (a ) stresses in the base metal portion of the
specimen in the neighborhood of the longitudinal centerline. In Fig. 10
we see that the residual stresses in this area also have those signs,
indicating that plastic yielding would be expected to occur at a lower
load level in this portion of the specimen. Figure 11, depicting the
idealized residual stress pattern for the as-deposited weld specimen,
shows large positive longitudinal (a ) stresses on the longitudinal cen-yy
terline, which again result in yielding at a lower load level. In fact,
the inclusion of residual stresses into the W-3 analysis lowers the load
level at which initial yielding occurs from an average longitudinal
stress of 154 MPa (22,300 psi) to 76.9 MPa (11,200 psi). Thus, at a
given load level above the yield point, a considerably greater amount of
plastic strain is predicted by the analysis including residual stresses
as compared to that in which the residual stresses are ignored.
It is not readily apparent why the inclusion of the measured resid
ual stress fields into the analyses should have had the effect of generally
worsening the agreement between analysis and experiment instead of im
proving it as might have been expected. The most likely explanation
seems to lie in the assumption that the location of the yield surface in
the specimens was unaffected by prior inelastic deformations induced by
the welding process; i.e., that the yield surface was initially isotropi-
cally oriented in deviatoric stress space. These prior inelastic defor
mations due to thermal stresses are, of course, the primary mechanism
responsible for the existence of the residual stress fields. In order
to account for the motion of the yield surface in stress space during
welding, a detailed thermomechanical analysis of the welding process
would be required, which is an exceptionally difficult task. Hence, the
assumption that the location of the yield surface was unaffected by the
welding process was made. If, however, the yield surface shifted sub
stantially during welding, as seems likely, this effect could well act

63
to produce the lower than predicted strains by delaying the onset of
yielding to a higher load level. However, without some qualitative de
scription of the behavior of the specimen during the welding process, it
is impossible to include this effect in the finite-element analysis.
Simplified models of the welding process may offer some hope here. It
is apparent that the residual stress field has a significant effect on
the room-temperature elastic-plastic deformation behavior of welded
specimens. However, it seems that a knowledge of the residual stress
field may not, by itself, be sufficient to allow accurate deformation
predictions to be made.
The effect of the residual stress field upon the deformation behav
ior of welded components of elevated temperatures is more questionable.
In this situation the residual stresses may relax with time to the point
where they no longer have a significant effect on the component behavior.
A recent analysis of a pipe-wall section containing an assumed residual
stress field and subjected to cyclic thermal loading indicated that after
10 to 12 cycles the behavior of the structure was essentially unaffected
by the residual stress field.

64
ACKNOWLEDGMENTS
The authors are grateful to J. A. Clinard for his advice and assis
tance in the analytical portion of this study. They also wish to ac
knowledge the efforts of W. F. Jackson in making the residual stress
measurements; to D. T. Godwin in the preparation of the figures; and to
S. J. Claiborne, H. D. Curtis, and E. H. Guinn for assistance in speci
men preparation, including instrumentation and testing. A special note
of appreciation is expressed to W. J. McAfee for his assistance in
incorporating comments and preparation of the final report.

65
REFERENCES
1. R. T. King et al., Creep Properties of a Type 308 Stainless SteelPressure Vessel Weld with Controlled Residual Elements, ORNL/TM-4131(May 1973).
2. D. G. Berghaus and J. P. Cannon, "Obtaining Derivatives from Experimental Data Using Smoothed Spline Functions," Exp. Mech. 13, 38-42(January 1973).
3. G. C. Smith and P. P. Holz, Repair Weld Induced Residual Stresses inThick-Walled Steel Pressure Vessels, ORNL/NUREG/TM-153 (June 1978).
4. A. J. Bush and F.J. Kromer, "Simplification of the Hole-DrillingMethod of Residual Stress Measurement," ISA Trans. 12, 249 (1973).
5. E. M. Beaney, Accurate Measurement of Residual Stress on Any SteelUsing the Center Hole Method, RD/B/N3568, Berkeley Nuclear Laboratories, Central Electricity Generating Board (December 1975).
6. J. A. Williams, Marchwood Engineering Laboratories, Central ElectricityGenerating Board, personal communication.
7. J. M. Corum et al., Interim Guidelines for Detailed Inelastic Analysisof High-Temperature Reactor System Components, ORNL-5014 (December1974).
8. J. A. Clinard and R. W. Swindeman, "Room-Temperature Properties for1-in. Plate of Heat 9T2796 of Type 304 Stainless Steel," in High-Temperature Structural Design Program Semiannu. Prog. Rep. June 30,1977, ORNL-5339, p. 153.
9. R. T. King, Metals and Ceramics Division, Oak Ridge National Laboratory, unpublished data.
10. B. R. Dewey et al., "Measurements of Anisotropic Elastic Constantsof Type 308 Stainless Steel Electroslag Welds," Exp. Mech. 17, 420-26 (November 1977).
11. R. T. King and E. Boiling, "Effect of Postweld Heat Treatment on theTensile Properties of Type 308 Stainless Steel Weld Metal with Controlled Residual Elements," in Mechanical Properties Test Data forStructural Materials Quarterly Prog. Rep. April 30, 1974, ORNL-4963,pp. 135-^0.
12. R. T. King and E. Boiling, "Creep of Type 308 Stainless Steel Weldsin the Transverse-to-the-Weld Direction at 593°C, in Mechanical Properties Test Data for Structural Materials Quarterly Prog. Rep.Jan. 31, 1975, ORNL-5104, pp. 185-91.

66
13. H. E. McCoy, Tensile and Creep Properties of Several Heats of Type304 Stainless Steel, ORNL/TM-4709 (November 1974).
14. T. J. Delph and W. K. Sartory, "Simulation of Residual Stress in aThermal Ratchetting Problem," in High-Temperature Structural DesignProgram Semiannu. Prog. Rep. Dec. 31, 1978, ORNL-5540 (be be published) .

67
ORNL/TM-6669Dist. Category UC-79,-79h, -79k
INTERNAL DISTRIBUTION
1. R. L. Battiste
2. J. J. Blass
3. S. E. Bolt
4. C. R. Brinkman
5. S.-J. Chang6. J. A. Clinard
7-16. J. M. Corum
17. J. R. Ellis
18. D. T. Godwin
19. G. M. Goodwin
20. W. L. Greenstreet
21. R. C. Gwaltney22. R. L. Huddleston
23. S. K. Iskander
24. K. C. Liu
25. R. L. Klueh
26. W. J. McAfee
27. S. E. Moore
28. c. E. Pugh
29. M. Richardson
30. W. K. Sartory
31. G. M. Slaughter32. J. P. Strizak
33. R. W. Swindeman
34. G. T. Yahr
35. Patent Office
36-37. Central Research Library38. Y- 12 Document Reference Section
39-46. Laboratory Records Department47. Laboratory Records (RC)
Subcontractors
48. A. Levy, Grumman Aerospace Corp., Bethpage, NY 1171449. C. E. Jaske, Battelle-Columbus Laboratories, Columbus, OH 4320150. W. J. O'Donnell, O'Donnell and Associates, Pittsburgh, PA 1523651. D. H. Pai, Foster-Wheeler Energy Corp., Livingston, NJ 07029
EXTERNAL DISTRIBUTION
52-53. Director, Division of Reactor Research and Technology, Departmentof Energy, Washington, D.C. 20545
54. Director, Nuclear Research and Development Division, 0R055. Assistant Manager, Energy Research and Development, ORO
56-283. Given distribution as shown in TID-4500 under categories UC-79,-79h, -79k
*U.S. GOVERNMENT PRINTING OFFICE: 1979-640-079-168
Related Documents


