Ron Plain Professor of Agricultural Economics University of Missouri- Columbia http://web.missouri.edu/~plainr/ Pork Outlook Midwest/Great Plains & Western Outlook Conference Indianapolis, August 2007

Ron Plain Professor of Agricultural Economics University of Missouri-Columbia plainr/ Pork Outlook Midwest/Great Plains & Western.
Dec 19, 2015
Welcome message from author
This document is posted to help you gain knowledge. Please leave a comment to let me know what you think about it! Share it to your friends and learn new things together.
Transcript

Ron PlainProfessor of Agricultural EconomicsUniversity of Missouri-Columbiahttp://web.missouri.edu/~plainr/
Pork Outlook
Midwest/Great Plains & Western Outlook Conference Indianapolis, August 2007

Production efficiencyHog cycleSeasonalityCost of productionInternational tradeSlaughter capacityDemand
Long Run Factors

Production Efficiency
Pigs Per Litter, 1930-2006USDA Hogs & Pigs Reports
5.5
6.0
6.5
7.0
7.5
8.0
8.5
9.0
9.519
30
1935
1940
1945
1950
1955
1960
1965
1970
1975
1980
1985
1990
1995
2000
2005
Head
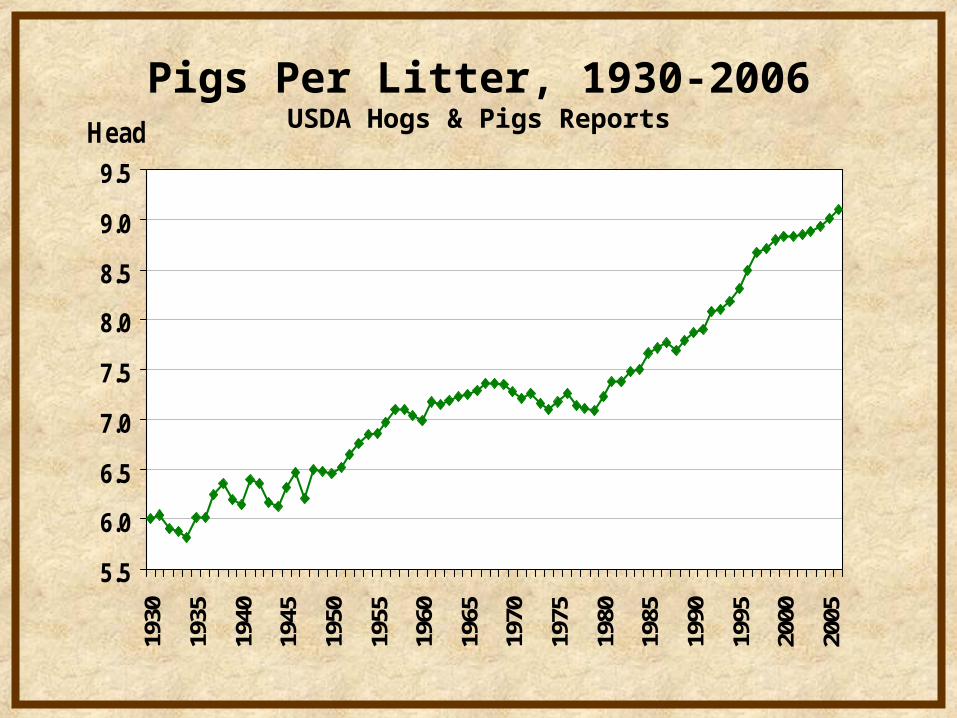
Litters Per Sow Per Year, 1930-2006
1.0
1.2
1.4
1.6
1.8
2.0
2.219
30
1935
1940
1945
1950
1955
1960
1965
1970
1975
1980
1985
1990
1995
2000
2005
Litters

Average U.S. Hog Carcass Weight, 1930-2006
110
120
130
140
150
160
170
180
190
200
210
30
35
40
45
50
55
60
65
70
75
80
85
90
95
00
05
Pounds
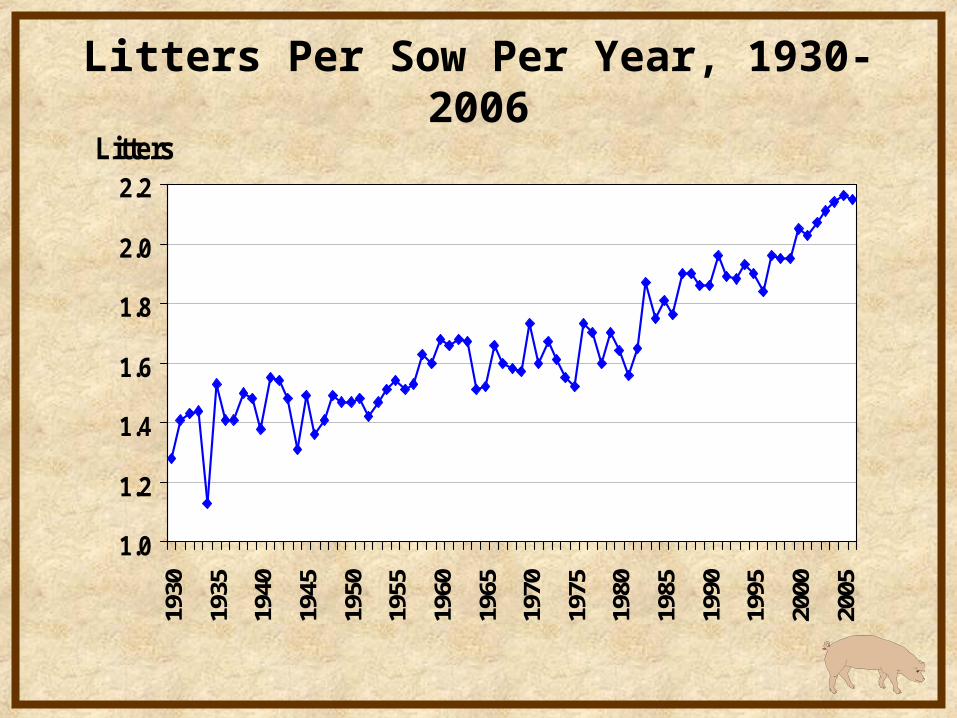
Annual U.S. Pork Production Per Sow, 1930-2006
0
500
1,000
1,500
2,000
2,500
3,000
3,500
4,000
4,500
1930
1935
1940
1945
1950
1955
1960
1965
1970
1975
1980
1985
1990
1995
2000
2005
Pounds

Annual U.S. Pork Production Per Sow, 1930-2006
0
500
1,000
1,500
2,000
2,500
3,000
3,500
4,000
4,500
1930
1935
1940
1945
1950
1955
1960
1965
1970
1975
1980
1985
1990
1995
2000
2005
Pounds
1930-80 growth rate: 2.027%
1980-06 growth rate 2.793%

U.S. Live Hog Imports, 1930-2006
0
1
2
3
4
5
6
7
8
9
10
30 35 40 45 50 55 60 65 70 75 80 85 90 95 00 05
Million Head
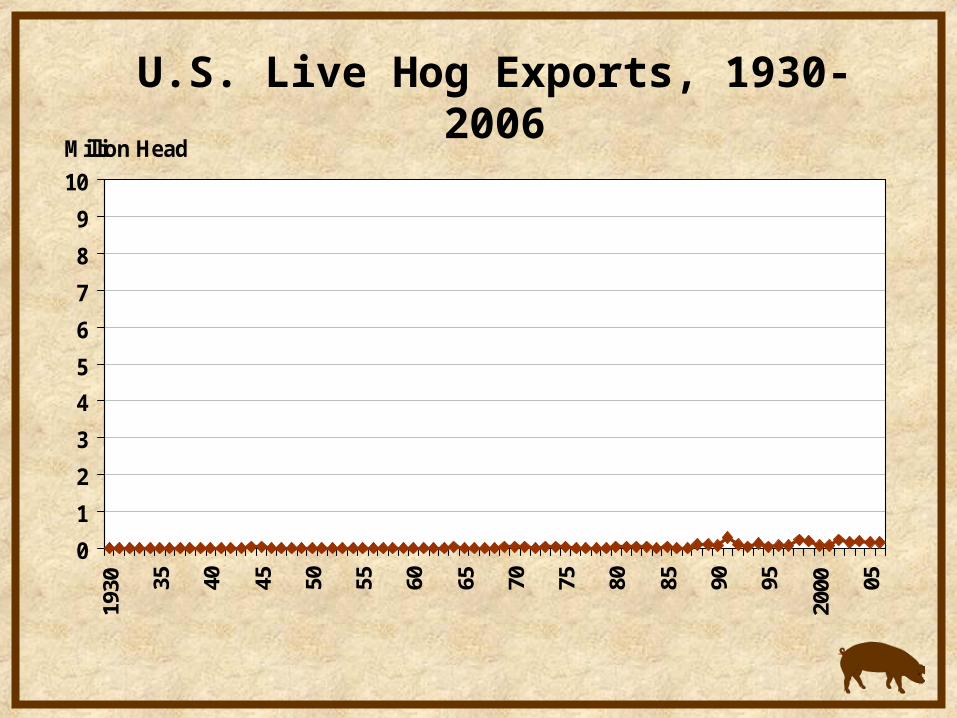
U.S. Live Hog Exports, 1930-2006
0
1
2
3
4
5
6
7
8
9
10
1930 35 40 45 50 55 60 65 70 75 80 85 90 95
2000 05
Million Head

Net U.S. Live Hog Imports, 1930-2006
-1
0
1
2
3
4
5
6
7
8
9
10
1930 35 40 45 50 55 60 65 70 75 80 85 90 95
2000 05
Million Head

Annual U.S. Pork Production Per Sow, 1930-2006
0
500
1,000
1,500
2,000
2,500
3,000
3,500
4,000
4,500
1930
1935
1940
1945
1950
1955
1960
1965
1970
1975
1980
1985
1990
1995
2000
2005
Pounds
total domestic

Annual U.S. Pork Production Per Sow, 1930-2006
0
500
1,000
1,500
2,000
2,500
3,000
3,500
4,000
4,500
1930
1935
1940
1945
1950
1955
1960
1965
1970
1975
1980
1985
1990
1995
2000
2005
Pounds
1930-80 growth rate: 2.027%
1980-06 growth rate 2.793%
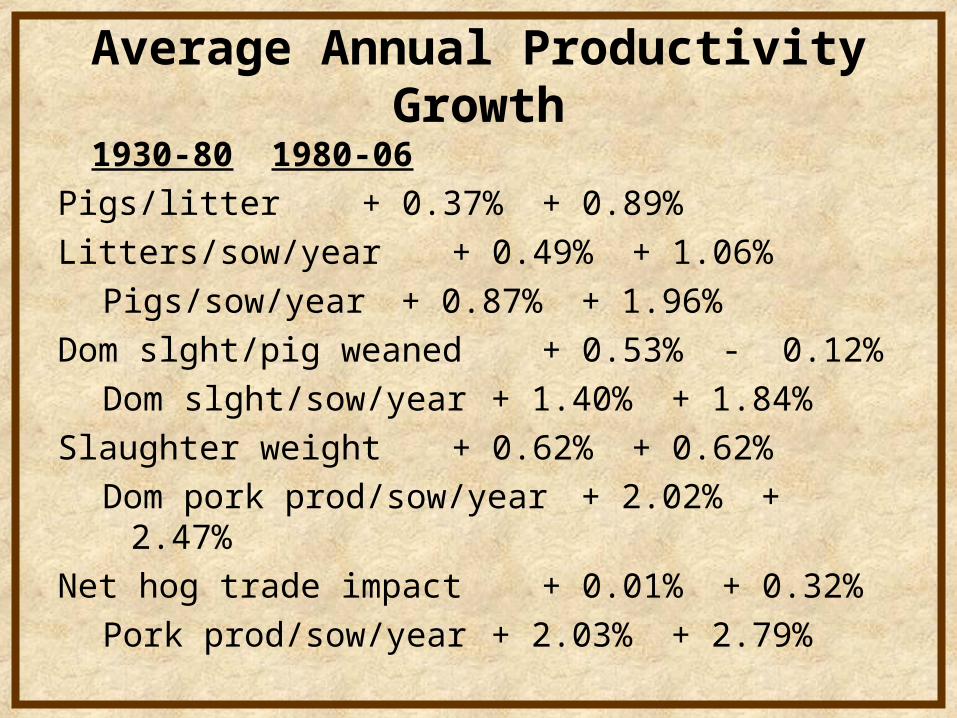
Average Annual Productivity Growth
1930-80 1980-06
Pigs/litter + 0.37% + 0.89%
Litters/sow/year + 0.49% + 1.06%
Pigs/sow/year + 0.87% + 1.96%
Dom slght/pig weaned + 0.53% - 0.12%
Dom slght/sow/year + 1.40% + 1.84%
Slaughter weight + 0.62% + 0.62%
Dom pork prod/sow/year + 2.02% + 2.47%
Net hog trade impact + 0.01% + 0.32%
Pork prod/sow/year + 2.03% + 2.79%

Hog Cycle

U.S. Commercial Hog SlaughterQuarterly Data, 1970-2007
-30
-20
-10
0
10
20
30
70
72
74
76
78
80
82
84
86
88
90
92
94
96
98
00
02
04
06
% change from year ago

Terminal Market Barrow & Gilt PriceQuarterly Data 1970-2007
-60
-40
-20
0
20
40
60
80
70 72 74 76 78 80 82 84 86 88 90 92 94 96 98 00 02 04 06
% change from year ago

Hog Price FlexibilityQuarterly Data 1970-2007
-30
-25
-20
-15
-10
-5
0
5
10
1570 72 74 76 78 80 82 84 86 88 90 92 94 96 98 00 02 04 06
% ch T Mkt B&G price / % ch com hog slt
In 8 of last 15 quarters, price & slaughter moved in the same direction

Seasonality

Average U.S. Daily Pork Production
60
65
70
75
80
85
90
Jan Feb Mar Apr May Jun Jul Aug Sep Oct Nov Dec
Million Lbs
1990-99 2000-06

U.S. Monthly Average Hog Price
36
38
40
42
44
46
48
50
52
Jan Feb Mar Apr May Jun Jul Aug Sep Oct Nov Dec
$/cwt
1990-99 2000-06

July to November Changes
Daily Pork Production• 1970s +30%• 1980s +24%• 1990s +20%• 2000- 6 +18%
Barrow & Gilt Prices• 1970s -11%• 1980s -13%• 1990s -20%• 2000- 6 -18%
Cost of Production

Cost of Slaughter Hog ProductionIowa State University Calculations, 1987-2007
37
39
41
43
45
47
49
51
53
55
1987
1988
1989
1990
1991
1992
1993
1994
1995
1996
1997
1998
1999
2000
2001
2002
2003
2004
2005
2006
2007
Marketing Month
$ Per Live Cwt
Source: John Lawrence, Iowa State University

OMAHA CORN PRICESWeekly
1.251.501.752.002.252.502.753.003.253.503.754.004.254.50
$ Per Bu.
Avg.1999-03
2005
2006
2007

Ethanol Capacity Growth
0
2
4
6
8
10
12
2001 2002 2003 2004 2005 2006 2007
bil
lio
n g
al.
Jan. 1 capacity Under construction
Source: Renewable Fuel Association website
http://www.ethanolrfa.org/industry/statistics/#B

Corn Milled for Ethanol
0.0
1.0
2.0
3.0
4.0
5.0
6.090
-91
92-9
3
94-9
5
96-9
7
98-9
9
00-0
1
02-0
3
04-0
5
06-0
7
08-0
9
Billi
on B
ushe
ls
Forecast
% corn for ethanol:2000-01: 6%2005-06: 14%2006-07: 20%2007-08: 26%

International Pork Trade
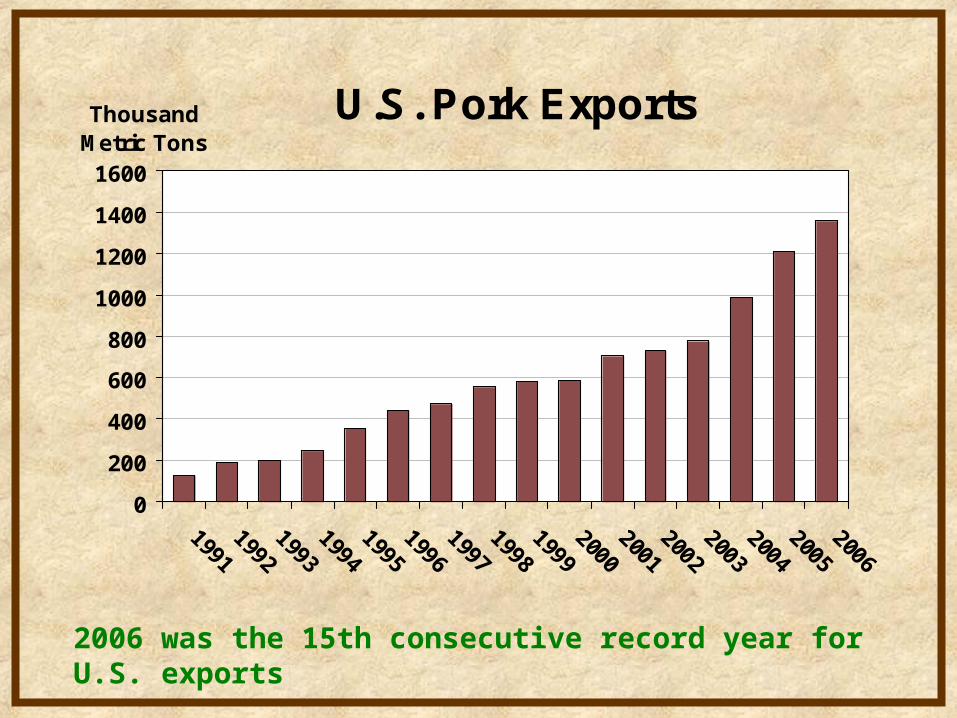
U.S. Pork Exports
0
200
400
600
800
1000
1200
1400
1600
Thousand Metric Tons
2006 was the 15th consecutive record year for U.S. exports
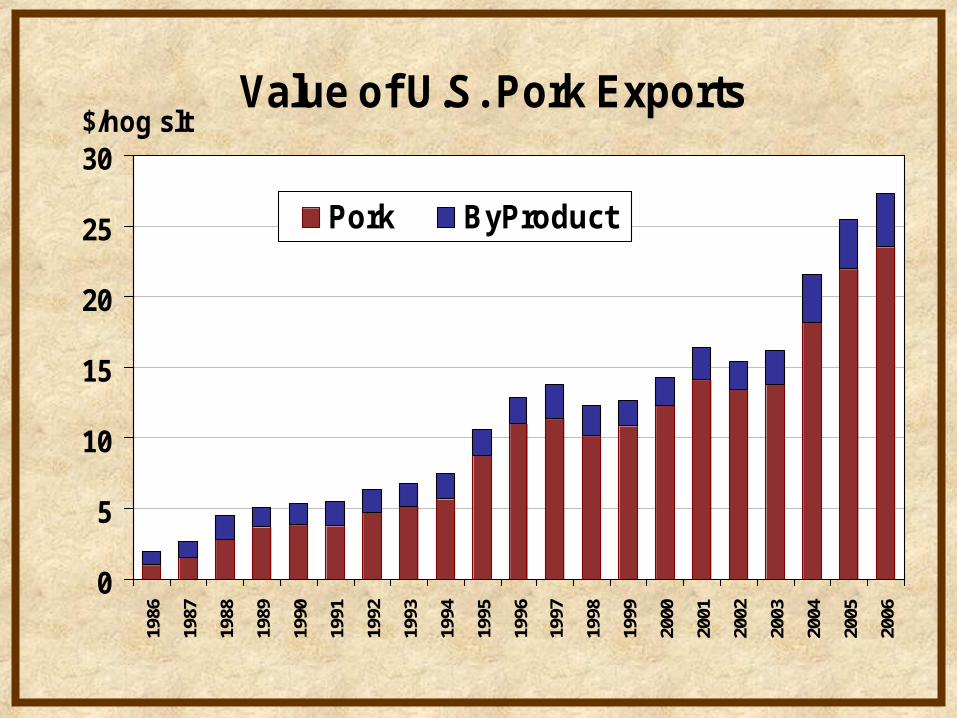
Value of U.S. Pork Exports
0
5
10
15
20
25
3019
86
1987
1988
1989
1990
1991
1992
1993
1994
1995
1996
1997
1998
1999
2000
2001
2002
2003
2004
2005
2006
$/hog slt
Pork ByProduct

Iowa Farrow to Finish Profits, 1994-2006Iowa State University Calculations
-70
-50
-30
-10
10
30
50
1994
1995
1996
1997
1998
1999
2000
2001
2002
2003
2004
2005
2006
$ Per Head
Source: John Lawrence, Iowa State University
35 consecutive months of profit, longest of record
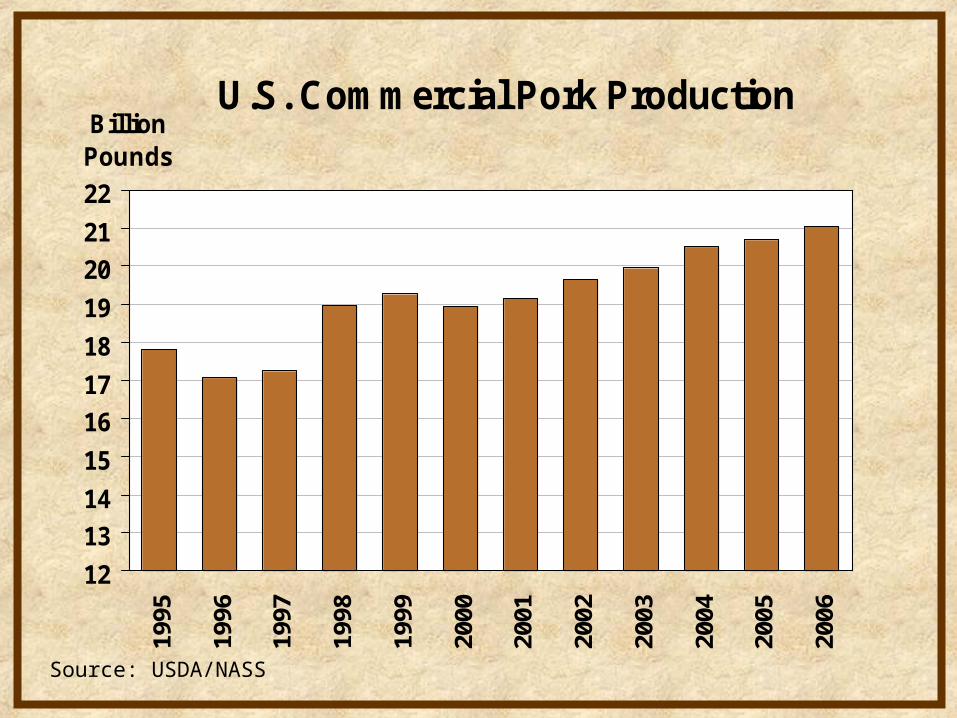
U.S. Commercial Pork Production
12
13
14
15
16
17
18
19
20
21
2219
95
1996
1997
1998
1999
2000
2001
2002
2003
2004
2005
2006
Billion Pounds
Source: USDA/NASS

U.S. Pork ExportsCarcass Weight Equivalent
0
0.5
1
1.5
2
2.5
3
3.5
1995
1996
1997
1998
1999
2000
2001
2002
2003
2004
2005
2006
Bill
ion
Pou
nds
Source: USDA/ERS

U.S. Pork ImportsCarcass Weight Equivalent
0
0.2
0.4
0.6
0.8
1
1.2
1.4
1995
1996
1997
1998
1999
2000
2001
2002
2003
2004
2005
2006
Bil
lio
n P
ou
nd
s
Source: USDA/ERS
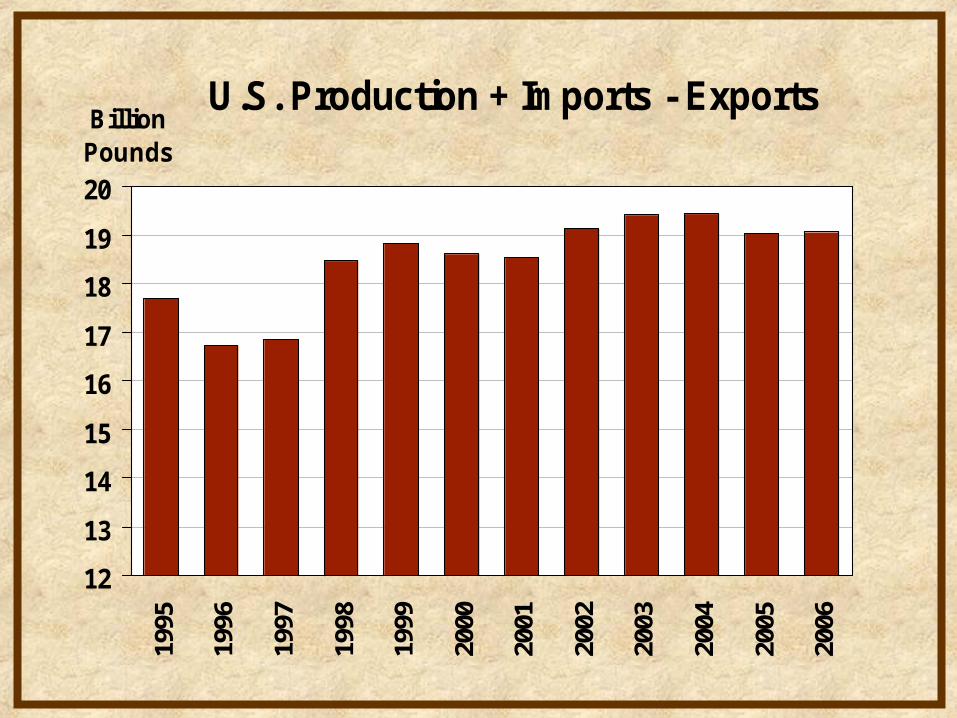
U.S. Production + Imports - Exports
12
13
14
15
16
17
18
19
2019
95
1996
1997
1998
1999
2000
2001
2002
2003
2004
2005
2006
Billion Pounds

U.S. Per Capita Pork Consumption
30
35
40
45
50
5519
95
1996
1997
1998
1999
2000
2001
2002
2003
2004
2005
2006
Pounds
Source: USDA/ERS

U.S. Retail Pork Price
170
190
210
230
250
270
29019
95
1996
1997
1998
1999
2000
2001
2002
2003
2004
2005
2006
Cents Per Pound
Source: USDA/ERS
Pork Trade Overview
The steady decrease in US pork imports and increase in pork exports has caused per capita US pork consumption to decline.
Thus, hog producers were able to enjoy three
consecutive years with record hog slaughter and profitable prices.
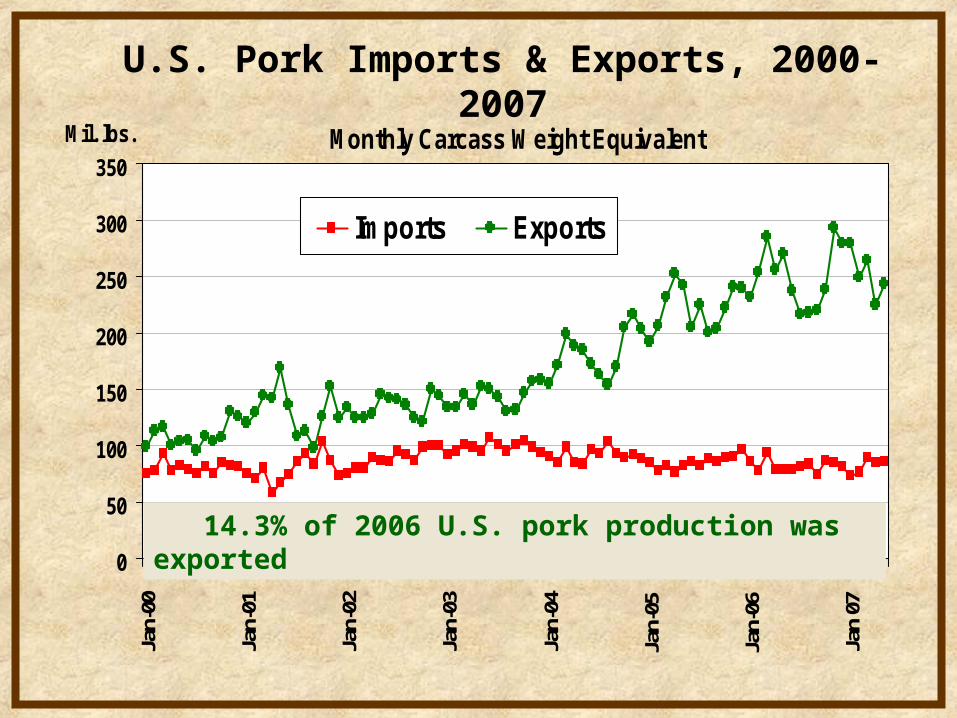
U.S. Pork Imports & Exports, 2000-2007Monthly Carcass Weight Equivalent
0
50
100
150
200
250
300
350Ja
n-00
Jan-
01
Jan-
02
Jan-
03
Jan-
04
Jan
-05
Jan
-06
Jan
07
Mil. lbs.
Imports Exports
14.3% of 2006 U.S. pork production was exported
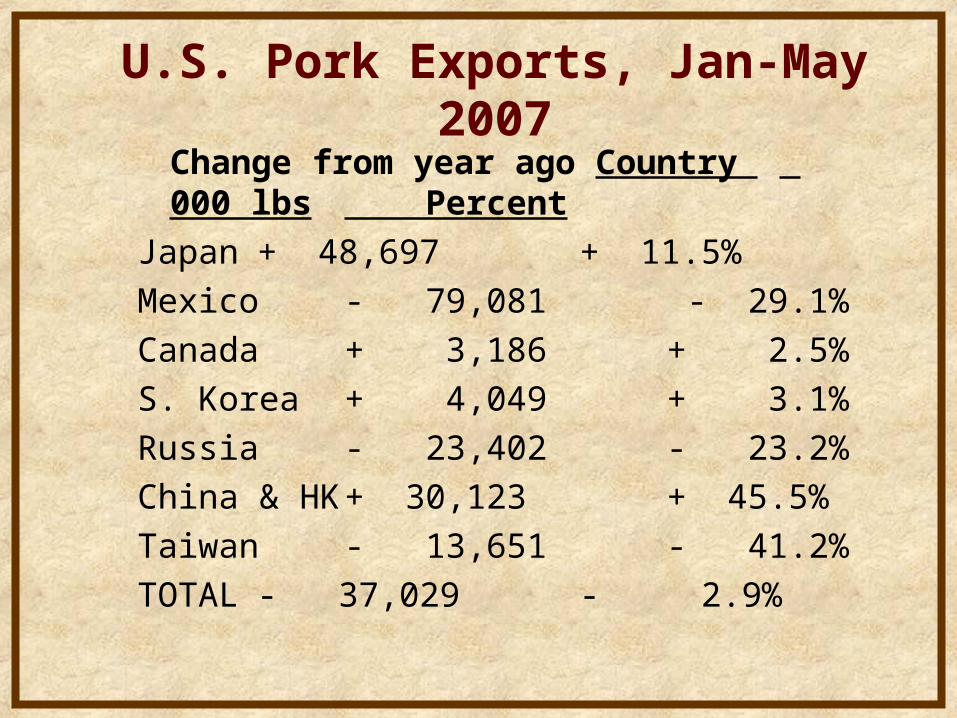
U.S. Pork Exports, Jan-May 2007
Change from year ago Country 000 lbs Percent
Japan + 48,697 + 11.5%
Mexico - 79,081 - 29.1%
Canada + 3,186 + 2.5%
S. Korea + 4,049 + 3.1%
Russia - 23,402 - 23.2%
China & HK + 30,123 + 45.5%
Taiwan - 13,651 - 41.2%
TOTAL - 37,029 - 2.9%
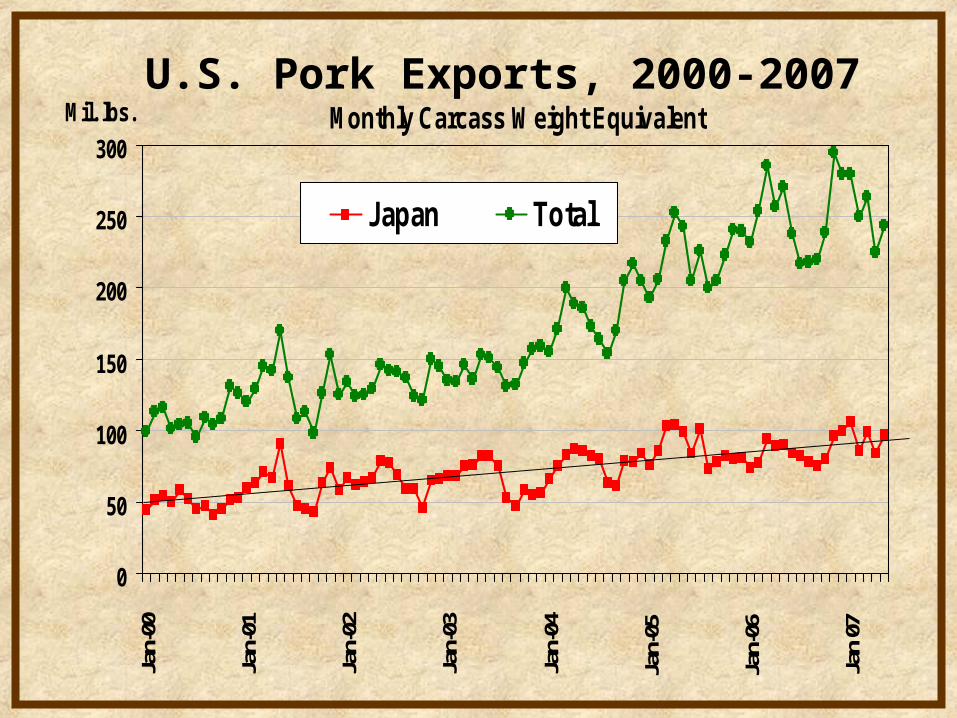
U.S. Pork Exports, 2000-2007Monthly Carcass Weight Equivalent
0
50
100
150
200
250
300Ja
n-00
Jan-
01
Jan-
02
Jan-
03
Jan-
04
Jan
-05
Jan
-06
Jan
07
Mil. lbs.
Japan Total

U.S. Pork Exports, 2000-2007Monthly Carcass Weight Equivalent
0
50
100
150
200
250
300Ja
n-00
Jan-
01
Jan-
02
Jan-
03
Jan-
04
Jan
-05
Jan
-06
Jan
07
Mil. lbs.
Mexico Total
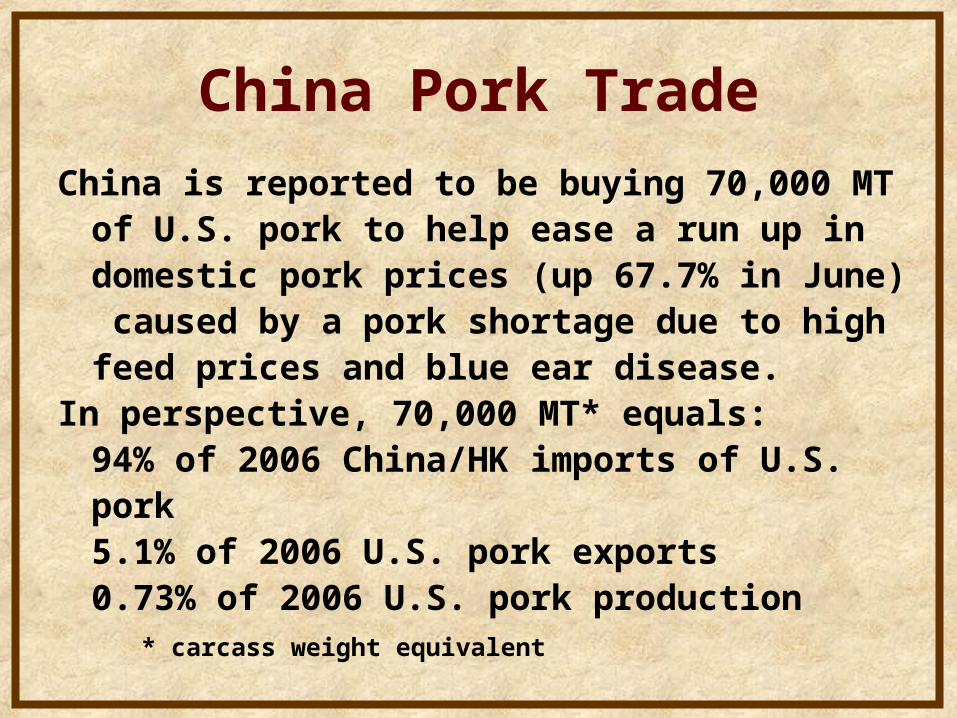
China Pork Trade
China is reported to be buying 70,000 MT of U.S. pork to help ease a run up in domestic pork prices (up 67.7% in June) caused by a pork shortage due to high feed prices and blue ear disease.
In perspective, 70,000 MT* equals:94% of 2006 China/HK imports of U.S. pork5.1% of 2006 U.S. pork exports0.73% of 2006 U.S. pork production
* carcass weight equivalent

Fall Price Decline
Aug-Oct Oct-Dec Aug-
Dec
10 yr average -$6.82 - $4.63 -$11.45
10 yr minimum -$3.09 +$2.51 -$ 1.16
Futures -$2.62 - $1.35 -$ 3.97

Live Hog Trade
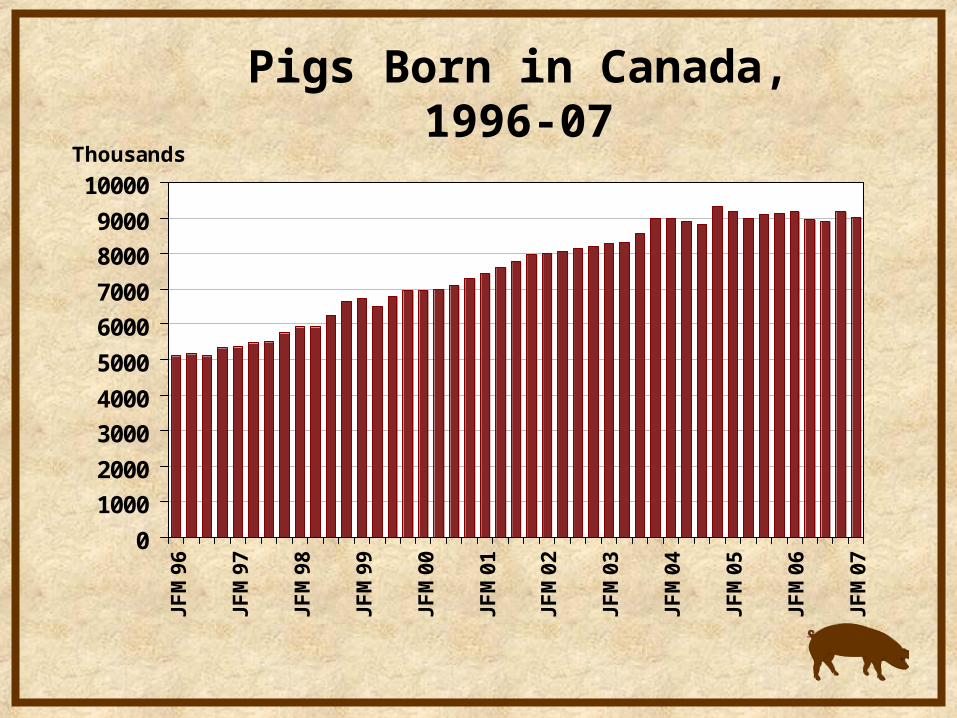
Pigs Born in Canada, 1996-07
0
1000
2000
3000
4000
5000
6000
7000
8000
9000
10000J
FM
96
JF
M9
7
JF
M9
8
JF
M9
9
JF
M0
0
JF
M0
1
JF
M0
2
JF
M0
3
JF
M0
4
JF
M0
5
JF
M0
6
JF
M0
7
Thousands

U.S. Pig Crop, 1996-07
0
5000
10000
15000
20000
25000
30000
DJF
96
JJA
96
DJF
97
JJA
97
DJF
98
JJA
98
DJF
99
JJA
99
DJF
00
JJA
00
DJF
01
JJA
01
DJF
02
JJA
02
DJF
03
JJA
03
DJF
04
JJA
04
DJF
05
JJA
05
DJF
06
JJA
06
DJF
07
Thousands

Growth in U.S.-Canadian Pig Crop1995-2005
13.9805
4.869 Canada
U.S.A.
Source: USDA/FAS
During the past decade, 74% of the increase in U.S.-Canadian pig production took place in Canada.
(million head)

Exchange Rate: Can $ Per US $
1.00
1.10
1.20
1.30
1.40
1.50
1.60
1.70Q
1 90
Q1
91
Q1
92
Q1
93
Q1
94
Q1
95
Q1
96
Q1
97
Q1
98
Q1
99
Q1
00
Q1
01
Q1
02
Q1
03
Q1
04
Q1
05
Q1
06
Q1
07

U.S. Hog Imports from Canada
0
100,000
200,000
300,000
400,000
500,000
600,000
700,00019
97
1998
1999
2000
2001
2002
2003
2004
2005
2006
2007
Head per mo.
Slaughter Hogs Feeders Pigs

U.S. Weekly Feeder Pig Imports
60000
70000
80000
90000
100000
110000
120000
130000
140000
150000JA
N
AP
JUL
OC
Head
2005
2006
2007

U.S. Weekly Slaughter Hog Imports
35000
40000
45000
50000
55000
60000
65000
70000
75000
80000
85000
Jan
Apr Ju
l
Oct
Head
2005
2006
2007
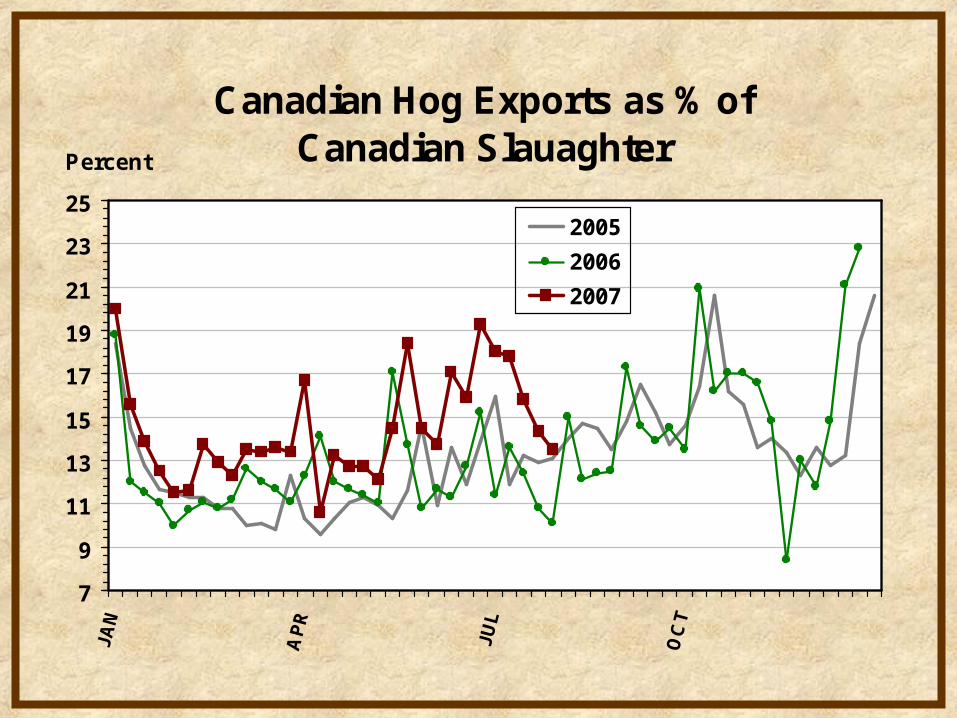
Canadian Hog Exports as % of Canadian Slauaghter
7
9
11
13
15
17
19
21
23
25
Percent
2005
2006
2007

Change in Hog Slaughter: US & Canada Weekly F.I. Hog Slaughter, 2006-07
-20
-15
-10
-5
0
5
10
15
Ja
n
Fe
b
Ma
r
Ap
r
Ma
Ju
n
Ju
l
Au
Se
p
Oc
tN
o
De
c
Ja
n
Fe
b
Ma
r
Ap
r
Ma
Ju
n
Ju
l
Au
% change from yr. ago USA
combinedCanada

Slaughter Capacity

Daily Hog Slaughter Capacity
340000
350000
360000
370000
380000
390000
400000
410000
420000
430000
19
95
19
96
19
97
19
98
19
99
20
00
20
01
20
02
20
03
20
04
20
05
20
06
20
07
Head
Steve Meyer’s survey indicates 2007 capacity of 425,185

Demand

Annual U.S. Pork Production, 1930-2006
0
5
10
15
20
25
1930
1935
1940
1945
1950
1955
1960
1965
1970
1975
1980
1985
1990
1995
2000
2005
Billion Pounds
actual 1.5% trend

U.S. Per Capita Pork Consumption, 1930-2006
0102030405060708090
1930
1935
1940
1945
1950
1955
1960
1965
1970
1975
1980
1985
1990
1995
2000
2005
Pounds
Retail Weight

U.S. Per Capita Pork Consumption, 1930-2006
0
10
20
30
40
50
60
1930
1935
1940
1945
1950
1955
1960
1965
1970
1975
1980
1985
1990
1995
2000
2005
Pounds
Boneless Weight

Change in Export Pork DemandBase Elasticity = - 0.5
-30-20-10
010203040506070
2001 Ju
n
Nov Apr
Sep Fe
b
Jul
Dec
May Oct
Mar
Aug
2006 Ju
n
Nov Apr
% C
hang
e Y
ear
Ago
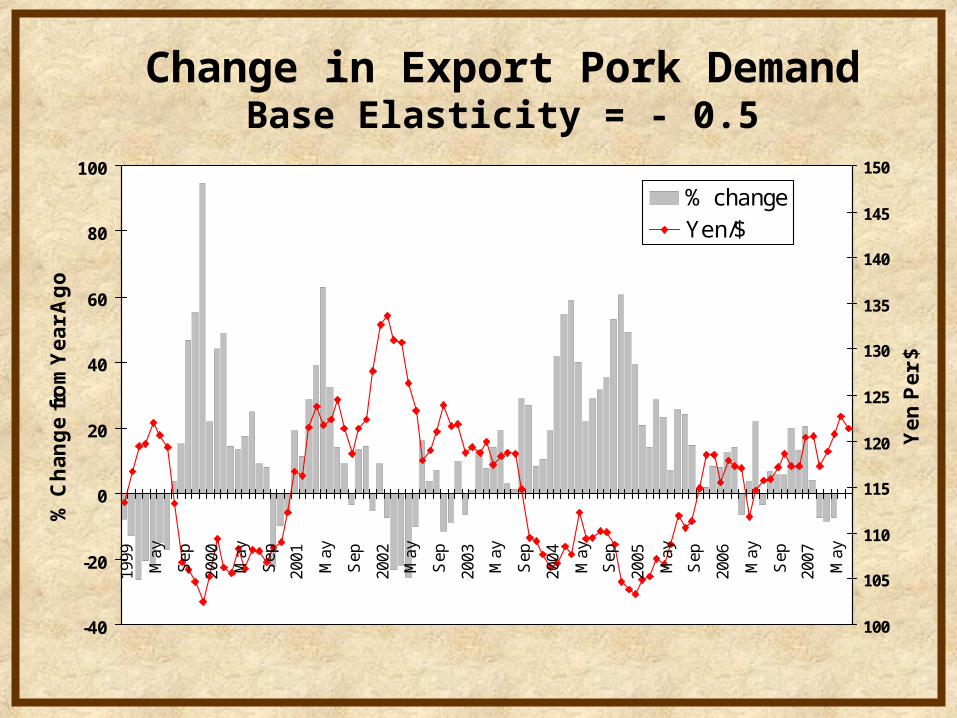
Change in Export Pork DemandBase Elasticity = - 0.5
-40
-20
0
20
40
60
80
100
1999
May
Sep
2000
May
Sep
2001
May
Sep
2002
May
Sep
2003
May
Sep
2004
May
Sep
2005
May
Sep
2006
May
Sep
2007
May
% C
ha
ng
e f
rom
Ye
ar
Ag
o
100
105
110
115
120
125
130
135
140
145
150
Ye
n P
er
$
% changeYen/$

Demand
Inventory
Weights
Price
Forecast
Short Run Factors
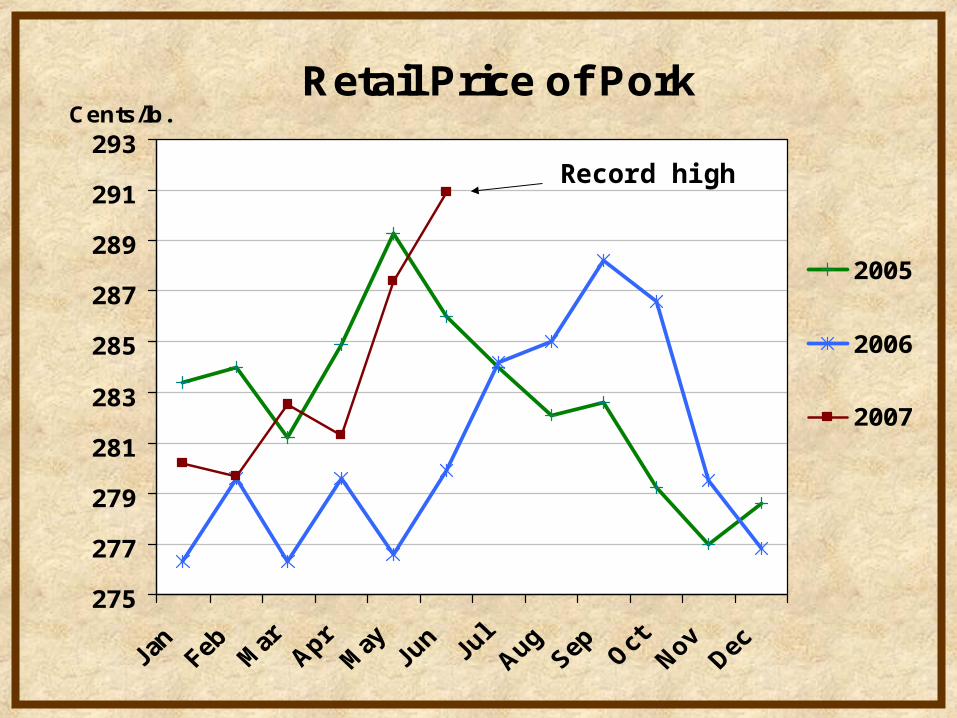
Retail Price of Pork
275
277
279
281
283
285
287
289
291
293Cents/lb.
2005
2006
2007
Record high

Change in Pork DemandBase Elasticity = - 0.75
-10-8-6-4-20
2468
10
20
01
>
Ju
n
No
v
Ap
r
Se
p
Fe
b
Ju
l
De
c
Ma
y
Oc
t
Ma
r
Au
g
20
06
>
Ju
n
No
v
Ap
r
% change from year ago

Change in Hog DemandBase Elasticity = - 0.2
-8
-3
2
7
12
17
20
01
>
Ju
n
No
v
Ap
r
Se
p
Fe
b
Ju
l
De
c
Ma
y
Oc
t
Ma
r
Au
g
20
06
>
Ju
n
No
v
Ap
r
% change from year ago

Inventory Reports

Pig/Month Accumulated Profits, 1990-2007Iowa State University Calculations
0
200
400
600
800
1000
1200
1990
1991
1992
1993
1994
1995
1996
1997
1998
1999
2000
2001
2002
2003
2004
2005
2006
2007
Dollars
Source: John Lawrence, Iowa State University
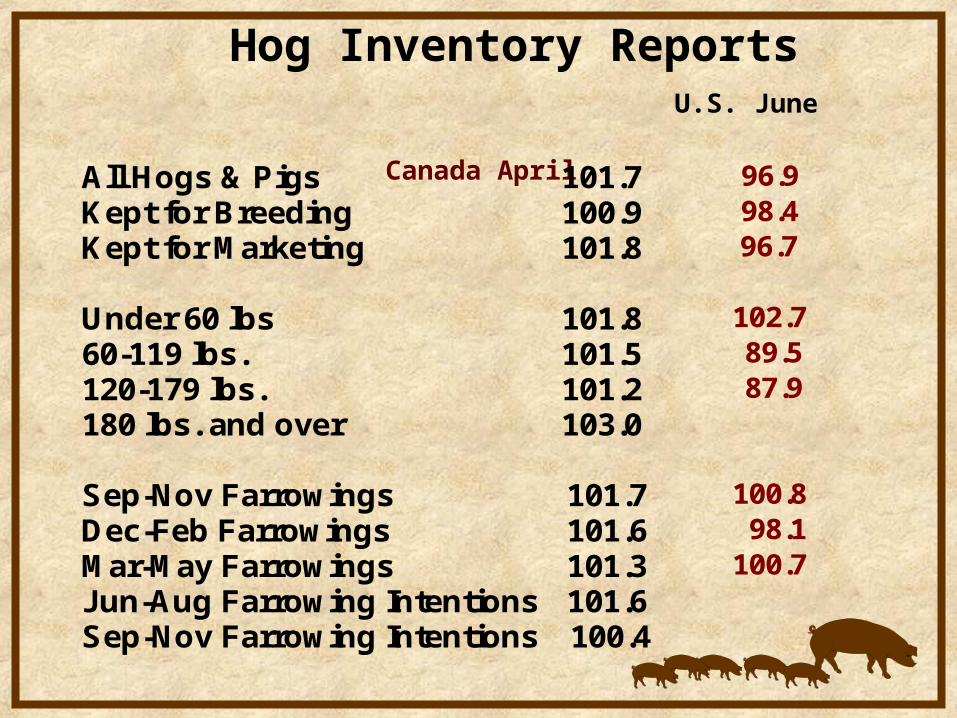
Hog Inventory Reports
U.S. June Canada April All Hogs & Pigs 101.7 96.9 Kept for Breeding 100.9 98.4 Kept for Marketing 101.8 96.7 Under 60 lbs 101.8 102.7 60-119 lbs. 101.5 89.5 120-179 lbs. 101.2 87.9 180 lbs. and over 103.0 Sep-Nov Farrowings 101.7 100.8 Dec-Feb Farrowings 101.6 98.1 Mar-May Farrowings 101.3 100.7 Jun-Aug Farrowing Intentions 101.6 Sep-Nov Farrowing Intentions 100.4

Sows Farrowed-U.S. & Canada Combined
-4
-3
-2
-1
0
1
2
3
4
5J
FM
99
JA
S9
9
JF
M0
0
JA
S0
0
JF
M0
1
JA
S0
1
JF
M0
2
JA
S0
2
JF
M0
3
JA
S0
3
JF
M0
4
JA
S0
4
JF
M0
5
JA
S0
5
JF
M0
6
JA
S0
6
JF
M0
7
% change from yr. ago

Estimated Gilt Retention & Sow Loss, 2006-2007GG Cattle & Hog Fax
0
20
40
60
80
100
120
140'0
6
Fe
b
Ma
r
Ap
r
Ma
Ju
n
Ju
l
Au
Se
p
Oc
t
No
v
De
c
'07
Fe
b
Ma
r
Ap
r
Ma
Ju
n
Ju
l
Th
ou
san
d H
ead
Per
Wee
k
Gilts Retained Sow Loss

Hog Weights

Barrow & Gilt Carcass WeightsPrior Day Slaughter Weekly Average
196
198
200
202
204
206
208Pounds
2005
2006
2007
Hog Prices

BARROW AND GILT BASE PRICESIowa - Minnesota, Carcass Basis, Weekly
50
55
60
65
70
75
80
85
$ per cwt.
Avg.2001-05
2006
2007
Source: USDA Prior Day Purchased reports

BARROW AND GILT NET PRICESNational, Carcass Basis, Weekly
50
55
60
65
70
75
80
$ per cwt.
Avg.2002-05
2006
2007
Source: USDA Prior Day Slaughtered reports

Barrow & Gilt Negotiated Live Price
40
42
44
46
48
50
52
54
56
58
60
Jan Feb Mar Apr May Jun Jul Aug Sep Oct Nov Dec
2004-06 2007
Source: USDA Prior Day Purchased reports

Major Unknowns
• Circovirus vaccine & death losses
• China & pork exports
• Weather
• Slaughter capacity

My Forecast

Commercial Hog Slaughter Forecast Million Head
*actual
2006 2007 2008
Qtr 1 26.208* 26.686* 27.330
Qtr 2 24.839* 25.524* 25.830
Qtr 3 25.810* 26.425 27.165
Qtr 4 27.880* 29.100 29.400
Year 104.737* 107.734 109.725
------Change------
06-07 07-08.
+1.8% +2.4%
.+2.7% +1.2%
+2.4% +1.2%
+2.8% +1.0%
+2.4% +1.4%
Note: Q4 07 & Q3 08 have 1 more slaughter day

Iowa-Minn Hog Price ForecastNegotiated Base Price Per Carcass Hundredweight
2006 2007 2008
Qtr 1 $56.37* $60.65* $64-68
Qtr 2 $65.41* $69.60* $67-71
Qtr 3 $68.24* $68-70 $64-68
Qtr 4 $60.76* $61-65 $58-62
Year $62.68* $65-67 $63-67
*actual price – prior day purchased

Iowa-Minn Live Hog Price ForecastNegotiated Base Price Per Live Hundredweight
2006 2007 2008
Qtr 1 $41.71* $44.88* $47-50
Qtr 2 $48.40* $51.50* $49-52
Qtr 3 $50.50* $50-52 $47-50
Qtr 4 $44.96* $45-48 $43-46
Year $46.38* $48-50 $46-49
*actual price – 74% of carcass price

Forecast Summary
• Farrowings 0-2% above year-ago
• Continued 2-3% productivity growth
• More imports of Canadian hogs/pigs
• Possible increase in pork exports
• Stable domestic demand
• Rising feed cost

Any Questions?
Related Documents