STUDIA UNIVERSITATIS BABEŞ-BOLYAI, NEGOTIA, L, 2, 2005 ROMANIAN CLOSED-END FUNDS – AN OVERVIEW CORNELIA POP, PHD 1 - ADINA CALUGARU, MBA 2 MIHAELA MARCU 3 ABSTRACT. Closed-end funds are less known compared to open-end funds to most of investors. Due to their classical discounts, their behavior on the stock markets is less understood by the individual investors. These two statements are true on the mature capital markets, but on the Romanian emerging capital market, the closed-end funds were and still are the individual investors’ darlings. The closed-end funds’ position on the Romanian capital market can be – mildly – viewed as peculiar. The present paper would try to answer several questions like: - Why are the Romanian closed-end funds more popular than the open-end funds? - Which was the closed-end funds’ contribution to the development of the Bucharest Stock Exchange? - How did the structure of the Romanian closed-end funds’ portfolios evolved/ changed over time? - How did the prices and premiums of the Romanian closed-end funds behave since their listing date at Bucharest Stock Exchange? Closed-end funds or closed-end investment companies represent the first investor-owned type of organization that pooled and invested funds primarily, but not exclusively, in financial assets. Closed-end investment companies were born in Europe in the early 19 th century and developed in England and Scotland during 1863-87, where investment funds are still popular today. By the late 19 th century, closed-end funds appeared in US as well and peaked in popularity during late 1920s. The open-end funds were formed later, in 1924 and found the way into investors hearts in about 20 years so widely that they over passed by far the closed- end investment companies/ closed-end funds that stagnated for a long period of time - after the market crash of 1929. Starting with 1985, after decades of indifference and obscurity, new life was breathed into the industry and closed-end 1 Professor, Faculty of Business, Babes-Bolyai University, Cluj-Napoca, Romania, e-mail: [email protected] 2 Financial Analyst, New York, e-mail: [email protected] 3 Doctoral Fellow, Food and Resource Economics Department, Institute of Food and Agricultural Sciences, University of Florida, e-mail: [email protected]

Welcome message from author
This document is posted to help you gain knowledge. Please leave a comment to let me know what you think about it! Share it to your friends and learn new things together.
Transcript

STUDIA UNIVERSITATIS BABEŞ-BOLYAI, NEGOTIA, L, 2, 2005
ROMANIAN CLOSED-END FUNDS – AN OVERVIEW
CORNELIA POP , PHD1 - ADINA CALUGARU, MBA 2 MIHAELA MARCU 3
ABSTRACT. Closed-end funds are less known compared to open-end funds to most of investors. Due to their classical discounts, their behavior on the stock markets is less understood by the individual investors. These two statements are true on the mature capital markets, but on the Romanian emerging capital market, the closed-end funds were and still are the individual investors’ darlings.
The closed-end funds’ position on the Romanian capital market can be – mildly – viewed as peculiar. The present paper would try to answer several questions like: − Why are the Romanian closed-end funds more popular than the open-end
funds? − Which was the closed-end funds’ contribution to the development of the
Bucharest Stock Exchange? − How did the structure of the Romanian closed-end funds’ portfolios evolved/
changed over time? − How did the prices and premiums of the Romanian closed-end funds behave
since their listing date at Bucharest Stock Exchange?
Closed-end funds or closed-end investment companies represent the first investor-owned type of organization that pooled and invested funds primarily, but not exclusively, in financial assets. Closed-end investment companies were born in Europe in the early 19th century and developed in England and Scotland during 1863-87, where investment funds are still popular today. By the late 19th century, closed-end funds appeared in US as well and peaked in popularity during late 1920s. The open-end funds were formed later, in 1924 and found the way into investors hearts in about 20 years so widely that they over passed by far the closed-end investment companies/ closed-end funds that stagnated for a long period of time - after the market crash of 1929. Starting with 1985, after decades of indifference and obscurity, new life was breathed into the industry and closed-end
1 Professor, Faculty of Business, Babes-Bolyai University, Cluj-Napoca, Romania, e-mail:
[email protected] 2 Financial Analyst, New York, e-mail: [email protected] 3 Doctoral Fellow, Food and Resource Economics Department, Institute of Food and Agricultural
Sciences, University of Florida, e-mail: [email protected]

CORNELIA POP, ADINA CALUGARU, MIHAELA MARCU
108
funds gained once again popularity. It was not for that long, but until 1989 when the crash provoked another round of losses. However, the late 1980s meant also the formation of a number of closed-end funds that invested almost exclusively in securities of forms located din a single, foreign country.
What makes the closed-end funds different from other corporate businesses is that they invest largely in the securities of other corporations and their core business is to manage these investment holdings for income and profit. Moreover, closed-end funds provide “contemporaneous and observable market-based rates of return for both stocks and underlying asset portfolios” [Dimson & Minio-Kozerski, 1999].
In US, at the end of 2004, as the data from table A shows, the number of closed-end funds was 620, 75% of which are bond funds. For the same period, the total number of open-end funds was 8044.
Table A Fund Type Fund category Number of Funds
Domestic 95 Equity Global/International 62
Total Equity Closed Funds 157 Bond Domestic taxable 138
Domestic international 295 Global/International 30
Total Bond Closed Funds 463 Total US Closed-end Funds 620
Source: www.ici.org/factbook , Mutual Fund Fact Book, 2005 In Romania, the situation is completely different. At the end of 2004, the
number of Romanian closed-end funds was 6 all of them with mixed portfolios, dominated by equities. The number of active Romanian open-end funds was only 16. The small number of open-end funds is the result of two crises – in 1996 and 2000 – first generated by the lack of appropriate regulation for mutual fund sector and the second generated by the relaxed attitude of Romanian National Security Commission toward enforcing the regulations on 2 biggest open-end funds.
The birth date for the first 5 Romanian closed-end funds could be considered November 1, 1996 when the Law 133/ 1996 was issued. It disposed the transformation of former 5 Private Property Funds4 in SIFs5. Since their transformation it was clear that SIFs situation was peculiar [Apostu, 1998]:
4 Those 5 Private Property Funds (PPFs) functioned based on Law no.58/ 1991 regarding the
privatization process of Romanian companies. Through this law, to each of the 5 PPF a number of companies was allocated and – in theory – every PPF owned maximum 30% of capital in each company. The 5 PPFs were formed based on regional concentration of allocated companies. Until October 1996, there existed: PPF1 Banat-Crisana, PPF2 Moldova, PPF3 Transilvania, PPF4 Muntenia and PPF5 Oltenia. In November 1996, those PPFs were transformed as follow:
PPF1 – became SIF1 Banat-Crisana;

ROMANIAN CLOSED-END FUNDS – AN OVERVIEW
109
1. they inherit the portfolios owned by the former PPFs; PPFs had no possibility to choose among the companies they owned and their portfolio structure was heavily influenced by the ups and downs of Romanian complicated privatization process, influenced by too many political interests; in November 1996, the SIFs’ portfolio structure was still under discussion and negotiation with the State Ownership Fund;
2. they had a very big number of shareholders (over 5 million each) and two ‘sources’ for these shareholders: there were those who subscribed since the beginning at PPFs and those added (some of them during 1997 and others in 1998) as a result of countless alterations to the laws and regulations concerning the Romanian privatization process. Many of these investors didn’t even know they were SIF’s shareholders. There were also many changes in the investors’ data (e.g. changes of names and addresses, deaths) which were not even tracked.
During 1997 and 1998, the SIFs administrators had the difficult tasks to identify all their shareholders and to solve the situation of their portfolios6.
Table B – SIFs’ number of shares7
1996 1999 2000 2001 Sept.2004 SIF1 Banat-Crisana 481,989,395 548,849,268 548,849,268 548,849,268 548,849,268 SIF2 Moldova 522,083,890 519,089,588 519,089,588 519,089,588 519,089,588 SIF3 Transilvania 546,071,666 546,071,666 546,071,666 546,071,666 546,071,666 SIF4 Muntenia 564,573,277 628,485,262 696,149,985 807,036,515 807,036,515 SIF5 Oltenia 563,246,040 580,165,174 580,165,174 580,165,174 580,165,174
Sources: For 1996 – Piata Financiara no.7-8/ 1999. For 1999 – Ogica, 1999. For 2000 & 2001 – SIFs’ Annual Reports, where available and Piata Financiara no.7-
8/2002. For September 2004 – Intercapital, 2004
PPF2 – became SIF2 Moldova; PPF3 – became SIF3 Transilvania; PPF4 – became SIF4 Muntenia and PPF5 – became SIF5 Oltenia. 5 The abbreviation comes from the Romanian name of these companies: Societati de investitii
financiare. The direct translation in English is Financial Investment Companies, but we considered that using the abbreviation: SIF -generated by the Romanian name- would make everyone’s life easier. Searching these companies on the Internet or in specialized publications under the SIF name has better chance of finding results.
6 The process of compensating the SIFs’ portfolios took place in 1997 and 1998. Only at the beginning of 1999, through a Government Emergency Ordinance no.54/ 1998, the situation of SIFs portfolios was clarified.
7 The face value of SIFs shares is 1000 ROL (0.1 RON). By multiplying the number of shares with their face value, the capital amount can be seen.

CORNELIA POP, ADINA CALUGARU, MIHAELA MARCU
110
Table C – Number of companies in SIFs’ portfolios (end of the year)
1996 1997 1998 1999 2000 2001 2002 2003 2004 SIF1 Banat-Crisana 2147 919 907 n/a 729 663 619 576 527 SIF2 Moldova 1052 725 682 601 n/a 545 397 371 353 SIF3 Transilvania 1352 594 573 536 491 n/a n/a 393 377 SIF4 Muntenia 1183 446 468 n/a n/a n/a 340 310 290 SIF5 Oltenia 1172 389 375 n/a 302 271 262 256 251
Note: the cells highlighted with blue contain data for June that year. Sources: For 1996, 1997 and 1998 – Piata Financiara no.7-8/ 1998 & no.9/ 1998. For 1999 to 2004 – SIFs’ Annual Reports, where available. In table C, for 1996 appears the number of companies transferred from
PPFs to SIFs. By the end of 1997 the companies’ number decreased dramatically due to compensation process with the State Owned Fund. Since 1997, the number of companies in SIFs portfolios decreased continually, as their managers decided to sell those companies, close them, to restructure or to liquidate others.
By the time when SIFs emerged on the Romanian financial market (November 1996), there were several regulations under which those peculiar closed-end funds could function: Law no.31/ 1990, the general law on Romanian companies, Government Ordinance no.24/ 1993 and the Romanian National Security Commission (CNVM)8 Regulation no.9/ 1996 on Romanian investment funds. But it was clear from the beginning that even if the SIFs structure was similar to closed-end funds, their situation was peculiar and a special law on these investment funds was necessary. The laws and regulations concerning Romanian capital market changed in 1994 (Law no.52/ 1994), in July 2002 (Law no.525/ 2002 and Law no.513/ 2002) and, again, in June 2004 (Law no.297/ 2004). To all these laws, a number of Regulations and Instructions issued by CNVM were to be added. At the present time, SIFs existence is based on Law no.297/ 2004. Unfortunately, neither the laws nor the other regulations manage to clarify the special statute of SIFs and until July 2005, no special law was approved and issued, which created a lot of confusion among those who tried to understand the intimacy of SIFs mechanisms.
Despite all these problems, due to the big number of shareholder, there was a constant pressure for SIFs to be listed at Bucharest Stock Exchange (BVB)9. Some sources [BERG, 1999] stated that the first deadline for SIFs to be introduced at BVB
8 Further we will use the abbreviation generated by the Romanian name of this commission for the
same reason mentioned in footnote 2. 9 Again, we will use the abbreviation generated by the Romanian name – Bursa de Valori Bucuresti or
BVB. We decided not to use the BSE abbreviation due to the fact that this is the same for Budapest Stock Exchange and we want to avoid any confusion.

ROMANIAN CLOSED-END FUNDS – AN OVERVIEW
111
was the Fall of 1997. Then, the deadline was moved to February 1998, to June 1998 and September 1998. All deadlines passed and SIFs were still not listed. During 1999 another problem appeared that of stolen shares. The solution found by SIFs – to introduce a special code which every shareholder who wants to trade his/ her shares must ask for it. This situation delayed again the SIFs presence at BVB quote.
Before the start of their listing at BVB, the administrators of the 5 SIFs discussed over a controversial decision: to limit or not the limit of the ownership of their shares/ shareholder to 0.1%. The main argument which the administrators provided: SIFs are investment funds with a large number of small shareholders and in order to protect them, the limit of 0.1% was necessary10. The hidden argument was that those administrators feared they would loose the power and control over the SIFs they managed for so long [BERG, 1999; Simion, 2004]. We must add that in 1999 chairmen for the 5 SIFs were the same persons who managed the 5 PPFs since 1992 and the decision of their nomination was mainly a political one [Tornea, 1999].
SIFs listing at BVB first tier11 started November 1, 1999 - 3 years to the date they were created.
The condition imposed by BVB when accepted the listing of SIFs was that in 6 months after the listing started, the ownership limit of 0.1% should be increased to 5% [Tornea, 1999; BERG, 1999].
Despite the imposed limit and their blurry image created by the lack of clear regulations and transparency, SIFs managed to find a way in the hearts of many investors.
We will let the figures speak for themselves:
Table D – Evolution of BVB total capitalization and SIF capitalization (end of period)
1999 2000 2001 2002 2003 2004 July 2005 BVB total capitalization (billion ROL)
6931.3 10956.4 38573.2 91580.2 121865.5 341473.7 446968.0
SIFs’ capitalization (billion ROL)
1206.5 1553.2 3555.8 8199.3 10924.2 23726.2 40701.4
% of SIFs capitalization in BVB total capitalization
17.41 14.18 9.22 8.95 8.97 6.95 9.10
Source: www.bvb.ro /summary of trades
10 After the limit of ownership of 0.1% was introduced, during the fall of 1999 the 5 SIFs demanded
an inquiry among their shareholders and the responses were amazing: 62% declared they wanted to hold their shares; only 8.4% declared they wanted to sell their shares right away after SIFs listing starts [Tornea, 1999].
11 First tier is the official name BVB used to designate its first category, were the best Romanian companies are listed.

CORNELIA POP, ADINA CALUGARU, MIHAELA MARCU
112
Table E – Comparative evolution for BVB and SIF trades, volume and value
1999 2000 2001 2002 2003 2004 July 2005 Average trades/ day – total BVB 1611 1968 1416 2680 1776 2494 4273 Average trades/ day – SIFs - 1390 637 1396 897 1089 1916 Average volume/ day – total BVB (million shares)
4.1 7.1 8.9 16.1 15.4 51.2 66.9
Average volume/ day – SIFs (million shares)
- 3.2 2.5 3.8 3.3 4.2 7.3
Average value/ day – total BVB (billion ROL)
5.5 7.3 15.3 28.5 39.5 94.9 254.8
Average value/ day – SIFs (billion ROL)
- 1.5 1.9 8.3 9.6 23.9 87.5
Source: www.bvb.ro for the primary data
Table F - % of SIFs in total BVB trades, volume and value
% of SIFs in Nov.1999- July 2005 1999 2000 2001 2002 2003 2004 July 2005
BVB trades 51.46 79.63 68.36 44.43 50.87 49.69 43.15 44.98 BVB volume 36.09 67.82 63.98 45.15 30.08 30.08 17.71 16.03 BVB value 34.02 43.07 36.78 28.10 34.19 34.99 31.92 38.59
Source: www.bvb.ro for the primary data As the tables D, E and F show, the SIFs capitalization is an important part
of BVB total capitalization (in average for the all period 10.7%), represent 51.46% of BVB trades, 36.09% of BVB volume and 34.02% of BVB trades’ value.
Graphics no.1 and 2 show BET and BET-FI evolution, respectively SIFs price evolution
BET is the first official index calculated at BVB since the Fall of 1997; its portfolio includes the best 10 companies at BVB, except SIFs. Due to the fact that BET has 10 companies in its portfolio, in some graphics it would be named BET-10.
BET-FI is the official index calculated at BVB only for SIFs since November 2000.
The correlation between the relative values of BET and BET-FI for the period November 2000 – July 2005 is 0.433232.

ROMANIAN CLOSED-END FUNDS – AN OVERVIEW
113
Graphic no.1 – BET and BET-FI evolution
Data presented in tables D, E, F and graphics no.1 and 2 suggests a
possible causality relationship between these two variables. In order to check the type of this relation, a Granger causality test is
performed on the two indices over the period November 1, 2000 – July 29, 2005 (both on the brut indices and on their logarithm zed rates of return12). The entire test is presented in the Appendix 1.
12 The logarithm zed rates of return for the indexes were used because ln(1+r) is a good
approximation for r (when r is the return rate of an index I such that 01
1 >−
=−
−
t
tt
I
IIr ). The variables
used are )ln()1ln(11
1
−−
− =−
+t
t
t
tt
bvb
bvb
bvb
bvbbvb and )ln(1−t
t
fi
fi.

CORNELIA POP, ADINA CALUGARU, MIHAELA MARCU
114
Graphic no.2 – SIFs’ prices evolution
To assert a causal relationship between a variable13 x and a variable y we
must find that in the system of equations:
[ ]
+⋅
+
=
t
ttt
t
t yyy
y
2
121
21
21
2
1
2
1
εε
ββαα
µµ we have 02 ≠α (previous movements in x
do not help explain movements in y even in the presence of a lagged value of y). This fact, in itself, is not sufficient to assert a causal relationship. Complications with this causality test: the model may be missing either intervening variables or additional lagged effects that should be present but are not. For the first of these, the problem is that the finding of a causal effects might equally well result from the omission of a variable correlated with both of (or all) the left-hand-side variables. Granger test is a no causality test.
13 Here the variables are bvb (the index BVB BET) and fi ( the index BET FI). The lagged variables have
the order of the lag in the beginning of the name of the variable (for example, l.bvb is bvb with lag of 1, and l2.fi is fi with a lag of 2). Since the fi and bvb are set as daily data, the lag of order 5 appears as a lag 7 (because the 6th and the 7th day of the week are non-working days). When testing on the log-return of the indexes, the variables used are: ln_bvb=ln(bvb)-ln(l.bvb) and ln_fi=ln(fi)-ln(l.fi)

ROMANIAN CLOSED-END FUNDS – AN OVERVIEW
115
When applied on the brut indices, the hypothesis that BVB BET does not Granger cause BET FI is rejected (see Tables 2-6), for lags of up to 5 days. So the information included in the BVB BET could be either independent of or a cause for the levels of the BET FI index from the next week (or 5 working days). Another interpretation of this result could be that the two indices are influenced by a third variable, which could be their common cause.
This result (that BVB BET does not Granger cause BET FI is rejected) is only confirmed for the lag of one day (see Table 7) by the acceptance of the hypothesis that BET FI does not Granger cause BVB BET). For the lags of 2 and up to 5 days, the hypothesis that BET FI does not Granger cause BVB BET is rejected (see Tables 8-11).
So it might be that BVB BET is a Granger cause for BET FI for the horizon of one day (from one day to the next day ), but for a longer horizon (2 up to 5 days, maybe even on the long run) these two indices have a common cause (a third variable).
When applied on the logarithmized rates of return of the indices, the Granger test generates results contradictory to the ones previously obtained by applying it for the brut data. The hypothesis that the logarithmized rates of return of BVB BET do not Granger cause the logarithmized rates of return of BET FI is only rejected in the long run, for lags of 3 and up to 5 days (see Tables 14-16). For shorter horizons lags, of up to 2 days (see Tables 12-13) this hypothesis is accepted.
Moreover, the logarithmized rates of return of BET FI do not Granger cause the logarithmized rates of return of BVB BET for all horizons except for the one day lag one (see Tables 17-21).
Consequently, the Granger test is not conclusive.
Even if the Granger test is not conclusive, the data in tables D, E, F suggests that the 5 SIFs played – and still play – an important role at BVB.
Some of the reasons for their popularity are not connected with the quality of their portfolio or/ and their management:
• they were launched on the Romanian financial market after the first big crises of Romanian mutual funds in the Spring and Summer of 1996;
• their listing at BVB started during a period when the stock exchange was struggling to stay alive;
• there were not too many investment opportunities on the Romanian financial market for any type of investors.
Other reasons for SIFs popularity were connected with their management process and performances:
• the SIFs managers struggle to change their inherited portfolio structures and to transform them quality portfolios; the process was and still is difficult due to a big number of special situations generated by the companies
CORNELIA POP, ADINA CALUGARU, MIHAELA MARCU
116
statute and the Romanian accounting regulations which does not allow SIFs to show their true portfolio market value14; the evolution of SIFs portfolios can not be presented due to the fact that all the 5 SIFs use other types of reports; but we can say that between 1997 and 1999 SIFs portfolio were concentrated mainly on industrial companies; a change occurred in the last 2-3 years when several Romanian banks become important assets in SIFs’ portfolios; SIF3 Transilvania, also, declared its interest in tourism industry and around 20% of its portfolio is represented by hotels and travel agencies;
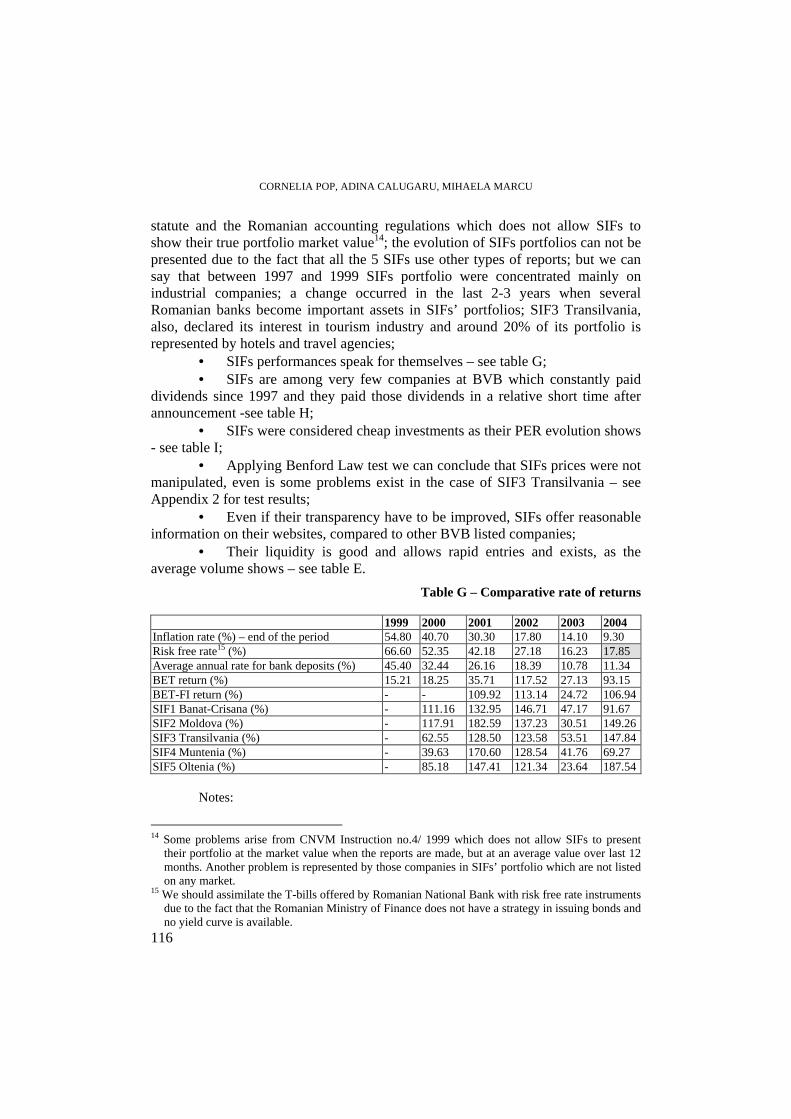
• SIFs performances speak for themselves – see table G; • SIFs are among very few companies at BVB which constantly paid
dividends since 1997 and they paid those dividends in a relative short time after announcement -see table H;
• SIFs were considered cheap investments as their PER evolution shows - see table I;
• Applying Benford Law test we can conclude that SIFs prices were not manipulated, even is some problems exist in the case of SIF3 Transilvania – see Appendix 2 for test results;
• Even if their transparency have to be improved, SIFs offer reasonable information on their websites, compared to other BVB listed companies;
• Their liquidity is good and allows rapid entries and exists, as the average volume shows – see table E.
Table G – Comparative rate of returns
1999 2000 2001 2002 2003 2004 Inflation rate (%) – end of the period 54.80 40.70 30.30 17.80 14.10 9.30 Risk free rate15 (%) 66.60 52.35 42.18 27.18 16.23 17.85 Average annual rate for bank deposits (%) 45.40 32.44 26.16 18.39 10.78 11.34 BET return (%) 15.21 18.25 35.71 117.52 27.13 93.15 BET-FI return (%) - - 109.92 113.14 24.72 106.94 SIF1 Banat-Crisana (%) - 111.16 132.95 146.71 47.17 91.67 SIF2 Moldova (%) - 117.91 182.59 137.23 30.51 149.26 SIF3 Transilvania (%) - 62.55 128.50 123.58 53.51 147.84 SIF4 Muntenia (%) - 39.63 170.60 128.54 41.76 69.27 SIF5 Oltenia (%) - 85.18 147.41 121.34 23.64 187.54
Notes:
14 Some problems arise from CNVM Instruction no.4/ 1999 which does not allow SIFs to present
their portfolio at the market value when the reports are made, but at an average value over last 12 months. Another problem is represented by those companies in SIFs’ portfolio which are not listed on any market.
15 We should assimilate the T-bills offered by Romanian National Bank with risk free rate instruments due to the fact that the Romanian Ministry of Finance does not have a strategy in issuing bonds and no yield curve is available.

ROMANIAN CLOSED-END FUNDS – AN OVERVIEW
117
1. the risk free rate for 2004 (highlighted in grey) is calculated based only on the data available for January to August; since September until December 2004 no T-bills were issued. 2. SIFs rates are calculated using capital gains and dividends. Sources: Romanian National Bank Annual Reports (www.bnro.ro) and www.bvb.ro for the primary data on BET, BET-FI and SIFs
Table H – SIFs’ dividend value and payout ratio
1999 2000 2001 2002 2003 2004 SIF1 Banat-Crisana - dividends (ROL) 130 240 330 400 480 500 Payout ratio for SIF1 (%) 69.61 67.34 73.89 73.27 76.40 68.15 SIF2 Moldova - dividends (ROL) 111 218 330 430 494 600 Payout ratio for SIF2 (%) 88.06 87.35 59.42 95.56 65.41 68.08 SIF3 Transilvania - dividends (ROL) 144 240 265 340 420 650 Payout ratio for SIF3 (%) 64.30 83.68 75.99 76.52 65.10 43.61 SIF4 Muntenia - dividends (ROL) 177 220 283 379 421 500 Payout ratio for SIF4 (%) 75.37 63.86 91.57 88.91 92.30 79.67 SIF5 Oltenia (%) 100 210 300 300 370 650 Payout ratio for SIF5 (%) 56.94 71.95 73.65 69.58 74.41 54.26
Sources: www.bvb.ro for the primary data
Table I – SIFs’ PER (average/ year)
1999 2000 2001 2002 2003 2004 SIF1 Banat-Crisana n/a n/a 3.9 5.6 6.4 11.5 SIF2 Moldova n/a n/a 4.8 4.6 5.2 8.1 SIF3 Transilvania n/a n/a 4.0 7.0 8.0 12.9 SIF4 Muntenia n/a n/a 3.9 6.6 7.9 10.8 SIF5 Oltenia n/a n/a 4.0 5.3 6.0 12.0
Sources: www.bvb.ro for the primary data As their names suggest, closed–end funds’ capitalization is closed,
meaning that they issue a fixed amount of stocks and their price is a result of the demand and supply like for any other securities traded on the market. Interestingly, their prices do not necessarily equal their net asset value (NAV)16 per share, of the underlying portfolio. This apparent ‘anomaly’ has been for decades and still represent the focus of extensive amount of academic research.
16 NAV= market value of the securities held less the liabilities, all divided by the number of shares in issue.

CORNELIA POP, ADINA CALUGARU, MIHAELA MARCU
118
The closed-end fund discount represents “the difference by which the price of a fund is lower than its net asset value per share” [Herzfeld, 1993].
Discounts can be substantial, long-lasting and variable, and are, perhaps, the most interesting aspect of closed-end investment companies.
In general, shares of closed-end funds are issued at a premium to net asset value. In US, premiums go as high as to 10%; in Great Britain the premiums amount to at least 5%. These premiums represent the fees paid to the underwriters and start-up costs associated with the floatation. After a few months (around 6 months) following their IPO, the shares prices decline. The shares trade at a discount which persist and fluctuates according to a mean-reverting pattern.
In case of liquidation or open-ending, the funds share prices rise and discounts disappear.
In Romania, due to the SIF particular formation, functionality and emerging on the stock market (3 years after their existence), the prices did not (and could not) follow this trend. The NAV was reported starting with November 1999 but the information is not properly available until June 2000 (more than 6 months after their launching on the market).
By that time, all of the 5 SIFs traded at discounts to their NAV, as it can be seen from Graphic no.3, 4, 5, 6 and 7. In these graphs, NAV is represented with dark blue (series1), the discount is represented in orange (series 2) and the closing price is represented in yellow (series 3).
Moreover, in SIFs situation there is was no case of liquidation or open-ending for these companies As a result, no evidence can be brought in this regard in terms of discount evolution.
We choose not to go – for the moment - into a deeper analysis of SIFs discounts due to the fact that their NAV is calculated using a peculiar CNVM Instruction no.4/ 1999 and it is still not clear at what extent the IAS are applied in calculating SIFs’ NAV. To these problems another was added: the lack of frequency in NAV reporting and the delay – sometimes over one week – between the market value and reported NAV.

ROMANIAN CLOSED-END FUNDS – AN OVERVIEW
119

CORNELIA POP, ADINA CALUGARU, MIHAELA MARCU
120

ROMANIAN CLOSED-END FUNDS – AN OVERVIEW
121
1
Conclusions: • Why are the Romanian closed-end funds more popular than the
open-end funds? - as we highlight above: external reasons and internal reasons; they
were (and still are) considered ‘BVB pearls’ [Investitori institutionali, July 2004) - we must add that among the small investors, very few understand the
way of an investment fund is working; they buy the returns and the dividends; we consider it is important that at BVB the number of active investors is small (around 25.000) and the Romanian brokers constantly recommend SIFs as good investments;
- SIFs popularity would, probably, increase further due to Government Ordinance no.41/ 2005 – starting with August 2, 2005 the ownership limit at SIFs was raised to 1% of outstanding shares17; during the month of August 2005 some brokers stated that foreign investment funds bought SIFs shares18.
• Which was the closed-end funds’ contribution to the development of the Bucharest Stock Exchange?
As the tables D, E and F show the SIFs contribution to BVB development as important; their listing at BVB triggered a bigger interest for the Romanian main stock exchange. This conclusion could be maintained even if the Granger test is not conclusive.
17 The discussions about raising the ownership limit of 0.1% were long and difficult to follow for any
outsider. CNVM and BVB tried to find ways to persuade SIFs administrators to raise that limit since 2000. The solution was found only when a Government Ordinance was issued in July 2005.
18 The limited ownership made difficult for any foreign investment fund to invest a reasonable amount of money in SIFs shares.

CORNELIA POP, ADINA CALUGARU, MIHAELA MARCU
122
• How did the structure of the Romanian closed-end funds’ portfolios evolved/ changed over time?
Unfortunately, we were not able to find sufficient and accurate information to compare either the portfolios’ structure using economic sectors or portfolios’ asset structure. What we could extract from the data SIFs display in their annual reports are the following trends:
- a constantly decrease in the number of companies due to selling, closing, mergers, acquisitions or spin-offs;
- after the industry sector, the financial sector is well represented in SIFs portfolios (over 15% for every SIF) due to their investments in Romanian banks;
- SIF3 Transilvania declared its interest for the tourism industry and reshape its portfolio to reflect this trend;
We have to add the fact that there are a couple of limitations regarding the investment policy guidelines. Among them, there are two which could represent a problem in the future: SIFs are not allowed to invest on foreign capital markets and in the shares of open-end mutual funds. Due to the fact that SIFs have impressive dimensions (their capitalization as we can see from the tables are important stakes of the BVB capitalizations) the Romanian capital market offerings are still poor, the market has a reduce capacity of absorption, the fact that SIFs are not allowed to invest on mature foreign capital markets could become a problem. At this point, probably, the managers of the 5 SIFs are not much concerned about this aspect but of the fact that they are not allowed to invest in open-end funds shares. These limitations could influence SIFs position and their future after Romanian accession to European Union.
• How did the prices and premiums of the Romanian closed-end funds behave since their listing date at Bucharest Stock Exchange?
Graphs no.3 to 7 present this evolution. SIFs discounts seems to behave in a classical manner, with the exception of several picks when the closing prices – due to a sharp increase - were above NAVs.
The future of SIFs – from juridical point of view - is still unclear. A special law for them is still expected and its necessity is under discussion. We should not forget that their portfolios still includes majority positions and companies inherited from PPFs, most of them of low quality and difficult to be eliminated. SIFs concentrate in their portfolios ownerships to important Romanian companies and their decision regarding these ownerships could have an important impact on Romanian economy.
If the special law would decide that SIFs would remain listed closed-end funds, the restructuring process of their portfolios would be painful and – in some analysts opinion (Simion, 2004 but not only) – SIFs would lose their competitive advantage.

ROMANIAN CLOSED-END FUNDS – AN OVERVIEW
123
One analyst (Simion, 2004) consider that SIFs are financial: � holdings from structural point of view � private equity funds combined with venture capital fund from their
portfolios structure point of view; and Simion consider that they should be allowed to continue to exist like
that, but for the right shareholders – those who understand the investment risks involved; but this oriented the discussion on the ownership limit. The fact that this limit was raised it is a step in the right direction. A second step – it remain to be seen in which direction – would be made when the decision to buy-back the shares owned by the residual shareholders19 would be taken.
Until a decision on the future of SIFs would be taken – and this is a difficult process where a lot of political interests and some group of investors interests would play their part – we believe that SIFs would remain among the BVB blue-chips and very popular among those who invest on Romanian capital market in the absence of other opportunities.
Appendix 1
(Table 1). Descriptive statistics for the variables bvb and fi Variable | Obs Mean Std. Dev. Min Max ----------+-------------------------------------------------------------- bvb | 1171 2122.865 1518.72 501.18 6525.08 fi | 1171 8536.863 7624.664 944.72 33155.81
19 The residual shareholders: those shareholders who received between 5-40 shares as a result of capitalized
dividends between 1992 and 1996. Their situation was (and probably still is) the following: Shares cumulated by the
small shareholders SIFs total number of
shares No.of shares owned
by every one small shareholder (considered residual shareholder)
% Number of shares
SIF1 Banat-Crisana 548,849,268 6 9.20 50,494,133 SIF2 Moldova 519,089,588 5 11.00 57,099,855 SIF3 Transilvania 546,071,666 8 16.40 89,555,753 SIF4 Muntenia 807,036,515 38 46.87 378,258,015 SIF5 Oltenia 580,165,714 10 15.00 87,024,857 Source: Capital no.24/ June 10, 2004

CORNELIA POP, ADINA CALUGARU, MIHAELA MARCU
124
1. TESTING ON THE BRUT DATA: 1.a. Does bvb influence fi? (Table 2). Regressing fi on l.fi l.bvb Adj R-squared = 0.9987 Prob > F = 0.0000 ------------------------------------------------------------------------------ fi | Coef. Std. Err. t P>|t| [95% Conf. Interval] -------------+---------------------------------------------------------------- fi | L1 | .9872417 .0070085 140.86 0.000 .9734873 1.000996 bvb | L1 | .0756275 .0351362 2.15 0.032 .0066717 .1445832 _cons | -30.92872 20.83178 -1.48 0.138 -71.81164 9.954201 ------------------------------------------------------------------------------ (Table 3). Regressing fi on l.fi l.bvb l2.bvb Adj R-squared = 0.9986 Prob > F = 0.0000 ------------------------------------------------------------------------------ fi | Coef. Std. Err. t P>|t| [95% Conf. Interval] -------------+---------------------------------------------------------------- fi | L1 | .9887128 .0083843 117.92 0.000 .9722508 1.005175 bvb | L1 | .9304065 .2447635 3.80 0.000 .449831 1.410982 L2 | -.8566359 .2417953 -3.54 0.000 -1.331383 -.3818882 _cons | -36.67046 24.94519 -1.47 0.142 -85.64856 12.30763 ------------------------------------------------------------------------------ test l.bvb l2.bvb ( 1) L.bvb = 0.0 ( 2) L2.bvb = 0.0 F( 2, 686) = 7.91 Prob > F = 0.0004 (Table 4). Regressing fi on l.fi l.bvb l2.bvb l3.bvb Adj R-squared = 0.9986 Prob > F = 0.0000v ------------------------------------------------------------------------------ fi | Coef. Std. Err. t P>|t| [95% Conf. Interval] -------------+---------------------------------------------------------------- fi | L1 | .9796773 .0101402 96.61 0.000 .9597493 .9996053 bvb | L1 | .3548208 .3076459 1.15 0.249 -.2497766 .9594182 L2 | -.9964699 .5147176 -1.94 0.053 -2.008012 .0150726 L3 | .7620177 .3203447 2.38 0.018 .1324641 1.391571 _cons | -50.80312 30.43528 -1.67 0.096 -110.6157 9.009457 ------------------------------------------------------------------------------ test l.bvb l2.bvb l3.bvb ( 1) L.bvb = 0.0 ( 2) L2.bvb = 0.0

ROMANIAN CLOSED-END FUNDS – AN OVERVIEW
125
( 3) L3.bvb = 0.0 F( 3, 451) = 3.72 Prob > F = 0.0115 (Table 5). Regressing fi on l.fi l.bvb l2.bvb l3.bvb l4.bvb Adj R-squared = 0.9990 Prob > F = 0.0000 ------------------------------------------------------------------------------ fi | Coef. Std. Err. t P>|t| [95% Conf. Interval] -------------+---------------------------------------------------------------- fi | L1 | .9817257 .0123983 79.18 0.000 .9572897 1.006162 bvb | L1 | 1.012195 .345674 2.93 0.004 .3309046 1.693486 L2 | -2.343834 .6063724 -3.87 0.000 -3.538937 -1.148731 L3 | 3.285636 .8968959 3.66 0.000 1.517939 5.053333 L4 | -1.842897 .5127544 -3.59 0.000 -2.853487 -.8323061 _cons | -58.48869 37.24557 -1.57 0.118 -131.8962 14.91882 ------------------------------------------------------------------------------ test l.bvb l2.bvb l3.bvb l4.bvb ( 1) L.bvb = 0.0 ( 2) L2.bvb = 0.0 ( 3) L3.bvb = 0.0 ( 4) L4.bvb = 0.0 F( 4, 218) = 5.53 Prob > F = 0.0003 (Table 6). Regressing fi on l.fi l.bvb l2.bvb l3.bvb l4.bvb l7.bvb Adj R-squared = 0.9990 Prob > F = 0.0000 ------------------------------------------------------------------------------ fi | Coef. Std. Err. t P>|t| [95% Conf. Interval] -------------+---------------------------------------------------------------- fi | L1 | .9839154 .0126606 77.71 0.000 .9589579 1.008873 bvb | L1 | .8903219 .3604583 2.47 0.014 .179761 1.600883 L2 | -2.149084 .6169667 -3.48 0.001 -3.365292 -.9328752 L3 | 3.104854 .9017458 3.44 0.001 1.327269 4.882439 L4 | -1.996488 .5445925 -3.67 0.000 -3.070027 -.922949 L7 | .2545325 .2836475 0.90 0.371 -.3046134 .8136784 _cons | -59.95484 37.82981 -1.58 0.114 -134.5276 14.61794 ------------------------------------------------------------------------------ test l.bvb l2.bvb l3.bvb l4.bvb l7.bvb ( 1) L.bvb = 0.0 ( 2) L2.bvb = 0.0 ( 3) L3.bvb = 0.0 ( 4) L4.bvb = 0.0 ( 5) L7.bvb = 0.0 F( 5, 211) = 4.34 Prob > F = 0.0009 1. b. Does fi influence bvb? (Table 7). Regressing bvb on l.bvb l.fi Adj R-squared = 0.9992 Prob > F = 0.0000 ------------------------------------------------------------------------------

CORNELIA POP, ADINA CALUGARU, MIHAELA MARCU
126
bvb | Coef. Std. Err. t P>|t| [95% Conf. Interval] -------------+---------------------------------------------------------------- bvb | L1 | 1.003581 .0055015 182.42 0.000 .9927837 1.014377 fi | L1 | -.0003539 .0010974 -0.32 0.747 -.0025075 .0017997 _cons | .4005242 3.261752 0.12 0.902 -6.00075 6.801798 ------------------------------------------------------------------------------ (Table 8). Regressing bvb on l.bvb l.fi l2.fi Adj R-squared = 0.9992 Prob > F = 0.0000 ------------------------------------------------------------------------------ bvb | Coef. Std. Err. t P>|t| [95% Conf. Interval] -------------+---------------------------------------------------------------- bvb | L1 | 1.015052 .0064131 158.28 0.000 1.00246 1.027643 fi | L1 | .0206228 .0058073 3.55 0.000 .0092205 .032025 L2 | -.0233446 .0057503 -4.06 0.000 -.0346349 -.0120543 _cons | -4.152578 3.799448 -1.09 0.275 -11.61252 3.307366 ------------------------------------------------------------------------------ test l.fi l2.fi ( 1) L.fi = 0.0 ( 2) L2.fi = 0.0 F( 2, 686) = 9.97 Prob > F = 0.0001 (Table 9). Regressing bvb on l.bvb l.fi l2.fi l3.fi Adj R-squared = 0.9992 Prob > F = 0.0000 ------------------------------------------------------------------------------ bvb | Coef. Std. Err. t P>|t| [95% Conf. Interval] -------------+---------------------------------------------------------------- bvb | L1 | 1.022112 .0076747 133.18 0.000 1.00703 1.037195 fi | L1 | .0135734 .0065813 2.06 0.040 .0006396 .0265071 L2 | .0016712 .009864 0.17 0.866 -.0177138 .0210562 L3 | -.0195523 .007261 -2.69 0.007 -.0338219 -.0052826 _cons | -5.870782 4.56979 -1.28 0.200 -14.85151 3.109943 ------------------------------------------------------------------------------ test l.fi l2.fi l3.fi ( 1) L.fi = 0.0 ( 2) L2.fi = 0.0 ( 3) L3.fi = 0.0 F( 3, 451) = 6.90 Prob > F = 0.0001 (Table 10). Regressing bvb on l.bvb l.fi l2.fi l3.fi l4.fi Adj R-squared = 0.9994 Prob > F = 0.0000 ------------------------------------------------------------------------------ bvb | Coef. Std. Err. t P>|t| [95% Conf. Interval]

ROMANIAN CLOSED-END FUNDS – AN OVERVIEW
127
-------------+---------------------------------------------------------------- bvb | L1 | 1.036094 .0096208 107.69 0.000 1.017133 1.055056 fi | L1 | .0247741 .0083207 2.98 0.003 .0083747 .0411734 L2 | -.0211337 .0108983 -1.94 0.054 -.0426132 .0003458 L3 | -.0077965 .0153897 -0.51 0.613 -.0381282 .0225353 L4 | -.0031248 .0105412 -0.30 0.767 -.0239006 .0176509 _cons | -12.76338 5.737158 -2.22 0.027 -24.07078 -1.455984 ------------------------------------------------------------------------------ test l.fi l2.fi l3.fi l4.fi ( 1) L.fi = 0.0 ( 2) L2.fi = 0.0 ( 3) L3.fi = 0.0 ( 4) L4.fi = 0.0 F( 4, 218) = 7.56 Prob > F = 0.0000 (Table 11). Regressing bvb on l.bvb l.fi l2.fi l3.fi l4.fi l7.fi Adj R-squared = 0.9994 Prob > F = 0.0000 ------------------------------------------------------------------------------ bvb | Coef. Std. Err. t P>|t| [95% Conf. Interval] -------------+---------------------------------------------------------------- bvb | L1 | 1.033331 .009958 103.77 0.000 1.013701 1.052961 fi | L1 | .0278714 .0085274 3.27 0.001 .0110615 .0446813 L2 | -.0246589 .0110258 -2.24 0.026 -.0463938 -.0029241 L3 | -.0063018 .0158958 -0.40 0.692 -.0376368 .0250332 L4 | -.0131592 .0120606 -1.09 0.276 -.036934 .0106155 L7 | .0094244 .0070052 1.35 0.180 -.0043847 .0232335 _cons | -11.08946 5.864997 -1.89 0.060 -22.65095 .4720397 ------------------------------------------------------------------------------ test l.fi l2.fi l3.fi l4.fi l7.fi ( 1) L.fi = 0.0 ( 2) L2.fi = 0.0 ( 3) L3.fi = 0.0 ( 4) L4.fi = 0.0 ( 5) L7.fi = 0.0 F( 5, 211) = 6.18 Prob > F = 0.0000 2. Testing on the log-return of the indexes 2. a. Does ln_bvb influence ln_fi ? (Table 12). Regressing ln_fi on l.ln_fi l.ln_bvb Adj R-squared = 0.0131 Prob > F = 0.0000 ------------------------------------------------------------------------------ ln_fi | Coef. Std. Err. t P>|t| [95% Conf. Interval] -------------+---------------------------------------------------------------- ln_fi | L1 | .1085207 .0400736 2.71 0.007 .0298393 .1872021 ln_bvb |

CORNELIA POP, ADINA CALUGARU, MIHAELA MARCU
128
L1 | .0454606 .0603732 0.75 0.452 -.0730775 .1639986 _cons | .0025942 .0008352 3.11 0.002 .0009542 .0042341 ------------------------------------------------------------------------------ (Table 13). Regressing ln_fi on l.ln_fi l.ln_bvb l2.ln_bvb Adj R-squared = 0.0134 Prob > F = 0.0000 ------------------------------------------------------------------------------ ln_fi | Coef. Std. Err. t P>|t| [95% Conf. Interval] -------------+---------------------------------------------------------------- ln_fi | L1 | .1459433 .0497962 2.93 0.004 .0480826 .243804 ln_bvb | L1 | -.0530822 .0742846 -0.71 0.475 -.1990682 .0929038 L2 | -.0482946 .0752811 -0.64 0.522 -.196239 .0996498 _cons | .0035192 .0010404 3.38 0.001 .0014745 .0055639 ------------------------------------------------------------------------------ test l.ln_bvb l2.ln_bvb ( 1) L.ln_bvb = 0.0 ( 2) L2.ln_bvb = 0.0 F( 2, 452) = 0.54 Prob > F = 0.5825 (Table 14). Regressing ln_fi l.ln_fi l.ln_bvb l2.ln_bvb l3.ln_bvb Prob > F = 0.0053 R-squared = 0.0648 ------------------------------------------------------------------------------ ln_fi | Coef. Std. Err. t P>|t| [95% Conf. Interval] -------------+---------------------------------------------------------------- ln_fi | L1 | .1534153 .0639825 2.40 0.017 .0273151 .2795156 ln_bvb | L1 | .0485203 .0891116 0.54 0.587 -.1271058 .2241464 L2 | -.0714579 .1061111 -0.67 0.501 -.2805875 .1376717 L3 | .2822563 .1028564 2.74 0.007 .0795411 .4849714 _cons | .001501 .0014082 1.07 0.288 -.0012743 .0042763 ------------------------------------------------------------------------------ test l.ln_bvb l2.ln_bvb l3.ln_bvb ( 1) L.ln_bvb = 0.0 ( 2) L2.ln_bvb = 0.0 ( 3) L3.ln_bvb = 0.0 F( 3, 219) = 2.57 Prob > F = 0.0552 (Table 15). Regressing ln_fi l.ln_fi l.ln_bvb l2.ln_bvb l3.ln_bvb l7.ln_bvb Prob > F = 0.0042 R-squared = 0.0773 ------------------------------------------------------------------------------ ln_fi | Coef. Std. Err. t P>|t| [95% Conf. Interval] -------------+---------------------------------------------------------------- ln_fi | L1 | .1344453 .0649978 2.07 0.040 .0063204 .2625702 ln_bvb | L1 | .0780974 .0909031 0.86 0.391 -.1010924 .2572872 L2 | -.0909552 .1105328 -0.82 0.412 -.3088393 .1269289

ROMANIAN CLOSED-END FUNDS – AN OVERVIEW
129
L3 | .328378 .1061137 3.09 0.002 .1192048 .5375512 L7 | .186016 .1087634 1.71 0.089 -.0283804 .4004123 _cons | .0010992 .0014479 0.76 0.449 -.0017549 .0039533 ------------------------------------------------------------------------------ test l.ln_bvb l2.ln_bvb l3.ln_bvb l7.ln_bvb ( 1) L.ln_bvb = 0.0 ( 2) L2.ln_bvb = 0.0 ( 3) L3.ln_bvb = 0.0 ( 4) L7.ln_bvb = 0.0 F( 4, 212) = 2.76 Prob > F = 0.0288 (Table 16). Regressing ln_fi on l.ln_fi l.ln_bvb l2.ln_bvb l3.ln_bvb l7.ln_bvb l8.ln_bvb Prob > F = 0.0104 Adj R-squared = 0.0496 ------------------------------------------------------------------------------ ln_fi | Coef. Std. Err. t P>|t| [95% Conf. Interval] -------------+---------------------------------------------------------------- ln_fi | L1 | .1360958 .0663813 2.05 0.042 .0052331 .2669585 ln_bvb | L1 | .0768339 .0913336 0.84 0.401 -.1032193 .2568871 L2 | -.0878431 .1110344 -0.79 0.430 -.306734 .1310478 L3 | .3182889 .1069515 2.98 0.003 .1074469 .5291308 L7 | .2075124 .1144118 1.81 0.071 -.0180367 .4330616 L8 | -.028202 .0860882 -0.33 0.744 -.1979144 .1415104 _cons | .001288 .0014698 0.88 0.382 -.0016096 .0041855 ------------------------------------------------------------------------------ test l.ln_bvb l2.ln_bvb l3.ln_bvb l7.ln_bvb l8.ln_bvb ( 1) L.ln_bvb = 0.0 ( 2) L2.ln_bvb = 0.0 ( 3) L3.ln_bvb = 0.0 ( 4) L7.ln_bvb = 0.0 ( 5) L8.ln_bvb = 0.0 F( 5, 209) = 2.14 Prob > F = 0.0620 2. b. Does ln_fi influence ln_bvb? (Table 17). Regressing ln_bvb on l.ln_bvb l.ln_fi Adj R-squared = 0.0398 Prob > F = 0.0000 ------------------------------------------------------------------------------ ln_bvb | Coef. Std. Err. t P>|t| [95% Conf. Interval] -------------+---------------------------------------------------------------- ln_bvb | L1 | .1674001 .0392712 4.26 0.000 .0902942 .244506 ln_fi | L1 | .0419236 .0260668 1.61 0.108 -.0092566 .0931038 _cons | .0017072 .0005433 3.14 0.002 .0006405 .002774 ------------------------------------------------------------------------------ (Table 18). Regressing ln_bvb l.ln_bvb l.ln_fi l2.ln_fi Adj R-squared = 0.0122 Prob > F = 0.0356

CORNELIA POP, ADINA CALUGARU, MIHAELA MARCU
130
------------------------------------------------------------------------------ ln_bvb | Coef. Std. Err. t P>|t| [95% Conf. Interval] -------------+---------------------------------------------------------------- ln_bvb | L1 | .0967102 .0498467 1.94 0.053 -.0012499 .1946702 ln_fi | L1 | .0407944 .0336278 1.21 0.226 -.0252918 .1068806 L2 | .0079427 .0320266 0.25 0.804 -.0549969 .0708823 _cons | .0020867 .0006986 2.99 0.003 .0007138 .0034596 ------------------------------------------------------------------------------ test l.ln_fi l2.ln_fi ( 1) L.ln_fi = 0.0 ( 2) L2.ln_fi = 0.0 F( 2, 452) = 0.78 Prob > F = 0.4613 (Table 19). Regressing ln_bvb on l.ln_bvb l.ln_fi l2.ln_fi l3.ln_fi Adj R-squared = 0.0549 Prob > F = 0.0025 ------------------------------------------------------------------------------ ln_bvb | Coef. Std. Err. t P>|t| [95% Conf. Interval] -------------+---------------------------------------------------------------- ln_bvb | L1 | .1893521 .0546972 3.46 0.001 .0815519 .2971523 ln_fi | L1 | .0216471 .0393305 0.55 0.583 -.0558676 .0991618 L2 | -.0064976 .039063 -0.17 0.868 -.0834851 .0704899 L3 | .0202424 .0375784 0.54 0.591 -.0538193 .094304 _cons | .0008362 .0008547 0.98 0.329 -.0008482 .0025207 ------------------------------------------------------------------------------ test l.ln_fi l2.ln_fi l3.ln_fi ( 1) L.ln_fi = 0.0 ( 2) L2.ln_fi = 0.0 ( 3) L3.ln_fi = 0.0 F( 3, 219) = 0.20 Prob > F = 0.8943 (Table 20). Regressing ln_bvb on l.ln_bvb l.ln_fi l2.ln_fi l3.ln_fi l7.ln_fi Adj R-squared = 0.0497 Prob > F = 0.0072 ------------------------------------------------------------------------------ ln_bvb | Coef. Std. Err. t P>|t| [95% Conf. Interval] -------------+---------------------------------------------------------------- ln_bvb | L1 | .1853532 .0556054 3.33 0.001 .0757429 .2949635 ln_fi | L1 | .0210719 .0399048 0.53 0.598 -.057589 .0997329 L2 | -.0107123 .0395752 -0.27 0.787 -.0887235 .067299 L3 | .0270737 .0386243 0.70 0.484 -.0490631 .1032105 L7 | -.0033751 .0423876 -0.08 0.937 -.0869303 .0801801 _cons | .0007628 .0008838 0.86 0.389 -.0009794 .0025049 ------------------------------------------------------------------------------ test l.ln_fi l2.ln_fi l3.ln_fi l7.ln_fi ( 1) L.ln_fi = 0.0

ROMANIAN CLOSED-END FUNDS – AN OVERVIEW
131
( 2) L2.ln_fi = 0.0 ( 3) L3.ln_fi = 0.0 ( 4) L7.ln_fi = 0.0 F( 4, 212) = 0.21 Prob > F = 0.9319 (Table 21). Regressing ln_bvb l.ln_bvb l.ln_fi l2.ln_fi l3.ln_fi l7.ln_fi l8.ln_fi Adj R-squared = 0.0607 Prob > F = 0.0039 ------------------------------------------------------------------------------ ln_bvb | Coef. Std. Err. t P>|t| [95% Conf. Interval] -------------+---------------------------------------------------------------- ln_bvb | L1 | .1748123 .055603 3.14 0.002 .0651977 .2844269 ln_fi | L1 | .0073906 .0402958 0.18 0.855 -.0720476 .0868289 L2 | -.0222509 .0397673 -0.56 0.576 -.1006473 .0561455 L3 | .0320779 .038525 0.83 0.406 -.0438696 .1080254 L7 | -.028114 .0443703 -0.63 0.527 -.1155847 .0593568 L8 | .0772627 .0403327 1.92 0.057 -.0022483 .1567737 _cons | .000624 .0008875 0.70 0.483 -.0011257 .0023737 ------------------------------------------------------------------------------ test l.ln_fi l2.ln_fi l3.ln_fi l7.ln_fi l8.ln_fi ( 1) L.ln_fi = 0.0 ( 2) L2.ln_fi = 0.0 ( 3) L3.ln_fi = 0.0 ( 4) L7.ln_fi = 0.0 ( 5) L8.ln_fi = 0.0 F( 5, 209) = 0.91 Prob > F = 0.4745
Appendix 2 Benford’s Law Test Benford’s law is also called the first digit law. Benford’s law states that in any series of data, the digit 1 tends to occur with a probability of approximately 30% and the probability decrease for the other digits (2 to 9) [http://matworld.wolfram.com/BenfordsLaw.html] We use the Benford’s law in our attempt to spot any manipulative actions over SIFs prices. We applied the test to SIFs daily returns; we applied the test to the ‘original’ series of returns, without taking into account the BVB closing days and to the ‘extended’ series where we included the closing days at BVB. For those closing days the return was calculated by dividing the first return which occurred after a closing period and this return was divided by the number of closing days. The results show some differences, but not very important, as it can be observed in tables no.22 and no.23 .

CORNELIA POP, ADINA CALUGARU, MIHAELA MARCU
132
Table no.22 – Benford’s Law for ‘original’ series
% frequency of first digit apparition
Benford Law BET-FI SIF1 SIF2 SIF3 SIF4 SIF5
Digit 1 30.10 32.54 37.37 32.83 42.80 39.05 33.36
Digit 2 17.61 18.69 16.86 21.59 14.40 17.52 20.96
Digit 3 12.49 11.73 11.21 11.78 14.40 12.19 12.32
Digit 4 9.69 9.44 8.57 7.14 5.70 6.57 7.63
Digit 5 7.92 6.88 5.74 6.60 8.60 7.33 7.08
Digit 6 6.69 6.61 7.57 4.73 3.80 4.38 7.35
Digit 7 5.80 5.20 5.01 5.53 5.50 3.05 4.50
Digit 8 5.12 4.76 3.46 6.33 3.30 4.76 4.41
Digit 9 4.58 4.14 4.19 3.48 1.50 5.14 2.39
Table no.23 – Benford’s Law for ‘extended’ series
% frequency of first digit apparition
Benford Law BET-FI SIF1 SIF2 SIF3 SIF4 SIF5
Digit 1 30.10 29.45 32.80 28.17 35.61 31.19 29.48
Digit 2 17.61 18.94 16.46 20.27 13.65 17.31 21.50
Digit 3 12.49 13.68 13.04 13.08 13.86 13.11 9.18
Digit 4 9.69 10.27 10.99 7.60 6.22 8.47 10.43
Digit 5 7.92 7.17 6.27 8.19 13.32 8.72 7.17
Digit 6 6.69 5.85 7.45 7.07 4.35 8.15 9.37
Digit 7 5.80 6.75 6.77 6.31 6.63 3.88 4.27
Digit 8 5.12 3.82 3.11 4.36 2.88 4.26 5.34
Digit 9 4.58 4.06 3.11 4.95 3.48 4.90 3.27 We completed this test results with the correlation coefficient between the returns at the moment t and at the moment t+1 (next day). The results are presented in table no.24. These are very weak and cumulated with Benford’s law test results, we considered that SIFs prices were not manipulated.
Table 24 – correlation coefficient
BET-FI SIF1 SIF2 SIF3 SIF4 SIF5 correlation of return at t and return at t+1 0.110834 0.0102285 0.1172921 0.107239 -0.009579 -0.031775

ROMANIAN CLOSED-END FUNDS – AN OVERVIEW
133
REFERENCES
1. Anderson, Seth C., Born, Jeffery A. - Closed-end fund pricing. Theories and
Evidence, IFMI (Innovations in Financial Markets and Institutions), Kluwer Academic Publishers, 2002
2. Anderson, Seth C., Born, Jeffery A. - Closed-end investment companies. Issues and Answers, Kluwer Academic Publishers, 1992
3. Apostu, Mioara – SIF’98: o cotare imposibila (1), Piata Financiara nr.6/ iunie 1998 4. Apostu, Mioara – SIF-urile isi restructureaza portofoliile (2), Piata Financiara nr.7-
8/ iulie-august 1998 5. Apostu, Mioara - SIF-urile isi restructureaza portofoliile (3), Piata Financiara nr.9/
septembrie 1998 6. Apostu, Mioara - SIF’98: o cotare imposibila (4), Piata Financiara nr.10/
octombrie 1998 7. Bleaney, Michael, Smith, R. Todd - Prior performance and closed-end fund
discounts, Discussion Papers in Economics, No.3/16, September 2003 8. Bucharest Equity Research Group (BERG) & Piata Financiara– SIF-urile la
inceput de drum, Piata Financiaranr.12/ decembrie 1999 9. Caruntu, Mihai – Tranzactii abandonate?, Piata Financiara nr.6/ iunie 1999 10. Caruntu, Mihai – Dileme in ajunul listarii la Bursa, Piata Financiara nr.9/
septembrie 1999 11. Caruntu, Mihai – Incepe deratizarea, Piata Financiara nr.10/ octombrie 1999 12. Caruntu, Mihai – Miza pozitiei de actionar majoritar, Piata Financiara nr.11/
noiembrie 1999 13. Caruntu, Mihai – Cea dintai primavara, Piata Financiara nr.2/ februarie 2000 14. Caruntu, Mihai – SIF-urile organizeaza diferit adunarile generale, Piata Financiara
nr.3/ martie 2000 15. Caruntu, Mihai – SIF-urilor li se pregateste ceva, Piata Financiara nr.4/ aprilie 2000 16. Caruntu, Mihai – SIF-urile vor alt sistem contabil, Piata Financiara nr.6/ iunie 2000 17. Caruntu, Mihai – DouaSIF-uri acuzate ca au incalcat Legea nr.31/ 1990, Piata
Financiara nr.9/ septembrie 2000 18. Caruntu, Mihai – AGA, pe baricade la SIF Oltenia, Piata Financiara nr.11/
noiembrie 2000 19. Caruntu, Mihai – Averea SIF nu poate fi evaluata, Piata Financiara nr.9/
septembrie 2001 20. Caruntu, Mihai – Musafiri surprizala usa SIF, Piata Financiara nr.11/ noiembrie 2001 21. Caruntu, Mihai – Confuzie in jurul societatilor de investitii, Piata Financiara nr.12/
decembrie 2001 22. Caruntu, Mihai – Atac surprizala patrimoniile SIF, Piata Financiara nr.2/ februarie 2002 23. Caruntu, Mihai – Panica in jurul SIF, Piata Financiara nr.2/ februarie 2003 24. Caruntu, Mihai – SIF isi asteapta ursitoarele, Piata Financiara nr.10/ octombrie 2003 25. Dimson, Elroy; Minio-Kozerski, Carolina - Closed-end funds: A Survey, Financial
markets, Institutions &Instruments, Vol. 8, Number 2, 1999 26. Herzefeld, Thomas - Herzfeld’s guide to closed-end funds, McGraw-Hill, New
York, 1993

CORNELIA POP, ADINA CALUGARU, MIHAELA MARCU
134
27. Intercapital Invest – Raport Societati de Investitii Financiare (SIF), 10 decembrie 2004, www.kmarket.ro
28. Ispir, Laurentiu, Nicolaescu, Vlad – Lupta pentru averea SIF: ultima sarja, Business Magazin 9-15 februarie 2005
29. Panait, Iulian – Pe ce se fundamenteaza preturile actiunilor SIF, Capital nr.44/ 28 octombrie 2004
30. Panait, Iulian – Companiile si SIF-urile au dinamizat tranzactiile, Capital nr.29/ 21 iulie 2005
31. Popa, Carol – AVAB a provocat panica printre actionarii SIF Moldova, Capital nr.46/ 14 noiembrie 2002
32. Popescu, Laurentiu – SIF-urile sunt cu ochii pe industria serviciilor, Capital nr.17/ 22 aprilie 2004
33. Popescu, Laurentiu – SIF-ul rascumpara 9-47% din actiuni, Capital nr.24/ 10 iunie 2004 34. Popescu, Laurentiu – Alianta SIF-urilor contra opt milioane de mici actionari,
Capital nr.24/ 10 iunie 2004 35. Popescu, Laurentiu – Actiunile SIF sunt stranse incetisor, Capital nr.49/ 4
decembrie 2004 36. Popescu, Laurentiu – O instructiune, mai multe interpretari, Capital nr.7/ 17
februarie 2005 37. Popescu, Laurentiu – Un proiect pentru nelinistea SIF-urilor, Capital nr.18/ 5 mai 2005 38. Popescu, Laurentiu – Participatiile SIF-urilor s-ar putea reduce, Capital nr.18/ 5 mai 2005 39. Simion, Dragos – Batalia pentru SIF, Piata Financiara nr.1/ ianuarie 2004 40. Tornea, Dan – Atentie cutremur: la SIF etajele superioare sunt in pericol, Capital
nr.38/ 25 septembrie 1999 41. Tornea, Dan – Toata lumea este asteptatala Bursa, Capital nr.38/ 25 septembrie 1999 42. Tornea, Dan – Actionarii SIF sunt cei mai buni dintre toti, Capital nr.38/ 25
septembrie 1999 43. *** - Ca in vremurile bune, Business Magazin 10-16 august 2005 44. *** - Investitori institutionali, Supliment al revistei Piata financiara, Mai, 1999 45. *** - Investitori institutionali, Supliment al revistei Piata financiara, Decembrie 2003 46. *** - Investitori institutionali, Supliment al revistei Piata financiara, Iulie-August 2004 47. *** - Investitori institutionali, Supliment al revistei Piata financiara, Decembrie 2004 48. *** - Investitori institutionali, Supliment al revistei Piata financiara, Iulie-August 2005 49. *** - Relatia SIF-uri – CNVM: unde nu-i lege e prea multa tocmeala, Adevarul
nr.3952/ 12 martie 2003 50. *** - Sintea privind Raportul de gestiune al SIF Transilvania SA aferent
exercitiului financiar 1998, Piata Financiaranr.4/ aprilie 1999 51. http://matworld.wolfram.com/BenfordsLaw.html 52. www.banat-crisana.ro (SIF1 Banat-Crisana) 53. www.sifm.ro (SIF2 Moldova) 54. www.transif.ro (SIF3 Transilvania) 55. www.sifmuntenia.ro (SIF4 Muntenia) 56. www.sifolt.ro (SIF5 Oltenia) 57. www.bvb.ro (Bucharest Stock Exchange) 58. www.ici.org 59. www.kmarket.ro
Related Documents


