HAL Id: hal-03212181 https://hal.archives-ouvertes.fr/hal-03212181 Submitted on 29 Apr 2021 HAL is a multi-disciplinary open access archive for the deposit and dissemination of sci- entific research documents, whether they are pub- lished or not. The documents may come from teaching and research institutions in France or abroad, or from public or private research centers. L’archive ouverte pluridisciplinaire HAL, est destinée au dépôt et à la diffusion de documents scientifiques de niveau recherche, publiés ou non, émanant des établissements d’enseignement et de recherche français ou étrangers, des laboratoires publics ou privés. Role of interlayer porosity and particle organization in the diffusion of water in swelling clays A. Asaad, F. Hubert, E. Ferrage, T. Dabat, E. Paineau, P. Porion, S. Savoye, B. Gregoire, B. Dazas, Alfred Delville, et al. To cite this version: A. Asaad, F. Hubert, E. Ferrage, T. Dabat, E. Paineau, et al.. Role of interlayer porosity and particle organization in the diffusion of water in swelling clays. Applied Clay Science, Elsevier, 2021, 207, pp.106089. 10.1016/j.clay.2021.106089. hal-03212181

Welcome message from author
This document is posted to help you gain knowledge. Please leave a comment to let me know what you think about it! Share it to your friends and learn new things together.
Transcript
HAL Id: hal-03212181https://hal.archives-ouvertes.fr/hal-03212181
Submitted on 29 Apr 2021
HAL is a multi-disciplinary open accessarchive for the deposit and dissemination of sci-entific research documents, whether they are pub-lished or not. The documents may come fromteaching and research institutions in France orabroad, or from public or private research centers.
L’archive ouverte pluridisciplinaire HAL, estdestinée au dépôt et à la diffusion de documentsscientifiques de niveau recherche, publiés ou non,émanant des établissements d’enseignement et derecherche français ou étrangers, des laboratoirespublics ou privés.
Role of interlayer porosity and particle organization inthe diffusion of water in swelling clays
A. Asaad, F. Hubert, E. Ferrage, T. Dabat, E. Paineau, P. Porion, S. Savoye,B. Gregoire, B. Dazas, Alfred Delville, et al.
To cite this version:A. Asaad, F. Hubert, E. Ferrage, T. Dabat, E. Paineau, et al.. Role of interlayer porosity and particleorganization in the diffusion of water in swelling clays. Applied Clay Science, Elsevier, 2021, 207,pp.106089. �10.1016/j.clay.2021.106089�. �hal-03212181�
1
Role of interlayer porosity and particle organization in the diffusion of 1
water in swelling clays 2
3
A. Asaad1,*, F. Hubert1, E. Ferrage1, T. Dabat1, E. Paineau2, P. Porion3, S. Savoye4, B. 4
Gregoire1, B. Dazas1, A. Delville3, E. Tertre1,* 5
6
1 IC2MP, Equipe HydrASA, UMR 7285 CNRS/Université de Poitiers, 86073 Poitiers, France. 7
2 Université Paris-Saclay, CNRS, Laboratoire de Physique des Solides, 91405 Orsay, France 8
3 ICMN, UMR 7374 CNRS/Université d'Orléans, 45071 Orléans, France 9
4 Université Paris-Saclay, CEA, Service d’Etude du Comportement de Radionucléides, 91191 10
Gif-sur-Yvette, France 11
12
⁎ E-mail addresses of the corresponding authors: 13
A. Asaad: [email protected] 14
E. Tertre: [email protected] 15
16
17
Highlights 18
- Samples with same interparticle porosity but different particle organizations. 19
- Reduction in the overall mobility of water in presence of interlayer porosity. 20
- Minor role of interlayer porosity in flux traversing samples. 21
- Anisotropy in water diffusion quantitatively related to the preferential orientation of the 22
particles. 23
24
2
Graphical abstract 25
Abstract 26
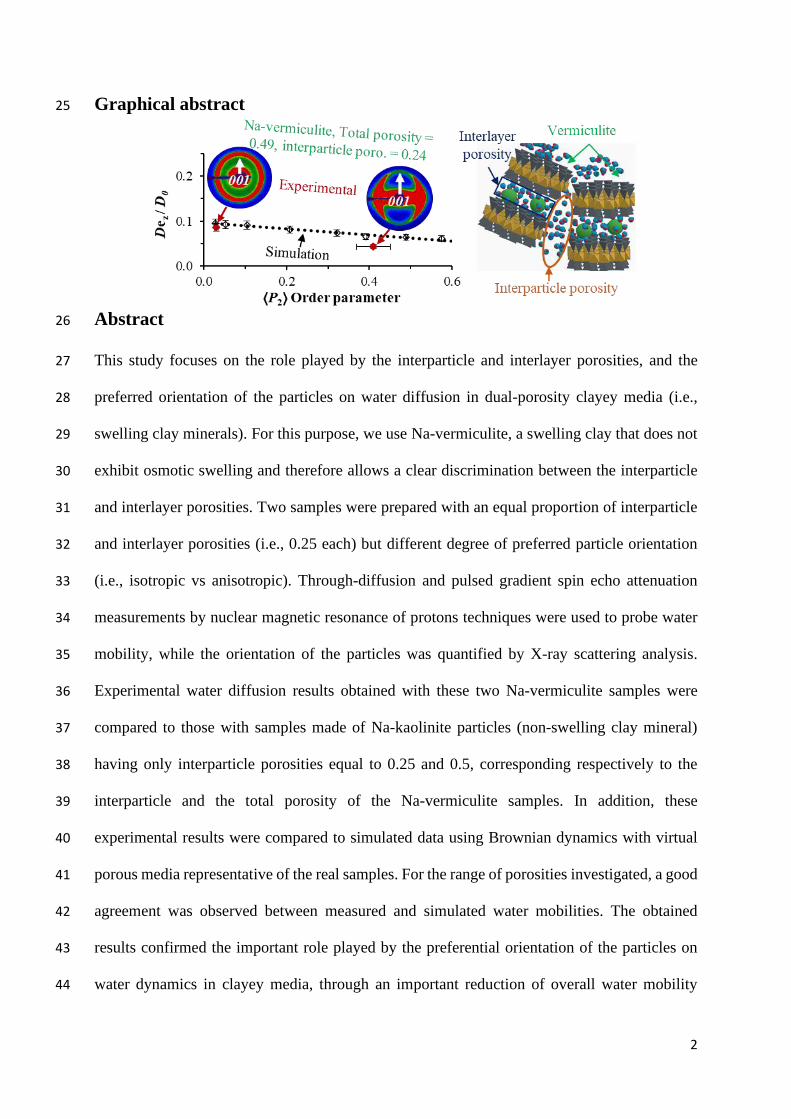
This study focuses on the role played by the interparticle and interlayer porosities, and the 27
preferred orientation of the particles on water diffusion in dual-porosity clayey media (i.e., 28
swelling clay minerals). For this purpose, we use Na-vermiculite, a swelling clay that does not 29
exhibit osmotic swelling and therefore allows a clear discrimination between the interparticle 30
and interlayer porosities. Two samples were prepared with an equal proportion of interparticle 31
and interlayer porosities (i.e., 0.25 each) but different degree of preferred particle orientation 32
(i.e., isotropic vs anisotropic). Through-diffusion and pulsed gradient spin echo attenuation 33
measurements by nuclear magnetic resonance of protons techniques were used to probe water 34
mobility, while the orientation of the particles was quantified by X-ray scattering analysis. 35
Experimental water diffusion results obtained with these two Na-vermiculite samples were 36
compared to those with samples made of Na-kaolinite particles (non-swelling clay mineral) 37
having only interparticle porosities equal to 0.25 and 0.5, corresponding respectively to the 38
interparticle and the total porosity of the Na-vermiculite samples. In addition, these 39
experimental results were compared to simulated data using Brownian dynamics with virtual 40
porous media representative of the real samples. For the range of porosities investigated, a good 41
agreement was observed between measured and simulated water mobilities. The obtained 42
results confirmed the important role played by the preferential orientation of the particles on 43
water dynamics in clayey media, through an important reduction of overall water mobility 44
3
between the isotropic and anisotropic Na-vermiculite samples. These results also showed that 45
for the same total porosity, the presence of interlayer porosity and associated nano-confinement 46
led to a logical reduction in the pore diffusion coefficient of water in Na-vermiculite in 47
comparison to Na-kaolinite. Moreover, in comparison with Na-kaolinite having the same 48
interparticle porosity, results showed that the contribution of the interlayer volume on the 49
traversing flux was small compared to the interparticle volume. Finally, the computed results 50
revealed that the anisotropy in water diffusion can be directly predicted based on the degree of 51
particles preferred orientation, irrespective of the total or the distribution of the different 52
porosity types. 53
1. Introduction 54
Diffusion is the main transport process in compacted clayey rocks owing to their low 55
hydraulic conductivity (Pusch, 1979; Bourg et al., 2003; Bourg and Tournassat, 2015). This 56
process has been extensively studied, especially in the context of the storage of nuclear waste 57
and CO2, and resulted in an abundance of experimental data obtained by various methods (such 58
as through-diffusion (TD) experiments using tracers or quasi-elastic neutron scattering) and 59
models describing the diffusion of different elements in clayey media (e.g., Sato and Suzuki, 60
2003; Van Loon et al., 2004; Andra, 2005; García-Gutiérrez et al., 2006; Landais, 2006; Bachu, 61
2008; González Sánchez et al., 2008a and b; Glaus et al., 2010; Gimmi and Kosakowski, 2011; 62
Altmann et al., 2015; Savoye et al., 2015; Charlet et al., 2017; Bestel et al., 2018; Dagnelie et 63
al., 2018). Note that these data were obtained for various media constitutive of mono- or multi-64
clayey phases and considering the presence or not of non-clayey minerals (Shackelford and 65
Moore, 2013; Bourg and Tournassat, 2015; Charlet et al., 2017; Bestel et al., 2018 and 66
references therein). 67
The organization and connectivity of the pore network are the main parameters that 68
control diffusion of water in clayey media since water is usually inert from a chemical 69
4
viewpoint (Bourg and Tournassat, 2015 and references therein). The influence of the total 70
porosity value is the parameter that has been the subject of most extensive investigation. Thus, 71
a logical decrease in the water diffusion coefficients with a diminution in the porosity is 72
commonly reported (e.g., Tournassat and Steefel, 2019 and references therein). In contrast, less 73
attention has been paid to the influence of other parameters, such as the preferential orientation 74
of the clay particles, a typical property of these platelet materials in natural aqueous 75
environments (Bennett et al., 1981), or to the distribution of different types of porosities (e.g., 76
interlayer vs. interparticle porosity in swelling clay minerals). Nevertheless, by investigating 77
the spatial anisotropy of the diffusion of water tracers in such media, either by TD experiments 78
or by analyzing the 3D distribution of the tracer, several authors (Farver and Yund, 1999; Sato, 79
2000; Sato and Suzuki, 2003; Suzuki et al., 2004; García-Gutiérrez et al., 2006; Wenk et al., 80
2008; Wittebroodt et al., 2012; Xiang et al., 2013; Jacops et al., 2017; Dagnelie et al., 2017) 81
have reported a significant diminution of the effective diffusion coefficients (De) of water in 82
the direction perpendicular to the sedimentation beds with respect to the parallel direction. Such 83
behavior was attributed to anisotropy in the shape and distribution of the pores between clay 84
particles, resulting from their preferred orientation, as evidenced by either X-ray scattering 85
(XRS, Wenk et al., 2008) or microscopy-imaging techniques (Sato, 2000; Suzuki et al., 2004). 86
The porosity and preferred orientation of the particles in clayey media are often coupled 87
parameters (a decrease in the porosity leads to an increase in the particle orientation). Hence, it 88
is complicated to discriminate the contribution of each parameter to the overall diffusion 89
process. To overcome such limitation, Dabat et al., (2020) recently proposed a methodology 90
that allow to prepare samples from Na-kaolinite particles (non-porous and non-charged 91
particles) with similar porosity but different degrees of preferential orientation of the particles. 92
These authors succeeded in connecting the anisotropy of the tensor diffusion of the water tracer 93
to the preferential orientation of the particles in these samples for a porosity value of ~ 0.5 based 94
5
on experimental water diffusion analyses obtained using pulsed gradient spin echo attenuation 95
measurements by nuclear magnetic resonance (PGSE-NMR) and numerical data from 96
Brownian dynamics (BD) simulations using various virtual porous media (VPMs). However, 97
such a relationship remains to be investigated in the case of clay media made of swelling clay 98
particles with two types of porosities (i.e., interlayer and interparticle) being accessible for the 99
water. In such dual-porosity media with charged surfaces, water mobility in the interlayer space 100
can be drastically reduced compared to that in the interparticle porosity, as revealed by 101
molecular dynamic simulations (Titiloye and Skipper, 2001; Marry et al., 2002; Malikova et 102
al., 2006; Michot et al., 2012 among others) and quasi-elastic neutron scattering studies 103
(González Sánchez et al., 2008a; Bestel, 2014) performed on low charge swelling clays, e.g. 104
montmorillonite. Note that this reduced mobility near the surface of the charged clayey particles 105
is usually considered in reactive transport models (i.e., models that couple transport to chemical 106
properties using continuum approaches (Ochs et al., 2001; Tournassat and Steefel, 2019 and 107
references therein), which predict the diffusion of water in complex and heterogenous clayey 108
media. The use of these numerical approaches allow for decoupling the diffusion that occurs in 109
the different types of porosity (i.e., interlayer vs. interparticle porosities), while discrete models 110
(e.g., molecular dynamics, random walk or BD simulations) also allow consideration of the 111
specific role of the particles’ preferred orientation on the diffusion properties (e.g., Churakov 112
and Gimmi, 2011; Tyagi et al., 2013; Bacle et al., 2016; Gimmi and Churakov, 2019; Dabat et 113
al., 2020; Underwood and Bourg, 2020). Beyond such numerical approaches, existing 114
experimental water diffusion data in dual-porosity media were almost exclusively obtained with 115
smectite particles (e.g., Bourg and Tournassat, 2015 and references therein). This mineral 116
displays, however, osmotic swelling in water-saturated conditions (i.e., incorporation of an ill-117
defined number of water molecules between the layers (Abend and Lagaly, 2000; Liu, 2013; 118
Tertre et al., 2018 among others), which hampers the calculation of the respective interlayer 119
6
and interparticle porosity volumes. In the scope of quantitatively discussing the role played by 120
interlayer and interparticle porosities on the diffusion of water, as well as by the preferred 121
orientation of the clay particles, additional experimental data on dual-porosity clay media that 122
are not sensitive to osmotic swelling are required. For this purpose, vermiculite clay mineral 123
represents an ideal candidate. Vermiculite is a swelling clay mineral with a structure similar to 124
smectite. However, owing to the higher layer charge, this mineral does not display osmotic 125
swelling (Faurel, 2012) and exhibits well-defined interlayer volumes in water-saturated 126
conditions, which allows for a better determination of the different interlayer and interparticle 127
volumes in the samples. Tertre et al. (2018) used this mineral to perform water tracer diffusion 128
experiments and highlighted the notable differences in the effective diffusion coefficients 129
obtained in vermiculite compared to montmorillonite for similar total porosities. Moreover, by 130
comparison with experimental data reported for kaolinite, these authors noticed that the 131
experimental data were similar for the same interparticle porosity value. However, because the 132
preferred orientation of the clay particles was not measured, it was not possible to deduce 133
information on the contribution of different parameters (the porosity distribution or particles’ 134
orientation) to the overall water diffusion process. 135
The present study represents an extension of the work of Tertre et al. (2018) and the recent 136
approach proposed by Dabat et al. (2020) for kaolinite clay mineral (at a porosity value of ~0.5), 137
to the dual-porosity media made of Na-vermiculite particles. In this work, an experimental 138
methodology was developed to obtain vermiculite samples with two degrees of preferential 139
particle orientation, as measured by XRS analysis, for the same total porosity of 50% (the same 140
total porosity used by Dabat et al. (2020) for Na-kaolinite samples). In such conditions, Na-141
vermiculite is composed of an equal proportion of interlayer and interparticle porosity 142
proportions (i.e., ~ 0.25). Experimental diffusion data on water tracer (HDO) in these media 143
were obtained using TD experiments that allow to determine the effective diffusion coefficients 144
7
in the direction perpendicular to the sedimentation plane of the particles. To complete the 145
experimental dataset on water diffusion, the sample set also included an additional clay medium 146
of Na-kaolinite with a total porosity of ~ 0.25 (i.e., similar interparticle porosity as with Na-147
vermiculite). For this sample, both the TD and PGSE-NMR results on water diffusion were 148
obtained to assess the concordance of the two methods on the analysis of water diffusion despite 149
the significant difference in the timescales probed for water dynamics (i.e., ms and days for the 150
PGSE-NMR and TD experiments, respectively). Following a coupled experimental-151
computational approach (Dabat et al., 2020), all these data were systematically compared to the 152
results obtained by BD simulations, which were performed with 3D virtual porous media, 153
generated to mimic the real ones in term of mineralogy and porosity distribution, while also 154
covering a large range of anisotropy degrees in particle orientations. 155
2. Materials and Methods 156
2.1. Materials 157
The vermiculite used in this study is from Santa Olalla (Huelva, Spain; Gonzáles García 158
and García Ramos, 1960; De La Calle et al., 1977). In its original form, the centimetric 159
vermiculite crystals are Mg2+-saturated with a structural formula (Marcos et al., 2003; Arguelles 160
et al., 2010): [(Mg4.92Fe0.44Al0.60Ti0.04) (Si5.66Al2.34)O20(OH)4](Mg0.76Ca0.06Na0.04), 7.63H2O]. 161
The 0.1-0.2 µm particle size fraction, used for this study, was obtained by sonication and 162
centrifugation methods using the protocol established by Reinholdt et al., (2013). The kaolinite 163
used is KGa-2 from the Source Clay Repository of the Clay Mineral Society, with an average 164
size of the particles of approximately 0.5 μm (Hassan et al., 2005), and a structural formula 165
(Mermut and Cano, 2001) of [(Al3.80Ti0.13Fe3+0.07) (Si3.84Al0.16)O5(OH 4)]. 166
Both materials were exchanged into homoionic Na+ form (i.e., Na-kaolinite and Na-167
vermiculite) using five saturation cycles with a 1-M NaCl solution, followed by removal of 168
excess of salt by dialysis using a 6-8 KD membrane until test with silver nitrate was negative. 169
8
Compacted samples were prepared from the dialyzed clay dispersion dried at 60°C and then 170
sieved through a 50 μm mesh to remove the coarsest aggregates. A centrifuged sample made of 171
Na-vermiculite particles was prepared directly from the dialyzed dispersion and was then stored 172
at 4°C. 173
2.2. Preparation of samples with contrasted anisotropy in particle orientation 174
The methodology used to prepare compacted Na-kaolinite for PGSE-NMR experiments 175
as well as experimental setup and acquisition conditions are detailed in section S1.1 in 176
Supplementary Data (S. D.). For TD experiments, the isotropic samples were prepared by 177
uniaxial compaction of dried clay powder in (poly)methyl methacrylate (PMMA) tubes 178
(diameter of 0.95 cm and a height of 7 cm) as in Tertre et al. (2018). By contrast, a new protocol 179
was developed in the present study to build an anisotropic Na-vermiculite medium with the 180
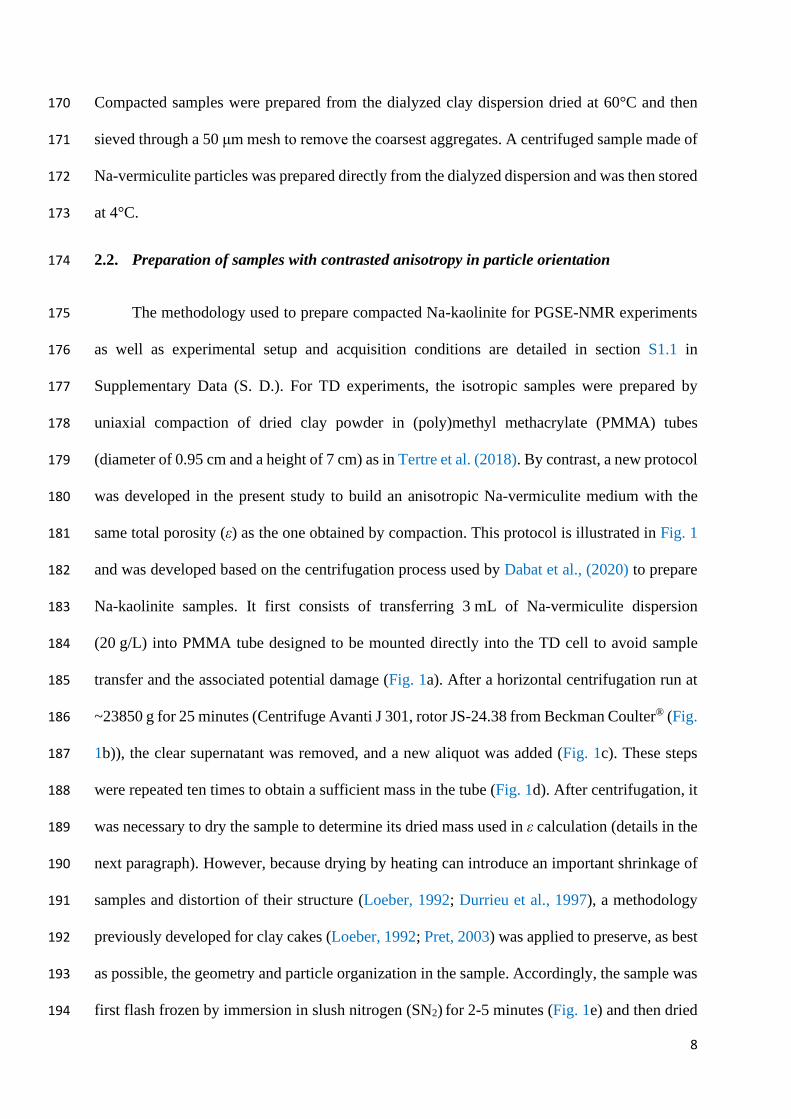
same total porosity (ε) as the one obtained by compaction. This protocol is illustrated in Fig. 1 181
and was developed based on the centrifugation process used by Dabat et al., (2020) to prepare 182
Na-kaolinite samples. It first consists of transferring 3 mL of Na-vermiculite dispersion 183
(20 g/L) into PMMA tube designed to be mounted directly into the TD cell to avoid sample 184
transfer and the associated potential damage (Fig. 1a). After a horizontal centrifugation run at 185
~23850 g for 25 minutes (Centrifuge Avanti J 301, rotor JS-24.38 from Beckman Coulter® (Fig. 186
1b)), the clear supernatant was removed, and a new aliquot was added (Fig. 1c). These steps 187
were repeated ten times to obtain a sufficient mass in the tube (Fig. 1d). After centrifugation, it 188
was necessary to dry the sample to determine its dried mass used in ε calculation (details in the 189
next paragraph). However, because drying by heating can introduce an important shrinkage of 190
samples and distortion of their structure (Loeber, 1992; Durrieu et al., 1997), a methodology 191
previously developed for clay cakes (Loeber, 1992; Pret, 2003) was applied to preserve, as best 192
as possible, the geometry and particle organization in the sample. Accordingly, the sample was 193
first flash frozen by immersion in slush nitrogen (SN2) for 2-5 minutes (Fig. 1e) and then dried 194
9
by lyophilization at – 40°C for 2-3 hours. Complete water removal was insured when the sample 195
maintained a stable mass during the last hour of lyophilization (Fig. 1f). Finally, the sample 196
was mounted to the TD cell, uniaxially compressed to the desired height (Fig. 1g-h). 197
The final thickness (L) of all samples prepared for this study are reported in Table 1. Total 198
porosity ε was calculated as difference between the sample volume (considering the diameter 199
of the tube and the sample’s L), and the volume occupied by the solid only (i.e., clay particles), 200
which was determined based on the sample dry mass (at the end of the lyophilization process) 201
and clay grain density. The latter was calculated to be 2.62 g cm-3 for Na-kaolinite based on the 202
structural formula and the crystal structure parameters refined for KGa-2 kaolinite by Sakharov 203
et al. (2016) and 2.73 g cm-3 for Na-vermiculite using the (a,b) cell parameters and the chemical 204
composition of the 2:1 layer reported by Arguelles et al. (2010) and the c* parameter (i.e., the 205
basal spacing) value for dehydrated layers at 10 Å (Gieseking, 1975). However, Na-vermiculite 206
displays a mono-hydrated state (1W) at room humidity and a bi-hydrated state (2W) in water-207
saturated conditions, respectively (Faurel, 2012). Consequently, two hydrated densities of 2.49 208
and 2.24 g cm 3 for 1W and 2W Na-vermiculite, respectively were calculated based on water 209
content and c* parameters derived by Faurel. (2012) for 1W (4.13 H2O/O20(OH)4, 210
c* = 11.97 Å) and 2W layers (9.9 H2O/O20(OH)4, c* = 14.86 Å). Note that for Na-kaolinite, 211
only the interparticle porosity (interp.) is accessible by the water tracer, resulting in ε = interp., 212
whereas Na-vermiculite exhibits both interp. and interlayer porosity (interl.). By considering the 213
difference in the c* parameter value between dehydrated layers at 10 Å (Gieseking, 1975) and 214
fully water saturated layers at 14.86 Å (Faurel, 2012), the interlayer volume corresponds 215
approximately to 1/3 of the particle thickness in water-saturated conditions. Consequently, the 216
proportion of the interp. vs. interl. porosities for Na-vermiculite (Table 1) can be calculated for 217
such conditions by using the following relation: 218
= interp. + interl. = interp. + (1- interp.)/3 (1) 219
10
Finally, for each sample used in this study, a duplicate was prepared to be used for 220
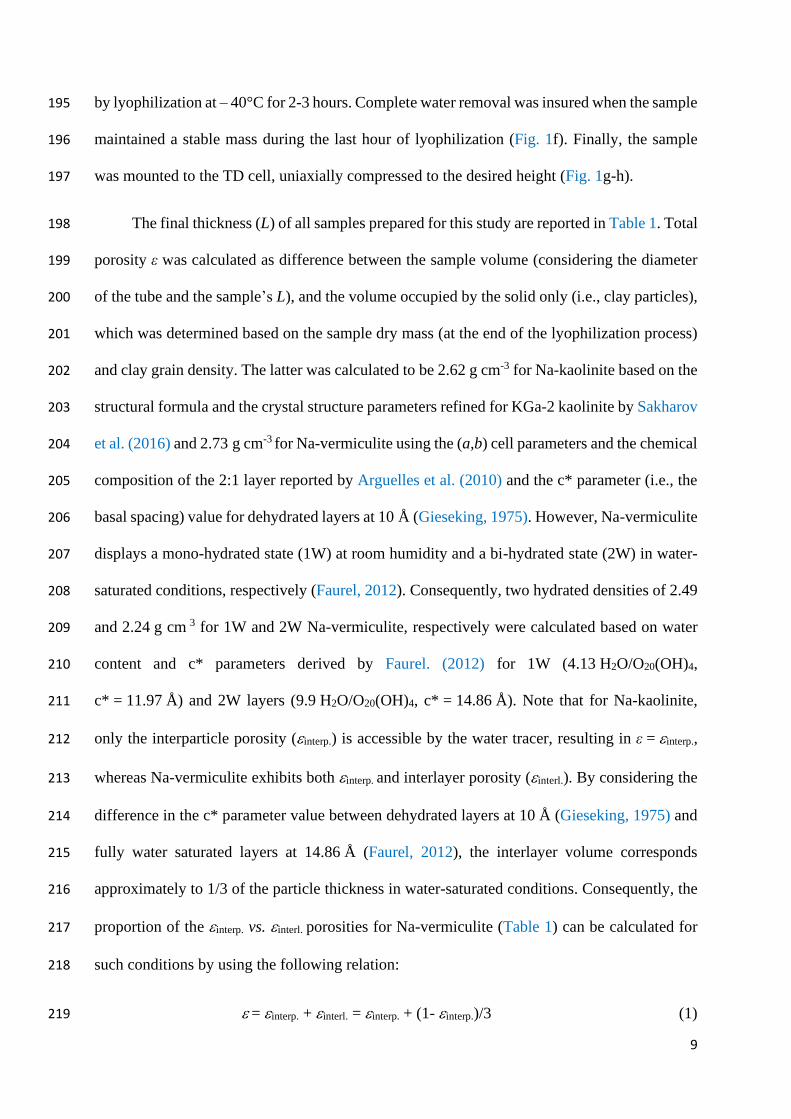
particle organization measurements. 221
Fig. 1. Illustration of the methodology used to prepare Na-vermiculite samples with a high degree 222
of particles’ preferred orientation. (a-d) Oriented sample is prepared by 10 runs of centrifugation of Na-223
vermiculite dispersion in (poly)methyl methacrylate (PMMA) tubes sealed from the bottom with 224
(poly)tetrafluoroethylene (PTFE) caps and by removal of the supernatant after each centrifugation run. 225
(e-f) Preparation of slush nitrogen and freezing of the sample followed by lyophilization. (g-h) Mounting 226
the sample into the diffusion cell and compaction to a certain thickness to reach the desired total porosity 227
value (see Section 2.2), the final thickness of the diffusion cell is maintained by threaded rods and nuts. 228
229
2.3. Measurements of preferred orientation of clay particles through the ⟨P2⟩ order 230
parameter 231
The degree of anisotropy in the orientation of clay particles in the samples used in this 232
work was obtained from two-dimensional X-Ray Scattering (2D-XRS) patterns recorded from 233
the duplicate samples. The measurements were performed at the Laboratoire de Physique des 234
Solides (LPS) - Orsay, France. Sample preparation method (i.e., induration and slicing) and 235
11
2D-XRS acqu isition parameters are detailed in S. D. (S.1.2). In this work, the degree of 236
anisotropy in the orientation of clay platelets is reported in terms of ⟨P2⟩ order parameter values 237
also referred to as the nematic order S (Dabat et al., 2018; Underwood and Bourg, 2020) or the 238
Hermans parameter H (Hermans and Platzek, 1939). The ⟨P2⟩ order parameter can be derived 239
from the orientation distribution functions (ODF) (Dabat et al., 2019, 2020 and references 240
therein) obtained from 2D-XRS patterns. Briefly, in a spherical coordinate, the orientation of a 241
platelet shape clay particle can be defined as a function of two angles: θ, which is the azimuthal 242
angle between the normal of the particle (vector that is perpendicular to the basal surface of the 243
particle) and the z axis, and Φ, the polar angle in the (xy) plane (Fig. 2a). For particles with 244
uniaxial symmetry (i.e., clay particles for which their z axis is the only symmetry axis as in this 245
study, Wenk et al. (2010) and references therein) the probability for a particle orientation over 246
all possible Φ angle values is equal. Therefore, the orientation of a clay platelet (ODF) can be 247
described as a function of only its θ angle, i.e., ƒ(θ), with the following constraints: 248
𝑓(𝜃) ≥ 0 (2) 249
𝑓(𝜃) = 𝑓(𝜋 − 𝜃) (3) 250
∫ 𝑓(𝜃)𝜋
0𝑠𝑖𝑛(𝜃)𝑑𝜃 = 1 (4) 251
Eqs. (2) and (3) indicate that the ODF is always positive, with the same probability of the 252
particles pointing upward or downward. The term ƒ(θ)sin(θ) in Eq. (4) corresponds to the 253
normalization over all the particles in the sample. From the 2D-XRS patterns, the scattered 254
intensities (I) of the 001 Bragg peak modulated as a function of the angle 𝜏 (the angle between 255
the normal of the incident beam and the surface of the 2D-detector), and the angle θ (Fig. 2b). 256
Because of the position of the 001 reflection at low scattering angles (2θB), the hypothesis θ = 257
𝜏 is a valid approximation (Dabat et al., 2019). Hence, the ODF ƒ(θ) can be expressed from the 258
scattered intensity I(θ) evolution integrated from the 2D-XRS patterns as follows: 259
12
ƒ(𝜃) =𝐼(𝜃)
∫ 𝐼(𝜃)𝜋
0 𝑠𝑖𝑛(𝜃)𝑑𝜃 (5) 260
The ODF ƒ(θ) can also be written with a second order Legendre polynomial as follows: 261
⟨𝑃2⟩ = ∫ ⟨𝑃2⟩(𝑐𝑜𝑠𝜃).𝜋
0ƒ(𝜃)𝑠𝑖𝑛(𝜃)𝑑𝜃 (6) 262
Finally, average value of ⟨P2⟩ calculated over the angular distribution using Eq. (6), is 263
comprised between 0 for an isotropic particle organization and 1 for a perfectly anisotropic 264
organization with all particles having the same preferred orientation (i.e., bedding plane). 265
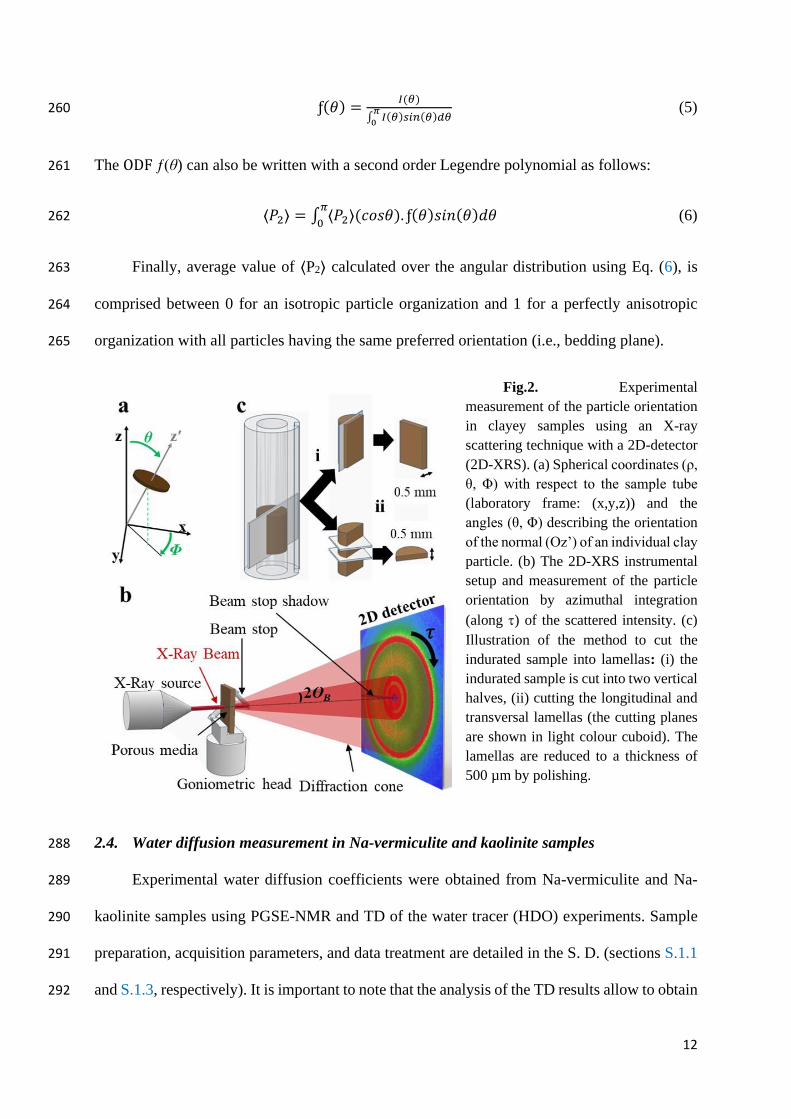
Fig.2. Experimental 266
measurement of the particle orientation 267
in clayey samples using an X-ray 268
scattering technique with a 2D-detector 269
(2D-XRS). (a) Spherical coordinates (ρ, 270
θ, Φ) with respect to the sample tube 271
(laboratory frame: (x,y,z)) and the 272
angles (θ, Φ) describing the orientation 273
of the normal (Oz’) of an individual clay 274
particle. (b) The 2D-XRS instrumental 275
setup and measurement of the particle 276
orientation by azimuthal integration 277
(along ) of the scattered intensity. (c) 278
Illustration of the method to cut the 279
indurated sample into lamellas: (i) the 280
indurated sample is cut into two vertical 281
halves, (ii) cutting the longitudinal and 282
transversal lamellas (the cutting planes 283
are shown in light colour cuboid). The 284
lamellas are reduced to a thickness of 285
500 µm by polishing. 286
287
2.4. Water diffusion measurement in Na-vermiculite and kaolinite samples 288
Experimental water diffusion coefficients were obtained from Na-vermiculite and Na-289
kaolinite samples using PGSE-NMR and TD of the water tracer (HDO) experiments. Sample 290
preparation, acquisition parameters, and data treatment are detailed in the S. D. (sections S.1.1 291
and S.1.3, respectively). It is important to note that the analysis of the TD results allow to obtain 292
13
the effective diffusion coefficient De of HDO in the z-direction of the tube (Dez), i.e., 293
perpendicular to the compression direction/centrifugation plane of the sample, while the PGSE-294
NMR analysis allows to obtain the pore diffusion coefficients Dpz and Dpx,y. 295
Dez is defined from the self- diffusion coefficient of species in bulk water (D0) by the following 296
equation (Bear, 1972; Dykhuizen and Casey, 1989; Bourg et al., 2006): 297
De =𝐺
D0 (7) 298
where ε is the accessible porosity for the tracer, and G the geometrical factor (tortuosity factor), 299
which describes the impact of the pore-network geometry (pore shape, particle orientation, 300
connectivity, and constrictively). The pore diffusion Dp can also be related to D0 as follows: 301
Dp =1
𝐺D0 (8) 302
Hence, in the case of water tracers for which the total porosity is accessible to diffusion and no 303
adsorption occurs, the pore and effective diffusion coefficients are related to ε as follows: 304
De = 휀 Dp (9) 305
2.5 Brownian dynamics simulations of water diffusion in virtual porous media 306
Mesoscale Brownian dynamics simulations of water diffusion in both Na-vermiculite and 307
Na-kaolinite as a function of the anisotropy in the particles’ orientation were performed on 3D 308
virtual porous media (VPM). To cover a large range of anisotropy degrees in particle 309
orientations, 13 particle packings were generated with ⟨P2⟩ values varied from 0.03 to 0.96 310
(Ferrage et al., 2018; Dabat et al., 2020); see Table. S1 in S. D., and Fig. 3a), mimicking the 311
distribution of the shapes and sizes of the particles in these samples. The description of the 312
generation of these VPM is detailed in S.1.4 of S. D. 313
Brownian dynamics simulations were performed according to the methodology detailed 314
by Dabat et al. (2020). For the case where the time step 𝛿𝑡 is much larger than the velocity 315
14
correlation time 𝛾𝑖 of probe 𝑖 (i.e., 𝛾𝑖𝛿𝑡 ≫ 1), and considering the probe’s displacements as 316
completely independent, the displacement of molecular probes in the framework of the general 317
Langevin equation can be reduced as follows (Gunsteren et al., 1981): 318
�⃗�𝑖(𝑡 + 𝛿𝑡) = �⃗�𝑖(𝑡) + �⃗⃗�𝑖 (10) 319
with the random force �⃗⃗�𝑖 that satisfies a Gaussian distribution function with zero mean and 320
standard deviation given by 321
⟨𝑅𝑖2⟩ = 2𝐷𝑖𝛿𝑡 (11) 322
where 𝐷𝑖 is the molecular self-diffusion of probe 𝑖. For diffusion within unrestricted isotropic 323
media, the modulus of the random 3D displacements is quantified by the self-diffusion 324
propagator, i.e., the density of the probability of the displacement distribution law (Callaghan, 325
1991; Bacle et al., 2016): 326
𝑃(𝑟, ∆ | 𝑟0 ,0) = {4𝜋𝐷∆}−3 2⁄ 𝑒𝑥𝑝 [−(𝑟−𝑟0)2
4𝐷∆] (12) 327
where ∆ is the diffusion time. The self-diffusion propagator that quantifies the mobility along a 328
single director is then defined by 329
𝑃𝛼(𝑟𝛼⃗⃗⃗⃗ , ∆ | 𝑟𝛼⃗⃗⃗⃗ 0, 0) = {4𝜋𝐷𝛼∆}−1 2⁄ 𝑒𝑥𝑝 [−
(𝑟𝛼⃗⃗⃗⃗⃗−𝑟𝛼⃗⃗⃗⃗⃗0)2
4𝐷𝛼∆] (13) 330
where 𝐷𝛼 is the component of the self-diffusion tensor that describes the mobility of the probe 331
along the selected 𝑒𝛼⃗⃗⃗⃗⃗ director (Callaghan, 1991). 332
For the BD simulations of water diffusion in Na-kaolinite with only interparticle porosity, 333
the same methodology as used by Dabat et al. (2020) was applied. However, in contrast to 334
simulations performed in this latter study, the size of the simulation box was not adapted to the 335
size of the kaolinite particles. Indeed, in the absence of grain porosity and without consideration 336
of specific interfacial effects on the probe dynamics, a mesoscopic simulation is independent 337
of the particle size, given that the time step is correctly adapted to the modification of the length 338
scale. Accordingly, the same simulation box as for Na-vermiculite (Table S1) was used to 339
15
compute the water diffusion in the kaolinite samples. Such a consideration is also supported by 340
the similar aspect ratios of particles for both types of minerals (0.08 and 0.07 for Na-vermiculite 341
and kaolinite, respectively) (Hassan et al., 2005; Reinholdt et al., 2013). For interparticle 342
diffusion in a kaolinite sample, a number 𝑁 = 2000 of water probes with molecular self-343
diffusion 𝐷0 set at 2.3.10-9 m2 s-1 were introduced randomly into the interparticle porosity of 344
the VPMs. A time step 𝛿𝑡 = 200 ps, over a total simulation time of 0.12 ms, was considered, 345
and additional tests showed that smaller values did not provide a difference in the simulation 346
results. During the simulations, the collision with the surface of the Na-kaolinite particles was 347
treated as a Maxwell’s 𝐴 wall with the angular probability 𝑓𝐴(𝜃, 𝑓) of water probes rebounding 348
from the surface given by 349
𝑓𝐴(𝜃, )𝑑𝛺 = cos 𝜃 𝑑𝛺/𝜋 (14) 350
where 𝜃 and 𝑓 are the usual polar and azimuthal angles (with respect to the normal of the surface 351
of the particle), and 𝑑𝛺 is the element of the solid angle (Fig. 3b). That condition mimics the 352
trajectory of a molecule by assuming a residence time at the solid surface that is long enough 353
to thermalize its velocity distribution function before being desorbed and returning to the fluid 354
(Valleau et al., 1991). 355
For BD simulations of water diffusion in Na-vermiculite, the water probes were allowed 356
to diffuse in both the interp. and interl. porosities. For the interparticle porosity values reported 357
in Table S1, the total porosity of the VPM is calculated according to Eq. (1). The self-diffusion 358
coefficients for the water molecules in the interlayer space Dinterl. were extracted from previous 359
molecular dynamics simulations performed by Tertre et al. (2015) for Na-vermiculite. Although 360
these authors only reported the self-diffusion coefficients for Na+, the associated bi-dimensional 361
self-diffusion coefficient for the water molecules was found to be at Dinterl. = 2.3.10-10 m2 s-1. 362
Such a value is one order of magnitude lower than that of bulk water and is in agreement with 363
numerical MD results and experimental quasi-elastic neutron scattering results obtained for 364
16
tetrahedrally-charged trioctahedral saponite with different layer charges (Michot et al., 2012). 365
Note that the obtained Dinterl. value is lower than commonly reported for montmorillonite 366
(Swenson et al., 2000; Marry and Turq, 2003; Malikova et al., 2005, 2006; Skipper et al., 2006), 367
related to the lower charge and location of the charge in the octahedral sheet of this mineral. 368
For the initial configuration of the BD simulations, the 2000 water probes were randomly 369
introduced in the simulation box with an acceptance probability of 1/3 when the probe was 370
included in the solid. The same time step and simulation time as for water diffusion restricted 371
to the interparticle porosity only was considered. During the simulation (Fig. 3c), the probes 372
colliding with the basal surface of the particles were allowed to rebound according to Eq. (11), 373
whereas a specific condition occurred in the case where the probe was in contact with a lateral 374
surface. In such a condition, based on a system at equilibrium (Bacle et al., 2016), the probe 375
was allowed to penetrate (or leave) the interlayer space of the particle according to the 376
acceptance rule: 377
𝑝𝑎𝑐𝑐𝑖→𝑗
= min [1;𝑝
𝑗
𝑝𝑖 ×𝑝𝑔𝑒𝑛
𝑗→𝑖
𝑝𝑔𝑒𝑛𝑖→𝑗 ] = min [1;
𝑐𝑗
𝑐𝑖× (
𝐷𝑖
𝐷𝑗)
3/2
× exp (−ℓ2
4𝐷𝑗𝛿𝑡+
ℓ2
4𝐷𝑖𝛿𝑡)] (18) 378
where ℓ is the modulus of the displacement from Eq. (11), and ci and cj are the water probe 379
concentrations in the environments i and j, respectively, with self-diffusion coefficients Di and 380
Dj. In the case of the probe that did not satisfy the acceptance rule to penetrate in the interlayer 381
porosity, a rebound was then considered according to Eq. (14) (Fig. 3c). 382
For simulations of water diffusion in both Na-kaolinite and Na-vermiculite, the pore water 383
diffusion coefficients 𝐷𝑝𝛼 along a selected 𝑒𝛼⃗⃗⃗⃗⃗ director were extracted from the asymptotic slope 384
of the radial mean squared displacement, as follows: 385
𝐷𝑝𝛼 = limΔ→∞
∑ (𝑥𝑖,𝛼(0)−𝑥𝑖,𝛼(𝛥))2𝑁𝑖=1
2NΔ (19) 386
where 𝛼 refers to the single direction 𝑒𝛼⃗⃗⃗⃗⃗ on which the mobility is extracted (other parameters 387
were already defined above; uncertainty on the calculated 𝐷𝑝𝛼 values were estimated at 10%). 388
17
389
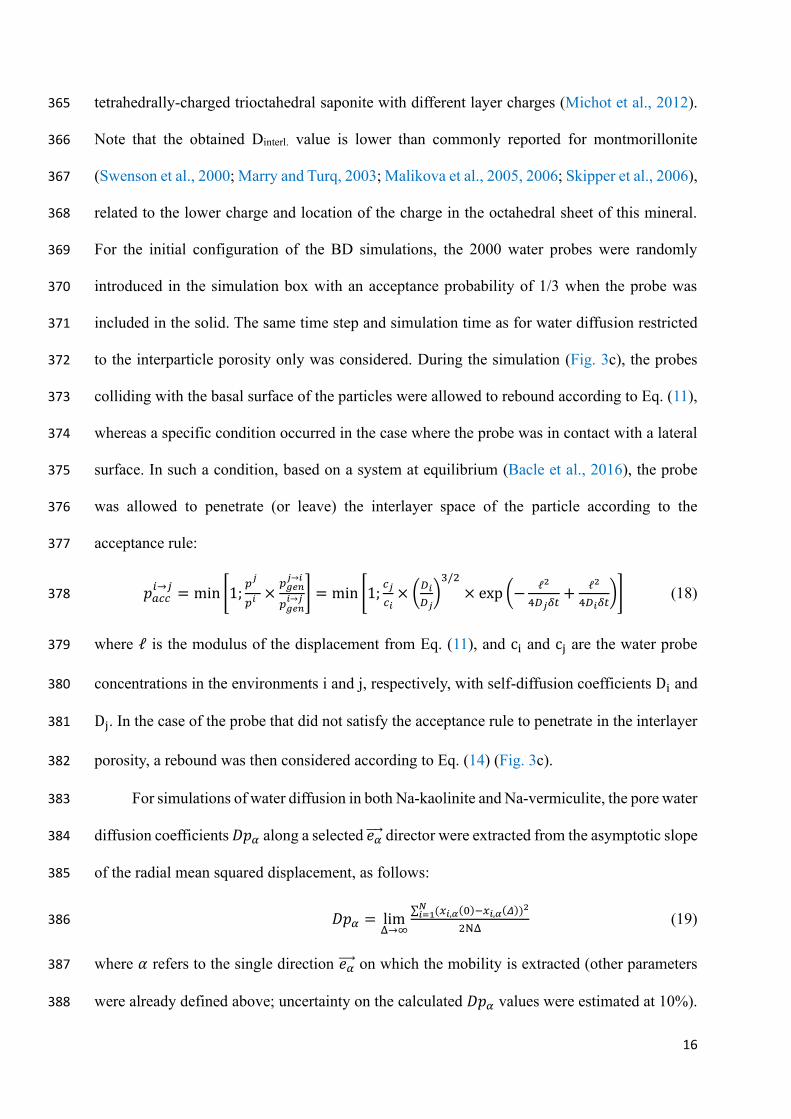
Fig. 3. (a) Virtual porous media with similar interparticle porosity (interp.) values but different anisotropy 390
degrees in particle orientation (i.e., ⟨P2⟩ order parameter). (b) Illustration of Brownian dynamics 391
displacements of water molecules in an Na-kaolinite sample. Water probes, with a self-diffusion 392
coefficient D0, diffuse in the interparticle porosity. A rebound of the water probe on a basal or lateral 393
surface of the particle is treated according to Maxwell’s A wall (see text for details). (c) Brownian 394
dynamics of water diffusion in Na-vermiculite. The water probe, initially in the interparticle porosity 395
and diffusing with D0 as the self-diffusion coefficient, can either rebound on the basal surface or 396
penetrate the interlayer space of the particle according to the acceptance rule paccinterp.→interl.
. If the 397
acceptance rule is satisfied, the probe then diffuses in the interlayer space according to the self-diffusion 398
coefficient Dinterl., which was extracted from molecular dynamics. Eventually, the water probe can leave 399
the particle and go back to the interparticle porosity according to the acceptance rule paccinterl.→interp.
. 400
401
3. Results and discussion 402
3.1. Measurement of preferred orientation of clay particles 403
For each sample, longitudinal and transverse 2D-XRS patterns were recorded (Fig. 2b, c) 404
with respect to the sample tube axis (i.e., the direction of compaction/preferred orientation of 405
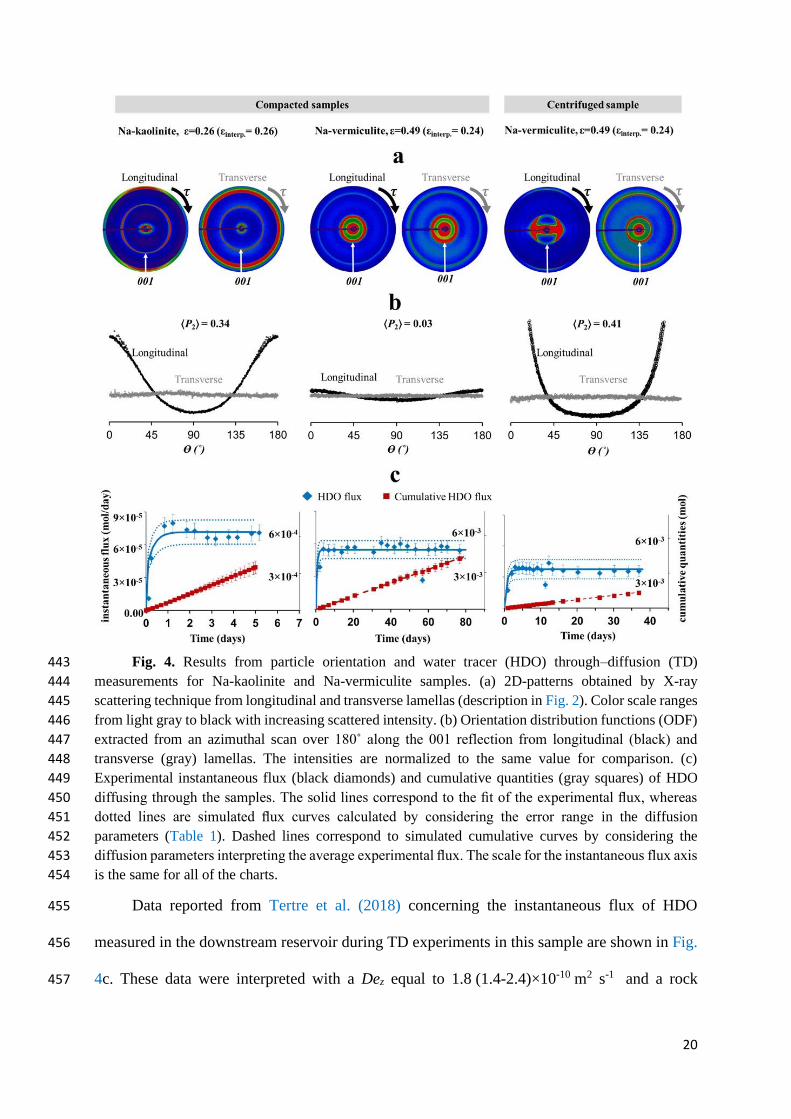
clay particles) (Fig. 2a). These patterns are reported in Fig. 4a with their corresponding ODFs 406
(Fig. 4b), whereas ⟨P2⟩ values extracted from these ODFs are reported in Table 1. For all 407
18
samples, the transverse ODFs (in gray) remain approximately constant regardless of the θ angle 408
(Fig. 4b), which indicates that the transverse lamellas are isotropic, as expected for lamellas 409
sliced in the direction parallel to the preferred orientation of the clay particles. On the other 410
hand, the longitudinal ODFs (in black) display symmetric profiles, which denotes a degree of 411
anisotropy in the particles’ orientation in this direction. 412
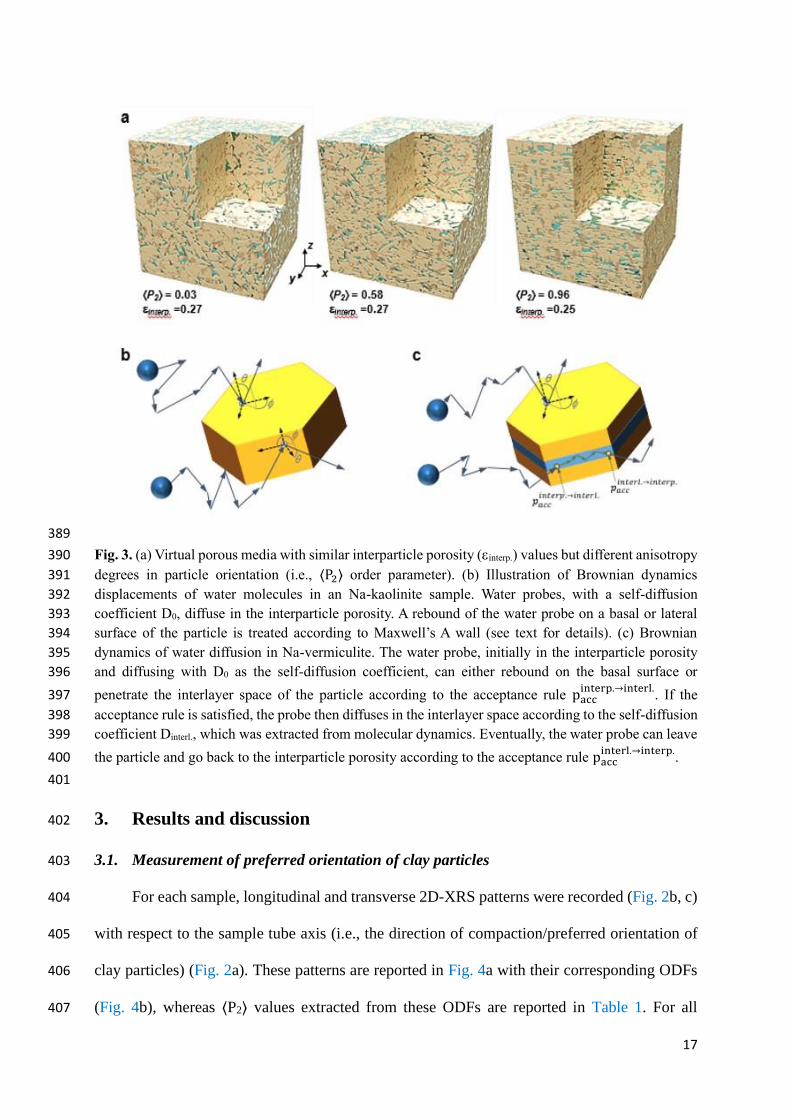
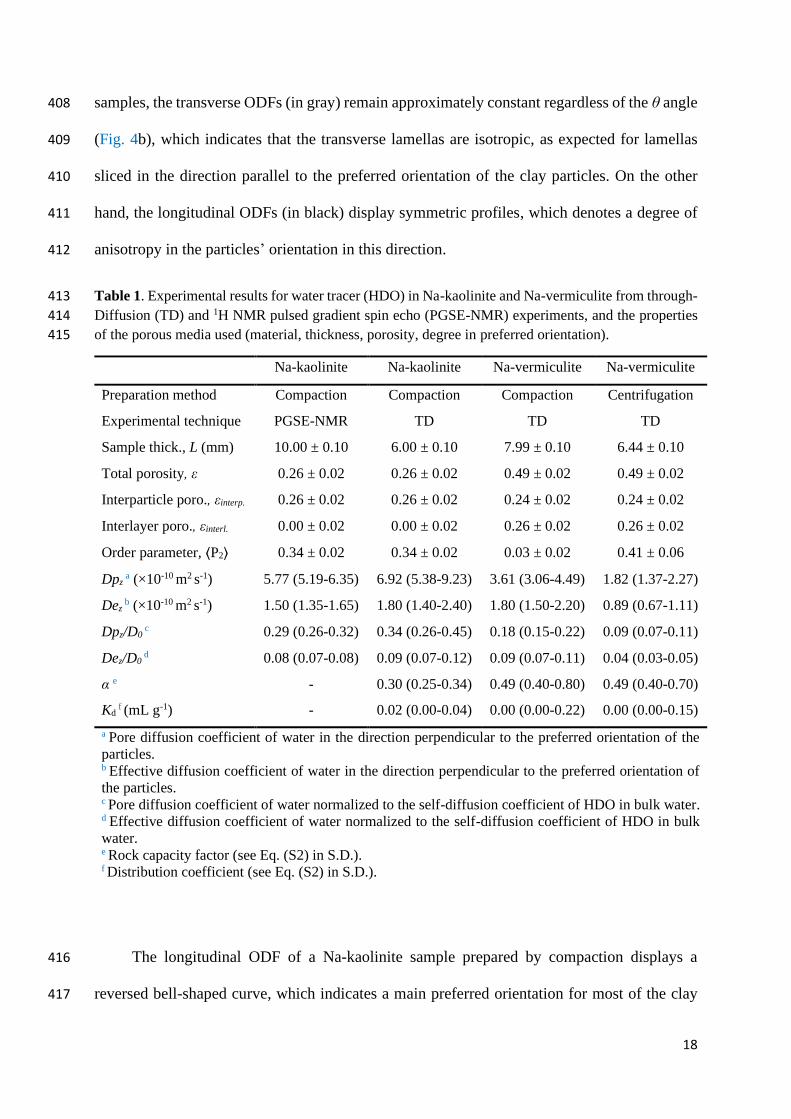
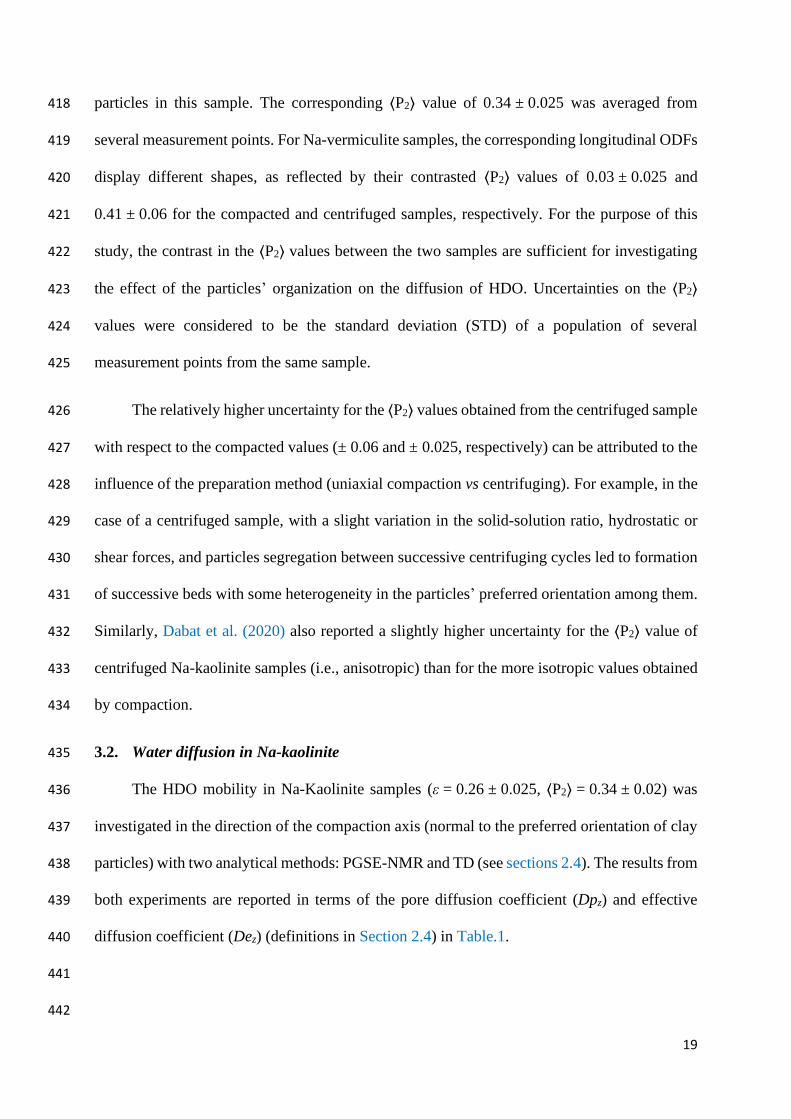
Table 1. Experimental results for water tracer (HDO) in Na-kaolinite and Na-vermiculite from through-413
Diffusion (TD) and 1H NMR pulsed gradient spin echo (PGSE-NMR) experiments, and the properties 414
of the porous media used (material, thickness, porosity, degree in preferred orientation). 415
Na-kaolinite Na-kaolinite Na-vermiculite Na-vermiculite
Preparation method Compaction Compaction Compaction Centrifugation
Experimental technique PGSE-NMR TD TD TD
Sample thick., L (mm) 10.00 ± 0.10 6.00 ± 0.10 7.99 ± 0.10 6.44 ± 0.10
Total porosity, ε 0.26 ± 0.02 0.26 ± 0.02 0.49 ± 0.02 0.49 ± 0.02
Interparticle poro., εinterp. 0.26 ± 0.02 0.26 ± 0.02 0.24 ± 0.02 0.24 ± 0.02
Interlayer poro., εinterl. 0.00 ± 0.02 0.00 ± 0.02 0.26 ± 0.02 0.26 ± 0.02
Order parameter, ⟨P2⟩ 0.34 ± 0.02 0.34 ± 0.02 0.03 ± 0.02 0.41 ± 0.06
Dpz a (×10-10 m2 s-1) 5.77 (5.19-6.35) 6.92 (5.38-9.23) 3.61 (3.06-4.49) 1.82 (1.37-2.27)
Dez b (×10-10 m2 s-1) 1.50 (1.35-1.65) 1.80 (1.40-2.40) 1.80 (1.50-2.20) 0.89 (0.67-1.11)
Dpz/D0 c 0.29 (0.26-0.32) 0.34 (0.26-0.45) 0.18 (0.15-0.22) 0.09 (0.07-0.11)
Dez/D0 d 0.08 (0.07-0.08) 0.09 (0.07-0.12) 0.09 (0.07-0.11) 0.04 (0.03-0.05)
α e - 0.30 (0.25-0.34) 0.49 (0.40-0.80) 0.49 (0.40-0.70)
Kd f (mL g-1) - 0.02 (0.00-0.04) 0.00 (0.00-0.22) 0.00 (0.00-0.15)
a Pore diffusion coefficient of water in the direction perpendicular to the preferred orientation of the
particles. b Effective diffusion coefficient of water in the direction perpendicular to the preferred orientation of
the particles. c Pore diffusion coefficient of water normalized to the self-diffusion coefficient of HDO in bulk water. d Effective diffusion coefficient of water normalized to the self-diffusion coefficient of HDO in bulk
water. e Rock capacity factor (see Eq. (S2) in S.D.). f Distribution coefficient (see Eq. (S2) in S.D.).
The longitudinal ODF of a Na-kaolinite sample prepared by compaction displays a 416
reversed bell-shaped curve, which indicates a main preferred orientation for most of the clay 417
19
particles in this sample. The corresponding ⟨P2⟩ value of 0.34 ± 0.025 was averaged from 418
several measurement points. For Na-vermiculite samples, the corresponding longitudinal ODFs 419
display different shapes, as reflected by their contrasted ⟨P2⟩ values of 0.03 ± 0.025 and 420
0.41 ± 0.06 for the compacted and centrifuged samples, respectively. For the purpose of this 421
study, the contrast in the ⟨P2⟩ values between the two samples are sufficient for investigating 422
the effect of the particles’ organization on the diffusion of HDO. Uncertainties on the ⟨P2⟩ 423
values were considered to be the standard deviation (STD) of a population of several 424
measurement points from the same sample. 425
The relatively higher uncertainty for the ⟨P2⟩ values obtained from the centrifuged sample 426
with respect to the compacted values (± 0.06 and ± 0.025, respectively) can be attributed to the 427
influence of the preparation method (uniaxial compaction vs centrifuging). For example, in the 428
case of a centrifuged sample, with a slight variation in the solid-solution ratio, hydrostatic or 429
shear forces, and particles segregation between successive centrifuging cycles led to formation 430
of successive beds with some heterogeneity in the particles’ preferred orientation among them. 431
Similarly, Dabat et al. (2020) also reported a slightly higher uncertainty for the ⟨P2⟩ value of 432
centrifuged Na-kaolinite samples (i.e., anisotropic) than for the more isotropic values obtained 433
by compaction. 434
3.2. Water diffusion in Na-kaolinite 435
The HDO mobility in Na-Kaolinite samples (ε = 0.26 ± 0.025, ⟨P2⟩ = 0.34 ± 0.02) was 436
investigated in the direction of the compaction axis (normal to the preferred orientation of clay 437
particles) with two analytical methods: PGSE-NMR and TD (see sections 2.4). The results from 438
both experiments are reported in terms of the pore diffusion coefficient (Dpz) and effective 439
diffusion coefficient (Dez) (definitions in Section 2.4) in Table.1. 440
441
442
20
Fig. 4. Results from particle orientation and water tracer (HDO) through–diffusion (TD) 443
measurements for Na-kaolinite and Na-vermiculite samples. (a) 2D-patterns obtained by X-ray 444
scattering technique from longitudinal and transverse lamellas (description in Fig. 2). Color scale ranges 445
from light gray to black with increasing scattered intensity. (b) Orientation distribution functions (ODF) 446
extracted from an azimuthal scan over 180˚ along the 001 reflection from longitudinal (black) and 447
transverse (gray) lamellas. The intensities are normalized to the same value for comparison. (c) 448
Experimental instantaneous flux (black diamonds) and cumulative quantities (gray squares) of HDO 449
diffusing through the samples. The solid lines correspond to the fit of the experimental flux, whereas 450
dotted lines are simulated flux curves calculated by considering the error range in the diffusion 451
parameters (Table 1). Dashed lines correspond to simulated cumulative curves by considering the 452
diffusion parameters interpreting the average experimental flux. The scale for the instantaneous flux axis 453
is the same for all of the charts. 454
Data reported from Tertre et al. (2018) concerning the instantaneous flux of HDO 455
measured in the downstream reservoir during TD experiments in this sample are shown in Fig. 456
4c. These data were interpreted with a Dez equal to 1.8 (1.4-2.4)×10-10 m2 s-1 and a rock 457
21
capacity factor () value equal to ε ( = 0.30 (0.25-0.34) vs. ε = 0.26 ± 0.02), which allows us 458
to confirm that HDO is an inert tracer for this sample (i.e., no significant HDO adsorption). 459
Considering the uncertainties associated for each type of measurement (~10 and ~15% 460
for PGSE-NMR and TD, respectively), both techniques resulted in a similar Dpz for HDO in 461
Na-kaolinite samples (6.9 (5.4-9.2), and 5.8 (5.2-6.4)×10-10 m2 s-1, respectively). This similarity 462
indicates that both techniques, even though they probe very contrasted time scales (days for TD 463
vs ms for PGSE-NMR), can be used interchangeably to investigate the dynamics of water tracer 464
in samples composed of non-charged clayey particles irrespective of the differences in the 465
spatial/temporal scales investigated. Accordingly, the PGSE-NMR method can be used for 466
upscaling purposes, at least up to the centimeter scale investigated by the TD method. 467
Moreover, similar Dpz values mean that the two samples (the one prepared for PGSE-NMR 468
analysis in this study and that used by Tertre et al. (2018) for TD experiments) have more or 469
less the same porosity and degree of anisotropy in their particle orientations (considering the 470
uncertainties on both parameters). 471
The Dpz/D0 values issued from the TD and PGSE-NMR experiments analysis are 472
compared to those obtained from BD simulations using VPMs (ε = interp. = 0.25-0.27; see Table 473
S1), which are characterized by different ⟨P2⟩ parameter values (Figure 5a). Overall, the BD 474
simulations show a decrease in Dpz (measured in the direction normal to the preferred 475
orientation) with the degree of anisotropy of the particles’ orientation, in link with the increased 476
tortuosity of the diffusion pathway. The good agreement between the experimental and 477
simulated data obtained in this study for an interparticle porosity interp. close to 0.25 but also 478
for a higher porosity value (i.e., 0.5; Dabat et al. (2020)) implies that the different VPMs 479
generated and characterized by different porosity and particle organizations are well 480
representative of the real samples, despite the difference in length scales between the real 481
samples and VPM’s (Ferrage et al., 2015). BD simulations on VPMs can thus be considered a 482
22
reliable tool to investigate water diffusion in clayey samples, especially in situations that are 483
experimentally challenging to produce, such as samples that are characterized by different 484
porosities and a high degree of anisotropy in the particle preferred orientation, since, most often, 485
the two parameters are coupled (Dabat et al., 2018). 486
3.3. Water diffusion in Na-vermiculite 487
TD results obtained with Na-vermiculite samples were fitted with averaged values 488
equal to ε, resulting in Kd = 0 (Table 1), which indicates that HDO can be considered an inert 489
tracer in Na-vermiculite samples, as also reported for kaolinite. However, slight HDO 490
adsorption cannot be excluded, as suggested by the higher uncertainties obtained on the 491
values for Na-vermiculite samples compared to the kaolinite values. Such behavior was also 492
reported by Tertre et al. (2018) for Na-vermiculite samples and can be attributed to slight HDO 493
adsorption in the interlayer of Na-vermiculite in relation to its high layer charge. 494
For the same ε value (ε = 0.49 ± 0.025), the contrast in the particles’ preferred orientation 495
(Fig. 4b) between the compacted and centrifuged Na-vermiculite samples (⟨P2⟩ = 0.03 ± 0.02, 496
and 0.41 ± 0.06, respectively) is well reflected by the difference in their experimental Dpz 497
values (Table 1). Indeed, the HDO flux (Fig. 4c) through the compacted sample can be 498
interpreted with a Dpz value equal to 3.6 (3.0-4.5)×10-10 m2 s-1, in comparison to almost two 499
times lower Dpz at 1.8 (1.4-2.3)×10-10 m2 s-1 obtained with the centrifuged sample. Such results 500
indicate that the different Na-vermiculite samples were well-adapted for investigating, with 501
similar total porosity, the influence of anisotropy in the particles’ preferred orientation on the 502
diffusion of water in a charged/dual porosity clayey media. Moreover, the data also infer that 503
in a clayey media, and together with porosity, the preferred orientation of the particles acts as 504
a first-order parameter in the control of the water diffusion. This behavior, previously reported 505
by Dabat et al. (2020) for non-charged clayey samples (i.e., Na-kaolinite), therefore also 506
extends to the case of charged clayey samples with a dual porosity. These findings decisively 507
23
show that comprehensive data on the orientation of the particles in a clay-rich media is a 508
prerequisite to correctly predict water diffusion within it. Finally, all the above stresses the need 509
to develop diffusion models in which both the porosity and the degree of particle preferred 510
orientation are explicitly included to increase the predictive capacity of such models. 511
In Fig. 5b and similar to Na-kaolinite samples, a good agreement is observed between 512
experimental points from Na-vermiculite samples and simulated data (ε = 0.50-0.51 and 513
interp. = 0.25-0.27; Table S1). Moreover, despite the higher value for Na-vermiculite 514
compared to Na-kaolinite, the lower Dpz values obtained for Na-vermiculite clearly highlight 515
the role played by the interlayer porosity on the overall reduced mobility of the water molecules 516
in the vicinity of charged clay particles (Nakashima and Mitsumori, 2005; Michot et al., 2012; 517
Porion et al., 2014). Note that in Fig. 5b, the point obtained for the centrifuged Na-vermiculite 518
sample at ⟨P2⟩ = 0.41 is somewhat lower than the corresponding simulated point. Such small 519
aberration can be due to the slightly lower interparticle porosity in the case of the experimental 520
Na-vermiculite sample (interp. = 0.24) compared to that used for the BD simulation 521
(interp. = 0.25-0.27). In addition, one can consider that due to the increased heterogeneity for the 522
centrifuged sample, which is characterized by the wider variation in ⟨P2⟩ values, water diffusion 523
could be controlled by zones in the samples with higher ⟨P2⟩ values and not by the mean degree 524
of preferred orientation. Despite this marginal difference, the good agreement between the 525
experimental and calculated Dpz values can be assigned to the lack of osmotic swelling in the 526
Na-vermiculite sample, which allows a correct quantitative description of the different types of 527
porosities volumes. In this respect, BD simulations on such granular virtual systems can be 528
considered to be a useful tool for investigating the role played by different parameters (i.e., 529
porosity, orientation of particles, and dual porosity volumes) on the overall diffusion process 530
of water in Na-vermiculite dual porosity media. 531
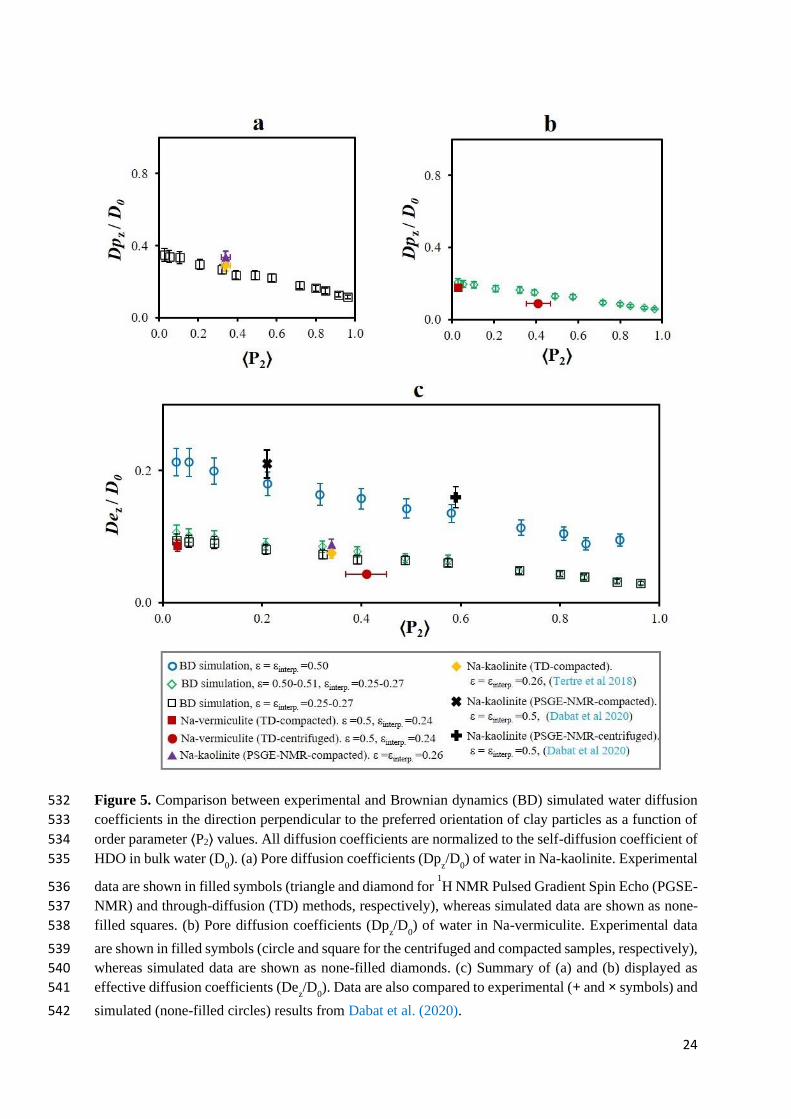
24
Figure 5. Comparison between experimental and Brownian dynamics (BD) simulated water diffusion 532
coefficients in the direction perpendicular to the preferred orientation of clay particles as a function of 533
order parameter ⟨P2⟩ values. All diffusion coefficients are normalized to the self-diffusion coefficient of 534
HDO in bulk water (D0). (a) Pore diffusion coefficients (Dp
z/D
0) of water in Na-kaolinite. Experimental 535
data are shown in filled symbols (triangle and diamond for 1H NMR Pulsed Gradient Spin Echo (PGSE-536
NMR) and through-diffusion (TD) methods, respectively), whereas simulated data are shown as none-537
filled squares. (b) Pore diffusion coefficients (Dpz/D
0) of water in Na-vermiculite. Experimental data 538
are shown in filled symbols (circle and square for the centrifuged and compacted samples, respectively), 539
whereas simulated data are shown as none-filled diamonds. (c) Summary of (a) and (b) displayed as 540
effective diffusion coefficients (Dez/D
0). Data are also compared to experimental (+ and × symbols) and 541
simulated (none-filled circles) results from Dabat et al. (2020). 542
25
543
3.4. The influence of interlayer vs. interparticle porosities on HDO diffusion in clayey 544
samples 545
To assess the role played by the two porosities types (interlayer and interparticle), the 546
HDO diffusivity is discussed below in terms of Dez since this parameter is commonly used over 547
Dpz in macroscopic models to describe the diffusing flux traversing a sample (Bourg and 548
Tournassat, 2015; Tournassat and Steefel, 2019 and references therein). The obtained Dez 549
values for water, normalized to self-diffusion in bulk D0, measured for both materials (kaolinite 550
and Na-vermiculite) using the two techniques (PSGE-NMR and TD), are plotted in Fig. 5c as 551
a function of the ⟨P2⟩ parameter. These data are compared to the calculated ones obtained from 552
BD simulations assuming that all porosity is accessible to diffusion (as confirmed by HDO 553
alpha values previously discussed and reported in Table 1). Considering that experimental 554
samples composed of Na-vermiculite and Na-kaolinite particles have approximatively the same 555
interparticle porosity (i.e., 0.26 vs. 0.24 for kaolinite and vermiculite, respectively) and that all 556
of the porosity of the Na-vermiculite samples is accessible to water diffusion, one can expect 557
that Dez obtained with Na-vermiculite samples are intermediate between those simulated for 558
εinterp. = 0.25 and εinterp. = 0.5 (for similar ⟨P2⟩ values). In fact, experimental data obtained with 559
Na-vermiculite (ε = 0.49) are drastically much closer to those simulated at εinterp. = 0.25 than to 560
those simulated at εinterp. = 0.5 (Fig. 5c). Such behavior suggests that even though interlayer 561
porosity is available for diffusion, the contribution of the flux of HDO diffusing in this 562
interlayer volume is very marginal compared to that in the interparticle porosity, which results 563
in Dez values that are almost independent of the interlayer porosity of the material. Interestingly, 564
the evolution of the diffusion anisotropy ratios 𝐷𝑒𝑥𝑦
𝐷𝑒𝑧 with the ⟨P2⟩ values reported in Fig. 6 565
indicates a significant increase in anisotropy with the increased degree of preferred orientation 566
of particles. This behavior is the same for different values of the total porosity and different 567
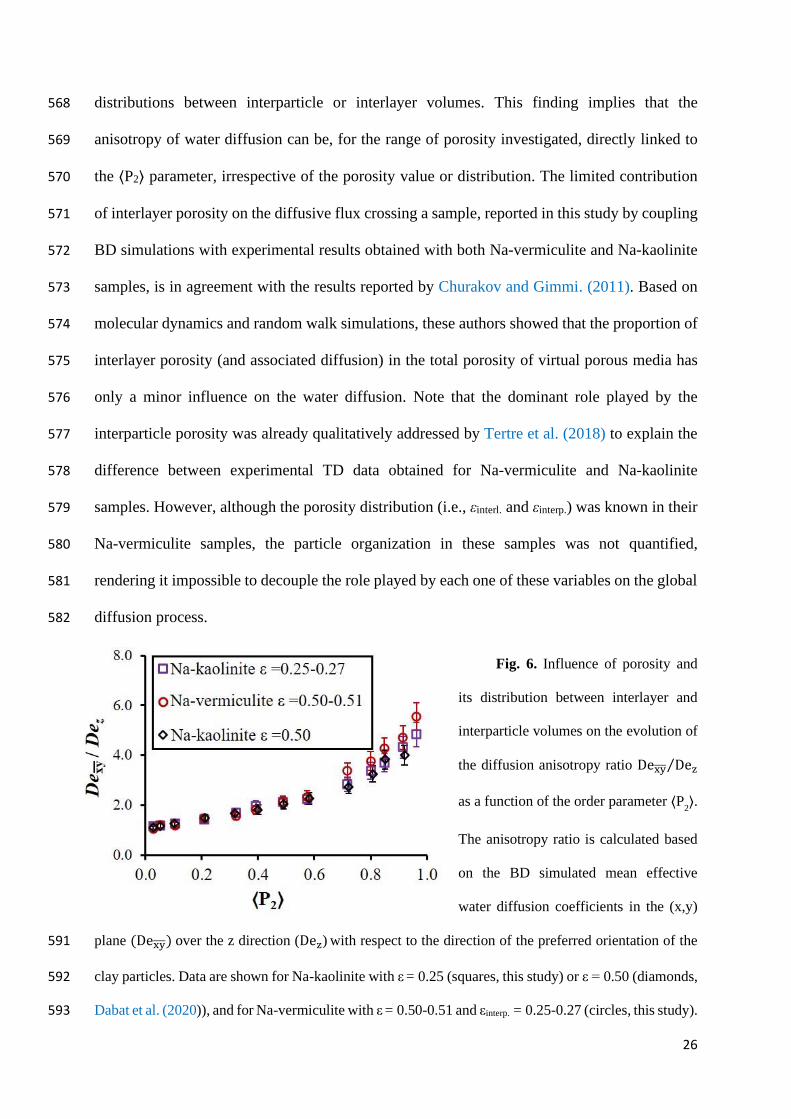
26
distributions between interparticle or interlayer volumes. This finding implies that the 568
anisotropy of water diffusion can be, for the range of porosity investigated, directly linked to 569
the ⟨P2⟩ parameter, irrespective of the porosity value or distribution. The limited contribution 570
of interlayer porosity on the diffusive flux crossing a sample, reported in this study by coupling 571
BD simulations with experimental results obtained with both Na-vermiculite and Na-kaolinite 572
samples, is in agreement with the results reported by Churakov and Gimmi. (2011). Based on 573
molecular dynamics and random walk simulations, these authors showed that the proportion of 574
interlayer porosity (and associated diffusion) in the total porosity of virtual porous media has 575
only a minor influence on the water diffusion. Note that the dominant role played by the 576
interparticle porosity was already qualitatively addressed by Tertre et al. (2018) to explain the 577
difference between experimental TD data obtained for Na-vermiculite and Na-kaolinite 578
samples. However, although the porosity distribution (i.e., εinterl. and εinterp.) was known in their 579
Na-vermiculite samples, the particle organization in these samples was not quantified, 580
rendering it impossible to decouple the role played by each one of these variables on the global 581
diffusion process. 582
Fig. 6. Influence of porosity and 583
its distribution between interlayer and 584
interparticle volumes on the evolution of 585
the diffusion anisotropy ratio Dexy Dez⁄ 586
as a function of the order parameter ⟨P2⟩. 587
The anisotropy ratio is calculated based 588
on the BD simulated mean effective 589
water diffusion coefficients in the (x,y) 590
plane (Dexy) over the z direction (Dez) with respect to the direction of the preferred orientation of the 591
clay particles. Data are shown for Na-kaolinite with ε = 0.25 (squares, this study) or ε = 0.50 (diamonds, 592
Dabat et al. (2020)), and for Na-vermiculite with ε = 0.50-0.51 and εinterp. = 0.25-0.27 (circles, this study). 593
27
Furthermore, as previously discussed in the introduction, determination of the εinterl./εinterp. 594
value is not easy for smectite due to osmotic swelling of this mineral, especially when the 595
saturating cations are Na+, which makes it difficult to discriminate the role played by interlayer 596
and interparticle porosities on the global diffusivity of water tracer in this mineral. Such a 597
phenomenon was, to some extent, indicated by Melkior et al. (2009), who reported that the 598
effective diffusion coefficient of water tracer was significantly dependent on the nature of the 599
compensating cations in samples made of smectitic particles (for the same total porosity), with 600
Dez increasing from Na-smectite, Ca-smectite to Cs-smectite. These authors attributed this 601
variation to the absence of gel formation for the Cs-samples compared to the Na-samples (and 602
to a lesser extent in Ca-samples). This observation was most likely related to the difficulty of 603
considering a defined interparticle porosity (i.e., pores not submitted to the particle charge) for 604
Na-smectites compared to Cs ones, and consequently raises the question about the relevance of 605
considering the Dez values obtained with Na-smectites as reference data for models describing 606
dual porosity clayey system. In that regard, the experimental results obtained in this study with 607
Na-vermiculite samples represent a new set of data for an extensive validation of dual-porosity 608
reactive transport models. 609
4. Concluding remarks and perspectives 610
A methodology was developed in this study to prepare experimental clayey samples for 611
which the porosity distribution (interlayer (εinterl.)/interparticle (εinterp.)) and particle organization 612
can be controlled independently. These new procedures were successfully applied to prepare 613
samples characterized by the same interparticle porosity but with the presence or not of 614
interlayer porosity accessible to water diffusion (Na-kaolinite vs Na-vermiculite samples), used 615
to investigate the role played by the two types of porosities and the particle organization on the 616
global diffusion of water. 617
28
The similarity of the diffusion data obtained for Na-kaolinite by two independent 618
experimental techniques (i.e., Pulsed Gradient Spin Echo attenuation measurements by Nuclear 619
Magnetic Resonance (PGSE-NMR) and through-diffusion (TD)) probing different length and 620
time scales (i.e., ms for PGSE-NMR vs. several days for TD), shows that a representative 621
elementary volume for the analysis of water diffusion process in clayey materials was reached 622
with PGSE-NMR method. Moreover, these two experimental techniques are found to be very 623
complementary for the analysis of water diffusion in clayey media. On the one hand, PGSE-624
NMR allows obtaining the full tensor of the water diffusion on the same sample, whereas the 625
TD experiments must be repeated when changing the probed direction of diffusion. On the other 626
hand, PGSE-NMR cannot be used when the sample contains a very high quantity of 627
paramagnetic elements, such as Fe in the Na-vermiculite used in this study, or when the probe 628
confinement is high (the case of water molecule in the interlayer of Na-vermiculite as a result 629
of its high structural charge). In that regard TD can be advantageously used irrespective of the 630
chemical composition of the sample and interlayer probe confinement. 631
By accounting for the uncertainties in both the porosity and particle organization 632
measurements, there were good agreements between the effective diffusion coefficients derived 633
from the experimental measurements obtained for all samples and simulated data. This finding 634
showed that, in a dual-porosity clayey media, even though the interlayer is accessible to water 635
diffusion, interparticle porosity and preferential orientation of the particles act as first-order 636
parameters in the global flux of water diffusing through these media, at least for the range of 637
porosity investigated. These results were obtained irrespective of the directional diffusion 638
probed, and they allowed us to conclude that the ⟨P2⟩ parameter (i.e., mathematical function 639
derived from two-dimensional X-Ray Scattering measurements comprised between 0 for an 640
isotropic particle organization and 1 for a perfectly anisotropic organization) is an excellent 641
29
descriptor of the anisotropy of the diffusion of water in materials made of swelling clay 642
particles. 643
Due to osmotic swelling of montmorillonite clay minerals, especially when the charge 644
compensating cation is Na+, distribution of interparticle and interlayer porosities is extremely 645
difficult to be determined. As logical continuation of this work, Na-vermiculite samples 646
characterized by well-defined εinterl./εinterp. ratios and particle organization, can be used for 647
further investigating the link between geometrical properties and the diffusion of charged 648
(ionic) tracers in swelling clays. Such approach would likely provide key information for 649
decoupling the role played by interfacial charges located on either basal or edge surfaces of Na-650
vermiculite from other parameters linked to the geometric organization of the particles, such as 651
the preferential orientation of the clay particles or the different porosities accessible to diffusion. 652
Acknowledgments 653
The results presented are part of the Ph.D. thesis of A.A. granted by “Région Nouvelle-654
Aquitaine”, University of Poitiers, France. Stephan Rouzière (LPS, Saclay, France) is 655
acknowledged for technical assistance in the XRS measurements. Dr. Jerome Labanowski 656
(IC2MP, Poitiers, France) is thanked for providing access to the lyophilizer used in this study. 657
Claude Veit (IC2MP, Poitiers, France) is thanked for the design and conception of the 658
compaction and centrifugation cells for the sample preparation. The authors are grateful to the 659
CNRS interdisciplinary “défi Needs” through its “MiPor” program (Project DARIUS), the 660
H2020 European program EURAD through its “Future” WP, the French government program 661
“Investissements d’Avenir” (EUR INTREE, reference ANR-18-EURE-0010), and the 662
European Union (ERDF) and “Région Nouvelle Aquitaine” for providing financial support for 663
this study. 664
665
666
30
5. References 667
Abend, S., Lagaly, G., 2000. Sol–gel transitions of sodium montmorillonite dispersions. 668 Applied Clay Science 16, 201–227. https://doi.org/10.1016/S0169-1317(99)00040-X 669
Altmann, S., Aertsens, M., Appelo, T., Bruggeman, C., Gaboreau, S., Glaus, M., Jacquier, P., 670 Kupcik, T., Maes, N., Montoya, V., Rabung, T., Savoye, S., et al, 2015. Processes of 671 cation migration in clayrocks: Final Scientific Report of the CatClay European Project. 672
CEA. 673
Andra, 2005. Argile : Évaluation de la Faisabilité du Stockage Géologique en Formation 674 Argileuse. Document du Synthèse, Andra. 675
Arguelles, A., Leoni, M., Blanco, J.A., Marcos, C., 2010. Semi-ordered crystalline structure 676 of the Santa Olalla vermiculite inferred from X-ray powder diffraction. American 677 Mineralogist 95, 126–134. https://doi.org/10.2138/am.2010.3249 678
Bachu, S., 2008. CO2 storage in geological media: Role, means, status and barriers to 679 deployment. Progress in Energy and Combustion Science 34, 254–273. 680 https://doi.org/10.1016/j.pecs.2007.10.001 681
Bacle, P., Dufrêche, J.-F., Rotenberg, B., Bourg, I.C., Marry, V., 2016. Modeling the 682 transport of water and ionic tracers in a micrometric clay sample. Applied Clay 683
Science 123, 18–28. https://doi.org/10.1016/j.clay.2015.12.014 684
Bear, J., 1972. Dynamics of Fluids in Porous Media. Dover Publication, New York. 685 Bestel, M., 2014. Water–montmorillonite systems: Neutron scattering and tracer through-686
diffusion studies (Thesis). University of Bern, Bern-Switzerland. 687
Bestel, M., Glaus, M.A., Frick, S., Gimmi, T., Juranyi, F., Van Loon, L.R., Diamond, L.W., 688
2018. Combined tracer through-diffusion of HTO and 22Na through Na-689 montmorillonite with different bulk dry densities. Applied Geochemistry 93, 158–166. 690
https://doi.org/10.1016/j.apgeochem.2018.04.008 691
Bennett, R.H., Brya, W.R., Keller, G.H., 1981. Clay fabric of selected submarine sediments; 692
fundamental properties and models. Journal of Sedimentary Research 51, 217–232. 693 https://doi.org/10.1306/212F7C52-2B24-11D7-8648000102C1865D 694
Bourg, I.C., Bourg, A.C.M., Sposito, G., 2003. Modeling diffusion and adsorption in 695 compacted bentonite: a critical review. Journal of Contaminant Hydrology 61, 293–696
302. https://doi.org/10.1016/S0169-7722(02)00128-6 697 Bourg, I.C., Sposito, G., Bourg, A.C.M., 2006. Tracer diffusion in compacted, water-saturated 698
bentonite. Clays Clay Miner. 54, 363–374. 699 https://doi.org/10.1346/CCMN.2006.0540307 700
Bourg, I.C., Tournassat, C., 2015. Self-Diffusion of Water and Ions in Clay Barriers, in: 701
Developments in Clay Science. Elsevier, pp. 189–226. https://doi.org/10.1016/B978-702 0-08-100027-4.00006-1 703
Callaghan, P.T., 1991. Principles of nuclear magnetic resonance microscopy. Clarendon 704 Press. 705
Charlet, L., Alt-Epping, P., Wersin, P., Gilbert, B., 2017. Diffusive transport and reaction in 706 clay rocks: A storage (nuclear waste, CO2, H2), energy (shale gas) and water quality 707 issue. Advances in Water Resources 106, 39–59. 708
https://doi.org/10.1016/j.advwatres.2017.03.019 709 Churakov, S.V., Gimmi, T., 2011. Up-Scaling of Molecular Diffusion Coefficients in Clays: 710
A Two-Step Approach. J. Phys. Chem. C 115, 6703–6714. 711 https://doi.org/10.1021/jp112325n 712
31
Dabat, T., Hubert, F., Paineau, E., Launois, P., Laforest, C., Grégoire, B., Dazas, B., Tertre, 713
E., Delville, A., Ferrage, E., 2019. A general orientation distribution function for clay-714
rich media. Nat Commun 10, 5456. https://doi.org/10.1038/s41467-019-13401-0 715 Dabat, T., Mazurier, A., Hubert, F., Tertre, E., Grégoire, B., Dazas, B., Ferrage, E., 2018. 716
Mesoscale Anisotropy in Porous Media Made of Clay Minerals. A Numerical Study 717 Constrained by Experimental Data. Materials 11, 1972. 718 https://doi.org/10.3390/ma11101972 719
Dabat, T., Porion, P., Hubert, F., Paineau, E., Dazas, B., Grégoire, B., Tertre, E., Delville, A., 720 Ferrage, E., 2020. Influence of preferred orientation of clay particles on the diffusion 721 of water in kaolinite porous media at constant porosity. Applied Clay Science 184, 722 105354. https://doi.org/10.1016/j.clay.2019.105354 723
Dagnelie, R.V.H., Arnoux, P., Enaux, J., Radwan, J., Ner, P., 2017. Perturbation induced by a 724
nitrate plume on diffusion of solutes in a large-scale clay rock sample. Applied Clay 725 Science 141. 219-226. 726
Dagnelie, R.V.H., Rasamimanana, S., Blin, V., Radwan, J., Thory, E., Robinet, J.-C., Lefèvre, 727
G., 2018. Diffusion of organic anions in clay-rich media: Retardation and effect of 728 anion exclusion. Chemosphere 213, 472–480. 729 https://doi.org/10.1016/j.chemosphere.2018.09.064 730
De La Calle, C., Pezerat, H., Gasperin, M., 1977. Problemes d'ordre-désordre dans les 731
vermiculites structure du minéral calcique hydraté a 2 couches. Journal de Physique 732 38, 128–133. 733
Durrieu, J., Argillier, J.F., Rosenberg, E., Li, Y., 1997. Static and Dynamic Filtration 734 Properties of Aqueous Suspensions of Clays and Electrolytes. Rev. Inst. Fr. Pét. 52, 735 207–218. https://doi.org/10.2516/ogst:1997020 736
Dykhuizen, R.C., Casey, W.H., 1989. An analysis of solute diffusion in rocks. Geochimica et 737 Cosmochimica Acta 53, 2797–2805. https://doi.org/10.1016/0016-7037(89)90157-9 738
Farver, J.R., Yund, R.A., 1999. Oxygen bulk diffusion measurements and TEM 739
characterization of a natural ultramylonite: implications for fluid transport in mica-740
bearing rocks. J. Metamorph. Geol 17, 669–683. 741 Faurel, M., 2012. Conception et mise en place d’expériences de diffusion de l’eau et de 742
solutés dans des milieux poreux modèles d’argiles gonflantes. Université de Poitiers, 743 Poitiers, France. 744
Ferrage, E., Hubert, F., Baronnet, A., Grauby, O., Tertre, E., Delville, A., Bihannic, I., Prêt, 745 D., Michot, L.J., Levitz, P., 2018. Influence of crystal structure defects on the small-746 angle neutron scattering/diffraction patterns of clay-rich porous media. J Appl 747 Crystallogr 51, 1311–1322. https://doi.org/10.1107/S160057671801052X 748
Ferrage, E., Hubert, F., Tertre, E., Delville, A., Michot, L.J., Levitz, P., 2015. Modeling the 749
arrangement of particles in natural swelling-clay porous media using three-750 dimensional packing of elliptic disks. Physical Review E 91, 062210. 751 https://doi.org/10.1103/PhysRevE.91.062210 752
García-Gutiérrez, M., Cormenzana, J.L., Missana, T., Mingarro, M., Martín, P.L., 2006. 753 Large-scale laboratory diffusion experiments in clay rocks. Physics and Chemistry of 754 the Earth, Parts A/B/C 31, 523–530. https://doi.org/10.1016/j.pce.2006.04.004 755
Gieseking, J.E. (Ed.), 1975. Soil Components Vol. 2: Inorganic Components, 1st ed. Springer-756
Verlag Berlin Heidelberg. 757
Gimmi, T., Churakov, S.V., 2019. Water retention and diffusion in unsaturated clays: 758 Connecting atomistic and pore scale simulations. Applied Clay Science 175, 169–183. 759 https://doi.org/10.1016/j.clay.2019.03.035 760
32
Gimmi, T., Kosakowski, G., 2011. How Mobile Are Sorbed Cations in Clays and Clay 761
Rocks? Environ. Sci. Technol. 45, 1443–1449. https://doi.org/10.1021/es1027794 762
Glaus, M.A., Frick, S., Rossé, R., Loon, L.R.V., 2010. Comparative study of tracer diffusion 763 of HTO, 22Na+ and 36Cl− in compacted kaolinite, illite and montmorillonite. 764 Geochimica et Cosmochimica Acta 74, 1999–2010. 765 https://doi.org/10.1016/j.gca.2010.01.010 766
Gonzáles García, F., García Ramos, G., 1960. On the genesis and transformation of 767
vermiculite. Presented at the Transactions 7th int. Congr. Soil Sci., Spain, pp. 482–768 491. 769
González Sánchez, F., Jurányi, F., Gimmi, T., Van Loon, L., Unruh, T., Diamond, L.W., 770 2008a. Translational diffusion of water and its dependence on temperature in charged 771 and uncharged clays: A neutron scattering study. J. Chem. Phys. 129, 174706. 772
https://doi.org/10.1063/1.3000638 773
González Sánchez, F., Van Loon, L.R., Gimmi, T., Jakob, A., Glaus, M.A., Diamond, L.W., 774 2008b. Self-diffusion of water and its dependence on temperature and ionic strength in 775 highly compacted montmorillonite, illite and kaolinite. Applied Geochemistry 23, 776 3840–3851. https://doi.org/10.1016/j.apgeochem.2008.08.008 777
Gunsteren, W.F., Berendsen, H.J.C., Rullmann, J.A.C., 1981. Stochastic dynamics for 778
molecules with constraints. Molecular Physics 44, 69–95. 779
https://doi.org/10.1080/00268978100102291 780
Hassan, M.S., Villieras, F., Gaboriaud, F., Razafitianamaharavo, A., 2005. AFM and low-781 pressure argon adsorption analysis of geometrical properties of phyllosilicates. Journal 782 of Colloid and Interface Science 296, 614–623. 783
https://doi.org/10.1016/j.jcis.2005.09.028 784 Hermans, P.H., Platzek, P., 1939. Beiträge zur Kenntnis des Deformationsmechanismus und 785
der Feinstruktur der Hydratzellulose. Kolloid-Z, Kolloid-Z 88, 68–72. 786 Jacops, E., Aertsens, M., Maes, N., Bruggeman, C., Swennen, R., Krooss, B., Amann-787
Hildenbrand, A., Littke, R., 2017. The Dependency of Diffusion Coefficients and 788 Geometric Factor on the Size of the Diffusing Molecule: Observations for Different 789
Clay-Based Materials. Geofluids 2017, 1–16. https://doi.org/10.1155/2017/8652560 790
Landais, P., 2006. Advances in geochemical research for the underground disposal of high-791 level, long-lived radioactive waste in a clay formation. Journal of Geochemical 792
Exploration 88, 32–36. https://doi.org/10.1016/j.gexplo.2005.08.011 793 Liu, L., 2013. Prediction of swelling pressures of different types of bentonite in dilute 794
solutions. Colloids and Surfaces A: Physicochemical and Engineering Aspects 434, 795
303–318. https://doi.org/10.1016/j.colsurfa.2013.05.068 796 Loeber, L., 1992. Etude de la structure des cakes d’argile formés sur la paroi des puits au 797
cours du forage. Université d’Orléans, Orléans-France. 798
Malikova, N., Cadéne, A., Marry, V., Dubois, E., Turq, P., Zanotti, J.-M., Longeville, S., 799
2005. Diffusion of water in clays – microscopic simulation and neutron scattering. 800 Chemical Physics 317, 226–235. https://doi.org/10.1016/j.chemphys.2005.04.035 801
Malikova, N., Cadène, A., Marry, V., Dubois, E., Turq, P., 2006. Diffusion of Water in Clays 802
on the Microscopic Scale: Modeling and Experiment. J. Phys. Chem. B 110, 3206–803 3214. https://doi.org/10.1021/jp056954z 804
Marcos, C., Argüelles, A., Ruíz-Conde, A., P. J. Sánchez-Soto, Blanco, J.A., 2003. Study of 805 the dehydration process of vermiculites by applying a vacuum pressure: formation of 806 interstratified phases. Mineral. mag. 67, 1253–1268. 807 https://doi.org/10.1180/0026461036760163 808
33
Marry, V., Turq, P., Cartailler, T., Levesque, D., 2002. Microscopic simulation of structure 809
and dynamics of water and counterions in a monohydrated montmorillonite. The 810
Journal of Chemical Physics 117, 3454–3463. https://doi.org/10.1063/1.1493186 811 Marry, V., Turq, P., 2003. Microscopic Simulations of Interlayer Structure and Dynamics in 812
Bihydrated Heteroionic Montmorillonites. J. Phys. Chem. B 107, 1832–1839. 813
Melkior, T., Gaucher, E.C., Brouard, C., Yahiaoui, S., Thoby, D., Clinard, Ch., Ferrage, E., 814
Guyonnet, D., Tournassat, C., Coelho, D., 2009. Na+ and HTO diffusion in compacted 815 bentonite: Effect of surface chemistry and related texture. Journal of Hydrology 370, 816 9–20. https://doi.org/10.1016/j.jhydrol.2009.02.035 817
Mermut, A.R., Cano, A.F., 2001. Baseline Studies of the Clay Minerals Society Source Clays: 818 Chemical Analyses of Major Elements. Clays and Clay Minerals 49, 381–386. 819
https://doi.org/10.1346/CCMN.2001.0490504 820 Michot, L.J., Ferrage, E., Jiménez-Ruiz, M., Boehm, M., Delville, A., 2012. Anisotropic 821
Features of Water and Ion Dynamics in Synthetic Na- and Ca-Smectites with 822 Tetrahedral Layer Charge. A Combined Quasi-elastic Neutron-Scattering and 823 Molecular Dynamics Simulations Study. J. Phys. Chem. C 116, 16619–16633. 824 https://doi.org/10.1021/jp304715m 825
Nakashima, Y., Mitsumori, F., 2005. H2O self-diffusion restricted by clay platelets with 826
immobilized bound H2O layers: PGSE NMR study of water-rich saponite gels. 827 Applied Clay Science 28, 209–221. https://doi.org/10.1016/j.clay.2004.01.017 828
Ochs, M., Lothenbach, B., Wanner, H., Sato, H., Yui, M., 2001. An integrated sorption–829 diffusion model for the calculation of consistent distribution and diffusion coefficients 830
in compacted bentonite. Journal of Contaminant Hydrology 47, 283–296. 831 https://doi.org/10.1016/S0169-7722(00)00157-1 832
Porion, P., Faugère, A.M., Delville, A., 2014. Structural and Dynamical Properties of Water 833
Molecules Confined within Clay Sediments Probed by Deuterium NMR Spectroscopy, 834
Multiquanta Relaxometry, and Two-Time Stimulated Echo Attenuation. J. Phys. 835 Chem. C 118, 20429–20444. https://doi.org/10.1021/jp506312q 836
Porion, P., Ferrage, E., Hubert, F., Tertre, E., Dabat, T., Faugère, A.M., Condé, F., Warmont, 837
F., Delville, A., 2018. Water Mobility within Compacted Clay Samples: Multi-Scale 838 Analysis Exploiting 1 H NMR Pulsed Gradient Spin Echo and Magnetic Resonance 839
Imaging of Water Density Profiles. ACS Omega 3, 7399–7406. 840 https://doi.org/10.1021/acsomega.8b01083 841
Pret, D., 2003. Nouvelles méthodes quantitatives de cartographie de la minéralogie et de la 842
porosité dans les matériaux argileux : application aux bentonites compactées des 843 barrières ouvragées. Université de Poitiers, Poitiers-France. 844
Pusch, R., 1979. Highly Compacted Sodium Bentonite for Isolating Rock-Deposited 845 Radioactive Waste Products. Journal Nuclear Technology 45, 153–157. 846 https://doi.org/10.13182/NT79-A32305 847
Reinholdt, M.X., Hubert, F., Faurel, M., Tertre, E., Razafitianamaharavo, A., Francius, G., 848 Prêt, D., Petit, S., Béré, E., Pelletier, M., Ferrage, E., 2013. Morphological properties 849 of vermiculite particles in size-selected fractions obtained by sonication. Applied Clay 850 Science 77–78, 18–32. https://doi.org/10.1016/j.clay.2013.03.013 851
Sakharov, B.A., Drits, V.A., McCarty, D.K., Walker, G.M., 2016. Modeling Powder X-Ray 852 Diffraction Patterns of the Clay Minerals Society Kaolinite Standards: Kga-1, Kga-1b, 853 and Kga-2. Clays Clay Miner. 64, 314–333. 854 https://doi.org/10.1346/CCMN.2016.0640307 855
Sato, H., 2000. The Effect of Pore Structural Factors on Diffusion in Compacted Sodium 856 Bentonite. MRS Proc. 663, 605. https://doi.org/10.1557/PROC-663-605 857
34
Sato, H., Suzuki, S., 2003. Fundamental study on the effect of an orientation of clay particles 858
on diffusion pathway in compacted bentonite. Applied Clay Science 23, 51–60. 859
https://doi.org/10.1016/S0169-1317(03)00086-3 860 Savoye, S., Beaucaire, C., Grenut, B., Fayette, A., 2015. Impact of the solution ionic strength 861
on strontium diffusion through the Callovo-Oxfordian clayrocks: An experimental and 862 modeling study. Applied Geochemistry 61, 41–52. 863 https://doi.org/10.1016/j.apgeochem.2015.05.011 864
Shackelford, C.D., Moore, S.M., 2013. Fickian diffusion of radionuclides for engineered 865 containment barriers: Diffusion coefficients, porosities, and complicating issues. 866 Engineering Geology 152, 133–147. https://doi.org/10.1016/j.enggeo.2012.10.014 867
Skipper, N.T., Lock, P.A., Titiloye, J.O., Swenson, J., Mirza, Z.A., Howells, W.S., 868 Fernandez-Alonso, F., 2006. The structure and dynamics of 2-dimensional fluids in 869
swelling clays. Chemical Geology 230, 182–196. 870 https://doi.org/10.1016/j.chemgeo.2006.02.023 871
Suzuki, S., Sato, H., Ishidera, T., Fujii, N., 2004. Study on anisotropy of effective diffusion 872
coefficient and activation energy for deuterated water in compacted sodium bentonite. 873 Journal of Contaminant Hydrology 68, 23–37. https://doi.org/10.1016/S0169-874 7722(03)00139-6 875
Swenson, J., Bergman, R., Howells, W.S., 2000. Quasielastic neutron scattering of two-876
dimensional water in a vermiculite clay. J. Chem. Phys. 113, 2873–2879. 877 https://doi.org/10.1063/1.1305870 878
Tertre, E., Delville, A., Prêt, D., Hubert, F., Ferrage, E., 2015. Cation diffusion in the 879
interlayer space of swelling clay minerals – A combined macroscopic and microscopic 880 study. Geochimica et Cosmochimica Acta 149, 251–267. 881 https://doi.org/10.1016/j.gca.2014.10.011 882
Tertre, E., Savoye, S., Hubert, F., Prêt, D., Dabat, T., Ferrage, E., 2018. Diffusion of Water 883
through the Dual-Porosity Swelling Clay Mineral Vermiculite. Environ. Sci. Technol. 884 52, 1899–1907. https://doi.org/10.1021/acs.est.7b05343 885
Titiloye, J.O., Skipper, N.T., 2001. Molecular dynamics simulation of methane in sodium 886
montmorillonite clay hydrates at elevated pressures and temperatures. Molecular 887 Physics 99, 899–906. https://doi.org/10.1080/00268970010028863 888
Tournassat, C., Steefel, C.I., 2019. Reactive Transport Modeling of Coupled Processes in 889 Nanoporous Media. Reviews in Mineralogy and Geochemistry 85, 75–109. 890 https://doi.org/10.2138/rmg.2019.85.4 891
Tyagi, M., Gimmi, T., Churakov, S.V., 2013. Multi-scale micro-structure generation strategy 892 for up-scaling transport in clays. Advances in Water Resources 59, 181–195. 893
https://doi.org/10.1016/j.advwatres.2013.06.002 894 Underwood, T.R., Bourg, I.C., 2020. Large-Scale Molecular Dynamics Simulation of the 895
Dehydration of a Suspension of Smectite Clay Nanoparticles. J. Phys. Chem. C 124, 896
3702–3714. https://doi.org/10.1021/acs.jpcc.9b11197 897 Valleau, J., Diestler, D., Cushman, J., Schoen, M., Hertzner, A., Riley, M., 1991. Comment 898
on: Adsorption and diffusion at rough surfaces. A comparison of statistical mechanics, 899 molecular dynamics, and kinetic theory. The Journal of Chemical Physics 95, 6194–900
6195. 901 Van Loon, L.R., Soler, J.M., Jakob, A., Bradbury, M.H., 2003. Effect of confining pressure 902
on the diffusion of HTO, 36Cl− and 125I− in a layered argillaceous rock (Opalinus 903 Clay): diffusion perpendicular to the fabric. Applied Geochemistry 18, 1653–1662. 904 https://doi.org/10.1016/S0883-2927(03)00047-7 905
35
Van Loon, L.R., Soler, J.M., Müller, W., Bradbury, M.H., 2004. Anisotropic Diffusion in 906
Layered Argillaceous Rocks: A Case Study with Opalinus Clay. Environ. Sci. 907
Technol. 38, 5721–5728. 908 Wenk, H.-R., Kanitpanyacharoen, W., Voltolini, M., 2010. Preferred orientation of 909
phyllosilicates: Comparison of fault gouge, shale and schist. Journal of Structural 910 Geology 12, 478-489. 911
Wenk, Voltolini, Mazurek, Loon, V.L.R., Vinsot, 2008. Preferred Orientations and 912
Anisotropy in Shales: Callovo-Oxfordian Shale (France) and Opalinus Clay 913 (Switzerland). Clays Clay Miner. 56, 285–306. 914 https://doi.org/10.1346/CCMN.2008.0560301 915
Wittebroodt, C., Savoye, S., Frasca, B., Gouze, P., 2012. Diffusion of HTO, 36Cl- and 125I- in 916 Upper Toarcian argillite samples from Tournemire: Effects of initial iodide 917
concentration and ionic strength. Applied Geochemistry 27, 1432-1441. 918 Xiang, Y., Al, T., Scott, L., Loomer, D., 2013. Diffusive anisotropy in low-permeability 919
Ordovician sedimentary rocks from the Michigan Basin in southwest Ontario. Journal 920
of Contaminant Hydrology 155, 31-45. 921 922
6. Supplementary data (S. D.) 923
S.1. Materials and methods 924
S.1.1. 1H NMR Pulsed Gradient Spin Echo experiments 925
The Pulsed Gradient Spin Echo attenuation measurements by Nuclear Magnetic 926
Resonance (PGSE-NMR) analyses were performed at the ICMN laboratory (Orléans, France) 927
on the Na-kaolinite compacted sample. The dried Na-kaolinite samples, in volume-constrained 928
Polyether ether ketone (PEEK) tubes (see Section S.1.1), were first water-saturated by capillary 929
imbibition. To do so, the bottom part of the sample was put in contact with deionized water, 930
while the other side of the tube was connected to a primary vacuum pump to favor water 931
migration and gentle evacuation of air from the pore network. The NMR measurements were 932
performed using the same setup and experimental conditions as in (Porion et al., 2018; Dabat 933
et al., 2020) on a Bruker® DSX100 spectrometer. This instrument operates with a static 934
magnetic field of 2.35 T and is equipped with a saddle detection coil and a micro-imaging probe 935
(Micro5 Bruker) with gradient coils to generate magnetic field gradients in three perpendicular 936
directions. The macroscopic water mobility along any pre-selected direction within the sample 937
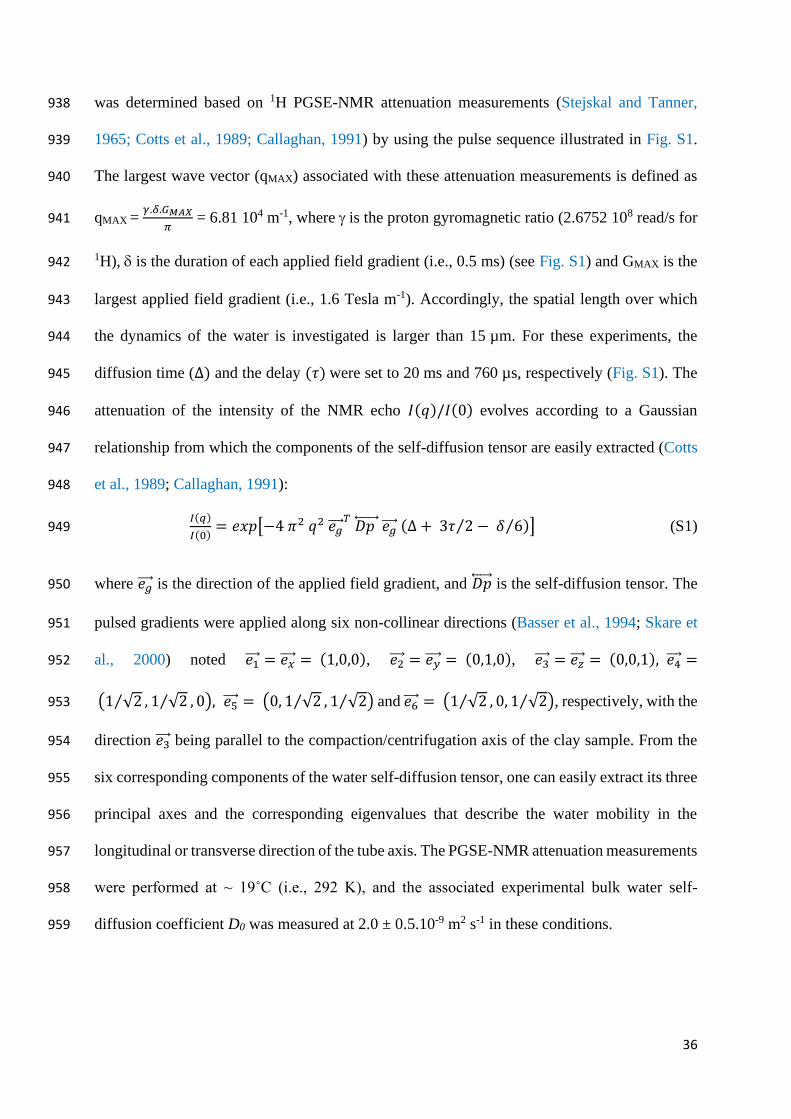
36
was determined based on 1H PGSE-NMR attenuation measurements (Stejskal and Tanner, 938
1965; Cotts et al., 1989; Callaghan, 1991) by using the pulse sequence illustrated in Fig. S1. 939
The largest wave vector (qMAX) associated with these attenuation measurements is defined as 940
qMAX = 𝛾.𝛿.𝐺𝑀𝐴𝑋
𝜋 = 6.81 104 m-1, where is the proton gyromagnetic ratio (2.6752 108 read/s for 941
1H), is the duration of each applied field gradient (i.e., 0.5 ms) (see Fig. S1) and GMAX is the 942
largest applied field gradient (i.e., 1.6 Tesla m-1). Accordingly, the spatial length over which 943
the dynamics of the water is investigated is larger than 15 µm. For these experiments, the 944
diffusion time (Δ) and the delay (𝜏) were set to 20 ms and 760 µs, respectively (Fig. S1). The 945
attenuation of the intensity of the NMR echo 𝐼(𝑞)/𝐼(0) evolves according to a Gaussian 946
relationship from which the components of the self-diffusion tensor are easily extracted (Cotts 947
et al., 1989; Callaghan, 1991): 948
𝐼(𝑞)
𝐼(0)= 𝑒𝑥𝑝[−4 𝜋2 𝑞2 𝑒𝑔⃗⃗ ⃗⃗
𝑇 𝐷𝑝 ⃡⃗⃗⃗⃗⃗⃗ 𝑒𝑔⃗⃗ ⃗⃗ (Δ + 3𝜏 2⁄ − 𝛿 6⁄ )] (S1) 949
where 𝑒𝑔⃗⃗ ⃗⃗ is the direction of the applied field gradient, and 𝐷𝑝⃡⃗⃗⃗⃗⃗ is the self-diffusion tensor. The 950
pulsed gradients were applied along six non-collinear directions (Basser et al., 1994; Skare et 951
al., 2000) noted 𝑒1⃗⃗⃗⃗ = 𝑒𝑥⃗⃗ ⃗⃗ = (1,0,0), 𝑒2⃗⃗ ⃗⃗ = 𝑒𝑦⃗⃗⃗⃗⃗ = (0,1,0), 𝑒3⃗⃗ ⃗⃗ = 𝑒𝑧⃗⃗⃗⃗ = (0,0,1), 𝑒4⃗⃗ ⃗⃗ =952
(1 √2⁄ , 1 √2⁄ , 0), 𝑒5⃗⃗ ⃗⃗ = (0, 1 √2⁄ , 1 √2⁄ ) and 𝑒6⃗⃗ ⃗⃗ = (1 √2⁄ , 0, 1 √2⁄ ), respectively, with the 953
direction 𝑒3⃗⃗ ⃗⃗ being parallel to the compaction/centrifugation axis of the clay sample. From the 954
six corresponding components of the water self-diffusion tensor, one can easily extract its three 955
principal axes and the corresponding eigenvalues that describe the water mobility in the 956
longitudinal or transverse direction of the tube axis. The PGSE-NMR attenuation measurements 957
were performed at ~ 19˚C (i.e., 292 K), and the associated experimental bulk water self-958
diffusion coefficient D0 was measured at 2.0 ± 0.5.10-9 m2 s-1 in these conditions. 959
37
960
Fig. S1. Pulse sequence used to perform Pulsed Gradient Spin Echo (PGSE-NMR) attenuation 961
measurements in Na-kaolinite samples. 962
963
. Induration of the samples and two-dimensional X-Ray Scattering measurements 964
For each sample used in this study, a duplicate was prepared to be used for particle 965
organization measurements. Induration of the duplicate samples was performed to produce thin 966
sections for two-dimensional X-Ray Scattering (2D-XRS) measurements. The induration 967
method used here was based on the thermal impregnation technique with methyl methacrylate 968
(MMA, C5H8O2), which was developed by Sammaljärvi et al. (2012) and successfully applied 969
for Na-kaolinite samples (Dabat et al., 2020). The duplicates for 2D-XRS were prepared in 970
PEEK tubes (diameter of 0.64 cm and height of 7.5 cm) instead of PMMA because the latter 971
can dissolve when in contact with MMA. Perforated PEEK caps and cellulose membrane with 972
a pore size of 0.1 μm were placed at each side to maintain both the total porosity and particle 973
organization of the sample during the induration process. The duplicates were first placed under 974
a vacuum for 20 minutes to remove the residual water that could interfere with the 975
polymerization of MMA. Then, liquid MMA mixed with thermal initiator benzoyl peroxide 976
(BPO, at 5% of MMA mass) was introduced into the tubes without breaking the vacuum to 977
facilitate the access of MMA gas to the smallest pores. The samples were kept in contact with 978
liquid MMA for a few days up to two weeks (in the case of centrifuged Na-vermiculite) to 979
promote as much as possible the capillary saturation of the pores by the MMA+BPO mixture. 980
38
After saturation, the PEEK tubes that contained clayey samples were sealed with PTFE caps 981
and placed in a water bath at 55°C for at least 24 hours to complete the polymerization of MMA 982
into PMMA. 983
Following the induration process, the obtained samples were cut longitudinally and 984
transversely with respect to the tube axis (Fig. 2a) using a circular saw (Fig. 2b). The resulting 985
lamellas were reduced by a polishing table to 500 µm thickness to allow sufficient transmission 986
for the XRS measurements (Dabat et al., 2020). Acquisition of two-dimensional XRS (2D-987
XRS) patterns for anisotropy in particle orientation measurements was performed at the 988
Laboratoire de Physique des Solides (LPS) - Orsay, France. The X-ray beam is generated via a 989
copper rotating anode generator (RU H3R, Rigaku Corporation, Japan), equipped with a 990
multilayer W/Si mirror (Osmic), which generates a monochromatic beam (λCuKα = 1.5418 Å) 991
with a spot size of 1 mm2 that passes through the slits to cover a 600 x 600 µm² surface of the 992
sample. The scattering signals (Fig. 2c) from the sample were collected on a 2D-detector 993
(MAR345, marXperts GmbH®, Germany, 150-µm pixel size). The sample-to-detector distance 994
was set to 250 mm. This configuration makes it possible to reach a scattering vector modulus 995
down to Qmin = 0.2 Å-1 (Q = 2π/d = 4π/λ sin(𝜃𝐵), where λ is the incident wavelength, and 2𝜃𝐵 996
is the scattering angle). The sample lamellas were aligned perpendicular to the incident X-ray 997
beam by mounting them on a goniometer head, and the XRS were acquired with a typical 998
acquisition time of 900 s. 999
S.1.3. Through-diffusion experiments on the HDO tracer 1000
The experimental setup for the Through-Diffusion (TD) experiments on the water tracer 1001
(HDO) was previously used by Tertre et al. (2018) and originally adapted from the one proposed 1002
by Van Loon et al. (2003). The configurations of this setup allow for measuring HDO diffusion 1003
along the z-direction, i.e., perpendicular to the compaction plane and the preferred orientation 1004
of the clay particles. It consists of a fluid circulation system and a PMMA tube that contains 1005
39
the clay sample compacted at the desired ε value (see section 2.2 in the original text). The 1006
sample is retained in the tube via a series of components on each side, listed from the closest to 1007
the sample to the farthest, as follows: (i) cellulose membrane with a pore size of 0.1 μm, (ii) a 1008
stainless-steel filter (pore diameter of 10 μm), and (iii) two PEEK grids (nominal spaces of 280 1009
and 450 μm for mono filaments with diameters equal to 120 and 200 μm, respectively). The 1010
PEEK grids are used to homogenize the flow of the solution that arrives at each side of the 1011
sample (Melkior, 2000). The fluid circulation system consists of two 50-mL reservoirs (i.e., 1012
upstream, and downstream reservoirs) and a peristaltic pump used to ensure the constant 1013
circulation of the solutions. Prior to the TD experiment, the sample was saturated with Milli-1014
Q® water (~18.2 MΩ cm) by maintaining circulation of the water on each side of it for two 1015
weeks (Tertre et al., 2018). 1016
For the TD experiments, the upstream reservoir was filled with 50 mL of a 0.01-M NaCl 1017
solution, spiked with HDO at 0.55 M and prepared by a dilution of initial D2O solution (purity 1018
of 99.8 atom % D purchased from Agros Organics®), and the downstream reservoir was filled 1019
with 50 mL of Milli-Q water. The 0.01-M NaCl solution was used in the upstream reservoir to 1020
to measure the in addition to HDO the diffusion of ions (i.e., Na+, Cl-) as performed previously 1021
in Tertre et al. (2018); data which are not reported in this present study. The two reservoirs were 1022
then connected to the TD setup, and t=0 was set as the fluid circulation started. To keep the 1023
HDO concentration gradient as constant as possible between the two reservoirs, both reservoirs 1024
were regularly replaced with fresh ones (the time step can vary between a few hours to 1 day 1025
depending on the experiments), and 1 mL aliquot from the reservoirs were collected for the 1026
HDO concentration measurements. The results from the upstream reservoirs (not shown) 1027
confirmed that the decrease in the HDO concentration did not exceed 3%, which validated the 1028
hypothesis of a constant gradient of HDO during the experiment (see below for the boundary 1029
conditions). 1030
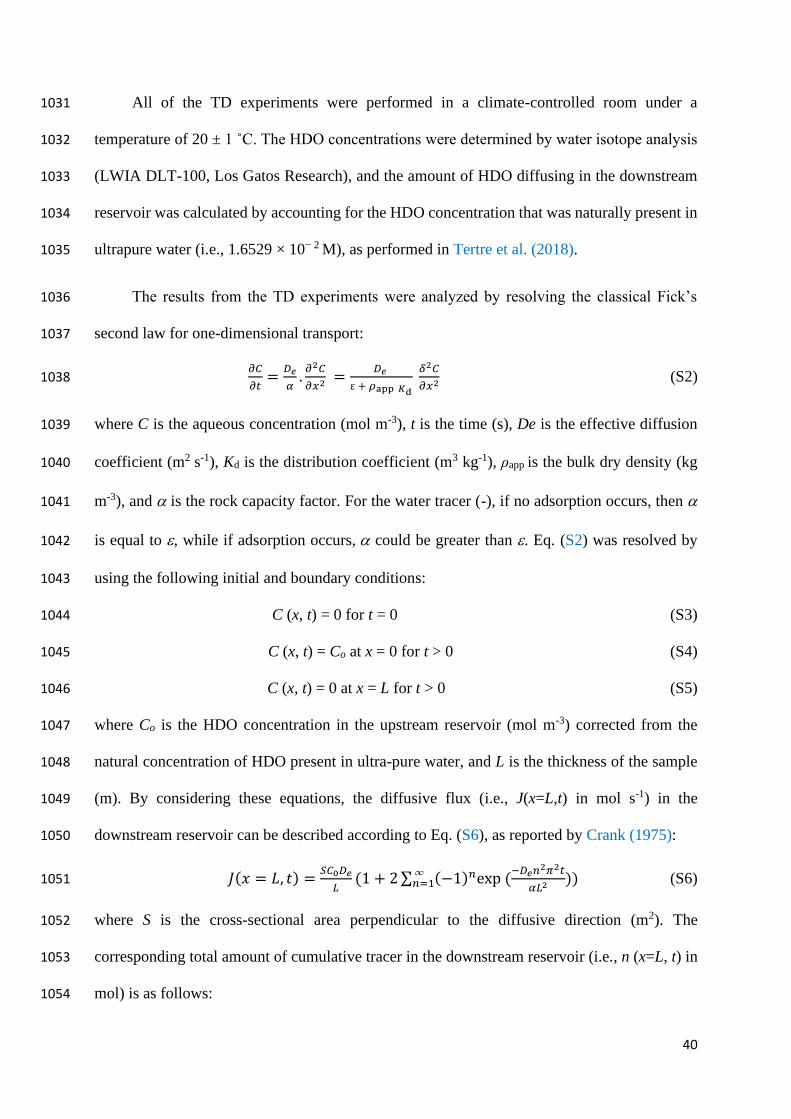
40
All of the TD experiments were performed in a climate-controlled room under a 1031
temperature of 20 ± 1 ˚C. The HDO concentrations were determined by water isotope analysis 1032
(LWIA DLT-100, Los Gatos Research), and the amount of HDO diffusing in the downstream 1033
reservoir was calculated by accounting for the HDO concentration that was naturally present in 1034
ultrapure water (i.e., 1.6529 × 10− 2 M), as performed in Tertre et al. (2018). 1035
The results from the TD experiments were analyzed by resolving the classical Fick’s 1036
second law for one-dimensional transport: 1037
𝜕𝐶
𝜕𝑡=
𝐷𝑒
𝛼.
𝜕2𝐶
𝜕𝑥2 =𝐷𝑒
ε + 𝜌app 𝐾d
𝛿2𝐶
𝜕𝑥2 (S2) 1038
where C is the aqueous concentration (mol m-3), t is the time (s), De is the effective diffusion 1039
coefficient (m2 s-1), Kd is the distribution coefficient (m3 kg-1), ρapp is the bulk dry density (kg 1040
m-3), and is the rock capacity factor. For the water tracer (-), if no adsorption occurs, then 1041
is equal to , while if adsorption occurs, could be greater than . Eq. (S2) was resolved by 1042
using the following initial and boundary conditions: 1043
C (x, t) = 0 for t = 0 (S3) 1044
C (x, t) = Co at x = 0 for t > 0 (S4) 1045
C (x, t) = 0 at x = L for t > 0 (S5) 1046
where Co is the HDO concentration in the upstream reservoir (mol m-3) corrected from the 1047
natural concentration of HDO present in ultra-pure water, and L is the thickness of the sample 1048
(m). By considering these equations, the diffusive flux (i.e., J(x=L,t) in mol s-1) in the 1049
downstream reservoir can be described according to Eq. (S6), as reported by Crank (1975): 1050
𝐽(𝑥 = 𝐿, 𝑡) =𝑆𝐶0𝐷𝑒
𝐿(1 + 2 ∑ (−1)𝑛exp (
−𝐷𝑒𝑛2𝜋2𝑡
𝛼𝐿2∞𝑛=1 )) (S6) 1051
where S is the cross-sectional area perpendicular to the diffusive direction (m2). The 1052
corresponding total amount of cumulative tracer in the downstream reservoir (i.e., n (x=L, t) in 1053
mol) is as follows: 1054
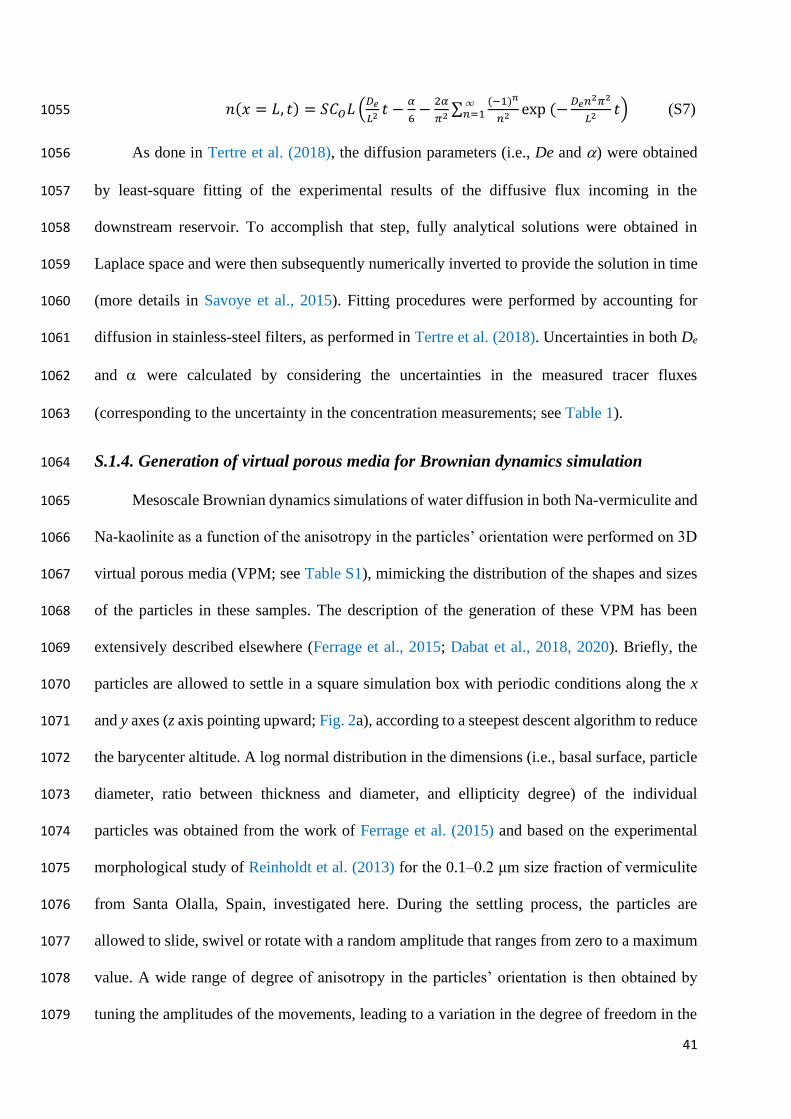
41
𝑛(𝑥 = 𝐿, 𝑡) = 𝑆𝐶𝑂𝐿 (𝐷𝑒
𝐿2𝑡 −
𝛼
6−
2𝛼
𝜋2∑
(−1)𝑛
𝑛2exp (−
𝐷𝑒𝑛2𝜋2
𝐿2𝑡∞
𝑛=1 ) (S7) 1055
As done in Tertre et al. (2018), the diffusion parameters (i.e., De and ) were obtained 1056
by least-square fitting of the experimental results of the diffusive flux incoming in the 1057
downstream reservoir. To accomplish that step, fully analytical solutions were obtained in 1058
Laplace space and were then subsequently numerically inverted to provide the solution in time 1059
(more details in Savoye et al., 2015). Fitting procedures were performed by accounting for 1060
diffusion in stainless-steel filters, as performed in Tertre et al. (2018). Uncertainties in both De 1061
and were calculated by considering the uncertainties in the measured tracer fluxes 1062
(corresponding to the uncertainty in the concentration measurements; see Table 1). 1063
S.1.4. Generation of virtual porous media for Brownian dynamics simulation 1064
Mesoscale Brownian dynamics simulations of water diffusion in both Na-vermiculite and 1065
Na-kaolinite as a function of the anisotropy in the particles’ orientation were performed on 3D 1066
virtual porous media (VPM; see Table S1), mimicking the distribution of the shapes and sizes 1067
of the particles in these samples. The description of the generation of these VPM has been 1068
extensively described elsewhere (Ferrage et al., 2015; Dabat et al., 2018, 2020). Briefly, the 1069
particles are allowed to settle in a square simulation box with periodic conditions along the x 1070
and y axes (z axis pointing upward; Fig. 2a), according to a steepest descent algorithm to reduce 1071
the barycenter altitude. A log normal distribution in the dimensions (i.e., basal surface, particle 1072
diameter, ratio between thickness and diameter, and ellipticity degree) of the individual 1073
particles was obtained from the work of Ferrage et al. (2015) and based on the experimental 1074
morphological study of Reinholdt et al. (2013) for the 0.1–0.2 μm size fraction of vermiculite 1075
from Santa Olalla, Spain, investigated here. During the settling process, the particles are 1076
allowed to slide, swivel or rotate with a random amplitude that ranges from zero to a maximum 1077
value. A wide range of degree of anisotropy in the particles’ orientation is then obtained by 1078
tuning the amplitudes of the movements, leading to a variation in the degree of freedom in the 1079
42
particle motions (Ferrage et al., 2015). This degree of anisotropy of the particles’ orientation 1080
was extracted by calculating the average of the second-order Legendre polynomial on the 1081
angular distribution of the particle orientations, as follows: 1082
⟨𝑃2⟩ = ⟨𝑃2(𝑐𝑜𝑠𝜃)⟩ = ⟨3𝑐𝑜𝑠2𝜃 − 1⟩/2 (S8) 1083
where 𝜃 is the angle between the normal unit vector of the particle and the z axis of the 1084
simulation box (Fig. 4a). This ⟨P2⟩ order parameter, also referred to as the nematic order S 1085
(Dabat et al., 2018; Underwood and Bourg, 2020) or the Hermans parameter H (Hermans and 1086
Platzek, 1939), takes the value of 0 for an isotropic organization and 1 when all of the particles 1087
are perfectly oriented in the bedding (all normal to the particles aligned with the z axis of the 1088
simulation box). 1089
To cover over a large range of anisotropy degrees in particle orientations, 13 particle 1090
packings with ⟨P2⟩ values that varied from 0.03 to 0.96 were generated according to this 1091
algorithm ((Ferrage et al., 2018; Dabat et al., 2020); see Table S1 and Fig. 4a). This 1092
methodology leads, however, to different interparticle porosity values as a function of ⟨𝑃2⟩ and 1093
does not allow obtaining periodic conditions in the z direction. To overcome these drawbacks 1094
for the BD simulations, additional treatments, as detailed by Dabat et al. (2020), were applied 1095
to the different obtained VPM. Briefly, a cubic sub-volume of ~2000 particles was first 1096
extracted, and particles were then polygonized considering 12 in-plane vectors plus 2 vectors 1097
passing along the normal of the particles. Periodic conditions with the minimum-image 1098
convention were applied along the three directors, 𝑒𝑥⃗⃗ ⃗⃗ , 𝑒𝑦⃗⃗⃗⃗⃗, and 𝑒𝑧⃗⃗⃗⃗ , of the simulation box. Based 1099
on the obtained sub-volumes, two subsequent treatments were applied to reduce the interparticle 1100
porosity of the packings and to reach an interparticle porosity value that is close to that of the 1101
water-saturated samples analyzed in this study by PGSE-NMR and through-diffusion 1102
experiments, i.e., interp.~0.25 (Dabat et al., 2020). The first treatment consists of allowing each 1103
particle to grow along its 14 vectors, with detection and rejection of particle overlapping. The 1104
43
second treatment implies the injection of a new particle on the surface of an existing particle 1105
and the subsequent particle growth to fill the porosity. The two processes led to final 1106
interparticle porosity values of approximately 0.27 for packings with 0.03 ⟨𝑃2⟩ 0.85 and 1107
approximately 0.25 for packings with ⟨𝑃2⟩ = 0.92 and 0.96 (Table S1; Fig. 4a). Because these 1108
treatments lead to a decrease in the particle sizes and thus an increase in the overall specific 1109
surface areas (SSA) of the sample, a last treatment involved the dilatation of the simulation box 1110
(and thus particle) dimensions. For vermiculite, the final cubic lengths of the VPM are ~1 μm 1111
(i.e., between 1.12 and 0.99 for the order parameter ⟨𝑃2⟩ ranging from 0.03 to 0.96, respectively; 1112
see Table S1) and of the SSA values are ~95 m2 g-1, which is in agreement with the experimental 1113
results from Reinholdt et al. (2013). The total number of particles ranges between ~11000 and 1114
~7400, for the more isotropic and anisotropic organizations, respectively (Table S1). 1115
1116
1117
1118
1119
1120
1121
1122
1123
1124
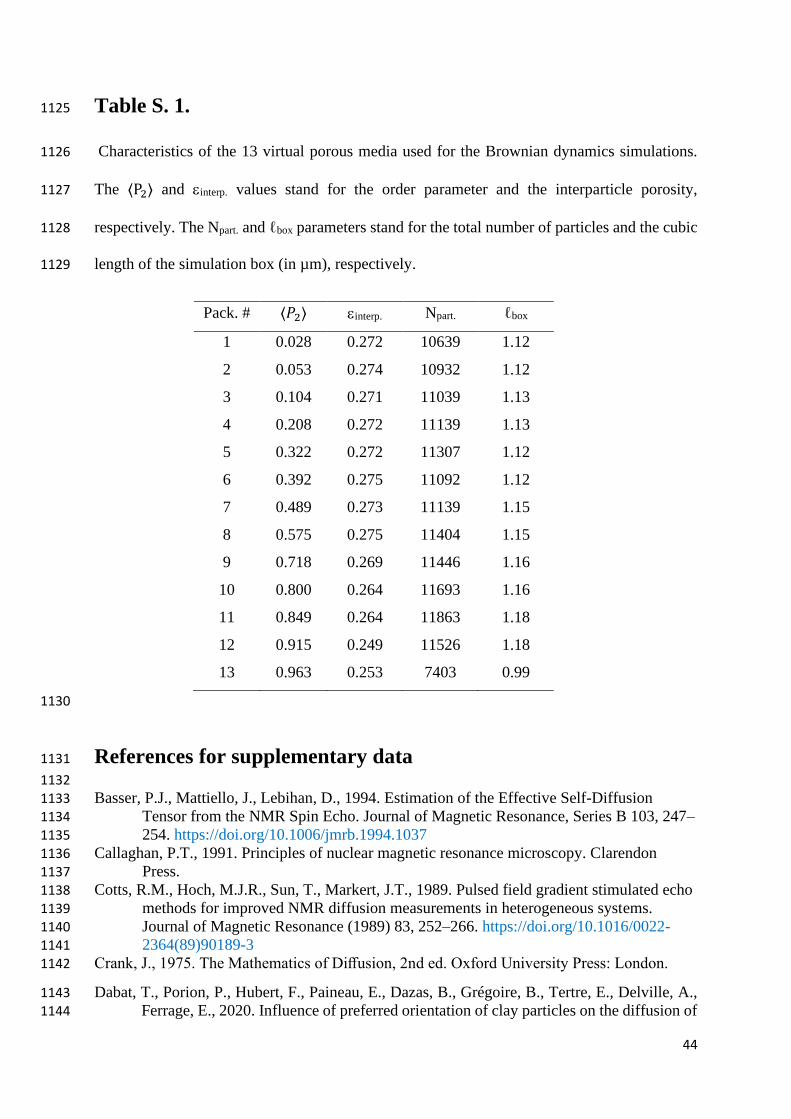
44
Table S. 1. 1125
Characteristics of the 13 virtual porous media used for the Brownian dynamics simulations. 1126
The ⟨P2⟩ and interp. values stand for the order parameter and the interparticle porosity, 1127
respectively. The Npart. and ℓbox parameters stand for the total number of particles and the cubic 1128
length of the simulation box (in µm), respectively. 1129
Pack. # ⟨𝑃2⟩ interp. Npart. ℓbox
1 0.028 0.272 10639 1.12
2 0.053 0.274 10932 1.12
3 0.104 0.271 11039 1.13
4 0.208 0.272 11139 1.13
5 0.322 0.272 11307 1.12
6 0.392 0.275 11092 1.12
7 0.489 0.273 11139 1.15
8 0.575 0.275 11404 1.15
9 0.718 0.269 11446 1.16
10 0.800 0.264 11693 1.16
11 0.849 0.264 11863 1.18
12 0.915 0.249 11526 1.18
13 0.963 0.253 7403 0.99
1130
References for supplementary data 1131
1132 Basser, P.J., Mattiello, J., Lebihan, D., 1994. Estimation of the Effective Self-Diffusion 1133
Tensor from the NMR Spin Echo. Journal of Magnetic Resonance, Series B 103, 247–1134
254. https://doi.org/10.1006/jmrb.1994.1037 1135 Callaghan, P.T., 1991. Principles of nuclear magnetic resonance microscopy. Clarendon 1136
Press. 1137
Cotts, R.M., Hoch, M.J.R., Sun, T., Markert, J.T., 1989. Pulsed field gradient stimulated echo 1138 methods for improved NMR diffusion measurements in heterogeneous systems. 1139
Journal of Magnetic Resonance (1989) 83, 252–266. https://doi.org/10.1016/0022-1140 2364(89)90189-3 1141
Crank, J., 1975. The Mathematics of Diffusion, 2nd ed. Oxford University Press: London. 1142
Dabat, T., Porion, P., Hubert, F., Paineau, E., Dazas, B., Grégoire, B., Tertre, E., Delville, A., 1143 Ferrage, E., 2020. Influence of preferred orientation of clay particles on the diffusion of 1144
45
water in kaolinite porous media at constant porosity. Applied Clay Science 184, 105354. 1145
https://doi.org/10.1016/j.clay.2019.105354 1146
Dabat, T., Mazurier, A., Hubert, F., Tertre, E., Grégoire, B., Dazas, B., Ferrage, E., 2018. 1147 Mesoscale Anisotropy in Porous Media Made of Clay Minerals. A Numerical Study 1148 Constrained by Experimental Data. Materials 11, 1972. 1149 https://doi.org/10.3390/ma11101972 1150
Ferrage, E., Hubert, F., Tertre, E., Delville, A., Michot, L.J., Levitz, P., 2015. Modeling the 1151
arrangement of particles in natural swelling-clay porous media using three-1152 dimensional packing of elliptic disks. Physical Review E 91, 062210. 1153 https://doi.org/10.1103/PhysRevE.91.062210 1154
Ferrage, E., Hubert, F., Baronnet, A., Grauby, O., Tertre, E., Delville, A., Bihannic, I., Prêt, 1155 D., Michot, L.J., Levitz, P., 2018. Influence of crystal structure defects on the small-1156
angle neutron scattering/diffraction patterns of clay-rich porous media. J Appl 1157 Crystallogr 51, 1311–1322. https://doi.org/10.1107/S160057671801052X 1158
Melkior, T., 2000. Etude méthodologique de la diffusion de cations interagissant dans des 1159
argiles : application : mise en œuvre expérimentale et modélisation du couplage 1160 chimie-diffusion d’alcalins dans une bentonite synthétique (Ph.D. Thesis). Ecole 1161 Centrale Paris, Paris, France. 1162
Hermans, P.H., Platzek, P., 1939. Beiträge zur Kenntnis des Deformationsmechanismus und 1163 der Feinstruktur der Hydratzellulose. Kolloid-Z, Kolloid-Z 88, 68–72. 1164
Porion, P., Ferrage, E., Hubert, F., Tertre, E., Dabat, T., Faugère, A.M., Condé, F., Warmont, 1165 F., Delville, A., 2018. Water Mobility within Compacted Clay Samples: Multi-Scale 1166
Analysis Exploiting 1 H NMR Pulsed Gradient Spin Echo and Magnetic Resonance 1167 Imaging of Water Density Profiles. ACS Omega 3, 7399–7406. 1168 https://doi.org/10.1021/acsomega.8b01083 1169
Reinholdt, M.X., Hubert, F., Faurel, M., Tertre, E., Razafitianamaharavo, A., Francius, G., 1170
Prêt, D., Petit, S., Béré, E., Pelletier, M., Ferrage, E., 2013. Morphological properties 1171 of vermiculite particles in size-selected fractions obtained by sonication. Applied Clay 1172 Science 77–78, 18–32. https://doi.org/10.1016/j.clay.2013.03.013 1173
Sammaljärvi, J., Jokelainen, L., Ikonen, J., Siitari-Kauppi, M., 2012. Free radical 1174 polymerisation of MMA with thermal initiator in brick and Grimsel granodiorite. 1175
Engineering Geology 135–136, 52–59. https://doi.org/10.1016/j.enggeo.2012.03.005 1176 Savoye, S., Beaucaire, C., Grenut, B., Fayette, A., 2015. Impact of the solution ionic strength 1177
on strontium diffusion through the Callovo-Oxfordian clayrocks: An experimental and 1178
modeling study. Applied Geochemistry 61, 41–52. 1179 https://doi.org/10.1016/j.apgeochem.2015.05.011 1180
Skare, S., Hedehus, M., Moseley, M.E., Li, T.-Q., 2000. Condition Number as a Measure of 1181 Noise Performance of Diffusion Tensor Data Acquisition Schemes with MRI. Journal 1182 of Magnetic Resonance 147, 340–352. https://doi.org/10.1006/jmre.2000.2209 1183
Stejskal, E.O., Tanner, J.E., 1965. Spin Diffusion Measurements: Spin Echoes in the Presence 1184 of a Time‐Dependent Field Gradient. The Journal of Chemical Physics 42, 288–292. 1185 https://doi.org/10.1063/1.1695690 1186
Related Documents