Water Research 36 (2002) 445–459 Role of filamentous microorganisms in activated sludge foaming: relationship of mycolata levels to foaming initiation and stability Francis L. de los Reyes III 1 , Lutgarde Raskin* Department of Civil and Environmental Engineering, University of Illinois at Urbana-Champaign, 3221 Newmark Civil Engineering Laboratory, 205 North Mathews Avenue, Urbana, IL 61801, USA Received 17 July 2000; received in revised form 17 January 2001; accepted 25 January 2001 Abstract The relationship between the levels of mycolic acid-containing actinomycetes (mycolata), Gordonia spp. and Gordonia amarae, and foam initiation and stability was characterized using: (1) batch tests involving addition of G. amarae cells to activated sludge, (2) analysis of a full-scale activated sludge plant that experienced seasonal foaming, and (3) a study of lab-scale activated sludge reactors augmented with G. amarae. Using batch tests, threshold Gordonia levels for foam formation and foam stability were determined to be approximately 2 10 8 mm ml 1 and 1 10 9 mm ml 1 , respectively. In the full-scale plant, the levels of Gordonia spp. and G. amarae increased during the course of foaming, and the foam formation threshold of 2 10 8 mm ml 1 corresponded to the onset of foaming. This value was also verified in lab-scale reactor washout experiments, where decreasing mycolata levels were observed during the course of foam dissipation. The foam stability threshold of 1 10 9 mm ml 1 was verified in lab-scale reactor studies. The increase in the levels of Gordonia spp. and G. amarae in the full-scale plant corresponded to an increase in temperature, suggesting that the growth of Gordonia spp. was favored during warmer periods. r 2002 Elsevier Science Ltd. All rights reserved. Keywords: Activated sludge; Filamentous foaming; Nocardioforms; Foam threshold; Gordonia amarae; 16S ribosomal RNA 1. Introduction Foam on the surfaces of activated sludge aeration basins and secondary clarifiers can be classified as permanent (a thick, brown foam is always present), or temporal (seasonal, or even sporadic). In both cases, the mycolic acid-containing actinomycetes, or mycolata (particularly Gordonia amarae, formerly Nocardia amar- ae) [1,2], and ‘‘Candidatus Microthrix parvicella’’ (here- inafter referred to as ‘‘M. parvicella’’) are believed to be the main causative organisms of filamentous foaming [3,4]. The transient nature of foam occurrence may therefore be analyzed by monitoring changes in the levels of these microorganisms over time. This approach has been used in previous studies [4–6], in which the unique morphology and staining characteristics of some mycolata (the nocardioforms) were used to quantify their levels in activated sludge. Despite these efforts, the appearance and disappear- ance of foam in many activated sludge plants is not completely understood. This may in part be due to the limitations of staining and microscopy techniques in identifying and quantifying causative organisms. With- out a clear link between foaming and levels of causative organisms, contradictory factors in foaming causes (and eventual cures) cannot be resolved [6,7]. Furthermore, the diversity of filaments in foam and identification *Corresponding author. Tel.: +1-217-333-6964; fax: +1- 217-333-6968. E-mail address: [email protected] (L. Raskin). 1 Present address: Department of Civil Engineering, North Carolina State University, Campus Box 7908, Raleigh, NC 27695, USA. 0043-1354/02/$ - see front matter r 2002 Elsevier Science Ltd. All rights reserved. PII:S0043-1354(01)00227-5

Welcome message from author
This document is posted to help you gain knowledge. Please leave a comment to let me know what you think about it! Share it to your friends and learn new things together.
Transcript
Water Research 36 (2002) 445–459
Role of filamentous microorganisms in activated sludgefoaming: relationship of mycolata levels to foaming initiation
and stability
Francis L. de los Reyes III1, Lutgarde Raskin*
Department of Civil and Environmental Engineering, University of Illinois at Urbana-Champaign, 3221 Newmark Civil Engineering
Laboratory, 205 North Mathews Avenue, Urbana, IL 61801, USA
Received 17 July 2000; received in revised form 17 January 2001; accepted 25 January 2001
Abstract
The relationship between the levels of mycolic acid-containing actinomycetes (mycolata), Gordonia spp. and Gordoniaamarae, and foam initiation and stability was characterized using: (1) batch tests involving addition of G. amarae cells
to activated sludge, (2) analysis of a full-scale activated sludge plant that experienced seasonal foaming, and (3) a studyof lab-scale activated sludge reactors augmented with G. amarae. Using batch tests, threshold Gordonia levels for foamformation and foam stability were determined to be approximately 2� 108 mmml�1 and 1� 109 mmml�1, respectively.
In the full-scale plant, the levels of Gordonia spp. and G. amarae increased during the course of foaming, and the foamformation threshold of 2� 108 mmml�1 corresponded to the onset of foaming. This value was also verified in lab-scalereactor washout experiments, where decreasing mycolata levels were observed during the course of foam dissipation.The foam stability threshold of 1� 109 mmml�1 was verified in lab-scale reactor studies. The increase in the levels of
Gordonia spp. and G. amarae in the full-scale plant corresponded to an increase in temperature, suggesting that thegrowth of Gordonia spp. was favored during warmer periods. r 2002 Elsevier Science Ltd. All rights reserved.
Keywords: Activated sludge; Filamentous foaming; Nocardioforms; Foam threshold; Gordonia amarae; 16S ribosomal RNA
1. Introduction
Foam on the surfaces of activated sludge aerationbasins and secondary clarifiers can be classified aspermanent (a thick, brown foam is always present), or
temporal (seasonal, or even sporadic). In both cases, themycolic acid-containing actinomycetes, or mycolata(particularly Gordonia amarae, formerly Nocardia amar-
ae) [1,2], and ‘‘Candidatus Microthrix parvicella’’ (here-inafter referred to as ‘‘M. parvicella’’) are believed to be
the main causative organisms of filamentous foaming[3,4]. The transient nature of foam occurrence may
therefore be analyzed by monitoring changes in thelevels of these microorganisms over time. This approachhas been used in previous studies [4–6], in which the
unique morphology and staining characteristics of somemycolata (the nocardioforms) were used to quantifytheir levels in activated sludge.
Despite these efforts, the appearance and disappear-ance of foam in many activated sludge plants is notcompletely understood. This may in part be due to thelimitations of staining and microscopy techniques in
identifying and quantifying causative organisms. With-out a clear link between foaming and levels of causativeorganisms, contradictory factors in foaming causes (and
eventual cures) cannot be resolved [6,7]. Furthermore,the diversity of filaments in foam and identification
*Corresponding author. Tel.: +1-217-333-6964; fax: +1-
217-333-6968.
E-mail address: [email protected] (L. Raskin).1Present address: Department of Civil Engineering, North
Carolina State University, Campus Box 7908, Raleigh, NC
27695, USA.
0043-1354/02/$ - see front matter r 2002 Elsevier Science Ltd. All rights reserved.
PII: S 0 0 4 3 - 1 3 5 4 ( 0 1 ) 0 0 2 2 7 - 5

difficulties may have contributed to the lack of under-standing. To help resolve these issues, population shifts
of putative foam-causing organisms before, during, andafter foaming need to be quantified.To link foaming to levels of foam-causing organisms,
group-, genus-, and species-specific small-subunit (SSU)ribosomal RNA (rRNA)-targeted oligonucleotideprobes for the mycolata, Gordonia spp. and Gordoniaamarae, respectively, were developed [8,9]. Probes have
also been developed for another putative foam-former,‘‘M. parvicella’’ [10]. We previously used membranehybridizations to quantify relative rRNA levels in
activated sludge and developed a quantitative fluores-cence in situ hybridization (FISH) method for estimat-ing the biomass associated with Gordonia spp. [11].
These two hybridization formats were subsequently usedto follow shifts in population levels of Gordonia spp. and‘‘M. parvicella’’ before, during, and after a seasonal
foaming incident in a full-scale plant [12]. The resultsshowed that the relative levels of rRNA and volatilesuspended solids (VSS) of Gordonia spp. (but not ‘‘M.parvicella’’) increased when foam appeared, and de-
creased when foam disappeared. This study alsosuggested that filamentous microorganisms need to bepresent above a threshold level for foam to appear in
activated sludge. This possibility had been mentionedpreviously by [6]. Since then, two studies have deter-mined thresholds for the occurrence of foam using in
situ counting methods: Cha et al. [5] found a thresholdof 1� 106 intersections g�1 VSS using a filamentintersection counting method and Davenport et al. [13]identified a threshold of 2� 106 mycolata cells ml�1
using a quantitative FISH method. These reports didnot differentiate between thresholds for foam initiationand foam stability, and the relationship of filament
levels to these two phenomena remains unclear.The present study was conducted to investigate the
relationship between levels of foam-causing organisms
and foam initiation and stability in activated sludge.Batch tests, lab-scale reactor experiments, and analysesof a full-scale activated sludge system were used to
identify and verify foaming thresholds. SSU rRNA-targeted hybridization probes were used to quantify thelevels of mycolata, Gordonia spp. and G. amarae, thusavoiding the limitations of traditional identification
methods.
2. Materials and methods
2.1. Culture conditions
G. amarae strains RBI and NM23 were kindlyprovided by M. Hernandez, University of Colorado.
G. amarae RBI was batch-grown in TGY medium (10 gtryptone, 1 g glucose, 7 g NaCl, and 2.5 g yeast extract
per liter; pH 7.0). G. amarae NM23 was batch-grown inmineral salts medium [14] with 0.5% acetate as the sole
carbon source. After 14 days of growth, the cells wereharvested by centrifugation for 10min at 6800� g andspent medium (i.e., used, cell-free medium) was collected
for use in batch experiments. G. amarae NM23 cellswere resuspended in 1 l spent medium before addition tothe reactors (see below).
2.2. Activated sludge samples
For batch tests, approximately 30 l of activated sludge
were obtained from the stabilization basin of a contact-stabilization activated sludge system at the Urbana-Champaign Sanitary District Northeast Wastewater
Treatment Plant (UCSD-NE WWTP), Urbana, IL. Thissludge sample was collected in February 1999, when theplant was not experiencing foaming problems.
To follow population shifts before and during afoaming episode, 50-ml grab samples of activated sludgemixed liquor and foam were obtained from the contactand stabilization basins of the UCSD-NE WWTP. Since
this plant usually experiences filamentous foamingduring the summer season (June–September) [12],samples were collected every 2–3 days from March to
September, 1999. Total suspended solids and VSS of theactivated sludge were determined using standard meth-ods [15].
For membrane hybridizations, samples were collectedand immediately transported to the laboratory forprocessing and storage. Samples (14ml) were centri-
fuged at 2040� g and the cell pellets were stored at�801C. Nucleic acids were extracted from cell pelletsusing a low-pH hot-phenol extraction procedure [16].For FISH, 3ml samples were immediately fixed with
9ml 4% (w : v) paraformaldehyde (PFA) as describedbelow.
2.3. Batch experiments
Activated sludge was placed in a 30-l container,
aerated using ceramic diffusers, and mixed. Any foamthat was formed was removed from the surface. Well-mixed activated sludge samples, 200 or 250ml, were
obtained from the bottom of the container and placed in500-ml graduated cylinders. To determine the effect ofspent and fresh growth media on foaming potential,batch tests were conducted in triplicate with the
following samples (each totaling 250ml): 250ml ofactivated sludge (AS), 200ml of AS+50ml freshmedium, 200ml of AS+40ml fresh medium+10ml
spent medium, 200ml AS+30ml fresh medium+20mlspent medium, 200ml AS+20ml fresh medium+30mlspent medium, 200ml AS+10ml fresh medium+40ml
spent medium, and 200ml AS+50ml spent medium. Todetermine the effect of cell mass on foaming potential,
F.L. de los Reyes III, L. Raskin / Water Research 36 (2002) 445–459446
batch tests were conducted in triplicate by suspendingvarying amounts of G. amarae RBI cell mass (7.4–
298mg of cells) in 50ml of spent medium, which wassubsequently mixed with 200ml of activated sludge.Mixing was performed manually by slow inversion
(three times) of the graduated cylinders to avoid airentrapment and the foaming potential tests wereperformed immediately after mixing. The added G.amarae biomass corresponded to 1.5%, 3.0%, 5.8%,
8.4%, 13.3%, 15.5%, 19.7%, 23.4%, and 38.0% of theVSS of the total mixture. Cell concentrations higherthan the culture concentrations were obtained by
centrifugation for 30min at 10,600� g.Statistical analysis was performed using StatView 5.0
(SAS Institute, Cary, NC). The analysis of variance
using Scheffe multiple pairwise comparison and Dunnettpairwise comparison with the control (no G. amarae cellsadded) was performed.
2.4. Foaming potential
Foaming potential tests were conducted by addingtwo tablets of Alka-Seltzert (two tablets contain 650mg
sodium acetylsalicylate, 3832mg heat-treated sodiumbicarbonate, and 2000mg citric acid; Bayer Corp.,Elkhart, IN) to 250ml of well-mixed samples in 500-ml
graduated cylinders [12]. To determine the foamingpotential, the volume of foam generated was measuredimmediately. Foam stability was measured by noting thefoam half-life, defined as the time it takes for half the
volume of foam generated in the foaming potential testto dissipate.
2.5. Quantitative membrane hybridization
Membrane hybridizations were performed as pre-viously described [8,17]. Membranes were hybridizedwith universal and specific oligonucleotide 32P labeled
probes (Table 1), and the resulting hybridizationresponses, measured using an Instant Imager (PackardInstruments, Meriden, CT), were used to determine the
relative concentration of target SSU rRNA in thesamples [8,17].
2.6. Determination of Gordonia mass using fluorescencein situ hybridization
From each mixture of activated sludge, fresh medium,and spent medium, 0.5ml of sample was collected before
the foaming potential test and placed in 1.7-mlcentrifuge tubes. Each sample was fixed with 1ml of4% (w : v) PFA for 1min at room temperature [8], andstored in phosphate buffered saline (PBS)/ethanol (1 : 1,
v : v) until used for FISH. An oligonucleotide probetargeting the SSU rRNA of Gordonia spp. S-G-Gor-0596-a-A-22 [8], labeled with tetramethylrhodamine
isothiocyanate (TRITC) or Cy3 was obtained fromGenosys Biotechnologies, Inc. (The Woodlands, TX).FISH was performed as previously described [11], with
the following modifications. Mutanolysin (Sigma, St.Louis, MO, Cat. No. M9909) at a concentration of5000Uml�1 in 0.1-M phosphate buffer (pH 6.8) was
used to make the cell wall of gram-positive bacteriamore permeable to the probes [10] after serial dehydra-tion in 50%, 80%, and 100% ethanol. The slides wereincubated for 20min at 371C in a 50-ml centrifuge tube
to avoid drying, the ethanol dehydration was repeated,and the slides were air dried. After FISH, the sampleswere stained with 40-6-diamidino-2-phenylindole dihy-
drochloride (DAPI) [8]. Cells were visualized using aZeiss Axioskop and appropriate dichromatic filter sets.Digital images were captured using a cooled charge
coupled device (CCD) camera (Photometrics, Tucson,AZ) with a KAF 1400 CCD [8]. Filament length wasmeasured using IPLab Spectrum v. 3.0 (Signal Analy-
tics, Vienna, VA) using the Measure Lengths command,with manual thresholding [11].To determine the abundance of Gordonia spp. in the
biomass, 30 random fields were captured (ten images
each from three slide wells), and the total filament lengthfrom each image field was determined [11]. The mass ofGordonia spp. was determined using the following
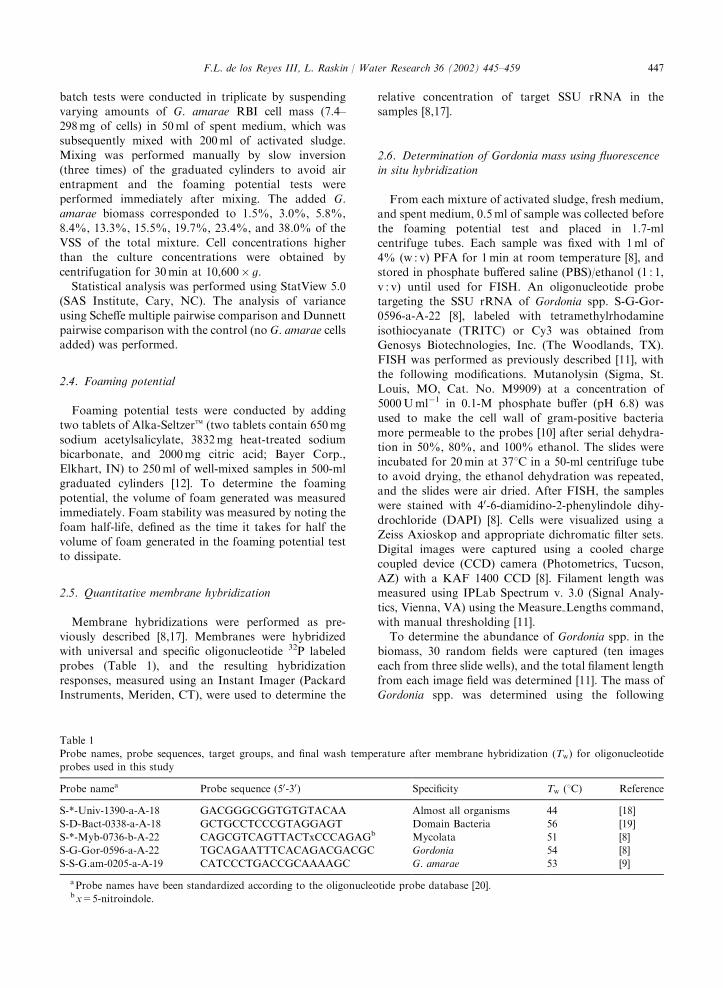
Table 1
Probe names, probe sequences, target groups, and final wash temperature after membrane hybridization (Tw) for oligonucleotide
probes used in this study
Probe namea Probe sequence (50-30) Specificity Tw (1C) Reference
S-*-Univ-1390-a-A-18 GACGGGCGGTGTGTACAA Almost all organisms 44 [18]
S-D-Bact-0338-a-A-18 GCTGCCTCCCGTAGGAGT Domain Bacteria 56 [19]
S-*-Myb-0736-b-A-22 CAGCGTCAGTTACTxCCCAGAGb Mycolata 51 [8]
S-G-Gor-0596-a-A-22 TGCAGAATTTCACAGACGACGC Gordonia 54 [8]
S-S-G.am-0205-a-A-19 CATCCCTGACCGCAAAAGC G. amarae 53 [9]
aProbe names have been standardized according to the oligonucleotide probe database [20].bx=5-nitroindole.
F.L. de los Reyes III, L. Raskin / Water Research 36 (2002) 445–459 447

equation [11]:
Gordonia spp: conc: ðmgVSSml�1Þ
¼ Rc�½ðLf�AwÞ=ðV�aÞ�; ð1Þ
where Rc ¼ 4:14� 10�10 mg Gordonia spp. VSS mm�1,Lf the average total filament length per field for the 30
random images (mm), Aw the area of microscope slidesample well (mm2), V the volume of sample applied tothe microscope sample well (ml) and A the area ofmicroscope field (mm2).
The averages of the total filament length per field forthe ten random image fields from each well weredetermined. The standard deviation of three averages
(one average for each slide well) was calculated.
2.7. Lab-scale reactor studies
Three sequencing batch reactors (SBRs), each with an
active working volume of 5 l were operated usingperistaltic pumps and timers with a 3-h cycle: 90minfill/react, 30min react, 30min settle, and 30min decantphases.
Mixed liquor and return activated sludge from theUCSD-NE WWTP were combined to obtain mixedliquor suspended solids (MLSS) and mixed liquor
volatile suspended solids (MLVSS) concentrations of1705 and 1356mg l�1, respectively, added to a 30-lcontainer, aerated using ceramic diffusers, and mixed
with a laboratory mixer. Any foam that was formed wasremoved from the surface. Three 4-l activated sludgesamples obtained from the bottom of the container,
were each mixed with 1 l of spent medium (with orwithout G. amarae NM23 cells), and were added to theSBRs to obtain a final volume of 5 l. Reactor A wasseeded with 5820mg of G. amarae NM23 cells (equiva-
lent to 51.8% of the VSS), Reactor B was seeded with990mg of G. amaraeNM23 cells (equivalent to 15.4% ofthe VSS), and no G. amarae NM23 cells were added to
Reactor C. A solids retention time (SRT) of 10 days wasmaintained by wasting daily from the mixed liquor. Thehydraulic retention time was set at 6 h. Primary effluent
from the UCSD-NE WWTP (average total BOD-E100mg l�1) was collected daily and used as influentfor the reactors. The reactors were sampled for foamingpotential, membrane hybridizations, and FISH every
2–4 days.
3. Results and discussion
3.1. Determination of Gordonia mass using fluorescencein situ hybridization
The mass of Gordonia spp. in activated sludge sampleswas determined using a previously developed FISH
quantification procedure [11]. In this previous study, therelationship between total filament length and VSS for a
pure culture of G. amarae was determined using imageanalysis after FISH had been performed. Assuming thatthe relationship between filament length and VSS in
pure culture is the same as the one in activated sludge,the contribution of Gordonia spp. to the total VSS canbe determined in activated sludge after filament lengthquantification by FISH and image analysis. Using this
method, it was determined that the Gordonia level in asample from non-foaming activated sludge obtainedfrom the stabilization tank of the UCSD-NE WWTP
was (2.9470.32)� 107 mmml�1 or (0.570.11)% of theVSS (mean7standard error, n ¼ 3 independent hybri-dizations).
To assess the effectiveness of the quantitative FISHmethod in activated sludge, known amounts of G.amarae RBI cells were added to this sample. The results
are shown in Fig. 1. A line representing 100% recovery(slope of 1 : 1, intercept of 0.5% VSS, representing theGordonia cell biomass in the initial sample) is shown forcomparison. Within the 95% confidence limits of the
method, added cells were recovered over a broad rangeof VSS levels, although there was a slight under-estimation at the higher levels (>23%). For samples
with high levels of filamentous biomass, it was difficultto measure filament length accurately because filamentsdisappeared from the microscope focal plane. As a
consequence, filament length and biomass were under-estimated. This underestimation may not be a problem
Fig. 1. Recovery of G. amarae RBI cells added to activated
sludge samples with quantitative FISH method. The bars
represent 95% confidence intervals; the line indicates the
anticipated recovery (100%).
F.L. de los Reyes III, L. Raskin / Water Research 36 (2002) 445–459448

for this study since foaming activated sludge typicallycontained Gordonia levels below 20% of the VSS (see
below). Thus, this quantitative FISH method can be usedto quantify Gordonia biomass levels in activated sludge.It should be noted that expressing Gordonia biomass
as a percentage of total VSS may misrepresent theirabsolute levels in a given sample. Even if activatedsludge contains a high absolute level of Gordoniabiomass, the Gordonia biomass expressed as a percen-
tage of the total VSS may be low if the total VSS is high.Expressing Gordonia abundance as filament length pervolume or VSS concentration (mg Gordonia VSS l�1)
may be more useful for determining threshold levels,since foaming is thought to depend on the density ofmycolata cells [13]. On the other hand, expressing
Gordonia biomass as a percentage of total VSS allowsus to compare the contribution of Gordonia biomass tototal biomass with the contribution of Gordonia rRNA
to total rRNA, thus allowing a comparison of mem-brane hybridization and FISH results.
3.2. Batch experiments
The foaming potential data obtained in the batchexperiments are shown in Fig. 2. The foaming potential
was determined to be (22271.7) ml (mean7standarderror, n ¼ 3 foaming potential tests) for the undilutedactivated sludge sample (3167mg l�1 MLSS) and
21774.4ml for a diluted (with distilled water) activatedsludge sample (2534mg l�1 MLSS). The foaming poten-tial increased to 27572.9ml for the sample diluted with50ml of fresh TGY medium. This result shows that the
medium used to culture G. amarae RBI contributedsignificantly to the foaming potential, likely due to thepresence of proteins or other surface active compounds
in tryptone and yeast extract. A foaming potential of250ml had previously been shown to be the cutoff level
for foaming in the UCSD-NE WWTP [12]. Thus, theaddition of fresh medium during the batch testsincreased the foaming potential to levels above this
cutoff. To determine the effect of spent medium, varyingamounts of spent medium were exchanged for freshmedium. Increasing the volume of spent medium did notchange the foaming potential significantly compared to
the foaming potential for the activated sludge samplediluted with fresh medium (ANOVA, a ¼ 0:01) (Fig. 2),indicating that the properties of the medium contribut-
ing to foaming potential did not change during cellgrowth. To minimize the effect of the medium onfoaming potential, all cell mass additions were resus-
pended in 50ml of spent medium.Additions of pure cultures of G. amarae RBI of
1.5% and 3.0% of the VSS (determined by direct VSS
measurement, equivalent to 1.09� 108 and1.94� 108mmml�1, respectively) did not increase thefoaming potential significantly (Fig. 2). However, at a G.amarae biomass level of 2.96� 108mmml�1 (represent-
ing a G. amarae biomass concentration of 5.8% of theVSS), the foaming potential increased significantly(ANOVA, Po0:01) to 33377.3ml (mean7standard
error, n ¼ 3 foaming potential tests). Thus, it is likelythat a threshold level for foam formation corresponds toa G. amarae filament length between 1.94� 108 and
2.96� 108mmml�1 (3% and 5.8% of the VSS, respec-tively). This G. amarae biomass level is consistent with a1997 study of the UCSD-NE WWTP ([12]; unpublisheddata), which showed an increase in Gordonia from less
than 1.01� 108mmml�1 (4% of the VSS) in non-foaming sludge to 8.52� 108mmml�1 (almost 10% ofthe VSS) after foam initiation.
Fig. 2. Foaming potential results obtained in batch experiments. Bars represent standard errors of three independent tests.
F.L. de los Reyes III, L. Raskin / Water Research 36 (2002) 445–459 449

Increasing the G. amarae biomass above 5.8% of theVSS did not result in significant changes (ANOVA,
Po0:01) in the foaming potential (the foaming potentialvaried from 333718.7 to 353721.4ml) (Fig. 2). How-ever, the foam half-life dramatically increased with
further increases in the G. amarae biomass levels (datanot shown). The foam half-life increased from 60 to 90 sto 510 to 540 s when G. amarae was increased from9.35� 108 to 1.18� 109 mmml�1 (15.5% to 19.7% of the
VSS). Thus, a filament level between these two valuesmay correspond to a threshold for foam stability.The first threshold is a formation threshold, which is
characterized by a sudden increase in foaming potential.The second threshold is a stability threshold and wehypothesize that this threshold corresponds to a situa-
tion in which foam is maintained as a thick viscous layeron the surface of the aeration basin.
3.3. Foaming potential and stability in a full-scaleactivated sludge plant
To evaluate whether the formation and stabilitythresholds determined by batch experiments are also
relevant for full-scale activated sludge systems, theUCSD-NE WWTP was studied. This plant treatsprimarily domestic wastewater with an average flow of
5.7� 104m3 day�1 (15 million gallons per day) and anaverage BOD of 150mg l�1. The main secondary
treatment process is a contact-stabilization activatedsludge system, which is schematically represented in
Fig. 3. Each summer, the system is temporarily switchedto conventional activated sludge mode to facilitateroutine annual maintenance. This plant experiences
seasonal foaming, generally from June to September,with a maximum foam thickness of 6–10 cm and amaximum foam coverage of 80–100% of the aerationbasin surface. Initial applications of quantitative mem-
brane hybridizations, FISH, and immunostainingshowed an approximately five-fold increase in Gordoniaspp., rRNA, and biomass levels during a change from
non-foaming to foaming conditions [12]. To describe thenature of this increase more accurately, the activatedsludge plant was monitored every 2–3 days over a period
of 6 months during the foaming season.Fig. 4a shows the MLSS levels in the contact and
stabilization basins and the temperature in the aeration
basin immediately before the secondary clarifier (BasinD). The plant was operated in contact-stabilizationmode until May 14, when the operation was switched toconventional activated sludge mode. The sampling
regimen (sampling from Basins A and B) was continuedafter the switch in operation (MLSS levels were onlydetermined for Basin B). Before this switch, a drastic
decrease in stabilization basin MLSS occurred due toaccidental prolonged wasting from the secondaryclarifier. An old wasting valve was inadvertently left
Fig. 3. Schematic representation of UCSD-NE WWTP activated sludge system. (a) Contact-stabilization activated sludge mode. (b)
Conventional activated sludge mode.
F.L. de los Reyes III, L. Raskin / Water Research 36 (2002) 445–459450

open from May 6 to 10, resulting in a massive loss ofsolids from the system, particularly from Basin A
(Fig. 4a).Fig. 4b shows the foaming potential over time. When
sampling began on March 22, the foaming potential in
Basin A was initially low (less than 200ml), which isconsistent with the absence of surface foam at the plant.The foaming potential then increased and reached
250ml on April 8, the cutoff value for foam formationfor this plant [12]. At the same time, some foam (lessthan 5% surface coverage of Basin A) was observed.
The increasing values of the foaming potential immedi-ately before the appearance of surface foam indicate thatmonitoring foaming potential can be part of an earlywarning system for predicting the onset of foaming. The
surface foam rapidly disappeared following two rainfall
events (April 8 and 10), resulting in a drop in foamingpotential. This observation indicates that the foam was
unstable and that the hydraulic pattern in the basins wasonly partially foam-trapping. Subsequently, the foamingpotential increased to a value greater than 250ml on
April 25. The foaming potentials of the contact basinand the stabilization basin during this period behavedsimilarly, although the foaming potential in the contact
basin was lower because of the lower solids concentra-tion. Surface foam was again observed on April 25 andremained present during the rest of the sampling period,
while surface foam coverage varied from 10% to 95%.The foaming potential for the rest of the samplingperiod fluctuated from 185 to 292ml. As expected, thefoaming potentials for the two basins became very
similar after the switch to conventional activated sludge
Fig. 4. Operational data for Basins A and B of the UCSD-NE WWTP activated sludge system (March–October 1999).
(a) Temperature and MLSS concentrations. (b) Foaming potential.
F.L. de los Reyes III, L. Raskin / Water Research 36 (2002) 445–459 451

mode. From June 13 to June 27, the plant operatorstried to control the foam by manipulating the SRT. The
waste activated sludge (WAS) flow rates were increasedto lower the SRT on June 14, decreased on June 24 asthe MLSS dropped below 1000mg l�1, and increased
again on June 27. This resulted in a decrease in foamingpotential after June 29, but surface foam was notcompletely eliminated, and the foaming potentialreturned to its previous levels by mid-July.
During the entire monitoring period, the foam half-life never exceeded 180 s, and was mostly around 10–20 s. This is well below the half-life of 510–540 s,
corresponding to the stability threshold determined inbatch tests. Therefore, the foam-causing filaments wereprobably present at a concentration below this stability
threshold, and the filament levels in this activated sludgeplant were likely between formation and stabilitythresholds during foaming episodes.
3.4. Changes in mycolata rRNA levels during foamingin a full-scale activated sludge plant
The results of membrane hybridizations with themycolata-, Gordonia-, and G. amarae-specific probes areshown in Fig. 5. In general, the levels were relatively low
in the mixed liquor of both aeration basins (less than 5%of the total SSU rRNA). During the first period ofobservation (March 22–May 11), the mycolata rRNA
percentages were considerably higher than the Gordoniaand G. amarae rRNA percentages; Gordonia levels wereapproximately 0.5% and G. amarae levels were close to
the limit of detection (LOD) of 0.4% (in Fig. 6, valuesbelow the LOD are presented as one half of the LOD[i.e., 0.2%], following the suggestion of Clarke [21]).Since surface foam was first observed in early April, the
initial foam was not linked to high levels of GordoniarRNA, but may be due to the presence of othermycolata. Following two rainfall events on April 8 and
10, the foam disappeared, and the foaming potentialdecreased (Fig. 4b). This decrease in foaming potentialcoincided with a decrease in mycolata rRNA levels
(particularly for Basin A) suggesting that (1) the initialfoam was due to mycolata cells other than Gordonia, ormycolata-produced surfactants, and (2) this foam was
not stable, and easily affected by changes in the hydraulicpatterns in the plant. After this temporal washout event,the mycolata rRNA levels in both basins increased again.The mycolata rRNA levels declined once more during
inadvertent wasting (May 5–13). After the switch toconventional activated sludge mode, the Gordonia and G.amarae rRNA fractions slowly increased, and this
increase paralleled the rise in basin temperature fromapproximately 15–201C (Fig. 4a). The mycolata, Gordo-nia, and G. amarae rRNA fractions continued to increase
and reached values of 3.3%, 2.2%, and 2.1% of the totalSSU rRNA, respectively, in Basin B, and 3.6%, 1.9%,
and 1.9%, respectively, in Basin A, on June 16. Activemanipulation of the WAS flow rates to reduce the
foaming (see above) disturbed this increasing trend andprobably resulted in the decrease of the mycolata,Gordonia, and G. amarae rRNA fractions after June
16. After this disturbance, the mycolata and GordoniarRNA percentages were very similar (mycolata levelswere sometimes even lower than Gordonia rRNApercentages, but the differences were small given the
variability of the quantitative hybridization assay [17]).These results again demonstrate the relative susceptibilityof non-Gordonia mycolata to operational changes. The
increase in Gordonia rRNA levels shows that foamingwas probably due to Gordonia after this point. While theG. amarae rRNA levels followed the same trend as those
of Gordonia, the presence of one or more Gordonia spp.other than G. amarae is suggested and may signify thepossible role of other Gordonia spp. in foaming. The
rRNA percentages for the mycolata, Gordonia, and G.amarae decreased considerably on September 10, con-sistent with decreasing intracellular rRNA levels deter-mined by FISH (see below).
The mycolata, Gordonia, and G. amarae rRNA levelsin foam are shown in Fig. 5c. From March 22 to May11, the levels of mycolata rRNA in foam were close to
those in the mixed liquor. These results suggest that theinitial foaming (before May 11) was not due to selectiveenrichment of mycolata cells in foam, but may be caused
by increased biosurfactant production by mycolata. Thesudden disappearance of foam in response to hydraulicevents is consistent with biosurfactants being washedout from the system. After May 11, mycolata cells were
selectively enriched in the foam (Fig. 5c). This observa-tion corresponded to the increases in mycolata, Gordo-nia, and G. amarae rRNA levels in the mixed liquor.
During this period, the mass of cells in the foam, and notsimply the presence of biosurfactant, appeared to be thecause of foaming. This foaming was also more stable,
i.e., not easily affected by changes in WAS flow rates orSRTs, as evidenced by (1) the maintenance of relativelyhigh rRNA levels, and (2) the continued presence of
surface foam. This verifies that once cells are enriched inthe foam, the manipulation of SRT (within normaloperating limits) may not be effective in completelyremoving the foam, because most of the cells in the foam
layer are not removed by normal wasting procedures.This selective enrichment occurred when the tempera-ture was higher than 171C, supporting the hypothesis of
higher Gordonia growth in activated sludge at highertemperatures, and may explain the yearly occurrence offoaming at this plant.
The operational adjustments in WAS flow beginningon June 14 resulted in a decrease in mycolata, Gordonia,and G. amarae rRNA levels in the foam, but did not
result in the complete removal of surface foam. Asstated above, the complete removal of mycolata in foam
F.L. de los Reyes III, L. Raskin / Water Research 36 (2002) 445–459452

by SRT manipulation may not be possible withoutcompromising plant operation. During the rest of the
summer, the rRNA levels in the foam did not fluctuatemuch and Gordonia, particularly G. amarae, constitutedmost of the mycolata in the foam. Before this period ofinstability, mycolata other than Gordonia were present
in the foam.
Considering all perturbations during the entire period,it can be concluded that mycolata other than Gordonia
were more sensitive to operational changes and thatGordonia spp. particularly G. amarae, became moredominant over the course of foaming. This may explainthe historical attribution of most foaming phenomena to
G. amarae, particularly in the United States. Not only
Fig. 5. Results of quantitative membrane hybridizations with oligonucleotide probes for the mycolata, Gordonia, and G. amarae for
UCSD-NE WWTP. (a) Basin A mixed liquor. (b) Basin B mixed liquor. (c) Basin B foam.
F.L. de los Reyes III, L. Raskin / Water Research 36 (2002) 445–459 453

did Gordonia become the dominant mycolata genus asfoaming progressed, it was also less susceptible than
other mycolata to sudden operational perturbationssuch as changing flows and wastage rates.
3.5. Changes in Gordonia biomass during foaming in afull-scale activated sludge plant
The levels of Gordonia biomass determined by
quantitative FISH are shown in Fig. 6. Fig. 6a showsthe levels expressed as total Gordonia filament length persample volume (mmml�1). In March and April, the total
Gordonia filament lengths in basins A and B variedbetween 1.9� 107 and 7.9� 107 mmml�1. These filamentlevels were below the threshold level for foam formation
determined by batch tests (approximately2� 108 mmml�1). The total filament length increased as
foaming progressed and peaked on July 4 at5.5� 108mmml�1 (basin B). Comparable values were
observed during the same time period in the sameactivated sludge plant in 1997, with foaming sludgehaving total filament lengths greater than
2� 108 mmml�1 (unpublished data). Taken together,these data suggest that a total filament length of2� 108 mmml�1 in the mixed liquor is a possible
threshold for foam formation. The data for this plantindicate that this first threshold was reached in late May(Fig. 6a). The Gordonia filament levels in the foam also
increased considerably during late May and early June.The second threshold determined in batch tests,
the foam stability threshold (approximately1� 109 mmml�1), was not reached in this plant during
the 1999 foaming season (Fig. 6a). This was furtherdemonstrated by the low foam half-life values measured
Fig. 6. Quantitative FISH results for mixed liquor and foam from the UCSD-NE WWTP. (a) Gordonia filament length per volume.
(b) % Gordonia VSS.
F.L. de los Reyes III, L. Raskin / Water Research 36 (2002) 445–459454

for this plant (o10–180 s). This second threshold wasevaluated in more detail using lab-scale reactor tests
(see below).The filament length measurements determined by
quantitative FISH were converted to VSS levels of
Gordonia according to Reyes et al. [11] and normalizedusing the total VSS of the activated sludge or foamsamples. Using this approach, the results for the UCSD-NE WWTP can be expressed as % Gordonia VSS
(Fig. 6b). A comparison of the values of % rRNA(Fig. 6) and % Gordonia VSS (Fig. 6b) shows similarfour- to seven-fold increases of % Gordonia rRNA
(o0.5–2%) and % Gordonia VSS (4–28%) duringfoaming. In the period before the start of ‘‘true’’filamentous foaming, the Gordonia % rRNA and %
VSS values were low (0.6% and 4.2%, respectively).However, at its peak value, the Gordonia contribution, of28%, to the VSS in Basin B corresponded to only 2% of
the total rRNA. This discrepancy may be due to: (1)overestimation of the VSS contribution of Gordonia; and/or (2) relatively low rRNA levels of Gordonia cells inmixed liquor during foaming. The overestimation of
Gordonia biomass is possible, since the VSS conversionassumes that the VSS of Gordonia grown in pure cultureis equivalent to the VSS of Gordonia growing in activated
sludge [11]. This assumption may not be correct, giventhat the cell envelope composition and surface-activelipids of the mycolata are dependent on substrate and
other cultivation conditions [22,23]. In addition, thefilaments in activated sludge appeared thinner than thepure culture cells used to develop the Gordonia filamentlength to VSS conversion. Therefore, it is likely that the
Gordonia VSS concentration per unit filament length inactivated sludge is lower than that in pure culture. Moredetailed comparative measurements of filament width
(diameter) need to be performed to address this possiblelimitation. The second scenario (low rRNA numbers inGordonia cells) may also be possible, given previous
studies that compare FISH and immunostaining results.The simultaneous application of FISH and immunostain-ing in activated sludge showed variable and weak FISH
fluorescent signals within the same Gordonia filament[24], indicating low target rRNA levels in Gordonia cells.In addition, filament lengths obtained using fluorescentlylabeled antibody stains are generally higher than FISH
estimates in various activated sludge plants [11].It remains to be resolved whether the low rRNA levels
in Gordonia cells are intrinsic, or due to low growth
activity. Recently, it has been shown that there may beas much as a 15-fold difference in SSU rRNA contentper cell in different species of marine Proteobacteria
growing at similar growth stages [25]. It is possible thatGordonia have intrinsically low cellular rRNA concen-trations compared to other activated sludge organisms.
It is also important to note that the filament levels(expressed as mmml�1) in the foam are five to ten times
higher than those in the mixed liquor (Fig. 6a), while therRNA percentages in foam and mixed liquor show a
three- to five-fold difference (Fig. 5). However, using thequantitative FISH method to estimate Gordonia biomassshows comparable rRNA and VSS percentages in the
foam. In this case, normalization to the foam VSS maynot be an accurate method for expressing the Gordoniacontribution to biomass, as the foam layer containsmuch more non-biomass solids than the mixed liquor.
Again, the filament length per unit volume may be amore meaningful representation of Gordonia biomasslevels than % VSS.
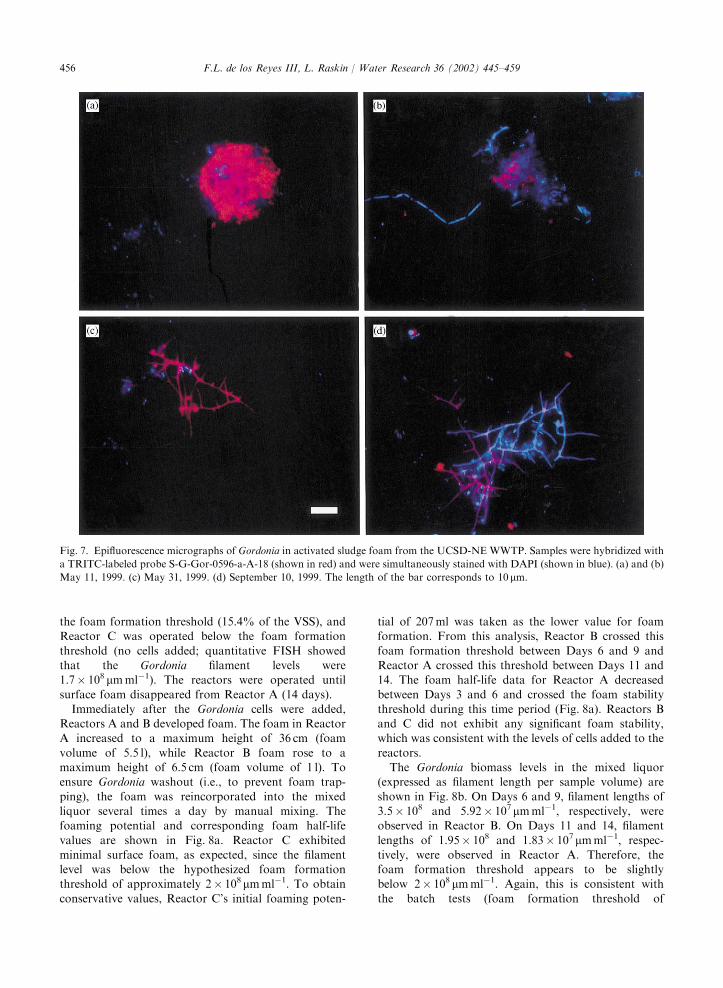
The FISH analysis visually revealed the changes incell morphologies as foaming progressed. In March andApril, Gordonia cells were mostly present as isolated
short rods inside activated sludge flocs. In mid- to late-May, large clusters of rod-shaped Gordonia cells wereobserved inside flocs (Figs. 7a and b). These cell clusters
were observed in increasing frequency towards the endof May and early June, and the cells were brighter thanthe typical Gordonia cells observed in March and April.By early June, typical branching filaments were observed
in the mixed liquor and the foam (Fig. 7c). Thesefilaments were much brighter than the filamentsobserved in July and August. Quantification of hybri-
dization signals in individual cells is beyond the scope ofthis study. However, it is interesting to note that thebrightest signals were observed in late May and early
June, when Gordonia growth rates were presumablyhighest. During the end of the sampling period(September 10), low signal intensities within filamentswere observed (Fig. 7d). This observation is consistent
with the decline in mycolata, Gordonia, and G. amaraerRNA percentages as measured by membrane hybridi-zation (Fig. 5). However, the reason for this decrease in
rRNA abundance is unclear.
3.6. Lab-scale reactor studies
Using batch experiments, we identified a stabilitythreshold (see above). However, we did not observe an
increase in foam stability in the full-scale plant duringthe entire study period, and hypothesized that thestability threshold was never reached. During previous,
unsuccessful attempts to induce filamentous foaming inlab-scale reactors under similar conditions (unpublisheddata), we had learned that it was difficult to maintainGordonia in lab-scale systems for extended periods of
time. Therefore, we decided to verify the stabilitythreshold value as the foam disappeared (i.e., washoutof Gordonia cells). The levels of Gordonia cells added to
the reactors were chosen to simulate different conditionswith respect to the thresholds identified by the batchtests: Reactor A was seeded with Gordonia cells to
operate above the stability threshold (51.8% of theVSS), Reactor B was run below the stability but above
F.L. de los Reyes III, L. Raskin / Water Research 36 (2002) 445–459 455
the foam formation threshold (15.4% of the VSS), andReactor C was operated below the foam formation
threshold (no cells added; quantitative FISH showedthat the Gordonia filament levels were1.7� 108 mmml�1). The reactors were operated until
surface foam disappeared from Reactor A (14 days).Immediately after the Gordonia cells were added,
Reactors A and B developed foam. The foam in ReactorA increased to a maximum height of 36 cm (foam
volume of 5.5 l), while Reactor B foam rose to amaximum height of 6.5 cm (foam volume of 1 l). Toensure Gordonia washout (i.e., to prevent foam trap-
ping), the foam was reincorporated into the mixedliquor several times a day by manual mixing. Thefoaming potential and corresponding foam half-life
values are shown in Fig. 8a. Reactor C exhibitedminimal surface foam, as expected, since the filamentlevel was below the hypothesized foam formationthreshold of approximately 2� 108mmml�1. To obtain
conservative values, Reactor C’s initial foaming poten-
tial of 207ml was taken as the lower value for foamformation. From this analysis, Reactor B crossed this
foam formation threshold between Days 6 and 9 andReactor A crossed this threshold between Days 11 and14. The foam half-life data for Reactor A decreased
between Days 3 and 6 and crossed the foam stabilitythreshold during this time period (Fig. 8a). Reactors Band C did not exhibit any significant foam stability,which was consistent with the levels of cells added to the
reactors.The Gordonia biomass levels in the mixed liquor
(expressed as filament length per sample volume) are
shown in Fig. 8b. On Days 6 and 9, filament lengths of3.5� 108 and 5.92� 107mmml�1, respectively, wereobserved in Reactor B. On Days 11 and 14, filament
lengths of 1.95� 108 and 1.83� 107mmml�1, respec-tively, were observed in Reactor A. Therefore, thefoam formation threshold appears to be slightlybelow 2� 108 mmml�1. Again, this is consistent with
the batch tests (foam formation threshold of
Fig. 7. Epifluorescence micrographs of Gordonia in activated sludge foam from the UCSD-NE WWTP. Samples were hybridized with
a TRITC-labeled probe S-G-Gor-0596-a-A-18 (shown in red) and were simultaneously stained with DAPI (shown in blue). (a) and (b)
May 11, 1999. (c) May 31, 1999. (d) September 10, 1999. The length of the bar corresponds to 10 mm.
F.L. de los Reyes III, L. Raskin / Water Research 36 (2002) 445–459456

>1.94� 108 mmml�1), 1997 data from the UCSD-NE
WWTP ([12]; unpublished data), and 1999 data from theUCSD-NE WWTP presented in this study. On Day 6,the total filament length for Reactor A was1.29� 10970.16� 109 mmml�1. The value of
1� 109 mmml�1 can be taken to be the lower bound ofthe foam stability threshold. We hypothesize that,because the filament level in the activated sludge of the
UCSD-NEWWTP did not exceed this second threshold,foaming at this plant is not as stable as in other plantswhere foam is present throughout the year.
The rRNA fractions of the mycolata are shown inFig. 9. The washout of G. amarae from all three reactorswas observed. In addition, the data indicate that the
contribution of G. amarae to the total rRNA was low.For example, approximately 10–12% of the total rRNAwas found to be G. amarae on Day 0 in Reactor A,compared to the addition of G. amarae biomass of
51.6% of the total VSS. This again suggests that the
intracellular rRNA concentrations in G. amarae are low
compared to those in other activated sludge organisms.
4. Implications and conclusions
Since the crucial aspect in understanding foaming is
foam initiation, it is necessary to quantify the levels ofcausative organisms before and during foaming. In thisstudy, the relationship of Gordonia levels to foaming wasevaluated using oligonucleotide hybridization probes
that allow identification and quantification without thelimitations of traditional microscopy techniques. Batchtests provided evidence for the cause-effect relationship
of G. amarae to foaming. These tests also identified twopossible thresholds: a formation threshold and astability threshold. While the existence of two thresholds
may be a universal phenomenon in foaming, it ispossible that the filament levels associated with these
Fig. 8. Lab-scale reactor data. (a) Foaming potential and stability. (b) Gordonia biomass determined by quantitative FISH.
F.L. de los Reyes III, L. Raskin / Water Research 36 (2002) 445–459 457

thresholds are treatment plant-specific. Once these
threshold levels are determined for a given treatmentplant, then foam occurrence and stability can bepredicted based on Gordonia levels. This may allow theobjective evaluation of incremental effects of control
methods. For example, a particular control method maybe effective in lowering Gordonia levels, but the effectcan be masked by the continued presence of foam. The
quantification of Gordonia levels in relation to thresholdlevels may allow the identification of crucial stages (e.g.,from stable to unstable foam) during the control period.
However, it should be noted that other factors, such aschanges in cell surface hydrophobicity or biosurfactantproduction, may affect the threshold values. Additionalstudies are needed to determine the role of these factors
in foam initiation and stability.
The monitoring of a full-scale plant over the course offoaming suggested that initial foaming in this plant was
induced by mycolata other than Gordonia, possibly bybiosurfactant production and not cell mass. During thisinitial foam period, the levels of mycolata in the foam
layer were similar to those in the mixed liquor,indicating that selective enrichment of mycolata in thefoam layer did not occur. In addition, the suddendisappearance of the foam following changes in plant
hydraulics is consistent with biosurfactant washout fromthe system.As foaming progressed, the growth of Gordonia, and
particularly G. amarae, was favored in the mixed liquorand in the foam. This was apparently related toincreasing temperature and the susceptibility of non-
Gordonia mycolata to operational perturbations, such assudden changes in plant hydraulics and solids inventory.Once a critical value of Gordonia biomass was surpassed
(formation threshold), ‘‘true’’ filamentous foamingoccurred, and the manipulation of SRT was notcompletely effective in removing the foam.The stability threshold is likely relevant for plants
with a continuous foaming problem. Activated sludgeplants that experience seasonal Gordonia foaming mayhave Gordonia levels between the formation and stability
thresholds. Systems with levels below the formationthreshold may have non-Gordonia foaming due to thepresence of other mycolata or biosurfactants. These
systems are characterized by the sudden appearance anddisappearance of foam in response to system perturba-tions. The combined use of foaming potential tests andoligonucleotide probe hybridizations can characterize
activated sludge plants in terms of these thresholds. Thisapproach could provide an early warning system forfoam occurrence or stability and result in a guide for
evaluating the effectiveness of foam control measures.
Acknowledgements
We are thankful to Tim Bachman, Mike Guthrie and
the operators of the Urbana-Champaign SanitaryDistrict for their support. Valuable discussions withGlen Daigger, Mark Hernandez, Dan Oerther, DominicFrigon, Margit Mau, and the assistance of Dominic
Frigon with statistical analysis are appreciated. Thisresearch was supported by the U.S. National ScienceFoundation (Grants BES 9410476 and BES 97-33826).
References
[1] Goodfellow M, Chun J, Stubbs S, Toboli AS. Transfer of
Nocardia amarae Lechevalier and Lechevalier 1974 to the
genus Gordona as Gordona amarae comb nov. Lett Appl
Microbiol 1994;19:401–5.
Fig. 9. Results of quantitative membrane hybridizations with
oligonucleotide probes for the mycolata (a), Gordonia (b), and
G. amarae (c) for the lab-scale reactors.
F.L. de los Reyes III, L. Raskin / Water Research 36 (2002) 445–459458

[2] Goodfellow M, Alderson G, Chun G. Rhodococcal
systematics: problems and developments. Antonie van
Leeuwenhoek 1998;74:3–20.
[3] Soddell JA, Seviour RJ. A review: microbiology of
foaming in activated sludge plants. J Appl Bacteriol
1990;69:145–76.
[4] Jenkins D, Richard M, Daigger GT. Manual on the causes
and control of activated sludge bulking and foaming.
Chelsea, Michigan: Lewis Publishers, Inc, 1993.
[5] Cha DK, Jenkins D, Lewis WP, Kido WH. Process control
factors influencing Nocardia populations in activated
sludge. Water Environ Res 1992;64:37–43.
[6] Pitt P, Jenkins D. Causes and control of Nocardia
in activated sludge. Res J Water Pollut Control Fed
1990;62:143–50.
[7] Dhaliwal BS. Discussion of: causes and control of
Nocardia in activated sludge. Res J Water Pollut Control
Fed 1991;63:184–5.
[8] de los Reyes F, Ritter W, Raskin L. Group-specific small-
subunit rRNA hybridization probes to characterize
filamentous foaming in activated sludge systems. Appl
Environ Microbiol 1997;63:1107–17.
[9] de los Reyes MF, de los Reyes FL, Hernandez M, Raskin
L. Quantification of Gordona amarae strains in foaming
activated sludge and anaerobic digester systems using
oligonucleotide hybridization probes. Appl Environ
Microbiol 1998;64:2503–12.
[12] Oerther DB, de los Reyes FL, de los Reyes MF, Raskin L.
Microbial populations in a full scale activated sludge
treatment piant before, during, and after an incident of
seasonal biological foaming. Water Res 2001;35(14):3325–36.
[11] de los Reyes FL, Oerther DB, de los Reyes MF,
Hernandez M, Raskin L. Characterization of filamentous
foaming in activated sludge systems using oligonucleotide
hybridization probes and antibody probes. Water Sci
Technol 1998;37(4–5):485–93.
[12] Oerther DB, de los Reyes FL, de los Reyes MF, Raskin L.
Microbial populations in a full scale activated sludge
treatment plant before, during, and after an incident of
seasonal biological foaming. Water Res 2001;35(14):
3325–36.
[13] Davenport RJ, Curtis TP, Goodfellow M, Stainsby F,
Bingley M. Quantitative use of fluorescent in situ
hybridization to examine relationships between mycolic
acid-containing actinomycetes and foaming in activated
sludge plants. Appl Environ Microbiol 2000;66:1158–66.
[14] Stanier RY, Palleroni NJ, Doudoroff M. The aerobic
pseudomonads. A taxonomic study. J Gen Microbiol
1966;43:159–277.
[15] Greenberg AE, Clesceri LS, Eaton AD, editors. Standard
methods for the examination of water and wastewater.
Washington DC: American Public Health Association
(APHA), 1992.
[16] Raskin L, Zheng D, Griffin ME, Stroot PG, Misra P.
Characterization of microbial communities in anaerobic
bioreactors using molecular probes. Antonie van Leeu-
wenhoek 1995;68:297–308.
[17] Raskin L, Capman WC, Sharp R, Poulsen LK, Stahl DA.
Molecular ecology of gastrointestinal ecosystems. In:
Mackie RI, White BA, Isaacson RE, editors. Ecology
and physiology of gastrointestinal microbes, vol. 2:
gastrointestinal microbiology and host interactions.
New York: Chapman and Hall, 1997. p. 243–98.
[18] Zheng D, Alm E, Stahl DA, Raskin L. Characterization of
universal small-subunit rRNA hybridization probes for
quantitative molecular microbial ecology studies. Appl
Environ Microbiol 1996;62:4504–13.
[19] Amann R, Binder BJ, Olson RJ, Chisholm SW, Devereux
R, Stahl DA. Combination of 16S rRNA-targeted
oligonucleotide probes with flow cytometry for analyzing
mixed microbial populations. Appl Environ Microbiol
1990;56:1919–25.
[20] Alm E, Oerther D, Larsen N, Stahl D, Raskin L. The
oligonucleotide probe database. Appl Environ Microbiol
1996;62:3557–9.
[21] Clarke JU. Evaluation of censored data methods to allow
statistical comparisons among very small samples with
below detection limit observations. Environ Sci Technol
1998;32:177–83.
[22] Lang S, Philp JC. Surface-active lipids in rhodococci.
Antonie van Leeuwenhoek 1998;74:59–70.
[23] Sutcliffe IC. Cell envelope composition and organisation
in the genus Rhodococcus. Antonie van Leeuwenhoek
1998;74:49–58.
[24] Oerther DB, de los Reyes FL, Hernandez M, Raskin L.
Simultaneous oligonucleotide probe hybridization and
immunostaining for in situ detection of Gordonia species
in activated sludge. FEMS Microbiol Ecol 1999;29:
129–36.
[25] Kerkhof L, Kemp P. Small ribosomal RNA content in
marine proteobacteria during non-steady-state growth.
FEMS Microbiol Ecol 1999;30:253–60.
F.L. de los Reyes III, L. Raskin / Water Research 36 (2002) 445–459 459
Related Documents